UNITED STATES
SECURITIES AND EXCHANGE COMMISSION
Washington, D.C. 20549
FORM N-CSR
CERTIFIED SHAREHOLDER REPORT OF REGISTERED MANAGEMENT INVESTMENT COMPANIES
Investment Company Act file number (811-3627)
Greenspring Fund, Incorporated
(Exact name of registrant as specified in charter)
2330 West Joppa Road, Suite 110
Lutherville, MD 21093-4641
(Address of principal executive offices) (Zip code)
Mr. Charles vK. Carlson, President
2330 West Joppa Road, Suite 110
Lutherville, MD 21093-4641
(Name and address of agent for service)
(410) 823-5353
Registrant's telephone number, including area code
Date of fiscal year end: December 31, 2007
Date of reporting period: December 31, 2007
Item 1. Report to Stockholders.
ANNUAL REPORT
DECEMBER 31, 2007
This report is authorized for distribution
only to shareholders who have received a
copy of the official Prospectus of the
Greenspring Fund, Incorporated.
Greenspring Fund, Incorporated
February 2008
Dear Fellow Shareholders:
We are pleased to present the Annual Report for the Greenspring Fund for 2007.
PERFORMANCE SUMMARY
The financial markets had a tumultuous year in 2007. The housing downturn and the subprime mortgage-induced credit crunch ravaged the stock and bond markets for much of the second half of 2007. Numerous mortgage companies went out of business with surprising suddenness. Prestigious investment banks reported staggering losses due to writedowns in their loan and investment portfolios and were forced to raise additional capital, often courtesy of Middle Eastern or Far Eastern government investment funds. Many investors who did not fully comprehend the underlying risks in investments with alphabetical colloquialisms such as MBS, CDO, CDS and SIV lost money when the risks turned out to be far greater than initially perceived. Despite this turmoil, the Greenspring Fund achieved a total return of 5.32% during 2007, including the reinvestment of the dividend and capital gains distributions that were made during July and December.
Greenspring Fund Performance for the Periods Ended December 31, 2007 |
| 1 Year | 5.32% |
| 3 Years* | 8.02% |
| 5 Years* | 12.46% |
| 10 Years* | 6.40% |
| 15 Years* | 9.61% |
| 20 Years* | 9.90% |
| Since inception on 7/1/83* | 10.95% |
| Expense Ratio** | 1.08% |
** | as stated in Prospectus dated 5-1-07. See note on last page of letter. |
Performance data quoted represents past performance; past performance does not guarantee future results. The investment return and principal value of an investment will fluctuate so that an investor’s shares, when redeemed, may be worth more or less than their original cost. Current performance of the Fund may be lower or higher than the performance quoted. Performance data current to the most recent month end may be obtained by calling 1-800-366-3863 or visiting the Fund’s web site. The Fund imposes a 2.00% redemption fee for shares held 60 days or less. Performance data does not reflect the redemption fee. If reflected, total returns would be reduced.
INFLUENCES on PERFORMANCE
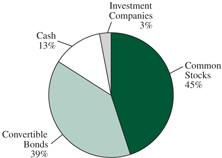
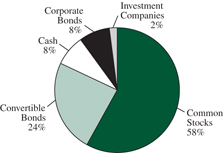
During 2007, all of the Greenspring Fund’s asset classes – common stock, preferred stock, convertible bonds, non-convertible bonds and cash – generated positive performances for the Fund. The returns of the equities and fixed income investments in the Fund’s portfolio were of similar magnitude during the year; however, the returns from the fixed income investments
Greenspring Fund, Incorporated
were far more consistently achieved. The Portfolio Allocation charts on page 2 show the composition of the Fund’s portfolio at the beginning and end of the year. As the charts indicate, the Fund redeployed some of its cash and fixed income investments toward equities as the year progressed and as the market’s turmoil pushed prices lower and created buying opportunities.
Greenspring Fund Portfolio Allocation12-31-06 | | Greenspring Fund Portfolio Allocation12-31-07 |
| | |
INFLUENCES of SPECIFIC SECURITIES
The ten securities that had the largest impact on the Greenspring Fund’s performance during 2007 (please see chart on page 3) were all common stocks. Six of those ten securities generated positive performances, while four had negative impacts. A discussion of the five securities with the largest impacts on the Greenspring Fund’s 2007 performance follows.
FTI CONSULTING Common Stock
FTI Consulting provides a variety of consulting services to corporations, both in the United States and, increasingly, internationally. The Company’s various consulting businesses and recent acquisitions experienced very healthy growth during 2007. FTI has historically had a leading position in corporate restructuring consulting, which is typically in robust demand during difficult economic times in Corporate America. The chaos created by the subprime mortgage debacle, and the related credit crunch, have created many business opportunities for FTI. Although the Company’s operations are very diversified, investors were attracted by the “bad news for others is good for our business” aspect of FTI’s restructuring business. FTI Consulting’s stock price rose from approximately $28 per share on December 31, 2006 to almost $62 per share at the end of the year.
Greenspring Fund, Incorporated
CIT GROUP Common Stock
The Greenspring Fund initially purchased shares of this specialty finance company in July of 2002 shortly after it was spun-off by its former parent, Tyco International. Subsequent to the spin-off, CIT did an excellent job of growing its earnings and improving its return on equity. During mid-2007, however, CIT announced a restructuring of its home lending operations, which had encountered some difficulties due to its subprime mortgage lending. Although CIT’s home lending business accounted for a relatively small portion of the Company’s earnings, the stock price came under considerable pressure, as the Company reported losses due to subprime mortgage writedowns. Investors continued to batter CIT’s stock during the balance of the year, as concerns about loan quality and liquidity buffeted the shares of all financial services companies. We believe that CIT, with its 100 years of experience as a specialty lender, has pursued a strategy that has been more conservatively and thoughtfully implemented than many of its specialty finance peers that were far less diversified and had far less experience than CIT. We believe that CIT will generate solid earnings during 2008 that will result in investors taking notice and bidding its stock price higher. CIT’s stock price began the year at more than $55 per share, and finished 2007 at approximately $24. The Fund purchased additional shares of CIT during March, July and August of 2007 at varying prices.
Securities that had the Most Significant Impact on GreenspringFund’s Performance During 2007(all were common stocks) |
| FTI Consulting (positive) |
| CIT Group (negative) |
| Michael Baker Corp. (positive) |
| Rush Enterprises (Class A and B) (positive) |
| Suncor Energy (positive) |
| Wabash National (negative) |
| KMG America Corp. (negative) |
| Assurant Inc. (positive) |
| Energen Corp. (positive) |
| Prestige Brands Holdings (negative) |
MICHAEL BAKER CORPORATION Common Stock
Michael Baker Corporation provides corporations and governments with engineering services needed for the construction of large-scale projects such as airports, highways, and bridges. They have worked on projects such as the National Pipeline Mapping System for the Department of Transportation, the Flood Map Modernization project for FEMA, and the expansion of the Baltimore-Washington International Airport. Additionally, Baker provides services to energy companies, primarily in the operation and maintenance of oil and gas wells. The Company’s backlog of projects is quite large, and the diversity of its customers and the types of projects that the Company undertakes give investors confidence in Baker’s ability to deliver the expected earnings prospects even in a slowing economy. Furthermore, the Company has hired an investment banker to assist in developing a strategy that may result in Baker
Greenspring Fund, Incorporated
selling its energy division, acquiring or merging with another engineering company, or possibly selling the entire company. Michael Baker’s stock price began the year at $22.65 per share, and rose significantly during the year. In early October, the Fund significantly reduced its position in the $48 per share range, thinking the stock price was already discounting most of the company’s positive attributes. Baker’s stock price subsequently dropped, enabling the Fund to partially re-build its position by buying additional shares at less than $33 per share.
RUSH ENTERPRISES Common Stock
Rush Enterprises sells and services heavy-duty trucks, principally of the high quality Peterbilt brand, throughout the United States. The Fund purchased the majority of its shares of Rush Enterprises during 2005, but also purchased a small portion during August of 2006. The Fund owns both Class A and Class B shares, with the principal difference being the number of votes per share that holders are entitled to cast. Over the last few years, the Company has pursued a strategy to reduce its dependence on the sale of heavy-duty trucks by expanding into the sale of medium-duty trucks and increasing its sales in the less cyclical parts and services business. In 2007, heavy-duty truck sales dropped substantially because many trucking companies had already purchased trucks in 2006 to avoid the impact of new environmental regulations affecting 2007 truck engines. The rapid growth in sales of medium-duty trucks and increased revenue from its parts and services division helped Rush offset the decline in heavy-duty truck sales, indicating that the diversification strategy is working. Prospects for Rush appear attractive as changes in environmental regulations set to take effect in 2010 may cause a surge in truck sales again in 2009. Rush Enterprises’ common stock increased from approximately $11 per share at the beginning of the year to about $18 per share at year end, adjusted for the 3-for-2 stock split paid in October 2007.
SUNCOR ENERGY Common Stock
The Fund purchased its shares of Suncor Energy in June of 2004 and it has been one of the Fund’s most successful investments since then. The Company controls a vast amount of acreage in northwestern Canada that contains significant amounts of oil sands reserves. Producing oil from these oil sands is more costly than developing conventional oil reserves. However, development of the oil sands reserves is currently very profitable, as the costs to develop the reserves are substantially below current oil prices. Furthermore, the Company has expanded and improved its production facilities during recent years, leading to much higher average daily production of oil. Importantly, unlike many energy companies, Suncor already has ample proven reserves, and its future success is not dependent upon the discovery of new reserves. Suncor’s challenge is to develop its reserves as economically as possible. The strong profits of the last several years have allowed the Company to
Greenspring Fund, Incorporated
maintain a healthy balance sheet while completing improvements to their refining and production facilities. During 2007, Suncor’s stock price rose from about $79 per share to $109 per share, aided by the increased price of oil, as well as investors’ growing understanding of the value of Suncor’s long-lasting reserves.
PORTFOLIO ACTIVITY
Greenspring Fund’s largest sales and purchases are shown in the two charts on the following pages. As 2007 progressed, we repositioned the Greenspring Fund’s portfolio as the severe volatility of both the stock and bond markets gave us cause to make adjustments. As mentioned earlier, the Fund increased the percentage of its investments held in common stocks during the course of the year, and reduced its holdings of cash and fixed income investments.
GREENSPRING FUND’S LARGEST SALES
NEKTAR PHARMACEUTICALS Convertible Bonds
The Greenspring Fund first purchased the Nektar Pharmaceuticals’ convertible bonds during late 2004, and we continued to purchase bonds in subsequent months. At the time of the Fund’s purchases, the Company had a very strong balance sheet, with its cash holdings exceeding its total debt obligations. The Company, however, was rapidly spending its cash reserves developing Exubera, a promising new inhaled insulin product. We were very confident in our investment in the 3.5% and 5% convertible bonds, even with the Company’s significant cash usage, because these bonds were the first bonds in the capital structure to mature and our projections showed that there should be ample cash reserves to retire the bonds at their maturity. As is typical with many of the Fund’s convertible bond investments, our ability to convert the bonds into common stock was not as important to us as the bonds’ very attractive yield-to-maturity. Nektar’s common stock rose and fell sharply at times while the Fund held the convertible bonds; however, the prices of the bonds were relatively unaffected. Both bonds matured during 2007, resulting in solid total returns for the Greenspring Fund.
SEPRACOR Convertible Bonds
Similar to the Fund’s investment in the Nektar convertible bonds, the Fund’s successful investment in Sepracor’s convertible bonds was a function of the attractive yield-to-maturity of the bonds, and was not dependent upon Sepracor’s common stock rising in value so that the bond’s convertibility feature came into play. The Fund first purchased the Sepracor 5% convertible bonds in December 2003, but continued to purchase bonds in subsequent years. At the time of our purchases, the Company had significant cash holdings and was solidly profitable, partially due to the introduction of Lunesta, a newly developed sleep aid product. Our confidence in
Greenspring Fund, Incorporated
the investment was enhanced by the fact that the 5% bond was the next issue in Sepracor’s capital structure to mature. Even if the Company’s fortunes were to unexpectedly turn down, our position in the 5% notes would be secure. The 5% bonds matured in February of 2007 resulting in an attractive total return.
Greenspring Fund Largest 2007 Sales |
Common Stocks: |
| Lamson & Sessions Co. |
| Michael Baker Corp. |
| KMG America Corp. |
| USI Holdings Corp. |
| Neoware Systems Inc. |
Bonds: |
| Nektar Therapeutics 3.5% and 5.0% convertible bonds |
| Sepracor Inc. 5% and 0% convertible bonds |
| Connetics Corp. 2.25% and 2% convertible bonds |
| Millennium Pharmaceuticals 5.5% convertible bonds |
| Case New Holland 9.25% corporate bonds |
We returned to Sepracor in August of 2007 when the Fund invested in a different convertible bond issue – the 0% convertible bonds due in October of 2024. This bond has a “put” feature that enables holders of the bond to sell their bonds back to the Company at par ($100) in October of 2008. At the time of the Fund’s purchase, Sepracor’s common stock price had just dropped significantly, dragging the price of this convertible bond lower as well, to a point that the yield-to-put was attractive. If the common stock rebounded in value, then the convertible bond would rebound in price as well. Even if the common stock did not rebound, however, the bond’s attractive yield-to-put should have been able to support the price of the bond. As it turned out, the common stock did rise in value, causing the convertible bond to also rise, at a faster rate than it would have had it followed its yield-to-put trajectory. We sold our holdings in mid-December of 2007, as the unexpectedly rapid price increase in the bonds made the expected yield-to-put no longer attractive, realizing an attractive total return that was better than originally expected.
CONNETICS CORP. Convertible Bonds
Our investment in the convertible bonds of Connetics Corp. was a short-term, yield-oriented investment. At the time of the Fund’s investment in Connetics’ convertible bonds, the Company had agreed to be acquired by Stiefel Laboratories. This transaction triggered a “change-in-control put” in the bonds, meaning that holders of the bonds would be given the opportunity to sell their bonds to the acquiring company at a stated price once the deal closed. After studying the details of the proposal and developing assumptions as to the likely timing of the closing of the acquisition, we determined that the Fund would receive an attractive short-term return. The transaction closed in early February of 2007 and the Fund sold its bonds to Stiefel Laboratories as expected, realizing the anticipated total return.
Greenspring Fund, Incorporated
GREENSPRING FUND’S LARGEST PURCHASES
LEVEL 3 COMMUNICATIONS Bonds
The Fund’s largest purchases during 2007 were of the bonds of Level 3 Communications – the 11% bonds due in March 2008, the 6% convertible bonds due in 2009, and the 6% convertible bonds due in 2010. Once again, our interest in the Level 3 bonds was in their attractive yield-to-maturity. Level 3 Communications provides infrastructure equipment, along with the ability to store and process content such as video, to telecommunications companies. Its business prospects are aided by the ever-increasing use of the Internet, although the industry currently suffers from excess capacity, resulting in a challenging pricing environment. Level 3 has a considerable amount of debt, and is not currently profitable; however, it has significant cash reserves and its common stock has a market capitalization of more than $4 billion, implying that the capital markets are available to the Company should it need to raise additional funds. Because of these three bonds’ near-term maturities, Level 3 will be focused on retiring these issues. We believe the 11% notes due in March should be easily retired without additional capital-raising efforts, and the 6% notes due in 2009 should be relatively easy to retire as well. Unless the Company’s profitability improves, however, Level 3 will need to access the capital markets in order to retire the 6% notes of 2010, which we believe will not present a problem.
Greenspring Fund |
Common Stocks: |
| CIT Group Inc. |
| Assurant, Inc. |
| Lamson & Sessions Co. |
| Radyne Corp. |
| W.R Berkley Corp. |
Bonds: |
| Level 3 Communications 6% and 11% bonds |
| Wabash National Corp. 3.25% convertible bonds |
| Xerox Corp. 9.75% and 7.625% corporate bonds |
| Case New Holland 9.25% corporate bonds |
| Hanover Compressor 4.75% convertible bonds |
CIT GROUP Common Stock (discussed already above)
WABASH NATIONAL Convertible Bonds
The Fund has owned shares of the common stock of Wabash National for several years, but also purchased Wabash’s convertible bonds during 2007. Wabash National is the country’s leading manufacturer of truck trailers. The Company’s common stock price declined during 2007, as trailer orders have declined and concerns about the economy have caused analysts to lower their earnings expectations. In November 2007, the Fund purchased Wabash’s convertible bonds, which mature in August of
Greenspring Fund, Incorporated
2008. The Company has already negotiated a new credit line with its banks that specifically allows the Company to use the line of credit to retire the convertible bonds if need be. Additionally, we believe that it is likely that the Company has already been in the marketplace purchasing bonds, a step that encourages us that Wabash will deal with retiring these bonds sooner rather than later. From the convertible bonds’ year-end price, the bonds should provide an attractive short-term yield-to-maturity.
2008 OUTLOOK
The financial markets have started the new year of 2008 in similar fashion to the way 2007 ended – with an abundance of volatility. The headlines are full of surprises, and investors react quickly and forcefully to the day’s news. Many investment banks are in the process of announcing a second round of multibillion-dollar losses. Concerns about the subprime mortgage market continue unabated. The overall economy seems to be slowing and some economists are beginning to predict a recession. In reaction, the Federal Reserve has indicated a willingness to cut interest rates further and politicians have proposed economic stimulus packages.
Greenspring Fund | % of Net |
| FTI Consulting Inc. | 6.8% |
| Ciena Corporation 3.75% convertible bonds | 4.5% |
| Suncor Energy Inc. | 4.0% |
| Level 3 Communications 6% convertible bonds | 3.7% |
| Assurant Inc. | 3.5% |
| Wabash National Corp. 3.25% convertible bonds | 3.2% |
| Xerox Corp. 7.625% corporate bonds | 3.1% |
| Hanover Compressor 4.75% convertible bonds | 3.0% |
| Agere Systems 6.5% convertible bonds | 2.8% |
| Radyne Corp. | 2.7% |
We continue to scour the markets for stocks and bonds that have been sold off by investors to levels that overly discount impending problems. In this type of environment, it is important, now more than ever, to focus on companies that have strong balance sheets and are not overly dependent on continuing access to the capital markets. We continue to look for companies that are capable of taking advantage of this environment and have the financial strength to improve their competitive position during these difficult times. In the fixed-income world, we are seeing relative yields on many corporate bonds improve, offering better spreads above the risk-free yields available on government securities. In this harsh credit environment, however, careful analysis of capital structures and cash flow capabilities remains very important. We continue to strive to achieve the
Greenspring Fund, Incorporated
Greenspring Fund’s investment objective of providing shareholders with long term capital appreciation achieved through a total return approach.
Respectfully,
 |  |
| Charles vK. Carlson | Michael J. Fusting |
| Portfolio Manager | Co-Chief Investment Officer |
| Co-Chief Investment Officer | |
Fund holdings and/or sector allocations are subject to change at any time and are not recommendations to buy or sell any security.
Mutual fund investing involves risk. Principal loss is possible. Small-capitalization companies tend to have limited liquidity and greater price volatility than large-capitalization companies. Investments by the Fund in lower-rated and non-rated securities present a greater risk of loss to principal and interest than higher-rated securities. Investments in debt securities typically decrease in value when interest rates rise. This risk is usually greater for longer-term debt securities.
Opinions expressed are subject to change, are not guaranteed and should not be considered recommendations to buy or sell any security.
Free cash flow measures the cash generating capability of a company by adding certain non-cash charges (e.g. depreciation and amortization) to earnings and subtracting recurring capital expenditures. Return on equity is a measure of a corporation’s profitability. Represents average return on equity on the securities in the portfolio, not the actual return on equity on the portfolio.
** The expense ratio of 1.08% includes indirect expenses that the Fund incurs from investing in the shares of other investment companies. The indirect fees represent the Fund’s pro rata portion of the cumulative expenses charged by the other investment companies. Without those indirect fees, the Fund’s Total Annual Operating Expenses would be 1.07%.
Distributed by Quasar Distributors, LLC 2/08
Greenspring Fund, Incorporated
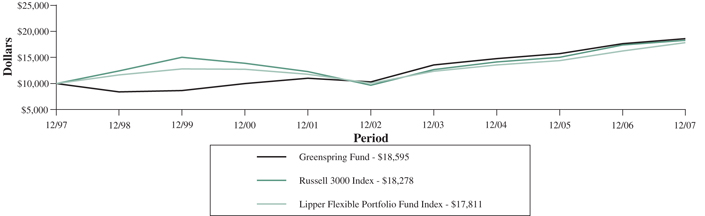
Growth of a $10,000 Investment in the Greenspring Fund
Over the Last Ten Years
Average Annual Total Returns | | | | | | | | | | | | |
| | | For Periods Ended December 31, 2007 |
| | | 1 Year | | 3 Years | | 5 Years | | 10 Years |
| Greenspring Fund | | | 5.32 | % | | | 8.02 | % | | | 12.46 | % | | | 6.40 | % |
| Russell 3000 Index | | | 5.14 | % | | | 8.89 | % | | | 13.63 | % | | | 6.22 | % |
| Lipper Flexible Portfolio Fund Index | | | 9.57 | % | | | 9.53 | % | | | 12.10 | % | | | 5.94 | % |
The graph and table do not reflect the deduction of taxes that a shareholder would pay on Greenspring Fund (the “Fund”) distributions or the redemption of Fund shares.
Performance data quoted represents past performance; past performance does not guarantee future results. The investment return and principal value of an investment will fluctuate so that an investor’s shares, when redeemed, may be worth more or less than their original cost. Current performance of the Fund may be lower or higher than the performance quoted. Performance data current to the most recent month end is available at www.greenspringfund.com or by calling 1-800-366-3863 toll free. The Fund imposes a 2.00% redemption fee for shares held 60 days or less. Performance data does not reflect the redemption fee. If reflected, total returns would be reduced.
Greenspring Fund, Incorporated
Expense Example For the Six Months Ended December 31, 2007 (Unaudited) |
As a shareholder of the Fund, you incur two types of costs: (1) redemption fees if you redeem within 60 days of purchase; and (2) ongoing costs, including management fees and other Fund expenses. This example is intended to help you understand your ongoing costs (in dollars) of investing in the Fund and to compare these costs with the ongoing costs of investing in other mutual funds. The example is based on an investment of $1,000 invested at the beginning of the period and held for the entire period (7/1/2007 - 12/31/2007).
Actual Expenses
The first line of the table below provides information about actual account values based on actual returns and actual expenses. You may use the information in this line, together with the amount you invested, to estimate the expenses that you paid over the period. Simply divide your account value by $1,000 (for example, an $8,600 account value divided by $1,000 = 8.6), then multiply the result by the number in the first line under the heading entitled “Expenses Paid During the Period” to estimate the expenses you paid on your account during this period.
Hypothetical Example for Comparison Purposes
The second line of the table below provides information about hypothetical account values and hypothetical expenses based on the Fund’s actual expense ratio and an assumed rate of return of 5% per year before expenses, which is not the Fund’s actual return. The hypothetical account values and expenses may not be used to estimate the actual ending account balance or expenses you paid for the period. You may use this information to compare the ongoing costs of investing in the Fund and other funds. To do so, compare this 5% hypothetical example with the 5% hypothetical examples that appear in the shareholder reports of the other funds. Please note that the expenses shown in the table are meant to highlight your ongoing costs only and do not reflect any transactional costs, such as redemption fees. Therefore, the second line of the table is useful in comparing ongoing costs only, and will not help you determine the relative total costs of owning different funds. In addition, if these transactional costs were included, your costs would have been higher.
| | | | | Expenses Paid During the Period 7/1/2007 – |
| Actual | | $1,000 | $986 | $5.16 |
Hypothetical (5% annual return before expenses) | | $1,000 | $1,020 | $5.24 |
| * | Expenses are equal to the Fund’s annualized expense ratio of 1.03%, multiplied by the average account value over the period multiplied by 184/365 (to reflect the one-half year period). |
Greenspring Fund, Incorporated
SCHEDULE OF INVESTMENTS at December 31, 2007 |
Shares | | | | Value | |
COMMON STOCKS: 58.0% | | | |
Building Products: 0.1% | | | |
| | 17,300 | | Griffon Corp.* | | $ | 215,385 | |
Business & Professional Services: 6.8% | | | | |
| | 282,800 | | FTI Consulting, Inc.* | | | 17,431,792 | |
Chemicals: 1.5% | | | | |
| | 199,325 | | Hercules, Inc. | | | 3,856,939 | |
Commercial Banks: 3.1% | | | | |
| | 40,074 | | American National | | | | |
| | | | Bankshares, Inc. | | | 800,278 | |
| | 388,801 | | Cardinal | | | | |
| | | | Financial Corp. | | | 3,623,625 | |
| | 164,624 | | First Mariner | | | | |
| | | | Bancorp, Inc.* | | | 933,418 | |
| | 759 | | Fulton Financial Corp. | | | 8,516 | |
| | 25,000 | | Middleburg | | | | |
| | | | Financial Corp. | | | 533,000 | |
| | 30,000 | | Patriot National | | | | |
| | | | Bancorp, Inc. | | | 479,100 | |
| | 26,190 | | Provident | | | | |
| | | | Bankshares Corp. | | | 560,204 | |
| | 27,500 | | Southern National | | | | |
| | | | Bancorp of Virginia* | | | 247,500 | |
| | 14,476 | | SunTrust Banks, Inc. | | | 904,605 | |
| | | | | | | 8,090,246 | |
Communications Equipment: 3.0% | | | | |
| | 761,741 | | Radyne Corp.* | | | 7,008,017 | |
| | 25,000 | | Superior Essex, Inc.* | | | 600,000 | |
| | | | | | | 7,608,017 | |
Construction & Engineering: 3.4% | | | | |
| | 135,600 | | EMCOR Group, Inc.* | | | 3,204,228 | |
| | 136,350 | | Michael Baker Corp.* | | | 5,603,985 | |
| | | | | | | 8,808,213 | |
Diversified Financial Services: 2.5% | | | | |
| | 272,149 | | CIT Group, Inc. | | | 6,539,740 | |
Diversified Gas Utilities: 2.7% | | | | |
| | 108,400 | | Energen Corp. | | | 6,962,532 | |
Electric Utilities: 2.0% | | | | |
| | 99,000 | | PPL Corp. | | | 5,156,910 | |
Electrical Equipment: 0.4% | | | | |
| | 17,400 | | Emerson Electric Co. | | | 985,884 | |
Energy Equipment & Services: 1.1% | | | | |
| | 204,414 | | Cal Dive | | | | |
| | | | International, Inc.* | | | 2,706,441 | |
Environmental Services: 3.7% | | | | |
| | 363,000 | | Allied Waste | | | | |
| | | | Industries, Inc.* | | | 4,000,260 | |
| | 149,958 | | Waste Industries | | | | |
| | | | USA, Inc. | | | 5,443,475 | |
| | | | | | | 9,443,735 | |
Equipment Rentals:1.2% | | | | |
| | 167,250 | | United Rentals, Inc.* | | | 3,070,710 | |
Household & Personal Products: 2.1% | | | | |
| | 723,400 | | Prestige Brands | | | | |
| | | | Holdings, Inc.* | | | 5,411,032 | |
Industrial Distribution: 2.2% | | | | |
| | 155,000 | | Watsco, Inc. | | | 5,697,800 | |
Insurance: 9.4% | | | | |
| | 136,100 | | Assurant, Inc. | | | 9,105,090 | |
| | 34,450 | | PartnerRe, Ltd.# | | | 2,843,158 | |
| | 320,884 | | United America | | | | |
| | | | Indemnity, Ltd.#* | | | 6,392,009 | |
| | 201,050 | | W.R. Berkley Corp. | | | 5,993,301 | |
| | | | | | | 24,333,558 | |
Machinery: 0.3% | | | | |
| | 20,000 | | Pentair, Inc. | | | 696,200 | |
Metals & Mining: 1.2% | | | | |
| | 86,000 | | Brush Engineered | | | | |
| | | | Materials, Inc.* | | | 3,183,720 | |
Oil & Gas Exploration & Production: 6.2% | | | | |
| | 40,300 | | CNX Gas Corp.* | | | 1,287,585 | |
| | 5,626 | | ConocoPhillips | | | 496,776 | |
| | 22,280 | | EOG Resources, Inc. | | | 1,988,490 | |
| | 92,000 | | Rosetta | | | | |
| | | | Resources, Inc.* | | | 1,824,360 | |
| | 96,000 | | Suncor Energy, Inc.# | | | 10,438,080 | |
| | | | | | | 16,035,291 | |
The accompanying notes are an integral part of these financial statements.
Greenspring Fund, Incorporated
SCHEDULE OF INVESTMENTS at December 31, 2007 (Con’t) |
Shares/Principal | | | | Value | |
COMMON STOCKS: 58.0% (Con’t) | | | |
Real Estate: 0.2% | | | |
| | 4,500 | | First Potomac | | | |
| | | | Realty Trust | | $ | 77,805 | |
| | 27,500 | | Urstadt Biddle | | | | |
| | | | Properties, Inc. - | | | | |
| | | | Class A | | | 426,250 | |
| | | | | | | 504,055 | |
Semiconductors & | | | | |
Semiconductor Equipment: 0.1% | | | | |
| | 34,093 | | Rudolph | | | | |
| | | | Technologies, Inc. * | | | 385,933 | |
Thrifts & Mortgage Finance: 0.0% | | | | |
| | 3,500 | | OceanFirst | | | | |
| | | | Financial Corp. | | | 55,335 | |
Transportation: 4.8% | | | | |
| | 211,930 | | Rush Enterprises, | | | | |
| | | | Inc. - Class A* | | | 3,852,887 | |
| | 295,798 | | Rush Enterprises, | | | | |
| | | | Inc. - Class B* | | | 5,265,204 | |
| | 28,200 | | SAIA, Inc.* | | | 375,060 | |
| | 360,350 | | Wabash | | | | |
| | | | National Corp. | | | 2,771,091 | |
| | | | | | | 12,264,242 | |
TOTAL COMMON STOCKS | | | | |
| (cost $112,692,521) | | | 149,443,710 | |
INVESTMENT COMPANIES: 2.3% | | | | |
| | 385,762 | | NGP Capital | | | | |
| | | | Resources Co. | | | | |
| | | | (cost $5,228,882) | | | 6,029,460 | |
CONVERTIBLE BONDS: 23.7% | | | | |
Automotive: 0.4% | | | | |
| $ | 1,038,000 | | Sonic Automotive, | | | | |
| | | | Inc., 5.250%, 5/7/09 | | | 1,022,430 | |
Communications Equipment: 5.4% | | | | |
| | 11,502,000 | | Ciena Corp., | | | | |
| | | | 3.750%, 2/1/08 | | | 11,502,000 | |
| | 2,524,000 | | Nortel Networks Corp., | | | | |
| | | | 4.250%, 9/1/08# | | | 2,489,295 | |
| | | | | | | 13,991,295 | |
Diversified Telecommunication Services: 4.6% | | | | |
| | 10,327,000 | | Level 3 | | | | |
| | | | Communications, Inc., | | | | |
| | | | 6.000%, 9/15/09 | | | 9,655,745 | |
| | 2,503,000 | | Level 3 | | | | |
| | | | Communications, | | | | |
| | | | Inc., 6.000%, 3/15/10 | | | 2,240,185 | |
| | | | | | | 11,895,930 | |
Energy Equipment & Services: 3.0% | | | | |
| | 7,825,000 | | Hanover | | | | |
| | | | Compressor Co., | | | | |
| | | | 4.750%, 3/15/08 | | | 7,766,313 | |
Environmental Services: 0.7% | | | | |
| | 1,975,000 | | Allied Waste | | | | |
| | | | Industries, Inc., | | | | |
| | | | 4.250%, 4/15/34 | | | 1,846,625 | |
Media: 2.3% | | | | |
| | 5,933,000 | | Getty Images, Inc., | | | | |
| | | | 0.500%, 6/9/23 | | | 5,769,843 | |
Semiconductor Equipment: 4.1% | | | | |
| | 7,015,000 | | Agere Systems, Inc., | | | | |
| | | | 6.500%, 12/15/09 | | | 7,111,456 | |
| | 3,500,000 | | Phototronics, Inc., | | | | |
| | | | 2.250%, 4/15/08 | | | 3,486,875 | |
| | | | | | | 10,598,331 | |
Transportation: 3.2% | | | | |
| | 8,434,000 | | Wabash | | | | |
| | | | National Corp., | | | | |
| | | | 3.250%, 8/1/08 | | | 8,244,235 | |
TOTAL CONVERTIBLE BONDS | | | | |
| (cost $60,696,672) | | | 61,135,002 | |
CORPORATE BONDS: 8.2% | | | | |
Automotive: 1.3% | | | | |
| | 2,091,000 | | Goodyear Tire | | | | |
| | | | & Rubber Co., | | | | |
| | | | 11.250%, 3/1/11 | | | 2,232,143 | |
| | 1,260,000 | | Sonic Automotive, | | | | |
| | | | Inc., 8.625%, 8/15/13 | | | 1,231,650 | |
| | | | | | | 3,463,793 | |
The accompanying notes are an integral part of these financial statements.
Greenspring Fund, Incorporated
SCHEDULE OF INVESTMENTS at December 31, 2007 (Con’t) |
Principal/Shares | | | | Value | |
CORPORATE BONDS: 8.2% (Con’t) | | | |
Commercial Banks: 0.2% | | | |
| $ | 500,000 | | Union Planters Bank, | | | |
| | | | 6.500%, 3/15/08 | | $ | 502,517 | |
Diversified Telecommunication Services: 2.3% | | | | |
| | 556,000 | | Level 3 | | | | |
| | | | Communications, Inc., | | | | |
| | | | 11.000%, 3/15/08^ | | | 557,077 | |
| | 3,379,000 | | Qwest Capital | | | | |
| | | | Funding, Inc., | | | | |
| | | | 6.375%, 7/15/08 | | | 3,379,000 | |
| | 1,908,000 | | Rogers | | | | |
| | | | Communications, Inc., | | | | |
| | | | 8.000%, 12/15/12# | | | 1,992,652 | |
| | | | | | | 5,928,729 | |
Electric Utilities: 0.1% | | | | |
| | 307,000 | | Dominion | | | | |
| | | | Resources, Inc., | | | | |
| | | | 8.125%, 6/15/10 | | | 331,743 | |
Electrical Equipment: 0.2% | | | | |
| | 110,000 | | GrafTech Finance, Inc., | | | | |
| | | | 10.250%, 2/15/12 | | | 113,988 | |
| | 434,000 | | Thomas & Betts Corp., | | | | |
| | | | 6.625%, 5/7/08 | | | 435,729 | |
| | | | | | | 549,717 | |
Environmental Services: 0.2% | | | | |
| | 426,000 | | Allied Waste | | | | |
| | | | Industries, Inc., | | | | |
| | | | 7.875%, 4/15/23 | | | 437,715 | |
Information Technology Services: 0.1% | | | | |
| | 160,000 | | Unisys Corp., | | | | |
| | | | 7.875%, 4/1/08 | | | 160,000 | |
Machinery: 0.1% | | | | |
| | 145,000 | | Briggs & | | | | |
| | | | Stratton Corp., | | | | |
| | | | 8.875%, 3/15/11 | | | 154,788 | |
Media: 0.5% | | | | |
| | 165,000 | | Belo Corp., | | | | |
| | | | 8.000%, 11/1/08 | | | 166,509 | |
| | 1,230,000 | | Time Warner, Inc., | | | | |
| | | | 7.480%, 1/15/08 | | | 1,230,383 | |
| | | | | | | 1,396,892 | |
Office Electronics: 3.2% | | | | |
| | 50,000 | | Xerox Corp., | | | | |
| | | | 9.750%, 1/15/09 | | | 52,283 | |
| | 7,740,000 | | Xerox Corp., | | | | |
| | | | 7.625%, 6/15/13 | | | 8,077,882 | |
| | | | | | | 8,130,165 | |
TOTAL CORPORATE BONDS | | | | |
| (cost $21,768,616) | | | 21,056,059 | |
SHORT-TERM INVESTMENTS: 7.6% | | | | |
Money Market Investments: 7.6% | | | | |
| | 8,675,634 | | AIM Liquid Assets | | | 8,675,634 | |
| | 11,006,456 | | AIM STIC | | | | |
| | | | Prime Portfolio | | | 11,006,456 | |
| | | | | | | 19,682,090 | |
TOTAL SHORT-TERM | | | | |
INVESTMENTS | | | | |
| (cost $19,682,090) | | | 19,682,090 | |
TOTAL INVESTMENTS | | | | |
IN SECURITIES | | | | |
| (cost $220,068,781): 99.8% | | | 257,346,321 | |
| | | | | | | | |
| Other Assets less Liabilities: 0.2% | | | 531,246 | |
NET ASSETS: 100.0% | | $ | 257,877,567 | |
| * | Non-income producing security. |
| # | U.S. security of foreign issuer. |
| ^ | Security valued at fair value by the Fund’s adviser under the supervision of the Fund’s Board of Directors. |
The accompanying notes are an integral part of these financial statements.
Greenspring Fund, Incorporated
STATEMENT OF ASSETS AND LIABILITIES at December 31, 2007 |
ASSETS | | | |
| Investments in securities, at value (cost $220,068,781) | | $ | 257,346,321 | |
| Receivables: | | | | |
| Fund shares sold | | | 122,988 | |
| Dividends and interest | | | 1,454,245 | |
| Prepaid expenses | | | 24,522 | |
| Total assets | | | 258,948,076 | |
| | | | | |
LIABILITIES | | | | |
| Payables: | | | | |
| Due to affiliate (Note 5) | | | 170,698 | |
| Securities purchased | | | 707,584 | |
| Fund shares redeemed | | | 74,274 | |
| Accrued expenses | | | 117,953 | |
| Total liabilities | | | 1,070,509 | |
| | | | | |
NET ASSETS | | $ | 257,877,567 | |
| | | | | |
| Capital shares issued and outstanding | | | | |
| (60,000,000 shares authorized, $0.01 par value) | | | 10,931,888 | |
| | | | | |
| Net asset value, offering and redemption price per share | | $ | 23.59 | |
| | | | | |
COMPONENTS OF NET ASSETS | | | | |
| Capital stock at par value | | $ | 109,319 | |
| Paid-in capital | | | 216,631,034 | |
| Accumulated net investment loss | | | (198,729 | ) |
| Undistributed net realized gain on investments | | | 4,058,403 | |
| Net unrealized appreciation on investments | | | 37,277,540 | |
NET ASSETS | | $ | 257,877,567 | |
The accompanying notes are an integral part of these financial statements.
Greenspring Fund, Incorporated
STATEMENT OF OPERATIONS For the Year Ended December 31, 2007 |
INVESTMENT INCOME | | | |
| Income | | | |
| Interest | | $ | 6,898,441 | |
| Dividends (net of foreign withholding taxes of $5,222) | | | 1,747,269 | |
| Total income | | | 8,645,710 | |
| | | | | |
| Expenses | | | | |
| Advisory fees (Note 5) | | | 1,973,717 | |
| Transfer agent fees (Note 6) | | | 209,911 | |
| Administration fees | | | 205,916 | |
| Fund accounting fees | | | 61,351 | |
| Administration fees - Corbyn (Note 5) | | | 56,412 | |
| Legal fees | | | 42,583 | |
| Custody fees | | | 41,154 | |
| Reports to shareholders | | | 35,055 | |
| Blue sky fees | | | 26,092 | |
| Audit fees | | | 23,000 | |
| Directors fees | | | 17,161 | |
| Miscellaneous fees | | | 17,064 | |
| Insurance fees | | | 14,397 | |
| Registration fees | | | 503 | |
| Total expenses | | | 2,724,316 | |
| Net investment income | | | 5,921,394 | |
| | | | | |
REALIZED AND UNREALIZED GAIN ON INVESTMENTS | | | | |
| Net realized gain on investments | | | 9,504,079 | |
| Change in net unrealized | | | | |
| appreciation/depreciation on investments | | | (1,848,483 | ) |
| Net realized and unrealized gain on investments | | | 7,655,596 | |
| Net increase in net assets resulting from operations | | $ | 13,576,990 | |
The accompanying notes are an integral part of these financial statements.
Greenspring Fund, Incorporated
STATEMENTS OF CHANGES IN NET ASSETS |
| | | Year Ended | | | Year Ended | |
| | | December 31, 2007 | | | December 31, 2006 | |
INCREASE (DECREASE) IN NET ASSETS FROM: | | | | | | |
| | | | | | | |
OPERATIONS | | | | | | |
| Net investment income | | $ | 5,921,394 | | | $ | 5,255,819 | |
| Net realized gain on investments | | | 9,504,079 | | | | 2,202,233 | |
| Change in net unrealized | | | | | | | | |
| appreciation/depreciation on investments | | | (1,848,483 | ) | | | 15,317,304 | |
Net increase in net assets | | | | | | | | |
resulting from operations | | | 13,576,990 | | | | 22,775,356 | |
| | | | | | | | | |
DISTRIBUTIONS TO SHAREHOLDERS | | | | | | | | |
| From net investment income | | | (6,053,466 | ) | | | (5,676,613 | ) |
| From net realized gain | | | (5,657,768 | ) | | | (1,948,942 | ) |
Total distributions to shareholders | | | (11,711,234 | ) | | | (7,625,555 | ) |
| | | | | | | | | |
CAPITAL SHARE TRANSACTIONS | | | | | | | | |
| Net increase in net assets derived from net | | | | | | | | |
| change in outstanding shares (a)+ | | | 12,120,099 | | | | 71,155,724 | |
Total increase in net assets | | | 13,985,855 | | | | 86,305,525 | |
| | | | | | | | | |
NET ASSETS | | | | | | | | |
| Beginning of year | | | 243,891,712 | | | | 157,586,187 | |
End of year (including accumulated | | | | | | | | |
net investment loss of $(198,729) | | | | | | | | |
and $(136,832), respectively) | | $ | 257,877,567 | | | $ | 243,891,712 | |
(a) A summary of capital share transactions is as follows:
| | | Year Ended | | | Year Ended | |
| | | December 31, 2007 | | | December 31, 2006 | |
| | | Shares | | | Value | | | Shares | | | Value | |
| Shares sold | | | 2,144,163 | | | $ | 51,718,315 | | | | 4,142,954 | | | $ | 94,837,670 | |
| Shares issued in reinvestment | | | | | | | | | | | | | | | | |
| of distributions | | | 437,963 | | | | 10,439,468 | | | | 306,541 | | | | 7,072,530 | |
| Shares redeemed + | | | (2,061,417 | ) | | | (50,037,684 | ) | | | (1,342,980 | ) | | | (30,754,476 | ) |
| Net increase | | | 520,709 | | | $ | 12,120,099 | | | | 3,106,515 | | | $ | 71,155,724 | |
| + | Net of redemption fees of $11,271 and $19,017, respectively. |
The accompanying notes are an integral part of these financial statements.
Greenspring Fund, Incorporated
FINANCIAL HIGHLIGHTS For a capital share outstanding throughout each year |
| | | Year Ended December 31, | |
| | | 2007 | | | 2006 | | | 2005 | | | 2004 | | | 2003 | |
| Net asset value, | | | | | | | | | | | | | | | |
| beginning of year | | $ | 23.43 | | | $ | 21.57 | | | $ | 20.91 | | | $ | 19.96 | | | $ | 15.70 | |
| | | | | | | | | | | | | | | | | | | | | |
INCOME (LOSS) FROM INVESTMENT OPERATIONS: | | | | | | | | | | | | | | | | | | | | |
| Net investment income | | | 0.55 | | | | 0.53 | | | | 0.47 | | | | 0.52 | | | | 0.53 | |
| Net realized and unrealized | | | | | | | | | | | | | | | | | | | | |
| gain (loss) on investments | | | 0.70 | | | | 2.10 | | | | 0.88 | | | | 1.18 | | | | 4.34 | |
| Total from | | | | | | | | | | | | | | | | | | | | |
| investment operations | | | 1.25 | | | | 2.63 | | | | 1.35 | | | | 1.70 | | | | 4.87 | |
| | | | | | | | | | | | | | | | | | | | | |
LESS DISTRIBUTIONS: | | | | | | | | | | | | | | | | | | | | |
| From net investment income | | | (0.56 | ) | | | (0.58 | ) | | | (0.44 | ) | | | (0.56 | ) | | | (0.61 | ) |
| From net realized gain | | | (0.53 | ) | | | (0.19 | ) | | | (0.25 | ) | | | (0.19 | ) | | | — | |
| Total distributions | | | (1.09 | ) | | | (0.77 | ) | | | (0.69 | ) | | | (0.75 | ) | | | (0.61 | ) |
| Paid-in capital from | | | | | | | | | | | | | | | | | | | | |
| redemption fees (Note 1) | | | —* | | | | —* | | | | —* | | | | —* | | | | —* | |
| Net asset value, | | | | | | | | | | | | | | | | | | | | |
| end of year | | $ | 23.59 | | | $ | 23.43 | | | $ | 21.57 | | | $ | 20.91 | | | $ | 19.96 | |
| Total return | | | 5.32 | % | | | 12.29 | % | | | 6.57 | % | | | 8.69 | % | | | 31.34 | % |
| | | | | | | | | | | | | | | | | | | | | |
RATIOS/SUPPLEMENTAL DATA: | | | | | | | | | | | | | | | | | | | | |
| Net assets, | | | | | | | | | | | | | | | | | | | | |
| end of year (millions) | | $ | 257.9 | | | $ | 243.9 | | | $ | 157.6 | | | $ | 132.5 | | | $ | 109.3 | |
| Ratio of expenses to | | | | | | | | | | | | | | | | | | | | |
| average net assets | | | 1.03 | % | | | 1.07 | % | | | 1.16 | % | | | 1.06 | % | | | 1.14 | % |
| Ratio of net | | | | | | | | | | | | | | | | | | | | |
| investment income | | | | | | | | | | | | | | | | | | | | |
| to average net assets | | | 2.24 | % | | | 2.56 | % | | | 2.30 | % | | | 2.60 | % | | | 3.44 | % |
| Portfolio turnover rate | | | 53.75 | % | | | 38.58 | % | | | 36.22 | % | | | 35.21 | % | | | 102.43 | % |
* Amount less than $0.01 per share.
The accompanying notes are an integral part of these financial statements.
Greenspring Fund, Incorporated
NOTES TO FINANCIAL STATEMENTS December 31, 2007 |
Note 1 - Significant Accounting Policies |
Greenspring Fund, Incorporated (the “Fund”) is a diversified, open-end management investment company registered under the Investment Company Act of 1940, as amended (the “1940 Act”). The Fund is organized as a Maryland corporation and commenced operations on July 1, 1983.
The preparation of the financial statements in accordance with accounting principles generally accepted in the United States of America requires management to make estimates and assumptions that affect the reported amounts and disclosures in the financial statements. Actual results could differ from those estimates.
Investment transactions and related investment income - Investment transactions are recorded on the trade date. Dividend income is recorded on the ex-dividend date and interest income, including amortization of premiums and accretion of discounts, is recorded on the accrual basis. Dividends determined to be a return of capital are recorded as a reduction of the cost basis of the security. Realized gains and losses from investment transactions are reported on an identified cost basis.
Valuation of investments - Equity securities listed on a national securities exchange or the NASDAQ National Market are valued at the last reported sale price or the official closing price for certain markets on the exchange of major listing as of the close of the regular session of the New York Stock Exchange.
Equity securities that are traded principally in the over-the-counter market, listed securities for which no sale was reported on the day of valuation, and listed securities whose primary market is believed by Corbyn Investment Management, Inc. (“Corbyn” or the “Adviser”) to be over-the-counter are valued at the mean of the closing bid and asked prices obtained from sources that the Adviser deems appropriate.
Debt securities generally trade in the over-the-counter market. Debt securities are valued by using quotations supplied by bond dealers who make markets in such securities or by an independent pricing service, which may use valuation models that consider the yield or price of bonds of similar quality, maturity and coupon, as well as prices by bond dealers, who make markets in such securities.
Short-term investments are valued at amortized cost, which approximates fair market value. The value of securities that mature, or have an announced call, within 60 days will be valued at market value.
Securities for which market quotations are not readily available or for which the available quotations do not appear to reflect the current value of the securities are valued at fair value as determined in good faith by the Adviser under the direction of the Board of Directors.
Greenspring Fund, Incorporated
NOTES TO FINANCIAL STATEMENTS December 31, 2007 (Con’t) |
In determining fair value, the Adviser, as directed by the Board of Directors, considers all relevant qualitative and quantitative information available. These factors are subject to change over time and are reviewed periodically. The values assigned to fair value investments are based on available information and do not necessarily represent amounts that might ultimately be realized, since such amounts depend on future developments inherent in long-term investments. Further, because of the inherent uncertainty of valuation, those estimated values may differ significantly from the values that would have been used had a ready market of the investments existed, and the differences could be material.
Dividends and distributions to stockholders - The Fund records dividends and distributions to stockholders on the ex-dividend date.
Redemption fees - The Fund’s Board of Directors has adopted policies and procedures with respect to frequent purchases and redemptions of Fund shares by Fund shareholders. The Fund is intended for long-term investors. The Fund discourages and does not accommodate frequent purchases and redemptions of Fund shares by Fund shareholders. The Fund reserves the right to decline a purchase order for any reason.
“Market-timers” who engage in frequent purchases and redemptions over a short period can disrupt the Fund’s investment program by requiring the Fund to have excess cash on hand or to liquidate holdings to accommodate redemptions. In addition, frequent purchases and redemptions may impede efficient Fund management and create additional transaction costs that are borne by all shareholders. To the extent that the Fund invests a significant portion of it’s assets in small-cap securities or high-yield bonds, it may be subject to the risks of market timing more than a fund that does not. Therefore, the Fund imposes a 2% redemption fee for shares held 60 days or less. The fee is deducted from the seller’s redemption proceeds and deposited into the Fund to help offset brokerage commissions, market impact, and other costs associated with fluctuations in Fund asset levels and cash flow caused by short-term trading. All shareholders are subject to these restrictions regardless of whether you purchased your shares directly from the Fund or through a financial intermediary. However, the Fund is limited in its ability to determine whether trades placed through financial intermediaries may signal excessive trading. Accordingly, the Fund may not be able to determine whether trading in combined orders or in omnibus accounts is contrary to the Fund’s policies. The Fund reserves the right to reject combined or omnibus orders in whole or in part.
The “first-in, first-out” method is used to determine the holding period. Under this method, the date of redemption will be compared with the earliest purchase date of shares held in the account. If the holding period for shares purchased is 60 days or
Greenspring Fund, Incorporated
NOTES TO FINANCIAL STATEMENTS December 31, 2007 (Con’t) |
less, the fee will be charged. The redemption fee may be modified or discontinued at any time, in which case, shareholders will be notified.
The fee does not apply to shares acquired through the reinvestment of dividends or other distributions, or shares redeemed pursuant to a systematic withdrawal plan or a mandatory IRA distribution.
Risk of loss arising from indemnifications - In the normal course of business, the Fund enters into contracts that contain a variety of representations, which provide general indemnifications. The Fund’s maximum exposure under these arrangements is unknown as this would involve future claims that may be made against the Fund that have not yet occurred. However, based on experience, the Fund expects the risk of loss to be remote.
Note 2 - Dividends and Distributions |
It is the Fund’s policy to declare dividends from net investment income and distributions from net realized gains as determined in accordance with income tax regulations, which may differ from accounting principles generally accepted in the United States of America. Accordingly, periodic reclassifications are made within the portfolio’s capital accounts to reflect income and gains available for distribution under income tax regulations.
On July 18, 2007 an income dividend of $0.25 per share, a short-term capital gain distribution of $0.01146 per share and a long-term capital gain distribution of $0.01444 per share were declared, payable on July 19, 2007, to shareholders of record on July 17, 2007. Additionally, on December 19, 2007, an income dividend of $0.310823 per share, a short-term capital gain distribution of $0.03515 per share and a long-term capital gain distribution of $0.46700 per share were declared, payable on December 20, 2007 to shareholders of record on December 18, 2007. The tax character of distributions paid during the years ended December 31, 2007 and 2006 were as follows:
Distributions paid from: | December 31, 2007 | December 31, 2006 |
| Ordinary income | $6,554,697 | $6,522,260 |
| Long-term capital gain | 5,156,537 | 1,103,295 |
These dividends are either distributed to shareholders or reinvested by the Fund in additional shares of common stock, which are issued to shareholders. For those shareholders reinvesting the dividends, the number of shares issued is based on the net asset value per share as of the close of business on the ex-dividend date.
Greenspring Fund, Incorporated
NOTES TO FINANCIAL STATEMENTS December 31, 2007 (Con’t) |
Note 3 - Purchases and Sales of Investments |
For the year ended December 31, 2007, purchases and sales of investments, other than short-term investments, aggregated $124,669,924 and $111,947,251, respectively.
Note 4 - Federal Income Taxes |
It is the Fund’s policy to comply with the requirements of the Internal Revenue Code applicable to regulated investment companies. Accordingly, the Fund intends to distribute substantially all of its taxable income. Therefore, no federal income tax provision is required.
Required Fund distributions are based on income and capital gain amounts determined in accordance with federal income tax regulations, which differ from net investment income and realized gains recognized for financial reporting purposes.
Accordingly, the composition of net assets and distributions on a tax basis may differ from those reflected in the accompanying financial statements. As of December 31, 2007, the components of distributable earnings on a tax basis were as follows:
| Cost of investments | | $ | 220,270,244 | |
Gross tax unrealized appreciation | | | 57,015,080 | |
| Gross tax unrealized depreciation | | | (19,939,003 | ) |
| Net tax unrealized appreciation | | | 37,076,077 | |
Undistributed ordinary income | | | 1,479,411 | |
| Undistributed long-term capital gain | | | 2,581,726 | |
| Total distributable earnings | | | 4,061,137 | |
| Other accumulated gains/(losses) | | | — | |
| Total accumulated earnings/(losses) | | $ | 41,137,214 | |
Accounting principles generally accepted in the United States of America require that certain components of net assets relating to permanent differences be reclassified between financial and tax reporting. These reclassifications have no effect on net assets or net asset value per share. For the year ended December 31, 2007, the Fund decreased accumulated net investment loss by $70,175 and decreased undistributed net realized gain on investments by $70,175.
Unaudited - The Fund designates 20.08% of dividends declared from net investment income during the fiscal year ended December 31, 2007 as qualified income under Jobs and Growth Tax Relief Reconciliation Act of 2003. For corporate shareholders in the Fund, the percentage of ordinary dividend income distributed for the year
Greenspring Fund, Incorporated
NOTES TO FINANCIAL STATEMENTS December 31, 2007 (Con’t) |
ended December 31, 2007, which is designated as qualifying for the dividends-received deduction, is 18.84%. For foreign shareholders in the Fund, for the year ended December 31, 2007, 67.50% of the ordinary distributions paid qualify as interest related dividends under the Internal Revenue Code Section 871(k)(1)(c), and 7.65% of the ordinary income distributions are designated as short-term capital gain distributions under Internal Revenue Code Section 871(k)(2)(c).
Note 5 - Transactions with Related Parties |
Corbyn serves as the Fund’s investment adviser. Under an agreement between the Fund and Corbyn, the Fund pays Corbyn a fee of 0.75% of the first $250 million of average daily net assets, 0.70% of average daily net assets between $250 million and $500 million and 0.65% of average daily net assets in excess of $500 million, which is computed daily and paid monthly. For the year ended December 31, 2007, the Fund incurred $1,973,717 in advisory fees.
The Fund has also entered into a Services Agreement with Corbyn to provide various administrative services. As compensation, the Fund pays Corbyn a fee of $2,500 per month plus 0.01% of average daily net assets, which is computed daily and paid monthly. For the year ended December 31, 2007, the Fund incurred $56,412 in administrative fees to Corbyn.
At December 31, 2007, investors for whom Corbyn was investment adviser held 813,813 shares of the Fund’s common stock.
Note 6 - Shareholder Servicing Fees |
Both the Fund and Corbyn have entered into various Shareholder Servicing Agreements, whereby a fee is paid to certain service agents who administer omnibus accounts for indirect shareholders of the Fund. The Board of Directors has authorized the Fund to pay the amount of the fees it estimates the Fund would have been charged by its transfer agent for administering the accounts on an individual basis. The amount is included in “Transfer agent fees” on the accompanying Statement of Operations. For the year ended December 31, 2007, the Fund incurred $140,900 of such fees.
Note 7 - New Accounting Pronouncements |
Effective June 29, 2007, the Fund adopted Financial Accounting Standards Board (“FASB”) Interpretation No. 48 (“FIN 48”), “Accounting for Uncertainty in Income Taxes,” a clarification of FASB Statement No. 109, “Accounting for Income Taxes.” FIN 48 establishes financial reporting rules regarding recognition and measurement of tax positions taken or expected to be taken on a tax return. Management has
Greenspring Fund, Incorporated
NOTES TO FINANCIAL STATEMENTS December 31, 2007 (Con’t) |
analyzed the Fund’s tax positions taken on federal income tax returns for all open tax years (tax years ended December 31, 2004 - 2007) for purposes of implementing FIN 48, and has concluded that no provision for income tax is required in the Fund’s financial statements.
In September 2006, the FASB issued Statement of Financial Accounting Standards (“SFAS”) No. 157, “Fair Value Measurements” (“SFAS 157”). SFAS 157 defines fair value, establishes a framework for measuring fair value in accordance with GAAP, and expands disclosure about fair value measurements. SFAS 157 is effective for financial statements issued for fiscal years beginning after November 15, 2007. Management is currently evaluating the implications of SFAS 157, and its impact on the financial statements has not yet been determined.
Greenspring Fund, Incorporated
REPORT OF INDEPENDENT REGISTERED PUBLIC ACCOUNTING FIRM
Board of Directors and Shareholders
Greenspring Fund, Incorporated
Lutherville, Maryland
We have audited the accompanying statement of assets and liabilities of the Greenspring Fund, Incorporated (the “Fund”), including the portfolio of investments, as of December 31, 2007, and the related statement of operations for the year then ended, the statement of changes in net assets for each of the two years in the period then ended, and financial highlights for each of the four years in the period then ended. These financial statements and financial highlights are the responsibility of the Fund’s management. Our responsibility is to express an opinion on these financial statements and financial highlights based on our audits. The financial highlights for the year ended December 31, 2003 have been audited by other auditors whose report dated January 21, 2004 expressed an unqualified opinion on such financial highlights.
We conducted our audits in accordance with the standards of the Public Company Accounting Oversight Board (United States). Those standards require that we plan and perform the audit to obtain reasonable assurance about whether the financial statements and financial highlights are free of material misstatement. The Fund is not required to have, nor were we engaged to perform, an audit of its internal control over financial reporting. Our audits included consideration of internal control over financial reporting as a basis for designing audit procedures that are appropriate in the circumstances, but not for the purpose of expressing an opinion on the effectiveness of the Fund’s internal control over financial reporting. Accordingly, we express no such opinion. An audit includes examining, on a test basis, evidence supporting the amounts and disclosures in the financial statements. Our procedures included confirmation of securities owned as of December 31, 2007, by correspondence with the custodian and brokers. An audit also includes assessing the accounting principles used and significant estimates made by management, as well as evaluating the overall financial statement presentation. We believe that our audits provide a reasonable basis for our opinion.
In our opinion, the financial statements and financial highlights referred to above present fairly, in all material respects, the financial position of the Greenspring Fund, Incorporated as of December 31, 2007, the results of its operations for the year then ended, the changes in its net assets for each of the two years in the period then ended, and the financial highlights for each of the four years in the period then ended, in conformity with accounting principles generally accepted in the United States of America.
TAIT, WELLER & BAKER LLP
Philadelphia, Pennsylvania
February 8, 2008
Greenspring Fund, Incorporated
Basic Information About Fund Directors and Officers
(Unaudited)
The Board of Directors supervises the management of the Fund. The following list summarizes information on the directors and officers of the Fund for the past five years. The address of each is 2330 West Joppa Road, Suite 110, Lutherville, MD 21093. The Fund’s Statement of Additional Information contains additional information about Fund directors and is available, without charge, upon request, by calling the Fund at (800) 366-3863, or by emailing the Fund at greenspring@greenspringfund.com.
Name, Address andDate of Birth | Position Held withthe Fund | Term of Office andLength of Time ServedTerm of Director Until next Annual Meeting ofStockholders and thereafter until a | Principal Occupation(s)During the Past Five Years | |
Interested Directors/Officers | | | | |
| Charles vK. Carlson | President | From March 1993 to present. | President and Director of the | None |
| Date of Birth 11/30/59 | Chairman of the Board | From January 1994 to present. | Fund’s Adviser. | |
| | Chief Executive Officer | From February 1994 to present. | | |
| | Director | From March 1987 to present. | | |
| William E. Carlson | Director | From February 1994 to present. | President of Shapiro Sher | None |
| Date of Birth 7/23/57 | | | Guinot & Sandler (a law firm) | |
| | | | from February 1999 to present. | |
| | | | Partner of Shapiro Sher | |
| | | | Guinot & Sandler from | |
| | | | February 1990 to present. | |
| Michael J. Fusting | Sr. Vice President | From May 1998 to present. | Managing Director of the | None |
| Date of Birth 1/12/61 | Chief Financial Officer | From February 1994 to present. | Fund’s Adviser. | |
| | Director | From March 1992 to present. | | |
| Michael T. Godack | Sr. Vice President | From March 1991 to present. | Managing Director of the | None |
| Date of Birth 1/24/54 | Director | From October 1982 to present. | Fund’s Adviser. | |
Greenspring Fund, Incorporated
Name, Address andDate of Birth | Position Held withthe Fund | Term of Office andLength of Time Served Term of DirectorUntil next Annual Meeting ofStockholders and thereafter until a | Principal Occupation(s)During the Past Five Years | |
Interested Directors/Officers (con’t) | | | | |
| Richard Hynson, Jr. | Director | From March 1985 to present. | Sr. Vice President and Managing | None |
| Date of Birth 2/16/44 | | | Director of the Fund’s Adviser. | |
| | | | | |
Disinterested Directors | | | | |
| David T. Fu | Director | From May 1990 to present. | Managing Director of Kanturk | None |
| Date of Birth 6/2/56 | | | Partners, LLC (a merchant bank) | |
| | | | from February 2004 to present. | |
| | | | Managing Director of Galway | |
| | | | Partners LLC (a merchant bank) | |
| | | | from May 2001 to January 2004. | |
| Sean T. Furlong | Director | From March 2003 to present. | Director of Finance and | None |
| Date of Birth 11/2/65 | | | Administration at the Gilman | |
| | | | School from June 2003 to present. | |
| | | | Director of Strategic Planning of | |
| | | | Newell-Rubbermaid (marketer of | |
| | | | consumer products) from August | |
| | | | 2002 to May 2003. | |
Greenspring Fund, Incorporated
Name, Address andDate of Birth | Position Held withthe Fund | Term of Office andLength of Time ServedTerm of DirectorUntil next Annual Meeting ofStockholders and thereafter until a | Principal Occupation(s)During the Past Five Years | |
Disinterested Directors (con’t) | | | | |
| Michael P. O’Boyle | Director | From July 2000 to present. | Chief Operating Officer of The | None |
| Date of Birth 5/20/56 | | | Cleveland Clinic Foundation | |
| | | | (world-renowned non-profit | |
| | | | provider of health care services, | |
| | | | education and research) and The | |
| | | | Cleveland Clinic Health System | |
| | | | from July 2005 to present. Chief | |
| | | | Financial Officer of The Cleveland | |
| | | | Clinic Foundation and The | |
| | | | Cleveland Clinic Health System | |
| | | | from October 2001 to June 2005. | |
Officers | | | | |
| Elizabeth Agresta Swam | Secretary | From May 1998 to present. | Employee of the Fund’s Adviser | None |
| Date of Birth 5/13/67 | and Treasurer | | from May 1998 to present. | |
| | AML Officer | From July 2002 to present. | | |
| | Chief Compliance | From July 2004 to present. | | |
| | Officer | | | |
Greenspring Fund, Incorporated
Greenspring Fund, Incorporated
Performance Since Inception on
July 1, 1983 through December 31, 2007
(Unaudited)
HOW $10,000 INVESTED ON 7/1/83 WOULD HAVE GROWN* |
| * | Figures include changes in principal value, reinvested dividends and capital gains distributions. Past expense limitations increased the Fund’s return. This chart illustrates the performance of a hypothetical $10,000 investment made in the Fund since inception through December 31, 2007. The total value of $127,414 assumes the reinvestment of dividends and capital gains, but does not reflect the effect of any redemption fees. This chart does not imply any future performance. |
Average annual total returns for the one, three, five and ten year periods ended December 31, 2007 were 5.32%, 8.02%, 12.46% and 6.40%, respectively. Average annual returns for more than one year assume a compounded rate of return and are not the Fund’s year-by-year results, which fluctuated over the periods shown. Returns do not reflect taxes that shareholders may pay on Fund distributions or redemption of Fund shares.
Greenspring Fund, Incorporated
Greenspring Fund, Incorporated
2330 West Joppa Road, Suite 110
Lutherville, MD 21093
(410) 823-5353
(800) 366-3863
www.greenspringfund.com
The Fund’s proxy voting policies and procedures, as well as its proxy voting record for the most recent 12 month period ended June 30, are available without charge, upon request, by contacting the Fund at (800) 366-3863 or greenspring@greenspringfund.com. The Fund will send the information within three business days of receipt of the request, by first class mail or other means designed to ensure equally prompt delivery. The Fund’s proxy voting record is also available on the Commission’s website at http://www.sec.gov. The Fund files its complete schedule of portfolio holdings with the Commission for the first and third quarters of each fiscal year on Form N-Q. The Fund’s Forms N-Q are available on the Commission’s website and may be reviewed and copied at the Commission’s Public Reference Room in Washington, DC. Information on the operation of the Public Reference Room may be obtained by calling (202) 551-8090. The Fund’s first and third quarter reports are available on its website at www.greenspringfund.com.
DIRECTORS | ADMINISTRATOR, FUND |
| Charles vK. Carlson, Chairman | ACCOUNTANT AND TRANSFER |
| William E. Carlson | AGENT |
| David T. Fu | U.S. Bancorp Fund Services, LLC |
| Sean T. Furlong | 615 East Michigan Street |
Michael J. FustingMichael T. GodackRichard Hynson, Jr.Michael P. O’Boyle OFFICERS Charles vK. CarlsonPresident and Chief Executive Officer Michael J. Fusting Sr. Vice President andChief Financial Officer Michael T. GodackSr. Vice President Elizabeth Agresta SwamChief Compliance Officer,Secretary, Treasurerand AML Officer INVESTMENT ADVISER Corbyn Investment Management, Inc.2330 West Joppa Road, Suite 108Lutherville, MD 21093-7207 | Milwaukee, WI 53202 DISTRIBUTORQuasar Distributors, LLC615 East Michigan StreetMilwaukee, WI 53202 U.S. Bank, N.A.1555 N. RiverCenter Dr., Suite 302Milwaukee, WI 53212 INDEPENDENT REGISTEREDPUBLIC ACCOUNTING FIRM Tait, Weller & Baker LLP 1818 Market Street, Suite 2400 Philadelphia, PA 19103 LEGAL COUNSEL Kirkpatrick & LockhartPreston Gate Ellis LLP1601 K Street NWWashington, DC 20006 |
Item 2. Code of Ethics.
The registrant has adopted a code of ethics that applies to the registrant’s principal executive officer and principal financial officer. The registrant has not made any amendments to its code of ethics during the period covered by this report. The registrant has not granted any waivers from any provisions of the code of ethics during the period covered by this report.
A copy of the registrant’s Code of Ethics is filed herewith.
Item 3. Audit Committee Financial Expert.
The registrant’s board of directors has determined that there is at least one audit committee financial expert serving on its audit committee. Mr. Sean T. Furlong is the “audit committee financial expert” and is considered to be “independent” as each term is defined in Item 3 of Form N-CSR.
Item 4. Principal Accountant Fees and Services.
The registrant has engaged its principal accountant to perform audit services, audit-related services, tax services or other services during the past two fiscal years. “Audit services” refer to performing an audit of the registrant's annual financial statements or services that are normally provided by the accountant in connection with statutory and regulatory filings or engagements for those fiscal years. “Audit-related services” refer to the assurance and related services by the principal accountant that are reasonably related to the performance of the audit. “Tax services” refer to professional services rendered by the principal accountant for tax compliance, tax advice, and tax planning. There were no “other services” provided by the principal accountant. The following table details the aggregate fees billed or expected to be billed for each of the last two fiscal years for audit fees, audit-related fees, tax fees and other fees by the principal accountant.
| | FYE 12/31/2007 | FYE 12/31/2006 |
| Audit Fees | $20,000 | $19,000 |
| Audit-Related Fees | N/A | N/A |
| Tax Fees | $2,800 | $2,700 |
| All Other Fees | N/A | N/A |
The audit committee has adopted pre-approval policies and procedures that require the audit committee to pre-approve all audit and non-audit services of the registrant, including services provided to any entity affiliated with the registrant. All of the principal accountant’s hours spent on auditing the registrant’s financial statements were attributed to work performed by full-time permanent employees of the principal accountant.
The following table indicates the non-audit fees billed or expected to be billed by the registrant’s accountant for services to the registrant and to the registrant’s investment adviser (and any other controlling entity, etc.—not sub-adviser) for the last two years. The audit committee of the board of directors has considered whether the provision of non-audit services that were rendered to the registrant's investment adviser is compatible with maintaining the principal accountant's independence and has concluded that the provision of such non-audit services by the accountant has not compromised the accountant’s independence.
| Non-Audit Related Fees | FYE 12/31/2007 | FYE 12/31/2006 |
| Registrant | N/A | N/A |
| Registrant’s Investment Adviser | N/A | N/A |
Item 5. Audit Committee of Listed Registrants.
Not applicable to registrants who are not listed issuers (as defined in Rule 10A-3 under the Securities Exchange Act of 1934).
Item 6. Schedule of Investments.
Schedule of Investments is included as part of the report to shareholders filed under Item 1 of this Form.
Item 7. Disclosure of Proxy Voting Policies and Procedures for Closed-End Management Investment Companies.
Not applicable to open-end investment companies.
Item 8. Portfolio Managers of Closed-End Management Investment Companies.
Not applicable to open-end investment companies.
Item 9. Purchases of Equity Securities by Closed-End Management Investment Company and Affiliated Purchasers.
Not applicable to open-end investment companies.
Item 10. Submission of Matters to a Vote of Security Holders.
Not Applicable.
Item 11. Controls and Procedures.
| (a) | The Registrant’s Chief Executive Officer and Chief Financial Officer have reviewed the Registrant's disclosure controls and procedures (as defined in Rule 30a-3(c) under the Investment Company Act of 1940 (the “Act”)) as of a date within 90 days of the filing of this report, as required by Rule 30a-3(b) under the Act and Rules 13a-15(b) or 15d-15(b) under the Securities Exchange Act of 1934. Based on their review, such officers have concluded that the disclosure controls and procedures are effective in ensuring that information required to be disclosed in this report is appropriately recorded, processed, summarized and reported and made known to them by others within the Registrant and by the Registrant’s service provider. |
| (b) | There were no changes in the Registrant's internal control over financial reporting (as defined in Rule 30a-3(d) under the Act) that occurred during the second fiscal quarter of the period covered by this report that has materially affected, or is reasonably likely to materially affect, the Registrant's internal control over financial reporting. |
Item 12. Exhibits.
| (a) | (1) Any code of ethics or amendment thereto, that is subject of the disclosure required by Item 2, to the extent that the registrant intends to satisfy Item 2 requirements through filing an exhibit. Filed herewith. |
(2) Certifications pursuant to Section 302 of the Sarbanes-Oxley Act of 2002. Filed herewith.
(3) Any written solicitation to purchase securities under Rule 23c-1 under the Act sent or given during the period covered by the report by or on behalf of the registrant to 10 or more persons. Not applicable to open-end investment companies.
(b) | Certification pursuant to Section 906 of the Sarbanes-Oxley Act of 2002. Furnished herewith. |
SIGNATURES
Pursuant to the requirements of the Securities Exchange Act of 1934 and the Investment Company Act of 1940, the registrant has duly caused this report to be signed on its behalf by the undersigned, thereunto duly authorized.
(Registrant) Greenspring Fund, Incorporated
By (Signature and Title) /s/ Charles vK. Carlson
Charles vK. Carlson, Chief Executive Officer
Date March 5, 2008
Pursuant to the requirements of the Securities Exchange Act of 1934 and the Investment Company Act of 1940, this report has been signed below by the following persons on behalf of the registrant and in the capacities and on the dates indicated.
By (Signature and Title) /s/ Charles vK. Carlson
Charles vK. Carlson, Chief Executive Officer
Date March 5, 2008
By (Signature and Title) /s/ Michael J. Fusting
Michael J. Fusting, Chief Financial Officer
Date March 5, 2008