UNITED STATES
SECURITIES AND EXCHANGE COMMISSION
Washington, D.C. 20549 |
FORM N-CSR
CERTIFIED SHAREHOLDER REPORT OF REGISTERED
MANAGEMENT INVESTMENT COMPANIES |
Investment Company Act file number: (811- 03630 )
Exact name of registrant as specified in charter: Putnam California Tax Exempt Income Fund
Address of principal executive offices: One Post Office Square, Boston, Massachusetts 02109
| Name and address of agent for service: | Beth S. Mazor, Vice President |
| | One Post Office Square |
| | Boston, Massachusetts 02109 |
| |
| Copy to: | John W. Gerstmayr, Esq. |
| | Ropes & Gray LLP |
| | One International Place |
| | Boston, Massachusetts 02110 |
Registrant’s telephone number, including area code: (617) 292-1000
Date of fiscal year end: September 30, 2006
Date of reporting period: October 1, 2005—September 30, 2006
Item 1. Report to Stockholders:
The following is a copy of the report transmitted to stockholders pursuant
to Rule 30e-1 under the Investment Company Act of 1940: |
What makes
Putnam different?
A time-honored tradition in
money management
Since 1937, our values have been rooted in a profound sense of responsibility for the money entrusted to us.
A prudent approach to investing
We use a research-driven team approach to seek consistent, dependable, superior investment results over time, although there is no guarantee a fund will meet its objectives.
Funds for every investment goal
We offer a broad range of mutual funds and other financial products so investors and their financial representatives can build diversified portfolios.
A commitment to doing what’s right
for investors
We have below-average expenses and stringent investor protections, and provide a wealth of information about the Putnam funds.
Industry-leading service
We help investors, along with their financial representatives, make informed investment decisions with confidence.

In 1830, Massachusetts Supreme Judicial Court Justice Samuel Putnam established The Prudent Man Rule, a legal foundation for responsible money management.
THE PRUDENT MAN RULE
All that can be required of a trustee to invest is that he shall conduct himself faithfully and exercise a sound discretion. He is to observe how men of prudence, discretion, and intelligence manage their own affairs, not in regard to speculation, but in regard to the permanent disposition of their funds, considering the probable income, as well as the probable safety of the capital to be invested.

Putnam
California Tax
Exempt Income
Fund
9| 30| 06
Annual Report
| Message from the Trustees | 1 |
| About the fund | 2 |
| Report from the fund managers | 5 |
| Performance | 9 |
| Expenses | 11 |
| Portfolio turnover | 13 |
| Risk | 13 |
| Your fund’s management | 14 |
| Terms and definitions | 16 |
| Trustee approval of management contract | 17 |
| Other information for shareholders | 20 |
| Financial statements | 21 |
| Federal tax information | 42 |
| About the Trustees | 43 |
| Officers | 47 |
Cover photograph: © Richard H. Johnson
Message from the Trustees

Putnam California Tax Exempt Income Fund:
potential for tax-advantaged high current income
When investing in tax-exempt bonds, opportunities come in all shapes and sizes. This is especially true with Putnam California Tax Exempt Income Fund. This fund explores the vast California municipal bond market to deliver to investors the potential for high current income and tax advantages.
Municipal bonds are typically issued by states and local municipalities to raise funds for building and maintaining public facilities. They are backed by either the issuing state, city, or town, or by revenues collected from usage fees. As a result, they have varying degrees of credit risk — that is, the risk that the issuer will not be able to repay the bond.
A municipal bond’s greatest benefit is that its income is generally exempt from federal income tax, and from state income tax for residents of the state in which the bond is issued. In California, this tax exemption is an especially powerful advantage because the state’s maximum income-tax rate is among the highest in the United States. And the sheer size of the California municipal bond market — it is one of the largest and most diverse in the country, encompassing virtually every sector of the municipal bond market — enables it to establish trends and shape demand in municipal bond markets across the country.
The fund capitalizes on the opportunities available in California by investing in a range of bonds — primarily investment-grade — across various sectors. When deciding whether to invest in a bond, the fund’s management team primarily considers credit risk and interest-rate risk, as well as the risk that the bond will be prepaid. Once a bond has been purchased, the management team continues to monitor developments that affect the bond market, the specific sector, and the bond issuer.
Municipal bonds may finance a range of projects in your
community and thus play a key role in its development.

The goal of the fund’s approach to research and active management is to stay a step ahead of the industry and pinpoint opportunities to adjust the fund’s holdings for the benefit of the fund and its shareholders.
This fund concentrates its investments by region and involves more risk than a fund that invests more broadly. Capital gains, if any, are taxable for federal and, in most cases, state purposes. For some investors, investment income may be subject to the federal alternative minimum tax. Income from federally exempt funds may be subject to state and local taxes. Mutual funds that invest in bonds are subject to certain risks, including interest-rate risk, credit risk, and inflation risk. As interest rates rise, the prices of bonds fall. Long-term bonds are more exposed to interest-rate risk than short-term bonds. Unlike bonds, bond funds have ongoing fees and expenses. Tax-free funds may not be suitable for IRAs and other non-taxable accounts.
Understanding
tax-equivalent yield
To understand the value of tax-free income, it is helpful to compare a municipal bond’s yield with the “tax-equivalent yield” — the before-tax yield that must be offered by a taxable bond in order to equal the municipal bond’s yield after taxes.
How to calculate tax-equivalent yield: The tax-equivalent yield equals the municipal bond’s yield divided by “one minus the tax rate.” For example, if a municipal bond’s yield is 5%, then its tax-equivalent yield is 7.7%, assuming the maximum 35% federal tax rate for 2006
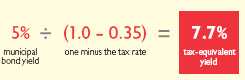
Results for investors subject to lower tax rates would not be as advantageous.

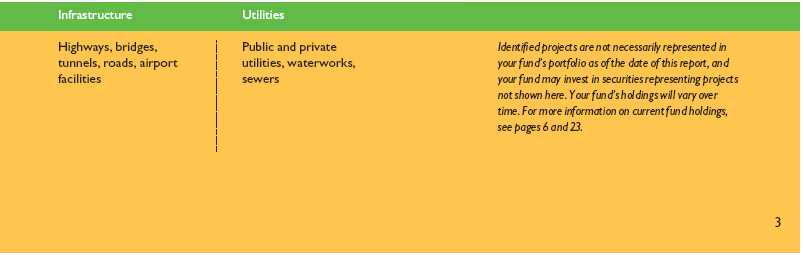
Putnam California Tax Exempt Income Fund invests typically in intermediate- to long-maturity municipal bonds issued in the state of California. Municipal bonds help finance public projects, such as schools, roads, water facilities, and hospitals. The fund may be appropriate for residents of California who seek income that is free from state and federal income tax.
Highlights
• For the 12 months ended September 30, 2006, Putnam California Tax Exempt Income Fund’s class A shares returned 4.09% without sales charges.
• The fund’s benchmark, the Lehman Municipal Bond Index, returned 4.45% .
• The average return for the fund’s Lipper category, California Municipal Debt Funds, was 4.22% .
• Additional fund performance, comparative performance, and Lipper data can be found in the performance section beginning on page 9.
Performance
Total return for class A shares for periods ended 9/30/06
Since the fund's inception (4/29/83), average annual return is 7.28% at NAV and 7.10% at POP.
| | Average annual return | Cumulative return |
|
| | NAV | POP | NAV | POP |
|
| 10 years | 5.24% | 4.83% | 66.58% | 60.29% |
|
| 5 years | 4.43 | 3.61 | 24.19 | 19.40 |
|
| 3 years | 4.24 | 2.94 | 13.27 | 9.09 |
|
| 1 year | 4.09 | 0.22 | 4.09 | 0.22 |
|
Data is historical. Past performance does not guarantee future results. More recent returns may be less or more than those shown. Investment return and principal value will fluctuate, and you may have a gain or a loss when you sell your shares. Performance assumes reinvestment of distributions and does not account for taxes. Returns at NAV do not reflect a sales charge of 3.75% . For the most recent month-end performance, visit www.putnam.com. A 1% short-term trading fee may apply.
4
Report from the fund managers
The year in review
Prompted by a brisk U.S. economy and rising oil prices, the Fed maintained upward pressure on interest rates for much of the fiscal year ended September 30, 2006, as it sought to reduce the prospect of inflation. Meanwhile, investors continued to bid up prices of higher-yielding bonds. Your fund’s emphasis on tobacco settlement bonds was an advantage during the period, helping to keep its results at net asset value (NAV, or without sales charges) relatively in line with the average for its Lipper category. However, the fund’s generally higher credit quality and modest exposure to longer-term bonds caused its results to lag its benchmark index. Although the portfolio’s underweight position in longer-maturity bonds and high-risk market areas like airlines was a drawback during the period, we stand by the prudence of these strategies and continue to emphasize diversification during this volatile market period.
Market overview
Following a string of 17 increases in the federal funds rate —including six that occurred during the fund’s fiscal year — the Fed suspended its credit-tightening program in August, opting to hold the benchmark rate for overnight loans between banks steady at 5.25% . Statements from the Federal Open Market Committee, the Fed’s policy-setting panel, indicate that future rate increases are possible but will depend on whether the Fed concludes that its two-year campaign to keep inflation in check has been successful.
Reflecting the Fed’s activity, yields on shorter-term bonds rose dramatically during the period, while yields on intermediate- and long-term bonds declined, leading to a convergence of shorter- and longer-term rates. As rates converged, the yield curve — a graphical representation of yields for bonds of comparable quality plotted from the shortest to the longest maturity — flattened.
A generally healthy economy, coupled with robust demand, contributed to the strong relative performance of lower-rated bonds. Among uninsured bonds in general and especially bonds rated Baa and below, yield spreads tightened as lower-rated bonds performed better than higher-rated bonds. The superior performance of
| Market sector performance | |
| These indexes provide an overview of performance in different market sectors for the 12 months ended 9/30/06. |
| |
|
| |
| Bonds | |
|
| Lehman Municipal Bond Index | |
| (tax-exempt bonds) | 4.45% |
|
| Lehman Aggregate Bond Index | |
| (broad bond market) | 3.67% |
|
| Lehman Government Bond Index | |
| (U.S. Treasury and agency securities) | 3.30% |
|
| Lehman Intermediate Treasury Bond Index | |
| (intermediate-maturity U.S. Treasury bonds) | 3.37% |
|
| Equities | |
|
| S&P 500 Index | |
| (broad stock market) | 10.79% |
|
| S&P Utilities Index | |
| (utilities stocks) | 4.77% |
|
| Russell 2000 Index | |
| (small-company stocks) | 9.92% |
5
lower-rated bonds was primarily the result of strong demand from buyers searching for higher yields. Non-rated bonds also rallied.
Market sectors that performed particularly well during the period included airline-related industrial development bonds (IDBs); securities issued by hospitals, utilities, and long-term care facilities; and bonds secured by land agreements. Tobacco settlement bonds, meanwhile, underperformed other credit-sensitive sectors modestly, but still outperformed higher-rated bonds. Limited issuance of tobacco settlement-related securities, coupled with strong investor demand, provided solid supply-and-demand support for the sector.
Strategy overview
Given our expectation for rising interest rates, we maintained a short (defensive) portfolio duration relative to the fund’s Lipper peer group, a strategy that detracted moderately from results as bonds with longer maturities generally outperformed those with shorter maturities. In order to keep the fund’s duration relatively short, we limited exposure to longer-maturity bonds, favoring intermediate-maturity securities instead. Duration is a measure of a fund’s sensitivity to changes in interest rates. Having a shorter-duration portfolio may help protect principal when interest rates rise, but it can reduce appreciation potential when rates fall. In light of the changing interest-rate environment, we had extended the fund’s duration by the end of the period, but still maintained a defensive posture relative to the peer group.
The fund’s higher overall credit quality compared to other funds in its peer group held back performance, as the lowest-quality tiers of the municipal bond market delivered the strongest results during the period. Although we continue to seek opportunities among lower-rated bonds that meet our credit standards, we believe valuations at the low-quality tiers of the market have become stretched and intend to continue favoring higher-quality bonds over the near term.
Your fund’s holdings
In spite of the ongoing legal challenges faced by the tobacco industry, your fund’s emphasis on tobacco settlement bonds continued to contribute favorably to performance. The relatively high interest these bonds pay is secured by tobacco companies’ settlement obligations to the states, so they generally offer higher yields than bonds of comparable quality. An improving litigation environment has led to higher prices for these bonds. The most recent class action challenge to the industry, launched this spring, had relatively little effect on the market. Moreover, we think tobacco settlement bonds provide valuable diversification, since their performance is not as closely tied to economic

Average effective duration and average effective maturity take into account put and call features, where applicable, and reflect prepayments for mortgage-backed securities. Duration is usually shorter than maturity because it reflects interest payments on a bond prior to its maturity.
6
growth as that of other, more economically sensitive holdings. The fund owns tobacco settlement bonds issued in
California and Puerto Rico.
General obligation bonds issued by Puerto Rico were downgraded in May due to financial turmoil that led to a partial government shutdown. Prices of uninsured Puerto Rico bonds declined, providing us an opportunity to add to the fund’s holdings at favorable price levels. We purchased Puerto Rico Government Development Bank bonds in May at attractive valuations. Puerto Rico bonds rallied late in the period, offsetting the sector’s earlier underperformance.
Credit spreads — the difference in yield between lower-and higher-rated bonds — continued a narrowing trend that started early in 2003, as investors became more aggressive in pursuit of income. Rising corporate profits also improved the financial strength of some issuers, and their bonds rose in value. Reflecting this trend, several industrial development bonds (IDBs) were among the fund’s strongest performers. IDBs are issued by municipalities but backed by the credit of the company or institution benefiting from the financing. Investor perceptions about the backing company’s health, or that of its industry group, affect the prices of these bonds more than the rating of the issuing municipality.
Several of the fund’s IDBs were pre-refunded during the fiscal year, and the fund’s performance benefited as a result.
Pre-refunding occurs when an issuer refinances an older, higher-coupon bond by issuing new bonds at lower interest rates. The proceeds are then invested in a secure investment — usually U.S. Treasury securities — that matures at the older bond’s first call date, effectively raising the bond’s perceived rating, and usually its price. Fund holdings that were pre-refunded included certain bonds issued by the California Department of Water Resources in 2002 when interest rates were high and the state was in the grip of a power crisis.
Another area we find interesting is the single-family housing market. Rising interest rates and declining mortgage prepayments have benefited this sector, although attractive investments appropriate for this fund are difficult to find. In September we were able to purchase some California Housing Finance Authority AMT Home Mortgage bonds that combine a relatively high rating and an attractive yield.
Please note that the holdings discussed in this report may not have been held by the fund for the entire period. Portfolio composition is subject to review in accordance with the fund’s investment strategy and may vary in the future.
Credit quality overview
Credit qualities shown as a percentage of portfolio value as of 9/30/06. A bond rated Baa or higher is considered investment grade. The chart reflects Moody’s ratings; percentages may include bonds not rated by Moody’s but considered by Putnam Management to be of comparable quality. Ratings will vary over time.

7
The outlook for your fund
The following commentary reflects anticipated developments that could affect your fund over the next six months, as well as your management team’s plans for responding to them.
It appears that the Fed has left the door open for future rate increases as it continues its efforts to engineer a “soft landing” for the economy. (A soft landing occurs when economic growth slows but is still solid enough to sustain job creation and corporate profits.) Therefore, while we anticipate that economic growth is likely to slow as we move into 2007, we plan to maintain a defensive duration strategy until longer-range Fed policy becomes clearer. In addition, given the municipal market’s exceptionally strong performance relative to Treasuries throughout the period, valuations have become elevated to levels that, we believe, argue in favor of taking a defensive approach over the near term.
In our view, the extended rally among lower-rated, higher-yielding bonds may be in its final stages. We base this view, in part, on the fact that the difference in yield between Aaa-rated bonds and Baa-rated bonds — the highest and lowest investment-grade ratings, respectively — is at its narrowest point since late 1999. In other words, the higher-income advantage available to those willing to assume additional credit risk has diminished substantially.
Among sectors, we remain positive on tobacco settlement bonds and currently plan to maintain, relative to your fund’s peer group, an overweight allocation to the sector, believing that the bonds continue to offer an attractive risk/reward profile. We are also seeking to maintain the fund’s exposure to the single-family housing sector.
The views expressed in this report are exclusively those of Putnam Management. They are not meant as investment advice.
This fund concentrates its investments by region and involves more risk than a fund that invests more broadly. Capital gains, if any, are taxable for federal and, in most cases, state purposes. For some investors, investment income may be subject to the federal alternative minimum tax. Income from federally exempt funds may be subject to state and local taxes. Mutual funds that invest in bonds are subject to certain risks, including interest-rate risk, credit risk, and inflation risk. As interest rates rise, the prices of bonds fall. Long-term bonds are more exposed to interest-rate risk than short-term bonds. Unlike bonds, bond funds have ongoing fees and expenses. Tax-free funds may not be suitable for IRAs and other non-taxable accounts.
8
Your fund’s performance
This section shows your fund’s performance for periods ended September 30, 2006, the end of its fiscal year. Performance should always be considered in light of a fund’s investment strategy. Data represents past performance. Past performance does not guarantee future results. More recent returns may be less or more than those shown. Investment return and principal value will fluctuate, and you may have a gain or a loss when you sell your shares. For the most recent month-end performance, please visit www.putnam.com or call Putnam at 1-800-225-1581.
Fund performance Total return for periods ended 9/30/06
| | Class A | | Class B | | Class C | | Class M | |
| (inception dates) | (4/29/83) | | (1/4/93) | | (7/26/99) | | (2/14/95) | |
| | NAV | POP | NAV | CDSC | NAV | CDSC | NAV | POP |
|
| Annual average | | | | | | | | |
| (life of fund) | 7.28% | 7.10% | 6.47% | 6.47% | 6.42% | 6.42% | 6.85% | 6.70% |
|
| 10 years | 66.58 | 60.29 | 56.14 | 56.14 | 53.76 | 53.76 | 61.45 | 56.33 |
| Annual average | 5.24 | 4.83 | 4.56 | 4.56 | 4.40 | 4.40 | 4.91 | 4.57 |
|
| 5 years | 24.19 | 19.40 | 20.16 | 18.27 | 19.26 | 19.26 | 22.32 | 18.30 |
| Annual average | 4.43 | 3.61 | 3.74 | 3.41 | 3.59 | 3.59 | 4.11 | 3.42 |
|
| 3 years | 13.27 | 9.09 | 11.03 | 8.17 | 10.66 | 10.66 | 12.13 | 8.58 |
| Annual average | 4.24 | 2.94 | 3.55 | 2.65 | 3.43 | 3.43 | 3.89 | 2.78 |
|
| 1 year | 4.09 | 0.22 | 3.46 | -1.42 | 3.24 | 2.26 | 3.79 | 0.46 |
|
Performance assumes reinvestment of distributions and does not account for taxes. Returns at public offering price (POP) for class A and M shares reflect a sales charge of 3.75% and 3.25%, respectively. Class B share returns reflect the applicable contingent deferred sales charge (CDSC), which is 5% in the first year, declining to 1% in the sixth year, and is eliminated thereafter. Class C shares reflect a 1% CDSC the first year that is eliminated thereafter. Performance for class B, C, and M shares before their inception is derived from the historical performance of class A shares, adjusted for the applicable sales charge (or CDSC) and the higher operating expenses for such shares.
A 1% short-term trading fee may be applied to shares exchanged or sold within 7 days of purchase.
Change in the value of a $10,000 investment ($9,625 after sales charge)
Cumulative total return from 9/30/96 to 9/30/06
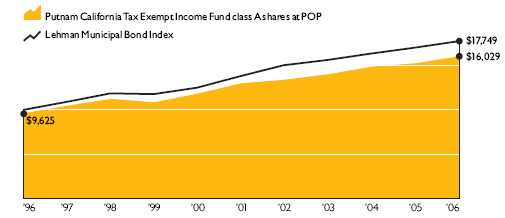
Past performance does not indicate future results. At the end of the same time period, a $10,000 investment in the fund’s class B and class C shares would have been valued at $15,614 and $15,376, respectively, and no contingent deferred sales charges would apply. A $10,000 investment in the fund’s class M shares would have been valued at $15,633. See first page of performance section for performance calculation method.
9
Comparative index returns For periods ended 9/30/06
| | | Lipper California |
| | Lehman Municipal | Municipal Debt Funds |
| | Bond Index | category average* |
|
| Annual average | | |
| (life of fund) | 7.74% | 7.28% |
|
| 10 years | 77.49 | 67.68 |
| Annual average | 5.90 | 5.29 |
|
| 5 years | 28.66 | 24.84 |
| Annual average | 5.17 | 4.53 |
|
| 3 years | 13.68 | 14.16 |
| Annual average | 4.37 | 4.50 |
|
| 1 year | 4.45 | 4.22 |
|
Index and Lipper results should be compared to fund performance at net asset value.
* Over the 1-, 3-, 5-, and 10-year periods ended 9/30/06, there were 121, 115, 97, and 73 funds, respectively, in this Lipper category.
Fund price and distribution information For the 12-month period ended 9/30/06
| Distributions | Class A | | Class B | Class C | Class M | |
|
| Number | 12 | | 12 | 12 | 12 | |
|
| Income1 | $0.340928 | $0.288182 | $0.276608 | $0.315906 |
|
| Capital gains2 | | | | | | |
|
| Long-term | 0.187700 | 0.187700 | 0.187700 | 0.187700 |
|
| Short-term | 0.000400 | 0.000400 | 0.000400 | 0.000400 |
|
| Total | $0.529028 | $0.476282 | $0.464708 | $0.504006 |
|
| Share value: | NAV | POP | NAV | NAV | NAV | POP |
| 9/30/05 | $8.43 | $8.76 | $8.42 | $8.46 | $8.41 | $8.69 |
|
| 9/30/06 | 8.23 | 8.55 | 8.22 | 8.26 | 8.21 | 8.49 |
|
| Current yield (end of period) | | | | | | |
| Current dividend rate3 | 4.08% | 3.93% | 3.45% | 3.29% | 3.79% | 3.66% |
|
| Taxable equivalent4 | 7.00 | 6.74 | 5.92 | 5.64 | 6.50 | 6.28 |
|
| Current 30-day SEC yield5 | 3.49 | 3.36 | 2.85 | 2.70 | 3.20 | 3.09 |
|
| Taxable equivalent3 | 5.99 | 5.76 | 4.89 | 4.63 | 5.49 | 5.30 |
|
1 For some investors, investment income may be subject to the federal alternative minimum tax.
2 Capital gains, if any, are taxable for federal and, in most cases, state purposes.
3 Most recent distribution, excluding capital gains, annualized and divided by NAV or POP at end of period.
4 Assumes maximum 41.70% federal and state combined tax rate for 2006. Results for investors subject to lower tax rates would not be as advantageous.
5 Based only on investment income, calculated using SEC guidelines.
10
Your fund’s expenses
As a mutual fund investor, you pay ongoing expenses, such as management fees, distribution fees (12b-1 fees), and other expenses. Using the information below, you can estimate how these expenses affect your investment and compare them with the expenses of other funds. You may also pay one-time transaction expenses, including sales charges (loads) and redemption fees, which are not shown in this section and would have resulted in higher total expenses. For more information, see your fund’s prospectus or talk to your financial advisor.
Review your fund’s expenses
The table below shows the expenses you would have paid on a $1,000 investment in Putnam California Tax Exempt Income Fund from April 1, 2006, to September 30, 2006. It also shows how much a $1,000 investment would be worth at the close of the period, assuming actual returns and expenses.
| | Class A | Class B | Class C | Class M |
|
| Expenses paid per $1,000* | $ 3.77 | $ 7.07 | $ 7.83 | $ 5.29 |
|
| Ending value (after expenses) | $1,032.20 | $1,027.80 | $1,027.90 | $1,030.70 |
|
* Expenses for each share class are calculated using the fund’s annualized expense ratio for each class, which represents the ongoing expenses as a percentage of net assets for the six months ended 9/30/06. The expense ratio may differ for each share class (see the last table in this section). Expenses are calculated by multiplying the expense ratio by the average account value for the period; then multiplying the result by the number of days in the period; and then dividing that result by the number of days in the year.
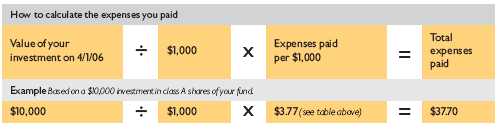
Estimate the expenses you paid
To estimate the ongoing expenses you paid for the six months ended September 30, 2006, use the calculation method below. To find the value of your investment on April 1, 2006, go to www.putnam.com and log on to your account. Click on the “Transaction History” tab in your Daily Statement and enter 04/01/2006 in both the “from” and “to” fields. Alternatively, call Putnam at 1-800-225-1581.
Compare expenses using the SEC’s method
The Securities and Exchange Commission (SEC) has established guidelines to help investors assess fund expenses. Per these guidelines, the table below shows your fund’s expenses based on a $1,000 investment, assuming a hypothetical 5% annualized return. You can use this information to compare the ongoing expenses (but not transaction expenses or total costs) of investing in the fund with those of other funds. All mutual fund shareholder reports will provide this information to help you make this comparison. Please note that you cannot use this information to estimate your actual ending account balance and expenses paid during the period.
| | Class A | Class B | Class C | Class M |
|
| Expenses paid per $1,000* | $ 3.75 | $ 7.03 | $ 7.79 | $ 5.27 |
|
| Ending value (after expenses) | $1,021.36 | $1,018.10 | $1,017.35 | $1,019.85 |
|
* Expenses for each share class are calculated using the fund’s annualized expense ratio for each class, which represents the ongoing expenses as a percentage of net assets for the six months ended 9/30/06. The expense ratio may differ for each share class (see the last table in this section). Expenses are calculated by multiplying the expense ratio by the average account value for the period; then multiplying the result by the number of days in the period; and then dividing that result by the number of days in the year.
11
Compare expenses using industry averages
You can also compare your fund’s expenses with the average of its peer group, as defined by Lipper, an independent fund-rating agency that ranks funds relative to others that Lipper considers to have similar investment styles or objectives. The expense ratio for each share class shown below indicates how much of your fund’s net assets have been used to pay ongoing expenses during the period.
| | Class A | Class B | Class C | Class M |
|
| Your fund's annualized expense ratio* | 0.74% | 1.39% | 1.54% | 1.04% |
|
| Average annualized expense ratio for Lipper peer group† | 0.82% | 1.47% | 1.62% | 1.12% |
|
* For the fund’s most recent fiscal half year; may differ from expense ratios based on one-year data in the financial highlights.
† Simple average of the expenses of all front-end load funds in the fund’s Lipper peer group, calculated in accordance with Lipper’s standard method for comparing fund expenses (excluding 12b-1 fees and without giving effect to any expense offset and brokerage service arrangements that may reduce fund expenses). This average reflects each fund’s expenses for its most recent fiscal year available to Lipper as of 9/30/06. To facilitate comparison, Putnam has adjusted this average to reflect the 12b-1 fees carried by each class of shares. The peer group may include funds that are significantly smaller or larger than the fund, which may limit the comparability of the fund’s expenses to the simple average, which typically is higher than the asset-weighted average.
12
Your fund’s portfolio turnover
and Overall Morningstar® Risk
Putnam funds are actively managed by teams of experts who buy and sell securities based on intensive analysis of companies, industries, economies, and markets. Portfolio turnover is a measure of how often a fund’s managers buy and sell securities for your fund. A portfolio turnover of 100%, for example, means that the managers sold and replaced securities valued at 100% of a fund’s assets within a one-year period. Funds with high turnover may be more likely to generate capital gains and dividends that must be distributed to shareholders as taxable income. High turnover may also cause a fund to pay more brokerage commissions and other transaction costs, which may detract from performance.
Funds that invest in bonds or other fixed-income instruments may have higher turnover than funds that invest only in stocks. Short-term bond funds tend to have higher turnover than longer-term bond funds, because shorter-term bonds will mature or be sold more frequently than longer-term bonds. You can use the table below to compare your fund’s turnover with the average turnover for funds in its Lipper category.
Turnover comparisons
Percentage of holdings that change every year
| | 2006 | 2005 | 2004 | 2003 | 2002 |
|
| Putnam California Tax Exempt Income Fund | 12% | 21% | 13% | 22% | 7% |
|
| Lipper California Municipal Debt Funds category average | 17% | 17% | 24% | 31% | 23% |
|
Turnover data for the fund is calculated based on the fund's fiscal-year period, which ends on September 30. Turnover data for the fund's Lipper category is calculated based on the average of the turnover of each fund in the category for its fiscal year ended during the indicated year. Fiscal years vary across funds in the Lipper category, which may limit the comparability of the fund's portfolio turnover rate to the Lipper average. Comparative data for 2006 is based on information available as of 9/30/06.
Your fund’s Overall Morningstar® Risk
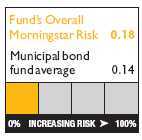
This risk comparison is designed to help you understand how your fund compares with other funds. The comparison utilizes a risk measure developed by Morningstar, an independent fund-rating agency. This risk measure is referred to as the fund’s Overall Morningstar Risk.
Your fund’s Overall Morningstar Risk is shown alongside that of the average fund in its broad asset class, as determined by Morningstar. The risk bar broadens the comparison by translating the fund’s Overall Morningstar Risk into a percentile, which is based on the fund’s ranking among all funds rated by Morningstar as of September 30, 2006. A higher Overall Morningstar Risk generally indicates that a fund’s monthly returns have varied more widely.
Morningstar determines a fund’s Overall Morningstar Risk by assessing variations in the fund’s monthly returns — with an emphasis on downside variations — over 3-, 5-, and 10-year periods, if available. Those measures are weighted and averaged to produce the fund’s Overall Morningstar Risk. The information shown is provided for the fund’s class A shares only; information for other classes may vary. Overall Morningstar Risk is based on historical data and does not indicate future results. Morningstar does not purport to measure the risk associated with a current investment in a fund, either on an absolute basis or on a relative basis. Low Overall Morningstar Risk does not mean that you cannot lose money on an investment in a fund. Copyright 2006 Morningstar, Inc. All Rights Reserved. The information contained herein (1) is proprietary to Morningstar and/or its content providers; (2) may not be copied or distributed; and (3) is not warran ted to be accurate, complete, or timely. Neither Morningstar nor its content providers are responsible for any damages or losses arising from any use of this information.
13
14
Your fund’s management
Your fund is managed by the members of the Putnam Tax Exempt Fixed-Income Team. James St. John is the Portfolio Leader, and Paul Drury, Brad Libby, Susan McCormack, and Thalia Meehan are Portfolio Members of your fund. The Portfolio Leader and Portfolio Members coordinate the team’s management of the fund.
For a complete listing of the members of the Putnam Tax Exempt Fixed-Income Team, including those who are not Portfolio Leaders or Portfolio Members of your fund, visit Putnam’s Individual Investor Web site at www.putnam.com.
Investment team fund ownership
The table below shows how much the fund’s current Portfolio Leader and Portfolio Members have invested in the fund and in all Putnam mutual funds (in dollar ranges). Information shown is as of September 30, 2006, and September 30, 2005.

N/A indicates the individual was not a Portfolio Leader or Portfolio Member as of 9/30/05.
Trustee and Putnam employee fund ownership
As of September 30, 2006, all of the 11 Trustees then on the Board of the Putnam funds owned fund shares. The table below shows the approximate value of investments in the fund and all Putnam funds as of that date by the Trustees and Putnam employees. These amounts include investments by the Trustees’ and employees’ immediate family members and investments through retirement and deferred compensation plans.
| | | Total assets in |
| | Assets in the fund | all Putnam funds |
|
| Trustees | $35,000 | $ 90,000,000 |
|
| Putnam employees | $14,000 | $418,000,000 |
|
Fund manager compensation
The total 2005 fund manager compensation that is attributable to your fund is approximately $1,000,000. This amount includes a portion of 2005 compensation paid by Putnam Management to the fund managers listed in this section for their portfolio management responsibilities, calculated based on the fund assets they manage taken as a percentage of the total assets they manage. The compensation amount also includes a portion of the 2005 compensation paid to the Chief Investment Officer of the team and the Group Chief Investment Officer of the fund’s broader investment category for their oversight responsibilities, calculated based on the fund assets they oversee taken as a percentage of the total assets they oversee. This amount does not include compensation of other personnel involved in research, trading, administration, systems, compliance, or fund operations; nor does it include non-compensation costs. These percentages are determined as of the fund’s fiscal period-end. For personnel who joined Putnam Management during or after 2005, the calculation reflects annualized 2005 compensation or an estimate of 2006 compensation, as applicable.
14
Other Putnam funds managed by the Portfolio Leader and Portfolio Members
James St. John is the Portfolio Leader and Paul Drury, Brad Libby, Susan McCormack, and Thalia Meehan are Portfolio Members of Putnam’s tax-exempt funds for the following states: Arizona, Florida, Massachusetts, Michigan, Minnesota, New Jersey, New York, Ohio, and Pennsylvania. The same group also manages Putnam AMT-Free Insured Municipal Fund, Putnam California Investment Grade Municipal Trust, Putnam Investment Grade Municipal Trust, Putnam Municipal Bond Fund, Putnam Municipal Opportunities Trust, Putnam New York Investment Grade Municipal Trust, and Putnam Tax Exempt Income Fund.
Paul Drury is the Portfolio Leader and Brad Libby, Susan McCormack, Thalia Meehan, and James St. John are Portfolio Members of Putnam High Yield Municipal Trust, Putnam Managed Municipal Income Trust, Putnam Tax-Free Health Care Fund, and Putnam Tax-Free High Yield Fund.
James St. John, Paul Drury, Brad Libby, Susan McCormack, and Thalia Meehan may also manage other accounts and variable trust funds advised by Putnam Management or an affiliate.
Changes in your fund’s Portfolio Leader and Portfolio Members
During the year ended September 30, 2006, Portfolio Member James St. John became Portfolio Leader, and Brad Libby and Thalia Meehan became Portfolio Members of your fund. These changes follow the departure of Portfolio Leader David Hamlin from your fund’s management team.
Putnam fund ownership by Putnam’s Executive Board
The table below shows how much the members of Putnam’s Executive Board have invested in all Putnam mutual funds (in dollar ranges). Information shown is as of September 30, 2006, and September 30, 2005.
| | | | $1 – | $10,001 – | $50,001 – | $100,001 – | $500,001 – | $1,000,001 |
| | Year | $0 | $10,000 | $50,000 | $100,000 | $500,000 | $1,000,000 | and over |
|
| Philippe Bibi | 2006 | | | | | | | • |
| Chief Technology Officer | 2005 | | | | | | | • |
|
| Joshua Brooks | 2006 | | | | | | | • |
| Deputy Head of Investments | 2005 | | | | | | | • |
|
| William Connolly | 2006 | | | | | | | • |
| Head of Retail Management | 2005 | | | | | | | • |
|
| Kevin Cronin | 2006 | | | | | | | • |
| Head of Investments | 2005 | | | | | | | • |
|
| Charles Haldeman, Jr. | 2006 | | | | | | | • |
| President and CEO | 2005 | | | | | | | • |
|
| Amrit Kanwal | 2006 | | | | | | • | |
| Chief Financial Officer | 2005 | | | | | | • | |
|
| Steven Krichmar | 2006 | | | | | | • | |
| Chief of Operations | 2005 | | | | | | | • |
|
| Francis McNamara, III | 2006 | | | | | | | • |
| General Counsel | 2005 | | | | | | | • |
|
| Jeffrey Peters | 2006 | | | | | | | • |
| Head of International Business | N/A | | | | | | | |
|
| Richard Robie, III | 2006 | | | | | | • | |
| Chief Administrative Officer | 2005 | | | | | | • | |
|
| Edward Shadek | 2006 | | | | | | | • |
| Deputy Head of Investments | 2005 | | | | | | | • |
|
| Sandra Whiston | 2006 | | | | | | • | |
| Head of Institutional Management | 2005 | | | | | | • | |
|
N/A indicates the individual was not a member of Putnam’s Executive Board as of 9/30/05.
15
Terms and definitions
Important terms
Total return shows how the value of the fund’s shares changed over time, assuming you held the shares through the entire period and reinvested all distributions in the fund.
Net asset value (NAV) is the price, or value, of one share of a mutual fund, without a sales charge. NAVs fluctuate with market conditions. NAV is calculated by dividing the net assets of each class of shares by the number of outstanding shares in the class.
Public offering price (POP) is the price of a mutual fund share plus the maximum sales charge levied at the time of purchase. POP performance figures shown here assume the 3.75% maximum sales charge for class A shares and 3.25% for class M shares.
Contingent deferred sales charge (CDSC) is generally a charge applied at the time of the redemption of class B or C shares and assumes redemption at the end of the period. Your fund’s class B CDSC declines from a 5% maximum during the first year to 1% during the sixth year. After the sixth year, the CDSC no longer applies. The CDSC for class C shares is 1% for one year after purchase.
Share classes
Class A shares are generally subject to an initial sales charge and no CDSC (except on certain redemptions of shares bought without an initial sales charge).
Class B shares are not subject to an initial sales charge. They may be subject to a CDSC.
Class C shares are not subject to an initial sales charge and are subject to a CDSC only if the shares are redeemed during the first year.
Class M shares have a lower initial sales charge and a higher 12b-1 fee than class A shares and no CDSC (except on certain redemptions of shares bought without an initial sales charge).
Comparative indexes
Lehman Aggregate Bond Index is an unmanaged index of U.S. investment-grade fixed-income securities.
Lehman Government Bond Index is an unmanaged index of U.S. Treasury and agency securities.
Lehman Intermediate Treasury Bond Index is an unmanaged index of U.S. Treasury securities with maturities between 1 and 10 years.
Lehman Municipal Bond Index is an unmanaged index of long-term fixed-rate investment-grade tax-exempt bonds.
Russell 2000 Index is an unmanaged index of the 2,000 smallest companies in the Russell 3000 Index.
S&P 500 Index is an unmanaged index of common stock performance.
S&P Utilities Index is an unmanaged index of common stocks issued by utility companies.
Indexes assume reinvestment of all distributions and do not account for fees. Securities and performance of a fund and an index will differ. You cannot invest directly in an index.
Lipper is a third-party industry-ranking entity that ranks mutual funds. Its rankings do not reflect sales charges. Lipper rankings are based on total return at net asset value relative to other funds that have similar current investment styles or objectives as determined by Lipper. Lipper may change a fund’s category assignment at its discretion. Lipper category averages reflect performance trends for funds within a category.
16
Trustee approval
of management contract
General conclusions
The Board of Trustees of the Putnam funds oversees the management of each fund and, as required by law, determines annually whether to approve the continuance of your fund’s management contract with Putnam Management. In this regard, the Board of Trustees, with the assistance of its Contract Committee consisting solely of Trustees who are not “interested persons” (as such term is defined in the Investment Company Act of 1940, as amended) of the Putnam funds (the “Independent Trustees”), requests and evaluates all information it deems reasonably necessary under the circumstances. Over the course of several months ending in June 2006, the Contract Committee met four times to consider the information provided by Putnam Management and other information developed with the assistance of the Board’s independent counsel and independent staff. The Contract Committee reviewed and discussed key aspects of this information with all of the Independe nt Trustees. Upon completion of this review, the Contract Committee recommended, and the Independent Trustees approved, the continuance of your fund’s management contract, effective July 1, 2006.
This approval was based on the following conclusions:
• That the fee schedule in effect for your fund represents reasonable compensation in light of the nature and quality of the services being provided to the fund, the fees paid by competitive funds and the costs incurred by Putnam Management in providing such services, and
• That such fee schedule represents an appropriate sharing between fund shareholders and Putnam Management of such economies of scale as may exist in the management of the fund at current asset levels.
These conclusions were based on a comprehensive consideration of all information provided to the Trustees and were not the result of any single factor. Some of the factors that figured particularly in the Trustees’ deliberations and how the Trustees considered these factors are described below, although individual Trustees may have evaluated the information presented differently, giving different weights to various factors. It is also important to recognize that the fee arrangements for your fund and the other Putnam funds are the result of many years of review and discussion between the Independent Trustees and Putnam Management, that certain aspects of such arrangements may receive greater scrutiny in some years than others, and that the Trustees’ conclusions may be based, in part, on their consideration of these same arrangements in prior years.
Management fee schedules and categories; total expenses
The Trustees reviewed the management fee schedules in effect for all Putnam funds, including fee levels and breakpoints, and the assignment of funds to particular fee categories. In reviewing fees and expenses, the Trustees generally focused their attention on material changes in circumstances — for example, changes in a fund’s size or investment style, changes in Putnam Management’s operating costs, or changes in competitive practices in the mutual fund industry — that suggest that consideration of fee changes might be warranted. The Trustees concluded that the circumstances did not warrant changes to the management fee structure of your fund, which had been carefully developed over the years, re-examined on many occasions and adjusted where appropriate. The Trustees focused on two areas of particular interest, as discussed further below:
• Competitiveness. The Trustees reviewed comparative fee and expense information for competitive funds, which indicated that, in a custom peer group of competitive funds selected by Lipper Inc., your fund ranked in the 36th percentile in management fees and in the 12th percentile in total expenses (less any applicable 12b-1 fees) as of December 31, 2005 (the first percentile being the least expensive funds and the 100th percentile being the most expensive funds). (Because the fund’s custom peer group is smaller than the fund’s broad Lipper Inc. peer group, this expense information may differ from the Lipper peer expense information found elsewhere in this report.) The Trustees noted that expense ratios for a number of Putnam funds, which show the percentage of fund assets used to pay for management and administrative services, distribution (12b- 1) fees and other expenses, had been increasing recently as a result of declining net assets and the natural operation of fee breakpoints.
The Trustees noted that the expense ratio increases described above were currently being controlled by expense limitations implemented in January 2004 and which Putnam Management, in consultation with the Contract Committee, has committed to maintain at least through 2007. These expense limitations give effect to a commitment by Putnam Management that the expense ratio of each open-end fund would be no higher than the average expense ratio of the competitive funds included in the fund’s relevant Lipper universe (exclusive of any applicable 12b-1 charges in each case). The Trustees observed that this commitment to limit fund expenses has served shareholders well since its inception. In order to ensure that the expenses of
17
the Putnam funds continue to meet evolving competitive standards, the Trustees requested, and Putnam Management agreed, to implement an additional expense limitation for certain funds for the twelve months beginning January 1, 2007 equal to the average expense ratio (exclusive of 12b-1 charges) of a custom peer group of competitive funds selected by Lipper based on the size of the fund. This additional expense limitation will be applied to those open-end funds that had above-average expense ratios (exclusive of 12b-1 charges) based on the Lipper custom peer group data for the period ended December 31, 2005. This additional expense limitation will not be applied to your fund.
• Economies of scale. Your fund currently has the benefit of breakpoints in its management fee that provide shareholders with significant economies of scale, which means that the effective management fee rate of a fund (as a percentage of fund assets) declines as a fund grows in size and crosses specified asset thresholds. Conversely, as a fund shrinks in size — as has been the case for many Putnam funds in recent years — these breakpoints result in increasing fee levels. In recent years, the Trustees have examined the operation of the existing breakpoint structure during periods of both growth and decline in asset levels. The Trustees concluded that the fee schedules in effect for the funds represented an appropriate sharing of economies of scale at current asset levels. In reaching this conclusion, the Trustees considered the Contract Committe e’s stated intent to continue to work with Putnam Management to plan for an eventual resumption in the growth of assets, including a study of potential economies that might be produced under various growth assumptions.
In connection with their review of the management fees and total expenses of the Putnam funds, the Trustees also reviewed the costs of the services to be provided and profits to be realized by Putnam Management and its affiliates from the relationship with the funds. This information included trends in revenues, expenses and profitability of Putnam Management and its affiliates relating to the investment management and distribution services provided to the funds. In this regard, the Trustees also reviewed an analysis of Putnam Management’s revenues, expenses and profitability with respect to the funds’ management contracts, allocated on a fund-by-fund basis. Because many of the costs incurred by Putnam Management in managing the funds are not readily identifiable to particular funds, the Trustees observed that the methodology for allocating costs is an important factor in evaluating Putnam Management’s costs and profitability, both as to the Putnam fu nds in the aggregate and as to individual funds. The Trustees reviewed Putnam Management’s cost allocation methodology with the assistance of independent consultants and concluded that this methodology was reasonable and well-considered.
Investment performance
The quality of the investment process provided by Putnam Management represented a major factor in the Trustees’ evaluation of the quality of services provided by Putnam Management under your fund’s management contract. The Trustees were assisted in their review of the Putnam funds’ investment process and performance by the work of the Investment Process Committee of the Trustees and the Investment Oversight Committee of the Trustees, which meet on a regular monthly basis with the funds’ portfolio teams throughout the year. The Trustees concluded that Putnam Management generally provides a high-quality investment process — as measured by the experience and skills of the individuals assigned to the management of fund portfolios, the resources made available to such personnel, and in general the ability of Putnam Management to attract and retain high-quality personnel — but also recognize that this does not guarantee favorable investment r esults for every fund in every time period. The Trustees considered the investment performance of each fund over multiple time periods and considered information comparing each fund’s performance with various benchmarks and with the performance of competitive funds.
The Trustees noted the satisfactory investment performance of many Putnam funds. They also noted the disappointing investment performance of certain funds in recent years and discussed with senior management of Putnam Management the factors contributing to such underperformance and actions being taken to improve performance. The Trustees recognized that, in recent years, Putnam Management has made significant changes in its investment personnel and processes and in the fund product line to address areas of underperformance. In particular, they noted the important contributions of Putnam Management’s leadership in attracting, retaining and supporting high-quality investment professionals and in systematically implementing an investment process that seeks to merge the best features of fundamental and quantitative analysis. The Trustees indicated their intention to continue to monitor performance trends to assess the effectiveness of these changes and to evaluate whether additional changes to address areas of underperformance are warranted.
In the case of your fund, the Trustees considered that your fund’s class A share cumulative total return performance at net asset
18
value was in the following percentiles of its Lipper Inc. peer group (Lipper California Municipal Debt Funds) (compared using tax-adjusted performance to recognize the different federal income tax treatment for capital gains distributions and exempt-interest distributions) for the one-, three- and five-year periods ended March 31, 2006 (the first percentile being the best performing funds and the 100th percentile being the worst performing funds):
| One-year period | Three-year period | Five-year period |
|
| 52nd | 38th | 45th |
(Because of the passage of time, these performance results may differ from the performance results for more recent periods shown elsewhere in this report. Over the one-, three- and five-year periods ended March 31, 2006, there were 122, 117, and 98 funds, respectively, in your fund’s Lipper peer group.* Past performance is no guarantee of future performance.)
As a general matter, the Trustees concluded that cooperative efforts between the Trustees and Putnam Management represent the most effective way to address investment performance problems. The Trustees noted that investors in the Putnam funds have, in effect, placed their trust in the Putnam organization, under the oversight of the funds’ Trustees, to make appropriate decisions regarding the management of the funds. Based on the responsiveness of Putnam Management in the recent past to Trustee concerns about investment performance, the Trustees concluded that it is preferable to seek change within Putnam Management to address performance shortcomings. In the Trustees’ view, the alternative of terminating a management contract and engaging a new investment adviser for an underperforming fund would entail significant disruptions and would not provide any greater assurance of improved investment performance.
Brokerage and soft-dollar allocations; other benefits
The Trustees considered various potential benefits that Putnam Management may receive in connection with the services it provides under the management contract with your fund. These include benefits related to brokerage and soft-dollar allocations, whereby a portion of the commissions paid by a fund for brokerage may be used to acquire research services that may be useful to Putnam Management in managing the assets of the fund and of other clients. The Trustees indicated their continued intent to monitor the potential benefits associated with the allocation of fund brokerage to ensure that the principle of seeking “best price and execution” remains paramount in the portfolio trading process.
The Trustees’ annual review of your fund’s management contract also included the review of its distributor’s contract and distribution plan with Putnam Retail Management Limited Partnership and the custodian agreement and investor servicing agreement with Putnam Fiduciary Trust Company, all of which provide benefits to affiliates of Putnam Management.
Comparison of retail and institutional fee schedules
The information examined by the Trustees as part of their annual contract review has included for many years information regarding fees charged by Putnam Management and its affiliates to institutional clients such as defined benefit pension plans, college endowments, etc. This information included comparison of such fees with fees charged to the funds, as well as a detailed assessment of the differences in the services provided to these two types of clients. The Trustees observed, in this regard, that the differences in fee rates between institutional clients and the mutual funds are by no means uniform when examined by individual asset sectors, suggesting that differences in the pricing of investment management services to these types of clients reflect to a substantial degree historical competitive forces operating in separate market places. The Trustees considered the fact that fee rates across all asset sectors are higher on a verage for mutual funds than for institutional clients, as well as the differences between the services that Putnam Management provides to the Putnam funds and those that it provides to institutional clients of the firm, but did not rely on such comparisons to any significant extent in concluding that the management fees paid by your fund are reasonable.
* The percentile rankings for your fund’s class A share annualized total return performance in the Lipper California Municipal Debt Funds category for the one-, five- and ten-year periods ended September 30, 2006, were 56%, 55%, and 55%, respectively. Over the one-, five- and ten-year periods ended September 30, 2006, the fund ranked 68 out of 121, 53 out of 97, and 40 out of 73 funds, respectively. Note that this more recent information was not available when the Trustees approved the continuance of your fund’s management contract.
19
Other information for shareholders
Putnam’s policy on confidentiality
In order to conduct business with our shareholders, we must obtain certain personal information such as account holders’ addresses, telephone numbers, Social Security numbers, and the names of their financial advisors. We use this information to assign an account number and to help us maintain accurate records of transactions and account balances. It is our policy to protect the confidentiality of your information, whether or not you currently own shares of our funds, and in particular, not to sell information about you or your accounts to outside marketing firms. We have safeguards in place designed to prevent unauthorized access to our computer systems and procedures to protect personal information from unauthorized use. Under certain circumstances, we share this information with outside vendors who provide services to us, such as mailing and proxy solicitation. In those cases, the service providers enter into confidentiali ty agreements with us, and we provide only the information necessary to process transactions and perform other services related to your account. We may also share this information with our Putnam affiliates to service your account or provide you with information about other Putnam products or services. It is also our policy to share account information with your financial advisor, if you’ve listed one on your Putnam account. If you would like clarification about our confidentiality policies or have any questions or concerns, please don’t hesitate to contact us at 1-800-225-1581, Monday through Friday, 8:30 a.m. to 7:00 p.m., or Saturdays from 9:00 a.m. to 5:00 p.m. Eastern Time.
Proxy voting
Putnam is committed to managing our mutual funds in the best interests of our shareholders. The Putnam funds’ proxy voting guidelines and procedures, as well as information regarding how your fund voted proxies relating to portfolio securities during the 12-month period ended June 30, 2006, are available on the Putnam Individual Investor Web site, www.putnam.com/individual, and on the SEC’s Web site, www.sec.gov. If you have questions about finding forms on the SEC’s Web site, you may call the SEC at 1-800-SEC-0330. You may also obtain the Putnam funds’ proxy voting guidelines and procedures at no charge by calling Putnam’s Shareholder Services at 1-800-225-1581.
Fund portfolio holdings
The fund will file a complete schedule of its portfolio holdings with the SEC for the first and third quarters of each fiscal year on Form N-Q. Shareholders may obtain the fund’s Forms N-Q on the SEC’s Web site at www.sec.gov. In addition, the fund’s Forms N-Q may be reviewed and copied at the SEC’s Public Reference Room in Washington, D.C. You may call the SEC at 1-800-SEC-0330 for information about the SEC’s Web site or the operation of the Public Reference Room.
20
Financial statements
These sections of the report, as well as the accompanying Notes, preceded by the Report of Independent Registered Public Accounting Firm, constitute the fund’s financial statements.
The fund’s portfolio lists all the fund’s investments and their values as of the last day of the reporting period. Holdings are organized by asset type and industry sector, country, or state to show areas of concentration and diversification.
Statement of assets and liabilities shows how the fund’s net assets and share price are determined. All investment and nonin-vestment assets are added together. Any unpaid expenses and other liabilities are subtracted from this total. The result is divided by the number of shares to determine the net asset value per share, which is calculated separately for each class of shares. (For funds with preferred shares, the amount subtracted from total assets includes the liquidation preference of preferred shares.)
Statement of operations shows the fund’s net investment gain or loss. This is done by first adding up all the fund’s earnings — from dividends and interest income — and subtracting its operating expenses to determine net investment income (or loss). Then, anynet gain or loss the fund realized on the sales of its holdings — as well as any unrealized gains or losses over the period — is added to or subtracted from the net investment result to determine the fund’s net gain or loss for the fiscal year.
Statement of changes in net assets shows how the fund’s net assets were affected by the fund’s net investment gain or loss, by distributions to shareholders, and by changes in the number of the fund’s shares. It lists distributions and their sources (net investment income or realized capital gains) over the current reporting period and the most recent fiscal year-end. The distributions listed here may not match the sources listed in the Statement of operations because the distributions are determined on a tax basis and may be paid in a different period from the one in which they were earned.
Financial highlights provide an overview of the fund’s investment results, per-share distributions, expense ratios, net investment income ratios, and portfolio turnover in one summary table, reflecting the five most recent reporting periods. In a semiannual report, the highlight table also includes the current reporting period.
21
Report of Independent Registered Public Accounting Firm
The Board of Trustees and Shareholders Putnam California Tax Exempt Income Fund:
We have audited the accompanying statement of assets and liabilities of Putnam California Tax Exempt Income Fund, including the fund’s portfolio, as of September 30, 2006, and the related statement of operations for the year then ended, the statements of changes in net assets for each of the two years in the period then ended and the financial highlights for each of the five years in the period then ended. These financial statements and financial highlights are the responsibility of the fund’s management. Our responsibility is to express an opinion on these financial statements and financial highlights based on our audits.
We conducted our audits in accordance with the standards of the Public Company Accounting Oversight Board (United States). Those standards require that we plan and perform our audit to obtain reasonable assurance about whether the financial statements and financial highlights are free of material misstatement. An audit includes examining, on a test basis, evidence supporting the amounts and disclosures in the financial statements. Our procedures included confirmation of securities owned as of September 30, 2006 by correspondence with the custodian and brokers or by other appropriate auditing procedures. An audit also includes assessing the accounting principles used and significant estimates made by management, as well as evaluating the overall financial statement presentation. We believe that our audits provide a reasonable basis for our opinion.
In our opinion, the financial statements and financial highlights referred to above present fairly, in all material respects, the financial position of Putnam California Tax Exempt Income Fund as of September 30, 2006, the results of its operations for the year then ended, the changes in its net assets for each of the two years in the period then ended, and the financial highlights for each of the five years in the period then ended, in conformity with U.S. generally accepted accounting principles.

Boston, Massachusetts
November 13, 2006
22
The fund’s portfolio 9/30/06
Key to abbreviations
AMBAC AMBAC Indemnity Corporation
COP Certificate of Participation
FGIC Financial Guaranty Insurance Company
FRB Floating Rate Bonds
FRN Floating Rate Notes
FSA Financial Security Assurance
G.O. Bonds General Obligation Bonds
IFB Inverse Floating Rate Bonds
IF COP Inverse Floating Rate Certificate of Participation
MBIA MBIA Insurance Company
U.S. Govt. Coll. U.S. Government Collateralized
VRDN Variable Rate Demand Notes
XLCA XL Capital Assurance
| MUNICIPAL BONDS AND NOTES (99.0%)* | | |
|
| | Rating ** | Principal amount | | Value |
|
| California (93.7%) | | | | |
| Alameda, Corridor | | | | |
| Trans. Auth. Rev. | | | | |
| Bonds, Ser. A, MBIA, | | | | |
| 5 1/4s, 10/1/21 | Aaa | $ 9,500,000 | $ | 10,006,825 |
| Alhambra, Unified | | | | |
| School Dist. G.O. | | | | |
| Bonds (Election | | | | |
| of 2004), Ser. A, | | | | |
| FGIC, 5s, 8/1/24 | Aaa | 1,825,000 | | 1,942,713 |
| Anaheim, COP, MBIA, | | | | |
| 6.2s, 7/16/23 | Aaa | 32,000,000 | | 33,373,120 |
| Anaheim, Pub. Fin. | | | | |
| Auth. Rev. Bonds | | | | |
| (Distr. Syst.), MBIA | | | | |
| 5 1/4s, 10/1/23 | Aaa | 8,675,000 | | 9,476,223 |
| 5 1/4s, 10/1/22 | Aaa | 6,700,000 | | 7,335,160 |
| 5s, 10/1/29 | Aaa | 6,945,000 | | 7,304,404 |
| Bay Area Toll Auth. | | | | |
| of CA Rev. Bonds | | | | |
| (San Francisco Bay | | | | |
| Area), Ser. F, 5s, | | | | |
| 4/1/20 | AA | 10,000,000 | | 10,799,700 |
| Brentwood, | | | | |
| Infrastructure Fin. | | | | |
| Auth. Rev. Bonds | | | | |
| 5 7/8s, 9/2/34 | BB-/P | 2,000,000 | | 2,071,840 |
| 5 3/4s, 9/2/24 | BB-/P | 1,350,000 | | 1,397,817 |
| Burbank, Pub. Fin. | | | | |
| Auth. Rev. Bonds | | | | |
| (West Olive Redev.), | | | | |
| AMBAC, 5s, 12/1/26 | Aaa | 3,390,000 | | 3,543,126 |
| CA Rev. Bonds | | | | |
| (Stanford Hosp. & | | | | |
| Clinics), Ser. A, | | | | |
| 5s, 11/15/23 | A2 | 6,750,000 | | 7,049,228 |
| MUNICIPAL BONDS AND NOTES (99.0%)* continued | | |
|
| | Rating ** | Principal amount | | Value |
|
| California continued | | | | |
| CA Edl. Fac. Auth. | | | | |
| Rev. Bonds | | | | |
| (Stanford U.), | | | | |
| Ser. Q, 5 1/4s, | | | | |
| 12/1/32 | Aaa | $ 22,360,000 | $ | 23,780,754 |
| (U. of Southern CA), | | | | |
| Ser. C, 5 1/8s, | | | | |
| 10/1/28 | | | | |
| (Prerefunded) | Aa1 | 20,000,000 | | 20,533,000 |
| (CA Institute | | | | |
| of Technology), | | | | |
| Ser. A, 5s, 10/1/32 | | | | |
| (Prerefunded) | Aaa | 2,000,000 | | 2,140,080 |
| (Lutheran U.), | | | | |
| Ser. C, 5s, 10/1/29 | Baa1 | 1,500,000 | | 1,536,720 |
| (Lutheran U.), | | | | |
| Ser. C, 5s, 10/1/24 | Baa1 | 1,250,000 | | 1,294,100 |
| (U. of the Pacific), | | | | |
| 5s, 11/1/16 | A2 | 865,000 | | 930,264 |
| (U. of the Pacific), | | | | |
| 5s, 11/1/14 | A2 | 295,000 | | 317,497 |
| (U. of the Pacific), | | | | |
| 5s, 11/1/13 | A2 | 525,000 | | 562,401 |
| (U. of the Pacific), | | | | |
| 5s, 11/1/11 | A2 | 625,000 | | 661,075 |
| (Lutheran U.), | | | | |
| Ser. C, 4 1/2s, | | | | |
| 10/1/19 | Baa1 | 2,080,000 | | 2,089,693 |
| CA Hlth. Fac. Fin. | | | | |
| Auth. Rev. Bonds | | | | |
| (Kaiser Permanente), | | | | |
| Ser. A, 5s, 4/1/37 | A+ | 9,000,000 | | 9,330,390 |
| (Lucile Salter | | | | |
| Packard Hosp.), | | | | |
| Ser. C, AMBAC, 5s, | | | | |
| 8/15/24 | Aaa | 6,390,000 | | 6,722,919 |
| Ser. B, AMBAC, 5s, | | | | |
| 7/1/21 | Aaa | 3,500,000 | | 3,501,645 |
| (Cedars Sinai Med. | | | | |
| Ctr.), 5s, 11/15/15 | A3 | 2,650,000 | | 2,840,164 |
| Ser. 5, MBIA, 5s, | | | | |
| 7/1/14 | AAA | 6,400,000 | | 6,403,008 |
| CA Hsg. Fin. Agcy. | | | | |
| Rev. Bonds (Home | | | | |
| Mtge.) | | | | |
| Ser. H, FGIC, 5 3/4s, | | | | |
| 8/1/30 | Aaa | 6,000,000 | | 6,485,820 |
| Ser. I, 4.6s, 8/1/21 | Aa2 | 5,000,000 | | 5,052,650 |
| Ser. C, FGIC, 3.6s, | | | | |
| 8/1/12 | Aaa | 3,340,000 | | 3,345,110 |
| CA Infrastructure & | | | | |
| Econ. Dev. Bank Rev. | | | | |
| Bonds | | | | |
| (Bay Area Toll | | | | |
| Bridges), AMBAC, 5s, | | | | |
| 7/1/33 | | | | |
| (Prerefunded) # | Aaa | 12,000,000 | | 13,557,720 |
23
| MUNICIPAL BONDS AND NOTES (99.0%)* continued | | |
|
| | Rating ** | | Principal amount | | Value |
|
| California continued | | | | | |
| CA Infrastructure & | | | | | |
| Econ. Dev. Bank Rev. | | | | | |
| Bonds | | | | | |
| (Bay Area Toll | | | | | |
| Bridges), Ser. A, | | | | | |
| FGIC, 5s, 7/1/29 | | | | | |
| (Prerefunded) | Aaa | $ | 5,000,000 | $ | 5,570,600 |
| (Science Ctr. Phase | | | | | |
| II), Ser. B, FGIC, | | | | | |
| 5s, 5/1/26 | AAA | | 2,870,000 | | 3,058,703 |
| (Science Ctr. Phase | | | | | |
| II), Ser. B, FGIC, | | | | | |
| 5s, 5/1/25 | AAA | | 2,730,000 | | 2,913,947 |
| (Science Ctr. Phase | | | | | |
| II), Ser. B, FGIC, | | | | | |
| 5s, 5/1/24 | AAA | | 2,600,000 | | 2,779,452 |
| CA State G.O. Bonds | | | | | |
| AMBAC, 5 1/2s, 4/1/11 Aaa | | 16,545,000 | | 17,909,301 |
| 5 1/4s, 12/1/24 | A+ | | 12,135,000 | | 13,068,424 |
| 5 1/4s, 12/1/23 | A+ | | 10,000,000 | | 10,789,700 |
| 5 1/4s, 2/1/20 | A+ | | 10,000,000 | | 11,247,800 |
| MBIA, 5 1/8s, 2/1/27 | AAA | | 5,000,000 | | 5,295,200 |
| MBIA, 5 1/8s, 2/1/26 | AAA | | 5,000,000 | | 5,301,700 |
| 5 1/8s, 4/1/24 | A+ | | 6,000,000 | | 6,365,400 |
| 5 1/8s, 4/1/23 | A+ | | 2,000,000 | | 2,125,780 |
| 5.1s, 2/1/34 | A+ | | 5,500,000 | | 5,621,715 |
| 5s, 5/1/24 | A1 | | 24,090,000 | | 25,429,404 |
| Ser. 2, 5s, 9/1/23 | A1 | | 8,020,000 | | 8,520,528 |
| Ser. 2, 5s, 9/1/22 | A1 | | 8,560,000 | | 9,114,774 |
| 5s, 5/1/22 | A1 | | 9,435,000 | | 10,001,383 |
| CA State Dept. | | | | | |
| of Wtr. Resources | | | | | |
| Rev. Bonds | | | | | |
| (Central Valley), | | | | | |
| Ser. J-2, 7s, | | | | | |
| 12/1/11 | Aa2 | | 8,395,000 | | 9,744,412 |
| Ser. A, AMBAC, | | | | | |
| 5 1/2s, 5/1/16 | | | | | |
| (Prerefunded) | Aaa | | 8,500,000 | | 9,428,625 |
| Ser. A, AMBAC, | | | | | |
| 5 1/2s, 5/1/15 | Aaa | | 100,000,000 | | 110,070,000 |
| Ser. A, AMBAC, | | | | | |
| 5 1/2s, 5/1/14 | Aaa | | 26,000,000 | | 28,687,620 |
| Ser. A, 5 1/4s, | | | | | |
| 5/1/20 (Prerefunded) | Aaa | | 4,000,000 | | 4,386,720 |
| Ser. W, FSA, 5 1/8s, | | | | | |
| 12/1/29 | Aaa | | 5,000,000 | | 5,216,950 |
| Ser. A, 5 1/8s, | | | | | |
| 5/1/19 (Prerefunded) | Aaa | | 25,000,000 | | 27,260,000 |
| Ser. A, 5 1/8s, | | | | | |
| 5/1/18 (Prerefunded) | Aaa | | 20,000,000 | | 21,808,000 |
| Ser. O, MBIA, 4 3/4s, | | | | | |
| 12/1/29 | Aaa | | 23,000,000 | | 23,011,960 |
| CA State Dept. | | | | | |
| of Wtr. Resources | | | | | |
| VRDN, Ser. B-2, | | | | | |
| 3.43s, 5/1/22 | VMIG1 | | 2,600,000 | | 2,600,000 |
| MUNICIPAL BONDS AND NOTES (99.0%)* continued | | |
|
| | Rating ** | | Principal amount | | Value |
|
| California continued | | | | | |
| CA State Econ. Recvy. | | | | | |
| G.O. Bonds, Ser. A | | | | | |
| 5s, 7/1/17 | AA+ | $ | 7,000,000 | $ | 7,392,070 |
| 5s, 7/1/16 | AA+ | | 4,000,000 | | 4,232,960 |
| CA State Econ. Recvy. | | | | | |
| VRDN, Ser. C-6, | | | | | |
| 3.6s, 7/1/23 | VMIG1 | | 8,700,000 | | 8,700,000 |
| CA State Pub. Wks. | | | | | |
| Board Rev. Bonds | | | | | |
| (Dept. of Gen. Svcs. | | | | | |
| Butterfield), | | | | | |
| Ser. ST-A | | | | | |
| 5 1/4s, 6/1/25 | A2 | | 2,500,000 | | 2,681,250 |
| 5s, 6/1/23 | A2 | | 2,900,000 | | 3,058,166 |
| 5s, 6/1/11 | A2 | | 2,000,000 | | 2,113,740 |
| CA State Pub. Wks. | | | | | |
| Board Lease Rev. Bonds | | | | | |
| Ser. A, MBIA, 6 1/2s, | | | | | |
| 9/1/17 | Aaa | | 28,000,000 | | 33,026,560 |
| (Dept. | | | | | |
| of Corrections-State | | | | | |
| Prisons), Ser. A, | | | | | |
| AMBAC, 5s, 12/1/19 | Aaa | | 33,500,000 | | 36,322,040 |
| CA State U. | | | | | |
| Foundation Rev. Bonds | | | | | |
| (Sacramento Auxiliary), | | | | | |
| Ser. A, MBIA, | | | | | |
| 5 1/2s, 10/1/37 | | | | | |
| (Prerefunded) | Aaa | | 1,340,000 | | 1,484,492 |
| CA Statewide Cmnty. | | | | | |
| Dev. Auth. Apt. Dev. | | | | | |
| Rev. Bonds (Irvine | | | | | |
| Apt. Cmntys.), | | | | | |
| Ser. A-4, 5 1/4s, | | | | | |
| 5/15/25 | BBB+ | | 12,500,000 | | 12,831,625 |
| CA Statewide Cmnty. | | | | | |
| Dev. Auth. COP (The | | | | | |
| Internext Group), | | | | | |
| 5 3/8s, 4/1/30 | BBB | | 15,300,000 | | 15,546,636 |
| CA Statewide Cmnty. | | | | | |
| Dev. Auth. Mandatory | | | | | |
| Put Bonds | | | | | |
| (Kaiser Permanente), | | | | | |
| Ser. B, 3.9s, 7/1/14 | A+ | | 5,000,000 | | 4,976,650 |
| CA Statewide Cmnty. | | | | | |
| Dev. Auth. | | | | | |
| Multi-Fam. Rev. Bonds | | | | | |
| (Archstone Communities), | | | | |
| 5.3s, 6/1/29 | Baa1 | | 6,000,000 | | 6,083,160 |
| (Hsg. Equity Res.), | | | | | |
| Ser. B, 5.2s, | | | | | |
| 12/1/29 | A- | | 5,000,000 | | 5,158,250 |
| CA Statewide Cmnty. | | | | | |
| Dev. Auth. Rev. Bonds | | | | | |
| (Huntington Memorial | | | | | |
| Hosp.), 5s, 7/1/22 | A+ | | 7,020,000 | | 7,411,154 |
| (Huntington Memorial | | | | | |
| Hosp.), 5s, 7/1/20 | A+ | | 4,820,000 | | 5,088,570 |
24
| MUNICIPAL BONDS AND NOTES (99.0%)* continued | | |
|
| | Rating ** | | Principal amount | | Value |
|
| California continued | | | | | |
| CA Statewide Cmnty. | | | | | |
| Dev. Auth. Rev. Bonds | | | | | |
| (Thomas Jefferson | | | | | |
| School of Law), | | | | | |
| Ser. A, 4 7/8s, | | | | | |
| 10/1/35 | BBB- | $ | 800,000 | $ | 803,760 |
| Ser. D, FGIC, 4 1/4s, | | | | | |
| 11/1/33 | Aaa | | 3,000,000 | | 3,094,290 |
| CA Statewide Cmnty. | | | | | |
| Dev. Auth. Special | | | | | |
| Tax FRB (Hsg. Equity | | | | | |
| Res. - C), 5.2s, 12/1/29 | A- | | 4,000,000 | | 4,126,600 |
| CA Statewide Cmnty. | | | | | |
| Dev. Auth. Special | | | | | |
| Tax Rev. Bonds | | | | | |
| (Cmnty. Fac. Dist. | | | | | |
| No. 1-Zone 1C), | | | | | |
| 7 1/4s, 9/1/30 | BB/P | | 2,270,000 | | 2,458,751 |
| (Citrus Garden Apt. | | | | | |
| Project - D1), | | | | | |
| 5 1/4s, 7/1/22 | A | | 1,630,000 | | 1,692,967 |
| (Cmnty. Fac. Dist. | | | | | |
| No. 1-Zone 1B), | | | | | |
| zero %, 9/1/20 | BB/P | | 1,615,000 | | 642,334 |
| CA Statewide Cmntys., | | | | | |
| Dev. Auth. Apt. | | | | | |
| Mandatory Put Bonds | | | | | |
| (Irvine Apt. | | | | | |
| Cmntys.), Ser. A-3, | | | | | |
| 5.1s, 5/17/10 | Baa2 | | 11,000,000 | | 11,263,890 |
| CA Statewide Fin. | | | | | |
| Auth. Tobacco | | | | | |
| Settlement Rev. | | | | | |
| Bonds, Class B, | | | | | |
| 5 5/8s, 5/1/29 | Baa3 | | 3,655,000 | | 3,811,690 |
| CA Tobacco | | | | | |
| Securitization Agcy. | | | | | |
| Rev. Bonds | | | | | |
| (Gold Cnty. | | | | | |
| Funding Corp.), | | | | | |
| 5 3/4s, 6/1/27 | | | | | |
| (Prerefunded) | AAA | | 925,000 | | 1,026,445 |
| (Sonoma Cnty. Corp.), | | | | | |
| Ser. B, 5 1/2s, | | | | | |
| 6/1/30 (Prerefunded) | BBB/F | | 5,000,000 | | 5,484,850 |
| zero %, 6/1/21 | Baa3 | | 10,000,000 | | 8,346,600 |
| Capistrano, Unified | | | | | |
| School Dist. Cmnty. | | | | | |
| Fac. Special Tax | | | | | |
| Bonds (Ladera), | | | | | |
| Ser. 98-2, 5 3/4s, | | | | | |
| 9/1/29 (Prerefunded) | BBB/P | | 8,000,000 | | 8,633,360 |
| Central CA Joint Pwr. | | | | | |
| Hlth. Fin. Auth. COP | | | | | |
| (Cmnty. Hosp. | | | | | |
| of Central CA), 6s, | | | | | |
| 2/1/30 | Baa2 | | 10,800,000 | | 11,288,700 |
| MUNICIPAL BONDS AND NOTES (99.0%)* continued | | |
|
| | Rating ** | | Principal amount | | Value |
|
| California continued | | | | | |
| Chabot-Las Positas, | | | | | |
| Cmnty. College Dist. | | | | | |
| G.O. Bonds (Election | | | | | |
| of 2004), Ser. A, MBIA | | | | | |
| 5s, 8/1/26 | | | | | |
| (Prerefunded) | Aaa | $ | 5,215,000 | $ | 5,723,723 |
| 5s, 8/1/25 | | | | | |
| (Prerefunded) | Aaa | | 3,000,000 | | 3,292,650 |
| Chino Basin, Regl. | | | | | |
| Fin. Auth. Rev. | | | | | |
| Bonds, AMBAC, | | | | | |
| 5 3/4s, 8/1/22 | Aaa | | 32,000,000 | | 32,027,200 |
| Chula Vista, Cmnty. | | | | | |
| Fac. Dist. Special | | | | | |
| Tax Bonds (No 07-I | | | | | |
| Otay Ranch Village | | | | | |
| Eleven), 5.1s, 9/1/26 | BB/P | | 375,000 | | 382,290 |
| Chula Vista, Cmnty. | | | | | |
| Fac. Dist. Special | | | | | |
| Tax Rev. Bonds | | | | | |
| (No. 06-1 Eastlake | | | | | |
| Woods Area), 6.2s, | | | | | |
| 9/1/33 | BBB/P | | 3,750,000 | | 4,002,375 |
| (No. 06-1 Eastlake | | | | | |
| Woods Area), 6.15s, | | | | | |
| 9/1/26 | BBB/P | | 2,000,000 | | 2,134,800 |
| (No. 97-3), 6.05s, | | | | | |
| 9/1/29 (Prerefunded) | BB+/P | | 4,420,000 | | 4,806,264 |
| (No 07-I Otay Ranch | | | | | |
| Village Eleven), | | | | | |
| 5 7/8s, 9/1/34 | BB/P | | 2,600,000 | | 2,746,978 |
| Chula Vista, Indl. | | | | | |
| Dev. Rev. Bonds (San | | | | | |
| Diego Gas), Ser. B, | | | | | |
| 5s, 12/1/27 | A1 | | 5,000,000 | | 5,217,150 |
| Colton, G.O. Bonds | | | | | |
| (Election of 2001), | | | | | |
| Ser. C, FGIC, | | | | | |
| 5 1/4s, 2/1/27 | Aaa | | 2,500,000 | | 2,704,575 |
| Commerce, Redev. | | | | | |
| Agcy. Rev. Bonds | | | | | |
| (Project 1), zero %, | | | | | |
| 8/1/21 | BBB | | 66,780,000 | | 28,303,367 |
| Contra Costa, Home | | | | | |
| Mtge. Fin. Auth. | | | | | |
| Rev. Bonds, Ser. G, | | | | | |
| MBIA, zero %, 9/1/17 | | | | | |
| (Prerefunded) | Aaa | | 35,000,000 | | 17,292,800 |
| Corona, COP (Vista | | | | | |
| Hosp. Syst.), zero %, | | | | | |
| 7/1/29 (In default) (F) † | D/P | | 10,000,000 | | 110,000 |
| Delano, COP (Delano | | | | | |
| Regl. Med. Ctr.), | | | | | |
| 5.6s, 1/1/26 | BBB- | | 19,200,000 | | 19,539,072 |
| Duarte, COP, Ser. A | | | | | |
| 5 1/4s, 4/1/31 | A- | | 7,000,000 | | 7,216,790 |
| 5 1/4s, 4/1/24 | A- | | 7,500,000 | | 7,753,875 |
25
| MUNICIPAL BONDS AND NOTES (99.0%)* continued | | |
|
| | Rating ** | | Principal amount | | Value |
|
| California continued | | | | | |
| El Camino, Cmnty. | | | | | |
| College Dist. G.O. | | | | | |
| Bonds (Election | | | | | |
| of 2002), Ser. B, | | | | | |
| FGIC, 5s, 8/1/22 | Aaa | $ | 2,345,000 | $ | 2,531,873 |
| El Camino, Hosp. | | | | | |
| Dist. Rev. Bonds, | | | | | |
| Ser. A, AMBAC, | | | | | |
| 6 1/4s, 8/15/17 | | | | | |
| (Prerefunded) | Aaa | | 10,725,000 | | 12,375,041 |
| Folsom, Special Tax | | | | | |
| Rev. Bonds (Cmnty. | | | | | |
| Facs. Dist. No. 10), | | | | | |
| 5 7/8s, 9/1/28 | BB/P | | 1,150,000 | | 1,194,275 |
| Foothill/Eastern | | | | | |
| Corridor Agcy. Rev. | | | | | |
| Bonds (CA Toll | | | | | |
| Roads) | | | | | |
| 5 3/4s, 1/15/40 | Baa3 | | 19,000,000 | | 19,779,190 |
| MBIA, 5 3/8s, 1/15/14 | Aaa | | 5,000,000 | | 5,350,200 |
| Foothill/Eastern | | | | | |
| Corridor Agcy. Toll | | | | | |
| Roads Rev. Bonds | | | | | |
| (Sr. Lien), Ser. A, | | | | | |
| U.S. Govt. Coll. | | | | | |
| 6 1/2s, 1/1/32 | | | | | |
| (Prerefunded) | Aaa | | 34,150,000 | | 34,401,686 |
| 6s, 1/1/34 | | | | | |
| (Prerefunded) | Aaa | | 38,875,000 | | 39,115,248 |
| Golden State Tobacco | | | | | |
| Securitization Corp. | | | | | |
| Rev. Bonds | | | | | |
| Ser. A-4, 7.8s, 6/1/42 | BBB | | 6,075,000 | | 7,412,290 |
| Ser. 03 A-1, 6 1/4s, | | | | | |
| 6/1/33 | BBB | | 18,225,000 | | 20,074,109 |
| Ser. B, 5 1/2s, | | | | | |
| 6/1/33 (Prerefunded) | AAA | | 36,000,000 | | 39,970,800 |
| Ser. A, 5s, 6/1/45 | A | | 6,750,000 | | 6,935,760 |
| Ser. 03 A-1, 5s, | | | | | |
| 6/1/21 | BBB | | 12,495,000 | | 12,549,978 |
| Huntington Beach, | | | | | |
| Cmnty. Fac. Dist. | | | | | |
| Special Tax (No. | | | | | |
| 2003-1 Huntington Ctr.) | | | | | |
| 5.85s, 9/1/33 | BB/P | | 2,845,000 | | 2,937,548 |
| 5.8s, 9/1/23 | BB/P | | 1,000,000 | | 1,032,660 |
| Irvine Ranch, Wtr. | | | | | |
| Dist. VRDN, 3.65s, | | | | | |
| 4/1/33 | VMIG1 | | 1,500,000 | | 1,500,000 |
| Irvine, Impt. Board | | | | | |
| Act of 1915 G.O. | | | | | |
| Bonds (Assmt. Dist. | | | | | |
| No. 03-19-Group 2), | | | | | |
| 5.45s, 9/2/23 | BB+/P | | 1,000,000 | | 1,031,650 |
| Irvine, Impt. Board | | | | | |
| Act of 1915 Special | | | | | |
| Assmt., 5s, 9/2/29 | BB+/P | | 710,000 | | 717,157 |
| MUNICIPAL BONDS AND NOTES (99.0%)* continued | | |
|
| | Rating ** | | Principal amount | | Value |
|
| California continued | | | | | |
| Irvine, Impt. Board | | | | | |
| Act of 1915 Special | | | | | |
| Assmt. Bonds | | | | | |
| (Assmt. Dist. No. | | | | | |
| 00-18-GRP 2), 5.6s, | | | | | |
| 9/2/22 | BBB/P | $ | 5,000,000 | $ | 5,162,550 |
| (Assmt. Dist. No. | | | | | |
| 00-18-GRP 3), 5.55s, | | | | | |
| 9/2/26 | BBB/P | | 1,825,000 | | 1,883,583 |
| Irvine, Impt. Board | | | | | |
| Act of 1915 VRDN | | | | | |
| (Assmt. Dist. No. | | | | | |
| 97-16), 3.65s, 9/2/22 | VMIG1 | | 5,230,000 | | 5,230,000 |
| Kern, High School | | | | | |
| Dist. G.O. Bonds, | | | | | |
| Ser. A, MBIA | | | | | |
| 6 1/2s, 8/1/14 | Aaa | | 3,825,000 | | 4,285,530 |
| 6 1/2s, 2/1/14 | Aaa | | 3,840,000 | | 4,302,336 |
| 6.4s, 8/1/13 | Aaa | | 3,435,000 | | 3,841,361 |
| 6.4s, 2/1/13 | Aaa | | 3,455,000 | | 3,863,727 |
| La Quinta, Redev. | | | | | |
| Agcy. Tax Alloc. | | | | | |
| (Area No. 1), AMBAC, | | | | | |
| 5s, 9/1/21 | Aaa | | 1,950,000 | | 2,052,180 |
| Lake Elsinore, Pub. | | | | | |
| Fin. Auth. Tax | | | | | |
| Alloc. Rev. Bonds, | | | | | |
| Ser. C, 6.7s, | | | | | |
| 10/1/33 | BBB/P | | 13,725,000 | | 14,747,924 |
| Lodi, Unified School | | | | | |
| Dist. G.O. Bonds | | | | | |
| (Election of 2002), FSA | | | | | |
| 5s, 8/1/27 | AAA | | 3,555,000 | | 3,737,123 |
| 5s, 8/1/26 | AAA | | 3,975,000 | | 4,183,449 |
| 5s, 8/1/25 | AAA | | 3,725,000 | | 3,924,884 |
| Los Angeles Cnty., | | | | | |
| Cap. Asset | | | | | |
| Leasing Corp. Lease | | | | | |
| Rev. Bonds, Ser. B, | | | | | |
| AMBAC, 6s, 12/1/15 | Aaa | | 3,095,000 | | 3,640,896 |
| Los Angeles, Cmnty. | | | | | |
| Redev. Agcy. Fin. | | | | | |
| Auth. Rev. Bonds | | | | | |
| (Bunker Hill), | | | | | |
| Ser. A, FSA, 5s, | | | | | |
| 12/1/27 | Aaa | | 16,000,000 | | 16,898,240 |
| Los Angeles, Cnty,. | | | | | |
| Cap. Asset | | | | | |
| Leasing Corp. Lease | | | | | |
| Rev. Bonds, Ser. B, | | | | | |
| AMBAC, 6s, 12/1/14 | Aaa | | 2,700,000 | | 3,141,990 |
| Los Angeles, Harbor | | | | | |
| Dept. Rev. Bonds, | | | | | |
| U.S. Govt. Coll., | | | | | |
| 7.6s, 10/1/18 | | | | | |
| (Prerefunded) | AAA | | 21,885,000 | | 26,690,289 |
26
| MUNICIPAL BONDS AND NOTES (99.0%)* continued | | |
|
| | Rating ** | Principal amount | | Value |
|
| California continued | | | | |
| Los Angeles, Pension | | | | |
| Auth. COP, Ser. A, | | | | |
| MBIA, 6.9s, 6/30/08 | Aaa | $ 26,235,000 | $ | 27,793,621 |
| Los Angeles, Unified | | | | |
| School Dist. G.O. Bonds | | | | |
| MBIA, 5 3/4s, 7/1/15 | Aaa | 6,880,000 | | 7,958,165 |
| Ser. A, MBIA, 5 1/2s, | | | | |
| 7/1/15 | Aaa | 5,000,000 | | 5,567,050 |
| Ser. E, MBIA, 5 1/8s, | | | | |
| 1/1/27 | Aaa | 6,830,000 | | 7,209,543 |
| Ser. A, MBIA, 5s, | | | | |
| 1/1/28 | Aaa | 7,000,000 | | 7,343,000 |
| (Election of 2004), | | | | |
| Ser. G, AMBAC, 5s, | | | | |
| 7/1/24 | Aaa | 16,770,000 | | 18,001,757 |
| Los Angeles, Wtr. & | | | | |
| Pwr. Rev. Bonds, | | | | |
| Ser. B, FSA, 5s, 7/1/35 | Aaa | 5,000,000 | | 5,202,650 |
| Metro. Wtr. Dist. FRN | | | | |
| (Southern CA Wtr. | | | | |
| Works), 3.085s, | | | | |
| 8/10/18 | Aa2 | 19,700,000 | | 19,700,000 |
| Metro. Wtr. Dist. IFB | | | | |
| (Southern CA | | | | |
| Waterworks), 8.088s, | | | | |
| 8/10/18 | Aa2 | 20,000,000 | | 26,188,800 |
| Metro. Wtr. Dist. | | | | |
| Rev. Bonds, Ser. A, | | | | |
| 5s, 7/1/26 | | | | |
| (Prerefunded) | Aa2 | 7,180,000 | | 7,387,861 |
| Mount Diablo, Hosp. | | | | |
| Rev. Bonds, Ser. A, | | | | |
| AMBAC, 5s, 12/1/13 | | | | |
| (Prerefunded) | Aaa | 10,000,000 | | 10,170,800 |
| Mountain | | | | |
| View-Whisman, School | | | | |
| Dist. G.O. Bonds | | | | |
| (Election of 1998), | | | | |
| Ser. D, MBIA, | | | | |
| 5 3/8s, 6/1/22 | | | | |
| (Prerefunded) | AAA | 1,000,000 | | 1,104,200 |
| North Natomas, Cmnty. | | | | |
| Fac. Dist. Special | | | | |
| Tax Rev. Bonds, | | | | |
| Ser. B, 6 3/8s, 9/1/31 | BBB/P | 6,260,000 | | 6,518,350 |
| Northridge, Wtr. | | | | |
| Dist. COP (1993 & | | | | |
| 2001), AMBAC, | | | | |
| 5 1/4s, 2/1/22 | | | | |
| (Prerefunded) | AAA | 1,800,000 | | 1,943,820 |
| Oakland, Bldg. Auth. | | | | |
| Rev. Bonds, AMBAC | | | | |
| 5 1/2s, 4/1/13 | | | | |
| (Prerefunded) | Aaa | 6,540,000 | | 6,801,273 |
| 5 1/2s, 4/1/12 | | | | |
| (Prerefunded) | Aaa | 6,295,000 | | 6,546,485 |
| MUNICIPAL BONDS AND NOTES (99.0%)* continued | | |
|
| | Rating ** | | Principal amount | | Value |
| California continued | | | | | |
| Oakland, Swr. Rev. | | | | | |
| Bonds, Ser. A, FSA, | | | | | |
| 5s, 6/15/26 | AAA | $ | 3,690,000 | $ | 3,892,138 |
| Orange Cnty., Cmnty. | | | | | |
| Fac. Dist. Special | | | | | |
| Tax Rev. Bonds | | | | | |
| (Ladera Ranch - No. | | | | | |
| 1), Ser. A, 6.2s, | | | | | |
| 8/15/23 | | | | | |
| (Prerefunded) | BBB/P | | 1,800,000 | | 1,887,192 |
| (Ladera Ranch — No. | | | | | |
| 1), Ser. A, 6.2s, | | | | | |
| 8/15/20 | | | | | |
| (Prerefunded) | BBB/P | | 1,290,000 | | 1,352,488 |
| (Ladera Ranch — No. | | | | | |
| 01-1), Ser. A, 6s, | | | | | |
| 8/15/32 | | | | | |
| (Prerefunded) | AAA | | 2,400,000 | | 2,641,440 |
| (Ladera Ranch — No. | | | | | |
| 03-1), Ser. A, | | | | | |
| 5 5/8s, 8/15/34 | BBB/P | | 2,750,000 | | 2,915,798 |
| (Ladera Ranch — No. | | | | | |
| 02-1), Ser. A, | | | | | |
| 5.55s, 8/15/33 | BBB/P | | 3,725,000 | | 3,844,945 |
| (Ladera Ranch — No. | | | | | |
| 03-1), Ser. A, | | | | | |
| 5 1/2s, 8/15/23 | BBB/P | | 1,000,000 | | 1,048,800 |
| Orange Cnty., Wtr. | | | | | |
| Dist. COP, Ser. B, | | | | | |
| MBIA, 5s, 8/15/28 | Aaa | | 10,000,000 | | 10,411,700 |
| Pasadena, Cap. Impt. | | | | | |
| IF COP, AMBAC, | | | | | |
| 5.35s, 2/1/14 | Aaa | | 24,855,000 | | 26,716,142 |
| Placentia, Redev. | | | | | |
| Auth. Tax Alloc. | | | | | |
| Rev. Bonds, Ser. B, | | | | | |
| 5 3/4s, 8/1/32 | BBB+ | | 2,500,000 | | 2,665,350 |
| Poway, Unified School | | | | | |
| Dist. Cmnty. Facs. | | | | | |
| Special Tax Bonds | | | | | |
| (Dist. No. 14- Area | | | | | |
| A), 5 1/8s, 9/1/26 | BB-/P | | 920,000 | | 938,952 |
| (Dist. No. 6 Impt. | | | | | |
| Area B), 5s, 9/1/25 | BB/P | | 1,120,000 | | 1,136,038 |
| (Dist. No. 6-4 S | | | | | |
| Ranch), 5s, 9/1/25 | BB/P | | 1,560,000 | | 1,583,462 |
| (Dist. No. 6 Impt. | | | | | |
| Area B), 5s, 9/1/24 | BB/P | | 1,025,000 | | 1,042,651 |
| (Dist. No. 6-4 S | | | | | |
| Ranch), 5s, 9/1/24 | BB/P | | 1,420,000 | | 1,444,452 |
| (Dist. No. 6 Impt. | | | | | |
| Area B), 5s, 9/1/23 | BB/P | | 935,000 | | 952,456 |
| (Dist. No. 6-4 S | | | | | |
| Ranch), 5s, 9/1/23 | BB/P | | 620,000 | | 631,575 |
| (Dist. No. 6 Impt. | | | | | |
| Area B), 5s, 9/1/22 | BB/P | | 775,000 | | 791,167 |
| (Dist. No. 6-4 S | | | | | |
| Ranch), 5s, 9/1/22 | BB/P | | 1,030,000 | | 1,051,486 |
27
| MUNICIPAL BONDS AND NOTES (99.0%)* continued | | |
|
| | Rating ** | | Principal amount | | Value |
|
| California continued | | | | | |
| Poway, Unified School | | | | | |
| Dist. Cmnty. Facs. | | | | | |
| Special Tax Bonds | | | | | |
| (Dist. No. 6 Impt. | | | | | |
| Area B), 5s, 9/1/21 | BB/P | $ | 600,000 | $ | 613,392 |
| (Dist. No. 6-4 S | | | | | |
| Ranch), 5s, 9/1/21 | BB/P | | 1,000,000 | | 1,022,320 |
| (Dist. No. 14- Area | | | | | |
| A), 5s, 9/1/20 | BB-/P | | 1,135,000 | | 1,151,787 |
| (Dist. No. 14- Del | | | | | |
| Sur), 5s, 9/1/20 | BB-/P | | 1,185,000 | | 1,201,685 |
| Rancho Cucamonga, | | | | | |
| Redev. Agcy. Tax | | | | | |
| Alloc. (Rancho | | | | | |
| Redev.), MBIA, | | | | | |
| 5 1/8s, 9/1/30 | Aaa | | 9,000,000 | | 9,325,080 |
| Redding, Elec. Syst. | | | | | |
| COP, MBIA, 6.368s, | | | | | |
| 7/1/22 (Prerefunded) | Aaa | | 20,800,000 | | 24,628,656 |
| Rio Hondo, Cmnty. | | | | | |
| College Dist. G.O. | | | | | |
| Bonds, Ser. A, MBIA | | | | | |
| 5 1/4s, 8/1/19 | | | | | |
| (Prerefunded) | Aaa | | 2,395,000 | | 2,669,204 |
| 5 1/4s, 8/1/18 | | | | | |
| (Prerefunded) | Aaa | | 2,300,000 | | 2,563,327 |
| 5 1/4s, 8/1/17 | | | | | |
| (Prerefunded) | Aaa | | 2,185,000 | | 2,435,161 |
| 5 1/4s, 8/1/16 | | | | | |
| (Prerefunded) | Aaa | | 2,020,000 | | 2,251,270 |
| Riverside Cnty., Pub. | | | | | |
| Fin. Auth. COP, | | | | | |
| 5.8s, 5/15/29 | BBB- | | 4,250,000 | | 4,420,170 |
| Riverside Cnty., | | | | | |
| Redev. Agcy. Tax | | | | | |
| Alloc., Ser. A, | | | | | |
| XLCA, 5s, 10/1/32 | Aaa | | 9,260,000 | | 9,637,252 |
| Roseville, Special | | | | | |
| Tax (Fiddyment Ranch | | | | | |
| Cmnty. Fac) | | | | | |
| Ser. 1, 5s, 9/1/20 | BB/P | | 525,000 | | 529,468 |
| 5s, 9/1/18 | BB/P | | 325,000 | | 329,807 |
| Roseville, Cmnty. | | | | | |
| Fac. Special Tax | | | | | |
| Bonds (Dist. 1), | | | | | |
| 5 3/4s, 9/1/23 | | | | | |
| (Prerefunded) | BB+/P | | 11,200,000 | | 11,643,072 |
| Roseville, Cmnty. | | | | | |
| Fac. Special Tax | | | | | |
| Rev. Bonds (Dist. | | | | | |
| 1), 6s, 9/1/33 | BB/P | | 1,750,000 | | 1,842,138 |
| Sacramento, Special | | | | | |
| Tax Rev. Bonds | | | | | |
| (North Natomas | | | | | |
| Cmnty. Fac.) | | | | | |
| Ser. 01-03, 6s, 9/1/28 | BBB/P | | 1,500,000 | | 1,588,305 |
| 5.7s, 9/1/23 | BBB/P | | 4,905,000 | | 5,001,776 |
| MUNICIPAL BONDS AND NOTES (99.0%)* continued | | |
|
| | Rating ** | Principal amount | | Value |
|
| California continued | | | | |
| Sacramento, Muni. | | | | |
| Util. Dist. Elec. | | | | |
| Rev. Bonds | | | | |
| Ser. A, MBIA, 6 1/4s, | | | | |
| 8/15/10 | | | | |
| (Prerefunded) | Aaa | $ 12,000,000 | $ | 12,927,720 |
| Ser. K, AMBAC, | | | | |
| 5 1/4s, 7/1/24 | Aaa | 11,500,000 | | 13,089,990 |
| Salinas, High School | | | | |
| Dist. G.O. Bonds | | | | |
| (Election of 2002), | | | | |
| Ser. B, MBIA, 5s, 6/1/26 | Aaa | 3,490,000 | | 3,721,038 |
| San Diego Cnty., COP | | | | |
| (Burnham Institute), | | | | |
| 6 1/4s, 9/1/29 | | | | |
| (Prerefunded) | Baa3 | 4,000,000 | | 4,335,360 |
| (Edgemoor), AMBAC, | | | | |
| 5s, 2/1/28 | Aaa | 2,300,000 | | 2,411,527 |
| San Diego Cnty., Wtr. | | | | |
| Auth. COP | | | | |
| (Stars & Cars), | | | | |
| Ser. B, MBIA, 6.3s, | | | | |
| 4/21/11 | Aaa | 56,700,000 | | 62,144,334 |
| Ser. A, FSA, 5s, | | | | |
| 5/1/30 | Aaa | 5,000,000 | | 5,266,950 |
| Ser. A, FSA, 5s, | | | | |
| 5/1/27 | Aaa | 10,000,000 | | 10,585,500 |
| San Diego, Assn. | | | | |
| of Bay Area | | | | |
| Governments Fin. | | | | |
| Auth. For Nonprofit | | | | |
| Corps. Rev. Bonds | | | | |
| (San Diego Hosp.), | | | | |
| Ser. A, 6 1/8s, | | | | |
| 8/15/20 | Baa1 | 7,400,000 | | 8,046,094 |
| San Diego, Pub. Fac. | | | | |
| Fin. Auth. Swr. Rev. | | | | |
| Bonds, FGIC, 5s, | | | | |
| 5/15/25 | Aaa | 15,350,000 | | 15,434,425 |
| San Diego, | | | | |
| Redev.Agcy. Tax Alloc. | | | | |
| (Centre City), | | | | |
| Ser. A, XLCA, 5s, | | | | |
| 9/1/22 | Aaa | 4,665,000 | | 4,942,754 |
| San Diego, Unified | | | | |
| School Dist. G.O. | | | | |
| Bonds (Election | | | | |
| of 1998), Ser. F, | | | | |
| FSA, 5s, 7/1/29 | Aaa | 14,320,000 | | 15,088,984 |
| San Diego, Wtr. Util. | | | | |
| Rev. Bonds, FGIC, | | | | |
| 4 3/4s, 8/1/28 | Aaa | 20,500,000 | | 20,634,070 |
| San Dieguito, Pub. | | | | |
| Facs. Auth. Rev. | | | | |
| Bonds, AMBAC, 5s, | | | | |
| 8/1/24 (Prerefunded) | Aaa | 2,800,000 | | 2,897,944 |
28
| MUNICIPAL BONDS AND NOTES (99.0%)* continued | | |
|
| | Rating ** | | Principal amount | | Value |
|
| California continued | | | | | |
| San Francisco, City & | | | | | |
| Cnty. Redev. Fin. | | | | | |
| Auth. Rev. Bonds | | | | | |
| (Redev. Project), | | | | | |
| Ser. B, FGIC, | | | | | |
| 5 1/4s, 8/1/18 | Aaa | $ | 7,225,000 | $ | 7,880,958 |
| San Francisco, State | | | | | |
| Bldg. Auth. Lease | | | | | |
| Rev. Bonds (San | | | | | |
| Francisco Civic Ctr. | | | | | |
| Complex), Ser. A, | | | | | |
| AMBAC, 5 1/4s, 12/1/21 | | | | | |
| (Prerefunded) | Aaa | | 10,000,000 | | 10,228,700 |
| San Joaquin Hills, | | | | | |
| Trans. Corridor | | | | | |
| Agcy. Rev. Bonds | | | | | |
| (Toll Road), Ser. A | | | | | |
| 5s, 1/1/33 | B | | 34,125,000 | | 33,777,949 |
| MBIA, zero %, 1/15/32 | Aaa | | 25,000,000 | | 7,820,750 |
| MBIA, zero %, 1/15/23 | Aaa | | 21,625,000 | | 10,562,515 |
| San Jose, Redev. | | | | | |
| Agcy. Tax Alloc. | | | | | |
| (Merged Area | | | | | |
| Redev.), FGIC, 5s, | | | | | |
| 8/1/27 | Aaa | | 15,395,000 | | 16,137,039 |
| San Marcos, Pub. Fac. | | | | | |
| Auth. Rev. Bonds | | | | | |
| 5.8s, 9/1/27 | Baa3 | | 2,995,000 | | 3,128,068 |
| 5.8s, 9/1/18 | Baa3 | | 1,635,000 | | 1,708,869 |
| 5 1/2s, 9/1/10 | Baa3 | | 1,435,000 | | 1,498,470 |
| Santa Barbara Cnty., | | | | | |
| Waterfront COP, | | | | | |
| AMBAC, 5s, 10/1/27 | Aaa | | 4,590,000 | | 4,816,149 |
| Santa Monica, Cmnty. | | | | | |
| College Dist. G.O. | | | | | |
| Bonds (Election | | | | | |
| of 2004), Ser. A, | | | | | |
| MBIA, 5s, 5/1/23 | Aaa | | 2,000,000 | | 2,137,920 |
| Santaluz Cmnty., | | | | | |
| Facs. Dist. No. 2 | | | | | |
| Special Tax Rev. Bonds | | | | | |
| (Impt. Area No. 1), | | | | | |
| Ser. B, 6 3/8s, | | | | | |
| 9/1/30 | BBB/P | | 12,665,000 | | 12,793,550 |
| (Impt. Area No. 3), | | | | | |
| Ser. B, 6.2s, 9/1/30 | BBB/P | | 500,000 | | 503,910 |
| (Impt. Area No. 3), | | | | | |
| Ser. B, 6.1s, 9/1/21 | BBB/P | | 500,000 | | 503,780 |
| Semitropic, Impt. | | | | | |
| Dist. Wtr. Storage | | | | | |
| Rev. Bonds, Ser. A, | | | | | |
| XLCA, 5 1/8s, 12/1/35 | AAA | | 5,000,000 | | 5,245,950 |
| Southern CA Pub. Pwr. | | | | | |
| Auth. Rev. Bonds | | | | | |
| (Southern Transmission), | | | | | |
| Ser. A, FSA, 5 1/4s, | | | | | |
| 7/1/18 | Aaa | | 3,750,000 | | 4,062,075 |
| MUNICIPAL BONDS AND NOTES (99.0%)* continued | | |
|
| | Rating ** | | Principal amount | | Value |
|
| California continued | | | | | |
| Stockton, Redev. | | | | | |
| Agcy. Rev. Bonds | | | | | |
| (Stockton Events | | | | | |
| Ctr.), FGIC, 5s, 9/1/28 | Aaa | $ | 1,500,000 | $ | 1,569,705 |
| Sunnyvale, Cmnty. | | | | | |
| Fac. Dist. Special | | | | | |
| Tax Rev. Bonds, | | | | | |
| 7.65s, 8/1/21 | BB-/P | | 5,820,000 | | 6,426,211 |
| Thousand Oaks, Cmnty. | | | | | |
| Fac. Dist. Special | | | | | |
| Tax Rev. Bonds | | | | | |
| (Marketplace 94-1) | | | | | |
| 6 7/8s, 9/1/24 | B/P | | 5,000,000 | | 5,433,400 |
| zero %, 9/1/14 | B/P | | 4,065,000 | | 2,359,204 |
| Tobacco Securitization | | | | | |
| Auth. of Southern CA | | | | | |
| Rev. Bonds | | | | | |
| Ser. A, 5 5/8s, | | | | | |
| 6/1/43 (Prerefunded) | AAA | | 5,000,000 | | 5,530,050 |
| Ser. A1-SNR, 4 3/4s, | | | | | |
| 6/1/25 | BBB | | 15,300,000 | | 15,377,112 |
| Torrance Memorial | | | | | |
| Med. Ctr. Rev. Bonds | | | | | |
| Ser. A, 5 1/2s, 6/1/31 | A1 | | 2,000,000 | | 2,105,360 |
| Ser. A, 6s, 6/1/22 | A1 | | 1,000,000 | | 1,107,320 |
| Tustin, Unified | | | | | |
| School Dist. Bonds | | | | | |
| (Cmnty. Fac. Dist. | | | | | |
| No. 97-1), U.S. | | | | | |
| Govt. Coll., 6 3/8s, | | | | | |
| 9/1/35 (Prerefunded) | AAA | | 4,000,000 | | 4,293,720 |
| U. of CA Rev. Bonds, | | | | | |
| Ser. G, FGIC, 5s, | | | | | |
| 5/15/23 | Aaa | | 9,165,000 | | 9,736,346 |
| Vallejo, COP (Marine | | | | | |
| World Foundation) | | | | | |
| 7.2s, 2/1/26 | BBB-/P | | 10,000,000 | | 10,285,100 |
| 7s, 2/1/17 | BBB-/P | | 4,000,000 | | 4,114,200 |
| Walnut, Energy Ctr. | | | | | |
| Auth. Rev. Bonds, | | | | | |
| Ser. A, AMBAC, 5s, | | | | | |
| 1/1/29 | Aaa | | 16,200,000 | | 16,877,646 |
| | | | | 1,976,032,453 |
|
| |
| Puerto Rico (5.0%) | | | | | |
| Children’s Trust Fund | | | | | |
| Tobacco Settlement | | | | | |
| Rev. Bonds (Asset | | | | | |
| Backed Bonds), | | | | | |
| 5 5/8s, 5/15/43 | BBB | | 4,000,000 | | 4,160,480 |
| Cmnwlth. of PR, G.O. | | | | | |
| Bonds | | | | | |
| FSA, 6 1/2s, 7/1/12 | Aaa | | 11,110,000 | | 12,779,500 |
| (Pub. Impt.), MBIA, | | | | | |
| 5 3/4s, 7/1/18 | | | | | |
| (Prerefunded) | Aaa | | 6,665,000 | | 7,164,475 |
| (Pub. Impt.), Ser. A, | | | | | |
| 5 1/4s, 7/1/30 | BBB | | 7,500,000 | | 8,012,400 |
29
| MUNICIPAL BONDS AND NOTES (99.0%)* continued | | |
|
| | Rating ** | Principal amount | | Value |
|
| Puerto Rico continued | | | | |
| Cmnwlth. of PR, Govt. | | | | |
| Dev. Bank Rev. | | | | |
| Bonds, Ser. B, 5s, | | | | |
| 12/1/13 | BBB | $ 12,000,000 | $ | 12,770,640 |
| Cmnwlth. of PR, Hwy. | | | | |
| & Trans. Auth. Rev. | | | | |
| Bonds | | | | |
| Ser. B, MBIA, 5 7/8s, | | | | |
| 7/1/35 (Prerefunded) | Aaa | 5,515,000 | | 6,020,726 |
| Ser. E, FSA, 5 1/2s, | | | | |
| 7/1/23 | Aaa | 9,000,000 | | 10,623,240 |
| Ser. AA, 5s, 7/1/28 | BBB+ | 1,200,000 | | 1,238,700 |
| Ser. K, 5s, 7/1/13 | BBB+ | 2,250,000 | | 2,392,605 |
| Cmnwlth. of PR, Muni. | | | | |
| Fin. Agcy. Rev. | | | | |
| Bonds, Ser. A, FSA | | | | |
| 5 1/4s, 8/1/20 | Aaa | 2,000,000 | | 2,162,080 |
| 5 1/4s, 8/1/18 | Aaa | 3,000,000 | | 3,249,660 |
| PR Indl. Tourist Edl. | | | | |
| Med. & Env. Control | | | | |
| Fac. Rev. Bonds | | | | |
| (Cogen. Fac.-AES), | | | | |
| 6 5/8s, 6/1/26 | Baa3 | 14,800,000 | | 16,231,746 |
| MUNICIPAL BONDS AND NOTES (99.0%)* continued | |
|
| | Rating ** | Principal amount | Value |
|
| Puerto Rico continued | | | |
| PR Pub. Fin. Corp. | | | |
| Rev. Bonds (Cmnwlth. | | | |
| Appropriation), | | | |
| Ser. A, 5 3/4s, | | | |
| 8/1/27 | BBB- | $ 8,575,000 | $ 9,245,136 |
| U. of PR Rev. Bonds, | | | |
| Ser. O, MBIA, | | | |
| 5 3/8s, 6/1/30 | Aaa | 10,000,000 | 10,016,100 |
| | | | 106,067,488 |
|
| |
| Virgin Islands (0.3%) | | | |
| VI Pub. Fin. Auth. | | | |
| Rev. Bonds, FGIC, | | | |
| 5s, 10/1/25 | Aaa | 6,000,000 | 6,464,580 |
|
| |
| |
| TOTAL INVESTMENTS | | | |
| Total investments (cost $1,946,877,134) | $2,088,564,521 |
* Percentages indicated are based on net assets of $2,109,783,678.
** The Moody’s or Standard & Poor’s ratings indicated are believed to be the most recent ratings available at September 30, 2006 for the securities listed. Ratings are generally ascribed to securities at the time of issuance. While the agencies may from time to time revise such ratings, they undertake no obligation to do so, and the ratings do not necessarily represent what the agencies would ascribe to these securities at September 30, 2006. Securities rated by Putnam are indicated by “/P” . Securities rated by Fitch are indicated by “/F” . Ratings are not covered by the Report of Independent Registered Public Accounting Firm. Security ratings are defined in the Statement of Additional Information.
† Non-income-producing security.
# A portion of this security was pledged and segregated with the custodian to cover margin requirements for futures contracts at September 30, 2006.
(F) Security is valued at fair value following procedures approved by the Trustees.
At September 30, 2006, liquid assets totaling $38,794,438 have been designated as collateral for open futures contracts.
The rates shown on VRDN, Mandatory Put Bonds, Floating Rate Bonds (FRB) and Floating Rate Notes (FRN) are the current interest rates at September 30, 2006.
The dates shown on Mandatory Put Bonds are the next mandatory put dates.
The dates shown on debt obligations other than Mandatory Put Bonds are the original maturity dates.
Inverse Floating Rate Bonds (IFB) and IF COP are securities that pay interest rates that vary inversely to changes in the market interest rates. As interest rates rise, inverse floaters produce less current income. The interest rates shown are the current interest rates at September 30, 2006.
The fund had the following industry group concentrations greater than 10% at September 30, 2006 (as a percentage of net assets):
Utilities 14.3%
Water and sewer 12.3
Transportation 11.3
The fund had the following insurance concentrations greater than 10% at September 30, 2006 (as a percentage of net assets):
MBIA 20.1%
AMBAC 19.1
3 0
| FUTURES CONTRACTS OUTSTANDING at 9/30/06 | | | | |
|
| | | | Number of | | Expiration | Unrealized |
| | | | contracts | Value | date | appreciation |
|
| U.S. Treasury Note 10 yr (Long) | 359 | $38,794,438 | Dec-06 | $395,705 |
|
| |
| |
| INTEREST RATE SWAP CONTRACTS OUTSTANDING at 9/30/06 | | | |
|
| | | | Payment | | | Unrealized |
| Swap counterparty / | | Termination | made by | Payment received | | appreciation/ |
| Notional amount | | date | fund per annum | by fund | | (depreciation) |
|
| Merrill Lynch Capital Services, Inc. | | | | |
| $50,200,000 | (E) | 11/22/16 | 4.1735% | 3 month U.S. Bond Market | |
| | | | | Association Municipal | | |
| | | | | Swap Index | | $(1,725,233) |
|
| 34,500,000 | (E) | 11/22/16 | 3 month USD-LIBOR-BBA | 5.711% | | 1,443,135 |
|
| Total | | | | | | $ (282,098) |
(E) See Note 1 to the financial statements regarding extended effective dates.
The accompanying notes are an integral part of these financial statements.
31
Statement of assets and liabilities 9/30/06
| ASSETS |
|
| Investment in securities, at value (Note 1): | |
| Unaffiliated issuers (identified cost $1,946,877,134) | $2,088,564,521 |
|
| Cash | 194,090 |
|
| Interest and other receivables | 27,389,810 |
|
| Receivable for shares of the fund sold | 1,593,888 |
|
| Unrealized appreciation on swap contracts (Note 1) | 1,443,135 |
|
| Receivable for securities sold | 3,297,564 |
|
| Total assets | 2,122,483,008 |
|
| |
| LIABILITIES | |
|
| Payable for variation margin (Note 1) | 33,656 |
|
| Distributions payable to shareholders | 3,279,015 |
|
| Payable for shares of the fund repurchased | 3,553,726 |
|
| Payable for compensation of Manager (Note 2) | 2,559,387 |
|
| Payable for investor servicing and custodian fees (Note 2) | 21,629 |
|
| Payable for Trustee compensation and expenses (Note 2) | 277,367 |
|
| Payable for administrative services (Note 2) | 5,152 |
|
| Payable for distribution fees (Note 2) | 1,110,819 |
|
| Unrealized depreciation on swap contracts (Note 1) | 1,725,233 |
|
| Other accrued expenses | 133,346 |
|
| Total liabilities | 12,699,330 |
|
| Net assets | $2,109,783,678 |
|
| |
| REPRESENTED BY | |
|
| Paid-in capital (Unlimited shares authorized) (Notes 1 and 4) | $1,975,302,910 |
|
| Undistributed net investment income (Note 1) | 223,505 |
|
| Accumulated net realized loss on investments (Note 1) | (7,543,731) |
|
| Net unrealized appreciation of investments | 141,800,994 |
|
| Total — Representing net assets applicable to capital shares outstanding | $2,109,783,678 |
|
| |
| COMPUTATION OF NET ASSET VALUE AND OFFERING PRICE | |
|
| Net asset value and redemption price per class A share ($1,959,603,476 divided by 238,145,683 shares) | $8.23 |
|
| Offering price per class A share (100/96.25 of $8.23)* | $8.55 |
|
| Net asset value and offering price per class B share ($120,917,798 divided by 14,706,139 shares)** | $8.22 |
|
| Net asset value and offering price per class C share ($23,147,077 divided by 2,801,801 shares)** | $8.26 |
|
| Net asset value and redemption price per class M share ($6,115,327 divided by 744,737 shares) | $8.21 |
|
| Offering price per class M share (100/96.75 of $8.21)*** | $8.49 |
* On single retail sales of less than $100,000. On sales of $100,000 or more the offering price is reduced.
** Redemption price per share is equal to net asset value less any applicable contingent deferred sales charge
*** On single retail sales of less than $50,000. On sales of $50,000 or more the offering price is reduced.
The accompanying notes are an integral part of these financial statements.
32
Statement of operations Year ended 9/30/06
| INTEREST INCOME | $105,489,169 |
|
| |
| EXPENSES | |
|
| Compensation of Manager (Note 2) | 10,368,635 |
|
| Investor servicing fees (Note 2) | 687,684 |
|
| Custodian fees (Note 2) | 169,424 |
|
| Trustee compensation and expenses (Note 2) | 95,576 |
|
| Administrative services (Note 2) | 44,938 |
|
| Distribution fees — Class A (Note 2) | 4,014,511 |
|
| Distribution fees — Class B (Note 2) | 1,267,732 |
|
| Distribution fees — Class C (Note 2) | 235,099 |
|
| Distribution fees — Class M (Note 2) | 30,386 |
|
| Other | 318,262 |
|
| Non-recurring costs (Notes 2 and 5) | 3,888 |
|
| Costs assumed by Manager (Notes 2 and 5) | (3,888) |
|
| Total expenses | 17,232,247 |
|
| Expense reduction (Note 2) | (365,576) |
|
| Net expenses | 16,866,671 |
|
| Net investment income | 88,622,498 |
|
| Net realized gain on investments (Notes 1 and 3) | 5,666,109 |
|
| Net realized gain on futures contracts (Note 1) | 213,829 |
|
| Net realized gain on swap contracts (Note 1) | 723,447 |
|
| Net unrealized depreciation of investments, swaps and futures contracts during the year | (11,013,575) |
|
| Net loss on investments | (4,410,190) |
|
| Net increase in net assets resulting from operations | $ 84,212,308 |
The accompanying notes are an integral part of these financial statements.
33
Statement of changes in net assets
| DECREASE IN NET ASSETS | | |
|
| | Year ended | Year ended |
| | 9/30/06 | 9/30/05 |
|
| Operations: | | |
| Net investment income | $ 88,622,498 | $ 96,875,557 |
|
| Net realized gain on investments | 6,603,385 | 52,403,737 |
|
| Net unrealized depreciation of investments | (11,013,575) | (57,192,826) |
|
| Net increase in net assets resulting from operations | 84,212,308 | 92,086,468 |
|
| Distributions to shareholders: (Note 1) | | |
|
| From ordinary income | | |
|
| Class A | — | (5,461,190) |
|
| Class B | — | (589,529) |
|
| Class C | — | (62,271) |
|
| Class M | — | (17,060) |
|
| From tax-exempt income | | |
|
| Class A | (82,093,559) | (87,707,391) |
|
| Class B | (5,231,903) | (7,348,219) |
|
| Class C | (788,690) | (808,504) |
|
| Class M | (234,332) | (251,440) |
|
| From net realized short-term gain on investments | | |
|
| Class A | (96,126) | (570,619) |
|
| Class B | (7,971) | (61,597) |
|
| Class C | (1,140) | (6,503) |
|
| Class M | (299) | (1,783) |
|
| From net realized long-term gain on investments | | |
|
| Class A | (45,107,089) | (24,561,426) |
|
| Class B | (3,740,341) | (2,651,322) |
|
| Class C | (535,031) | (279,914) |
|
| Class M | (140,249) | (76,735) |
|
| Redemption fees (Note 1) | 56 | 11 |
|
| Decrease from capital share transactions (Note 4) | (103,020,580) | (112,806,348) |
|
| Total decrease in net assets | (156,784,946) | (151,175,372) |
|
| |
| NET ASSETS | | |
|
| Beginning of year | 2,266,568,624 | 2,417,743,996 |
|
| End of year (including undistributed net investment income of $223,505 and $266,610, respectively) | $2,109,783,678 | $2,266,568,624 |
The accompanying notes are an integral part of these financial statements.
34
This page left blank intentionally.
35
Financial highlights (For a common share outstanding throughout the period)
| INVESTMENT OPERATIONS: | | | | | LESS DISTRIBUTIONS: | | | | | | RATIOS AND SUPPLEMENTAL DATA: | |
|
| | | | Net | | | | | | | Total | | | Ratio of net | |
| | Net asset | | realized and | Total | From | From | | | Net asset | return | Net | Ratio of | investment | |
| | value, | Net | unrealized | from | net | net realized | | | value, | at net | assets, | expenses to | income (loss) | Portfolio |
| | beginning | investment | gain (loss) on | investment | investment | gain on | Total | Redemption | end | asset | end of period | average net | to average | turnover |
| Period ended | of period | income (loss) | investments | operations | income | investments | distributions | fees | of period | value (%)(a) | (in thousands) | assets (%)(b) | net assets (%) | (%) |
|
| CLASS A | | | | | | | | | | | | | | |
| September 30, 2006 | $8.43 | .34 | (.01) | .33 | (.34) | (.19) | (.53) | —(c) | $8.23 | 4.09 | $1,959,603 | .75 | 4.17 | 11.70 |
| September 30, 2005 | 8.57 | .36 | (.02) | .34 | (.38) | (.10) | (.48) | —(c) | 8.43 | 4.08 | 2,057,513 | .75 | 4.20 | 21.15 |
| September 30, 2004 | 8.62 | .38 | .01 | .39 | (.40) | (.04) | (.44) | — | 8.57 | 4.60 | 2,144,817 | .79 | 4.49 | 13.01 |
| September 30, 2003 | 8.84 | .39 | (.17) | .22 | (.39) | (.05) | (.44) | — | 8.62 | 2.64 | 2,540,224 | .76 | 4.52 | 22.39 |
| September 30, 2002 | 8.71 | .41 | .15 | .56 | (.41) | (.02) | (.43) | — | 8.84 | 6.69 | 2,739,618 | .75 | 4.82 | 6.50 |
|
| |
| CLASS B | | | | | | | | | | | | | | |
| September 30, 2006 | $8.42 | .29 | (.01) | .28 | (.29) | (.19) | (.48) | —(c) | $8.22 | 3.46 | $120,918 | 1.39 | 3.52 | 11.70 |
| September 30, 2005 | 8.56 | .30 | (.02) | .28 | (.32) | (.10) | (.42) | —(c) | 8.42 | 3.40 | 178,443 | 1.40 | 3.55 | 21.15 |
| September 30, 2004 | 8.62 | .33 | (.01) | .32 | (.34) | (.04) | (.38) | — | 8.56 | 3.81 | 241,841 | 1.44 | 3.84 | 13.01 |
| September 30, 2003 | 8.83 | .33 | (.16) | .17 | (.33) | (.05) | (.38) | — | 8.62 | 2.09 | 352,861 | 1.41 | 3.87 | 22.39 |
| September 30, 2002 | 8.70 | .36 | .15 | .51 | (.36) | (.02) | (.38) | — | 8.83 | 6.00 | 420,977 | 1.40 | 4.17 | 6.50 |
|
| |
| CLASS C | | | | | | | | | | | | | | |
| September 30, 2006 | $8.46 | .28 | (.01) | .27 | (.28) | (.19) | (.47) | —(c) | $8.26 | 3.24 | $23,147 | 1.54 | 3.37 | 11.70 |
| September 30, 2005 | 8.60 | .29 | (.02) | .27 | (.31) | (.10) | (.41) | —(c) | 8.46 | 3.21 | 24,333 | 1.55 | 3.40 | 21.15 |
| September 30, 2004 | 8.65 | .34 | (.02) | .32 | (.33) | (.04) | (.37) | — | 8.60 | 3.83 | 24,313 | 1.59 | 3.69 | 13.01 |
| September 30, 2003 | 8.87 | .32 | (.17) | .15 | (.32) | (.05) | (.37) | — | 8.65 | 1.83 | 32,171 | 1.56 | 3.72 | 22.39 |
| September 30, 2002 | 8.74 | .35 | .15 | .50 | (.35) | (.02) | (.37) | — | 8.87 | 5.83 | 30,974 | 1.55 | 4.00 | 6.50 |
|
| |
| CLASS M | | | | | | | | | | | | | | |
| September 30, 2006 | $8.41 | .32 | (.01) | .31 | (.32) | (.19) | (.51) | —(c) | $8.21 | 3.79 | $6,115 | 1.04 | 3.87 | 11.70 |
| September 30, 2005 | 8.55 | .33 | (.02) | .31 | (.35) | (.10) | (.45) | —(c) | 8.41 | 3.76 | 6,279 | 1.05 | 3.90 | 21.15 |
| September 30, 2004 | 8.61 | .35 | —(c) | .35 | (.37) | (.04) | (.41) | — | 8.55 | 4.17 | 6,774 | 1.09 | 4.19 | 13.01 |
| September 30, 2003 | 8.82 | .36 | (.16) | .20 | (.36) | (.05) | (.41) | — | 8.61 | 2.45 | 9,009 | 1.06 | 4.21 | 22.39 |
| September 30, 2002 | 8.69 | .39 | .15 | .54 | (.39) | (.02) | (.41) | — | 8.82 | 6.38 | 15,668 | 1.05 | 4.51 | 6.50 |
|
(a) Total return assumes dividend reinvestment and does not reflect the effect of sales charges.
(b) Includes amounts paid through expense offset arrangements (Note 2).
(c) Amount represents less than $0.01 per share.
The accompanying notes are an integral part of these financial statements.
36
Notes to financial statements 9/30/06
Note 1: Significant accounting policies
Putnam California Tax Exempt Income Fund (the “fund”), a Massachusetts business trust, is registered under the Investment Company Act of 1940, as amended, as a diversified, open-end management investment company. The fund seeks as high a level of current income exempt from federal and California personal income tax as Putnam Investment Management, LLC (“Putnam Management”), the fund’s manager, an indirect wholly-owned subsidiary of Putnam, LLC, believes is consistent with preservation of capital by investing in a diversified portfolio of longer-term California tax-exempt securities. The fund may be affected by economic and political developments in the state of California.
The fund offers class A, class B, class C and class M shares. Class A and class M shares are sold with a maximum front-end sales charge of 3.75% and 3.25%, respectively, and generally do not pay contingent deferred sales charges. Class B shares, which convert to class A shares after approximately eight years, do not pay a front-end sales charge, and are subject to a contingent deferred sales charge, if those shares are redeemed within six years of purchase. Class C shares have a one-year 1.00% contingent deferred sales charge and do not convert to class A shares. The expenses for class A, class B, class C and class M shares may differ based on the distribution fee of each class, which is identified in Note 2.
A 2.00% redemption fee may apply to any shares that are redeemed (either by selling or exchanging into another fund) within 5 days of purchase. The redemption fee is accounted for as an addition to paid-in-capital.
The redemption fees discussed above will be replaced, effective October 2, 2006, by a 1.00% redemption fee on any shares purchased on or after such date that are redeemed (either by selling or exchanging into another fund) within 7 days of purchase.
Investment income, realized and unrealized gains and losses and expenses of the fund are borne pro-rata based on the relative net assets of each class to the total net assets of the fund, except that each class bears expenses unique to that class (including the distribution fees applicable to such classes). Each class votes as a class only with respect to its own distribution plan or other matters on which a class vote is required by law or determined by the Trustees. Shares of each class would receive their pro-rata share of the net assets of the fund, if the fund were liquidated. In addition, the Trustees declare separate dividends on each class of shares.
In the normal course of business, the fund enters into contracts that may include agreements to indemnify another party under given circumstances. The fund’s maximum exposure under these arrangements is unknown as this would involve future claims that may be, but have not yet been, made against the fund. However, the fund expects the risk of material loss to be remote.
The following is a summary of significant accounting policies consistently followed by the fund in the preparation of its financial statements. The preparation of financial statements is in conformity with accounting principles generally accepted in the United States of America and requires management to make estimates and assumptions that affect the reported amounts of assets and liabilities in the financial statements and the reported amounts of increases and decreases in net assets from operations during the reporting period. Actual results could differ from those estimates.
A) Security valuationTax-exempt bonds and notes are generally valued on the basis of valuations provided by an independent pricing service approved by the Trustees. Such services use information with respect to transactions in bonds, quotations from bond dealers, market transactions in comparable securities and various relationships between securities in determining value. Certain investments are also valued at fair value following procedures approved by the Trustees. Such valuations and procedures are reviewed periodically by the Trustees. The fair value of securities is generally determined as the amount that the fund could reasonably expect to realize from an orderly disposition of such securities over a reasonable period of time. By its nature, a fair value price is a good faith estimate of the value of a security at a given point in time and does not reflect an actual market price, which ma y be different by a material amount.
B) Security transactions and related investment income Security transactions are recorded on the trade date (the date the order to buy or sell is executed). Gains or losses on securities sold are determined on the identified cost basis.
Interest income is recorded on the accrual basis. All premiums/discounts are amortized/accreted on a yield-to-maturity basis. The premium in excess of the call price, if any, is amortized to the call date; thereafter, any remaining premium is amortized to maturity.
C) Futures and options contracts The fund may use futures and options contracts to hedge against changes in the values of securities the fund owns or expects to purchase, or for other investment purposes. The fund may also write options on swaps or securities it owns or in which it may invest to increase its current returns.
The potential risk to the fund is that the change in value of futures and options contracts may not correspond to the change in value of the hedged instruments. In addition, losses may arise from changes in the value of the underlying instruments, if there is an illiquid secondary market for the contracts, or if the counterparty to the contract is unable to perform. Risks may exceed amounts recognized on the statement of assets and liabilities. When the contract is closed, the fund records a realized gain or loss equal to the difference between the value of the contract at the time it was opened and the value at the time it was closed. Realized gains and losses on purchased options are included in realized gains and losses on investment securities. If a written call option is exercised, the premium originally received is recorded as an addition to sales proceeds. If a written put option is exercised, the premium originally received is recorded as a reduction to the cost of investments.
Futures contracts are valued at the quoted daily settlement prices established by the exchange on which they trade. The fund and the broker agree to exchange an amount of cash equal to the daily fluctuation in the value of the futures contract. Such receipts or payments are known as “variation margin.” Exchange traded options are valued at the last sale price or, if no sales are reported, the last bid price for purchased options and the last ask price for written options. Options traded over-the-counter are valued using prices supplied by dealers. Futures and written option contracts outstanding at period end, if any, are listed after the fund’s portfolio.
D) Interest rate swap contracts The fund may enter into interest rate swap contracts, which are arrangements between two parties to exchange cash flows based on a notional principal amount, to manage the fund’s exposure to interest rates. Interest rate swap contracts are marked to market daily based upon quotations from an independent pricing service or market makers and the change, if any, is recorded as unrealized gain or loss. Payments received or made are recorded as realized gains or loss. Certain interest rate swap contracts may include extended effective
38
dates. Income related to these swap contracts is accrued based on the terms of the contract. The fund could be exposed to credit or market risk due to unfavorable changes in the fluctuation of interest rates or if the counterparty defaults on its obligation to perform. Risk of loss may exceed amounts recognized on the statement of assets and liabilities. Interest rate swap contracts outstanding at period end, if any, are listed after the fund’s portfolio.
E) Federal taxes It is the policy of the fund to distribute all of its income within the prescribed time and otherwise comply with the provisions of the Internal Revenue Code of 1986 (the “Code”) applicable to regulated investment companies. It is also the intention of the fund to distribute an amount sufficient to avoid imposition of any excise tax under Section 4982 of the Code, as amended. Therefore, no provision has been made for federal taxes on income, capital gains or unrealized appreciation on securities held nor for excise tax on income and capital gains.
F) Distributions to shareholders Distributions to shareholders from net investment income are recorded by the fund on the ex-dividend date. Distributions from capital gains, if any, are recorded on the ex-dividend date and paid at least annually. The amount and character of income and gains to be distributed are determined in accordance with income tax regulations, which may differ from generally accepted accounting principles. These differences include temporary and permanent differences of dividends payable and straddle loss deferrals. Reclassifications are made to the fund’s capital accounts to reflect income and gains available for distribution (or available capital loss carryovers) under income tax regulations. For the year ended September 30, 2006, the fund reclassified $317,119 to decrease undistributed net investment income and a decrease to accumulated net realized losses of $317,119.
The tax basis components of distributable earnings and the federal tax cost as of September 30, 2006 were as follows:
| Unrealized appreciation | $ 141,216,393 |
| Unrealized depreciation | (649,229) |
| | ——————————————— |
| Net unrealized appreciation | 140,567,164 |
| Undistributed tax exempt income | 3,019,511 |
| Undistributed ordinary income | 35,411 |
| Undistributed short-term gain | 531,491 |
| Undistributed long-term gain | 4,725,275 |
| Cost for federal income tax purposes | $1,947,997,357 |
Note 2: Management fee, administrative services and other transactions
Putnam Management is paid for management and investment advisory services quarterly based on the average net assets of the fund. Such fee is based on the lesser of a (i) an annual rate of 0.50% of the average net assets of the fund or (ii) the following annual rates expressed as a percentage of the fund’s average net assets: 0.60% of the first $500 million, 0.50% of the next $500 million, 0.45% of the next $500 million, 0.40% of the next $5 billion, 0.375% of the next $5 billion, 0.355% of the next $5 billion, 0.34% of the next $5 billion and 0.33% thereafter.
Putnam Management has agreed to waive fees and reimburse expenses of the fund through September 30, 2007 to the extent necessary to ensure that the fund’s expenses do not exceed the simple average of the expenses of all front-end load funds viewed by Lipper Inc. as having the same investment classification or objective as the fund. The expense reimbursement is based on a comparison of the fund’s expenses with the average annualized operating expenses of the funds in its Lipper peer group for each calendar quarter during the fund’s last fiscal year, excluding 12b-1 fees and without giving effect to any expense offset and brokerage service arrangements that may reduce fund expenses. For the year ended September 30, 2006, Putnam Management did not waive any of its management fee from the fund.
For the year ended September 30, 2006, Putnam Management has assumed $3,888 of legal, shareholder servicing and communication, audit and Trustee fees incurred by the fund in connection with certain legal and regulatory matters (including those described in Note 5).
The fund reimburses Putnam Management an allocated amount for the compensation and related expenses of certain officers of the fund and their staff who provide administrative services to the fund. The aggregate amount of all such reimbursements is determined annually by the Trustees.
Custodial functions for the fund’s assets are provided by Putnam Fiduciary Trust Company (“PFTC”), a subsidiary of Putnam, LLC. PFTC receives fees for custody services based on the fund’s asset level, the number of its security holdings and transaction volumes. Putnam Investor Services, a division of PFTC, provides investor servicing agent functions to the fund. Putnam Investor Services receives fees for investor servicing based on the number of shareholder accounts in the fund and the level of defined contribution plan assets in the fund. During the year ended September 30, 2006, the fund incurred $857,108 for these services.
The fund has entered into an arrangement with PFTC whereby credits realized as a result of uninvested cash balances are used to reduce a portion of the fund’s expenses. For the year ended, September 30, 2006, the fund’s expenses were reduced by $365,576 under these arrangements.
Each independent Trustee of the fund receives an annual Trustee fee, of which $656, as a quarterly retainer, has been allocated to the fund, and an additional fee for each Trustees meeting attended. Trustees receive additional fees for attendance at certain committee meetings, industry seminars and for certain compliance-related matters. Trustees also are reimbursed for expenses they incur relating to their services as Trustees. George Putnam, III, who is not an independent Trustee, also receives the foregoing fees for his services as Trustee.
The fund has adopted a Trustee Fee Deferral Plan (the “Deferral Plan”) which allows the Trustees to defer the receipt of all or a portion of Trustees fees payable on or after July 1, 1995. The deferred fees remain invested in certain Putnam funds until distribution in accordance with the Deferral Plan.
The fund has adopted an unfunded noncontributory defined benefit pension plan (the “Pension Plan”) covering all Trustees of the fund who have served as a Trustee for at least five years and were first elected prior to 2004. Benefits under the Pension Plan are equal to 50% of the Trustee’s average annual attendance and retainer fees for the three years ended December 31, 2005. Pension expense for the fund is included in Trustee compensation and expenses in the statement of operations. Accrued pension liability is included in Payable for Trustee compensation and expenses in the statement of assets and liabilities. The Trustees have terminated the Pension Plan with respect to any Trustee first elected after 2003.
The fund has adopted distribution plans (the “Plans”) with respect to its class A, class B, class C and class M shares pursuant to rule 12b-1 under the Investment Company Act of 1940. The purpose of the Plans is to compensate Putnam Retail Management, a wholly-owned subsidiary of
39
Putnam, LLC and Putnam Retail Management GP, Inc., for services provided and expenses incurred in distributing shares of the fund. The Plans provide for payments by the fund to Putnam Retail Management at an annual rate of up to 035%, 1.00%, 1.00% and 0.50% of the average net assets attributable to class A, class B, class C and class M shares, respectively. The Trustees have approved payment by the fund at the annual rate of 0.85%, 1.00% and 0.50% for class B, class C and class M shares, respectively. For class A shares, the annual payment rate will equal the weighted average of (i) 0.20% on the net assets of the fund attributable to class A shares purchased and paid for prior to April 1, 2005 and (ii) 0.25% on all other net assets of the fund attributable to class A shares.
For the year ended September 30, 2006, Putnam Retail Management, acting as underwriter, received net commissions of $107,481 and $552 from the sale of class A and class M shares, respectively, and received $143,971 and $3,033 in contingent deferred sales charges from redemptions of class B and class C shares, respectively.
A deferred sales charge of up to 1.00% is assessed on certain redemptions of class A shares that were purchased without an initial sales charge as part of an investment of $1 million or more. For the year ended September 30, 2006, Putnam Retail Management, acting as underwriter, received $8,751 on class A redemptions.
Note 3: Purchases and sales of securities
During the year ended September 30, 2006, cost of purchases and proceeds from sales of investment securities other than short-term investments aggregated $242,836,956 and $370,474,698, respectively. There were no purchases or sales of U.S. government securities.
Note 4: Capital shares
At September 30, 2006, there was an unlimited number of shares of beneficial interest authorized. Transactions in capital shares were as follows:
| CLASS A | Shares | Amount |
|
| Year ended 9/30/06: | | |
| Shares sold | 15,665,446 | $ 128,384,112 |
|
| Shares issued in connection with | | |
| reinvestment of distributions | 9,592,527 | 78,592,201 |
|
| | 25,257,973 | 206,976,313 |
|
| Shares repurchased | (31,222,707) | (256,262,051) |
|
| Net decrease | (5,964,734) | $ (49,285,738) |
| |
| Year ended 9/30/05: | | |
| Shares sold | 13,097,010 | $ 111,091,464 |
|
| Shares issued in connection with | | |
| reinvestment of distributions | 8,329,525 | 70,601,551 |
|
| | 21,426,535 | 181,693,015 |
|
| Shares repurchased | (27,660,985) | (234,661,814) |
|
| Net decrease | (6,234,450) | $ (52,968,799) |
| CLASS B | Shares | Amount |
|
| Year ended 9/30/06: | | |
| Shares sold | 348,444 | $ 2,854,663 |
|
| Shares issued in connection with | | |
| reinvestment of distributions | 715,954 | 5,861,353 |
|
| | 1,064,398 | 8,716,016 |
|
| Shares repurchased | (7,547,762) | (61,832,902) |
|
| Net decrease | (6,483,364) | $ (53,116,886) |
| |
| Year ended 9/30/05: | | |
| Shares sold | 430,731 | $ 3,669,083 |
|
| Shares issued in connection with | | |
| reinvestment of distributions | 782,614 | 6,628,646 |
|
| | 1,213,345 | 10,297,729 |
|
| Shares repurchased | (8,276,190) | (70,162,138) |
|
| Net decrease | (7,062,845) | $ (59,864,409) |
|
| |
| CLASS C | Shares | Amount |
|
| Year ended 9/30/06: | | |
| Shares sold | 501,289 | $ 4,126,427 |
|
| Shares issued in connection with | | |
| reinvestment of distributions | 114,259 | 939,568 |
|
| | 615,548 | 5,065,995 |
|
| Shares repurchased | (689,900) | (5,667,687) |
|
| Net decrease | (74,352) | $ (601,692) |
| |
| Year ended 9/30/05: | | |
| Shares sold | 481,921 | $ 4,096,332 |
|
| Shares issued in connection with | | |
| reinvestment of distributions | 89,727 | 766,767 |
|
| | 571,648 | 4,863,099 |
|
| Shares repurchased | (522,890) | (4,448,947) |
|
| Net increase | 48,758 | $ 414,152 |
|
| |
| CLASS M | Shares | Amount |
|
| Year ended 9/30/06: | | |
| Shares sold | 68,490 | $ 559,731 |
|
| Shares issued in connection with | | |
| reinvestment of distributions | 32,534 | 265,947 |
|
| | 101,024 | 825,678 |
|
| Shares repurchased | (102,795) | (841,942) |
|
| Net decrease | (1,771) | $ (16,264) |
| |
| Year ended 9/30/05: | | |
| Shares sold | 37,309 | $ 316,269 |
|
| Shares issued in connection with | | |
| reinvestment of distributions | 27,408 | 231,836 |
|
| | 64,717 | 548,105 |
|
| Shares repurchased | (110,512) | (935,397) |
|
| Net decrease | (45,795) | $ (387,292) |
40
Note 5: Regulatory matters and litigation
Putnam Management has entered into agreements with the Securities and Exchange Commission and the Massachusetts Securities Division settling charges connected with excessive short-term trading by Putnam employees and, in the case of the charges brought by the Massachusetts Securities Division, by participants in some Putnam-administered 401(k) plans. Pursuant to these settlement agreements, Putnam Management will pay a total of $193.5 million in penalties and restitution, with $153.5 million being paid to certain open-end funds and their shareholders. The amount will be allocated to shareholders and funds pursuant to a plan developed by an independent consultant, and will be paid following approval of the plan by the SEC and the Massachusetts Securities Division.
The Securities and Exchange Commission’s and Massachusetts Securities Division’s allegations and related matters also serve as the general basis for numerous lawsuits, including purported class action lawsuits filed against Putnam Management and certain related parties, including certain Putnam funds. Putnam Management will bear any costs incurred by Putnam funds in connection with these lawsuits. Putnam Management believes that the likelihood that the pending private lawsuits and purported class action lawsuits will have a material adverse financial impact on the fund is remote, and the pending actions are not likely to materially affect its ability to provide investment management services to its clients, including the Putnam funds.
Putnam Management and Putnam Retail Management are named as defendants in a civil suit in which the plaintiffs allege that the management and distribution fees paid by certain Putnam funds were excessive and seek recovery under the Investment Company Act of 1940. Putnam Management and Putnam Retail Management have contested the plaintiffs’ claims and the matter is currently pending in the U.S. District Court for the District of Massachusetts. Based on currently available information, Putnam Management believes that this action is without merit and that it is unlikely to have a material effect on Putnam Management’s and Putnam Retail Management’s ability to provide services to their clients, including the fund.
Note 6: New accounting pronouncements
In June 2006, the Financial Accounting Standards Board (“FASB”) issued Interpretation No. 48, Accounting for Uncertainty in Income Taxes (the “Interpretation”). The Interpretation prescribes a minimum threshold for financial statement recognition of the benefit of a tax position taken or expected to be taken by a filer in the filer’s tax return. The Interpretation will become effective for fiscal years beginning after December 15, 2006 but will also apply to tax positions reflected in the fund’s financial statements as of that date. No determination has been made whether the adoption of the Interpretation will require the fund to make any adjustments to its net assets or have any other effect on the fund’s financial statements.
In September 2006, the FASB issued Statement of Financial Accounting Standards No. 157, Fair Value Measurements (the “Standard”). The Standard defines fair value, sets out a framework for measuring fair value and requires additional disclosures about fair value measurements. The Standard applies to fair value measurements already required or permitted by existing standards. The Standard is effective for financial statements issued for fiscal years beginning after November 15, 2007 and interim periods within those fiscal years. Putnam Management is currently evaluating what impact the adoption of the Standard will have on the fund’s financial statements.
41
Federal tax information
(Unaudited)
Federal tax information
The fund has designated 100.00% of dividends paid from net investment income during the fiscal year as tax exempt for Federal income tax purposes.
Pursuant to Section 852 of the Internal Revenue Code, as amended, the fund hereby designates $5,328,509 as long term capital gain, for its taxable year ended September 30, 2006.
The Form 1099 you receive in January 2007 will show the tax status of all distributions paid to your account in calendar 2006.
42
About the Trustees
Jameson A. Baxter (Born 1943), Trustee since 1994, Vice Chairman since 2005
Ms. Baxter is the President of Baxter Associates, Inc., a private investment firm that she founded in 1986.
Ms. Baxter serves as a Director of ASHTA Chemicals, Inc., Banta Corporation (a printing and digital imaging firm), Ryerson Tull, Inc. (a steel service corporation), the Mutual Fund Directors Forum, Advocate Health Care and BoardSource, formerly the National Center for Nonprofit Boards. She is Chairman Emeritus of the Board of Trustees, Mount Holyoke College, having served as Chairman for five years and as a board member for thirteen years. Until 2002, Ms. Baxter was a Director of Intermatic Corporation (a manufacturer of energy control products).
Ms. Baxter has held various positions in investment banking and corporate finance, including Vice President and Principal of the Regency Group, and Vice President of and Consultant to First Boston Corporation. She is a graduate of Mount Holyoke College.
Charles B. Curtis (Born 1940), Trustee since 2001
Mr. Curtis is President and Chief Operating Officer of the Nuclear Threat Initiative (a private foundation dealing with national security issues) and serves as Senior Advisor to the United Nations Foundation.
Mr. Curtis is a member of the Council on Foreign Relations and the Trustee Advisory Council of the Applied Physics Laboratory, Johns Hopkins University. Until 2003, Mr. Curtis was a member of the Electric Power Research Institute Advisory Council and the University of Chicago Board of Governors for Argonne National Laboratory. Prior to 2002, Mr. Curtis was a Member of the Board of Directors of the Gas Technology Institute and the Board of Directors of the Environment and Natural Resources Program Steering Committee, John F. Kennedy School of Government, Harvard University. Until 2001, Mr. Curtis was a member of the Department of Defense Policy Board and Director of EG&G Technical Services, Inc. (a fossil energy research and development support company).
From August 1997 to December 1999, Mr. Curtis was a Partner at Hogan & Hartson L.L.P., a Washington, D.C. law firm. Prior to May 1997, Mr. Curtis was Deputy Secretary of Energy and Under Secretary of the U.S. Department of Energy. He served as Chairman of the Federal Energy Regulatory Commission from 1977 to 1981 and has held positions on the staff of the U.S. House of Representatives, the U.S. Treasury Department, and the SEC.
Myra R. Drucker (Born 1948), Trustee since 2004
Ms. Drucker is Chair of the Board of Trustees of Commonfund (a not-for-profit firm specializing in asset management for educational endowments and foundations), Vice Chair of the Board of Trustees of Sarah Lawrence College, and a member of the Investment Committee of the Kresge Foundation (a charitable trust). She is also a director of New York Stock Exchange LLC, a wholly-owned subsidiary of the publicly-traded NYSE Group, Inc. She is an advisor to Hamilton Lane LLC and RCM Capital Management (investment management firms).
Ms. Drucker is an ex-officio member of the New York Stock Exchange (NYSE) Pension Managers Advisory Committee, having served as Chair for seven years and a member of the Executive Committee of the Committee on Investment of Employee Benefit Assets.
Until August 31, 2004, Ms. Drucker was Managing Director and a member of the Board of Directors of General Motors Asset Management and Chief Investment Officer of General Motors Trust Bank. Ms. Drucker also served as a member of the NYSE Corporate Accountability and Listing Standards Committee and the NYSE/NASD IPO Advisory Committee.
Prior to joining General Motors Asset Management in 2001, Ms. Drucker held various executive positions in the investment management industry. Ms. Drucker served as Chief Investment Officer of Xerox Corporation (a technology and service company in the document industry), where she was responsible for the investment of the company’s pension assets. Ms. Drucker was also Staff Vice President and Director of Trust Investments for International Paper (a paper, paper distribution, packaging and forest products company) and previously served as Manager of Trust Investments for Xerox Corporation. Ms. Drucker received a B.A. degree in Literature and Psychology from Sarah Lawrence College and pursued graduate studies in economics, statistics and portfolio theory at Temple University.
John A. Hill (Born 1942), Trustee since 1985 and Chairman since 2000
Mr. Hill is Vice Chairman of First Reserve Corporation, a private equity buyout firm that specializes in energy investments in the diversified worldwide energy industry.
43
Mr. Hill is a Director of Devon Energy Corporation, TransMontaigne Oil Company and various private companies controlled by First Reserve Corporation, as well as Chairman of TH Lee, Putnam Investment Trust (a closed-end investment company advised by an affiliate of Putnam Management). He is also a Trustee of Sarah Lawrence College. Until 2005, he was a Director of Continuum Health Partners of New York.
Prior to acquiring First Reserve Corporation in 1983, Mr. Hill held executive positions in investment banking and investment management with several firms and with the federal government, including Deputy Associate Director of the Office of Management and Budget and Deputy Director of the Federal Energy Administration. He is active in various business associations, including the Economic Club of New York, and lectures on energy issues in the United States and Europe. Mr. Hill holds a B.A. degree in Economics from Southern Methodist University and pursued graduate studies there as a Woodrow Wilson Fellow.
Paul L. Joskow (Born 1947), Trustee since 1997
Dr. Joskow is the Elizabeth and James Killian Professor of Economics and Management, and Director of the Center for Energy and Environmental Policy Research at the Massachusetts Institute of Technology.
Dr. Joskow serves as a Director of National Grid plc (a UK-based holding company with interests in electric and gas transmission and distribution and telecommunications infrastructure) and TransCanada Corporation (an energy company focused on natural gas transmission and power services). He also serves on the Board of Overseers of the Boston Symphony Orchestra. Prior to February 2005, he served on the board of the Whitehead Institute for Biomedical Research (a non-profit research institution) and has been President of the Yale University Council since 1993. Prior to February 2002, he was a Director of State Farm Indemnity Company (an automobile insurance company), and, prior to March 2000, he was a Director of New England Electric System (a public utility holding company).
Dr. Joskow has published five books and numerous articles on topics in industrial organization, government regulation of industry, and competition policy. He is active in industry restructuring, environmental, energy, competition and privatization policies — serving as an advisor to governments and corporations worldwide. Dr. Joskow holds a Ph.D. and M. Phil from Yale University and a B.A. from Cornell University.
Elizabeth T. Kennan (Born 1938), Trustee since 1992
Dr. Kennan is a Partner of Cambus-Kenneth Farm (thoroughbred horse and cattle breeding). She is President Emeritus of Mount Holyoke College.
Dr. Kennan served as Chairman and is now Lead Director of Northeast Utilities. Until 2005, she was a Director of Talbots, Inc. She has served as Director on a number of other boards, including Bell Atlantic, Chastain Real Estate, Shawmut Bank, Berkshire Life Insurance and Kentucky Home Life Insurance. She is a Trustee of the National Trust for Historic Preservation, of Centre College and of Midway College in Midway, Kentucky. Until 2006, she was a member of The Trustees of Reservations. Dr. Kennan has served on the oversight committee of the Folger Shakespeare Library, as President of Five Colleges Incorporated, as a Trustee of Notre Dame University and is active in various educational and civic associations.
As a member of the faculty of Catholic University for twelve years, until 1978, Dr. Kennan directed the post-doctoral program in Patristic and Medieval Studies, taught history and published numerous articles. Dr. Kennan holds a Ph.D. from the University of Washington in Seattle, an M.S. from St. Hilda’s College at Oxford University and an A.B. from Mount Holyoke College. She holds several honorary doctorates.
Kenneth R. Leibler (Born 1949), Trustee since 2006
Mr. Leibler is founding Chairman of the Boston Options Exchange, the nation’s newest electronic marketplace for the trading of derivative securities.
Mr. Leibler currently serves as a Trustee of Beth Israel Deaconess Hospital in Boston. He is also lead director of Ruder Finn Group, a global communications and advertising firm. Since 2003, he has served as a director of the Optimum Funds group. Prior to October 2006, he served as a director of ISO New England, the organization responsible for the operation of the electric generation system in the New England states. Prior to 2000, he was a director of the Investment Company Institute in Washington, D.C.
44
Prior to January 2005, Mr. Leibler served as Chairman and Chief Executive Officer of the Boston Stock Exchange. Prior to January 2000, he served as President and Chief Executive Officer of Liberty Financial Companies, a publicly traded diversified asset management organization. Prior to June 1990, he served as President and Chief Operating Officer of the American Stock Exchange, the youngest person in Exchange history to hold the title of President. Prior to serving as Amex President, he held the position of Chief Financial Officer, and headed its management and marketing operations. Mr. Leibler graduated magna cum laude in economics from Syracuse University, where he was elected Phi Beta Kappa.
Robert E. Patterson (Born 1945), Trustee since 1984
Mr. Patterson is Senior Partner of Cabot Properties, L.P. and Chairman of Cabot Properties, Inc. (a private equity firm investing in commercial real estate).
Mr. Patterson serves as Chairman Emeritus and Trustee of the Joslin Diabetes Center and as a Director of Brandywine Trust Group, LLC. Prior to June 2003, he was a Trustee of Sea Education Association. Prior to December 2001, he was President and Trustee of Cabot Industrial Trust (a publicly traded real estate investment trust). Prior to February 1998, he was Executive Vice President and Director of Acquisitions of Cabot Partners Limited Partnership (a registered investment adviser involved in institutional real estate investments). Prior to 1990, he served as Executive Vice President of Cabot, Cabot & Forbes Realty Advisors, Inc. (the predecessor company of Cabot Partners).
Mr. Patterson practiced law and held various positions in state government and was the founding Executive Director of the Massachusetts Industrial Finance Agency. Mr. Patterson is a graduate of Harvard College and Harvard Law School.
W. Thomas Stephens (Born 1942), Trustee since 1997
Mr. Stephens is Chairman and Chief Executive Officer of Boise Cascade, L.L.C. (a paper, forest products and timberland assets company).
Until 2005, Mr. Stephens was a director of TransCanadaPipelines, Ltd. Until 2004, Mr. Stephens was a Director of Xcel Energy Incorporated (a public utility company), Qwest Communications, and Norske Canada, Inc. (a paper manufacturer). Until 2003, Mr. Stephens was a Director of Mail-Well, Inc. (a diversified printing company). He served as Chairman of Mail-Well until 2001 and as CEO of MacMillan-Bloedel, Ltd. (a forest products company) until 1999.
Prior to 1996, Mr. Stephens was Chairman and Chief Executive Officer of Johns Manville Corporation. He holds B.S. and M.S. degrees from the University of Arkansas.
Richard B. Worley (Born 1945), Trustee since 2004
Mr. Worley is Managing Partner of Permit Capital LLC, an investment management firm.
Mr. Worley serves on the Executive Committee of the University of Pennsylvania Medical Center, is a Trustee of The Robert Wood Johnson Foundation (a philanthropic organization devoted to health care issues) and is a Director of The Colonial Williamsburg Foundation (a historical preservation organization). Mr. Worley also serves on the investment committees of Mount Holyoke College and World Wildlife Fund (a wildlife conservation organization).
Prior to joining Permit Capital LLC in 2002, Mr. Worley served as Chief Strategic Officer of Morgan Stanley Investment Management. He previously served as President, Chief Executive Officer and Chief Investment Officer of Morgan Stanley Dean Witter Investment Management and as a Managing Director of Morgan Stanley, a financial services firm. Mr. Worley also was the Chairman of Miller Anderson & Sherrerd, an investment management firm.
Mr. Worley holds a B.S. degree from University of Tennessee and pursued graduate studies in economics at the University of Texas.
Charles E. Haldeman, Jr.* (Born 1948), Trustee since 2004
Mr. Haldeman is President and Chief Executive Officer of Putnam, LLC (“Putnam Investments”). He is a member of Putnam Investments’ Executive Board of Directors and Advisory Council. Prior to November 2003, Mr. Haldeman served as Co-Head of Putnam Investments’ Investment Division.
Prior to joining Putnam Investments in 2002, Mr. Haldeman held executive positions in the investment management industry. He previously served as Chief Executive Officer of Delaware Investments and President & Chief Operating Officer of United Asset Management. Mr. Haldeman was also a partner and director of Cooke & Bieler, Inc. (an investment management firm).
Mr. Haldeman currently serves on the Board of Governors of the Investment Company Institute and as a Trustee of Dartmouth College, and he is a member of the Partners HealthCare Systems Investment Committee. He is a graduate of Dartmouth College, Harvard Law School and Harvard Business School. Mr. Haldeman is also a Chartered Financial Analyst (CFA) charterholder.
45
George Putnam, III* (Born 1951), Trustee since 1984 and President since 2000
Mr. Putnam is President of New Generation Research, Inc.
(a publisher of financial advisory and other research services), and of New Generation Advisers, Inc. (a registered investment advisor to private funds). Mr. Putnam founded the New Generation companies in 1986.
Mr. Putnam is a Director of The Boston Family Office, LLC (a registered investment adviser). He is a Trustee of St. Mark’s School and Shore Country Day School, and until 2002 was a Trustee of the Sea Education Association.
Mr. Putnam previously worked as an attorney with the law firm of Dechert LLP (formerly known as Dechert Price & Rhoads) in Philadelphia. He is a graduate of Harvard College, Harvard Business School and Harvard Law School.
The address of each Trustee is One Post Office Square, Boston, MA 02109.
As of September 30, 2006, there were 108 Putnam Funds. All Trustees serve as Trustees of all Putnam funds.
Each Trustee serves for an indefinite term, until his or her resignation, retirement at age 72, death, or removal.
* Trustees who are or may be deemed to be “interested persons” (as defined in the Investment Company Act of 1940) of the fund, Putnam Management, Putnam Retail Management, or Marsh & McLennan Companies, Inc., the parent company of Putnam, LLC and its affiliated companies. Messrs. Haldeman and Putnam, III are deemed “interested persons” by virtue of their positions as officers of the fund, Putnam Management or Putnam Retail Management and as shareholders of Marsh & McLennan Companies, Inc. Mr. Putnam, III is the President of your fund and each of the other Putnam funds. Mr. Haldeman is President and Chief Executive Officer of Putnam Investments.
46
Officers
In addition to George Putnam, III, the other officers of the fund are shown below:
Charles E. Porter (Born 1938)
Executive Vice President, Principal Executive Officer, Associate
Treasurer, and Compliance Liaison
Since 1989
Jonathan S. Horwitz (Born 1955)
Senior Vice President and Treasurer
Since 2004
Prior to 2004, Managing Director,
Putnam Investments
Steven D. Krichmar (Born 1958)
Vice President and Principal Financial Officer
Since 2002
Senior Managing Director, Putnam Investments.
Prior to July 2001, Partner, PricewaterhouseCoopers LLP
Michael T. Healy (Born 1958)
Assistant Treasurer and Principal Accounting Officer
Since 2000
Managing Director, Putnam Investments
Beth S. Mazor (Born 1958)
Vice President
Since 2002
Managing Director, Putnam Investments
James P. Pappas (Born 1953)
Vice President
Since 2004
Managing Director, Putnam Investments and Putnam Management.
During 2002, Chief Operating Officer, Atalanta/Sosnoff Management
Corporation; prior to 2001, President and Chief Executive Officer,
UAM Investment Services, Inc.
Richard S. Robie, III (Born 1960)
Vice President
Since 2004
Senior Managing Director, Putnam Investments, Putnam Management
and Putnam Retail Management. Prior to 2003, Senior Vice President,
United Asset Management Corporation
Francis J. McNamara, III (Born 1955)
Vice President and Chief Legal Officer
Since 2004
Senior Managing Director, Putnam Investments, Putnam Management
and Putnam Retail Management. Prior to 2004, General Counsel,
State Street Research & Management Company
Charles A. Ruys de Perez (Born 1957)
Vice President and Chief Compliance Officer
Since 2004
Managing Director, Putnam Investments
Mark C. Trenchard (Born 1962)
Vice President and BSA Compliance Officer
Since 2002
Managing Director, Putnam Investments
Judith Cohen (Born 1945)
Vice President, Clerk and Assistant Treasurer
Since 1993
Wanda M. McManus (Born 1947)
Vice President, Senior Associate Treasurer and Assistant Clerk
Since 2005
Nancy E. Florek (Born 1957)
Vice President, Assistant Clerk, Assistant Treasurer
and Proxy Manager
Since 2005
The address of each Officer is One Post Office Square, Boston, MA 02109.
47
The Putnam Family of Funds
The following is a list of Putnam’s open-end mutual funds offered to the public. Investors should carefully consider the investment objective, risks, charges, and expenses of a fund before investing. For a prospectus containing this and other information for any Putnam fund or product, call your financial advisor at 1-800-225-1581 and ask for a prospectus. Please read the prospectus carefully before investing.
Growth funds
Discovery Growth Fund
Growth Opportunities Fund
Health Sciences Trust
International New Opportunities Fund*
New Opportunities Fund
OTC & Emerging Growth Fund
Small Cap Growth Fund*
Vista Fund
Voyager Fund
Blend funds
Capital Appreciation Fund
Capital Opportunities Fund*
Europe Equity Fund*
Global Equity Fund*
Global Natural Resources Fund*
International Capital Opportunities Fund*
International Equity Fund*
Investors Fund
Research Fund
Tax Smart Equity Fund®
Utilities Growth and Income Fund
Value funds
Classic Equity Fund
Convertible Income-Growth Trust
Equity Income Fund
The George Putnam Fund of Boston
The Putnam Fund for Growth and Income
International Growth and Income Fund*
Mid Cap Value Fund
New Value Fund
Small Cap Value Fund*†
Income funds
American Government Income Fund
Diversified Income Trust
Floating Rate Income Fund
Global Income Trust*
High Yield Advantage Fund*†
High Yield Trust*
Income Fund
Limited Duration Government Income Fund
Money Market Fund‡
U.S. Government Income Trust
Tax-free income funds
AMT-Free Insured Municipal Fund
Tax Exempt Income Fund
Tax Exempt Money Market Fund§
Tax-Free High Yield Fund
State tax-free income funds:
Arizona, California, Florida, Massachusetts, Michigan, Minnesota,
New Jersey, New York, Ohio, and Pennsylvania
Asset allocation funds
Income Strategies Fund
Putnam Asset Allocation Funds — three investment portfolios that spread your money across a variety of stocks, bonds, and money market investments.
The three portfolios:
Asset Allocation: Balanced Portfolio
Asset Allocation: Conservative Portfolio
Asset Allocation: Growth Portfolio
Putnam RetirementReady® Funds
Putnam RetirementReady Funds — ten investment portfolios that offer diversification among stocks, bonds, and money market instruments and adjust to become more conservative over time based on a target date for withdrawing assets.
The ten funds:
Putnam RetirementReady 2050 Fund
Putnam RetirementReady 2045 Fund
Putnam RetirementReady 2040 Fund
Putnam RetirementReady 2035 Fund
Putnam RetirementReady 2030 Fund
Putnam RetirementReady 2025 Fund
Putnam RetirementReady 2020 Fund
Putnam RetirementReady 2015 Fund
Putnam RetirementReady 2010 Fund
Putnam RetirementReady Maturity Fund
* A 1% redemption fee on total assets redeemed or exchanged within 90 days of purchase may be imposed for all share classes of these funds.
† Closed to new investors.
‡ An investment in a money market fund is not insured or guaranteed by the Federal Deposit Insurance Corporation or any other government agency. Although the fund seeks to preserve your investment at $1.00 per share, it is possible to lose money by investing in the fund.
With the exception of money market funds, a 1% redemption fee may be applied to shares exchanged or sold within 7 days of purchase (90 days, for certain funds).
Check your account balances and the most recent month-end performance at www.putnam.com.
48
Fund information
Founded over 65 years ago, Putnam Investments was built around the concept that a balance between risk and reward is the hallmark of a well-rounded financial program. We manage over 100 mutual funds in growth, value, blend, fixed income, and international.
| Investment Manager | Officers | Judith Cohen |
| Putnam Investment | George Putnam, III | Vice President, Clerk and Assistant Treasurer |
| Management, LLC | President | |
| One Post Office Square | | |
| Boston, MA 02109 | Charles E. Porter | Wanda M. McManus |
| Executive Vice President, Principal | Vice President, Senior Associate Treasurer |
| Marketing Services | Executive Officer, Associate Treasurer, | and Assistant Clerk |
| Putnam Retail Management | and Compliance Liaison | |
| One Post Office Square | | Nancy E. Florek |
| Boston, MA 02109 | Jonathan S. Horwitz | Vice President, Assistant Clerk, |
| Senior Vice President and Treasurer | Assistant Treasurer and Proxy Manager |
| Custodian | | |
| Putnam Fiduciary Trust Company | Steven D. Krichmar | |
| Vice President and Principal Financial Officer | |
| Legal Counsel | | |
| Ropes & Gray LLP | Michael T. Healy | |
| Assistant Treasurer and Principal | |
| Independent Registered Public | Accounting Officer | |
| Accounting Firm | | |
| KPMG LLP | Beth S. Mazor | |
| Vice President | |
| Trustees | | |
| John A. Hill, Chairman | James P. Pappas | |
| Jameson Adkins Baxter, Vice Chairman | Vice President | |
| Charles B. Curtis | | |
| Myra R. Drucker | Richard S. Robie, III | |
| Charles E. Haldeman, Jr. | Vice President | |
| Paul L. Joskow | | |
| Elizabeth T. Kennan | Francis J. McNamara, III | |
| Kenneth R. Leibler | Vice President and Chief Legal Officer | |
| Robert E. Patterson | | |
| George Putnam, III | Charles A. Ruys de Perez | |
| W. Thomas Stephens | Vice President and Chief Compliance Officer | |
| Richard B. Worley | | |
| Mark C. Trenchard | |
| Vice President and BSA Compliance Officer | |
| | |
This report is for the information of shareholders of Putnam California Tax Exempt Income Fund. It may also be used as sales literature when preceded or accompanied by the current prospectus, the most recent copy of Putnam’s Quarterly Performance Summary, and Putnam’s Quarterly Ranking Summary. For more recent performance, please visit www.putnam.com. Investors should carefully consider the investment objective, risks, charges, and expenses of a fund, which are described in its prospectus. For this and other information or to request a prospectus, call 1-800-225-1581 toll free. Please read the prospectus carefully before investing. The fund’s Statement of Additional Information contains additional information about the fund’s Trustees and is available without charge upon request by calling 1-800-225-1581.

Item 2. Code of Ethics:
(a) The fund’s principal executive, financial and accounting officers are employees of Putnam Investment Management, LLC, the Fund's investment manager. As such they are subject to a comprehensive Code of Ethics adopted and administered by Putnam Investments which is designed to protect the interests of the firm and its clients. The Fund has adopted a Code of Ethics which incorporates the Code of Ethics of Putnam Investments with respect to all of its officers and Trustees who are employees of Putnam Investment Management, LLC. For this reason, the Fund has not adopted a separate code of ethics governing its principal executive, financial and accounting officers.
(c) None
Item 3. Audit Committee Financial Expert:
The Funds' Audit and Compliance Committee is comprised solely of Trustees who are "independent" (as such term has been defined by the Securities and Exchange Commission ("SEC") in regulations implementing Section 407 of the Sarbanes-Oxley Act (the "Regulations")). The Trustees believe that each of the members of the Audit and Compliance Committee also possess a combination of knowledge and experience with respect to financial accounting matters, as well as other attributes, that qualify them for service on the Committee. In addition, the Trustees have determined that each of Mr. Patterson, Mr. Stephens, Mr. Leibler and Mr. Hill meets the financial literacy requirements of the New York Stock Exchange's rules and qualifies as an "audit committee financial expert" (as such term has been defined by the Regulations) based on their review of his pertinent experience and education. Certain other Trustees, although not on the Audit and Compliance Committee, would also quali fy as "audit committee financial experts." The SEC has stated that the designation or identification of a person as an audit committee financial expert pursuant to this Item 3 of Form N-CSR does not impose on such person any duties, obligations or liability that are greater than the duties, obligations and liability imposed on such person as a member of the Audit and Compliance Committee and the Board of Trustees in the absence of such designation or identification.
Item 4. Principal Accountant Fees and Services:
The following table presents fees billed in each of the last two fiscal years for services rendered to the fund by the fund’s independent auditor:
| Fiscal | | Audit- | | |
| year | Audit | Related | Tax | All Other |
| ended | Fees | Fees | Fees | Fees |
|
|
| September 30, 2006 | $42,280 | $-- | $4,680 | $1,383 |
| September 30, 2005 | $37,192 | $-- | $4,192 | $ - |
For the fiscal years ended September 30, 2006 and September 30, 2005, the fund’s independent auditor billed aggregate non-audit fees in the amounts of $6,063 and $4,192 respectively, to the fund, Putnam Management and any entity controlling, controlled by or under common control with Putnam Management that provides ongoing services to the fund.
Audit Fees represent fees billed for the fund’s last two fiscal years.
Audit-Related Fees represent fees billed in the fund’s last two fiscal years for services traditionally performed by the fund’s auditor, including accounting consultation for proposed transactions or concerning financial accounting and reporting standards and other audit or attest services not required by statute or regulation.
Tax Fees represent fees billed in the fund’s last two fiscal years for tax compliance, tax planning and tax advice services. Tax planning and tax advice services include assistance with tax audits, employee benefit plans and requests for rulings or technical advice from taxing authorities.
All Other Fees represent fees billed for services relating to expense allocation methodology.
Pre-Approval Policies of the Audit and Compliance Committee. The Audit and Compliance Committee of the Putnam funds has determined that, as a matter of policy, all work performed for the funds by the funds’ independent auditors will be pre-approved by the Committee itself and thus will generally not be subject to pre-approval procedures.
The Audit and Compliance Committee also has adopted a policy to pre-approve the engagement by Putnam Management and certain of its affiliates of the funds’ independent auditors, even in circumstances where pre-approval is not required by applicable law. Any such requests by Putnam Management or certain of its affiliates are typically submitted in writing to the Committee and explain, among other things, the nature of the proposed engagement, the estimated fees, and why this work should be performed by that particular audit firm as opposed to another one. In reviewing such requests, the Committee considers, among other things, whether the provision of such services by the audit firm are compatible with the independence of the audit firm.
The following table presents fees billed by the fund’s independent auditor for services required to be approved pursuant to paragraph (c)(7)(ii) of Rule 2-01 of Regulation S-X.
| Fiscal | Audit- | | All | Total |
| year | Related | Tax | Other | Non-Audit |
| ended | Fees | Fees | Fees | Fees |
| September 30, | | | | |
| 2006 | $ - | $ - | $ - | $ - |
| September | | | | |
| 30, 2005 | $ - | $ - | $ - | $ - |
Item 5. Audit Committee of Listed Registrants
Not applicable
Item 6. Schedule of Investments:
The registrant’s schedule of investments in unaffiliated issuers is included in the report to shareholders in Item 1 above.
Item 7. Disclosure of Proxy Voting Policies and Procedures For Closed-End Management Investment Companies:
Not applicable
Item 8. Portfolio Managers of Closed-End Investment Companies
Not Applicable
Item 9. Purchases of Equity Securities by Closed-End Management Investment Companies and Affiliated Purchasers:
Not applicable
Item 10. Submission of Matters to a Vote of Security Holders:
| Item 11. Controls and Procedures: |
(a) The registrant's principal executive officer and principal financial officer have concluded, based on their evaluation of the effectiveness of the design and operation of the registrant's disclosure controls and procedures as of a date within 90 days of the filing date of this report, that the design and operation of such procedures are generally effective to provide reasonable assurance that information required to be disclosed by the registrant in this report is recorded, processed, summarized and reported within the time periods specified in the Commission's rules and forms.
(b) Changes in internal control over financial reporting: Not applicable
(a)(1) The Code of Ethics of The Putnam Funds, which incorporates the Code of Ethics of Putnam Investments, is filed herewith.
(a)(2) Separate certifications for the principal executive officer and principal financial officer of the registrant as required by Rule 30a-2(a) under the Investment Company Act of 1940, as amended, are filed herewith.
(b) The certifications required by Rule 30a-2(b) under the Investment Company Act of 1940, as amended, are filed herewith.
Pursuant to the requirements of the Securities Exchange Act of 1934 and the Investment Company Act of 1940, the registrant has duly caused this report to be signed on its behalf by the undersigned, thereunto duly authorized.
Putnam California Tax Exempt Income Fund
By (Signature and Title):
/s/Michael T. Healy
Michael T. Healy
Principal Accounting Officer
Date: December 5, 2006 |
Pursuant to the requirements of the Securities Exchange Act of 1934 and the Investment Company Act of 1940, this report has been signed below by the following persons on behalf of the registrant and in the capacities and on the dates indicated.
By (Signature and Title):
/s/Charles E. Porter
Charles E. Porter
Principal Executive Officer
Date: December 5, 2006 |
By (Signature and Title):
/s/Steven D. Krichmar
Steven D. Krichmar
Principal Financial Officer
Date: December 5, 2006