| | |
| UNITED STATES |
| SECURITIES AND EXCHANGE COMMISSION |
| Washington, D.C. 20549 |
| |
| FORM N-CSR |
| |
| CERTIFIED SHAREHOLDER REPORT OF REGISTERED |
| MANAGEMENT INVESTMENT COMPANIES |
| | |
| Investment Company Act file number: (811- 03630) | |
| |
| Exact name of registrant as specified in charter: Putnam California Tax Exempt Income Fund |
| |
| Address of principal executive offices: One Post Office Square, Boston, Massachusetts 02109 |
| | |
| Name and address of agent for service: | Beth S. Mazor, Vice President |
| | One Post Office Square |
| | Boston, Massachusetts 02109 |
| | |
| Copy to: | John W. Gerstmayr, Esq. |
| | Ropes & Gray LLP |
| | One International Place |
| | Boston, Massachusetts 02110 |
| | |
| Registrant’s telephone number, including area code: | (617) 292-1000 |
| | |
| Date of fiscal year end: September 30, 2008 | |
| |
| Date of reporting period: October 1, 2007— September 30, 2008 |
Item 1. Report to Stockholders:
The following is a copy of the report transmitted to stockholders pursuant to Rule 30e-1 under the Investment Company Act of 1940:

What makes
Putnam different?
A time-honored tradition in money management
Since 1937, our values have been rooted in a profound sense of responsibility for the money entrusted to us.
A prudent approach to investing
We use a research-driven team approach to seek superior investment results over time.
Funds for every investment goal
We offer a broad range of mutual funds and other financial products so investors and their financial representatives can build diversified portfolios.
A commitment to doing what’s right for investors
With a focus on investment performance, below-average expenses, and in-depth information about our funds, we put the interests of investors first and seek to set the standard for integrity and service.
Industry-leading service
We help investors, along with their financial representatives, make informed investment decisions with confidence.

In 1830, Massachusetts Supreme Judicial Court Justice Samuel Putnam established The Prudent Man Rule, a legal foundation for responsible money management.
THE PRUDENT MAN RULE
All that can be required of a trustee to invest is that he shall conduct himself faithfully and exercise a sound discretion. He is to observe how men of prudence, discretion, and intelligence manage their own affairs, not in regard to speculation, but in regard to the permanent disposition of their funds, considering the probable income, as well as the probable safety of the capital to be invested.

Putnam
California
Tax Exempt
Income Fund
9 | 30 | 08
Annual Report
| |
| Message from the Trustees | 1 |
| About the fund | 2 |
| Performance and portfolio snapshots | 4 |
| Interview with your fund’s Portfolio Leader | 5 |
| Performance in depth. | 8 |
| Expenses | 10 |
| Portfolio turnover | 12 |
| Risk | 12 |
| Your fund’s management. | 13 |
| Terms and definitions | 14 |
| Trustee approval of management contract | 15 |
| Other information for shareholders. | 18 |
| Financial statements | 19 |
| Federal tax information | 37 |
| About the Trustees | 38 |
| Officers | 41 |
Cover photograph: © Richard H. Johnson
Message from the Trustees
Dear Fellow Shareholder:
The financial markets have been experiencing the kind of upheaval not seen in decades. Investor confidence has been shaken by losses across a range of sectors and by the collapse of several financial industry companies. Coordinated responses by a full array of economic and financial authorities both in the United States and overseas should restore stability in due course, but investors should not expect a reduction in volatility in the near term. The likelihood of a U.S. recession, in particular, now makes the situation more challenging. History has shown that markets are extremely resilient over the long term, and we expect that, in time, they will recover from this crisis.
As a shareholder of this fund, you should feel confident about the financial standing of Putnam Investments. Our parent companies, Great-West Lifeco and Power Financial Corporation, are among the largest and most successful organizations in the financial services industry. All three companies are well capitalized with strong cash flows.
We are pleased to announce that Robert L. Reynolds, a well-known leader and visionary in the mutual fund industry, has joined the Putnam leadership team as President and Chief Executive Officer of Putnam Investments, effective July 1, 2008. Charles E. Haldeman, Jr., former President and CEO, has taken on the role of Chairman of Putnam Investment Management, LLC, the firm’s fund management company. He continues to serve as President of the Funds and as a Trustee.
Mr. Reynolds brings to Putnam Investments substantial industry experience and an outstanding record of success, including serving as Vice Chairman and Chief Operating Officer at Fidelity Investments from 2000 to 2007. We look forward to working with Mr. Reynolds as we continue our efforts to position Putnam Investments to exceed our shareholders’ expectations.
We would also like to take this opportunity to welcome new shareholders to the fund and to thank all of our investors for your continued confidence in Putnam during these challenging times.

About the fund
Potential for tax-advantaged high current income
When investing in tax-exempt bonds, opportunities come in all shapes and sizes. This is especially true with Putnam California Tax Exempt Income Fund. The fund explores the vast California municipal bond market, seeking to deliver high current income and tax advantages.
Municipal bonds are typically issued by states and local municipalities to raise funds for building and maintaining public facilities. They are backed by either the issuing state, city, or town, or by revenues collected from usage fees. As a result, they have varying degrees of credit risk — that is, the risk that the issuer will not be able to repay the bond.
A municipal bond’s greatest benefit is that its income is generally exempt from federal income tax, and from state income tax for residents of the state in which the bond is issued. In California, this tax exemption is an especially powerful advantage because the state’s maximum income-tax rate is among the highest in the United States. And the sheer size of the California municipal bond market — it is one of the largest and most diverse in the country, encompassing virtually every sector of the municipal bond market — enables it to establish trends and shape demand in municipal bond markets across the country.
The fund seeks to capitalize on the opportunities available in California by investing in a range of bonds —primarily investment grade — across various sectors. When deciding whether to invest in a bond, the fund’s management team primarily considers credit risk and interest-rate risk, as well as the risk that the bond will be prepaid. Once a bond has been purchased, the management team continues to monitor developments that affect the bond market, the specific sector, and the bond issuer.
The goal of the management team’s research and active management is to stay a step ahead of the industry and pinpoint opportunities to adjust the fund’s holdings for the benefit of the fund and its shareholders.
The fund concentrates its investments by region and involves more risk than a fund that invests more broadly. Capital gains, if any, are taxable for federal and, in most cases, state purposes. For some investors, investment income may be subject to the federal alternative minimum tax. Income from federally exempt funds may be subject to state and local taxes. Tax-free funds may not be suitable for IRAs and other non-taxable accounts. Consult your tax advisor for more information. Funds that invest in bonds are subject to certain risks, including interest-rate risk, credit risk, and inflation risk. As interest rates rise, the prices of bonds fall. Long-term bonds are more exposed to interest-rate risk than short-term bonds. Unlike bonds, bond funds have ongoing fees and expenses.
Understanding tax-equivalent yield
To understand the value of tax-free income, it is helpful to compare a municipal bond’s yield with the “tax-equivalent yield” — the before-tax yield that must be offered by a taxable bond in order to equal the municipal bond’s yield after taxes.
How to calculate tax-equivalent yield:
The tax-equivalent yield equals the municipal bond’s yield divided by “one minus the tax rate.” For example, if a municipal bond’s yield is 5%, then its tax-equivalent yield is 7.7%, assuming the maximum 35% federal tax rate for 2008.

Results for investors subject to lower tax rates would not be as advantageous.
Municipal bonds may finance a range of projects in your community and thus play a key role in its development.

Performance and portfolio snapshots
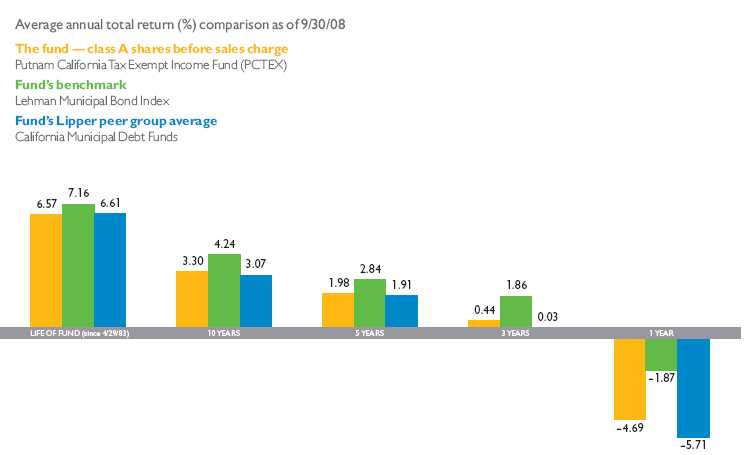
Current performance may be lower or higher than the quoted past performance, which cannot guarantee future results. Share price, principal value, and return will fluctuate, and you may have a gain or a loss when you sell your shares. Performance of class A shares assumes reinvestment of distributions and does not account for taxes. Fund returns in the bar chart do not reflect a sales charge of 4.00%; had they, returns would have been lower. See pages 5 and 8–9 for additional performance information. For a portion of the periods, this fund may have limited expenses, without which returns would have been lower. A 1% short-term trading fee may apply. To obtain the most recent month-end performance, visit www.putnam.com.
“We believe that many areas of the municipal bond market have been oversold by panicked investors, creating unique opportunities for the fund to add highly rated bonds paying unusually high yields.”
Thalia Meehan, Portfolio Leader, Putnam California Tax Exempt Income Fund
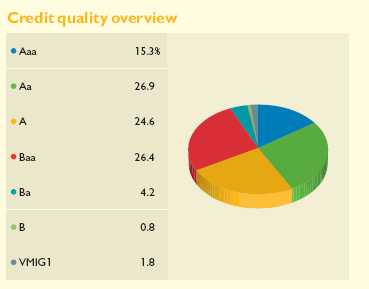
Credit qualities shown as a percentage of portfolio value as of 9/30/08. A bond rated Baa or higher (MIG3/VMIG3 or higher, for short-term debt) is considered investment grade. The chart reflects Moody’s ratings; percentages may include bonds not rated by Moody’s but considered by Putnam Management to be of comparable quality. Ratings will vary over time.
4

Thalia Meehan
Thank you,Thalia, for talking with us today about what has been a tumultuous 12 months for the fixed-income markets. How has this affected the municipal bond market?
The past 12 months have been a historically challenging time for nearly all markets, including municipal bonds. Several factors related to the subprime-lending crisis contributed to an increase in volatility for municipal bonds during the period. Concerns about the credit ratings of municipal bond insurers, which also insure subprime debt, added to the volatility in late 2007 and during the first half of 2008. In addition, forced selling by hedge funds and investment banks put pressure on municipal bonds as these firms needed to raise capital and cover losses. All of this added up to an environment in which all investment-grade asset classes, including municipal bonds, underperformed U.S. Treasuries.
How did Putnam CaliforniaTax Exempt Income Fund fare?
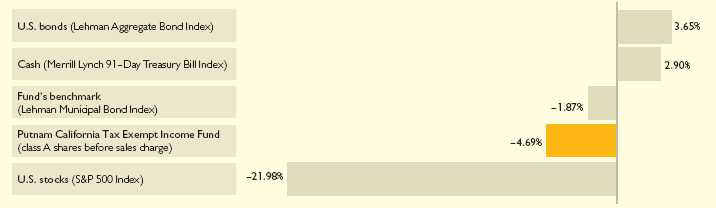
In these rough markets, the fund continued to outperform its peers; however, the fund did post a negative return for the period. For the 12 months ended September 30, 2008, the fund returned –4.69%, outperforming its Lipper class, California Municipal Debt Funds, which returned –5.71%. The fund simultaneously lagged its benchmark, the Lehman Municipal Bond Index, which returned –1.87%. The national benchmark tracks the performance of a broad range of municipal bonds.
The final month of the 12-month period was particularly tumultuous. Can you describe what happened with municipal bonds during that time?
The municipal bond market endured one of its worst months ever in September. As the credit crisis grew to epic proportions, the yield spreads between tax-exempt bonds and Treasury bonds diverged dramatically, as investors eschewed all asset classes with any credit risk.
But three recent factors further compounded the credit concerns. The first was unrelenting downward price pressure on municipal bonds. This pressure was spurred by the forced selling of hedge fund positions and the rumored potential liquidation of AIG’s $50 billion to $60 billion municipal portfolio.
Broad market index and fund performance
This comparison shows your fund’s performance in the context of broad market indexes for the 12 months ended 9/30/08. See the previous page and pages 8–9 for additional fund performance information. Index descriptions can be found on page 14.
5
Second, dealer liquidity became more constrained with the historic bankruptcy of Lehman Brothers, the exit of UBS from the institutional market, and the purchase of Merrill Lynch by Bank of America.
Finally, we saw a temporary lack of primary market supply of municipal bonds due to market conditions. Because new issues typically help provide price discovery in the marketplace, as dealers delayed pricing new issues, secondary market liquidity was negatively affected. All of these issues put downward pressure on municipal bond prices, further hurting the asset class’s performance.
How did you position the portfolio in light of these ongoing issues?
We’ve decided to remain cautious, continuing to focus on keeping the fund’s overall credit quality high. The fund’s shorter-maturity positions helped performance as the yield curve steepened and prices on shorter-term instruments held up better than longer-maturity bonds. Security selection in the insured sector also aided relative performance. At the beginning of the period, nearly all insured bonds traded in a relatively tight range. As concerns rose about monoline insurers (firms that insure issuers of municipal debt), there was growing differentiation in quality among insured issues. Our positioning within insured issues aided performance relative to our peers.
Any notable contributors and detractors?
Puerto Rico Aqueduct and Sewer Authority bonds aided performance for the year. We believed these bonds were being wrongly undervalued due to fears of oversupply in Puerto Rico and general credit market weakness. We were rewarded when the bonds rallied.
Another strong performer was our holding in bonds issued for University of the Pacific, which benefitted from being a short-maturity, high-quality credit bond. This position outperformed on a relative basis as the yield curve steepened and shorter-maturity issues outperformed their longer-maturity counterparts.
Tobacco settlement bond Golden Tobacco was a notable detractor. Tobacco settlement bonds are secured by the income stream from tobacco companies’ lawsuit-settlement obligations to individual states — and generally offer higher yields than bonds of comparable quality. The tobacco sector, however, began underperforming in the fall of 2007 as investors began a flight to quality credit. Because the market for tobacco bonds is large and relatively liquid, investors who wanted to trim credit exposure sold these liquid bonds first, which put pressure on the sector as a whole.
Our exposure to bonds issued by Southern California Public Power Authority also hurt performance. On the whole, prepaid gas bonds help a municipal utility buy
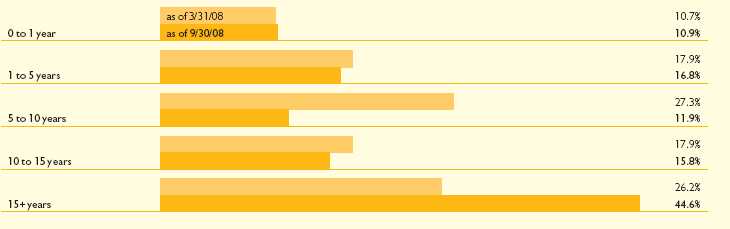
Comparison of maturity composition
This chart illustrates the fund’s composition by maturity, showing the percentage of holdings in different maturity ranges and how the composition has changed over the past six months. Holdings and maturity ranges will vary over time.
6
natural gas at a discounted price. One important feature of a prepaid gas bond, however, is that the bond’s rating is tied to its financial sponsor — in this case, Goldman Sachs. Because Goldman was among the broker/ dealers affected by liquidity problems and concerns about subprime exposure, the performance of these bonds suffered.
What is your outlook for the municipal bond market?
Investors have seen the Federal Reserve [the Fed] dramatically inject liquidity into the markets, and the government take other unprecedented steps to aid the economy and free up credit markets. However, it is important to understand that the effects of many of the changes will take time, and markets are likely, in our view, to remain volatile in the near term — particularly with the lingering concerns over state budgets and monoline insurers.
Despite the current market environment, we see two key reasons why municipal bond funds remain particularly attractive. The first is future tax rates. We believe that income tax rates are unlikely to fall from here and may even rise with a new administration in the White House, given that the Bush tax cuts are scheduled to sunset in 2010. This may cause municipal bonds to become an even more attractive asset class relative to taxable fixed income.
Second, the overall credit quality of the municipal asset class remains strong. The fund has benefited from having a bias for higher-quality holdings in the portfolio. We believe that many areas of the municipal bond market have been oversold by panicked investors, creating unique opportunities for the fund to add highly rated bonds paying unusually high yields.
Finally, I’d like to add that in these turbulent credit markets, investors should understand that Putnam’s deep research bench is making a difference for them every day. As confidence in the public ratings agencies is called into question, the in-depth, independent research of a large, integrated team like ours cannot be overemphasized.
Thank you, Thalia, for your time and insights today.
The views expressed in this report are exclusively those of Putnam Management. They are not meant as investment advice.
I N T H E N E W S
In early October, federal lawmakers approved the Emergency Economic Stabilization Act of 2008 (EESA), a $700 billion economic package designed to ease the nation’s worsening credit crisis. Under the law, a Troubled Asset Relief Program (TARP) was originally authorized to purchase failed mortgages and mortgage-related securities at the heart of the credit crisis. However, in mid-November, U.S. Treasury Secretary Henry Paulson redirected TARP’s mission to help relieve pressure in the area of consumer credit. TARP will now focus on offering aid to banks and other firms that issue student, auto, and credit card loans.
Please note that the holdings discussed in this report may not have been held by the fund for the entire period. Portfolio composition is subject to review in accordance with the fund’s investment strategy and may vary in the future.
Comparison of top sector weightings
This chart shows how the fund’s top weightings have changed over the past six months. Weightings are shown as a percentage of net assets. Holdings will vary over time. Sector concentrations listed after the portfolio schedule in the Financial Statements section of this shareholder report are exclusive of insured or prerefunded status and may differ from the summary information below.

7
Your fund’s performance
This section shows your fund’s performance, price, and distribution information for periods ended September 30, 2008, the end of its most recent fiscal year. In accordance with regulatory requirements for mutual funds, we also include expense information taken from the fund’s current prospectus. Performance should always be considered in light of a fund’s investment strategy. Data represents past performance. Past performance does not guarantee future results. More recent returns may be less or more than those shown. Investment return and principal value will fluctuate, and you may have a gain or a loss when you sell your shares. Performance information does not reflect any deduction for taxes a shareholder may owe on fund distributions or on the redemption of fund shares. For the most recent month-end performance, please visit the Individual Investors section of www.putnam.com or call Putnam at 1-800-225-1581. Class Y shares are generally only available to corporate and institutional clients and clients in other approved programs. See the Terms and Definitions section in this report for definitions of the share classes offered by your fund.
Fund performance Total return for periods ended 9/30/08
| | | | | | | | | |
| | Class A | Class B | Class C | Class M | Class Y |
| (inception dates) | (4/29/83) | (1/4/93) | (7/26/99) | (2/14/95) | (1/2/08) |
|
| | NAV | POP | NAV | CDSC | NAV | CDSC | NAV | POP | NAV |
|
| Annual average (life of fund) | 6.57% | 6.40% | 5.78% | 5.78% | 5.72% | 5.72% | 6.16% | 6.02% | 6.59% |
|
| 10 years | 38.38 | 32.88 | 29.79 | 29.79 | 27.89 | 27.89 | 34.20 | 29.78 | 38.80 |
| Annual average | 3.30 | 2.88 | 2.64 | 2.64 | 2.49 | 2.49 | 2.99 | 2.64 | 3.33 |
|
| 5 years | 10.28 | 5.96 | 6.73 | 5.04 | 6.04 | 6.04 | 8.46 | 5.07 | 10.60 |
| Annual average | 1.98 | 1.16 | 1.31 | 0.99 | 1.18 | 1.18 | 1.64 | 0.99 | 2.04 |
|
| 3 years | 1.32 | –2.66 | –0.55 | –3.15 | –1.10 | –1.10 | 0.39 | –2.78 | 1.61 |
| Annual average | 0.44 | –0.89 | –0.18 | –1.06 | –0.37 | –0.37 | 0.13 | –0.94 | 0.53 |
|
| 1 year | –4.69 | –8.55 | –5.45 | –9.98 | –5.40 | –6.31 | –5.11 | –8.20 | –4.41 |
|
Current performance may be lower or higher than the quoted past performance, which cannot guarantee future results. After sales charge returns (public offering price, or POP) for class A and M shares reflect a maximum 4.00% and 3.25% load, respectively, as of 1/2/08. Class B share returns reflect the applicable contingent deferred sales charge (CDSC), which is 5% in the first year, declining to 1% in the sixth year, and is eliminated thereafter. Class C shares reflect a 1% CDSC for the first year that is eliminated thereafter. Class Y shares have no initial sales charge or CDSC. Performance for class B, C, M, and Y shares before their inception is derived from the historical performance of class A shares, adjusted for the applicable sales charge (or CDSC) and, except for class Y shares, the higher operating expenses for such shares.
For a portion of the periods, this fund may have limited expenses, without which returns would have been lower.
A 1% short-term trading fee may be applied to shares exchanged or sold within 7 days of purchase.
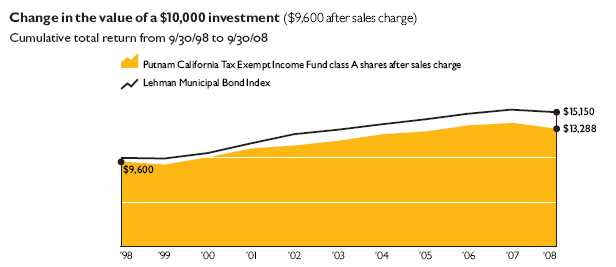
Past performance does not indicate future results. At the end of the same time period, a $10,000 investment in the fund’s class B and class C shares would have been valued at $12,979 and $12,789, respectively, and no contingent deferred sales charges would apply. A $10,000 investment in the fund’s class M shares ($9,675 after sales charge) would have been valued at $12,978 at public offering price. A $10,000 investment in the fund’s class Y share would have been valued at $13,880.
8
Comparative index returns For periods ended 9/30/08
| | |
| | | Lipper California Municipal Debt |
| | Lehman Municipal Bond Index | Funds category average* |
|
| Annual average (life of fund) | 7.16% | 6.61% |
|
| 10 years | 51.50 | 35.51 |
| Annual average | 4.24 | 3.07 |
|
| 5 years | 15.01 | 9.98 |
| Annual average | 2.84 | 1.91 |
|
| 3 years | 5.67 | 0.17 |
| Annual average | 1.86 | 0.03 |
|
| 1 year | –1.87 | –5.71 |
|
Index and Lipper results should be compared to fund performance at net asset value.
* Over the 1-year, 3-year, 5-year, 10-year, and life-of-fund periods ended 9/30/08, there were 120, 106, 100, 71, and 3 funds, respectively, in this Lipper category.
Fund price and distribution information For the 12-month period ended 9/30/08
| | | | | | | | |
| Distributions | | Class A | | Class B | Class C | Class M | | Class Y |
|
| Number | | 12 | | 12 | 12 | 12 | | 9 |
|
| Income 1 | | $0.341921 | | $0.291046 | $0.280511 | $0.318295 | | $0.268897 |
|
| Capital gains — Long-term 2 | | 0.036700 | | 0.036700 | 0.036700 | 0.036700 | | — |
|
| Capital gains — Short-term 2 | | — | | — | — | — | | — |
|
| Total | | $0.378621 | | $0.327746 | $0.317211 | $0.354995 | | $0.268897 |
|
| Share value | | NAV | POP | NAV | NAV | NAV | POP | NAV |
|
| 9/30/07 | | $8.04 | $8.38* | $8.04 | $8.07 | $8.03 | $8.30 | — |
|
| 1/2/2008† | | — | — | — | — | — | — | $7.96 |
|
| 9/30/08 | | 7.30 | 7.60 | 7.29 | 7.33 | 7.28 | 7.52 | 7.31 |
|
| Current yield (end of period) | | NAV | POP | NAV | NAV | NAV | POP | NAV |
|
| Current dividend rate 3 | | 4.76% | 4.58% | 4.09% | 3.93% | 4.46% | 4.32% | 4.99% |
|
| Taxable equivalent 4 | | 8.16 | 7.86 | 7.02 | 6.74 | 7.65 | 7.41 | 8.56 |
|
| Current 30-day SEC yield 5 | | N/A | 4.29 | 3.80 | 3.64 | N/A | 4.03 | 4.67 |
|
| Taxable equivalent 4 | | N/A | 7.36 | 6.52 | 6.24 | N/A | 6.91 | 8.01 |
|
The classification of distributions, if any, is an estimate. Final distribution information will appear on your year-end tax forms.
* Reflects an increase in sales charges that took effect on 1/2/08.
† Inception date of class Y shares.
1 For some investors, investment income may be subject to the federal alternative minimum tax.
2 Capital gains, if any, are taxable for federal and, in most cases, state purposes.
3 Most recent distribution, excluding capital gains, annualized and divided by NAV or POP at end of period.
4 Assumes maximum 41.70% federal and state combined tax rate for 2008. Results for investors subject to lower tax rates would not be as advantageous.
5 Based only on investment income and calculated using the maximum offering price for each share class, in accordance with SEC guidelines.
Fund’s annual operating expenses For the fiscal year ended 9/30/07
| | | | | | |
| | | Class A | Class B | Class C | Class M | Class Y |
|
| Total annual fund operating expenses | | 0.76% | 1.40% | 1.55% | 1.05% | 0.55% |
|
Expense information in this table is taken from the most recent prospectus, is subject to change, and may differ from that shown in the next section and in the financial highlights of this report. Expenses are shown as a percentage of average net assets.
9
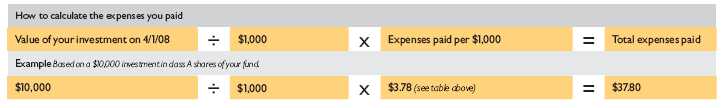
Your fund’s expenses
As a mutual fund investor, you pay ongoing expenses, such as management fees, distribution fees (12b-1 fees), and other expenses. Using the following information, you can estimate how these expenses affect your investment and compare them with the expenses of other funds. You may also pay one-time transaction expenses, including sales charges (loads) and redemption fees, which are not shown in this section and would have resulted in higher total expenses. For more information, see your fund’s prospectus or talk to your financial representative.
Review your fund’s expenses
The following table shows the expenses you would have paid on a $1,000 investment in Putnam California Tax Exempt Income Fund from April 1, 2008, to September 30, 2008. It also shows how much a $1,000 investment would be worth at the close of the period, assuming actual returns and expenses.
| | | | | |
| | Class A | Class B | Class C | Class M | Class Y |
|
| Expenses paid per $1,000* | $3.78 | $6.90 | $7.64 | $5.20 | $2.75 |
|
| Ending value (after expenses) | $963.10 | $958.70 | $959.60 | $960.40 | $964.20 |
|
* Expenses for each share class are calculated using the fund’s annualized expense ratio for each class, which represents the ongoing expenses as a percentage of average net assets for the six months ended 9/30/08. The expense ratio may differ for each share class (see the last table in this section). Expenses are calculated by multiplying the expense ratio by the average account value for the period; then multiplying the result by the number of days in the period; and then dividing that result by the number of days in the year.
Estimate the expenses you paid
To estimate the ongoing expenses you paid for the six months ended September 30, 2008, use the following calculation method. To find the value of your investment on April 1, 2008, call Putnam at 1-800-225-1581.
Compare expenses using the SEC’s method
The Securities and Exchange Commission (SEC) has established guidelines to help investors assess fund expenses. Per these guidelines, the following table shows your fund’s expenses based on a $1,000 investment, assuming a hypothetical 5% annualized return. You can use this information to compare the ongoing expenses (but not transaction expenses or total costs) of investing in the fund with those of other funds. All mutual fund shareholder reports will provide this information to help you make this comparison. Please note that you cannot use this information to estimate your actual ending account balance and expenses paid during the period.
| | | | | |
| | Class A | Class B | Class C | Class M | Class Y |
|
| Expenses paid per $1,000* | $3.89 | $7.11 | $7.87 | $5.35 | $2.83 |
|
| Ending value (after expenses) | $1,021.15 | $1,017.95 | $1,017.20 | $1,019.70 | $1,022.20 |
|
* Expenses for each share class are calculated using the fund’s annualized expense ratio for each class, which represents the ongoing expenses as a percentage of average net assets for the six months ended 9/30/08. The expense ratio may differ for each share class (see the last table in this section). Expenses are calculated by multiplying the expense ratio by the average account value for the period; then multiplying the result by the number of days in the period; and then dividing that result by the number of days in the year.
10
Compare expenses using industry averages
You can also compare your fund’s expenses with the average of its peer group, as defined by Lipper, an independent fund-rating agency that ranks funds relative to others that Lipper considers to have similar investment styles or objectives. The expense ratio for each share class shown indicates how much of your fund’s average net assets have been used to pay ongoing expenses during the period.
| | | | | |
| | Class A | Class B | Class C | Class M | Class Y |
|
| Your fund’s annualized expense ratio* | 0.77% | 1.41% | 1.56% | 1.06% | 0.56% |
|
| Average annualized expense ratio for Lipper peer group† | 0.81% | 1.45% | 1.60% | 1.10% | 0.60% |
|
* For the fund’s most recent fiscal half year; may differ from expense ratios based on one-year data in the financial highlights.
† Putnam keeps fund expenses below the Lipper peer group average expense ratio by limiting our fund expenses if they exceed the Lipper average. The Lipper average is a simple average of front-end load funds in the peer group that excludes 12b-1 fees as well as any expense offset and brokerage/service arrangements that may reduce fund expenses. To facilitate the comparison in this presentation, Putnam has adjusted the Lipper average to reflect 12b-1 fees. Investors should note that the other funds in the peer group may be significantly smaller or larger than the fund, and that an asset-weighted average would likely be lower than the simple average. Also, the fund and Lipper report expense data at different times; the fund’s expense ratio shown here is annualized data for the most recent six-month period, while the quarterly updated Lipper average is based on the most recent fiscal year-end data available for the peer group funds as of 9/30/08.
11
Your fund’s portfolio turnover and Morningstar® Risk
Putnam funds are actively managed by teams of experts who buy and sell securities based on intensive analysis of companies, industries, economies, and markets. Portfolio turnover is a measure of how often a fund’s managers buy and sell securities for your fund. A portfolio turnover of 100%, for example, means that the managers sold and replaced securities valued at 100% of a fund’s average portfolio value within a given period. Funds with high turnover may be more likely to generate capital gains that must be distributed to shareholders as taxable income. High turnover may also cause a fund to pay more brokerage commissions and other transaction costs, which may detract from performance.
Funds that invest in bonds or other fixed-income instruments may have higher turnover than funds that invest only in stocks. Short-term bond funds tend to have higher turnover than longer-term bond funds, because shorter-term bonds will mature or be sold more frequently than longer-term bonds. You can use the following table to compare your fund’s turnover with the average turnover for funds in its Lipper category.
Turnover comparisons
Percentage of holdings that change every year
| | | | | | |
| | | 2008 | 2007 | 2006 | 2005 | 2004 |
|
| Putnam California Tax Exempt Income Fund | | 48% | 36% | 12% | 21% | 13% |
|
| Lipper California Municipal Debt Funds category average | | 31% | 23% | 22% | 17% | 24% |
|
Turnover data for the fund is calculated based on the fund’s fiscal-year period, which ends on September 30. Turnover data for the fund’s Lipper category is calculated based on the average of the turnover of each fund in the category for its fiscal year ended during the indicated year. Fiscal years vary across funds in the Lipper category, which may limit the comparability of the fund’s portfolio turnover rate to the Lipper average. Comparative data for 2008 is based on information available as of 9/30/08.
Your fund’s Morningstar® Risk
This risk comparison is designed to help you understand how your fund compares with other funds. The comparison utilizes a risk measure developed by Morningstar, an independent fund-rating agency. This risk measure is referred to as the fund’s Morningstar Risk.

Your fund’s Morningstar Risk is shown alongside that of the average fund in its Morningstar category. The risk bar broadens the comparison by translating the fund’s Morningstar Risk into a percentile, which is based on the fund’s ranking among all funds rated by Morningstar as of September 30, 2008. A higher Morningstar Risk generally indicates that a fund’s monthly returns have varied more widely.
Morningstar determines a fund’s Morningstar Risk by assessing variations in the fund’s monthly returns — with an emphasis on downside variations — over a 3-year period, if available. Those measures are weighted and averaged to produce the fund’s Morningstar Risk. The information shown is provided for the fund’s class A shares only; information for other classes may vary. Morningstar Risk is based on historical data and does not indicate future results. Morningstar does not purport to measure the risk associated with a current investment in a fund, either on an absolute basis or on a relative basis. Low Morningstar Risk does not mean that you cannot lose money on an investment in a fund. Copyright 2008 Morningstar, Inc. All Rights Reserved. The information contained herein (1) is proprietary to Morningstar and/or its content providers; (2) may not be copied or distributed; and (3) is not warranted to be accurate, complete, or timely. Neither Morningstar nor its content providers are responsible for any damages or losses arising from any use of this information.
12
Your fund’s management
Your fund is managed by the members of the Putnam Tax Exempt Fixed-Income Team. Thalia Meehan is the Portfolio Leader, and Paul Drury, Brad Libby, and Susan McCormack are Portfolio Members, of your fund. The Portfolio Leader and Portfolio Members coordinate the team’s management of the fund.
For a complete listing of the members of the Putnam Tax Exempt Fixed-Income Team, including those who are not Portfolio Leaders or Portfolio Members of your fund, please visit the Individual Investors section of www.putnam.com.
Trustee and Putnam employee fund ownership
As of September 30, 2008, 12 of the 13 Trustees of the Putnam funds owned fund shares. The table below shows the approximate value of investments in the fund and all Putnam funds as of that date by the Trustees and Putnam employees. These amounts include investments by the Trustees’ and employees’ immediate family members and investments through retirement and deferred compensation plans.
| | | |
| | Assets in | Total assets in | |
| | the fund | all Putnam funds | |
| |
| Trustees | $34,000 | $37,000,000 | |
| |
| Putnam employees | $14,000 | $471,000,000 | |
| |
Other Putnam funds managed by the Portfolio Leader and Portfolio Members
Thalia Meehan is the Portfolio Leader, and Paul Drury, Brad Libby, and Susan McCormack are Portfolio Members, of Putnam’s open-end tax-exempt funds for the following states: Arizona, California, Massachusetts, Michigan, Minnesota, New Jersey, New York, Ohio, and Pennsylvania. The same group also manages Putnam Tax Exempt Income Fund, Putnam AMT-Free Insured Municipal Fund, and Putnam Municipal Opportunities Trust.
Paul Drury is the Portfolio Leader, and Brad Libby, Susan McCormack, and Thalia Meehan are Portfolio Members, of Putnam Tax-Free High Yield Fund and Putnam Managed Municipal Income Trust.
Thalia Meehan, Paul Drury, Brad Libby, and Susan McCormack may also manage other accounts and variable trust funds advised by Putnam Management or an affiliate.
Investment team fund ownership
The following table shows how much the fund’s current Portfolio Leader and Portfolio Members have invested in the fund and in all Putnam mutual funds (in dollar ranges). Information shown is as of September 30, 2008, and September 30, 2007.

13
Terms and definitions
Important terms
Total return shows how the value of the fund’s shares changed over time, assuming you held the shares through the entire period and reinvested all distributions in the fund.
Net asset value (NAV) is the price, or value, of one share of a mutual fund, without a sales charge. NAVs fluctuate with market conditions. NAV is calculated by dividing the net assets of each class of shares by the number of outstanding shares in the class.
Public offering price (POP) is the price of a mutual fund share plus the maximum sales charge levied at the time of purchase. POP performance figures shown here assume the 4.00% maximum sales charge for class A shares and 3.25% for class M shares.
Contingent deferred sales charge (CDSC) is generally a charge applied at the time of the redemption of class B or C shares and assumes redemption at the end of the period. Your fund’s class B CDSC declines from a 5% maximum during the first year to 1% during the sixth year. After the sixth year, the CDSC no longer applies. The CDSC for class C shares is 1% for one year after purchase.
Current yield is the annual rate of return earned from dividends or interest of an investment. Current yield is expressed as a percentage of the price of a security, fund share, or principal investment.
Share classes
Class A shares are generally subject to an initial sales charge and no CDSC (except on certain redemptions of shares bought without an initial sales charge).
Class B shares are not subject to an initial sales charge. They may be subject to a CDSC.
Class C shares are not subject to an initial sales charge and are subject to a CDSC only if the shares are redeemed during the first year.
Class M shares have a lower initial sales charge and a higher 12b-1 fee than class A shares and no CDSC.
Class Y shares are not subject to an initial sales charge or CDSC, and carry no 12b-1 fee. They are generally only available to corporate and institutional clients and clients in other approved programs.
Comparative indexes
Lehman Aggregate Bond Index is an unmanaged index of U.S. investment-grade fixed-income securities.
Lehman Municipal Bond Index is an unmanaged index of long-term fixed-rate investment-grade tax-exempt bonds.
Merrill Lynch 91-Day Treasury Bill Index is an unmanaged index that seeks to measure the performance of U.S. Treasury bills available in the marketplace.
S&P 500 Index is an unmanaged index of common stock performance.
Indexes assume reinvestment of all distributions and do not account for fees. Securities and performance of a fund and an index will differ. You cannot invest directly in an index.
Lipper is a third-party industry-ranking entity that ranks mutual funds. Its rankings do not reflect sales charges. Lipper rankings are based on total return at net asset value relative to other funds that have similar current investment styles or objectives as determined by Lipper. Lipper may change a fund’s category assignment at its discretion. Lipper category averages reflectperformance trends for funds within a category.
14
Trustee approval of management contract
General conclusions
The Board of Trustees of the Putnam funds oversees the management of each fund and, as required by law, determines annually whether to approve the continuance of your fund’s management contract with Putnam Investment Management (“Putnam Management”). In this regard, the Board of Trustees, with the assistance of its Contract Committee consisting solely of Trustees who are not “interested persons” (as such term is defined in the Investment Company Act of 1940, as amended) of the Putnam funds (the “Independent Trustees”), requests and evaluates all information it deems reasonably necessary under the circumstances. Over the course of several months ending in June 2008, the Contract Committee met several times to consider the information provided by Putnam Management and other information developed with the assistance of the Board’s independent counsel and independent staff. The Contract Committee reviewed and discussed key aspects of t his information with all of the Independent Trustees. The Contract Committee recommended, and the Independent Trustees approved, the continuance of your fund’s management contract, effective July 1, 2008.
The Independent Trustees’ approval was based on the following conclusions:
• That the fee schedule in effect for your fund represented reasonable compensation in light of the nature and quality of the services being provided to the fund, the fees paid by competitive funds and the costs incurred by Putnam Management in providing such services, and
• That this fee schedule represented an appropriate sharing between fund shareholders and Putnam Management of such economies of scale as may exist in the management of the fund at current asset levels.
These conclusions were based on a comprehensive consideration of all information provided to the Trustees, were subject to the continued application of certain expense reductions and waivers and other considerations noted below, and were not the result of any single factor. Some of the factors that figured particularly in the Trustees’ deliberations and how the Trustees considered these factors are described below, although individual Trustees may have evaluated the information presented differently, giving different weights to various factors. It is also important to recognize that the fee arrangements for your fund and the other Putnam funds are the result of many years of review and discussion between the Independent Trustees and Putnam Management, that certain aspects of such arrangements may receive greater scrutiny in some years than others, and that the Trustees’ conclusions may be based, in part, on their consideration of these same arrangements in prior years.
Management fee schedules and categories; total expenses
The Trustees reviewed the management fee schedules in effect for all Putnam funds, including fee levels and breakpoints, and the assignment of funds to particular fee categories. In reviewing fees and expenses, the Trustees generally focused their attention on material changes in circumstances — for example, changes in a fund’s size or investment style, changes in Putnam Management’s operating costs or responsibilities, or changes in competitive practices in the mutual fund industry — that suggest that consideration of fee changes might be warranted. The Trustees concluded that the circumstances did not warrant changes to the management fee structure of your fund, which had been carefully developed over the years, re-examined on many occasions and adjusted where appropriate. In this regard, the Trustees also noted that shareholders of your fund voted in 2007 to approve new management contracts containing an identical fee structure. The Trustees focuse d on two areas of particular interest, as discussed further below:
• Competitiveness. The Trustees reviewed comparative fee and expense information for competitive funds, which indicated that, in a custom peer group of competitive funds selected by Lipper Inc., your fund ranked in the 58th percentile in management fees and in the 29th percentile in total expenses (less any applicable 12b-1 fees) as of December 31, 2007 (the first percentile being the least expensive funds and the 100th percentile being the most expensive funds). (Because the fund’s custom peer group is smaller than the fund’s broad Lipper Inc. peer group, this expense information may differ from the Lipper peer expense information found elsewhere in this report.) The Trustees noted that expense ratios for a number of Putnam funds, which show the percentage of fund assets used to pay for management and administrative services, distribution (12b-1) fees and other expenses, had been increasing recently as a result of declining net assets and the natural operation of fee breakpoints.
The Trustees noted that the expense ratio increases described above were currently being controlled by expense limitations initially implemented in January 2004. The Trustees have received a commitment from Putnam Management and its parent company to continue this program through at least June 30, 2009. These expense limitations give effect to a commitment by Putnam Management that the expense ratio of each open-end fund would be no higher than the average expense ratio of the competitive funds included in the fund’s relevant Lipper universe (exclusive of any applicable 12b-1 charges in each case). The Trustees observed that this commitment to limit fund expenses has served shareholders well since its inception.
In order to ensure that the expenses of the Putnam funds continue to meet evolving competitive standards, the Trustees requested, and Putnam Management agreed, to extend for the twelve months beginning July 1, 2008, an additional expense limitation for certain funds at an amount equal to the average expense ratio (exclusive of 12b-1 charges) of a custom
15
peer group of competitive funds selected by Lipper to correspond to the size of the fund. This additional expense limitation will be applied to those open-end funds that had above-average expense ratios (exclusive of 12b-1 charges) based on the custom peer group data for the period ended December 31, 2007. This additional expense limitation will not be applied to your fund because it had a below-average expense ratio relative to its custom peer group.
In addition, the Trustees devoted particular attention to analyzing the Putnam funds’ fees and expenses relative to those of competitors in fund complexes of comparable size and with a comparable mix of asset categories. The Trustees concluded that this analysis did not reveal any mattersrequiring further attention at the current time.
• Economies of scale. Your fund currently has the benefit of breakpoints in its management fee that provide shareholders with significant economies of scale, which means that the effective management fee rate of the fund (as a percentage of fund assets) declines as the fund grows in size and crosses specified asset thresholds.
Conversely, if the fund shrinks in size — as has been the case for many Putnam funds in recent years — these breakpoints result in increasing fee levels. In recent years, the Trustees have examined the operation of the existing breakpoint structure during periods of both growth and decline in asset levels. The Trustees concluded that the fee schedule in effect for your fund represented an appropriate sharing of economies of scale at current asset levels.
In connection with their review of the management fees and total expenses of the Putnam funds, the Trustees also reviewed the costs of the services to be provided and profits to be realized by Putnam Management and its affiliates from the relationship with the funds. This information included trends in revenues, expenses and profitability of Putnam Management and its affiliates relating to the investment management and distribution services provided to the funds. In this regard, the Trustees also reviewed an analysis of Putnam Management’s revenues, expenses and profitability with respect to the funds’ management contracts, allocated on a fund-by-fund basis.
Investment performance
The quality of the investment process provided by Putnam Management represented a major factor in the Trustees’ evaluation of the quality of services provided by Putnam Management under your fund’s management contract. The Trustees were assisted in their review of the Putnam funds’ investment process and performance by the work of the Investment Oversight Coordinating Committee of the Trustees and the Investment Oversight Committees of the Trustees, which had met on a regular monthly basis with the funds’ portfolio teams throughout the year. The Trustees concluded that Putnam Management generally provides a high-quality investment process — as measured by the experience and skills of the individuals assigned to the management of fund portfolios, the resources made available to such personnel, and in general the ability of Putnam Management to attract and retain high-quality personnel — but also recognized that this does not guarantee favorab le investment results for every fund in every time period. The Trustees considered the investment performance of each fund over multiple time periods and considered information comparing each fund’s performance with various benchmarks and with the performance of competitive funds.
While the Trustees noted the satisfactory investment performance of certain Putnam funds, they considered the disappointing investment performance of many funds in recent periods, particularly over periods in 2007 and 2008. They discussed with senior management of Putnam Management the factors contributing to such underperformance and actions being taken to improve performance. The Trustees recognized that, in recent years, Putnam Management has taken steps to strengthen its investment personnel and processes to address areas of underperformance, including recent efforts to further centralize Putnam Management’s equity research function. In this regard, the Trustees took into consideration efforts by Putnam Management to improve its ability to assess and mitigate investment risk in individual funds, across asset classes, and across the complex as a whole. The Trustees indicated their intention to continue to monitor performance trends to assess the effectiveness of these efforts and to evaluate whether additional changes to address areas of underperformance are warranted.
In the case of your fund, the Trustees considered that your fund’s class A share cumulative total return performance at net asset value was in the following percentiles of its Lipper Inc. peer group (Lipper California Municipal Debt Funds) (compared using tax-adjusted performance to recognize the different federal income tax treatment for capital gains distributions and exempt-interest distributions) for the one-year, three-year and five-year periods ended December 31, 2007 (the first percentile being the best-performing funds and the 100th percentile being the worst-performing funds):
| | |
| One-year period | 33rd | |
| |
| Three-year period | 45th | |
| |
| Five-year period | 43rd | |
| |
(Because of the passage of time, these performance results may differ from the performance results for more recent periods shown elsewhere in this report.) Over the one-year, three-year and five-year periods ended December 31, 2007, there were 117, 107 and 99 funds, respectively, in your fund’s Lipper peer group.* Past performance is no guarantee of future returns.
* The percentile rankings for your fund’s class A share annualized total return performance in the Lipper California Municipal Debt Funds category for the one-year, five-year, and ten-year periods ended September 30, 2008, were 50%, 55%, and 38%, respectively. Over the one-year, five-year, and ten-year periods ended September 30, 2008, your fund ranked 60th out of 120, 55th out of 100, and 27th out of 71 funds, respectively. Unlike the information above, these rankings reflect performance before taxes. Note that this more recent information was not available when the Trustees approved the continuance of your fund’s management contract.
16
As a general matter, the Trustees believe that cooperative efforts between the Trustees and Putnam Management represent the most effective way to address investment performance problems. The Trustees noted that investors in the Putnam funds have, in effect, placed their trust in the Putnam organization, under the oversight of the funds’ Trustees, to make appropriate decisions regarding the management of the funds. Based on the responsiveness of Putnam Management in the recent past to Trustee concerns about investment performance, the Trustees concluded that it is preferable to seek change within Putnam Management to address performance shortcomings. In the Trustees’ view, the alternative of engaging a new investment adviser for an underperforming fund would entail significant disruptions and would not provide any greater assurance of improved investment performance.
Brokerage and soft-dollar
allocations; other benefits
The Trustees considered various potential benefits that Putnam Management may receive in connection with the services it provides under the management contract with your fund. These include benefits related to brokerage and soft-dollar allocations, whereby a portion of the commissions paid by a fund for brokerage may be used to acquire research services that may be useful to Putnam Management in managing the assets of the fund and of other clients.
The Trustees considered changes made in 2008, at Putnam Management’s request, to the Putnam funds’ brokerage allocation policy, which expanded the permitted categories of brokerage and research services payable with soft dollars and increased the permitted soft dollar allocation to third-party services over what had been authorized in previous years. The Trustees indicated their continued intent to monitor the potential benefits associated with the allocation of fund brokerage and trends in industry practice to ensure that the principle of seeking “best price and execution” remains paramount in the portfolio trading process.
The Trustees’ annual review of your fund’s management contract arrangements also included the review of its distributor’s contract and distribution plan with Putnam Retail Management Limited Partnership and the investor servicing agreement with Putnam Fiduciary Trust Company (“PFTC”), each of which provides benefits to affiliates of Putnam Management. In the case of the investor servicing agreement, the Trustees considered that certain shareholder servicing functions were shifted to a third-party service provider by PFTC in 2007.
Comparison of retail and
institutional fee schedules
The information examined by the Trustees as part of their annual contract review has included for many years information regarding fees charged by Putnam Management and its affiliates to institutional clients such as defined benefit pension plans, college endowments, etc. This information included comparisons of such fees with fees charged to the funds, as well as a detailed assessment of the differences in the services provided to these two types of clients. The Trustees observed, in this regard, that the differences in fee rates between institutional clients and mutual funds are by no means uniform when examined by individual asset sectors, suggesting that differences in the pricing of investment management services to these types of clients reflect to a substantial degree historical competitive forces operating in separate market places. The Trustees considered the fact that fee rates across different asset classes are typically higher o n average for mutual funds than for institutional clients, as well as the differences between the services that Put-nam Management provides to the Putnam funds and those that it provides to institutional clients of the firm, but did not rely on such comparisons to any significant extent in concluding that the management fees paid by your fund are reasonable.
17
Other information for shareholders
Putnam’s policy on confidentiality
In order to conduct business with our shareholders, we must obtain certain personal information such as account holders’ addresses, telephone numbers, Social Security numbers, and the names of their financial representatives. We use this information to assign an account number and to help us maintain accurate records of transactions and account balances. It is our policy to protect the confidentiality of your information, whether or not you currently own shares of our funds, and, in particular, not to sell information about you or your accounts to outside marketing firms. We have safeguards in place designed to prevent unauthorized access to our computer systems and procedures to protect personal information from unauthorized use. Under certain circumstances, we share this information with outside vendors who provide services to us, such as mailing and proxy solicitation. In those cases, the service providers enter into confidentiality agreements with us, and we provide only the information necessary to process transactions and perform other services related to your account. We may also share this information with our Putnam affiliates to service your account or provide you with information about other Putnam products or services. It is also our policy to share account information with your financial representative, if you’ve listed one on your Putnam account. If you would like clarification about our confidentiality policies or have any questions or concerns, please don’t hesitate to contact us at 1-800-225-1581, Monday through Friday, 8:30 a.m. to 8:00 p.m., or Saturdays from 9:00 a.m. to 5:00 p.m. Eastern Time.
Proxy voting
Putnam is committed to managing our mutual funds in the best interests of our shareholders. The Putnam funds’ proxy voting guidelines and procedures, as well as information regarding how your fund voted proxies relating to portfolio securities during the 12-month period ended June 30, 2008, are available in the Individual Investors section of www.putnam.com, and on the SEC’s Web site, www.sec.gov. If you have questions about finding forms on the SEC’s Web site, you may call the SEC at 1-800-SEC-0330. You may also obtain the Putnam funds’ proxy voting guidelines and procedures at no charge by calling Putnam’s Shareholder Services at 1-800-225-1581.
Fund portfolio holdings
The fund will file a complete schedule of its portfolio holdings with the SEC for the first and third quarters of each fiscal year on Form N-Q. Shareholders may obtain the fund’s Forms N-Q on the SEC’s Web site at www.sec.gov. In addition, the fund’s Forms N-Q may be reviewed and copied at the SEC’s Public Reference Room in Washington, D.C. You may call the SEC at 1-800-SEC-0330 for information about the SEC’s Web site or the operation of the Public Reference Room.
18
Financial statements
These sections of the report, as well as the accompanying Notes, preceded by the Report of Independent Registered Public Accounting Firm, constitute the fund’s financial statements.
The fund’s portfolio lists all the fund’s investments and their values as of the last day of the reporting period. Holdings are organized by asset type and industry sector, country, or state to show areas of concentration and diversification.
Statement of assets and liabilities shows how the fund’s net assets and share price are determined. All investment and noninvestment assets are added together. Any unpaid expenses and other liabilities are subtracted from this total. The result is divided by the number of shares to determine the net asset value per share, which is calculated separately for each class of shares. (For funds with preferred shares, the amount subtracted from total assets includes the liquidation preference of preferred shares.)
Statement of operations shows the fund’s net investment gain or loss. This is done by first adding up all the fund’s earnings — from dividends and interest income — and subtracting its operating expenses to determine net investment income (or loss). Then, any net gain or loss the fund realized on the sales of its holdings — as well as any unrealized gains or losses over the period — is added to or subtracted from the net investment result to determine the fund’s net gain or loss for the fiscal year.
Statement of changes in net assets shows how the fund’s net assets were affected by the fund’s net investment gain or loss, by distributions to shareholders, and by changes in the number of the fund’s shares. It lists distributions and their sources (net investment income or realized capital gains) over the current reporting period and the most recent fiscal year-end. The distributions listed here may not match the sources listed in the Statement of operations because the distributions are determined on a tax basis and may be paid in a different period from the one in which they were earned.
Financial highlights provide an overview of the fund’s investment results, per-share distributions, expense ratios, net investment income ratios, and portfolio turnover in one summary table, reflecting the five most recent reporting periods. In a semi-annual report, the highlight table also includes the current reporting period.
19
Report of Independent Registered Public Accounting Firm
The Board of Trustees and Shareholders of
Putnam California Tax Exempt Income Fund:
We have audited the accompanying statement of assets and liabilities of Putnam California Tax Exempt Income Fund, including the fund’s portfolio, as of September 30, 2008, and the related statement of operations for the year then ended, the statements of changes in net assets for each of the two years in the period then ended and the financial highlights for each of the five years or periods in the period then ended. These financial statements and financial highlights are the responsibility of the fund’s management. Our responsibility is to express an opinion on these financial statements and financial highlights based on our audits.
We conducted our audits in accordance with the standards of the Public Company Accounting Oversight Board (United States). Those standards require that we plan and perform our audit to obtain reasonable assurance about whether the financial statements and financial highlights are free of material misstatement. An audit includes examining, on a test basis, evidence supporting the amounts and disclosures in the financial statements. Our procedures included confirmation of securities owned as of September 30, 2008 by correspondence with the custodian and brokers or by other appropriate auditing procedures. An audit also includes assessing the accounting principles used and significant estimates made by management, as well as evaluating the overall financial statement presentation. We believe that our audits provide a reasonable basis for our opinion.
In our opinion, the financial statements and financial highlights referred to above present fairly, in all material respects, the financial position of Putnam California Tax Exempt Income Fund as of September 30, 2008, the results of its operations for the year then ended, the changes in its net assets for each of the two years in the period then ended, and the financial highlights for each of the five years or periods in the period then ended, in conformity with U.S. generally accepted accounting principles.

Boston, Massachusetts
November 13, 2008
20
The fund’s portfolio 9/30/08
| |
| Key to abbreviations | |
| | |
| AGO Assured Guaranty, Ltd. | IF COP Inverse Floating Rate Certificates of Participation |
| AMBAC AMBAC Indemnity Corporation | MBIA MBIA Insurance Company |
| COP Certificate of Participation | Radian Insd. Radian Group Insured |
| FGIC Financial Guaranty Insurance Company | U.S. Govt. Coll. U.S. Government Collateralized |
| FRN Floating Rate Notes | VRDN Variable Rate Demand Notes |
| FSA Financial Security Assurance | XLCA XL Capital Assurance |
| G.O. Bonds General Obligation Bonds | |
| | |
| | | |
| MUNICIPAL BONDS AND NOTES (97.6%)* | Rating** | Principal amount | Value |
|
| California (93.3%) | | | |
| ABAG Fin. Auth. COP (Odd Fellows Home), 6s, 8/15/24 | A+ | $1,000,000�� | $1,006,690 |
|
| Acalanes, Unified High School Dist. G.O. Bonds (Election of 2002), Ser. A, FGIC, zero %, | | | |
| 8/1/21 (Prerefunded) | Aa2 | 5,815,000 | 3,106,780 |
|
| Alameda Cnty., Unified School Dist. G.O. Bonds, Ser. A, FSA, zero %, 8/1/15 | Aaa | 1,000,000 | 742,920 |
|
| Alameda, Corridor Trans. Auth. Rev. Bonds, Ser. A | | | |
| MBIA, 5 1/4s, 10/1/21 | AA | 9,500,000 | 9,628,440 |
| AMBAC, zero %, 10/1/19 | AA | 48,270,000 | 25,207,559 |
|
| Alhambra, Unified School Dist. G.O. Bonds (Election of 2004), Ser. A, FGIC, 5s, 8/1/24 | A2 | 1,825,000 | 1,697,706 |
|
| Anaheim, COP, MBIA, 6.2s, 7/16/23 # | AA | 32,000,000 | 32,693,760 |
|
| Anaheim, Pub. Fin. Auth. Rev. Bonds (Distr. Syst.), MBIA | | | |
| 5 1/4s, 10/1/23 | AA | 8,675,000 | 8,559,882 |
| 5 1/4s, 10/1/22 | AA | 6,700,000 | 6,667,170 |
| 5s, 10/1/29 | AA | 1,945,000 | 1,820,189 |
|
| Anaheim, Pub. Fin. Auth. Lease Rev. Bonds | | | |
| (Cap. Appn. Sub. Impt.), Ser. C, FSA, zero %, 9/1/30 | Aaa | 1,290,000 | 344,314 |
| (Pub. Impt.), Ser. C, FSA, zero %, 9/1/19 | Aaa | 1,770,000 | 1,007,696 |
|
| Arcadia, Unified School Dist. G.O. Bonds (Election of 2006), Ser. A, FSA, zero %, 8/1/18 | Aaa | 1,500,000 | 868,050 |
|
| Aromas-San Juan, Unified School Dist. G.O. Bonds, Ser. A, FGIC, zero %, 8/1/26 | A- | 1,475,000 | 419,682 |
|
| Azusa, Pub. Fin. Auth. Rev. Bonds (Parity Wtr. Syst. Cap. Impt.), FSA, 5s, 7/1/21 | Aaa | 1,215,000 | 1,214,903 |
|
| Bay Area Toll Auth. of CA Rev Bonds, Ser. F, 5s, 4/1/31 T | AA | 13,600,000 | 12,748,368 |
|
| Bay Area Toll Auth. of CA Rev. Bonds | | | |
| (San Francisco Bay Area), Ser. F1, 5s, 4/1/34 | AA | 5,000,000 | 4,637,900 |
| Ser. F, 5s, 4/1/31 | AA | 3,100,000 | 2,905,878 |
| (San Francisco Bay Area), Ser. F, 5s, 4/1/26 | AA | 15,500,000 | 14,784,364 |
| (San Francisco Bay Area), Ser. F, 5s, 4/1/24 | AA | 10,245,000 | 9,901,895 |
|
| Burbank, Pub. Fin. Auth. Rev. Bonds (West Olive Redev.), AMBAC, 5s, 12/1/26 | AA | 3,390,000 | 3,093,070 |
|
| Burbank, Unified School Dist. G.O. Bonds (Election of 1997), Ser. C, FGIC, zero %, 8/1/18 | A+ | 2,345,000 | 1,386,387 |
|
| CA Edl. Fac. Auth. Rev. Bonds | | | |
| (Claremont Graduate U.), Ser. A, 6s, 3/1/38 | A3 | 1,045,000 | 1,048,658 |
| (CA Lutheran U.), 5 3/4s, 10/1/38 | Baa1 | 5,000,000 | 4,519,900 |
| (Stanford U.), Ser. Q, 5 1/4s, 12/1/32 | Aaa | 22,360,000 | 22,722,678 |
| (U. Redlands), Ser. A, 5 1/8s, 8/1/38 | A3 | 6,430,000 | 5,659,107 |
| (Claremont Graduate U.), Ser. A, 5 1/8s, 3/1/28 | A3 | 1,270,000 | 1,147,394 |
| (Claremont Graduate U.), Ser. A, 5s, 3/1/31 | A3 | 2,465,000 | 2,189,733 |
| (CA College of Arts), 5s, 6/1/30 | Baa3 | 1,825,000 | 1,518,291 |
| (Lutheran U.), Ser. C, 5s, 10/1/29 | Baa1 | 1,500,000 | 1,270,005 |
| (Claremont Graduate U.), Ser. A, 5s, 3/1/26 | A3 | 1,200,000 | 1,089,804 |
| (Lutheran U.), Ser. C, 5s, 10/1/24 | Baa1 | 1,250,000 | 1,113,150 |
| (U. of the Pacific), 5s, 11/1/16 | A2 | 1,095,000 | 1,128,507 |
| (U. of the Pacific), 5s, 11/1/14 | A2 | 295,000 | 309,470 |
| (U. of the Pacific), 5s, 11/1/13 | A2 | 525,000 | 551,602 |
| (U. of the Pacific), 5s, 11/1/11 | A2 | 625,000 | 656,025 |
| (Lutheran U.), Ser. C, 4 1/2s, 10/1/19 | Baa1 | 2,830,000 | 2,587,865 |
|
| CA Hlth. Fac. Fin. Auth. Rev. Bonds | | | |
| (Catholic Hlth. Care West), Ser. J, 5 5/8s, 7/1/32 | A2 | 5,000,000 | 4,532,450 |
| (Sutter Hlth.), Ser. A, MBIA, 5 3/8s, 8/15/30 | AA | 1,600,000 | 1,616,928 |
| (Kaiser Permanente), Ser. A, 5 1/4s, 4/1/39 | A+ | 1,000,000 | 878,620 |
| (Kaiser Permanente), Ser. A, 5s, 4/1/37 | A+ | 10,000,000 | 8,472,300 |
| (Cedars-Sinai Med. Ctr.), 5s, 11/15/34 | A2 | 6,750,000 | 5,831,258 |
| (CA-NV Methodist), 5s, 7/1/26 | A+ | 1,745,000 | 1,604,074 |
21
| | | |
| MUNICIPAL BONDS AND NOTES (97.6%)* cont. | Rating** | Principal amount | Value |
|
| California cont. | | | |
| CA Hlth. Fac. Fin. Auth. Rev. Bonds | | | |
| (Lucile Salter Packard Hosp.), Ser. C, AMBAC, 5s, 8/15/24 | Aa2 | $6,390,000 | $6,056,378 |
| (Stanford Hosp. & Clinics), Ser. A, 5s, 11/15/23 | A1 | 7,250,000 | 6,698,493 |
| Ser. B, AMBAC, 5s, 7/1/21 | AA | 3,500,000 | 3,431,890 |
| (Cedars Sinai Med. Ctr.), 5s, 11/15/15 | A2 | 2,900,000 | 2,950,199 |
|
| CA Hsg. Fin. Agcy. Rev. Bonds | | | |
| (Home Mtge.), Ser. H, FGIC, 5 3/4s, 8/1/30 | Aa2 | 15,000 | 15,008 |
| (Multi-Fam. Hsg. III), Ser. B, MBIA, 5 1/2s, 8/1/39 | AA | 1,650,000 | 1,467,923 |
| (Home Mtge.), Ser. L, 5.2s, 8/1/28 | Aa2 | 4,500,000 | 4,188,645 |
| (Home Mtge.), Ser. M, 4 3/4s, 8/1/42 | Aa2 | 8,050,000 | 6,069,700 |
| (Home Mtge.), Ser. K, 4 5/8s, 8/1/26 | Aa2 | 2,500,000 | 2,041,175 |
| (Home Mtge.), Ser. I, 4.6s, 8/1/21 | Aa2 | 5,000,000 | 4,408,100 |
|
| CA Infrastructure & Econ. Dev. Bank Rev. Bonds | | | |
| (Bay Area Toll Bridges), Ser. A, FGIC, 5s, 7/1/29 (Prerefunded) | Aaa | 5,000,000 | 4,905,150 |
| (Oakland Unified School Dist. Fin.), 5s, 8/15/22 | A+ | 4,985,000 | 4,697,615 |
| Ser. B, 4s, 6/1/10 | B/P | 1,000,000 | 526,510 |
| Ser. A, zero %, 12/1/20 | B/P | 2,445,000 | 726,018 |
| Ser. A, zero %, 12/1/19 | B/P | 3,445,000 | 1,093,546 |
| Ser. A, zero %, 12/1/18 | B/P | 4,890,000 | 1,606,561 |
| Ser. A, zero %, 12/1/17 | B/P | 2,445,000 | 830,762 |
| Ser. A, zero %, 12/1/16 | B/P | 2,445,000 | 858,537 |
| Ser. A, zero %, 12/1/15 | B/P | 2,440,000 | 884,915 |
|
| CA Muni. Fin. Auth. COP | | | |
| (Cmnty. Hosp. Central CA), 5 1/4s, 2/1/46 | Baa2 | 11,000,000 | 8,553,710 |
| (Cmnty. Hosp. Central CA), 5 1/4s, 2/1/27 | Baa2 | 8,000,000 | 6,837,920 |
| (Cmnty. Hosp. of Central CA), 5s, 2/1/22 | Baa2 | 2,400,000 | 2,113,320 |
|
| CA Muni. Fin. Auth. Rev. Bonds | | | |
| (Biola U.), 5 7/8s, 10/1/34 | Baa1 | 5,000,000 | 4,617,050 |
| (Biola U.), 5.8s, 10/1/28 | Baa1 | 220,000 | 206,404 |
| (Loma Linda U.), 5s, 4/1/28 | A2 | 2,000,000 | 1,805,060 |
| (U. Students Coop Assn.), 5s, 4/1/22 | BBB– | 790,000 | 726,547 |
|
| CA Poll. Control Fin. Auth. VRDN (Pacific Gas & Electric Corp.) | | | |
| Ser. F, 3.9s, 11/1/26 | A–1+ | 3,600,000 | 3,600,000 |
| Class C, 3.65s, 11/1/26 | A–1+ | 13,800,000 | 13,800,000 |
| Ser. E, 3.9s, 11/1/26 | A–1+ | 7,800,000 | 7,800,000 |
|
| CA Poll. Control Fin. Auth. Solid Waste Disp. Rev. Bonds | | | |
| (Keller Canyon Landfill Co.), 6 7/8s, 11/1/27 | BB– | 1,000,000 | 939,920 |
| (Waste Management, Inc.), Ser. A-2, 5.4s, 4/1/25 | BBB | 7,500,000 | 6,112,500 |
| (Waste Management, Inc.), Ser. B, 5s, 7/1/27 | BBB | 4,500,000 | 3,334,275 |
|
| CA State G.O. Bonds | | | |
| 5 1/2s, 3/1/27 | A1 | 5,000,000 | 4,999,750 |
| 5 1/2s, 3/1/26 | A1 | 6,000,000 | 6,008,400 |
| AMBAC, 5 1/2s, 4/1/11 | AA | 16,545,000 | 17,552,425 |
| 5 1/4s, 3/1/30 | A1 | 2,155,000 | 2,069,274 |
| 5 1/4s, 12/1/24 | A1 | 12,135,000 | 11,913,779 |
| 5 1/4s, 12/1/23 | A1 | 11,000,000 | 10,852,160 |
| 5 1/4s, 2/1/20 | A1 | 5,000,000 | 5,119,800 |
| 5 1/8s, 3/1/25 | A1 | 2,060,000 | 1,998,756 |
| 5 1/8s, 3/1/24 | A1 | 2,435,000 | 2,372,883 |
| 5 1/8s, 4/1/23 | A1 | 2,250,000 | 2,192,760 |
| 5s, 2/1/29 (Prerefunded) | AAA | 400,000 | 425,532 |
| AMBAC, 4 1/4s, 12/1/35 | AA | 6,000,000 | 4,621,620 |
|
| CA State Dept. of Wtr. Resources Rev. Bonds | | | |
| FSA, 5 1/8s, 12/1/29 | Aaa | 4,885,000 | 4,892,425 |
| FSA, 5 1/8s, 12/1/29 (Prerefunded) | Aaa | 115,000 | 123,103 |
| (Central Valley), Ser. AE, 5s, 12/1/29 | Aaa | 3,000,000 | 2,860,440 |
| (Pwr. Supply), Ser. H, 5s, 5/1/21 | Aa3 | 6,000,000 | 5,944,560 |
|
| CA State Pub. Wks. Board Rev. Bonds (Dept. of Gen. Svcs. Butterfield), Ser. ST-A | | | |
| 5 1/4s, 6/1/25 | A2 | 2,500,000 | 2,360,675 |
| 5s, 6/1/23 | A2 | 2,900,000 | 2,718,141 |
|
22
| | | |
| MUNICIPAL BONDS AND NOTES (97.6%)* cont. | Rating** | Principal amount | Value |
|
| California cont. | | | |
| CA State Pub. Wks. Board Lease Rev. Bonds | | | |
| Ser. A, MBIA, 6 1/2s, 9/1/17 | AA | $28,000,000 | $31,742,480 |
| (Dept. of Corrections-State Prisons), Ser. A, AMBAC, 5s, 12/1/19 | AA | 33,500,000 | 33,237,695 |
|
| CA Statewide Cmnty. Dev. Mandatory Put Bonds (Hsg. Equity Res.), Ser. B, 5.2s, 6/15/09 | Baa1 | 5,850,000 | 5,943,542 |
|
| CA Statewide Cmnty. Dev. Auth. COP (The Internext Group), 5 3/8s, 4/1/30 | BBB | 15,300,000 | 12,688,596 |
|
| CA Statewide Cmnty. Dev. Auth. Rev. Bonds (Henry Mayo Newhall Memorial Hosp.) | | | |
| 5s, 10/1/27 | A+ | 3,685,000 | 3,234,251 |
| 5s, 10/1/20 | A+ | 1,055,000 | 1,008,633 |
|
| CA Statewide Cmnty. Dev. Auth. 144A Rev. Bonds (Front Porch Cmntys. & Svcs.), Ser. A, | | | |
| 5 1/8s, 4/1/37 | BBB | 5,000,000 | 3,935,950 |
|
| CA Statewide Cmnty. Dev. Auth. Special Tax Mandatory Put Bonds (Hsg. Equity Res. — C), | | | |
| Ser. C, 5.2s, 6/15/09 | Baa1 | 4,000,000 | 4,063,960 |
|
| CA Statewide Cmnty. Dev. Auth. Special Tax Rev. Bonds | | | |
| (Cmnty. Fac. Dist. No. 1-Zone 1C), 7 1/4s, 9/1/30 | BB/P | 2,270,000 | 2,301,281 |
| (Citrus Garden Apt. Project – D1), 5 1/4s, 7/1/22 | A | 1,630,000 | 1,521,507 |
| (Cmnty. Fac. Dist. No. 1-Zone 1B), zero %, 9/1/20 | BB/P | 1,435,000 | 516,830 |
|
| CA Statewide Cmnty., Dev. Auth. Rev. Bonds | | | |
| (Irvine LLC-UCI East Campus), 6s, 5/15/40 | Baa2 | 10,000,000 | 9,281,400 |
| (Kaiser Permanente), Ser. B, 5s, 3/1/41 | A+ | 7,500,000 | 6,287,250 |
| (Huntington Memorial Hosp.), 5s, 7/1/21 | A+ | 2,205,000 | 2,067,254 |
| (Kaiser Permanente), Ser. A, 4 3/4s, 4/1/33 | A+ | 1,600,000 | 1,316,848 |
|
| CA Statewide Cmntys., Dev. Auth. Rev. Bonds | | | |
| (Thomas Jefferson School of Law), Ser. A, 7 1/4s, 10/1/38 | BB+ | 2,415,000 | 2,197,481 |
| (Enloe Med. Ctr.), 6 1/4s, 8/15/33 | A+ | 7,500,000 | 7,537,650 |
| (Enloe Med. Ctr.), 6 1/4s, 8/15/28 | A+ | 5,000,000 | 5,058,250 |
| (Catholic Hlth. Care West), Ser. A, 5 1/2s, 7/1/30 | A2 | 12,000,000 | 10,865,880 |
| (Kaiser Permanente), Ser. B, 5 1/4s, 3/1/45 | A+ | 14,000,000 | 12,121,480 |
| (Sr. Living-Presbyterian Homes), Ser. A, 4 7/8s, 11/15/36 | BBB+ | 1,000,000 | 769,210 |
|
| CA Statewide Fin. Auth. Tobacco Settlement Rev. Bonds, Class B, 5 5/8s, 5/1/29 | Baa3 | 3,355,000 | 2,855,742 |
|
| CA Tobacco Securitization Agcy. Rev. Bonds (Sonoma Cnty. Corp.), Ser. B, 5 1/2s, 6/1/30 (Prerefunded) | AAA/F | 5,000,000 | 5,417,500 |
|
| CA Tobacco Securitization Agcy. stepped coupon Rev. Bonds zero %,(5.25s, 12/1/10) 6/1/21 †† | Baa3 | 10,000,000 | 7,621,600 |
|
| Cabrillo, Cmnty. College Dist. G.O. Bonds, Ser. C, AMBAC, zero %, 5/1/26 | AA | 10,095,000 | 3,827,015 |
|
| Carlsbad, Unified School Dist. G.O. Bonds, FGIC, zero %, 11/1/21 | Aa3 | 2,250,000 | 1,063,890 |
|
| Center, Unified School Dist. G.O. Bonds (Election of 1991), Ser. D, MBIA, zero %, 8/1/23 | AA | 5,855,000 | 2,267,524 |
|
| Central CA Joint Pwr. Hlth. Fin. Auth. COP (Cmnty. Hosp. of Central CA), 6s, 2/1/30 (Prerefunded) | AAA | 9,000,000 | 9,505,350 |
|
| Chabot-Las Positas, Cmnty. College Dist. G.O. Bonds (Election of 2004), Ser. B, AMBAC, zero %, 8/1/17 | Aa2 | 3,785,000 | 2,360,667 |
|
| Chino Basin, Desalter Auth. Rev. Bonds, Ser. A, AGO, 5s, 6/1/30 | Aaa | 5,865,000 | 5,374,217 |
|
| Chino Basin, Regl. Fin. Auth. Rev. Bonds, AMBAC, 5 3/4s, 8/1/22 | AA | 32,000,000 | 32,043,200 |
|
| Chino Valley, Unified School Dist. G.O. Bonds (Election of 2002), Ser. D, FGIC | | | |
| zero %, 8/1/26 | A1 | 4,415,000 | 1,352,491 |
| zero %, 8/1/25 | A1 | 3,945,000 | 1,281,967 |
|
| Chula Vista, Cmnty. Fac. Dist. Special Tax Rev. Bonds | | | |
| (No. 06-1 Eastlake Woods Area), 6.2s, 9/1/33 | BBB/P | 3,750,000 | 3,440,063 |
| (No. 06-1 Eastlake Woods Area), 6.15s, 9/1/26 | BBB/P | 2,000,000 | 1,868,220 |
| (No. 97-3), 6.05s, 9/1/29 (Prerefunded) | BB+/P | 4,420,000 | 4,657,133 |
| (No. 07-1 Otay Ranch Village Eleven), 5 7/8s, 9/1/34 | BB/P | 2,500,000 | 2,188,150 |
| (No. 07-I Otay Ranch Village Eleven), 5.1s, 9/1/26 | BB/P | 360,000 | 296,176 |
|
| Chula Vista, Indl. Dev. Rev. Bonds (San Diego Gas), Ser. B, 5s, 12/1/27 | A1 | 5,000,000 | 4,180,400 |
|
| Clovis, Unified School Dist. G.O. Bonds (Election of 2004), Ser. A, FGIC, zero %, 8/1/19 | AA | 8,350,000 | 4,581,645 |
|
| Coast, Cmnty. College Dist. G.O. Bonds, MBIA | | | |
| zero %, 8/1/22 | Aa2 | 5,280,000 | 2,297,011 |
| zero %, 8/1/21 | Aa2 | 4,500,000 | 2,123,460 |
| zero %, 8/1/20 | Aa2 | 2,440,000 | 1,253,672 |
|
| Commerce, Joint Pwr. Fin. Auth. Tax Alloc. Bonds (Redev. No. 1), Ser. A, AMBAC, 5s, 8/1/26 | AA | 250,000 | 218,228 |
|
| Commerce, Redev. Agcy. Rev. Bonds (Project 1), zero %, 8/1/21 (Prerefunded) | BBB | 66,780,000 | 32,043,714 |
|
| Compton, Unified School Dist, G.O. Bonds (Election of 2002), Ser. D, AMBAC, zero %, 6/1/13 | AA | 1,440,000 | 1,190,722 |
|
23
| | | |
| MUNICIPAL BONDS AND NOTES (97.6%)* cont. | Rating** | Principal amount | Value |
|
| California cont. | | | |
| Compton, Unified School Dist. G.O. Bonds (Election of 2002), Ser. D, AMBAC | | | |
| zero %, 6/1/18 | AA | $7,295,000 | $4,383,493 |
| zero %, 6/1/17 | AA | 7,145,000 | 4,650,609 |
| zero %, 6/1/16 | AA | 6,885,000 | 4,783,698 |
| zero %, 6/1/14 | AA | 2,970,000 | 2,325,272 |
|
| Contra Costa Cnty., Pub. Fin. Auth. Tax Alloc. Bonds (Contra Costa Centre), Ser. A, MBIA, | | | |
| 4 3/4s, 8/1/26 | AA | 2,095,000 | 1,822,105 |
|
| Contra Costa, Home Mtge. Fin. Auth. Rev. Bonds, Ser. G, MBIA, zero %, 9/1/17 (Prerefunded) | Aaa | 35,000,000 | 18,859,400 |
|
| Corona, COP (Vista Hosp. Syst.), zero %, 7/1/29 (In default) F † | D/P | 10,000,000 | 110,000 |
|
| Corona, Cmnty. Fac. Dist. Special Tax (No. 97-2 Eagle Glen), Ser. 97-2, 5 3/4s, 9/1/16 | BBB/P | 2,395,000 | 2,380,319 |
|
| Delano, COP (Delano Regl. Med. Ctr.), 5.6s, 1/1/26 | BBB– | 19,700,000 | 17,575,355 |
|
| Desert Sands, Unified School Dist. G.O. Bonds, AMBAC, zero %, 6/1/13 | AA | 2,050,000 | 1,706,769 |
|
| Duarte, COP, Ser. A | | | |
| 5 1/4s, 4/1/31 | A3 | 7,000,000 | 6,067,880 |
| 5 1/4s, 4/1/24 | A3 | 7,500,000 | 6,880,125 |
|
| East Bay, Muni. Util. Dist. Wtr. Syst. Rev. Bonds, Ser. A, FGIC, 5s, 6/1/32 | AA+ | 17,500,000 | 16,547,475 |
|
| El Camino, Hosp. Dist. Rev. Bonds, Ser. A, AMBAC, 6 1/4s, 8/15/17 (Prerefunded) | AA | 10,725,000 | 11,951,189 |
|
| Folsom Cordova, Unified School Dist. G.O. Bonds (School Fac. Impt. Dist. No. 1), Ser. A, MBIA, | | | |
| zero %, 10/1/25 | AA | 1,505,000 | 500,819 |
|
| Folsom Cordova, Unified School Dist. Fac. Impt. G.O. Bonds (Dist. No. 1), Ser. A, MBIA, zero %, 10/1/23 | AA | 1,445,000 | 553,175 |
|
| Folsom, Special Tax Rev. Bonds (Cmnty. Facs. Dist. No. 10), 5 7/8s, 9/1/28 (Prerefunded) | AAA/P | 1,150,000 | 1,208,282 |
|
| Foothill/Eastern Corridor Agcy. Rev. Bonds (CA Toll Roads) | | | |
| 5 3/4s, 1/15/40 | Baa3 | 19,000,000 | 17,009,370 |
| MBIA, 5 3/8s, 1/15/14 | AA | 5,000,000 | 5,163,550 |
|
| Foothill/Eastern Corridor Agcy. Toll Roads Rev. Bonds, Ser. A, 5s, 1/1/35 | Baa3 | 2,000,000 | 1,605,680 |
|
| Gateway, Unified School Dist. COP, FSA | | | |
| zero %, 3/1/27 | Aaa | 410,000 | 133,865 |
| zero %, 3/1/26 | Aaa | 390,000 | 135,743 |
| zero %, 3/1/25 | Aaa | 375,000 | 139,039 |
| zero %, 3/1/24 | Aaa | 360,000 | 143,363 |
| zero %, 3/1/23 | Aaa | 345,000 | 146,639 |
|
| Golden State Tobacco Securitization Corp. Rev. Bonds | | | |
| Ser. A-4, 7.8s, 6/1/42 (Prerefunded) | AAA | 6,075,000 | 7,061,337 |
| Ser. 03 A-1, 6 1/4s, 6/1/33 (Prerefunded) | Aaa | 13,060,000 | 14,044,984 |
| Ser. A-1, 5 3/4s, 6/1/47 | BBB | 15,000,000 | 11,050,950 |
| Ser. B, 5 1/2s, 6/1/33 (Prerefunded) | Aaa | 36,000,000 | 38,352,240 |
| Ser. A-1, 5 1/8s, 6/1/47 | BBB | 20,375,000 | 13,461,355 |
| Ser. A-1, 5s, 6/1/33 | BBB | 54,390,000 | 37,883,722 |
| Ser. A, AMBAC, zero %, 6/1/24 | AA | 15,500,000 | 5,914,025 |
|
| Golden State Tobacco Securitization Corp. stepped-coupon Rev. Bonds, Ser. A, zero %, | | | |
| (4.55s, 6/1/10) 6/1/22 †† | Aaa | 4,085,000 | 3,210,973 |
|
| Golden West, School Fin. Auth. Rev. Bonds, Ser. A, MBIA | | | |
| zero %, 8/1/20 | AA | 2,000,000 | 1,037,120 |
| zero %, 2/1/20 | AA | 2,480,000 | 1,322,237 |
|
| Hartnell, Cmnty. College Dist. G.O. Bonds (Election of 2002), Ser. B, FSA, 5s, 6/1/31 | Aaa | 5,000,000 | 4,668,450 |
|
| Huntington Beach, Cmnty. Fac. Dist. Special Tax (No. 2003-1 Huntington Ctr.) | | | |
| 5.85s, 9/1/33 | BB/P | 2,845,000 | 2,552,705 |
| 5.8s, 9/1/23 | BB/P | 1,000,000 | 918,290 |
|
| Inland Empire Tobacco Securitization Auth. Rev. Bonds, Ser. A, 4 5/8s, 6/1/21 | BBB+/F | 4,115,000 | 3,590,420 |
|
| Irvine Ranch, Wtr. Dist. VRDN, 4.5s, 4/1/33 | VMIG1 | 4,750,000 | 4,750,000 |
|
| Irvine, Impt. Board Act of 1915 G.O. Bonds (Assmt. Dist. No. 03-19-Group 2), 5.45s, 9/2/23 | BB+/P | 1,000,000 | 917,610 |
|
| Irvine, Impt. Board Act of 1915 Special Assmt. (Dist. No. 04-20) | | | |
| 5s, 9/2/25 | BB/P | 3,000,000 | 2,580,810 |
| 5s, 9/2/21 | BB/P | 1,000,000 | 911,800 |
| 5s, 9/2/20 | BB/P | 1,000,000 | 924,510 |
| 5s, 9/2/19 | BB/P | 1,000,000 | 939,770 |
| 4 7/8s, 9/2/18 | BB/P | 1,000,000 | 943,190 |
| 4.8s, 9/2/17 | BB/P | 1,000,000 | 950,470 |
| 4.7s, 9/2/16 | BB/P | 1,350,000 | 1,293,084 |
24
| | | |
| MUNICIPAL BONDS AND NOTES (97.6%)* cont. | Rating** | Principal amount | Value |
|
| California cont. | | | |
| Irvine, Impt. Board Act of 1915 Special Assmt. (Dist. No. 04-20) | | | |
| 4 5/8s, 9/2/15 | BB/P | $1,290,000 | $1,241,535 |
| 4 1/2s, 9/2/14 | BB/P | 1,235,000 | 1,192,640 |
| 4.3s, 9/2/12 | BB/P | 1,000,000 | 977,090 |
| 4 1/4s, 9/2/11 | BB/P | 1,085,000 | 1,068,627 |
|
| Irvine, Impt. Board Act of 1915 Special Assmt. Bonds | | | |
| (Assmt. Dist. No. 00-18-GRP 2), 5.6s, 9/2/22 | BBB/P | 5,000,000 | 4,776,500 |
| (No. 00-18 Group 3), 5.55s, 9/2/26 | BBB/P | 1,825,000 | 1,655,494 |
| (No. 03-19 Group 4), 5s, 9/2/29 | BB+/P | 710,000 | 566,424 |
| (Dist. No. 04-20), 4.4s, 9/2/13 | BB/P | 1,180,000 | 1,145,945 |
|
| Jurupa, Unified School Dist. G.O. Bonds, FGIC, zero %, 8/1/23 | A | 1,470,000 | 575,138 |
|
| Kern Cnty., Wtr. Agcy. Impt. Certificates of Participation (Dist. No. 4), Ser. A, AGO, 5s, 5/1/28 | Aaa | 5,030,000 | 4,663,714 |
|
| La Quinta, Redev. Agcy. Tax Alloc. (Area No. 1), AMBAC, 5s, 9/1/21 | AA | 1,950,000 | 1,862,699 |
|
| Lake Elsinore, Pub. Fin. Auth. Tax Alloc. Rev. Bonds, Ser. C, 6.7s, 10/1/33 | BBB/P | 13,365,000 | 13,411,510 |
|
| Lake Elsinore, School Fin. Auth. Rev. Bonds, FSA, 4 3/4s, 10/1/26 | Aaa | 1,595,000 | 1,404,876 |
|
| Las Virgenes, Unified School Dist. G.O. Bonds, FSA, zero %, 11/1/23 | Aaa | 1,395,000 | 590,824 |
|
| Lodi, Unified School Dist. G.O. Bonds (Election of 2002), FSA, 5s, 8/1/27 | Aaa | 3,555,000 | 3,424,567 |
|
| Long Beach, Bond Fin. Auth. Rev. Bonds (Natural Gas), Ser. A | | | |
| 5 1/2s, 11/15/30 | A2 | 8,500,000 | 7,475,750 |
| 5 1/2s, 11/15/28 | A2 | 5,000,000 | 4,444,850 |
|
| Los Angeles Cnty., COP (Disney), AMBAC, zero %, 9/1/11 | AA | 2,000,000 | 1,810,960 |
|
| Los Angeles, Cmnty. Redev. Agcy. Fin. Auth. Rev. Bonds (Bunker Hill), Ser. A, FSA, 5s, 12/1/27 | Aaa | 16,000,000 | 14,815,360 |
|
| Los Angeles, Harbor Dept. Rev. Bonds, U.S. Govt. Coll., 7.6s, 10/1/18 (Prerefunded) | AAA | 19,415,000 | 23,036,092 |
|
| Metro. Wtr. Dist. Rev. Bonds (Southern CA Wtr. Wks.) | | | |
| 5 3/4s, 8/10/18 | AAA | 40,000,000 | 43,954,000 |
| Ser. A, 5s, 7/1/32 | AAA | 10,000,000 | 9,352,900 |
| Ser. A, 5s, 7/1/26 | AAA | 7,790,000 | 7,496,707 |
|
| Modesto, High School Dist. Stanislaus Cnty., G.O. Bonds, Ser. A, FGIC, zero %, 8/1/24 | A1 | 1,200,000 | 454,428 |
|
| Mount Pleasant, Elementary School Dist. G.O. Bonds (Election of 1998), Ser. E, AMBAC, zero %, | | | |
| 9/1/14 (Prerefunded) | AA | 1,080,000 | 868,061 |
|
| Murrieta Valley, Unified School Dist. G.O. Bonds, FSA, zero %, 9/1/31 | Aaa | 6,445,000 | 1,563,041 |
|
| Napa Valley, Cmnty. College Dist. G.O. Bonds (Election of 2002), Ser. C, MBIA | | | |
| zero %, 8/1/22 | AA | 5,000 | 2,128 |
| zero %, 8/1/21 | AA | 8,575,000 | 3,965,938 |
|
| Natomas, Unified School Dist. G.O. Bonds, FGIC | | | |
| zero %, 8/1/29 | A | 4,210,000 | 1,086,601 |
| zero %, 8/1/22 | A | 1,500,000 | 617,055 |
| zero %, 8/1/21 | A | 1,500,000 | 666,840 |
|
| Newark, Unified School Dist. (Election of 1997), Ser. D, FSA, zero %, 8/1/26 | Aaa | 1,300,000 | 449,228 |
|
| North Natomas, Cmnty. Fac. Special Tax Bonds | | | |
| Ser. B, 6 3/8s, 9/1/31 | BBB/P | 6,260,000 | 5,733,847 |
| (Dist. No. 4), Ser. D, 5s, 9/1/33 | BBB/P | 3,845,000 | 3,027,053 |
| Ser. D, 5s, 9/1/26 | BBB/P | 1,745,000 | 1,440,986 |
|
| Oakland, Swr. Rev. Bonds, Ser. A, FSA, 5s, 6/15/26 | Aaa | 3,690,000 | 3,571,809 |
|
| Ontario, COP (Wtr. Syst. Impt.), MBIA, 5s, 7/1/29 | AA | 4,900,000 | 4,645,102 |
|
| Orange Cnty., Cmnty. Fac. Dist. Special Tax Bonds (Ladera Ranch No. 02-1), Ser. A, 5.55s, 8/15/33 | BBB/P | 3,725,000 | 3,312,121 |
|
| Orange Cnty., Cmnty. Fac. Dist. Special Tax Rev. Bonds | | | |
| (Ladera Ranch – No. 01-1), Ser. A, 6s, 8/15/32 (Prerefunded) | AAA | 2,400,000 | 2,577,840 |
| (Ladera Ranch – No. 03-1), Ser. A, 5 5/8s, 8/15/34 | BB | 2,750,000 | 2,462,928 |
| (Ladera Ranch – No. 03-1), Ser. A, 5 1/2s, 8/15/23 | BB | 1,000,000 | 943,680 |
|
| Pajaro Valley, Unified School Dist. G.O. Bonds (Election of 2002), Ser. B, FSA, zero %, 8/1/26 | Aaa | 1,500,000 | 505,740 |
|
| Pasadena, Cap. Impt. IF COP, AMBAC, 5.35s, 2/1/14 | AA | 24,855,000 | 26,083,333 |
|
| Peralta, Cmnty. College Dist. G.O. Bonds, FSA, 5s, 8/1/24 | Aaa | 6,000,000 | 5,922,120 |
|
| Placentia, Redev. Auth. Tax Alloc. Rev. Bonds, Ser. B, 5 3/4s, 8/1/32 | BBB+ | 3,000,000 | 2,861,460 |
|
| Pleasant Valley, School Dist. Ventura Cnty., G.O. Bonds, Ser. C, MBIA, 5.8s, 8/1/30 (Prerefunded) | AA | 1,180,000 | 1,205,488 |
|
| Poway, Unified School Dist. Cmnty. Facs. Special Tax (Cmnty. Fac. Dist. No. 14-Del Sur), 5 1/4s, 9/1/36 | BB–/P | 5,500,000 | 4,365,460 |
|
| Rancho Cordova, Cmnty. Fac. Dist. Special Tax (No. 2003-1 Sunridge Anatolia), 6.1s, 9/1/37 | BBB/P | 1,485,000 | 1,294,163 |
|
25
| | | |
| MUNICIPAL BONDS AND NOTES (97.6%)* cont. | Rating** | Principal amount | Value |
|
| California cont. | | | |
| Rancho Mirage, Joint Powers Fin. Auth. Rev. Bonds | | | |
| (Eisenhower Med. Ctr.), Ser. A, 5s, 7/1/38 | A3 | $3,500,000 | $2,873,045 |
| (Eisenhower Med.), Ser. B, MBIA, 4 7/8s, 7/1/22 | A2 | 4,000,000 | 3,566,040 |
|
| Redding, Elec. Syst. COP, MBIA, 6.368s, 7/1/22 (Prerefunded) | AA | 20,800,000 | 23,691,200 |
|
| Redwood City, Redev. Agcy., TAN (Redev. Area 2-A), AMBAC, zero %, 7/15/22 | AA | 3,230,000 | 1,429,953 |
|
| Rio Linda, Unified School Dist. G.O. Bonds (Election of 2006), FSA, 5s, 8/1/31 | Aaa | 10,000,000 | 9,133,600 |
|
| Ripon, Redev. Agcy. Tax Alloc. (Cmnty. Redev.), MBIA, 4 3/4s, 11/1/36 | A2 | 1,600,000 | 1,322,576 |
|
| Riverside Cnty., Pub. Fin. Auth. COP, 5.8s, 5/15/29 | BBB– | 4,250,000 | 3,777,783 |
|
| Rohnert Pk., Cmnty. Dev. Agcy. Tax Alloc. Bonds (Rohnert Redev.), MBIA, zero %, 8/1/25 | AA | 1,340,000 | 462,153 |
|
| Roseville, Cmnty. Fac. Special Tax Bonds (Cmnty. Fac. Dist. No. 1-Crocker), 6s, 9/1/33 (Prerefunded) | AAA/P | 1,750,000 | 1,858,588 |
|
| Roseville, Natural Gas Fin. Auth. Rev. Bonds | | | |
| 5s, 2/15/21 | A2 | 1,145,000 | 1,029,172 |
| 5s, 2/15/17 | A2 | 2,495,000 | 2,337,640 |
| 5s, 2/15/15 | A2 | 4,435,000 | 4,232,675 |
|
| Sacramento City Fin. Auth. TAN, Ser. A, FGIC, zero %, 12/1/23 | BBB+ | 15,815,000 | 5,657,974 |
|
| Sacramento Cnty., Arpt. Syst. Rev. Bonds, Ser. A, FSA | | | |
| 5s, 7/1/28 | Aaa | 1,500,000 | 1,409,610 |
| 5s, 7/1/26 | Aaa | 5,000,000 | 4,767,000 |
| 5s, 7/1/25 | Aaa | 3,990,000 | 3,836,465 |
| 5s, 7/1/24 | Aaa | 2,715,000 | 2,622,907 |
|
| Sacramento Cnty., Sanitation Dist. Rev. Bonds (Sacremento Regl. Cnty. Sanitation), FGIC, 5s, 12/1/30 | AA | 10,000,000 | 9,390,000 |
|
| Sacramento, Special Tax Rev. Bonds (North Natomas Cmnty. Fac.) | | | |
| Ser. 01-03, 6s, 9/1/28 | BBB/P | 1,500,000 | 1,429,650 |
| 5.7s, 9/1/23 | BBB/P | 4,905,000 | 4,526,040 |
|
| Sacramento, City Fin. Auth. Tax Alloc. Bonds | | | |
| Ser. A, FGIC, zero %, 12/1/22 | BBB+ | 7,500,000 | 2,895,600 |
| (Cap. Appn.), Ser. A, FGIC, zero %, 12/1/19 | BBB+ | 5,000,000 | 2,508,000 |
|
| Sacramento, Muni. Util. Dist. Elec. Rev. Bonds | | | |
| Ser. A, MBIA, 6 1/4s, 8/15/10 (Prerefunded) | AA | 8,350,000 | 8,561,005 |
| Ser. K, AMBAC, 5 1/4s, 7/1/24 | AA | 11,500,000 | 11,150,400 |
|
| Sacramento, Muni. Util. Dist. Fin. Auth. Rev. Bonds (Cosumnes), MBIA, 5s, 7/1/19 | AA | 1,070,000 | 1,011,353 |
|
| Salinas, Unified School Dist. G.O. Bonds (Cap. Appn.), Ser. A, FGIC, zero %, 10/1/24 | A2 | 1,200,000 | 435,084 |
|
| San Diego Cnty., COP (Burnham Institute), 6 1/4s, 9/1/29 (Prerefunded) | Baa3 | 4,000,000 | 4,167,720 |
|
| San Diego Cnty., Wtr. Auth. COP (Stars & Cars), Ser. B, MBIA, 6.3s, 4/21/11 | AA+ | 56,700,000 | 59,924,528 |
|
| San Diego, Assn. of Bay Area Governments Fin. Auth. For Nonprofit Corps. Rev. Bonds | | | |
| (San Diego Hosp.), Ser. A, 6 1/8s, 8/15/20 | A– | 8,750,000 | 8,877,750 |
|
| San Diego, Cmnty. College Dist. G.O. Bonds (Election of 2006), FSA | | | |
| 5s, 8/1/25 | Aaa | 9,610,000 | 9,395,505 |
| zero %, 8/1/16 | Aaa | 5,060,000 | 3,541,696 |
|
| San Diego, Pub. Fac. Fin. Auth. TAN (Southcrest), Ser. B, Radian Insd., 5 1/8s, 10/1/22 | A3 | 1,000,000 | 892,940 |
|
| San Diego, Redev. Agcy. Tax Alloc. (Centre City), Ser. A, XLCA, 5s, 9/1/22 | A3 | 4,665,000 | 4,528,268 |
|
| San Francisco, City & Cnty. Redev. Fin. Auth. Rev. Bonds (Redev. Project), Ser. B, FGIC, 5 1/4s, 8/1/18 | A2 | 7,225,000 | 7,438,354 |
|
| San Francisco, City & Cnty. Arpt. Comm. Rev. Bonds (Intl. Arpt.), Ser. 34D, AGO, 5 1/4s, 5/1/25 | Aaa | 2,250,000 | 2,189,228 |
|
| San Joaquin Hills, Trans. Corridor Agcy. Rev. Bonds (Toll Road), Ser. A | | | |
| 5s, 1/1/33 | Ba2 | 34,125,000 | 27,527,613 |
| MBIA, zero %, 1/15/32 | AA | 25,000,000 | 5,114,000 |
| MBIA, zero %, 1/15/23 | AA | 21,625,000 | 8,378,174 |
|
| San Joaquin Hills, Trans. Corridor Agcy. Toll Rd. Rev. Bonds, Ser. A, MBIA | | | |
| 5 3/8s, 1/15/29 | AA | 5,790,000 | 5,321,531 |
| zero %, 1/15/26 | AA | 48,135,000 | 15,041,225 |
|
| San Jose, Redev. Agcy. Tax Alloc. Bonds (Merged Area Redev.), Ser. B, Radian Insd., 5s, 8/1/32 | A3 | 3,935,000 | 3,340,579 |
|
| San Jose, Unified School Dist. Santa Clara Cnty., G.O. Bonds, FGIC, zero %, 8/1/15 | AA | 1,250,000 | 922,475 |
|
| San Juan, Basin Auth. Rev. Bonds (Ground Wtr. Recvy.), AMBAC, 5s, 12/1/34 | AA | 1,000,000 | 923,740 |
|
| San Marcos, Pub. Fac. Auth. Rev. Bonds | | | |
| 5.8s, 9/1/27 | Baa3 | 2,995,000 | 3,037,140 |
| 5.8s, 9/1/18 | Baa3 | 1,635,000 | 1,660,768 |
| 5 1/2s, 9/1/10 | Baa3 | 760,000 | 773,004 |
|
| Santa Barbara Cnty., Waterfront COP, AMBAC, 5s, 10/1/27 | AA | 4,590,000 | 4,447,710 |
|
26
| | | |
| MUNICIPAL BONDS AND NOTES (97.6%)* cont. | Rating** | Principal amount | Value |
|
| California cont. | | | |
| Santaluz, Cmnty. Facs. Dist. No. 2 Special Tax Rev. Bonds | | | |
| (Impt. Area No. 1), Ser. B, 6 3/8s, 9/1/30 | BBB/P | $12,100,000 | $11,570,503 |
| (Impt. Area No. 3), Ser. B, 6.2s, 9/1/30 | BBB/P | 500,000 | 472,450 |
| (Impt. Area No. 3), Ser. B, 6.1s, 9/1/21 | BBB/P | 500,000 | 477,805 |
|
| Saugus, Unified School Dist. G.O. Bonds, FGIC, zero %, 8/1/24 | A1 | 1,210,000 | 445,958 |
|
| Semitropic, Impt. Dist. Wtr. Storage Rev. Bonds, Ser. A, XLCA, 5 1/8s, 12/1/35 | A | 5,000,000 | 4,444,200 |
|
| Shasta Tehama Trinity, Joint Cmnty. College Dist. G.O. Bonds (Election of 2002), Ser. B, FSA, | | | |
| 5s, 8/1/30 | Aaa | 9,070,000 | 8,307,576 |
|
| Sierra View, Hlth. Care Dist. Rev. Bonds | | | |
| 5 1/4s, 7/1/37 | A/F | 2,000,000 | 1,641,120 |
| 5 1/4s, 7/1/32 | A/F | 1,000,000 | 830,970 |
|
| Sierra, Joint Cmnty. College Dist. School Fac. Impt. G.O. Bonds (Dist. No. 2 Western NV), Ser. B, MBIA | | | |
| zero %, 8/1/15 | AA | 1,495,000 | 1,088,211 |
| zero %, 8/1/14 | AA | 1,295,000 | 1,003,729 |
|
| Sierra, Joint Cmnty. College Dist. School Fac. Impt. Dist. No. 2 G.O. Bonds (Dist. No. 2 Western NV), | | | |
| Ser. B, MBIA, zero %, 8/1/13 | AA | 1,275,000 | 1,046,648 |
|
| Silicon Valley, Tobacco Securitization Auth. Rev. Bonds (Santa Clara), Ser. A, zero %, 6/1/36 | BBB+/F | 9,300,000 | 985,335 |
|
| Solano, Cmnty. College Dist. G.O. Bonds (Election of 2002), Ser. B, FGIC, zero %, 8/1/25 | Aa3 | 9,020,000 | 3,023,865 |
|
| Southern CA Pub. Pwr. Auth. Rev. Bonds | | | |
| (Natural Gas No. 1), Ser. A, 5 1/4s, 11/1/24 | AA– | 2,850,000 | 2,391,150 |
| (Natural Gas), Ser. A, 5 1/4s, 11/1/21 | AA– | 3,000,000 | 2,600,550 |
| (Southern Transmission), Ser. A, FSA, 5 1/4s, 7/1/18 | Aaa | 3,750,000 | 3,923,213 |
|
| Stockton, Redev. Agcy. Rev. Bonds (Stockton Events Ctr.), FGIC, 5s, 9/1/28 | A | 1,500,000 | 1,307,775 |
|
| Sunnyvale, Cmnty. Fac. Dist. Special Tax Rev. Bonds, 7.65s, 8/1/21 | BB–/P | 5,360,000 | 5,398,056 |
|
| Sweetwater, High School COP, FSA, 5s, 9/1/27 | Aaa | 7,840,000 | 7,643,138 |
|
| Thousand Oaks, Cmnty. Fac. Dist. Special Tax Rev. Bonds (Marketplace 94-1) | | | |
| 6 7/8s, 9/1/24 | B/P | 5,000,000 | 5,057,600 |
| zero %, 9/1/14 | B/P | 2,805,000 | 1,784,429 |
|
| Tobacco Securitization Auth. of Southern CA Rev. Bonds | | | |
| Ser. A, 5 5/8s, 6/1/43 (Prerefunded) | Aaa | 5,000,000 | 5,429,950 |
| Class A1-SNR, 5 1/8s, 6/1/46 | BBB | 5,000,000 | 3,533,700 |
| Ser. A1-SNR, 5s, 6/1/37 | BBB | 2,000,000 | 1,419,380 |
| Ser. A1-SNR, 4 3/4s, 6/1/25 | BBB | 15,825,000 | 13,541,926 |
|
| Torrance Memorial Med. Ctr. Rev. Bonds, Ser. A | | | |
| 6s, 6/1/22 | A1 | 1,500,000 | 1,542,435 |
| 5 1/2s, 6/1/31 | A1 | 2,000,000 | 1,869,780 |
|
| Tustin, Unified School Dist. Special Tax (Cmnty. Fac. Dist. No. 97-1), FSA, 5s, 9/1/32 | Aaa | 1,000,000 | 929,210 |
|
| U. of CA Rev. Bonds, Ser. L, 5s, 5/15/24 | Aa1 | 5,655,000 | 5,522,899 |
|
| Union, Elementary School Dist. G.O. Bonds, Ser. B, FGIC, zero %, 9/1/22 | AA | 1,855,000 | 820,578 |
|
| Vernon, Natural Gas Fin. Auth. Mandatory Put Bonds, Ser. A-4, MBIA, 5s, 8/3/09 | AA | 4,730,000 | 4,731,608 |
|
| Washington Twp., Hlth. Care Dist. Rev. Bonds, Ser. A | | | |
| 5s, 7/1/17 | A3 | 1,125,000 | 1,109,261 |
| 5s, 7/1/16 | A3 | 535,000 | 533,941 |
| 5s, 7/1/14 | A3 | 975,000 | 988,036 |
| 5s, 7/1/13 | A3 | 930,000 | 946,424 |
| 5s, 7/1/12 | A3 | 300,000 | 305,820 |
| 4 1/4s, 7/1/11 | A3 | 775,000 | 775,357 |
| 4 1/8s, 7/1/10 | A3 | 815,000 | 820,077 |
| 4s, 7/1/09 | A3 | 350,000 | 352,856 |
|
| West Basin, Muni. Wtr. Dist. COP, Ser. A, MBIA, 5s, 8/1/30 | AA | 5,745,000 | 5,305,851 |
|
| West Contra Costa, Unified School Dist. G.O. Bonds, FGIC | | | |
| zero %, 8/1/19 | A– | 6,985,000 | 3,760,026 |
| zero %, 8/1/18 | A– | 7,535,000 | 4,392,378 |
|
| West Kern, Cmnty. Coll. Dist. G.O. Bonds (Election of 2004), Ser. B, XLCA | | | |
| zero %, 11/1/24 | A+ | 2,395,000 | 835,256 |
| zero %, 11/1/22 | A+ | 2,315,000 | 932,737 |
| zero %, 11/1/20 | A+ | 1,240,000 | 585,925 |
|
| | | | 1,647,251,992 |
27
| | | |
| MUNICIPAL BONDS AND NOTES (97.6%)* cont. | Rating** | Principal amount | Value |
|
| Puerto Rico (4.3%) | | | |
| Children’s Trust Fund Tobacco Settlement Rev. Bonds (Asset Backed Bonds), 5 5/8s, 5/15/43 | BBB | $4,000,000 | $3,478,520 |
|
| Cmnwlth. of PR, Aqueduct & Swr. Auth. Rev. Bonds, Ser. A | | | |
| 6s, 7/1/44 | Baa3 | 14,000,000 | 13,481,160 |
| 6s, 7/1/38 | Baa3 | 7,350,000 | 7,092,677 |
|
| Cmnwlth. of PR, Hwy. & Trans. Auth. Rev. Bonds | | | |
| Ser. AA, 5s, 7/1/28 | A– | 1,200,000 | 1,065,048 |
| Ser. K, 5s, 7/1/13 | BBB+ | 2,250,000 | 2,269,665 |
|
| Cmnwlth. of PR, Indl. Tourist Edl. Med. & Env. Control Fac. Rev. Bonds (Cogen. Fac.-AES), | | | |
| 6 5/8s, 6/1/26 | Baa3 | 14,800,000 | 15,161,416 |
|
| Cmnwlth. of PR, Muni. Fin. Agcy. Rev. Bonds, Ser. A, FSA | | | |
| 5 1/4s, 8/1/20 | Aaa | 2,000,000 | 2,009,480 |
| 5 1/4s, 8/1/18 | Aaa | 2,855,000 | 2,902,222 |
|
| Cmnwlth. of PR, Pub. Bldg. Auth. Rev. Bonds (Govt. Fac.), Ser. N, Cmnwlth. of PR Gtd. | | | |
| 5 1/2s, 7/1/27 | Baa3 | 3,000,000 | 2,753,700 |
| 5 1/2s, 7/1/25 | Baa3 | 12,505,000 | 11,552,619 |
| 5 1/2s, 7/1/20 | Baa3 | 5,320,000 | 5,136,194 |
|
| U. of PR Rev. Bonds | | | |
| Ser. P, 5s, 6/1/26 | Baa2 | 5,000,000 | 4,356,000 |
| Ser. Q, 5s, 6/1/25 | Baa2 | 5,000,000 | 4,377,250 |
|
| | | | 75,635,951 |
|
| |
| TOTAL INVESTMENTS | | | |
|
| Total investments (cost $1,795,090,002) | | | $1,722,887,943 |
* Percentages indicated are based on net assets of $1,765,144,426.
** The Moody’s, Standard & Poor’s or Fitch ratings indicated are believed to be the most recent ratings available at September 30, 2008 for the securities listed. Ratings are generally ascribed to securities at the time of issuance. While the agencies may from time to time revise such ratings, they undertake no obligation to do so, and the ratings do not necessarily represent what the agencies would ascribe to these securities at September 30, 2008. Securities rated by Putnam are indicated by “/P.” Securities rated by Fitch are indicated by “/F.” The rating of an insured security represents what is believed to be the most recent rating of the insurer’s claims-paying ability available at September 30, 2008 and does not reflect any subsequent changes. Ratings are not covered by the Report of Independent Registered Public Accounting Firm. Security ratings are defined in the Statement of Additional Information.
† Non-income-producing security.
†† The interest rate and date shown parenthetically represent the new interest rate to be paid and the date the fund will begin accruing interest at this rate.
T Underlying security in a tender option bond transaction. The security has been segregated as collateral for financing transactions.
# A portion of this these security was pledged and segregated with the custodian to cover margin requirements for futures contracts at September 30, 2008.
F Is valued at fair value following procedures approved by the Trustees.
At September 30, 2008, liquid assets totaling $1,891,529 have been designated as collateral for open swap contracts.
144A after the name of an issuer represents securities exempt from registration under Rule 144A under the Securities Act of 1933, as amended. These securities may be resold in transactions exempt from registration, normally to qualified institutional buyers.
The rates shown on VRDN, Mandatory Put Bonds and FRN are the current interest rates at September 30, 2008.
The dates shown on Mandatory Put Bonds are the next mandatory put dates.
The dates shown on debt obligations other than Mandatory Put Bonds are the original maturity dates.
IFB and IF COP are securities that pay interest rates that vary inversely to changes in the market interest rates. As interest rates rise, inverse floaters produce less current income. The interest rates shown are the current interest rates at September 30, 2008.
The fund had the following sector concentrations greater than 10% at September 30, 2008 (as a percentage of net assets):
| | |
| Utilities | 18.3% | |
| Land | 11.9 | |
| Health care | 11.8 | |
| Transportation | 11.1 | |
| Local government | 10.8 | |
The fund had the following insurance concentrations greater than 10% at September 30, 2008 (as a percentage of net assets):
28
| | | | | |
| FUTURES CONTRACTS OUTSTANDING at 9/30/08 | Number of | | | Expiration | Unrealized |
| | contracts | Value | | date | appreciation |
|
| U.S. Treasury Note 10 yr (Short) | 255 | $29,229,375 | | Dec-08 | $35,474 |
|
| Total | | | | | $35,474 |
| | | | | | |
| TOTAL RETURN SWAP CONTRACTS OUTSTANDING at 9/30/08 | | |
| | | | Termi- | | | |
| Swap | Notional | | nation | Fixed payments received (paid) | Total return received by | Unrealized |
| counterparty | amount | | date | by fund per annum | or paid by fund | depreciation |
| Citibank, N.A. | $6,866,740 | | 12/15/08 | — | 4.16% minus Municipal Market Data | $(686,735) |
| | | | | | Index AAA municipal yields 15 Year | |
| | | | | | rate | |
| |
| | 6,866,740 | | 12/19/08 | — | 4.31% minus Municipal Market Data | (575,637) |
| | | | | | Index AAA municipal yields 15 Year | |
| | | | | | rate | |
| |
| | 13,150,000 | | 12/22/08 | — | 5.05% minus Municipal Market Data | (243,845) |
| | | | | | Index AAA municipal yields 20 Year | |
| | | | | | rate | |
|
| |
| Goldman Sachs International | 6,766,981 | | 12/18/08 | — | 4.70% minus Municipal Market Data | (385,312) |
| | | | | | Index AAA municipal yields 20 Year | |
| | | | | | rate | |
|
| |
| Total | | | | | | $(1,891,529) |
The accompanying notes are an integral part of these financial statements.
29
Statement of assets and liabilities 9/30/08
| |
| ASSETS | |
|
| Investment in securities, at value (Note 1): | |
| Unaffiliated issuers (identified cost $1,795,090,002) | $1,722,887,943 |
|
| Cash | 36,109,992 |
|
| Interest and other receivables | 21,395,699 |
|
| Receivable for shares of the fund sold | 2,410,892 |
|
| Receivable for securities sold | 17,131,399 |
|
| Receivable from Manager (Note 2) | 125,954 |
|
| Receivable for variation margin (Note 1) | 47,814 |
|
| Total assets | 1,800,109,693 |
|
| |
| LIABILITIES | |
|
| Distributions payable to shareholders | 2,966,825 |
|
| Payable for securities purchased | 12,083,314 |
|
| Payable for shares of the fund repurchased | 3,849,528 |
|
| Payable for compensation of Manager (Note 2) | 2,304,018 |
|
| Payable for investor servicing fees (Note 2) | 57,212 |
|
| Payable for Trustee compensation and expenses (Note 2) | 275,497 |
|
| Payable for administrative services (Note 2) | 3,135 |
|
| Payable for distribution fees (Note 2) | 997,496 |
|
| Unrealized depreciation on swap contracts (Note 1) | 1,891,529 |
|
| Payable for closed swap contracts (Note 1) | 225,023 |
|
| Payable for floating rate notes issued (Note 1) | 10,200,000 |
|
| Other accrued expenses | 111,690 |
|
| Total liabilities | 34,965,267 |
| |
| Net assets | $1,765,144,426 |
| |
| |
| REPRESENTED BY | |
|
| Paid-in capital (Unlimited shares authorized) | $1,854,447,535 |
|
| Undistributed net investment income (Note 1) | 4,943,928 |
|
| Accumulated net realized loss on investments (Note 1) | (20,188,923) |
|
| Net unrealized depreciation of investments | (74,058,114) |
|
| Total — Representing net assets applicable to capital | |
| shares outstanding | $1,765,144,426 |
| |
| |
| COMPUTATION OF NET ASSET VALUE AND OFFERING PRICE |
|
| Net asset value and redemption price per class A share | |
| ($1,666,073,941 divided by 228,189,521 shares) | $7.30 |
|
| Offering price per class A share (100/96.00 of $7.30)* | $7.60 |
|
| Net asset value and offering price per class B share | |
| ($49,315,887 divided by 6,760,590 shares)** | $7.29 |
|
| Net asset value and offering price per class C share | |
| ($34,679,203 divided by 4,729,951 shares)** | $7.33 |
|
| Net asset value and redemption price per class M share | |
| ($4,357,701 divided by 598,212 shares) | $7.28 |
|
| Offering price per class M share (100/96.75 of $7.28)*** | $7.52 |
|
| Net asset value and redemption price per class Y share | |
| ($10,717,694 divided by 1,465,703 shares) | $7.31 |
|
* On single retail sales of less than $100,000. On sales of $100,000 or more the offering price is reduced.
** Redemption price per share is equal to net asset value less any applicable contingent deferred sales charge.
*** On single retail sales of less than $50,000. On sales of $50,000 or more the offering price is reduced.
The accompanying notes are an integral part of these financial statements.
30
| |
| Statement of operations Year ended 9/30/08 | |
| |
| INTEREST INCOME | $98,278,475 |
|
| |
| EXPENSES | |
|
| Compensation of Manager (Note 2) | 9,316,204 |
|
| Investor servicing fees (Note 2) | 747,727 |
|
| Custodian fees (Note 2) | 29,608 |
|
| Trustee compensation and expenses (Note 2) | 72,777 |
|
| Administrative services (Note 2) | 47,476 |
|
| Distribution fees — Class A (Note 2) | 3,752,422 |
|
| Distribution fees — Class B (Note 2) | 543,872 |
|
| Distribution fees — Class C (Note 2) | 279,576 |
|
| Distribution fees — Class M (Note 2) | 23,111 |
|
| Interest and fees expense (Note 1) | 69,952 |
|
| Other | 362,712 |
|
| Non-recurring costs (Notes 2 and 5) | 3,291 |
|
| Costs assumed by Manager (Notes 2 and 5) | (3,291) |
|
| Total expenses | 15,245,437 |
| | |
| Expense reduction (Note 2) | (250,356) |
|
| Net expenses | 14,995,081 |
| | |
| Net investment income | 83,283,394 |
|
| Net realized loss on investments (Notes 1 and 3) | (9,519,538) |
|
| Net realized gain on swap contracts (Note 1) | 234,982 |
|
| Net realized loss on futures contracts (Note 1) | (467,651) |
|
| Net unrealized depreciation of investments, futures | |
| contracts and swap contracts during the year | (161,814,387) |
|
| Net loss on investments | (171,566,594) |
|
| Net decrease in net assets resulting from operations | $(88,283,200) |
| | |
| Statement of changes in net assets | |
| |
| DECREASE IN NET ASSETS | | |
| | Year ended | Year ended |
| | 9/30/08 | 9/30/07 |
|
| Operations: | | |
|
| Net investment income | $83,283,394 | $85,569,152 |
|
| Net realized gain (loss) on investments | (9,752,207) | 11,882,945 |
|
| Net unrealized depreciation of investments | (161,814,387) | (54,044,721) |
|
| Net increase (decrease) in net assets | | |
| resulting from operations | (88,283,200) | 43,407,376 |
|
| Distributions to shareholders (Note 1): | | |
|
| From ordinary income | | |
|
| Taxable net investment income | | |
|
| Class A | (1,113,153) | (30,327) |
|
| Class B | (44,346) | (1,700) |
|
| Class C | (13,387) | (328) |
|
| Class M | (2,864) | (90) |
|
| Net realized short-term gain on investments | |
|
| Class A | — | (827,178) |
|
| Class B | — | (47,752) |
|
| Class C | — | (9,764) |
|
| Class M | — | (2,473) |
|
| From tax-exempt net investment income | | |
|
| Class A | (76,610,017) | (78,490,853) |
|
| Class B | (2,322,456) | (3,382,364) |
|
| Class C | (974,416) | (725,949) |
|
| Class M | (184,417) | (211,279) |
|
| Class Y | (262,329) | — |
|
| From net realized long-term gain on investments | |
|
| Class A | (8,330,607) | (5,435,741) |
|
| Class B | (321,331) | (313,796) |
|
| Class C | (106,799) | (64,162) |
|
| Class M | (22,121) | (16,251) |
|
| Redemption fees (Note 1) | 22,628 | 298 |
|
| Decrease from capital share transactions | | |
| (Note 4) | (4,404,262) | (115,513,842) |
|
| Total decrease in net assets | (182,973,077) | (161,666,175) |
|
| |
| NET ASSETS | | |
|
| Beginning of year | 1,948,117,503 | 2,109,783,678 |
|
| End of year (including undistributed net | | |
| investment income of $4,943,928 and | | |
| $3,077,174, respectively) | $1,765,144,426 | $1,948,117,503 |
The accompanying notes are an integral part of these financial statements.
31
Financial highlights (For a common share outstanding throughout the period)
| | | | | | | | | | | | | | | | | | | | | | | | | | | | |
| INVESTMENT OPERATIONS: | | | | | | | | LESS DISTRIBUTIONS: | | | | | | | | RATIOS AND SUPPLEMENTAL DATA: | | |
|
| | | | | | | | | | | | | | | | | | | | | | | | | | | Ratio of net | | |
| | | Net asset value, | | | | Net realized and | | Total from | | | | From net | | | | | | | | Total return | | Net assets, | | Ratio of expenses | | investment income | | |
| | | beginning | | Net investment | | unrealized gain (loss) | | investment | | From net | | realized gain on | | Total | | Redemption | | Net asset value, | | at net asset | | end of period | | to average | | (loss) to average | | Portfolio |
| Period ended | | of period | | income (loss) | | on investments | | operations | | investment income | | investments | | distributions | | fees | | end of period | | value (%) a | | (in thousands) | | net assets (%) b | | net assets (%) | | turnover (%) |
|
| Class A | | | | | | | | | | | | | | | | | | | | | | | | | | | | |
| September 30, 2008 | | $8.04 | | .35 | | (.71) | | (.36) | | (.34) | | (.04) | | (.38) | | — c | | $7.30 | | (4.69) | | $1,666,074 | | .77 d | | 4.44 d | | 48.13 |
| September 30, 2007 | | 8.23 | | .35 | | (.17) | | .18 | | (.34) | | (.03) | | (.37) | | — c | | 8.04 | | 2.14 | | 1,845,476 | | .76 | | 4.25 | | 36.29 |
| September 30, 2006 | | 8.43 | | .34 | | (.01) | | .33 | | (.34) | | (.19) | | (.53) | | — c | | 8.23 | | 4.09 | | 1,959,603 | | .75 | | 4.17 | | 11.70 |
| September 30, 2005 | | 8.57 | | .36 | | (.02) | | .34 | | (.38) | | (.10) | | (.48) | | — c | | 8.43 | | 4.08 | | 2,057,513 | | .75 | | 4.20 | | 21.15 |
| September 30, 2004 | | 8.62 | | .38 | | .01 | | .39 | | (.40) | | (.04) | | (.44) | | — | | 8.57 | | 4.60 | | 2,144,817 | | .79 | | 4.49 | | 13.01 |
|
| Class B | | | | | | | | | | | | | | | | | | | | | | | | | | | | |
| September 30, 2008 | | $8.04 | | .30 | | (.72) | | (.42) | | (.29) | | (.04) | | (.33) | | — c | | $7.29 | | (5.45) | | $49,316 | | 1.41 d | | 3.79 d | | 48.13 |
| September 30, 2007 | | 8.22 | | .30 | | (.17) | | .13 | | (.28) | | (.03) | | (.31) | | — c | | 8.04 | | 1.63 | | 76,150 | | 1.40 | | 3.60 | | 36.29 |
| September 30, 2006 | | 8.42 | | .29 | | (.01) | | .28 | | (.29) | | (.19) | | (.48) | | — c | | 8.22 | | 3.46 | | 120,918 | | 1.39 | | 3.52 | | 11.70 |
| September 30, 2005 | | 8.56 | | .30 | | (.02) | | .28 | | (.32) | | (.10) | | (.42) | | — c | | 8.42 | | 3.40 | | 178,443 | | 1.40 | | 3.55 | | 21.15 |
| September 30, 2004 | | 8.62 | | .33 | | (.01) | | .32 | | (.34) | | (.04) | | (.38) | | — | | 8.56 | | 3.81 | | 241,841 | | 1.44 | | 3.84 | | 13.01 |
|
| Class C | | | | | | | | | | | | | | | | | | | | | | | | | | | | |
| September 30, 2008 | | $8.07 | | .29 | | (.71) | | (.42) | | (.28) | | (.04) | | (.32) | | — c | | $7.33 | | (5.40) | | $34,679 | | 1.56 d | | 3.66 d | | 48.13 |
| September 30, 2007 | | 8.26 | | .28 | | (.17) | | .11 | | (.27) | | (.03) | | (.30) | | — c | | 8.07 | | 1.32 | | 21,493 | | 1.55 | | 3.46 | | 36.29 |
| September 30, 2006 | | 8.46 | | .28 | | (.01) | | .27 | | (.28) | | (.19) | | (.47) | | — c | | 8.26 | | 3.24 | | 23,147 | | 1.54 | | 3.37 | | 11.70 |
| September 30, 2005 | | 8.60 | | .29 | | (.02) | | .27 | | (.31) | | (.10) | | (.41) | | — c | | 8.46 | | 3.21 | | 24,333 | | 1.55 | | 3.40 | | 21.15 |
| September 30, 2004 | | 8.65 | | .34 | | (.02) | | .32 | | (.33) | | (.04) | | (.37) | | — | | 8.60 | | 3.83 | | 24,313 | | 1.59 | | 3.69 | | 13.01 |
|
| Class M | | | | | | | | | | | | | | | | | | | | | | | | | | | | |
| September 30, 2008 | | $8.03 | | .33 | | (.72) | | (.39) | | (.32) | | (.04) | | (.36) | | — c | | $7.28 | | (5.11) | | $4,358 | | 1.06 d | | 4.14 d | | 48.13 |
| September 30, 2007 | | 8.21 | | .32 | | (.16) | | .16 | | (.31) | | (.03) | | (.34) | | — c | | 8.03 | | 1.97 | | 4,998 | | 1.05 | | 3.95 | | 36.29 |
| September 30, 2006 | | 8.41 | | .32 | | (.01) | | .31 | | (.32) | | (.19) | | (.51) | | — c | | 8.21 | | 3.79 | | 6,115 | | 1.04 | | 3.87 | | 11.70 |
| September 30, 2005 | | 8.55 | | .33 | | (.02) | | .31 | | (.35) | | (.10) | | (.45) | | — c | | 8.41 | | 3.76 | | 6,279 | | 1.05 | | 3.90 | | 21.15 |
| September 30, 2004 | | 8.61 | | .35 | | — c | | .35 | | (.37) | | (.04) | | (.41) | | — | | 8.55 | | 4.17 | | 6,774 | | 1.09 | | 4.19 | | 13.01 |
|
| Class Y | | | | | | | | | | | | | | | | | | | | | | | | | | | | |
| September 30, 2008† | | $7.96 | | .28 | | (.66) | | (.38) | | (.27) | | — | | (.27) | | — c | | $7.31 | | (4.91) * | | $10,718 | | .42 *d | | 3.53 *d | | 48.13 |
|
*Not annualized.
†For the period January 2, 2008 (commencement of operations) to September 30, 2008.
a Total return assumes dividend reinvestment and does not reflect the effect of sales charges.
b Includes amounts paid through expense offset arrangements (Note 2).
c Amount represents less than $0.01 per share.
d Includes interest and fee expense associated with borrowings which amounted to less than 0.01% for the period ended September 30, 2008.
The accompanying notes are an integral part of these financial statements.
Notes to financial statements 9/30/08
Note 1: Significant accounting policies
Putnam California Tax Exempt Income Fund (the “fund”), a Massachusetts business trust, is registered under the Investment Company Act of 1940, as amended, as a diversified, open-end management investment company. The fund seeks as high a level of current income exempt from federal and California personal income tax as Putnam Investment Management, LLC (“Putnam Management”), the fund’s manager, a wholly-owned subsidiary of Putnam, LLC, believes is consistent with preservation of capital by investing in a diversified portfolio of longer-term California tax-exempt securities. The fund may be affected by economic and political developments in the state of California.
The fund offers class A, class B, class C, class M and class Y shares. Class A and class M shares are sold with a maximum front-end sales charge of 4.00% and 3.25%, respectively, and generally do not pay a contingent deferred sales charge. The fund began offering class Y shares on January 2, 2008. Class B shares, which convert to class A shares after approximately eight years, do not pay a front-end sales charge and are subject to a contingent deferred sales charge, if those shares are redeemed within six years of purchase. Class C shares have a one-year 1.00% contingent deferred sales charge and do not convert to class A shares. The expenses for class A, class B, class C, and class M shares may differ based on the distribution fee of each class, which is identified in Note 2. Class Y shares, which are sold at net asset value, are generally subject to the same expenses as class A, class B, class C, and class M shares, but do not bear a distribution fee. Class Y shar es are generally only available to corporate and institutional clients and clients in other approved programs.
A 1.00% redemption fee may apply on any shares that are redeemed (either by selling or exchanging into another fund) within 7 days of purchase. The redemption fee is accounted for as an addition to paid-in-capital.
Investment income, realized and unrealized gains and losses and expenses of the fund are borne pro-rata based on the relative net assets of each class to the total net assets of the fund, except that each class bears expenses unique to that class (including the distribution fees applicable to such classes). Each class votes as a class only with respect to its own distribution plan or other matters on which a class vote is required by law or determined by the Trustees. If the fund were liquidated, shares of each class would receive their pro-rata share of the net assets of the fund. In addition, the Trustees declare separate dividends on each class of shares.
In the normal course of business, the fund enters into contracts that may include agreements to indemnify another party under given circumstances. The fund’s maximum exposure under these arrangements is unknown as this would involve future claims that may be, but have not yet been, made against the fund. However, the fund’s management team expects the risk of material loss to be remote.
The following is a summary of significant accounting policies consistently followed by the fund in the preparation of its financial statements. The preparation of financial statements is in conformity with accounting principles generally accepted in the United States of America and requires management to make estimates and assumptions that affect the reported amounts of assets and liabilities in the financial statements and the reported amounts of increases and decreases in net assets from operations during the reporting period. Actual results could differ from those estimates.
A) Security valuation Tax-exempt bonds and notes are generally valued on the basis of valuations provided by an independent pricing service approved by the Trustees. Such services use information with respect to transactions in bonds, quotations from bond dealers, market transactions in comparable securities and various relationships between securities in determining value. Certain investments and derivatives are also valued at fair value following procedures approved by the Trustees. Such valuations and procedures are reviewed periodically by the Trustees. The fair value of securities is generally determined as the amount that the fund could reasonably expect to realize from an orderly disposition of such securities over a reasonable period of time. By its nature, a fair value price is a good faith estimate of the value of a security at a given point in time and does not reflect an actua l market price, which may be different by a material amount.
B) Security transactions and related investment income Security transactions are recorded on the trade date (the date the order to buy or sell is executed). Gains or losses on securities sold are determined on the identified cost basis.
Interest income is recorded on the accrual basis. All premiums/discounts are amortized/accreted on a yield-to-maturity basis. The premium in excess of the call price, if any, is amortized to the call date; thereafter, any remaining premium is amortized to maturity.
C) Tender option bonds The fund may participate in transactions whereby a fixed-rate bond owned by the fund is transferred to a tender option bond trust (“TOB trust”) , sponsored by a broker, in exchange for residual interests in the TOB trust’s assets and cash flows, which are in the form of inverse floating rate bonds. The TOB trust funds the purchase of the fixed rate bonds by issuing floating-rate bonds issued to third parties and allowing the fund to retain the residual interest in the fixed-rate bonds through the inverse floating rate bonds. The inverse floating rate bonds held by the fund gives the fund the right to (1) cause the holders of the floating rate bonds to tender their notes at par, and (2) to have the fixed-rate bond held by the TOB trust transferred to the fund, causing the TOB trust to collapse. The fund accounts for the transfer of the fixed-rate bond to the TOB trust as a secured borrow ing by including the fixed-rate bond in The fund’s portfolio and including the floating rate bond as a liability in the Statement of assets and liabilities. At September 30, 2008, the fund’s investments with a value of $12,748,368 were held by the TOB trust and served as collateral for $10,200,000 in floating-rate bonds outstanding. During the period ended September 30, 2008, the fund incurred interest expense of $58,778 for these investments based on an average interest rate of 2.174% .
D) Futures and options contracts The fund may use futures and options contracts to hedge against changes in the values of securities the fund owns, owned or expects to purchase, or for other investment purposes. The fund may also write options on swaps or securities it owns or in which it may invest to increase its current returns.
The potential risk to the fund is that the change in value of futures and options contracts may not correspond to the change in value of the hedged instruments. In addition, losses may arise from changes in the value of the underlying instruments, if there is an illiquid secondary market for the contracts, or if the counterparty to the contract is unable to perform. Risks may exceed amounts recognized on the Statement of assets and liabilities. When the contract is closed, the fund records a realized gain or loss equal to the difference between the value of the contract at the time it was opened and the value at the time it was closed. Realized gains and losses on purchased options are included in realized gains and losses on investment securities. If a written call option is exercised, the premium originally received is recorded as an addition to sales proceeds. If a written put option is exercised, the premium originally received is recorded as a reduction to the cost of investments.
Futures contracts are valued at the quoted daily settlement prices established by the exchange on which they trade. The fund and the broker agree to exchange an amount of cash equal to the daily fluctuation in the value of the futures contract. Such receipts or payments are known as “variation margin.” Exchange traded options are valued at the last sale price or, if no sales are reported, the last bid price for purchased options and the last ask price for written options. Options traded over-the-counter are valued using prices supplied by dealers. Futures and written option contracts outstanding at period end, if any, are listed after the fund’s portfolio.
34
E) Total return swap contracts The fund may enter into total return swap contracts, which are arrangements to exchange a market linked return for a periodic payment, both based on a notional principal amount. To the extent that the total return of the security, index or other financial measure underlying the transaction exceeds or falls short of the offsetting interest rate obligation, the fund will receive a payment from or make a payment to the counterparty. Total return swap contracts are marked to market daily based upon quotations from market makers and the change, if any, is recorded as an unrealized gain or loss. Payments received or made are recorded as realized gains or losses. Certain total return swap contracts may include extended effective dates. Payments related to these swap contracts is accrued based on the terms of the contract. The fund could be exposed to credit or market risk due to unfavorable changes i n the fluctuation of interest rates or in the price of the underlying security or index, the possibility that there is no liquid market for these agreements or that the counterparty may default on its obligation to perform. Risk of loss may exceed amounts recognized on the Statement of assets and liabilities. Total return swap contracts outstanding at period end, if any, are listed after the fund’s portfolio.
F) Interest rate swap contracts The fund may enter into interest rate swap contracts, which are arrangements between two parties to exchange cash flows based on a notional principal amount, to manage the fund’s exposure to interest rates. An interest rate swap can be purchased or sold with an upfront premium. An upfront payment received by the fund is recorded as a liability on the fund’s books. An upfront payment made by the fund is recorded as an asset on the fund’s books. Interest rate swap contracts are marked to market daily based upon quotations from an independent pricing service or market makers and the change, if any, is recorded as an unrealized gain or loss. Payments received or made are recorded as realized gains or losses. Certain interest rate swap contracts may include extended effective dates. Payments related to these swap contracts are accrued based on the terms of the contract. The fund cou ld be exposed to credit or market risk due to unfavorable changes in the fluctuation of interest rates or if the counterparty defaults on its obligation to perform. Risk of loss may exceed amounts recognized on the Statement of assets and liabilities. Interest rate swap contracts outstanding at period end, if any, are listed after the fund’s portfolio.
G) Federal taxes It is the policy of the fund to distribute all of its income within the prescribed time and otherwise comply with the provisions of the Internal Revenue Code of 1986, as amended (the “Code”), applicable to regulated investment companies. It is also the intention of the fund to distribute an amount sufficient to avoid imposition of any excise tax under Section 4982 of the Code. Therefore, no provision has been made for federal taxes on income, capital gains or unrealized appreciation on securities held nor for excise tax on income and capital gains.
At September 30, 2008 the fund had a capital loss carryover of $766,815 available to the extent allowed by the Code to offset future net capital gain, if any. This capital loss carryover will expire on September 30, 2016.
Pursuant to federal income tax regulations applicable to regulated investment companies, the fund has elected to defer to its fiscal year ending September 30, 2009. $12,430,465 of losses recognized during the period November 1, 2007 to September 30, 2008.
H) Distributions to shareholders Distributions to shareholders Income dividends are recorded daily by the fund and are paid monthly. Distributions from capital gains, if any, are recorded on the ex-dividend date and paid at least annually. The amount and character of income and gains to be distributed are determined in accordance with income tax regulations which may differ from generally accepted accounting principles. These differences include temporary and/or permanent differences of post-October loss deferrals. Reclassifications are made to the fund’s capital accounts to reflect income and gains available for distribution (or available capital loss carryovers) under income tax regulations. For the year ended September 30, 2008, the fund reclassified $110,745 to increase undistributed net investment income and $960,197 to decrease paid-in-capital, with a decrease to accumulated ne t realized losses of $849,452.
The tax basis components of distributable earnings and the federal tax cost as of September 30, 2008 were as follows:
| | |
| Unrealized appreciation | $44,540,630 | |
| Unrealized depreciation | (119,848,720) | |
| |
| Net unrealized depreciation | (75,308,090) | |
| Undistributed tax exempt income | 6,666,043 | |
| Undistributed ordinary income | 513,367 | |
| Capital loss carryforward | (766,815) | |
| Post-October loss | (12,430,465) | |
| |
| Cost for federal income tax purposes | $1,798,196,033 | |
Note 2: Management fee, administrative services and other transactions
The fund pays Putnam Management for management and investment advisory services quarterly based on the average net assets of the fund. Such fee is based on the following annual rates: 0.60% of the first $500 million, 0.50% of the next $500 million, 0.45% of the next $500 million, 0.40% of the next $5 billion, 0.375% of the next $5 billion, 0.355% of the next $5 billion, 0.34% of the next $5 billion and 0.33% thereafter.
Putnam Management has agreed to waive fees and reimburse expenses of the fund through June 30, 2009 to the extent necessary to ensure that the fund’s expenses do not exceed the simple average of the expenses of all front-end load funds viewed by Lipper Inc. as having the same investment classification or objective as the fund. The expense reimbursement is based on a comparison of the fund’s expenses with the average annualized operating expenses of the funds in its Lipper peer group for each calendar quarter during the fund’s last fiscal year, excluding 12b-1 fees and without giving effect to any expense offset and brokerage/service arrangements that may reduce fund expenses. For the year ended September 30, 2008, Putnam Management did not waive any of its management fee from the fund.
For year ended September 30, 2008, Putnam Management has assumed $3,291 of legal, shareholder servicing and communication, audit and Trustee fees incurred by the fund in connection with certain legal and regulatory matters (including those described in Note 5).
The fund reimburses Putnam Management an allocated amount for the compensation and related expenses of certain officers of the fund and their staff who provide administrative services to the fund. The aggregate amount of all such reimbursements is determined annually by the Trustees.
Custodial services for the fund’s assets were provided by Putnam Fiduciary Trust Company (“PFTC”), an affiliate of Putnam Management, and by State Street Bank and Trust Company (“State Street”). Custody fees are based on the fund’s asset level, the number of its security holdings, transaction volumes and with respect to PFTC, certain fees related to the transition of assets to State Street. Putnam Investor Services, a division of PFTC, provided investor servicing agent functions to the fund. Putnam Investor Services received fees for investor servicing, subject to certain limitations, based on the number of shareholder accounts in the fund and the level of defined contribution plan assets in the fund. During the year ended September 30, 2008, the fund incurred $762,209 for custody and investor servicing agent functions provided by PFTC.
The fund has entered into expense offset arrangements with PFTC and State Street whereby PFTC’s and State Street’s fees are reduced by credits allowed on cash balances. For the year ended September 30, 2008, the fund’s expenses were reduced by $250,356 under the expense offset arrangements.
Each independent Trustee of the fund receives an annual Trustee fee, of which $713, as a quarterly retainer, has been allocated to the fund, and an additional fee for each Trustees meeting attended. Trustees receive additional fees for
35
attendance at certain committee meetings and industry seminars and for certain compliance-related matters. Trustees also are reimbursed for expenses they incur relating to their services as Trustees.
The fund has adopted a Trustee Fee Deferral Plan (the “Deferral Plan”) which allows the Trustees to defer the receipt of all or a portion of Trustees fees payable on or after July 1, 1995. The deferred fees remain invested in certain Putnam funds until distribution in accordance with the Deferral Plan.
The fund has adopted an unfunded noncontributory defined benefit pension plan (the “Pension Plan”) covering all Trustees of the fund who have served as a Trustee for at least five years and were first elected prior to 2004. Benefits under the Pension Plan are equal to 50% of the Trustee’s average annual attendance and retainer fees for the three years ended December 31, 2005. The retirement benefit is payable during a Trustee’s lifetime, beginning the year following retirement, for the number of years of service through December 31, 2006. Pension expense for the fund is included in Trustee compensation and expenses in the Statement of operations. Accrued pension liability is included in Payable for Trustee compensation and expenses in the Statement of assets and liabilities. The Trustees have terminated the Pension Plan with respect to any Trustee first elected after 2003.
The fund has adopted distribution plans (the “Plans”) with respect to its class A, class B, class C and class M shares pursuant to Rule 12b-1 under the Investment Company Act of 1940. The purpose of the Plans is to compensate Putnam Retail Management Limited Partnership, a wholly-owned subsidiary of Putnam, LLC and Putnam Retail Management GP, Inc., for services provided and expenses incurred in distributing shares of the fund. The Plans provide for payments by the fund to Putnam Retail Management Limited Partnership at an annual rate of up to 0.35%, 1.00%, 1.00% and 0.50% of the average net assets attributable to class A, class B, class C and class M shares, respectively. The Trustees have approved payment by the fund at the annual rate of 0.85%, 1.00% and 0.50% of the average net assets for class B, class C and class M shares, respectively. For class A shares, the annual payment rate will equal the weighted average of (i) 0.20% on the net assets of the f und attributable to class A shares purchased and paid for prior to April 1, 2005 and (ii) 0.25% on all other net assets of the fund attributable to class A shares.
For the year ended September 30, 2008, Putnam Retail Management Limited Partnership, acting as underwriter, received net commissions of $299,964 and $849 from the sale of class A and class M shares, respectively, and received $35,071 and $9,718 in contingent deferred sales charges from redemptions of class B and class C shares, respectively.
A deferred sales charge of up to 1.00% is assessed on certain redemptions of class A shares that were purchased without an initial sales charge as part of an investment of $1 million or more. For the year ended September 30, 2008, Putnam Retail Management Limited Partnership, acting as underwriter, received $36,824 on class A redemptions.
Note 3: Purchases and sales of securities
During the year ended September 30, 2008, cost of purchases and proceeds from sales of investment securities other than short-term investments aggregated $888,955,645 and $952,209,936, respectively. There were no purchases or sales of U.S. government securities.
Note 4: Capital shares
At September 30, 2008, there was an unlimited number of shares of beneficial interest authorized. Transactions in capital shares were as follows:
| | | | |
| | Year ended 9/30/08 | Year ended 9/30/07 |
|
| Class A | Shares | Amount | Shares | Amount |
|
| Shares sold | 24,423,462 | $191,328,397 | 17,018,721 | $138,644,767 |
|
| Shares issued in | 6,557,058 | 51,141,231 | 6,062,363 | 49,406,140 |
| connection with | | | | |
| reinvestment of | | | | |
| distributions | | | | |
|
| | 30,980,520 | 242,469,628 | 23,081,084 | 188,050,907 |
|
| Shares | (32,217,226) | (252,825,320) | (31,800,540) | (258,800,766) |
| repurchased | | | | |
|
| Net decrease | (1,236,706) | $(10,355,692) | (8,719,456) | $(70,749,859) |
|
| |
| | Year ended 9/30/08 | Year ended 9/30/07 |
|
| Class B | Shares | Amount | Shares | Amount |
|
| Shares sold | 272,836 | $2,167,422 | 371,280 | $3,022,881 |
|
| Shares issued in | 212,389 | 1,627,143 | 284,908 | 2,314,911 |
| connection with | | | | |
| reinvestment of | | | | |
| distributions | | | | |
|
| | 485,225 | 3,794,565 | 656,188 | 5,337,792 |
|
| Shares | (3,199,765) | (25,141,927) | (5,887,197) | (47,958,881) |
| repurchased | | | | |
|
| Net decrease | (2,714,540) | $(21,347,362) | (5,231,009) | $(42,621,089) |
|
| |
| | Year ended 9/30/08 | Year ended 9/30/07 |
|
| Class C | Shares | Amount | Shares | Amount |
|
| Shares sold | 2,708,427 | $21,247,751 | 757,468 | $6,188,440 |
|
| Shares issued in | 101,607 | 792,061 | 66,949 | 547,709 |
| connection with | | | | |
| reinvestment of | | | | |
| distributions | | | | |
|
| | 2,810,034 | 22,039,812 | 824,417 | 6,736,149 |
|
| Shares | (741,873) | (5,814,986) | (964,428) | (7,888,172) |
| repurchased | | | | |
|
| Net increase | 2,068,161 | $16,224,826 | (140,011) | $(1,152,023) |
| (decrease) | | | | |
|
| |
| | Year ended 9/30/08 | Year ended 9/30/07 |
|
| Class M | Shares | Amount | Shares | Amount |
|
| Shares sold | 110,521 | $863,598 | 45,476 | $371,276 |
|
| Shares issued in | 19,017 | 147,906 | 19,137 | 155,711 |
| connection with | | | | |
| reinvestment of | | | | |
| distributions | | | | |
|
| | 129,538 | 1,011,504 | 64,613 | 526,987 |
|
| Shares | (154,132) | (1,216,827) | (186,544) | (1,517,858) |
| repurchased | | | | |
|
| Net decrease | (24,594) | $(205,323) | (121,931) | $(990,871) |
|
36
| | |
| | For the period 1/2/08 |
| | (commencement of operations) to 9/30/08 |
|
| Class Y | Shares | Amount |
|
| Shares sold | 1,898,222 | $14,633,889 |
|
| Shares issued in | 33,361 | 256,111 |
| connection with | | |
| reinvestment of | | |
| distributions | | |
|
| | 1,931,583 | 14,890,000 |
|
| Shares | (465,880) | (3,610,711) |
| repurchased | | |
|
| Net increase | 1,465,703 | $11,279,289 |
| (decrease) | | |
|
At September 30, 2008, Putnam, LLC owned 1,301 class Y shares of the fund (less than 0.1% of class Y shares outstanding), valued at $9,510.
Note 5: Regulatory matters and litigation
In late 2003 and 2004, Putnam Management settled charges brought by the Securities and Exchange Commission and the Massachusetts Securities Division in connection with excessive short-term trading in Putnam funds. Distribution of payments from Putnam Management to certain open-end Putnam funds and their shareholders is expected to be completed in the next several months. These allegations and related matters have served as the general basis for certain lawsuits, including purported class action lawsuits against Putnam Management and, in a limited number of cases, some Putnam funds. Putnam Management believes that these lawsuits will have no material adverse effect on the funds or on Putnam Management’s ability to provide investment management services. In addition, Putnam Management has agreed to bear any costs incurred by the Putnam funds as a result of these matters.
Note 6: New accounting pronouncements
In June 2006, the Financial Accounting Standards Board (“FASB”) issued Interpretation No. 48, Accounting for Uncertainty in Income Taxes (the “Interpretation”). The Interpretation prescribes a minimum threshold for financial statement recognition of the benefit of a tax position taken or expected to be taken by a filer in the filer’s tax return. Upon adoption, the Interpretation did not have a material effect on the fund’s financial statements. However, the conclusions regarding the Interpretation may be subject to review and adjustment at a later date based on factors including, but not limited to, further implementation guidance expected from the FASB, and on-going analysis of tax laws, regulations and interpretations thereof. Each of the fund’s federal tax returns for the prior three fiscal years remains subject to examination by the Internal Revenue Service
In September 2006, the FASB issued Statement of Financial Accounting Standards No. 157, Fair Value Measurements (the “Standard”). The Standard defines fair value, sets out a framework for measuring fair value and expands disclosures about fair value measurements. The Standard applies to fair value measurements already required or permitted by existing standards. The Standard is effective for fiscal years beginning after November 15, 2007 and interim periods within those fiscal years. Putnam Management does not believe the adoption of the Standard will impact the amounts reported in the financial statements; however, additional disclosures will be required about the inputs used to develop the measurements of fair value.
In March 2008, Statement of Financial Accounting Standards No. 161, Disclosures about Derivative Instruments and Hedging Activities (“SFAS 161”) — an amendment of FASB Statement No. 133, was issued and is effective for fiscal years beginning after November 15, 2008. SFAS 161 requires enhanced disclosures about how and why an entity uses derivative instruments and how derivative instruments affect an entity’s financial position. Putnam Management is currently evaluating the impact the adoption of SFAS 161 will have on the fund’s financial statement disclosures.
In September 2008, FASB Staff Position FAS 133-1 and FIN 45-4, “Disclosures about Credit Derivatives and Certain Guarantees: An Amendment of FASB Statement No. 133 and FASB Interpretation No. 45; and Clarification of the Effective Date of FASB Statement No. 161” (“Amendment”) was issued and is effective for annual and interim reporting periods ending after November 15, 2008. The Amendment requires enhanced disclosures regarding a fund’s credit derivatives holdings and hybrid financial instruments containing embedded credit derivatives. Management is currently evaluating the impact the adoption of the Amendment will have on the Funds’ financial statement disclosures.
Note 7: Market conditions
Recent events in the financial sector have resulted in an unusually high degree of volatility in the financial markets. The fund’s investments in the financial sector reflected in the fund’s schedule of investments, exposes investors to the negative (or positive) performance resulting from these events.
Federal tax information (unaudited)
The fund has designated 98.44% of dividends paid from net investment income during the fiscal year as tax exempt for Federal income tax purposes.
The Form 1099 you receive in January 2009 will show the tax status of all distributions paid to your account in calendar 2008.
37
About the Trustees
Jameson A. Baxter
Born 1943, Trustee since 1994, Vice Chairman since 2005
Ms. Baxter is the President of Baxter Associates, Inc., a private investment firm.
Ms. Baxter serves as a Director of ASHTA Chemicals, Inc., and the Mutual Fund Directors Forum. Until 2007, she was a Director of Banta Corporation (a printing and supply chain management company), Ryerson, Inc. (a metals service corporation), and Advocate Health Care. Until 2004, she was a Director of BoardSource (formerly the National Center for Nonprofit Boards); and until 2002, she was a Director of Intermatic Corporation (a manufacturer of energy control products). She is Chairman Emeritus of the Board of Trustees, Mount Holyoke College, having served as Chairman for five years.
Ms. Baxter has held various positions in investment banking and corporate finance, including Vice President of and Consultant to First Boston Corporation and Vice President and Principal of the Regency Group. She is a graduate of Mount Holyoke College.
Charles B. Curtis
Born 1940, Trustee since 2001
Mr. Curtis is President and Chief Operating Officer of the Nuclear Threat Initiative (a private foundation dealing with national security issues), and serves as Senior Advisor to the United Nations Foundation.
Mr. Curtis is a member of the Council on Foreign Relations and serves as Director of Edison International and Southern California Edison. Until 2006, Mr. Curtis served as a member of the Trustee Advisory Council of the Applied Physics Laboratory, Johns Hopkins University. Until 2003, Mr. Curtis was a member of the Electric Power Research Institute Advisory Council and the University of Chicago Board of Governors for Argonne National Laboratory. Prior to 2002, Mr. Curtis was a member of the Board of Directors of the Gas Technology Institute and the Board of Directors of the Environment and Natural Resources Program Steering Committee, John F. Kennedy School of Government, Harvard University. Until 2001, Mr. Curtis was a member of the Department of Defense Policy Board and Director of EG&G Technical Services, Inc. (a fossil energy research and development support company).
From August 1997 to December 1999, Mr. Curtis was a Partner at Hogan & Hartson LLP, an international law firm headquartered in Washington, D.C. Prior to May 1997, Mr. Curtis was Deputy Secretary of Energy and Under Secretary of the U.S. Department of Energy. He served as Chairman of the Federal Energy Regulatory Commission from 1977 to 1981 and has held positions on the staff of the U.S. House of Representatives, the U.S. Treasury Department, and the SEC.
Robert J. Darretta
Born 1946, Trustee since 2007
Mr. Darretta serves as Director of United-Health Group, a diversified health-care company.
Until April 2007, Mr. Darretta was Vice Chairman of the Board of Directors of Johnson & Johnson, one of the world’s largest and most broadly based health-care companies. Prior to 2007, he had responsibility for Johnson & Johnson’s finance, investor relations, information technology, and procurement function. He served as Johnson & Johnson Chief Financial Officer for a decade, prior to which he spent two years as Treasurer of the corporation and over ten years leading various Johnson & Johnson operating companies.
Mr. Darretta received a B.S. in Economics from Villanova University.
Myra R. Drucker
Born 1948, Trustee since 2004
Ms. Drucker is Chair of the Board of Trustees of Commonfund (a not-for-profit firm specializing in managing assets for educational endowments and foundations), Vice Chair of the Board of Trustees of Sarah Lawrence College, and a member of the Investment Committee of the Kresge Foundation (a charitable trust). She is also a Director of New York Stock Exchange LLC (a wholly-owned subsidiary of NYSE Euronext), and a Director of Interactive Data Corporation (a provider of financial market data and analytics to financial institutions and investors).
Ms. Drucker is an ex-officio member of the New York Stock Exchange (NYSE) Pension Managers Advisory Committee, having served as Chair for seven years. She serves as an advisor to RCM Capital Management (an investment management firm) and to the Employee Benefits Investment Committee of The Boeing Company (an aerospace firm).
From November 2001 until August 2004, Ms. Drucker was Managing Director and a member of the Board of Directors of General Motors Asset Management and Chief Investment Officer of General Motors Trust Bank. From December 1992 to November 2001, Ms. Drucker served as Chief Investment Officer of Xerox Corporation (a document company). Prior to December 1992, Ms. Drucker was Staff Vice President and Director of Trust Investments for International Paper (a paper and packaging company).
Ms. Drucker received a B.A. degree in Literature and Psychology from Sarah Lawrence College and pursued graduate studies in economics, statistics, and portfolio theory at Temple University.
Charles E. Haldeman, Jr.*
Born 1948, Trustee since 2004 and President of the Funds since 2007
Mr. Haldeman is Chairman of Putnam Investment Management, LLC and President of the Putnam Funds. Prior to July 2008, he was President and Chief Executive Officer of Putnam, LLC (“Putnam Investments”). Prior to November 2003, Mr. Haldeman served as Co-Head of Putnam Investments’ Investment Division.
Prior to joining Putnam in 2002, he held executive positions in the investment management industry. He previously served as Chief Executive Officer of Delaware Investments and President and Chief Operating Officer of United Asset Management. Mr. Haldeman was also a
38
Partner and Director of Cooke & Bieler, Inc. (an investment management firm).
Mr. Haldeman currently serves on the Board of Governors of the Investment Company Institute and as Chair of the Board of Trustees of Dartmouth College. He also serves on the Partners HealthCare Investment Committee, the Tuck School of Business Overseers, and the Harvard Business School Board of Dean’s Advisors. He is a graduate of Dartmouth College, Harvard Law School, and Harvard Business School. Mr. Haldeman is also a Chartered Financial Analyst (CFA) charterholder.
John A. Hill
Born 1942, Trustee since 1985 and Chairman since 2000
Mr. Hill is founder and Vice-Chairman of First Reserve Corporation, the leading private equity buyout firm specializing in the worldwide energy industry, with offices in Greenwich, Connecticut; Houston, Texas; London, England; and Shanghai, China. The firm’s investments on behalf of some of the nation’s largest pension and endowment funds are currently concentrated in 26 companies with annual revenues in excess of $13 billion, which employ over 100,000 people in 23 countries.
Mr. Hill is Chairman of the Board of Trustees of the Putnam Mutual Funds, a Director of Devon Energy Corporation and various private companies owned by First Reserve, and serves as a Trustee of Sarah Lawrence College where he chairs the Investment Committee.
Prior to forming First Reserve in 1983, Mr. Hill served as President of F. Eberstadt and Company, an investment banking and investment management firm. Between 1969 and 1976, Mr. Hill held various senior positions in Washington, D.C. with the federal government, including Deputy Associate Director of the Office of Management and Budget and Deputy Administrator of the Federal Energy Administration during the Ford Administration.
Born and raised in Midland, Texas, he received his B.A. in Economics from Southern Methodist University and pursued graduate studies as a Woodrow Wilson Fellow.
Paul L. Joskow
Born 1947, Trustee since 1997
Dr. Joskow is an economist and President of the Alfred P. Sloan Foundation (a philanthropic institution focused primarily on research and education on issues related to science, technology, and economic performance). He is on leave from his position as the Elizabeth and James Killian Professor of Economics and Management at the Massachusetts Institute of Technology (MIT), where he has been on the faculty since 1972. Dr. Joskow was the Director of the Center for Energy and Environmental Policy Research at MIT from 1999 through 2007.
Dr. Joskow serves as a Trustee of Yale University, as a Director of TransCanada Corporation (an energy company focused on natural gas transmission and power services) and of Exelon Corporation (an energy company focused on power services), and as a member of the Board of Overseers of the Boston Symphony Orchestra. Prior to August 2007, he served as a Director of National Grid (a UK-based holding company with interests in electric and gas transmission and distribution and telecommunications infrastructure). Prior to July 2006, he served as President of the Yale University Council and continues to serve as a member of the Council. Prior to February 2005, he served on the board of the Whitehead Institute for Biomedical Research (a non-profit research institution). Prior to February 2002, he was a Director of State Farm Indemnity Company (an automobile insurance company), and prior to March 2000, he was a Director of New England Electric System (a public utility holding comp any).
Dr. Joskow has published six books and numerous articles on industrial organization, government regulation of industry, and competition policy. He is active in industry restructuring, environmental, energy, competition, and privatization policies — serving as an advisor to governments and corporations worldwide. Dr. Joskow holds a Ph.D. and MPhil from Yale University and a B.A. from Cornell University.
Elizabeth T. Kennan
Born 1938, Trustee since 1992
Dr. Kennan is a Partner of Cambus-Kenneth Farm (thoroughbred horse and cattle breeding). She is President Emeritus of Mount Holyoke College.
Dr. Kennan served as Chairman and is now Lead Director of Northeast Utilities. She is a Trustee of the National Trust for Historic Preservation, of Centre College, and of Midway College in Midway, Kentucky. Until 2006, she was a member of The Trustees of Reservations. Prior to 2001, Dr. Kennan served on the oversight committee of the Folger Shakespeare Library. Prior to June 2005, she was a Director of Talbots, Inc., and she has served as Director on a number of other boards, including Bell Atlantic, Chastain Real Estate, Shawmut Bank, Berkshire Life Insurance, and Kentucky Home Life Insurance. Dr. Kennan has also served as President of Five Colleges Incorporated and as a Trustee of Notre Dame University, and is active in various educational and civic associations.
As a member of the faculty of Catholic University for twelve years, until 1978, Dr. Kennan directed the post-doctoral program in Patristic and Medieval Studies, taught history, and published numerous articles and two books. Dr. Kennan holds a Ph.D. from the University of Washington in Seattle, an M.S. from St. Hilda’s College at Oxford University, and an A.B. from Mount Holyoke College. She holds several honorary doctorates.
Kenneth R. Leibler
Born 1949, Trustee since 2006
Mr. Leibler is a founder and former Chairman of the Boston Options Exchange, an electronic marketplace for the trading of derivative securities.
Mr. Leibler currently serves as a Trustee of Beth Israel Deaconess Hospital in Boston. He is also Lead Director of Ruder Finn Group, a global communications and advertising firm, and a Director of Northeast Utilities, which operates New England’s largest energy delivery system. Prior to December 2006, he served as a Director of the Optimum Funds group. Prior to October 2006, he served as a Director of ISO New England, the
39
organization responsible for the operation of the electric generation system in the New England states. Prior to 2000, Mr. Leibler was a Director of the Investment Company Institute in Washington, D.C.
Prior to January 2005, Mr. Leibler served as Chairman and Chief Executive Officer of the Boston Stock Exchange. Prior to January 2000, he served as President and Chief Executive Officer of Liberty Financial Companies, a publicly traded diversified asset management organization. Prior to June 1990, Mr. Leibler served as President and Chief Operating Officer of the American Stock Exchange (AMEX), and at the time was the youngest person in AMEX history to hold the title of President. Prior to serving as AMEX President, he held the position of Chief Financial Officer, and headed its management and marketing operations. Mr. Leibler graduated magna cum laude with a degree in Economics from Syracuse University, where he was elected Phi Beta Kappa.
Robert E. Patterson
Born 1945, Trustee since 1984
Mr. Patterson is Senior Partner of Cabot Properties, LP and Chairman of Cabot Properties, Inc. (a private equity firm investing in commercial real estate).
Mr. Patterson serves as Chairman Emeritus and Trustee of the Joslin Diabetes Center. Prior to June 2003, he was a Trustee of Sea Education Association. Prior to December 2001, Mr. Patterson was President and Trustee of Cabot Industrial Trust (a publicly traded real estate investment trust). Prior to February 1998, he was Executive Vice President and Director of Acquisitions of Cabot Partners Limited Partnership (a registered investment adviser involved in institutional real estate investments). Prior to 1990, he served as Executive Vice President of Cabot, Cabot & Forbes Realty Advisors, Inc. (the predecessor company of Cabot Partners).
Mr. Patterson practiced law and held various positions in state government, and was the founding Executive Director of the Massachusetts Industrial Finance Agency. Mr. Patterson is a graduate of Harvard College and Harvard Law School.
George Putnam, III
Born 1951, Trustee since 1984
Mr. Putnam is Chairman of New Generation Research, Inc. (a publisher of financial advisory and other research services), and President of New Generation Advisers, Inc. (a registered investment adviser to private funds). Mr. Putnam founded the New Generation companies in 1986.
Mr. Putnam is a Director of The Boston Family Office, LLC (a registered investment adviser). He is a Trustee of St. Mark’s School and a Trustee of the Marine Biological Laboratory in Woods Hole, Massachusetts. Until 2006, he was a Trustee of Shore Country Day School, and until 2002, was a Trustee of the Sea Education Association.
Mr. Putnam previously worked as an attorney with the law firm of Dechert LLP (formerly known as Dechert Price & Rhoads) in Philadelphia. He is a graduate of Harvard College, Harvard Business School, and Harvard Law School.
Robert L. Reynolds*
Born 1952, Trustee since 2008
Mr. Reynolds is President and Chief Executive Officer of Putnam Investments, and a member of Putnam Investments’ Executive Board of Directors. He has more than 30 years of investment and financial services experience.
Prior to joining Putnam Investments in 2008, Mr. Reynolds was Vice Chairman and Chief Operating Officer of Fidelity Investments from 2000 to 2007. During this time, he served on the Board of Directors for FMR Corporation, Fidelity Investments Insurance Ltd., Fidelity Investments Canada Ltd., and Fidelity Management Trust Company. He was also a Trustee of the Fidelity Family of Funds. From 1984 to 2000, Mr. Reynolds served in a number of increasingly responsible leadership roles at Fidelity.
Mr. Reynolds serves on several not-for-profit boards, including those of the West Virginia University Foundation, Concord Museum, Dana-Farber Cancer Institute, Lahey Clinic, and Initiative for a Competitive Inner City in Boston. He is a member of the Chief Executives Club of Boston, the National Innovation Initiative, and the Council on Competitiveness.
Mr. Reynolds received a B.S. in Business Administration/Finance from West Virginia University.
Richard B.Worley
Born 1945, Trustee since 2004
Mr. Worley is Managing Partner of Permit Capital LLC, an investment management firm.
Mr. Worley serves as a Trustee of the University of Pennsylvania Medical Center, The Robert Wood Johnson Foundation (a philanthropic organization devoted to health-care issues), and the National Constitution Center. He is also a Director of The Colonial Williamsburg Foundation (a historical preservation organization), and the Philadelphia Orchestra Association. Mr. Worley also serves on the investment committees of Mount Holyoke College and World Wildlife Fund (a wildlife conservation organization).
Prior to joining Permit Capital LLC in 2002, Mr. Worley served as President, Chief Executive Officer, and Chief Investment Officer of Morgan Stanley Dean Witter Investment Management and as a Managing Director of Morgan Stanley, a financial services firm. Mr. Worley also was the Chairman of Miller Anderson & Sherrerd, an investment management firm that was acquired by Morgan Stanley in 1996.
Mr. Worley holds a B.S. degree from the University of Tennessee and pursued graduate studies in economics at the University of Texas.
The address of each Trustee is One Post Office Square, Boston, MA 02109.
As of September 30, 2008, there were 99 Putnam funds. All Trustees serve as Trustees of all Putnam funds. Each Trustee serves for an indefinite term, until his or her resignation, retirement at age 72, death, or removal.
* Trustee who is an “interested person” (as defined in the Investment Company Act of 1940) of the fund, Putnam Management, and/or Putnam Retail Management. Mr. Reynolds is President and Chief Executive Officer of Putnam Investments. Mr. Haldeman is the President of your fund and each of the other Putnam funds and Chairman of Putnam Investment Management, LLC, and prior to July 2008 was President and Chief Executive Officer of Putnam Investments.
40
Officers
In addition to Charles E. Haldeman, Jr., the other officers of the fund are shown below:
| | |
| Charles E. Porter (Born 1938) | James P. Pappas (Born 1953) | Wanda M. McManus (Born 1947) |
| Executive Vice President, Principal Executive | Vice President | Vice President, Senior Associate Treasurer |
| Officer, Associate Treasurer, and | Since 2004 | and Assistant Clerk |
| Compliance Liaison | Managing Director, Putnam Investments and | Since 2005 |
| Since 1989 | Putnam Management. During 2002, Chief | |
| | Operating Officer, Atalanta/Sosnoff | Nancy E. Florek (Born 1957) |
| Jonathan S. Horwitz (Born 1955) | Management Corporation | Vice President, Assistant Clerk, Assistant |
| Senior Vice President and Treasurer | | Treasurer and Proxy Manager |
| Since 2004 | Francis J. McNamara, III (Born 1955) | Since 2005 |
| Prior to 2004, Managing Director, | Vice President and Chief Legal Officer | |
| Putnam Investments | Since 2004 | |
| Senior Managing Director, Putnam | |
| Steven D. Krichmar (Born 1958) | Investments, Putnam Management | |
| Vice President and Principal Financial Officer | and Putnam Retail Management. Prior | |
| Since 2002 | to 2004, General Counsel, State Street | |
| Senior Managing Director, | Research & Management Company | |
| Putnam Investments | | |
| | Robert R. Leveille (Born 1969) | |
| Janet C. Smith (Born 1965) | Vice President and Chief Compliance Officer | |
| Vice President, Principal Accounting Officer | Since 2007 | |
| and Assistant Treasurer | Managing Director, Putnam Investments, | |
| Since 2007 | Putnam Management, and Putnam Retail | |
| Managing Director, Putnam Investments and | Management. Prior to 2004, member of | |
| Putnam Management | Bell Boyd & Lloyd LLC. Prior to 2003, | |
| Vice President and Senior Counsel, | |
| Susan G. Malloy (Born 1957) | Liberty Funds Group LLC | |
| Vice President and Assistant Treasurer | | |
| Since 2007 | Mark C. Trenchard (Born 1962) | |
| Managing Director, Putnam Investments | Vice President and BSA Compliance Officer | |
| Since 2002 | |
| Beth S. Mazor (Born 1958) | Managing Director, Putnam Investments | |
| Vice President | | |
| Since 2002 | Judith Cohen (Born 1945) | |
| Managing Director, Putnam Investments | Vice President, Clerk and Assistant Treasurer | |
| Since 1993 | |
The address of each Officer is One Post Office Square, Boston, MA 02109.
41
The Putnam Family of Funds
The following is a list of Putnam’s open-end mutual funds offered to the public. Investors should carefully consider the investment objective, risks, charges, and expenses of a fund before investing. For a prospectus containing this and other information for any Putnam fund or product, call your financial advisor at 1-800-225-1581 and ask for a prospectus. Please read the prospectus carefully before investing.
Growth funds
Discovery Growth Fund
Growth Opportunities Fund
Health Sciences Trust
International New Opportunities Fund*
New Opportunities Fund
OTC & Emerging Growth Fund
Small Cap Growth Fund*
Vista Fund
Voyager Fund
Blend funds
Capital Appreciation Fund
Capital Opportunities Fund*
Europe Equity Fund*
Global Equity Fund*
Global Natural Resources Fund*
International Capital Opportunities Fund*
International Equity Fund*
Investors Fund
Research Fund
Tax Smart Equity Fund®
Utilities Growth and Income Fund
Value funds
Classic Equity Fund
Convertible Income-Growth Trust
Equity Income Fund
The George Putnam Fund of Boston
The Putnam Fund for Growth and Income
International Growth and Income Fund*
Mid Cap Value Fund
New Value Fund
Small Cap Value Fund*
Income funds
American Government Income Fund
Diversified Income Trust
Floating Rate Income Fund
Global Income Trust*
High Yield Advantage Fund*
High Yield Trust*
Income Fund
Money Market Fund†
U.S. Government Income Trust
Tax-free income funds
AMT-Free Insured Municipal Fund
Tax Exempt Income Fund
Tax Exempt Money Market Fund†
Tax-Free High Yield Fund
State tax-free income funds:
Arizona, California, Massachusetts, Michigan, Minnesota,
New Jersey, New York, Ohio, and Pennsylvania
Asset allocation funds
Income Strategies Fund
Putnam Asset Allocation Funds — three investment portfolios that spread your money across a variety of stocks, bonds, and money market investments.
The three portfolios:
Asset Allocation: Balanced Portfolio
Asset Allocation: Conservative Portfolio
Asset Allocation: Growth Portfolio
Putnam RetirementReady® Funds
Putnam RetirementReady Funds — 10 investment portfolios that offer diversification among stocks, bonds, and money market instruments and adjust to become more conservative over time based on a target date for withdrawing assets.
The 10 funds:
Putnam RetirementReady 2050 Fund
Putnam RetirementReady 2045 Fund
Putnam RetirementReady 2040 Fund
Putnam RetirementReady 2035 Fund
Putnam RetirementReady 2030 Fund
Putnam RetirementReady 2025 Fund
Putnam RetirementReady 2020 Fund
Putnam RetirementReady 2015 Fund
Putnam RetirementReady 2010 Fund
Putnam RetirementReady Maturity Fund
* A 1% redemption fee on total assets redeemed or exchanged within 90 days of purchase may be imposed for all share classes of these funds.
†An investment in a money market fund is not insured or guaranteed by the Federal Deposit Insurance Corporation or any other government agency. Although the fund seeks to preserve the value of your investment at $1.00 per share, it is possible to lose money by investing in the fund.
With the exception of money market funds, a 1% redemption fee may be applied to shares exchanged or sold within 7 days of purchase (90 days, for certain funds).
Check your account balances and the most recent month-end performance in the Individual Investors section at www.putnam.com.
42
Services for shareholders
Investor services
Systematic investment plan Tell us how much you wish to invest regularly — weekly, semimonthly, or monthly — and the amount you choose will be transferred automatically from your checking or savings account. There’s no additional fee for this service, and you can suspend it at any time. This plan may be a great way to save for college expenses or to plan for your retirement.
Please note that regular investing does not guarantee a profit or protect against loss in a declining market. Before arranging a systematic investment plan, consider your financial ability to continue making purchases in periods when prices are low.
Systematic exchange You can make regular transfers from one Putnam fund to another Putnam fund. There are no additional fees for this service, and you can cancel or change your options at any time.
Dividends PLUS You can choose to have the dividend distributions from one of your Putnam funds automatically reinvested in another Putnam fund at no additional charge.
Free exchange privilege You can exchange money between Putnam funds free of charge, as long as they are the same class of shares. A signature guarantee is required if you are exchanging more than $500,000.
Reinstatement privilege If you’ve sold Putnam shares or received a check for a dividend or capital gain, you may reinvest the proceeds with Putnam within 90 days of the transaction and they will be reinvested at the fund’s current net asset value —with no sales charge. However, reinstatement of class B shares may have special tax consequences. Ask your financial or tax representative for details.
Check-writing service You have ready access to many Putnam accounts. It’s as simple as writing a check, and there are no special fees or service charges. For more information about the check-writing service, call Putnam or visit our Web site.
Dollar cost averaging When you’re investing for long-term goals, it’s time, not timing, that counts. Investing on a systematic basis is a better strategy than trying to figure out when the markets will go up or down. This means investing the same amount of money regularly over a long period. This method of investing is called dollar cost averaging. When a fund’s share price declines, your investment dollars buy more shares at lower prices. When it increases, they buy fewer shares. Over time, you will pay a lower average price per share.
For more information
Visit the Individual Investors section at www.putnam.com
A secure section of our Web site contains complete information on your account, including balances and transactions, updated daily. You may also conduct transactions, such as exchanges, additional investments, and address changes. Log on today to get your password.
Call us toll free at 1-800-225-1581 Ask a helpful Putnam representative or your financial advisor for details about any of these or other services, or see your prospectus.
43
Putnam puts your interests first
Putnam has introduced a number of voluntary initiatives designed to reduce fund expenses, provide investors with more useful information, and help safeguard the interests of all Putnam investors. Visit the Individual Investors section at www.putnam.com for details.
Cost-cutting initiatives
Ongoing expenses will be limited
Through calendar 2008, total ongoing expenses, including management fees for all funds, will be maintained at or below the average of each fund’s industry peers in its Lipper load-fund universe. For more information, please see the Statement of Additional information.
Lower class B purchase limit To help ensure that investors are in the most cost-effective share class, the maximum amount that can be invested in class B shares has been reduced to $100,000. (Larger trades or accumulated amounts will be refused.)
Improved disclosure
Putnam fund prospectuses and shareholder reports have been revised to disclose additional information that will help shareholders compare funds and weigh their costs and risks along with their potential benefits. Shareholders will find easy-to-understand information about fund expense ratios, portfolio manager compensation, risk comparisons, turnover comparisons, brokerage commissions, and employee and trustee ownership of Putnam funds. Disclosure of breakpoint discounts has also been enhanced to alert investors to potential cost savings.
Protecting investors’ interests
Short-term trading fee introduced To discourage short-term trading, which can interfere with a fund’s long-term strategy, a 1% short-term trading fee may be imposed on any Putnam fund shares (other than money market funds) redeemed or exchanged within 7 calendar days of purchase (for certain funds, this fee applies for 90 days).
44
Fund information
Founded over 70 years ago, Putnam Investments was built around the concept that a balance between risk and reward is the hallmark of a well-rounded financial program. We manage nearly 100 mutual funds in growth, value, blend, fixed income, and international.
| | |
| Investment Manager | Officers | Judith Cohen |
| Putnam Investment | Charles E. Haldeman, Jr. | Vice President, Clerk and Assistant Treasurer |
| Management, LLC | President | |
| One Post Office Square | | Wanda M. McManus |
| Boston, MA 02109 | Charles E. Porter | Vice President, Senior Associate Treasurer |
| | Executive Vice President, Principal | and Assistant Clerk |
| Marketing Services | Executive Officer, Associate Treasurer | |
| Putnam Retail Management | and Compliance Liaison | Nancy E. Florek |
| One Post Office Square | | Vice President, Assistant Clerk, Assistant |
| Boston, MA 02109 | Jonathan S. Horwitz | Treasurer and Proxy Manager |
| Senior Vice President and Treasurer | |
| Custodian | | |
| State Street Bank and Trust Company | Steven D. Krichmar | |
| | Vice President and Principal Financial Officer | |
| Legal Counsel | | |
| Ropes & Gray LLP | Janet C. Smith | |
| Vice President, Principal Accounting Officer | |
| Independent Registered Public | and Assistant Treasurer | |
| Accounting Firm | | |
| KPMG LLP | Susan G. Malloy | |
| | Vice President and Assistant Treasurer | |
| Trustees | | |
| John A. Hill, Chairman | Beth S. Mazor | |
| Jameson A. Baxter, Vice Chairman | Vice President | |
| Charles B. Curtis | | |
| Robert J. Darretta | James P. Pappas | |
| Myra R. Drucker | Vice President | |
| Charles E. Haldeman, Jr. | | |
| Paul L. Joskow | Francis J. McNamara, III | |
| Elizabeth T. Kennan | Vice President and Chief Legal Officer | |
| Kenneth R. Leibler | | |
| Robert E. Patterson | Robert R. Leveille | |
| George Putnam, III | Vice President and Chief Compliance Officer | |
| Robert L. Reynolds | | |
| Richard B. Worley | Mark C. Trenchard | |
| | Vice President and BSA Compliance Officer | |
| | |
This report is for the information of shareholders of Putnam California Tax Exempt Income Fund. It may also be used as sales literature when preceded or accompanied by the current prospectus, the most recent copy of Putnam’s Quarterly Performance Summary, and Putnam’s Quarterly Ranking Summary. For more recent performance, please visit www.putnam.com. Investors should carefully consider the investment objective, risks, charges, and expenses of a fund, which are described in its prospectus. For this and other information or to request a prospectus, call 1-800-225-1581 toll free. Please read the prospectus carefully before investing. The fund’s Statement of Additional Information contains additional information about the fund’s Trustees and is available without charge upon request by calling 1-800-225-1581.

Item 2. Code of Ethics:
(a) The fund’s principal executive, financial and accounting officers are employees of Putnam Investment Management, LLC, the Fund's investment manager. As such they are subject to a comprehensive Code of Ethics adopted and administered by Putnam Investments which is designed to protect the interests of the firm and its clients. The Fund has adopted a Code of Ethics which incorporates the Code of Ethics of Putnam Investments with respect to all of its officers and Trustees who are employees of Putnam Investment Management, LLC. For this reason, the Fund has not adopted a separate code of ethics governing its principal executive, financial and accounting officers.
(c) In May 2008, the Code of Ethics of Putnam Investment Management, LLC was updated in its entirety to include the amendments adopted in August 2007 as well as a several additional technical, administrative and non-substantive changes.
Item 3. Audit Committee Financial Expert:
The Funds' Audit and Compliance Committee is comprised solely of Trustees who are "independent" (as such term has been defined by the Securities and Exchange Commission ("SEC") in regulations implementing Section 407 of the Sarbanes-Oxley Act (the "Regulations")). The Trustees believe that each of the members of the Audit and Compliance Committee also possess a combination of knowledge and experience with respect to financial accounting matters, as well as other attributes, that qualify them for service on the Committee. In addition, the Trustees have determined that each of Mr. Patterson, Mr. Leibler, Mr. Hill and Mr. Darretta meets the financial literacy requirements of the New York Stock Exchange's rules and qualifies as an "audit committee financial expert" (as such term has been defined by the Regulations) based on their review of his pertinent experience and education. Certain other Trustees, although not on the Audit and Compliance Committee, would also quali fy as "audit committee financial experts." The SEC has stated that the designation or identification of a person as an audit committee financial expert pursuant to this Item 3 of Form N-CSR does not impose on such person any duties, obligations or liability that are greater than the duties, obligations and liability imposed on such person as a member of the Audit and Compliance Committee and the Board of Trustees in the absence of such designation or identification.
Item 4. Principal Accountant Fees and Services:
The following table presents fees billed in each of the last two fiscal years for services rendered to the fund by the fund’s independent auditor:
| | | | | |
| Fiscal | | | Audit- | | |
| year | | Audit | Related | Tax | All Other |
| ended | | Fees | Fees | Fees | Fees |
|
| September 30, 2008 | | $53,100 | $-- | $6,000 | $- |
|
| September 30, 2007 | | $54,050 | $ -- | $5,450 | $ -- |
|
For the fiscal years ended September 30, 2008 and September 30, 2007, the fund’s independent auditor billed aggregate non-audit fees in the amounts of $74,733 and $ 5,450 respectively, to the fund, Putnam Management and any entity controlling, controlled by or under common control with Putnam Management that provides ongoing services to the fund.
Audit Fees represent fees billed for the fund's last two fiscal years relating to the audit and review of the financial statements included in annual reports and registration statements, and other
services that are normally provided in connection with statutory and regulatory filings or engagements.
Audit-Related Fees represent fees billed in the fund’s last two fiscal years for services traditionally performed by the fund’s auditor, including accounting consultation for proposed transactions or concerning financial accounting and reporting standards and other audit or attest services not required by statute or regulation.
Tax Fees represent fees billed in the fund’s last two fiscal years for tax compliance, tax planning and tax advice services. Tax planning and tax advice services include assistance with tax audits, employee benefit plans and requests for rulings or technical advice from taxing authorities.
Pre-Approval Policies of the Audit and Compliance Committee. The Audit and Compliance Committee of the Putnam funds has determined that, as a matter of policy, all work performed for the funds by the funds’ independent auditors will be pre-approved by the Committee itself and thus will generally not be subject to pre-approval procedures.
The Audit and Compliance Committee also has adopted a policy to pre-approve the engagement by Putnam Management and certain of its affiliates of the funds’ independent auditors, even in circumstances where pre-approval is not required by applicable law. Any such requests by Putnam Management or certain of its affiliates are typically submitted in writing to the Committee and explain, among other things, the nature of the proposed engagement, the estimated fees, and why this work should be performed by that particular audit firm as opposed to another one. In reviewing such requests, the Committee considers, among other things, whether the provision of such services by the audit firm are compatible with the independence of the audit firm.
The following table presents fees billed by the fund’s independent auditor for services required to be approved pursuant to paragraph (c)(7)(ii) of Rule 2-01 of Regulation S-X.
| | | | | |
| Fiscal | | Audit- | | All | Total |
| year | | Related | Tax | Other | Non-Audit |
| ended | | Fees | Fees | Fees | Fees |
|
| September 30, 2008 | | $ - | $ - | $ - | $ - |
|
| September 30, 2007 | | $ - | $ - | $ - | $ - |
|
Item 5. Audit Committee of Listed Registrants
Not applicable
Item 6. Schedule of Investments:
The registrant’s schedule of investments in unaffiliated issuers is included in the report to shareholders in Item 1 above.
Item 7. Disclosure of Proxy Voting Policies and Procedures For Closed-End Management Investment Companies:
Not applicable
Item 8. Portfolio Managers of Closed-End Investment Companies
Not Applicable
Item 9. Purchases of Equity Securities by Closed-End Management Investment Companies and Affiliated Purchasers:
Not applicable
Item 10. Submission of Matters to a Vote of Security Holders:
Not applicable
Item 11. Controls and Procedures:
(a) The registrant's principal executive officer and principal financial officer have concluded, based on their evaluation of the effectiveness of the design and operation of the registrant's disclosure controls and procedures as of a date within 90 days of the filing date of this report, that the design and operation of such procedures are generally effective to provide reasonable assurance that information required to be disclosed by the registrant in this report is recorded, processed, summarized and reported within the time periods specified in the Commission's rules and forms.
(b) Changes in internal control over financial reporting: Not applicable
Item 12. Exhibits:
(a)(1) The Code of Ethics of The Putnam Funds, which incorporates the Code of Ethics of Putnam Investments, is filed herewith.
(a)(2) Separate certifications for the principal executive officer and principal financial officer of the registrant as required by Rule 30a-2(a) under the Investment Company Act of 1940, as amended, are filed herewith.
(b) The certifications required by Rule 30a-2(b) under the Investment Company Act of 1940, as amended, are filed herewith.
SIGNATURES
Pursuant to the requirements of the Securities Exchange Act of 1934 and the Investment Company Act of 1940, the registrant has duly caused this report to be signed on its behalf by the undersigned, thereunto duly authorized.
Putnam California Tax Exempt Income Fund
By (Signature and Title):
/s/Janet C. Smith
Janet C. Smith
Principal Accounting Officer
Date: November 26, 2008
Pursuant to the requirements of the Securities Exchange Act of 1934 and the Investment Company Act of 1940, this report has been signed below by the following persons on behalf of the registrant and in the capacities and on the dates indicated.
By (Signature and Title):
/s/Charles E. Porter
Charles E. Porter
Principal Executive Officer
Date: November 26, 2008
By (Signature and Title):
/s/Steven D. Krichmar
Steven D. Krichmar
Principal Financial Officer
Date: November 26, 2008