| | |
| UNITED STATES
SECURITIES AND EXCHANGE COMMISSION |
| | |
| CERTIFIED SHAREHOLDER REPORT OF REGISTERED
MANAGEMENT INVESTMENT COMPANIES
|
| | |
| Investment Company Act file number: | (811-03630) |
| | |
| Exact name of registrant as specified in charter: | Putnam California Tax Exempt Income Fund |
| | |
| Address of principal executive offices: | One Post Office Square, Boston, Massachusetts 02109 |
| | |
| Name and address of agent for service: | Beth S. Mazor, Vice President
One Post Office Square
Boston, Massachusetts 02109 |
| | |
| Copy to: | John W. Gerstmayr, Esq.
Ropes & Gray LLP
800 Boylston Street
Boston, Massachusetts 02199-3600 |
| | |
| Registrant’s telephone number, including area code: | (617) 292-1000 |
| | |
| Date of fiscal year end: | September 30, 2011 |
| | |
| Date of reporting period: | October 1, 2010 — September 30, 2011 |
| | |
|
Item 1. Report to Stockholders: | |
| | |
| The following is a copy of the report transmitted to stockholders pursuant to Rule 30e-1 under the Investment Company Act of 1940: | |
Putnam
California Tax Exempt
Income Fund
Annual report
9 | 30 | 11
| | | |
| Message from the Trustees | 1 | | |
| | |
| About the fund | 2 | | |
| | |
| Performance snapshot | 4 | | |
| | |
| Interview with your fund’s portfolio manager | 5 | | |
| | |
| Your fund’s performance | 11 | | |
| | |
| Your fund’s expenses | 14 | | |
| | |
| Terms and definitions | 16 | | |
| | |
| Trustee approval of management contract | 17 | | |
| | |
| Other information for shareholders | 21 | | |
| | |
| Financial statements | 22 | | |
| | |
| Federal tax information | 49 | | |
| | |
| About the Trustees | 50 | | |
| | |
| Officers | 52 | | |
| | |
Message from the Trustees
Dear Fellow Shareholder:
Markets have reflected a heightened state of investor anxiety in recent weeks and months. The deepening European sovereign debt crisis, the potential for an economic slowdown in the United States, and the deceleration of growth by economic powerhouse China have all diminished investors’ appetite for risk.
While volatility may linger for some time, it is important to note that Putnam’s active portfolio managers continue to pursue investment opportunities around the world. In fact, during times when emotion drives market movements, nimble investors have historically had the best opportunities to take advantage of market inefficiencies.
We believe that in volatile markets, it is important to consult your financial advisor to help determine whether your portfolio reflects an appropriate degree of diversification. We also note that Putnam continues to bolster its lineup of funds that seek to limit volatility or guard against downside risk.
We would like to thank John A. Hill, who has served as Chairman of the Trustees since 2000 and who continues on as a Trustee, for his service. We are pleased to announce that Jameson A. Baxter is the new Chair, having served as Vice Chair since 2005 and a Trustee since 1994. Ms. Baxter is President of Baxter Associates, Inc., a private investment firm, and Chair of the Mutual Fund Directors Forum. In addition, she serves as Chair Emeritus of the Board of Trustees of Mount Holyoke College, Director of the Adirondack Land Trust, and Trustee of the Nature Conservancy’s Adirondack Chapter.
Lastly, we would like to take this opportunity to welcome new shareholders to the fund and to thank all of our investors for your continued confidence in Putnam.

About the fund
Potential for tax-advantaged high current income

When investing in tax-exempt bonds, opportunities come in all shapes and sizes. This is especially true for Putnam California Tax Exempt Income Fund, which explores the vast California municipal bond market, investing across a range of market sectors.
Municipal bonds can help investors keep more of their investment income while also financing important public projects such as schools, roads, and hospitals. Municipal bonds are typically issued by states and local municipalities, and they offer income that is generally exempt from federal income tax.
For residents of the state where the bond is issued, income is typically exempt from state and local income taxes as well. While the stated yields on municipal bonds are usually lower than those on taxable bonds, state tax exemption is a powerful advantage because state income tax can erode investment income significantly.
The fund combines bonds of differing credit quality to increase income potential. In addition to investing in high-quality bonds, the fund’s managers allocate a smaller portion of the portfolio to lower-rated bonds, which may offer higher income in return for more risk. When deciding whether to invest in a bond, the managers carefully consider the risks involved, including credit risk, interest-rate risk, and the risk that the bond will be prepaid.
The fund is backed by the resources of Putnam’s fixed-income organization, in which bond analysts conduct ongoing, rigorous research. Once a bond has been purchased, the managers continue to monitor developments that may affect the bond market, the sector, and the issuer of the bond.
The goal of their in-depth research and active management is to stay a step ahead of the industry and pinpoint opportunities for investors.
Consider these risks before investing: Investments in a single state carry risks of vulnerability to common economic forces and other factors affecting the state’s tax-exempt investments, which may result in greater losses and volatility. Capital gains, if any, are taxable for federal and, in most cases, state purposes. For some investors, investment income may be subject to the federal alternative minimum tax. Funds that invest in bonds are subject to certain risks including interest-rate risk, credit risk, and inflation risk. As interest rates rise, the prices of bonds fall. Long-term bonds are more exposed to interest-rate risk than short-term bonds. Unlike bonds, bond funds have ongoing fees and expenses. The fund may invest significantly in particular segments of the tax-exempt debt market, making it more vulnerable to fluctuations in the values of the securities it holds than a fund that invests more broadly.
Understanding tax-equivalent yield
To understand the value of tax-free income, it is helpful to compare a municipal bond’s yield with the “tax-equivalent yield” — the before-tax yield that must be offered by a taxable bond in order to equal the municipal bond’s yield after taxes.
How to calculate tax-equivalent yield:
The tax-equivalent yield equals the municipal bond’s yield divided by “one minus the tax rate.” For example, if a municipal bond’s yield is 5%, then its tax-equivalent yield is 7.7%, assuming the maximum 35% federal tax rate for 2011.
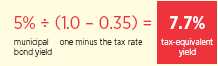
Results for investors subject to lower tax rates would not be as advantageous.

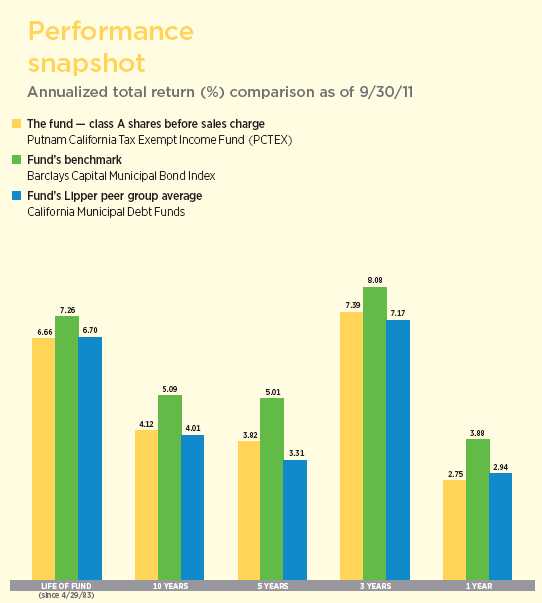
Current performance may be lower or higher than the quoted past performance, which cannot guarantee future results. Share price, principal value, and return will fluctuate, and you may have a gain or a loss when you sell your shares. Performance of class A shares assumes reinvestment of distributions and does not account for taxes. Fund returns in the bar chart do not reflect a sales charge of 4.00%; had they, returns would have been lower. See pages 5 and 11–13 for additional performance information. For a portion of the periods, the fund had expense limitations, without which returns would have been lower. To obtain the most recent month-end performance, visit putnam.com.
4
Interview with your fund’s portfolio manager
Thalia Meehan, CFA
Municipal bonds were frequently in the news during the past 12 months. How would you describe the investment environment?
Although the end result for shareholders was positive, the past year has been one of the more volatile periods for municipal bonds in recent memory, beginning in November 2010, when a number of factors combined to create significant headwinds for the market.
First, the Federal Reserve announced it would purchase $600 billion in Treasury bonds over a period of several months in a second round of quantitative easing measures, known as “QE2,” designed in part to keep yields low and encourage investor risk-taking. In theory, this move should have caused government bond yields to fall. But, in fact, the widely anticipated QE2 announcement had already been priced in and investors responded by selling their positions in Treasuries. This sent yields higher and, in turn, put pressure on interest rates in the municipal bond market.
Second, as the end of 2010 approached, investor uncertainty grew over the possibility of pending tax-rate increases and the expiration of the Build America Bonds, or “BABs,” program, which for the past two years had played a key role in lending stability to the municipal bond market. This uncertainty, coupled with dire media coverage of state budget challenges and predictions of widespread defaults, led to a broad sell-off in municipal bonds as investors pulled money out of the asset class.
As 2011 progressed, however, the municipal bond market gained back a good deal of what it lost in the fourth quarter. Widespread defaults did not materialize, and in fact remained quite low relative to their historical average. States continued to face challenges in balancing their budgets, but by the end
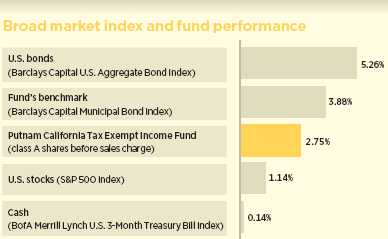
This comparison shows your fund’s performance in the context of broad market indexes for the 12 months ended 9/30/11. See pages 4 and 11–13 for additional fund performance information. Index descriptions can be found on page 16.
5
of the period all state legislatures that were slated to enact budgets had done so, including California, which passed its budget on time for the first time in years. Income tax receipts also generally have begun to modestly improve versus last year. As investors ultimately realized that municipal credit conditions were not nearly as bleak as some feared, they re-entered the municipal market.
The fund’s returns during its fiscal year trailed those of its benchmark, although the fund’s performance generally was in line with its Lipper peer group average.
What effect did recent policy debates have on the tax-exempt bond market?
It was a very eventful period from a policy perspective. First, the popular BABs program expired at the end of 2010. BABs are taxable municipal bonds that carry special tax credits and federal subsidies for the states and local governments that issue them, which resulted in substantial savings on borrowing costs. Issuers in all 50 states participated in the BABs program, and, despite some speculation that the program might be extended, it was allowed to expire on December 31, 2010.
The expiration of the BABs program caused a significant spike in municipal bond supply at the end of 2010. To lock in the federal subsidy BABs offered, many states pushed up issuance originally slated for the first quarter of 2011 into the fourth quarter of 2010. Because excess supply can lead to lower prices when demand fails to keep pace, some investors worried that the unusually high issuance at the end of 2010 would continue in the tax-free market in 2011, undermining price stability. However, tax-free issuance year to date in 2011 has been even lower than expected, which helped to provide price stability to the market.
Speculation about changes to tax policy also affected the market. At the end of 2010, the Bush-era tax cuts were slated to expire, and
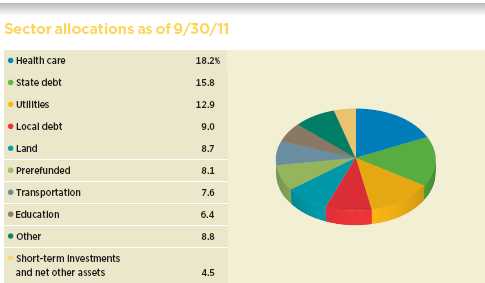
Allocations are represented as a percentage of the fund’s net assets. Summary information may differ from the portfolio schedule included in the financial statements due to the inclusion of derivative securities and the exclusion of as-of trades, if any. Holdings and allocations may vary over time.
6
it was unclear for several weeks whether Congress would pass legislation to extend current federal income tax rates. Eventually, a bill was passed in December to preserve current tax rates through the end of 2012, but taxes have remained a part of political discussions all year.

More recently, the 12-member “super committee,” created through August’s debt ceiling legislation, has been tasked with reducing the deficit by at least $1.2 trillion. Recommendations from this committee are due to Congress by November 23, and a vote by lawmakers is scheduled to take place by December 23. If legislators fail to cut spending by $1.2 trillion over the next 10 years, automatic across-the-board cuts would be implemented to make up the difference. Expenditure cuts, whether negotiated or automatic, could have an impact on the municipal bond market.
On the revenue side, there have been proposals for the deficit reduction plan that also could impact the municipal bond market. Simplification of the tax code is one possibility, with potential changes to a number of the existing marginal rates, which would affect the relative attractiveness of municipal bonds. While it is difficult to determine the eventual outcome of the super committee’s deliberations, the future tax treatment of municipal bonds will likely be a “tax expenditure” that will receive a significant amount of scrutiny. We believe the likelihood of eliminating municipal bonds’ tax-exempt status is low. It is possible that some types
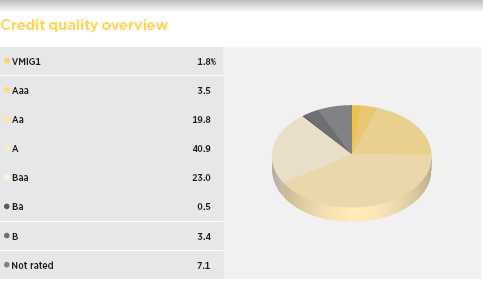
Credit qualities are shown as a percentage of net assets as of 9/30/11. A bond rated Baa or higher (MIG3/VMIG3 or higher, for short-term debt) is considered investment grade. The chart reflects Moody’s ratings; percentages may include bonds or derivatives not rated by Moody’s but rated by Standard & Poor’s or, if unrated by S&P, by Fitch, and then included in the closest equivalent Moody’s rating. Ratings will vary over time. Credit qualities are included for portfolio securities and are not included for derivative instruments and cash. The fund itself has not been rated by an independent rating agency.
7
of bonds, such as so-called “private activity” bonds, might lose their ability to issue in the tax-exempt market in the future. In any case, it appears highly likely that state and local governments will face continued pressure as debate over the deficit reduction continues, and this increases the possibility of headline-driven price volatility.
In August, Standard & Poor’s downgraded its credit rating for U.S. Treasuries and a number of municipal bonds. What impact did that have on the market?
On the heels of its August 5 downgrade of U.S. sovereign debt, Standard & Poor’s [S&P] lowered its ratings from AAA to AA+ for more than 11,000 municipal securities, including taxable and tax-exempt securities. While this number does seem large, it covers less than 1% of the $3 trillion municipal bond market. These securities all had links to the federal government, and, according to S&P, the affected issues fall into four broad categories: municipal housing bonds backed by the federal government or invested in U.S. government securities; bonds of certain government-related entities in the housing and public power sectors; bonds backed by federal leases; and defeased bonds secured by U.S. Treasury and agency securities in escrow.
The downgrade was not surprising given the interdependence of state and federal finances, and S&P had been suggesting such a move was imminent for some time. To date, state general-obligation, or “G.O.,” bond ratings were unchanged; 13 states continue to hold AAA ratings. Nonetheless, we believe S&P’s downgrades underscore the importance of performing intensive fundamental research when investing in the municipal bond market. At Putnam, we independently research every bond we hold and assess the
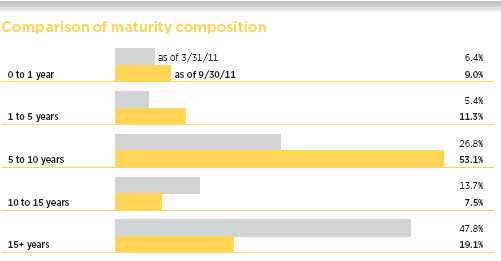
This chart illustrates the fund’s composition by maturity, showing the percentage of holdings in different maturity ranges and how the composition has changed over the past six months. Holdings and maturity ranges will vary over time. The effective maturity dates of bonds with call features may change as a result of market conditions.
8
credit risk it represents before we add it to the portfolio.
How did you position the portfolio during the fund’s fiscal year?
For much of the period, our strategy was to position the portfolio for improving fundamentals in the municipal bond market. While we felt that the budget challenges faced by many states were significant, we were confident that conditions would improve as long as the broad economy did not stall.
Against this backdrop, we believed that essential service revenue bonds remained attractive, while we continued to limit the fund’s exposure to local G.O.s, which are securities issued at the city or county level. We believe that as the federal government looks to reduce transfer payments to the states — and as states, in turn, seek to close their deficits by reducing spending — these types of bonds are at risk for downgrades or other headline-driven price volatility. And unlike state general obligation bonds, local G.O.s rely more on property tax revenue than on income or sales taxes. With real estate prices still under pressure in many markets, property taxes have been slower to recover than other tax sources.
From a credit perspective, we held an overweight position in A- and Baa-rated securities versus the fund’s benchmark, which contributed positively to relative returns. In terms of sectors, we positioned the fund in California state G.O.s, higher education, power, and health care, specifically hospitals.
What is your outlook?
While technical factors in the market have been positive — specifically, light supply and stable demand — uncertainty remains. We believe that states will continue to face financial challenges as the economy struggles to find its footing. For the most part, however, we believe that the fiscal conditions of states and municipalities are showing signs of improvement. Tax receipts are beginning to improve, albeit slowly, and we believe defaults will remain relatively low.
Our concerns remain focused on the economy and Congress’s plans to reduce the deficit. Higher federal income tax rates, a change in the tax status of municipal bonds, or significant cuts in state funding all would have consequences for the municipal bond market. But for investors with longer time horizons, we believe that our actively managed approach remains a prudent way to diversify holdings and generate tax-exempt income in the municipal bond market.
Thank you, Thalia, for bringing us up to date.
The views expressed in this report are exclusively those of Putnam Management and are subject to change. They are not meant as investment advice.
Please note that the holdings discussed in this report may not have been held by the fund for the entire period. Portfolio composition is subject to review in accordance with the fund’s investment strategy and may vary in the future. Current and future portfolio holdings are subject to risk.

Portfolio Manager Thalia Meehan holds a B.A. from Williams College. A CFA charterholder, Thalia joined Putnam in 1989 and has been in the investment industry since 1983.
In addition to Thalia, your fund’s portfolio managers are Paul Drury and Susan McCormack.
9
IN THE NEWS
U.S. corporations are holding more cash on their books than at any time in nearly 50 years. At the end of June, non-financial companies held more than $2 trillion in cash and other liquid assets, according to the Federal Reserve (the Fed). This marks an increase of more than $88 billion since the end of March. Cash accounted for 7.1% of all company assets, according to the Fed, the highest level since 1963. The Fed’s analysis does not include the substantial amount of cash that U.S. companies hold overseas. While critics are putting pressure on companies to use the cash to invest or create more jobs, others say the sizeable cash holdings could provide an important buffer for U.S. companies if European bank woes should spark a global financial crisis.
10
Your fund’s performance
This section shows your fund’s performance, price, and distribution information for periods ended September 30, 2011, the end of its most recent fiscal year. In accordance with regulatory requirements for mutual funds, we also include expense information taken from the fund’s current prospectus. Performance should always be considered in light of a fund’s investment strategy. Data represent past performance. Past performance does not guarantee future results. More recent returns may be less or more than those shown. Investment return and principal value will fluctuate, and you may have a gain or a loss when you sell your shares. Performance information does not reflect any deduction for taxes a shareholder may owe on fund distributions or on the redemption of fund shares. For the most recent month-end performance, please visit the Individual Investors section at putnam.com or call Putnam at 1-800-225-1581. Class Y shares are not available to all investors. See the Terms and Definitions section in this report for definitions of the share classes offered by your fund.
Fund performance Total return for periods ended 9/30/11
| | | | | | | | | |
| | Class A | Class B | Class C | Class M | Class Y |
| (inception dates) | (4/29/83) | (1/4/93) | (7/26/99) | (2/14/95) | (1/2/08) |
|
| | Before | After | | | | | Before | After | Net |
| | sales | sales | Before | After | Before | After | sales | sales | asset |
| | charge | charge | CDSC | CDSC | CDSC | CDSC | charge | charge | value |
|
| Annual average | | | | | | | | | |
| (life of fund) | 6.66% | 6.51% | 5.89% | 5.89% | 5.81% | 5.81% | 6.26% | 6.13% | 6.70% |
|
| 10 years | 49.74 | 43.66 | 40.56 | 40.56 | 38.40 | 38.40 | 45.38 | 40.58 | 51.33 |
| Annual average | 4.12 | 3.69 | 3.46 | 3.46 | 3.30 | 3.30 | 3.81 | 3.46 | 4.23 |
|
| 5 years | 20.60 | 15.77 | 16.96 | 15.05 | 16.06 | 16.06 | 18.87 | 14.89 | 21.88 |
| Annual average | 3.82 | 2.97 | 3.18 | 2.84 | 3.02 | 3.02 | 3.52 | 2.81 | 4.04 |
|
| 3 years | 23.86 | 18.98 | 21.67 | 18.67 | 21.11 | 21.11 | 22.85 | 18.92 | 24.80 |
| Annual average | 7.39 | 5.96 | 6.76 | 5.87 | 6.59 | 6.59 | 7.10 | 5.95 | 7.66 |
|
| 1 year | 2.75 | –1.32 | 2.24 | –2.66 | 1.95 | 0.97 | 2.45 | –0.88 | 2.99 |
|
Current performance may be lower or higher than the quoted past performance, which cannot guarantee future results. After-sales-charge returns for class A and M shares reflect the deduction of the maximum 4.00% and 3.25% sales charge, respectively, levied at the time of purchase. Class B share returns after contingent deferred sales charge (CDSC) reflect the applicable CDSC, which is 5% in the first year, declining over time to 1% in the sixth year, and is eliminated thereafter. Class C share returns after CDSC reflect a 1% CDSC for the first year that is eliminated thereafter. Class Y shares have no initial sales charge or CDSC. Performance for class B, C, M, and Y shares before their inception is derived from the historical performance of class A shares, adjusted for the applicable sales charge (or CDSC) and the higher operating expenses for such shares, except for class Y shares, for which 12b-1 fees are not applicable.
For a portion of the periods, the fund had expense limitations, without which returns would have been lower.
Class B share performance does not reflect conversion to class A shares.
11
Comparative index returns For periods ended 9/30/11
| | |
| | Barclays Capital | Lipper California Municipal Debt Funds |
| | Municipal Bond Index | category average* |
|
| Annual average (life of fund) | 7.26% | 6.70% |
|
| 10 years | 64.31 | 48.42 |
| Annual average | 5.09 | 4.01 |
|
| 5 years | 27.71 | 17.87 |
| Annual average | 5.01 | 3.31 |
|
| 3 years | 26.24 | 23.10 |
| Annual average | 8.08 | 7.17 |
|
| 1 year | 3.88 | 2.94 |
|
Index and Lipper results should be compared with fund performance before sales charge, before CDSC, or at net asset value.
* Over the 1-year, 3-year, 5-year, 10-year, and life-of-fund periods ended 9/30/11, there were 115, 111, 98, 78, and 3 funds, respectively, in this Lipper category.
Past performance does not indicate future results. At the end of the same time period, a $10,000 investment in the fund’s class B and class C shares would have been valued at $14,056 and $13,840 respectively, and no contingent deferred sales charges would apply. A $10,000 investment in the fund’s class M shares ($9,675 after sales charge) would have been valued at $14,058. A $10,000 investment in the fund’s class Y shares would have been valued at $15,133.
12
Fund price and distribution information For the 12-month period ended 9/30/11
| | | | | | | |
| Distributions | Class A | Class B | Class C | Class M | Class Y |
|
| Number | 12 | 12 | 12 | 12 | 12 |
|
| Income 1 | $0.358774 | $0.310545 | $0.299858 | $0.336981 | $0.375557 |
|
| Capital gains 2 | —�� | — | — | — | — |
|
| Total | $0.358774 | $0.310545 | $0.299858 | $0.336981 | $0.375557 |
|
| | Before | After | Net | Net | Before | After | Net |
| | sales | sales | asset | asset | sales | sales | asset |
| Share value | charge | charge | value | value | charge | charge | value |
|
| 9/30/10 | $7.99 | $8.32 | $7.98 | $8.03 | $7.97 | $8.24 | $8.01 |
|
| 9/30/11 | 7.83 | 8.16 | 7.83 | 7.87 | 7.81 | 8.07 | 7.85 |
|
| | Before | After | Net | Net | Before | After | Net |
| | sales | sales | asset | asset | sales | sales | asset |
| Current yield (end of period) | charge | charge | value | value | charge | charge | value |
|
| Current dividend rate 3 | 4.56% | 4.37% | 3.93% | 3.75% | 4.29% | 4.15% | 4.76% |
|
| Taxable equivalent 4 | 7.82% | 7.50% | 6.74% | 6.43% | 7.36% | 7.12% | 8.16% |
|
| Current 30-day SEC yield 5 | N/A | 3.83% | 3.36% | 3.22% | N/A | 3.60% | 4.21% |
|
| Taxable equivalent 4 | N/A | 6.57% | 5.76% | 5.52% | N/A | 6.17% | 7.22% |
|
The classification of distributions, if any, is an estimate. Before-sales-charge share value and current dividend rate for class A and M shares, if applicable, do not take into account any sales charge levied at the time of purchase. After-sales-charge share value, current dividend rate, and current 30-day SEC yield, if applicable, are calculated assuming that the maximum sales charge (4.00% for class A shares and 3.25% for class M shares) was levied at the time of purchase. Final distribution information will appear on your year-end tax forms.
1 For some investors, investment income may be subject to the federal alternative minimum tax.
2 Capital gains, if any, are taxable for federal and, in most cases, state purposes.
3 Most recent distribution, excluding capital gains, annualized and divided by share price before or after sales charge at period-end.
4 Assumes maximum 41.70% federal and state combined tax rate for 2011. Results for investors subject to lower tax rates would not be as advantageous.
5 Based only on investment income and calculated using the maximum offering price for each share class, in accordance with SEC guidelines.
13
Your fund’s expenses
As a mutual fund investor, you pay ongoing expenses, such as management fees, distribution fees (12b-1 fees), and other expenses. Using the following information, you can estimate how these expenses affect your investment and compare them with the expenses of other funds. You may also pay one-time transaction expenses, including sales charges (loads) and redemption fees, which are not shown in this section and would have resulted in higher total expenses. For more information, see your fund’s prospectus or talk to your financial representative.
Expense ratios
| | | | | |
| | Class A | Class B | Class C | Class M | Class Y |
|
| Total annual operating expenses for the fiscal year | | | | | |
| ended 9/30/10* | 0.75% | 1.38% | 1.53% | 1.03% | 0.53% |
|
| Annualized expense ratio for the six-month period | | | | | |
| ended 9/30/11† | 0.75% | 1.38% | 1.53% | 1.03% | 0.53% |
|
Fiscal-year expense information in this table is taken from the most recent prospectus, is subject to change, and may differ from that shown for the annualized expense ratio and in the financial highlights of this report. Expenses are shown as a percentage of average net assets.* Restated to reflect projected expenses under a management contract effective 1/1/10.
† For the fund’s most recent fiscal half year; may differ from expense ratios based on one-year data in the financial highlights.
Expenses per $1,000
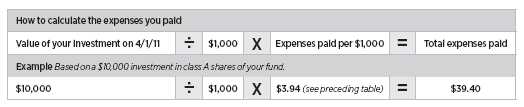
The following table shows the expenses you would have paid on a $1,000 investment in the fund from April 1, 2011, to September 30, 2011. It also shows how much a $1,000 investment would be worth at the close of the period, assuming actual returns and expenses.
| | | | | |
| | Class A | Class B | Class C | Class M | Class Y |
|
| Expenses paid per $1,000*† | $3.94 | $7.25 | $8.03 | $5.41 | $2.79 |
|
| Ending value (after expenses) | $1,098.20 | $1,096.20 | $1,094.80 | $1,096.80 | $1,100.60 |
|
* Expenses for each share class are calculated using the fund’s annualized expense ratio for each class, which represents the ongoing expenses as a percentage of average net assets for the six months ended 9/30/11. The expense ratio may differ for each share class.
† Expenses are calculated by multiplying the expense ratio by the average account value for the period; then multiplying the result by the number of days in the period; and then dividing that result by the number of days in the year.
14
Estimate the expenses you paid
To estimate the ongoing expenses you paid for the six months ended September 30, 2011, use the following calculation method. To find the value of your investment on April 1, 2011, call Putnam at 1-800-225-1581.
Compare expenses using the SEC’s method
The Securities and Exchange Commission (SEC) has established guidelines to help investors assess fund expenses. Per these guidelines, the following table shows your fund’s expenses based on a $1,000 investment, assuming a hypothetical 5% annualized return. You can use this information to compare the ongoing expenses (but not transaction expenses or total costs) of investing in the fund with those of other funds. All mutual fund shareholder reports will provide this information to help you make this comparison. Please note that you cannot use this information to estimate your actual ending account balance and expenses paid during the period.
| | | | | |
| | Class A | Class B | Class C | Class M | Class Y |
|
| Expenses paid per $1,000*† | $3.80 | $6.98 | $7.74 | $5.22 | $2.69 |
|
| Ending value (after expenses) | $1,021.31 | $1,018.15 | $1,017.40 | $1,019.90 | $1,022.41 |
|
* Expenses for each share class are calculated using the fund’s annualized expense ratio for each class, which represents the ongoing expenses as a percentage of average net assets for the six months ended 9/30/11. The expense ratio may differ for each share class.
† Expenses are calculated by multiplying the expense ratio by the average account value for the period; then multiplying the result by the number of days in the period; and then dividing that result by the number of days in the year.
15
Terms and definitions
Important terms
Total return shows how the value of the fund’s shares changed over time, assuming you held the shares through the entire period and reinvested all distributions in the fund.
Before sales charge, or net asset value, is the price, or value, of one share of a mutual fund, without a sales charge. Before-sales-charge figures fluctuate with market conditions, and are calculated by dividing the net assets of each class of shares by the number of outstanding shares in the class.
After sales charge is the price of a mutual fund share plus the maximum sales charge levied at the time of purchase. After-sales-charge performance figures shown here assume the 4.00% maximum sales charge for class A shares and 3.25% for class M shares.
Contingent deferred sales charge (CDSC) is generally a charge applied at the time of the redemption of class B or C shares and assumes redemption at the end of the period. Your fund’s class B CDSC declines from a 5% maximum during the first year to 1% during the sixth year. After the sixth year, the CDSC no longer applies. The CDSC for class C shares is 1% for one year after purchase.
Current yield is the annual rate of return earned from dividends or interest of an investment. Current yield is expressed as a percentage of the price of a security, fund share, or principal investment.
Share classes
Class A shares are generally subject to an initial sales charge and no CDSC (except on certain redemptions of shares bought without an initial sales charge).
Class B shares are not subject to an initial sales charge. They may be subject to a CDSC.
Class C shares are not subject to an initial sales charge and are subject to a CDSC only if the shares are redeemed during the first year.
Class M shares have a lower initial sales charge and a higher 12b-1 fee than class A shares and no CDSC.
Class Y shares are not subject to an initial sales charge or CDSC, and carry no 12b-1 fee. They are generally only available to corporate and institutional clients and clients in other approved programs.
Comparative indexes
Barclays Capital U.S. Aggregate Bond Index is an unmanaged index of U.S. investment-grade fixed-income securities.
Barclays Capital Municipal Bond Index is an unmanaged index of long-term fixed-rate investment-grade tax-exempt bonds.
BofA (Bank of America) Merrill Lynch U.S. 3-Month Treasury Bill Index is an unmanaged index that seeks to measure the performance of U.S. Treasury bills available in the marketplace.
S&P 500 Index is an unmanaged index of common stock performance.
Indexes assume reinvestment of all distributions and do not account for fees. Securities and performance of a fund and an index will differ. You cannot invest directly in an index.
Lipper is a third-party industry-ranking entity that ranks mutual funds. Its rankings do not reflect sales charges. Lipper rankings are based on total return at net asset value relative to other funds that have similar current investment styles or objectives as determined by Lipper. Lipper may change a fund’s category assignment at its discretion. Lipper category averages reflect performance trends for funds within a category.
16
Trustee approval of management contract
General conclusions
The Board of Trustees of the Putnam funds oversees the management of each fund and, as required by law, determines annually whether to approve the continuance of your fund’s management contract with Putnam Investment Management (“Putnam Management”) and the sub-management contract with respect to your fund between Putnam Management and its affiliate, Putnam Investments Limited (“PIL”).
The Board of Trustees, with the assistance of its Contract Committee, which consists solely of Trustees who are not “interested persons” (as this term is defined in the Investment Company Act of 1940, as amended) of the Putnam funds (“Independent Trustees”), requests and evaluates all information it deems reasonably necessary under the circumstances in connection with its annual contract review. Over the course of several months ending in June 2011, the Contract Committee met on a number of occasions with representatives of Putnam Management, and separately in executive session, to consider the information that Putnam Management provided and other information developed with the assistance of the Board’s independent counsel and independent staff. The Contract Committee reviewed and discussed key aspects of this information with all of the Independent Trustees on a number of occasions. At the Trustees’ June 17, 2011 meeting, the Contract Committee recommended, and the Independent Trustees approved, the continuance of your fund’s management and sub-management contracts, effective July 1, 2011. (Because PIL is an affiliate of Putnam Management and Putnam Management remains fully responsible for all services provided by PIL, the Trustees have not evaluated PIL as a separate entity, and all subsequent references to Putnam Management below should be deemed to include reference to PIL as necessary or appropriate in the context.)
The Independent Trustees’ approval was based on the following conclusions:
• That the fee schedule in effect for your fund represented reasonable compensation in light of the nature and quality of the services being provided to the fund, the fees paid by competitive funds, and the costs incurred by Putnam Management in providing services, and
• That the fee schedule represented an appropriate sharing between fund shareholders and Putnam Management of such economies of scale as may exist in the management of the fund at current asset levels.
These conclusions were based on a comprehensive consideration of all information provided to the Trustees and were not the result of any single factor. Some of the factors that figured particularly in the Trustees’ deliberations and how the Trustees considered these factors are described below, although individual Trustees may have evaluated the information presented differently, giving different weights to various factors. It is also important to recognize that the management arrangements for your fund and the other Putnam funds are the result of many years of review and discussion between the Independent Trustees and Putnam Management, that some aspects of the arrangements may receive greater scrutiny in some years than others, and that the Trustees’ conclusions may be based, in part, on their consideration of fee arrangements in previous years.
Management fee schedules and total expenses
The Trustees reviewed the management fee schedules in effect for all Putnam funds, including fee levels and breakpoints. In reviewing management fees, the Trustees
17
generally focus their attention on material changes in circumstances — for example, changes in assets under management or investment style, changes in Putnam Management’s operating costs, or changes in competitive practices in the mutual fund industry — that suggest that consideration of fee changes might be warranted. The Trustees concluded that the circumstances did not warrant changes to the management fee structure of your fund.
Most of the open-end Putnam funds have new management contracts, with new fee schedules reflecting the implementation of more competitive fee levels for many funds, complex-wide breakpoints for the open-end funds, and performance fees for some funds. These new management contracts have been in effect for a little over a year — since January or, for a few funds, February, 2010. The Trustees approved the new management contracts on July 10, 2009, and fund shareholders subsequently approved the contracts by overwhelming majorities of the shares voted.
Because these management contracts had been implemented only recently, the Contract Committee had limited practical experience with the operation of the new fee structures. Under its new management contract, your fund has the benefit of breakpoints in its management fee that provide shareholders with significant economies of scale in the form of reduced fee levels as assets under management in the Putnam family of funds increase. The Contract Committee observed that the complex-wide breakpoints of the open-end funds had only been in place for a short while, and the Trustees will examine the operation of this new breakpoint structure in future years in light of further experience.
As in the past, the Trustees also focused on the competitiveness of each fund’s total expense ratio. In order to ensure that expenses of the Putnam funds continue to meet evolving competitive standards, the Trustees and Putnam Management agreed in 2009 to implement certain expense limitations. These expense limitations serve in particular to maintain competitive expense levels for funds with large numbers of small shareholder accounts and funds with relatively small net assets. Most funds, including your fund, had sufficiently low expenses that these expense limitations did not apply. The expense limitations were: (i) a contractual expense limitation applicable to all retail open-end funds of 37.5 basis points on investor servicing fees and expenses and (ii) a contractual expense limitation applicable to all open-end funds of 20 basis points on so-called “other expenses” (i.e., all expenses exclusive of management fees, investor servicing fees, distribution fees, investment-related expenses, interest, taxes, brokerage commissions and extraordinary expenses). Putnam Management’s support for these expense limitations was an important factor in the Trustees’ decision to approve the continuance of your fund’s management and sub-management contracts.
The Trustees reviewed comparative fee and expense information for a custom group of competitive funds selected by Lipper Inc. This comparative information included your fund’s percentile ranking for effective management fees and total expenses (excluding any applicable 12b-1 fee), which provides a general indication of your fund’s relative standing. In the custom peer group, your fund ranked in the 2nd quintile in effective management fees (determined for your fund and the other funds in the custom peer group based on fund asset size and the applicable contractual management fee schedule) and in the 2nd quintile in total expenses (excluding any applicable 12b-1 fees) as of December 31, 2010 (the first quintile representing the least expensive funds and the fifth quintile the most expensive funds). The fee and expense data reported by Lipper as of December 31, 2010 reflected the most
18
recent fiscal year-end data available in Lipper’s database at that time.
In connection with their review of the management fees and total expenses of the Putnam funds, the Trustees also reviewed the costs of the services provided and the profits realized by Putnam Management and its affiliates from their contractual relationships with the funds. This information included trends in revenues, expenses and profitability of Putnam Management and its affiliates relating to the investment management, investor servicing and distribution services provided to the funds. In this regard, the Trustees also reviewed an analysis of Putnam Management’s revenues, expenses and profitability, allocated on a fund-by-fund basis, with respect to the funds’ management, distribution, and investor servicing contracts. For each fund, the analysis presented information about revenues, expenses and profitability for each of the agreements separately and for the agreements taken together on a combined basis. The Trustees concluded that, at current asset levels, the fee schedules in place represented reasonable compensation for the services being provided and represented an appropriate sharing of such economies of scale as may exist in the management of the funds at that time.
The information examined by the Trustees as part of their annual contract review for the Putnam funds has included for many years information regarding fees charged by Putnam Management and its affiliates to institutional clients such as defined benefit pension plans, college endowments, and the like. This information included comparisons of those fees with fees charged to the funds, as well as an assessment of the differences in the services provided to these different types of clients. The Trustees observed that the differences in fee rates between institutional clients and mutual funds are by no means uniform when examined by individual asset sectors, suggesting that differences in the pricing of investment management services to these types of clients may reflect historical competitive forces operating in separate markets. The Trustees considered the fact that in many cases fee rates across different asset classes are higher on average for mutual funds than for institutional clients, as well as the differences between the services that Putnam Management provides to the Putnam funds and those that it provides to its institutional clients. The Trustees did not rely on these comparisons to any significant extent in concluding that the management fees paid by your fund are reasonable.
Investment performance
The quality of the investment process provided by Putnam Management represented a major factor in the Trustees’ evaluation of the quality of services provided by Putnam Management under your fund’s management contract. The Trustees were assisted in their review of the Putnam funds’ investment process and performance by the work of several investment oversight committees of the Trustees, which met on a regular basis with the funds’ portfolio teams and with the Chief Investment Officer and other members of Putnam Management’s Investment Division throughout the year. The Trustees concluded that Putnam Management generally provides a high-quality investment process — based on the experience and skills of the individuals assigned to the management of fund portfolios, the resources made available to them, and in general Putnam Management’s ability to attract and retain high-quality personnel — but also recognized that this does not guarantee favorable investment results for every fund in every time period. The Trustees considered the investment performance of each fund over multiple time periods and considered information comparing each fund’s performance with various benchmarks and with the performance of competitive funds.
19
The Committee noted the substantial improvement in the performance of most Putnam funds during the 2009–2010 period and Putnam Management’s ongoing efforts to strengthen its investment personnel and processes. The Committee also noted the disappointing investment performance of some funds for periods ended December 31, 2010 and considered information provided by Putnam Management regarding the factors contributing to the underperformance and actions being taken to improve the performance of these particular funds. The Trustees indicated their intention to continue to monitor performance trends to assess the effectiveness of these efforts and to evaluate whether additional actions to address areas of underperformance are warranted.
In the case of your fund, the Trustees considered that its class A share cumulative total return performance at net asset value was in the following quartiles of its Lipper Inc. peer group (Lipper California Municipal Debt Funds) for the one-year, three-year and five-year periods ended December 31, 2010 (the first quartile representing the best-performing funds and the fourth quartile the worst-performing funds):
| | | |
| One-year period | 1st | | |
| | |
| Three-year period | 2nd | | |
| | |
| Five-year period | 2nd | | |
| | |
Over the one-year, three-year and five-year periods ended December 31, 2010, there were 120, 115 and 101 funds, respectively, in your fund’s Lipper peer group. (When considering performance information, shareholders should be mindful that past performance is not a guarantee of future results.)
Brokerage and soft-dollar allocations; investor servicing
The Trustees considered various potential benefits that Putnam Management may receive in connection with the services it provides under the management contract with your fund. These include benefits related to brokerage allocation and the use of soft dollars, whereby a portion of the commissions paid by a fund for brokerage may be used to acquire research services that are expected to be useful to Putnam Management in managing the assets of the fund and of other clients. Subject to policies established by the Trustees, soft-dollar credits acquired through these means are used primarily to supplement Putnam Management’s internal research efforts. However, the Trustees noted that a portion of available soft-dollar credits continues to be allocated to the payment of fund expenses. The Trustees indicated their continued intent to monitor regulatory developments in this area with the assistance of their Brokerage Committee and also indicated their continued intent to monitor the potential benefits associated with fund brokerage and soft-dollar allocations and trends in industry practices to ensure that the principle of seeking best price and execution remains paramount in the portfolio trading process.
Putnam Management may also receive benefits from payments that the funds make to Putnam Management’s affiliates for investor or distribution services. In conjunction with the annual review of your fund’s management contract, the Trustees reviewed your fund’s investor servicing agreement with Putnam Investor Services, Inc. (“PSERV”) and its distributor’s contracts and distribution plans with Putnam Retail Management Limited Partnership (“PRM”), both of which are affiliates of Putnam Management. The Trustees concluded that the fees payable by the funds to PSERV and PRM, as applicable, for such services are reasonable in relation to the nature and quality of such services.
20
Other information for shareholders
Important notice regarding Putnam’s privacy policy
In order to conduct business with our shareholders, we must obtain certain personal information such as account holders’ names, addresses, Social Security numbers, and dates of birth. Using this information, we are able to maintain accurate records of accounts and transactions.
It is our policy to protect the confidentiality of our shareholder information, whether or not a shareholder currently owns shares of our funds. In particular, it is our policy not to sell information about you or your accounts to outside marketing firms. We have safeguards in place designed to prevent unauthorized access to our computer systems and procedures to protect personal information from unauthorized use.
Under certain circumstances, we must share account information with outside vendors who provide services to us, such as mailings and proxy solicitations. In these cases, the service providers enter into confidentiality agreements with us, and we provide only the information necessary to process transactions and perform other services related to your account. Finally, it is our policy to share account information with your financial representative, if you’ve listed one on your Putnam account.
Proxy voting
Putnam is committed to managing our mutual funds in the best interests of our shareholders. The Putnam funds’ proxy voting guidelines and procedures, as well as information regarding how your fund voted proxies relating to portfolio securities during the 12-month period ended June 30, 2011, are available in the Individual Investors section at putnam.com, and on the SEC’s website, www.sec.gov. If you have questions about finding forms on the SEC’s website, you may call the SEC at 1-800-SEC-0330. You may also obtain the Putnam funds’ proxy voting guidelines and procedures at no charge by calling Putnam’s Shareholder Services at 1-800-225-1581.
Fund portfolio holdings
The fund will file a complete schedule of its portfolio holdings with the SEC for the first and third quarters of each fiscal year on Form N-Q. Shareholders may obtain the fund’s Forms N-Q on the SEC’s website at www.sec.gov. In addition, the fund’s Forms N-Q may be reviewed and copied at the SEC’s Public Reference Room in Washington, D.C. You may call the SEC at 1-800-SEC-0330 for information about the SEC’s website or the operation of the Public Reference Room.
Trustee and employee fund ownership
Putnam employees and members of the Board of Trustees place their faith, confidence, and, most importantly, investment dollars in Putnam mutual funds. As of September 30, 2011, Putnam employees had approximately $298,000,000 and the Trustees had approximately $65,000,000 invested in Putnam mutual funds. These amounts include investments by the Trustees’ and employees’ immediate family members as well as investments through retirement and deferred compensation plans.
21
Financial statements
These sections of the report, as well as the accompanying Notes, preceded by the Report of Independent Registered Public Accounting Firm, constitute the fund’s financial statements.
The fund’s portfolio lists all the fund’s investments and their values as of the last day of the reporting period. Holdings are organized by asset type and industry sector, country, or state to show areas of concentration and diversification.
Statement of assets and liabilities shows how the fund’s net assets and share price are determined. All investment and non-investment assets are added together. Any unpaid expenses and other liabilities are subtracted from this total. The result is divided by the number of shares to determine the net asset value per share, which is calculated separately for each class of shares. (For funds with preferred shares, the amount subtracted from total assets includes the liquidation preference of preferred shares.)
Statement of operations shows the fund’s net investment gain or loss. This is done by first adding up all the fund’s earnings — from dividends and interest income — and subtracting its operating expenses to determine net investment income (or loss). Then, any net gain or loss the fund realized on the sales of its holdings — as well as any unrealized gains or losses over the period — is added to or subtracted from the net investment result to determine the fund’s net gain or loss for the fiscal year.
Statement of changes in net assets shows how the fund’s net assets were affected by the fund’s net investment gain or loss, by distributions to shareholders, and by changes in the number of the fund’s shares. It lists distributions and their sources (net investment income or realized capital gains) over the current reporting period and the most recent fiscal year-end. The distributions listed here may not match the sources listed in the Statement of operations because the distributions are determined on a tax basis and may be paid in a different period from the one in which they were earned.
Financial highlights provide an overview of the fund’s investment results, per-share distributions, expense ratios, net investment income ratios, and portfolio turnover in one summary table, reflecting the five most recent reporting periods. In a semiannual report, the highlights table also includes the current reporting period.
22
Report of Independent Registered Public Accounting Firm
To the Board of Trustees and Shareholders of
Putnam California Tax Exempt Income Fund:
We have audited the accompanying statement of assets and liabilities of Putnam California Tax Exempt Income Fund (the fund), including the fund’s portfolio, as of September 30, 2011, and the related statement of operations for the year then ended, the statements of changes in net assets for each of the years in the two-year period then ended and the financial highlights for each of the years or periods in the five-year period then ended. These financial statements and financial highlights are the responsibility of the fund’s management. Our responsibility is to express an opinion on these financial statements and financial highlights based on our audits.
We conducted our audits in accordance with the standards of the Public Company Accounting Oversight Board (United States). Those standards require that we plan and perform our audit to obtain reasonable assurance about whether the financial statements and financial highlights are free of material misstatement. An audit includes examining, on a test basis, evidence supporting the amounts and disclosures in the financial statements. Our procedures included confirmation of securities owned as of September 30, 2011 by correspondence with the custodian and brokers or by other appropriate auditing procedures. An audit also includes assessing the accounting principles used and significant estimates made by management, as well as evaluating the overall financial statement presentation. We believe that our audits provide a reasonable basis for our opinion.
In our opinion, the financial statements and financial highlights referred to above present fairly, in all material respects, the financial position of Putnam California Tax Exempt Income Fund as of September 30, 2011 the results of its operations for the year then ended, the changes in its net assets for each of the years in the two-year period then ended, and the financial highlights for each of the years or periods in the five-year period then ended, in conformity with U.S. generally accepted accounting principles.

Boston, Massachusetts
November 14, 2011
23
| |
| The fund’s portfolio 9/30/11 | |
| | |
| Key to holding’s abbreviations | |
| ABAG Association Of Bay Area Governments | G.O. Bonds General Obligation Bonds |
| AGM Assured Guaranty Municipal Corporation | NATL National Public Finance Guarantee Corp. |
| AGO Assured Guaranty, Ltd. | Radian Insd. Radian Group Insured |
| AMBAC AMBAC Indemnity Corporation | SGI Syncora Guarantee, Inc. |
| Cmnwlth. of PR Gtd. Commonwealth of | TAN Tax Anticipation Notes |
| Puerto Rico Guaranteed | U.S. Govt. Coll. U.S. Government Collateralized |
| COP Certificates of Participation | VRDN Variable Rate Demand Notes |
| FGIC Financial Guaranty Insurance Company | |
| | | |
| MUNICIPAL BONDS AND NOTES (99.2%)* | Rating** | Principal amount | Value |
|
| California (92.4%) | | | |
| ABAG Fin. Auth. for Nonprofit Corps. Rev. Bonds | | | |
| (Sharp Hlth. Care), 6 1/4s, 8/1/39 | A2 | $20,750,000 | $22,424,318 |
| (St. Rose Hosp.), Ser. A, 6s, 5/15/29 | A– | 5,625,000 | 6,080,569 |
|
| Alameda, Corridor Trans. Auth. Rev. Bonds, | | | |
| Ser. A, AMBAC, zero %, 10/1/19 | A– | 29,270,000 | 19,122,969 |
|
| Anaheim, Pub. Fin. Auth. Rev. Bonds | | | |
| (Elec. Syst. Distr. Fac.), Ser. A, 5 3/8s, 10/1/36 | AA– | 3,000,000 | 3,244,230 |
| (Distr. Syst.), NATL, 5s, 10/1/29 | A+ | 1,945,000 | 1,976,801 |
|
| Arcadia, Unified School Dist. G.O. Bonds | | | |
| (Election of 2006), Ser. A, AGM, zero %, 8/1/18 | AA+ | 1,500,000 | 1,131,720 |
|
| Bay Area Toll Auth. of CA Rev Bonds, Ser. F, | | | |
| 5s, 4/1/31 T | AA | 13,600,000 | 14,190,858 |
|
| Burbank, Pub. Fin. Auth. Rev. Bonds (West Olive | | | |
| Redev.), AMBAC, 5s, 12/1/26 | BBB+ | 3,390,000 | 3,060,899 |
|
| CA Rev. Bonds | | | |
| (Catholic Hlth. Care West), Ser. A, 6s, 7/1/39 | A2 | 10,500,000 | 11,242,560 |
| (Adventist Hlth. Syst.-West), Ser. A, | | | |
| 5 3/4s, 9/1/39 | A | 10,500,000 | 10,980,585 |
|
| CA Edl. Fac. Auth. Rev. Bonds | | | |
| (Claremont Graduate U.), Ser. A, 6s, 3/1/38 | A3 | 1,045,000 | 1,109,842 |
| (CA Lutheran U.), 5 3/4s, 10/1/38 | Baa1 | 5,000,000 | 5,106,550 |
| (U. of the Pacific), 5 1/2s, 11/1/39 | A2 | 1,250,000 | 1,310,500 |
| (U. of the Pacific), 5 1/4s, 11/1/29 | A2 | 1,265,000 | 1,334,714 |
| (Loyola-Marymount U.), Ser. A, 5 1/8s, 10/1/40 | A2 | 2,955,000 | 3,071,752 |
| (U. Redlands), Ser. A, 5 1/8s, 8/1/38 | A3 | 6,430,000 | 6,287,383 |
| (Claremont Graduate U.), Ser. A, 5 1/8s, 3/1/28 | A3 | 1,270,000 | 1,321,575 |
| (U. of The Pacific), 5s, 11/1/36 | A2 | 10,735,000 | 10,844,818 |
| (U. of La Verne), Ser. A, 5s, 6/1/31 | Baa2 | 1,970,000 | 1,810,253 |
| (Chapman U.), 5s, 4/1/31 | A2 | 2,000,000 | 2,048,580 |
| (Claremont Graduate U.), Ser. A, 5s, 3/1/31 | A3 | 2,465,000 | 2,505,722 |
| (U. of the Pacific), 5s, 11/1/30 | A2 | 2,500,000 | 2,536,675 |
| (CA College of Arts), 5s, 6/1/30 | Baa3 | 1,825,000 | 1,638,648 |
| (Lutheran U.), Ser. C, 5s, 10/1/29 | Baa1 | 1,500,000 | 1,492,950 |
| (U. of The Pacific), 5s, 11/1/25 | A2 | 4,000,000 | 4,142,760 |
| (Lutheran U.), Ser. C, 5s, 10/1/24 | Baa1 | 1,250,000 | 1,260,688 |
| (Lutheran U.), Ser. C, 4 1/2s, 10/1/19 | Baa1 | 2,830,000 | 2,863,111 |
|
24
| | | |
| MUNICIPAL BONDS AND NOTES (99.2%)* cont. | Rating** | Principal amount | Value |
|
| California cont. | | | |
| CA Hlth. Fac. Fin. Auth. Rev. Bonds | | | |
| (Providence Hlth. & Svcs.), Ser. C, | | | |
| 6 1/2s, 10/1/38 | Aa2 | $5,400,000 | $6,110,586 |
| (Providence Hlth. & Svcs.), Ser. C, 6 1/2s, | | | |
| 10/1/38 (Prerefunded 10/1/18) | Aa2 | 100,000 | 133,371 |
| (Providence Hlth. & Svcs.), Class C, | | | |
| 6 1/4s, 10/1/28 | Aa2 | 3,350,000 | 3,805,600 |
| (Catholic Hlth. Care West), Ser. J, 5 5/8s, 7/1/32 | A2 | 2,750,000 | 2,833,215 |
| (Sutter Hlth.), Ser. A, 5 1/4s, 11/15/46 | Aa3 | 10,000,000 | 10,120,000 |
| (Stanford Hosp.), Ser. A-2, 5 1/4s, 11/15/40 | Aa3 | 1,000,000 | 1,034,850 |
| (Cedars Sinai Med. Ctr.), 5s, 8/15/39 | A2 | 14,170,000 | 14,105,810 |
| (Cedars-Sinai Med. Ctr.), 5s, 11/15/34 | AAA | 6,250,000 | 6,249,688 |
| (CA-NV Methodist), 5s, 7/1/26 | A– | 1,745,000 | 1,782,483 |
|
| CA Hsg. Fin. Agcy. Rev. Bonds | | | |
| Ser. J, 5 3/4s, 8/1/47 | A | 3,275,000 | 3,272,577 |
| (Home Mtge.), Ser. H, FGIC, 5 3/4s, 8/1/30 | A | 10,000 | 10,017 |
| (Multi-Fam. Hsg. III), Ser. B, NATL, 5 1/2s, 8/1/39 | A3 | 1,650,000 | 1,504,404 |
| (Home Mtge.), Ser. L, 5.2s, 8/1/28 | A | 2,525,000 | 2,453,139 |
| (Home Mtge.), Ser. I, 4 7/8s, 8/1/41 | A | 5,000,000 | 4,204,950 |
| (Home Mtge.), Ser. M, 4 3/4s, 8/1/42 | A | 8,050,000 | 6,479,606 |
| (Home Mtge.), Ser. K, 4 5/8s, 8/1/26 | Baa2 | 2,500,000 | 2,237,700 |
| (Home Mtge.), Ser. I, 4.6s, 8/1/21 | A | 3,310,000 | 3,133,279 |
|
| CA Infrastructure & Econ. Dev. Bank Rev. Bonds | | | |
| (CA Indpt. Syst. Operator), Ser. A, 6 1/4s, 2/1/39 | A1 | 12,000,000 | 12,986,640 |
| (Oakland Unified School Dist. Fin.), 5s, 8/15/22 | A2 | 4,985,000 | 4,993,275 |
|
| CA Muni. Fin. Auth. COP (Cmnty. Hosp. Central CA) | | | |
| 5 1/4s, 2/1/46 | Baa2 | 11,000,000 | 9,276,410 |
| 5 1/4s, 2/1/37 | Baa2 | 14,650,000 | 12,831,642 |
|
| CA Muni. Fin. Auth. Rev. Bonds | | | |
| (U. of La Verne), Ser. A, 6 1/4s, 6/1/40 | Baa2 | 4,000,000 | 4,137,240 |
| (Biola U.), 5 7/8s, 10/1/34 | Baa1 | 11,000,000 | 11,264,660 |
| (Biola U.), 5.8s, 10/1/28 | Baa1 | 220,000 | 228,785 |
| (Eisenhower Med. Ctr.), Ser. A, 5 3/4s, 7/1/40 F52 | Baa1 | 10,500,000 | 10,584,945 |
| (Loma Linda U.), 5s, 4/1/28 | A | 2,000,000 | 2,036,460 |
| (U. Students Coop Assn.), 5s, 4/1/22 | BBB– | 790,000 | 790,743 |
|
| CA Muni. Fin. Auth. Sr. Living Rev. Bonds | | | |
| (Pilgrim Place Claremont), Ser. A, 6 1/8s, 5/15/39 | A– | 4,000,000 | 4,273,880 |
|
| CA Poll. Control Fin. Auth. Rev. Bonds (San Jose | | | |
| Wtr. Co.), 5.1s, 6/1/40 | A | 4,500,000 | 4,610,430 |
|
| CA Poll. Control Fin. Auth. VRDN (Pacific Gas & | | | |
| Electric Corp.) | | | |
| Ser. F, 0.1s, 11/1/26 | A–1+ | 23,800,000 | 23,800,000 |
| Class C, 0.12s, 11/1/26 | A–1+ | 10,600,000 | 10,600,000 |
| Ser. E, 0.1s, 11/1/26 | VMIG1 | 18,900,000 | 18,900,000 |
|
| CA Poll. Control Fin. Auth. Solid Waste Disp. | | | |
| Rev. Bonds (Waste Management, Inc.) | | | |
| Ser. A-2, 5.4s, 4/1/25 | BBB | 7,500,000 | 7,676,700 |
| Ser. B, 5s, 7/1/27 | BBB | 4,500,000 | 4,480,245 |
|
| CA Poll. Control Fin. Auth. Wtr. Fac. Rev. Bonds | | | |
| (American Wtr. Cap. Corp.), 5 1/4s, 8/1/40 | BBB+ | 4,000,000 | 3,929,680 |
|
25
| | | |
| MUNICIPAL BONDS AND NOTES (99.2%)* cont. | Rating** | Principal amount | Value |
|
| California cont. | | | |
| CA State G.O. Bonds | | | |
| 6 1/2s, 4/1/33 | A1 | $43,000,000 | $50,352,570 |
| 5 3/4s, 4/1/31 | A1 | 40,620,000 | 44,329,825 |
|
| CA State Enterprise Auth. Swr. Fac. Rev. Bonds | | | |
| (Anheuser-Busch), 5.3s, 9/1/47 | A– | 2,000,000 | 2,001,820 |
|
| CA State Pub. Wks. Board Rev. Bonds | | | |
| Ser. I-1, 6 1/8s, 11/1/29 | A2 | 3,000,000 | 3,311,850 |
| (Dept. of Ed. — Riverside Campus), Ser. B, | | | |
| 6 1/8s, 4/1/29 | A2 | 490,000 | 537,863 |
| (Dept. of Dev. Svcs. — Porterville), Ser. C, | | | |
| 6s, 4/1/27 | A2 | 575,000 | 637,411 |
| (Dept. of Ed. — Riverside Campus), Ser. B, | | | |
| 6s, 4/1/26 | A2 | 2,625,000 | 2,927,689 |
| (Trustees CA State U.), Ser. D, 6s, 4/1/26 | Aa3 | 1,365,000 | 1,552,455 |
| (Riverside Campus), Ser. B, 6s, 4/1/25 | A2 | 1,755,000 | 1,968,145 |
| (Dept. of Dev. Svcs. — Porterville), Ser. C, | | | |
| 6s, 4/1/24 | A2 | 3,615,000 | 4,049,089 |
| (Dept. of Ed. — Riverside Campus), Ser. B, | | | |
| 6s, 4/1/24 | A2 | 4,485,000 | 5,023,559 |
| Ser. G-1, 5 3/4s, 10/1/30 | A2 | 11,500,000 | 12,077,760 |
| Ser. A-1, 5 1/2s, 3/1/25 | A2 | 2,500,000 | 2,696,850 |
| (Regents U.), Ser. E, 5s, 4/1/29 | Aa2 | 7,015,000 | 7,358,595 |
| (Regents U.), Ser. E, 5s, 4/1/28 | Aa2 | 8,290,000 | 8,766,924 |
|
| CA State Pub. Wks. Board Lease Rev. Bonds | | | |
| Ser. A, NATL, 6 1/2s, 9/1/17 | A2 | 24,580,000 | 27,039,966 |
| (Dept. of Corrections-State Prisons), Ser. A, | | | |
| AMBAC, 5s, 12/1/19 | A2 | 17,250,000 | 18,310,875 |
|
| CA State U. Rev. Bonds (Systemwide), Ser. A, | | | |
| 5 3/4s, 11/1/28 | Aa2 | 5,000,000 | 5,597,800 |
|
| CA Statewide Cmnty. Dev. Auth. COP (The Internext | | | |
| Group), 5 3/8s, 4/1/30 | BBB | 15,300,000 | 13,953,753 |
|
| CA Statewide Cmnty. Dev. Auth. Rev. Bonds | | | |
| (Thomas Jefferson School of Law), Ser. A, | | | |
| 7 1/4s, 10/1/38 | BB+ | 2,415,000 | 2,453,205 |
| (American Baptist Homes West), 6 1/4s, 10/1/39 | BBB | 4,500,000 | 4,508,370 |
| (Sutter Hlth.), Ser. A, 6s, 8/15/42 | Aa3 | 5,000,000 | 5,458,750 |
| (Irvine LLC-UCI East Campus), 6s, 5/15/40 | Baa2 | 11,000,000 | 10,924,760 |
| (American Baptist Homes West), 5 3/4s, 10/1/25 | BBB | 950,000 | 950,589 |
| (Sutter Hlth.), Ser. B, 5 1/4s, 11/15/48 | Aa3 | 2,000,000 | 2,012,080 |
| (Huntington Memorial Hosp.), 5s, 7/1/35 | A+ | 11,175,000 | 10,975,973 |
| (Sr. Living-Presbyterian Homes), Ser. A, | | | |
| 4 7/8s, 11/15/36 | BBB | 1,000,000 | 859,550 |
|
| CA Statewide Cmnty. Dev. Auth. 144A Rev. Bonds | | | |
| (Front Porch Cmntys. & Svcs.), Ser. A, | | | |
| 5 1/8s, 4/1/37 | BBB | 9,500,000 | 7,924,995 |
|
| CA Statewide Cmnty. Dev. Auth. Special | | | |
| Tax Rev. Bonds | | | |
| (Cmnty. Fac. Dist. No. 1-Zone 1C), 7 1/4s, 9/1/30 | BB/P | 2,270,000 | 2,289,295 |
| (Citrus Garden Apt. Project - D1), 5 1/4s, 7/1/22 | BBB | 1,630,000 | 1,616,015 |
| (Cmnty. Fac. Dist. No. 1-Zone 1B), zero %, 9/1/20 | BB/P | 1,110,000 | 536,208 |
|
26
| | | |
| MUNICIPAL BONDS AND NOTES (99.2%)* cont. | Rating** | Principal amount | Value |
|
| California cont. | | | |
| CA Statewide Cmnty., Dev. Auth. Rev. Bonds | | | |
| (Sr. Living — Presbyterian Homes), 7 1/4s, 11/15/41 | BBB | $6,000,000 | $6,463,620 |
| (Enloe Med. Ctr.), 6 1/4s, 8/15/33 | A– | 7,500,000 | 8,110,650 |
| (Enloe Med. Ctr.), 6 1/4s, 8/15/28 | A– | 5,000,000 | 5,542,350 |
| (Catholic Hlth. Care West), Ser. A, 5 1/2s, 7/1/30 | A2 | 9,940,000 | 10,214,443 |
| (Kaiser Permanente), Ser. B, 5 1/4s, 3/1/45 | A+ | 19,000,000 | 19,117,610 |
| Ser. C, 5 1/4s, 8/1/31 | A+ | 7,600,000 | 7,751,696 |
| (Kaiser Permanente), Ser. B, 5s, 3/1/41 | A+ | 1,815,000 | 1,815,617 |
| (Henry Mayo Newhall Memorial Hosp.), 5s, 10/1/27 | A– | 3,685,000 | 3,802,662 |
| (Henry Mayo Newhall Memorial Hosp.), 5s, 10/1/20 | A– | 1,055,000 | 1,138,957 |
|
| CA Statewide Fin. Auth. Tobacco Settlement Rev. | | | |
| Bonds, Class B, 5 5/8s, 5/1/29 | B2 | 2,990,000 | 2,738,601 |
|
| CA Tobacco Securitization Agcy. Rev. Bonds | | | |
| (Sonoma Cnty. Corp.), Ser. B, 5 1/2s, 6/1/30 | | | |
| (Prerefunded 6/1/12) | AAA/F | 3,145,000 | 3,224,348 |
|
| Carlsbad, Unified School Dist. G.O. Bonds, FGIC, | | | |
| NATL, zero %, 11/1/21 | Aa2 | 2,250,000 | 1,418,940 |
|
| Castaic Lake, Wtr. Agcy. COP (Water Syst. Impt.), | | | |
| AMBAC, zero %, 8/1/27 | AA | 10,000,000 | 4,199,100 |
|
| Chino Basin, Desalter Auth. Rev. Bonds, Ser. A, | | | |
| AGO, 5s, 6/1/30 | AA+ | 3,540,000 | 3,740,647 |
|
| Chula Vista, Cmnty. Fac. Dist. Special Tax | | | |
| Rev. Bonds | | | |
| (No. 06-1 Eastlake Woods Area), 6.2s, 9/1/33 | BBB/P | 3,750,000 | 3,771,750 |
| (No. 06-1 Eastlake Woods Area), 6.15s, 9/1/26 | BBB/P | 2,000,000 | 2,040,480 |
| (No. 07-1 Otay Ranch Village Eleven), | | | |
| 5 7/8s, 9/1/34 | BB+/P | 2,335,000 | 2,284,541 |
| (No. 07-I Otay Ranch Village Eleven), 5.1s, 9/1/26 | BB+/P | 340,000 | 322,293 |
|
| Chula Vista, Indl. Dev. Rev. Bonds (San Diego Gas) | | | |
| Ser. C, 5 7/8s, 2/15/34 | Aa3 | 2,600,000 | 2,886,026 |
| Ser. D, 5 7/8s, 1/1/34 | Aa3 | 5,000,000 | 5,550,050 |
|
| Coast, Cmnty. College Dist. G.O. Bonds, NATL | | | |
| zero %, 8/1/22 | Aa1 | 1,280,000 | 745,331 |
| zero %, 8/1/21 | Aa1 | 4,500,000 | 2,794,455 |
|
| Commerce, Redev. Agcy. Rev. Bonds (Project 1), | | | |
| zero %, 8/1/21 (Escrowed to maturity) | AAA/P | 58,200,000 | 34,624,926 |
|
| Compton, Unified School Dist. G.O. Bonds | | | |
| (Election of 2002), Ser. D, AMBAC | | | |
| zero %, 6/1/18 | Aa3 | 7,295,000 | 5,521,221 |
| zero %, 6/1/17 | Aa3 | 7,145,000 | 5,733,362 |
|
| Contra Costa, Home Mtge. Fin. Auth. Rev. Bonds, | | | |
| Ser. G, NATL, zero %, 9/1/17 (Escrowed | | | |
| to maturity) | Aaa | 23,705,000 | 15,425,792 |
|
| Corona, Cmnty. Fac. Dist. Special Tax (No. 97-2 | | | |
| Eagle Glen), Ser. 97-2, 5 3/4s, 9/1/16 | BBB+/P | 2,395,000 | 2,411,813 |
|
| Delano, COP (Delano Regl. Med. Ctr.), 5.6s, 1/1/26 | BBB– | 20,200,000 | 19,581,880 |
|
| Duarte, COP, Ser. A | | | |
| 5 1/4s, 4/1/31 | A1 | 7,000,000 | 6,999,860 |
| 5 1/4s, 4/1/24 | A1 | 7,500,000 | 7,505,400 |
|
27
| | | |
| MUNICIPAL BONDS AND NOTES (99.2%)* cont. | Rating** | Principal amount | Value |
|
| California cont. | | | |
| El Camino, Hosp. Dist. Rev. Bonds, Ser. A, AMBAC, | | | |
| 6 1/4s, 8/15/17 (Escrowed to maturity) | AA/F | $8,510,000 | $9,743,695 |
|
| Folsom Cordova, Unified School Dist. G.O. Bonds | | | |
| (School Fac. Impt. Dist. No. 1), Ser. A, NATL, | | | |
| zero %, 10/1/25 | Aa3 | 1,505,000 | 673,608 |
|
| Foothill-De Anza, Cmnty. College Dist. G.O. | | | |
| Bonds, Ser. C, 5s, 8/1/40 | Aaa | 6,750,000 | 7,270,695 |
|
| Foothill/Eastern Corridor Agcy. Rev. Bonds (CA | | | |
| Toll Roads) | | | |
| 5 3/4s, 1/15/40 | Baa3 | 19,000,000 | 17,439,340 |
| NATL, 5 3/8s, 1/15/14 | Baa1 | 5,000,000 | 5,027,750 |
| Ser. A, 5s, 1/1/35 | Baa3 | 2,000,000 | 1,684,740 |
|
| Golden State Tobacco Securitization Corp. Rev. | | | |
| Bonds | | | |
| Ser. A-4, 7.8s, 6/1/42 (Prerefunded 6/1/13) | Aaa | 6,075,000 | 6,807,341 |
| Ser. 03 A-1, 6 1/4s, 6/1/33 (Prerefunded 6/1/12) | Aaa | 8,760,000 | 9,429,352 |
| Ser. A-1, 5s, 6/1/33 | BB+ | 12,340,000 | 8,654,906 |
| Ser. A, 4.55s, 6/1/22 | AA+ | 4,085,000 | 4,143,375 |
| Ser. A-1, 4 1/2s, 6/1/27 | BBB– | 10,675,000 | 8,339,630 |
| Ser. S-B, zero %, 6/1/47 | B | 24,000,000 | 797,280 |
| Ser. A, AMBAC, zero %, 6/1/24 | A2 | 15,500,000 | 7,789,060 |
|
| Golden West, School Fin. Auth. Rev. Bonds, | | | |
| Ser. A, NATL | | | |
| zero %, 8/1/20 | Baa1 | 2,000,000 | 1,272,660 |
| zero %, 2/1/20 | Baa1 | 2,480,000 | 1,619,068 |
|
| Huntington Beach, Cmnty. Fac. Dist. Special Tax | | | |
| (No. 2003-1 Huntington Ctr.) | | | |
| 5.85s, 9/1/33 | BB+/P | 2,845,000 | 2,793,164 |
| 5.8s, 9/1/23 | BB+/P | 1,000,000 | 1,010,030 |
|
| Imperial Irrigation Elec. Dist. Rev. Bonds | | | |
| Ser. A, 6 1/4s, 11/1/31 | AA– | 1,000,000 | 1,172,240 |
| Ser. A, 5 1/2s, 11/1/41 | AA– | 9,000,000 | 9,825,120 |
| 5 1/8s, 11/1/38 | AA– | 7,000,000 | 7,326,970 |
|
| Irvine Ranch, Wtr. Dist. VRDN, 0.69s, 4/1/33 | VMIG1 | 7,900,000 | 7,900,000 |
|
| Irvine, Impt. Board Act of 1915 G.O. Bonds | | | |
| (Assmt. Dist. No. 03-19-Group 2), 5.45s, 9/2/23 | BBB/P | 935,000 | 943,696 |
|
| Irvine, Impt. Board Act of 1915 Special | | | |
| Assmt. Bonds | | | |
| (Dist. No. 00-18 Group 3), 5.55s, 9/2/26 | BBB+/P | 1,825,000 | 1,828,486 |
| (Dist. No. 04-20), 5s, 9/2/25 | BB–/P | 2,000,000 | 1,960,640 |
| (Dist. No. 04-20), 5s, 9/2/21 | BB–/P | 1,000,000 | 1,020,450 |
| (Dist. No. 04-20), 5s, 9/2/20 | BB–/P | 1,000,000 | 1,029,830 |
| (Dist. No. 04-20), 5s, 9/2/19 | BB–/P | 1,000,000 | 1,032,500 |
| (Dist. No. 04-20), 4 7/8s, 9/2/18 | BB–/P | 1,000,000 | 1,032,540 |
|
| Irvine, Impt. Board Act of 1915 Ltd. Oblig. | | | |
| Special Assmt. Bonds (No. 03-19 Group 4), | | | |
| 5s, 9/2/29 | BB–/P | 665,000 | 595,268 |
|
| Las Virgenes, Unified School Dist. G.O. Bonds | | | |
| Ser. A, AGM, 5s, 8/1/28 | AA+ | 5,245,000 | 5,514,960 |
| AGM, zero %, 11/1/23 | AA+ | 1,395,000 | 763,107 |
|
28
| | | |
| MUNICIPAL BONDS AND NOTES (99.2%)* cont. | Rating** | Principal amount | Value |
|
| California cont. | | | |
| Long Beach, Bond Fin. Auth. Rev. Bonds | | | |
| (Natural Gas), Ser. A, 5 1/2s, 11/15/28 | A | $5,000,000 | $4,950,500 |
|
| Los Angeles, Cmnty. College Dist. G.O. Bonds | | | |
| (Election of 2008), Ser. A, 6s, 8/1/33 | Aa1 | 10,000,000 | 11,556,600 |
|
| Los Angeles, Cmnty. Redev. Agcy. Fin. Auth. Rev. | | | |
| Bonds (Bunker Hill), Ser. A, AGM, 5s, 12/1/27 | AA+ | 16,000,000 | 16,734,720 |
|
| Los Angeles, Dept. Arpt. Rev. Bonds (Los Angeles | | | |
| Intl. Arpt.), Ser. D, 5s, 5/15/40 | AA | 11,500,000 | 12,295,685 |
|
| Los Angeles, Harbor Dept. Rev. Bonds, U.S. Govt. | | | |
| Coll., 7.6s, 10/1/18 (Escrowed to maturity) | AA+ | 14,970,000 | 18,527,770 |
|
| Los Angeles, Unified School Dist. G.O. Bonds | | | |
| Ser. D, 5s, 1/1/34 | Aa2 | 3,865,000 | 4,036,065 |
| Ser. F, 5s, 7/1/29 | Aa2 | 2,000,000 | 2,138,740 |
|
| M-S-R Energy Auth. Rev. Bonds, Ser. A, | | | |
| 6 1/2s, 11/1/39 | A | 5,000,000 | 5,504,200 |
|
| Metro. Wtr. Dist. Rev. Bonds (Southern CA Wtr. | | | |
| Wks.), 5 3/4s, 8/10/18 | AAA | 20,000,000 | 23,865,400 |
|
| Murrieta Valley, Unified School Dist. G.O. Bonds, | | | |
| AGM, zero %, 9/1/31 | AA+ | 6,445,000 | 1,937,560 |
|
| Napa Valley, Cmnty. College Dist. G.O. Bonds | | | |
| (Election of 2002), Ser. C, NATL | | | |
| zero %, 8/1/22 | Aa2 | 5,000 | 2,992 |
| zero %, 8/1/21 | Aa2 | 8,575,000 | 5,448,298 |
|
| North Natomas, Cmnty. Fac. Special Tax Bonds | | | |
| Ser. B, 6 3/8s, 9/1/31 | BBB–/P | 6,150,000 | 6,160,455 |
| (Dist. No. 4), Ser. D, 5s, 9/1/33 | BBB–/P | 3,770,000 | 3,259,994 |
| Ser. D, 5s, 9/1/26 | BBB–/P | 1,710,000 | 1,576,244 |
|
| Oakland, Joint Powers Fin. Auth. VRDN (Fruitvale | | | |
| Transit Village), Ser. B, 0.16s, 7/1/33 | VMIG1 | 1,275,000 | 1,275,000 |
|
| Oakland, Swr. Rev. Bonds, Ser. A, AGM, 5s, 6/15/26 | AA+ | 3,690,000 | 3,836,751 |
|
| Oakland, Unified School Dist. Alameda Cnty., G.O. | | | |
| Bonds (Election of 2006), Ser. A, 6 1/8s, 8/1/29 | A2 | 4,000,000 | 4,331,080 |
|
| Orange Cnty., Cmnty. Fac. Dist. Special | | | |
| Tax Rev. Bonds | | | |
| (Ladera Ranch — No. 03-1), Ser. A, 5 5/8s, 8/15/34 | BBB–/P | 2,750,000 | 2,750,990 |
| (Ladera Ranch No. 02-1), Ser. A, 5.55s, 8/15/33 | BBB–/P | 3,725,000 | 3,637,202 |
| (Ladera Ranch — No. 03-1), Ser. A, 5 1/2s, 8/15/23 | BBB–/P | 1,000,000 | 1,001,850 |
|
| Palomar Pomerado, Hlth. G.O. Bonds (Election | | | |
| of 2004), Ser. A, AGO | | | |
| zero %, 8/1/27 | AA+ | 3,395,000 | 1,369,713 |
| zero %, 8/1/26 | AA+ | 5,000,000 | 2,164,250 |
| zero %, 8/1/24 | AA+ | 5,130,000 | 2,555,253 |
|
| Pico Rivera, Pub. Fin. Auth. Lease Rev. Bonds | | | |
| 5 3/4s, 9/1/39 | A+ | 6,000,000 | 6,258,720 |
| 5 1/2s, 9/1/31 | A+ | 1,000,000 | 1,048,900 |
|
| Placentia, Redev. Auth. Tax Alloc. Rev. Bonds, | | | |
| Ser. B, 5 3/4s, 8/1/32 | BBB+ | 3,000,000 | 2,748,690 |
|
| Poway, Unified School Dist. G.O. Bonds (Election | | | |
| of 2008), zero %, 8/1/29 | Aa2 | 11,350,000 | 4,197,457 |
|
29
| | | |
| MUNICIPAL BONDS AND NOTES (99.2%)* cont. | Rating** | Principal amount | Value |
|
| California cont. | | | |
| Rancho Cordova, Cmnty. Fac. Dist. Special Tax | | | |
| (No. 2003-1 Sunridge Anatolia), 6.1s, 9/1/37 | BB+/P | $1,485,000 | $1,398,558 |
|
| Rancho Mirage, Joint Powers Fin. Auth. Rev. Bonds | | | |
| (Eisenhower Med. Ctr.), Ser. A, 5s, 7/1/47 | Baa1 | 6,000,000 | 5,311,860 |
|
| Redding, Elec. Syst. COP, NATL, 6.368s, 7/1/22 | | | |
| (Escrowed to maturity) | Baa1 | 18,465,000 | 22,446,239 |
|
| Redwood City, Redev. Agcy., TAN (Redev. Area | | | |
| 2-A), AMBAC, zero %, 7/15/22 | A- | 3,230,000 | 1,729,600 |
|
| Richmond, JT Pwrs. Fin. Auth. Rev. Bonds (Lease | | | |
| Civic Ctr.), AGO, 5 3/4s, 8/1/29 | AA+ | 2,000,000 | 2,208,940 |
|
| Rio Linda, Unified School Dist. G.O. Bonds | | | |
| (Election of 2006), AGM, 5s, 8/1/31 | AA+ | 6,000,000 | 6,245,280 |
|
| Ripon, Redev. Agcy. Tax Alloc. (Cmnty. Redev.), | | | |
| NATL, 4 3/4s, 11/1/36 | Baa1 | 1,470,000 | 1,131,386 |
|
| Riverside Cnty., Pub. Fin. Auth. COP, | | | |
| 5.8s, 5/15/29 | BB– | 4,250,000 | 3,223,838 |
|
| Rohnert Pk., Cmnty. Dev. Agcy. Tax Alloc. Bonds | | | |
| (Rohnert Redev.), NATL, zero %, 8/1/25 | A– | 1,340,000 | 613,720 |
|
| Sacramento City Fin. Auth. TAN, Ser. A, FGIC, | | | |
| NATL, zero %, 12/1/23 | A– | 15,815,000 | 7,897,378 |
|
| Sacramento Cnty., Arpt. Syst. Rev. Bonds | | | |
| 5s, 7/1/40 | A2 | 2,650,000 | 2,681,614 |
| Ser. A, AGM, 5s, 7/1/28 | AA+ | 1,500,000 | 1,575,990 |
| Ser. A, AGM, 5s, 7/1/26 | AA+ | 5,000,000 | 5,307,650 |
| Ser. A, AGM, 5s, 7/1/25 | AA+ | 3,990,000 | 4,262,278 |
|
| Sacramento, Special Tax Rev. Bonds (North Natomas | | | |
| Cmnty. Fac.) | | | |
| Ser. 01-03, 6s, 9/1/28 | BBB/P | 1,455,000 | 1,459,700 |
| 5.7s, 9/1/23 | BBB–/P | 4,795,000 | 4,844,771 |
|
| Sacramento, City Fin. Auth. Tax Alloc. Bonds | | | |
| Ser. A, FGIC, NATL, zero %, 12/1/22 | A– | 7,500,000 | 4,040,475 |
| (Cap. Appn.), Ser. A, FGIC, NATL, zero %, 12/1/19 | A– | 5,000,000 | 3,300,100 |
|
| Sacramento, Muni. Util. Dist. Rev. Bonds, Ser. X, | | | |
| 5s, 8/15/28 ∆ | A1 | 1,650,000 | 1,788,881 |
|
| Sacramento, Muni. Util. Dist. Elec. Rev. Bonds, | | | |
| Ser. K, AMBAC, 5 1/4s, 7/1/24 | A1 | 11,500,000 | 13,156,230 |
|
| Sacramento, Muni. Util. Dist. Fin. Auth. Rev. | | | |
| Bonds (Cosumnes), NATL, 5s, 7/1/19 | Baa1 | 1,070,000 | 1,127,994 |
|
| San Bernardino, Cmnty. College Dist. G.O. Bonds | | | |
| (Election of 2002), Ser. A, 6 1/4s, 8/1/33 | Aa2 | 1,000,000 | 1,121,070 |
|
| San Diego, Pub. Fac. Fin. Auth. Rev. Bonds | | | |
| Ser. A, 5 1/4s, 3/1/40 | A2 | 1,000,000 | 1,014,870 |
| Ser. A, 5 1/4s, 9/1/35 | A2 | 1,500,000 | 1,524,450 |
| Ser. A, 5 1/4s, 3/1/25 | A2 | 6,065,000 | 6,441,211 |
| (Southcrest), Ser. B, Radian Insd., 5 1/8s, 10/1/22 | Baa2 | 1,000,000 | 948,040 |
| Ser. A, 5s, 9/1/26 | A2 | 6,265,000 | 6,441,548 |
|
| San Diego, Pub. Fac. Fin. Auth. Swr. Rev. Bonds, | | | |
| Ser. A | | | |
| 5 1/4s, 5/15/29 | Aa3 | 1,245,000 | 1,366,886 |
| 5 1/8s, 5/15/29 | Aa3 | 7,885,000 | 8,515,484 |
|
30
| | | |
| MUNICIPAL BONDS AND NOTES (99.2%)* cont. | Rating** | Principal amount | Value |
|
| California cont. | | | |
| San Diego, Redev. Agcy. Tax Alloc. (Centre City), | | | |
| Ser. A, SGI, 5s, 9/1/22 | A2 | $4,665,000 | $4,668,545 |
|
| San Diego, Unified School Dist. G.O. Bonds | | | |
| Ser. C, zero %, 7/1/46 | Aa1 | 10,000,000 | 1,240,100 |
| (Election of 2008), Ser. C, zero %, 7/1/44 | Aa1 | 15,000,000 | 2,104,350 |
|
| San Francisco, City & Cnty. Arpt. Comm. Rev. | | | |
| Bonds (Intl. Arpt.) | | | |
| Ser. 34D, AGO, 5 1/4s, 5/1/25 | AA+ | 2,250,000 | 2,465,504 |
| Ser. F, 5s, 5/1/40 | A1 | 4,750,000 | 4,937,768 |
| Ser. G, 5s, 5/1/40 | A1 | 4,400,000 | 4,573,932 |
|
| San Francisco, City & Cnty. Redev. Fin. Auth. TAN | | | |
| (Mission Bay North Redev.), Ser. C, 6 3/4s, 8/1/41 | A– | 1,000,000 | 1,084,040 |
|
| San Francisco, City & Cnty. Redev. Fin. Auth. Tax | | | |
| Alloc. Bonds (Mission Bay South), Ser. D, | | | |
| 6 5/8s, 8/1/39 | BBB | 1,250,000 | 1,299,650 |
|
| San Joaquin Cnty. Trans. Auth. Rev. Bonds, | | | |
| Ser. A, 5 1/2s, 3/1/41 | AA | 7,000,000 | 7,775,460 |
|
| San Joaquin Hills, Trans. Corridor Agcy. Rev. Bonds | | | |
| Ser. A, NATL, 5 3/8s, 1/15/29 | Baa1 | 2,000,000 | 1,586,980 |
| (Toll Road), Ser. A, 5s, 1/1/33 | BB– | 34,125,000 | 26,198,445 |
|
| San Jose, Redev. Agcy. Tax Alloc. Bonds (Merged | | | |
| Area Redev.), Ser. B, Radian Insd., 5s, 8/1/32 | BBB+ | 3,935,000 | 3,219,814 |
|
| San Jose, Redev. Agcy. Tax Alloc. Rev. Bonds, | | | |
| Ser. B, 6 1/4s, 8/1/20 | Baa1 | 2,025,000 | 2,144,475 |
|
| San Juan, Basin Auth. Rev. Bonds (Ground Wtr. | | | |
| Recvy.), AMBAC, 5s, 12/1/34 | A/P | 1,000,000 | 914,250 |
|
| San Marcos, Pub. Fac. Auth. Rev. Bonds | | | |
| 5.8s, 9/1/27 | Baa3 | 2,995,000 | 2,996,526 |
| 5.8s, 9/1/18 | Baa3 | 1,475,000 | 1,485,473 |
|
| San Mateo Cnty., Cmnty. College G.O. Bonds | | | |
| (Election of 2005) | | | |
| Ser. B, NATL, zero %, 9/1/27 | Aaa | 10,545,000 | 4,525,809 |
| Ser. A, NATL, zero %, 9/1/26 | Aaa | 4,000,000 | 1,941,120 |
|
| Santa Barbara Cnty., Waterfront COP, AMBAC, | | | |
| 5s, 10/1/27 | A3 | 4,590,000 | 4,627,959 |
|
| Santa Clara, Elec. Rev. Rev. Bonds, Ser. A | | | |
| 6s, 7/1/31 | A | 2,500,000 | 2,807,550 |
| 5 1/4s, 7/1/32 | A | 4,000,000 | 4,243,880 |
|
| Santaluz, Cmnty. Facs. Dist. No. 2 Special Tax | | | |
| Rev. Bonds | | | |
| (Impt. Area No. 1), Ser. B, 6 3/8s, 9/1/30 | BBB/P | 10,765,000 | 10,804,400 |
| (Impt. Area No. 3), Ser. B, 6.2s, 9/1/30 | BBB/P | 495,000 | 496,411 |
| (Impt. Area No. 3), Ser. B, 6.1s, 9/1/21 | BBB/P | 500,000 | 502,770 |
|
| Saugus, Unified School Dist. G.O. Bonds, FGIC, | | | |
| NATL, zero %, 8/1/24 | Aa2 | 1,210,000 | 639,957 |
|
| Semitropic, Impt. Dist. Wtr. Storage Rev. Bonds, | | | |
| Ser. A, SGI, 5 1/8s, 12/1/35 | AA | 3,000,000 | 3,070,350 |
|
| Sierra View, Hlth. Care Dist. Rev. Bonds | | | |
| 5 1/4s, 7/1/37 | A/F | 4,500,000 | 4,480,740 |
| 5 1/4s, 7/1/32 | A/F | 1,000,000 | 994,910 |
|
31
| | | |
| MUNICIPAL BONDS AND NOTES (99.2%)* cont. | Rating** | Principal amount | Value |
|
| California cont. | | | |
| Solano, Cmnty. College Dist. G.O. Bonds (Election | | | |
| of 2002), Ser. B, FGIC, NATL, zero %, 8/1/25 | Aa2 | $9,020,000 | $4,371,271 |
|
| Southern CA Pub. Pwr. Auth. Rev. Bonds | | | |
| (Natural Gas No. 1), Ser. A, 5 1/4s, 11/1/24 | Baa1 | 2,850,000 | 2,882,177 |
| (Natural Gas), Ser. A, 5 1/4s, 11/1/21 | Baa1 | 1,500,000 | 1,535,295 |
| Ser. A, 5s, 7/1/40 | AA– | 6,860,000 | 7,165,612 |
|
| Stockton, Redev. Agcy. Rev. Bonds (Stockton | | | |
| Events Ctr.), FGIC, NATL, 5s, 9/1/28 | BBB+ | 1,500,000 | 1,513,245 |
|
| Sunnyvale, Cmnty. Fac. Dist. Special Tax Rev. | | | |
| Bonds, 7.65s, 8/1/21 | B+/P | 4,535,000 | 4,538,311 |
|
| Sweetwater, High School COP, AGM, 5s, 9/1/27 | AA+ | 7,840,000 | 7,919,811 |
|
| Thousand Oaks, Cmnty. Fac. Dist. Special Tax Rev. | | | |
| Bonds (Marketplace 94-1) | | | |
| 6 7/8s, 9/1/24 | B/P | 5,000,000 | 5,052,100 |
| zero %, 9/1/14 | B/P | 1,240,000 | 991,007 |
|
| Tobacco Securitization Auth. of Southern CA | | | |
| Rev. Bonds | | | |
| Ser. A, 5 5/8s, 6/1/43 (Prerefunded 6/1/12) | Aaa | 5,000,000 | 5,176,250 |
| Class A1-SNR, 5 1/8s, 6/1/46 | BBB | 5,000,000 | 3,264,100 |
| Ser. A1-SNR, 5s, 6/1/37 | BBB | 2,000,000 | 1,382,660 |
|
| Tracy, Operational Partnership, Joint Powers | | | |
| Auth. Lease Rev. Bonds, AGO | | | |
| 6 3/8s, 10/1/38 | AA+ | 2,200,000 | 2,477,288 |
| 6 1/4s, 10/1/33 | AA+ | 3,000,000 | 3,355,650 |
|
| Tuolumne Wind Project Auth. Rev. Bonds | | | |
| (Tuolumne Co.), Ser. A | | | |
| 5 7/8s, 1/1/29 | A+ | 6,000,000 | 6,680,700 |
| 5 5/8s, 1/1/29 | A+ | 1,000,000 | 1,096,580 |
|
| Turlock, Dist. Ser. A, 5s, 1/1/40 | A+ | 11,640,000 | 11,963,475 |
|
| U. of CA Rev. Bonds, Ser. O, 5 1/4s, 5/15/39 | Aa1 | 10,000,000 | 10,888,100 |
|
| Ventura Cnty., COP (Pub. Fin. Auth. III) | | | |
| 5 3/4s, 8/15/29 | AA | 1,500,000 | 1,652,100 |
| 5 3/4s, 8/15/28 | AA | 1,745,000 | 1,934,245 |
|
| Vernon, Elec. Syst. Rev. Bonds, Ser. A, | | | |
| 5 1/8s, 8/1/21 | A3 | 7,000,000 | 6,896,050 |
|
| West Kern, Cmnty. Coll. Dist. G.O. Bonds | | | |
| (Election of 2004), Ser. B, SGI, zero %, 11/1/24 | A1 | 2,395,000 | 1,096,048 |
|
| | | | 1,437,899,914 |
| Guam (0.2%) | | | |
| Territory of GU, Govt. Wtr. Wks. Auth. Wtr. & | | | |
| Waste Wtr. Syst. Rev. Bonds, 5 5/8s, 7/1/40 | Ba2 | 2,450,000 | 2,366,896 |
|
| | | | 2,366,896 |
| Puerto Rico (6.5%) | | | |
| Children’s Trust Fund Tobacco Settlement Rev. | | | |
| Bonds (Asset Backed Bonds), 5 5/8s, 5/15/43 | BBB | 4,000,000 | 3,234,920 |
|
| Cmnwlth. of PR, G.O. Bonds | | | |
| Ser. C, 6 1/2s, 7/1/40 | Baa1 | 5,000,000 | 5,463,300 |
| Ser. C, 6s, 7/1/39 | Baa1 | 3,770,000 | 3,906,361 |
| Ser. A, 5 1/4s, 7/1/34 | Baa1 | 2,750,000 | 2,696,100 |
|
32
| | | |
| MUNICIPAL BONDS AND NOTES (99.2%)* cont. | Rating** | Principal amount | Value |
|
| Puerto Rico cont. | | | |
| Cmnwlth. of PR, Aqueduct & Swr. Auth. Rev. Bonds, | | | |
| Ser. A | | | |
| 6s, 7/1/44 | Baa2 | $14,000,000 | $14,523,880 |
| 6s, 7/1/38 | Baa2 | 7,350,000 | 7,625,036 |
|
| Cmnwlth. of PR, Hwy. & Trans. Auth. Rev. Bonds, | | | |
| Ser. AA, 5s, 7/1/28 | A3 | 1,200,000 | 1,205,460 |
|
| Cmnwlth. of PR, Indl. Tourist Edl. Med. & Env. | | | |
| Control Facs. Rev. Bonds (Cogen. Fac.-AES), | | | |
| 6 5/8s, 6/1/26 | Baa3 | 14,800,000 | 14,750,272 |
|
| Cmnwlth. of PR, Infrastructure Fin. Auth. Special | | | |
| Tax, Ser. B, 5s, 7/1/31 | Baa1 | 5,000,000 | 4,877,100 |
|
| Cmnwlth. of PR, Pub. Bldg. Auth. Rev. Bonds | | | |
| (Govt. Fac.), Ser. P, Cmnwlth. of PR Gtd., | | | |
| 6 1/8s, 7/1/23 | Baa1 | 5,500,000 | 6,048,020 |
|
| Cmnwlth. of PR, Sales Tax Fin. Corp. Rev. Bonds | | | |
| Ser. A, 6s, 8/1/42 | A1 | 19,500,000 | 21,155,160 |
| Ser. C, 5 1/4s, 8/1/41 | A1 | 6,250,000 | 6,454,438 |
|
| U. of PR Rev. Bonds | | | |
| Ser. P, 5s, 6/1/26 (Puerto Rico) | Baa1 | 5,000,000 | 5,005,850 |
| Ser. Q, 5s, 6/1/25 (Puerto Rico) | Baa1 | 5,000,000 | 5,032,650 |
|
| | | | 101,978,547 |
| Virgin Islands (0.1%) | | | |
| VI Pub. Fin. Auth. Rev. Bonds, Ser. A, 5s, 10/1/25 | Baa2 | 2,000,000 | 2,037,700 |
|
| | | | 2,037,700 |
|
| |
| TOTAL INVESTMENTS | | | |
|
| Total investments (cost $1,464,237,149) | | | $1,544,283,057 |
Notes to the fund’s portfolio
Unless noted otherwise, the notes to the fund’s portfolio are for the close of the fund’s reporting period, which ran from October 1, 2010 through September 30, 2011 (the reporting period).
* Percentages indicated are based on net assets of $1,556,944,085.
** The Moody’s, Standard & Poor’s or Fitch ratings indicated are believed to be the most recent ratings available at the close of the reporting period for the securities listed. Ratings are generally ascribed to securities at the time of issuance. While the agencies may from time to time revise such ratings, they undertake no obligation to do so, and the ratings do not necessarily represent what the agencies would ascribe to these securities at the close of the reporting period. Securities rated by Putnam are indicated by “/P.” Securities rated by Fitch are indicated by “/F.” The rating of an insured security represents what is believed to be the most recent rating of the insurer’s claims-paying ability available at the close of the reporting period and does not reflect any subsequent changes. Ratings are not covered by the Report of Independent Registered Public Accounting Firm. Security ratings are defined in the Statement of Additional Information.
∆ Forward commitment, in part or in entirety (Note 1).
T Underlying security in a tender option bond transaction. The security has been segregated as collateral for financing transactions.
144A after the name of an issuer represents securities exempt from registration under Rule 144A under the Securities Act of 1933, as amended. These securities may be resold in transactions exempt from registration, normally to qualified institutional buyers.
VRDN are floating-rate securities with a long-term maturity, that carry a coupon that resets every one or seven days. The rates shown are the current interest rates at the close of the reporting period.
33
The dates shown parenthetically on prerefunded bonds represent the next prerefunding dates.
The fund had the following sector concentrations greater than 10% at the close of the reporting period (as a percentage of net assets):
| | | |
| Health care | 18.1% | | |
| Utilities | 16.7 | | |
| State government | 15.6 | | |
Accounting Standards Codification ASC 820 Fair Value Measurements and Disclosures (ASC 820) establishes a three-level hierarchy for disclosure of fair value measurements. The valuation hierarchy is based upon the transparency of inputs to the valuation of the fund’s investments. The three levels are defined as follows:
Level 1 — Valuations based on quoted prices for identical securities in active markets.
Level 2 — Valuations based on quoted prices in markets that are not active or for which all significant inputs are observable, either directly or indirectly.
Level 3 — Valuations based on inputs that are unobservable and significant to the fair value measurement.
The following is a summary of the inputs used to value the fund’s net assets as of the close of the reporting period:
| | | |
| | | Valuation inputs | |
|
| Investments in securities: | Level 1 | Level 2 | Level 3 |
|
| Municipal bonds and notes | $— | $1,544,283,057 | $— |
|
| Totals by level | $— | $1,544,283,057 | $— |
The accompanying notes are an integral part of these financial statements.
34
Statement of assets and liabilities 9/30/11
| |
| ASSETS | |
|
| Investment in securities, at value (Note 1): | |
| Unaffiliated issuers (identified cost $1,464,237,149) | $1,544,283,057 |
|
| Cash | 1,245,086 |
|
| Interest and other receivables | 20,878,576 |
|
| Receivable for shares of the fund sold | 1,287,201 |
|
| Receivable for investments sold | 6,799,198 |
|
| Total assets | 1,574,493,118 |
| |
| LIABILITIES | |
|
| Distributions payable to shareholders | 1,716,388 |
|
| Payable for investments purchased | 2,068,740 |
|
| Payable for purchases of delayed delivery securities (Notes 1) | 1,786,109 |
|
| Payable for shares of the fund repurchased | 3,241,810 |
|
| Payable for compensation of Manager (Note 2) | 571,873 |
|
| Payable for investor servicing fees (Note 2) | 67,179 |
|
| Payable for custodian fees (Note 2) | 5,810 |
|
| Payable for Trustee compensation and expenses (Note 2) | 314,400 |
|
| Payable for administrative services (Note 2) | 6,996 |
|
| Payable for distribution fees (Note 2) | 840,170 |
|
| Payable for floating rate notes issued (Note 1) | 6,814,218 |
|
| Other accrued expenses | 115,340 |
|
| Total liabilities | 17,549,033 |
| | |
| Net assets | $1,556,944,085 |
|
| |
| REPRESENTED BY | |
|
| Paid-in capital (Unlimited shares authorized) (Notes 1 and 4) | $1,542,954,690 |
|
| Undistributed net investment income (Note 1) | 4,597,739 |
|
| Accumulated net realized loss on investments (Note 1) | (70,654,252) |
|
| Net unrealized appreciation of investments and assets and liabilities in foreign currencies | 80,045,908 |
|
| Total — Representing net assets applicable to capital shares outstanding | $1,556,944,085 |
(Continued on next page)
35
Statement of assets and liabilities (Continued)
| |
| COMPUTATION OF NET ASSET VALUE AND OFFERING PRICE | |
|
| Net asset value and redemption price per class A share | |
| ($1,466,160,218 divided by 187,178,826 shares) | $7.83 |
|
| Offering price per class A share (100/96.00 of $7.83)* | $8.16 |
|
| Net asset value and offering price per class B share ($8,614,765 divided by 1,100,748 shares)** | $7.83 |
|
| Net asset value and offering price per class C share ($45,515,912 divided by 5,784,513 shares)** | $7.87 |
|
| Net asset value and redemption price per class M share ($2,589,689 divided by 331,390 shares) | $7.81 |
|
| Offering price per class M share (100/96.75 of $7.81)† | $8.07 |
|
| Net asset value, offering price and redemption price per class Y share | |
| ($34,063,501 divided by 4,339,873 shares) | $7.85 |
|
* On single retail sales of less than $100,000. On sales of $100,000 or more the offering price is reduced.
** Redemption price per share is equal to net asset value less any applicable contingent deferred sales charge.
† On single retail sales of less than $50,000. On sales of $50,000 or more the offering price is reduced.
The accompanying notes are an integral part of these financial statements.
36
Statement of operations Year ended 9/30/11
| |
| INTEREST INCOME | $86,428,900 |
|
| EXPENSES | |
|
| Compensation of Manager (Note 2) | $6,905,376 |
|
| Investor servicing fees (Note 2) | 840,339 |
|
| Custodian fees (Note 2) | 22,937 |
|
| Trustee compensation and expenses (Note 2) | 136,127 |
|
| Administrative services (Note 2) | 44,525 |
|
| Distribution fees — Class A (Note 2) | 3,200,342 |
|
| Distribution fees — Class B (Note 2) | 96,624 |
|
| Distribution fees — Class C (Note 2) | 463,986 |
|
| Distribution fees — Class M (Note 2) | 12,276 |
|
| Interest and fees expense (Note 1) | 43,820 |
|
| Other | 333,328 |
|
| Total expenses | 12,099,680 |
| | |
| Expense reduction (Note 2) | (6,443) |
|
| Net expenses | 12,093,237 |
| | |
| Net investment income | 74,335,663 |
|
| Net realized loss on investments (Notes 1 and 3) | (24,512,470) |
|
| Net unrealized depreciation of investments during the year | (17,221,599) |
|
| Net loss on investments | (41,734,069) |
| | |
| Net increase in net assets resulting from operations | $32,601,594 |
|
The accompanying notes are an integral part of these financial statements.
37
Statement of changes in net assets
| | |
| DECREASE IN NET ASSETS | Year ended 9/30/11 | Year ended 9/30/10 |
|
| Operations: | | |
| Net investment income | $74,335,663 | $79,465,589 |
|
| Net realized loss on investments | (24,512,470) | (22,915,940) |
|
| Net unrealized appreciation (depreciation) of investments | (17,221,599) | 35,180,240 |
|
| Net increase in net assets resulting from operations | 32,601,594 | 91,729,889 |
|
| Distributions to shareholders (Note 1): | | |
| From ordinary income | | |
| Taxable net investment income | | |
|
| Class A | (140,785) | (260,246) |
|
| Class B | (1,247) | (4,010) |
|
| Class C | (4,468) | (7,234) |
|
| Class M | (241) | (486) |
|
| Class Y | (2,327) | (2,987) |
|
| From tax-exempt net investment income | | |
| Class A | (69,830,113) | (75,181,015) |
|
| Class B | (465,858) | (869,052) |
|
| Class C | (1,823,642) | (1,827,073) |
|
| Class M | (109,132) | (137,323) |
|
| Class Y | (1,407,847) | (946,699) |
|
| Increase in capital from settlement payments (Note 5) | 132,294 | — |
|
| Redemption fees (Note 1) | — | 560 |
|
| Decrease from capital share transactions (Note 4) | (124,930,766) | (40,766,308) |
|
| Total decrease in net assets | (165,982,538) | (28,271,984) |
| |
| NET ASSETS | | |
|
| Beginning of year | 1,722,926,623 | 1,751,198,607 |
|
| End of year (including undistributed net investment income of | | |
| $4,597,739 and $4,440,671, respectively) | $1,556,944,085 | $1,722,926,623 |
|
The accompanying notes are an integral part of these financial statements.
38
|
| This page left blank intentionally. |
39
Financial highlights (For a common share outstanding throughout the period)
| | | | | | | | | | | | | | | |
| INVESTMENT OPERATIONS: | | LESS DISTRIBUTIONS: | | RATIOS AND SUPPLEMENTAL DATA: |
|
| | | | | | | | | | | | | | | Ratio | |
| | Net asset | | Net realized | | | | | | | | | | Ratio | of net investment | |
| | value, | | and unrealized | Total from | From | From | | | | | Total return | Net assets, | of expenses | income (loss) | |
| | beginning | Net investment | gain (loss) | investment | net investment | net realized gain | Total | Redemption | Non-recurring | Net asset value, | at net asset | end of period | to average | to average | Portfolio |
| Period ended | of period | income (loss) | on investments | operations | income | on investments | distributions | fees | reimbursements | end of period | value (%) a | (in thousands) | net assets (%) b | net assets (%) | turnover (%) |
|
| Class A | | | | | | | | | | | | | | | |
| September 30, 2011 | $7.99 | .36 | (.16) | .20 | (.36) | — | (.36) | — | — d | $7.83 | 2.75 | $1,466,160 | .75 e | 4.77 e | 9 |
| September 30, 2010 | 7.93 | .36 | .07 | .43 | (.37) | — | (.37) | — c | — | 7.99 | 5.64 | 1,627,229 | .76 e | 4.74 e | 16 |
| September 30, 2009 | 7.30 | .36 | .62 | .98 | (.35) | — | (.35) | — c | — | 7.93 | 14.12 | 1,655,447 | .80 e,f | 4.98 e,f | 26 |
| September 30, 2008 | 8.04 | .35 | (.71) | (.36) | (.34) | (.04) | (.38) | — c | — | 7.30 | (4.69) | 1,666,074 | .77 e | 4.44 e | 48 |
| September 30, 2007 | 8.23 | .35 | (.17) | .18 | (.34) | (.03) | (.37) | — c | — | 8.04 | 2.14 | 1,845,476 | .76 | 4.25 | 36 |
|
| Class B | | | | | | | | | | | | | | | |
| September 30, 2011 | $7.98 | .31 | (.15) | .16 | (.31) | — | (.31) | — | — d | $7.83 | 2.24 | $8,615 | 1.38 e | 4.15 e | 9 |
| September 30, 2010 | 7.92 | .31 | .07 | .38 | (.32) | — | (.32) | — c | — | 7.98 | 4.97 | 15,928 | 1.39 e | 4.14 e | 16 |
| September 30, 2009 | 7.29 | .31 | .63 | .94 | (.31) | — | (.31) | — c | — | 7.92 | 13.37 | 29,276 | 1.44 e,f | 4.35 e,f | 26 |
| September 30, 2008 | 8.04 | .30 | (.72) | (.42) | (.29) | (.04) | (.33) | — c | — | 7.29 | (5.45) | 49,316 | 1.41 e | 3.79 e | 48 |
| September 30, 2007 | 8.22 | .30 | (.17) | .13 | (.28) | (.03) | (.31) | — c | — | 8.04 | 1.63 | 76,150 | 1.40 | 3.60 | 36 |
|
| Class C | | | | | | | | | | | | | | | |
| September 30, 2011 | $8.03 | .30 | (.16) | .14 | (.30) | — | (.30) | — | — d | $7.87 | 1.95 | $45,516 | 1.53 e | 3.99 e | 9 |
| September 30, 2010 | 7.96 | .30 | .08 | .38 | (.31) | — | (.31) | — c | — | 8.03 | 4.95 | 51,872 | 1.54 e | 3.95 e | 16 |
| September 30, 2009 | 7.33 | .30 | .63 | .93 | (.30) | — | (.30) | — c | — | 7.96 | 13.18 | 44,289 | 1.59 e,f | 4.18 e,f | 26 |
| September 30, 2008 | 8.07 | .29 | (.71) | (.42) | (.28) | (.04) | (.32) | — c | — | 7.33 | (5.40) | 34,679 | 1.56 e | 3.66 e | 48 |
| September 30, 2007 | 8.26 | .28 | (.17) | .11 | (.27) | (.03) | (.30) | — c | — | 8.07 | 1.32 | 21,493 | 1.55 | 3.46 | 36 |
|
| Class M | | | | | | | | | | | | | | | |
| September 30, 2011 | $7.97 | .34 | (.16) | .18 | (.34) | — | (.34) | — | — d | $7.81 | 2.45 | $2,590 | 1.03 e | 4.48 e | 9 |
| September 30, 2010 | 7.91 | .34 | .06 | .40 | (.34) | — | (.34) | — c | — | 7.97 | 5.34 | 3,011 | 1.04 e | 4.46 e | 16 |
| September 30, 2009 | 7.28 | .34 | .62 | .96 | (.33) | — | (.33) | — c | — | 7.91 | 13.81 | 3,775 | 1.09 e,f | 4.69 e,f | 26 |
| September 30, 2008 | 8.03 | .33 | (.72) | (.39) | (.32) | (.04) | (.36) | — c | — | 7.28 | (5.11) | 4,358 | 1.06 e | 4.14 e | 48 |
| September 30, 2007 | 8.21 | .32 | (.16) | .16 | (.31) | (.03) | (.34) | — c | — | 8.03 | 1.97 | 4,998 | 1.05 | 3.95 | 36 |
|
| Class Y | | | | | | | | | | | | | | | |
| September 30, 2011 | $8.01 | .38 | (.16) | .22 | (.38) | — | (.38) | — | — d | $7.85 | 2.99 | $34,064 | .53 e | 4.98 e | 9 |
| September 30, 2010 | 7.94 | .38 | .07 | .45 | (.38) | — | (.38) | — c | — | 8.01 | 6.01 | 24,888 | .54 e | 4.95 e | 16 |
| September 30, 2009 | 7.31 | .37 | .63 | 1.00 | (.37) | — | (.37) | — c | — | 7.94 | 14.34 | 18,410 | .59 e,f | 5.18 e,f | 26 |
| September 30, 2008† | 7.96 | .28 | (.66) | (.38) | (.27) | — | (.27) | — c | — | 7.31 | (4.91) * | 10,718 | .42*e | 3.53*e | 48 |
|
See notes to financial highlights at the end of this section.
The accompanying notes are an integral part of these financial statements.
Financial highlights (Continued)
* Not annualized.
† For the period January 2, 2008 (commencement of operations) to September 30, 2008.
a Total return assumes dividend reinvestment and does not reflect the effect of sales charges.
b Includes amounts paid through expense offset arrangements (Note 2).
c Amount represents less than $0.01 per share.
d Reflects a non-recurring reimbursement related to restitution amounts in connection with a distribution plan approved by the SEC which amounted to less than $0.01 per share outstanding on July 21, 2011. Also reflects a non-recurring reimbursement related to short-term trading related lawsuits, which amounted to less than $0.01 per share outstanding on May 11, 2011 (Note 5).
e Includes interest and fee expense associated with borrowings which amounted to the following (Note 1):
| |
| | Percentage of |
| | average net assets |
|
| September 30, 2011 | <0.01% |
|
| September 30, 2010 | <0.01 |
|
| September 30, 2009 | <0.01 |
|
| September 30, 2008 | <0.01 |
|
f Reflects an involuntary contractual expense limitation in effect during the period. As a result of such limitation, the expenses of each class of the fund reflect a reduction as of the following amounts (Note 2):
| |
| | Percentage of |
| | average net assets |
|
| September 30, 2010 | 0.01% |
|
| September 30, 2009 | <0.01 |
|
The accompanying notes are an integral part of these financial statements.
42
Notes to financial statements 9/30/11
Note 1: Significant accounting policies
Putnam California Tax Exempt Income Fund (the fund) is a Massachusetts business trust, which is registered under the Investment Company Act of 1940, as amended, as a diversified, open-end management investment company. The fund seeks as high a level of current income exempt from federal and California personal income tax as Putnam Investment Management, LLC (Putnam Management), the fund’s manager, a wholly-owned subsidiary of Putnam Investments, LLC, believes to be consistent with preservation of capital by investing mainly in bonds that pay interest that is exempt from federal income tax and California personal income tax (but that may be subject to federal alternative minimum tax (AMT)), are investment grade in quality, and have intermediate to long-term maturities (three years or longer). The fund may be affected by economic and political developments in the state of California.
The fund offers class A, class B, class C, class M and class Y shares. Class A and class M shares are sold with a maximum front-end sales charge of 4.00% and 3.25%, respectively, and generally do not pay a contingent deferred sales charge. Class B shares, which convert to class A shares after approximately eight years, do not pay a front-end sales charge and are subject to a contingent deferred sales charge if those shares are redeemed within six years of purchase. Class C shares have a one-year 1.00% contingent deferred sales charge and do not convert to class A shares. The expenses for class A, class B, class C, and class M shares may differ based on the distribution fee of each class, which is identified in Note 2. Class Y shares, which are sold at net asset value, are generally subject to the same expenses as class A, class B, class C, and class M shares, but do not bear a distribution fee. Class Y shares are not available to all investors.
Prior to August 2, 2010, a 1.00% redemption fee applied to certain shares that were redeemed (either by selling or exchanging into another fund) within 7 days of purchase. The redemption fee was accounted for as an addition to paid-in-capital. Effective August 2, 2010, this redemption fee no longer applies to shares redeemed.
Investment income, realized and unrealized gains and losses and expenses of the fund are borne pro-rata based on the relative net assets of each class to the total net assets of the fund, except that each class bears expenses unique to that class (including the distribution fees applicable to such classes). Each class votes as a class only with respect to its own distribution plan or other matters on which a class vote is required by law or determined by the Trustees. If the fund were liquidated, shares of each class would receive their pro-rata share of the net assets of the fund. In addition, the Trustees declare separate dividends on each class of shares.
In the normal course of business, the fund enters into contracts that may include agreements to indemnify another party under given circumstances. The fund’s maximum exposure under these arrangements is unknown as this would involve future claims that may be, but have not yet been, made against the fund. However, the fund’s management team expects the risk of material loss to be remote.
The following is a summary of significant accounting policies consistently followed by the fund in the preparation of its financial statements. The preparation of financial statements is in conformity with accounting principles generally accepted in the United States of America and requires management to make estimates and assumptions that affect the reported amounts of assets and liabilities in the financial statements and the reported amounts of increases and decreases in net assets from operations. Actual results could differ from those estimates. Subsequent events after the Statement of assets and liabilities date through the date that the financial statements were issued have been evaluated in the preparation of the financial statements. Unless otherwise noted, the “reporting period” represents the period from October 1, 2010 through September 30, 2011.
A) Security valuation Tax-exempt bonds and notes are generally valued on the basis of valuations provided by an independent pricing service approved by the Trustees. Such services use information with respect to transactions in bonds, quotations from bond dealers, market transactions in comparable securities and various relationships between securities in determining value. These securities will generally be categorized as Level 2.
Certain investments, including certain restricted and illiquid securities and derivatives, are also valued at fair value following procedures approved by the Trustees. Such valuations and procedures are reviewed periodically by the Trustees. These valuations consider such factors as significant market or specific security events such as interest rate or credit quality changes, various relationships with other securities, discount rates, U.S. Treasury, U.S. swap and credit yields, index levels, convexity exposures and recovery rates. These securities are classified as Level 2 or
43
as Level 3 depending on the priority of the significant inputs. The fair value of securities is generally determined as the amount that the fund could reasonably expect to realize from an orderly disposition of such securities over a reasonable period of time. By its nature, a fair value price is a good faith estimate of the value of a security in a current sale and does not reflect an actual market price, which may be different by a material amount.
B) Security transactions and related investment income Security transactions are recorded on the trade date (the date the order to buy or sell is executed). Gains or losses on securities sold are determined on the identified cost basis. Interest income is recorded on the accrual basis. All premiums/discounts are amortized/accreted on a yield-to-maturity basis. The premium in excess of the call price, if any, is amortized to the call date; thereafter, any remaining premium is amortized to maturity.
Securities purchased or sold on a delayed delivery basis may be settled a month or more after the trade date; interest income is accrued based on the terms of the securities. Losses may arise due to changes in the market value of the underlying securities or if the counterparty does not perform under the contract.
C) Tender option bond transactions The fund may participate in transactions whereby a fixed-rate bond is transferred to a tender option bond trust (TOB trust) sponsored by a broker. The TOB trust funds the purchase of the fixed rate bonds by issuing floating-rate bonds to third parties and allowing the fund to retain the residual interest in the TOB trust’s assets and cash flows, which are in the form of inverse floating rate bonds. The inverse floating rate bonds held by the fund give the fund the right to (1) cause the holders of the floating rate bonds to tender their notes at par, and (2) to have the fixed-rate bond held by the TOB trust transferred to the fund, causing the TOB trust to collapse. The fund accounts for the transfer of the fixed-rate bond to the TOB trust as a secured borrowing by including the fixed-rate bond in the fund’s portfolio and including the floating rate bond as a liability in the Statement of assets and liabilities. At the close of the reporting period, the fund’s investments with a value of $14,190,858 were held by the TOB trust and served as collateral for $6,814,218 in floating-rate bonds outstanding. For the reporting period ended, the fund incurred interest expense of $15,153 for these investments based on an average interest rate of 0.17%.
D) Interfund lending The fund, along with other Putnam funds, may participate in an interfund lending program pursuant to an exemptive order issued by the Securities and Exchange Commission (the SEC). This program allows the fund to borrow from other Putnam funds that permit such transactions. Interfund lending transactions are subject to each fund’s investment policies and borrowing and lending limits. Interest earned or paid on the interfund lending transaction will be based on the average of certain current market rates. During the reporting period, the fund did not utilize the program.
E) Line of credit The fund participates, along with other Putnam funds, in a $325 million unsecured committed line of credit and a $185 million unsecured uncommitted line of credit, both provided by State Street Bank and Trust Company (State Street). Borrowings may be made for temporary or emergency purposes, including the funding of shareholder redemption requests and trade settlements. Interest is charged to the fund based on the fund’s borrowing at a rate equal to the Federal Funds rate plus 1.25% for the committed line of credit and the Federal Funds rate plus 1.30% for the uncommitted line of credit. A closing fee equal to 0.02% of the committed line of credit and $50,000 for the uncommitted line of credit has been paid by the participating funds. In addition, a commitment fee of 0.13% per annum on any unutilized portion of the committed line of credit is allocated to the participating funds based on their relative net assets and paid quarterly. During the reporting period, the fund had no borrowings against these arrangements.
F) Federal taxes It is the policy of the fund to distribute all of its income within the prescribed time period and otherwise comply with the provisions of the Internal Revenue Code of 1986, as amended (the Code), applicable to regulated investment companies. It is also the intention of the fund to distribute an amount sufficient to avoid imposition of any excise tax under Section 4982 of the Code. The fund is subject to the provisions of Accounting Standards Codification ASC 740 Income Taxes (ASC 740). ASC 740 sets forth a minimum threshold for financial statement recognition of the benefit of a tax position taken or expected to be taken in a tax return. The fund did not have a liability to record for any unrecognized tax benefits in the accompanying financial statements. No provision has been made for federal taxes on income, capital gains or unrealized appreciation on securities held nor for excise tax on income and capital gains. Each of the fund’s federal tax returns for the prior three fiscal years remains subject to examination by the Internal Revenue Service.
44
At September 30, 2011 the fund had a capital loss carryover of $45,190,306 available to the extent allowed by the Code to offset future net capital gain, if any. The amounts of the carryovers and the expiration dates are:
| | |
| Loss carryover | | Expiration |
|
| $766,815 | | September 30, 2016 |
|
| 12,478,683 | | September 30, 2017 |
|
| 1,872,123 | | September 30, 2018 |
|
| 30,072,685 | | September 30, 2019 |
|
Under the recently enacted Regulated Investment Company Modernization Act of 2010, the fund will be permitted to carry forward capital losses incurred in taxable years beginning after December 22, 2010 for an unlimited period. However, any losses incurred during those future years will be required to be utilized prior to the losses incurred in pre-enactment tax years. As a result of this ordering rule, pre-enactment capital loss carryforwards may be more likely to expire unused. Additionally, post-enactment capital losses that are carried forward will retain their character as either short-term or long-term capital losses rather than being considered all short-term as under previous law.
Pursuant to federal income tax regulations applicable to regulated investment companies, the fund has elected to defer to its fiscal year ending September 30, 2012 $22,857,572 of losses recognized during the period from November 1, 2010 to September 30, 2011.
G) Distributions to shareholders Income dividends are recorded daily by the fund and are paid monthly. Distributions from capital gains, if any, are recorded on the ex-dividend date and paid at least annually. The amount and character of income and gains to be distributed are determined in accordance with income tax regulations which may differ from generally accepted accounting principles. These differences include temporary and/ or permanent differences of post-October loss deferrals, dividends payable, market discount, and straddle loss deferrals. Reclassifications are made to the fund’s capital accounts to reflect income and gains available for distribution (or available capital loss carryovers) under income tax regulations. For the reporting period ended, the fund reclassified $392,935 to decrease undistributed net investment income and $132,340 to decrease paid-in-capital, with a decrease to accumulated net realized losses of $525,275.
The tax basis components of distributable earnings and the federal tax cost as of the close of the reporting period were as follows:
| |
| Unrealized appreciation | $96,485,540 |
| Unrealized depreciation | (17,439,489) |
|
| Net unrealized appreciation | 79,046,051 |
| Undistributed tax-exempt income | 5,952,482 |
| Undistributed ordinary income | 361,645 |
| Capital loss carryforward | (45,190,306) |
| Post-October loss | (22,857,572) |
| Cost for federal income tax purposes | $1,465,237,006 |
Note 2: Management fee, administrative services and other transactions
The fund pays Putnam Management a management fee (based on the fund’s average net assets and computed and paid monthly) at annual rates that may vary based on the average of the aggregate net assets of most open-end funds, as defined in the fund’s management contract, sponsored by Putnam Management. Such annual rates may vary as follows:
| | | |
| 0.590% | of the first $5 billion, | | |
| 0.540% | of the next $5 billion, | | |
| 0.490% | of the next $10 billion, | | |
| 0.440% | of the next $10 billion, | | |
| 0.390% | of the next $50 billion, | | |
| 0.370% | of the next $50 billion, | | |
| 0.360% | of the next $100 billion, | | |
| 0.355% | of any excess thereafter. | | |
45
Putnam Management has contractually agreed, through June 30, 2012, to waive fees or reimburse the fund’s expenses to the extent necessary to limit the cumulative expenses of the fund, exclusive of brokerage, interest, taxes, investment-related expenses, extraordinary expenses and payments under the fund’s investor servicing contract, investment management contract and distribution plans, on a fiscal year-to-date basis to an annual rate of 0.20% of the fund’s average net assets over such fiscal year-to-date period. During the reporting period, the fund’s expenses were not reduced as a result of this limit.
Putnam Investments Limited (PIL), an affiliate of Putnam Management, is authorized by the Trustees to manage a separate portion of the assets of the fund as determined by Putnam Management from time to time. Putnam Management pays a quarterly sub-management fee to PIL for its services at an annual rate of 0.40% of the average net assets of the portion of the fund managed by PIL.
The fund reimburses Putnam Management an allocated amount for the compensation and related expenses of certain officers of the fund and their staff who provide administrative services to the fund. The aggregate amount of all such reimbursements is determined annually by the Trustees.
Custodial functions for the fund’s assets are provided by State Street. Custody fees are based on the fund’s asset level, the number of its security holdings and transaction volumes.
Putnam Investor Services, Inc., an affiliate of Putnam Management, provides investor servicing agent functions to the fund. Putnam Investor Services, Inc. received fees for investor servicing based on the fund’s retail asset level, the number of shareholder accounts in the fund and the level of defined contribution plan assets in the fund. Investor servicing fees will not exceed an annual rate of 0.375% of the fund’s average net assets. The amounts incurred for investor servicing agent functions during the reporting period are included in Investor servicing fees in the Statement of operations.
The fund has entered into expense offset arrangements with Putnam Investor Services, Inc. and State Street whereby Putnam Investor Services, Inc.’s and State Street’s fees are reduced by credits allowed on cash balances. For the reporting period, the fund’s expenses were reduced by $6,443 under the expense offset arrangements.
Each independent Trustee of the fund receives an annual Trustee fee, of which $1,049, as a quarterly retainer, has been allocated to the fund, and an additional fee for each Trustees meeting attended. Trustees also are reimbursed for expenses they incur relating to their services as Trustees.
The fund has adopted a Trustee Fee Deferral Plan (the Deferral Plan) which allows the Trustees to defer the receipt of all or a portion of Trustees fees payable on or after July 1, 1995. The deferred fees remain invested in certain Putnam funds until distribution in accordance with the Deferral Plan.
The fund has adopted an unfunded noncontributory defined benefit pension plan (the Pension Plan) covering all Trustees of the fund who have served as a Trustee for at least five years and were first elected prior to 2004. Benefits under the Pension Plan are equal to 50% of the Trustee’s average annual attendance and retainer fees for the three years ended December 31, 2005. The retirement benefit is payable during a Trustee’s lifetime, beginning the year following retirement, for the number of years of service through December 31, 2006. Pension expense for the fund is included in Trustee compensation and expenses in the Statement of operations. Accrued pension liability is included in Payable for Trustee compensation and expenses in the Statement of assets and liabilities. The Trustees have terminated the Pension Plan with respect to any Trustee first elected after 2003.
The fund has adopted distribution plans (the Plans) with respect to its class A, class B, class C and class M shares pursuant to Rule 12b–1 under the Investment Company Act of 1940. The purpose of the Plans is to compensate Putnam Retail Management Limited Partnership, a wholly-owned subsidiary of Putnam Investments, LLC and Putnam Retail Management GP, Inc., for services provided and expenses incurred in distributing shares of the fund. The Plans provide for payments by the fund to Putnam Retail Management Limited Partnership at an annual rate of up to 0.35%, 1.00%, 1.00% and 1.00% of the average net assets attributable to class A, class B, class C and class M shares, respectively. The Trustees have approved payment by the fund at the annual rate of 0.85%, 1.00% and 0.50% of the average net assets for class B, class C and class M shares, respectively. For class A shares, the annual payment rate will equal the weighted average of (i) 0.20% on the net assets of the fund attributable to class A shares purchased and paid for prior to April 1, 2005 and (ii) 0.25% on all other net assets of the fund attributable to class A shares.
For the reporting period, Putnam Retail Management Limited Partnership, acting as underwriter, received net commissions of $91,448 and $308 from the sale of class A and class M shares, respectively, and received $10,542 and $4,985 in contingent deferred sales charges from redemptions of class B and class C shares, respectively.
46
A deferred sales charge of up to 1.00% is assessed on certain redemptions of class A shares exchanged from other Putnam funds that were purchased without an initial sales charge. For the reporting period, Putnam Retail Management Limited Partnership, acting as underwriter, received $1,959 on class A redemptions.
Note 3: Purchases and sales of securities
During the reporting period, cost of purchases and proceeds from sales of investment securities other than short-term investments aggregated $129,790,323 and $288,629,086, respectively. There were no purchases or proceeds from sales of long-term U.S. government securities.
Note 4: Capital shares
At the close of the reporting period, there was an unlimited number of shares of beneficial interest authorized. Transactions in capital shares were as follows:
| | | | |
| | Year ended 9/30/11 | Year ended 9/30/10 |
|
| Class A | Shares | Amount | Shares | Amount |
|
| Shares sold | 10,566,546 | $80,748,686 | 13,850,119 | $107,555,397 |
|
| Shares issued in connection with | | | | |
| reinvestment of distributions | 6,404,774 | 48,439,599 | 5,788,996 | 44,839,819 |
|
| | 16,971,320 | 129,188,285 | 19,639,115 | 152,395,216 |
|
| Shares repurchased | (33,412,037) | (251,398,459) | (24,856,214) | (192,601,332) |
|
| Net decrease | (16,440,717) | $(122,210,174) | (5,217,099) | $(40,206,116) |
|
| |
| | Year ended 9/30/11 | Year ended 9/30/10 |
|
| Class B | Shares | Amount | Shares | Amount |
|
| Shares sold | 88,935 | $673,338 | 280,105 | $2,166,631 |
|
| Shares issued in connection with | | | | |
| reinvestment of distributions | 42,463 | 320,749 | 71,293 | 549,775 |
|
| | 131,398 | 994,087 | 351,398 | 2,716,406 |
|
| Shares repurchased | (1,025,501) | (7,738,496) | (2,053,563) | (15,844,516) |
|
| Net decrease | (894,103) | $(6,744,409) | (1,702,165) | $(13,128,110) |
|
| |
| | Year ended 9/30/11 | Year ended 9/30/10 |
|
| Class C | Shares | Amount | Shares | Amount |
|
| Shares sold | 1,198,840 | $9,229,185 | 2,069,842 | $16,127,453 |
|
| Shares issued in connection with | | | | |
| reinvestment of distributions | 169,191 | 1,285,764 | 165,265 | 1,285,647 |
|
| | 1,368,031 | 10,514,949 | 2,235,107 | 17,413,100 |
|
| Shares repurchased | (2,045,752) | (15,443,490) | (1,335,932) | (10,374,152) |
|
| Net increase (decrease) | (677,721) | $(4,928,541) | 899,175 | $7,038,948 |
|
| |
| | Year ended 9/30/11 | Year ended 9/30/10 |
|
| Class M | Shares | Amount | Shares | Amount |
|
| Shares sold | 36,171 | $282,326 | 19,479 | $151,832 |
|
| Shares issued in connection with | | | | |
| reinvestment of distributions | 11,352 | 85,740 | 11,430 | 88,310 |
|
| | 47,523 | 368,066 | 30,909 | 240,142 |
|
| Shares repurchased | (93,708) | (718,116) | (130,630) | (995,140) |
|
| Net decrease | (46,185) | $(350,050) | (99,721) | $(754,998) |
|
47
| | | | |
| | Year ended 9/30/11 | Year ended 9/30/10 |
|
| Class Y | Shares | Amount | Shares | Amount |
|
| Shares sold | 2,609,037 | $19,753,684 | 1,505,193 | $11,803,134 |
|
| Shares issued in connection with | | | | |
| reinvestment of distributions | 121,397 | 921,164 | 93,599 | 726,183 |
|
| | 2,730,434 | 20,674,848 | 1,598,792 | 12,529,317 |
|
| Shares repurchased | (1,499,398) | (11,372,440) | (808,621) | (6,245,349) |
|
| Net increase | 1,231,036 | $9,302,408 | 790,171 | $6,283,968 |
|
Note 5: Regulatory matters and litigation
In late 2003 and 2004, Putnam Management settled charges brought by the SEC and the Massachusetts Securities Division in connection with excessive short-term trading in Putnam funds. In July 2011, the fund recorded a receivable of $129,861 related to restitution amounts in connection with a distribution plan approved by the SEC. This amount is reported in the Increase in capital from settlement payments line on the Statement of changes in net assets. These allegations and related matters have served as the general basis for certain lawsuits, including purported class action lawsuits against Putnam Management and, in a limited number of cases, some Putnam funds. In May 2011, the fund received a payment of $2,433 related to settlement of those lawsuits. This amount is reported in the Increase in capital from settlement payments line on the Statement of changes in net assets. Putnam Management has agreed to bear any costs incurred by the Putnam funds as a result of these matters.
Note 6: Market and credit risk
In the normal course of business, the fund trades financial instruments and enters into financial transactions where risk of potential loss exists due to changes in the market (market risk) or failure of the contracting party to the transaction to perform (credit risk). The fund may be exposed to additional credit risk that an institution or other entity with which the fund has unsettled or open transactions will default.
48
Federal tax information (Unaudited)
The fund has designated 99.8% of dividends paid from net investment income during the reporting period as tax exempt for Federal income tax purposes.
The Form 1099 that will be mailed to you in January 2012 will show the tax status of all distributions paid to your account in calendar 2011.
49
About the Trustees
| | |
| Independent Trustees | |
| Name | | |
| Year of birth | | |
| Position held | Principal occupations during past five years | Other directorships |
|
| Ravi Akhoury | Advisor to New York Life Insurance Company. Trustee of | Jacob Ballas Capital |
| Born 1947 | American India Foundation and of the Rubin Museum. | India, a non-banking |
| Trustee since 2009 | From 1992 to 2007, was Chairman and CEO of MacKay | finance company |
| | Shields, a multi-product investment management firm | focused on private |
| | with over $40 billion in assets under management. | equity advisory services; |
| | | RAGE Frameworks, |
| | | Inc., a private software |
| | | company |
|
| Barbara M. Baumann | President and Owner of Cross Creek Energy Corporation, | SM Energy Company, a |
| Born 1955 | a strategic consultant to domestic energy firms and direct | domestic exploration |
| Trustee since 2010 | investor in energy projects. Trustee of Mount Holyoke | and production |
| | College and member of the Investment Committee for the | company; UniSource |
| | college’s endowment. Former Chair and current board | Energy Corporation, |
| | member of Girls Incorporated of Metro Denver. Member of | an Arizona utility; CVR |
| | the Finance Committee, The Children’s Hospital of Denver. | Energy, a petroleum |
| | | refiner and fertilizer |
| | | manufacturer |
|
| Jameson A. Baxter | President of Baxter Associates, Inc., a private investment | None |
| Born 1943 | firm. Chair of Mutual Fund Directors Forum. Chair Emeritus | |
| Trustee since 1994, | of the Board of Trustees of Mount Holyoke College. | |
| Vice Chair from 2005 | Director of the Adirondack Land Trust and Trustee of the | |
| to 2011, and Chair | Nature Conservancy’s Adirondack Chapter. | |
| since 2011 | | |
|
| Charles B. Curtis | Former President and Chief Operating Officer of the | Edison International; |
| Born 1940 | Nuclear Threat Initiative, a private foundation dealing | Southern California |
| Trustee since 2001 | with national security issues. Senior Advisor to the Center | Edison |
| for Strategic and International Studies. Member of the | |
| | Council on Foreign Relations. | |
|
| Robert J. Darretta | Health Care Industry Advisor to Permira, a global private | UnitedHealth |
| Born 1946 | equity firm. Until April 2007, was Vice Chairman of the | Group, a diversified |
| Trustee since 2007 | Board of Directors of Johnson & Johnson. Served as | health-care company |
| Johnson & Johnson’s Chief Financial Officer for a decade. | |
|
| John A. Hill | Founder and Vice-Chairman of First Reserve | Devon Energy |
| Born 1942 | Corporation, the leading private equity buyout firm | Corporation, a leading |
| Trustee since 1985 and | focused on the worldwide energy industry. Serves as a | independent natural gas |
| Chairman from 2000 | Trustee and Chairman of the Board of Trustees of Sarah | and oil exploration and |
| to 2011 | Lawrence College. Also a member of the Advisory Board | production company |
| | of the Millstein Center for Corporate Governance and | |
| | Performance at the Yale School of Management. | |
|
50
| | |
| Name | | |
| Year of birth | | |
| Position held | Principal occupations during past five years | Other directorships |
|
| Paul L. Joskow | Economist and President of the Alfred P. Sloan | TransCanada |
| Born 1947 | Foundation, a philanthropic institution focused primarily | Corporation, an energy |
| Trustee since 1997 | on research and education on issues related to science, | company focused on |
| | technology, and economic performance. Elizabeth and | natural gas transmission |
| | James Killian Professor of Economics, Emeritus at the | and power services; |
| | Massachusetts Institute of Technology (MIT). Prior to | Exelon Corporation, an |
| | 2007, served as the Director of the Center for Energy and | energy company focused |
| | Environmental Policy Research at MIT. | on power services |
|
| Kenneth R. Leibler | Founder and former Chairman of Boston Options | Northeast Utilities, |
| Born 1949 | Exchange, an electronic marketplace for the trading | which operates New |
| Trustee since 2006 | of derivative securities. Vice Chairman of the Board of | England’s largest energy |
| | Trustees of Beth Israel Deaconess Hospital in Boston, | delivery system |
| Massachusetts. Until November 2010, director of Ruder | |
| Finn Group, a global communications and advertising firm. | |
|
| Robert E. Patterson | Senior Partner of Cabot Properties, LP and Co-Chairman | None |
| Born 1945 | of Cabot Properties, Inc., a private equity firm investing in | |
| Trustee since 1984 | commercial real estate. Past Chairman and Trustee of the | |
| | Joslin Diabetes Center. | |
|
| George Putnam, III | Chairman of New Generation Research, Inc., a publisher | None |
| Born 1951 | of financial advisory and other research services, and | |
| Trustee since 1984 | founder and President of New Generation Advisors, LLC, | |
| | a registered investment advisor to private funds. | |
| Director of The Boston Family Office, LLC, a registered | |
| | investment advisor. | |
|
| W. Thomas Stephens | Retired as Chairman and Chief Executive Officer of Boise | TransCanadaPipelines |
| Born 1942 | Cascade, LLC, a paper, forest products, and timberland | Ltd., an energy |
| Trustee from 1997 to 2008 | assets company, in December 2008. Prior to 2010, | infrastructure company |
| and since 2009 | Director of Boise Inc., a manufacturer of paper and | |
| | packaging products. | |
|
| Interested Trustee | | |
|
| Robert L. Reynolds* | President and Chief Executive Officer of Putnam | None |
| Born 1952 | Investments since 2008. Prior to joining Putnam | |
| Trustee since 2008 and | Investments, served as Vice Chairman and Chief | |
| President of the Putnam | Operating Officer of Fidelity Investments from | |
| Funds since July 2009 | 2000 to 2007. | |
|
The address of each Trustee is One Post Office Square, Boston, MA 02109.
As of September 30, 2011, there were 107 Putnam funds. All Trustees serve as Trustees of all Putnam funds.
Each Trustee serves for an indefinite term, until his or her resignation, retirement at age 72, removal, or death.
* Mr. Reynolds is an “interested person” (as defined in the Investment Company Act of 1940) of the fund, Putnam Management, and/or Putnam Retail Management. He is President and Chief Executive Officer of Putnam Investments, as well as the President of your fund and each of the other Putnam funds.
51
Officers
In addition to Robert L. Reynolds, the other officers of the fund are shown below:
| |
| Jonathan S. Horwitz (Born 1955) | Robert T. Burns (Born 1961) |
| Executive Vice President, Principal Executive | Vice President and Chief Legal Officer |
| Officer, Treasurer and Compliance Liaison | Since 2011 |
| Since 2004 | General Counsel, Putnam Investments and |
| | Putnam Management |
| Steven D. Krichmar (Born 1958) | |
| Vice President and Principal Financial Officer | James P. Pappas (Born 1953) |
| Since 2002 | Vice President |
| Chief of Operations, Putnam Investments and | Since 2004 |
| Putnam Management | Director of Trustee Relations, |
| | Putnam Investments and Putnam Management |
| Janet C. Smith (Born 1965) | |
| Vice President, Assistant Treasurer and | Judith Cohen (Born 1945) |
| Principal Accounting Officer | Vice President, Clerk and Assistant Treasurer |
| Since 2007 | Since 1993 |
| Director of Fund Administration Services, | |
| Putnam Investments and Putnam Management | Michael Higgins (Born 1976) |
| | Vice President, Senior Associate Treasurer and |
| Beth S. Mazor (Born 1958) | Assistant Clerk |
| Vice President | Since 2010 |
| Since 2002 | Manager of Finance, Dunkin’ Brands (2008– |
| Manager of Trustee Relations, Putnam | 2010); Senior Financial Analyst, Old Mutual Asset |
| Investments and Putnam Management | Management (2007–2008); Senior Financial |
| | Analyst, Putnam Investments (1999–2007) |
| Robert R. Leveille (Born 1969) | |
| Vice President and Chief Compliance Officer | Nancy E. Florek (Born 1957) |
| Since 2007 | Vice President, Assistant Clerk, Assistant |
| Chief Compliance Officer, Putnam Investments, | Treasurer and Proxy Manager |
| Putnam Management, and Putnam Retail | Since 2000 |
| Management | |
| | Susan G. Malloy (Born 1957) |
| Mark C. Trenchard (Born 1962) | Vice President and Assistant Treasurer |
| Vice President and BSA Compliance Officer | Since 2007 |
| Since 2002 | Director of Accounting & Control Services, |
| Director of Operational Compliance, | Putnam Management |
| Putnam Investments and Putnam | |
| Retail Management | |
The principal occupations of the officers for the past five years have been with the employers as shown above although in some cases, they have held different positions with such employers. The address of each Officer is One Post Office Square, Boston, MA 02109.
52
Fund information
Founded over 70 years ago, Putnam Investments was built around the concept that a balance between risk and reward is the hallmark of a well-rounded financial program. We manage over 100 funds across income, value, blend, growth, asset allocation, absolute return, and global sector categories.
| | |
| Investment Manager | Robert J. Darretta | Robert R. Leveille |
| Putnam Investment | John A. Hill | Vice President and |
| Management, LLC | Paul L. Joskow | Chief Compliance Officer |
| One Post Office Square | Kenneth R. Leibler | |
| Boston, MA 02109 | Robert E. Patterson | Mark C. Trenchard |
| | George Putnam, III | Vice President and |
| Investment Sub-Manager | Robert L. Reynolds | BSA Compliance Officer |
| Putnam Investments Limited | W. Thomas Stephens | |
| 57–59 St James’s Street | | Robert T. Burns |
| London, England SW1A 1LD | Officers | Vice President and |
| | Robert L. Reynolds | Chief Legal Officer |
| Marketing Services | President | |
| Putnam Retail Management | | James P. Pappas |
| One Post Office Square | Jonathan S. Horwitz | Vice President |
| Boston, MA 02109 | Executive Vice President, | |
| | Principal Executive | Judith Cohen |
| Custodian | Officer, Treasurer and | Vice President, Clerk and |
| State Street Bank | Compliance Liaison | Assistant Treasurer |
| and Trust Company | | |
| | Steven D. Krichmar | Michael Higgins |
| Legal Counsel | Vice President and | Vice President, Senior Associate |
| Ropes & Gray LLP | Principal Financial Officer | Treasurer and Assistant Clerk |
| | | |
| Independent Registered | Janet C. Smith | Nancy E. Florek |
| Public Accounting Firm | Vice President, Assistant | Vice President, Assistant Clerk, |
| KPMG LLP | Treasurer and Principal | Assistant Treasurer and |
| | Accounting Officer | Proxy Manager |
| Trustees | | |
| Jameson A. Baxter, Chair | Beth S. Mazor | Susan G. Malloy |
| Ravi Akhoury | Vice President | Vice President and |
| Barbara M. Baumann | | Assistant Treasurer |
| Charles B. Curtis | | |
This report is for the information of shareholders of Putnam California Tax Exempt Income Fund. It may also be used as sales literature when preceded or accompanied by the current prospectus, the most recent copy of Putnam’s Quarterly Performance Summary, and Putnam’s Quarterly Ranking Summary. For more recent performance, please visit putnam.com. Investors should carefully consider the investment objectives, risks, charges, and expenses of a fund, which are described in its prospectus. For this and other information or to request a prospectus or summary prospectus, call 1-800-225-1581 toll free. Please read the prospectus carefully before investing. The fund’s Statement of Additional Information contains additional information about the fund’s Trustees and is available without charge upon request by calling 1-800-225-1581.
| |
| (a) The fund’s principal executive, financial and accounting officers are employees of Putnam Investment Management, LLC, the Fund’s investment manager. As such they are subject to a comprehensive Code of Ethics adopted and administered by Putnam Investments which is designed to protect the interests of the firm and its clients. The Fund has adopted a Code of Ethics which incorporates the Code of Ethics of Putnam Investments with respect to all of its officers and Trustees who are employees of Putnam Investment Management, LLC. For this reason, the Fund has not adopted a separate code of ethics governing its principal executive, financial and accounting officers. |
| |
| (c) In May 2008, the Code of Ethics of Putnam Investment Management, LLC was updated in its entirety to include the amendments adopted in August 2007 as well as a several additional technical, administrative and non-substantive changes. In May of 2009, the Code of Ethics of Putnam Investment Management, LLC was amended to reflect that all employees will now be subject to a 90-day blackout restriction on holding Putnam open-end funds, except for portfolio managers and their supervisors (and each of their immediate family members), who will be subject to a one-year blackout restriction on the funds that they manage or supervise. In June 2010, the Code of Ethics of Putnam Investments was updated in its entirety to include the amendments adopted in May of 2009 and to change certain rules and limits contained in the Code of Ethics. In addition, the updated Code of Ethics included numerous technical, administrative and non-substantive changes, which were intended primarily to make the document easier to navigate and understand. In July 2011, the Code of Ethics of Putnam Investments was updated to reflect several technical, administrative and non-substantive changes resulting from changes in employee titles. |
| |
| Item 3. Audit Committee Financial Expert: |
| |
| The Funds’ Audit and Compliance Committee is comprised solely of Trustees who are “independent” (as such term has been defined by the Securities and Exchange Commission (“SEC”) in regulations implementing Section 407 of the Sarbanes-Oxley Act (the “Regulations”)). The Trustees believe that each of the members of the Audit and Compliance Committee also possess a combination of knowledge and experience with respect to financial accounting matters, as well as other attributes, that qualify them for service on the Committee. In addition, the Trustees have determined that each of Mr. Leibler, Mr. Hill, Mr. Darretta and Ms. Baumann qualifies as an “audit committee financial expert” (as such term has been defined by the Regulations) based on their review of his or her pertinent experience and education. The SEC has stated that the designation or identification of a person as an audit committee financial expert pursuant to this Item 3 of Form N-CSR does not impose on such person any duties, obligations or liability that are greater than the duties, obligations and liability imposed on such person as a member of the Audit and Compliance Committee and the Board of Trustees in the absence of such designation or identification. |
| |
| Item 4. Principal Accountant Fees and Services: |
| |
| The following table presents fees billed in each of the last two fiscal years for services rendered to the fund by the fund’s independent auditor: |
| | | | | |
| Fiscal year ended | Audit Fees | Audit-Related Fees | Tax Fees | All Other Fees |
|
|
| | | | | |
| September 30, 2011 | $59,344 | $-- | $6,100 | $ — |
| September 30, 2010 | $50,591 | $-- | $5,800 | $ — |
| |
| For the fiscal years ended September 30, 2011and September 30, 2010, the fund’s independent auditor billed aggregate non-audit fees in the amounts of $6,100 and $5,800 respectively, to the fund, Putnam Management and any entity controlling, controlled by or under common control with Putnam Management that provides ongoing services to the fund. |
| |
| Audit Fees represent fees billed for the fund’s last two fiscal years relating to the audit and review of the financial statements included in annual reports and registration statements, and other services that are normally provided in connection with statutory and regulatory filings or engagements. |
| |
| Audit-Related Fees represent fees billed in the fund’s last two fiscal years for services traditionally performed by the fund’s auditor, including accounting consultation for proposed transactions or concerning financial accounting and reporting standards and other audit or attest services not required by statute or regulation. |
| |
| Tax Fees represent fees billed in the fund’s last two fiscal years for tax compliance, tax planning and tax advice services. Tax planning and tax advice services include assistance with tax audits, employee benefit plans and requests for rulings or technical advice from taxing authorities. |
| |
| Pre-Approval Policies of the Audit and Compliance Committee. The Audit and Compliance Committee of the Putnam funds has determined that, as a matter of policy, all work performed for the funds by the funds’ independent auditors will be pre-approved by the Committee itself and thus will generally not be subject to pre-approval procedures. |
| |
| The Audit and Compliance Committee also has adopted a policy to pre-approve the engagement by Putnam Management and certain of its affiliates of the funds’ independent auditors, even in circumstances where pre-approval is not required by applicable law. Any such requests by Putnam Management or certain of its affiliates are typically submitted in writing to the Committee and explain, among other things, the nature of the proposed engagement, the estimated fees, and why this work should be performed by that particular audit firm as opposed to another one. In reviewing such requests, the Committee considers, among other things, whether the provision of such services by the audit firm are compatible with the independence of the audit firm. |
| |
| The following table presents fees billed by the fund’s independent auditor for services required to be approved pursuant to paragraph (c)(7)(ii) of Rule 2-01 of Regulation S-X. |
| | | | | |
| Fiscal year ended | Audit-Related Fees | Tax Fees | All Other Fees | Total Non-Audit Fees |
|
|
| | | | | |
| September 30, 2011 | $ — | $ — | $ — | $ — |
| | | | | |
| September 30, 2010 | $ — | $ — | $ — | $ — |
| |
| Item 5. Audit Committee of Listed Registrants |
| |
| Item 6. Schedule of Investments: |
| |
| The registrant’s schedule of investments in unaffiliated issuers is included in the report to shareholders in Item 1 above. |
| |
| Item 7. Disclosure of Proxy Voting Policies and Procedures For Closed-End Management Investment Companies: |
| |
| Item 8. Portfolio Managers of Closed-End Investment Companies |
| |
| Item 9. Purchases of Equity Securities by Closed-End Management Investment Companies and Affiliated Purchasers: |
| |
| Item 10. Submission of Matters to a Vote of Security Holders: |
| |
| Item 11. Controls and Procedures: |
| |
| (a) The registrant’s principal executive officer and principal financial officer have concluded, based on their evaluation of the effectiveness of the design and operation of the registrant’s disclosure controls and procedures as of a date within 90 days of the filing date of this report, that the design and operation of such procedures are generally effective to provide reasonable assurance that information required to be disclosed by the registrant in this report is recorded, processed, summarized and reported within the time periods specified in the Commission’s rules and forms. |
| |
| (b) Changes in internal control over financial reporting: Not applicable |
| |
| (a)(1) The Code of Ethics of The Putnam Funds, which incorporates the Code of Ethics of Putnam Investments, is filed herewith. |
| |
| (a)(2) Separate certifications for the principal executive officer and principal financial officer of the registrant as required by Rule 30a-2(a) under the Investment Company Act of 1940, as amended, are filed herewith. |
| |
| (b) The certifications required by Rule 30a-2(b) under the Investment Company Act of 1940, as amended, are filed herewith. |
| |
| Pursuant to the requirements of the Securities Exchange Act of 1934 and the Investment Company Act of 1940, the registrant has duly caused this report to be signed on its behalf by the undersigned, thereunto duly authorized. |
| |
| Putnam California Tax Exempt Income Fund |
| |
| By (Signature and Title): |
| |
| /s/Janet C. Smith
Janet C. Smith
Principal Accounting Officer
|
| |
| Pursuant to the requirements of the Securities Exchange Act of 1934 and the Investment Company Act of 1940, this report has been signed below by the following persons on behalf of the registrant and in the capacities and on the dates indicated. |
| |
| By (Signature and Title): |
| |
| /s/Jonathan S. Horwitz
Jonathan S. Horwitz
Principal Executive Officer
|
| |
| By (Signature and Title): |
| |
| /s/Steven D. Krichmar
Steven D. Krichmar
Principal Financial Officer
|