CERTIFIED SHAREHOLDER REPORT OF REGISTERED MANAGEMENT INVESTMENT COMPANIES
Investment Company Act file number:
(811-03630)
Exact name of registrant as specified in charter:
Putnam California Tax Exempt Income Fund
Address of principal executive offices:
One Post Office Square, Boston, Massachusetts 02109
Name and address of agent for service:
Robert T. Burns, Vice President One Post Office Square Boston, Massachusetts 02109
Copy to:
Bryan Chegwidden, Esq. Ropes & Gray LLP 1211 Avenue of the Americas New York, New York 10036
Registrant’s telephone number, including area code:
(617) 292-1000
Date of fiscal year end:
September 30, 2014
Date of reporting period :
October 1, 2013 — September 30, 2014
Item 1. Report to Stockholders:
The following is a copy of the report transmitted to stockholders pursuant to Rule 30e-1 under the Investment Company Act of 1940:
Putnam California Tax Exempt Income Fund
Annual report 9 | 30 | 14
Message from the Trustees
1
About the fund
2
Performance snapshot
4
Interview with your fund’s portfolio manager
5
Your fund’s performance
11
Your fund’s expenses
14
Terms and definitions
16
Other information for shareholders
17
Important notice regarding Putnam’s privacy policy
18
Trustee approval of management contract
19
Financial statements
24
Federal tax information
51
Shareholder meeting results
52
About the Trustees
53
Officers
55
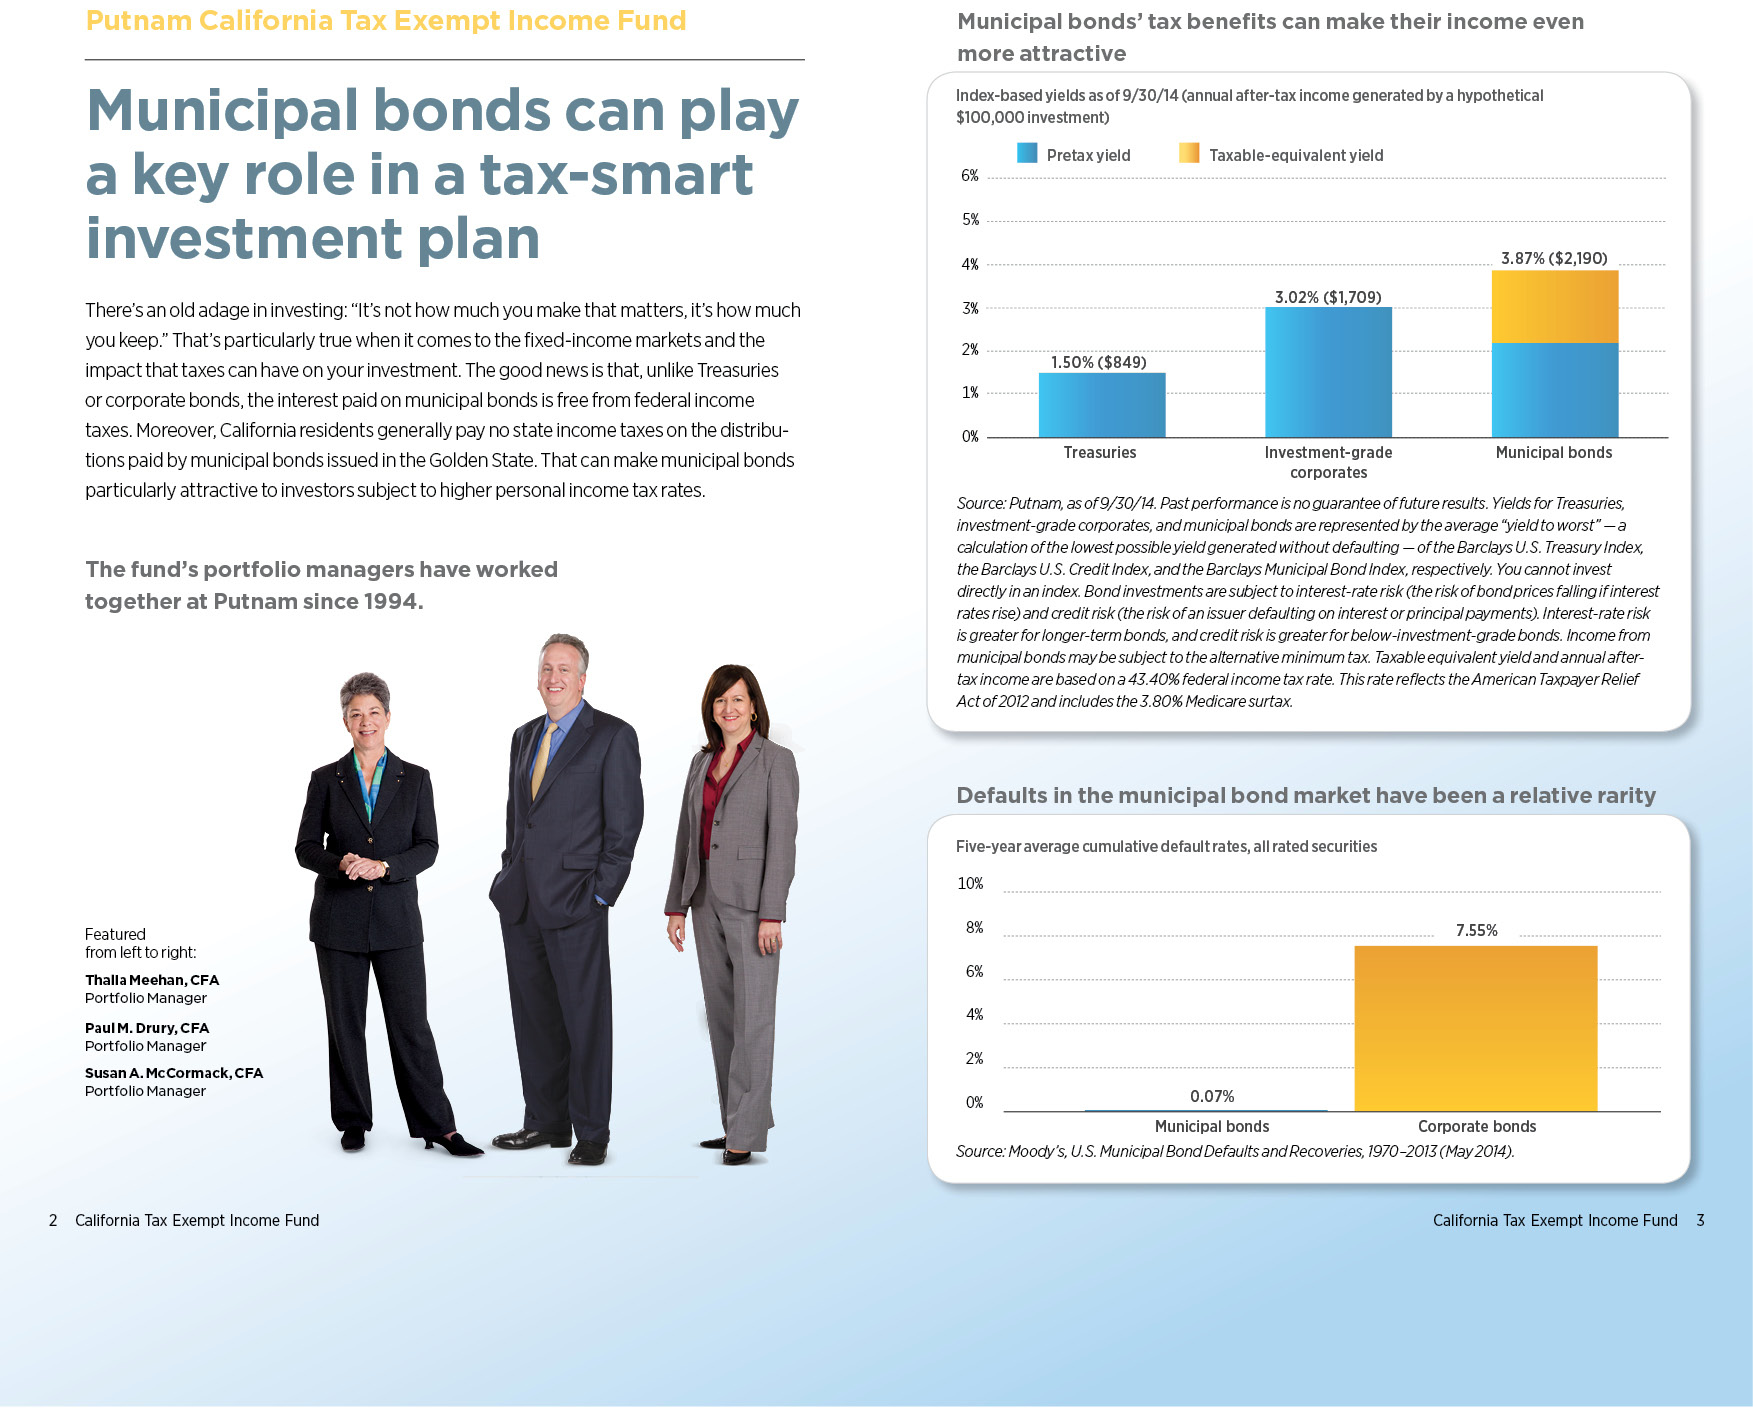
Consider these risks before investing: Bond prices may fall or fail to rise over time for several reasons, including general financial market conditions, changing market perceptions of the risk of default, changes in government intervention, and factors related to a specific issuer or industry. These factors may also lead to periods of high volatility and reduced liquidity in the bond markets. Single-state investments are at risk of common economic forces and other factors affecting a state’s tax-exempt investments. This may result in greater losses and volatility. Capital gains, if any, are taxed at the federal and, in most cases, state levels. For some investors, investment income may be subject to the federal alternative minimum tax. Bond investments are subject to interest-rate risk (the risk of bond prices falling if interest rates rise) and credit risk (the risk of an issuer defaulting on interest or principal payments). Interest-rate risk is greater for longer-term bonds, and credit risk is greater for below-investment-grade bonds. Unlike bonds, funds that invest in bonds have fees and expenses. Tax-exempt bonds may be issued under the Internal Revenue Code only by limited types of issuers for limited types of projects. As a result, the fund’s investments may be focused in certain market segments and be more vulnerable to fluctuations in the values of the securities it holds than a more broadly invested fund. Interest the fund receives might be taxable. You can lose money by investing in the fund.
Message from the Trustees
Dear Fellow Shareholder:
With the U.S. economy on firmer footing, the U.S. Federal Reserve has wound down its quantitative easing efforts, which were achieved through purchases of government securities and other financial assets. Now, a new chapter begins for the markets, including the likelihood that the central bank will initiate interest-rate increases in the middle of next year. At the same time, changes are likely at hand in fixed-income markets. With the Fed ending its asset purchases, the government will need to find other buyers for its newly issued securities.
The hope is that the recovery today is strong enough to foster self-sustaining growth without the help of the central bank. In fact, after years of modest growth, it appears that the U.S. economy is positioned to expand at a more vigorous pace, as indicated by an annualized GDP growth rate above 4% in the second quarter.
Amid these transitions, the stock market experienced high volatility, with sharp declines in October. These drops may be tied to the Ebola health crisis, ongoing global threats, and divergent growth rates between the U.S. and non-U.S. economies. Still, strong domestic growth, we believe, bodes well for corporate earnings and equity prices, even if interest rates were to rise. Also of importance, U.S. corporate revenue growth has started to bounce back.
During this transitional time for the markets and the economy, we encourage you to meet with your financial advisor to ensure that your portfolio is properly diversified and aligned with your objectives and risk tolerance. Keep in mind that Putnam offers a wide range of strategies for all environments, as well as new ways of thinking about building portfolios for today’s markets.
As always, thank you for investing with Putnam.
Respectfully yours,
Robert L. Reynolds President and Chief Executive Officer Putnam Investments
Jameson A. Baxter Chair, Board of Trustees
November 11, 2014
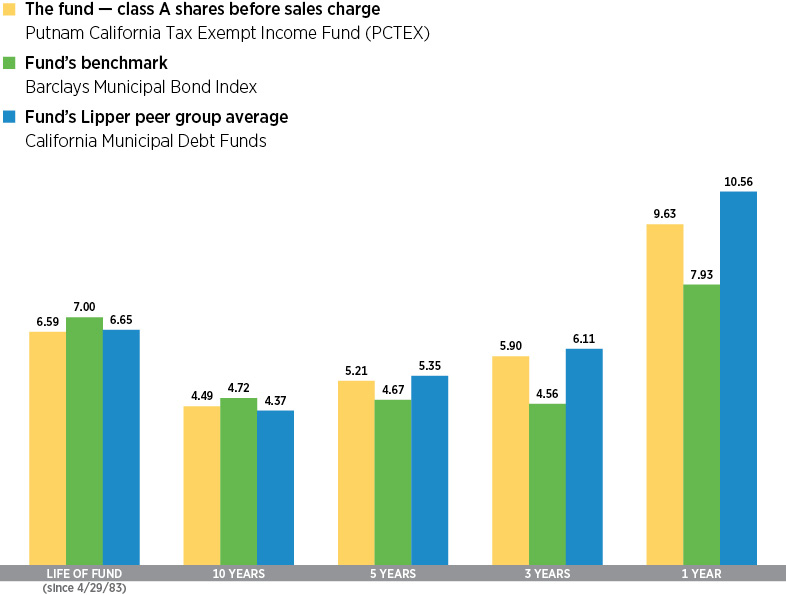
Performance snapshot
Annualized total return (%) comparison as of 9/30/14
Current performance may be lower or higher than the quoted past performance, which cannot guarantee future results. Share price, principal value, and return will fluctuate, and you may have a gain or a loss when you sell your shares. Performance of class A shares assumes reinvestment of distributions and does not account for taxes. Fund returns in the bar chart do not reflect a sales charge of 4.00%; had they, returns would have been lower. See pages 5 and 11–13 for additional performance information. For a portion of the periods, the fund had expense limitations, without which returns would have been lower. To obtain the most recent month-end performance, visit putnam.com.
4 California Tax Exempt Income Fund
Interview with your fund’s portfolio manager
Thalia Meehan, CFA
What was the market environment like for municipal bonds during the 12 months ended September 30, 2014?
After a challenging start for rate-sensitive investments in the early months of the reporting period, U.S. interest rates fell during much of the period despite improving economic data. By early spring of 2014, a relative calm had descended on the financial markets, as the European Central Bank took unprecedented steps to reinvigorate the eurozone economy. Meanwhile, the Federal Reserve continued to scale back its stimulative bond-buying program while affirming its commitment to low interest rates. Investors also seemed reassured that Fed Chair Janet Yellen could keep inflation in check without having to increase the central bank’s benchmark interest rate during this transitional phase.
In the final months of the period, the macroeconomic backdrop caused yields to move lower as geopolitical tensions in Ukraine, Iraq, and Gaza fed a flight-to-safety bid for fixed-income securities. Investor anxiety also rose in response to the Scottish independence vote, the possibility of heftier European sanctions against Russia, and weak growth in China. And while the U.S. economy was perceived as being fairly stable and interest rates were expected to remain low, investors became more cautious about the potential impact of the Fed’s raising interest rates in 2015.
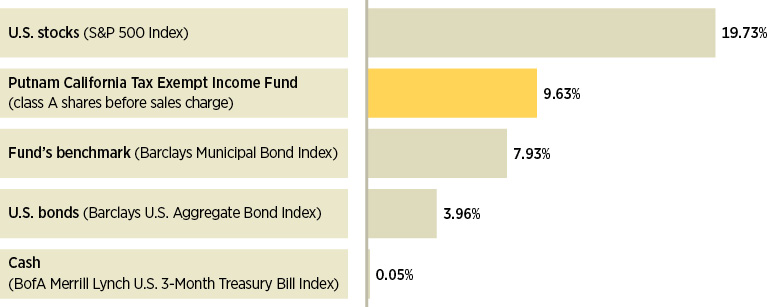
Broad market index and fund performance
This comparison shows your fund’s performance in the context of broad market indexes for the 12 months ended 9/30/14. See pages 4 and 11–13 for additional fund performance information. Index descriptions can be found on page 16.
California Tax Exempt Income Fund 5
How did Putnam California Tax Exempt Income Fund perform against this backdrop?
For much of the reporting period, the macroeconomic backdrop and easy-money policies from central banks around the globe helped to keep interest rates low and to drive municipal bond prices higher. Furthermore, technical factors also lent price support to municipal bonds, as strong investor demand continued to surpass supply. For the 12 months ended September 30, 2014, the fund delivered a solid return that surpassed its benchmark, the Barclays Municipal Bond Index, but lagged the average return of its Lipper peer group.
While the gap is closing, new issue supply remains lower than demand year over year. What is contributing to this trend?
On a year-to-date basis through September 2014, long-term issuance in the municipal bond market is down about 10% from the level for the same period in 2013. [Source: Bond Buyer] The declining volume of new long-term municipal bonds coming to market is due, in part, to state and local governments undertaking fewer projects while turning their fiscal attention toward funding employee pensions and other fixed costs in their budgets.
This more modest level of supply has not kept pace with the solid demand from traditional tax-sensitive retail investors. In addition, crossover buyers and hedge fund investors
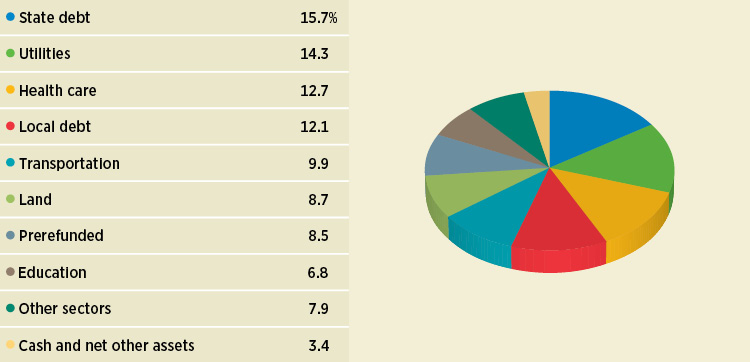
Sector allocations
Allocations are shown as a percentage of the fund’s net assets as of 9/30/14. Cash and net other assets, if any, represent the market value weights of cash, derivatives, short-term securities, and other unclassified assets in the portfolio. Summary information may differ from the information in the portfolio schedule notes included in the financial statements due to the inclusion of derivative securities, any interest accruals, and the use of different classifications of securities for presentation purposes. Holdings and allocations may vary over time.
6 California Tax Exempt Income Fund
“Against a backdrop of low rates and modest-to-moderate growth, municipal bonds continued to surprise on the upside.”
Thalia Meehan
have also been drawn to the competitive yields and attractive relative value offered by this asset class rather than by its tax benefit. In 2013, the municipal market was plagued by mutual fund outflows, but in 2014 positive inflows to tax-free mutual funds, primarily tax-free high-yield and intermediate-term bond funds, have been strong sources of demand. Thus, with interest rates still low and fundamental credit quality improving, there has been greater investor appetite for yields offered by the relatively riskier municipal bonds further out on the maturity spectrum as well as for those in the lower-rated, higher-yielding sectors.
Some isolated credit situations continue to make headlines, but would you say that the creditworthiness of the municipal bond market remains strong?
Overall, the fundamental credit outlook for municipal bonds remains solid, in our opinion. For calendar year 2013, bankruptcy filings represented 0.07% of the $3.6 trillion municipal bond market — well below the long-term average of 7.55% for global corporate bonds, according to Moody’s [U.S. Municipal Bond Defaults and Recoveries, 1970–2013 (May 2014)]. The default rate has
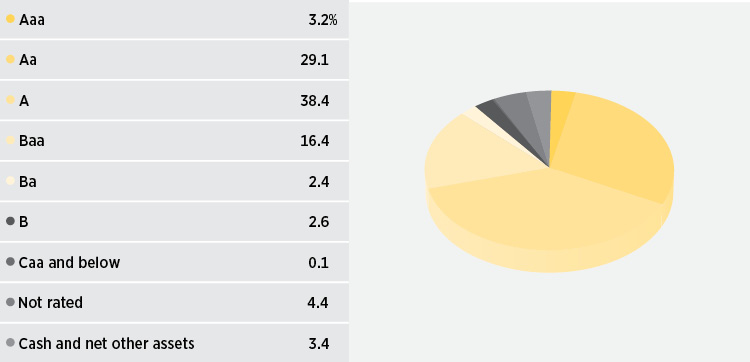
Credit quality overview
Credit qualities are shown as a percentage of the fund’s net assets as of 9/30/14. A bond rated Baa or higher (MIG3/VMIG3 or higher, for short-term debt) is considered investment grade. The chart reflects Moody’s ratings; percentages may include bonds or derivatives not rated by Moody’s but rated by Standard & Poor’s (S&P) or, if unrated by S&P, by Fitch ratings, and then included in the closest equivalent Moody’s rating based on analysis of these agencies’ respective ratings criteria. Moody’s ratings are used in recognition of Moody’s’ prominence among rating agencies and breadth of coverage of rated securities. Ratings may vary over time.
Cash and net other assets, if any, represent the market value weights of cash, derivatives, short-term securities, and other unclassified assets in the portfolio. The fund itself has not been rated by an independent rating agency.
California Tax Exempt Income Fund 7
remained low in 2014 to date, and we don’t believe defaults will increase meaningfully in the near future. Of course, there are outliers, such as Detroit and Puerto Rico, that have garnered much media attention, but for the most part, these are isolated credit situations.
At the state level, we have seen improvement across the board, and most state fiscal situations are stable. State tax receipts increased for 16 straight quarters during the 2010 to 2013 time frame.
How was the fund positioned during the reporting period?
We maintained our defensive bias in the portfolio because we believed that the municipal bond market’s attractive returns thus far in 2014 could be attributed primarily to a combination of lower rates and strong market technicals. We kept the fund’s duration positioning, or interest-rate sensitivity, below that of its Lipper peer group. This included maintaining a slightly higher cash position in the portfolio to help shelter it from price pressures given the risk of interest rates moving higher. We also believed carrying a slightly higher-than-average cash balance afforded the fund greater flexibility to purchase attractively valued bonds even in a rising-rate environment.
We continued to emphasize essential service revenue bonds, which are typically issued by state and local government entities to finance specific revenue-generating projects. While we believed that conditions were improving at the state and local levels, we continued
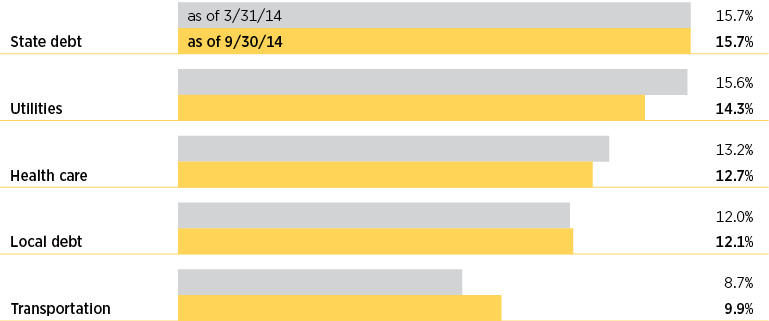
Comparison of top sector weightings
This chart shows how the fund’s top weightings have changed over the past six months. Allocations are shown as a percentage of the fund’s net assets. Current period summary information may differ from the information in the portfolio schedule notes included in the financial statements due to the inclusion of derivative securities, any interest accruals, and the use of different classifications of securities for presentation purposes. Holdings and allocations may vary over time.
8 California Tax Exempt Income Fund
to underweight local G.O. [general obligation] bonds relative to the benchmark. These securities rely on the taxing power of the issuer and the health of the local economy to make payments.
Relative to the benchmark, the fund retained an overweight exposure to municipal bonds rated A and Baa. In terms of sectors, we favored transportation, higher education, essential service utilities, industrial, and continuing-care retirement community bonds in the portfolio relative to its Lipper peer group. Overall, this credit positioning contributed positively to performance. Our shorter-duration interest-rate positioning was one of the biggest detractors for relative performance versus our peers, as interest rates moved lower during the period. Underweight exposures to Puerto Rico bonds also dampened results. However, we plan to maintain our underweight exposure to issuers in Puerto Rico given our negative credit outlook for the Commonwealth.
What factors are likely to influence the performance of municipal bonds in the coming months?
Against a backdrop of low interest rates and modest-to-moderate growth, municipal bonds continued to surprise on the upside during the reporting period, delivering solid performance that, on a year-to-date basis through September 30, exceeded most fixed-income alternatives and that of many equity asset classes.
While the midterm elections in November and the potential for tax reform will be on the minds of investors, we believe the most significant driver of municipal bond returns in the coming months will be the Fed’s interest-rate policy. The central bank’s decision to begin increasing its benchmark federal funds rate from near zero is expected to depend on the pace of the U.S. recovery and further improvement in the labor market. Most observers anticipate that the Fed will begin raising interest rates sometime in mid-2015. Thus, we believe future performance of municipal bonds will be highly influenced by movements in U.S. Treasuries.
It has become more challenging to find attractively valued municipal bonds given the run-up in prices thus far in 2014. We see our fundamental credit research as key to finding relative value in the municipal market and providing income and return potential going forward.
Thank you, Thalia, for your time and insights today.
The views expressed in this report are exclusively those of Putnam Management and are subject to change. They are not meant as investment advice.
Please note that the holdings discussed in this report may not have been held by the fund for the entire period. Portfolio composition is subject to review in accordance with the fund’s investment strategy and may vary in the future. Current and future portfolio holdings are subject to risk.
Portfolio Manager Thalia Meehan holds a B.A. from Williams College. She joined Putnam in 1989 and has been in the investment industry since 1983.
In addition to Thalia, your fund’s portfolio managers are Paul M. Drury, CFA, and Susan A. McCormack, CFA.
California Tax Exempt Income Fund 9
IN THE NEWS
Tumbling oil prices, which dropped at least 20% from June to October 2014, signaled the beginning of a bear market caused by a vast oversupply of oil and weakening global demand. Shale gas and oil production extraction methods have helped boost U.S. oil production to 8.7 million barrels per day in September, the highest since July 1986, according to the Energy Information Administration. This output has greatly increased oil supplies worldwide. Rather than focus on lowering production in order to push prices higher, the 12-nation Organization of Petroleum Exporting Countries (OPEC) has opted to increase output and sell off reserves at a deep discount to struggling economies in Asia and Europe. Falling demand is also playing a role in the price drop. The International Energy Agency has cut its 2014 and 2015 estimates for oil demand to levels last seen in 2009, the most recent global recessionary period. With continued downward pressure on the world’s oil markets, there is a silver lining — some U.S. drivers have seen gasoline prices dip below $3 per gallon.
10 California Tax Exempt Income Fund
Your fund’s performance
This section shows your fund’s performance, price, and distribution information for periods ended September 30, 2014, the end of its most recent fiscal year. In accordance with regulatory requirements for mutual funds, we also include expense information taken from the fund’s current prospectus. Performance should always be considered in light of a fund’s investment strategy. Data represent past performance. Past performance does not guarantee future results. More recent returns may be less or more than those shown. Investment return and principal value will fluctuate, and you may have a gain or a loss when you sell your shares. Performance information does not reflect any deduction for taxes a shareholder may owe on fund distributions or on the redemption of fund shares. For the most recent month-end performance, please visit the Individual Investors section at putnam.com or call Putnam at 1-800-225-1581. Class Y shares are not available to all investors. See the Terms and Definitions section in this report for definitions of the share classes offered by your fund.
Fund performance Total return for periods ended 9/30/14
Class A
Class B
Class C
Class M
Class Y
(inception dates)
(4/29/83)
(1/4/93)
(7/26/99)
(2/14/95)
(1/2/08)
Before sales charge
After sales charge
Before CDSC
After CDSC
Before CDSC
After CDSC
Before sales charge
After sales charge
Net asset value
Annual average
(life of fund)
6.59%
6.45%
6.36%
6.36%
5.74%
5.74%
6.19%
6.08%
6.64%
10 years
55.13
48.92
47.61
47.61
43.39
43.39
50.60
45.71
57.73
Annual average
4.49
4.06
3.97
3.97
3.67
3.67
4.18
3.84
4.66
5 years
28.94
23.78
24.93
22.93
24.02
24.02
27.03
22.90
30.45
Annual average
5.21
4.36
4.55
4.22
4.40
4.40
4.90
4.21
5.46
3 years
18.77
14.02
16.41
13.41
15.92
15.92
17.68
13.86
19.50
Annual average
5.90
4.47
5.20
4.28
5.05
5.05
5.58
4.42
6.12
1 year
9.63
5.25
8.96
3.96
8.73
7.73
9.22
5.67
9.85
Current performance may be lower or higher than the quoted past performance, which cannot guarantee future results. After-sales-charge returns for class A and M shares reflect the deduction of the maximum 4.00% and 3.25% sales charge, respectively, levied at the time of purchase. Class B share returns after contingent deferred sales charge (CDSC) reflect the applicable CDSC, which is 5% in the first year, declining over time to 1% in the sixth year, and is eliminated thereafter. Class C share returns after CDSC reflect a 1% CDSC for the first year that is eliminated thereafter. Class Y shares have no initial sales charge or CDSC. Performance for class B, C, M, and Y shares before their inception is derived from the historical performance of class A shares, adjusted for the applicable sales charge (or CDSC) and the higher operating expenses for such shares, except for class Y shares, for which 12b-1 fees are not applicable.
For a portion of the periods, the fund had expense limitations, without which returns would have been lower.
Class B share performance reflects conversion to class A shares after eight years.
California Tax Exempt Income Fund 11
Comparative index returns For periods ended 9/30/14
Barclays Municipal Bond Index
Lipper California Municipal Debt Funds category average*
Annual average (life of fund)
7.00%
6.65%
10 years
58.67
53.57
Annual average
4.72
4.37
5 years
25.65
29.85
Annual average
4.67
5.35
3 years
14.32
19.50
Annual average
4.56
6.11
1 year
7.93
10.56
Index and Lipper results should be compared with fund performance before sales charge, before CDSC, or at net asset value.
*Over the 1-year, 3-year, 5-year, 10-year, and life-of-fund periods ended 9/30/14, there were 125, 112, 107, 84, and 3 funds, respectively, in this Lipper category.
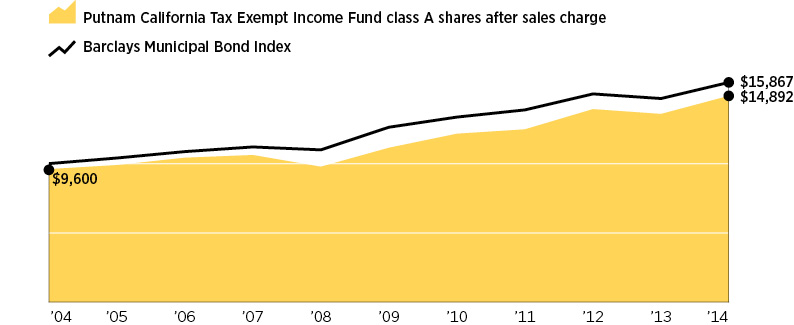
Change in the value of a $10,000 investmentb ($9,600 after sales charge)
Cumulative total return from 9/30/04 to 9/30/14
Past performance does not indicate future results. At the end of the same time period, a $10,000 investment in the fund’s class B and class C shares would have been valued at $14,761 and $14,339, respectively, and no contingent deferred sales charges would apply. A $10,000 investment in the fund’s class M shares ($9,675 after sales charge) would have been valued at $14,571. A $10,000 investment in the fund’s class Y shares would have been valued at $15,773.
12 California Tax Exempt Income Fund
Fund price and distribution information For the 12-month period ended 9/30/14
Distributions
Class A
Class B
Class C
Class M
Class Y
Number
12
12
12
12
12
Income 1
$0.317559
$0.266896
$0.254454
$0.294978
$0.334858
Capital gains 2
—
—
—
—
—
Total
$0.317559
$0.266896
$0.254454
$0.294978
$0.334858
Share value
Before sales charge
After sales charge
Net asset value
Net asset value
Before sales charge
After sales charge
Net asset value
9/30/13
$7.81
$8.14
$7.80
$7.85
$7.79
$8.05
$7.83
9/30/14
8.23
8.57
8.22
8.27
8.20
8.48
8.25
Current rate (end of period)
Before sales charge
After sales charge
Net asset value
Net asset value
Before sales charge
After sales charge
Net asset value
Current dividend rate 3
3.86%
3.71%
3.23%
3.06%
3.59%
3.47%
4.06%
Taxable equivalent 4
7.87
7.56
6.58
6.24
7.32
7.07
8.27
Current 30-day SEC yield 5
N/A
2.18
1.64
1.49
N/A
1.92
2.48
Taxable equivalent 4
N/A
4.44
3.34
3.04
N/A
3.91
5.05
The classification of distributions, if any, is an estimate. Before-sales-charge share value and current dividend rate for class A and M shares, if applicable, do not take into account any sales charge levied at the time of purchase. After-sales-charge share value, current dividend rate, and current 30-day SEC yield, if applicable, are calculated assuming that the maximum sales charge (4.00% for class A shares and 3.25% for class M shares) was levied at the time of purchase. Final distribution information will appear on your year-end tax forms.
1 For some investors, investment income may be subject to the federal alternative minimum tax.
2 Capital gains, if any, are taxable for federal and, in most cases, state purposes.
3 Most recent distribution, including any return of capital and excluding capital gains, annualized and divided by share price before or after sales charge at period-end.
4 Assumes maximum 50.93% federal and state combined tax rate for 2014. Results for investors subject to lower tax rates would not be as advantageous.
5 Based only on investment income and calculated using the maximum offering price for each share class, in accordance with SEC guidelines.
California Tax Exempt Income Fund 13
Your fund’s expenses
As a mutual fund investor, you pay ongoing expenses, such as management fees, distribution fees (12b-1 fees), and other expenses. Using the following information, you can estimate how these expenses affect your investment and compare them with the expenses of other funds. You may also pay one-time transaction expenses, including sales charges (loads) and redemption fees, which are not shown in this section and would have resulted in higher total expenses. For more information, see your fund’s prospectus or talk to your financial representative.
Expense ratios
Class A
Class B
Class C
Class M
Class Y
Total annual operating expenses for the fiscal year ended 9/30/13
0.74%
1.37%
1.52%
1.02%
0.52%
Annualized expense ratio for the six-month period ended 9/30/14*
0.73%
1.36%
1.51%
1.01%
0.51%
Fiscal-year expense information in this table is taken from the most recent prospectus, is subject to change, and may differ from that shown for the annualized expense ratio and in the financial highlights of this report.
Expenses are shown as a percentage of average net assets.
*For the fund’s most recent fiscal half year; may differ from expense ratios based on one-year data in the financial highlights.
Expenses per $1,000
The following table shows the expenses you would have paid on a $1,000 investment in the fund from April 1, 2014 to September 30, 2014. It also shows how much a $1,000 investment would be worth at the close of the period, assuming actual returns and expenses.
Class A
Class B
Class C
Class M
Class Y
Expenses paid per $1,000*†
$3.75
$6.98
$7.74
$5.18
$2.62
Ending value (after expenses)
$1,050.00
$1,046.70
$1,045.60
$1,047.40
$1,051.00
*Expenses for each share class are calculated using the fund’s annualized expense ratio for each class, which represents the ongoing expenses as a percentage of average net assets for the six months ended 9/30/14. The expense ratio may differ for each share class.
†Expenses are calculated by multiplying the expense ratio by the average account value for the period; then multiplying the result by the number of days in the period; and then dividing that result by the number of days in the year.
14 California Tax Exempt Income Fund
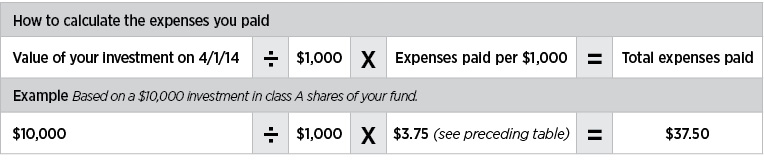
Estimate the expenses you paid
To estimate the ongoing expenses you paid for the six months ended September 30, 2014, use the following calculation method. To find the value of your investment on April 1, 2014, call Putnam at 1-800-225-1581.
Compare expenses using the SEC’s method
The Securities and Exchange Commission (SEC) has established guidelines to help investors assess fund expenses. Per these guidelines, the following table shows your fund’s expenses based on a $1,000 investment, assuming a hypothetical 5% annualized return. You can use this information to compare the ongoing expenses (but not transaction expenses or total costs) of investing in the fund with those of other funds. All mutual fund shareholder reports will provide this information to help you make this comparison. Please note that you cannot use this information to estimate your actual ending account balance and expenses paid during the period.
Class A
Class B
Class C
Class M
Class Y
Expenses paid per $1,000*†
$3.70
$6.88
$7.64
$5.11
$2.59
Ending value (after expenses)
$1,021.41
$1,018.25
$1,017.50
$1,020.00
$1,022.51
*Expenses for each share class are calculated using the fund’s annualized expense ratio for each class, which represents the ongoing expenses as a percentage of average net assets for the six months ended 9/30/14. The expense ratio may differ for each share class.
†Expenses are calculated by multiplying the expense ratio by the average account value for the six-month period; then multiplying the result by the number of days in the six-month period; and then dividing that result by the number of days in the year.
California Tax Exempt Income Fund 15
Terms and definitions
Important terms
Total return shows how the value of the fund’s shares changed over time, assuming you held the shares through the entire period and reinvested all distributions in the fund.
Before sales charge, or net asset value, is the price, or value, of one share of a mutual fund, without a sales charge. Before-sales-charge figures fluctuate with market conditions, and are calculated by dividing the net assets of each class of shares by the number of outstanding shares in the class.
After sales charge is the price of a mutual fund share plus the maximum sales charge levied at the time of purchase. After-sales-charge performance figures shown here assume the 4.00% maximum sales charge for class A shares and 3.25% for class M shares.
Contingent deferred sales charge (CDSC) is generally a charge applied at the time of the redemption of class B or C shares and assumes redemption at the end of the period. Your fund’s class B CDSC declines over time from a 5% maximum during the first year to 1% during the sixth year. After the sixth year, the CDSC no longer applies. The CDSC for class C shares is 1% for one year after purchase.
Share classes
Class A shares are generally subject to an initial sales charge and no CDSC (except on certain redemptions of shares bought without an initial sales charge).
Class B shares are not subject to an initial sales charge. They may be subject to a CDSC.
Class C shares are not subject to an initial sales charge and are subject to a CDSC only if the shares are redeemed during the first year.
Class M shares have a lower initial sales charge and a higher 12b-1 fee than class A shares and no CDSC (except on certain redemptions of shares bought without an initial sales charge).
Class Y shares are not subject to an initial sales charge or CDSC, and carry no 12b-1 fee. They are generally only available to corporate and institutional clients and clients in other approved programs.
Fixed-income terms
Current rate is the annual rate of return earned from dividends or interest of an investment. Current rate is expressed as a percentage of the price of a security, fund share, or principal investment.
Yield curve is a graph that plots the yields of bonds with equal credit quality against their differing maturity dates, ranging from shortest to longest. It is used as a benchmark for other debt, such as mortgage or bank lending rates.
Comparative indexes
Barclays Municipal Bond Index is an unmanaged index of long-term fixed-rate investment-grade tax-exempt bonds.
Barclays U.S. Aggregate Bond Index is an unmanaged index of U.S. investment-grade fixed-income securities.
BofA Merrill Lynch U.S. 3-Month Treasury Bill Index is an unmanaged index that seeks to measure the performance of U.S. Treasury bills available in the marketplace.
S&P 500 Index is an unmanaged index of common stock performance.
Indexes assume reinvestment of all distributions and do not account for fees. Securities and performance of a fund and an index will differ. You cannot invest directly in an index.
Lipper is a third-party industry-ranking entity that ranks mutual funds. Its rankings do not reflect sales charges. Lipper rankings are based on total return at net asset value
16 California Tax Exempt Income Fund
relative to other funds that have similar current investment styles or objectives as determined by Lipper. Lipper may change a fund’s category assignment at its discretion. Lipper category averages reflect performance trends for funds within a category.
Other information for shareholders
Proxy voting
Putnam is committed to managing our mutual funds in the best interests of our shareholders. The Putnam funds’ proxy voting guidelines and procedures, as well as information regarding how your fund voted proxies relating to portfolio securities during the 12-month period ended June 30, 2014, are available in the Individual Investors section of putnam.com, and on the Securities and Exchange Commission (SEC) website, www.sec.gov. If you have questions about finding forms on the SEC’s website, you may call the SEC at 1-800-SEC-0330. You may also obtain the Putnam funds’ proxy voting guidelines and procedures at no charge by calling Putnam’s Shareholder Services at 1-800-225-1581.
Fund portfolio holdings
The fund will file a complete schedule of its portfolio holdings with the SEC for the first and third quarters of each fiscal year on Form N-Q. Shareholders may obtain the fund’s Form N-Q on the SEC’s website at www.sec.gov. In addition, the fund’s Form N-Q may be reviewed and copied at the SEC’s Public Reference Room in Washington, D.C. You may call the SEC at 1-800-SEC-0330 for information about the SEC’s website or the operation of the Public Reference Room.
Trustee and employee fund ownership
Putnam employees and members of the Board of Trustees place their faith, confidence, and, most importantly, investment dollars in Putnam mutual funds. As of September 30, 2014, Putnam employees had approximately $489,000,000 and the Trustees had approximately $137,000,000 invested in Putnam mutual funds. These amounts include investments by the Trustees’ and employees’ immediate family members as well as investments through retirement and deferred compensation plans.
California Tax Exempt Income Fund 17
Important notice regarding Putnam’s privacy policy
In order to conduct business with our shareholders, we must obtain certain personal information such as account holders’ names, addresses, Social Security numbers, and dates of birth. Using this information, we are able to maintain accurate records of accounts and transactions.
It is our policy to protect the confidentiality of our shareholder information, whether or not a shareholder currently owns shares of our funds. In particular, it is our policy not to sell information about you or your accounts to outside marketing firms. We have safeguards in place designed to prevent unauthorized access to our computer systems and procedures to protect personal information from unauthorized use.
Under certain circumstances, we must share account information with outside vendors who provide services to us, such as mailings and proxy solicitations. In these cases, the service providers enter into confidentiality agreements with us, and we provide only the information necessary to process transactions and perform other services related to your account. Finally, it is our policy to share account information with your financial representative, if you’ve listed one on your Putnam account.
18 California Tax Exempt Income Fund
Trustee approval of management contract
General conclusions
The Board of Trustees of the Putnam funds oversees the management of each fund and, as required by law, determines annually whether to approve the continuance of your fund’s management contract with Putnam Investment Management, LLC (“Putnam Management”) and the sub-management contract with respect to your fund between Putnam Management and its affiliate, Putnam Investments Limited (“PIL”). The Board of Trustees, with the assistance of its Contract Committee, requests and evaluates all information it deems reasonably necessary under the circumstances in connection with its annual contract review. The Contract Committee consists solely of Trustees who are not “interested persons” (as this term is defined in the Investment Company Act of 1940, as amended (the “1940 Act”)) of the Putnam funds (“Independent Trustees”).
At the outset of the review process, members of the Board’s independent staff and independent legal counsel met with representatives of Putnam Management to review the annual contract review materials furnished to the Contract Committee during the course of the previous year’s review and to discuss possible changes in these materials that might be necessary or desirable for the coming year. Following these discussions and in consultation with the Contract Committee, the Independent Trustees’ independent legal counsel requested that Putnam Management furnish specified information, together with any additional information that Putnam Management considered relevant, to the Contract Committee. Over the course of several months ending in June 2014, the Contract Committee met on a number of occasions with representatives of Putnam Management, and separately in executive session, to consider the information that Putnam Management provided, as well as supplemental information provided in response to additional requests made by the Contract Committee. Throughout this process, the Contract Committee was assisted by the members of the Board’s independent staff and by independent legal counsel for the Putnam funds and the Independent Trustees.
In May 2014, the Contract Committee met in executive session to discuss and consider its preliminary recommendations with respect to the continuance of the contracts. At the Trustees’ June 20, 2014 meeting, the Contract Committee met in executive session with the other Independent Trustees to review a summary of the key financial, performance and other data that the Contract Committee considered in the course of its review. The Contract Committee then presented its written report, which summarized the key factors that the Committee had considered and set forth its final recommendations. The Contract Committee then recommended, and the Independent Trustees approved, the continuance of your fund’s management and sub-management contracts, effective July 1, 2014. (Because PIL is an affiliate of Putnam Management and Putnam Management remains fully responsible for all services provided by PIL, the Trustees have not attempted to evaluate PIL as a separate entity, and all subsequent references to Putnam Management below should be deemed to include reference to PIL as necessary or appropriate in the context.)
The Independent Trustees’ approval was based on the following conclusions:
• That the fee schedule in effect for your fund represented reasonable compensation in light of the nature and quality of the services being provided to the fund, the fees paid by competitive funds, and the costs incurred by Putnam Management in providing services to the fund; and
California Tax Exempt Income Fund 19
• That the fee schedule in effect for your fund represented an appropriate sharing between fund shareholders and Putnam Management of such economies of scale as may exist in the management of the fund at current asset levels.
These conclusions were based on a comprehensive consideration of all information provided to the Trustees and were not the result of any single factor. Some of the factors that figured particularly in the Trustees’ deliberations and how the Trustees considered these factors are described below, although individual Trustees may have evaluated the information presented differently, giving different weights to various factors. It is also important to recognize that the management arrangements for your fund and the other Putnam funds are the result of many years of review and discussion between the Independent Trustees and Putnam Management, that some aspects of the arrangements may receive greater scrutiny in some years than others, and that the Trustees’ conclusions may be based, in part, on their consideration of fee arrangements in previous years. For example, with some minor exceptions, the current fee arrangements under the management contracts for the Putnam funds were implemented at the beginning of 2010 following extensive review by the Contract Committee and discussions with representatives of Putnam Management, as well as approval by shareholders. Shareholders also voted overwhelmingly to approve these fee arrangements in early 2014, when they were asked to approve new management contracts (with the same fees and substantially identical other provisions) following the possible termination of the previous management contracts as a result of the death of the Honorable Paul G. Desmarais. (Mr. Desmarais, both directly and through holding companies, controlled a majority of the voting shares of Power Corporation of Canada, which (directly and indirectly) is the majority owner of Putnam Management. Mr. Desmarais’ voting control of shares of Power Corporation of Canada was transferred to The Desmarais Family Residuary Trust upon his death and this transfer, as a technical matter, may have constituted an “assignment” within the meaning of the 1940 Act, causing the Putnam funds’ management contracts to terminate automatically.)
Management fee schedules and total expenses
The Trustees reviewed the management fee schedules in effect for all Putnam funds, including fee levels and breakpoints. The Trustees also reviewed the total expenses of each Putnam fund, recognizing that in most cases management fees represented the major, but not the sole, determinant of total costs to shareholders.
In reviewing fees and expenses, the Trustees generally focus their attention on material changes in circumstances — for example, changes in assets under management, changes in a fund’s investment style, changes in Putnam Management’s operating costs or profitability, or changes in competitive practices in the mutual fund industry — that suggest that consideration of fee changes might be warranted. The Trustees concluded that the circumstances did not warrant changes to the management fee structure of your fund.
Under its management contract, your fund has the benefit of breakpoints in its management fee schedule that provide shareholders with economies of scale in the form of reduced fee levels as assets under management in the Putnam family of funds increase. The Trustees concluded that the fee schedule in effect for your fund represented an appropriate sharing of economies of scale between fund shareholders and Putnam Management.
As in the past, the Trustees also focused on the competitiveness of each fund’s total expense ratio. In order to ensure that expenses of the Putnam funds continue to meet competitive standards, the Trustees and Putnam
20 California Tax Exempt Income Fund
Management have implemented certain expense limitations. These expense limitations were: (i) a contractual expense limitation applicable to all retail open-end funds of 32 basis points on investor servicing fees and expenses and (ii) a contractual expense limitation applicable to all open-end funds of 20 basis points on so-called “other expenses” (i.e., all expenses exclusive of management fees, investor servicing fees, distribution fees, investment-related expenses, interest, taxes, brokerage commissions, extraordinary expenses and acquired fund fees and expenses). These expense limitations serve in particular to maintain competitive expense levels for funds with large numbers of small shareholder accounts and funds with relatively small net assets. Most funds, including your fund, had sufficiently low expenses that these expense limitations did not apply. Putnam Management’s support for these expense limitation arrangements was an important factor in the Trustees’ decision to approve the continuance of your fund’s management and sub-management contracts.
The Trustees reviewed comparative fee and expense information for a custom group of competitive funds selected by Lipper Inc. (“Lipper”). This comparative information included your fund’s percentile ranking for effective management fees and total expenses (excluding any applicable 12b-1 fee), which provides a general indication of your fund’s relative standing. In the custom peer group, your fund ranked in the first quintile in effective management fees (determined for your fund and the other funds in the custom peer group based on fund asset size and the applicable contractual management fee schedule) and in the second quintile in total expenses (excluding any applicable 12b-1 fees) as of December 31, 2013 (the first quintile representing the least expensive funds and the fifth quintile the most expensive funds). The fee and expense data reported by Lipper as of December 31, 2013 reflected the most recent fiscal year-end data available in Lipper’s database at that time.
In connection with their review of the management fees and total expenses of the Putnam funds, the Trustees also reviewed the costs of the services provided and the profits realized by Putnam Management and its affiliates from their contractual relationships with the funds. This information included trends in revenues, expenses and profitability of Putnam Management and its affiliates relating to the investment management, investor servicing and distribution services provided to the funds. In this regard, the Trustees also reviewed an analysis of Putnam Management’s revenues, expenses and profitability, allocated on a fund-by-fund basis, with respect to the funds’ management, distribution, and investor servicing contracts. For each fund, the analysis presented information about revenues, expenses and profitability for each of the agreements separately and for the agreements taken together on a combined basis. The Trustees concluded that, at current asset levels, the fee schedules in place represented reasonable compensation for the services being provided and represented an appropriate sharing of such economies of scale as may exist in the management of the Putnam funds at that time.
The information examined by the Trustees as part of their annual contract review for the Putnam funds has included for many years information regarding fees charged by Putnam Management and its affiliates to institutional clients such as defined benefit pension plans, college endowments, and the like. This information included comparisons of those fees with fees charged to the Putnam funds, as well as an assessment of the differences in the services provided to these different types of clients. The Trustees observed that the differences in fee rates between institutional clients and mutual funds are by no means uniform when examined by individual asset sectors, suggesting that
California Tax Exempt Income Fund 21
differences in the pricing of investment management services to these types of clients may reflect historical competitive forces operating in separate markets. The Trustees considered the fact that in many cases fee rates across different asset classes are higher on average for mutual funds than for institutional clients, as well as the differences between the services that Putnam Management provides to the Putnam funds and those that it provides to its institutional clients. The Trustees did not rely on these comparisons to any significant extent in concluding that the management fees paid by your fund are reasonable.
Investment performance
The quality of the investment process provided by Putnam Management represented a major factor in the Trustees’ evaluation of the quality of services provided by Putnam Management under your fund’s management contract. The Trustees were assisted in their review of the Putnam funds’ investment process and performance by the work of the investment oversight committees of the Trustees, which meet on a regular basis with the funds’ portfolio teams and with the Chief Investment Officer and other senior members of Putnam Management’s Investment Division throughout the year. The Trustees concluded that Putnam Management generally provides a high-quality investment process — based on the experience and skills of the individuals assigned to the management of fund portfolios, the resources made available to them, and in general Putnam Management’s ability to attract and retain high-quality personnel — but also recognized that this does not guarantee favorable investment results for every fund in every time period.
The Trustees considered that 2013 was a year of strong competitive performance for many of the Putnam funds, with only a relatively small number of exceptions. They noted that this strong performance was exemplified by the fact that the Putnam funds were recognized by Barron’s as the second-best performing mutual fund complex for both 2013 and the five-year period ended December 31, 2013. They also noted, however, the disappointing investment performance of some funds for periods ended December 31, 2013 and considered information provided by Putnam Management regarding the factors contributing to the underperformance and actions being taken to improve the performance of these particular funds. The Trustees indicated their intention to continue to monitor performance trends to assess the effectiveness of these efforts and to evaluate whether additional actions to address areas of underperformance are warranted. For purposes of evaluating investment performance, the Trustees generally focus on competitive industry rankings for the one-year, three-year and five-year periods. For a number of Putnam funds with relatively unique investment mandates for which meaningful competitive performance rankings are not considered available, the Trustees evaluated performance based on comparisons of fund returns with the returns of selected investment benchmarks. In the case of your fund, the Trustees considered that its class A share cumulative total return performance at net asset value was in the following quartiles of its Lipper peer group (Lipper California Municipal Debt Funds) for the one-year, three-year and five-year periods ended December 31, 2013 (the first quartile representing the best-performing funds and the fourth quartile the worst-performing funds):
One-year period
2nd
Three-year period
2nd
Five year-period
1st
Over the one-year, three-year and five-year periods ended December 31, 2013, there were 119, 113 and 109 funds, respectively, in your fund’s Lipper peer group. (When considering performance information, shareholders should be mindful that past performance is not a guarantee of future results.)
22 California Tax Exempt Income Fund
Brokerage and soft-dollar allocations; investor servicing
The Trustees considered various potential benefits that Putnam Management may receive in connection with the services it provides under the management contract with your fund. These include benefits related to brokerage allocation and the use of soft dollars, whereby a portion of the commissions paid by a fund for brokerage may be used to acquire research services that are expected to be useful to Putnam Management in managing the assets of the fund and of other clients. Subject to policies established by the Trustees, soft dollars generated by these means are used primarily to acquire brokerage and research services that enhance Putnam Management’s investment capabilities and supplement Putnam Management’s internal research efforts. However, the Trustees noted that a portion of available soft dollars continues to be used to pay fund expenses. The Trustees indicated their continued intent to monitor regulatory and industry developments in this area with the assistance of their Brokerage Committee and also indicated their continued intent to monitor the allocation of the Putnam funds’ brokerage in order to ensure that the principle of seeking best price and execution remains paramount in the portfolio trading process.
Putnam Management may also receive benefits from payments that the funds make to Putnam Management’s affiliates for investor or distribution services. In conjunction with the annual review of your fund’s management and sub-management contracts, the Trustees reviewed your fund’s investor servicing agreement with Putnam Investor Services, Inc. (“PSERV”) and its distributor’s contracts and distribution plans with Putnam Retail Management Limited Partnership (“PRM”), both of which are affiliates of Putnam Management. The Trustees concluded that the fees payable by the funds to PSERV and PRM, as applicable, for such services are reasonable in relation to the nature and quality of such services, the fees paid by competitive funds, and the costs incurred by PSERV and PRM, as applicable, in providing such services.
California Tax Exempt Income Fund 23
Financial statements
These sections of the report, as well as the accompanying Notes, preceded by the Report of Independent Registered Public Accounting Firm, constitute the fund’s financial statements.
The fund’s portfolio lists all the fund’s investments and their values as of the last day of the reporting period. Holdings are organized by asset type and industry sector, country, or state to show areas of concentration and diversification.
Statement of assets and liabilities shows how the fund’s net assets and share price are determined. All investment and non-investment assets are added together. Any unpaid expenses and other liabilities are subtracted from this total. The result is divided by the number of shares to determine the net asset value per share, which is calculated separately for each class of shares. (For funds with preferred shares, the amount subtracted from total assets includes the liquidation preference of preferred shares.)
Statement of operations shows the fund’s net investment gain or loss. This is done by first adding up all the fund’s earnings — from dividends and interest income — and subtracting its operating expenses to determine net investment income (or loss). Then, any net gain or loss the fund realized on the sales of its holdings — as well as any unrealized gains or losses over the period — is added to or subtracted from the net investment result to determine the fund’s net gain or loss for the fiscal year.
Statement of changes in net assets shows how the fund’s net assets were affected by the fund’s net investment gain or loss, by distributions to shareholders, and by changes in the number of the fund’s shares. It lists distributions and their sources (net investment income or realized capital gains) over the current reporting period and the most recent fiscal year-end. The distributions listed here may not match the sources listed in the Statement of operations because the distributions are determined on a tax basis and may be paid in a different period from the one in which they were earned.
Financial highlights provide an overview of the fund’s investment results, per-share distributions, expense ratios, net investment income ratios, and portfolio turnover in one summary table, reflecting the five most recent reporting periods. In a semiannual report, the highlights table also includes the current reporting period.
24 California Tax Exempt Income Fund
Report of Independent Registered Public Accounting Firm
The Board of Trustees and Shareholders Putnam California Tax Exempt Income Fund:
We have audited the accompanying statement of assets and liabilities of Putnam California Tax Exempt Income Fund (the fund), including the fund’s portfolio, as of September 30, 2014, and the related statement of operations for the year then ended, the statements of changes in net assets for each of the years in the two-year period then ended, and the financial highlights for each of the years in the five-year period then ended. These financial statements and financial highlights are the responsibility of the fund’s management. Our responsibility is to express an opinion on these financial statements and financial highlights based on our audits.
We conducted our audits in accordance with the standards of the Public Company Accounting Oversight Board (United States). Those standards require that we plan and perform the audit to obtain reasonable assurance about whether the financial statements and financial highlights are free of material misstatement. An audit includes examining, on a test basis, evidence supporting the amounts and disclosures in the financial statements. Our procedures included confirmation of securities owned as of September 30, 2014, by correspondence with the custodian and brokers or by other appropriate auditing procedures. An audit also includes assessing the accounting principles used and significant estimates made by management, as well as evaluating the overall financial statement presentation. We believe that our audits provide a reasonable basis for our opinion.
In our opinion, the financial statements and financial highlights referred to above present fairly, in all material respects, the financial position of Putnam California Tax Exempt Income Fund as of September 30, 2014, the results of its operations for the year then ended, the changes in its net assets for each of the years in the two-year period then ended, and the financial highlights for each of the years in the five-year period then ended, in conformity with U.S. generally accepted accounting principles.
Boston, Massachusetts November 11, 2014
California Tax Exempt Income Fund 25
The fund’s portfolio 9/30/14
Key to holding’s abbreviations
ABAG Association Of Bay Area Governments
AGM Assured Guaranty Municipal Corporation
AGO Assured Guaranty, Ltd.
AMBAC AMBAC Indemnity Corporation
COP Certificates of Participation
FGIC Financial Guaranty Insurance Company
G.O. Bonds General Obligation Bonds
NATL National Public Finance Guarantee Corp.
Radian Insd. Radian Group Insured
SGI Syncora Guarantee, Inc.
U.S. Govt. Coll. U.S. Government Collateralized
VRDN Variable Rate Demand Notes, which are floating-rate securities with long-term maturities that carry coupons that reset and are payable upon demand either daily, weekly or monthly. The rate shown is the current interest rate at the close of the reporting period.
MUNICIPAL BONDS AND NOTES (99.2%)*
Rating**
Principal amount
Value
California (95.2%)
ABAG Fin. Auth. for Nonprofit Corps. Rev. Bonds
(Sharp Hlth. Care), 6 1/4s, 8/1/39
AA–
$14,000,000
$16,296,839
(Episcopal Sr. Cmntys.), 6 1/8s, 7/1/41
BBB+/F
2,045,000
2,320,196
(Episcopal Sr. Cmntys.), Ser. A, 5s, 7/1/42
BBB+/F
700,000
749,553
(O’Connor Woods), 5s, 1/1/33
A
2,300,000
2,491,820
ABAG Fin. Auth. Non-Profit Corps Insd. Sr. Living Rev. Bonds
VI Pub. Fin. Auth. Rev. Bonds, Ser. A, 5s, 10/1/25
Baa2
2,000,000
2,199,520
2,199,520
TOTAL INVESTMENTS
Total investments (cost $1,235,999,589)
$1,377,073,327
California Tax Exempt Income Fund 37
Notes to the fund’s portfolio
Unless noted otherwise, the notes to the fund’s portfolio are for the close of the fund’s reporting period, which ran from October 1, 2013 through September 30, 2014 (the reporting period). Within the following notes to the portfolio, references to “ASC 820” represent Accounting Standards Codification 820 Fair Value Measurements and Disclosures and references to “OTC”, if any, represent over-the-counter.
*
Percentages indicated are based on net assets of $1,388,294,446
**
The Moody’s, Standard & Poor’s or Fitch ratings indicated are believed to be the most recent ratings available at the close of the reporting period for the securities listed. Ratings are generally ascribed to securities at the time of issuance. While the agencies may from time to time revise such ratings, they undertake no obligation to do so, and the ratings do not necessarily represent what the agencies would ascribe to these securities at the close of the reporting period. Securities rated by Putnam are indicated by “/P.” Securities rated by Fitch are indicated by “/F.” If a security is insured, it will usually be rated by the ratings organizations based on the financial strength of the insurer. Ratings are not covered by the Report of Independent Registered Public Accounting Firm. For further details regarding security ratings, please see the Statement of Additional Information.
144A after the name of an issuer represents securities exempt from registration under Rule 144A under the Securities Act of 1933, as amended. These securities may be resold in transactions exempt from registration, normally to qualified institutional buyers.
The dates shown parenthetically on prerefunded bonds represent the next prerefunding dates.
The dates shown on debt obligations are the original maturity dates.
The fund had the following sector concentrations greater than 10% at the close of the reporting period (as a percentage of net assets):
State debt
15.7%
Health care
14.4
Utilities
14.2
Local debt
12.0
Transportation
10.3
ASC 820 establishes a three-level hierarchy for disclosure of fair value measurements. The valuation hierarchy is based upon the transparency of inputs to the valuation of the fund’s investments. The three levels are defined as follows:
Level 1: Valuations based on quoted prices for identical securities in active markets.
Level 2: Valuations based on quoted prices in markets that are not active or for which all significant inputs are observable, either directly or indirectly.
Level 3: Valuations based on inputs that are unobservable and significant to the fair value measurement.
The following is a summary of the inputs used to value the fund’s net assets as of the close of the reporting period:
Valuation inputs
Investments in securities:
Level 1
Level 2
Level 3
Municipal bonds and notes
$—
$1,377,073,327
$—
Totals by level
$—
$1,377,073,327
$—
During the reporting period, transfers within the fair value hierarchy, if any, did not represent, in the aggregate, more than 1% of the fund’s net assets measured as of the end of the period.
The accompanying notes are an integral part of these financial statements.
Payable for Trustee compensation and expenses (Note 2)
476,118
Payable for administrative services (Note 2)
1,880
Payable for distribution fees (Note 2)
737,662
Distributions payable to shareholders
1,106,266
Other accrued expenses
115,258
Total liabilities
9,615,889
Net assets
$1,388,294,446
REPRESENTED BY
Paid-in capital (Unlimited shares authorized) (Notes 1 and 4)
$1,307,065,532
Undistributed net investment income (Note 1)
4,802,121
Accumulated net realized loss on investments (Note 1)
(64,646,945)
Net unrealized appreciation of investments
141,073,738
Total — Representing net assets applicable to capital shares outstanding
$1,388,294,446
COMPUTATION OF NET ASSET VALUE AND OFFERING PRICE
Net asset value and redemption price per class A share ($1,278,390,663 divided by 155,403,531 shares)
$8.23
Offering price per class A share (100/96.00 of $8.23)*
$8.57
Net asset value and offering price per class B share ($6,363,574 divided by 774,285 shares)**
$8.22
Net asset value and offering price per class C share ($44,233,339 divided by 5,348,582 shares)**
$8.27
Net asset value and redemption price per class M share ($2,670,412 divided by 325,505 shares)
$8.20
Offering price per class M share (100/96.75 of $8.20)†
$8.48
Net asset value, offering price and redemption price per class Y share ($56,636,458 divided by 6,867,512 shares)
$8.25
*
On single retail sales of less than $100,000. On sales of $100,000 or more the offering price is reduced.
**
Redemption price per share is equal to net asset value less any applicable contingent deferred sales charge.
†
On single retail sales of less than $50,000. On sales of $50,000 or more the offering price is reduced.
The accompanying notes are an integral part of these financial statements.
California Tax Exempt Income Fund 39
Statement of operations Year ended 9/30/14
INTEREST INCOME
$65,775,607
EXPENSES
Compensation of Manager (Note 2)
$6,010,342
Investor servicing fees (Note 2)
684,660
Custodian fees (Note 2)
17,563
Trustee compensation and expenses (Note 2)
91,646
Distribution fees (Note 2)
3,298,757
Administrative services (Note 2)
33,542
Interest and fees expense (Note 2)
18,578
Other
346,858
Total expenses
10,501,946
Expense reduction (Note 2)
(2,034)
Net expenses
10,499,912
Net investment income
55,275,695
Net realized gain on investments (Notes 1 and 3)
485,594
Net unrealized appreciation of investments during the year
71,141,582
Net gain on investments
71,627,176
Net increase in net assets resulting from operations
$126,902,871
The accompanying notes are an integral part of these financial statements.
40 California Tax Exempt Income Fund
Statement of changes in net assets
DECREASE IN NET ASSETS
Year ended 9/30/14
Year ended 9/30/13
Operations:
Net investment income
$55,275,695
$66,182,226
Net realized gain on investments
485,594
467,722
Net unrealized appreciation (depreciation) of investments
71,141,582
(107,755,169)
Net increase (decrease) in net assets resulting from operations
126,902,871
(41,105,221)
Distributions to shareholders (Note 1):
From ordinary income
Taxable net investment income
Class A
(409,586)
(449,977)
Class B
(2,231)
(2,532)
Class C
(13,699)
(17,269)
Class M
(840)
(884)
Class Y
(15,055)
(17,032)
From tax-exempt net investment income
Class A
(50,778,096)
(60,484,380)
Class B
(223,926)
(282,787)
Class C
(1,383,610)
(1,816,311)
Class M
(97,327)
(109,057)
Class Y
(2,052,777)
(2,487,802)
Decrease from capital share transactions (Note 4)
(133,654,593)
(161,018,450)
Total decrease in net assets
(61,728,869)
(267,791,702)
NET ASSETS
Beginning of year
1,450,023,315
1,717,815,017
End of year (including undistributed net investment income of $4,802,121 and $5,004,648, respectively)
$1,388,294,446
$1,450,023,315
The accompanying notes are an integral part of these financial statements.
California Tax Exempt Income Fund 41
Financial highlights (For a common share outstanding throughout the period)
INVESTMENT OPERATIONS:
LESS DISTRIBUTIONS:
RATIOS AND SUPPLEMENTAL DATA:
Period ended
Net asset value, beginning of period
Net investment income (loss)
Net realized and unrealized gain (loss) on investments
Total from investment operations
From net investment income
From net realized gain on investments
Total distributions
Redemption fees
Non-recurring reimbursements
Net asset value, end of period
Total return at net asset value (%)a
Net assets, end of period (in thousands)
Ratio of expenses to average net assets (%)b,c
Ratio of net investment income (loss) to average net assets (%)c
Portfolio turnover (%)
Class A
September 30, 2014
$7.81
.32
.42
.74
(.32)
—
(.32)
—
—
$8.23
9.63
$1,278,391
.74
3.99
11
September 30, 2013
8.34
.33
(.53)
(.20)
(.33)
—
(.33)
—
—
7.81
(2.50)
1,338,414
.74
4.03
11
September 30, 2012
7.83
.34
.51
.85
(.34)
—
(.34)
—
—
8.34
11.12
1,591,810
.75
4.30
6
September 30, 2011
7.99
.36
(.16)
.20
(.36)
—
(.36)
—
—d
7.83
2.75
1,466,160
.75
4.77
9
September 30, 2010
7.93
.36
.07
.43
(.37)
—
(.37)
—e
—
7.99
5.64
1,627,229
.76f
4.74f
16
Class B
September 30, 2014
$7.80
.27
.42
.69
(.27)
—
(.27)
—
—
$8.22
8.96
$6,364
1.37
3.36
11
September 30, 2013
8.34
.28
(.54)
(.26)
(.28)
—
(.28)
—
—
7.80
(3.24)
7,255
1.37
3.40
11
September 30, 2012
7.83
.29
.51
.80
(.29)
—
(.29)
—
—
8.34
10.42
8,749
1.38
3.67
6
September 30, 2011
7.98
.31
(.15)
.16
(.31)
—
(.31)
—
—d
7.83
2.24
8,615
1.38
4.15
9
September 30, 2010
7.92
.31
.07
.38
(.32)
—
(.32)
—e
—
7.98
4.97
15,928
1.39f
4.14f
16
Class C
September 30, 2014
$7.85
.25
.42
.67
(.25)
—
(.25)
—
—
$8.27
8.73
$44,233
1.52
3.21
11
September 30, 2013
8.38
.27
(.53)
(.26)
(.27)
—
(.27)
—
—
7.85
(3.25)
47,175
1.52
3.25
11
September 30, 2012
7.87
.28
.51
.79
(.28)
—
(.28)
—
—
8.38
10.19
56,923
1.53
3.51
6
September 30, 2011
8.03
.30
(.16)
.14
(.30)
—
(.30)
—
—d
7.87
1.95
45,516
1.53
3.99
9
September 30, 2010
7.96
.30
.08
.38
(.31)
—
(.31)
—e
—
8.03
4.95
51,872
1.54f
3.95f
16
Class M
September 30, 2014
$7.79
.29
.41
.70
(.29)
—
(.29)
—
—
$8.20
9.22
$2,670
1.02
3.71
11
September 30, 2013
8.32
.31
(.53)
(.22)
(.31)
—
(.31)
—
—
7.79
(2.78)
2,606
1.02
3.75
11
September 30, 2012
7.81
.32
.51
.83
(.32)
—
(.32)
—
—
8.32
10.83
3,341
1.03
4.00
6
September 30, 2011
7.97
.34
(.16)
.18
(.34)
—
(.34)
—
—d
7.81
2.45
2,590
1.03
4.48
9
September 30, 2010
7.91
.34
.06
.40
(.34)
—
(.34)
—e
—
7.97
5.34
3,011
1.04f
4.46f
16
Class Y
September 30, 2014
$7.83
.33
.42
.75
(.33)
—
(.33)
—
—
$8.25
9.85
$56,636
.52
4.20
11
September 30, 2013
8.36
.35
(.53)
(.18)
(.35)
—
(.35)
—
—
7.83
(2.28)
54,574
.52
4.25
11
September 30, 2012
7.85
.36
.51
.87
(.36)
—
(.36)
—
—
8.36
11.30
56,992
.53
4.49
6
September 30, 2011
8.01
.38
(.16)
.22
(.38)
—
(.38)
—
—d
7.85
2.99
34,064
.53
4.98
9
September 30, 2010
7.94
.38
.07
.45
(.38)
—
(.38)
—e
—
8.01
6.01
24,888
.54f
4.95f
16
The accompanying notes are an integral part of these financial statements.
42
California Tax Exempt Income Fund
California Tax Exempt Income Fund
43
Financial highlights (Continued)
a Total return assumes dividend reinvestment and does not reflect the effect of sales charges.
b Includes amounts paid through expense offset arrangements, if any (Note 2). Also excludes acquired fund fees, if any.
c Includes interest and fees expense associated with borrowings which amounted to the following (Note 1):
Percentage of average net assets
September 30, 2014
<0.01%
September 30, 2013
<0.01
September 30, 2012
<0.01
September 30, 2011
<0.01
September 30, 2010
<0.01
d Reflects a non-recurring reimbursement related to restitution amounts in connection with a distribution plan approved by the Securities and Exchange Commission (the SEC) which amounted to less than $0.01 per share outstanding on July 21, 2011. Also reflects a non-recurring reimbursement related to short-term trading related lawsuits, which amounted to less than $0.01 per share outstanding on May 11, 2011.
e Amount represents less than $0.01 per share.
f Reflects an involuntary contractual expense limitation in effect during the period. As a result of such limitation, the expenses of each class of the fund reflect a reduction as of the following amounts (Note 2):
Percentage of average net assets
September 30, 2010
0.01%
The accompanying notes are an integral part of these financial statements.
44 California Tax Exempt Income Fund
Notes to financial statements 9/30/14
Within the following Notes to financial statements, references to “State Street” represent State Street Bank and Trust Company, references to “the SEC” represent the Securities and Exchange Commission, references to “Putnam Management” represent Putnam Investment Management, LLC, the fund’s manager, an indirect wholly-owned subsidiary of Putnam Investments, LLC and references to “OTC”, if any, represent over-the-counter. Unless otherwise noted, the “reporting period” represents the period from October 1, 2013 through September 30, 2014.
Putnam California Tax Exempt Income Fund (the fund) is a Massachusetts business trust, which is registered under the Investment Company Act of 1940, as amended, as a diversified open-end management investment company. The goal of the fund is to seek as high a level of current income exempt from federal income tax and California personal income tax as Putnam Management believes to be consistent with preservation of capital. The fund invests mainly in bonds that pay interest that is exempt from federal income tax and California personal income tax (but that may be subject to federal alternative minimum tax (AMT)), are investment-grade in quality, and have intermediate- to long-term maturities (three years or longer). Putnam Management may consider, among other factors, credit, interest rate and prepayment risks, as well as general market conditions, when deciding whether to buy or sell investments.
The fund offers class A, class B, class C, class M and class Y shares. Class A and class M shares are sold with a maximum front-end sales charge of 4.00% and 3.25%, respectively, and generally do not pay a contingent deferred sales charge. Class B shares, which convert to class A shares after approximately eight years, do not pay a front-end sales charge and are subject to a contingent deferred sales charge if those shares are redeemed within six years of purchase. Class C shares have a one-year 1.00% contingent deferred sales charge and do not convert to class A shares. The expenses for class A, class B, class C, and class M shares may differ based on the distribution fee of each class, which is identified in Note 2. Class Y shares, which are sold at net asset value, are generally subject to the same expenses as class A, class B, class C, and class M shares, but do not bear a distribution fee. Class Y shares are not available to all investors.
In the normal course of business, the fund enters into contracts that may include agreements to indemnify another party under given circumstances. The fund’s maximum exposure under these arrangements is unknown as this would involve future claims that may be, but have not yet been, made against the fund. However, the fund’s management team expects the risk of material loss to be remote.
Note 1: Significant accounting policies
The following is a summary of significant accounting policies consistently followed by the fund in the preparation of its financial statements. The preparation of financial statements is in conformity with accounting principles generally accepted in the United States of America and requires management to make estimates and assumptions that affect the reported amounts of assets and liabilities in the financial statements and the reported amounts of increases and decreases in net assets from operations. Actual results could differ from those estimates. Subsequent events after the Statement of assets and liabilities date through the date that the financial statements were issued have been evaluated in the preparation of the financial statements.
Investment income, realized and unrealized gains and losses and expenses of the fund are borne pro-rata based on the relative net assets of each class to the total net assets of the fund, except that each class bears expenses unique to that class (including the distribution fees applicable to such classes). Each class votes as a class only with respect to its own distribution plan or other matters on which a class vote is required by law or determined by the Trustees. If the fund were liquidated, shares of each class would receive their pro-rata share of the net assets of the fund. In addition, the Trustees declare separate dividends on each class of shares.
Security valuation Tax-exempt bonds and notes are generally valued on the basis of valuations provided by an independent pricing service approved by the Trustees. Such services use information with respect to transactions in bonds, quotations from bond dealers, market transactions in comparable securities and various relationships between securities in determining value. These securities will generally be categorized as Level 2.
Certain investments, including certain restricted and illiquid securities and derivatives, are also valued at fair value following procedures approved by the Trustees. Such valuations and procedures are reviewed periodically by the Trustees. These valuations consider such factors as significant market or specific security events such as interest rate or credit quality changes, various relationships with other securities, discount rates, U.S. Treasury, U.S. swap and credit yields, index levels, convexity exposures and recovery rates. These securities are classified as Level 2 or as Level 3 depending on the priority of the significant inputs. The fair value of securities is generally determined
California Tax Exempt Income Fund 45
as the amount that the fund could reasonably expect to realize from an orderly disposition of such securities over a reasonable period of time. By its nature, a fair value price is a good faith estimate of the value of a security in a current sale and does not reflect an actual market price, which may be different by a material amount.
Security transactions and related investment income Security transactions are recorded on the trade date (the date the order to buy or sell is executed). Gains or losses on securities sold are determined on the identified cost basis.
Interest income is recorded on the accrual basis. All premiums/discounts are amortized/accreted on a yield-to-maturity basis. The premium in excess of the call price, if any, is amortized to the call date; thereafter, any remaining premium is amortized to maturity.
Tender option bond transactions The fund may participate in transactions whereby a fixed-rate bond is transferred to a tender option bond trust (TOB trust) sponsored by a broker. The TOB trust funds the purchase of the fixed rate bonds by issuing floating-rate bonds to third parties and allowing the fund to retain the residual interest in the TOB trust’s assets and cash flows, which are in the form of inverse floating rate bonds. The inverse floating rate bonds held by the fund give the fund the right to (1) cause the holders of the floating rate bonds to tender their notes at par, and (2) to have the fixed-rate bond held by the TOB trust transferred to the fund, causing the TOB trust to collapse. The fund accounts for the transfer of the fixed-rate bond to the TOB trust as a secured borrowing by including the fixed-rate bond in the fund’s portfolio and including the floating rate bond as a liability in the Statement of assets and liabilities. At the close of the reporting period, the fund no longer holds investments in the TOB trust. For the reporting period ended, the fund incurred interest expense of $18,578 for these investments based on an average interest rate of 0.06%.
Interfund lending The fund, along with other Putnam funds, may participate in an interfund lending program pursuant to an exemptive order issued by the SEC. This program allows the fund to borrow from other Putnam funds that permit such transactions. Interfund lending transactions are subject to each fund’s investment policies and borrowing and lending limits. Interest earned or paid on the interfund lending transaction will be based on the average of certain current market rates. During the reporting period, the fund did not utilize the program.
Lines of credit The fund participates, along with other Putnam funds, in a $392.5 million unsecured committed line of credit and a $235.5 million unsecured uncommitted line of credit, both provided by State Street. Borrowings may be made for temporary or emergency purposes, including the funding of shareholder redemption requests and trade settlements. Interest is charged to the fund based on the fund’s borrowing at a rate equal to the Federal Funds rate plus 1.25% for the committed line of credit and the Federal Funds rate plus 1.30% for the uncommitted line of credit. A closing fee equal to 0.04% of the committed line of credit and 0.04% of the uncommitted line of credit has been paid by the participating funds. In addition, a commitment fee of 0.11% per annum on any unutilized portion of the committed line of credit is allocated to the participating funds based on their relative net assets and paid quarterly. During the reporting period, the fund had no borrowings against these arrangements.
Federal taxes It is the policy of the fund to distribute all of its income within the prescribed time period and otherwise comply with the provisions of the Internal Revenue Code of 1986, as amended (the Code), applicable to regulated investment companies. It is also the intention of the fund to distribute an amount sufficient to avoid imposition of any excise tax under Section 4982 of the Code.
The fund is subject to the provisions of Accounting Standards Codification 740 Income Taxes (ASC 740). ASC 740 sets forth a minimum threshold for financial statement recognition of the benefit of a tax position taken or expected to be taken in a tax return. The fund did not have a liability to record for any unrecognized tax benefits in the accompanying financial statements. No provision has been made for federal taxes on income, capital gains or unrealized appreciation on securities held nor for excise tax on income and capital gains. Each of the fund’s federal tax returns for the prior three fiscal years remains subject to examination by the Internal Revenue Service.
46 California Tax Exempt Income Fund
At September 30, 2014, the fund had a capital loss carryover of $63,711,613 available to the extent allowed by the Code to offset future net capital gain, if any. The amounts of the carryovers and the expiration dates are:
Loss carryover
Short-term
Long-term
Total
Expiration
$7,694,809
$10,826,499
$18,521,308
*
766,815
N/A
766,815
September 30, 2016
12,478,683
N/A
12,478,683
September 30, 2017
1,872,123
N/A
1,872,123
September 30, 2018
30,072,684
N/A
30,072,684
September 30, 2019
*Under the Regulated Investment Company Modernization Act of 2010, the fund will be permitted to carry forward capital losses incurred in taxable years beginning after December 22, 2010 for an unlimited period. However, any losses incurred will be required to be utilized prior to the losses incurred in pre-enactment tax years. As a result of this ordering rule, pre-enactment capital loss carryforwards may be more likely to expire unused. Additionally, post-enactment capital losses that are carried forward will retain their character as either short-term or long-term capital losses rather than being considered all short-term as under previous law.
Pursuant to federal income tax regulations applicable to regulated investment companies, the fund has elected to defer $922,683 of certain losses recognized during the period from November 1, 2013 to September 30, 2014 to its fiscal year ending September 30, 2015.
Distributions to shareholders Income dividends are recorded daily by the fund and are paid monthly. Distributions from capital gains, if any, are recorded on the ex-dividend date and paid at least annually. The amount and character of income and gains to be distributed are determined in accordance with income tax regulations which may differ from generally accepted accounting principles.
These differences include temporary and/or permanent differences from late year loss deferrals, from dividends payable, from straddle loss deferrals, and from amortization and accretion. Reclassifications are made to the fund’s capital accounts to reflect income and gains available for distribution (or available capital loss carryovers) under income tax regulations. At the close of the reporting period, the fund reclassified $501,075 to decrease undistributed net investment income and $501,075 to decrease accumulated net realized loss.
The tax basis components of distributable earnings and the federal tax cost as of the close of the reporting period were as follows:
Unrealized appreciation
$145,099,116
Unrealized depreciation
(3,165,913)
Net unrealized appreciation
141,933,203
Undistributed ordinary income
200,686
Undistributed tax-exempt income
5,707,701
Capital loss carryforward
(63,711,613)
Post-October capital loss deferral
(922,683)
Cost for federal income tax purposes
$1,235,140,124
Note 2: Management fee, administrative services and other transactions
The fund pays Putnam Management a management fee (based on the fund’s average net assets and computed and paid monthly) at annual rates that may vary based on the average of the aggregate net assets of most open-end funds, as defined in the fund’s management contract, sponsored by Putnam Management. Such annual rates may vary as follows:
0.590%
of the first $5 billion,
0.540%
of the next $5 billion,
0.490%
of the next $10 billion,
0.440%
of the next $10 billion,
0.390%
of the next $50 billion,
0.370%
of the next $50 billion,
0.360%
of the next $100 billion and
0.355%
of any excess thereafter.
California Tax Exempt Income Fund 47
The fund’s shareholders approved the fund’s current management contract with Putnam Management effective February 27, 2014. Shareholders were asked to approve the fund’s management contract following the death on October 8, 2013 of The Honourable Paul G. Desmarais, who had controlled directly and indirectly a majority of the voting shares of Power Corporation of Canada, the ultimate parent company of Putnam Management. The substantive terms of the management contract, including terms relating to fees, are identical to the terms of the fund’s previous management contract and reflect the rates provided in the table above.
Putnam Management has contractually agreed, through June 30, 2015, to waive fees or reimburse the fund’s expenses to the extent necessary to limit the cumulative expenses of the fund, exclusive of brokerage, interest, taxes, investment-related expenses, extraordinary expenses, acquired fund fees and expenses and payments under the fund’s investor servicing contract, investment management contract and distribution plans, on a fiscal year-to-date basis to an annual rate of 0.20% of the fund’s average net assets over such fiscal year-to-date period. During the reporting period, the fund’s expenses were not reduced as a result of this limit.
Putnam Investments Limited (PIL), an affiliate of Putnam Management, is authorized by the Trustees to manage a separate portion of the assets of the fund as determined by Putnam Management from time to time. Putnam Management pays a quarterly sub-management fee to PIL for its services at an annual rate of 0.40% of the average net assets of the portion of the fund managed by PIL.
The fund reimburses Putnam Management an allocated amount for the compensation and related expenses of certain officers of the fund and their staff who provide administrative services to the fund. The aggregate amount of all such reimbursements is determined annually by the Trustees.
Custodial functions for the fund’s assets are provided by State Street. Custody fees are based on the fund’s asset level, the number of its security holdings and transaction volumes.
Putnam Investor Services, Inc., an affiliate of Putnam Management, provides investor servicing agent functions to the fund. Putnam Investor Services, Inc. received fees for investor servicing based on the fund’s retail asset level, the number of shareholder accounts in the fund and the level of defined contribution plan assets in the fund. Investor servicing fees will not exceed an annual rate of 0.32% of the fund’s average net assets. During the reporting period, the expenses for each class of shares related to investor servicing fees were as follows:
Class A
$633,960
Class B
3,328
Class C
21,710
Class M
1,306
Class Y
24,356
Total
$684,660
The fund has entered into expense offset arrangements with Putnam Investor Services, Inc. and State Street whereby Putnam Investor Services, Inc.’s and State Street’s fees are reduced by credits allowed on cash balances. For the reporting period, the fund’s expenses were reduced by $2,034 under the expense offset arrangements.
Each Independent Trustee of the fund receives an annual Trustee fee, of which $801, as a quarterly retainer, has been allocated to the fund, and an additional fee for each Trustees meeting attended. Trustees also are reimbursed for expenses they incur relating to their services as Trustees.
The fund has adopted a Trustee Fee Deferral Plan (the Deferral Plan) which allows the Trustees to defer the receipt of all or a portion of Trustees fees payable on or after July 1, 1995. The deferred fees remain invested in certain Putnam funds until distribution in accordance with the Deferral Plan.
The fund has adopted an unfunded noncontributory defined benefit pension plan (the Pension Plan) covering all Trustees of the fund who have served as a Trustee for at least five years and were first elected prior to 2004. Benefits under the Pension Plan are equal to 50% of the Trustee’s average annual attendance and retainer fees for the three years ended December 31, 2005. The retirement benefit is payable during a Trustee’s lifetime, beginning the year following retirement, for the number of years of service through December 31, 2006. Pension expense for the fund is included in Trustee compensation and expenses in the Statement of operations. Accrued pension liability is included in Payable for Trustee compensation and expenses in the Statement of assets and liabilities. The Trustees have terminated the Pension Plan with respect to any Trustee first elected after 2003.
The fund has adopted distribution plans (the Plans) with respect to its class A, class B, class C and class M shares pursuant to Rule 12b–1 under the Investment Company Act of 1940. The purpose of the Plans is to compensate Putnam Retail Management Limited Partnership, an indirect wholly-owned subsidiary of Putnam Investments, LLC, for services provided and expenses incurred in distributing shares of the fund. The Plans provide for payments by the fund to Putnam Retail Management Limited Partnership at an annual rate of up to 0.35%, 1.00%, 1.00% and
48 California Tax Exempt Income Fund
1.00% of the average net assets attributable to class A, class B, class C and class M shares, respectively. The Trustees have approved payment by the fund at the annual rate of 0.85%, 1.00% and 0.50% of the average net assets for class B, class C and class M shares, respectively. For class A shares, the annual payment rate will equal the weighted average of (i) 0.20% on the net assets of the fund attributable to class A shares purchased and paid for prior to April 1, 2005 and (ii) 0.25% on all other net assets of the fund attributable to class A shares. During the reporting period, the class specific expenses related to distribution fees were as follows:
Class A
$2,786,929
Class B
57,448
Class C
441,112
Class M
13,268
Total
$3,298,757
For the reporting period, Putnam Retail Management Limited Partnership, acting as underwriter, received net commissions of $56,004 and $112 from the sale of class A and class M shares, respectively, and received $2,307 and $13 in contingent deferred sales charges from redemptions of class B and class C shares, respectively.
A deferred sales charge of up to 1.00% is assessed on certain redemptions of class A shares. For the reporting period, Putnam Retail Management Limited Partnership, acting as underwriter, received $186 on class A redemptions.
Note 3: Purchases and sales of securities
During the reporting period, cost of purchases and proceeds from sales, excluding short-term investments were as follows:
Cost of purchases
Proceeds from sales
Investments in securities, including TBA commitments (Long-term)
$146,713,438
$252,999,320
U.S. government securities (Long-term)
—
—
Total
$146,713,438
$252,999,320
Note 4: Capital shares
At the close of the reporting period, there was an unlimited number of shares of beneficial interest authorized. Transactions in capital shares were as follows:
Year ended 9/30/14
Year ended 9/30/13
Class A
Shares
Amount
Shares
Amount
Shares sold
7,474,360
$59,918,545
18,304,324
$152,049,316
Shares issued in connection with reinvestment of distributions
4,853,502
38,900,168
5,564,631
45,654,343
12,327,862
98,818,713
23,868,955
197,703,659
Shares repurchased
(28,330,366)
(225,448,945)
(43,259,365)
(352,812,645)
Net decrease
(16,002,504)
$(126,630,232)
(19,390,410)
$(155,108,986)
Year ended 9/30/14
Year ended 9/30/13
Class B
Shares
Amount
Shares
Amount
Shares sold
31,544
$251,410
106,757
$884,105
Shares issued in connection with reinvestment of distributions
25,922
207,426
29,889
245,025
57,466
458,836
136,646
1,129,130
Shares repurchased
(213,110)
(1,698,618)
(256,328)
(2,073,639)
Net decrease
(155,644)
$(1,239,782)
(119,682)
$(944,509)
California Tax Exempt Income Fund 49
Year ended 9/30/14
Year ended 9/30/13
Class C
Shares
Amount
Shares
Amount
Shares sold
678,627
$5,470,981
1,326,280
$11,124,158
Shares issued in connection with reinvestment of distributions
136,290
1,097,712
168,765
1,391,477
814,917
6,568,693
1,495,045
12,515,635
Shares repurchased
(1,477,119)
(11,778,644)
(2,274,273)
(18,502,278)
Net decrease
(662,202)
$(5,209,951)
(779,228)
$(5,986,643)
Year ended 9/30/14
Year ended 9/30/13
Class M
Shares
Amount
Shares
Amount
Shares sold
9,833
$78,462
49,061
$406,798
Shares issued in connection with reinvestment of distributions
10,802
86,334
11,896
97,392
20,635
164,796
60,957
504,190
Shares repurchased
(29,763)
(239,388)
(127,770)
(1,057,692)
Net decrease
(9,128)
$(74,592)
(66,813)
$(553,502)
Year ended 9/30/14
Year ended 9/30/13
Class Y
Shares
Amount
Shares
Amount
Shares sold
2,478,401
$19,976,244
3,320,617
$27,371,431
Shares issued in connection with reinvestment of distributions
159,406
1,282,344
206,529
1,699,796
2,637,807
21,258,588
3,527,146
29,071,227
Shares repurchased
(2,742,882)
(21,758,624)
(3,370,241)
(27,496,037)
Net increase (decrease)
(105,075)
$(500,036)
156,905
$1,575,190
Note 5: Market, credit and other risks
In the normal course of business, the fund trades financial instruments and enters into financial transactions where risk of potential loss exists due to changes in the market (market risk) or failure of the contracting party to the transaction to perform (credit risk). The fund may be exposed to additional credit risk that an institution or other entity with which the fund has unsettled or open transactions will default. The fund concentrates a majority of its investments in the state of California and may be affected by economic and political developments in that state.
50 California Tax Exempt Income Fund
Federal tax information (Unaudited)
The fund has designated 99.20% of dividends paid from net investment income during the reporting period as tax exempt for Federal income tax purposes.
The Form 1099 that will be mailed to you in January 2015 will show the tax status of all distributions paid to your account in calendar 2014.
California Tax Exempt Income Fund 51
Shareholder meeting results (Unaudited)
February 27, 2014 special meeting
At the meeting, each of the nominees for Trustees was elected as follows:
Votes for
Votes withheld
Liaquat Ahamed
110,812,770
4,413,756
Ravi Akhoury
110,832,522
4,394,004
Barbara M. Baumann
111,144,678
4,081,848
Jameson A. Baxter
111,072,448
4,154,078
Charles B. Curtis
110,995,194
4,231,332
Robert J. Darretta
110,997,346
4,229,180
Katinka Domotorffy
111,134,472
4,092,054
John A. Hill
111,117,487
4,109,039
Paul L. Joskow
111,087,977
4,138,549
Kenneth R. Leibler
111,111,280
4,115,246
Robert E. Patterson
111,114,551
4,111,975
George Putnam, III
111,113,763
4,112,763
Robert L. Reynolds
111,106,511
4,120,015
W. Thomas Stephens
111,135,762
4,090,764
A proposal to approve a new management contract between the fund and Putnam Management was approved as follows:
Votes for
Votes against
Abstentions
Broker non-votes
88,487,167
2,870,510
6,719,299
17,149,550
March 7, 2014 special meeting
A proposal to adopt an Amended and Restated Declaration of Trust, with respect to which the February 27, 2014 meeting had been adjourned, was approved as follows:
Votes for
Votes against
Abstentions
Broker non-votes
92,862,472
3,145,166
8,858,120
15,726,007
All tabulations are rounded to the nearest whole number.
52 California Tax Exempt Income Fund
About the Trustees
Independent Trustees
Liaquat Ahamed
Born 1952, Trustee since 2012
Principal occupations during past five years: Pulitzer Prize-winning author of Lords of Finance: The Bankers Who Broke the World, whose articles on economics have appeared in such publications as the New York Times, Foreign Affairs, and the Financial Times. Director of Aspen Insurance Co., a New York Stock Exchange company, and Chair of the Aspen Board’s Investment Committee. Trustee of the Brookings Institution and Chair of its Investment Committee.
Other directorships: The Rohatyn Group, an emerging-market fund complex that manages money for institutions
Ravi Akhoury
Born 1947, Trustee since 2009
Principal occupations during past five years: Trustee of American India Foundation and of the Rubin Museum. From 1992 to 2007, was Chairman and CEO of MacKay Shields, a multi-product investment management firm.
Other directorships: RAGE Frameworks, Inc., a private software company; English Helper, Inc., a private software company
Barbara M. Baumann
Born 1955, Trustee since 2010
Principal occupations during past five years: President and Owner of Cross Creek Energy Corporation, a strategic consultant to domestic energy firms and direct investor in energy projects. Current Board member of The Denver Foundation. Former Chair and current Board member of Girls Incorporated of Metro Denver. Member of the Finance Committee, the Children’s Hospital of Colorado.
Other directorships: Buckeye Partners, L.P., a publicly traded master limited partnership focused on pipeline transport, storage, and distribution of petroleum products; Devon Energy Corporation, a leading independent natural gas and oil exploration and production company
Jameson A. Baxter
Born 1943, Trustee since 1994, Vice Chair from 2005 to 2011, and Chair since 2011
Principal occupations during past five years: President of Baxter Associates, Inc., a private investment firm. Chair of Mutual Fund Directors Forum. Chair Emeritus of the Board of Trustees of Mount Holyoke College. Director of the Adirondack Land Trust and Trustee of the Nature Conservancy’s Adirondack Chapter.
Charles B. Curtis
Born 1940, Trustee since 2001
Principal occupations during past five years: Senior Advisor to the Center for Strategic and International Studies. President Emeritus and former President and Chief Operating Officer of the Nuclear Threat Initiative, a private foundation dealing with national security issues. Member of the Council on Foreign Relations and U.S. State Department International Security Advisory Board.
Robert J. Darretta
Born 1946, Trustee since 2007
Principal occupations during past five years: From 2009 until 2012, served as Health Care Industry Advisor to Permira, a global private equity firm. Until April 2007, was Vice Chairman of the Board of Directors of Johnson & Johnson. Served as Johnson & Johnson’s Chief Financial Officer for a decade.
Other directorships: UnitedHealth Group, a diversified health-care company
Katinka Domotorffy
Born 1975, Trustee since 2012
Principal occupations during past five years: Voting member of the Investment Committees of the Anne Ray Charitable Trust and Margaret A. Cargill Foundation, part of the Margaret A. Cargill Philanthropies. Until 2011, Partner, Chief Investment Officer, and Global Head of Quantitative Investment Strategies at Goldman Sachs Asset Management.
Other directorships: Reach Out and Read of Greater New York, an organization dedicated to promoting childhood literacy
John A. Hill
Born 1942, Trustee since 1985 and Chairman from 2000 to 2011
Principal occupations during past five years: Founder and Vice-Chairman of First Reserve Corporation, the leading private equity buyout firm focused on the worldwide energy industry. Trustee and Chairman of the Board of Trustees of Sarah Lawrence College. Member of the Advisory Board of the Millstein Center for Global Markets and Corporate Ownership at The Columbia University Law School.
Other directorships: Devon Energy Corporation, a leading independent natural gas and oil exploration and production company
California Tax Exempt Income Fund 53
Paul L. Joskow
Born 1947, Trustee since 1997
Principal occupations during past five years: Economist and President of the Alfred P. Sloan Foundation, a philanthropic institution focused primarily on research and education on issues related to science, technology, and economic performance. Elizabeth and James Killian Professor of Economics, Emeritus at the Massachusetts Institute of Technology (MIT). Prior to 2007, served as the Director of the Center for Energy and Environmental Policy Research at MIT.
Other directorships: Yale University; Exelon Corporation, an energy company focused on power services; Boston Symphony Orchestra; Prior to April 2013, served as Director of TransCanada Corporation and TransCanada Pipelines Ltd., energy companies focused on natural gas transmission, oil pipelines and power services
Kenneth R. Leibler
Born 1949, Trustee since 2006
Principal occupations during past five years: Founder and former Chairman of Boston Options Exchange, an electronic marketplace for the trading of derivative securities. Serves on the Board of Trustees of Beth Israel Deaconess Hospital in Boston, Massachusetts. Director of Beth Israel Deaconess Care Organization. Until November 2010, director of Ruder Finn Group, a global communications and advertising firm.
Other directorships: Northeast Utilities, which operates New England’s largest energy delivery system
Robert E. Patterson
Born 1945, Trustee since 1984
Principal occupations during past five years: Co-Chairman of Cabot Properties, Inc., a private equity firm investing in commercial real estate, and Chairman of its Investment Committee. Past Chairman and Trustee of the Joslin Diabetes Center.
George Putnam, III
Born 1951, Trustee since 1984
Principal occupations during past five years: Chairman of New Generation Research, Inc., a publisher of financial advisory and other research services. Founder and President of New Generation Advisors, LLC, a registered investment advisor to private funds. Director of The Boston Family Office, LLC, a registered investment advisor.
W. Thomas Stephens
Born 1942, Trustee from 1997 to 2008 and since 2009
Principal occupations during past five years: Retired as Chairman and Chief Executive Officer of Boise Cascade, LLC, a paper, forest products, and timberland assets company, in December 2008. Prior to 2010, Director of Boise Inc., a manufacturer of paper and packaging products.
Other directorships: TransCanada Pipelines Ltd., an energy infrastructure company
Interested Trustee
Robert L. Reynolds*
Born 1952, Trustee since 2008 and President of the Putnam Funds since 2009
Principal occupations during past five years: President and Chief Executive Officer of Putnam Investments since 2008 and, since 2014, President and Chief Executive Officer of Great-West Financial, a financial services company that provides retirement savings plans, life insurance, and annuity and executive benefits products, and of Great-West Lifeco U.S. Inc., a holding company that owns Putnam Investments and Great-West Financial. Prior to joining Putnam Investments, served as Vice Chairman and Chief Operating Officer of Fidelity Investments from 2000 to 2007.
*Mr. Reynolds is an “interested person” (as defined in the Investment Company Act of 1940) of the fund and Putnam Investments. He is President and Chief Executive Officer of Putnam Investments, as well as the President of your fund and each of the other Putnam funds.
The address of each Trustee is One Post Office Square, Boston, MA 02109.
As of September 30, 2014, there were 116 Putnam funds. All Trustees serve as Trustees of all Putnam funds.
Each Trustee serves for an indefinite term, until his or her resignation, retirement at age 75, removal, or death.
54 California Tax Exempt Income Fund
Officers
In addition to Robert L. Reynolds, the other officers of the fund are shown below:
Jonathan S. Horwitz (Born 1955)
Executive Vice President, Principal Executive Officer, and Compliance Liaison
Since 2004
Steven D. Krichmar (Born 1958)
Vice President and Principal Financial Officer
Since 2002
Chief of Operations, Putnam Investments and Putnam Management
Robert T. Burns (Born 1961)
Vice President and Chief Legal Officer
Since 2011
General Counsel, Putnam Investments, Putnam Management, and Putnam Retail Management
Manager of Finance, Dunkin’ Brands (2008–2010); Senior Financial Analyst, Old Mutual Asset Management (2007–2008); Senior Financial Analyst, Putnam Investments (1999–2007)
Janet C. Smith (Born 1965)
Vice President, Principal Accounting Officer, and Assistant Treasurer
Since 2007
Director of Fund Administration Services, Putnam Investments and Putnam Management
Susan G. Malloy (Born 1957)
Vice President and Assistant Treasurer
Since 2007
Director of Accounting & Control Services, Putnam Investments and Putnam Management
James P. Pappas (Born 1953)
Vice President
Since 2004
Director of Trustee Relations, Putnam Investments and Putnam Management
Mark C. Trenchard (Born 1962)
Vice President and BSA Compliance Officer
Since 2002
Director of Operational Compliance, Putnam Investments and Putnam Retail Management
Nancy E. Florek (Born 1957)
Vice President, Director of Proxy Voting and Corporate Governance, Assistant Clerk, and Associate Treasurer
Since 2000
The principal occupations of the officers for the past five years have been with the employers as shown above, although in some cases they have held different positions with such employers. The address of each officer is One Post Office Square, Boston, MA 02109.
California Tax Exempt Income Fund 55
Services for shareholders
Investor services
Systematic investment plan Tell us how much you wish to invest regularly — weekly, semimonthly, or monthly — and the amount you choose will be transferred automatically from your checking or savings account. There’s no additional fee for this service, and you can suspend it at any time. This plan may be a great way to save for college expenses or to plan for your retirement.
Please note that regular investing does not guarantee a profit or protect against loss in a declining market. Before arranging a systematic investment plan, consider your financial ability to continue making purchases in periods when prices are low.
Systematic exchange You can make regular transfers from one Putnam fund to another Putnam fund. There are no additional fees for this service, and you can cancel or change your options at any time.
Dividends PLUS You can choose to have the dividend distributions from one of your Putnam funds automatically reinvested in another Putnam fund at no additional charge.
Free exchange privilege You can exchange money between Putnam funds free of charge, as long as they are the same class of shares. A signature guarantee is required if you are exchanging more than $500,000. The fund reserves the right to revise or terminate the exchange privilege.
Reinstatement privilege If you’ve sold Putnam shares or received a check for a dividend or capital gain, you may reinvest the proceeds with Putnam within 90 days of the transaction and they will be reinvested at the fund’s current net asset value — with no sales charge. However, reinstatement of class B shares may have special tax consequences. Ask your financial or tax representative for details.
Check-writing service You have ready access to many Putnam accounts. It’s as simple as writing a check, and there are no special fees or service charges. For more information about the check-writing service, call Putnam or visit our website.
Dollar cost averaging When you’re investing for long-term goals, it’s time, not timing, that counts. Investing on a systematic basis is a better strategy than trying to figure out when the markets will go up or down. This means investing the same amount of money regularly over a long period. This method of investing is called dollar cost averaging. When a fund’s share price declines, your investment dollars buy more shares at lower prices. When it increases, they buy fewer shares. Over time, you will pay a lower average price per share.
For more information
Visit the Individual Investors section at putnam.com A secure section of our website contains complete information on your account, including balances and transactions, updated daily. You may also conduct transactions, such as exchanges, additional investments, and address changes. Log on today to get your password.
Call us toll free at 1-800-225-1581 Ask a helpful Putnam representative or your financial advisor for details about any of these or other services, or see your prospectus.
56 California Tax Exempt Income Fund
Fund information
Founded over 75 years ago, Putnam Investments was built around the concept that a balance between risk and reward is the hallmark of a well-rounded financial program. We manage over 100 funds across income, value, blend, growth, asset allocation, absolute return, and global sector categories.
Investment Manager
Putnam Investment Management, LLC One Post Office Square Boston, MA 02109
Investment Sub-Manager
Putnam Investments Limited 57–59 St James’s Street London, England SW1A 1LD
Marketing Services
Putnam Retail Management One Post Office Square Boston, MA 02109
Custodian
State Street Bank and Trust Company
Legal Counsel
Ropes & Gray LLP
Independent Registered Public Accounting Firm
KPMG LLP
Trustees
Jameson A. Baxter, Chair Liaquat Ahamed Ravi Akhoury Barbara M. Baumann Charles B. Curtis Robert J. Darretta Katinka Domotorffy John A. Hill Paul L. Joskow Kenneth R. Leibler Robert E. Patterson George Putnam, III Robert L. Reynolds W. Thomas Stephens
Officers
Robert L. Reynolds President
Jonathan S. Horwitz Executive Vice President, Principal Executive Officer, and Compliance Liaison
Steven D. Krichmar Vice President and Principal Financial Officer
Robert T. Burns Vice President and Chief Legal Officer
Robert R. Leveille Vice President and Chief Compliance Officer
Michael J. Higgins Vice President, Treasurer, and Clerk
Janet C. Smith Vice President, Principal Accounting Officer, and Assistant Treasurer
Susan G. Malloy Vice President and Assistant Treasurer
James P. Pappas Vice President
Mark C. Trenchard Vice President and BSA Compliance Officer
Nancy E. Florek Vice President, Director of Proxy Voting and Corporate Governance, Assistant Clerk, and Associate Treasurer
This report is for the information of shareholders of Putnam California Tax Exempt Income Fund. It may also be used as sales literature when preceded or accompanied by the current prospectus, the most recent copy of Putnam’s Quarterly Performance Summary, and Putnam’s Quarterly Ranking Summary. For more recent performance, please visit putnam.com. Investors should carefully consider the investment objectives, risks, charges, and expenses of a fund, which are described in its prospectus. For this and other information or to request a prospectus or summary prospectus, call 1-800-225-1581 toll free. Please read the prospectus carefully before investing. The fund’s Statement of Additional Information contains additional information about the fund’s Trustees and is available without charge upon request by calling 1-800-225-1581.
Item 2. Code of Ethics:
(a) The fund’s principal executive, financial and accounting officers are employees of Putnam Investment Management, LLC, the Fund’s investment manager. As such they are subject to a comprehensive Code of Ethics adopted and administered by Putnam Investments which is designed to protect the interests of the firm and its clients. The Fund has adopted a Code of Ethics which incorporates the Code of Ethics of Putnam Investments with respect to all of its officers and Trustees who are employees of Putnam Investment Management, LLC. For this reason, the Fund has not adopted a separate code of ethics governing its principal executive, financial and accounting officers.
(c) In July 2013, the Code of Ethics of Putnam Investment Management, LLC was amended. The changes to the Code of Ethics were as follows: (i) eliminating the requirement for employees to hold their shares of Putnam mutual funds for specified periods of time, (ii) removing the requirement to preclear transactions in certain kinds of exchange-traded funds and exchange-traded notes, although reporting of all such instruments remains required; (iii) eliminating the excessive trading rule related to employee transactions in securities requiring preclearance under the Code; (iv) adding provisions related to monitoring of employee trading; (v) changing from a set number of shares to a set dollar value of stock of mid- and large-cap companies on the Restricted List that can be purchased or sold; (vi) adding a requirement starting in March 2014 for employees to generally use certain approved brokers that provide Putnam with an electronic feed of transactions and statements for their personal brokerage accounts; and (vii) certain other changes.
Item 3. Audit Committee Financial Expert:
The Funds’ Audit and Compliance Committee is comprised solely of Trustees who are “independent” (as such term has been defined by the Securities and Exchange Commission (“SEC”) in regulations implementing Section 407 of the Sarbanes-Oxley Act (the “Regulations”)). The Trustees believe that each of the members of the Audit and Compliance Committee also possess a combination of knowledge and experience with respect to financial accounting matters, as well as other attributes, that qualify them for service on the Committee. In addition, the Trustees have determined that each of Mr. Leibler, Mr. Hill, Mr. Darretta, and Ms. Baumann qualifies as an “audit committee financial expert” (as such term has been defined by the Regulations) based on their review of his or her pertinent experience and education. The SEC has stated, and the funds’ amended and restated agreement and Declaration of Trust provides, that the designation or identification of a person as an audit committee financial expert pursuant to this Item 3 of Form N-CSR does not impose on such person any duties, obligations or liability that are greater than the duties, obligations and liability imposed on such person as a member of the Audit and Compliance Committee and the Board of Trustees in the absence of such designation or identification.
Item 4. Principal Accountant Fees and Services:
The following table presents fees billed in each of the last two fiscal years for services rendered to the fund by the fund’s independent auditor:
Fiscal year ended
Audit Fees
Audit-Related Fees
Tax Fees
All Other Fees
September 30, 2014
$59,178
$ —
$6,590
$ —
September 30, 2013
$58,141
$ —
$6,458
$ —
For the fiscal years ended September 30, 2014 and September 30, 2013, the fund’s independent auditor billed aggregate non-audit fees in the amounts of $6,590 and $6,458 respectively, to the fund, Putnam Management and any entity controlling, controlled by or under common control with Putnam Management that provides ongoing services to the fund.
Audit Fees represent fees billed for the fund’s last two fiscal years relating to the audit and review of the financial statements included in annual reports and registration statements, and other services that are normally provided in connection with statutory and regulatory filings or engagements.
Audit-Related Fees represent fees billed in the fund’s last two fiscal years for services traditionally performed by the fund’s auditor, including accounting consultation for proposed transactions or concerning financial accounting and reporting standards and other audit or attest services not required by statute or regulation.
Tax Fees represent fees billed in the fund’s last two fiscal years for tax compliance, tax planning and tax advice services. Tax planning and tax advice services include assistance with tax audits, employee benefit plans and requests for rulings or technical advice from taxing authorities.
Pre-Approval Policies of the Audit and Compliance Committee. The Audit and Compliance Committee of the Putnam funds has determined that, as a matter of policy, all work performed for the funds by the funds’ independent auditors will be pre-approved by the Committee itself and thus will generally not be subject to pre-approval procedures.
The Audit and Compliance Committee also has adopted a policy to pre-approve the engagement by Putnam Management and certain of its affiliates of the funds’ independent auditors, even in circumstances where pre-approval is not required by applicable law. Any such requests by Putnam Management or certain of its affiliates are typically submitted in writing to the Committee and explain, among other things, the nature of the proposed engagement, the estimated fees, and why this work should be performed by that particular audit firm as opposed to another one. In reviewing such requests, the Committee considers, among other things, whether the provision of such services by the audit firm are compatible with the independence of the audit firm.
The following table presents fees billed by the fund’s independent auditor for services required to be approved pursuant to paragraph (c)(7)(ii) of Rule 2-01 of Regulation S-X.
Fiscal year ended
Audit-Related Fees
Tax Fees
All Other Fees
Total Non-Audit Fees
September 30, 2014
$ —
$ —
$ —
$ —
September 30, 2013
$ —
$ —
$ —
$ —
Item 5. Audit Committee of Listed Registrants
Not applicable
Item 6. Schedule of Investments:
The registrant’s schedule of investments in unaffiliated issuers is included in the report to shareholders in Item 1 above.
Item 7. Disclosure of Proxy Voting Policies and Procedures For Closed-End Management Investment Companies:
Not applicable
Item 8. Portfolio Managers of Closed-End Investment Companies
Not Applicable
Item 9. Purchases of Equity Securities by Closed-End Management Investment Companies and Affiliated Purchasers:
Not applicable
Item 10. Submission of Matters to a Vote of Security Holders:
Not applicable
Item 11. Controls and Procedures:
(a) The registrant’s principal executive officer and principal financial officer have concluded, based on their evaluation of the effectiveness of the design and operation of the registrant’s disclosure controls and procedures as of a date within 90 days of the filing date of this report, that the design and operation of such procedures are generally effective to provide reasonable assurance that information required to be disclosed by the registrant in this report is recorded, processed, summarized and reported within the time periods specified in the Commission’s rules and forms.
(b) Changes in internal control over financial reporting: Not applicable
Item 12. Exhibits:
(a)(1) The Code of Ethics of The Putnam Funds, which incorporates the Code of Ethics of Putnam Investments, is filed herewith.
(a)(2) Separate certifications for the principal executive officer and principal financial officer of the registrant as required by Rule 30a-2(a) under the Investment Company Act of 1940, as amended, are filed herewith.
(b) The certifications required by Rule 30a-2(b) under the Investment Company Act of 1940, as amended, are filed herewith.
SIGNATURES
Pursuant to the requirements of the Securities Exchange Act of 1934 and the Investment Company Act of 1940, the registrant has duly caused this report to be signed on its behalf by the undersigned, thereunto duly authorized.
Putnam California Tax Exempt Income Fund
By (Signature and Title):
/s/ Janet C. Smith Janet C. Smith Principal Accounting Officer
Date: November 26, 2014
Pursuant to the requirements of the Securities Exchange Act of 1934 and the Investment Company Act of 1940, this report has been signed below by the following persons on behalf of the registrant and in the capacities and on the dates indicated.
By (Signature and Title):
/s/ Jonathan S. Horwitz Jonathan S. Horwitz Principal Executive Officer
Date: November 26, 2014
By (Signature and Title):
/s/ Steven D. Krichmar Steven D. Krichmar Principal Financial Officer
Date: November 26, 2014
We use cookies on this site to provide a more responsive and personalized service. Continuing to browse, clicking I Agree, or closing this banner indicates agreement. See our Cookie Policy for more information.