| | |
| UNITED STATES
SECURITIES AND EXCHANGE COMMISSION |
| | |
| CERTIFIED SHAREHOLDER REPORT OF REGISTERED
MANAGEMENT INVESTMENT COMPANIES
|
| | |
| Investment Company Act file number: | (811-03630) |
| | |
| Exact name of registrant as specified in charter: | Putnam California Tax Exempt Income Fund |
| | |
| Address of principal executive offices: | One Post Office Square, Boston, Massachusetts 02109 |
| | |
| Name and address of agent for service: | Robert T. Burns, Vice President
One Post Office Square
Boston, Massachusetts 02109 |
| | |
| Copy to: | John W. Gerstmayr, Esq.
Ropes & Gray LLP
800 Boylston Street
Boston, Massachusetts 02199-3600 |
| | |
| Registrant’s telephone number, including area code: | (617) 292-1000 |
| | |
| Date of fiscal year end: | September 30, 2013 |
| | |
| Date of reporting period: | October 1, 2012 — September 30, 2013 |
| | |
|
Item 1. Report to Stockholders: | |
| | |
| The following is a copy of the report transmitted to stockholders pursuant to Rule 30e-1 under the Investment Company Act of 1940: | |
Putnam
California Tax Exempt
Income Fund
Annual report
9 | 30 | 13
| | | |
| Message from the Trustees | 1 | | |
| | |
| About the fund | 2 | | |
| | |
| Performance snapshot | 4 | | |
| | |
| Interview with your fund’s portfolio manager | 5 | | |
| | |
| Your fund’s performance | 11 | | |
| | |
| Your fund’s expenses | 14 | | |
| | |
| Terms and definitions | 16 | | |
| | |
| Other information for shareholders | 17 | | |
| | |
| Important notice regarding Putnam’s privacy policy | 18 | | |
| | |
| Trustee approval of management contract | 19 | | |
| | |
| Financial statements | 24 | | |
| | |
| Federal tax information | 55 | | |
| | |
| About the Trustees | 56 | | |
| | |
| Officers | 58 | | |
| | |
Consider these risks before investing: Single-state investments are at risk of common economic forces and other factors affecting a state’s tax-exempt investments. This may result in greater losses and volatility. Capital gains, if any, are taxed at the federal and, in most cases, state levels. For some investors, investment income may be subject to the federal alternative minimum tax. Bond investments are subject to interest-rate risk (the risk of bond prices falling if interest rates rise) and credit risk (the risk of an issuer defaulting on interest or principal payments). Interest-rate risk is greater for longer-term bonds, and credit risk is greater for below-investment-grade bonds. Unlike bonds, funds that invest in bonds have fees and expenses. Tax-exempt bonds may be issued under the Internal Revenue Code only by limited types of issuers for limited types of projects. As a result, the fund’s investments may be focused in certain market segments and be more vulnerable to fluctuations in the values of the securities it holds than a more broadly invested fund. Interest the fund receives might be taxable. Bond prices may fall or fail to rise over time for several reasons, including general financial market conditions and factors related to a specific issuer or industry. You can lose money by investing in the fund.
Message from the Trustees
Dear Fellow Shareholder:
Political events, including the 16-day partial shutdown of the federal government in October, have created an unpredictable environment for investors. Generally, investors prefer clarity, and the drawn-out political wrangling and lack of resolution of the budget and debt ceiling have obscured the way forward for many.
Still, markets have shown remarkable resiliency this year, with the S&P 500 Index up approximately 25% as of October 31, 2013. Corporate balance sheets appear to be healthy, and profits remain strong. Moreover, the Federal Reserve has pledged to maintain an aggressive monetary stimulus policy until the U.S. economic recovery establishes a firm footing.
Of course, it is impossible to predict political and economic outcomes, but we know from past experience the value of maintaining a long-term perspective when it comes to investing. At Putnam, our investment professionals combine in-depth fundamental research, active investing, and risk management strategies that can serve investors well in any market. By integrating investment innovation with alternative approaches, we offer a diverse set of products for a wide range of financial goals.
We also strongly emphasize the importance of seeking the guidance of a financial advisor who can help you work toward your investment goals, based on your individual time horizon and tolerance for risk.
We would like to welcome new shareholders of the fund and to thank you for investing with Putnam. We would also like to extend our thanks to Elizabeth Kennan, who has retired from the Board of Trustees, for her 20 years of dedicated service.

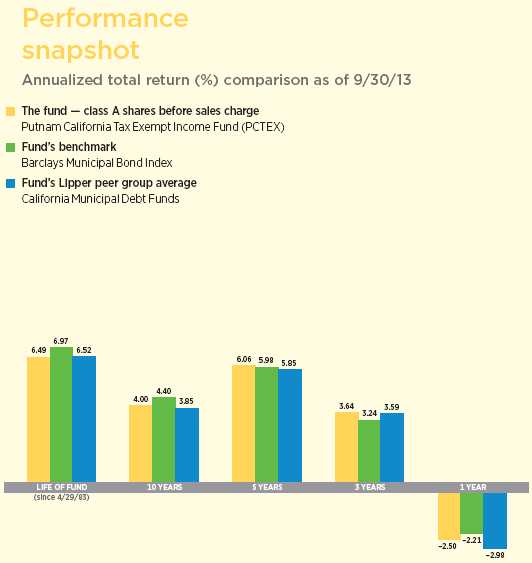
Current performance may be lower or higher than the quoted past performance, which cannot guarantee future results. Share price, principal value, and return will fluctuate, and you may have a gain or a loss when you sell your shares. Performance of class A shares assumes reinvestment of distributions and does not account for taxes. Fund returns in the bar chart do not reflect a sales charge of 4.00%; had they, returns would have been lower. See pages 5 and 11-13 for additional performance information. For a portion of the periods, the fund had expense limitations, without which returns would have been lower. To obtain the most recent month-end performance, visit putnam.com.
| |
| 4 | California Tax Exempt Income Fund |
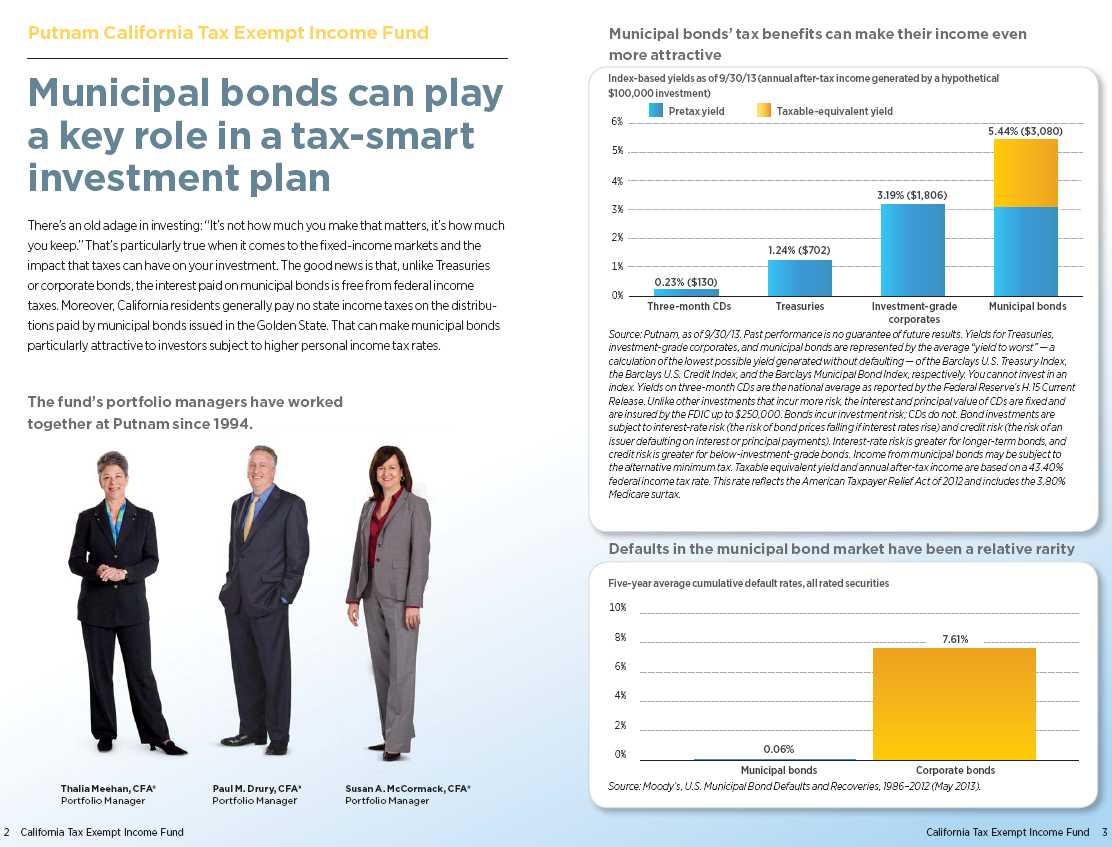
Interview with your fund’s portfolio manager

What was the market environment like for municipal bonds during the 12 months ended September 30, 2013?
During the early months of the fund’s fiscal year, the investment environment was positive for municipal bonds. Demand remained high, supply was relatively tight, and fundamentals in the municipal market continued to improve. As calendar year 2012 came to a close, however, investor uncertainty surrounding the fiscal cliff led to a sell-off. By way of background, as part of the 2011 debt-ceiling negotiations, Congress had scheduled $1.2 trillion in tax increases and spending cuts to begin taking effect on January 1, 2013. In the end, existing tax rates were preserved for most taxpayers, but the political gridlock leading up to the final legislation sent some investors to the sidelines to wait for greater clarification.
Although the outcome provided some clarity around tax rates for 2013, the municipal market had somewhat muted performance during the first quarter of 2013. This past spring, however, continued improvement in U.S. economic growth raised concerns that the Federal Reserve would pare back its stimulative bond-buying program, known as quantitative easing [QE]. In a sell-off from May into July, interest rates rose and yield curves steepened globally.
The debate about the pace of tapering the QE program — and its eventual
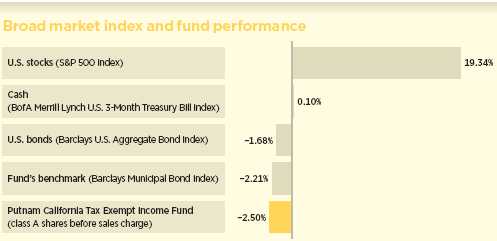
This comparison shows your fund’s performance in the context of broad market indexes for the 12 months ended 9/30/13. See pages 4 and 11–13 for additional fund performance information. Index descriptions can be found on pages 16–17.
| |
| California Tax Exempt Income Fund | 5 |
end — preoccupied financial markets for the balance of the reporting period and contributed to a challenging environment for municipal bonds. Rates continued to climb during the summer months before a late-period rally in September. Overall, the municipal bond yield curve steepened. The upward trend in rates hurt performance because bond prices move in the opposite direction of rates.
Technical pressures — that is, supply-and-demand dynamics — also created a headwind in the final months of the period. Faced with the prospect of higher interest rates, many retail investors sold their municipal bond investments. In addition, Detroit’s bankruptcy and Puerto Rico’s debt challenges added to investor fears. In September, however, the technical backdrop improved somewhat. Municipal bond prices rallied as demand from price-conscious retail and non-traditional, or crossover, buyers picked up, and outflows from municipal bond funds slowed. In addition, there was a significant reduction in refunding activity across the municipal bond market. This combination of diminished supply and somewhat better demand proved to be a tailwind for municipal bond prices in September.
Ultimately, at its September 2013 meeting, the Fed surprised many observers by its decision not to reduce QE, keeping rates unchanged. Municipal bond prices generally rallied after the Fed’s announcement.
Against this backdrop, the fund lagged its benchmark index, the Barclays Municipal Bond Index, but outperformed the average return of its Lipper peer group.
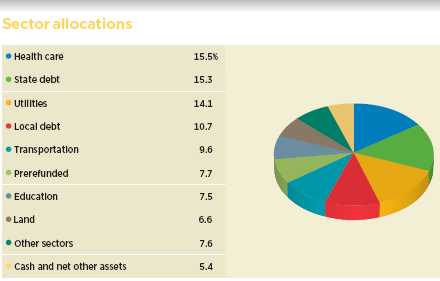
Allocations are shown as a percentage of the fund’s net assets as of 9/30/13. Cash and net other assets, if any, represent the market value weights of cash, derivatives, and short-term securities in the portfolio. Summary information may differ from the information in the portfolio schedule notes included in the financial statements due to the inclusion of derivative securities, any interest accruals, and the use of different classifications of securities for presentation purposes. Holdings and allocations may vary over time.
| |
| 6 | California Tax Exempt Income Fund |
What are your thoughts on the recent rate volatility and the U.S. economy?
In our opinion, the Fed concluded this past spring that the economy had entered a much healthier phase than when the latest round of QE began in late 2012, and that if the pace of improvement continued, it would be prudent to begin dialing back its bond-buying program. However, at its September meeting, the central bank decided to wait for further evidence of improvement in economic growth and the labor market before setting a timetable for tapering. In short, Fed officials now appear more concerned about softness in recent economic data. We also believe the central bank may be more worried than investors about fiscal issues at the federal level, given recent market performance.
Although the political stand-off around the federal debt ceiling has been temporarily resolved, there is certainly the chance that similar events will be repeated in early 2014. For now, we expect the markets to refocus on economic data over the near term.
How are you managing the risk posed by higher interest rates?
We expect continued pressure on interest rates and yield spreads as investors adjust their expectations about Fed policy. However,
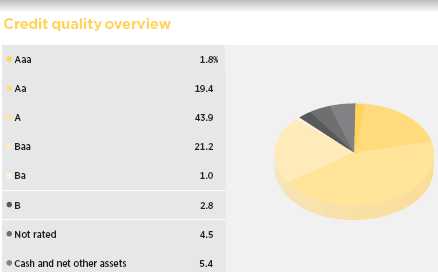
Credit qualities are shown as a percentage of the fund’s net assets as of 9/30/13. A bond rated Baa or higher (MIG3/VMIG3 or higher, for short-term debt) is considered investment grade. The chart reflects Moody’s ratings; percentages may include bonds or derivatives not rated by Moody’s but rated by Standard & Poor’s (S&P) or, if unrated by S&P, by Fitch ratings, and then included in the closest equivalent Moody’s rating. Ratings may vary over time.
Credit quality includes bonds and represents only the fixed-income portion of the portfolio. Cash and net other assets, if any, represent the market value weights of cash, derivatives, short-term securities, and other unclassified assets in the portfolio. The fund itself has not been rated by an independent rating agency.
| |
| California Tax Exempt Income Fund | 7 |
we believe it is unlikely that rates are going to suddenly spike as they did in May and June of 2013. If yields rise more than economic fundamentals seem to warrant, we may view it as an opportunity to add attractively valued securities to the fund. To prepare for this possibility, we are holding a bit more cash in the portfolio as we enter the fourth quarter of 2013 than at the start of the third quarter, and the fund has a slightly shorter duration, or interest-rate sensitivity, than its Lipper peer group.
Periods of high volatility, although unpleasant for investors, may offer attractive buying opportunities. Tax-exempt yields, in our opinion, are more attractive now given the sharp rise in rates. In fact, we have not seen yields at this level since 2011. We believe our fundamental research will help to unlock these opportunities and provide return potential. The municipal bond market is exceptionally diverse, composed of small issuers, complex instruments, and an array of market participants with varying return objectives. We believe this market dynamic presents inefficiencies that can make attractive investment opportunities.
Is the default rate in the municipal bond market still low by historic standards?
Yes. For calendar year 2012, bankruptcy filings represented approximately 0.12% of the $3.7 trillion municipal bond market, and they remained near this rate during 2013 as well. This default rate is in line with historical averages, and we do not believe defaults will increase meaningfully in the near future.
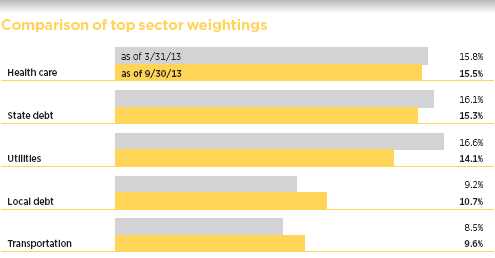
This chart shows how the fund’s top weightings have changed over the past six months. Allocations are shown as a percentage of the fund’s net assets. Current period summary information may differ from the information in the portfolio schedule notes included in the financial statements due to the inclusion of derivative securities, any interest accruals, and the use of different classifications of securities for presentation purposes. Holdings and allocations may vary over time.
| |
| 8 | California Tax Exempt Income Fund |
In our opinion, the significance of defaults and downgrades is the headline risk that emerges from occasional isolated incidents of insolvency. For example, Puerto Rico was downgraded by Moody’s last year, and by Standard & Poor’s this past spring. Puerto Rico’s debt is widely held, and the considerable negative coverage of Puerto Rico’s strained economy led to a heavy sell-off in August. Puerto Rico’s government has since taken measures to mend its credit profile, notably proposals for pension reform. Despite these reforms, the credit is likely to remain pressured due to its struggling economy. Also, the City of Detroit filed for Chapter 9 bankruptcy in July. Detroit’s filing was a large headline event, but it is something that the market had expected for some time. Although there is some near-term headline risk, we feel that the Chapter 9 filing is isolated, and we expect a negligible impact on the broader municipal market. At the same time, we continue to monitor the legal proceedings because they have the potential to set new precedents that can influence the market.
Given improvements in state budget forecasts, Moody’s revised its outlook for U.S. states in August to “stable” after five years of negative ratings. Credit quality at the state level remains quite high, with 30 of the 50 states holding either an Aaa or Aa1 rating, the two highest possible ratings. On balance, we think the outlook is stabilizing, given the improvement in employment, economic growth, and consumer confidence data — all of which have contributed to rising tax collections.
How did you position the portfolio during the period?
We identified what we considered improving fundamentals and still-attractive spreads in the market and sought to benefit from them. For example, revenue credits — typically issued by state and local governments to finance a specific revenue-generating project — fared well, in our view. To this end, we maintained our overweight position in revenue bonds rated BBB. While we believed that the budget challenges faced by many municipalities were significant, we were confident that conditions would improve as long as the broader economy did not stall. Our overweight to essential service revenue bonds was offset by the fund’s underweight positioning in local G.O. [general obligation] bonds — securities issued at the city or county level. As the federal government looks to reduce transfer payments to the states, we believe that these types of bonds are at risk for downgrades or other headline-driven price volatility. In terms of sectors, relative to the fund’s benchmark index, we favored airlines, higher education, utility, and health-care bonds.
Overall, this credit positioning helped the fund’s performance during the period. The shorter-duration interest-rate positioning also benefited returns, especially during the second half of the period as interest rates moved higher starting in May.
As we enter the fourth quarter, and the fund’s new fiscal year, what is your outlook for the municipal bond market?
We continue to have a constructive outlook for municipal bonds, especially as part of a diversified portfolio and for long-term investors seeking tax-free income. The second half of the reporting period proved to be a volatile time for municipal bonds, and market conditions remain less than robust. It’s worth noting, however, that while spreads are much narrower than they were at their peak, we believe the recent sell-off has created more attractive opportunities in a dislocated municipal market.
In our view, technical factors in the market are the big wild card. Tax-exempt municipal fund outflows have put downward pressure on prices. Although we have seen some
| |
| California Tax Exempt Income Fund | 9 |
institutional crossover buyers come into the market to help support prices, we think it is unlikely that we will see volatility subside until outflows and rate volatility diminish. As I mentioned previously, the overall fundamental credit outlook of municipal bonds appears solid. With regard to tax policy, while investors gained certainty on tax rates for 2013, many issues remain unresolved, including the debt ceiling and the potential for broader tax reform — both of which could affect the value of municipal bonds. As always, we are monitoring the situation closely and positioning the portfolio accordingly, based on our analysis.
Thank you, Thalia, for bringing us up to date.
The views expressed in this report are exclusively those of Putnam Management and are subject to change. They are not meant as investment advice.
Please note that the holdings discussed in this report may not have been held by the fund for the entire period. Portfolio composition is subject to review in accordance with the fund’s investment strategy and may vary in the future. Current and future portfolio holdings are subject to risk.
Portfolio Manager Thalia Meehan holds a B.A. from Williams College. A CFA charterholder, Thalia joined Putnam in 1989 and has been in the investment industry since 1983.
In addition to Thalia, your fund’s portfolio managers are Paul M. Drury, CFA®, and Susan A. McCormack, CFA®.
IN THE NEWS
With the U.S. Federal Reserve facing the formidable challenge of starting to unwind its unprecedented monetary stimulus program, President Barack Obama in October nominated Janet Yellen to chair the world’s most powerful central bank. Ben Bernanke completes his second four-year term as Fed chairman on January 31, 2014. If she receives congressional confirmation, Yellen, vice chairman of the Fed since 2010 and a key architect of the central bank’s $85-billion-a-month asset-purchase program, would become the first woman to lead the central bank in its 100-year history. Bernanke, who led the Fed in its efforts to help the U.S. economy withstand the worst financial crisis since the 1930s, has said that the central bank will not taper its monthly bond purchases until U.S. economic data, particularly with respect to employment, show further improvement. The Fed has also pledged to hold short-term interest rates near zero until the nation’s unemployment rate, which stood at 7.2% as of September 30, 2013, reaches 6.5%, provided inflation remains in check.
| |
| 10 | California Tax Exempt Income Fund |
Your fund’s performance
This section shows your fund’s performance, price, and distribution information for periods ended September 30, 2013, the end of its most recent fiscal year. In accordance with regulatory requirements for mutual funds, we also include expense information taken from the fund’s current prospectus. Performance should always be considered in light of a fund’s investment strategy. Data represent past performance. Past performance does not guarantee future results. More recent returns may be less or more than those shown. Investment return and principal value will fluctuate, and you may have a gain or a loss when you sell your shares. Performance information does not reflect any deduction for taxes a shareholder may owe on fund distributions or on the redemption of fund shares. For the most recent month-end performance, please visit the Individual Investors section at putnam.com or call Putnam at 1-800-225-1581. Class Y shares are not available to all investors. See the Terms and Definitions section in this report for definitions of the share classes offered by your fund.
Fund performance Total return for periods ended 9/30/13
| | | | | | | | | |
| | Class A | Class B | Class C | Class M | Class Y |
| (inception dates) | (4/29/83) | (1/4/93) | (7/26/99) | (2/14/95) | (1/2/08) |
|
| | Before | After | | | | | Before | After | Net |
| | sales | sales | Before | After | Before | After | sales | sales | asset |
| | charge | charge | CDSC | CDSC | CDSC | CDSC | charge | charge | value |
|
| Annual average | | | | | | | | | |
| (life of fund) | 6.49% | 6.35% | 5.72% | 5.72% | 5.64% | 5.64% | 6.09% | 5.98% | 6.54% |
|
| 10 years | 48.05 | 42.13 | 38.75 | 38.75 | 36.89 | 36.89 | 43.69 | 39.02 | 50.25 |
| Annual average | 4.00 | 3.58 | 3.33 | 3.33 | 3.19 | 3.19 | 3.69 | 3.35 | 4.16 |
|
| 5 years | 34.20 | 28.83 | 30.02 | 28.02 | 29.09 | 29.09 | 32.37 | 28.06 | 35.78 |
| Annual average | 6.06 | 5.20 | 5.39 | 5.06 | 5.24 | 5.24 | 5.77 | 5.07 | 6.31 |
|
| 3 years | 11.32 | 6.87 | 9.23 | 6.30 | 8.69 | 8.69 | 10.41 | 6.82 | 12.03 |
| Annual average | 3.64 | 2.24 | 2.99 | 2.06 | 2.82 | 2.82 | 3.36 | 2.22 | 3.86 |
|
| 1 year | –2.50 | –6.40 | –3.24 | –7.92 | –3.25 | –4.19 | –2.78 | –5.94 | –2.28 |
|
Current performance may be lower or higher than the quoted past performance, which cannot guarantee future results. After-sales-charge returns for class A and M shares reflect the deduction of the maximum 4.00% and 3.25% sales charge, respectively, levied at the time of purchase. Class B share returns after contingent deferred sales charge (CDSC) reflect the applicable CDSC, which is 5% in the first year, declining over time to 1% in the sixth year, and is eliminated thereafter. Class C share returns after CDSC reflect a 1% CDSC for the first year that is eliminated thereafter. Class Y shares have no initial sales charge or CDSC. Performance for class B, C, M, and Y shares before their inception is derived from the historical performance of class A shares, adjusted for the applicable sales charge (or CDSC) and the higher operating expenses for such shares, except for class Y shares, for which 12b-1 fees are not applicable.
For a portion of the periods, the fund had expense limitations, without which returns would have been lower.
Class B share performance does not reflect conversion to class A shares.
| |
| California Tax Exempt Income Fund | 11 |
Comparative index returns For periods ended 9/30/13
| | |
| | | Lipper California |
| | Barclays Municipal | Municipal Debt Funds |
| | Bond Index | category average* |
|
| Annual average (life of fund) | 6.97% | 6.52% |
|
| 10 years | 53.78 | 46.03 |
| Annual average | 4.40 | 3.85 |
|
| 5 years | 33.71 | 32.91 |
| Annual average | 5.98 | 5.85 |
|
| 3 years | 10.03 | 11.16 |
| Annual average | 3.24 | 3.59 |
|
| 1 year | –2.21 | –2.98 |
|
Index and Lipper results should be compared with fund performance before sales charge, before CDSC, or at net asset value.
* Over the 1-year, 3-year, 5-year, 10-year, and life-of-fund periods ended 9/30/13, there were 120, 113, 108, 86, and 3 funds, respectively, in this Lipper category.
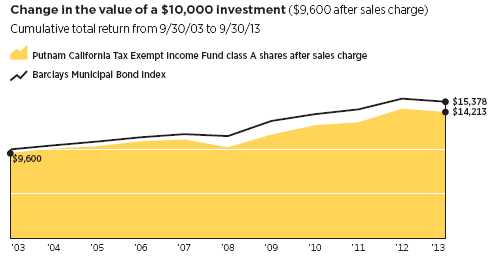
Past performance does not indicate future results. At the end of the same time period, a $10,000 investment in the fund’s class B and class C shares would have been valued at $13,875 and $13,689, respectively, and no contingent deferred sales charges would apply. A $10,000 investment in the fund’s class M shares ($9,675 after sales charge) would have been valued at $13,902. A $10,000 investment in the fund’s class Y shares would have been valued at $15,025.
| |
| 12 | California Tax Exempt Income Fund |
Fund price and distribution information For the 12-month period ended 9/30/13
| | | | | | | |
| Distributions | Class A | Class B | Class C | Class M | Class Y |
|
| Number | 12 | 12 | 12 | 12 | 12 |
|
| Income 1 | $0.330884 | $0.278659 | $0.265757 | $0.307719 | $0.348958 |
|
| Capital gains 2 | — | — | — | — | — |
|
| Total | $0.330884 | $0.278659 | $0.265757 | $0.307719 | $0.348958 |
|
| | Before | After | Net | Net | Before | After | Net |
| | sales | sales | asset | asset | sales | sales | asset |
| Share value | charge | charge | value | value | charge | charge | value |
|
| 9/30/12 | $8.34 | $8.69 | $8.34 | $8.38 | $8.32 | $8.60 | $8.36 |
|
| 9/30/13 | 7.81 | 8.14 | 7.80 | 7.85 | 7.79 | 8.05 | 7.83 |
|
| | Before | After | Net | Net | Before | After | Net |
| | sales | sales | asset | asset | sales | sales | asset |
| Current rate (end of period) | charge | charge | value | value | charge | charge | value |
|
| Current dividend rate 3 | 4.27% | 4.10% | 3.63% | 3.45% | 4.00% | 3.87% | 4.48% |
|
| Taxable equivalent 4 | 8.41 | 8.08 | 7.15 | 6.80 | 7.88 | 7.62 | 8.82 |
|
| Current 30-day SEC yield 5 | N/A | 3.45 | 2.97 | 2.82 | N/A | 3.21 | 3.81 |
|
| Taxable equivalent 4 | N/A | 6.80 | 5.85 | 5.55 | N/A | 6.32 | 7.50 |
|
The classification of distributions, if any, is an estimate. Before-sales-charge share value and current dividend rate for class A and M shares, if applicable, do not take into account any sales charge levied at the time of purchase.
After-sales-charge share value, current dividend rate, and current 30-day SEC yield, if applicable, are calculated assuming that the maximum sales charge (4.00% for class A shares and 3.25% for class M shares) was levied at the time of purchase. Final distribution information will appear on your year-end tax forms.
1 For some investors, investment income may be subject to the federal alternative minimum tax.
2 Capital gains, if any, are taxable for federal and, in most cases, state purposes.
3 Most recent distribution, including any return of capital and excluding capital gains, annualized and divided by share price before or after sales charge at period-end.
4 Assumes maximum 49.23% federal and state combined tax rate for 2013. Results for investors subject to lower tax rates would not be as advantageous.
5 Based only on investment income and calculated using the maximum offering price for each share class, in accordance with SEC guidelines.
| |
| California Tax Exempt Income Fund | 13 |
Your fund’s expenses
As a mutual fund investor, you pay ongoing expenses, such as management fees, distribution fees (12b-1 fees), and other expenses. Using the following information, you can estimate how these expenses affect your investment and compare them with the expenses of other funds. You may also pay one-time transaction expenses, including sales charges (loads) and redemption fees, which are not shown in this section and would have resulted in higher total expenses. For more information, see your fund’s prospectus or talk to your financial representative.
Expense ratios
| | | | | |
| | Class A | Class B | Class C | Class M | Class Y |
|
| Total annual operating expenses for the fiscal | | | | | |
| year ended 9/30/12 | 0.75% | 1.38% | 1.53% | 1.03% | 0.53% |
|
| Annualized expense ratio for the six-month | | | | | |
| period ended 9/30/13* | 0.74% | 1.37% | 1.52% | 1.02% | 0.52% |
|
Fiscal-year expense information in this table is taken from the most recent prospectus, is subject to change, and may differ from that shown for the annualized expense ratio and in the financial highlights of this report. Expenses are shown as a percentage of average net assets.
* For the fund’s most recent fiscal half year; may differ from expense ratios based on one-year data in the financial highlights.
Expenses per $1,000
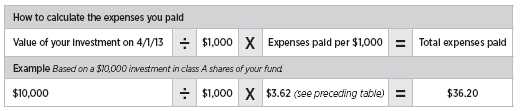
The following table shows the expenses you would have paid on a $1,000 investment in the fund from April 1, 2013, to September 30, 2013. It also shows how much a $1,000 investment would be worth at the close of the period, assuming actual returns and expenses.
| | | | | |
| | Class A | Class B | Class C | Class M | Class Y |
|
| Expenses paid per $1,000*† | $3.62 | $6.70 | $7.43 | $4.99 | $2.55 |
|
| Ending value (after expenses) | $954.80 | $950.50 | $950.00 | $953.30 | $956.00 |
|
* Expenses for each share class are calculated using the fund’s annualized expense ratio for each class, which represents the ongoing expenses as a percentage of average net assets for the six months ended 9/30/13. The expense ratio may differ for each share class.
† Expenses are calculated by multiplying the expense ratio by the average account value for the period; then multiplying the result by the number of days in the period; and then dividing that result by the number of days in the year.
| |
| 14 | California Tax Exempt Income Fund |
Estimate the expenses you paid
To estimate the ongoing expenses you paid for the six months ended September 30, 2013, use the following calculation method. To find the value of your investment on April 1, 2013, call Putnam at 1-800-225-1581.
Compare expenses using the SEC’s method
The Securities and Exchange Commission (SEC) has established guidelines to help investors assess fund expenses. Per these guidelines, the following table shows your fund’s expenses based on a $1,000 investment, assuming a hypothetical 5% annualized return. You can use this information to compare the ongoing expenses (but not transaction expenses or total costs) of investing in the fund with those of other funds. All mutual fund shareholder reports will provide this information to help you make this comparison. Please note that you cannot use this information to estimate your actual ending account balance and expenses paid during the period.
| | | | | |
| | Class A | Class B | Class C | Class M | Class Y |
|
| Expenses paid per $1,000*† | $3.74 | $6.93 | $7.69 | $5.16 | $2.64 |
|
| Ending value (after expenses) | $1,021.37 | $1,018.20 | $1,017.45 | $1,019.95 | $1,022.46 |
|
* Expenses for each share class are calculated using the fund’s annualized expense ratio for each class, which represents the ongoing expenses as a percentage of average net assets for the six months ended 9/30/13. The expense ratio may differ for each share class.
† Expenses are calculated by multiplying the expense ratio by the average account value for the six-month period; then multiplying the result by the number of days in the six-month period; and then dividing that result by the number of days in the year.
| |
| California Tax Exempt Income Fund | 15 |
Terms and definitions
Important terms
Total return shows how the value of the fund’s shares changed over time, assuming you held the shares through the entire period and reinvested all distributions in the fund.
Before sales charge, or net asset value, is the price, or value, of one share of a mutual fund, without a sales charge. Before-sales-charge figures fluctuate with market conditions, and are calculated by dividing the net assets of each class of shares by the number of outstanding shares in the class.
After sales charge is the price of a mutual fund share plus the maximum sales charge levied at the time of purchase. After-sales-charge performance figures shown here assume the 4.00% maximum sales charge for class A shares and 3.25% for class M shares.
Contingent deferred sales charge (CDSC) is generally a charge applied at the time of the redemption of class B or C shares and assumes redemption at the end of the period. Your fund’s class B CDSC declines over time from a 5% maximum during the first year to 1% during the sixth year. After the sixth year, the CDSC no longer applies. The CDSC for class C shares is 1% for one year after purchase.
Share classes
Class A shares are generally subject to an initial sales charge and no CDSC (except on certain redemptions of shares bought without an initial sales charge).
Class B shares are not subject to an initial sales charge. They may be subject to a CDSC.
Class C shares are not subject to an initial sales charge and are subject to a CDSC only if the shares are redeemed during the first year.
Class M shares have a lower initial sales charge and a higher 12b-1 fee than class A shares and no CDSC.
Class Y shares are not subject to an initial sales charge or CDSC, and carry no 12b-1 fee. They are generally only available to corporate and institutional clients and clients in other approved programs.
Fixed-income terms
Current rate is the annual rate of return earned from dividends or interest of an investment. Current rate is expressed as a percentage of the price of a security, fund share, or principal investment.
Yield curve is a graph that plots the yields of bonds with equal credit quality against their differing maturity dates, ranging from shortest to longest. It is used as a benchmark for other debt, such as mortgage or bank lending rates.
Comparative indexes
Barclays Municipal Bond Index is an unmanaged index of long-term fixed-rate investment-grade tax-exempt bonds.
Barclays U.S. Aggregate Bond Index is an unmanaged index of U.S. investment-grade fixed-income securities.
BofA Merrill Lynch U.S. 3-Month Treasury Bill Index is an unmanaged index that seeks to measure the performance of U.S. Treasury bills available in the marketplace.
S&P 500 Index is an unmanaged index of common stock performance.
Indexes assume reinvestment of all distributions and do not account for fees. Securities and performance of a fund and an index will differ. You cannot invest directly in an index.
| |
| 16 | California Tax Exempt Income Fund |
Lipper is a third-party industry-ranking entity that ranks mutual funds. Its rankings do not reflect sales charges. Lipper rankings are based on total return at net asset value relative to other funds that have similar current investment styles or objectives as determined by Lipper. Lipper may change a fund’s category assignment at its discretion. Lipper category averages reflect performance trends for funds within a category.
Other information for shareholders
Proxy voting
Putnam is committed to managing our mutual funds in the best interests of our shareholders. The Putnam funds’ proxy voting guidelines and procedures, as well as information regarding how your fund voted proxies relating to portfolio securities during the 12-month period ended June 30, 2013, are available in the Individual Investors section of putnam.com, and on the Securities and Exchange Commission (SEC) website, www.sec.gov. If you have questions about finding forms on the SEC’s website, you may call the SEC at 1-800-SEC-0330. You may also obtain the Putnam funds’ proxy voting guidelines and procedures at no charge by calling Putnam’s Shareholder Services at 1-800-225-1581.
Fund portfolio holdings
The fund will file a complete schedule of its portfolio holdings with the SEC for the first and third quarters of each fiscal year on Form N-Q. Shareholders may obtain the fund’s Forms N-Q on the SEC’s website at www.sec.gov. In addition, the fund’s Forms N-Q may be reviewed and copied at the SEC’s Public Reference Room in Washington, D.C. You may call the SEC at 1-800-SEC-0330 for information about the SEC’s website or the operation of the Public Reference Room.
Trustee and employee fund ownership
Putnam employees and members of the Board of Trustees place their faith, confidence, and, most importantly, investment dollars in Putnam mutual funds. As of September 30, 2013, Putnam employees had approximately $400,000,000 and the Trustees had approximately $96,000,000 invested in Putnam mutual funds. These amounts include investments by the Trustees’ and employees’ immediate family members as well as investments through retirement and deferred compensation plans.
| |
| California Tax Exempt Income Fund | 17 |
Important notice regarding Putnam’s privacy policy
In order to conduct business with our shareholders, we must obtain certain personal information such as account holders’ names, addresses, Social Security numbers, and dates of birth. Using this information, we are able to maintain accurate records of accounts and transactions.
It is our policy to protect the confidentiality of our shareholder information, whether or not a shareholder currently owns shares of our funds. In particular, it is our policy not to sell information about you or your accounts to outside marketing firms. We have safeguards in place designed to prevent unauthorized access to our computer systems and procedures to protect personal information from unauthorized use.
Under certain circumstances, we must share account information with outside vendors who provide services to us, such as mailings and proxy solicitations. In these cases, the service providers enter into confidentiality agreements with us, and we provide only the information necessary to process transactions and perform other services related to your account. Finally, it is our policy to share account information with your financial representative, if you’ve listed one on your Putnam account.
| |
| 18 | California Tax Exempt Income Fund |
Trustee approval of management contract
General conclusions
The Board of Trustees of the Putnam funds oversees the management of each fund and, as required by law, determines annually whether to approve the continuance of your fund’s management contract with Putnam Investment Management (“Putnam Management”) and the sub-management contract with respect to your fund between Putnam Management and its affiliate, Putnam Investments Limited (“PIL”). The Board of Trustees, with the assistance of its Contract Committee, requests and evaluates all information it deems reasonably necessary under the circumstances in connection with its annual contract review. The Contract Committee consists solely of Trustees who are not “interested persons” (as this term is defined in the Investment Company Act of 1940, as amended (the “1940 Act”)) of the Putnam funds (“Independent Trustees”).
At the outset of the review process, members of the Board’s independent staff and independent legal counsel met with representatives of Putnam Management to review the annual contract review materials furnished to the Contract Committee during the course of the previous year’s review and to discuss possible changes in these materials that might be necessary or desirable for the coming year. Following these discussions and in consultation with the Contract Committee, the Independent Trustees’ independent legal counsel requested that Putnam Management furnish specified information, together with any additional information that Putnam Management considered relevant, to the Contract Committee. Over the course of several months ending in June 2013, the Contract Committee met on a number of occasions with representatives of Putnam Management, and separately in executive session, to consider the information that Putnam Management provided. Throughout this process, the Contract Committee was assisted by the members of the Board’s independent staff and by independent legal counsel for the Putnam funds and the Independent Trustees.
In May 2013, the Contract Committee met in executive session to discuss and consider its preliminary recommendations with respect to the continuance of the contracts. At the Trustees’ June 20, 2013 meeting, the Contract Committee met in executive session with the other Independent Trustees to review a summary of the key financial data that the Contract Committee considered in the course of its review. The Contract Committee then presented its written report, which summarized the key factors that the Committee had considered and set forth its final recommendations. The Contract Committee then recommended, and the Independent Trustees approved, the continuance of your fund’s management and sub-management contracts, effective July 1, 2013, subject to certain changes in the sub-management contract noted below. (Because PIL is an affiliate of Putnam Management and Putnam Management remains fully responsible for all services provided by PIL, the Trustees have not evaluated PIL as a separate entity, and all subsequent references to Putnam Management below should be deemed to include reference to PIL as necessary or appropriate in the context.)
The Independent Trustees’ approval was based on the following conclusions:
• That the fee schedule in effect for your fund represented reasonable compensation in light of the nature and quality of the services being provided to the fund, the fees paid by competitive funds, and the costs incurred by Putnam Management in providing services to the fund, and
• That the fee schedule represented an appropriate sharing between fund
| |
| California Tax Exempt Income Fund | 19 |
shareholders and Putnam Management of such economies of scale as may exist in the management of the fund at current asset levels.
These conclusions were based on a comprehensive consideration of all information provided to the Trustees and were not the result of any single factor. Some of the factors that figured particularly in the Trustees’ deliberations and how the Trustees considered these factors are described below, although individual Trustees may have evaluated the information presented differently, giving different weights to various factors. It is also important to recognize that the management arrangements for your fund and the other Putnam funds are the result of many years of review and discussion between the Independent Trustees and Putnam Management, that some aspects of the arrangements may receive greater scrutiny in some years than others, and that the Trustees’ conclusions may be based, in part, on their consideration of fee arrangements in previous years. For example, with some minor exceptions, the current fee arrangements in the management contracts for the Putnam funds were implemented at the beginning of 2010 following extensive review and discussion by the Trustees, as well as approval by shareholders.
As noted above, the Trustees considered administrative revisions to your fund’s sub-management contract. Putnam Management recommended that the sub-management contract be revised to reduce the sub-management fee that Putnam Management pays to PIL with respect to the portion of the portfolios of certain funds, but not your fund, that may be allocated to PIL from time to time. The Independent Trustees’ approval of this recommendation was based on their conclusion that these changes would have no practical effect on Putnam Management’s continued responsibility for the management of these funds or the costs borne by fund shareholders and would not result in any reduction in the nature and quality of services provided to the funds.
Management fee schedules and total expenses
The Trustees reviewed the management fee schedules in effect for all Putnam funds, including fee levels and breakpoints. The Trustees also reviewed the total expenses of each Putnam fund, recognizing that in most cases management fees represented the major, but not the sole, determinant of total costs to shareholders.
In reviewing fees and expenses, the Trustees generally focus their attention on material changes in circumstances — for example, changes in assets under management, changes in a fund’s investment style, changes in Putnam Management’s operating costs or profitability, or changes in competitive practices in the mutual fund industry — that suggest that consideration of fee changes might be warranted. The Trustees concluded that the circumstances did not warrant changes to the management fee structure of your fund.
Under its management contract, your fund has the benefit of breakpoints in its management fee schedule that provide shareholders with economies of scale in the form of reduced fee levels as assets under management in the Putnam family of funds increase. The Trustees concluded that the fee schedule in effect for your fund represented an appropriate sharing of economies of scale between fund shareholders and Putnam Management.
As in the past, the Trustees also focused on the competitiveness of each fund’s total expense ratio. In order to ensure that expenses of the Putnam funds continue to meet competitive standards, the Trustees and Putnam Management have implemented certain expense limitations. These expense limitations were: (i) a contractual expense limitation applicable to all retail open-end funds of 32 basis points on investor servicing fees and expenses and
|
| 20 California Tax Exempt Income Fund |
(ii) a contractual expense limitation applicable to all open-end funds of 20 basis points on so-called “other expenses” (i.e., all expenses exclusive of management fees, investor servicing fees, distribution fees, investment-related expenses, interest, taxes, brokerage commissions, extraordinary expenses and acquired fund fees and expenses). These expense limitations serve in particular to maintain competitive expense levels for funds with large numbers of small shareholder accounts and funds with relatively small net assets. Most funds, including your fund, had sufficiently low expenses that these expense limitations did not apply. Putnam Management’s support for these expense limitations was an important factor in the Trustees’ decision to approve the continuance of your fund’s management and sub-management contracts.
The Trustees reviewed comparative fee and expense information for a custom group of competitive funds selected by Lipper Inc. This comparative information included your fund’s percentile ranking for effective management fees and total expenses (excluding any applicable 12b-1 fee), which provides a general indication of your fund’s relative standing. In the custom peer group, your fund ranked in the 2nd quintile in effective management fees (determined for your fund and the other funds in the custom peer group based on fund asset size and the applicable contractual management fee schedule) and in the 2nd quintile in total expenses (excluding any applicable 12b-1 fees) as of December 31, 2012 (the first quintile representing the least expensive funds and the fifth quintile the most expensive funds). The fee and expense data reported by Lipper as of December 31, 2012 reflected the most recent fiscal year-end data available in Lipper’s database at that time.
In connection with their review of the management fees and total expenses of the Putnam funds, the Trustees also reviewed the costs of the services provided and the profits realized by Putnam Management and its affiliates from their contractual relationships with the funds. This information included trends in revenues, expenses and profitability of Putnam Management and its affiliates relating to the investment management, investor servicing and distribution services provided to the funds. In this regard, the Trustees also reviewed an analysis of Putnam Management’s revenues, expenses and profitability, allocated on a fund-by-fund basis, with respect to the funds’ management, distribution, and investor servicing contracts. For each fund, the analysis presented information about revenues, expenses and profitability for each of the agreements separately and for the agreements taken together on a combined basis. The Trustees concluded that, at current asset levels, the fee schedules in place represented reasonable compensation for the services being provided and represented an appropriate sharing of such economies of scale as may exist in the management of the Putnam funds at that time.
The information examined by the Trustees as part of their annual contract review for the Putnam funds has included for many years information regarding fees charged by Putnam Management and its affiliates to institutional clients such as defined benefit pension plans, college endowments, and the like. This information included comparisons of those fees with fees charged to the funds, as well as an assessment of the differences in the services provided to these different types of clients. The Trustees observed that the differences in fee rates between institutional clients and mutual funds are by no means uniform when examined by individual asset sectors, suggesting that differences in the pricing of investment management services to these types of clients may reflect historical competitive forces operating in separate markets. The Trustees considered the fact that in many cases fee rates across different asset classes are higher on average
| |
| California Tax Exempt Income Fund | 21 |
for mutual funds than for institutional clients, as well as the differences between the services that Putnam Management provides to the Putnam funds and those that it provides to its institutional clients. The Trustees did not rely on these comparisons to any significant extent in concluding that the management fees paid by your fund are reasonable.
Investment performance
The quality of the investment process provided by Putnam Management represented a major factor in the Trustees’ evaluation of the quality of services provided by Putnam Management under your fund’s management contract. The Trustees were assisted in their review of the Putnam funds’ investment process and performance by the work of the investment oversight committees of the Trustees, which meet on a regular basis with the funds’ portfolio teams and with the Chief Investment Officer and other senior members of Putnam Management’s Investment Division throughout the year. The Trustees concluded that Putnam Management generally provides a high-quality investment process — based on the experience and skills of the individuals assigned to the management of fund portfolios, the resources made available to them, and in general Putnam Management’s ability to attract and retain high-quality personnel — but also recognized that this does not guarantee favorable investment results for every fund in every time period.
The Trustees considered that 2012 was a year of strong competitive performance for many of the Putnam funds, with only a relatively small number of exceptions. They noted that this strong performance was exemplified by the fact that the Putnam funds were recognized by Barron’s as the best performing mutual fund complex for 2012 — the second time in four years that Putnam Management has achieved this distinction for the Putnam funds. They also noted, however, the disappointing investment performance of some funds for periods ended December 31, 2012 and considered information provided by Putnam Management regarding the factors contributing to the underperformance and actions being taken to improve the performance of these particular funds. The Trustees indicated their intention to continue to monitor performance trends to assess the effectiveness of these efforts and to evaluate whether additional actions to address areas of underperformance are warranted.
For purposes of evaluating investment performance, the Trustees generally focus on competitive industry rankings for the one-year, three-year, and five-year periods. For a number of Putnam funds with relatively unique investment mandates, the Trustees evaluated performance based on comparisons of their total returns with the returns of selected investment benchmarks or targeted returns. In the case of your fund, the Trustees considered that its class A share cumulative total return performance at net asset value was in the following quartiles of its Lipper Inc. peer group (Lipper California Municipal Debt Funds) for the one-year, three-year and five-year periods ended December 31, 2012 (the first quartile representing the best-performing funds and the fourth quartile the worst-performing funds):
| | | |
| One-year period | 3rd | | |
| | |
| Three-year period | 2nd | | |
| | |
| Five-year period | 2nd | | |
| | |
Over the one-year, three-year and five-year periods ended December 31, 2012, there were 118, 113 and 107 funds, respectively, in your fund’s Lipper peer group. (When considering performance information, shareholders should be mindful that past performance is not a guarantee of future results.)
Brokerage and soft-dollar allocations; investor servicing
The Trustees considered various potential benefits that Putnam Management may receive in connection with the services it provides under
|
| 22 California Tax Exempt Income Fund |
the management contract with your fund. These include benefits related to brokerage allocation and the use of soft dollars, whereby a portion of the commissions paid by a fund for brokerage may be used to acquire research services that are expected to be useful to Putnam Management in managing the assets of the fund and of other clients. Subject to policies established by the Trustees, soft dollars generated by these means are used primarily to acquire brokerage and research services that enhance Putnam Management’s investment capabilities and supplement Putnam Management’s internal research efforts. However, the Trustees noted that a portion of available soft dollars continues to be used to pay fund expenses. The Trustees indicated their continued intent to monitor regulatory and industry developments in this area with the assistance of their Brokerage Committee and also indicated their continued intent to monitor the allocation of the Putnam funds’ brokerage in order to ensure that the principle of seeking best price and execution remains paramount in the portfolio trading process.
Putnam Management may also receive benefits from payments that the funds make to Putnam Management’s affiliates for investor or distribution services. In conjunction with the annual review of your fund’s management and sub-management contracts, the Trustees reviewed your fund’s investor servicing agreement with Putnam Investor Services, Inc. (“PSERV”) and its distributor’s contracts and distribution plans with Putnam Retail Management Limited Partnership (“PRM”), both of which are affiliates of Putnam Management. The Trustees concluded that the fees payable by the funds to PSERV and PRM, as applicable, for such services are reasonable in relation to the nature and quality of such services, the fees paid by competitive funds, and the costs incurred by PSERV and PRM, as applicable, in providing such services.
| |
| California Tax Exempt Income Fund | 23 |
Financial statements
These sections of the report, as well as the accompanying Notes, preceded by the Report of Independent Registered Public Accounting Firm, constitute the fund’s financial statements.
The fund’s portfolio lists all the fund’s investments and their values as of the last day of the reporting period. Holdings are organized by asset type and industry sector, country, or state to show areas of concentration and diversification.
Statement of assets and liabilities shows how the fund’s net assets and share price are determined. All investment and non-investment assets are added together. Any unpaid expenses and other liabilities are subtracted from this total. The result is divided by the number of shares to determine the net asset value per share, which is calculated separately for each class of shares. (For funds with preferred shares, the amount subtracted from total assets includes the liquidation preference of preferred shares.)
Statement of operations shows the fund’s net investment gain or loss. This is done by first adding up all the fund’s earnings — from dividends and interest income — and subtracting its operating expenses to determine net investment income (or loss). Then, any net gain or loss the fund realized on the sales of its holdings — as well as any unrealized gains or losses over the period — is added to or subtracted from the net investment result to determine the fund’s net gain or loss for the fiscal year.
Statement of changes in net assets shows how the fund’s net assets were affected by the fund’s net investment gain or loss, by distributions to shareholders, and by changes in the number of the fund’s shares. It lists distributions and their sources (net investment income or realized capital gains) over the current reporting period and the most recent fiscal year-end. The distributions listed here may not match the sources listed in the Statement of operations because the distributions are determined on a tax basis and may be paid in a different period from the one in which they were earned.
Financial highlights provide an overview of the fund’s investment results, per-share distributions, expense ratios, net investment income ratios, and portfolio turnover in one summary table, reflecting the five most recent reporting periods. In a semiannual report, the highlights table also includes the current reporting period.
|
| 24 California Tax Exempt Income Fund |
Report of Independent Registered Public Accounting Firm
The Board of Trustees and Shareholders
Putnam California Tax Exempt Income Fund:
We have audited the accompanying statement of assets and liabilities of Putnam California Tax Exempt Income Fund (the fund), including the fund’s portfolio, as of September 30, 2013, and the related statement of operations for the year then ended, the statements of changes in net assets for each of the years in the two-year period then ended, and the financial highlights for each of the years in the five-year period then ended. These financial statements and financial highlights are the responsibility of the fund’s management. Our responsibility is to express an opinion on these financial statements and financial highlights based on our audits.
We conducted our audits in accordance with the standards of the Public Company Accounting Oversight Board (United States). Those standards require that we plan and perform the audit to obtain reasonable assurance about whether the financial statements and financial highlights are free of material misstatement. An audit includes examining, on a test basis, evidence supporting the amounts and disclosures in the financial statements. Our procedures included confirmation of securities owned as of September 30, 2013, by correspondence with the custodian and brokers or by other appropriate auditing procedures. An audit also includes assessing the accounting principles used and significant estimates made by management, as well as evaluating the overall financial statement presentation. We believe that our audits provide a reasonable basis for our opinion.
In our opinion, the financial statements and financial highlights referred to above present fairly, in all material respects, the financial position of Putnam California Tax Exempt Income Fund as of September 30, 2013, the results of its operations for the year then ended, the changes in its net assets for each of the years in the two-year period then ended and the financial highlights for each of the years in the five-year period then ended, in conformity with U.S. generally accepted accounting principles.

Boston, Massachusetts
November 13, 2013
| |
| California Tax Exempt Income Fund | 25 |
The fund’s portfolio 9/30/13
| |
| Key to holding’s abbreviations | |
| ABAG Association Of Bay Area Governments | NATL National Public Finance Guarantee Corp. |
| AGM Assured Guaranty Municipal Corporation | Radian Insd. Radian Group Insured |
| AGO Assured Guaranty, Ltd. | SGI Syncora Guarantee, Inc. |
| AMBAC AMBAC Indemnity Corporation | U.S. Govt. Coll. U.S. Government Collateralized |
| COP Certificates of Participation | VRDN Variable Rate Demand Notes, which are |
| FGIC Financial Guaranty Insurance Company | floating-rate securities with long-term maturities, |
| FNMA Coll. Federal National Mortgage | that carry coupons that reset and are payable upon |
| Association Collateralized | demand either daily, weekly or monthly. The rate |
| G.O. Bonds General Obligation Bonds | shown is the current interest rate at the close of the |
| reporting period. |
| |
| | | |
| MUNICIPAL BONDS AND NOTES (100.1%)* | Rating** | Principal amount | Value |
|
| California (96.3%) | | | |
| ABAG Fin. Auth. for Nonprofit Corps. Rev. Bonds | | | |
| (Sharp Hlth. Care), 6 1/4s, 8/1/39 | A1 | $20,750,000 | $22,938,502 |
| (Episcopal Sr. Cmntys.), 6 1/8s, 7/1/41 | BBB | 2,045,000 | 2,123,201 |
| (Episcopal Sr. Cmntys.), Ser. A, 5s, 7/1/47 | BBB | 1,500,000 | 1,283,865 |
| (Episcopal Sr. Cmntys.), Ser. A, 5s, 7/1/42 | BBB | 700,000 | 613,228 |
| (O’Connor Woods), 5s, 1/1/33 | A | 2,300,000 | 2,381,926 |
|
| ABAG Fin. Auth. Non-Profit Corps Insd. Sr. | | | |
| Living Rev. Bonds | | | |
| (Odd Fellows Home of CA), Ser. A, 5s, 4/1/42 | A | 1,000,000 | 977,710 |
| (Odd Fellows Home), Ser. A, 5s, 4/1/32 | A | 3,000,000 | 3,070,590 |
|
| Alameda Cnty., Joint Pwrs. Auth. Lease Rev. | | | |
| Bonds (Multiple Cap.), Ser. A | | | |
| 5 1/4s, 12/1/29 ## | AA | 3,800,000 | 4,100,922 |
| 5s, 12/1/34 ## | AA | 4,960,000 | 5,111,181 |
|
| Alameda, Corridor Trans. Auth. Rev. Bonds, Ser. A, | | | |
| AMBAC, zero %, 10/1/19 | BBB+ | 24,270,000 | 20,040,467 |
|
| Anaheim, Pub. Fin. Auth. Rev. Bonds | | | |
| (Elec. Syst. Distr. Fac.), Ser. A, 5 3/8s, 10/1/36 | AA– | 3,000,000 | 3,226,620 |
| (Distr. Syst.), NATL, 5s, 10/1/29 | A+ | 1,945,000 | 1,991,875 |
|
| Arcadia, Unified School Dist. G.O. Bonds (Election | | | |
| of 2006), Ser. A, AGM, zero %, 8/1/18 | Aa2 | 1,500,000 | 1,270,830 |
|
| Bay Area Toll Auth. of CA Rev Bonds, Ser. F, | | | |
| 5s, 4/1/31T | AA | 13,600,000 | 15,150,359 |
|
| Bay Area Toll Auth. of CA Rev. Bonds (Toll Bridge), | | | |
| Ser. S-4, 5s, 4/1/33 | A1 | 3,000,000 | 3,138,450 |
|
| Burbank, Pub. Fin. Auth. Tax Alloc. Bonds (West | | | |
| Olive Redev.), AMBAC, 5s, 12/1/26 | BBB+ | 3,390,000 | 3,167,379 |
|
| CA Rev. Bonds | | | |
| (Catholic Hlth. Care West), Ser. A, 6s, 7/1/39 | A | 5,250,000 | 5,688,480 |
| (Adventist Hlth. Syst.-West), Ser. A, | | | |
| 5 3/4s, 9/1/39 | A | 10,500,000 | 11,275,530 |
|
| CA Edl. Fac. Auth. Rev. Bonds | | | |
| (Claremont Graduate U.), Ser. A, 6s, 3/1/38 | Baa1 | 1,045,000 | 1,117,805 |
| (CA Lutheran U.), 5 3/4s, 10/1/38 | Baa1 | 5,000,000 | 5,170,600 |
|
| 26 California Tax Exempt Income Fund |
| | | |
| MUNICIPAL BONDS AND NOTES (100.1%)* cont. | Rating** | Principal amount | Value |
|
| California cont. | | | |
| CA Edl. Fac. Auth. Rev. Bonds | | | |
| (Pacific U.), 5 1/2s, 11/1/39 | | | |
| (Prerefunded 11/1/19) | A2 | $100,000 | $122,565 |
| (U. of the Pacific), 5 1/2s, 11/1/39 | A2 | 1,085,000 | 1,116,518 |
| (U. of the Pacific), U.S. Govt. Coll., 5 1/2s, | | | |
| 11/1/39 (Prerefunded, 11/1/19) | AAA/P | 65,000 | 79,879 |
| (CA College of Arts), 5 1/4s, 6/1/30 | Baa3 | 1,360,000 | 1,358,395 |
| (U. of the Pacific), 5 1/4s, 11/1/29 | A2 | 1,265,000 | 1,325,189 |
| (Loyola-Marymount U.), Ser. A, 5 1/8s, 10/1/40 | A2 | 2,955,000 | 2,990,696 |
| (U. Redlands), Ser. A, 5 1/8s, 8/1/38 | A3 | 6,430,000 | 6,444,532 |
| (Claremont Graduate U.), Ser. A, 5 1/8s, 3/1/28 | Baa1 | 1,270,000 | 1,319,403 |
| (U. Southern CA), Ser. A, 5s, 10/1/39 | Aa1 | 3,000,000 | 3,115,320 |
| (U. of the Pacific), 5s, 11/1/36 | A2 | 10,005,000 | 10,041,817 |
| (U. of the Pacific), U.S. Govt. Coll., 5s, 11/1/36 | | | |
| (Prerefunded, 11/1/15) | AAA/P | 730,000 | 801,175 |
| (U. of La Verne), Ser. A, 5s, 6/1/35 | Baa2 | 1,000,000 | 929,910 |
| (U. of La Verne), Ser. A, 5s, 6/1/31 | Baa2 | 1,970,000 | 1,880,877 |
| (Chapman U.), 5s, 4/1/31 | A2 | 2,425,000 | 2,510,772 |
| (Claremont Graduate U.), Ser. A, 5s, 3/1/31 | Baa1 | 2,465,000 | 2,510,504 |
| (U. of the Pacific), 5s, 11/1/30 | A2 | 2,500,000 | 2,575,975 |
| (CA College of Arts), 5s, 6/1/30 | Baa3 | 1,825,000 | 1,772,641 |
| (Lutheran U.), Ser. C, 5s, 10/1/29 | Baa1 | 1,500,000 | 1,500,000 |
| (U. of The Pacific), 5s, 11/1/25 | A2 | 4,000,000 | 4,204,480 |
| (Lutheran U.), Ser. C, 5s, 10/1/24 | Baa1 | 1,250,000 | 1,255,400 |
| (Lutheran U.), Ser. C, 4 1/2s, 10/1/19 | Baa1 | 2,830,000 | 2,876,299 |
| (Loyola-Marymount U.), Ser. A, NATL, | | | |
| zero %, 10/1/28 | A2 | 355,000 | 168,550 |
|
| CA Hlth. Fac. Fin. Auth. Rev. Bonds | | | |
| (Providence Hlth. & Svcs.), Ser. C, | | | |
| 6 1/2s, 10/1/38 | Aa2 | 5,400,000 | 6,096,870 |
| (Providence Hlth. & Svcs.), Ser. C, 6 1/2s, | | | |
| 10/1/38 (Prerefunded 10/1/18) | AAA/P | 100,000 | 125,012 |
| (Providence Hlth. & Svcs.), Class C, | | | |
| 6 1/4s, 10/1/28 | Aa2 | 3,350,000 | 3,806,572 |
| (Sutter Hlth.), Ser. A, 5 1/4s, 11/15/46 | Aa3 | 10,000,000 | 10,027,900 |
| (Stanford Hosp.), Ser. A-2, 5 1/4s, 11/15/40 | Aa3 | 1,000,000 | 1,039,440 |
| (Scripps Hlth.), Ser. A, 5s, 11/15/40 | Aa3 | 1,500,000 | 1,509,870 |
| (Cedars Sinai Med. Ctr.), 5s, 8/15/39 | A2 | 8,215,000 | 8,297,643 |
| (Cedars-Sinai Med. Ctr.), 5s, 11/15/34 | A2 | 6,250,000 | 6,297,063 |
| (Scripps Hlth.), Ser. A, 5s, 11/15/32 | Aa3 | 1,000,000 | 1,025,430 |
| (CA-NV Methodist), 5s, 7/1/26 | A | 1,745,000 | 1,813,770 |
|
| CA Hsg. Fin. Agcy. Rev. Bonds | | | |
| Ser. J, 5 3/4s, 8/1/47 | A | 1,665,000 | 1,705,443 |
| (Home Mtge.), Ser. H, FGIC, 5 3/4s, 8/1/30 | A | 10,000 | 10,117 |
| (Multi-Fam. Hsg. III), Ser. B, NATL, | | | |
| 5 1/2s, 8/1/39 | A | 1,650,000 | 1,501,022 |
| (Home Mtge.), Ser. L, FNMA Coll., 5.2s, 8/1/28 | A | 2,145,000 | 2,159,693 |
| (Home Mtge.), Ser. I, 4 7/8s, 8/1/41 | A | 4,060,000 | 3,499,152 |
| (Home Mtge.), Ser. M, 4 3/4s, 8/1/42 | A | 4,990,000 | 4,286,111 |
| |
| California Tax Exempt Income Fund | 27 |
| | | |
| MUNICIPAL BONDS AND NOTES (100.1%)* cont. | Rating** | Principal amount | Value |
|
| California cont. | | | |
| CA Hsg. Fin. Agcy. Rev. Bonds | | | |
| (Home Mtge.), Ser. K, 4 5/8s, 8/1/26 | Baa2 | $2,500,000 | $2,340,950 |
| (Home Mtge.), Ser. I, 4.6s, 8/1/21 | A | 580,000 | 564,746 |
|
| CA Infrastructure & Econ. Dev. Bank Rev. Bonds | | | |
| (CA Indpt. Syst. Operator), Ser. A, | | | |
| 6 1/4s, 2/1/39 | A1 | 12,000,000 | 12,570,720 |
| (Oakland Unified School Dist. Fin.), 5s, 8/15/22 | A | 4,985,000 | 5,127,671 |
|
| CA Infrastructure & Econ. Dev. Bank VRDN | | | |
| (Los Angeles Museum), Ser. A, 0.05s, 9/1/37 | | | |
| (Wells Fargo Bank N.A.) | VMIG1 | 16,795,000 | 16,795,000 |
| (Pacific Gas & Elec. Co.), Ser. B, 0.04s, 11/1/26 | | | |
| (Mizuho Corp. Bank) | VMIG1 | 14,500,000 | 14,500,000 |
|
| CA Muni. Fin. Auth. COP (Cmnty. Hosp. | | | |
| Central CA) | | | |
| 5 1/4s, 2/1/46 | Baa2 | 11,000,000 | 10,120,220 |
| 5 1/4s, 2/1/37 | Baa2 | 14,650,000 | 13,821,982 |
|
| CA Muni. Fin. Auth. Rev. Bonds | | | |
| (U. of La Verne), Ser. A, 6 1/4s, 6/1/40 | Baa2 | 4,000,000 | 4,315,200 |
| (Emerson College), 6s, 1/1/42 | Baa1 | 1,000,000 | 1,046,850 |
| (Biola U.), 5 7/8s, 10/1/34 | Baa1 | 12,470,000 | 12,909,442 |
| (Biola U.), 5.8s, 10/1/28 | Baa1 | 220,000 | 233,449 |
| (Eisenhower Med. Ctr.), Ser. A, 5 3/4s, 7/1/40 | Baa2 | 10,500,000 | 10,662,960 |
| (Emerson College), 5 3/4s, 1/1/33 | Baa1 | 2,000,000 | 2,086,440 |
| (Loma Linda U.), 5s, 4/1/28 | A | 2,000,000 | 2,034,580 |
| (U. Students Coop Assn.), 5s, 4/1/22 | BBB– | 790,000 | 785,142 |
|
| CA Muni. Fin. Auth. Sr. Living Rev. Bonds (Pilgrim | | | |
| Place Claremont), Ser. A, 6 1/8s, 5/15/39 | A | 4,000,000 | 4,158,240 |
|
| CA Poll. Control Fin. Auth. Rev. Bonds | | | |
| (San Jose Wtr. Co.), 5.1s, 6/1/40 | A | 4,500,000 | 4,568,220 |
| (Wtr. Furnishing), 5s, 11/21/45 | Baa3 | 8,000,000 | 6,717,040 |
|
| CA Poll. Control Fin. Auth. VRDN (Pacific Gas & | | | |
| Electric Corp.) | | | |
| Ser. F, 0.05s, 11/1/26 | A–1+ | 7,400,000 | 7,400,000 |
| Class C, 0.06s, 11/1/26 | A–1+ | 20,700,000 | 20,700,000 |
| Ser. E, 0.05s, 11/1/26 | VMIG1 | 14,700,000 | 14,700,000 |
|
| CA Poll. Control Fin. Auth. Solid Waste Disp. | | | |
| Rev. Bonds (Waste Management, Inc.), | | | |
| Ser. B, 5s, 7/1/27 | BBB | 4,500,000 | 4,511,655 |
|
| CA Poll. Control Fin. Auth. Solid Waste Disp. 144A | | | |
| Rev. Bonds (Waste Management, Inc.), Ser. A-2, | | | |
| 5.4s, 4/1/25 | BBB | 7,500,000 | 7,594,050 |
|
| CA Poll. Control Fin. Auth. Wtr. Fac. Rev. Bonds | | | |
| (American Wtr. Cap. Corp.), 5 1/4s, 8/1/40 | A– | 4,000,000 | 3,882,080 |
|
| CA State G.O. Bonds | | | |
| 6 1/2s, 4/1/33 | A1 | 35,000,000 | 41,572,300 |
| 5 3/4s, 4/1/31 | A1 | 39,620,000 | 44,040,800 |
| 5 1/4s, 4/1/35 | A1 | 10,000,000 | 10,633,500 |
| 5 1/4s, 2/1/29 | A1 | 4,000,000 | 4,356,880 |
| 5s, 4/1/37 | A1 | 2,000,000 | 2,070,320 |
|
|
| 28 California Tax Exempt Income Fund |
| | | |
| MUNICIPAL BONDS AND NOTES (100.1%)* cont. | Rating** | Principal amount | Value |
|
| California cont. | | | |
| CA State VRDN, 0.03s, 5/1/33 | VMIG1 | $4,400,000 | $4,400,000 |
|
| CA State Pub. Wks. Board Rev. Bonds | | | |
| Ser. I-1, 6 1/8s, 11/1/29 | A2 | 3,000,000 | 3,491,880 |
| (Dept. of Ed. — Riverside Campus), Ser. B, | | | |
| 6 1/8s, 4/1/29 | A2 | 490,000 | 564,353 |
| (Dept. of Dev. Svcs. — Porterville), | | | |
| Ser. C, 6s, 4/1/27 | A2 | 575,000 | 665,885 |
| (Dept. of Ed. — Riverside Campus), | | | |
| Ser. B, 6s, 4/1/26 | A2 | 2,625,000 | 3,052,928 |
| (Trustees CA State U.), Ser. D, 6s, 4/1/26 | Aa3 | 1,365,000 | 1,587,522 |
| (Riverside Campus), Ser. B, 6s, 4/1/25 | A2 | 1,755,000 | 2,047,910 |
| (Dept. of Dev. Svcs. — Porterville), | | | |
| Ser. C, 6s, 4/1/24 | A2 | 3,615,000 | 4,238,515 |
| (Dept. of Ed. — Riverside Campus), | | | |
| Ser. B, 6s, 4/1/24 | A2 | 4,485,000 | 5,258,573 |
| Ser. G-1, 5 3/4s, 10/1/30 | A2 | 11,500,000 | 12,724,520 |
| Ser. A-1, 5 1/2s, 3/1/25 | A2 | 2,500,000 | 2,800,075 |
| (Regents U.), Ser. E, 5s, 4/1/29 | | | |
| (Prerefunded 4/1/19) | Aa2 | 7,015,000 | 7,533,198 |
| (Regents U.), Ser. E, 5s, 4/1/28 | | | |
| (Prerefunded 4/1/19) | Aa2 | 8,290,000 | 8,979,894 |
|
| CA State Pub. Wks. Board Lease Rev. Bonds | | | |
| (Dept. of Corrections-State Prisons), Ser. A, | | | |
| AMBAC, 5s, 12/1/19 | A2 | 17,250,000 | 19,091,265 |
|
| CA State U. Rev. Bonds (Systemwide), Ser. A | | | |
| 5 3/4s, 11/1/28 | Aa2 | 5,000,000 | 5,605,750 |
| 5s, 11/1/37 | Aa2 | 5,430,000 | 5,659,092 |
|
| CA Statewide Cmnty. Dev. Auth. COP (The | | | |
| Internext Group), 5 3/8s, 4/1/30 | BBB | 10,365,000 | 10,386,663 |
|
| CA Statewide Cmnty. Dev. Auth. Rev. Bonds | | | |
| (Sr. Living — Presbyterian Homes), | | | |
| 7 1/4s, 11/15/41 | BBB– | 6,000,000 | 6,571,200 |
| (American Baptist Homes West), | | | |
| 6 1/4s, 10/1/39 | BBB | 4,500,000 | 4,610,430 |
| (Enloe Med. Ctr.), 6 1/4s, 8/15/33 | A | 6,500,000 | 7,240,870 |
| (Enloe Med. Ctr.), 6 1/4s, 8/15/28 | A | 5,000,000 | 5,667,550 |
| (Sutter Hlth.), Ser. A, 6s, 8/15/42 | Aa3 | 5,000,000 | 5,494,250 |
| (Irvine, LLC-UCI East Campus), 6s, 5/15/40 | Baa2 | 11,000,000 | 11,351,780 |
| (Catholic Hlth. Care West), Ser. A, | | | |
| 5 1/2s, 7/1/30 | A | 9,820,000 | 10,492,374 |
| (Sutter Hlth.), Ser. B, 5 1/4s, 11/15/48 | Aa3 | 2,000,000 | 2,006,380 |
| (Kaiser Permanente), Ser. B, 5 1/4s, 3/1/45 | A+ | 19,000,000 | 19,127,110 |
| Ser. C, 5 1/4s, 8/1/31 | A+ | 2,600,000 | 2,653,846 |
| (Episcopal Cmntys. and Svcs.), 5s, 5/15/42 | A–/F | 3,250,000 | 2,827,793 |
| (Kaiser Permanente), Ser. B, 5s, 3/1/41 | A+ | 1,815,000 | 1,818,594 |
| (Huntington Memorial Hosp.), 5s, 7/1/35 | A+ | 11,175,000 | 11,086,271 |
| (Episcopal Cmntys. and Svcs.), 5s, 5/15/32 | A–/F | 600,000 | 559,326 |
| (Henry Mayo Newhall Memorial Hosp.), | | | |
| 5s, 10/1/27 | A | 3,685,000 | 3,834,427 |
|
| California Tax Exempt Income Fund 29 |
| | | |
| MUNICIPAL BONDS AND NOTES (100.1%)* cont. | Rating** | Principal amount | Value |
|
| California cont. | | | |
| CA Statewide Cmnty. Dev. Auth. Rev. Bonds | | | |
| (Terraces at San Joaquin Gardens), Ser. A, | | | |
| 5s, 10/1/22 | BB/P | $3,150,000 | $3,223,301 |
| (Henry Mayo Newhall Memorial Hosp.), | | | |
| 5s, 10/1/20 | A | 1,055,000 | 1,131,435 |
|
| CA Statewide Cmnty. Dev. Auth. 144A Rev. Bonds | | | |
| (Thomas Jefferson School of Law), Ser. A, | | | |
| 7 1/4s, 10/1/38 | B+ | 2,415,000 | 2,377,761 |
| (American Baptist Homes West), | | | |
| 5 3/4s, 10/1/25 | BBB | 950,000 | 998,545 |
| (Front Porch Cmntys. & Svcs.), Ser. A, | | | |
| 5 1/8s, 4/1/37 | BBB | 9,500,000 | 8,961,635 |
|
| CA Statewide Cmnty. Dev. Auth. Special Tax | | | |
| Special Tax Bonds (Cmnty. Fac. Dist. No. 1-Zone | | | |
| 1B), zero %, 9/1/20 | BB/P | 875,000 | 576,476 |
|
| CA Statewide Fin. Auth. Tobacco Settlement Rev. | | | |
| Bonds, Class B, 5 5/8s, 5/1/29 | Baa3 | 2,495,000 | 2,388,862 |
|
| Carlsbad, Unified School Dist. G.O. Bonds, FGIC, | | | |
| NATL, zero %, 11/1/21 | Aa2 | 2,250,000 | 1,712,228 |
|
| Castaic Lake, Wtr. Agcy. COP (Water Syst. Impt.), | | | |
| AMBAC, zero %, 8/1/27 | AA | 10,000,000 | 5,296,000 |
|
| Chino Basin, Desalter Auth. Rev. Bonds, Ser. A, | | | |
| AGO, 5s, 6/1/30 | Aa3 | 3,540,000 | 3,744,506 |
|
| Chula Vista, Cmnty. Fac. Dist. Special Tax Rev. | | | |
| Bonds (No. 07-I Otay Ranch Village Eleven), | | | |
| 5.1s, 9/1/26 | BBB–/P | 335,000 | 333,730 |
|
| Chula Vista, Indl. Dev. Rev. Bonds (San Diego Gas) | | | |
| Ser. C, 5 7/8s, 2/15/34 | Aa3 | 2,600,000 | 2,815,878 |
| Ser. D, 5 7/8s, 1/1/34 | Aa3 | 5,000,000 | 5,415,150 |
|
| Chula Vista, Muni. Fin. Auth. Special Tax Bonds | | | |
| 5 1/2s, 9/1/30 | BBB+ | 765,000 | 783,750 |
| 5 1/2s, 9/1/29 | BBB+ | 2,235,000 | 2,302,005 |
|
| Coast, Cmnty. College Dist. G.O. Bonds, NATL | | | |
| zero %, 8/1/22 | Aa1 | 1,280,000 | 914,138 |
| zero %, 8/1/21 | Aa1 | 4,500,000 | 3,385,170 |
|
| Commerce, Redev. Agcy. Tax Alloc. Bonds (Redev. | | | |
| Area 1), zero %, 8/1/21 (Escrowed to maturity) | AAA/P | 41,145,000 | 28,626,222 |
|
| Contra Costa, Home Mtge. Fin. Auth. Rev. | | | |
| Bonds, Ser. G, NATL, zero %, 9/1/17 (Escrowed | | | |
| to maturity) | Aaa | 13,980,000 | 11,110,465 |
|
| Corona, Cmnty. Fac. Dist. Special Tax Bonds | | | |
| (No. 97-2 Eagle Glen), Ser. 97-2, 5 3/4s, 9/1/16 | BBB+/P | 1,820,000 | 1,836,908 |
|
| Corona-Norco, School Dist. Pub. Fin. Auth. | | | |
| Special Tax Bonds | | | |
| Ser. A, 5s, 9/1/35 | BBB+ | 585,000 | 562,384 |
| Ser. A, 5s, 9/1/32 | BBB+ | 1,125,000 | 1,092,791 |
| (Sr. Lien), Ser. A, 5s, 9/1/28 | BBB+ | 275,000 | 274,414 |
|
| Corona-Norco, Unified School Dist. Special Tax | | | |
| Bonds (Cmnty. Facs. Dist. No. 98-1), 5s, 9/1/28 | BBB+ | 1,590,000 | 1,614,772 |
|
|
| 30 California Tax Exempt Income Fund |
| | | |
| MUNICIPAL BONDS AND NOTES (100.1%)* cont. | Rating** | Principal amount | Value |
|
| California cont. | | | |
| El Camino, Hosp. Dist. Rev. Bonds, Ser. A, AMBAC, | | | |
| 6 1/4s, 8/15/17 (Escrowed to maturity) | AA/F | $6,010,000 | $6,612,623 |
|
| Folsom Cordova, Unified School Dist. G.O. Bonds | | | |
| (School Fac. Impt. Dist. No. 1), Ser. A, NATL, | | | |
| zero %, 10/1/25 | A1 | 1,505,000 | 865,104 |
|
| Foothill-De Anza, Cmnty. College Dist. G.O. | | | |
| Bonds, Ser. C, 5s, 8/1/40 | Aaa | 6,750,000 | 6,983,685 |
|
| Foothill/Eastern Corridor Agcy. Rev. Bonds | | | |
| (CA Toll Road), 5 3/4s, 1/15/40 | Baa3 | 16,000,000 | 15,534,400 |
| (CA Toll Roads), NATL, 5 3/8s, 1/15/14 | A | 5,000,000 | 5,014,750 |
| (CA Toll Roads), Ser. A, 5s, 1/1/35 | Baa3 | 2,000,000 | 1,790,120 |
|
| Fullerton, Cmnty. Facs. Dist. No. 1 Special Tax | | | |
| Bonds (Amerige Heights), 5s, 9/1/32 | A– | 1,000,000 | 1,009,980 |
|
| Garden Grove, Unified School Dist. G.O. Bonds | | | |
| (2010 Election), Ser. C | | | |
| 5s, 8/1/32 | Aa2 | 1,000,000 | 1,080,550 |
| 5s, 8/1/31 | Aa2 | 1,500,000 | 1,593,240 |
| 5s, 8/1/30 | Aa2 | 1,000,000 | 1,068,800 |
| 5s, 8/1/29 | Aa2 | 500,000 | 540,275 |
|
| Golden State Tobacco Securitization | | | |
| Corp. Rev. Bonds | | | |
| Ser. A-1, 5s, 6/1/33 | B3 | 10,340,000 | 7,983,928 |
| Ser. A, AGM, 4.55s, 6/1/22 | AA– | 4,085,000 | 4,327,322 |
| Ser. A-1, 4 1/2s, 6/1/27 | B | 9,355,000 | 8,050,631 |
| Ser. A, AMBAC, zero %, 6/1/24 | A2 | 15,500,000 | 10,332,920 |
|
| Golden West, School Fin. Auth. Rev. Bonds, | | | |
| Ser. A, NATL | | | |
| zero %, 8/1/20 | A | 2,000,000 | 1,495,800 |
| zero %, 2/1/20 | A | 2,480,000 | 1,918,305 |
|
| Grossmont-Cuyamaca, Cmnty. College Dist. G.O. | | | |
| Bonds (Election 2012), Ser. A, 5 1/4s, 8/1/38 | Aa2 | 4,000,000 | 4,229,400 |
|
| Imperial Irrigation Elec. Dist. Rev. Bonds | | | |
| Ser. A, 6 1/4s, 11/1/31 | AA– | 1,000,000 | 1,145,420 |
| Ser. A, 5 1/2s, 11/1/41 | AA– | 9,000,000 | 9,395,820 |
| 5 1/8s, 11/1/38 | AA– | 7,000,000 | 7,267,120 |
| Ser. C, 5s, 11/1/41 | AA– | 7,195,000 | 7,220,254 |
|
| Infrastructure & Econ. Dev. Bank Rev. Bonds (J. | | | |
| David Gladstone Inst.), Ser. A, 5s, 10/1/31 | A– | 4,000,000 | 4,060,560 |
|
| Irvine, Impt. Board Act of 1915 Special | | | |
| Assessment Bonds | | | |
| (Ltd. Oblig. Assmt. Dist. No. 13-1), 5s, 9/2/29 | BBB– | 705,000 | 692,825 |
| (Dist No. 12-1), 5s, 9/2/23 | BBB+ | 1,000,000 | 1,100,310 |
|
| Las Virgenes, Unified School Dist. G.O. Bonds | | | |
| Ser. A, AGM, 5s, 8/1/28 | Aa2 | 5,245,000 | 5,587,341 |
| AGM, zero %, 11/1/23 | Aa2 | 1,395,000 | 923,058 |
|
| Long Beach, Bond Fin. Auth. Rev. Bonds | | | |
| (Natural Gas), Ser. A, 5 1/2s, 11/15/28 | A– | 5,000,000 | 5,367,300 |
| (Aquarium of the Pacific), 5s, 11/1/30 | A1 | 1,000,000 | 1,032,830 |
| (Aquarium of the Pacific), 5s, 11/1/29 | A1 | 1,250,000 | 1,300,475 |
|
| |
| California Tax Exempt Income Fund | 31 |
| | | |
| MUNICIPAL BONDS AND NOTES (100.1%)* cont. | Rating** | Principal amount | Value |
|
| California cont. | | | |
| Long Beach, Cmnty. College Dist. G.O. Bonds | | | |
| (2008 Election), Ser. B | | | |
| zero %, 8/1/34 | Aa2 | $1,500,000 | $488,325 |
| zero %, 8/1/33 | Aa2 | 625,000 | 214,663 |
|
| Los Angeles Cnty., School Dist. COP | | | |
| (Headquarters Bldg.), Ser. B | | | |
| 5s, 10/1/31 | A1 | 1,125,000 | 1,150,346 |
| 5s, 10/1/30 | A1 | 1,250,000 | 1,284,638 |
|
| Los Angeles, Cmnty. College Dist. G.O. Bonds | | | |
| (Election of 2008), Ser. A, 6s, 8/1/33 | Aa1 | 9,000,000 | 10,247,579 |
|
| Los Angeles, Cmnty. Redev. Agcy. Fin. Auth. Rev. | | | |
| Bonds (Bunker Hill), Ser. A, AGM, 5s, 12/1/27 | AA– | 16,000,000 | 16,536,480 |
|
| Los Angeles, Dept. Arpt. Rev. Bonds (Los Angeles | | | |
| Intl. Arpt.) | | | |
| Ser. A, 5s, 5/15/40 | AA | 5,000,000 | 5,081,350 |
| Ser. D, 5s, 5/15/40 | AA | 11,500,000 | 11,687,105 |
|
| Los Angeles, Dept. of Wtr. & Pwr. Rev. Bonds | | | |
| (Pwr. Syst.), Ser. B, 5s, 7/1/43 | Aa3 | 5,000,000 | 5,127,800 |
| Ser. A, 5s, 7/1/37 | Aa2 | 2,000,000 | 2,109,960 |
|
| Los Angeles, Harbor Dept. Rev. Bonds, U.S. Govt. | | | |
| Coll., 7.6s, 10/1/18 (Escrowed to maturity) | AA+ | 11,435,000 | 13,338,584 |
|
| Los Angeles, Unified School Dist. G.O. Bonds | | | |
| Ser. D, 5s, 1/1/34 | Aa2 | 3,865,000 | 4,013,107 |
| Ser. F, 5s, 7/1/29 | Aa2 | 2,000,000 | 2,135,460 |
|
| Los Angeles, Wastewater Syst. Rev. Bonds, | | | |
| Ser. B, 5s, 6/1/30 | AA | 6,000,000 | 6,531,480 |
|
| M-S-R Energy Auth. Rev. Bonds, Ser. A, | | | |
| 6 1/2s, 11/1/39 | A– | 5,000,000 | 5,795,450 |
|
| Metro. Wtr. Dist. Rev. Bonds (Southern CA Wtr. | | | |
| Wks.), 5 3/4s, 8/10/18 | AAA | 15,000,000 | 17,226,749 |
|
| Modesto, Irrigation Dist. Elec. Rev. Bonds | | | |
| Ser. A, AGM, 5s, 7/1/32 | AA– | 800,000 | 835,720 |
| Ser. A, AGM, 5s, 7/1/31 | AA– | 1,600,000 | 1,676,592 |
| AGM, 5s, 7/1/30 | AA– | 1,220,000 | 1,284,343 |
|
| Mt. San Antonio, Cmnty College Dist. G.O. Bonds | | | |
| (Election 2008), Ser. A-13, 5s, 8/1/34 | Aa2 | 2,000,000 | 2,073,760 |
|
| Murrieta Valley, Unified School Dist. G.O. Bonds, | | | |
| AGM, zero %, 9/1/31 | AA– | 6,445,000 | 2,430,281 |
|
| Murrieta, Pub. Fin. Auth. Rev. Bonds, 5s, 9/1/26 | BBB– | 1,000,000 | 1,001,380 |
|
| Napa Valley, Cmnty. College Dist. G.O. Bonds | | | |
| (Election of 2002), Ser. C, NATL | | | |
| zero %, 8/1/22 | Aa2 | 5,000 | 3,468 |
| zero %, 8/1/21 | Aa2 | 8,575,000 | 6,261,294 |
|
| North Natomas, Cmnty. Fac. Special Tax Bonds | | | |
| (Dist. No. 4), Ser. E, 5 1/4s, 9/1/33 | BBB+ | 1,500,000 | 1,476,270 |
| (Dist. No. 4), Ser. D, 5s, 9/1/33 | BBB+/P | 3,685,000 | 3,514,974 |
| Ser. D, 5s, 9/1/26 | BBB+/P | 1,710,000 | 1,703,485 |
|
|
| 32 California Tax Exempt Income Fund |
| | | |
| MUNICIPAL BONDS AND NOTES (100.1%)* cont. | Rating** | Principal amount | Value |
|
| California cont. | | | |
| Northern CA Pwr. Agcy. Rev. Bonds (Hydroelec. | | | |
| Project No. 1), Ser. A | | | |
| 5s, 7/1/32 | A+ | $700,000 | $733,278 |
| 5s, 7/1/30 | A+ | 1,000,000 | 1,056,480 |
|
| Oakland, Swr. Rev. Bonds, Ser. A, AGM, | | | |
| 5s, 6/15/26 | AA– | 3,690,000 | 3,744,944 |
|
| Oakland, Unified School Dist. Alameda | | | |
| Cnty., G.O. Bonds | | | |
| (Election of 2012), 6 5/8s, 8/1/38 | BBB/P | 1,000,000 | 1,058,300 |
| (Election of 2006), Ser. A, 6 1/8s, 8/1/29 | BBB/P | 4,000,000 | 4,185,680 |
|
| Orange Cnty., Cmnty. Fac. Dist. Special | | | |
| Tax Rev. Bonds | | | |
| (Ladera Ranch — No. 03-1), Ser. A, | | | |
| 5 5/8s, 8/15/34 | BB+/P | 2,750,000 | 2,754,125 |
| (Ladera Ranch — No. 02-1), Ser. A, | | | |
| 5.55s, 8/15/33 | BBB–/P | 3,725,000 | 3,730,252 |
| (Ladera Ranch — No. 03-1), Ser. A, | | | |
| 5 1/2s, 8/15/23 | BB+/P | 1,000,000 | 1,002,800 |
|
| Orange Cnty., Trans. Auth Toll Road Rev. Bonds | | | |
| (Sr. Lien — 91 Express Lane), 5s, 8/15/29 | A1 | 1,050,000 | 1,123,364 |
|
| Pico Rivera, Pub. Fin. Auth. Lease Rev. Bonds | | | |
| 5 3/4s, 9/1/39 | A+ | 6,000,000 | 6,308,940 |
| 5 1/2s, 9/1/31 | A+ | 1,000,000 | 1,057,730 |
|
| Placentia, Redev. Auth. Tax Alloc. Bonds, Ser. B, | | | |
| 5 3/4s, 8/1/32 | BBB+ | 2,915,000 | 2,904,768 |
|
| Port of Oakland, Rev. Bonds (Sr. Lien), Ser. P | | | |
| 5s, 5/1/33 | A+ | 1,860,000 | 1,868,947 |
| 5s, 5/1/31 | A+ | 1,000,000 | 1,015,290 |
|
| Poway, Unified School Dist. G.O. Bonds (Election | | | |
| of 2008), zero %, 8/1/29 | Aa2 | 11,350,000 | 5,138,486 |
|
| Poway, Unified School Dist. Pub. Fin. Auth. | | | |
| Special Tax Bonds | | | |
| 5s, 9/15/32 | BBB | 500,000 | 485,095 |
| 5s, 9/15/28 | BBB | 1,110,000 | 1,131,767 |
|
| Rancho Cordova, Cmnty. Fac. Dist. Special Tax | | | |
| Bonds (Sunridge Anatolia), Ser. 03-1, 5s, 9/1/32 | BB+/P | 1,250,000 | 1,181,238 |
|
| Rancho Mirage, Joint Powers Fin. Auth. Rev. | | | |
| Bonds (Eisenhower Med. Ctr.), Ser. A, 5s, 7/1/47 | Baa2 | 6,000,000 | 5,439,540 |
|
| Redding, Elec. Syst. Rev. Bonds, NATL, 6.368s, | | | |
| 7/1/22 (Escrowed to maturity) | A | 8,950,000 | 10,780,364 |
|
| Redwood City, Redev. Agcy., Tax Alloc. Bonds | | | |
| (Redev. Area 2-A), AMBAC, zero %, 7/15/22 | A– | 3,230,000 | 2,153,344 |
|
| Richmond, JT Pwrs. Fin. Auth. Rev. Bonds (Lease | | | |
| Civic Ctr.), AGO, 5 3/4s, 8/1/29 | AA– | 2,000,000 | 2,086,160 |
|
| Rio Linda, Unified School Dist. G.O. Bonds | | | |
| (Election of 2006), AGM, 5s, 8/1/31 | AA– | 6,000,000 | 6,133,680 |
|
| Ripon, Redev. Agcy. Tax Alloc. Bonds (Cmnty. | | | |
| Redev.), NATL, 4 3/4s, 11/1/36 | Baa1 | 1,450,000 | 1,259,253 |
|
| Riverside Cnty., Pub. Fin. Auth. COP, | | | |
| 5.8s, 5/15/29 | B/P | 4,250,000 | 2,423,903 |
|
| |
| California Tax Exempt Income Fund | 33 |
| | | |
| MUNICIPAL BONDS AND NOTES (100.1%)* cont. | Rating** | Principal amount | Value |
|
| California cont. | | | |
| Riverside Cnty., Trans. Comm. Toll Rev. Bonds, | | | |
| Ser. A, 5 3/4s, 6/1/44 | BBB– | $750,000 | $749,933 |
|
| Rohnert Pk., Cmnty. Dev. Agcy. Tax Alloc. Bonds | | | |
| (Rohnert Redev.), NATL, zero %, 8/1/25 | A | 1,340,000 | 692,472 |
|
| Sacramento City Fin. Auth. Tax Alloc. Bonds, | | | |
| Ser. A, FGIC, NATL, zero %, 12/1/23 | A | 15,815,000 | 9,660,751 |
|
| Sacramento Cnty., Arpt. Syst. Rev. Bonds | | | |
| 5s, 7/1/40 | A | 2,650,000 | 2,663,356 |
| Ser. A, AGM, 5s, 7/1/28 | AA– | 1,500,000 | 1,590,765 |
| Ser. A, AGM, 5s, 7/1/26 | AA– | 5,000,000 | 5,356,600 |
| Ser. A, AGM, 5s, 7/1/25 | AA– | 3,990,000 | 4,310,916 |
|
| Sacramento, City Fin. Auth. Tax Alloc. Bonds | | | |
| Ser. A, FGIC, NATL, zero %, 12/1/22 | A | 7,500,000 | 4,861,050 |
| (Cap. Appn.), Ser. A, FGIC, NATL, | | | |
| zero %, 12/1/19 | A | 5,000,000 | 3,907,950 |
|
| Sacramento, Muni. Util. Dist. Rev. Bonds | | | |
| Ser. Y, 5s, 8/15/32 | AA– | 1,500,000 | 1,582,320 |
| Ser. Y, 5s, 8/15/31 | AA– | 500,000 | 530,855 |
| Ser. X, 5s, 8/15/28 | AA– | 1,650,000 | 1,784,640 |
|
| Sacramento, Muni. Util. Dist. Elec. Rev. Bonds, | | | |
| Ser. K, AMBAC, 5 1/4s, 7/1/24 | AA– | 11,520,000 | 13,386,931 |
|
| Sacramento, Muni. Util. Dist. Fin. Auth. Rev. Bonds | | | |
| (Cosumnes), NATL, 5s, 7/1/19 | A | 1,070,000 | 1,141,958 |
|
| Sacramento, Regl. Trans. Dist. Rev. Bonds | | | |
| (Farebox), 5s, 3/1/42 | A2 | 7,290,000 | 7,289,707 |
|
| San Bernardino, Cmnty. College Dist. G.O. | | | |
| Bonds (Election of 2002), Ser. A, 6 1/4s, 8/1/33 | | | |
| (Prerefunded 8/1/18) | Aa2 | 1,000,000 | 1,232,990 |
|
| San Diego Cmnty. Facs. Dist. No. 3 Special Tax | | | |
| Bonds, 5s, 9/1/36 | BBB–/P | 995,000 | 956,901 |
|
| San Diego Cnty., Regl. Arpt. Auth. Rev. Bonds, | | | |
| Ser. B, 5s, 7/1/38 | A1 | 2,000,000 | 1,952,680 |
|
| San Diego, Pub. Fac. Fin. Auth. Rev. Bonds, Ser. A | | | |
| 5 1/4s, 3/1/40 | A+ | 1,000,000 | 1,005,700 |
| 5 1/4s, 9/1/35 | A+ | 1,500,000 | 1,529,520 |
| 5 1/4s, 3/1/25 | A+ | 6,065,000 | 6,598,781 |
| 5s, 9/1/26 | A+ | 6,265,000 | 6,612,708 |
|
| San Diego, Pub. Fac. Fin. Auth. Tax Alloc. | | | |
| Bonds (Southcrest), Ser. B, Radian Insd., | | | |
| 5 1/8s, 10/1/22 | Baa3 | 1,000,000 | 1,004,830 |
|
| San Diego, Pub. Fac. Fin. Auth. Swr. Rev. | | | |
| Bonds, Ser. A | | | |
| 5 1/4s, 5/15/29 | Aa3 | 1,245,000 | 1,364,943 |
| 5 1/8s, 5/15/29 | Aa3 | 7,885,000 | 8,532,910 |
|
| San Diego, Redev. Agcy. Tax Alloc. Bonds (Centre | | | |
| City), Ser. A, SGI, 5s, 9/1/22 | A | 4,665,000 | 4,756,994 |
|
| San Diego, Unified School Dist. G.O. Bonds | | | |
| (Election of 2008), Ser. C, zero %, 7/1/44 | Aa3 | 10,000,000 | 1,703,700 |
|
|
| 34 California Tax Exempt Income Fund |
| | | |
| MUNICIPAL BONDS AND NOTES (100.1%)* cont. | Rating** | Principal amount | Value |
|
| California cont. | | | |
| San Francisco City & Cnty. Arpt. Comm. Intl. | | | |
| Arpt. Rev. Bonds | | | |
| Ser. A, 5 1/4s, 5/1/33 | A1 | $4,000,000 | $4,115,080 |
| 5s, 5/1/29 | A1 | 5,200,000 | 5,562,595 |
|
| San Francisco City & Cnty., Redev. Agcy. Cmnty. | | | |
| Successor Special Tax Bonds (No. 6 Mission Bay | | | |
| South Pub. Impts.), Ser. A, 5s, 8/1/31 | BB+/P | 1,140,000 | 1,117,519 |
|
| San Francisco, City & Cnty. Arpt. Comm. Rev. | | | |
| Bonds (Intl. Arpt.) | | | |
| Ser. 34D, AGO, 5 1/4s, 5/1/25 | AA– | 2,250,000 | 2,478,128 |
| Ser. F, 5s, 5/1/40 | A1 | 4,750,000 | 4,808,188 |
| Ser. G, 5s, 5/1/40 | A1 | 4,400,000 | 4,453,900 |
|
| San Francisco, City & Cnty. Redev. Fin. Auth. Tax | | | |
| Alloc. Bonds | | | |
| (Mission Bay North Redev.), Ser. C, | | | |
| 6 3/4s, 8/1/41 | A– | 1,000,000 | 1,151,170 |
| (Mission Bay South), Ser. D, 6 5/8s, 8/1/39 | BBB | 1,250,000 | 1,341,700 |
|
| San Joaquin Cnty., Trans. Auth. Rev. Bonds, Ser. A, | | | |
| 5 1/2s, 3/1/41 | AA | 7,000,000 | 7,588,070 |
|
| San Joaquin Hills, Trans. Corridor Agcy. Rev. | | | |
| Bonds (Toll Road), Ser. A, 5s, 1/1/33 | BB– | 17,125,000 | 15,808,773 |
|
| San Jose, Redev. Agcy. Tax Alloc. Bonds (Merged | | | |
| Area Redev.), Ser. B, Radian Insd., 5s, 8/1/32 | BBB | 3,935,000 | 3,772,563 |
|
| San Juan, Basin Auth. Rev. Bonds (Ground Wtr. | | | |
| Recvy.), AMBAC, 5s, 12/1/34 | A/P | 1,000,000 | 955,910 |
|
| San Mateo Cnty., Cmnty. College G.O. Bonds | | | |
| (Election of 2005) | | | |
| Ser. B, NATL, zero %, 9/1/27 | Aaa | 10,545,000 | 5,882,528 |
| Ser. A, NATL, zero %, 9/1/26 | Aaa | 4,000,000 | 2,368,600 |
|
| Santa Barbara Cnty., Waterfront COP, AMBAC, | | | |
| 5s, 10/1/27 | A3 | 4,590,000 | 4,590,321 |
|
| Santa Clara, Elec. Rev. Rev. Bonds, Ser. A | | | |
| 6s, 7/1/31 | A+ | 2,500,000 | 2,846,050 |
| 5 1/4s, 7/1/32 | A+ | 4,000,000 | 4,261,360 |
|
| Santaluz, Cmnty. Facs. Dist. No. 2 Special | | | |
| Tax Rev. Bonds | | | |
| (Impt. Area No. 3), Ser. B, 6.2s, 9/1/30 | BBB/P | 495,000 | 497,119 |
| (Impt. Area No. 3), Ser. B, 6.1s, 9/1/21 | BBB/P | 500,000 | 503,590 |
| (Impt. Area No. 1), Ser. A, 5 1/4s, 9/1/27 | | | |
| (Prerefunded 9/1/21) | BBB+ | 3,285,000 | 3,416,301 |
| (Impt. Area No. 1), Ser. A, 5 1/4s, 9/1/26 | | | |
| (Prerefunded 9/1/21) | BBB+ | 1,490,000 | 1,566,675 |
| (Impt. Area No. 1), Ser. A, 5.1s, 9/1/30 | | | |
| (Prerefunded 9/1/21) | BBB+ | 490,000 | 496,341 |
|
| Saugus, Unified School Dist. G.O. Bonds, FGIC, | | | |
| NATL, zero %, 8/1/24 | Aa2 | 1,210,000 | 783,027 |
|
| Semitropic, Impt. Dist. Wtr. Storage Rev. | | | |
| Bonds, Ser. A | | | |
| SGI, 5 1/8s, 12/1/35 (Prerefunded 12/1/14) | A+ | 3,000,000 | 3,169,800 |
| 5s, 12/1/35 | A+ | 15,265,000 | 15,341,936 |
| 5s, 12/1/28 | A+ | 2,305,000 | 2,406,443 |
|
| |
| California Tax Exempt Income Fund | 35 |
| | | |
| MUNICIPAL BONDS AND NOTES (100.1%)* cont. | Rating** | Principal amount | Value |
|
| California cont. | | | |
| Sierra View, Hlth. Care Dist. Rev. Bonds | | | |
| 5 1/4s, 7/1/37 | A/F | $4,500,000 | $4,439,520 |
| 5 1/4s, 7/1/32 | A/F | 1,000,000 | 1,003,620 |
|
| Solano, Cmnty. College Dist. G.O. Bonds (Election | | | |
| of 2002), Ser. B, FGIC, NATL, zero %, 8/1/25 | Aa3 | 9,020,000 | 5,130,215 |
|
| Southern CA Pub. Pwr. Auth. Rev. Bonds | | | |
| (Natural Gas No. 1), Ser. A, 5 1/4s, 11/1/24 | A3 | 2,850,000 | 3,019,433 |
| (Natural Gas), Ser. A, 5 1/4s, 11/1/21 | A3 | 1,500,000 | 1,643,460 |
| Ser. A, 5s, 7/1/40 | AA– | 6,860,000 | 7,069,230 |
|
| Sunnyvale, Cmnty. Fac. Dist. Special Tax Rev. | | | |
| Bonds, 7.65s, 8/1/21 | B+/P | 3,875,000 | 3,880,929 |
|
| Sweetwater, High School COP, AGM, 5s, 9/1/27 | AA– | 7,840,000 | 7,872,928 |
|
| Tobacco Securitization Auth. of Southern | | | |
| CA Rev. Bonds | | | |
| Class A1-SNR, 5 1/8s, 6/1/46 | B+ | 5,000,000 | 3,629,150 |
| Ser. A1-SNR, 5s, 6/1/37 | BB+ | 2,000,000 | 1,506,980 |
|
| Tracy, Operational Partnership, Joint Powers Auth. | | | |
| Lease Rev. Bonds, AGO | | | |
| 6 3/8s, 10/1/38 | AA– | 2,200,000 | 2,410,452 |
| 6 1/4s, 10/1/33 | AA– | 3,000,000 | 3,315,690 |
|
| Tuolumne Wind Project Auth. Rev. Bonds | | | |
| (Tuolumne Co.), Ser. A | | | |
| 5 7/8s, 1/1/29 | A+ | 6,000,000 | 6,686,100 |
| 5 5/8s, 1/1/29 | A+ | 1,000,000 | 1,099,940 |
|
| Turlock, Irrigation Dist. Rev. Bonds, | | | |
| Ser. A, 5s, 1/1/40 | A+ | 14,640,000 | 14,685,529 |
|
| U. of CA Rev. Bonds | | | |
| Ser. O, 5 1/4s, 5/15/39 | Aa1 | 10,000,000 | 10,514,900 |
| Ser. AI, 5s, 5/15/32 | Aa1 | 3,000,000 | 3,225,000 |
|
| Ventura Cnty., COP (Pub. Fin. Auth. III) | | | |
| 5 3/4s, 8/15/29 | AA | 1,500,000 | 1,595,640 |
| 5 3/4s, 8/15/28 | AA | 1,745,000 | 1,871,129 |
|
| West Kern, Cmnty. Coll. Dist. G.O. Bonds (Election | | | |
| of 2004), Ser. B, SGI, zero %, 11/1/24 | A1 | 2,395,000 | 1,430,174 |
|
| Yucaipa Special Tax Bonds (Cmnty. Fac. Dist. No. | | | |
| 98-1 Chapman Heights), 5 3/8s, 9/1/30 | BBB+ | 750,000 | 769,635 |
|
| | | | 1,396,030,431 |
| Delaware (0.3%) | | | |
| DE State Hlth. Facs. Auth. VRDN (Christiana | | | |
| Care), Ser. A, 0.05s, 10/1/38 | VMIG1 | 5,000,000 | 5,000,000 |
|
| | | | 5,000,000 |
| Guam (0.3%) | | | |
| Territory of GU, Bus. Privilege Tax Rev. Bonds, | | | |
| Ser. A, 5s, 1/1/31 | A | 1,000,000 | 1,030,580 |
|
| Territory of GU, Govt. Wtr. Wks. Auth. Wtr. & | | | |
| Waste Wtr. Syst. Rev. Bonds, 5 5/8s, 7/1/40 | Ba2 | 2,450,000 | 2,418,076 |
|
| Territory of GU, Pwr. Auth. Rev. Bonds, Ser. A, | | | |
| 5s, 10/1/30 | AA– | 1,000,000 | 1,031,420 |
|
| | | | 4,480,076 |
|
| 36 California Tax Exempt Income Fund |
| | | |
| MUNICIPAL BONDS AND NOTES (100.1%)* cont. | Rating** | Principal amount | Value |
|
| Mississippi (0.5%) | | | |
| Jackson Cnty., Port Fac. VRDN (Chevron USA, | | | |
| Inc.), 0.03s, 6/1/23 | P–1 | $7,600,000 | $7,600,000 |
|
| | | | 7,600,000 |
| Puerto Rico (2.2%) | | | |
| Children’s Trust Fund Tobacco Settlement | | | |
| (The) Rev. Bonds (Asset Backed Bonds), | | | |
| 5 5/8s, 5/15/43 | Baa3 | 4,000,000 | 3,449,040 |
|
| Cmnwlth. of PR, G.O. Bonds | | | |
| Ser. C, 6 1/2s, 7/1/40 | Baa3 | 5,000,000 | 3,831,150 |
| Ser. C, 6s, 7/1/39 | Baa3 | 3,770,000 | 2,721,111 |
| Ser. A, 5 1/4s, 7/1/34 | Baa3 | 2,750,000 | 2,036,705 |
|
| Cmnwlth. of PR, Aqueduct & Swr. Auth. Rev. | | | |
| Bonds, Ser. A | | | |
| 6s, 7/1/44 | Ba1 | 1,000,000 | 742,030 |
| 6s, 7/1/38 | Ba1 | 4,850,000 | 3,632,407 |
|
| Cmnwlth. of PR, Elec. Pwr. Auth. Rev. Bonds, | | | |
| Ser. AAA, 5 1/4s, 7/1/28 | BBB | 3,290,000 | 2,538,071 |
|
| Cmnwlth. of PR, Hwy. & Trans. Auth. Rev. Bonds, | | | |
| Ser. AA, 5s, 7/1/28 | BBB+ | 1,200,000 | 899,892 |
|
| Cmnwlth. of PR, Indl. Tourist Edl. Med. & Env. | | | |
| Control Facs. Rev. Bonds (Cogen. Fac.-AES), | | | |
| 6 5/8s, 6/1/26 | Ba1 | 3,950,000 | 3,600,939 |
|
| Cmnwlth. of PR, Sales Tax Fin. Corp. Rev. | | | |
| Bonds, Ser. C | | | |
| 5 1/4s, 8/1/40 | Aa3 | 6,250,000 | 5,492,624 |
| 5s, 8/1/40 | Aa3 | 3,915,000 | 3,313,186 |
|
| | | | 32,257,155 |
| Utah (0.3%) | | | |
| Murray City, Hosp. VRDN (IHC Hlth. Svcs., Inc.), | | | |
| Ser. D, 0.05s, 5/15/36 | A–1+ | 3,900,000 | 3,900,000 |
|
| | | | 3,900,000 |
| Virgin Islands (0.2%) | | | |
| VI Pub. Fin. Auth. Rev. Bonds, Ser. A, 5s, 10/1/25 | Baa2 | 2,000,000 | 2,098,580 |
|
| | | | 2,098,580 |
| |
| TOTAL INVESTMENTS | | | |
|
| Total investments (cost $1,381,434,086) | | | $1,451,366,242 |
Notes to the fund’s portfolio
Unless noted otherwise, the notes to the fund’s portfolio are for the close of the fund’s reporting period, which ran from October 1, 2012 through September 30, 2013 (the reporting period). Within the following notes to the portfolio, references to “ASC 820” represent Accounting Standards Codification 820 Fair Value Measurements and Disclosures and references to “OTC”, if any, represent over-the-counter.
* Percentages indicated are based on net assets of $1,450,023,315
** The Moody’s, Standard & Poor’s or Fitch ratings indicated are believed to be the most recent ratings available at the close of the reporting period for the securities listed. Ratings are generally ascribed to securities at the time of issuance. While the agencies may from time to time revise such ratings, they undertake no obligation to do so, and the ratings do not necessarily represent what the agencies would ascribe to these securities at the close of the reporting period. Securities rated by Putnam are indicated by “/P.” Securities rated by Fitch are indicated by “/F.” The rating of an insured security represents what is believed to be the most recent rating of the insurer’s claims-paying ability available at the close of the reporting period, if higher than the rating of the direct issuer of the bond, and does not reflect any subsequent changes. Ratings are not covered by the Report of Independent Registered Public Accounting Firm. Security ratings are defined in the Statement of Additional Information.
| |
| California Tax Exempt Income Fund | 37 |
## Forward commitment, in part or in entirety (Note 1).
T Underlying security in a tender option bond transaction. The security has been segregated as collateral for financing transactions.
At the close of the reporting period, the fund maintained liquid assets totaling $8,315,176 to cover tender option bonds.
144A after the name of an issuer represents securities exempt from registration under Rule 144A under the Securities Act of 1933, as amended. These securities may be resold in transactions exempt from registration, normally to qualified institutional buyers.
The dates shown parenthetically on prerefunded bonds represent the next prerefunding dates.
The fund had the following sector concentrations greater than 10% at the close of the reporting period (as a percentage of net assets):
| |
| Utilities | 18.7% |
| Health care | 15.8 |
| State debt | 15.3 |
| Local debt | 10.6 |
ASC 820 establishes a three-level hierarchy for disclosure of fair value measurements. The valuation hierarchy is based upon the transparency of inputs to the valuation of the fund’s investments. The three levels are defined as follows:
Level 1: Valuations based on quoted prices for identical securities in active markets.
Level 2: Valuations based on quoted prices in markets that are not active or for which all significant inputs are observable, either directly or indirectly.
Level 3: Valuations based on inputs that are unobservable and significant to the fair value measurement.
The following is a summary of the inputs used to value the fund’s net assets as of the close of the reporting period:
| | | |
| | | Valuation inputs | |
|
| Investments in securities: | Level 1 | Level 2 | Level 3 |
|
| Municipal bonds and notes | $— | $1,451,366,242 | $— |
|
| Totals by level | $— | $1,451,366,242 | $— |
The accompanying notes are an integral part of these financial statements.
|
| 38 California Tax Exempt Income Fund |
Statement of assets and liabilities 9/30/13
| |
| ASSETS | |
|
| Investment in securities, at value (Note 1): | |
| Unaffiliated issuers (identified cost $1,381,434,086) | $1,451,366,242 |
|
| Cash | 19,959 |
|
| Interest and other receivables | 19,515,230 |
|
| Receivable for shares of the fund sold | 750,905 |
|
| Receivable for investments sold | 14,015,568 |
|
| Total assets | 1,485,667,904 |
| |
| LIABILITIES | |
|
| Payable for investments purchased | 8,333,719 |
|
| Payable for purchases of delayed delivery securities (Note 1) | 8,920,619 |
|
| Payable for shares of the fund repurchased | 8,301,206 |
|
| Payable for compensation of Manager (Note 2) | 520,620 |
|
| Payable for custodian fees (Note 2) | 5,329 |
|
| Payable for investor servicing fees (Note 2) | 122,465 |
|
| Payable for Trustee compensation and expenses (Note 2) | 436,628 |
|
| Payable for administrative services (Note 2) | 6,357 |
|
| Payable for distribution fees (Note 2) | 805,830 |
|
| Payable for floating rate notes issued (Note 1) | 6,835,183 |
|
| Distributions payable to shareholders | 1,257,306 |
|
| Other accrued expenses | 99,327 |
|
| Total liabilities | 35,644,589 |
| | |
| Net assets | $1,450,023,315 |
|
| |
| REPRESENTED BY | |
|
| Paid-in capital (Unlimited shares authorized) (Notes 1 and 4) | $1,440,720,125 |
|
| Undistributed net investment income (Note 1) | 5,004,648 |
|
| Accumulated net realized loss on investments (Note 1) | (65,633,614) |
|
| Net unrealized appreciation of investments | 69,932,156 |
|
| Total — Representing net assets applicable to capital shares outstanding | $1,450,023,315 |
(Continued on next page)
|
| California Tax Exempt Income Fund 39 |
Statement of assets and liabilities (Continued)
| |
| COMPUTATION OF NET ASSET VALUE AND OFFERING PRICE | |
|
| Net asset value and redemption price per class A share | |
| ($1,338,413,827 divided by 171,406,035 shares) | $7.81 |
|
| Offering price per class A share (100/96.00 of $7.81)* | $8.14 |
|
| Net asset value and offering price per class B share ($7,254,702 divided by 929,929 shares)** | $7.80 |
|
| Net asset value and offering price per class C share ($47,174,611 divided by 6,010,784 shares)** | $7.85 |
|
| Net asset value and redemption price per class M share ($2,606,121 divided by 334,633 shares) | $7.79 |
|
| Offering price per class M share (100/96.75 of $7.79)† | $8.05 |
|
| Net asset value, offering price and redemption price per class Y share | |
| ($54,574,054 divided by 6,972,587 shares) | $7.83 |
|
* On single retail sales of less than $100,000. On sales of $100,000 or more the offering price is reduced.
** Redemption price per share is equal to net asset value less any applicable contingent deferred sales charge.
† On single retail sales of less than $50,000. On sales of $50,000 or more the offering price is reduced.
The accompanying notes are an integral part of these financial statements.
|
| 40 California Tax Exempt Income Fund |
Statement of operations Year ended 9/30/13
| |
| INTEREST INCOME | $78,827,695 |
|
| EXPENSES | |
|
| Compensation of Manager (Note 2) | $7,293,763 |
|
| Investor servicing fees (Note 2) | 763,676 |
|
| Custodian fees (Note 2) | 17,906 |
|
| Trustee compensation and expenses (Note 2) | 152,875 |
|
| Distribution fees (Note 2) | 3,985,772 |
|
| Administrative services (Note 2) | 47,702 |
|
| Interest and fees expense (Note 2) | 44,089 |
|
| Other | 344,117 |
|
| Total expenses | 12,649,900 |
| | |
| Expense reduction (Note 2) | (4,431) |
|
| Net expenses | 12,645,469 |
| | |
| Net investment income | 66,182,226 |
|
| |
| Net realized gain on investments (Notes 1 and 3) | 2,003,314 |
|
| Net realized loss on swap contracts (Note 1) | (1,446,129) |
|
| Net realized loss on futures contracts (Note 1) | (89,463) |
|
| Net unrealized depreciation of investments during the year | (107,755,169) |
|
| Net loss on investments | (107,287,447) |
| | |
| Net decrease in net assets resulting from operations | $(41,105,221) |
|
The accompanying notes are an integral part of these financial statements.
| |
| California Tax Exempt Income Fund | 41 |
Statement of changes in net assets
| | |
| INCREASE (DECREASE) IN NET ASSETS | Year ended 9/30/13 | Year ended 9/30/12 |
|
| Operations: | | |
| Net investment income | $66,182,226 | $69,828,547 |
|
| Net realized gain on investments | 467,722 | 3,681,034 |
|
| Net unrealized appreciation (depreciation) of investments | (107,755,169) | 97,641,417 |
|
| Net increase (decrease) in net assets resulting | | |
| from operations | (41,105,221) | 171,150,998 |
|
| Distributions to shareholders (Note 1): | | |
| From ordinary income | | |
| Taxable net investment income | | |
|
| Class A | (449,977) | (465,632) |
|
| Class B | (2,532) | (2,581) |
|
| Class C | (17,269) | (14,558) |
|
| Class M | (884) | (864) |
|
| Class Y | (17,032) | (11,838) |
|
| From tax-exempt net investment income | | |
| Class A | (60,484,380) | (64,430,776) |
|
| Class B | (282,787) | (305,055) |
|
| Class C | (1,816,311) | (1,699,292) |
|
| Class M | (109,057) | (119,083) |
|
| Class Y | (2,487,802) | (2,014,225) |
|
| Increase (decrease) from capital share transactions (Note 4) | (161,018,450) | 58,783,838 |
|
| Total increase (decrease) in net assets | (267,791,702) | 160,870,932 |
|
| NET ASSETS | | |
|
| Beginning of year | 1,717,815,017 | 1,556,944,085 |
|
| End of year (including undistributed net investment income | | |
| of $5,004,648 and $4,960,966, respectively) | $1,450,023,315 | $1,717,815,017 |
|
The accompanying notes are an integral part of these financial statements.
|
| 42 California Tax Exempt Income Fund |
|
| This page left blank intentionally. |
|
| California Tax Exempt Income Fund 43 |
Financial highlights (For a common share outstanding throughout the period)
| | | | | | | | | | | | | | | |
| INVESTMENT OPERATIONS: | | LESS DISTRIBUTIONS: | | RATIOS AND SUPPLEMENTAL DATA: |
|
| | | | | | | | | | | | | | | Ratio | |
| | Net asset | | Net realized | | | | | | | | | | Ratio | of net investment | |
| | value, | | and unrealized | Total from | From | From | | | | | Total return | Net assets, | of expenses | income (loss) | |
| | beginning | Net investment | gain (loss) | investment | net investment | net realized gain | Total | Redemption | Non-recurring | Net asset value, | at net asset | end of period | to average | to average | Portfolio |
| Period ended | of period | income (loss) | on investments | operations | income | on investments | distributions | fees | reimbursements | end of period | value (%) a | (in thousands) | net assets (%) b,c | net assets (%) c | turnover (%) |
|
| Class A | | | | | | | | | | | | | | | |
| September 30, 2013 | $8.34 | .33 | (.53) | (.20) | (.33) | — | (.33) | — | — | $7.81 | (2.50) | $1,338,414 | .74 | 4.03 | 11 |
| September 30, 2012 | 7.83 | .34 | .51 | .85 | (.34) | — | (.34) | — | — | 8.34 | 11.12 | 1,591,810 | .75 | 4.30 | 6 |
| September 30, 2011 | 7.99 | .36 | (.16) | .20 | (.36) | — | (.36) | — | — d | 7.83 | 2.75 | 1,466,160 | .75 | 4.77 | 9 |
| September 30, 2010 | 7.93 | .36 | .07 | .43 | (.37) | — | (.37) | — e | — | 7.99 | 5.64 | 1,627,229 | .76 | 4.74 | 16 |
| September 30, 2009 | 7.30 | .36 | .62 | .98 | (.35) | — | (.35) | — e | — | 7.93 | 14.12 | 1,655,447 | .80 f | 4.98 f | 26 |
|
| Class B | | | | | | | | | | | | | | | |
| September 30, 2013 | $8.34 | .28 | (.54) | (.26) | (.28) | — | (.28) | — | — | $7.80 | (3.24) | $7,255 | 1.37 | 3.40 | 11 |
| September 30, 2012 | 7.83 | .29 | .51 | .80 | (.29) | — | (.29) | — | — | 8.34 | 10.42 | 8,749 | 1.38 | 3.67 | 6 |
| September 30, 2011 | 7.98 | .31 | (.15) | .16 | (.31) | — | (.31) | — | — d | 7.83 | 2.24 | 8,615 | 1.38 | 4.15 | 9 |
| September 30, 2010 | 7.92 | .31 | .07 | .38 | (.32) | — | (.32) | — e | — | 7.98 | 4.97 | 15,928 | 1.39 | 4.14 | 16 |
| September 30, 2009 | 7.29 | .31 | .63 | .94 | (.31) | — | (.31) | — e | — | 7.92 | 13.37 | 29,276 | 1.44 f | 4.35 f | 26 |
|
| Class C | | | | | | | | | | | | | | | |
| September 30, 2013 | $8.38 | .27 | (.53) | (.26) | (.27) | — | (.27) | — | — | $7.85 | (3.25) | $47,175 | 1.52 | 3.25 | 11 |
| September 30, 2012 | 7.87 | .28 | .51 | .79 | (.28) | — | (.28) | — | — | 8.38 | 10.19 | 56,923 | 1.53 | 3.51 | 6 |
| September 30, 2011 | 8.03 | .30 | (.16) | .14 | (.30) | — | (.30) | — | — d | 7.87 | 1.95 | 45,516 | 1.53 | 3.99 | 9 |
| September 30, 2010 | 7.96 | .30 | .08 | .38 | (.31) | — | (.31) | — e | — | 8.03 | 4.95 | 51,872 | 1.54 | 3.95 | 16 |
| September 30, 2009 | 7.33 | .30 | .63 | .93 | (.30) | — | (.30) | — e | — | 7.96 | 13.18 | 44,289 | 1.59 f | 4.18 f | 26 |
|
| Class M | | | | | | | | | | | | | | | |
| September 30, 2013 | $8.32 | .31 | (.53) | (.22) | (.31) | — | (.31) | — | — | $7.79 | (2.78) | $2,606 | 1.02 | 3.75 | 11 |
| September 30, 2012 | 7.81 | .32 | .51 | .83 | (.32) | — | (.32) | — | — | 8.32 | 10.83 | 3,341 | 1.03 | 4.00 | 6 |
| September 30, 2011 | 7.97 | .34 | (.16) | .18 | (.34) | — | (.34) | — | — d | 7.81 | 2.45 | 2,590 | 1.03 | 4.48 | 9 |
| September 30, 2010 | 7.91 | .34 | .06 | .40 | (.34) | — | (.34) | — e | — | 7.97 | 5.34 | 3,011 | 1.04 | 4.46 | 16 |
| September 30, 2009 | 7.28 | .34 | .62 | .96 | (.33) | — | (.33) | — e | — | 7.91 | 13.81 | 3,775 | 1.09 f | 4.69 f | 26 |
|
| Class Y | | | | | | | | | | | | | | | |
| September 30, 2013 | $8.36 | .35 | (.53) | (.18) | (.35) | — | (.35) | — | — | $7.83 | (2.28) | $54,574 | .52 | 4.25 | 11 |
| September 30, 2012 | 7.85 | .36 | .51 | .87 | (.36) | — | (.36) | — | — | 8.36 | 11.30 | 56,992 | .53 | 4.49 | 6 |
| September 30, 2011 | 8.01 | .38 | (.16) | .22 | (.38) | — | (.38) | — | — d | 7.85 | 2.99 | 34,064 | .53 | 4.98 | 9 |
| September 30, 2010 | 7.94 | .38 | .07 | .45 | (.38) | — | (.38) | — e | — | 8.01 | 6.01 | 24,888 | .54 | 4.95 | 16 |
| September 30, 2009 | 7.31 | .37 | .63 | 1.00 | (.37) | — | (.37) | — e | — | 7.94 | 14.34 | 18,410 | .59 f | 5.18 f | 26 |
|
See notes to financial highlights at the end of this section.
The accompanying notes are an integral part of these financial statements.
| |
| 44 California Tax Exempt Income Fund | California Tax Exempt Income Fund 45 |
Financial highlights (Continued)
a Total return assumes dividend reinvestment and does not reflect the effect of sales charges.
b Includes amounts paid through expense offset arrangements (Note 2).
c Includes interest and fee expense associated with borrowings which amounted to the following (Note 1):
| |
| | Percentage of |
| | average net assets |
|
| September 30, 2013 | <0.01% |
|
| September 30, 2012 | <0.01 |
|
| September 30, 2011 | <0.01 |
|
| September 30, 2010 | <0.01 |
|
| September 30, 2009 | <0.01 |
|
d Reflects a non-recurring reimbursement related to restitution amounts in connection with a distribution plan approved by the Securities and Exchange Commission (the SEC) which amounted to less than $0.01 per share outstanding on July 21, 2011. Also reflects a non-recurring reimbursement related to short-term trading related lawsuits, which amounted to less than $0.01 per share outstanding on May 11, 2011.
e Amount represents less than $0.01 per share.
f Reflects an involuntary contractual expense limitation in effect during the period. As a result of such limitation, the expenses of each class of the fund reflect a reduction as of the following amounts (Note 2):
| |
| | Percentage of |
| | average net assets |
|
| September 30, 2010 | 0.01% |
|
| September 30, 2009 | <0.01 |
|
The accompanying notes are an integral part of these financial statements.
|
| 46 California Tax Exempt Income Fund |
Notes to financial statements 9/30/13
Within the following Notes to financial statements, references to “State Street” represent State Street Bank and Trust Company, references to “the SEC” represent the Securities and Exchange Commission, references to “Putnam Management” represent Putnam Investment Management, LLC, the fund’s manager, an indirect wholly-owned subsidiary of Putnam Investments, LLC and references to “OTC”, if any, represent over-the-counter. Unless otherwise noted, the “reporting period” represents the period from October 1, 2012 through September 30, 2013.
Putnam California Tax Exempt Income Fund (the fund) is a Massachusetts business trust, which is registered under the Investment Company Act of 1940, as amended, as a diversified open-end management investment company. The investment objective of the fund is to seek as high a level of current income exempt from federal income tax and California personal income tax as Putnam Management believes to be consistent with preservation of capital. The fund invests mainly in bonds that pay interest that is exempt from federal income tax and California personal income tax (but that may be subject to federal alternative minimum tax (AMT)), are investment-grade in quality, and have intermediate- to long-term maturities (three years or longer). Putnam Management may consider, among other factors, credit, interest rate and prepayment risks, as well as general market conditions, when deciding whether to buy or sell investments.
The fund offers class A, class B, class C, class M and class Y shares. Class A and class M shares are sold with a maximum front-end sales charge of 4.00% and 3.25%, respectively, and generally do not pay a contingent deferred sales charge. Class B shares, which convert to class A shares after approximately eight years, do not pay a front-end sales charge and are subject to a contingent deferred sales charge if those shares are redeemed within six years of purchase. Class C shares have a one-year 1.00% contingent deferred sales charge and do not convert to class A shares. The expenses for class A, class B, class C, and class M shares may differ based on the distribution fee of each class, which is identified in Note 2. Class Y shares, which are sold at net asset value, are generally subject to the same expenses as class A, class B, class C, and class M shares, but do not bear a distribution fee. Class Y shares are not available to all investors.
In the normal course of business, the fund enters into contracts that may include agreements to indemnify another party under given circumstances. The fund’s maximum exposure under these arrangements is unknown as this would involve future claims that may be, but have not yet been, made against the fund. However, the fund’s management team expects the risk of material loss to be remote.
Note 1: Significant accounting policies
The following is a summary of significant accounting policies consistently followed by the fund in the preparation of its financial statements. The preparation of financial statements is in conformity with accounting principles generally accepted in the United States of America and requires management to make estimates and assumptions that affect the reported amounts of assets and liabilities in the financial statements and the reported amounts of increases and decreases in net assets from operations. Actual results could differ from those estimates. Subsequent events after the Statement of assets and liabilities date through the date that the financial statements were issued have been evaluated in the preparation of the financial statements.
Investment income, realized and unrealized gains and losses and expenses of the fund are borne pro-rata based on the relative net assets of each class to the total net assets of the fund, except that each class bears expenses unique to that class (including the distribution fees applicable to such classes). Each class votes as a class only with respect to its own distribution plan or other matters on which a class vote is required by law or determined by the Trustees. If the fund were liquidated, shares of each class would receive their pro-rata share of the net assets of the fund. In addition, the Trustees declare separate dividends on each class of shares.
Security valuation Tax-exempt bonds and notes are generally valued on the basis of valuations provided by an independent pricing service approved by the Trustees. Such services use information with respect to transactions in bonds, quotations from bond dealers, market transactions in comparable securities and various relationships between securities in determining value. These securities will generally be categorized as Level 2.
Certain investments, including certain restricted and illiquid securities and derivatives, are also valued at fair value following procedures approved by the Trustees. Such valuations and procedures are reviewed periodically by the Trustees. These valuations consider such factors as significant market or specific security events such as interest rate or credit quality changes, various relationships with other securities, discount rates, U.S. Treasury, U.S. swap and credit yields, index levels, convexity exposures and recovery rates. These securities are classified as Level 2 or as Level 3 depending on the priority of the significant inputs. The fair value of securities is generally determined
|
| California Tax Exempt Income Fund 47 |
as the amount that the fund could reasonably expect to realize from an orderly disposition of such securities over a reasonable period of time. By its nature, a fair value price is a good faith estimate of the value of a security in a current sale and does not reflect an actual market price, which may be different by a material amount.
Security transactions and related investment income Security transactions are recorded on the trade date (the date the order to buy or sell is executed). Gains or losses on securities sold are determined on the identified cost basis. Interest income is recorded on the accrual basis. All premiums/discounts are amortized/accreted on a yield-to-maturity basis. The premium in excess of the call price, if any, is amortized to the call date; thereafter, any remaining premium is amortized to maturity. Securities purchased or sold on a delayed delivery basis may be settled a month or more after the trade date; interest income is accrued based on the terms of the securities. Losses may arise due to changes in the market value of the underlying securities or if the counterparty does not perform under the contract.
Futures contracts The fund uses futures contracts to gain exposure to interest rates.
The potential risk to the fund is that the change in value of futures contracts may not correspond to the change in value of the hedged instruments. In addition, losses may arise from changes in the value of the underlying instruments, if there is an illiquid secondary market for the contracts, if interest or exchange rates move unexpectedly or if the counterparty to the contract is unable to perform. With futures, there is minimal counterparty credit risk to the fund since futures are exchange traded and the exchange’s clearinghouse, as counterparty to all exchange traded futures, guarantees the futures against default. Risks may exceed amounts recognized on the Statement of assets and liabilities. When the contract is closed, the fund records a realized gain or loss equal to the difference between the value of the contract at the time it was opened and the value at the time it was closed.
Futures contracts are valued at the quoted daily settlement prices established by the exchange on which they trade. The fund and the broker agree to exchange an amount of cash equal to the daily fluctuation in the value of the futures contract. Such receipts or payments are known as “variation margin.”
Futures contracts outstanding at period end, if any, are listed after the fund’s portfolio.
Total return swap contracts The fund entered into OTC total return swap contracts, which are arrangements to exchange a market linked return for a periodic payment, both based on a notional principal amount, to manage interest rate risk.
To the extent that the total return of the security, index or other financial measure underlying the transaction exceeds or falls short of the offsetting interest rate obligation, the fund will receive a payment from or make a payment to the counterparty. OTC total return swap contracts are marked to market daily based upon quotations from an independent pricing service or market makers and the change, if any, is recorded as an unrealized gain or loss. Payments received or made are recorded as realized gains or losses. Certain OTC total return swap contracts may include extended effective dates. Payments related to these swap contracts are accrued based on the terms of the contract. The fund could be exposed to credit or market risk due to unfavorable changes in the fluctuation of interest rates or in the price of the underlying security or index, the possibility that there is no liquid market for these agreements or that the counterparty may default on its obligation to perform. The fund’s maximum risk of loss from counterparty risk is the fair value of the contract. This risk may be mitigated by having a master netting arrangement between the fund and the counterparty. Risk of loss may exceed amounts recognized on the Statement of assets and liabilities.
OTC total return swap contracts outstanding at period end, if any, are listed after the fund’s portfolio.
Master agreements The fund is a party to ISDA (International Swaps and Derivatives Association, Inc.) Master Agreements (Master Agreements) with certain counterparties that govern OTC derivative and foreign exchange contracts entered into from time to time. The Master Agreements may contain provisions regarding, among other things, the parties’ general obligations, representations, agreements, collateral requirements, events of default and early termination. With respect to certain counterparties, in accordance with the terms of the Master Agreements, collateral posted to the fund is held in a segregated account by the fund’s custodian and with respect to those amounts which can be sold or repledged, are presented in the fund’s portfolio.
Collateral pledged by the fund is segregated by the fund’s custodian and identified in the fund’s portfolio. Collateral can be in the form of cash or debt securities issued by the U.S. Government or related agencies or other securities as agreed to by the fund and the applicable counterparty. Collateral requirements are determined based on the fund’s net position with each counterparty.
|
| 48 California Tax Exempt Income Fund |
Termination events applicable to the fund may occur upon a decline in the fund’s net assets below a specified threshold over a certain period of time. Termination events applicable to counterparties may occur upon a decline in the counterparty’s long-term and short-term credit ratings below a specified level. In each case, upon occurrence, the other party may elect to terminate early and cause settlement of all derivative and foreign exchange contracts outstanding, including the payment of any losses and costs resulting from such early termination, as reasonably determined by the terminating party. Any decision by one or more of the fund’s counterparties to elect early termination could impact the fund’s future derivative activity.
At the close of the reporting period, the fund did not have a net liability position on open derivative contracts subject to the Master Agreements.
Tender option bond transactions The fund may participate in transactions whereby a fixed-rate bond is transferred to a tender option bond trust (TOB trust) sponsored by a broker. The TOB trust funds the purchase of the fixed rate bonds by issuing floating-rate bonds to third parties and allowing the fund to retain the residual interest in the TOB trust’s assets and cash flows, which are in the form of inverse floating rate bonds. The inverse floating rate bonds held by the fund give the fund the right to (1) cause the holders of the floating rate bonds to tender their notes at par, and (2) to have the fixed-rate bond held by the TOB trust transferred to the fund, causing the TOB trust to collapse. The fund accounts for the transfer of the fixed-rate bond to the TOB trust as a secured borrowing by including the fixed-rate bond in the fund’s portfolio and including the floating rate bond as a liability in the Statement of assets and liabilities. At the close of the reporting period, the fund’s investments with a value of $15,150,359 were held by the TOB trust and served as collateral for $6,835,183 in floating-rate bonds outstanding. For the reporting period ended, the fund incurred interest expense of $8,753 for these investments based on an average interest rate of 0.13%.
Interfund lending The fund, along with other Putnam funds, may participate in an interfund lending program pursuant to an exemptive order issued by the SEC. This program allows the fund to borrow from other Putnam funds that permit such transactions. Interfund lending transactions are subject to each fund’s investment policies and borrowing and lending limits. Interest earned or paid on the interfund lending transaction will be based on the average of certain current market rates. During the reporting period, the fund did not utilize the program.
Line of credit The fund participates, along with other Putnam funds, in a $315 million unsecured committed line of credit and a $185 million unsecured uncommitted line of credit, both provided by State Street. Borrowings may be made for temporary or emergency purposes, including the funding of shareholder redemption requests and trade settlements. Interest is charged to the fund based on the fund’s borrowing at a rate equal to the Federal Funds rate plus 1.25% for the committed line of credit and the Federal Funds rate plus 1.30% for the uncommitted line of credit. A closing fee equal to 0.02% of the committed line of credit and $50,000 for the uncommitted line of credit has been paid by the participating funds. In addition, a commitment fee of 0.11% per annum on any unutilized portion of the committed line of credit is allocated to the participating funds based on their relative net assets and paid quarterly. During the reporting period, the fund had no borrowings against these arrangements.
Federal taxes It is the policy of the fund to distribute all of its income within the prescribed time period and otherwise comply with the provisions of the Internal Revenue Code of 1986, as amended (the Code), applicable to regulated investment companies. It is also the intention of the fund to distribute an amount sufficient to avoid imposition of any excise tax under Section 4982 of the Code.
The fund is subject to the provisions of Accounting Standards Codification 740 Income Taxes (ASC 740). ASC 740 sets forth a minimum threshold for financial statement recognition of the benefit of a tax position taken or expected to be taken in a tax return. The fund did not have a liability to record for any unrecognized tax benefits in the accompanying financial statements. No provision has been made for federal taxes on income, capital gains or unrealized appreciation on securities held nor for excise tax on income and capital gains. Each of the fund’s federal tax returns for the prior three fiscal years remains subject to examination by the Internal Revenue Service.
|
| California Tax Exempt Income Fund 49 |
At September 30, 2013, the fund had a capital loss carryover of $58,231,947 available to the extent allowed by the Code to offset future net capital gain, if any. The amounts of the carryovers and the expiration dates are:
| | | |
| | Loss carryover | |
|
| Short-term | Long-term | Total | Expiration |
|
| $2,292,763 | $10,748,879 | $13,041,642 | * |
|
| 766,815 | N/A | 766,815 | September 30, 2016 |
|
| 12,478,683 | N/A | 12,478,683 | September 30, 2017 |
|
| 1,872,123 | N/A | 1,872,123 | September 30, 2018 |
|
| 30,072,684 | N/A | 30,072,684 | September 30, 2019 |
|
* Under the Regulated Investment Company Modernization Act of 2010, the fund will be permitted to carry forward capital losses incurred in taxable years beginning after December 22, 2010 for an unlimited period. However, any losses incurred will be required to be utilized prior to the losses incurred in pre-enactment tax years. As a result of this ordering rule, pre-enactment capital loss carryforwards may be more likely to expire unused. Additionally, post-enactment capital losses that are carried forward will retain their character as either short-term or long-term capital losses rather than being considered all short-term as under previous law.
Pursuant to federal income tax regulations applicable to regulated investment companies, the fund has elected to defer certain capital losses of $6,394,360 recognized during the period between November 1, 2012 and September 30, 2013 to its fiscal year ending September 30, 2014.
Distributions to shareholders Income dividends are recorded daily by the fund and are paid monthly. Distributions from capital gains, if any, are recorded on the ex-dividend date and paid at least annually. The amount and character of income and gains to be distributed are determined in accordance with income tax regulations which may differ from generally accepted accounting principles. These differences include temporary and/or permanent differences from late year loss deferrals, dividends payable, straddle loss deferrals, bond amortization and accretion and from tender option bond loss deferral. Reclassifications are made to the fund’s capital accounts to reflect income and gains available for distribution (or available capital loss carryovers) under income tax regulations. At the close of the reporting period, the fund reclassified $470,513 to decrease undistributed net investment income and $470,513 to decrease accumulated net realized loss.
The tax basis components of distributable earnings and the federal tax cost as of the close of the reporting period were as follows:
| |
| Unrealized appreciation | $92,760,313 |
| Unrealized depreciation | (22,835,578) |
|
| Net unrealized appreciation | 69,924,735 |
| Undistributed tax-exempt income | 5,955,667 |
| Undistributed ordinary income | 306,287 |
| Capital loss carryforward | (58,231,947) |
| Post-October capital loss deferral | (6,394,360) |
| Cost for federal income tax purposes | $1,381,441,507 |
Note 2: Management fee, administrative services and other transactions
The fund pays Putnam Management a management fee (based on the fund’s average net assets and computed and paid monthly) at annual rates that may vary based on the average of the aggregate net assets of most open-end funds, as defined in the fund’s management contract, sponsored by Putnam Management. Such annual rates may vary as follows:
| | | | |
| 0.590% | of the first $5 billion, | | 0.390% | of the next $50 billion, |
| |
|
| 0.540% | of the next $5 billion, | | 0.370% | of the next $50 billion, |
| |
|
| 0.490% | of the next $10 billion, | | 0.360% | of the next $100 billion and |
| |
|
| 0.440% | of the next $10 billion, | | 0.355% | of any excess thereafter. |
| |
|
|
| 50 California Tax Exempt Income Fund |
Following the death on October 8, 2013 of The Honourable Paul G. Desmarais, who controlled directly and indirectly a majority of the voting shares of Power Corporation of Canada, the ultimate parent company of Putnam Management, the Trustees of the fund approved an interim management contract with Putnam Management. Consistent with Rule 15a-4 under the Investment Company Act of 1940, the interim management contract will remain in effect until the earlier to occur of (i) approval by the fund’s shareholders of a new management contract and (ii) March 7, 2014. Except with respect to termination, the terms of the interim management contract, including terms relating to fees payable to Putnam Management, are identical to the terms of the fund’s previous management contract with Putnam Management. The Trustees of the fund also approved the continuance, effective October 8, 2013, of the sub-management contract between Putnam Management and Putnam Investments Limited (PIL) described below, for a term no longer than March 7, 2014.
Putnam Management has contractually agreed, through June 30, 2014, to waive fees or reimburse the fund’s expenses to the extent necessary to limit the cumulative expenses of the fund, exclusive of brokerage, interest, taxes, investment-related expenses, extraordinary expenses, acquired fund fees and expenses and payments under the fund’s investor servicing contract, investment management contract and distribution plans, on a fiscal year-to-date basis to an annual rate of 0.20% of the fund’s average net assets over such fiscal year-to-date period. During the reporting period, the fund’s expenses were not reduced as a result of this limit. This expense limitation remains in place under the interim management contract described above.
PIL, an affiliate of Putnam Management, is authorized by the Trustees to manage a separate portion of the assets of the fund as determined by Putnam Management from time to time. Putnam Management pays a quarterly sub-management fee to PIL for its services at an annual rate of 0.40% of the average net assets of the portion of the fund managed by PIL.
The fund reimburses Putnam Management an allocated amount for the compensation and related expenses of certain officers of the fund and their staff who provide administrative services to the fund. The aggregate amount of all such reimbursements is determined annually by the Trustees.
Custodial functions for the fund’s assets are provided by State Street. Custody fees are based on the fund’s asset level, the number of its security holdings and transaction volumes.
Putnam Investor Services, Inc., an affiliate of Putnam Management, provides investor servicing agent functions to the fund. Putnam Investor Services, Inc. received fees for investor servicing based on the fund’s retail asset level, the number of shareholder accounts in the fund and the level of defined contribution plan assets in the fund. Investor servicing fees will not exceed an annual rate of 0.32% of the fund’s average net assets. During the reporting period, the expenses for each class of shares related to investor servicing fees were as follows:
| | | | |
| Class A | $704,324 | | Class M | 1,362 |
| |
|
| Class B | 3,912 | | Class Y | 27,541 |
| |
|
| Class C | 26,537 | | Total | $763,676 |
| |
|
The fund has entered into expense offset arrangements with Putnam Investor Services, Inc. and State Street whereby Putnam Investor Services, Inc.’s and State Street’s fees are reduced by credits allowed on cash balances. For the reporting period, the fund’s expenses were reduced by $4,431 under the expense offset arrangements.
Each independent Trustee of the fund receives an annual Trustee fee, of which $1,156, as a quarterly retainer, has been allocated to the fund, and an additional fee for each Trustees meeting attended. Trustees also are reimbursed for expenses they incur relating to their services as Trustees.
The fund has adopted a Trustee Fee Deferral Plan (the Deferral Plan) which allows the Trustees to defer the receipt of all or a portion of Trustees fees payable on or after July 1, 1995. The deferred fees remain invested in certain Putnam funds until distribution in accordance with the Deferral Plan.
The fund has adopted an unfunded noncontributory defined benefit pension plan (the Pension Plan) covering all Trustees of the fund who have served as a Trustee for at least five years and were first elected prior to 2004. Benefits under the Pension Plan are equal to 50% of the Trustee’s average annual attendance and retainer fees for the three years ended December 31, 2005. The retirement benefit is payable during a Trustee’s lifetime, beginning the year following retirement, for the number of years of service through December 31, 2006. Pension expense for the fund is included in Trustee compensation and expenses in the Statement of operations. Accrued pension liability is included in Payable for Trustee compensation and expenses in the Statement of assets and liabilities. The Trustees have terminated the Pension Plan with respect to any Trustee first elected after 2003.
| |
| California Tax Exempt Income Fund | 51 |
The fund has adopted distribution plans (the Plans) with respect to its class A, class B, class C and class M shares pursuant to Rule 12b–1 under the Investment Company Act of 1940. The purpose of the Plans is to compensate Putnam Retail Management Limited Partnership, an indirect wholly-owned subsidiary of Putnam Investments, LLC, for services provided and expenses incurred in distributing shares of the fund. The Plans provide for payments by the fund to Putnam Retail Management Limited Partnership at an annual rate of up to 0.35%, 1.00%, 1.00% and 1.00% of the average net assets attributable to class A, class B, class C and class M shares, respectively. The Trustees have approved payment by the fund at the annual rate of 0.85%, 1.00% and 0.50% of the average net assets for class B, class C and class M shares, respectively. For class A shares, the annual payment rate will equal the weighted average of (i) 0.20% on the net assets of the fund attributable to class A shares purchased and paid for prior to April 1, 2005 and (ii) 0.25% on all other net assets of the fund attributable to class A shares. During the reporting period, the class specific expenses related to distribution fees were as follows:
| | | | |
| Class A | $3,325,296 | | Class M | 14,724 |
| |
|
| Class B | 71,902 | | Total | $3,985,772 |
| |
|
| Class C | 573,850 | | | |
| | |
For the reporting period, Putnam Retail Management Limited Partnership, acting as underwriter, received net commissions of $126,617 and $804 from the sale of class A and class M shares, respectively, and received $2,241 and $537 in contingent deferred sales charges from redemptions of class B and class C shares, respectively.
A deferred sales charge of up to 1.00% is assessed on certain redemptions of class A shares. For the reporting period, Putnam Retail Management Limited Partnership, acting as underwriter, received $7,514 on class A redemptions.
Note 3: Purchases and sales of securities
During the reporting period, cost of purchases and proceeds from sales of investment securities other than short-term investments aggregated $164,392,853 and $360,356,556, respectively. There were no purchases or proceeds from sales of long-term U.S. government securities.
Note 4: Capital shares
At the close of the reporting period, there was an unlimited number of shares of beneficial interest authorized. Transactions in capital shares were as follows:
| | | | |
| | Year ended 9/30/13 | Year ended 9/30/12 |
|
| Class A | Shares | Amount | Shares | Amount |
|
| Shares sold | 18,304,324 | $152,049,316 | 17,970,155 | $146,532,100 |
|
| Shares issued in connection with | | | | |
| reinvestment of distributions | 5,564,631 | 45,654,343 | 5,719,293 | 46,518,328 |
|
| | 23,868,955 | 197,703,659 | 23,689,448 | 193,050,428 |
|
| Shares repurchased | (43,259,365) | (352,812,645) | (20,071,829) | (162,915,939) |
|
| Net increase (decrease) | (19,390,410) | $(155,108,986) | 3,617,619 | $30,134,489 |
|
| |
| | Year ended 9/30/13 | Year ended 9/30/12 |
|
| Class B | Shares | Amount | Shares | Amount |
|
| Shares sold | 106,757 | $884,105 | 251,733 | $2,042,302 |
|
| Shares issued in connection with | | | | |
| reinvestment of distributions | 29,889 | 245,025 | 29,214 | 237,471 |
|
| | 136,646 | 1,129,130 | 280,947 | 2,279,773 |
|
| Shares repurchased | (256,328) | (2,073,639) | (332,084) | (2,669,063) |
|
| Net decrease | (119,682) | $(944,509) | (51,137) | $(389,290) |
|
|
| 52 California Tax Exempt Income Fund |
| | | | |
| | Year ended 9/30/13 | Year ended 9/30/12 |
|
| Class C | Shares | Amount | Shares | Amount |
|
| Shares sold | 1,326,280 | $11,124,158 | 2,246,058 | $18,421,747 |
|
| Shares issued in connection with | | | | |
| reinvestment of distributions | 168,765 | 1,391,477 | 155,582 | 1,272,091 |
|
| | 1,495,045 | 12,515,635 | 2,401,640 | 19,693,838 |
|
| Shares repurchased | (2,274,273) | (18,502,278) | (1,396,141) | (11,374,879) |
|
| Net increase (decrease) | (779,228) | $(5,986,643) | 1,005,499 | $8,318,959 |
|
| |
| | Year ended 9/30/13 | Year ended 9/30/12 |
|
| Class M | Shares | Amount | Shares | Amount |
|
| Shares sold | 49,061 | $406,798 | 87,821 | $708,796 |
|
| Shares issued in connection with | | | | |
| reinvestment of distributions | 11,896 | 97,392 | 11,858 | 96,333 |
|
| | 60,957 | 504,190 | 99,679 | 805,129 |
|
| Shares repurchased | (127,770) | (1,057,692) | (29,623) | (240,765) |
|
| Net increase (decrease) | (66,813) | $(553,502) | 70,056 | $564,364 |
|
| |
| | Year ended 9/30/13 | Year ended 9/30/12 |
|
| Class Y | Shares | Amount | Shares | Amount |
|
| Shares sold | 3,320,617 | $27,371,431 | 3,947,566 | $32,175,568 |
|
| Shares issued in connection with | | | | |
| reinvestment of distributions | 206,529 | 1,699,796 | 175,371 | 1,432,977 |
|
| | 3,527,146 | 29,071,227 | 4,122,937 | 33,608,545 |
|
| Shares repurchased | (3,370,241) | (27,496,037) | (1,647,128) | (13,453,229) |
|
| Net increase | 156,905 | $1,575,190 | 2,475,809 | $20,155,316 |
|
Note 5: Market, credit and other risks
In the normal course of business, the fund trades financial instruments and enters into financial transactions where risk of potential loss exists due to changes in the market (market risk) or failure of the contracting party to the transaction to perform (credit risk). The fund may be exposed to additional credit risk that an institution or other entity with which the fund has unsettled or open transactions will default. The fund may be affected by economic and political developments in the state of California.
Note 6: Summary of derivative activity
The average volume of activity for the reporting period for any derivative type that was held during the period is listed below and was as follows:
| |
| Futures contracts (number of contracts) | —* |
|
| OTC total return swap contracts (notional) | —* |
|
* For the reporting period, the transaction volume was minimal.As of the close of the reporting period, the fund did not hold any derivative instruments.
| |
| California Tax Exempt Income Fund | 53 |
The following is a summary of realized gains or losses of derivative instruments on the Statement of operations for the reporting period (see Note 1) (there were no unrealized gains or losses on derivative instruments):
Amount of realized gain or (loss) on derivatives recognized in net gain or (loss) on investments
| | | |
| Derivatives not accounted for as hedging | | | |
| instruments under ASC 815 | Futures | Swaps | Total |
|
| Interest rate contracts | $(89,463) | $(1,446,129) | $(1,535,592) |
|
| Total | $(89,463) | $(1,446,129) | $(1,535,592) |
|
Note 7: New accounting pronouncement
In January 2013, ASU 2013–01, “Clarifying the Scope of Disclosures about Offsetting Assets and Liabilities,” amended ASU No. 2011–11, “Disclosures about Offsetting Assets and Liabilities.” The ASUs create new disclosure requirements requiring entities to disclose both gross and net information for derivatives and other financial instruments that are either offset in the Statement of assets and liabilities or subject to an enforceable master netting arrangement or similar agreement. The disclosure requirements are effective for annual reporting periods beginning on or after January 1, 2013 and interim periods within those annual periods. Putnam Management is currently evaluating the application of ASUs 2013–01 and 2011–11 and their impact, if any, on the fund’s financial statements.
|
| 54 California Tax Exempt Income Fund |
Federal tax information (Unaudited)
The fund has designated 99.26% of dividends paid from net investment income during the reporting period as tax exempt for Federal income tax purposes.
The Form 1099 that will be mailed to you in January 2014 will show the tax status of all distributions paid to your account in calendar 2013.
|
| California Tax Exempt Income Fund 55 |
About the Trustees
Independent Trustees

|
| 56 California Tax Exempt Income Fund |
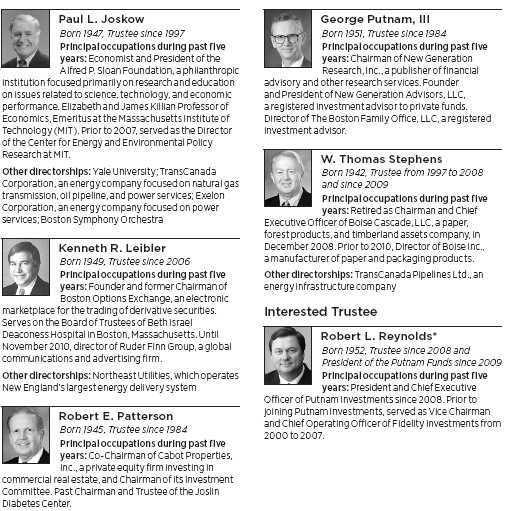
* Mr. Reynolds is an “interested person” (as defined in the Investment Company Act of 1940) of the fund and Putnam Investments. He is President and Chief Executive Officer of Putnam Investments, as well as the President of your fund and each of the other Putnam funds.
The address of each Trustee is One Post Office Square, Boston, MA 02109.
As of September 30, 2013, there were 116 Putnam funds. All Trustees serve as Trustees of all Putnam funds.
Each Trustee serves for an indefinite term, until his or her resignation, retirement at age 75, removal, or death.
| |
| California Tax Exempt Income Fund | 57 |
Officers
In addition to Robert L. Reynolds, the other officers of the fund are shown below:
| |
| Jonathan S. Horwitz (Born 1955) | Janet C. Smith (Born 1965) |
| Executive Vice President, Principal Executive | Vice President, Principal Accounting Officer, |
| Officer, and Compliance Liaison | and Assistant Treasurer |
| Since 2004 | Since 2007 |
| | Director of Fund Administration Services, |
| Steven D. Krichmar (Born 1958) | Putnam Investments and Putnam Management |
| Vice President and Principal Financial Officer | |
| Since 2002 | Susan G. Malloy (Born 1957) |
| Chief of Operations, Putnam Investments and | Vice President and Assistant Treasurer |
| Putnam Management | Since 2007 |
| | Director of Accounting & Control Services, |
| Robert T. Burns (Born 1961) | Putnam Investments and Putnam Management |
| Vice President and Chief Legal Officer | |
| Since 2011 | James P. Pappas (Born 1953) |
| General Counsel, Putnam Investments, Putnam | Vice President |
| Management, and Putnam Retail Management | Since 2004 |
| | Director of Trustee Relations, |
| Robert R. Leveille (Born 1969) | Putnam Investments and Putnam Management |
| Vice President and Chief Compliance Officer | |
| Since 2007 | Mark C. Trenchard (Born 1962) |
| Chief Compliance Officer, Putnam Investments, | Vice President and BSA Compliance Officer |
| Putnam Management, and Putnam Retail | Since 2002 |
| Management | Director of Operational Compliance, |
| | Putnam Investments and Putnam |
| Michael J. Higgins (Born 1976) | Retail Management |
| Vice President, Treasurer, and Clerk | |
| Since 2010 | Nancy E. Florek (Born 1957) |
| Manager of Finance, Dunkin’ Brands (2008– | Vice President, Director of Proxy Voting and |
| 2010); Senior Financial Analyst, Old Mutual Asset | Corporate Governance, Assistant Clerk, |
| Management (2007–2008); Senior Financial | and Associate Treasurer |
| Analyst, Putnam Investments (1999–2007) | Since 2000 |
The principal occupations of the officers for the past five years have been with the employers as shown above, although in some cases they have held different positions with such employers. The address of each Officer is One Post Office Square, Boston, MA 02109.
|
| 58 California Tax Exempt Income Fund |
The Putnam family of funds
The following is a list of Putnam’s open-end mutual funds offered to the public. Investors should carefully consider the investment objective, risks, charges, and expenses of a fund before investing. For a prospectus, or a summary prospectus if available, containing this and other information for any Putnam fund or product, call your financial advisor at 1-800-225-1581 and ask for a prospectus. Please read the prospectus carefully before investing.
| |
| Growth | International Value Fund |
| Growth Opportunities Fund | Multi-Cap Value Fund |
| International Growth Fund | Small Cap Value Fund |
| Multi-Cap Growth Fund | |
| Small Cap Growth Fund | Income |
| Voyager Fund | American Government Income Fund |
| | Diversified Income Trust |
| Blend | Emerging Markets Income Fund |
| Asia Pacific Equity Fund | Floating Rate Income Fund |
| Capital Opportunities Fund | Global Income Trust |
| Capital Spectrum Fund | High Yield Advantage Fund |
| Emerging Markets Equity Fund | High Yield Trust |
| Equity Spectrum Fund | Income Fund |
| Europe Equity Fund | Money Market Fund* |
| Global Equity Fund | Short Duration Income Fund |
| International Capital Opportunities Fund | U.S. Government Income Trust |
| International Equity Fund | |
| Investors Fund | Tax-free income |
| Low Volatility Equity Fund | AMT-Free Municipal Fund |
| Multi-Cap Core Fund | Intermediate-Term Municipal Income Fund |
| Research Fund | Short-Term Municipal Income Fund |
| Strategic Volatility Equity Fund | Tax Exempt Income Fund |
| | Tax Exempt Money Market Fund* |
| Value | Tax-Free High Yield Fund |
| Convertible Securities Fund | |
| Equity Income Fund | State tax-free income funds: |
| George Putnam Balanced Fund | Arizona, California, Massachusetts, Michigan, |
| Global Dividend Fund | Minnesota, New Jersey, New York, Ohio, |
| The Putnam Fund for Growth and Income | and Pennsylvania. |
| |
* An investment in a money market fund is not insured or guaranteed by the Federal Deposit Insurance Corporation or any other government agency. Although the fund seeks to preserve the value of your investment at $1.00 per share, it is possible to lose money by investing in the fund.
|
| California Tax Exempt Income Fund 59 |
| |
| Absolute Return | Putnam RetirementReady® Funds — portfolios |
| Absolute Return 100 Fund® | with automatically adjusting allocations to |
| Absolute Return 300 Fund® | stocks, bonds, and money market instruments, |
| Absolute Return 500 Fund® | becoming more conservative over time. |
| Absolute Return 700 Fund® | |
| | RetirementReady 2055 Fund |
| Global Sector | RetirementReady 2050 Fund |
| Global Consumer Fund | RetirementReady 2045 Fund |
| Global Energy Fund | RetirementReady 2040 Fund |
| Global Financials Fund | RetirementReady 2035 Fund |
| Global Health Care Fund | RetirementReady 2030 Fund |
| Global Industrials Fund | RetirementReady 2025 Fund |
| Global Natural Resources Fund | RetirementReady 2020 Fund |
| Global Sector Fund | RetirementReady 2015 Fund |
| Global Technology Fund | |
| Global Telecommunications Fund | Putnam Retirement Income Lifestyle |
| Global Utilities Fund | Funds — portfolios with managed |
| | allocations to stocks, bonds, and money |
| Asset Allocation | market investments to generate |
| Putnam Global Asset Allocation Funds — | retirement income. |
| portfolios with allocations to stocks, bonds, | |
| and money market instruments that are | Retirement Income Fund Lifestyle 1 |
| adjusted dynamically within specified ranges | Retirement Income Fund Lifestyle 2 |
| as market conditions change. | Retirement Income Fund Lifestyle 3 |
| | |
| Dynamic Asset Allocation Balanced Fund | |
| Dynamic Asset Allocation | |
| Conservative Fund | |
| Dynamic Asset Allocation Growth Fund | |
| Dynamic Risk Allocation Fund | |
Check your account balances and the most recent month-end performance in the Individual Investors section at putnam.com.
|
| 60 California Tax Exempt Income Fund |
Fund information
Founded over 75 years ago, Putnam Investments was built around the concept that a balance between risk and reward is the hallmark of a well-rounded financial program. We manage over 100 funds across income, value, blend, growth, asset allocation, absolute return, and global sector categories.
| | |
| Investment Manager | Trustees | Robert R. Leveille |
| Putnam Investment | Jameson A. Baxter, Chair | Vice President and |
| Management, LLC | Liaquat Ahamed | Chief Compliance Officer |
| One Post Office Square | Ravi Akhoury | |
| Boston, MA 02109 | Barbara M. Baumann | Michael J. Higgins |
| | Charles B. Curtis | Vice President, Treasurer, |
| Investment Sub-Manager | Robert J. Darretta | and Clerk |
| Putnam Investments Limited | Katinka Domotorffy | |
| 57–59 St James’s Street | John A. Hill | Janet C. Smith |
| London, England SW1A 1LD | Paul L. Joskow | Vice President, |
| | Kenneth R. Leibler | Principal Accounting Officer, |
| Marketing Services | Robert E. Patterson | and Assistant Treasurer |
| Putnam Retail Management | George Putnam, III | |
| One Post Office Square | Robert L. Reynolds | Susan G. Malloy |
| Boston, MA 02109 | W. Thomas Stephens | Vice President and |
| | | Assistant Treasurer |
| Custodian | Officers | |
| State Street Bank | Robert L. Reynolds | James P. Pappas |
| and Trust Company | President | Vice President |
| | | |
| Legal Counsel | Jonathan S. Horwitz | Mark C. Trenchard |
| Ropes & Gray LLP | Executive Vice President, | Vice President and |
| | Principal Executive Officer, and | BSA Compliance Officer |
| Independent Registered | Compliance Liaison | |
| Public Accounting Firm | | Nancy E. Florek |
| KPMG LLP | Steven D. Krichmar | Vice President, Director of |
| | Vice President and | Proxy Voting and Corporate |
| | Principal Financial Officer | Governance, Assistant Clerk, |
| | | and Associate Treasurer |
| | Robert T. Burns | |
| | Vice President and | |
| | Chief Legal Officer | |
This report is for the information of shareholders of Putnam California Tax Exempt Income Fund. It may also be used as sales literature when preceded or accompanied by the current prospectus, the most recent copy of Putnam’s Quarterly Performance Summary, and Putnam’s Quarterly Ranking Summary. For more recent performance, please visit putnam.com. Investors should carefully consider the investment objectives, risks, charges, and expenses of a fund, which are described in its prospectus. For this and other information or to request a prospectus or summary prospectus, call 1-800-225-1581 toll free. Please read the prospectus carefully before investing. The fund’s Statement of Additional Information contains additional information about the fund’s Trustees and is available without charge upon request by calling 1-800-225-1581.
| |
| (a) The fund’s principal executive, financial and accounting officers are employees of Putnam Investment Management, LLC, the Fund’s investment manager. As such they are subject to a comprehensive Code of Ethics adopted and administered by Putnam Investments which is designed to protect the interests of the firm and its clients. The Fund has adopted a Code of Ethics which incorporates the Code of Ethics of Putnam Investments with respect to all of its officers and Trustees who are employees of Putnam Investment Management, LLC. For this reason, the Fund has not adopted a separate code of ethics governing its principal executive, financial and accounting officers. |
| |
| (c) In July 2013, the Code of Ethics of Putnam Investment Management, LLC was amended. The changes to the Code of Ethics were as follows: (i) eliminating the requirement for employees to hold their shares of Putnam mutual funds for specified periods of time, (ii) removing the requirement to preclear transactions in certain kinds of exchange-traded funds and exchange-traded notes, although reporting of all such instruments remains required; (iii) eliminating the excessive trading rule related to employee transactions in securities requiring preclearance under the Code; (iv) adding provisions related to monitoring of employee trading; (v) changing from a set number of shares to a set dollar value of stock of mid- and large-cap companies on the Restricted List that can be purchased or sold; (vi) adding a requirement starting in March 2014 for employees to generally use certain approved brokers that provide Putnam with an electronic feed of transactions and statements for their personal brokerage accounts; and (vii) certain other changes. |
| |
| Item 3. Audit Committee Financial Expert: |
| |
| The Funds’ Audit and Compliance Committee is comprised solely of Trustees who are “independent” (as such term has been defined by the Securities and Exchange Commission (“SEC”) in regulations implementing Section 407 of the Sarbanes-Oxley Act (the “Regulations”)). The Trustees believe that each of the members of the Audit and Compliance Committee also possess a combination of knowledge and experience with respect to financial accounting matters, as well as other attributes, that qualify them for service on the Committee. In addition, the Trustees have determined that each of Mr. Leibler, Mr. Hill, Mr. Darretta and Ms. Baumann qualifies as an “audit committee financial expert” (as such term has been defined by the Regulations) based on their review of his or her pertinent experience and education. The SEC has stated that the designation or identification of a person as an audit committee financial expert pursuant to this Item 3 of Form N-CSR does not impose on such person any duties, obligations or liability that are greater than the duties, obligations and liability imposed on such person as a member of the Audit and Compliance Committee and the Board of Trustees in the absence of such designation or identification. |
| |
| Item 4. Principal Accountant Fees and Services: |
| |
| The following table presents fees billed in each of the last two fiscal years for services rendered to the fund by the fund’s independent auditor: |
| | | | | |
| Fiscal year ended | Audit Fees | Audit-Related Fees | Tax Fees | All Other Fees |
|
|
| | | | | |
| September 30, 2013 | $58,141 | $-- | $6,458 | $ — |
| September 30, 2012 | $56,702 | $-- | $6,300 | $ — |
| |
| For the fiscal years ended September 30, 2013 and September 30, 2012, the fund’s independent auditor billed aggregate non-audit fees in the amounts of $6,458 and $6,300 respectively, to the fund, Putnam Management and any entity controlling, controlled by or under common control with Putnam Management that provides ongoing services to the fund. |
| |
| Audit Fees represent fees billed for the fund’s last two fiscal years relating to the audit and review of the financial statements included in annual reports and registration statements, and other services that are normally provided in connection with statutory and regulatory filings or engagements. |
| |
| Audit-Related Fees represent fees billed in the fund’s last two fiscal years for services traditionally performed by the fund’s auditor, including accounting consultation for proposed transactions or concerning financial accounting and reporting standards and other audit or attest services not required by statute or regulation. |
| |
| Tax Fees represent fees billed in the fund’s last two fiscal years for tax compliance, tax planning and tax advice services. Tax planning and tax advice services include assistance with tax audits, employee benefit plans and requests for rulings or technical advice from taxing authorities. |
| |
| Pre-Approval Policies of the Audit and Compliance Committee. The Audit and Compliance Committee of the Putnam funds has determined that, as a matter of policy, all work performed for the funds by the funds’ independent auditors will be pre-approved by the Committee itself and thus will generally not be subject to pre-approval procedures. |
| |
| The Audit and Compliance Committee also has adopted a policy to pre-approve the engagement by Putnam Management and certain of its affiliates of the funds’ independent auditors, even in circumstances where pre-approval is not required by applicable law. Any such requests by Putnam Management or certain of its affiliates are typically submitted in writing to the Committee and explain, among other things, the nature of the proposed engagement, the estimated fees, and why this work should be performed by that particular audit firm as opposed to another one. In reviewing such requests, the Committee considers, among other things, whether the provision of such services by the audit firm are compatible with the independence of the audit firm. |
| |
| The following table presents fees billed by the fund’s independent auditor for services required to be approved pursuant to paragraph (c)(7)(ii) of Rule 2-01 of Regulation S-X. |
| | | | | |
| Fiscal year ended | Audit-Related Fees | Tax Fees | All Other Fees | Total Non-Audit Fees |
|
|
| | | | | |
| September 30, 2013 | $ — | $ — | $ — | $ — |
| | | | | |
| September 30, 2012 | $ — | $ — | $ — | $ — |
| |
| Item 5. Audit Committee of Listed Registrants |
| |
| Item 6. Schedule of Investments: |
| |
| The registrant’s schedule of investments in unaffiliated issuers is included in the report to shareholders in Item 1 above. |
| |
| Item 7. Disclosure of Proxy Voting Policies and Procedures For Closed-End Management Investment Companies: |
| |
| Item 8. Portfolio Managers of Closed-End Investment Companies |
| |
| Item 9. Purchases of Equity Securities by Closed-End Management Investment Companies and Affiliated Purchasers: |
| |
| Item 10. Submission of Matters to a Vote of Security Holders: |
| |
| Item 11. Controls and Procedures: |
| |
| (a) The registrant’s principal executive officer and principal financial officer have concluded, based on their evaluation of the effectiveness of the design and operation of the registrant’s disclosure controls and procedures as of a date within 90 days of the filing date of this report, that the design and operation of such procedures are generally effective to provide reasonable assurance that information required to be disclosed by the registrant in this report is recorded, processed, summarized and reported within the time periods specified in the Commission’s rules and forms. |
| |
| (b) Changes in internal control over financial reporting: Not applicable |
| |
| (a)(1) The Code of Ethics of The Putnam Funds, which incorporates the Code of Ethics of Putnam Investments, is filed herewith. |
| |
| (a)(2) Separate certifications for the principal executive officer and principal financial officer of the registrant as required by Rule 30a-2(a) under the Investment Company Act of 1940, as amended, are filed herewith. |
| |
| (b) The certifications required by Rule 30a-2(b) under the Investment Company Act of 1940, as amended, are filed herewith. |
| |
| Pursuant to the requirements of the Securities Exchange Act of 1934 and the Investment Company Act of 1940, the registrant has duly caused this report to be signed on its behalf by the undersigned, thereunto duly authorized. |
| |
| Putnam California Tax Exempt Income Fund |
| |
| By (Signature and Title): |
| |
| /s/Janet C. Smith
Janet C. Smith
Principal Accounting Officer
|
| |
| Pursuant to the requirements of the Securities Exchange Act of 1934 and the Investment Company Act of 1940, this report has been signed below by the following persons on behalf of the registrant and in the capacities and on the dates indicated. |
| |
| By (Signature and Title): |
| |
| /s/Jonathan S. Horwitz
Jonathan S. Horwitz
Principal Executive Officer
|
| |
| By (Signature and Title): |
| |
| /s/Steven D. Krichmar
Steven D. Krichmar
Principal Financial Officer
|