UNITED STATES
SECURITIES AND EXCHANGE COMMISSION
Washington, D.C. 20549
FORM N-CSR
CERTIFIED SHAREHOLDER REPORT OF REGISTERED
MANAGEMENT INVESTMENT COMPANIES
| Investment Company Act file number: (811- 03630 ) |
| Exact name of registrant as specified in charter: Putnam California Tax Exempt Income Fund |
Address of principal executive offices: One Post Office Square, Boston, Massachusetts 02109
| Name and address of agent for service: | Beth S. Mazor, Vice President |
| | One Post Office Square |
| | Boston, Massachusetts 02109 |
| |
| Copy to: | John W. Gerstmayr, Esq. |
| | Ropes & Gray LLP |
| | One International Place |
| | Boston, Massachusetts 02110 |
| |
| Registrant’s telephone number, including area code: | (617) 292-1000 | |
| |
| Date of fiscal year end: September 30, 2007 | | |
Date of reporting period: October 1, 2006— March 31, 2007
Item 1. Report to Stockholders:
The following is a copy of the report transmitted to stockholders pursuant to Rule 30e-1 under the Investment Company Act of 1940:

What makes Putnam different?

In 1830, Massachusetts Supreme Judicial Court Justice Samuel Putnam established The Prudent Man Rule, a legal foundation for responsible money management.
THE PRUDENT MAN RULE
All that can be required of a trustee to invest is that he shall conduct himself faithfully and exercise a sound discretion. He is to observe how men of prudence, discretion, and intelligence manage their own affairs, not in regard to speculation, but in regard to the permanent disposition of their funds, considering the probable income, as well as the probable safety of the capital to be invested.

A time-honored tradition in money management
Since 1937, our values have been rooted in a profound sense of responsibility for the money entrusted to us.
A prudent approach to investing
We use a research-driven team approach to seek consistent, dependable, superior investment results over time, although there is no guarantee a fund will meet its objectives.
Funds for every investment goal
We offer a broad range of mutual funds and other financial products so investors and their financial representatives can build diversified portfolios.
A commitment to doing what’s right for investors
We have below-average expenses and stringent investor protections, and provide a wealth of information about the Putnam funds.
Industry-leading service
We help investors, along with their financial representatives, make informed investment decisions with confidence.
Putnam
California Tax Exempt
Income Fund
3| 31| 07
Semiannual Report
| Message from the Trustees | 2 |
| About the fund | 4 |
| Report from the fund managers | 7 |
| Performance | 13 |
| Expenses | 16 |
| Portfolio turnover | 18 |
| Risk | 19 |
| Your fund’s management | 20 |
| Terms and definitions | 23 |
| Trustee approval of management contract | 25 |
| Other information for shareholders | 31 |
| Financial statements | 32 |
Cover photograph: © Richard H. Johnson
Message from the Trustees
Dear Fellow Shareholder
Although the global economy continues to demonstrate healthy growth, it has become evident that certain sectors of the U.S. economy have slowed somewhat. Volatility in the financial markets has been on the rise, reflecting increased uncertainty about the potential impact of problems in the housing market. However, we have also seen indications that inflation is stabilizing and the unemployment rate is declining. We consequently believe the resilience of the U.S. economy will enable it to weather this period of uncertainty.
As you may have heard, on February 1, 2007, Marsh & McLennan Companies, Inc. announced that it had signed a definitive agreement to sell its ownership interest in Putnam Investments Trust, the parent company of Putnam Management and its affiliates, to Great-West Lifeco Inc. Great-West Lifeco is a financial services holding company with operations in Canada, the United States, and Europe and is a member of the Power Financial Corporation group of companies. This transaction is subject to regulatory approvals and other conditions, including the approval of new management contracts by shareholders of a substantial number of Putnam funds at shareholder meetings scheduled for May 15, 2007. We currently expect the transaction to be completed by the middle of 2007.
Putnam’s team of investment and business professionals will continue to be led by Putnam President and Chief Executive Officer Ed Haldeman. Your Trustees have been actively involved through every step of the discussions, and we will continue in our role of overseeing the Putnam funds on your behalf.
2
In the following pages, members of your fund’s management team discuss the fund’s performance and strategies for the fiscal period ended March 31, 2007, and provide their outlook for the months ahead. As always, we thank you for your support of the Putnam funds.
Putnam California Tax Exempt Income Fund:
potential for tax-advantaged high current income
When investing in tax-exempt bonds, opportunities come in all shapes and sizes. This is especially true with Putnam California Tax Exempt Income Fund. The fund explores the vast California municipal bond market, seeking to deliver high current income and tax advantages.
Municipal bonds are typically issued by states and local municipalities to raise funds for building and maintaining public facilities. They are backed by either the issuing state, city, or town, or by revenues collected from usage fees. As a result, they have varying degrees of credit risk — that is, the risk that the issuer will not be able to repay the bond.
A municipal bond’s greatest benefit is that its income is generally exempt from federal income tax, and from state income tax for residents of the state in which the bond is issued. In California, this tax exemption is an especially powerful advantage because the state’s maximum income-tax rate is among the highest in the United States. And the sheer size of the California municipal bond market —it is one of the largest and most diverse in the country, encompassing virtually every sector of the municipal bond market — enables it to establish trends and shape demand in municipal bond markets across the country.
The fund seeks to capitalize on the opportunities available in California by investing in a range of bonds — primarily investment-grade —across various sectors. When deciding whether to invest in a bond, the fund’s management team primarily considers credit risk and interest-rate risk, as well as the risk that the bond will be prepaid. Once a bond has been purchased, the management team continues to monitor developments that affect the bond market, the specific sector, and the bond issuer.
The goal of the fund’s approach to research and active management is to stay a step ahead of the industry and pinpoint opportunities to adjust the fund’s holdings for the benefit of the fund and its shareholders.
The fund concentrates its investments by region and involves more risk than a fund that invests more broadly. Capital gains, if any, are taxable for federal and, in most cases, state purposes. For some investors, investment income may be subject to the federal alternative minimum tax. Income from federally exempt funds may be subject to state and local taxes. Funds that invest in bonds are subject to certain risks, including interest-rate risk, credit risk, and inflation risk. As interest rates rise, the prices of bonds fall. Long-term bonds are more exposed to interest-rate risk than short-term bonds. Unlike bonds, bond funds have ongoing fees and expenses. Tax-free funds may not be suitable for IRAs and other non-taxable accounts. Consult your tax advisor for more information.
Understanding
tax-equivalent yield
To understand the value of tax-free income, it is helpful to compare a municipal bond’s yield with the “tax-equivalent yield” — the before-tax yield that must be offered by a taxable bond in order to equal the municipal bond’s yield after taxes.
How to calculate tax-equivalent yield:
The tax-equivalent yield equals the municipal bond’s yield divided by “one minus the tax rate.” For example, if a municipal bond’s yield is 5%, then its tax-equivalent yield is 7.7%, assuming the maximum 35% federal tax rate for 2007.
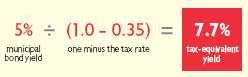
Results for investors subject to lower tax rates would not be as advantageous.
Municipal bonds may finance a range of projects in your
community and thus play a key role in its development.

Putnam California Tax Exempt Income Fund seeks as high a level of current income exempt from federal income tax and California personal income tax as believed to be consistent with preservation of capital. The fund invests typically in intermediate- to long-maturity municipal bonds issued in the state of California. Municipal bonds help finance public projects, such as schools, roads, water facilities, and hospitals. The fund may be appropriate for residents of California who seek income that is free from state and federal income tax.
Highlights
• For the six months ended March 31, 2007, Putnam California Tax Exempt Income Fund’s class A shares returned 1.78% without sales charges.
• The fund’s benchmark, the Lehman Municipal Bond Index, returned 1.93% .
• The average return for the fund’s Lipper category, California Municipal Debt Funds, was 1.77% .
• Additional fund performance, comparative performance, and Lipper data can be found in the performance section beginning on page 13.
Performance
Total return for class A shares for periods ended 3/31/07
Since the fund’s inception (4/29/83), average annual return is 7.20% before sales charge and 7.03% after sales charge.
| | Average annual return | Cumulative return |
|
| | Before sales charge | After sales charge | Before sales charge | After sales charge |
|
| 10 years | 5.23% | 4.82% | 66.43% | 60.10% |
|
| 5 years | 5.04 | 4.22 | 27.85 | 22.96 |
|
| 3 years | 3.80 | 2.46 | 11.85 | 7.55 |
|
| 1 year | 5.03 | 1.09 | 5.03 | 1.09 |
|
| 6 months | — | — | 1.78 | –2.06 |
|
Current performance may be lower or higher than the quoted past performance, which cannot guarantee future results. Share price, principal value, and return will fluctuate, and you may have a gain or a loss when you sell your shares. Performance of class A shares assumes reinvestment of distributions and does not account for taxes. After sales charge returns reflect a maximum 3.75% load. A 1% short-term trading fee may apply. To obtain the most recent month-end performance, visit www.putnam.com.
6
Report from the fund managers
The period in review
Relative calm characterized the environment for fixed-income investments during the six months ended March 31, 2007, as the Federal Reserve (the Fed) paused in its efforts to rein in the economy by raising interest rates. Since interest rates were still low by historic standards, investors continued to favor higher-yielding, lower-rated bonds; increased demand for these bonds drove up their prices during the period. Your fund’s position in higher-risk sectors of the municipal bond market, notably airline-related bonds, was smaller than that of many others in its peer group, dampening its relative performance. However, we maintain our belief in the prudence of this strategy, taken together with our efforts to diversify the portfolio across different market sectors. The fund’s focus on a single geographic area and its moderate exposure to longer-term bonds caused its results before sales charges to lag behind its nationally diversified benchmark, the Lehman Municipal Bo nd Index. However, our emphasis on tobacco settlement bonds contributed positively to performance and kept the fund’s results in line with the average for its Lipper category.
Market overview
Just before the beginning of the fund’s 2007 fiscal year, there was a major change in the Fed’s interest-rate policy. After 17 increases in the federal funds rate, the Fed suspended its credit-tightening program in August 2006, holding this benchmark rate for overnight loans between banks steady at 5.25% . The central bank’s rate policy has held rates steady since then. Statements from the Federal Open Market Committee, the central bank’s policy-setting panel, have indicated that future rate decisions will depend on whether the Fed concludes that inflation or slower growth represents the greater risk to the economy. Reflecting the uncertainty in the marketplace regarding the Fed’s policy direction, yields on shorter-maturity bonds increased, and short- and intermediate-term tax-exempt bonds underperformed comparable Treasuries.
7
An overall stable credit environment, coupled with solid demand from buyers searching for higher yields, contributed to the strong relative performance of lower-rated bonds. Among uninsured bonds in general and especially bonds rated Baa and below, lower-rated bonds performed better than higher-rated bonds. Investors should remember that bond prices move in the opposite direction of their yields, though, so as lower-rated bonds gained in value, their yields declined and the yield advantages that had initially drawn investor attention became less pronounced.
The performance of airline-related industrial development bonds (IDBs) was exceptional, as trends in domestic airline travel remained healthy. The health-care sector also posted solid results for the period, as securities issued by hospitals and long-term care facilities generally advanced. Tobacco settlement bonds strengthened as well.
Strategy overview
Given our expectation for rising interest rates, we maintained a short (defensive) portfolio duration relative to the fund’s Lipper peer group. This strategy contributed moderately to results since yields rose during the period. Duration is a measure of a fund’s sensitivity to changes in interest rates. Having a shorter-duration portfolio may help protect principal when interest rates rise, but it can reduce appreciation potential when rates fall. Later in the
Market sector performance
These indexes provide an overview of performance in different market sectors for the six months ended 3/31/07.
| Bonds | |
| Lehman Municipal Bond Index (tax-exempt bonds) | 1.93% |
|
| Lehman Aggregate Bond Index (broad bond market) | 2.76% |
|
| Lehman Government Bond Index (U.S. Treasury and agency securities) | 2.29% |
|
| Lehman Intermediate Treasury Bond Index (intermediate-maturity U.S. Treasury bonds) | 2.34% |
| |
| Equities | |
|
| S&P 500 Index (broad stock market) | 7.38% |
|
| S&P Utilities Index (utilities stocks) | 19.29% |
|
| Russell 2000 Index (small-company stocks) | 11.02% |
|
8
period, we began to extend the fund’s duration relative to its peer group by adding bonds with longer maturities.
We have increased our use of derivative instruments, such as interest-rate swap contracts, to execute several of the fund’s investment strategies. By enabling two parties to exchange, or swap, interest-rate payments at a future date, these contracts give us more control over the fund’s exposure to the upward and downward movement of interest rates without requiring an exchange of principal. The use of these derivatives lets us take positions that reflect our views on yield curve trends without needing to sell bonds we would like to retain, and can also reduce the fund’s transaction costs. This, in turn, increases our flexibility in managing the fund. During the period, our interest-rate swap positions detracted moderately from performance, but we nevertheless believe that the flexibility offered by such arrangements makes derivatives a valuable tool in our overall management strategy.
The fund’s underweight allocation to bonds at the lower-end of the credit spectrum — bonds rated Ba and below —detracted from results relative to the peer group, as bonds in this area of the market outperformed during the period.
Your fund’s holdings
In spite of the ongoing legal challenges faced by the tobacco industry, your fund’s emphasis on tobacco settlement bonds continued to contribute favorably to performance. The relatively high
Comparison of the fund’s maturity and duration
This chart compares changes in the fund’s average effective maturity (a weighted average of the holdings’ maturities) and its average effective duration (a measure of its sensitivity to interest-rate changes).

Average effective duration and average effective maturity take into account put and call features, where applicable, and reflect prepayments for mortgage-backed securities. Duration is usually shorter than maturity because it reflects interest payments on a bond prior to its maturity.
9
interest these bonds pay is secured by tobacco companies’ settlement obligations to the states, so they generally offer higher yields than bonds of comparable quality. As the litigation environment improved, investors have been bidding up the prices of these bonds. In addition to their income advantages, we believe tobacco settlement bonds provide valuable diversification, since their performance is not as closely tied to economic growth as are more economically sensitive holdings. The fund owns tobacco settlement bonds issued in California and Puerto Rico. (Interest paid on municipal bonds issued in Puerto Rico, an American protectorate, pass tax-free to residents of any state, providing some diversification for single-state municipal bond funds.)
Despite the Fed’s efforts to raise interest rates last year, rates are still low by historic standards, and corporate profits in many sectors remain healthy. As a result, investors have continued to bid up prices of higher-yielding bonds, particularly industrial development bonds (IDBs), which are issued by municipalities but backed by the credit of companies or institutions that benefit from the financing. Investor perceptions about the backing company’s health, or that of its industry group, affect the prices of IDBs, and the upward trend in corporate profits has consequently improved the perceived value of many issues. IDBs issued for airlines were
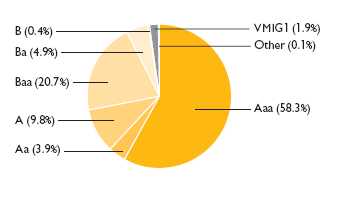
Credit quality overview
Credit qualities shown as a percentage of portfolio value as of 3/31/07. A bond rated Baa or higher (MIG3/VMIG3 or higher, for short-term debt) is considered investment grade. The chart reflects Moody’s ratings; percentages may include bonds not rated by Moody’s but considered by Putnam Management to be of comparable quality. Ratings will vary over time.
10
among the best performers during the period, but the fund had a relatively small position in this sector.
Sector diversification continues to be an important strategy for your fund. Rising interest rates and declining mortgage payments have benefited the single-family housing market, although attractive investments appropriate for this fund have been difficult to find. Property values are high throughout California, so we were pleased to be able to acquire some land-secured bonds issued for the city of Azusa. Home prices in this area have risen sharply over the past few years and prices in this development are likely to be high, making them vulnerable in a housing market downturn. However, this 300-acre parcel of land outside of Los Angeles is under development by four contractors with a large equity stake in the project. The development is expected to be complete within the next four years, and the bonds currently have an attractive ratin g.
The fund had an overweight position in the utilities sector during the period, partly because of the attractive yields relative to yields in other credit sectors. While credit spreads — the difference in yield between lower- and higher-rated bonds of comparable maturities — have narrowed, spreads in the power sector are less volatile in price than comparable issues, making them attractive in this tight credit spread environment. Bonds issued by Southern California Pacific Gas and Electric are one example of a power company IDB currently in the portfolio. Although we continue to favor this sector, we believe individual issues may now be nearing full valuation, and we may reduce the fund’s weighting to preserve its gains.
Please note that the holdings discussed in this report may not have been held by the fund for the entire period. Portfolio composition is subject to review in accordance with the fund’s investment strategy and may vary in the future.
11
The outlook for your fund
The following commentary reflects anticipated developments that could affect your fund over the next six months, as well as your management team’s plans for responding to them.
We believe the Fed is likely to continue to hold interest rates steady until more data becomes available to clarify whether inflation or slower growth is the greater risk to our currently stable economy. Therefore, while we anticipate that economic growth is likely to slow as 2007 unfolds, we plan to maintain a neutral duration strategy until longer-range Fed policy becomes clearer.
In our view, the extended rally among lower-rated, higher-yielding bonds may be in its final stages. We base this view, in part, on the fact that the difference in yield between Aaa-rated bonds and Baa-rated bonds — the highest and lowest investment-grade ratings, respectively — is at its narrowest point since late 1999. In other words, the higher-income advantage available to those willing to assume additional credit risk by investing in lower-rated bonds has diminished to the lowest level in over seven years. It has been our experience that when investor demand is this elevated, many high-yielding securities can become over-priced. We continue to believe that this is not the most opportune time to reach too far out in terms of maturity (i.e., extend duration by investing in longer dated securities) or too far down in quality in pursuit of higher income. Over the near term, we will focus on certain market sectors — notably, single-family housing and power company IDBs — where we believe the fund may benefit in an environment of moderating economic growth without being exposed to undue risk.
The views expressed in this report are exclusively those of Putnam Management. They are not meant as investment advice.
The fund concentrates its investments by region and involves more risk than a fund that invests more broadly. Capital gains, if any, are taxable for federal and, in most cases, state purposes. For some investors, investment income may be subject to the federal alternative minimum tax. Income from federally exempt funds may be subject to state and local taxes. Funds that invest in bonds are subject to certain risks, including interest-rate risk, credit risk, and inflation risk. As interest rates rise, the prices of bonds fall. Long-term bonds are more exposed to interest-rate risk than short-term bonds. Unlike bonds, bond funds have ongoing fees and expenses. Tax-free funds may not be suitable for IRAs and other non-taxable accounts. Consult your tax advisor for more information.
12
Your fund’s performance
This section shows your fund’s performance for periods ended March 31, 2007, the end of the first half of its current fiscal year. In accordance with regulatory requirements for mutual funds, we also include expense information taken from the fund’s current prospectus. Performance should always be considered in light of a fund’s investment strategy. Data represents past performance. Past performance does not guarantee future results. More recent returns may be less or more than those shown. Investment return and principal value will fluctuate, and you may have a gain or a loss when you sell your shares. For the most recent month-end performance, please visit www.putnam.com or call Putnam at 1-800-225-1581.
Fund performance
Total return for periods ended 3/31/07
| | Class A | | Class B | | Class C | | Class M | |
| (inception dates) | (4/29/83) | | (1/4/93) | | (7/26/99) | | (2/14/95) | |
|
| | NAV | POP | NAV | CDSC | NAV | CDSC | NAV | POP |
|
| Annual average | | | | | | | | |
| (life of fund) | 7.20% | 7.03% | 6.40% | 6.40% | 6.34% | 6.34% | 6.78% | 6.63% |
|
| 10 years | 66.43 | 60.10 | 56.02 | 56.02 | 53.55 | 53.55 | 61.33 | 56.05 |
| Annual average | 5.23 | 4.82 | 4.55 | 4.55 | 4.38 | 4.38 | 4.90 | 4.55 |
|
| 5 years | 27.85 | 22.96 | 23.78 | 21.83 | 22.97 | 22.97 | 26.05 | 21.84 |
| Annual average | 5.04 | 4.22 | 4.36 | 4.03 | 4.22 | 4.22 | 4.74 | 4.03 |
|
| 3 years | 11.85 | 7.55 | 9.59 | 6.76 | 9.09 | 9.09 | 10.76 | 7.08 |
| Annual average | 3.80 | 2.46 | 3.10 | 2.20 | 2.94 | 2.94 | 3.47 | 2.31 |
|
| 1 year | 5.03 | 1.09 | 4.28 | –0.72 | 4.17 | 3.17 | 4.73 | 1.41 |
|
| 6 months | 1.78 | –2.06 | 1.46 | –3.51 | 1.37 | 0.37 | 1.63 | –1.75 |
|
Current performance may be lower or higher than the quoted past performance, which cannot guarantee future results. After sales charge returns (public offering price, or POP) for class A and M shares reflect a maximum 3.75% and 3.25% load, respectively. Class B share returns reflect the applicable contingent deferred sales charge (CDSC), which is 5% in the first year, declining to 1% in the sixth year, and is eliminated thereafter. Class C shares reflect a 1% CDSC for the first year and is eliminated thereafter. Performance for class B, C, and M shares before their inception is derived from the historical performance of class A shares, adjusted for the applicable sales charge (or CDSC) and the higher operating expenses for such shares.
A 1% short-term trading fee may be applied to shares exchanged or sold within 7 days of purchase.
13
Comparative index returns
For periods ended 3/31/07
| | | Lipper California |
| | Lehman Municipal | Municipal Debt Funds |
| | Bond Index | category average* |
|
| Annual average | | |
| (life of fund) | 7.66% | 7.20% |
|
| 10 years | 76.83 | 67.19 |
| Annual average | 5.87 | 5.26 |
|
| 5 years | 30.71 | 28.57 |
| Annual average | 5.50 | 5.14 |
|
| 3 years | 12.36 | 12.70 |
| Annual average | 3.96 | 4.06 |
|
| 1 year | 5.43 | 5.05 |
|
| 6 months | 1.93 | 1.77 |
|
Index and Lipper results should be compared to fund performance at net asset value.
* Over the 6-month, 1-year, 3-year, 5-year, 10-year, and life-of-fund periods ended 3/31/07, there were 116, 116, 107, 94, 69, and 3 funds, respectively, in this Lipper category.
14
Fund price and distribution information
For the six-month period ended 3/31/07
| Distributions* | Class A | | Class B | Class C | Class M |
|
| Number | 6 | 6 | 6 | 6 |
|
| Income1 | $0.167334 | $0.141185 | $0.135493 | $0.154957 |
|
| Capital gains2 | | | | | | |
|
| Long-term | 0.023000 | 0.023000 | 0.023000 | 0.023000 |
|
| Short-term | 0.003500 | 0.003500 | 0.003500 | 0.003500 |
|
| Total | $0.193834 | $0.167685 | $0.161993 | $0.181457 |
|
| Share value: | NAV | POP | NAV | NAV | NAV | POP |
|
| 9/30/06 | $8.23 | $8.55 | $8.22 | $8.26 | $8.21 | $8.49 |
|
| 3/31/07 | 8.18 | 8.50 | 8.17 | 8.21 | 8.16 | 8.43 |
|
| Current yield (end of period) | | | | | | |
|
| Current dividend rate3 | 4.06% | 3.91% | 3.42% | 3.26% | 3.77% | 3.65% |
|
| Taxable equivalent4 | 6.96 | 6.71 | 5.87 | 5.59 | 6.47 | 6.26 |
|
| Current 30-day SEC yield5 | 3.42 | 3.29 | 2.78 | 2.63 | 3.13 | 3.03 |
|
| Taxable equivalent4 | 5.87 | 5.64 | 4.77 | 4.51 | 5.37 | 5.20 |
|
* Dividend sources are estimated and may vary based on final tax calculations after the fund’s fiscal year-end.
1 For some investors, investment income may be subject to the federal alternative minimum tax. Income from federally exempt funds may be subject to state and local taxes.
2 Capital gains, if any, are taxable for federal and, in most cases, state purposes.
3 Most recent distribution, excluding capital gains, annualized and divided by NAV or POP at end of period.
4 Assumes maximum 41.70% federal and state combined tax rate for 2007. Results for investors subject to lower tax rates would not be as advantageous.
5 Based only on investment income, calculated using SEC guidelines.
Fund’s annual operating expenses
For the fiscal year ended 9/30/06
| | Class A | Class B | Class C | Class M |
|
| Total annual fund operating expenses | 0.75% | 1.39% | 1.54% | 1.04% |
|
Expense information in this table is taken from the most recent prospectus, is subject to change, and may differ from that shown in the next section and in the financial highlights of this report.
15
Your fund’s expenses
As a mutual fund investor, you pay ongoing expenses, such as management fees, distribution fees (12b-1 fees), and other expenses. Using the information below, you can estimate how these expenses affect your investment and compare them with the expenses of other funds. You may also pay one-time transaction expenses, including sales charges (loads) and redemption fees, which are not shown in this section and would have resulted in higher total expenses. For more information, see your fund’s prospectus or talk to your financial advisor.
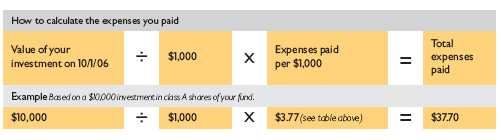
Review your fund’s expenses
The table below shows the expenses you would have paid on a $1,000 investment in Putnam California Tax Exempt Income Fund from October 1, 2006, to March 31, 2007. It also shows how much a $1,000 investment would be worth at the close of the period, assuming actual returns and expenses.
| | Class A | Class B | Class C | Class M |
|
| Expenses paid per $1,000* | $ 3.77 | $ 7.03 | $ 7.78 | $ 5.28 |
|
| Ending value (after expenses) | $1,017.80 | $1,014.60 | $1,013.70 | $1,016.30 |
|
* Expenses for each share class are calculated using the fund’s annualized expense ratio for each class, which represents the ongoing expenses as a percentage of average net assets for the six months ended 3/31/07. The expense ratio may differ for each share class (see the last table in this section). Expenses are calculated by multiplying the expense ratio by the average account value for the period; then multiplying the result by the number of days in the period; and then dividing that result by the number of days in the year.
Estimate the expenses you paid
To estimate the ongoing expenses you paid for the six months ended March 31, 2007, use the calculation method below. To find the value of your investment on October 1, 2006, go to www.putnam.com and log on to your account. Click on the “Transaction History” tab in your Daily Statement and enter 10/01/2006 in both the “from” and “to” fields. Alternatively, call Putnam at 1-800-225-1581.
16
Compare expenses using the SEC’s method
The Securities and Exchange Commission (SEC) has established guidelines to help investors assess fund expenses. Per these guidelines, the table below shows your fund’s expenses based on a $1,000 investment, assuming a hypothetical 5% annualized return. You can use this information to compare the ongoing expenses (but not transaction expenses or total costs) of investing in the fund with those of other funds. All mutual fund shareholder reports will provide this information to help you make this comparison. Please note that you cannot use this information to estimate your actual ending account balance and expenses paid during the period.
| | Class A | Class B | Class C | Class M |
|
| Expenses paid per $1,000* | $ 3.78 | $ 7.04 | $ 7.80 | $ 5.29 |
|
| Ending value (after expenses) | $1,021.19 | $1,017.95 | $1,017.20 | $1,019.70 |
|
* Expenses for each share class are calculated using the fund’s annualized expense ratio for each class, which represents the ongoing expenses as a percentage of average net assets for the six months ended 3/31/07. The expense ratio may differ for each share class (see the last table in this section). Expenses are calculated by multiplying the expense ratio by the average account value for the period; then multiplying the result by the number of days in the period; and then dividing that result by the number of days in the year.
Compare expenses using industry averages
You can also compare your fund’s expenses with the average of its peer group, as defined by Lipper, an independent fund-rating agency that ranks funds relative to others that Lipper considers to have similar investment styles or objectives. The expense ratio for each share class shown below indicates how much of your fund’s average net assets have been used to pay ongoing expenses during the period.
| | Class A | Class B | Class C | Class M |
| Your fund’s annualized expense ratio | 0.75% | 1.40% | 1.55% | 1.05% |
|
| Average annualized expense ratio | | | | |
| for Lipper peer group* | 0.81% | 1.46% | 1.61% | 1.11% |
|
* Simple average of the expenses of all front-end load funds in the fund’s Lipper peer group, calculated in accordance with Lipper’s standard method for comparing fund expenses (excluding 12b-1 fees and without giving effect to any expense offset and brokerage service arrangements that may reduce fund expenses). This average reflects each fund’s expenses for its most recent fiscal year available to Lipper as of 3/31/07. To facilitate comparison, Putnam has adjusted this average to reflect the 12b-1 fees carried by each class of shares. The peer group may include funds that are significantly smaller or larger than the fund, which may limit the comparability of the fund’s expenses to the simple average, which typically is higher than the asset-weighted average.
17
Your fund’s
portfolio turnover
Putnam funds are actively managed by teams of experts who buy and sell securities based on intensive analysis of companies, industries, economies, and markets. Portfolio turnover is a measure of how often a fund’s managers buy and sell securities for your fund. A portfolio turnover of 100%, for example, means that the managers sold and replaced securities valued at 100% of a fund’s assets within a one-year period. Funds with high turnover may be more likely to generate capital gains and dividends that must be distributed to shareholders as taxable income. High turnover may also cause a fund to pay more brokerage commissions and other transaction costs, which may detract from performance.
Funds that invest in bonds or other fixed-income instruments may have higher turnover than funds that invest only in stocks. Short-term bond funds tend to have higher turnover than longer-term bond funds, because shorter-term bonds will mature or be sold more frequently than longer-term bonds. You can use the table below to compare your fund’s turnover with the average turnover for funds in its Lipper category.
Turnover comparisons
Percentage of holdings that change every year
| | 2006 | 2005 | 2004 | 2003 | 2002 |
| Putnam California Tax | | | | | |
| Exempt Income Fund | 12% | 21% | 13% | 22% | 7% |
|
| Lipper California Municipal | | | | | |
| Debt Funds category average | 22% | 17% | 24% | 31% | 23% |
|
Turnover data for the fund is calculated based on the fund’s fiscal-year period, which ends on September 30. Turnover data for the fund’s Lipper category is calculated based on the average of the turnover of each fund in the category for its fiscal year ended during the indicated year. Fiscal years vary across funds in the Lipper category, which may limit the comparability of the fund’s portfolio turnover rate to the Lipper average. Comparative data for 2006 is based on information available as of 12/31/06.
18
Your fund’s risk
This risk comparison is designed to help you understand how your fund compares with other funds. The comparison utilizes a risk measure developed by Morningstar, an independent fund-rating agency. This risk measure is referred to as the fund’s Morningstar Risk.
Your fund’s Morningstar® Risk
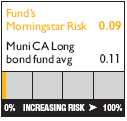
Your fund’s Morningstar Risk is shown alongside that of the average fund in its Morningstar category. The risk bar broadens the comparison by translating the fund’s Morningstar Risk into a percentile, which is based on the fund’s ranking among all funds rated by Morningstar as of March 31, 2007. A higher Morningstar Risk generally indicates that a fund’s monthly returns have varied more widely.
Morningstar determines a fund’s Morningstar Risk by assessing variations in the fund’s monthly returns — with an emphasis on downside variations — over a 3-year period, if available. Those measures are weighted and averaged to produce the fund’s Morningstar Risk. The information shown is provided for the fund’s class A shares only; information for other classes may vary. Morningstar Risk is based on historical data and does not indicate future results. Morningstar does not purport to measure the risk associated with a current investment in a fund, either on an absolute basis or on a relative basis. Low Morningstar Risk does not mean that you cannot lose money on an investment in a fund. Copyright 2007 Morningstar, Inc. All Rights Reserved. The information contained herein (1) is proprietary to Morningstar and/or its content providers; (2) may not be copied or distributed; and (3) is not warranted to be accurate, complete, or timely. Neither Morningstar nor its content providers are responsible for any damages or losses arising from any use of this information.
19
Your fund’s management
Your fund is managed by the members of the Putnam Tax Exempt Fixed-Income Team. Thalia Meehan is the Portfolio Leader, and Paul Drury, Brad Libby, and Susan McCormack are Portfolio Members of your fund. The Portfolio Leader and Portfolio Members coordinate the team’s management of the fund.
For a complete listing of the members of the Putnam Tax Exempt Fixed-Income Team, including those who are not Portfolio Leaders or Portfolio Members of your fund, visit Putnam’s Individual Investor Web site at www.putnam.com.
Investment team fund ownership
The table below shows how much the fund’s current Portfolio Leader and Portfolio Members have invested in the fund and in all Putnam mutual funds (in dollar ranges). Information shown is as of March 31, 2007, and March 31, 2006.
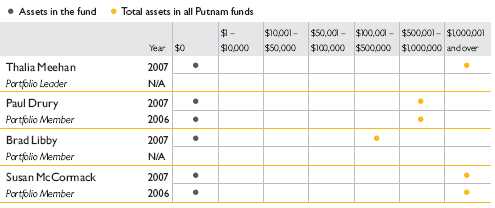
N/A indicates the individual was not a Portfolio Leader or Portfolio Member as of 3/31/06.
Trustee and Putnam employee fund ownership
As of March 31, 2007, all of the Trustees of the Putnam funds owned fund shares. The table below shows the approximate value of investments in the fund and all Putnam funds as of that date by the Trustees and Putnam employees. These amounts include investments by the Trustees’ and employees’ immediate family members and investments through retirement and deferred compensation plans.
| | | Total assets in |
| | Assets in the fund | all Putnam funds |
|
| Trustees | $36,000 | $ 98,000,000 |
|
| Putnam employees | $16,000 | $458,000,000 |
|
20
Fund manager compensation
The total 2006 fund manager compensation that is attributable to your fund is approximately $580,000. This amount includes a portion of 2006 compensation paid by Putnam Management to the fund managers listed in this section for their portfolio management responsibilities, calculated based on the fund assets they manage taken as a percentage of the total assets they manage. The compensation amount also includes a portion of the 2006 compensation paid to the Chief Investment Officer of the team and the Group Chief Investment Officer of the fund’s broader investment category for their oversight responsibilities, calculated based on the fund assets they oversee taken as a percentage of the total assets they oversee. This amount does not include compensation of other personnel involved in research, trading, administration, systems, compliance, or fund operations; nor does it include non-compensation costs. These percentages are determined as of the fund’s fiscal period-end. For personnel who joined Putnam Management during or after 2006, the calculation reflects annualized 2006 compensation or an estimate of 2007 compensation, as applicable.
Other Putnam funds managed by the Portfolio Leader and Portfolio Members
Thalia Meehan is the Portfolio Leader, and Paul Drury, Brad Libby, and Susan McCormack are Portfolio Members, of Putnam’s open-end tax-exempt funds for the following states: Arizona, Massachusetts, Michigan, Minnesota, New Jersey, New York, Ohio, and Pennsylvania. The same group also manages Putnam AMT-Free Insured Municipal Fund, Putnam Investment Grade Municipal Trust, Putnam Municipal Bond Fund, Putnam Municipal Opportunities Trust, Putnam New York Investment Grade Municipal Trust, and Putnam Tax Exempt Income Fund.
Paul Drury is the Portfolio Leader, and Brad Libby, Susan McCormack, and Thalia Meehan are Portfolio Members, of Putnam High Yield Municipal Trust, Putnam Managed Municipal Income Trust, Putnam Tax-Free Health Care Fund, and Putnam Tax-Free High Yield Fund.
Thalia Meehan, Paul Drury, Brad Libby, and Susan McCormack may also manage other accounts and variable trust funds advised by Putnam Management or an affiliate.
Changes in your fund’s Portfolio Leader and Portfolio Members
During the year ended March 31, 2007, Brad Libby became a Portfolio Member, and Thalia Meehan became a Portfolio Member and then Portfolio Leader, of your fund. These changes followed the departure of Portfolio Leaders David Hamlin and James St. John from your fund’s management team.
21
Putnam fund ownership by Putnam’s Executive Board
The table below shows how much the members of Putnam’s Executive Board have invested in all Putnam mutual funds (in dollar ranges). Information shown is as of March 31, 2007, and March 31, 2006.
| | | | $1 – | | $10,001 – | | $50,001 – | | $100,001 – | | $500,001 – | $1,000,001 |
| | Year | $0 | $10,000 | | $50,000 | | $100,000 | | $500,000 | | $1,000,000 | and over |
|
| Philippe Bibi | 2007 | | | | | | | | | | | • |
|
|
| Chief Technology Officer | 2006 | | | | | | | | | | | • |
|
| Joshua Brooks | 2007 | | | | | | | | | | | • |
|
|
| Deputy Head of Investments | 2006 | | | | | | | | | | | • |
|
| William Connolly | 2007 | | | | | | | | | | | • |
|
|
| Head of Retail Management | 2006 | | | | | | | | | | | • |
|
| Kevin Cronin | 2007 | | | | | | | | | | | • |
|
|
| Head of Investments | 2006 | | | | | | | | | | | • |
|
| Charles Haldeman, Jr. | 2007 | | | | | | | | | | | • |
|
|
| President and CEO | 2006 | | | | | | | | | | | • |
|
| Amrit Kanwal | 2007 | | | | | | | | | | • | |
|
|
| Chief Financial Officer | 2006 | | | | | | | | • | | | |
|
| Steven Krichmar | 2007 | | | | | | | | | | | • |
|
|
| Chief of Operations | 2006 | | | | | | | | | | • | |
|
| Francis McNamara, III | 2007 | | | | | | | | | | | • |
|
|
| General Counsel | 2006 | | | | | | | | | | | • |
|
| Jeffrey Peters | 2007 | | | | | | | | | | | • |
|
|
| Head of International Business | N/A | | | | | | | | | | | |
|
| Richard Robie, III | 2007 | | | | | | | | | | • | |
|
|
| Chief Administrative Officer | 2006 | | | | | | | | | | • | |
|
| Edward Shadek | 2007 | | | | | | | | | | | • |
|
|
| Deputy Head of Investments | 2006 | | | | | | | | | | | • |
|
| Sandra Whiston | 2007 | | | | | | | | | | | • |
|
|
| Head of Institutional Management | 2006 | | | | | | | | | | • | |
|
| |
| N/A indicates the individual was not a member of Putnam’s Executive Board as of 3/31/06. | | | | | |
22
Terms and definitions
Important terms
Total return shows how the value of the fund’s shares changed over time, assuming you held the shares through the entire period and reinvested all distributions in the fund.
Net asset value (NAV) is the price, or value, of one share of a mutual fund, without a sales charge. NAVs fluctuate with market conditions. NAV is calculated by dividing the net assets of each class of shares by the number of outstanding shares in the class.
Public offering price (POP) is the price of a mutual fund share plus the maximum sales charge levied at the time of purchase. POP performance figures shown here assume the 3.75% maximum sales charge for class A shares and 3.25% for class M shares.
Contingent deferred sales charge (CDSC) is generally a charge applied at the time of the redemption of class B or C shares and assumes redemption at the end of the period. Your fund’s class B CDSC declines from a 5% maximum during the first year to 1% during the sixth year. After the sixth year, the CDSC no longer applies. The CDSC for class C shares is 1% for one year after purchase.
Share classes
Class A shares are generally subject to an initial sales charge and no CDSC (except on certain redemptions of shares bought without an initial sales charge).
Class B shares are not subject to an initial sales charge. They may be subject to a CDSC.
Class C shares are not subject to an initial sales charge and are subject to a CDSC only if the shares are redeemed during the first year.
Class M shares have a lower initial sales charge and a higher 12b-1 fee than class A shares and no CDSC.
23
Comparative indexes
Lehman Aggregate Bond Index is an unmanaged index of U.S. investment-grade fixed-income securities.
Lehman Government Bond Index is an unmanaged index of U.S. Treasury and agency securities.
Lehman Intermediate Treasury Bond Index is an unmanaged index of U.S. Treasury securities with maturities between 1 and 10 years.
Lehman Municipal Bond Index is an unmanaged index of long-term fixed-rate investment-grade tax-exempt bonds.
Russell 2000 Index is an unmanaged index of the 2,000 smallest companies in the Russell 3000 Index.
S&P 500 Index is an unmanaged index of common stock performance.
S&P Utilities Index is an unmanaged index of common stocks issued by utility companies.
Indexes assume reinvestment of all distributions and do not account for fees. Securities and performance of a fund and an index will differ. You cannot invest directly in an index.
Lipper is a third-party industry-ranking entity that ranks mutual funds. Its rankings do not reflect sales charges. Lipper rankings are based on total return at net asset value relative to other funds that have similar current investment styles or objectives as determined by Lipper. Lipper may change a fund’s category assignment at its discretion. Lipper category averages reflect performance trends for funds within a category.
24
Trustee approval of
management contract
General conclusions
The Board of Trustees of the Putnam funds oversees the management of each fund and, as required by law, determines annually whether to approve the continuance of your fund’s management contract with Putnam Management. In this regard, the Board of Trustees, with the assistance of its Contract Committee consisting solely of Trustees who are not “interested persons” (as such term is defined in the Investment Company Act of 1940, as amended) of the Putnam funds (the “Independent Trustees”), requests and evaluates all information it deems reasonably necessary under the circumstances. Over the course of several months ending in June 2006, the Contract Committee met four times to consider the information provided by Putnam Management and other information developed with the assistance of the Board’s independent counsel and independent staff. The Contract Committee reviewed and discussed key aspects of this information with all of the Independe nt Trustees. Upon completion of this review, the Contract Committee recommended, and the Independent Trustees approved, the continuance of your fund’s management contract, effective July 1, 2006.
This approval was based on the following conclusions:
• That the fee schedule in effect for your fund represented reasonable compensation in light of the nature and quality of the services being provided to the fund, the fees paid by competitive funds and the costs incurred by Putnam Management in providing such services, and
• That such fee schedule represented an appropriate sharing between fund shareholders and Putnam Management of such economies of scale as may exist in the management of the fund at current asset levels.
These conclusions were based on a comprehensive consideration of all information provided to the Trustees and were not the result of any single factor. Some of the factors that figured particularly in the Trustees’ deliberations and how the Trustees considered these factors are described below, although individual Trustees may have evaluated the information presented differently, giving different weights to various factors. It is also important to recognize that the fee arrangements for your fund and the other Putnam funds are the result of many years of review and discussion between the Independent Trustees and Putnam Management, that certain aspects of such arrangements may receive greater scrutiny in some years than others, and that the Trustees’ conclusions may be based, in part, on their consideration of these same arrangements in prior years.
25
Management fee schedules and categories; total expenses
The Trustees reviewed the management fee schedules in effect for all Putnam funds, including fee levels and breakpoints, and the assignment of funds to particular fee categories. In reviewing fees and expenses, the Trustees generally focused their attention on material changes in circumstances — for example, changes in a fund’s size or investment style, changes in Putnam Management’s operating costs, or changes in competitive practices in the mutual fund industry — that suggest that consideration of fee changes might be warranted. The Trustees concluded that the circumstances did not warrant changes to the management fee structure of your fund, which had been carefully developed over the years, re-examined on many occasions and adjusted where appropriate. The Trustees focused on two areas of particular interest, as discussed further below:
• Competitiveness. The Trustees reviewed comparative fee and expense information for competitive funds, which indicated that, in a custom peer group of competitive funds selected by Lipper Inc., your fund ranked in the 36th percentile in management fees and in the 12th percentile in total expenses (less any applicable 12b-1 fees) as of December 31, 2005 (the first percentile being the least expensive funds and the 100th percentile being the most expensive funds). (Because the fund’s custom peer group is smaller than the fund’s broad Lipper Inc. peer group, this expense information may differ from the Lipper peer expense information found elsewhere in this report.) The Trustees noted that expense ratios for a number of Putnam funds, which show the percentage of fund assets used to pay for management and administrative services, distribution (12b-1) fees and other expenses, had been increasing recently as a result of declining net assets and the natural operation of fee breakpoints.
The Trustees noted that the expense ratio increases described above were currently being controlled by expense limitations implemented in January 2004 and which Putnam Management, in consultation with the Contract Committee, has committed to maintain at least through 2007. These expense limitations give effect to a commitment by Putnam Management that the expense ratio of each open-end fund would be no higher than the average expense ratio of the competitive funds included in the fund’s relevant Lipper universe (exclusive of any applicable 12b-1 charges in each case). The Trustees observed that this commitment to limit fund expenses has served shareholders well since its inception. In order to ensure that the expenses of the Putnam funds continue to meet evolving competitive standards, the Trustees requested, and Putnam Management agreed, to implement an additional expense limitation for certain funds for the twelve months beginning January 1, 2007 equal to the average expense ratio (exclusive of 12b-1 charges) of a custom peer group of competitive funds selected by Lipper based on the size of the fund. This additional expense limitation will be applied to those open-end funds that had above-average expense ratios (exclusive of 12b-1 charges) based on the Lipper custom peer group data for the period ended December 31, 2005. This additional expense limitation will not be applied to your fund.
26
• Economies of scale. Your fund currently has the benefit of breakpoints in its management fee that provide shareholders with significant economies of scale, which means that the effective management fee rate of a fund (as a percentage of fund assets) declines as a fund grows in size and crosses specified asset thresholds. Conversely, as a fund shrinks in size — as has been the case for many Putnam funds in recent years — these breakpoints result in increasing fee levels. In recent years, the Trustees have examined the operation of the existing breakpoint structure during periods of both growth and decline in asset levels. The Trustees concluded that the fee schedules in effect for the funds represented an appropriate sharing of economies of scale at current asset levels. In reaching this conclusion, the Trustees considered the Contract Committee’s stated intent to continue to work with Putnam Management to plan for an eventual resumption in the growth of assets, including a study of potential economies that might be produced under various growth assumptions.
In connection with their review of the management fees and total expenses of the Putnam funds, the Trustees also reviewed the costs of the services to be provided and profits to be realized by Putnam Management and its affiliates from the relationship with the funds. This information included trends in revenues, expenses and profitability of Putnam Management and its affiliates relating to the investment management and distribution services provided to the funds. In this regard, the Trustees also reviewed an analysis of Putnam Management’s revenues, expenses and profitability with respect to the funds’ management contracts, allocated on a fund-by-fund basis. Because many of the costs incurred by Putnam Management in managing the funds are not readily identifiable to particular funds, the Trustees observed that the methodology for allocating costs is an important factor in evaluating Putnam Management’s costs and profitability, both as to the Putnam funds in the aggregate and as to individual funds. The Trustees reviewed Putnam Management’s cost allocation methodology with the assistance of independent consultants and concluded that this methodology was reasonable and well-considered.
Investment performance
The quality of the investment process provided by Putnam Management represented a major factor in the Trustees’ evaluation of the quality of services provided by Putnam Management under your fund’s management contract. The Trustees were assisted in their review of the Putnam funds’ investment process and performance by the work of the Investment Process Committee of the Trustees and the Investment Oversight Committees of the Trustees, which meet on a regular monthly basis with the funds’ portfolio teams throughout the year. The Trustees concluded that Putnam Management generally provides a high-quality investment process — as measured by the experience and skills of the individuals assigned to the management of fund portfolios, the resources made available to such personnel, and in general the ability of Putnam Management to attract and retain high-quality personnel — but also recognize that this does not guarantee favorable investment results for every fund in every time period.
27
The Trustees considered the investment performance of each fund over multiple time periods and considered information comparing each fund’s performance with various benchmarks and with the performance of competitive funds.
The Trustees noted the satisfactory investment performance of many Putnam funds. They also noted the disappointing investment performance of certain funds in recent years and discussed with senior management of Putnam Management the factors contributing to such underperformance and actions being taken to improve performance. The Trustees recognized that, in recent years, Putnam Management has made significant changes in its investment personnel and processes and in the fund product line to address areas of underperformance. In particular, they noted the important contributions of Putnam Management’s leadership in attracting, retaining and supporting high-quality investment professionals and in systematically implementing an investment process that seeks to merge the best features of fundamental and quantitative analysis. The Trustees indicated their intention to continue to monitor performance trends to assess the effectiveness of these changes and to evaluate whether additional changes to address areas of underperformance are warranted.
In the case of your fund, the Trustees considered that your fund’s class A share cumulative total return performance at net asset value was in the following percentiles of its Lipper Inc. peer group (Lipper California Municipal Debt Funds) (compared using tax-adjusted performance to recognize the different federal income tax treatment for capital gains distributions and exempt-interest distributions) for the one-, three- and five-year periods ended March 31, 2006 (the first percentile being the best performing funds and the 100th percentile being the worst performing funds):
| One-year period | Three-year period | Five-year period |
|
| 52nd | 38th | 45th |
(Because of the passage of time, these performance results may differ from the performance results for more recent periods shown elsewhere in this report. Over the one-, three- and five-year periods ended March 31, 2006, there were 122, 117, and 98 funds, respectively, in your fund’s Lipper peer group.* Past performance is no guarantee of future performance.)
As a general matter, the Trustees concluded that cooperative efforts between the Trustees and Putnam Management represent the most effective way to address investment performance problems. The Trustees noted that investors in the Putnam funds have, in effect, placed their trust in the Putnam organization, under the oversight of the funds’ Trustees, to make appropriate decisions regarding the management of the funds. Based on the responsiveness of Putnam Management in the recent past to Trustee concerns about investment performance,
* The percentile rankings for your fund’s class A share annualized total return performance in the Lipper California Municipal Debt Funds category for the one-, five- and ten-year periods ended March 31, 2007, were 53%, 57%, and 55%, respectively. Over the one-, five- and ten-year periods ended March 31, 2007, the fund ranked 61st out of 116, 54th out of 94, and 38th out of 69 funds, respectively. Unlike the information above, these rankings reflect performance before taxes. Note that this more recent information was not available when the Trustees approved the continuance of your fund’s management contract.
28
the Trustees concluded that it is preferable to seek change within Putnam Management to address performance shortcomings. In the Trustees’ view, the alternative of terminating a management contract and engaging a new investment adviser for an underperforming fund would entail significant disruptions and would not provide any greater assurance of improved investment performance.
Brokerage and soft-dollar allocations; other benefits
The Trustees considered various potential benefits that Putnam Management may receive in connection with the services it provides under the management contract with your fund. These include benefits related to brokerage and soft-dollar allocations, whereby a portion of the commissions paid by a fund for brokerage may be used to acquire research services that may be useful to Putnam Management in managing the assets of the fund and of other clients. The Trustees indicated their continued intent to monitor the potential benefits associated with the allocation of fund brokerage to ensure that the principle of seeking “best price and execution” remains paramount in the portfolio trading process.
The Trustees’ annual review of your fund’s management contract also included the review of its distributor’s contract and distribution plan with Putnam Retail Management Limited Partnership and the custodian agreement and investor servicing agreement with Putnam Fiduciary Trust Company, all of which provide benefits to affiliates of Putnam Management.
Comparison of retail and institutional fee schedules
The information examined by the Trustees as part of their annual contract review has included for many years information regarding fees charged by Putnam Management and its affiliates to institutional clients such as defined benefit pension plans, college endowments, etc. This information included comparison of such fees with fees charged to the funds, as well as a detailed assessment of the differences in the services provided to these two types of clients. The Trustees observed, in this regard, that the differences in fee rates between institutional clients and the funds are by no means uniform when examined by individual asset sectors, suggesting that differences in the pricing of investment management services to these types of clients reflect to a substantial degree historical competitive forces operating in separate market places. The Trustees considered the fact that fee rates across all asset sectors are higher on average for funds than for institutional clients, as well as the differences between the services that Putnam Management provides to the Putnam funds and those that it provides to institutional clients of the firm, but did not rely on such comparisons to any significant extent in concluding that the management fees paid by your fund are reasonable.
29
Approval of new management contracts in connection with pending change in control
As discussed in the “Message from the Trustees” at the beginning of this shareholder report, on February 1, 2007, Marsh & McLennan Companies, Inc. announced that it had signed a definitive agreement to sell its ownership interest in Putnam Investments Trust, the parent company of Putnam Management and its affiliates, to Great-West Lifeco Inc., a member of the Power Financial Corporation group of companies. This transaction is subject to regulatory approvals and other conditions, including the approval of new management contracts by shareholders of a substantial number of Putnam funds at shareholder meetings scheduled for May 15, 2007. The transaction is currently expected to be completed by the middle of 2007.
At an in-person meeting on February 8–9, 2007, the Trustees considered the approval of new management contracts for each Putnam fund proposed to become effective upon the closing of the transaction, and the filing of a preliminary proxy statement. At an in-person meeting on March 8-9, 2007, the Trustees considered the approval of the final forms of the proposed new management contracts for each Putnam fund and the proxy statement. They reviewed the terms of the proposed new management contracts and the differences between the proposed new management contracts and the current management contracts. They noted that the terms of the proposed new management contracts were substantially identical to the current management contracts, except for certain changes developed at the initiative of the Trustees and designed largely to address inconsistencies among various of the existing contracts, which had been developed and implemented at different times in the past. In considering the approval of the proposed new management contracts, the Trustees also considered, as discussed further in the proxy statement, various matters relating to the transaction. Finally, in considering the proposed new management contracts, the Trustees also took into account their deliberations and conclusions (discussed above in the preceding paragraphs of the “Trustee Approval of Management Contract” section) in connection with the most recent annual approval of the continuance of the Putnam funds’ management contracts effective July 1, 2006, and the extensive materials that they had reviewed in connection with that approval process. Based upon the foregoing considerations, on March 9, 2007, the Trustees, including all of the Independent Trustees, unanimously approved the proposed new management contracts and determined to recommend their approval to the shareholders of the Putnam funds.
30
Other information
for shareholders
Important notice regarding delivery of shareholder documents
In accordance with SEC regulations, Putnam sends a single copy of annual and semiannual shareholder reports, prospectuses, and proxy statements to Putnam shareholders who share the same address, unless a shareholder requests otherwise. If you prefer to receive your own copy of these documents, please call Putnam at 1-800-225-1581, and Putnam will begin sending individual copies within 30 days.
Proxy voting
Putnam is committed to managing our mutual funds in the best interests of our shareholders. The Putnam funds’ proxy voting guidelines and procedures, as well as information regarding how your fund voted proxies relating to portfolio securities during the 12-month period ended June 30, 2006, are available on the Putnam Individual Investor Web site, www.putnam.com/individual, and on the SEC’s Web site, www.sec.gov. If you have questions about finding forms on the SEC’s Web site, you may call the SEC at 1-800-SEC-0330. You may also obtain the Putnam funds’ proxy voting guidelines and procedures at no charge by calling Putnam’s Shareholder Services at 1-800-225-1581.
Fund portfolio holdings
The fund will file a complete schedule of its portfolio holdings with the SEC for the first and third quarters of each fiscal year on Form N-Q. Shareholders may obtain the fund’s Forms N-Q on the SEC’s Web site at www.sec.gov. In addition, the fund’s Forms N-Q may be reviewed and copied at the SEC’s Public Reference Room in Washington, D.C. You may call the SEC at 1-800-SEC-0330 for information about the SEC’s Web site or the operation of the Public Reference Room.
31
Financial statements
A guide to financial statements
These sections of the report, as well as the accompanying Notes, constitute the fund’s financial statements.
The fund’s portfolio lists all the fund’s investments and their values as of the last day of the reporting period. Holdings are organized by asset type and industry sector, country, or state to show areas of concentration and diversification.
Statement of assets and liabilities shows how the fund’s net assets and share price are determined. All investment and noninvestment assets are added together. Any unpaid expenses and other liabilities are subtracted from this total. The result is divided by the number of shares to determine the net asset value per share, which is calculated separately for each class of shares. (For funds with preferred shares, the amount subtracted from total assets includes the liquidation preference of preferred shares.)
Statement of operations shows the fund’s net investment gain or loss. This is done by first adding up all the fund’s earnings — from dividends and interest income — and subtracting its operating expenses to determine net investment income (or loss). Then, any net gain or loss the fund realized on the sales of its holdings — as well as any unrealized gains or losses over the period — is added to or subtracted from the net investment result to determine the fund’s net gain or loss for the fiscal period.
Statement of changes in net assets shows how the fund’s net assets were affected by the fund’s net investment gain or loss, by distributions to shareholders, and by changes in the number of the fund’s shares. It lists distributions and their sources (net investment income or realized capital gains) over the current reporting period and the most recent fiscal year-end. The distributions listed here may not match the sources listed in the Statement of operations because the distributions are determined on a tax basis and may be paid in a different period from the one in which they were earned. Dividend sources are estimated at the time of declaration. Actual results may vary. Any non-taxable return of capital cannot be determined until final tax calculations are completed after the end of the fund’s fiscal year.
Financial highlights provide an overview of the fund’s investment results, per-share distributions, expense ratios, net investment income ratios, and portfolio turnover in one summary table, reflecting the five most recent reporting periods. In a semiannual report, the highlight table also includes the current reporting period.
32
The fund’s portfolio 3/31/07 (Unaudited)
| Key to abbreviations | |
| AMBAC AMBAC Indemnity Corporation | IFB Inverse Floating Rate Bonds |
| COP Certificate of Participation | IF COP Inverse Floating Rate Certificates |
| FGIC Financial Guaranty Insurance Company | of Participation |
| FRB Floating Rate Bonds | MBIA MBIA Insurance Company |
| FRN Floating Rate Notes | U.S. Govt. Coll. U.S. Government Collateralized |
| FSA Financial Security Assurance | VRDN Variable Rate Demand Notes |
| G.O. Bonds General Obligation Bonds | XLCA XL Capital Assurance |
| MUNICIPAL BONDS AND NOTES (99.6%)* | | | |
|
| | Rating** | Principal amount | Value |
|
| California (95.0%) | | | |
| Assn. of Bay Area Governments (ABAG) | | | |
| Fin. Auth. COP (Odd Fellows Home), | | | |
| 6s, 8/15/24 | A+ | $ 1,000,000 | $ 1,018,310 |
| Alameda, Corridor Trans. Auth. Rev. Bonds, | | | |
| Ser. A, MBIA, 5 1/4s, 10/1/21 | Aaa | 9,500,000 | 9,948,020 |
| Alhambra, Unified School Dist. G.O. Bonds | | | |
| (Election of 2004), Ser. A, FGIC, 5s, 8/1/24 | Aaa | 1,825,000 | 1,937,110 |
| Anaheim, COP, MBIA, 6.2s, 7/16/23 | Aaa | 32,000,000 | 32,938,880 |
| Anaheim, City School Dist. G.O. Bonds | | | |
| (Election of 2002), MBIA, zero %, 8/1/24 | AAA | 5,000,000 | 2,340,400 |
| Anaheim, Pub. Fin. Auth. Rev. Bonds | | | |
| (Distr. Syst.), MBIA | | | |
| 5 1/4s, 10/1/23 | Aaa | 8,675,000 | 9,370,995 |
| 5 1/4s, 10/1/22 | Aaa | 6,700,000 | 7,247,457 |
| 5s, 10/1/29 | Aaa | 6,945,000 | 7,308,085 |
| Anaheim, Pub. Fin. Auth. Lease Rev. Bonds | | | |
| (Cap. Appn. Sub. Impt.), Ser. C, FSA, | | | |
| zero %, 9/1/30 | Aaa | 2,000,000 | 697,680 |
| (Pub. Impt.), Ser. C, FSA, zero %, 9/1/19 | Aaa | 2,770,000 | 1,639,812 |
| Anaheim, Unified High School Dist. | | | |
| G.O. Bonds, FSA, 4 3/4s, 8/1/24 | Aaa | 2,950,000 | 3,060,743 |
| Aromas-San Juan, Unified School Dist. | | | |
| G.O. Bonds, Ser. A, FGIC, zero %, 8/1/26 | Aaa | 1,475,000 | 628,911 |
| Azusa, Cmnty. Fac. Dist. Special Tax Bonds | | | |
| (Ser. 05-1 Improvement Area No. 1) | | | |
| 5s, 9/1/37 | BB–/P | 1,650,000 | 1,664,586 |
| 5s, 9/1/27 | BB–/P | 865,000 | 875,467 |
| Bay Area Toll Auth. of CA Rev. Bonds | | | |
| (San Francisco Bay Area), Ser. F, 5s, 4/1/20 | AA | 10,000,000 | 10,749,000 |
| Berryessa, Unified School Dist. G.O. Bonds | | | |
| (Election of 1999), Ser. C, FSA, zero %, 8/1/27 | Aaa | 1,315,000 | 535,429 |
| Burbank, Pub. Fin. Auth. Rev. Bonds (West | | | |
| Olive Redev.), AMBAC, 5s, 12/1/26 | Aaa | 3,390,000 | 3,533,804 |
33
| MUNICIPAL BONDS AND NOTES (99.6%)* continued | | |
|
| | Rating** | Principal amount | Value |
|
| California continued | | | |
| Burbank, Unified School Dist. G.O. Bonds | | | |
| (Election of 1997), Ser. C, FGIC, zero %, 8/1/18 | Aaa | $ 2,345,000 | $ 1,477,631 |
| CA Edl. Fac. Auth. Rev. Bonds | | | |
| (Stanford U.), Ser. Q, 5 1/4s, 12/1/32 | Aaa | 22,360,000 | 23,733,128 |
| (CA Institute of Technology), Ser. A, 5s, | | | |
| 10/1/32 (Prerefunded) | Aaa | 2,000,000 | 2,121,120 |
| (Claremont Graduate U.), Ser. A, 5s, 3/1/31 | A3 | 2,465,000 | 2,562,565 |
| (Lutheran U.), Ser. C, 5s, 10/1/29 | Baa1 | 1,500,000 | 1,549,170 |
| (Claremont Graduate U.), Ser. A, 5s, 3/1/26 | A3 | 1,200,000 | 1,257,276 |
| (Lutheran U.), Ser. C, 5s, 10/1/24 | Baa1 | 1,250,000 | 1,295,813 |
| (U. of the Pacific), 5s, 11/1/16 | A2 | 1,095,000 | 1,169,690 |
| (U. of the Pacific), 5s, 11/1/14 | A2 | 295,000 | 315,299 |
| (U. of the Pacific), 5s, 11/1/13 | A2 | 525,000 | 558,506 |
| (U. of the Pacific), 5s, 11/1/11 | A2 | 625,000 | 655,938 |
| (Lutheran U.), Ser. C, 4 1/2s, 10/1/19 | Baa1 | 2,830,000 | 2,864,102 |
| CA Hlth. Fac. Fin. Auth. Rev. Bonds | | | |
| (Sutter Hlth.), Ser. A, MBIA, 5 3/8s, 8/15/30 | Aaa | 1,600,000 | 1,649,600 |
| (Kaiser Permanente), Ser. A, 5s, 4/1/37 | A+ | 10,000,000 | 10,321,600 |
| (Lucile Salter Packard Hosp.), Ser. C, | | | |
| AMBAC, 5s, 8/15/24 | Aaa | 6,390,000 | 6,701,640 |
| (Stanford Hosp. & Clinics), Ser. A, | | | |
| 5s, 11/15/23 | A2 | 7,250,000 | 7,607,208 |
| Ser. B, AMBAC, 5s, 7/1/21 | Aaa | 3,500,000 | 3,502,310 |
| (Cedars Sinai Med. Ctr.), 5s, 11/15/15 | A2 | 2,650,000 | 2,851,374 |
| Ser. 5, MBIA, 5s, 7/1/14 | Aaa | 6,400,000 | 6,404,224 |
| CA Hsg. Fin. Agcy. Rev. Bonds | | | |
| (Home Mtge.), Ser. H, FGIC, 5 3/4s, 8/1/30 | Aaa | 6,000,000 | 6,450,840 |
| (Multi-Fam. Hsg. III), Ser. B, MBIA, | | | |
| 5 1/2s, 8/1/39 | Aaa | 1,650,000 | 1,690,557 |
| (Home Mtge.), Ser. I, 4.6s, 8/1/21 | Aa2 | 5,000,000 | 5,053,950 |
| CA Infrastructure & Econ. Dev. Bank | | | |
| Rev. Bonds | | | |
| (Bay Area Toll Bridges), AMBAC, 5s, 7/1/33 | | | |
| (Prerefunded) # | Aaa | 13,425,000 | 15,000,827 |
| (Bay Area Toll Bridges), Ser. A, FGIC, 5s, | | | |
| 7/1/29 (Prerefunded) | Aaa | 5,000,000 | 5,613,850 |
| (Science Ctr. Phase II), Ser. B, FGIC, | | | |
| 5s, 5/1/26 | AAA | 2,870,000 | 3,052,819 |
| (Science Ctr. Phase II), Ser. B, FGIC, | | | |
| 5s, 5/1/25 | AAA | 2,730,000 | 2,906,030 |
| (Science Ctr. Phase II), Ser. B, FGIC, | | | |
| 5s, 5/1/24 | AAA | 2,600,000 | 2,771,704 |
| CA Poll. Control Fin. Auth. VRDN (Southern Ca. | | | |
| Pacific Gas & Electric Corp.) | | | |
| Ser. E, 3.71s, 11/1/26 | A–1+ | 16,800,000 | 16,800,000 |
| Ser. F, 3.71s, 11/1/26 | A–1+ | 22,900,000 | 22,900,000 |
34
| MUNICIPAL BONDS AND NOTES (99.6%)* continued | | |
|
| | Rating** | Principal amount | Value |
|
| California continued | | | |
| CA State G.O. Bonds | | | |
| AMBAC, 5 1/2s, 4/1/11 | Aaa | $ 16,545,000 | $ 17,729,457 |
| 5 1/4s, 12/1/24 | A1 | 12,135,000 | 13,047,067 |
| 5 1/4s, 12/1/23 | A1 | 11,000,000 | 11,840,840 |
| 5 1/4s, 2/1/20 | A+ | 10,000,000 | 11,137,600 |
| MBIA, 5 1/8s, 2/1/27 | Aaa | 5,000,000 | 5,299,100 |
| MBIA, 5 1/8s, 2/1/26 | Aaa | 5,000,000 | 5,302,150 |
| 5 1/8s, 4/1/24 | A1 | 6,000,000 | 6,340,680 |
| 5 1/8s, 4/1/23 | A1 | 2,250,000 | 2,380,545 |
| 5.1s, 2/1/34 | A+ | 11,055,000 | 11,254,653 |
| 5s, 2/1/29 (Prerefunded) | A1 | 400,000 | 414,000 |
| 4 3/4s, 10/1/28 | A1 | 31,600,000 | 32,450,356 |
| 4 3/4s, 9/1/28 | A1 | 5,000,000 | 5,133,450 |
| AMBAC, 4 1/2s, 8/1/28 | Aaa | 25,000,000 | 25,097,250 |
| 4 1/2s, 10/1/26 | A1 | 11,200,000 | 11,128,096 |
| 4 1/2s, 8/1/26 | A1 | 15,000,000 | 14,903,400 |
| CA State Dept. of Wtr. Resources Rev. Bonds | | | |
| Ser. A, AMBAC, 5 1/2s, 5/1/15 | Aaa | 32,550,000 | 35,507,493 |
| Ser. A, AMBAC, 5 1/2s, 5/1/14 | Aaa | 11,000,000 | 12,026,190 |
| Ser. A, 5 1/4s, 5/1/20 (Prerefunded) | Aaa | 4,000,000 | 4,342,720 |
| Ser. W, FSA, 5 1/8s, 12/1/29 | Aaa | 5,000,000 | 5,219,350 |
| Ser. A, 5 1/8s, 5/1/19 (Prerefunded) | Aaa | 25,000,000 | 26,998,250 |
| Ser. A, 5 1/8s, 5/1/18 (Prerefunded) | Aaa | 20,000,000 | 21,598,600 |
| Ser. O, MBIA, 4 3/4s, 12/1/29 | Aaa | 23,000,000 | 23,020,700 |
| CA State Econ. Recvy. G.O. Bonds, Ser. A | | | |
| 5s, 7/1/17 | AA+ | 7,000,000 | 7,339,780 |
| 5s, 7/1/16 | AA+ | 4,000,000 | 4,202,160 |
| CA State Pub. Wks. Board Rev. Bonds | | | |
| (Dept. of Gen. Svcs. Butterfield), Ser. ST-A, | | | |
| 5 1/4s, 6/1/25 | A2 | 2,500,000 | 2,670,700 |
| (Dept. of Gen. Svcs. Cap East End), Ser. A, | | | |
| AMBAC, 5s, 12/1/27 | Aaa | 12,250,000 | 12,794,758 |
| (Dept. of Gen. Svcs. Butterfield), Ser. ST-A, | | | |
| 5s, 6/1/23 | A2 | 2,900,000 | 3,046,421 |
| (Dept. of Gen. Svcs. Butterfield), Ser. ST-A, | | | |
| 5s, 6/1/11 | A2 | 2,000,000 | 2,101,620 |
| CA State Pub. Wks. Board Lease Rev. Bonds | | | |
| Ser. A, MBIA, 6 1/2s, 9/1/17 | Aaa | 28,000,000 | 32,600,960 |
| (Dept. of Corrections-State Prisons), | | | |
| Ser. A, AMBAC, 5s, 12/1/19 | Aaa | 33,500,000 | 36,191,390 |
| CA State U. Foundation Rev. Bonds | | | |
| (Sacramento Auxiliary), Ser. A, MBIA, | | | |
| 5 1/2s, 10/1/37 (Prerefunded) | Aaa | 1,340,000 | 1,469,337 |
| CA Statewide Cmnty. Dev. Auth. Apt. Dev. | | | |
| Rev. Bonds (Irvine Apt. Cmntys.), Ser. A-4, | | | |
| 5 1/4s, 5/15/25 | BBB+ | 12,500,000 | 12,852,375 |
| CA Statewide Cmnty. Dev. Auth. Mandatory | | | |
| Put Bonds (Kaiser Permanente), Ser. B, | | | |
| 3.9s, 7/1/14 | A+ | 5,000,000 | 4,984,150 |
35
| MUNICIPAL BONDS AND NOTES (99.6%)* continued | | |
|
| | Rating** | Principal amount | Value |
|
| California continued | | | |
| CA Statewide Cmnty. Dev. Auth. Rev. Bonds | | | |
| (Huntington Memorial Hosp.), 5s, 7/1/22 | A+ | $ 7,020,000 | $ 7,397,395 |
| (Huntington Memorial Hosp.), 5s, 7/1/21 | A+ | 455,000 | 479,461 |
| (Huntington Memorial Hosp.), 5s, 7/1/20 | A+ | 4,820,000 | 5,079,123 |
| (Southern Ca. Edison Co.), Ser. D, FGIC, | | | |
| 4 1/4s, 11/1/33 | Aaa | 3,000,000 | 3,090,420 |
| (Thomas Jefferson School of Law), Ser. A, | | | |
| 4 7/8s, 10/1/35 | BBB– | 800,000 | 811,384 |
| CA Statewide Cmnty. Dev. Auth. Special Tax | | | |
| FRB (Hsg. Equity Res. — C), 5.2s, 12/1/29 | A– | 4,000,000 | 4,112,480 |
| CA Statewide Cmnty. Dev. Auth. Special Tax | | | |
| Rev. Bonds | | | |
| (Cmnty. Fac. Dist. No. 1-Zone 1C), | | | |
| 7 1/4s, 9/1/30 | BB/P | 2,270,000 | 2,444,949 |
| (Citrus Garden Apt. Project — D1), | | | |
| 5 1/4s, 7/1/22 | A | 1,630,000 | 1,691,565 |
| (Cmnty. Fac. Dist. No. 1-Zone 1B), | | | |
| zero %, 9/1/20 | BB/P | 1,615,000 | 664,847 |
| CA Statewide Cmntys., Dev. Auth. COP | | | |
| (The Internext Group), 5 3/8s, 4/1/30 | BBB– | 15,300,000 | 15,532,866 |
| CA Statewide Cmntys., Dev. Auth. Apt. | | | |
| Mandatory Put Bonds (Irvine Apt. Cmntys.), | | | |
| Ser. A-3, 5.1s, 5/17/10 | BBB+ | 11,000,000 | 11,311,960 |
| CA Statewide Cmntys., Dev. Auth. | | | |
| Multi-Fam. Rev. Bonds (Hsg. Equity Res.), | | | |
| Ser. B, 5.2s, 12/1/29 | A– | 5,850,000 | 6,014,502 |
| CA Statewide Fin. Auth. Tobacco Settlement | | | |
| Rev. Bonds, Class B, 5 5/8s, 5/1/29 | Baa3 | 3,590,000 | 3,754,745 |
| CA Tobacco Securitization Agcy. Rev. Bonds | | | |
| (Sonoma Cnty. Corp.), Ser. B, 5 1/2s, | | | |
| 6/1/30 (Prerefunded) | AAA/F | 5,000,000 | 5,438,450 |
| zero %, 6/1/21 | Baa3 | 10,000,000 | 8,655,800 |
| Castaic Lake, Wtr. Agcy. COP, Ser. C, MBIA | | | |
| 5s, 8/1/26 | Aaa | 3,450,000 | 3,656,034 |
| 5s, 8/1/25 | Aaa | 3,285,000 | 3,486,371 |
| 5s, 8/1/24 | Aaa | 3,130,000 | 3,326,846 |
| Central CA Joint Pwr. Hlth. Fin. Auth. COP | | | |
| (Cmnty. Hosp. of Central CA), 6s, 2/1/30 | Baa2 | 11,000,000 | 11,532,290 |
| Central Marin, Sanitation Agcy. Rev. Bonds, | | | |
| MBIA, 5s, 9/1/26 | Aaa | 3,000,000 | 3,208,890 |
| Chabot-Las Positas, Cmnty. College Dist. | | | |
| G.O. Bonds (Election of 2004), Ser. A, MBIA | | | |
| 5s, 8/1/26 (Prerefunded) | Aaa | 5,215,000 | 5,677,675 |
| 5s, 8/1/25 (Prerefunded) | Aaa | 3,000,000 | 3,266,160 |
| Chino Basin, Regl. Fin. Auth. Rev. Bonds, | | | |
| AMBAC, 5 3/4s, 8/1/22 | Aaa | 32,000,000 | 32,027,520 |
36
| MUNICIPAL BONDS AND NOTES (99.6%)* continued | | |
|
| | Rating** | Principal amount | Value |
|
| California continued | | | |
| Chula Vista, Cmnty. Fac. Dist. Special Tax | | | |
| Rev. Bonds | | | |
| (No. 06-1 Eastlake Woods Area), | | | |
| 6.2s, 9/1/33 | BBB/P | $ 3,750,000 | $ 4,006,200 |
| (No. 06-1 Eastlake Woods Area), | | | |
| 6.15s, 9/1/26 | BBB/P | 2,000,000 | 2,134,360 |
| (No. 97-3), 6.05s, 9/1/29 (Prerefunded) | BB+/P | 4,420,000 | 4,751,809 |
| (No. 07-1 Otay Ranch Village Eleven), | | | |
| 5 7/8s, 9/1/34 | BB/P | 2,600,000 | 2,745,860 |
| (No. 07-I Otay Ranch Village Eleven), | | | |
| 5.1s, 9/1/26 | BB/P | 375,000 | 383,134 |
| Chula Vista, Indl. Dev. Rev. Bonds (San Diego | | | |
| Gas), Ser. B, 5s, 12/1/27 | A1 | 5,000,000 | 5,213,850 |
| Colton, G.O. Bonds (Election of 2001), | | | |
| Ser. C, FGIC, 5 1/4s, 2/1/27 | Aaa | 2,500,000 | 2,697,600 |
| Commerce, Redev. Agcy. Rev. Bonds | | | |
| (Project 1), zero %, 8/1/21 | BBB | 66,780,000 | 29,074,676 |
| Contra Costa Cnty., Pub. Fin. Lease Rev. | | | |
| Bonds, Ser. A, MBIA, 4 3/4s, 6/1/25 | Aaa | 7,095,000 | 7,337,436 |
| Contra Costa, Home Mtge. Fin. Auth. Rev. | | | |
| Bonds, Ser. G, MBIA, zero %, 9/1/17 | | | |
| (Prerefunded) | Aaa | 35,000,000 | 18,031,300 |
| Corona, COP (Vista Hosp. Syst.), zero %, | | | |
| 7/1/29 (In default) (F) † | D/P | 10,000,000 | 110,000 |
| Delano, COP (Delano Regl. Med. Ctr.), | | | |
| 5.6s, 1/1/26 | BBB– | 19,700,000 | 20,216,534 |
| Duarte, COP, Ser. A | | | |
| 5 1/4s, 4/1/31 | A– | 7,000,000 | 7,204,820 |
| 5 1/4s, 4/1/24 | A3 | 7,500,000 | 7,723,800 |
| El Camino, Cmnty. College Dist. G.O. Bonds | | | |
| (Election of 2002), Ser. B, FGIC, 5s, 8/1/22 | Aaa | 2,345,000 | 2,522,118 |
| El Camino, Hosp. Dist. Rev. Bonds, Ser. A, | | | |
| AMBAC, 6 1/4s, 8/15/17 (Prerefunded) | Aaa | 10,725,000 | 12,224,141 |
| Folsom Cordova, Unified School Dist. Fac. | | | |
| Impt. G.O. Bonds (Dist. No. 1), Ser. A, | | | |
| MBIA, zero %, 10/1/23 | Aaa | 1,445,000 | 703,787 |
| Folsom, Special Tax Rev. Bonds (Cmnty. Facs. | | | |
| Dist. No. 10), 5 7/8s, 9/1/28 | BB/P | 1,150,000 | 1,197,150 |
| Foothill/Eastern Corridor Agcy. Rev. Bonds | | | |
| (CA Toll Roads) | | | |
| 5 3/4s, 1/15/40 | Baa3 | 19,000,000 | 19,919,980 |
| MBIA, 5 3/8s, 1/15/14 | Aaa | 5,000,000 | 5,280,550 |
| Gateway, Unified School Dist. COP, FSA | | | |
| zero %, 3/1/29 | AAA | 440,000 | 169,932 |
| zero %, 3/1/28 | AAA | 425,000 | 159,915 |
| zero %, 3/1/27 | AAA | 410,000 | 161,966 |
| zero %, 3/1/26 | AAA | 390,000 | 161,725 |
| zero %, 3/1/25 | AAA | 375,000 | 163,200 |
37
| MUNICIPAL BONDS AND NOTES (99.6%)* continued | | |
|
| | Rating** | Principal amount | Value |
|
| California continued | | | |
| Gateway, Unified School Dist. COP, FSA | | | |
| zero %, 3/1/24 | AAA | $ 360,000 | $ 174,474 |
| zero %, 3/1/23 | AAA | 345,000 | 165,790 |
| Golden State Tobacco Securitization Corp. | | | |
| Rev. Bonds | | | |
| Ser. A-4, 7.8s, 6/1/42 (Prerefunded) | AAA | 6,075,000 | 7,435,071 |
| Ser. 03 A-1, 6 1/4s, 6/1/33 (Prerefunded) | AAA | 18,225,000 | 20,145,915 |
| Ser. B, 5 1/2s, 6/1/33 (Prerefunded) | Aaa | 36,000,000 | 39,537,720 |
| Ser. A, 5s, 6/1/45 | A2 | 6,750,000 | 6,968,633 |
| Ser. A-1, 5s, 6/1/33 | BBB | 10,000,000 | 9,898,500 |
| Ser. 03 A-1, 5s, 6/1/21 (Prerefunded) | AAA | 12,290,000 | 12,328,959 |
| Ser. A-1, 4 1/2s, 6/1/27 | BBB | 26,175,000 | 25,563,029 |
| Golden West, School Fin. Auth. Rev. Bonds, | | | |
| Ser. A, MBIA | | | |
| zero %, 8/1/20 | Aaa | 2,000,000 | 1,131,600 |
| zero %, 2/1/20 | Aaa | 2,480,000 | 1,433,490 |
| Greenfield, Redev. Agcy. Tax Alloc. Bonds, | | | |
| AMBAC, 4 3/4s, 2/1/30 | Aaa | 4,865,000 | 4,998,885 |
| Grossmont, Unified High School Dist. G.O. | | | |
| Bonds (Election of 2004), FSA, zero %, 8/1/28 | Aaa | 2,250,000 | 874,688 |
| Huntington Beach, Cmnty. Fac. Dist. | | | |
| Special Tax (No. 2003-1 Huntington Ctr.) | | | |
| 5.85s, 9/1/33 | BB/P | 2,845,000 | 2,938,003 |
| 5.8s, 9/1/23 | BB/P | 1,000,000 | 1,032,830 |
| Irvine, Impt. Board Act of 1915 G.O. Bonds | | | |
| (Assmt. Dist. No. 03-19-Group 2), | | | |
| 5.45s, 9/2/23 | BB+/P | 1,000,000 | 1,031,820 |
| Irvine, Impt. Board Act of 1915 Special | | | |
| Assmt. Bonds | | | |
| (Assmt. Dist. No. 00-18-Group 2), | | | |
| 5.6s, 9/2/22 | BBB/P | 5,000,000 | 5,162,750 |
| (Assmt. No. 00-18 Group 3), 5.55s, 9/2/26 | BBB/P | 1,825,000 | 1,883,875 |
| (Assmt. No. 03-19 Group 4), 5s, 9/2/29 | BB+/P | 710,000 | 717,938 |
| Jurupa, Unified School Dist. G.O. Bonds, FGIC | | | |
| zero %, 8/1/24 | Aaa | 2,675,000 | 1,252,114 |
| zero %, 8/1/23 | Aaa | 1,470,000 | 721,197 |
| Kern, Cmnty. College Dist. G.O. Bonds | | | |
| (Election of 2002 — Safety Repair & Impt.), | | | |
| FSA, zero %, 11/1/29 | Aaa | 2,690,000 | 965,656 |
| La Quinta, Redev. Agcy. Tax Alloc. | | | |
| (Area No. 1), AMBAC, 5s, 9/1/21 | Aaa | 1,950,000 | 2,054,696 |
| Lake Elsinore, Pub. Fin. Auth. Tax Alloc. | | | |
| Rev. Bonds, Ser. C, 6.7s, 10/1/33 | BBB/P | 13,725,000 | 14,643,340 |
| Lake Elsinore, School Fin. Auth. Rev. | | | |
| Bonds, FSA | | | |
| 4 3/4s, 10/1/26 | Aaa | 1,595,000 | 1,649,645 |
| 4 3/4s, 10/1/25 | Aaa | 1,505,000 | 1,557,841 |
| 4 3/4s, 10/1/24 | Aaa | 1,415,000 | 1,463,478 |
| 4 3/4s, 10/1/23 | Aaa | 1,335,000 | 1,383,007 |
38
| MUNICIPAL BONDS AND NOTES (99.6%)* continued | | |
|
| | Rating** | Principal amount | Value |
|
| California continued | | | |
| Las Virgenes, Unified School Dist. G.O. Bonds | | | |
| Ser. A, FSA, 5s, 8/1/31 | Aaa | $ 5,000,000 | $ 5,325,600 |
| FSA, zero %, 11/1/23 | Aaa | 1,395,000 | 676,980 |
| Lodi, Unified School Dist. G.O. Bonds | | | |
| (Election of 2002), FSA | | | |
| 5s, 8/1/27 | Aaa | 3,555,000 | 3,739,576 |
| 5s, 8/1/26 | Aaa | 3,975,000 | 4,183,648 |
| 5s, 8/1/25 | Aaa | 3,725,000 | 3,922,649 |
| Los Angeles Cnty., Cap. Asset Leasing Corp. | | | |
| Lease Rev. Bonds, Ser. B, AMBAC | | | |
| 6s, 12/1/15 | Aaa | 3,095,000 | 3,605,613 |
| 6s, 12/1/14 | Aaa | 2,700,000 | 3,110,697 |
| Los Angeles, Cmnty. Redev. Agcy. Fin. | | | |
| Auth. Rev. Bonds (Bunker Hill), Ser. A, | | | |
| FSA, 5s, 12/1/27 | Aaa | 16,000,000 | 16,872,800 |
| Los Angeles, Harbor Dept. Rev. Bonds, U.S. | | | |
| Govt. Coll., 7.6s, 10/1/18 (Prerefunded) | AAA | 21,885,000 | 26,483,695 |
| Los Angeles, Pension Auth. COP, Ser. A, | | | |
| MBIA, 6.9s, 6/30/08 | Aaa | 26,235,000 | 27,328,212 |
| Los Angeles, Unified School Dist. G.O. Bonds | | | |
| MBIA, 5 3/4s, 7/1/15 | Aaa | 6,880,000 | 7,857,854 |
| Ser. E, MBIA, 5 1/8s, 1/1/27 (Prerefunded) | Aaa | 6,830,000 | 7,339,996 |
| (Election of 2004), Ser. G, AMBAC, | | | |
| 5s, 7/1/24 | Aaa | 16,770,000 | 17,920,254 |
| Los Angeles, Wtr. & Pwr. Rev. Bonds | | | |
| Ser. B, FSA, 5s, 7/1/35 | Aaa | 5,000,000 | 5,239,700 |
| (Pwr. Syst.), Ser. A-2, FSA, 5s, 7/1/25 | Aaa | 3,475,000 | 3,694,134 |
| Madera, Unified School Dist. G.O. Bonds | | | |
| (Election of 2002), FGIC | | | |
| zero %, 5/1/30 | AAA | 4,805,000 | 1,701,787 |
| zero %, 8/1/29 | AAA | 3,500,000 | 1,298,815 |
| Metro. Wtr. Dist. FRN (Southern CA Wtr. | | | |
| Works), 3.079s, 8/10/18 | AA+ | 20,000,000 | 20,000,000 |
| Metro. Wtr. Dist. IFB (Southern CA Wtr. | | | |
| Works), 8.094s, 8/10/18 | AA+ | 20,000,000 | 25,735,600 |
| Metro. Wtr. Dist. Rev. Bonds, Ser. A, 5s, | | | |
| 7/1/26 (Prerefunded) | AA+ | 7,180,000 | 7,328,267 |
| Mount Diablo, Hosp. Rev. Bonds, Ser. A, | | | |
| AMBAC, 5s, 12/1/13 (Prerefunded) | Aaa | 9,000,000 | 9,334,260 |
| Mountain View-Whisman, School Dist. G.O. | | | |
| Bonds (Election of 1998), Ser. D, MBIA, | | | |
| 5 3/8s, 6/1/22 (Prerefunded) | AAA | 1,000,000 | 1,093,620 |
| Newark, Unified School Dist. (Election | | | |
| of 1997), Ser. D, FSA, zero %, 8/1/26 | Aaa | 1,300,000 | 549,081 |
| North Natomas, Cmnty. Fac. Special Tax | | | |
| Bonds (Dist. No. 4) | | | |
| Ser. D, 5s, 9/1/33 | BBB–/P | 1,760,000 | 1,787,262 |
| Ser. D, 5s, 9/1/26 | BBB–/P | 1,755,000 | 1,790,574 |
| Ser. B, 6 3/8s, 9/1/31 | BBB/P | 6,260,000 | 6,498,569 |
39
| MUNICIPAL BONDS AND NOTES (99.6%)* continued | | |
|
| | Rating** | Principal amount | Value |
| |
| California continued | | | |
| Novato, Unified School Dist. G.O. Bonds, | | | |
| FSA, 5s, 8/1/27 | Aaa | $ 2,230,000 | $ 2,347,097 |
| Oakland, Bldg. Auth. Rev. Bonds, AMBAC, | | | |
| 5 1/2s, 4/1/13 (Prerefunded) | Aaa | 6,540,000 | 6,731,491 |
| Oakland, Swr. Rev. Bonds, Ser. A, FSA, | | | |
| 5s, 6/15/26 | Aaa | 3,690,000 | 3,883,208 |
| Ontario, COP (Wtr. Syst. Impt.), MBIA, | | | |
| 5s, 7/1/29 | Aaa | 5,500,000 | 5,758,665 |
| Orange Cnty., Cmnty. Fac. Dist. Special Tax | | | |
| Rev. Bonds | | | |
| (Ladera Ranch — No. 1), Ser. A, 6.2s, | | | |
| 8/15/23 (Prerefunded) | BBB/P | 1,800,000 | 1,863,108 |
| (Ladera Ranch — No. 1), Ser. A, 6.2s, | | | |
| 8/15/20 (Prerefunded) | BBB/P | 1,290,000 | 1,335,227 |
| (Ladera Ranch — No. 01-1), Ser. A, 6s, | | | |
| 8/15/32 (Prerefunded) | AAA | 2,400,000 | 2,608,488 |
| (Ladera Ranch — No. 03-1), Ser. A, | | | |
| 5 5/8s, 8/15/34 | BBB/P | 2,750,000 | 2,910,738 |
| (Ladera Ranch — No. 03-1), Ser. A, | | | |
| 5 1/2s, 8/15/23 | BBB/P | 1,000,000 | 1,047,980 |
| (Ladera Ranch — No. 02-1), Ser. A, | | | |
| 5.55s, 8/15/33 | BBB/P | 3,725,000 | 3,834,217 |
| Orange Cnty., Wtr. Dist. COP, Ser. B, | | | |
| MBIA, 5s, 8/15/28 | Aaa | 10,000,000 | 10,402,500 |
| Pajaro Valley, Unified School Dist. G.O. Bonds | | | |
| (Election of 2002), Ser. B, FSA, zero %, 8/1/26 | Aaa | 1,500,000 | 639,570 |
| Pasadena, Cap. Impt. IF COP, AMBAC, | | | |
| 5.35s, 2/1/14 | Aaa | 24,855,000 | 26,445,223 |
| Placentia, Redev. Auth. Tax Alloc. Rev. Bonds, | | | |
| Ser. B, 5 3/4s, 8/1/32 | BBB+ | 3,000,000 | 3,200,070 |
| Pomona, Pub. Fin. Auth. Rev. Bonds | | | |
| (Merged Redev.), AMBAC, 5s, 2/1/31 | Aaa | 1,280,000 | 1,356,378 |
| (Wtr. Fac.), Ser. AY, AMBAC, 5s, 5/1/25 | AAA | 1,205,000 | 1,284,506 |
| (Wtr. Fac.), Ser. AY, AMBAC, 5s, 5/1/23 | AAA | 1,455,000 | 1,555,948 |
| Poway, Unified School Dist. Cmnty. Facs. | | | |
| Special Tax Bonds | | | |
| (Dist. No. 14 — Area A), 5 1/8s, 9/1/26 | BB–/P | 920,000 | 940,985 |
| (Dist. No. 6 Impt. Area B), 5s, 9/1/25 | BB/P | 1,120,000 | 1,138,402 |
| (Dist. No. 6-4 S Ranch), 5s, 9/1/25 | BB/P | 1,560,000 | 1,586,707 |
| (Dist. No. 6 Impt. Area B), 5s, 9/1/24 | BB/P | 1,025,000 | 1,044,680 |
| (Dist. No. 6-4 S Ranch), 5s, 9/1/24 | BB/P | 1,420,000 | 1,447,264 |
| (Dist. No. 6 Impt. Area B), 5s, 9/1/23 | BB/P | 935,000 | 954,261 |
| (Dist. No. 6-4 S Ranch), 5s, 9/1/23 | BB/P | 620,000 | 632,772 |
| (Dist. No. 6 Impt. Area B), 5s, 9/1/22 | BB/P | 775,000 | 790,965 |
| (Dist. No. 6-4 S Ranch), 5s, 9/1/22 | BB/P | 1,030,000 | 1,051,218 |
| (Dist. No. 6 Impt. Area B), 5s, 9/1/21 | BB/P | 600,000 | 613,194 |
40
| MUNICIPAL BONDS AND NOTES (99.6%)* continued | | |
|
| | Rating** | Principal amount | Value |
|
| California continued | | | |
| Poway, Unified School Dist. Cmnty. Facs. | | | |
| Special Tax Bonds | | | |
| (Dist. No. 6-4 S Ranch), 5s, 9/1/21 | BB/P | $ 1,000,000 | $ 1,021,990 |
| (Dist. No. 14 — Area A), 5s, 9/1/20 | BB–/P | 1,135,000 | 1,151,980 |
| (Dist. No. 14 — Del Sur), 5s, 9/1/20 | BB–/P | 1,185,000 | 1,201,910 |
| Rancho Cucamonga, Redev. Agcy. Tax Alloc. | | | |
| (Rancho Redev.), MBIA, 5 1/8s, 9/1/30 | Aaa | 9,000,000 | 9,353,520 |
| Redding, Elec. Syst. COP, MBIA, 6.368s, | | | |
| 7/1/22 (Prerefunded) | Aaa | 20,800,000 | 24,358,464 |
| Rio Hondo, Cmnty. College Dist. G.O. Bonds, | | | |
| Ser. A, MBIA | | | |
| 5 1/4s, 8/1/19 (Prerefunded) | Aaa | 2,395,000 | 2,645,709 |
| 5 1/4s, 8/1/18 (Prerefunded) | Aaa | 2,300,000 | 2,540,764 |
| 5 1/4s, 8/1/17 (Prerefunded) | Aaa | 2,185,000 | 2,413,726 |
| 5 1/4s, 8/1/16 (Prerefunded) | Aaa | 2,020,000 | 2,231,454 |
| Riverside Cnty., Pub. Fin. Auth. COP, | | | |
| 5.8s, 5/15/29 | BBB– | 4,250,000 | 4,399,473 |
| Riverside Cnty., Redev. Agcy. Tax Alloc., | | | |
| Ser. A, XLCA, 5s, 10/1/32 | Aaa | 9,260,000 | 9,665,310 |
| Rohnert Pk., Cmnty. Dev. Agcy. Tax Alloc. | | | |
| Bonds (Rohnert Redev.), MBIA, zero %, 8/1/25 | Aaa | 1,340,000 | 587,563 |
| Roseville, Cmnty. Fac. Special Tax Bonds | | | |
| (Cmnty. Fac. Dist. No. 1 — Crocker), | | | |
| 6s, 9/1/33 | BB/P | 1,750,000 | 1,838,708 |
| (Cmnty. Fac. Dist. No. 1 — Fiddyment Ranch), | | | |
| 5s, 9/1/18 | BB/P | 325,000 | 330,106 |
| (Cmnty. Fac. Dist. No. 1 — Fiddyment Ranch), | | | |
| Ser. 1, 5s, 9/1/20 | BB/P | 525,000 | 529,683 |
| (Dist. 1), 5 3/4s, 9/1/23 (Prerefunded) | BB+/P | 11,200,000 | 11,520,544 |
| Sacramento, Special Tax Rev. Bonds | | | |
| (North Natomas Cmnty. Fac.), | | | |
| Ser. 01-03, 6s, 9/1/28 | BBB/P | 1,500,000 | 1,583,370 |
| (North Natomas Cmnty. Fac.), Ser. 4-A, | | | |
| 5.7s, 9/1/23 | BBB/P | 4,905,000 | 4,986,129 |
| Sacramento, Muni. Util. Dist. Elec. Rev. Bonds | | | |
| Ser. A, MBIA, 6 1/4s, 8/15/10 | Aaa | 12,000,000 | 12,717,840 |
| Ser. K, AMBAC, 5 1/4s, 7/1/24 | Aaa | 11,500,000 | 13,084,010 |
| Sacramento, Muni. Util. Dist. Fin. Auth. Rev. | | | |
| Bonds (Cosumnes), MBIA, 4 3/4s, 7/1/25 | Aaa | 5,000,000 | 5,196,850 |
| Salinas, High School Dist. G.O. Bonds | | | |
| (Election of 2002), Ser. B, MBIA, 5s, 6/1/26 | Aaa | 3,490,000 | 3,713,918 |
| Salinas, Unified School Dist. G.O. Bonds | | | |
| (Cap. Appn.), Ser. A, FGIC, zero %, 10/1/24 | Aaa | 1,200,000 | 557,604 |
| San Bruno Pk., School Dist. G.O. Bonds | | | |
| (Election of 1998), Ser. C, FSA, zero %, 8/1/26 | Aaa | 1,500,000 | 639,570 |
| San Diego Cnty., COP | | | |
| (Burnham Institute), 6 1/4s, 9/1/29 | | | |
| (Prerefunded) | Baa3 | 4,000,000 | 4,286,680 |
| (Edgemoor), AMBAC, 5s, 2/1/28 | Aaa | 2,300,000 | 2,418,358 |
41
| MUNICIPAL BONDS AND NOTES (99.6%)* continued | | |
|
| | Rating** | Principal amount | Value |
|
| California continued | | | |
| San Diego Cnty., Wtr. Auth. COP | | | |
| (Stars & Cars), Ser. B, MBIA, 6.3s, 4/21/11 | Aaa | $ 56,700,000 | $ 61,254,144 |
| Ser. A, FSA, 5s, 5/1/30 | Aaa | 5,000,000 | 5,274,900 |
| Ser. A, FSA, 5s, 5/1/27 | Aaa | 10,000,000 | 10,570,800 |
| San Diego, ABAG Fin. Auth. For Nonprofit | | | |
| Corps. Rev. Bonds (San Diego Hosp.), Ser. A, | | | |
| 6 1/8s, 8/15/20 | Baa1 | 7,400,000 | 7,965,804 |
| San Diego, Pub. Fac. Fin. Auth. Swr. Rev. Bonds, | | | |
| FGIC, 5s, 5/15/25 | Aaa | 15,350,000 | 15,373,179 |
| San Diego, Redev. Agcy. Tax Alloc. | | | |
| (Centre City), Ser. A, XLCA, 5s, 9/1/22 | Aaa | 4,665,000 | 4,924,654 |
| San Diego, Unified School Dist. G.O. Bonds | | | |
| (Election of 1998), Ser. F, FSA, 5s, 7/1/29 | | | |
| (Prerefunded) | Aaa | 14,320,000 | 15,577,726 |
| San Diego, Wtr. Util. Rev. Bonds, FGIC, | | | |
| 4 3/4s, 8/1/28 | Aaa | 20,500,000 | 20,642,680 |
| San Dieguito, Pub. Facs. Auth. Rev. Bonds, | | | |
| AMBAC, 5s, 8/1/24 (Prerefunded) | Aaa | 2,800,000 | 2,873,500 |
| San Francisco, City & Cnty. Redev. Fin. Auth. | | | |
| Rev. Bonds (Redev. Project), Ser. B, FGIC, | | | |
| 5 1/4s, 8/1/18 | Aaa | 7,225,000 | 7,808,708 |
| San Joaquin Hills, Trans. Corridor Agcy. | | | |
| Rev. Bonds (Toll Road), Ser. A | | | |
| 5s, 1/1/33 | Ba2 | 34,125,000 | 34,135,579 |
| MBIA, zero %, 1/15/32 | Aaa | 25,000,000 | 8,258,750 |
| MBIA, zero %, 1/15/23 | Aaa | 21,625,000 | 10,864,400 |
| San Jose, Redev. Agcy. Tax Alloc. Bonds | | | |
| (Merged Area Redev.), FGIC, 5s, 8/1/27 | Aaa | 15,395,000 | 16,099,783 |
| (Merged Area Redev.), Ser. C, MBIA, | | | |
| 5s, 8/1/26 | Aaa | 1,545,000 | 1,646,537 |
| San Juan, Basin Auth. Rev. Bonds (Ground | | | |
| Wtr. Recvy.), AMBAC, 5s, 12/1/34 | Aaa | 1,000,000 | 1,039,350 |
| San Marcos, Pub. Fac. Auth. Rev. Bonds | | | |
| 5.8s, 9/1/27 | Baa3 | 2,995,000 | 3,102,580 |
| 5.8s, 9/1/18 | Baa3 | 1,635,000 | 1,696,018 |
| 5 1/2s, 9/1/10 | Baa3 | 1,435,000 | 1,483,905 |
| Santa Barbara Cnty., Waterfront COP, | | | |
| AMBAC, 5s, 10/1/27 | Aaa | 4,590,000 | 4,807,382 |
| Santa Monica, Cmnty. College Dist. | | | |
| G.O. Bonds | | | |
| (Election of 2004), Ser. A, MBIA, 5s, | | | |
| 5/1/23 (Prerefunded) | Aaa | 2,000,000 | 2,184,380 |
| (Election of 2002), Ser. A, FGIC, | | | |
| zero %, 8/1/31 | Aaa | 1,385,000 | 457,050 |
| (Election of 2002), Ser. A, FGIC, | | | |
| zero %, 8/1/28 | Aaa | 1,055,000 | 401,670 |
42
| MUNICIPAL BONDS AND NOTES (99.6%)* continued | | |
|
| | Rating** | Principal amount | Value |
|
| California continued | | | |
| Santaluz Cmnty., Facs. Dist. No. 2 Special | | | |
| Tax Rev. Bonds | | | |
| (Impt. Area No. 3), Ser. B, 6.2s, 9/1/30 | BBB/P | $ 500,000 | $ 501,820 |
| (Impt. Area No. 3), Ser. B, 6.1s, 9/1/21 | BBB/P | 500,000 | 501,700 |
| (Impt. Area No. 1), Ser. B, 6 3/8s, 9/1/30 | BBB/P | 12,520,000 | 12,599,627 |
| Semitropic, Impt. Dist. Wtr. Storage Rev. | | | |
| Bonds, Ser. A, XLCA, 5 1/8s, 12/1/35 | Aaa | 5,000,000 | 5,259,800 |
| Silicon Valley, Tobacco Securitization | | | |
| Auth. Rev. Bonds (Santa Clara), Ser. A, | | | |
| zero %, 6/1/36 | BBB/F | 9,300,000 | 1,849,584 |
| Solano Cnty., COP, MBIA | | | |
| 4 3/4s, 11/1/24 | Aaa | 5,035,000 | 5,243,147 |
| 4 3/4s, 11/1/23 | Aaa | 4,805,000 | 5,020,312 |
| Southern CA Pub. Pwr. Auth. Rev. Bonds | | | |
| (Southern Transmission), Ser. A, FSA, | | | |
| 5 1/4s, 7/1/18 | Aaa | 3,750,000 | 4,024,425 |
| Stockton, Redev. Agcy. Rev. Bonds | | | |
| (Stockton Events Ctr.), FGIC, 5s, 9/1/28 | Aaa | 1,500,000 | 1,568,865 |
| Sunnyvale, Cmnty. Fac. Dist. Special Tax | | | |
| Rev. Bonds, 7.65s, 8/1/21 | BB–/P | 5,820,000 | 6,294,039 |
| Thousand Oaks, Cmnty. Fac. Dist. Special | | | |
| Tax Rev. Bonds (Marketplace 94-1) | | | |
| 6 7/8s, 9/1/24 | B/P | 5,000,000 | 5,432,000 |
| zero %, 9/1/14 | B/P | 4,065,000 | 2,429,081 |
| Tobacco Securitization Auth. of Southern CA | | | |
| Rev. Bonds | | | |
| Ser. A, 5 5/8s, 6/1/43 (Prerefunded) | AAA | 5,000,000 | 5,467,600 |
| Ser. A1-SNR, 5s, 6/1/37 | BBB | 15,000,000 | 14,929,500 |
| Ser. A1-SNR, 4 3/4s, 6/1/25 | BBB | 15,300,000 | 15,391,341 |
| Torrance Memorial Med. Ctr. Rev. Bonds, | | | |
| Ser. A, | | | |
| 6s, 6/1/22 | A1 | 1,500,000 | 1,631,325 |
| 5 1/2s, 6/1/31 | A1 | 2,000,000 | 2,123,620 |
| Tustin, Unified School Dist. Special Tax Bonds | | | |
| (Cmnty. Fac. Dist. No. 97-1), FSA, | | | |
| 5s, 9/1/32 | Aaa | 1,000,000 | 1,037,820 |
| (Cmnty. Fac. Dist. No. 97-1), U.S. Govt. | | | |
| Coll., 6 3/8s, 9/1/35 (Prerefunded) | AAA | 4,000,000 | 4,234,440 |
| U. of CA Rev. Bonds, Ser. A, MBIA, | | | |
| 4 3/4s, 5/15/23 | Aaa | 3,255,000 | 3,396,788 |
| Union, Elementary School Dist. G.O. Bonds, | | | |
| Ser. A, FGIC, zero %, 9/1/24 | Aaa | 2,800,000 | 1,317,008 |
| Vallejo, COP (Marine World Foundation) | | | |
| 7.2s, 2/1/26 | BBB–/P | 10,000,000 | 10,314,900 |
| 7s, 2/1/17 | BBB–/P | 4,800,000 | 4,951,296 |
43
| MUNICIPAL BONDS AND NOTES (99.6%)* continued | | |
|
| | Rating** | Principal amount | Value |
|
| California continued | | | |
| Victor, Elementary School Dist. G.O. Bonds, | | | |
| Ser. A, FGIC, zero %, 8/1/25 | Aaa | $ 1,535,000 | $ 685,239 |
| Walnut, Energy Ctr. Auth. Rev. Bonds, Ser. A, | | | |
| AMBAC, 5s, 1/1/29 | Aaa | 16,200,000 | 16,875,702 |
| West Kern, Cmnty. Coll. Dist. G.O. Bonds | | | |
| (Election of 2004), Ser. B, XLCA | | | |
| zero %, 11/1/24 | Aaa | 2,395,000 | 1,044,124 |
| zero %, 11/1/22 | Aaa | 2,315,000 | 1,117,728 |
| zero %, 11/1/20 | Aaa | 1,240,000 | 669,786 |
| | | | 1,945,987,012 |
|
| |
| Puerto Rico (4.3%) | | | |
| Children’s Trust Fund Tobacco Settlement Rev. | | | |
| Bonds (Asset Backed Bonds), 5 5/8s, 5/15/43 | BBB | 4,000,000 | 4,208,920 |
| Cmnwlth. of PR, G.O. Bonds | | | |
| FSA, 6 1/2s, 7/1/12 | Aaa | 11,110,000 | 12,618,738 |
| (Pub. Impt.), MBIA, 5 3/4s, 7/1/18 | | | |
| (Prerefunded) | Aaa | 6,665,000 | 7,090,960 |
| Cmnwlth. of PR, Govt. Dev. Bank Rev. Bonds, | | | |
| Ser. B, 5s, 12/1/13 | BBB | 12,000,000 | 12,738,000 |
| Cmnwlth. of PR, Hwy. & Trans. Auth. | | | |
| Rev. Bonds | | | |
| Ser. B, MBIA, 5 7/8s, 7/1/35 (Prerefunded) | Aaa | 5,515,000 | 5,946,163 |
| Ser. E, FSA, 5 1/2s, 7/1/23 | Aaa | 9,000,000 | 10,518,030 |
| Ser. AA, 5s, 7/1/28 | A– | 1,200,000 | 1,243,488 |
| Ser. K, 5s, 7/1/13 | BBB+ | 2,250,000 | 2,381,985 |
| Cmnwlth. of PR, Muni. Fin. Agcy. Rev. Bonds, | | | |
| Ser. A, FSA | | | |
| 5 1/4s, 8/1/20 | Aaa | 2,000,000 | 2,133,540 |
| 5 1/4s, 8/1/18 | Aaa | 3,000,000 | 3,204,780 |
| PR Indl. Tourist Edl. Med. & Env. Control | | | |
| Fac. Rev. Bonds (Cogen. Fac. — AES), | | | |
| 6 5/8s, 6/1/26 | Baa3 | 14,800,000 | 16,080,780 |
| PR Pub. Fin. Corp. Rev. Bonds (Cmnwlth. | | | |
| Appropriation), Ser. A, 5 3/4s, 8/1/27 | BBB– | 8,600,000 | 9,218,856 |
| | | | 87,384,240 |
|
| |
| Virgin Islands (0.3%) | | | |
| VI Pub. Fin. Auth. Rev. Bonds, FGIC, | | | |
| 5s, 10/1/25 | Aaa | 6,000,000 | 6,455,280 |
|
| |
| |
| TOTAL INVESTMENTS | | | |
| Total investments (cost $1,915,409,119) | | | $ 2,039,826,532 |
44
* Percentages indicated are based on net assets of $2,048,829,242.
** The Moody’s or Standard & Poor’s ratings indicated are believed to be the most recent ratings available at March 31, 2007 for the securities listed. Ratings are generally ascribed to securities at the time of issuance. While the agencies may from time to time revise such ratings, they undertake no obligation to do so, and the ratings do not necessarily represent what the agencies would ascribe to these securities at March 31, 2007. Securities rated by Putnam are indicated by “/P.” Securities rated by Fitch are indicated by “/F.” Security ratings are defined in the Statement of Additional Information.
† Non-income-producing security.
# A portion of this security was pledged and segregated with the custodian to cover margin requirements for futures contracts at March 31, 2007.
(F) Security is valued at fair value following procedures approved by the Trustees.
At March 31, 2007, liquid assets totaling $40,050,150 have been designated as collateral for open forward commitments.
The rates shown on VRDN, Mandatory Put Bonds, FRB and FRN are the current interest rates at March 31, 2007.
The dates shown on Mandatory Put Bonds are the next mandatory put dates.
The dates shown on debt obligations other than Mandatory Put Bonds are the original maturity dates.
IFB and IF COP are securities that pay interest rates that vary inversely to changes in the market interest rates. As interest rates rise, inverse floaters produce less current income. The interest rates shown are the current interest rates at March 31, 2007.
The fund had the following sector concentrations greater than 10% at March 31, 2007 (as a percentage of net assets):
| Utilities | 25.3% |
| State Government | 14.9 |
| Local Government | 14.6 |
| Land | 12.4 |
| The fund had the following insurance concentrations greater than 10% at March 31, 2007 (as a percentage of net assets): |
| MBIA | 21.5% |
| AMBAC | 16.2 |
| FUTURES CONTRACTS OUTSTANDING at 3/31/07 (Unaudited) | | | | |
|
| | | | Number of | | | Expiration | Unrealized |
| | | | contracts | Value | | date | appreciation |
|
| U.S. Treasury Note 10 yr (Short) | 165 | $17,840,625 | | Jun-07 | $9,988 |
|
| |
| |
| INTEREST RATE SWAP CONTRACTS OUTSTANDING at 3/31/07 (Unaudited) | | | |
|
| | | | Payments | Payments | | | Unrealized |
| Swap counterparty / | | Termination | made by | received by | | | appreciation/ |
| Notional amount | | date | fund per annum | fund per annum | (depreciation) |
|
| JPMorgan Chase Bank, N.A. | | | | | | |
| $61,750,000 | (E) | 11/8/11 | 3 month USD-LIBOR-BBA | 5.036% | | | $ 123,500 |
|
| 95,000,000 | (E) | 11/8/11 | 3.488% | U.S. Bond Market | |
| | | | | Association Municipal | |
| | | | | Swap Index | | | (270,113) |
|
| Total | | | | | | | $(146,613) |
(E) See Note 1 to the financial statements regarding extended effective dates.
The accompanying notes are an integral part of these financial statements.
45
| Statement of assets and liabilities 3/31/07 (Unaudited) | |
|
| |
| ASSETS | |
|
| Investment in securities, at value (Note 1): | |
| Unaffiliated issuers (identified cost $1,915,409,119) | $2,039,826,532 |
|
| Cash | 1,585,483 |
|
| Interest and other receivables | 24,391,257 |
|
| Receivable for shares of the fund sold | 2,878,292 |
|
| Receivable for securities sold | 37,626,577 |
|
| Unrealized appreciation on swap contracts (Note 1) | 123,500 |
|
| Receivable for variation margin (Note 1) | 62,823 |
|
| Total assets | 2,106,494,464 |
|
| |
| LIABILITIES | |
|
| Distributions payable to shareholders | 3,239,053 |
|
| Payable for securities purchased | 48,362,986 |
|
| Payable for shares of the fund repurchased | 1,815,600 |
|
| Payable for compensation of Manager (Note 2) | 2,465,561 |
|
| Payable for investor servicing and custodian fees (Note 2) | 60,618 |
|
| Payable for Trustee compensation and expenses (Note 2) | 278,114 |
|
| Payable for administrative services (Note 2) | 3,330 |
|
| Payable for distribution fees (Note 2) | 1,074,874 |
|
| Unrealized depreciation on swap contracts (Note 1) | 270,113 |
|
| Other accrued expenses | 94,973 |
|
| Total liabilities | 57,665,222 |
|
| Net assets | $2,048,829,242 |
|
| |
| REPRESENTED BY | |
|
| Paid-in capital (Unlimited shares authorized) (Notes 1 and 4) | $1,926,806,509 |
|
| Undistributed net investment income (Note 1) | 1,642,278 |
|
| Accumulated net realized loss on investments (Note 1) | (3,900,333) |
|
| Net unrealized appreciation of investments | 124,280,788 |
|
| Total — Representing net assets applicable to capital shares outstanding | $2,048,829,242 |
| |
| (Continued on next page) | |
46
| Statement of assets and liabilities (Continued) | |
|
| |
| COMPUTATION OF NET ASSET VALUE AND OFFERING PRICE | |
|
| Net asset value and redemption price per class A share | |
| ($1,924,879,308 divided by 235,338,598 shares) | $8.18 |
|
| Offering price per class A share | |
| (100/96.25 of $8.18)* | $8.50 |
|
| Net asset value and offering price per class B share | |
| ($96,912,170 divided by 11,858,696 shares)** | $8.17 |
|
| Net asset value and offering price per class C share | |
| ($21,380,750 divided by 2,604,076 shares)** | $8.21 |
|
| Net asset value and redemption price per class M share | |
| ($5,657,014 divided by 693,172 shares) | $8.16 |
|
| Offering price per class M share | |
| (100/96.75 of $8.16)*** | $8.43 |
* On single retail sales of less than $100,000. On sales of $100,000 or more the offering price is reduced.
** Redemption price per share is equal to net asset value less any applicable contingent deferred sales charge.
*** On single retail sales of less than $50,000. On sales of $50,000 or more the offering price is reduced.
The accompanying notes are an integral part of these financial statements.
47
| Statement of operations Six months ended 3/31/07 (Unaudited) | |
|
| |
| INTEREST INCOME | $ 51,308,743 |
|
| |
| EXPENSES | |
|
| Compensation of Manager (Note 2) | 5,019,844 |
|
| Investor servicing fees (Note 2) | 364,993 |
|
| Custodian fees (Note 2) | 97,489 |
|
| Trustee compensation and expenses (Note 2) | 31,761 |
|
| Administrative services (Note 2) | 24,711 |
|
| Distribution fees — Class A (Note 2) | 1,988,733 |
|
| Distribution fees — Class B (Note 2) | 464,788 |
|
| Distribution fees — Class C (Note 2) | 111,686 |
|
| Distribution fees — Class M (Note 2) | 14,594 |
|
| Other | 139,624 |
|
| Total expenses | 8,258,223 |
|
| Expense reduction (Note 2) | (243,693) |
|
| Net expenses | 8,014,530 |
|
| Net investment income | 43,294,213 |
|
| Net realized gain on investments (Notes 1 and 3) | 10,746,248 |
|
| Net realized gain on futures contracts (Note 1) | 170,229 |
|
| Net realized loss on swap contracts (Note 1) | (555,962) |
|
| Net unrealized depreciation of investments, swap contracts | |
| and futures contracts during the period | (17,520,206) |
|
| Net loss on investments | (7,159,691) |
|
| Net increase in net assets resulting from operations | $ 36,134,522 |
The accompanying notes are an integral part of these financial statements.
48
| Statement of changes in net assets | |
|
| |
| |
| DECREASE IN NET ASSETS | | |
|
| | Six months ended | Year ended |
| | 3/31/07* | 9/30/06 |
|
| Operations: | | |
| Net investment income | $ 43,294,213 | $ 88,622,498 |
|
| Net realized gain on investments | 10,360,515 | 6,603,385 |
|
| Net unrealized depreciation of investments | (17,520,206) | (11,013,575) |
|
| Net increase in net assets resulting from operations | 36,134,522 | 84,212,308 |
|
| Distributions to shareholders: (Note 1) | | |
|
| From ordinary income | | |
|
| Taxable net investment income | | |
|
| Class A | (30,327) | — |
|
| Class B | (1,700) | — |
|
| Class C | (328) | — |
|
| Class M | (90) | — |
|
| Net realized short-term gain on investments | | |
|
| Class A | (827,178) | (96,126) |
|
| Class B | (47,752) | (7,971) |
|
| Class C | (9,764) | (1,140) |
|
| Class M | (2,473) | (299) |
|
| From tax-exempt net investment income | | |
|
| Class A | (39,483,499) | (82,093,559) |
|
| Class B | (1,882,274) | (5,231,903) |
|
| Class C | (366,667) | (788,690) |
|
| Class M | (110,555) | (234,332) |
|
| From net realized long-term gain on investments | | |
|
| Class A | (5,435,741) | (45,107,089) |
|
| Class B | (313,795) | (3,740,341) |
|
| Class C | (64,163) | (535,031) |
|
| Class M | (16,251) | (140,249) |
|
| Redemption fees (Note 1) | 1 | 56 |
|
| Decrease from capital share transactions (Note 4) | (48,496,402) | (103,020,580) |
|
| Total decrease in net assets | (60,954,436) | (156,784,946) |
|
| |
| NET ASSETS | | |
|
| Beginning of period | 2,109,783,678 | 2,266,568,624 |
|
| End of period (including undistributed net investment | | |
| income of $1,642,278 and $223,505, respectively) | $2,048,829,242 | $2,109,783,678 |
* Unaudited
The accompanying notes are an integral part of these financial statements.
49
| Financial highlights (For a common share outstanding throughout the period) | | | | | | | | | | | | | | | | |
| |
| |
| INVESTMENT OPERATIONS: | | | | | | | | LESS DISTRIBUTIONS: | | | | | | | | | | RATIOS AND SUPPLEMENTAL DATA: | | |
|
| | | | | | Net | | | | | | | | | | | | | | Total | | | | | | Ratio of net | | |
| | Net asset | | | | realized and | | Total | | From | | From | | | | | | Net asset | | return | | Net | | Ratio of | | investment | | |
| | value, | | Net | | unrealized | | from | | net | | net realized | | | | | | value, | | at net | | assets, | | expenses to | | income (loss) | | Portfolio |
| | beginning | | investment | | gain (loss) on | | investment | | investment | | gain on | | Total | | Redemption | | end | | asset | | end of period | | average net | | to average | | turnover |
| Period ended | of period | | income (loss) | | investments | | operations | | income | | investments | | distributions | | fees | | of period | | value (%)(a) | | (in thousands) | | assets (%)(b) | | net assets (%) | | (%) |
|
| CLASS A | | | | | | | | | | | | | | | | | | | | | | | | | | | |
| March 31, 2007** | $8.23 | | .17 | | (.02) | | .15 | | (.17) | | (.03) | | (.20) | | —(c) | | $8.18 | | 1.78* | | $1,924,879 | | .37* | | 2.10* | | 15.35* |
| September 30, 2006 | 8.43 | | .34 | | (.01) | | .33 | | (.34) | | (.19) | | (.53) | | —(c) | | 8.23 | | 4.09 | | 1,959,603 | | .75 | | 4.17 | | 11.70 |
| September 30, 2005 | 8.57 | | .36 | | (.02) | | .34 | | (.38) | | (.10) | | (.48) | | —(c) | | 8.43 | | 4.08 | | 2,057,513 | | .75 | | 4.20 | | 21.15 |
| September 30, 2004 | 8.62 | | .38 | | .01 | | .39 | | (.40) | | (.04) | | (.44) | | — | | 8.57 | | 4.60 | | 2,144,817 | | .79 | | 4.49 | | 13.01 |
| September 30, 2003 | 8.84 | | .39 | | (.17) | | .22 | | (.39) | | (.05) | | (.44) | | — | | 8.62 | | 2.64 | | 2,540,224 | | .76 | | 4.52 | | 22.39 |
| September 30, 2002 | 8.71 | | .41 | | .15 | | .56 | | (.41) | | (.02) | | (.43) | | — | | 8.84 | | 6.69 | | 2,739,618 | | .75 | | 4.82 | | 6.50 |
|
| |
| CLASS B | | | | | | | | | | | | | | | | | | | | | | | | | | | |
| March 31, 2007** | $8.22 | | .15 | | (.03) | | .12 | | (.14) | | (.03) | | (.17) | | —(c) | | $8.17 | | 1.46* | | $96,912 | | .70* | | 1.78* | | 15.35* |
| September 30, 2006 | 8.42 | | .29 | | (.01) | | .28 | | (.29) | | (.19) | | (.48) | | —(c) | | 8.22 | | 3.46 | | 120,918 | | 1.39 | | 3.52 | | 11.70 |
| September 30, 2005 | 8.56 | | .30 | | (.02) | | .28 | | (.32) | | (.10) | | (.42) | | —(c) | | 8.42 | | 3.40 | | 178,443 | | 1.40 | | 3.55 | | 21.15 |
| September 30, 2004 | 8.62 | | .33 | | (.01) | | .32 | | (.34) | | (.04) | | (.38) | | — | | 8.56 | | 3.81 | | 241,841 | | 1.44 | | 3.84 | | 13.01 |
| September 30, 2003 | 8.83 | | .33 | | (.16) | | .17 | | (.33) | | (.05) | | (.38) | | — | | 8.62 | | 2.09 | | 352,861 | | 1.41 | | 3.87 | | 22.39 |
| September 30, 2002 | 8.70 | | .36 | | .15 | | .51 | | (.36) | | (.02) | | (.38) | | — | | 8.83 | | 6.00 | | 420,977 | | 1.40 | | 4.17 | | 6.50 |
|
| |
| CLASS C | | | | | | | | | | | | | | | | | | | | | | | | | | | |
| March 31, 2007** | $8.26 | | .14 | | (.02) | | .12 | | (.14) | | (.03) | | (.17) | | —(c) | | $8.21 | | 1.37* | | $21,381 | | .77* | | 1.71* | | 15.35* |
| September 30, 2006 | 8.46 | | .28 | | (.01) | | .27 | | (.28) | | (.19) | | (.47) | | —(c) | | 8.26 | | 3.24 | | 23,147 | | 1.54 | | 3.37 | | 11.70 |
| September 30, 2005 | 8.60 | | .29 | | (.02) | | .27 | | (.31) | | (.10) | | (.41) | | —(c) | | 8.46 | | 3.21 | | 24,333 | | 1.55 | | 3.40 | | 21.15 |
| September 30, 2004 | 8.65 | | .34 | | (.02) | | .32 | | (.33) | | (.04) | | (.37) | | — | | 8.60 | | 3.83 | | 24,313 | | 1.59 | | 3.69 | | 13.01 |
| September 30, 2003 | 8.87 | | .32 | | (.17) | | .15 | | (.32) | | (.05) | | (.37) | | — | | 8.65 | | 1.83 | | 32,171 | | 1.56 | | 3.72 | | 22.39 |
| September 30, 2002 | 8.74 | | .35 | | .15 | | .50 | | (.35) | | (.02) | | (.37) | | — | | 8.87 | | 5.83 | | 30,974 | | 1.55 | | 4.00 | | 6.50 |
|
| |
| CLASS M | | | | | | | | | | | | | | | | | | | | | | | | | | | |
| March 31, 2007** | $8.21 | | .16 | | (.03) | | .13 | | (.15) | | (.03) | | (.18) | | —(c) | | $8.16 | | 1.63* | | $5,657 | | .52* | | 1.96* | | 15.35* |
| September 30, 2006 | 8.41 | | .32 | | (.01) | | .31 | | (.32) | | (.19) | | (.51) | | —(c) | | 8.21 | | 3.79 | | 6,115 | | 1.04 | | 3.87 | | 11.70 |
| September 30, 2005 | 8.55 | | .33 | | (.02) | | .31 | | (.35) | | (.10) | | (.45) | | —(c) | | 8.41 | | 3.76 | | 6,279 | | 1.05 | | 3.90 | | 21.15 |
| September 30, 2004 | 8.61 | | .35 | | —(c) | | .35 | | (.37) | | (.04) | | (.41) | | — | | 8.55 | | 4.17 | | 6,774 | | 1.09 | | 4.19 | | 13.01 |
| September 30, 2003 | 8.82 | | .36 | | (.16) | | .20 | | (.36) | | (.05) | | (.41) | | — | | 8.61 | | 2.45 | | 9,009 | | 1.06 | | 4.21 | | 22.39 |
| September 30, 2002 | 8.69 | | .39 | | .15 | | .54 | | (.39) | | (.02) | | (.41) | | — | | 8.82 | | 6.38 | | 15,668 | | 1.05 | | 4.51 | | 6.50 |
|
* Not annualized.
** Unaudited.
(a) Total return assumes dividend reinvestment and does not reflect the effect of sales charges.
(b) Includes amounts paid through expense offset arrangements (Note 2).
(c) Amount represents less than $0.01 per share.
The accompanying notes are an integral part of these financial statements.
Notes to financial statements 3/31/07 (Unaudited)
Note 1: Significant accounting policies
Putnam California Tax Exempt Income Fund (the “fund”), a Massachusetts business trust, is registered under the Investment Company Act of 1940, as amended, as a diversified, open-end management investment company. The fund seeks as high a level of current income exempt from federal and California personal income tax as Putnam Investment Management, LLC (“Putnam Management”), the fund’s manager, an indirect wholly-owned subsidiary of Putnam, LLC, believes is consistent with preservation of capital by investing in a diversified portfolio of longer-term California tax-exempt securities. The fund may be affected by economic and political developments in the state of California.
The fund offers class A, class B, class C and class M shares. Class A and class M shares are sold with a maximum front-end sales charge of 3.75% and 3.25%, respectively, and generally do not pay contingent deferred sales charges. Class B shares, which convert to class A shares after approximately eight years, do not pay a front-end sales charge, and are subject to a contingent deferred sales charge, if those shares are redeemed within six years of purchase. Class C shares have a one-year 1.00% contingent deferred sales charge and do not convert to class A shares. The expenses for class A, class B, class C and class M shares may differ based on the distribution fee of each class, which is identified in Note 2.
Effective October 2, 2006, a 1.00% redemption fee may apply on any shares purchased on or after such date that are redeemed (either by selling or exchanging into another fund) within 7 days of purchase. The redemption fee is accounted for as an addition to paid-in-capital. Prior to October 2, 2006, a 2.00% redemption fee applied to any shares that were redeemed (either by selling or exchanging into another fund) within 5 days of purchase.
Investment income, realized and unrealized gains and losses and expenses of the fund are borne pro-rata based on the relative net assets of each class to the total net assets of the fund, except that each class bears expenses unique to that class (including the distribution fees applicable to such classes). Each class votes as a class only with respect to its own distribution plan or other matters on which a class vote is required by law or determined by the Trustees. Shares of each class would receive their pro-rata share of the net assets of the fund, if the fund were liquidated. In addition, the Trustees declare separate dividends on each class of shares.
In the normal course of business, the fund enters into contracts that may include agreements to indemnify another party under given circumstances. The fund’s maximum exposure under these arrangements is unknown as this would involve future claims that may be, but have not yet been, made against the fund. However, the fund expects the risk of material loss to be remote.
The following is a summary of significant accounting policies consistently followed by the fund in the preparation of its financial statements. The preparation of financial statements is in conformity with accounting principles generally accepted in the United States of America and requires management to make estimates and assumptions that affect the reported amounts of assets and liabilities in the financial statements and the reported amounts of increases and decreases in net assets from operations during the reporting period. Actual results could differ from those estimates.
A) Security valuation Tax-exempt bonds and notes are generally valued on the basis of valuations provided by an independent pricing service approved by the Trustees. Such services use information with respect to transactions in bonds, quotations from bond dealers, market transactions in comparable securities and various relationships between securities in determining value. Certain investments are also valued at fair value following procedures approved by the Trustees. Such valuations and procedures are reviewed periodically by the Trustees. The fair
52
value of securities is generally determined as the amount that the fund could reasonably expect to realize from an orderly disposition of such securities over a reasonable period of time. By its nature, a fair value price is a good faith estimate of the value of a security at a given point in time and does not reflect an actual market price, which may be different by a material amount.
B) Security transactions and related investment income Security transactions are recorded on the trade date (the date the order to buy or sell is executed). Gains or losses on securities sold are determined on the identified cost basis.
Interest income is recorded on the accrual basis. All premiums/discounts are amortized/accreted on a yield-to-maturity basis. The premium in excess of the call price, if any, is amortized to the call date; thereafter, any remaining premium is amortized to maturity.
Securities purchased or sold on a forward commitment basis may be settled a month or more after the trade date; interest income is accrued based on the terms of the securities. Losses may arise due to changes in the market value of the underlying securities or if the counterparty does not perform under the contract.
C) Futures and options contracts The fund may use futures and options contracts to hedge against changes in the values of securities the fund owns or expects to purchase, or for other investment purposes. The fund may also write options on swaps or securities it owns or in which it may invest to increase its current returns.
The potential risk to the fund is that the change in value of futures and options contracts may not correspond to the change in value of the hedged instruments. In addition, losses may arise from changes in the value of the underlying instruments, if there is an illiquid secondary market for the contracts, or if the counterparty to the contract is unable to perform. Risks may exceed amounts recognized on the statement of assets and liabilities. When the contract is closed, the fund records a realized gain or loss equal to the difference between the value of the contract at the time it was opened and the value at the time it was closed. Realized gains and losses on purchased options are included in realized gains and losses on investment securities. If a written call option is exercised, the premium originally received is recorded as an addition to sales proceeds. If a written put option is exercised, the premium originally receive d is recorded as a reduction to the cost of investments.
Futures contracts are valued at the quoted daily settlement prices established by the exchange on which they trade. The fund and the broker agree to exchange an amount of cash equal to the daily fluctuation in the value of the futures contract. Such receipts or payments are known as “variation margin.” Exchange traded options are valued at the last sale price or, if no sales are reported, the last bid price for purchased options and the last ask price for written options. Options traded over-the-counter are valued using prices supplied by dealers. Futures and written option contracts outstanding at period end, if any, are listed after the fund’s portfolio
D) Interest rate swap contracts The fund may enter into interest rate swap contracts, which are arrangements between two parties to exchange cash flows based on a notional principal amount, to manage the fund’s exposure to interest rates. Interest rate swap contracts are marked to market daily based upon quotations from an independent pricing service or market makers and the change, if any, is recorded as unrealized gain or loss. Payments received or made are recorded as realized gains or loss. Certain interest rate swap contracts may include extended effective dates. Income related to these swap contracts is accrued based on the terms of the contract. The fund could be exposed to credit or market risk due to unfavorable changes in the fluctuation of interest rates or if the counterparty
53
defaults on its obligation to perform. Risk of loss may exceed amounts recognized on the statement of assets and liabilities. Interest rate swap contracts outstanding at period end, if any, are listed after the fund’s portfolio.
E) Federal taxes It is the policy of the fund to distribute all of its income within the prescribed time and otherwise comply with the provisions of the Internal Revenue Code of 1986 (the “Code”) applicable to regulated investment companies. It is also the intention of the fund to distribute an amount sufficient to avoid imposition of any excise tax under Section 4982 of the Code, as amended. Therefore, no provision has been made for federal taxes on income, capital gains or unrealized appreciation on securities held nor for excise tax on income and capital gains.
The aggregate identified cost on a tax basis is $1,916,529,342, resulting in gross unrealized appreciation and depreciation of $124,739,846 and $1,442,656, respectively, or net unrealized appreciation of $123,297,190.
F) Distributions to shareholders Income dividends are recorded daily by the fund and are paid monthly. Distributions from capital gains, if any, are recorded on the ex-dividend date and paid at least annually. The amount and character of income and gains to be distributed are determined in accordance with income tax regulations, which may differ from generally accepted accounting principles. Dividend sources are estimated at the time of declaration. Actual results may vary. Any non-taxable return of capital cannot be determined until final tax calculations are completed after the end of the fund’s fiscal year. Reclassifications are made to the fund’s capital accounts to reflect income and gains available for distribution (or available capital loss carryovers) under income tax regulations.
Note 2: Management fee, administrative services and other transactions
Putnam Management is paid for management and investment advisory services quarterly based on the average net assets of the fund. Such fee is based on the lesser of a (i) an annual rate of 0.50% of the average net assets of the fund or (ii) the following annual rates expressed as a percentage of the fund’s average net assets: 0.60% of the first $500 million, 0.50% of the next $500 million, 0.45% of the next $500 million, 0.40% of the next $5 billion, 0.375% of the next $5 billion, 0.355% of the next $5 billion, 0.34% of the next $5 billion and 0.33% thereafter.
Putnam Management has agreed to waive fees and reimburse expenses of the fund through September 30, 2007 to the extent necessary to ensure that the fund’s expenses do not exceed the simple average of the expenses of all front-end load funds viewed by Lipper Inc. as having the same investment classification or objective as the fund. The expense reimbursement is based on a comparison of the fund’s expenses with the average annualized operating expenses of the funds in its Lipper peer group for each calendar quarter during the fund’s last fiscal year, excluding 12b-1 fees and without giving effect to any expense offset and brokerage service arrangements that may reduce fund expenses. For the six months ended March 31, 2007, Putnam Management did not waive any of its management fee from the fund.
The fund reimburses Putnam Management an allocated amount for the compensation and related expenses of certain officers of the fund and their staff who provide administrative services to the fund. The aggregate amount of all such reimbursements is determined annually by the Trustees.
Custodial functions for the fund’s assets were provided by Putnam Fiduciary Trust Company (“PFTC”), a subsidiary of Putnam, LLC, and by State Street Bank and Trust Company. Custody fees are based on the fund’s asset level, the number of its security holdings and transaction
54
volumes. Putnam Investor Services, a division of PFTC, provided investor servicing agent functions to the fund. Putnam Investor Services received fees for investor servicing based on the number of shareholder accounts in the fund and the level of defined contribution plan assets in the fund. During the period ended March 31, 2007, the fund incurred $457,508 for custody and investor servicing agent functions provided by PFTC.
The fund has entered into arrangements with PFTC and State Street Bank and Trust Company whereby PFTC’s and State Street Bank and Trust Company’s fees are reduced by credits allowed on cash balances. For the six months ended March 31, 2007, the fund’s expenses were reduced by $243,693 under these arrangements.
Each independent Trustee of the fund receives an annual Trustee fee, of which $644, as a quarterly retainer, has been allocated to the fund, and an additional fee for each Trustees meeting attended. Trustees receive additional fees for attendance at certain committee meetings, industry seminars and for certain compliance-related matters. Trustees also are reimbursed for expenses they incur relating to their services as Trustees. George Putnam, III, who is not an independent Trustee, also receives the foregoing fees for his services as Trustee.
The fund has adopted a Trustee Fee Deferral Plan (the “Deferral Plan”) which allows the Trustees to defer the receipt of all or a portion of Trustees fees payable on or after July 1, 1995. The deferred fees remain invested in certain Putnam funds until distribution in accordance with the Deferral Plan.
The fund has adopted an unfunded noncontributory defined benefit pension plan (the “Pension Plan”) covering all Trustees of the fund who have served as a Trustee for at least five years and were first elected prior to 2004. Benefits under the Pension Plan are equal to 50% of the Trustee’s average annual attendance and retainer fees for the three years ended December 31, 2005. The retirement benefit is payable during a Trustee’s lifetime, beginning the year following retirement, for the number of years of service through December 31, 2006. Pension expense for the fund is included in Trustee compensation and expenses in the statement of operations. Accrued pension liability is included in Payable for Trustee compensation and expenses in the statement of assets and liabilities. The Trustees have terminated the Pension Plan with respect to any Trustee first elected after 2003.
The fund has adopted distribution plans (the “Plans”) with respect to its class A, class B, class C and class M shares pursuant to rule 12b-1 under the Investment Company Act of 1940. The purpose of the Plans is to compensate Putnam Retail Management, a wholly-owned subsidiary of Putnam, LLC and Putnam Retail Management GP, Inc., for services provided and expenses incurred in distributing shares of the fund. The Plans provide for payments by the fund to Putnam Retail Management at an annual rate of up to 035%, 1.00%, 1.00% and 0.50% of the average net assets attributable to class A, class B, class C and class M shares, respectively. The Trustees have approved payment by the fund at the annual rate of 0.85%, 1.00% and 0.50% for class B, class C and class M shares, respectively. For class A shares, the annual payment rate will equal the weighted average of (i) 0.20% on the net assets of the fund attributable to class A shares purchased and paid for prior to April 1, 2005 and (ii) 0.25% on all other net assets of the fund attributable to class A shares.
For the six months ended March 31, 2007, Putnam Retail Management, acting as underwriter, received net commissions of $102,283 and $46 from the sale of class A and class M shares, respectively, and received $37,161 and $1,026 in contingent deferred sales charges from redemptions of class B and class C shares, respectively.
A deferred sales charge of up to 1.00% is assessed on certain redemptions of class A shares that were purchased without an initial sales charge as part of an investment of $1 million or more. For the six months ended March 31, 2007, Putnam Retail Management, acting as underwriter, received $25,494 on class A redemptions.
55
Note 3: Purchases and sales of securities
During the six months ended March 31, 2007, cost of purchases and proceeds from sales of investment securities other than short-term investments aggregated $310,990,157 and $375,094,514, respectively. There were no purchases or sales of U.S. government securities.
Note 4: Capital shares
At March 31, 2007, there was an unlimited number of shares of beneficial interest authorized. Transactions in capital shares were as follows:
| CLASS A | Shares | Amount |
|
| Six months ended 3/31/07: | |
| Shares sold | 8,954,146 | $ 73,527,567 |
|
| Shares issued | | |
| in connection | | |
| with reinvestment | | |
| of distributions | 3,299,851 | 27,121,337 |
|
| | 12,253,997 | 100,648,904 |
|
| Shares | | |
| repurchased | (15,061,082) | (123,729,635) |
|
| Net decrease | (2,807,085) | $ (23,080,731) |
| |
| Year ended 9/30/06: | | |
| Shares sold | 15,665,446 | $ 128,384,112 |
|
| Shares issued | | |
| in connection | | |
| with reinvestment | | |
| of distributions | 9,592,527 | 78,592,201 |
|
| | 25,257,973 | 206,976,313 |
|
| Shares | | |
| repurchased | (31,222,707) | (256,262,051) |
|
| Net decrease | (5,964,734) | $ (49,285,738) |
| CLASS B | Shares | Amount |
|
| Six months ended 3/31/07: | | |
| Shares sold | 154,374 | $ 1,273,879 |
|
| Shares issued | | |
| in connection | | |
| with reinvestment | | |
| of distributions | 172,180 | 1,405,730 |
|
| | 326,554 | 2,679,609 |
|
| Shares | | |
| repurchased | (3,173,997) | (26,034,753) |
|
| Net decrease | (2,847,443) | $(23,355,144) |
| |
| Year ended 9/30/06: | | |
| Shares sold | 348,444 | $ 2,854,663 |
|
| Shares issued | | |
| in connection | | |
| with reinvestment | | |
| of distributions | 715,954 | 5,861,353 |
|
| | 1,064,398 | 8,716,016 |
|
| Shares | | |
| repurchased | (7,547,762) | (61,832,902) |
|
| Net decrease | (6,483,364) | $(53,116,886) |
| CLASS C | Shares | Amount |
|
| Six months ended 3/31/07: | |
| Shares sold | 296,615 | $ 2,441,727 |
|
| Shares issued | | |
| in connection | | |
| with reinvestment | | |
| of distributions | 36,303 | 299,574 |
|
| | 332,918 | 2,741,301 |
|
| Shares | | |
| repurchased | (530,643) | (4,378,159) |
|
| Net decrease | (197,725) | $(1,636,858) |
| |
| Year ended 9/30/06: | | |
| Shares sold | 501,289 | $ 4,126,427 |
|
| Shares issued | | |
| in connection | | |
| with reinvestment | | |
| of distributions | 114,259 | 939,568 |
|
| | 615,548 | 5,065,995 |
|
| Shares | | |
| repurchased | (689,900) | (5,667,687) |
|
| Net decrease | (74,352) | $ (601,692) |
| CLASS M | Shares | Amount |
|
| Six months ended 3/31/07: | | |
| Shares sold | 29,418 | $241,499 |
|
| Shares issued | | |
| in connection | | |
| with reinvestment | | |
| of distributions | 10,920 | 89,555 |
|
| | 40,338 | 331,054 |
|
| Shares | | |
| repurchased | (91,903) | (754,723) |
|
| Net decrease | (51,565) | $(423,669) |
| |
| Year ended 9/30/06: | | |
| Shares sold | 68,490 | $ 559,731 |
|
| Shares issued | | |
| in connection | | |
| with reinvestment | | |
| of distributions | 32,534 | 265,947 |
|
| | 101,024 | 825,678 |
|
| Shares | | |
| repurchased | (102,795) | (841,942) |
|
| Net decrease | (1,771) | $ (16,264) |
Note 5: Regulatory matters and litigation
In late 2003 and 2004, Putnam Management settled charges brought by the Securities and Exchange Commission (the “SEC”) and the Massachusetts Securities Division (“MSD”) in connection with excessive short-term trading by certain former Putnam employees and, in the case of charges brought by the MSD, excessive short-term trading by participants in some Putnam-administered 401(k) plans. Putnam Management agreed to pay $193.5 million in penalties and restitution, of which $153.5 million will be distributed to certain open-end Putnam funds and their shareholders after the SEC and MSD approve a distribution plan being developed by an independent consultant. The allegations of the SEC and MSD and related matters have served as the general basis for certain lawsuits, including purported class action lawsuits filed against Putnam Management and, in a limited number of cases, against some Putnam funds.
Putnam Management believes that these lawsuits will have no material adverse effect on the funds or on Putnam Management’s ability to provide investment management services. In addition, Putnam Management has agreed to bear any costs incurred by the Putnam funds as a result of these matters.
Putnam Management and Putnam Retail Management are named as defendants in a civil suit in which the plaintiffs allege that the management and distribution fees paid by certain Putnam funds were excessive and seek recovery under the Investment Company Act of 1940. Putnam Management and Putnam Retail Management have contested the plaintiffs’ claims and the matter is currently pending in the U.S. District Court for the District of Massachusetts. Based on currently available information, Putnam Management believes that this action is without merit and that it is unlikely to have a material effect on Putnam Management’s and Putnam Retail Management’s ability to provide services to their clients, including the fund.
Note 6: New accounting pronouncements
In June 2006, the Financial Accounting Standards Board (“FASB”) issued Interpretation No. 48, Accounting for Uncertainty in Income Taxes (the “Interpretation”). The Interpretation prescribes a minimum threshold for financial statement recognition of the benefit of a tax position taken or expected to be taken by a filer in the filer’s tax return. The Interpretation will become effective for fiscal years beginning after December 15, 2006 but will also apply to tax positions reflected in the fund’s financial statements as of that date. No determination has been made whether the adoption of the Interpretation will require the fund to make any adjustments to its net assets or have any other effect on the fund’s financial statements. The effects of implementing this pronouncement, if any, will be noted in the fund’s next semiannual financial statements.
57
In September 2006, the FASB issued Statement of Financial Accounting Standards No. 157, Fair Value Measurements (the “Standard”). The Standard defines fair value, sets out a framework for measuring fair value and requires additional disclosures about fair value measurements. The Standard applies to fair value measurements already required or permitted by existing standards. The Standard is effective for financial statements issued for fiscal years beginning after November 15, 2007 and interim periods within those fiscal years. Putnam Management is currently evaluating what impact the adoption of the Standard will have on the fund’s financial statements.
58
Putnam puts your interests first
In January 2004, Putnam began introducing a number of voluntary initiatives designed to reduce fund expenses, provide investors with more useful information, and help safeguard the interests of all Putnam investors. Visit www.putnam.com for details.
Cost-cutting initiatives
Reduced sales charges The maximum sales charge for class A shares has been reduced to 5.25% for equity funds (formerly 5.75%) and 3.75% for most income funds (formerly 4.50%) . The maximum sales charge for class M shares has been reduced to 3.25% for equity funds (formerly 3.50%) .*
Lower class B purchase limit To help ensure that investors are in the most cost-effective share class, the maximum amount that can be invested in class B shares has been reduced to $100,000. (Larger trades or accumulated amounts will be refused.)
Ongoing expenses will be limited Through calendar 2007, total ongoing expenses, including management fees for all funds, will be maintained at or below the average of each fund’s industry peers in its Lipper load-fund universe. For more information, please see the Statement of Additional information.
Improved disclosure
Putnam fund prospectuses and shareholder reports have been revised to disclose additional information that will help shareholders compare funds and weigh their costs and risks along with their potential benefits. Shareholders will find easy-to-understand information about fund expense ratios, portfolio manager compensation, risk comparisons, turnover comparisons, brokerage commissions, and employee and trustee ownership of Putnam funds. Disclosure of breakpoint discounts has also been enhanced to alert investors to potential cost savings.
Protecting investors’ interests
Short-term trading fee introduced To discourage short-term trading, which can interfere with a fund’s long-term strategy, a 1% short-term trading fee may be imposed on any Putnam fund shares (other than money market funds) redeemed or exchanged within seven calendar days of purchase (for certain funds, this fee applies for 90 days).
* The maximum sales charge for class A shares of Putnam Limited Duration Government Income Fund and Putnam Floating Rate Income Fund remains 3.25% .
59
Services for shareholders
Investor services
Help your investment grow Set up a program for systematic investing from a Putnam fund or from your own savings or checking account. (Regular investing does not guarantee a profit or protect against loss in a declining market.)
Switch funds easily* You can move money from one Putnam fund to another within the same class of shares without a service charge.
Access your money easily You can have checks sent regularly or redeem shares any business day at the then-current net asset value, which may be more or less than the original cost of the shares. Class B and class C shares carry a sales charge that is applied to certain withdrawals.
How to buy additional shares You may buy shares through your financial advisor or directly from Putnam. To open an account by mail, send a check made payable to the name of the fund along with a completed fund application. To add to an existing account, complete the investment slip found at the top of your Confirmation of Activity statement and return it with a check payable to your fund.
For more information
Visit www.putnam.com A secure section of our Web site contains complete information on your account, including balances and transactions, updated daily. You may also conduct transactions, such as exchanges, additional investments, and address changes. Log on today to get your password.
Call us toll free at 1-800-225-1581 Ask a helpful Putnam representative or your financial advisor for details about any of these or other services, or see your prospectus.
*This privilege is subject to change or termination. An exchange of funds may result in a taxable event. In addition, a 1% redemption fee will be applied to shares exchanged or sold within 7 days of purchase, and, for certain funds, this fee applies on total assets redeemed or exchanged within 90 days of purchase.
60
Fund information
Founded nearly 70 years ago, Putnam Investments was built around the concept that a balance between risk and reward is the hallmark of a well-rounded financial program. We manage over 100 mutual funds in growth, value, blend, fixed income, and international.
| Investment Manager | Officers | Francis J. McNamara, III |
| Putnam Investment | George Putnam, III | Vice President and |
| Management, LLC | President | Chief Legal Officer |
| One Post Office Square | | |
| Boston, MA 02109 | Charles E. Porter | Robert R. Leveille |
| Executive Vice President, | Chief Compliance Officer |
| Principal Executive Officer, | |
| Marketing Services | Associate Treasurer and | Mark C. Trenchard |
| Putnam Retail Management | Compliance Liaison | Vice President and |
| One Post Office Square | | BSA Compliance Officer |
| Boston, MA 02109 | Jonathan S. Horwitz | |
| | Senior Vice President | Judith Cohen |
| Custodians | and Treasurer | Vice President, Clerk and |
| Putnam Fiduciary Trust | | Assistant Treasurer |
| Company, State Street Bank | Steven D. Krichmar | |
| and Trust Company | Vice President and | Wanda M. McManus |
| | Principal Financial Officer | Vice President, Senior Associate |
| Legal Counsel | | Treasurer and Assistant Clerk |
| Ropes & Gray LLP | Janet C. Smith | |
| | Vice President, Principal | Nancy E. Florek |
| Trustees | Accounting Officer and | Vice President, Assistant Clerk, |
| John A. Hill, Chairman | Assistant Treasurer | Assistant Treasurer and |
| Jameson Adkins Baxter, | | Proxy Manager |
| Vice Chairman | Susan G. Malloy | |
| Charles B. Curtis | Vice President and | |
| Myra R. Drucker | Assistant Treasurer | |
| Charles E. Haldeman, Jr. | | |
| Paul L. Joskow | Beth S. Mazor | |
| Elizabeth T. Kennan | Vice President | |
| Kenneth R. Leibler | | |
| Robert E. Patterson | James P. Pappas | |
| George Putnam, III | Vice President | |
| W. Thomas Stephens | | |
| Richard B. Worley | Richard S. Robie, III | |
| Vice President | |
This report is for the information of shareholders of Putnam California Tax Exempt Income Fund. It may also be used as sales literature when preceded or accompanied by the current prospectus, the most recent copy of Putnam’s Quarterly Performance Summary, and Putnam’s Quarterly Ranking Summary. For more recent performance, please visit www.putnam.com. Investors should carefully consider the investment objective, risks, charges, and expenses of a fund, which are described in its prospectus. For this and other information or to request a prospectus, call 1-800-225-1581 toll free. Please read the prospectus carefully before investing. The fund’s Statement of Additional Information contains additional information about the fund’s Trustees and is available without charge upon request by calling 1-800-225-1581.

Item 2. Code of Ethics:
Not applicable
Item 3. Audit Committee Financial Expert:
Not applicable
Item 4. Principal Accountant Fees and Services:
Not applicable
Item 5. Audit Committee of Listed Registrants
Not applicable
Item 6. Schedule of Investments:
The registrant’s schedule of investments in unaffiliated issuers is included in the report to shareholders in Item 1 above.
Item 7. Disclosure of Proxy Voting Policies and Procedures For Closed-End Management Investment Companies:
Not applicable
Item 8. Portfolio Managers of Closed-End Investment Companies
Not Applicable
Item 9. Purchases of Equity Securities by Closed-End Management Investment Companies and Affiliated Purchasers:
Not applicable
Item 10. Submission of Matters to a Vote of Security Holders:
Not applicable
Item 11. Controls and Procedures:
(a) The registrant's principal executive officer and principal financial officer have concluded, based on their evaluation of the effectiveness of the design and operation of the registrant's disclosure controls and procedures as of a date within 90 days of the filing date of this report, that the design and operation of such procedures are generally effective to provide reasonable assurance that information required to be disclosed by the registrant in this report is recorded, processed, summarized and reported within the time periods specified in the Commission's rules and forms.
(b) Changes in internal control over financial reporting: Effective January 1, 2007, the fund retained State Street Bank and Trust Company ("State Street") as its custodian. Putnam Fiduciary Trust Company, the fund's previous custodian, is managing the transfer of the fund's assets to State Street. This transfer is expected to be completed for all Putnam funds during the first half of 2007, with PFTC remaining as custodian with respect to fund assets until the assets are transferred. Also effective January 1, 2007, the fund's investment manager, Putnam
Investment Management, LLC entered into a Master Sub-Accounting Services Agreement with State Street, under which the investment manager has delegated to State Street responsibility for providing certain administrative, pricing, and bookkeeping services for the fund.
Item 12. Exhibits:
(a)(1) Not applicable
(a)(2) Separate certifications for the principal executive officer and principal financial officer of the registrant as required by Rule 30a-2(a) under the Investment Company Act of 1940, as amended, are filed herewith.
(b) The certifications required by Rule 30a-2(b) under the Investment Company Act of 1940, as amended, are filed herewith.
SIGNATURES
Pursuant to the requirements of the Securities Exchange Act of 1934 and the Investment Company Act of 1940, the registrant has duly caused this report to be signed on its behalf by the undersigned, thereunto duly authorized.
Putnam California Tax Exempt Income Fund
By (Signature and Title):
/s/Janet C. Smith
Janet C. Smith
Principal Accounting Officer
Date: May 29, 2007
Pursuant to the requirements of the Securities Exchange Act of 1934 and the Investment Company Act of 1940, this report has been signed below by the following persons on behalf of the registrant and in the capacities and on the dates indicated.
By (Signature and Title):
/s/Charles E. Porter
Charles E. Porter
Principal Executive Officer
Date: May 29, 2007
By (Signature and Title):
/s/Steven D. Krichmar
Steven D. Krichmar
Principal Financial Officer
Date: May 29, 2007