| | | |
| | |
| UNITED STATES |
| SECURITIES AND EXCHANGE COMMISSION |
| Washington, D.C. 20549 |
| |
| FORM N-CSR |
| |
| CERTIFIED SHAREHOLDER REPORT OF REGISTERED |
| MANAGEMENT INVESTMENT COMPANIES |
| | |
| Investment Company Act file number: (811- 03630) | |
| | |
| Exact name of registrant as specified in charter: | Putnam California Tax Exempt Income Fund |
| |
| Address of principal executive offices: One Post Office Square, Boston, Massachusetts 02109 |
| | |
| Name and address of agent for service: | | Beth S. Mazor, Vice President |
| | One Post Office Square |
| | Boston, Massachusetts 02109 |
| | |
| Copy to: | | John W. Gerstmayr, Esq. |
| | Ropes & Gray LLP |
| | One International Place |
| | Boston, Massachusetts 02110 |
| | |
| Registrant’s telephone number, including area code: | (617) 292-1000 |
| | | |
| Date of fiscal year end: September 30, 2009 | | |
| |
| Date of reporting period: October 1, 2008 — March 31, 2009 |
Item 1. Report to Stockholders:
The following is a copy of the report transmitted to stockholders pursuant to Rule 30e-1 under the Investment Company Act of 1940:

Since 1937, when George Putnam created a prudent mix of stocks and bonds in a single, professionally managed portfolio, we have championed the wisdom of the balanced approach. Today, we offer a world of equity, fixed-income, multi-asset, and absolute-return portfolios so investors can pursue a range of financial goals. Our seasoned portfolio managers seek superior results over time, backed by original, fundamental research on a global scale. We believe in service excellence, in the value of experienced financial advice, and in putting clients first in everything we do.
In 1830, Massachusetts Supreme Judicial Court Justice Samuel Putnam established The Prudent Man Rule, a legal foundation for responsible money management.

THE PRUDENT MAN RULE
All that can be required of a trustee to invest is that he shall conduct himself faithfully and exercise a sound discretion. He is to observe how men of prudence, discretion, and intelligence manage their own affairs, not in regard to speculation, but in regard to the permanent disposition of their funds, considering the probable income, as well as the probable safety of the capital to be invested.

Putnam
California Tax Exempt
Income Fund
3|31|09
Semiannual Report
| |
| Message from the Trustees | 2 |
| About the fund | 4 |
| Performance snapshot | 6 |
| Interview with your fund’s Portfolio Manager | 7 |
| Performance in depth. | 12 |
| Expenses | 14 |
| Portfolio turnover | 16 |
| Your fund’s management. | 16 |
| Terms and definitions | 18 |
| Trustee approval of management contract | 19 |
| Other information for shareholders. | 24 |
| Financial statements | 25 |
Message from the Trustees
Dear Fellow Shareholder:
After 18 months of deep and painful losses, the stock market showed a glimmer of promise late in the first quarter. For the first 10 weeks of 2009, the S&P 500 Index fell by approximately 25%, before abruptly reversing course with just three weeks left in the quarter. Recent technical and valuation improvements also may augur well for the fixed-income market.
While the bottom of a bear market can only be identified in retrospect, we are encouraged by the upswing because it corresponds closely to historic turning points in the stock market. Notably, the upswing followed more aggressive government stimulus efforts and Federal Reserve action, as well as the kind of widespread sell-offs by investors that are often associated with market bottoms.
Under President and CEO Robert L. Reynolds, Putnam Investments has instituted several changes in order to position Putnam mutual funds for a market recovery. In April, Walter C. Donovan, a 25-year investment-industry veteran, joined Putnam as Chief Investment Officer. Mr. Donovan will lead a reinvigorated investment organization strengthened by the arrival during the past few months of several well-regarded senior portfolio managers, research analysts, and equity traders.
We also are pleased to announce that Ravi Akhoury has been elected to the Board of Trustees of the Putnam Funds. From 1992 to 2007, Mr. Akhoury was Chairman and CEO of MacKay Shields,
2
a multi-product investment management firm with over $40 billion in assets under management. He serves as advisor to New York Life Insurance Company, and previously was a member of its Executive Management Committee.
We would like to take this opportunity to welcome new shareholders to the fund and to thank all of our investors for your continued confidence in Putnam.

About the fund
Potential for tax-advantaged high current income
When investing in tax-exempt bonds, opportunities come in all shapes and sizes. This is especially true with Putnam California Tax Exempt Income Fund. The fund explores the vast California municipal bond market, seeking to deliver high current income and tax advantages.
Municipal bonds are typically issued by states and local municipalities to raise funds for building and maintaining public facilities. They are backed by either the issuing state, city, or town, or by revenues collected from usage fees. As a result, they have varying degrees of credit risk — that is, the risk that the issuer will not be able to repay the bond.
A municipal bond’s greatest benefit is that its income is generally exempt from federal income tax, and from state income tax for residents of the state in which the bond is issued. In California, this tax exemption is an especially powerful advantage because the state’s maximum income-tax rate is among the highest in the United States. And the sheer size of the California municipal bond market — it is one of the largest and most diverse in the country, encompassing virtually every sector — enables it to establish trends and shape demand in municipal bond markets across the country.
The fund seeks to capitalize on the opportunities available in California by investing in a range of bonds — primarily investment grade — across various sectors. When deciding whether to invest in a bond, the fund’s portfolio managers primarily consider credit risk and interest-rate risk, as well as the risk that the bond will be prepaid. Once a bond has been purchased, the managers continue to monitor developments that affect the bond market, the specific sector, and the bond issuer.
The goal of research and active management is to stay a step ahead of the industry and pinpoint opportunities to adjust the fund’s holdings for the benefit of investors.
The fund concentrates its investments by region and involves more risk than a fund that invests more broadly. Capital gains, if any, are taxable for federal and, in most cases, state purposes. For some investors, investment income may be subject to the federal alternative minimum tax. Income from federally exempt funds may be subject to state and local taxes. Tax-free funds may not be suitable for IRAs and other non-taxable accounts. Consult your tax advisor for more information. Funds that invest in bonds are subject to certain risks, including interest-rate risk, credit risk, and inflation risk. As interest rates rise, the prices of bonds fall. Long-term bonds are more exposed to interest-rate risk than short-term bonds. Unlike bonds, bond funds have ongoing fees and expenses.
Understanding
tax-equivalent yield
To understand the value of tax-free income, it is helpful to compare a municipal bond’s yield with the “tax-equivalent yield” — the before-tax yield that must be offered by a taxable bond in order to equal the municipal bond’s yield after taxes.
How to calculate tax-equivalent yield: The tax-equivalent yield equals the municipal bond’s yield divided by “one minus the tax rate.” For example, if a municipal bond’s yield is 5%, then its tax-equivalent yield is 7.7%, assuming the maximum 35% federal tax rate for 2009.
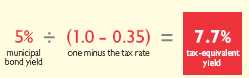
Results for investors subject to lower
tax rates would not be as advantageous.
Municipal bonds may finance a range of projects in your
community and thus play a key role in its development.

Performance snapshot
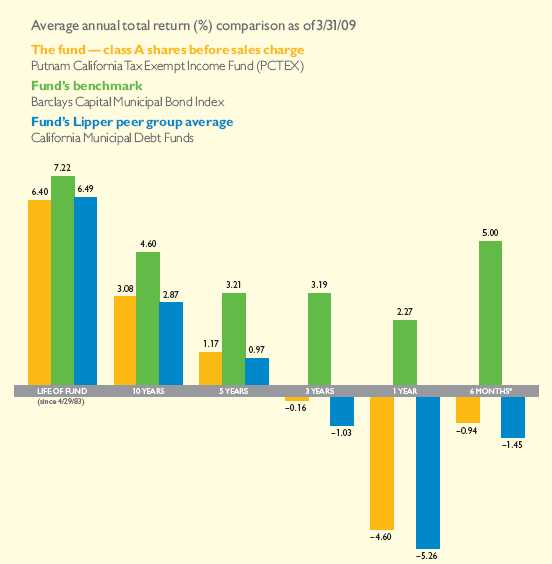
Current performance may be lower or higher than the quoted past performance, which cannot guarantee future results. Share price, principal value, and return will fluctuate, and you may have a gain or a loss when you sell your shares. Performance of class A shares assumes reinvestment of distributions and does not account for taxes. Fund returns in the bar chart do not reflect a sales charge of 4.00%; had they, returns would have been lower. See pages 7 and 12–14 for additional performance information. For a portion of the periods, this fund may have limited expenses, without which returns would have been lower. Due to market volatility, current performance may be higher or lower than performance shown. A 1% short-term trading fee may apply. To obtain the most recent month-end performance, visit putnam.com.
* Returns for the six-month period are not annualized, but cumulative.
6
Interview with your
fund’s Portfolio Manager
Thalia Meehan
Thank you,Thalia, for talking with us today about what has been a challenging six months for the fixed-income markets. How has this volatility affected the municipal bond market?
The fourth quarter of 2008 was dominated by continued extreme turmoil in credit markets following the collapse of Lehman Brothers. In addition, forced selling by hedge funds and investment banks put pressure on municipal bonds as these firms needed to raise capital and cover losses. All of this added up to an environment in which all investment-grade asset classes, including municipal bonds, underperformed U.S. Treasuries.
The economy remained weak in the first quarter of 2009, extending the recession that took hold in 2008, as financial markets, though improved from the fourth quarter, stayed in disarray. Consumer confidence was feeble, housing prices continued to retreat, and unemployment rose to levels not seen in decades. The U.S. government, notably the Federal Reserve [the Fed] and the
Broad market index and fund performance
This comparison shows your fund’s performance in the context of broad market indexes for the six months ended 3/31/09. See page 6 and 12–14 for additional fund performance information. Index descriptions can be found on page 18.

7
Treasury, implemented several wide-ranging measures to restore market stability and investor confidence, joining policymakers around the globe in efforts to shore up bank balance sheets and reestablish the flow of credit. That said, strong coupon reinvestment in January and February aided performance in high-grade municipal bonds. Against this backdrop, municipal bonds posted their best quarterly performance since 2004.
How did Putnam CaliforniaTax Exempt Income Fund perform?
Although the fund performed in line with its peers, it still posted a negative return for the period. For the six months ended March 31, 2009, the fund returned –0.94%, outperforming its Lipper class, California Municipal Debt Funds, which returned –1.45%. The fund simultaneously lagged its benchmark, the Barclays Capital Municipal Bond Index, which returned 5.00%. The national benchmark tracks the performance of a broader range of municipal bonds.
Can you describe what happened with municipal bonds during the period?
During the fourth quarter, dealer liquidity became more constrained with the historic bankruptcy of Lehman Brothers, the exit of UBS from the institutional market, and the purchase of Merrill Lynch by Bank of America. We saw a temporary lack of primary
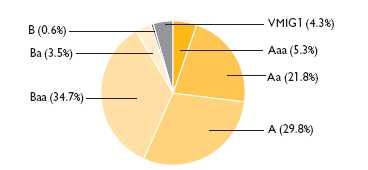
Credit quality overview
Credit qualities shown as a percentage of portfolio value as of 3/31/09. A bond rated Baa or higher (MIG3/VMIG3 or higher, for short-term debt) is considered investment grade. The chart reflects Moody’s ratings; percentages may include bonds not rated by Moody’s but considered by Putnam Management to be of comparable quality. Ratings will vary over time.
8
market supply as municipal bond issuers delayed new issuance due to market conditions. Because new issues typically help establish prices in the marketplace, as dealers delayed pricing new issues, secondary market liquidity was negatively affected. All of these issues put downward pressure on municipal bond prices, further hurting the asset class’s performance. Yields widened to unprecedented levels in mid-December before partially recovering as the primary market reopened and fund flows turned positive. The municipal market remained bifurcated as investors flocked to short-maturity bonds rated AA or above, while shunning issues with a credit rating below AA.
How did you position the portfolio in light of these ongoing issues?
During the period, the fund’s overall credit quality was high, and we remained underweight the long end of the curve. This positioning aided overall performance as the lower-rated issues underperformed their higher-quality peers. In addition, the portfolio’s overweight to 15- to 25-year maturities aided overall performance. From a sector perspective, an overweight to tobacco bonds constrained results. In March, we added exposure to California general obligation bonds at historically wide spreads.
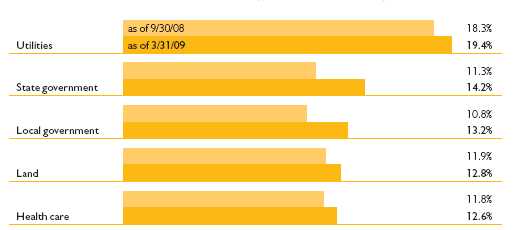
Comparison of top sector weightings
This chart shows how the fund’s top weightings have changed over the past six months. Weightings are shown as a percentage of net assets. Holdings will vary over time. Sector concentrations listed after the portfolio schedule in the Financial Statements section of this shareholder report are exclusive of insured or prerefunded status and may differ from the summary information below.
9
Any notable contributors and detractors?
Any high-quality bonds benefited as investors sought out quality during the period. Within the California Tax Exempt Income Fund, holding issues of University of the Pacific bonds aided overall performance. The high-quality issuer also benefited from a high level of applicants and strong admissions numbers.
As for holdings that hurt performance, any bond with a long maturity or lower credit quality suffered as the yield curve steepened and lower-rated instruments were punished as investors fled from perceived risk. An example of such a holding is Golden State Tobacco bonds, which have longer maturities and lower credit ratings. Tobacco settlement bonds are secured by the income stream from tobacco companies’ lawsuit settlement obligations to individual states and generally offer higher yields than bonds of comparable quality. The tobacco sector, however, underperformed as investors began a flight to quality credit. Because the market for tobacco bonds is large and relatively liquid, investors who wanted to trim credit exposure sold these liquid bonds first, which put pressure on the sector as a whole.
IN THE NEWS
On April 16, 2009, the U.S. Treasury Department launched a $9.9 billion mortgage modification program aimed at stemming the tide of rising, record foreclosures in the United States, which included a 24% year-over-year increase in foreclosure filings in first quarter 2009. Under the plan, which could help an estimated three to four million homeowners, the Treasury will pay six of the nation’s largest mortgage service companies a $1,000 onetime fee each time they reduce a homeowner’s mortgage payments to 38% of his or her income for five years. The Treasury would then subsidize further homeowner payments down to 31% of income. Further, these mortgage servicers will receive as much as $1,000 per year for as many as three years, if a borrower stays current in the program. Homeowners who maintain their standing in the program are also eligible to receive up to $1,000 a year for five years to be used to reduce loan prin cipals.
What is your outlook for the municipal bond market?
The Fed and the Treasury have taken unprecedented steps to inject liquidity into the credit markets, boost the economy, and help ease the flow of credit. The effects of these historic actions should help over time, but
10
the markets are likely, in our view, to remain challenging over the next several months. Just as I remarked six months ago, concerns remain about state budgets, the future of bond insurers, and the potential for regulatory changes.
Even in this environment, we see two notable reasons why municipal bond funds remain particularly attractive. The first is the likelihood of higher future tax rates. We believe that income tax rates are likely to rise when the Bush administration tax cuts are scheduled to discontinue, or “sunset,” in 2010. This has the potential to make municipal bonds an even more attractive asset class relative to taxable fixed income. Second, the overall credit quality of the municipal asset class is strong. What’s more, we believe that many areas of the municipal bond market have been oversold, creating opportunities to purchase issues at attractive yields.
Thank you,Thalia, for your time and insights today.
The views expressed in this report are exclusively those of Putnam Management. They are not meant as investment advice.
Please note that the holdings discussed in this report may not have been held by the fund for the entire period. Portfolio composition is subject to review in accordance with the fund’s investment strategy and may vary in the future. Current and future portfolio holdings are subject to risk.
11
Your fund’s performance
This section shows your fund’s performance, price, and distribution information for periods ended March 31, 2009, the end of the first half of its current fiscal year. In accordance with regulatory requirements for mutual funds, we also include expense information taken from the fund’s current prospectus. Performance should always be considered in light of a fund’s investment strategy. Data represents past performance. Past performance does not guarantee future results. More recent returns may be less or more than those shown. Investment return and principal value will fluctuate, and you may have a gain or a loss when you sell your shares. Performance information does not reflect any deduction for taxes a shareholder may owe on fund distributions or on the redemption of fund shares. For the most recent month-end performance, please visit the Individual Investors section of putnam.com or call Putnam at 1-800-225-1581. Class Y shares are generally only avail able to corporate and institutional clients and clients in other approved programs. See the Terms and Definitions section in this report for definitions of the share classes offered by your fund.
Fund performance Total return for periods ended 3/31/09
| | | | | | | | | |
| | Class A | Class B | Class C | Class M | Class Y |
| (inception dates) | (4/29/83) | (1/4/93) | (7/26/99) | (2/14/95) | (1/2/08) |
|
| | NAV | POP | NAV | CDSC | NAV | CDSC | NAV | POP | NAV |
|
| Annual average | | | | | | | | | |
| (life of fund) | 6.40% | 6.23% | 5.62% | 5.62% | 5.55% | 5.55% | 5.99% | 5.86% | 6.42% |
|
| 10 years | 35.44 | 30.02 | 26.95 | 26.95 | 25.07 | 25.07 | 31.34 | 27.23 | 35.99 |
| Annual average | 3.08 | 2.66 | 2.41 | 2.41 | 2.26 | 2.26 | 2.76 | 2.44 | 3.12 |
|
| 5 years | 5.98 | 1.68 | 2.51 | 0.88 | 1.79 | 1.79 | 4.30 | 0.84 | 6.40 |
| Annual average | 1.17 | 0.33 | 0.50 | 0.18 | 0.36 | 0.36 | 0.85 | 0.17 | 1.25 |
|
| 3 years | –0.49 | –4.45 | –2.45 | –5.05 | –2.83 | –2.83 | –1.39 | –4.50 | –0.08 |
| Annual average | –0.16 | –1.51 | –0.82 | –1.71 | –0.95 | –0.95 | –0.47 | –1.52 | –0.03 |
|
| 1 year | –4.60 | –8.38 | –5.34 | –9.88 | –5.30 | –6.21 | –5.01 | –8.11 | –4.38 |
|
| 6 months | –0.94 | –4.85 | –1.27 | –6.10 | –1.32 | –2.28 | –1.09 | –4.25 | –0.83 |
|
Current performance may be lower or higher than the quoted past performance, which cannot guarantee future results. After-sales-charge returns (public offering price, or POP) for class A and M shares reflect a maximum 4.00% and 3.25% load, respectively. Class B share returns reflect the applicable contingent deferred sales charge (CDSC), which is 5% in the first year, declining to 1% in the sixth year, and is eliminated thereafter. Class C shares reflect a 1% CDSC for the first year that is eliminated thereafter. Class Y shares have no initial sales charge or CDSC. Performance for class B, C, M, and Y shares before their inception is derived from the historical performance of class A shares, adjusted for the applicable sales charge (or CDSC) and, except for class Y shares, the higher operating expenses for such shares.
For a portion of the periods, this fund may have limited expenses, without which returns would have been lower.
Due to market volatility, current performance may be higher or lower than performance shown.
A 1% short-term trading fee may be applied to shares exchanged or sold within 7 days of purchase.
12
Comparative index returns For periods ended 3/31/09
| | |
| | Barclays Capital Municipal | Lipper California Municipal Debt |
| | Bond Index | Funds category average* |
|
| Annual average (life of fund) | 7.22% | 6.49% |
|
| 10 years | 56.73 | 33.18 |
| Annual average | 4.60 | 2.87 |
|
| 5 years | 17.10 | 5.21 |
| Annual average | 3.21 | 0.97 |
|
| 3 years | 9.88 | –2.74 |
| Annual average | 3.19 | –1.03 |
|
| 1 year | 2.27 | –5.26 |
|
| 6 months | 5.00 | –1.45 |
|
Index and Lipper results should be compared to fund performance at net asset value.
* Over the 6-month, 1-year, 3-year, 5-year, 10-year, and life-of-fund periods ended 3/31/09, there were 123, 121, 110, 101, 72, and 3 funds, respectively, in this Lipper category.
Fund price and distribution information For the six-month period ended 3/31/09
| | | | | | | |
| Distributions | Class A | Class B | Class C | Class M | Class Y |
|
| Number | 6 | 6 | 6 | 6 | 6 |
|
| Income 1 | $0.177686 | $0.155157 | $0.150699 | $0.167236 | $0.185447 |
|
| Capital gains 2 | — | — | — | — | — |
|
| Total | $0.177686 | $0.155157 | $0.150699 | $0.167236 | $0.185447 |
|
| Share value | NAV | POP | NAV | NAV | NAV | POP | NAV |
|
| 9/30/08 | $7.30 | $7.60 | $7.29 | $7.33 | $7.28 | $7.52 | $7.31 |
|
| 3/31/09 | 7.05 | 7.34 | 7.04 | 7.08 | 7.03 | 7.27 | 7.06 |
|
| Current yield (end of period) | NAV | POP | NAV | NAV | NAV | POP | NAV |
|
| Current dividend rate 3 | 4.93% | 4.74% | 4.29% | 4.14% | 4.65% | 4.49% | 5.15% |
|
| Taxable equivalent 4 | 8.46 | 8.13 | 7.36 | 7.10 | 7.98 | 7.70 | 8.83 |
|
| Current 30-day SEC yield 5 | N/A | 4.62 | 4.17 | 4.02 | N/A | 4.37 | 5.03 |
|
| Taxable equivalent 4 | N/A | 7.92 | 7.15 | 6.90 | N/A | 7.50 | 8.63 |
|
The classification of distributions, if any, is an estimate. Final distribution information will appear on your year-end tax forms.
1 For some investors, investment income may be subject to the federal alternative minimum tax.
2 Capital gains, if any, are taxable for federal and, in most cases, state purposes.
3 Most recent distribution, excluding capital gains, annualized and divided by NAV or POP at end of period.
4 Assumes maximum 41.70% federal and state combined tax rate for 2009. Results for investors subject to lower tax rates would not be as advantageous.
5 Based only on investment income and calculated using the maximum offering price for each share class, in accordance with SEC guidelines.
13
Fund’s annual operating expenses For the fiscal year ended 9/30/08
| | | | | |
| | Class A | Class B | Class C | Class M | Class Y* |
|
| Total annual fund operating expenses | 0.78% | 1.41% | 1.56% | 1.06% | 0.56% |
|
Expense information in this table is taken from the most recent prospectus, is subject to change, and may differ from that shown in the next section and in the financial highlights of this report. Expenses are shown as a percentage of average net assets.
* Expenses for class Y shares (added 1/2/08) are based on class A shares excluding distribution (12b-1) fees for the last fiscal year.
Your fund’s expenses
As a mutual fund investor, you pay ongoing expenses, such as management fees, distribution fees (12b-1 fees), and other expenses. In the most recent six-month period, your fund limited these expenses; had it not done so, expenses would have been higher. Using the following information, you can estimate how these expenses affect your investment and compare them with the expenses of other funds. You may also pay one-time transaction expenses, including sales charges (loads) and redemption fees, which are not shown in this section and would have resulted in higher total expenses. For more information, see your fund’s prospectus or talk to your financial representative.
Review your fund’s expenses
The following table shows the expenses you would have paid on a $1,000 investment in Putnam California Tax Exempt Income Fund from October 1, 2008, to March 31, 2009. It also shows how much a $1,000 investment would be worth at the close of the period, assuming actual returns and expenses.
| | | | | |
| | Class A | Class B | Class C | Class M | Class Y |
|
| Expenses paid per $1,000* | $3.97 | $7.13 | $7.88 | $5.41 | $2.93 |
|
| Ending value (after expenses) | $990.60 | $987.30 | $986.80 | $989.10 | $991.70 |
|
* Expenses for each share class are calculated using the fund’s annualized expense ratio for each class, which represents the ongoing expenses as a percentage of average net assets for the six months ended 3/31/09. The expense ratio may differ for each share class (see the last table in this section). Expenses are calculated by multiplying the expense ratio by the average account value for the period; then multiplying the result by the number of days in the period; and then dividing that result by the number of days in the year.
Estimate the expenses you paid
To estimate the ongoing expenses you paid for the six months ended March 31, 2009, use the following calculation method. To find the value of your investment on October 1, 2008, call Putnam at 1-800-225-1581.

14
Compare expenses using the SEC’s method
The Securities and Exchange Commission (SEC) has established guidelines to help investors assess fund expenses. Per these guidelines, the following table shows your fund’s expenses based on a $1,000 investment, assuming a hypothetical 5% annualized return. You can use this information to compare the ongoing expenses (but not transaction expenses or total costs) of investing in the fund with those of other funds. All mutual fund shareholder reports will provide this information to help you make this comparison. Please note that you cannot use this information to estimate your actual ending account balance and expenses paid during the period.
| | | | | |
| | Class A | Class B | Class C | Class M | Class Y |
|
| Expenses paid per $1,000* | $4.03 | $7.24 | $8.00 | $5.49 | $2.97 |
|
| Ending value (after expenses) | $1,020.94 | $1,017.75 | $1,017.00 | $1,019.50 | $1,021.99 |
|
* Expenses for each share class are calculated using the fund’s annualized expense ratio for each class, which represents the ongoing expenses as a percentage of average net assets for the six months ended 3/31/09. The expense ratio may differ for each share class (see the last table in this section). Expenses are calculated by multiplying the expense ratio by the average account value for the period; then multiplying the result by the number of days in the period; and then dividing that result by the number of days in the year.
Compare expenses using industry averages
You can also compare your fund’s expenses with the average of its peer group, as defined by Lipper, an independent fund-rating agency that ranks funds relative to others that Lipper considers to have similar investment styles or objectives. The expense ratio for each share class shown indicates how much of your fund’s average net assets have been used to pay ongoing expenses during the period.
| | | | | |
| | Class A | Class B | Class C | Class M | Class Y |
|
| Your fund’s annualized expense ratio | 0.80% | 1.44% | 1.59% | 1.09% | 0.59% |
|
| Average annualized expense ratio | | | | | |
| for Lipper peer group* | 0.80% | 1.44% | 1.59% | 1.09% | 0.59% |
|
* Putnam keeps fund expenses below the Lipper peer group average expense ratio by limiting our fund expenses if they exceed the Lipper average. The Lipper average is a simple average of front-end load funds in the peer group that excludes 12b-1 fees as well as any expense offset and brokerage/service arrangements that may reduce fund expenses. To facilitate the comparison in this presentation, Putnam has adjusted the Lipper average to reflect 12b-1 fees. Investors should note that the other funds in the peer group may be significantly smaller or larger than the fund, and that an asset-weighted average would likely be lower than the simple average. Also, the fund and Lipper report expense data at different times; the fund’s expense ratio shown here is annualized data for the most recent six-month period, while the quarterly updated Lipper average is based on the most recent fiscal year-end data available for the peer group funds as of 3/31/09.
15
Your fund’s portfolio turnover
Putnam funds are actively managed by experts who buy and sell securities based on intensive analysis of companies, industries, economies, and markets. Portfolio turnover is a measure of how often a fund’s managers buy and sell securities for your fund. A portfolio turnover of 100%, for example, means that the managers sold and replaced securities valued at 100% of a fund’s assets within a one-year period. Funds with high turnover may be more likely to generate capital gains that must be distributed to shareholders as taxable income. High turnover may also cause a fund to pay more brokerage commissions and other transaction costs, which may detract from performance.
Funds that invest in bonds or other fixed-income instruments may have higher turnover than funds that invest only in stocks. Short-term bond funds tend to have higher turnover than longer-term bond funds, because shorter-term bonds will mature or be sold more frequently than longer-term bonds. You can use the following table to compare your fund’s turnover with the average turnover for funds in its Lipper category.
Turnover comparisons Percentage of holdings that change every year
| | | | | |
| | 2008 | 2007 | 2006 | 2005 | 2004 |
|
| Putnam California Tax Exempt | | | | | |
| Income Fund | 48% | 36% | 12% | 21% | 13% |
|
| Lipper California Municipal Debt | | | | | |
| Funds category average | 32% | 23% | 22% | 17% | 24% |
|
Turnover data for the fund is calculated based on the fund's fiscal-year period, which ends on September 30. Turnover data for the fund's Lipper category is calculated based on the average of the turnover of each fund in the category for its fiscal year ended during the indicated year. Fiscal years vary across funds in the Lipper category, which may limit the comparability of the fund's portfolio turnover rate to the Lipper average. Comparative data for 2008 is based on information available as of 12/31/08.
Your fund’s management
In addition to Thalia Meehan, your fund’s Portfolio Managers are Paul Drury, Brad Libby, and Susan McCormack.
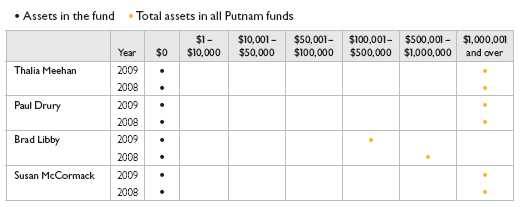
Portfolio management fund ownership
The following table shows how much the fund’s current Portfolio Managers have invested in the fund and in all Putnam mutual funds (in dollar ranges). Information shown is as of March 31, 2009, and March 31, 2008.
16
Trustee and Putnam employee fund ownership
As of March 31, 2009, all of the Trustees of the Putnam funds owned fund shares. The following table shows the approximate value of investments in the fund and all Putnam funds as of that date by the Trustees and Putnam employees. These amounts include investments by the Trustees’ and employees’ immediate family members and investments through retirement and deferred compensation plans.
| | |
| | Assets in the fund | Total assets in all Putnam funds |
|
| Trustees | $35,000 | $30,000,000 |
|
| Putnam employees | $13,000 | $319,000,000 |
|
Other Putnam funds managed by the Portfolio Managers
Thalia Meehan, Paul Drury, Brad Libby, and Susan McCormack are Portfolio Managers of Putnam’s open-end tax-exempt funds for the following states: Arizona, California, Massachusetts, Michigan, Minnesota, New Jersey, New York, Ohio, and Pennsylvania. The same group also manages Putnam Tax Exempt Income Fund, Putnam Tax-Free High Yield Fund, Putnam AMT-Free Municipal Fund*, Putnam Managed Municipal Income Trust, and Putnam Municipal Opportunities Trust.
Thalia Meehan, Paul Drury, Brad Libby, and Susan McCormack may also manage other accounts and variable trust funds advised by Putnam Management or an affiliate.
* Prior to November 30, 2008, the fund was known as Putnam AMT-Free Insured Municipal Fund.
17
Terms and definitions
Important terms
Total return shows how the value of the fund’s shares changed over time, assuming you held the shares through the entire period and reinvested all distributions in the fund.
Net asset value (NAV) is the price, or value, of one share of a mutual fund, without a sales charge. NAVs fluctuate with market conditions. NAV is calculated by dividing the net assets of each class of shares by the number of outstanding shares in the class.
Public offering price (POP) is the price of a mutual fund share plus the maximum sales charge levied at the time of purchase. POP performance figures shown here assume the 4.00% maximum sales charge for class A shares and 3.25% for class M shares.
Contingent deferred sales charge (CDSC) is generally a charge applied at the time of the redemption of class B or C shares and assumes redemption at the end of the period. Your fund’s class B CDSC declines from a 5% maximum during the first year to 1% during the sixth year. After the sixth year, the CDSC no longer applies. The CDSC for class C shares is 1% for one year after purchase.
Current yield is the annual rate of return earned from dividends or interest of an investment. Current yield is expressed as a percentage of the price of a security, fund share, or principal investment.
Share classes
Class A shares are generally subject to an initial sales charge and no CDSC (except on certain redemptions of shares bought without an initial sales charge).
Class B shares are not subject to an initial sales charge. They may be subject to a CDSC.
Class C shares are not subject to an initial sales charge and are subject to a CDSC only if the shares are redeemed during the first year.
Class M shares have a lower initial sales charge and a higher 12b-1 fee than class A shares and no CDSC.
Class Y shares are not subject to an initial sales charge or CDSC, and carry no 12b-1 fee. They are generally only available to corporate and institutional clients, and clients in other approved programs.
Comparative indexes
Barclays Capital Aggregate Bond Index is an unmanaged index of U.S. investment-grade fixed-income securities.
Barclays Capital Municipal Bond Index is an unmanaged index of long-term fixed-rate investment-grade tax-exempt bonds.
Merrill Lynch U.S. 3-Month Treasury Bill Index is an unmanaged index that seeks to measure the performance of U.S. Treasury bills available in the marketplace.
S&P 500 Index is an unmanaged index of common stock performance.
Indexes assume reinvestment of all distributions and do not account for fees. Securities and performance of a fund and an index will differ. You cannot invest directly in an index.
Lipper is a third-party industry-ranking entity that ranks mutual funds. Its rankings do not reflect sales charges. Lipper rankings are based on total return at net asset value relative to other funds that have similar current investment styles or objectives as determined by Lipper. Lipper may change a fund’s category assignment at its discretion. Lipper category averages reflect performance trends for funds within a category.
18
Trustee approval of management contract
General conclusions
The Board of Trustees of the Putnam funds oversees the management of each fund and, as required by law, determines annually whether to approve the continuance of your fund’s management contract with Putnam Investment Management (“Putnam Management”). In this regard, the Board of Trustees, with the assistance of its Contract Committee consisting solely of Trustees who are not “interested persons” (as such term is defined in the Investment Company Act of 1940, as amended) of the Putnam funds (the “Independent Trustees”), requests and evaluates all information it deems reasonably necessary under the circumstances. Over the course of several months ending in June 2008, the Contract Committee met several times to consider the information provided by Putnam Management and other information developed with the assistance of the Board’s independent counsel and independent staff. The Contract Committee reviewed and discussed key aspects of t his information with all of the Independent Trustees. The Contract Committee recommended, and the Independent Trustees approved, the continuance of your fund’s management contract, effective July 1, 2008.
The Independent Trustees’ approval was based on the following conclusions:
• That the fee schedule in effect for your fund represented reasonable compensation in light of the nature and quality of the services being provided to the fund, the fees paid by competitive funds and the costs incurred by Putnam Management in providing such services, and
• That this fee schedule represented an appropriate sharing between fund shareholders and Putnam Management of such economies of scale as may exist in the management of the fund at current asset levels.
These conclusions were based on a comprehensive consideration of all information provided to the Trustees, were subject to the continued application of certain expense reductions and waivers and other considerations noted below, and were not the result of any single factor. Some of the factors that figured particularly in the Trustees’ deliberations and how the Trustees considered these factors are described below, although individual Trustees may have evaluated the information presented differently, giving different weights to various factors. It is also important to recognize that the fee arrangements for your fund and the other Putnam funds are the result of many years of review and discussion between the Independent Trustees and Putnam Management, that certain aspects of such arrangements may receive greater scrutiny in some years than others, and that the Trustees’ conclusions may be based, in part, on their consideration of these same arrangements in prio r years.
Management fee schedules and
categories; total expenses
The Trustees reviewed the management fee schedules in effect for all Putnam funds, including fee levels and breakpoints, and the assignment of funds to particular fee categories. In reviewing fees and expenses, the Trustees generally focused their attention on material changes in circumstances — for example, changes in a fund’s size or investment style, changes in Putnam Management’s operating costs or responsibilities, or changes in competitive practices in the mutual fund industry — that suggest that consideration of fee changes might be warranted. The Trustees concluded that the circumstances did not warrant changes to the management fee structure of your fund, which had been carefully developed over the years,
19
re-examined on many occasions and adjusted where appropriate. In this regard, the Trustees also noted that shareholders of your fund voted in 2007 to approve new management contracts containing an identical fee structure. The Trustees focused on two areas of particular interest, as discussed further below:
• Competitiveness. The Trustees reviewed comparative fee and expense information for competitive funds, which indicated that, in a custom peer group of competitive funds selected by Lipper Inc., your fund ranked in the 58th percentile in management fees and in the 29th percentile in total expenses (less any applicable 12b-1 fees) as of December 31, 2007 (the first percentile being the least expensive funds and the 100th percentile being the most expensive funds). (Because the fund’s custom peer group is smaller than the fund’s broad Lipper Inc. peer group, this expense information may differ from the Lipper peer expense information found elsewhere in this report.) The Trustees noted that expense ratios for a number of Putnam funds, which show the percentage of fund assets used to pay for management and administrative services, distribution (12b-1) fees and other expenses, had been increas ing recently as a result of declining net assets and the natural operation of fee breakpoints.
The Trustees noted that the expense ratio increases described above were currently being controlled by expense limitations initially implemented in January 2004. The Trustees have received a commitment from Putnam Management and its parent company to continue this program through at least June 30, 2009. These expense limitations give effect to a commitment by Putnam Management that the expense ratio of each open-end fund would be no higher than the average expense ratio of the competitive funds included in the fund’s relevant Lipper universe (exclusive of any applicable 12b-1 charges in each case). The Trustees observed that this commitment to limit fund expenses has served shareholders well since its inception.
In order to ensure that the expenses of the Putnam funds continue to meet evolving competitive standards, the Trustees requested, and Putnam Management agreed, to extend for the twelve months beginning July 1, 2008, an additional expense limitation for certain funds at an amount equal to the average expense ratio (exclusive of 12b-1 charges) of a custom peer group of competitive funds selected by Lipper to correspond to the size of the fund. This additional expense limitation will be applied to those open-end funds that had above-average expense ratios (exclusive of 12b-1 charges) based on the custom peer group data for the period ended December 31, 2007. This additional expense limitation will not be applied to your fund because it had a below-average expense ratio relative to its custom peer group.
In addition, the Trustees devoted particular attention to analyzing the Putnam funds’ fees and expenses relative to those of competitors in fund complexes of comparable size and with a comparable mix of asset categories. The Trustees concluded that this analysis did not reveal any matters requiring further attention at the current time.
• Economies of scale. Your fund currently has the benefit of breakpoints in its management fee that provide shareholders with significant economies of scale, which means that the effective management fee rate of the fund (as a percentage of fund assets) declines as the fund grows in size and crosses specified asset thresholds. Conversely, if the fund shrinks in size — as has been the case for many Putnam funds in recent years — these breakpoints result in increasing fee levels. In recent years, the Trustees have examined the operation of the existing breakpoint structure during periods of both growth and decline in asset levels. The Trustees concluded that the fee
20
schedule in effect for your fund represented an appropriate sharing of economies of scale at current asset levels.
In connection with their review of the management fees and total expenses of the Putnam funds, the Trustees also reviewed the costs of the services to be provided and profits to be realized by Putnam Management and its affiliates from the relationship with the funds. This information included trends in revenues, expenses and profitability of Putnam Management and its affiliates relating to the investment management and distribution services provided to the funds. In this regard, the Trustees also reviewed an analysis of Putnam Management’s revenues, expenses and profitability with respect to the funds’ management contracts, allocated on a fund-by-fund basis.
Investment performance
The quality of the investment process provided by Putnam Management represented a major factor in the Trustees’ evaluation of the quality of services provided by Putnam Management under your fund’s management contract. The Trustees were assisted in their review of the Putnam funds’ investment process and performance by the work of the Investment Oversight Coordinating Committee of the Trustees and the Investment Oversight Committees of the Trustees, which had met on a regular monthly basis with the funds’ portfolio teams throughout the year. The Trustees concluded that Putnam Management generally provides a high-quality investment process — as measured by the experience and skills of the individuals assigned to the management of fund portfolios, the resources made available to such personnel, and in general the ability of Putnam Management to attract and retain high-quality personnel —but also recognized that this does not guarantee favorabl e investment results for every fund in every time period. The Trustees considered the investment performance of each fund over multiple time periods and considered information comparing each fund’s performance with various benchmarks and with the performance of competitive funds.
While the Trustees noted the satisfactory investment performance of certain Putnam funds, they considered the disappointing investment performance of many funds in recent periods, particularly over periods in 2007 and 2008. They discussed with senior management of Putnam Management the factors contributing to such underperformance and actions being taken to improve performance. The Trustees recognized that, in recent years, Putnam Management has taken steps to strengthen its investment personnel and processes to address areas of underperformance, including recent efforts to further centralize Putnam Management’s equity research function. In this regard, the Trustees took into consideration efforts by Putnam Management to improve its ability to assess and mitigate investment risk in individual funds, across asset classes, and across the complex as a whole. The Trustees indicated their intention to continue to monitor performance trends to assess the effectiveness of these efforts and to evaluate whether additional changes to address areas of underperformance are warranted.
In the case of your fund, the Trustees considered that your fund’s class A share cumulative total return performance at net asset value was in the following percentiles of its Lipper Inc. peer group (Lipper California Municipal Debt Funds) (compared using tax-adjusted performance to recognize the different federal income tax treatment for capital gains distributions and exempt-interest distributions) for the one-year, three-year and five-year periods ended December 31, 2007 (the first percentile being the best-performing
21
funds and the 100th percentile being the worst-performing funds):
| | | |
| One-year period | 33rd | | |
| | |
| Three-year period | 45th | | |
| | |
| Five-year period | 43rd | | |
| | |
(Because of the passage of time, these performance results may differ from the performance results for more recent periods shown elsewhere in this report.) Over the one-year, three-year and five-year periods ended December 31, 2007, there were 117, 107 and 99 funds, respectively, in your fund’s Lipper peer group.* Past performance is no guarantee of future returns.
As a general matter, the Trustees believe that cooperative efforts between the Trustees and Putnam Management represent the most effective way to address investment performance problems. The Trustees noted that investors in the Putnam funds have, in effect, placed their trust in the Putnam organization, under the oversight of the funds’ Trustees, to make appropriate decisions regarding the management of the funds. Based on the responsiveness of Putnam Management in the recent past to Trustee concerns about investment performance, the Trustees concluded that it is preferable to seek change within Putnam Management to address performance shortcomings. In the Trustees’ view, the alternative of engaging a new investment adviser for an underperforming fund would entail significant disruptions and would not provide any greater assurance of improved investment performance.
Brokerage and soft-dollar allocations;
other benefits
The Trustees considered various potential benefits that Putnam Management may receive in connection with the services it provides under the management contract with your fund. These include benefits related to brokerage and soft-dollar allocations, whereby a portion of the commissions paid by a fund for brokerage may be used to acquire research services that may be useful to Putnam Management in managing the assets of the fund and of other clients. The Trustees considered changes made in 2008, at Putnam Management’s request, to the Putnam funds’ brokerage allocation policy, which expanded the permitted categories of brokerage and research services payable with soft dollars and increased the permitted soft dollar allocation to third-party services over what had been authorized in previous years. The Trustees indicated their continued intent to monitor the potential benefits associated with the allocation of fund brokerage and trends in industry practice to ensur e that the principle of seeking “best price and execution” remains paramount in the portfolio trading process.
The Trustees’ annual review of your fund’s management contract arrangements also included the review of its distributor’s contract and distribution plan with Putnam Retail Management Limited Partnership and the investor servicing agreement with Putnam Fiduciary Trust Company (“PFTC”), each of which provides benefits to affiliates of Putnam
* The percentile rankings for your fund’s class A share annualized total return performance in the Lipper California Municipal Debt Funds category for the one-year, five-year, and ten-year periods ended March 31, 2009, were 59%, 57%, and 47%, respectively. Over the one-year, five-year, and ten-year periods ended March 31, 2009, your fund ranked 71st out of 121, 58th out of 101, and 34th out of 72 funds, respectively. Unlike the information above, these rankings reflect performance before taxes. Note that this more recent information was not available when the Trustees approved the continuance of your fund’s management contract.
22
Management. In the case of the investor servicing agreement, the Trustees considered that certain shareholder servicing functions were shifted to a third-party service provider by PFTC in 2007.
Comparison of retail and institutional
fee schedules
The information examined by the Trustees as part of their annual contract review has included for many years information regarding fees charged by Putnam Management and its affiliates to institutional clients such as defined benefit pension plans, college endowments, etc. This information included comparisons of such fees with fees charged to the funds, as well as a detailed assessment of the differences in the services provided to these two types of clients. The Trustees observed, in this regard, that the differences in fee rates between institutional clients and mutual funds are by no means uniform when examined by individual asset sectors, suggesting that differences in the pricing of investment management services to these types of clients reflect to a substantial degree historical competitive forces operating in separate market places. The Trustees considered the fact that fee rates across different asset classes are typically higher o n average for mutual funds than for institutional clients, as well as the differences between the services that Putnam Management provides to the Putnam funds and those that it provides to institutional clients of the firm, but did not rely on such comparisons to any significant extent in concluding that the management fees paid by your fund are reasonable.
23
Other information for shareholders
Important notice regarding delivery
of shareholder documents
In accordance with SEC regulations, Putnam sends a single copy of annual and semiannual shareholder reports, prospectuses, and proxy statements to Putnam shareholders who share the same address, unless a shareholder requests otherwise. If you prefer to receive your own copy of these documents, please call Putnam at 1-800-225-1581, and Putnam will begin sending individual copies within 30 days.
Proxy voting
Putnam is committed to managing our mutual funds in the best interests of our shareholders. The Putnam funds’ proxy voting guidelines and procedures, as well as information regarding how your fund voted proxies relating to portfolio securities during the 12-month period ended June 30, 2008, are available in the Individual
Investors section of putnam.com, and on the SEC’s Web site, www.sec.gov. If you have questions about finding forms on the SEC’s Web site, you may call the SEC at 1-800-SEC-0330. You may also obtain the Putnam funds’ proxy voting guidelines and procedures at no charge by calling Putnam’s Shareholder Services at 1-800-225-1581.
Fund portfolio holdings
The fund will file a complete schedule of its portfolio holdings with the SEC for the first and third quarters of each fiscal year on Form N-Q. Shareholders may obtain the fund’s Forms N-Q on the SEC’s Web site at www.sec.gov. In addition, the fund’s Forms N-Q may be reviewed and copied at the SEC’s Public Reference Room in Washington, D.C. You may call the SEC at 1-800-SEC-0330 for information about the SEC’s Web site or the operation of the Public Reference Room.
24
Financial statements
A guide to financial statements
These sections of the report, as well as the accompanying Notes, constitute the fund’s financial statements.
The fund’s portfolio lists all the fund’s investments and their values as of the last day of the reporting period. Holdings are organized by asset type and industry sector, country, or state to show areas of concentration and diversification.
Statement of assets and liabilities shows how the fund’s net assets and share price are determined. All investment and noninvestment assets are added together. Any unpaid expenses and other liabilities are subtracted from this total. The result is divided by the number of shares to determine the net asset value per share, which is calculated separately for each class of shares. (For funds with preferred shares, the amount subtracted from total assets includes the liquidation preference of preferred shares.)
Statement of operations shows the fund’s net investment gain or loss. This is done by first adding up all the fund’s earnings —from dividends and interest income — and subtracting its operating expenses to determine net investment income (or loss). Then, any net gain or loss the fund realized on the sales of its holdings — as well as any unrealized gains or losses over the period — is added to or subtracted from the net investment result to determine the fund’s net gain or loss for the fiscal period.
Statement of changes in net assets shows how the fund’s net assets were affected by the fund’s net investment gain or loss, by distributions to shareholders, and by changes in the number of the fund’s shares. It lists distributions and their sources (net investment income or realized capital gains) over the current reporting period and the most recent fiscal year-end. The distributions listed here may not match the sources listed in the Statement of operations because the distributions are determined on a tax basis and may be paid in a different period from the one in which they were earned. Dividend sources are estimated at the time of declaration. Actual results may vary. Any non-taxable return of capital cannot be determined until final tax calculations are completed after the end of the fund’s fiscal year.
Financial highlights provide an overview of the fund’s investment results, per-share distributions, expense ratios, net investment income ratios, and portfolio turnover in one summary table, reflecting the five most recent reporting periods. In a semiannual report, the highlight table also includes the current reporting period.
25
The fund’s portfolio 3/31/09 (Unaudited)
| |
| Key to abbreviations | |
| AGO Assured Guaranty, Ltd. | IF COP Inverse Floating Rate Certificates |
| AMBAC AMBAC Indemnity Corporation | of Participation |
| Cmnwlth. of PR Gtd. Commonwealth of Puerto | NATL National Public Finance Guarantee Corp. |
| Rico Guaranteed | Radian Insd. Radian Group Insured |
| COP Certificate of Participation | TAN Tax Anticipation Notes |
| FGIC Financial Guaranty Insurance Company | TRAN Tax Revenue Anticipation Notes |
| FSA Financial Security Assurance | U.S. Govt. Coll. U.S. Government Collateralized |
| G.O. Bonds General Obligation Bonds | VRDN Variable Rate Demand Notes |
| | XLCA XL Capital Assurance |
| | | |
| MUNICIPAL BONDS AND NOTES (101.2%)* | Rating** | Principal amount | Value |
|
| California (97.0%) | | | |
| Assn. of Bay Area Governments Fin. Auth. COP | | | |
| (Odd Fellows Home), 6s, 8/15/24 | A | $1,000,000 | $992,980 |
|
| Acalanes, Unified High School Dist. G.O. Bonds | | | |
| (Election of 2002), Ser. A, FGIC, zero %, 8/1/21 | | | |
| (Prerefunded) | Aa2 | 5,815,000 | 3,348,568 |
|
| Alameda Cnty., Unified School Dist. G.O. Bonds, | | | |
| Ser. A, FSA, zero %, 8/1/15 | AAA | 1,000,000 | 799,390 |
|
| Alameda, Corridor Trans. Auth. Rev. Bonds, Ser. A | | | |
| NATL, 5 1/4s, 10/1/21 | AA– | 9,500,000 | 9,650,195 |
| AMBAC, zero %, 10/1/19 | A | 48,270,000 | 27,398,052 |
|
| Alhambra, Unified School Dist. G.O. Bonds | | | |
| (Election of 2004), Ser. A, FGIC, 5s, 8/1/24 | AA– | 1,825,000 | 1,769,757 |
|
| Anaheim, COP, NATL, 6.2s, 7/16/23 | AA | 32,000,000 | 32,135,360 |
|
| Anaheim, Pub. Fin. Auth. Rev. Bonds (Distr. Syst.), NATL | | | |
| 5 1/4s, 10/1/23 | AA– | 7,575,000 | 7,763,618 |
| 5 1/4s, 10/1/22 | AA– | 6,700,000 | 6,922,440 |
| 5s, 10/1/29 | AA– | 1,945,000 | 1,856,211 |
|
| Anaheim, Pub. Fin. Auth. Lease Rev. Bonds | | | |
| (Cap. Appn. Sub. Impt.), Ser. C, FSA, zero %, 9/1/30 | AAA | 1,290,000 | 243,036 |
| (Cap. Appn. Sub. Pub. Impt.), Class C, FSA, | | | |
| zero %, 9/1/22 | AAA | 6,500,000 | 2,584,400 |
| (Pub. Impt.), Ser. C, FSA, zero %, 9/1/19 | AAA | 1,770,000 | 901,390 |
|
| Arcadia, Unified School Dist. G.O. Bonds | | | |
| (Election of 2006), Ser. A, FSA, zero %, 8/1/18 | AAA | 1,500,000 | 983,220 |
|
| Aromas-San Juan, Unified School Dist. G.O. Bonds, | | | |
| Ser. A, FGIC, zero %, 8/1/26 | BBB+ | 1,475,000 | 477,900 |
|
| Bay Area Toll Auth. of CA Rev. Bonds | | | |
| (San Francisco Bay Area) | | | |
| Ser. F, 5s, 4/1/31 T | AA | 13,600,000 | 12,650,176 |
| Ser. F1, 5s, 4/1/34 | AA | 5,000,000 | 4,707,800 |
|
| Burbank, Pub. Fin. Auth. Rev. Bonds (West Olive | | | |
| Redev.), AMBAC, 5s, 12/1/26 | A | 3,390,000 | 2,901,840 |
|
| Burbank, Unified School Dist. G.O. Bonds | | | |
| (Election of 1997), Ser. C, FGIC, zero %, 8/1/18 | AA | 2,345,000 | 1,555,415 |
|
| CA Edl. Fac. Auth. Rev. Bonds | | | |
| (Claremont Graduate U.), Ser. A, 6s, 3/1/38 | A3 | 1,045,000 | 1,008,833 |
| (CA Lutheran U.), 5 3/4s, 10/1/38 | Baa1 | 5,000,000 | 3,971,200 |
26
| | | |
| MUNICIPAL BONDS AND NOTES (101.2%)* cont. | Rating** | Principal amount | Value |
|
| California cont. | | | |
| CA Edl. Fac. Auth. Rev. Bonds | | | |
| (U. Redlands), Ser. A, 5 1/8s, 8/1/38 | A3 | $6,430,000 | $5,369,179 |
| (Claremont Graduate U.), Ser. A, 5 1/8s, 3/1/28 | A3 | 1,270,000 | 1,148,753 |
| (U. of the Pacific), 5s, 11/1/36 | A2 | 1,750,000 | 1,434,090 |
| (Claremont Graduate U.), Ser. A, 5s, 3/1/31 | A3 | 2,465,000 | 2,085,809 |
| (CA College of Arts), 5s, 6/1/30 | Baa3 | 1,825,000 | 1,205,029 |
| (Lutheran U.), Ser. C, 5s, 10/1/29 | Baa1 | 1,500,000 | 1,070,175 |
| (Claremont Graduate U.), Ser. A, 5s, 3/1/26 | A3 | 1,200,000 | 1,089,840 |
| (U. of the Pacific), 5s, 11/1/25 | A2 | 4,000,000 | 3,613,400 |
| (Lutheran U.), Ser. C, 5s, 10/1/24 | Baa1 | 1,250,000 | 968,388 |
| (U. of the Pacific), 5s, 11/1/16 | A2 | 1,095,000 | 1,137,201 |
| (U. of the Pacific), 5s, 11/1/14 | A2 | 295,000 | 311,570 |
| (U. of the Pacific), 5s, 11/1/13 | A2 | 525,000 | 556,889 |
| (U. of the Pacific), 5s, 11/1/11 | A2 | 625,000 | 658,475 |
| (Lutheran U.), Ser. C, 4 1/2s, 10/1/19 | Baa1 | 2,830,000 | 2,308,403 |
|
| CA Hlth. Fac. Fin. Auth. Rev. Bonds | | | |
| (Providence Hlth. & Svcs.), Ser. C, 6 1/2s, 10/1/38 | Aa2 | 5,500,000 | 5,733,200 |
| (Providence Hlth. & Svcs.), Class C, 6 1/4s, 10/1/28 | Aa2 | 3,350,000 | 3,501,119 |
| (Catholic Hlth. Care West), Ser. J, 5 5/8s, 7/1/32 | A2 | 7,750,000 | 7,122,638 |
| (Sutter Hlth.), Ser. A, NATL, 5 3/8s, 8/15/30 | Aa3 | 1,600,000 | 1,536,112 |
| (Kaiser Permanente), Ser. A, 5 1/4s, 4/1/39 | A+ | 1,000,000 | 841,350 |
| (Kaiser Permanente), Ser. A, 5s, 4/1/37 | A+ | 10,000,000 | 8,118,000 |
| (Cedars-Sinai Med. Ctr.), 5s, 11/15/34 | A2 | 6,750,000 | 5,498,010 |
| (CA-NV Methodist), 5s, 7/1/26 | A | 1,745,000 | 1,524,380 |
| (Lucile Salter Packard Hosp.), Ser. C, AMBAC, | | | |
| 5s, 8/15/24 | Aa2 | 6,390,000 | 6,397,029 |
| (Stanford Hosp. & Clinics), Ser. A, 5s, 11/15/23 | A1 | 7,250,000 | 6,589,453 |
| Ser. B, AMBAC, 5s, 7/1/21 | A2 | 3,500,000 | 3,443,125 |
| (Cedars Sinai Med. Ctr.), 5s, 11/15/15 | A2 | 2,900,000 | 2,973,689 |
|
| CA Hsg. Fin. Agcy. Rev. Bonds | | | |
| Ser. J, 5 3/4s, 8/1/47 | Aa2 | 4,995,000 | 4,963,282 |
| (Home Mtge.), Ser. H, FGIC, 5 3/4s, 8/1/30 | Aa2 | 15,000 | 14,480 |
| (Multi-Fam. Hsg. III), Ser. B, NATL, 5 1/2s, 8/1/39 | Aa3 | 1,650,000 | 1,435,170 |
| (Home Mtge.), Ser. L, 5.2s, 8/1/28 | Aa2 | 4,500,000 | 4,109,175 |
| (Home Mtge.), Ser. M, 4 3/4s, 8/1/42 | Aa2 | 8,050,000 | 5,683,944 |
| (Home Mtge.), Ser. K, 4 5/8s, 8/1/26 | Aa2 | 2,500,000 | 1,979,200 |
| (Home Mtge.), Ser. I, 4.6s, 8/1/21 | Aa2 | 5,000,000 | 4,313,250 |
|
| CA Infrastructure & Econ. Dev. Bank Rev. Bonds | | | |
| (Oakland Unified School Dist. Fin.), 5s, 8/15/22 | A+ | 4,985,000 | 5,131,260 |
| Ser. B, 4s, 6/1/10 | B/P | 1,000,000 | 250,000 |
| Ser. A, zero %, 12/1/20 | B/P | 2,445,000 | 337,557 |
| Ser. A, zero %, 12/1/19 | B/P | 3,445,000 | 502,419 |
| Ser. A, zero %, 12/1/18 | B/P | 4,890,000 | 756,385 |
| Ser. A, zero %, 12/1/17 | B/P | 2,445,000 | 401,053 |
| Ser. A, zero %, 12/1/16 | B/P | 2,445,000 | 423,792 |
| Ser. A, zero %, 12/1/15 | B/P | 2,440,000 | 445,788 |
|
| CA Muni. Fin. Auth. COP | | | |
| (Cmnty. Hosp. Central CA), 5 1/4s, 2/1/46 | Baa2 | 11,000,000 | 7,124,150 |
| (Cmnty. Hosp. Central CA), 5 1/4s, 2/1/27 | Baa2 | 8,000,000 | 5,910,000 |
| (Cmnty. Hosp. Central CA), 5s, 2/1/22 | Baa2 | 2,400,000 | 1,864,320 |
|
27
| | | |
| MUNICIPAL BONDS AND NOTES (101.2%)* cont. | Rating** | Principal amount | Value |
|
| California cont. | | | |
| CA Muni. Fin. Auth. Rev. Bonds | | | |
| (Biola U.), 5 7/8s, 10/1/34 | Baa1 | $6,500,000 | $5,300,880 |
| (Biola U.), 5.8s, 10/1/28 | Baa1 | 220,000 | 184,765 |
| (Loma Linda U.), 5s, 4/1/28 | A2 | 2,000,000 | 1,856,280 |
| (U. Students COOP Assn.), 5s, 4/1/22 | BBB– | 790,000 | 573,982 |
|
| CA Poll. Control Fin. Auth. VRDN (Pacific Gas & | | | |
| Electric Corp.) | | | |
| Ser. F, 0.2s, 11/1/26 | A–1+ | 6,400,000 | 6,400,000 |
| Ser. C, 0.25s, 11/1/26 | A–1+ | 10,400,000 | 10,400,000 |
| Ser. E, 0.2s, 11/1/26 | VMIG1 | 7,500,000 | 7,500,000 |
|
| CA Poll. Control Fin. Auth. Solid Waste Disp. | | | |
| Rev. Bonds | | | |
| (Keller Canyon Landfill Co.), 6 7/8s, 11/1/27 | BBB | 1,000,000 | 898,240 |
| (Browning-Ferris), 6 3/4s, 9/1/19 | BBB | 4,195,000 | 3,978,706 |
| (Waste Management, Inc.), Ser. A-2, 5.4s, 4/1/25 | BBB | 7,500,000 | 5,774,400 |
| (Waste Management, Inc.), Ser. B, 5s, 7/1/27 | BBB | 4,500,000 | 3,178,395 |
|
| CA State G.O. Bonds | | | |
| 6 1/2s, 4/1/33 | A2 | 43,000,000 | 45,225,250 |
| 5 3/4s, 4/1/31 # # | A2 | 23,000,000 | 22,639,130 |
| 5 1/2s, 3/1/26 | A1 | 2,000,000 | 1,973,920 |
| 5 1/4s, 3/1/30 | A1 | 2,155,000 | 1,992,879 |
| 5 1/4s, 12/1/23 | A1 | 10,750,000 | 10,576,603 |
| 5 1/4s, 2/1/20 | A1 | 5,000,000 | 5,128,400 |
| 5 1/8s, 3/1/25 | A1 | 2,060,000 | 1,950,387 |
| 5 1/8s, 3/1/24 | A1 | 2,435,000 | 2,320,847 |
| 5s, 2/1/29 (Prerefunded) | AAA | 400,000 | 442,484 |
|
| CA State VRDN (Kindergarten U.), Ser. A-2, | | | |
| 0.4s, 5/1/34 | VMIG1 | 10,550,000 | 10,550,000 |
|
| CA State Dept. of Wtr. Resources Rev. Bonds | | | |
| FSA, 5 1/8s, 12/1/29 | AAA | 4,885,000 | 4,921,491 |
| FSA, 5 1/8s, 12/1/29 (Prerefunded) | AAA | 115,000 | 127,714 |
| (Central Valley), Ser. AE, 5s, 12/1/29 | AAA | 1,250,000 | 1,257,225 |
|
| CA State Dept. of Wtr. Resources VRDN (Pwr. Supply) | | | |
| Ser. B-1, 0.25s, 5/1/22 | VMIG1 | 2,350,000 | 2,350,000 |
| Ser. F-4, 0.25s, 5/1/22 | VMIG1 | 16,100,000 | 16,100,000 |
|
| CA State Econ. Recvy. VRDN, Ser. C-2, 0.35s, 7/1/23 | VMIG1 | 1,610,000 | 1,610,000 |
|
| CA State Pub. Wks. Board Rev. Bonds (Dept. of Gen. | | | |
| Svcs. Butterfield), Ser. ST-A | | | |
| 5 1/4s, 6/1/25 | A2 | 2,500,000 | 2,356,775 |
| 5s, 6/1/23 | A2 | 2,900,000 | 2,727,740 |
|
| CA State Pub. Wks. Board Lease Rev. Bonds | | | |
| Ser. A, NATL, 6 1/2s, 9/1/17 | AA | 28,000,000 | 32,051,879 |
| (Dept. of Corrections-State Prisons), Ser. A, AMBAC, | | | |
| 5s, 12/1/19 | A2 | 33,500,000 | 32,997,500 |
|
| CA State U. Rev. Bonds (Systemwide), Ser. A, | | | |
| 5 3/4s, 11/1/28 | Aa3 | 5,000,000 | 5,197,450 |
|
| CA Statewide Cmnty. Dev. Mandatory Put Bonds | | | |
| (Hsg. Equity Res.), Ser. B, 5.2s, 6/15/09 | Baa1 | 5,850,000 | 5,892,647 |
|
| CA Statewide Cmnty. Dev. Auth. COP (The Internext | | | |
| Group), 5 3/8s, 4/1/30 | BBB | 15,300,000 | 10,364,985 |
|
28
| | | |
| MUNICIPAL BONDS AND NOTES (101.2%)* cont. | Rating** | Principal amount | Value |
|
| California cont. | | | |
| CA Statewide Cmnty. Dev. Auth. 144A Rev. Bonds | | | |
| (Front Porch Cmntys. & Svcs.), Ser. A, 5 1/8s, 4/1/37 | BBB | $9,500,000 | $5,969,705 |
|
| CA Statewide Cmnty. Dev. Auth. Special Tax Mandatory | | | |
| Put Bonds (Hsg. Equity Res. — C), Ser. C, 5.2s, 6/15/09 | Baa1 | 4,000,000 | 4,029,160 |
|
| CA Statewide Cmnty. Dev. Auth. Special Tax Rev. Bonds | | | |
| (Cmnty. Fac. Dist. No. 1-Zone 1C), 7 1/4s, 9/1/30 | BB/P | 2,270,000 | 2,134,095 |
| (Citrus Garden Apt. Project — D1), 5 1/4s, 7/1/22 | A | 1,630,000 | 1,498,443 |
| (Cmnty. Fac. Dist. No. 1-Zone 1B), zero %, 9/1/20 | BB/P | 1,435,000 | 535,642 |
|
| CA Statewide Cmnty. Dev. Auth. Rev. Bonds | | | |
| (Thomas Jefferson School of Law), Ser. A, 7 1/4s, | | | |
| 10/1/38 | BB+ | 2,415,000 | 1,823,977 |
| (Enloe Med. Ctr.), 6 1/4s, 8/15/33 | A+ | 7,500,000 | 7,131,075 |
| (Enloe Med. Ctr.), 6 1/4s, 8/15/28 | A+ | 5,000,000 | 4,922,400 |
| (Irvine LLC-UCI East Campus), 6s, 5/15/40 | Baa2 | 10,000,000 | 8,011,300 |
| (Catholic Hlth. Care West), Ser. A, 5 1/2s, 7/1/30 | A2 | 12,000,000 | 10,932,000 |
| (Kaiser Permanente), Ser. B, 5 1/4s, 3/1/45 | A+ | 14,000,000 | 11,591,300 |
| (Kaiser Permanente), Ser. B, 5s, 3/1/41 | A+ | 7,500,000 | 6,018,600 |
| (Henry Mayo Newhall Memorial Hosp.), 5s, 10/1/27 | A | 3,685,000 | 3,164,899 |
| (Huntington Memorial Hosp.), 5s, 7/1/21 | A+ | 2,205,000 | 2,043,506 |
| (Henry Mayo Newhall Memorial Hosp.), 5s, 10/1/20 | A | 1,055,000 | 1,023,593 |
| (Sr. Living-Presbyterian Homes), Ser. A, | | | |
| 4 7/8s, 11/15/36 | BBB+ | 1,000,000 | 643,100 |
| (Kaiser Permanente), Ser. A, 4 3/4s, 4/1/33 | A+ | 1,600,000 | 1,264,160 |
|
| CA Statewide Cmnty. Dev. Auth. VRDN (Children’s | | | |
| Hosp.), Ser. C, 0.3s, 8/15/34 | VMIG1 | 1,800,000 | 1,800,000 |
|
| CA Statewide Fin. Auth. Tobacco Settlement Rev. | | | |
| Bonds, Class B, 5 5/8s, 5/1/29 | Baa3 | 3,320,000 | 2,337,811 |
|
| CA Tobacco Securitization Agcy. Rev. Bonds | | | |
| (Sonoma Cnty. Corp.), Ser. B, 5 1/2s, 6/1/30 | | | |
| (Prerefunded) | AAA/F | 5,000,000 | 5,661,550 |
| stepped-coupon Rev. Bonds, zero %, | | | |
| (5.25s, 12/1/18) 6/1/21 †† | Baa3 | 10,000,000 | 6,381,200 |
|
| Carlsbad, Unified School Dist. G.O. Bonds, FGIC, | | | |
| zero %, 11/1/21 | Aa3 | 2,250,000 | 1,200,105 |
|
| Center, Unified School Dist. G.O. Bonds (Election | | | |
| of 1991), Ser. D, NATL, zero %, 8/1/23 | AA– | 5,855,000 | 2,353,476 |
|
| Chabot-Las Positas, Cmnty. College Dist. G.O. Bonds | | | |
| (Election of 2004), Ser. B, AMBAC, zero %, 8/1/17 | Aa2 | 3,785,000 | 2,627,812 |
|
| Chino Basin, Desalter Auth. Rev. Bonds, Ser. A, AGO, | | | |
| 5s, 6/1/30 | AAA | 5,865,000 | 5,678,552 |
|
| Chino Basin, Regl. Fin. Auth. Rev. Bonds, AMBAC, | | | |
| 5 3/4s, 8/1/22 | Aa3 | 32,000,000 | 32,428,800 |
|
| Chino Valley, Unified School Dist. G.O. Bonds | | | |
| (Election of 2002), Ser. D, FGIC | | | |
| zero %, 8/1/26 | AA | 4,415,000 | 1,428,120 |
| zero %, 8/1/25 | AA | 3,945,000 | 1,386,904 |
|
| Chula Vista, Cmnty. Fac. Dist. Special Tax Rev. Bonds | | | |
| (No. 06-1 Eastlake Woods Area) | | | |
| 6.2s, 9/1/33 | BBB/P | 3,750,000 | 3,313,725 |
| 6.15s, 9/1/26 | BBB/P | 2,000,000 | 1,835,920 |
29
| | | |
| MUNICIPAL BONDS AND NOTES (101.2%)* cont. | Rating** | Principal amount | Value |
|
| California cont. | | | |
| Chula Vista, Cmnty. Fac. Dist. Special Tax Rev. Bonds | | | |
| (No. 07-1 Otay Ranch Village Eleven) | | | |
| 5 7/8s, 9/1/34 | BB/P | $2,485,000 | $1,824,015 |
| 5.1s, 9/1/26 | BB/P | 360,000 | 244,094 |
|
| Chula Vista, Indl. Dev. Rev. Bonds (San Diego Gas), | | | |
| Ser. B, 5s, 12/1/27 | A1 | 5,000,000 | 3,884,150 |
|
| Coast, Cmnty. College Dist. G.O. Bonds, NATL | | | |
| zero %, 8/1/22 | Aa2 | 1,280,000 | 659,328 |
| zero %, 8/1/21 | Aa2 | 4,500,000 | 2,480,580 |
|
| Commerce, Joint Pwr. Fin. Auth. Tax Alloc. Bonds | | | |
| (Redev. No. 1), Ser. A, AMBAC, 5s, 8/1/26 | A | 250,000 | 207,790 |
|
| Commerce, Redev. Agcy. Rev. Bonds (Project 1), | | | |
| zero %, 8/1/21 (Prerefunded) | BBB | 66,780,000 | 35,081,537 |
|
| Compton, Unified School Dist. G.O. Bonds (Election | | | |
| of 2002), Ser. D, AMBAC | | | |
| zero %, 6/1/18 | A2 | 7,295,000 | 4,809,302 |
| zero %, 6/1/17 | A2 | 7,145,000 | 5,032,938 |
| zero %, 6/1/16 | A2 | 6,885,000 | 5,137,656 |
| zero %, 6/1/14 | A2 | 2,970,000 | 2,464,239 |
| zero %, 6/1/13 | A2 | 1,440,000 | 1,258,186 |
|
| Contra Costa Cnty., Pub. Fin. Auth. Tax Alloc. Bonds | | | |
| (Contra Costa Centre), Ser. A, NATL, 4 3/4s, 8/1/26 | AA– | 2,095,000 | 1,581,285 |
|
| Contra Costa, Home Mtge. Fin. Auth. Rev. Bonds, | | | |
| Ser. G, NATL, zero %, 9/1/17 (Prerefunded) | Aaa | 35,000,000 | 20,168,750 |
|
| Corona, Cmnty. Fac. Dist. Special Tax (No. 97-2 | | | |
| Eagle Glen), Ser. 97-2, 5 3/4s, 9/1/16 | BBB/P | 2,395,000 | 2,174,157 |
|
| Delano, COP (Delano Regl. Med. Ctr.), 5.6s, 1/1/26 | BBB– | 19,700,000 | 15,406,778 |
|
| Desert Sands, Unified School Dist. G.O. Bonds, | | | |
| AMBAC, zero %, 6/1/13 | Aa3 | 2,050,000 | 1,820,790 |
|
| Duarte, COP, Ser. A | | | |
| 5 1/4s, 4/1/31 | A+ | 7,000,000 | 5,716,690 |
| 5 1/4s, 4/1/24 | A+ | 7,500,000 | 6,700,500 |
|
| El Camino, Hosp. Dist. Rev. Bonds, Ser. A, AMBAC, | | | |
| 6 1/4s, 8/15/17 (Prerefunded) | A | 10,725,000 | 12,514,144 |
|
| Folsom Cordova, Unified School Dist. G.O. Bonds | | | |
| (School Fac. Impt. Dist. No. 1), Ser. A, NATL, | | | |
| zero %, 10/1/25 | AA | 1,505,000 | 582,345 |
| zero %, 10/1/23 | AA | 1,445,000 | 654,455 |
|
| Foothill/Eastern Corridor Agcy. Rev. Bonds | | | |
| (CA Toll Roads) | | | |
| 5 3/4s, 1/15/40 | Baa3 | 19,000,000 | 13,798,750 |
| NATL, 5 3/8s, 1/15/14 | AA– | 5,000,000 | 4,771,350 |
| Ser. A, 5s, 1/1/35 | Baa3 | 2,000,000 | 1,325,600 |
|
| Gateway, Unified School Dist. COP, FSA | | | |
| zero %, 3/1/27 | AAA | 410,000 | 136,485 |
| zero %, 3/1/26 | AAA | 390,000 | 140,283 |
| zero %, 3/1/25 | AAA | 375,000 | 147,829 |
| zero %, 3/1/24 | AAA | 360,000 | 155,812 |
| zero %, 3/1/23 | AAA | 345,000 | 157,841 |
|
30
| | | |
| MUNICIPAL BONDS AND NOTES (101.2%)* cont. | Rating** | Principal amount | Value |
|
| California cont. | | | |
| Golden State Tobacco Securitization Corp. Rev. Bonds | | | |
| Ser. A-4, 7.8s, 6/1/42 (Prerefunded) | Aaa | $6,075,000 | $7,393,336 |
| Ser. 03 A-1, 6 1/4s, 6/1/33 (Prerefunded) | Aaa | 13,060,000 | 14,436,132 |
| Ser. A-1, 5 3/4s, 6/1/47 | BBB | 15,000,000 | 8,566,800 |
| Ser. A-1, 5 1/8s, 6/1/47 | BBB | 20,375,000 | 10,493,329 |
| Ser. A-1, 5s, 6/1/33 | BBB | 54,390,000 | 32,040,060 |
| Ser. A-1, 4 1/2s, 6/1/27 | BBB | 4,000,000 | 2,944,640 |
| Ser. A, AMBAC, zero %, 6/1/24 | Aa2 | 15,500,000 | 5,458,170 |
|
| Golden State Tobacco Securitization Corp. | | | |
| stepped-coupon Rev. Bonds, Ser. A, zero %,(4.55% | | | |
| 6/1/2010) 6/1/22 †† | AAA | 4,085,000 | 3,410,158 |
|
| Golden West, School Fin. Auth. Rev. Bonds, | | | |
| Ser. A, NATL | | | |
| zero %, 8/1/20 | AA | 2,000,000 | 1,150,680 |
| zero %, 2/1/20 | AA | 2,480,000 | 1,462,084 |
|
| Huntington Beach, Cmnty. Fac. Dist. Special Tax | | | |
| (No. 2003-1 Huntington Ctr.) | | | |
| 5.85s, 9/1/33 | BB/P | 2,845,000 | 2,096,964 |
| 5.8s, 9/1/23 | BB/P | 1,000,000 | 807,120 |
|
| Irvine Ranch, Wtr. Dist. VRDN, 0.3s, 4/1/33 | VMIG1 | 1,950,000 | 1,950,000 |
|
| Irvine, Impt. Board Act of 1915 G.O. Bonds | | | |
| (Assmt. Dist. No. 03-19-Group 2), 5.45s, 9/2/23 | BB+/P | 1,000,000 | 874,630 |
|
| Irvine, Impt. Board Act of 1915 Special Assmt. Bonds | | | |
| (Dist. No. 04-20) | | | |
| 5s, 9/2/25 | BB/P | 3,000,000 | 2,127,270 |
| 5s, 9/2/21 | BB/P | 1,000,000 | 796,790 |
| 5s, 9/2/20 | BB/P | 1,000,000 | 796,660 |
| 5s, 9/2/19 | BB/P | 1,000,000 | 858,440 |
| 4 7/8s, 9/2/18 | BB/P | 1,000,000 | 873,390 |
| 4.8s, 9/2/17 | BB/P | 1,000,000 | 885,740 |
| 4.7s, 9/2/16 | BB/P | 1,350,000 | 1,213,164 |
| 4 5/8s, 9/2/15 | BB/P | 1,290,000 | 1,176,080 |
| 4 1/2s, 9/2/14 | BB/P | 1,235,000 | 1,142,832 |
| 4.4s, 9/2/13 | BB/P | 1,180,000 | 1,106,368 |
| 4.3s, 9/2/12 | BB/P | 1,000,000 | 950,830 |
| 4 1/4s, 9/2/11 | BB/P | 1,085,000 | 1,048,284 |
|
| Irvine, Impt. Board Act of 1915 Special Assmt. Bonds | | | |
| (Dist. No. 00-18-Group 2), 5.6s, 9/2/22 | BBB/P | 5,000,000 | 4,724,800 |
| (Dist. No. 00-18-Group 3), 5.55s, 9/2/26 | BBB/P | 1,825,000 | 1,665,203 |
|
| Irvine, Impt. Board Act of 1915 VRDN (Dist. No. 93-14), | | | |
| Ser. 14, 0.2s, 9/2/25 | VMIG1 | 9,625,000 | 9,625,000 |
|
| Irvine, Impt. Board Act of 1915 Ltd. Oblig. Special Assmt. | | | |
| Bonds (No. 03-19 Group 4), 5s, 9/2/29 | BB+/P | 710,000 | 478,725 |
|
| Jurupa, Unified School Dist. G.O. Bonds, FGIC, | | | |
| zero %, 8/1/23 | AA | 1,470,000 | 673,745 |
|
| Kern Cnty., Wtr. Agcy. Impt. COP (Dist. No. 4), Ser. A, | | | |
| AGO, 5s, 5/1/28 | AAA | 5,030,000 | 4,855,861 |
|
| La Quinta, Redev. Agcy. Tax Alloc. (Area No. 1), | | | |
| AMBAC, 5s, 9/1/21 | A+ | 1,950,000 | 1,765,628 |
|
| Lake Elsinore, Pub. Fin. Auth. Tax Alloc. Rev. Bonds, | | | |
| Ser. C, 6.7s, 10/1/33 | BBB/P | 13,365,000 | 11,280,861 |
|
31
| | | |
| MUNICIPAL BONDS AND NOTES (101.2%)* cont. | Rating** | Principal amount | Value |
|
| California cont. | | | |
| Lake Elsinore, School Fin. Auth. Rev. Bonds, FSA, | | | |
| 4 3/4s, 10/1/26 | AAA | $1,595,000 | $1,501,597 |
|
| Las Virgenes, Unified School Dist. G.O. Bonds | | | |
| Ser. A, FSA, 5s, 8/1/28 | AAA | 5,245,000 | 5,186,990 |
| FSA, zero %, 11/1/23 | AAA | 1,395,000 | 681,974 |
|
| Long Beach, Bond Fin. Auth. Rev. Bonds (Natural Gas), | | | |
| Ser. A | | | |
| 5 1/2s, 11/15/30 | A+ | 8,500,000 | 5,695,255 |
| 5 1/2s, 11/15/28 | A+ | 5,000,000 | 3,412,050 |
|
| Los Angeles Cnty., COP (Disney), AMBAC, | | | |
| zero %, 9/1/11 | A+ | 2,000,000 | 1,883,700 |
|
| Los Angeles, Cmnty. College Dist. G.O. Bonds | | | |
| (Election of 2008), Ser. A, 6s, 8/1/33 | Aa2 | 10,000,000 | 10,501,700 |
| (Election of 2001), Ser. E-1, 5s, 8/1/25 | Aa2 | 5,000,000 | 5,003,350 |
|
| Los Angeles, Cmnty. Redev. Agcy. Fin. Auth. Rev. Bonds | | | |
| (Bunker Hill), Ser. A, FSA, 5s, 12/1/27 | AAA | 16,000,000 | 13,654,240 |
|
| Los Angeles, Harbor Dept. Rev. Bonds, U.S. Govt. Coll., | | | |
| 7.6s, 10/1/18 (Prerefunded) | AAA | 19,415,000 | 24,132,068 |
|
| Los Angeles, Unified School Dist. G.O. Bonds, Ser. F, | | | |
| 5s, 7/1/29 | Aa3 | 2,000,000 | 1,909,160 |
|
| Metro. Wtr. Dist. Rev. Bonds (Southern CA Wtr. Wks.) | | | |
| 5 3/4s, 8/10/18 | Aa2 | 45,000,000 | 48,721,500 |
| Ser. A, 5s, 7/1/32 | AAA | 10,000,000 | 9,837,200 |
| Ser. A, 5s, 7/1/26 | AAA | 7,790,000 | 7,979,764 |
|
| Modesto, High School Dist. Stanislaus Cnty., G.O. | | | |
| Bonds, Ser. A, FGIC, zero %, 8/1/24 | AA– | 1,200,000 | 512,364 |
|
| Mount Pleasant, Elementary School Dist. G.O. Bonds | | | |
| (Election of 1998), Ser. E, AMBAC, zero %, 9/1/14 | | | |
| (Prerefunded) | A+ | 1,080,000 | 913,907 |
|
| Murrieta Valley, Unified School Dist. G.O. Bonds, FSA, | | | |
| zero %, 9/1/31 | AAA | 6,445,000 | 1,383,226 |
|
| Napa Valley, Cmnty. College Dist. G.O. Bonds | | | |
| (Election of 2002), Ser. C, NATL | | | |
| zero %, 8/1/22 | AA– | 5,000 | 2,490 |
| zero %, 8/1/21 | AA– | 8,575,000 | 4,581,451 |
|
| Natomas, Unified School Dist. G.O. Bonds, FGIC | | | |
| zero %, 8/1/29 | AA– | 4,210,000 | 1,179,095 |
| zero %, 8/1/22 | AA– | 1,500,000 | 713,820 |
| zero %, 8/1/21 | AA– | 1,500,000 | 765,675 |
|
| North Natomas, Cmnty. Fac. Special Tax Bonds | | | |
| Ser. B, 6 3/8s, 9/1/31 | BBB/P | 6,260,000 | 4,898,325 |
| (Dist. No. 4), Ser. D, 5s, 9/1/33 | BBB/P | 3,845,000 | 2,483,024 |
| Ser. D, 5s, 9/1/26 | BBB/P | 1,745,000 | 1,239,543 |
|
| Oakland, Joint Powers Fin. Auth. VRDN (Fruitvale | | | |
| Transit Village), Ser. B, 0.28s, 7/1/33 | VMIG1 | 1,045,000 | 1,045,000 |
|
| Oakland, Swr. Rev. Bonds, Ser. A, FSA, 5s, 6/15/26 | AAA | 3,690,000 | 3,725,018 |
|
| Ontario, COP (Wtr. Syst. Impt.), NATL, 5s, 7/1/29 | AA– | 4,900,000 | 4,648,483 |
|
32
| | | |
| MUNICIPAL BONDS AND NOTES (101.2%)* cont. | Rating** | Principal amount | Value |
|
| California cont. | | | |
| Orange Cnty., Cmnty. Fac. Dist. Special Tax Rev. Bonds | | | |
| (Ladera Ranch — No. 01-1), Ser. A, 6s, 8/15/32 | | | |
| (Prerefunded) | AAA | $2,400,000 | $2,601,648 |
| (Ladera Ranch — No. 02-1), Ser. A, 5.55s, 8/15/33 | BBB/P | 3,725,000 | 2,774,715 |
| (Ladera Ranch — No. 03-1), Ser. A, 5 5/8s, 8/15/34 | BBB/P | 2,750,000 | 2,275,763 |
| (Ladera Ranch — No. 03-1), Ser. A, 5 1/2s, 8/15/23 | BBB/P | 1,000,000 | 891,140 |
|
| Palomar Pomerado, Hlth. G.O. Bonds (Election | | | |
| of 2004), Ser. A, AGO, zero %, 8/1/24 | AAA | 5,130,000 | 1,979,564 |
|
| Pasadena, Cap. Impt. IF COP, AMBAC, 5.35s, 2/1/14 | A | 24,855,000 | 27,066,845 |
|
| Placentia, Redev. Auth. Tax Alloc. Rev. Bonds, Ser. B, | | | |
| 5 3/4s, 8/1/32 | BBB+ | 3,000,000 | 2,650,410 |
|
| Pleasant Valley, School Dist. Ventura Cnty., G.O. Bonds, | | | |
| Ser. C, NATL, 5.8s, 8/1/30 (Prerefunded) | AA | 1,180,000 | 1,181,251 |
|
| Poway, Unified School Dist. G.O. Bonds (Election | | | |
| of 2008), zero %, 8/1/29 | Aa3 | 11,350,000 | 3,432,921 |
|
| Poway, Unified School Dist. Cmnty. Facs. Special Tax | | | |
| (Cmnty. Fac. Dist. No. 14-Del Sur), 5 1/4s, 9/1/36 | BB–/P | 5,500,000 | 3,653,265 |
|
| Rancho Cordova, Cmnty. Fac. Dist. Special Tax | | | |
| (No. 2003-1 Sunridge Anatolia), 6.1s, 9/1/37 | BBB/P | 1,485,000 | 1,114,983 |
|
| Rancho Mirage, Joint Powers Fin. Auth. Rev. Bonds | | | |
| (Eisenhower Med. Ctr.), Ser. A, 5s, 7/1/38 | A3 | 3,500,000 | 2,707,950 |
| (Eisenhower Med. Ctr.), Ser. B, NATL, 4 7/8s, 7/1/22 | Baa1 | 4,000,000 | 3,434,160 |
|
| Redding, Elec. Syst. COP, NATL, 6.368s, 7/1/22 | | | |
| (Prerefunded) | AA– | 20,800,000 | 23,235,472 |
|
| Redwood City, Redev. Agcy., TAN (Redev. Area 2-A), | | | |
| AMBAC, zero %, 7/15/22 | A | 3,230,000 | 1,603,921 |
|
| Rio Linda, Unified School Dist. G.O. Bonds (Election | | | |
| of 2006), FSA, 5s, 8/1/31 | AAA | 10,000,000 | 9,127,500 |
|
| Ripon, Redev. Agcy. Tax Alloc. (Cmnty. Redev.), NATL, | | | |
| 4 3/4s, 11/1/36 | A3 | 1,600,000 | 1,178,160 |
|
| Riverside Cnty., Pub. Fin. Auth. COP, 5.8s, 5/15/29 | BBB– | 4,250,000 | 3,259,495 |
|
| Rohnert Pk., Cmnty. Dev. Agcy. Tax Alloc. Bonds | | | |
| (Rohnert Redev.), NATL, zero %, 8/1/25 | AA | 1,340,000 | 487,077 |
|
| Roseville, Natural Gas Fin. Auth. Rev. Bonds | | | |
| 5s, 2/15/21 | A1 | 1,145,000 | 822,774 |
| 5s, 2/15/17 | A1 | 2,495,000 | 1,972,522 |
| 5s, 2/15/15 | A1 | 4,435,000 | 3,700,076 |
|
| Sacramento City Fin. Auth. TAN, Ser. A, FGIC, | | | |
| zero %, 12/1/23 | AA | 15,815,000 | 6,049,712 |
|
| Sacramento Cnty., Arpt. Syst. Rev. Bonds, Ser. A, FSA | | | |
| 5s, 7/1/28 | AAA | 1,500,000 | 1,456,560 |
| 5s, 7/1/26 | AAA | 5,000,000 | 4,976,750 |
| 5s, 7/1/25 | AAA | 3,990,000 | 4,007,277 |
| 5s, 7/1/24 | AAA | 2,715,000 | 2,756,974 |
|
| Sacramento, Special Tax Rev. Bonds (North Natomas | | | |
| Cmnty. Fac.) | | | |
| Ser. 01-03, 6s, 9/1/28 | BBB/P | 1,500,000 | 1,134,420 |
| 5.7s, 9/1/23 | BBB/P | 4,905,000 | 3,830,216 |
|
33
| | | |
| MUNICIPAL BONDS AND NOTES (101.2%)* cont. | Rating** | Principal amount | Value |
|
| California cont. | | | |
| Sacramento, City Fin. Auth. Tax Alloc. Bonds | | | |
| Ser. A, FGIC, zero %, 12/1/22 | AA | $7,500,000 | $3,113,175 |
| (Cap. Appn.), Ser. A, FGIC, zero %, 12/1/19 | AA | 5,000,000 | 2,529,300 |
|
| Sacramento, Muni. Util. Dist. Elec. Rev. Bonds | | | |
| Ser. A, NATL, 6 1/4s, 8/15/10 (Prerefunded) | AA– | 8,350,000 | 8,479,175 |
| Ser. K, AMBAC, 5 1/4s, 7/1/24 | A1 | 11,500,000 | 11,833,155 |
|
| Sacramento, Muni. Util. Dist. Fin. Auth. Rev. Bonds | | | |
| (Cosumnes), NATL, 5s, 7/1/19 | AA– | 1,070,000 | 1,012,017 |
|
| Salinas, Unified School Dist. G.O. Bonds (Cap. Appn.), | | | |
| Ser. A, FGIC, zero %, 10/1/24 | AA | 1,200,000 | 496,308 |
|
| San Bernardino, Cmnty. College Dist. G.O. Bonds | | | |
| (Election of 2002), Ser. A, 6 1/4s, 8/1/33 | Aa3 | 1,000,000 | 1,060,800 |
|
| San Diego Cnty., Wtr. Auth. COP (Stars & Cars), | | | |
| Ser. B, NATL, 6.3s, 4/21/11 | AA+ | 56,700,000 | 60,019,217 |
|
| San Diego, Assn. of Bay Area Governments Fin. Auth. | | | |
| For Nonprofit Corps. Rev. Bonds (San Diego Hosp.), | | | |
| Ser. A, 6 1/8s, 8/15/20 | A3 | 8,750,000 | 8,703,275 |
|
| San Diego, Cmnty. College Dist. G.O. Bonds | | | |
| (Election of 2006), FSA, 5s, 8/1/25 | AAA | 9,610,000 | 9,746,654 |
| (Election of 2002), FSA, 5s, 5/1/25 | AAA | 2,405,000 | 2,437,588 |
| (Election of 2002), FSA, 5s, 5/1/24 | AAA | 1,590,000 | 1,624,169 |
|
| San Diego, Pub. Fac. Fin. Auth. TAN (Southcrest), | | | |
| Ser. B, Radian Insd., 5 1/8s, 10/1/22 | A3 | 1,000,000 | 893,410 |
|
| San Diego, Redev. Agcy. Tax Alloc. (Centre City), | | | |
| Ser. A, XLCA, 5s, 9/1/22 | A3 | 4,665,000 | 4,272,487 |
|
| San Diego, Redev. Agcy. TRAN (Centre City), Ser. A, | | | |
| XLCA, 5 1/4s, 9/1/15 | A3 | 3,215,000 | 3,321,738 |
|
| San Francisco, City & Cnty. Redev. Fin. Auth. Rev. Bonds | | | |
| (Redev. Project), Ser. B, FGIC, 5 1/4s, 8/1/18 | AA– | 7,225,000 | 7,291,181 |
|
| San Francisco, City & Cnty. Arpt. Comm. Rev. Bonds | | | |
| (Intl. Arpt.), Ser. 34D, AGO, 5 1/4s, 5/1/25 | AAA | 2,250,000 | 2,267,685 |
|
| San Joaquin Hills, Trans. Corridor Agcy. Rev. Bonds | | | |
| (Toll Road), Ser. A | | | |
| 5s, 1/1/33 | Ba2 | 34,125,000 | 23,974,519 |
| NATL, 5 3/8s, 1/15/29 | AA | 5,790,000 | 3,958,044 |
| NATL, zero %, 1/15/32 | AA | 25,000,000 | 3,562,750 |
| NATL, zero %, 1/15/26 | AA | 48,135,000 | 12,069,851 |
| NATL, zero %, 1/15/23 | AA | 21,625,000 | 7,248,916 |
|
| San Jose, Redev. Agcy. Tax Alloc. Bonds (Merged | | | |
| Area Redev.), Ser. B, Radian Insd., 5s, 8/1/32 | A3 | 3,935,000 | 3,139,068 |
|
| San Jose, Redev. Agcy. Tax Alloc. Rev. Bonds, Ser. B, | | | |
| 6 1/4s, 8/1/20 | A3 | 5,025,000 | 5,319,214 |
|
| San Jose, Unified School Dist. Santa Clara Cnty., G.O. | | | |
| Bonds, FGIC, zero %, 8/1/15 | AA | 1,250,000 | 996,138 |
|
| San Juan, Basin Auth. Rev. Bonds (Ground Wtr. Recvy.), | | | |
| AMBAC, 5s, 12/1/34 | A | 1,000,000 | 855,260 |
|
34
| | | |
| MUNICIPAL BONDS AND NOTES (101.2%)* cont. | Rating** | Principal amount | Value |
|
| California cont. | | | |
| San Marcos, Pub. Fac. Auth. Rev. Bonds | | | |
| 5.8s, 9/1/27 | Baa3 | $2,995,000 | $2,417,893 |
| 5.8s, 9/1/18 | Baa3 | 1,635,000 | 1,541,723 |
| 5 1/2s, 9/1/10 | Baa3 | 760,000 | 767,418 |
|
| San Mateo Cnty., Cmnty. College G.O. Bonds | | | |
| (Election of 2005), Ser. A, NATL, zero %, 9/1/26 | Aa1 | 4,000,000 | 1,477,000 |
|
| Santa Barbara Cnty., Waterfront COP, AMBAC, | | | |
| 5s, 10/1/27 | A | 4,590,000 | 4,434,170 |
|
| Santaluz, Cmnty. Facs. Dist. No. 2 Special Tax | | | |
| Rev. Bonds | | | |
| (Impt. Area No. 1), Ser. B, 6 3/8s, 9/1/30 | BBB/P | 12,100,000 | 10,152,988 |
| (Impt. Area No. 3), Ser. B, 6.2s, 9/1/30 | BBB/P | 500,000 | 429,785 |
| (Impt. Area No. 3), Ser. B, 6.1s, 9/1/21 | BBB/P | 500,000 | 450,020 |
|
| Saugus, Unified School Dist. G.O. Bonds, FGIC, | | | |
| zero %, 8/1/24 | AA | 1,210,000 | 510,100 |
|
| Semitropic, Impt. Dist. Wtr. Storage Rev. Bonds, | | | |
| Ser. A, XLCA, 5 1/8s, 12/1/35 | A | 5,000,000 | 4,052,650 |
|
| Shasta Tehama Trinity, Joint Cmnty. College Dist. | | | |
| G.O. Bonds (Election of 2002), Ser. B, FSA, 5s, 8/1/30 | AAA | 7,070,000 | 6,574,252 |
|
| Sierra View, Hlth. Care Dist. Rev. Bonds | | | |
| 5 1/4s, 7/1/37 | A/F | 2,000,000 | 1,518,620 |
| 5 1/4s, 7/1/32 | A/F | 1,000,000 | 782,220 |
|
| Sierra, Joint Cmnty. College Dist. School Fac. Impt. G.O. | | | |
| Bonds (Dist. No. 2 Western NV), Ser. B, NATL | | | |
| zero %, 8/1/15 | AA | 1,495,000 | 1,176,670 |
| zero %, 8/1/14 | AA | 1,295,000 | 1,070,810 |
| zero %, 8/1/13 | AA | 1,275,000 | 1,112,272 |
|
| Silicon Valley, Tobacco Securitization Auth. Rev. Bonds | | | |
| (Santa Clara), Ser. A, zero %, 6/1/36 | BBB+/F | 9,300,000 | 565,812 |
|
| Solano, Cmnty. College Dist. G.O. Bonds (Election | | | |
| of 2002), Ser. B, FGIC, zero %, 8/1/25 | AA | 9,020,000 | 3,447,534 |
|
| Southern CA Pub. Pwr. Auth. Rev. Bonds | | | |
| (Natural Gas No. 1), Ser. A, 5 1/4s, 11/1/24 | A | 2,850,000 | 2,148,900 |
| (Natural Gas), Ser. A, 5 1/4s, 11/1/21 | A | 1,500,000 | 1,171,620 |
|
| Stockton, Redev. Agcy. Rev. Bonds (Stockton | | | |
| Events Ctr.), FGIC, 5s, 9/1/28 | AA– | 1,500,000 | 1,344,915 |
|
| Sunnyvale, Cmnty. Fac. Dist. Special Tax Rev. Bonds, | | | |
| 7.65s, 8/1/21 | BB–/P | 5,360,000 | 4,782,406 |
|
| Sweetwater, High School COP, FSA, 5s, 9/1/27 | AAA | 7,840,000 | 7,954,621 |
|
| Thousand Oaks, Cmnty. Fac. Dist. Special Tax Rev. | | | |
| Bonds (Marketplace 94-1) | | | |
| 6 7/8s, 9/1/24 | B/P | 5,000,000 | 4,443,450 |
| zero %, 9/1/14 | B/P | 2,805,000 | 1,847,289 |
|
| Tobacco Securitization Auth. of Southern CA Rev. Bonds | | | |
| Ser. A, 5 5/8s, 6/1/43 (Prerefunded) | AAA | 5,000,000 | 5,672,500 |
| Class A1-SNR, 5 1/8s, 6/1/46 | BBB | 5,000,000 | 2,580,000 |
| Ser. A1-SNR, 5s, 6/1/37 | BBB | 2,000,000 | 1,039,040 |
| Ser. A1-SNR, 4 3/4s, 6/1/25 | BBB | 15,825,000 | 11,454,134 |
|
35
| | | |
| MUNICIPAL BONDS AND NOTES (101.2%)* cont. | Rating** | Principal amount | Value |
|
| California cont. | | | |
| Torrance Memorial Med. Ctr. Rev. Bonds, Ser. A | | | |
| 6s, 6/1/22 | A1 | $1,500,000 | $1,510,125 |
| 5 1/2s, 6/1/31 | A1 | 2,000,000 | 1,812,140 |
|
| Tracy, Operational Partnership, Joint Powers Auth. | | | |
| Lease Rev. Bonds, AGO | | | |
| 6 3/8s, 10/1/38 | AAA | 2,200,000 | 2,297,878 |
| 6 1/4s, 10/1/33 | AAA | 3,000,000 | 3,117,450 |
|
| Tustin, Unified School Dist. Special Tax (Cmnty. Fac. | | | |
| Dist. No. 97-1), FSA, 5s, 9/1/32 | AAA | 1,000,000 | 949,700 |
|
| Vernon, Natural Gas Fin. Auth. Mandatory Put Bonds, | | | |
| Ser. A-4, NATL, 5s, 8/3/09 | AA | 4,730,000 | 4,710,654 |
|
| Washington Twp., Hlth. Care Dist. Rev. Bonds, Ser. A | | | |
| 5s, 7/1/17 | A3 | 1,125,000 | 1,105,549 |
| 5s, 7/1/16 | A3 | 535,000 | 531,432 |
| 5s, 7/1/14 | A3 | 975,000 | 986,583 |
|
| West Basin, Muni. Wtr. Dist. COP, Ser. A, NATL, | | | |
| 5s, 8/1/30 | Aa3 | 5,745,000 | 5,455,624 |
|
| West Contra Costa, Unified School Dist. G.O. | | | |
| Bonds, NATL, FGIC | | | |
| zero %, 8/1/19 | AA– | 6,985,000 | 4,123,944 |
| zero %, 8/1/18 | AA– | 7,535,000 | 4,827,750 |
|
| West Kern, Cmnty. Coll. Dist. G.O. Bonds (Election | | | |
| of 2004), Ser. B, XLCA | | | |
| zero %, 11/1/24 | A+ | 2,395,000 | 906,388 |
| zero %, 11/1/22 | A+ | 2,315,000 | 1,033,416 |
| zero %, 11/1/20 | A+ | 1,240,000 | 671,237 |
|
| | | | 1,551,382,895 |
| Puerto Rico (4.2%) | | | |
| Children’s Trust Fund Tobacco Settlement Rev. Bonds | | | |
| (Asset Backed Bonds), 5 5/8s, 5/15/43 | BBB | 4,000,000 | 2,630,760 |
|
| Cmnwlth. of PR, Aqueduct & Swr. Auth. Rev. Bonds, | | | |
| Ser. A | | | |
| 6s, 7/1/44 | Baa3 | 14,000,000 | 11,771,199 |
| 6s, 7/1/38 | Baa3 | 7,350,000 | 6,299,244 |
|
| Cmnwlth. of PR, Hwy. & Trans. Auth. Rev. Bonds | | | |
| Ser. AA, 5s, 7/1/28 | BBB+ | 1,200,000 | 936,132 |
| Ser. K, 5s, 7/1/13 | BBB | 2,250,000 | 2,213,370 |
|
| Cmnwlth. of PR, Indl. Tourist Edl. Med. & Env. Control | | | |
| Fac. Rev. Bonds (Cogen. Fac.-AES), 6 5/8s, 6/1/26 | Baa3 | 14,800,000 | 13,232,236 |
|
| Cmnwlth. of PR, Muni. Fin. Agcy. Rev. Bonds, | | | |
| Ser. A, FSA | | | |
| 5 1/4s, 8/1/20 | AAA | 2,000,000 | 2,009,540 |
| 5 1/4s, 8/1/18 | AAA | 2,855,000 | 2,873,814 |
|
| Cmnwlth. of PR, Pub. Bldg. Auth. Rev. Bonds (Govt. Fac.), | | | |
| Ser. N, Cmnwlth. of PR Gtd. | | | |
| 5 1/2s, 7/1/27 | Baa3 | 3,000,000 | 2,518,650 |
| 5 1/2s, 7/1/25 | Baa3 | 12,505,000 | 10,634,376 |
| 5 1/2s, 7/1/20 | Baa3 | 5,320,000 | 4,817,952 |
|
36
| | | |
| MUNICIPAL BONDS AND NOTES (101.2%)* cont. | Rating** | Principal amount | Value |
|
| Puerto Rico cont. | | | |
| U. of PR Rev. Bonds | | | |
| Ser. P, 5s, 6/1/26 | Baa2 | $5,000,000 | $3,805,300 |
| Ser. Q, 5s, 6/1/25 | Baa2 | 5,000,000 | 3,823,700 |
|
| | | | 67,566,273 |
|
| |
| TOTAL INVESTMENTS | | | |
|
| Total investments (cost $1,750,981,347) | | | $1,618,949,168 |
* Percentages indicated are based on net assets of $1,600,404,098.
** The Moody’s, Standard & Poor’s or Fitch ratings indicated are believed to be the most recent ratings available at March 31, 2009 for the securities listed. Ratings are generally ascribed to securities at the time of issuance. While the agencies may from time to time revise such ratings, they undertake no obligation to do so, and the ratings do not necessarily represent what the agencies would ascribe to these securities at March 31, 2009. Securities rated by Putnam are indicated by “/P.” Securities rated by Fitch are indicated by “/F.” The rating of an insured security represents what is believed to be the most recent rating of the insurer’s claims-paying ability available at March 31, 2009 and does not reflect any subsequent changes. Security ratings are defined in the Statement of Additional Information.
## Forward commitments, in part or in entirety (Note 1).
At March 31, 2009, liquid assets totaling $13,173,161 have been designated as collateral for open forward commitments.
T Underlying security in a tender option bond transaction. The security has been segregated as collateral for financing transactions (Note 1).
†† The interest rate and date shown parenthetically represent the new interest rate to be paid and the date the fund will begin accruing interest at this rate.
The rates shown on VRDN and Mandatory Put Bonds are the current interest rates at March 31, 2009.
The dates shown on Mandatory Put Bonds are the next mandatory put dates.
The dates shown on debt obligations other than Mandatory Put Bonds are the original maturity dates.
IF COP are securities that pay interest rates that vary inversely to changes in the market interest rates. As interest rates rise, inverse floaters produce less current income. The interest rates shown are the current interest rates at March 31, 2009.
The fund had the following sector concentrations greater than 10% at March 31, 2009 (as a percentage of net assets):
| | | |
| Utilities | 19.4% | | |
| State government | 14.2 | | |
| Local government | 13.2 | | |
| Land | 12.8 | | |
| Health care | 12.6 | | |
The fund had the following insurance concentrations greater than 10% at March 31, 2009 (as a percentage of net assets):
37
In September 2006, the FASB issued Statement of Financial Accounting Standards No. 157, Fair Value Measurements (SFAS 157). SFAS 157 is effective for financial statements issued for fiscal years beginning after November 15, 2007 and interim periods within those fiscal years. While the adoption of SFAS 157 does not have a material effect on the fund’s net asset value, it does require additional disclosures about fair value measurements. The Standard establishes a three-level hierarchy for disclosure of fair value measurements. The valuation hierarchy is based upon the transparency of inputs to the valuation of the fund’s investments. The three levels are defined as follows:
Level 1 — Valuations based on quoted prices for identical securities in active markets.
Level 2 — Valuations based on quoted prices in markets that are not active or for which all significant inputs are observable, either directly or indirectly.
Level 3 — Valuations based on inputs that are unobservable and significant to the fair value measurement.
The following is a summary of the inputs used to value the fund’s net assets as of March 31, 2009:
| | |
| Valuation inputs | Investments in securities | Other financial instruments |
|
| Level 1 | $— | $— |
|
| Level 2 | 1,618,949,168 | — |
|
| Level 3 | — | — |
|
| Total | $1,618,949,168 | $— |
Other financial instruments include futures, written options, TBA sale commitments, swaps and forward contracts which are valued at the unrealized appreciation/(depreciation) on the instrument.
The accompanying notes are an integral part of these financial statements.
38
Statement of assets and liabilities 3/31/09 (Unaudited)
| |
| ASSETS | |
|
| Investment in securities, at value (Note 1): | |
| Unaffiliated issuers (identified cost $1,750,981,347) | $1,618,949,168 |
|
| Cash | 50,398,488 |
|
| Interest and other receivables | 18,442,615 |
|
| Receivable for shares of the fund sold | 1,432,764 |
|
| Receivable for investments sold | 4,005,250 |
|
| Total assets | 1,693,228,285 |
|
| |
| LIABILITIES | |
|
| Distributions payable to shareholders | 2,836,797 |
|
| Payable for investments purchased | 64,575,972 |
|
| Payable for purchases of delayed delivery securities (Note 1) | 13,173,161 |
|
| Payable for shares of the fund repurchased | 2,172,778 |
|
| Payable for compensation of Manager (Note 2) | 1,983,404 |
|
| Payable for investor servicing fees (Note 2) | 81,456 |
|
| Payable for custodian fees (Note 2) | 5,071 |
|
| Payable for Trustee compensation and expenses (Note 2) | 230,968 |
|
| Payable for administrative services (Note 2) | 9,000 |
|
| Payable for distribution fees (Note 2) | 855,711 |
|
| Payable for floating rate notes issued (Note 1) | 6,800,000 |
|
| Other accrued expenses | 99,869 |
|
| Total liabilities | 92,824,187 |
| |
| Net assets | $1,600,404,098 |
|
| |
| REPRESENTED BY | |
|
| Paid-in capital (Unlimited shares authorized) (Notes 1 and 4) | $1,751,973,421 |
|
| Undistributed net investment income (Note 1) | 4,781,349 |
|
| Accumulated net realized loss on investments (Note 1) | (24,318,493) |
|
| Net unrealized depreciation of investments | (132,032,179) |
|
| Total — Representing net assets applicable to capital shares outstanding | $1,600,404,098 |
|
| |
| COMPUTATION OF NET ASSET VALUE AND OFFERING PRICE | |
|
| Net asset value and redemption price per class A share ($1,513,697,261 divided by 214,694,904 shares) | $7.05 |
|
| Offering price per class A share (100/96.00 of $7.05)* | $7.34 |
|
| Net asset value and offering price per class B share ($37,082,609 divided by 5,264,997 shares)** | $7.04 |
|
| Net asset value and offering price per class C share ($33,934,003 divided by 4,792,994 shares)** | $7.08 |
|
| Net asset value and redemption price per class M share ($3,858,486 divided by 548,494 shares) | $7.03 |
|
| Offering price per class M share (100/96.75 of $7.03)*** | $7.27 |
|
| Net asset value, offering price and redemption price per class Y share | |
| ($11,831,739 divided by 1,675,622 shares) | $7.06 |
|
* On single retail sales of less than $100,000. On sales of $100,000 or more the offering price is reduced.
** Redemption price per share is equal to net asset value less any applicable contingent deferred sales charge.
*** On single retail sales of less than $50,000. On sales of $50,000 or more the offering price is reduced.
The accompanying notes are an integral part of these financial statements.
39
Statement of operations Six months ended 3/31/09 (Unaudited)
| |
| INTEREST INCOME | $47,585,795 |
|
| |
| EXPENSES | |
|
| Compensation of Manager (Note 2) | $4,084,256 |
|
| Investor servicing fees (Note 2) | 430,414 |
|
| Custodian fees (Note 2) | 9,449 |
|
| Trustee compensation and expenses (Note 2) | 46,526 |
|
| Administrative services (Note 2) | 37,849 |
|
| Distribution fees — Class A (Note 2) | 1,619,802 |
|
| Distribution fees — Class B (Note 2) | 175,479 |
|
| Distribution fees — Class C (Note 2) | 162,796 |
|
| Distribution fees — Class M (Note 2) | 9,789 |
|
| Interest and fees expense (Note 1) | 59,304 |
|
| Other | 165,998 |
|
| Fees waived and reimbursed by Manager (Note 2) | (34,497) |
|
| Total expenses | 6,767,165 |
| | |
| Expense reduction (Note 2) | (15,475) |
|
| Net expenses | 6,751,690 |
| |
| Net investment income | 40,834,105 |
|
| |
| Net realized loss on investments (Notes 1 and 3) | (1,177,247) |
|
| Net realized loss on swap contracts (Note 1) | (504,806) |
|
| Net realized loss on futures contracts (Note 1) | (2,447,517) |
|
| Net unrealized depreciation of investments, futures contracts, | |
| and swap contracts during the period | (57,974,065) |
|
| Net loss on investments | (62,103,635) |
| |
| Net decrease in net assets resulting from operations | $(21,269,530) |
|
The accompanying notes are an integral part of these financial statements.
40
Statement of changes in net assets
| | |
| DECREASE IN NET ASSETS | Six months ended 3/31/09* | Year ended 9/30/08 |
|
| Operations: | | |
| Net investment income | $40,834,105 | $83,283,394 |
|
| Net realized loss on investments | (4,129,570) | (9,752,207) |
|
| Net unrealized depreciation of investments | (57,974,065) | (161,814,387) |
|
| Net decrease in net assets resulting from operations | (21,269,530) | (88,283,200) |
|
| Distributions to shareholders (Note 1): | | |
| From ordinary income | | |
| Taxable net investment income | | |
| Class A | (1,062,827) | (1,113,153) |
|
| Class B | (28,851) | (44,346) |
|
| Class C | (22,109) | (13,387) |
|
| Class M | (2,813) | (2,864) |
|
| Class Y | (8,545) | — |
|
| From tax-exempt net investment income | | |
| Class A | (37,910,519) | (76,610,017) |
|
| Class B | (892,532) | (2,322,456) |
|
| Class C | (676,027) | (974,416) |
|
| Class M | (91,375) | (184,417) |
|
| Class Y | (301,086) | (262,329) |
|
| From net realized long-term gain on investments | | |
| Class A | — | (8,330,607) |
|
| Class B | — | (321,331) |
|
| Class C | — | (106,799) |
|
| Class M | — | (22,121) |
|
| Redemption fees (Note 1) | 2,160 | 22,628 |
|
| Decrease from capital share transactions (Note 4) | (102,476,274) | (4,404,262) |
|
| Total decrease in net assets | (164,740,328) | (182,973,077) |
|
| |
| NET ASSETS | | |
|
| Beginning of period | 1,765,144,426 | 1,948,117,503 |
|
| End of period (including undistributed net investment | | |
| income of $4,781,349 and $4,943,928, respectively) | $1,600,404,098 | $1,765,144,426 |
|
* Unaudited
The accompanying notes are an integral part of these financial statements.
41
Financial highlights (For a common share outstanding throughout the period)
| | | | | | | | | | | | | | |
| INVESTMENT OPERATIONS: | | LESS DISTRIBUTIONS: | | RATIOS AND SUPPLEMENTAL DATA: |
|
| | | | | | | | | | | | | | Ratio of net | |
| | | | Net realized | | | | | | | | | Ratio | investment | |
| | Net asset value, | | and unrealized | Total from | From net | From net | | | | Total return | Net assets, | of expenses | income (loss) | |
| | beginning | Net investment | gain (loss) on | investment | investment | realized gain on | Total | Redemption | Net asset value, | at net asset | end of period | to average | to average | Portfolio |
| Period ended | of period | income (loss) | investments | operations | income | investments | distributions | fees | end of period | value (%) a | (in thousands) | net assets (%) b | net assets (%) | turnover (%) |
|
| Class A | | | | | | | | | | | | | | |
| March 31, 2009 ** | $7.30 | .18 c | (.25) | (.07) | (.18) | — | (.18) | — d | $7.05 | (.94) * | $1,513,697 | .40 *c,e | 2.53 *c,e | 12.38 * |
| September 30, 2008 | 8.04 | .35 | (.71) | (.36) | (.34) | (.04) | (.38) | — d | 7.30 | (4.69) | 1,666,074 | .77 e | 4.44 e | 48.13 |
| September 30, 2007 | 8.23 | .35 | (.17) | .18 | (.34) | (.03) | (.37) | — d | 8.04 | 2.14 | 1,845,476 | .76 | 4.25 | 36.29 |
| September 30, 2006 | 8.43 | .34 | (.01) | .33 | (.34) | (.19) | (.53) | — d | 8.23 | 4.09 | 1,959,603 | .75 | 4.17 | 11.70 |
| September 30, 2005 | 8.57 | .36 | (.02) | .34 | (.38) | (.10) | (.48) | — d | 8.43 | 4.08 | 2,057,513 | .75 | 4.20 | 21.15 |
| September 30, 2004 | 8.62 | .38 | .01 | .39 | (.40) | (.04) | (.44) | — | 8.57 | 4.60 | 2,144,817 | .79 | 4.49 | 13.01 |
|
| Class B | | | | | | | | | | | | | | |
| March 31, 2009 ** | $7.29 | .16 c | (.25) | (.09) | (.16) | — | (.16) | — d | $7.04 | (1.27) * | $37,083 | .72 *c,e | 2.20 *c,e | 12.38 * |
| September 30, 2008 | 8.04 | .30 | (.72) | (.42) | (.29) | (.04) | (.33) | — d | 7.29 | (5.45) | 49,316 | 1.41 e | 3.79 e | 48.13 |
| September 30, 2007 | 8.22 | .30 | (.17) | .13 | (.28) | (.03) | (.31) | — d | 8.04 | 1.63 | 76,150 | 1.40 | 3.60 | 36.29 |
| September 30, 2006 | 8.42 | .29 | (.01) | .28 | (.29) | (.19) | (.48) | — d | 8.22 | 3.46 | 120,918 | 1.39 | 3.52 | 11.70 |
| September 30, 2005 | 8.56 | .30 | (.02) | .28 | (.32) | (.10) | (.42) | — d | 8.42 | 3.40 | 178,443 | 1.40 | 3.55 | 21.15 |
| September 30, 2004 | 8.62 | .33 | (.01) | .32 | (.34) | (.04) | (.38) | — | 8.56 | 3.81 | 241,841 | 1.44 | 3.84 | 13.01 |
|
| Class C | | | | | | | | | | | | | | |
| March 31, 2009 ** | $7.33 | .15 c | (.25) | (.10) | (.15) | — | (.15) | — d | $7.08 | (1.32) * | $33,934 | .79 *c,e | 2.13 *c,e | 12.38 * |
| September 30, 2008 | 8.07 | .29 | (.71) | (.42) | (.28) | (.04) | (.32) | — d | 7.33 | (5.40) | 34,679 | 1.56 e | 3.66 e | 48.13 |
| September 30, 2007 | 8.26 | .28 | (.17) | .11 | (.27) | (.03) | (.30) | — d | 8.07 | 1.32 | 21,493 | 1.55 | 3.46 | 36.29 |
| September 30, 2006 | 8.46 | .28 | (.01) | .27 | (.28) | (.19) | (.47) | — d | 8.26 | 3.24 | 23,147 | 1.54 | 3.37 | 11.70 |
| September 30, 2005 | 8.60 | .29 | (.02) | .27 | (.31) | (.10) | (.41) | — d | 8.46 | 3.21 | 24,333 | 1.55 | 3.40 | 21.15 |
| September 30, 2004 | 8.65 | .34 | (.02) | .32 | (.33) | (.04) | (.37) | — | 8.60 | 3.83 | 24,313 | 1.59 | 3.69 | 13.01 |
|
| Class M | | | | | | | | | | | | | | |
| March 31, 2009 ** | $7.28 | .17 c | (.25) | (.08) | (.17) | — | (.17) | — d | $7.03 | (1.09) * | $3,858 | .54 *c,e | 2.38 *c,e | 12.38 * |
| September 30, 2008 | 8.03 | .33 | (.72) | (.39) | (.32) | (.04) | (.36) | — d | 7.28 | (5.11) | 4,358 | 1.06 e | 4.14 e | 48.13 |
| September 30, 2007 | 8.21 | .32 | (.16) | .16 | (.31) | (.03) | (.34) | — d | 8.03 | 1.97 | 4,998 | 1.05 | 3.95 | 36.29 |
| September 30, 2006 | 8.41 | .32 | (.01) | .31 | (.32) | (.19) | (.51) | — d | 8.21 | 3.79 | 6,115 | 1.04 | 3.87 | 11.70 |
| September 30, 2005 | 8.55 | .33 | (.02) | .31 | (.35) | (.10) | (.45) | — d | 8.41 | 3.76 | 6,279 | 1.05 | 3.90 | 21.15 |
| September 30, 2004 | 8.61 | .35 | — d | .35 | (.37) | (.04) | (.41) | — | 8.55 | 4.17 | 6,774 | 1.09 | 4.19 | 13.01 |
|
| Class Y | | | | | | | | | | | | | | |
| March 31, 2009 ** | $7.31 | .19 c | (.25) | (.06) | (.19) | — | (.19) | — d | $7.06 | (.83) * | $11,832 | .29 *c,e | 2.64 *c,e | 12.38 * |
| September 30, 2008† | 7.96 | .28 | (.66) | (.38) | (.27) | — | (.27) | — d | 7.31 | (4.91) * | 10,718 | .42 *e | 3.53 *e | 48.13 |
|
* Not annualized.
** Unaudited.
† For the period January 2, 2008 (commencement of operations) to September 30, 2008.
a Total return assumes dividend reinvestment and does not reflect the effect of sales charges.
b Includes amounts paid through expense offset arrangements (Note 2).
c Reflects an involuntary contractual expense limitation in effect during the period. As a result of such limitation, the expenses of the fund reflect a reduction of less than 0.01% of average net assets (Note 2).
d Amount represents less than $0.01 per share.
e Includes interest and fee expense associated with borrowings which amounted to the following (Note 1):
| |
| | Percentage of |
| | average net assets |
|
| March 31, 2009 | <0.01% |
|
| September 30, 2008 | <0.01 |
|
The accompanying notes are an integral part of these financial statements.
Notes to financial statements 3/31/09 (Unaudited)
Note 1: Significant accounting policies
Putnam CaliforniaTax Exempt Income Fund (the“fund”), a Massachusetts business trust, is registered under the Investment Company Act of 1940, as amended, as a diversified, open-end management investment company. The fund seeks as high a level of current income exempt from federal and California personal income tax as Putnam Investment Management, LLC (“Putnam Management”), the fund’s manager, a wholly-owned subsidiary of Putnam Investments, LLC, believes is consistent with preservation of capital by investing in a diversified portfolio primarily consisting of longer-term California tax-exempt securities. The fund may be affected by economic and political developments in the state of California.
The fund offers class A, class B, class C, class M and class Y shares. Class A and class M shares are sold with a maximum front-end sales charge of 4.00% and 3.25%, respectively, and generally do not pay a contingent deferred sales charge. Class B shares, which convert to class A shares after approximately eight years, do not pay a front-end sales charge and are subject to a contingent deferred sales charge, if those shares are redeemed within six years of purchase. Class C shares have a one-year 1.00% contingent deferred sales charge and do not convert to class A shares. The expenses for class A, class B, class C, and class M shares may differ based on the distribution fee of each class, which is identified in Note 2. Class Y shares, which are sold at net asset value, are generally subject to the same expenses as class A, class B, class C, and class M shares, but do not bear a distribution fee. Class Y shares are generally only available to corporate and institutio nal clients and clients in other approved programs.
A 1.00% redemption fee may apply on any shares that are redeemed (either by selling or exchanging into another fund) within 7 days of purchase. The redemption fee is accounted for as an addition to paid-in-capital.
Investment income, realized and unrealized gains and losses and expenses of the fund are borne pro-rata based on the relative net assets of each class to the total net assets of the fund, except that each class bears expenses unique to that class (including the distribution fees applicable to such classes). Each class votes as a class only with respect to its own distribution plan or other matters on which a class vote is required by law or determined by the Trustees. If the fund were liquidated, shares of each class would receive their pro-rata share of the net assets of the fund. In addition, the Trustees declare separate dividends on each class of shares.
In the normal course of business, the fund enters into contracts that may include agreements to indemnify another party under given circumstances. The fund’s maximum exposure under these arrangements is unknown as this would involve future claims that may be, but have not yet been, made against the fund. However, the fund’s management team expects the risk of material loss to be remote.
The following is a summary of significant accounting policies consistently followed by the fund in the preparation of its financial statements. The preparation of financial statements is in conformity with accounting principles generally accepted in the United States of America and requires management to make estimates and assumptions that affect the reported amounts of assets and liabilities in the financial statements and the reported amounts of increases and decreases in net assets from operations during the reporting period. Actual results could differ from those estimates.
A) Security valuation Tax-exempt bonds and notes are generally valued on the basis of valuations provided by an independent pricing service approved by the Trustees. Such services use information with respect to transactions in bonds, quotations from bond dealers, market transactions in comparable securities and various relationships between securities in determining value. Certain investments, including certain restricted and illiquid securities and derivatives are also valued at fair value following procedures approved by the Trustees. Such valuations and procedures are reviewed periodically by the Trustees. The fair value of securities is generally determined as the amount that the fund could reasonably expect to realize from an orderly disposition of such securities over a reasonable period of time. By its nature, a fair value price is a good faith estimate of the value of a security at a given point in time and does no t reflect an actual market price, which may be different by a material amount.
B) Security transactions and related investment income Security transactions are recorded on the trade date (the date the order to buy or sell is executed). Gains or losses on securities sold are determined on the identified cost basis.
44
Interest income is recorded on the accrual basis. All premiums/discounts are amortized/accreted on a yield-to-maturity basis. The premium in excess of the call price, if any, is amortized to the call date; thereafter, any remaining premium is amortized to maturity.
Securities purchased or sold on a forward commitment or delayed delivery basis may be settled a month or more after the trade date; interest income is accrued based on the terms of the securities. Losses may rise due to changes in the market value of the underlying securities or if the counterparty does not perform under the contract.
C) Futures and options contracts The fund may use futures and options contracts to hedge against changes in the values of securities the fund owns, owned or expects to purchase, or for other investment purposes. The fund may also write options on swaps or securities it owns or in which it may invest to increase its current returns.
The potential risk to the fund is that the change in value of futures and options contracts may not correspond to the change in value of the hedged instruments. In addition, losses may arise from changes in the value of the underlying instruments, if there is an illiquid secondary market for the contracts, interest or exchange rates moving unexpectedly or if the counterparty to the contract is unable to perform. Risks may exceed amounts recognized on the Statement of assets and liabilities. When the contract is closed, the fund records a realized gain or loss equal to the difference between the value of the contract at the time it was opened and the value at the time it was closed. Realized gains and losses on purchased options are included in realized gains and losses on investment securities. If a written call option is exercised, the premium originally received is recorded as an addition to sales proceeds. If a written put option is exercised, the premium origina lly received is recorded as a reduction to the cost of investments.
Futures contracts are valued at the quoted daily settlement prices established by the exchange on which they trade. The fund and the broker agree to exchange an amount of cash equal to the daily fluctuation in the value of the futures contract. Such receipts or payments are known as “variation margin.” Exchange traded options are valued at the last sale price or, if no sales are reported, the last bid price for purchased options and the last ask price for written options. Options traded over-the-counter are valued using prices supplied by dealers. Futures and written option contracts outstanding at period end, if any, are listed after the fund’s portfolio.
D) Total return swap contracts The fund may enter into total return swap contracts, which are arrangements to exchange a market linked return for a periodic payment, both based on a notional principal amount. To the extent that the total return of the security, index or other financial measure underlying the transaction exceeds or falls short of the offsetting interest rate obligation, the fund will receive a payment from or make a payment to the counterparty. Total return swap contracts are marked to market daily based upon quotations from market makers and the change, if any, is recorded as an unrealized gain or loss. Payments received or made are recorded as realized gains or losses. Certain total return swap contracts may include extended effective dates. Payments related to these swap contracts are accrued based on the terms of the contract. The fund could be exposed to credit or market risk due to unfavorable changes in the fluctuation of interest rates or in the price of the underlying security or index, the possibility that there is no liquid market for these agreements or that the counterparty may default on its obligation to perform. Risk of loss may exceed amounts recognized on the Statement of assets and liabilities. Total return swap contracts outstanding at period end, if any, are listed after the fund’s portfolio.
E) Master agreements The fund is a party to ISDA (International Swap and Derivatives Association, Inc.) Master Agreements (“Master Agreements”) with certain counterparties that govern over the counter derivative and foreign exchange contracts entered into from time to time.The Master Agreements may contain provisions regarding, among other things, the parties’ general obligations, representations, agreements, collateral requirements, events of default and early termination. With respect to certain counterparties, in accordance with the terms of the Master Agreements, collateral posted to the fund is held in a segregated account by the fund’s custodian; collateral pledged by the fund is segregated by the fund’s custodian and identified in The fund’s portfolio. Collateral can be in the form of cash or debt securities issued by the U.S. Government or related agencies or other securities as agreed to by the fund and the applicable counterparty. Termination events applicable to the fund may occur upon a decline in the fund’s net assets below a specified threshold over a certain period of time. Termination events applicable to counterparties may occur upon a decline in the counterparty’s long-term and short-term credit ratings below a specified level. In each case, upon occurrence, the other party may elect to terminate early and cause settlement of all derivative and foreign exchange contracts outstanding, including the
45
payment of any losses and costs resulting from such early termination, as reasonably determined by the terminating party. Any decision by one or more of the fund’s counterparties to elect early termination could impact the fund’s future derivative activity.
F) Tender option bonds The fund may participate in transactions whereby a fixed-rate bond is transferred to a tender option bond trust (“TOB trust”) sponsored by a broker. The TOB trust funds the purchase of the fixed rate bonds by issuing floating-rate bonds issued to third parties and allowing the fund to retain the residual interest in the TOB trust’s assets and cash flows, which are in the form of inverse floating rate bonds. The inverse floating rate bonds held by the fund give the fund the right to (1) cause the holders of the floating rate bonds to tender their notes at par, and (2) to have the fixed-rate bond held by the TOB trust transferred to the fund, causing the TOB trust to collapse. The fund accounts for the transfer of the fixed-rate bond to the TOB trust as a secured borrowing by including the fixed-rate bond in The fund’s portfolio and including the floating rate bond as a liability in the Statement of assets and liabilities. At March 31, 2009, the fund’s investments with a value of $12,650,176 were held by the TOB trust and served as collateral for $6,800,000 in floating-rate bonds outstanding. During the period ended March 31, 2009, the fund incurred interest expense of $44,657 for these investments based on an average interest rate of 1.354%.
G) Federal taxes It is the policy of the fund to distribute all of its income within the prescribed time and otherwise comply with the provisions of the Internal Revenue Code of 1986, as amended (the “Code”), applicable to regulated investment companies. It is also the intention of the fund to distribute an amount sufficient to avoid imposition of any excise tax under Section 4982 of the Code. The fund is subject to the provisions of FASB Interpretation No. 48, Accounting for Uncertainties in Income Taxes (“FIN 48”). FIN 48 sets forth a minimum threshold for financial statement recognition of the benefit of a tax position taken or expected to be taken in a tax return. The fund did not have any unrecognized tax benefits in the accompanying financial statements. No provision has been made for federal taxes on income, capital gains or unrealized appreciation on securities held nor for excise tax on income a nd capital gains. Each of the fund’s federal tax returns for the prior three fiscal years remains subject to examination by the Internal Revenue Service and state departments of revenue.
At September 30, 2008 the fund had a capital loss carryover of $766,815 available to the extent allowed by the Code to offset future net capital gain, if any. This capital loss carryover will expire on September 30, 2016.
Pursuant to federal income tax regulations applicable to regulated investment companies, the fund has elected to defer to its fiscal year ending September 30, 2009 $12,430,465 of losses recognized during the period November 1, 2007 to September 30, 2008.
The aggregate identified cost on a tax basis is $1,754,087,378, resulting in gross unrealized appreciation and depreciation of $48,460,759 and $183,598,969, respectively, or net unrealized depreciation of $135,138,210.
H) Distributions to shareholders Income dividends are recorded daily by the fund and are paid monthly. Distributions from capital gains, if any, are recorded on the ex-dividend date and paid at least annually. The amount and character of income and gains to be distributed are determined in accordance with income tax regulations which may differ from generally accepted accounting principles. Dividend sources are estimated at the time of declaration. Actual results may vary. Any non-taxable return of capital cannot be determined until final tax calculations are completed after the end of the fund’s fiscal year. Reclassifications are made to the fund’s capital accounts to reflect income and gains available for distribution (or available capital loss carryovers) under income tax regulations.
Note 2: Management fee, administrative
services and other transactions
The fund pays Putnam Management for management and investment advisory services quarterly based on the average net assets of the fund. Such fee is based on the lesser of (i) an annual rate of 0.50% of the average net assets of the fund or (ii) the following annual rates expressed as a percentage of the funds average net assets: 0.60% of the first $500 million, 0.50% of the next $500 million, 0.45% of the next $500 million, 0.40% of the next $5 billion, 0.375% of the next $5 billion, 0.355% of the next $5 billion, 0.34% of the next $5 billion and 0.33% thereafter.
Putnam Management has agreed to waive fees and reimburse expenses of the fund through June 30, 2009 to the extent necessary to ensure that the fund’s expenses do not exceed the simple average of the expenses of all front-end load funds viewed by Lipper Inc. as having the same investment classification or objective as the fund. The expense reimbursement
46
is based on a comparison of the fund’s expenses with the average annualized operating expenses of the funds in its Lipper peer group for each calendar quarter during the fund’s last fiscal year, excluding 12b-1 fees and without giving effect to any expense offset and brokerage/service arrangements that may reduce fund expenses. For the period ended March 31, 2009, Putnam Management waived $34,497 of its management fee from the fund.
The fund reimburses Putnam Management an allocated amount for the compensation and related expenses of certain officers of the fund and their staff who provide administrative services to the fund. The aggregate amount of all such reimbursements is determined annually by the Trustees
Custodial functions for the fund’s assets were provided by State Street Bank and Trust Company (“State Street”). Custody fees are based on the fund’s asset level, the number of its security holdings and transaction volumes.
Putnam Investor Services, Inc., an affiliate of Putnam Management, provided investor servicing agent functions to the fund. Prior to December 31, 2008, these services were provided by Putnam Investor Services, a division of Putnam Fiduciary Trust Company (“PFTC”), which is an affiliate of Putnam Management. Putnam Investor Services, Inc. and Putnam Investor Services received fees for investor servicing, subject to certain limitations, based on the number of shareholder accounts in the fund and the level of defined contribution plan assets in the fund. The amounts incurred for investor servicing agent functions provided by affili-ates of Putnam Management during the period ended March 31, 2009 are included in Investor servicing fees in the Statement of operations.
The fund has entered into expense offset arrangements with PFTC and State Street whereby PFTC’s and State Street’s fees are reduced by credits allowed on cash balances. For the six months ended March 31, 2009, the fund’s expenses were reduced by $15,475 under the expense offset arrangements.
Each independent Trustee of the fund receives an annual Trustee fee, of which $956, as a quarterly retainer, has been allocated to the fund, and an additional fee for each Trustees meeting attended. Trustees receive additional fees for attendance at certain committee meetings and industry seminars and for certain compliance-related matters. Trustees also are reimbursed for expenses they incur relating to their services as Trustees.
The fund has adopted a Trustee Fee Deferral Plan (the “Deferral Plan”) which allows the Trustees to defer the receipt of all or a portion of Trustees fees payable on or after July 1, 1995. The deferred fees remain invested in certain Putnam funds until distribution in accordance with the Deferral Plan.
The fund has adopted an unfunded noncontributory defined benefit pension plan (the “Pension Plan”) covering all Trustees of the fund who have served as a Trustee for at least five years and were first elected prior to 2004. Benefits under the Pension Plan are equal to 50% of the Trustee’s average annual attendance and retainer fees for the three years ended December 31, 2005. The retirement benefit is payable during a Trustee’s lifetime, beginning the year following retirement, for the number of years of service through December 31, 2006. Pension expense for the fund is included in Trustee compensation and expenses in the Statement of operations. Accrued pension liability is included in Payable for Trustee compensation and expenses in the Statement of assets and liabilities. The Trustees have terminated the Pension Plan with respect to any Trustee first elected after 2003.
The fund has adopted distribution plans (the “Plans”) with respect to its class A, class B, class C and class M shares pursuant to Rule 12b-1 under the Investment Company Act of 1940. The purpose of the Plans is to compensate Putnam Retail Management Limited Partnership, a wholly-owned subsidiary of Putnam Investments, LLC and Putnam Retail Management GP, Inc., for services provided and expenses incurred in distributing shares of the fund. The Plans provide for payments by the fund to Putnam Retail Management Limited Partnership at an annual rate of up to 0.35%, 1.00%, 1.00% and 0.50% of the average net assets attributable to class A, class B, class C and class M shares, respectively. The Trustees have approved payment by the fund at the annual rate of 0.85%, 1.00% and 0.50% of the average net assets for class B, class C and class M shares, respectively. For class A shares, the annual payment rate will equal the weighted average of (i) 0.20% on the net ass ets of the fund attributable to class A shares purchased and paid for prior to April 1, 2005 and (ii) 0.25% on all other net assets of the fund attributable to class A shares.
For the six months ended March 31, 2009, Putnam Retail Management Limited Partnership, acting as underwriter, received net commissions of $74,432 and $56 from the sale of class A and class M shares, respectively, and received $22,071 and $14,280 in contingent deferred sales charges from redemptions of class B and class C shares, respectively.
47
A deferred sales charge of up to 1.00% is assessed on certain redemptions of class A shares that were purchased without an initial sales charge as part of an investment of $1 million or more. For the six months ended March 31, 2009, Putnam Retail Management Limited Partnership, acting as underwriter, received $55,700 on class A redemptions.
Note 3: Purchases and sales of securities
During the six months ended March 31, 2009, cost of purchases and proceeds from sales of investment securities other than short-term investments aggregated $195,049,498 and $280,468,110, respectively. There were no purchases or sales of U.S. government securities.
Note 4: Capital shares
At March 31, 2009, there was an unlimited number of shares of beneficial interest authorized. Transactions in capital shares were as follows:
| | | | |
| | Six months ended 3/31/09 | Year ended 9/30/08 |
|
| Class A | Shares | Amount | Shares | Amount |
|
| Shares sold | 7,787,875 | $54,450,853 | 24,423,462 | $191,328,397 |
|
| Shares issued in connection with | 3,221,874 | 22,531,806 | 6,557,058 | 51,141,231 |
| reinvestment of distributions | | | | |
|
| | 11,009,749 | 76,982,659 | 30,980,520 | 242,469,628 |
|
| Shares repurchased | (24,504,366) | (170,762,705) | (32,217,226) | (252,825,320) |
|
| Net decrease | (13,494,617) | $(93,780,046) | (1,236,706) | $(10,355,692) |
|
| |
| | Six months ended 3/31/09 | Year ended 9/30/08 |
|
| Class B | Shares | Amount | Shares | Amount |
|
| Shares sold | 152,723 | $1,077,726 | 272,836 | $2,167,422 |
|
| Shares issued in connection with | 78,910 | 550,782 | 212,389 | 1,627,143 |
| reinvestment of distributions | | | | |
|
| | 231,633 | 1,628,508 | 485,225 | 3,794,565 |
|
| Shares repurchased | (1,727,226) | (12,048,731) | (3,199,765) | (25,141,927) |
|
| Net decrease | (1,495,593) | $(10,420,223) | (2,714,540) | $(21,347,362) |
|
| |
| | Six months ended 3/31/09 | Year ended 9/30/08 |
|
| Class C | Shares | Amount | Shares | Amount |
|
| Shares sold | 858,125 | $6,042,886 | 2,708,427 | $21,247,751 |
|
| Shares issued in connection with | 70,749 | 496,717 | 101,607 | 792,061 |
| reinvestment of distributions | | | | |
|
| | 928,874 | 6,539,603 | 2,810,034 | 22,039,812 |
|
| Shares repurchased | (865,831) | (6,010,036) | (741,873) | (5,814,986) |
|
| Net increase | 63,043 | $529,567 | 2,068,161 | $16,224,826 |
|
| |
| | Six months ended 3/31/09 | Year ended 9/30/08 |
|
| Class M | Shares | Amount | Shares | Amount |
|
| Shares sold | 31,810 | $210,342 | 110,521 | $863,598 |
|
| Shares issued in connection with | 9,602 | 66,988 | 19,017 | 147,906 |
| reinvestment of distributions | | | | |
|
| | 41,412 | 277,330 | 129,538 | 1,011,504 |
|
| Shares repurchased | (91,130) | (628,628) | (154,132) | (1,216,827) |
|
| Net decrease | (49,718) | $(351,298) | (24,594) | $(205,323) |
|
48
| | | | |
| | | | For the period 1/2/08 |
| | | | (commencement of operations) |
| | Six months ended 3/31/09 | to 9/30/08 |
|
| Class Y | Shares | Amount | Shares | Amount |
|
| Shares sold | 535,802 | $3,786,277 | 1,898,222 | $14,633,889 |
|
| Shares issued in connection with | 41,115 | 287,751 | 33,361 | 256,111 |
| reinvestment of distributions | | | | |
|
| | 576,917 | 4,074,028 | 1,931,583 | 14,890,000 |
|
| Shares repurchased | (366,998) | (2,528,302) | (465,880) | (3,610,711) |
|
| Net increase | 209,919 | $1,545,726 | 1,465,703 | $11,279,289 |
|
Note 5: Regulatory matters and litigation
In late 2003 and 2004, Putnam Management settled charges brought by the Securities and Exchange Commission (the “SEC”) and the Massachusetts Securities Division in connection with excessive short-term trading in Putnam funds. Distribution of payments from Putnam Management to certain open-end Putnam funds and their shareholders is expected to be completed in the next several months. These allegations and related matters have served as the general basis for certain lawsuits, including purported class action lawsuits against Putnam Management and, in a limited number of cases, some Putnam funds. Putnam Management believes that these lawsuits will have no material adverse effect on the funds or on Putnam Management’s ability to provide investment management services. In addition, Putnam Management has agreed to bear any costs incurred by the Putnam funds as a result of these matters.
Note 6: New accounting pronouncements
In March 2008, Statement of Financial Accounting Standards No. 161, Disclosures about Derivative Instruments and Hedging Activities (“SFAS 161”) — an amendment of FASB Statement No. 133, was issued and is effective for fiscal years and interim periods beginning after November 15, 2008. SFAS 161 requires enhanced disclosures about how and why an entity uses derivative instruments and how derivative instruments affect an entity’s financial position. Putnam Management is currently evaluating the impact the adoption of SFAS 161 will have on the fund’s financial statement disclosures.
In April 2009, FASB issued a new FASB Staff Position FSP FAS 157-4 which amends FASB Statement No. 157, Fair Value Measurements, and is effective for interim and annual periods ending after June 15, 2009. FSP FAS 157-4 provides additional guidance when the volume and level of activity for the asset or liability measured at fair value has significantly decreased. Additionally, FSP FAS 157-4 expands disclosure by reporting entities with respect to categories of assets and liabilities carried at fair value. Putnam Management believes applying the provisions of FSP FAS 157-4 will not have a material impact on the fund’s financial statements.
Note 7: Market and credit risk
In the normal course of business, the fund trades financial instruments and enters into financial transactions where risk of potential loss exists due to changes in the market (market risk) or failure of the contracting party to the transaction to perform (credit risk). The fund may be exposed to additional credit risk that an institution or other entity with which the funds have unsettled or open transactions will default.
49
The Putnam family of funds
The following is a list of Putnam’s open-end mutual funds offered to the public. Investors should carefully consider the investment objective, risks, charges, and expenses of a fund before investing. For a prospectus containing this and other information for any Putnam fund or product, call your financial advisor at 1-800-225-1581 and ask for a prospectus. Please read the prospectus carefully before investing.
Growth
Growth Opportunities Fund
International New Opportunities Fund*
New Opportunities Fund
Small Cap Growth Fund*
Vista Fund
Voyager Fund
Blend
Capital Opportunities Fund*
Europe Equity Fund*
Global Equity Fund*
Global Natural Resources Fund*
International Capital Opportunities Fund*
International Equity Fund*
Investors Fund
Research Fund
Value
Convertible Income-Growth Trust
Equity Income Fund
The George Putnam Fund of Boston
The Putnam Fund for Growth and Income
International Growth and Income Fund*
Mid Cap Value Fund
Small Cap Value Fund*
Income
American Government Income Fund
Diversified Income Trust
Floating Rate Income Fund
Global Income Trust*
High Yield Advantage Fund*
High Yield Trust*
Income Fund
Money Market Fund†
U.S. Government Income Trust
* A 1% redemption fee on total assets redeemed or exchanged within 90 days of purchase may be imposed for all share classes of these funds.
† An investment in a money market fund is not insured or guaranteed by the Federal Deposit Insurance Corporation or any other government agency. Although the fund seeks to preserve the value of your investment at $1.00 per share, it is possible to lose money by investing in the fund.
50
Tax-free income
AMT-Free Municipal Fund‡
Tax Exempt Income Fund
Tax Exempt Money Market Fund†
Tax-Free High Yield Fund
State tax-free income funds:
Arizona, California, Massachusetts, Michigan, Minnesota, New Jersey, New York, Ohio, and Pennsylvania
Absolute Return
Absolute Return 100 Fund
Absolute Return 300 Fund
Absolute Return 500 Fund
Absolute Return 700 Fund
Global Sector
Global Consumer Fund
Global Energy Fund
Global Financials Fund
Global Health Care Fund**
Global Industrials Fund
Global Natural Resources Fund
Global Technology Fund
Global Telecommunications Fund
Global Utilities Fund††
Asset allocation
Income Strategies Fund
Putnam Asset Allocation Funds — three investment portfolios that spread your money across a variety of stocks, bonds, and money market investments.
The three portfolios:
Asset Allocation: Balanced Portfolio
Asset Allocation: Conservative Portfolio
Asset Allocation: Growth Portfolio
Putnam RetirementReady®
Putnam RetirementReady Funds — 10 investment portfolios that offer diversification among stocks, bonds, and money market instruments and adjust to become more conservative over time based on a target date for withdrawing assets.
The 10 funds:
Putnam RetirementReady 2050 Fund
Putnam RetirementReady 2045 Fund
Putnam RetirementReady 2040 Fund
Putnam RetirementReady 2035 Fund
Putnam RetirementReady 2030 Fund
Putnam RetirementReady 2025 Fund
Putnam RetirementReady 2020 Fund
Putnam RetirementReady 2015 Fund
Putnam RetirementReady 2010 Fund
Putnam RetirementReady Maturity Fund
‡ Prior to November 30, 2008, the fund was known as Putnam AMT-Free Insured Municipal Fund.
** Prior to January 2, 2009, the fund was known as Putnam Health Sciences Trust.
†† Prior to January 2, 2009, the fund was known as Putnam Utilities Growth and Income Fund.
With the exception of money market funds, a 1% redemption fee may be applied to shares exchanged or sold within 7 days of purchase (90 days, for certain funds).
Check your account balances and the most recent month-end performance in the Individual Investors section at putnam.com.
51
Services for shareholders
Investor services
Systematic investment plan Tell us how much you wish to invest regularly — weekly, semimonthly, or monthly — and the amount you choose will be transferred automatically from your checking or savings account. There’s no additional fee for this service, and you can suspend it at any time. This plan may be a great way to save for college expenses or to plan for your retirement.
Please note that regular investing does not guarantee a profit or protect against loss in a declining market. Before arranging a systematic investment plan, consider your financial ability to continue making purchases in periods when prices are low.
Systematic exchange You can make regular transfers from one Putnam fund to another Putnam fund. There are no additional fees for this service, and you can cancel or change your options at any time.
Dividends PLUS You can choose to have the dividend distributions from one of your Putnam funds automatically reinvested in another Putnam fund at no additional charge.
Free exchange privilege You can exchange money between Putnam funds free of charge, as long as they are the same class of shares. A signature guarantee is required if you are exchanging more than $500,000.
Reinstatement privilege If you’ve sold Putnam shares or received a check for a dividend or capital gain, you may reinvest the proceeds with Putnam within 90 days of the transaction and they will be reinvested at the fund’s current net asset value — with no sales charge. However, reinstatement of class B shares may have special tax consequences. Ask your financial or tax representative for details.
Check-writing service You have ready access to many Putnam accounts. It’s as simple as writing a check, and there are no special fees or service charges. For more information about the check-writing service, call Putnam or visit our Web site.
Dollar cost averaging When you’re investing for long-term goals, it’s time, not timing, that counts. Investing on a systematic basis is a better strategy than trying to figure out when the markets will go up or down. This means investing the same amount of money regularly over a long period. This method of investing is called dollar cost averaging. When a fund’s share price declines, your investment dollars buy more shares at lower prices. When it increases, they buy fewer shares. Over time, you will pay a lower average price per share.
For more information
Visit the Individual Investors section at putnam.com A secure section of our Web site contains complete information on your account, including balances and transactions, updated daily. You may also conduct transactions, such as exchanges, additional investments, and address changes. Log on today to get your password.
Call us toll free at 1-800-225-1581 Ask a helpful Putnam representative or your financial advisor for details about any of these or other services, or see your prospectus.
52
Fund information
Founded over 70 years ago, Putnam Investments was built around the concept that a balance between risk and reward is the hallmark of a well-rounded financial program. We manage 100 mutual funds across income, value, blend, growth, asset allocation, absolute return, and global sector categories.
| | |
| Investment Manager | Robert E. Patterson | Beth S. Mazor |
| Putnam Investment | George Putnam, III | Vice President |
| Management, LLC | Robert L. Reynolds | |
| One Post Office Square | Richard B. Worley | James P. Pappas |
| Boston, MA 02109 | | Vice President |
| | Officers | |
| Marketing Services | Charles E. Haldeman, Jr. | Francis J. McNamara, III |
| Putnam Retail Management | President | Vice President and |
| One Post Office Square | | Chief Legal Officer |
| Boston, MA 02109 | Charles E. Porter | |
| | Executive Vice President, | Robert R. Leveille |
| Custodian | Principal Executive Officer, | Vice President and |
| State Street Bank | Associate Treasurer and | Chief Compliance Officer |
| and Trust Company | Compliance Liaison | |
| | | Mark C. Trenchard |
| Legal Counsel | Jonathan S. Horwitz | Vice President and |
| Ropes & Gray LLP | Senior Vice President | BSA Compliance Officer |
| | and Treasurer | |
| Trustees | | Judith Cohen |
| John A. Hill, Chairman | Steven D. Krichmar | Vice President, Clerk and |
| Jameson A. Baxter, | Vice President and | Assistant Treasurer |
| Vice Chairman | Principal Financial Officer | |
| Ravi Akhoury | | Wanda M. McManus |
| Charles B. Curtis | Janet C. Smith | Vice President, Senior Associate |
| Robert J. Darretta | Vice President, Principal | Treasurer and Assistant Clerk |
| Myra R. Drucker | Accounting Officer and | |
| Charles E. Haldeman, Jr. | Assistant Treasurer | Nancy E. Florek |
| Paul L. Joskow | | Vice President, Assistant Clerk, |
| Elizabeth T. Kennan | Susan G. Malloy | Assistant Treasurer and |
| Kenneth R. Leibler | Vice President and | Proxy Manager |
| Assistant Treasurer | |
| | | |
This report is for the information of shareholders of Putnam California Tax Exempt Income Fund. It may also be used as sales literature when preceded or accompanied by the current prospectus, the most recent copy of Putnam’s Quarterly Performance Summary, and Putnam’s Quarterly Ranking Summary. For more recent performance, please visit putnam.com. Investors should carefully consider the investment objective, risks, charges, and expenses of a fund, which are described in its prospectus. For this and other information or to request a prospectus, call 1-800-225-1581 toll free. Please read the prospectus carefully before investing. The fund’s Statement of Additional Information contains additional information about the fund’s Trustees and is available without charge upon request by calling 1-800-225-1581.

Item 2. Code of Ethics:
Not applicable
Item 3. Audit Committee Financial Expert:
Not applicable
Item 4. Principal Accountant Fees and Services:
Not applicable
Item 5. Audit Committee of Listed Registrants
Not applicable
Item 6. Schedule of Investments:
The registrant’s schedule of investments in unaffiliated issuers is included in the report to shareholders in Item 1 above.
Item 7. Disclosure of Proxy Voting Policies and Procedures For Closed-End Management Investment Companies:
Not applicable
Item 8. Portfolio Managers of Closed-End Investment Companies
Not Applicable
Item 9. Purchases of Equity Securities by Closed-End Management Investment Companies and Affiliated Purchasers:
Not applicable
Item 10. Submission of Matters to a Vote of Security Holders:
Not applicable
Item 11. Controls and Procedures:
(a) The registrant's principal executive officer and principal financial officer have concluded, based on their evaluation of the effectiveness of the design and operation of the registrant's disclosure controls and procedures as of a date within 90 days of the filing date of this report, that the design and operation of such procedures are generally effective to provide reasonable assurance that information required to be disclosed by the registrant in this report is recorded, processed, summarized and reported within the time periods specified in the Commission's rules and forms.
(b) Changes in internal control over financial reporting: Not applicable
Item 12. Exhibits:
(a)(1) Not applicable
(a)(2) Separate certifications for the principal executive officer and principal financial officer of the registrant as required by Rule 30a-2(a) under the Investment Company Act of 1940, as amended, are filed herewith.
(b) The certifications required by Rule 30a-2(b) under the Investment Company Act of 1940, as amended, are filed herewith.
SIGNATURES
Pursuant to the requirements of the Securities Exchange Act of 1934 and the Investment Company Act of 1940, the registrant has duly caused this report to be signed on its behalf by the undersigned, thereunto duly authorized.
Putnam California Tax Exempt Income Fund
By (Signature and Title):
/s/Janet C. Smith
Janet C. Smith
Principal Accounting Officer
Date: May 29, 2009
Pursuant to the requirements of the Securities Exchange Act of 1934 and the Investment Company Act of 1940, this report has been signed below by the following persons on behalf of the registrant and in the capacities and on the dates indicated.
By (Signature and Title):
/s/Charles E. Porter
Charles E. Porter
Principal Executive Officer
Date: May 29, 2009
By (Signature and Title):
/s/Steven D. Krichmar
Steven D. Krichmar
Principal Financial Officer
Date: May 29, 2009