UNITED STATES
SECURITIES AND EXCHANGE COMMISSION
Washington, DC 20549
FORM 10-K
Annual Report Pursuant to Section 13 or 15(d) of the Securities Exchange Act of 1934
For the fiscal year ended December 31, 2006
Commission file number 001-09718
THE PNC FINANCIAL SERVICES GROUP, INC.
(Exact name of registrant as specified in its charter)
| | | | | | | | |
| | | Pennsylvania | | | | 25-1435979 | | |
| | (State or other jurisdiction of incorporation or organization) | | | | (I.R.S. Employer Identification No.) | | |
One PNC Plaza
249 Fifth Avenue
Pittsburgh, Pennsylvania 15222-2707
(Address of principal executive offices, including zip code)
Registrant’s telephone number, including area code - (412) 762-2000
Securities registered pursuant to Section 12(b) of the Act:
| | | | |
| Title of Each Class | | | | Name of Each Exchange on Which Registered |
Common Stock, par value $5.00 | | | | New York Stock Exchange |
$1.60 Cumulative Convertible Preferred Stock-Series C, par value $1.00 | | | | New York Stock Exchange |
$1.80 Cumulative Convertible Preferred Stock-Series D, par value $1.00 | | | | New York Stock Exchange |
Series G Junior Participating Preferred Share Purchase Rights | | | | New York Stock Exchange |
Securities registered pursuant to Section 12(g) of the Act:
$1.80 Cumulative Convertible Preferred Stock - Series A, par value $1.00
$1.80 Cumulative Convertible Preferred Stock - Series B, par value $1.00
8.25% Convertible Subordinated Debentures Due 2008
Indicate by check mark if the registrant is a well-known seasoned issuer, as defined in Rule 405 of the Securities Act. YesX No
Indicate by check mark if the registrant is not required to file reports pursuant to Section 13 or Section 15(d) of the Act. Yes NoX
Indicate by check mark whether the registrant: (1) has filed all reports required to be filed by Section 13 or 15(d) of the Securities Exchange Act of 1934 during the preceding 12 months (or for such shorter period that the registrant was required to file such reports), and (2) has been subject to such filing requirements for the past 90 days. YesX No
Indicate by check mark if the disclosure of delinquent filers pursuant to Item 405 of Regulation S-K is not contained herein, and will not be contained, to the best of registrant’s knowledge, in definitive proxy or information statements incorporated by reference in Part III of this Form 10-K or any amendment to this Form 10-K.
Indicate by check mark whether the registrant is a large accelerated filer, an accelerated filer, or a non-accelerated filer. See definition of “accelerated filer and large accelerated filer” in Rule 12b-2 of the Exchange Act. (Check one):
| | | | |
| Large accelerated filerX | | Accelerated filer | | Non-accelerated filer |
Indicate by check mark whether the registrant is a shell company (as defined in Rule 12b-2 of the Act). Yes NoX
The aggregate market value of the registrant’s outstanding voting common stock held by nonaffiliates on June 30, 2006, determined using the per share closing price on that date on the New York Stock Exchange of $70.17, was approximately $20.6 billion. There is no non-voting common equity of the registrant outstanding.
Number of shares of registrant’s common stock outstanding at February 16, 2007: 293,164,316
DOCUMENTS INCORPORATED BY REFERENCE
Portions of the definitive Proxy Statement of The PNC Financial Services Group, Inc. to be filed pursuant to Regulation 14A for the annual meeting of shareholders to be held on April 24, 2007 (“Proxy Statement”) are incorporated by reference into Part III of this Form 10-K.
TABLE OF CONTENTS
PART I
Forward-Looking Statements: From time to time The PNC Financial Services Group, Inc. (“PNC” or the “Corporation”) has made and may continue to make written or oral forward-looking statements regarding our outlook or expectations for earnings, revenues, expenses, capital levels, asset quality or other future financial or business performance, strategies or expectations, or the impact of legal, regulatory or supervisory matters on our business operations or performance. This Annual Report on Form 10-K (the “Report” or “Form 10-K”) also includes forward-looking statements. With respect to all such forward-looking statements, you should review our Risk Factors discussion in Item 1A and our Cautionary Statement Regarding Forward-Looking Information included in Item 7 of this Report.
ITEM 1 –BUSINESS
BUSINESSOVERVIEWWe are one of the largest diversified financial services companies in the United States based on assets, with businesses engaged in retail banking, corporate and institutional banking, asset management and global fund processing services. We provide many of our products and services nationally and others in our primary geographic markets located in Pennsylvania; New Jersey; the greater Washington, DC area, including Maryland and Virginia; Ohio; Kentucky; and Delaware. We also provide certain global fund processing services internationally. At December 31, 2006, our consolidated total assets, deposits and shareholders’ equity were $101.8 billion, $66.3 billion and $10.8 billion, respectively.
We were incorporated under the laws of the Commonwealth of Pennsylvania in 1983 with the consolidation of Pittsburgh National Corporation and Provident National Corporation. Since 1983, we have diversified our geographical presence, business mix and product capabilities through internal growth, strategic bank and non-bank acquisitions and equity investments, and the formation of various non-banking subsidiaries.
On October 8, 2006, we entered into a definitive agreement with Mercantile Bankshares Corporation (“Mercantile”) for PNC to acquire Mercantile. Mercantile shareholders will be entitled to .4184 shares of PNC common stock and $16.45 in cash for each share of Mercantile, or in the aggregate approximately 53 million shares of PNC common stock and $2.1 billion in cash. Based on PNC’s recent stock prices, this transaction is valued at approximately $6.0 billion in the aggregate.
Mercantile is a bank holding company with approximately $18 billion in assets that provides banking and investment and wealth management services through 240 offices in Maryland, Virginia, the District of Columbia, Delaware and southeastern Pennsylvania. The transaction is expected to close in March 2007 and is subject to customary closing conditions, including regulatory approvals.
We acquired Riggs National Corporation (“Riggs”), a Washington, DC based banking company, effective May 13, 2005. Under the terms of the agreement, Riggs merged into The PNC Financial Services Group, Inc. and PNC Bank, National Association (“PNC Bank, N.A.”), our principal bank subsidiary, acquired substantially all of the assets of Riggs Bank, N.A., the principal banking subsidiary of Riggs.
We include information on significant recent acquisitions in Note 2 Acquisitions in the Notes To Consolidated Financial Statements in Item 8 of this Report and here by reference.
REVIEWOFLINESOFBUSINESS In addition to the following information relating to our lines of business, we incorporate
2
information under the captions Line of Business Highlights, Product Revenue, Cross-Border Leases and Related Tax and Accounting Matters, and Business Segments Review in Item 7 of this Report here by reference. Also, we include financial and other information by business in Note 21 Segment Reporting in the Notes To Consolidated Financial Statements in Item 8 of this Report here by reference.
We have four major businesses engaged in providing banking, asset management and global fund processing products and services: Retail Banking; Corporate & Institutional Banking; BlackRock; and PFPC. Assets, revenue and earnings attributable to foreign activities were not material in the periods presented.
RETAIL BANKING
Retail Banking provides deposit, lending, brokerage, trust, investment management, and cash management services to approximately 2.5 million consumer and small business customers within our primary geographic area. Our customers are serviced through approximately 850 offices in our branch network, the call center located in Pittsburgh and the Internet –www.pncbank.com. The branch network is located primarily in Pennsylvania; New Jersey; the greater Washington, DC area, including Maryland and Virginia; Ohio; Kentucky; and Delaware. Brokerage services are provided through PNC Investments, LLC, and J.J.B. Hilliard, W.L. Lyons, Inc. Retail Banking also serves as investment manager and trustee for employee benefit plans and charitable and endowment assets and provides nondiscretionary defined contribution plan services and investment options through itsVested Interest®product. These services are provided to individuals and corporations primarily within our primary geographic markets.
Our goal is to generate sustainable revenue growth by continuing to increase our customer base. We also seek revenue growth by attempting to sell additional products and services to these customers. In addition, we are focused on optimizing our network of branches by opening and upgrading stand-alone and in-store branches in attractive sites while consolidating or selling branches with less opportunity for growth.
CORPORATE & INSTITUTIONAL BANKING
Corporate & Institutional Banking provides lending, treasury management, and capital markets products and services to mid-sized corporations, government entities and selectively to large corporations. Lending products include secured and unsecured loans, letters of credit and equipment leases. Treasury management services include cash and investment management, receivables management, disbursement services, funds transfer services, information reporting and global trade services. Capital markets-related products and services include foreign exchange, derivatives, loan syndications, mergers and acquisitions advisory and related services to middle-market companies, securities underwriting, and securities sales and trading. Corporate & Institutional Banking also provides
commercial loan servicing, real estate advisory and technology solutions for the commercial real estate finance industry. Corporate & Institutional Banking provides products and services generally within our primary geographic markets, with certain products and services provided nationally.
Corporate & Institutional Banking is focused on becoming a premier provider of financial services in each of the markets it serves. Its value proposition to its customers is driven by providing a broad range of competitive and high quality products and services by a team fully committed to delivering the comprehensive resources of PNC to help each client succeed. Corporate & Institutional Banking’s primary goals are to achieve market share growth and enhanced returns by means of expansion and retention of customer relationships and prudent risk and expense management.
BLACKROCK
BlackRock, Inc. (“BlackRock”) is one of the largest publicly traded investment management firms in the United States. As of December 31, 2006, BlackRock’s assets under management were approximately $1.1 trillion. The firm manages assets on behalf of institutions and individuals worldwide through a variety of fixed income, cash management, equity, and alternative investment separate account and mutual fund products. In addition, BlackRock provides BlackRock Solutions®, risk management, investment system outsourcing, and financial advisory services to institutional investors. The firm has a major presence in key global markets, including the United States, Europe, Asia, Australia and the Middle East. For additional information, please see BlackRock’s filings with the SEC, accessible on the SEC’s website or on the firm’s website at www.blackrock.com.
On September 29, 2006, Merrill Lynch contributed its investment management business (“MLIM”) to BlackRock in exchange for 65 million shares of newly issued BlackRock common and preferred stock. Immediately following the closing, PNC continued to own approximately 44 million shares of BlackRock common stock. Accordingly, at December 31, 2006, our ownership interest in BlackRock was approximately 34%. Prior to this transaction, BlackRock had been a majority-owned subsidiary of PNC. See Note 2 Acquisitions in the Notes To Consolidated Financial Statements in Item 8 of this Report for further details regarding the BlackRock/MLIM transaction.
Subsequent to the BlackRock/MLIM transaction, our BlackRock investment continues to be a strategic asset of PNC and a key component of our diversified earnings stream. The ability of BlackRock to grow assets under management is the key driver of increases in its revenue, earnings and, ultimately, shareholder value. BlackRock’s strategies for growth in assets under management include a focus on achieving client investment performance objectives in a manner consistent with their risk preferences and delivering excellent client service. The business dedicates significant
3
resources to attracting and retaining talented professionals and to the ongoing enhancement of its investment technology and operating capabilities to deliver on its strategy.
PFPC
PFPC is a leading full service provider of processing, technology and business solutions for the global investment industry. Securities services include custody, securities lending, and accounting and administration for funds registered under the 1940 Act and alternative investments. Investor services include transfer agency, managed accounts, subaccounting, and distribution. PFPC serviced $2.2 trillion in total assets and 68 million shareholder accounts as of December 31, 2006 both domestically and internationally through its Ireland and Luxembourg operations.
PFPC focuses technological resources on driving efficiency through streamlining operations and developing flexible systems architecture and client-focused servicing solutions.
SUBSIDIARIES Our corporate legal structure at December 31, 2006 consisted of two subsidiary banks, including their subsidiaries, and approximately 60 active non-bank subsidiaries. PNC Bank, N.A., headquartered in Pittsburgh, Pennsylvania, is our principal bank subsidiary. At December 31, 2006, PNC Bank, N.A. had total consolidated assets representing approximately 89% of our consolidated assets. Our other bank subsidiary is PNC Bank, Delaware. For additional information on our subsidiaries, you may review Exhibit 21 to this Report.
STATISTICALDISCLOSUREBYBANKHOLDINGCOMPANIESThe following statistical information is included on the indicated pages of this Report and is incorporated herein by reference:
| | |
Form 10-K page |
Average Consolidated Balance Sheet And Net Interest Analysis | | 119 |
Analysis Of Year-To-Year Changes In Net Interest Income | | 118 |
Book Values Of Securities | | 28 and 89-91 |
Maturities And Weighted-Average Yield Of Securities | | 91 |
Loan Types | | 27, 92 and 120 |
Selected Loan Maturities And Interest Sensitivity | | 122 |
Nonaccrual, Past Due And Restructured Loans And Other Nonperforming Assets | | 49,75-76, 94 and 120 |
Potential Problem Loans And Loans Held For Sale | | 29-30, 49 |
Summary Of Loan Loss Experience | | 49-50 and 121 |
Assignment Of Allowance For Loan And Lease Losses | | 49-50 and 121 |
Average Amount And Average Rate Paid On Deposits | | 119 |
Time Deposits Of $100,000 Or More | | 97 and 122 |
Selected Consolidated Financial Data | | 18-19 |
SUPERVISIONANDREGULATION
OVERVIEW
PNC is a bank holding company registered under the Bank Holding Company Act of 1956 as amended (“BHC Act”) and
a financial holding company under the Gramm-Leach-Bliley Act (“GLB Act”).
We are subject to numerous governmental regulations, some of which are highlighted below. You should also read Note 4 Regulatory Matters in the Notes To Consolidated Financial Statements in Item 8 of this Report, included here by reference, for additional information regarding our regulatory issues. Applicable laws and regulations restrict permissible activities and investments and require compliance with protections for loan, deposit, brokerage, fiduciary, mutual fund and other customers, among other things. They also restrict our ability to repurchase stock or to receive dividends from bank subsidiaries and impose capital adequacy requirements. The consequences of noncompliance can include substantial monetary and nonmonetary sanctions.
In addition, we are subject to comprehensive examination and supervision by, among other regulatory bodies, the Board of Governors of the Federal Reserve System (“Federal Reserve”) and the Office of the Comptroller of the Currency (“OCC”). We are subject to examination by these regulators, which results in examination reports and ratings (which are not publicly available) that can impact the conduct and growth of our businesses. These examinations consider not only compliance with applicable laws and regulations, but also capital levels, asset quality and risk, management ability and performance, earnings, liquidity, and various other factors. An examination downgrade by any of our federal bank regulators potentially can result in the imposition of significant limitations on our activities and growth. These regulatory agencies generally have broad discretion to impose restrictions and limitations on the operations of a regulated entity where the agencies determine, among other things, that such operations are unsafe or unsound, fail to comply with applicable law or are otherwise inconsistent with laws and regulations or with the supervisory policies of these agencies. This supervisory framework could materially impact the conduct, growth and profitability of our operations.
We are also subject to regulation by the Securities and Exchange Commission (“SEC”) by virtue of our status as a public company and due to the nature of some of our businesses.
As a regulated financial services firm, our relationships and good standing with regulators are of fundamental importance to the continuation and growth of our businesses. The Federal Reserve, OCC, SEC, and other domestic and foreign regulators have broad enforcement powers, and powers to approve, deny, or refuse to act upon our applications or notices to conduct new activities, acquire or divest businesses or assets, or reconfigure existing operations.
Over the last several years, there has been an increasing regulatory focus on compliance with anti-money laundering laws and regulations, resulting in, among other things, several
4
significant publicly announced enforcement actions. There has also been a heightened focus recently on the protection of confidential customer information.
There are numerous rules governing the regulation of financial services institutions and their holding companies. Accordingly, the following discussion is general in nature and does not purport to be complete or to describe all of the laws and regulations that apply to us.
BANK REGULATION
As a bank holding company and a financial holding company, we are subject to supervision and regular inspection by the Federal Reserve. Our subsidiary banks and their subsidiaries are subject to supervision and examination by applicable federal and state banking agencies, principally the OCC with respect to PNC Bank, N.A. and the Federal Reserve Bank of Cleveland and the Office of the State Bank Commissioner of Delaware with respect to PNC Bank, Delaware.
Notwithstanding PNC’s reduced ownership interest in BlackRock and the deconsolidation resulting from the BlackRock/MLIM transaction, BlackRock continues to be subject to the supervision and regulation of the Federal Reserve to the same extent as it was prior to the transaction.
Parent Company Liquidity and Dividends. The principal source of our liquidity at the parent company level is dividends from PNC Bank, N.A. Our subsidiary banks are subject to various federal and state restrictions on their ability to pay dividends to PNC Bancorp, Inc., the direct parent of the subsidiary banks, which in turn may affect the ability of PNC Bancorp, Inc. to pay dividends to PNC at the parent company level. Our subsidiary banks are also subject to federal laws limiting extensions of credit to their parent holding company and non-bank affiliates as discussed in Note 4 Regulatory Matters included in the Notes To Consolidated Financial Statements in Item 8 of this Report, which is incorporated herein by reference. Further information is also available in the Liquidity Risk Management section of Item 7 of this Report.
Under Federal Reserve policy, a bank holding company is expected to act as a source of financial strength to each of its subsidiary banks and to commit resources to support each such bank. Consistent with the “source of strength” policy for subsidiary banks, the Federal Reserve has stated that, as a matter of prudent banking, a bank holding company generally should not maintain a rate of cash dividends unless its net income available to common shareholders has been sufficient to fully fund the dividends and the prospective rate of earnings retention appears to be consistent with the corporation’s capital needs, asset quality and overall financial condition. This policy does not currently have a negative impact on PNC’s ability to pay dividends at our current level.
Additional Powers Under the GLB Act. The GLB Act permits a qualifying bank holding company to become a “financial
holding company” and thereby to affiliate with financial companies engaging in a broader range of activities than would otherwise be permitted for a bank holding company. Permitted affiliates include securities underwriters and dealers, insurance companies and companies engaged in other activities that are determined by the Federal Reserve, in consultation with the Secretary of the Treasury, to be “financial in nature or incidental thereto” or are determined by the Federal Reserve unilaterally to be “complementary” to financial activities. We became a financial holding company as of March 13, 2000.
The Federal Reserve is the “umbrella” regulator of a financial holding company, with its operating entities, such as its subsidiary broker-dealers, investment managers, investment companies, insurance companies and banks, also subject to the jurisdiction of various federal and state “functional” regulators with normal regulatory responsibility for companies in their lines of business.
As subsidiaries of a financial holding company under the GLB Act, our non-bank subsidiaries are allowed to conduct new financial activities or acquire non-bank financial companies with after-the-fact notice to the Federal Reserve. In addition, our non-bank subsidiaries (and any financial subsidiaries of subsidiary banks) are now permitted to engage in certain activities that were not permitted for banks and bank holding companies prior to enactment of the GLB Act, and to engage on less restrictive terms in certain activities that were previously permitted. Among other activities, we currently rely on our status as a financial holding company to conduct mutual fund distribution activities, merchant banking activities, and underwriting and dealing activities.
To continue to qualify for financial holding company status, our subsidiary banks must maintain “well capitalized” capital ratios, examination ratings of “1” or “2” (on a scale of 1 to 5), and certain other criteria that are incorporated into the definition of “well managed” under the BHC Act and Federal Reserve rules. If we were to no longer qualify for this status, we could not continue to enjoy the after-the-fact notice process for new non-banking activities and non-banking acquisitions, and would be required promptly to enter into an agreement with the Federal Reserve providing a plan for our subsidiary banks to meet the “well capitalized” and “well managed” criteria. The Federal Reserve would have broad authority to limit our activities. Failure to satisfy the criteria within a six-month period could result in a requirement that we conform existing non-banking activities to activities that were permissible prior to the enactment of the GLB Act. If a subsidiary bank failed to maintain a “satisfactory” or better rating under the Community Reinvestment Act of 1977, as amended (“CRA”), we could not commence new activities or make new investments in reliance on the GLB Act.
In addition, the GLB Act permits a national bank, such as PNC Bank, N.A., to engage in expanded activities through the
5
formation of a “financial subsidiary.” In order to qualify to establish or acquire a financial subsidiary, PNC Bank, N.A. and each of its depository institution affiliates must be “well capitalized” and “well managed” and may not have a less than “satisfactory” CRA rating. A national bank that is one of the largest 50 insured banks in the United States, such as PNC Bank, N.A., must also have issued debt (which, for this purpose, may include the uninsured portion of PNC Bank, N.A.’s long-term certificates of deposit) with certain minimum ratings. PNC Bank, N.A. has filed a financial subsidiary certification with the OCC and currently engages in insurance agency activities through a financial subsidiary. PNC Bank, N.A. may also generally engage through a financial subsidiary in any activity that is financial in nature or incidental to a financial activity. Certain activities, however, are impermissible for a financial subsidiary of a national bank, including insurance underwriting, insurance investments, real estate investment or development, and merchant banking.
If one of our subsidiary banks were to fail to meet the “well capitalized” or “well managed” and related criteria, PNC Bank, N.A. would be required to enter into an agreement with the OCC to correct the condition. The OCC would have the authority to limit the activities of the bank. If the condition were not corrected within six months or within any additional time granted by the OCC, PNC Bank, N.A. could be required to conform the activities of any of its financial subsidiaries to activities in which a national bank could engage directly. In addition, if the bank or any insured depository institution affiliate receives a less than satisfactory CRA examination rating, PNC Bank, N.A. would not be permitted to engage in any new activities or to make new investments in reliance on the financial subsidiary authority.
Other Federal Reserve and OCC Regulation. The federal banking agencies possess broad powers to take corrective action as deemed appropriate for an insured depository institution and its holding company. The extent of these powers depends upon whether the institution in question is considered “well capitalized,” “adequately capitalized,” “undercapitalized,” “significantly undercapitalized” or “critically undercapitalized.” Generally, the smaller an institution’s capital base in relation to its total assets, the greater the scope and severity of the agencies’ powers, ultimately permitting the agencies to appoint a receiver for the institution. Business activities may also be influenced by an institution’s capital classification. For instance, only a “well capitalized” depository institution may accept brokered deposits without prior regulatory approval and an “adequately capitalized” depository institution may accept brokered deposits only with prior regulatory approval. At December 31, 2006 and December 31, 2005, both of our subsidiary banks exceeded the required ratios for classification as “well capitalized.” For additional discussion of capital adequacy requirements, we refer you to “Capital And Funding Sources” in the Consolidated Balance Sheet Review section of Item 7 of this Report and to Note 4 Regulatory Matters included in the
Notes To Consolidated Financial Statements in Item 8 of this Report.
Laws and regulations limit the scope of our permitted activities and investments. In addition to the activities that would be permitted a financial subsidiary, national banks (such as PNC Bank, N.A.) and their operating subsidiaries may engage in any activities that are determined by the OCC to be part of or incidental to the business of banking.
Moreover, examination ratings of “3” or lower, lower capital ratios than peer group institutions, regulatory concerns regarding management, controls, assets, operations or other factors, can all potentially result in practical limitations on the ability of a bank or bank holding company to engage in new activities, grow, acquire new businesses, repurchase its stock or pay dividends, or to continue to conduct existing activities.
The Federal Reserve’s prior approval is required whenever we propose to acquire all or substantially all of the assets of any bank or thrift, to acquire direct or indirect ownership or control of more than 5% of the voting shares of any bank or thrift, or to merge or consolidate with any other bank holding company or thrift holding company. When reviewing bank acquisition applications for approval, the Federal Reserve considers, among other things, each subsidiary bank’s record in meeting the credit needs of the communities it serves in accordance with the CRA. Our ability to grow through acquisitions could be limited by these approval requirements.
At December 31, 2006, both of our bank subsidiaries, PNC Bank, N.A. and PNC Bank, Delaware, were rated “outstanding” with respect to CRA.
FDIC Insurance. Both of our subsidiary banks are insured by the FDIC and subject to premium assessments. Regulatory matters could increase the cost of FDIC deposit insurance premiums to an insured bank. Since 1996, the FDIC had not assessed banks in the most favorable capital and assessment risk classification categories for insurance premiums for most deposits, due to the favorable ratio of the assets in the FDIC’s deposit insurance funds to the aggregate level of insured deposits outstanding. This resulted in significant cost savings to all insured banks. Deposit insurance premiums are assessed as a percentage of the deposits of the insured institution.
Beginning January 1, 2007, the FDIC reinstituted the assessment premiums for all deposits, which could impose a significant cost to all insured banks, including our subsidiary banks, reducing the net spread between deposit and other bank funding costs and the earnings from assets and services of the bank, and thus the net income of the bank. Because of a one-time assessment credit based on deposit premiums that the subsidiary banks of PNC had paid prior to 1996, the deposit insurance assessment for PNC’s subsidiary banks should be substantially offset for at least the next two years.
6
FDIC deposit insurance premiums are “risk based”; therefore, higher fee percentages would be charged to banks that have lower capital ratios or higher risk profiles. These risk profiles take into account weaknesses that are found by the primary banking regulator through its examination and supervision of the bank. A negative evaluation by the FDIC or a bank’s primary federal banking regulator could increase the costs to a bank and result in an aggregate cost of deposit funds higher than that of competing banks in a lower risk category.
Our subsidiary banks are subject to “cross-guarantee” provisions under federal law that provide that if one of these banks fails or requires FDIC assistance, the FDIC may assess a “commonly-controlled” bank for the estimated losses suffered by the FDIC. Such liability could have a material adverse effect on our financial condition or that of the assessed bank. While the FDIC’s claim is junior to the claims of depositors, holders of secured liabilities, general creditors and subordinated creditors, it is superior to the claims of the bank’s shareholders and affiliates, including PNC and intermediate bank holding companies.
SECURITIESAND RELATED REGULATION
The SEC, together with either the OCC or the Federal Reserve, regulates our registered broker-dealer subsidiaries. These subsidiaries are also subject to rules and regulations promulgated by the National Association of Securities Dealers, Inc. (“NASD”), among others. Hilliard Lyons is also a member of the New York Stock Exchange and subject to its regulations and supervision.
Several of our subsidiaries are registered with the SEC as investment advisers and, therefore, are subject to the requirements of the Investment Advisers Act of 1940 and the SEC’s regulations thereunder. The principal purpose of the regulations applicable to investment advisers is the protection of clients and the securities markets, rather than the protection of creditors and shareholders of investment advisors. The regulations applicable to investment advisers cover all aspects of the investment advisory business, including limitations on the ability of investment advisers to charge performance-based or non-refundable fees to clients; record-keeping; operational, marketing and reporting requirements; disclosure requirements; limitations on principal transactions between an adviser or its affiliates and advisory clients; as well as general anti-fraud prohibitions. These investment advisory subsidiaries also may be subject to state securities laws and regulations. In addition, our investment advisory subsidiaries that are investment advisors to registered investment companies and other managed accounts are subject to the requirements of the Investment Company Act of 1940, as amended, and the SEC’s regulations thereunder. PFPC is subject to regulation by the SEC as a service provider to registered investment companies.
Additional legislation, changes in rules promulgated by the SEC, other federal and state regulatory authorities and self-
regulatory organizations, or changes in the interpretation or enforcement of existing laws and rules may directly affect the method of operation and profitability of investment advisers. The profitability of investment advisers could also be affected by rules and regulations that impact the business and financial communities in general, including changes to the laws governing taxation, antitrust regulation and electronic commerce.
Recently, the SEC and other governmental agencies have been investigating the mutual fund industry, including its service providers. The SEC has adopted and proposed various rules, and legislation has been introduced in Congress, intended to reform the regulation of this industry. The effect of regulatory reform has, and is likely to continue to, increase the extent of regulation of the mutual fund industry and impose additional compliance obligations and costs on our subsidiaries involved with that industry.
Under various provisions of the federal securities laws (including in particular those applicable to broker-dealers, investment advisers and registered investment companies and their service providers), a determination by a court or regulatory agency that certain violations have occurred at a company or its affiliates can result in fines, a limitation of permitted activities, disqualification to continue to conduct certain activities and an inability to rely on certain favorable exemptions. Certain types of infractions and violations can also affect a public company in its timing and ability to expeditiously issue new securities into the capital markets. In addition, expansion of activities of a broker-dealer generally requires approval of the New York Stock Exchange and/or NASD, and regulators may take into account a variety of considerations in acting upon such applications, including internal controls, capital, management experience and quality, and supervisory concerns.
BlackRock has subsidiaries in securities and related businesses subject to SEC and NASD regulation, as described above. For additional information about the regulation of BlackRock, we refer you to the discussion under the “Regulation” section of Item 1 Business in BlackRock’s most recent Annual Report on Form 10-K, which may be obtained electronically at the SEC’s website at www.sec.gov.
COMPETITION We are subject to intense competition from various financial institutions and from non-bank entities that engage in similar activities without being subject to bank regulatory supervision and restrictions.
In making loans, our subsidiary banks compete with traditional banking institutions as well as consumer finance companies, leasing companies and other non-bank lenders, and institutional investors including CLO managers, hedge funds, mutual fund complexes and private equity firms. Loan pricing, structure and credit standards are under competitive pressure as lenders seek to deploy capital and a broader range
7
of borrowers have access to capital markets. Traditional deposit activities are subject to pricing pressures and customer migration as a result of intense competition for consumer investment dollars.
Our subsidiary banks compete for deposits with the following:
| | • | | Other commercial banks, |
| | • | | Savings and loan associations, |
| | • | | Treasury management service companies, |
| | • | | Insurance companies, and |
| | • | | Issuers of commercial paper and other securities, including mutual funds. |
Our various non-bank businesses engaged in investment banking and private equity activities compete with the following:
| | • | | Investment banking firms, |
| | • | | Private equity firms, and |
| | • | | Other investment vehicles. |
In providing asset management services, our businesses compete with the following:
| | • | | Investment management firms, |
| | • | | Large banks and other financial institutions, |
| | • | | Mutual fund complexes, and |
The fund servicing business is also highly competitive, with a relatively small number of providers. Merger, acquisition and consolidation activity in the financial services industry has also impacted the number of existing or potential fund servicing clients and has intensified competition.
We include here by reference the additional information regarding competition included in the Item 1A Risk Factors section of this Report.
EMPLOYEES Period-end employees totaled 23,783 at December 31, 2006 (comprised of 21,455 full-time and 2,328 part-time employees).
SEC REPORTS AND CORPORATE GOVERNANCE INFORMATION
We are subject to the informational requirements of the Securities Exchange Act of 1934, as amended (“Exchange Act”), and, in accordance with the Exchange Act, we file annual, quarterly and current reports, proxy statements, and other information with the SEC. Our SEC File Number is 001-09718. You may read and copy this information at the SEC’s Public Reference Room located at 100 F Street NE, Room 1580, Washington, D.C. 20549. You can obtain
information on the operation of the Public Reference Room by calling the SEC at 1-800-SEC-0330.
You can also obtain copies of this information by mail from the Public Reference Section of the SEC, 100F Street, N.E., Washington, D.C. 20549, at prescribed rates.
The SEC also maintains an internet World Wide Web site that contains reports, proxy and information statements, and other information about issuers, like us, who file electronically with the SEC. The address of that site is www.sec.gov. You can also inspect reports, proxy statements and other information about us at the offices of The New York Stock Exchange, 20 Broad Street, New York, New York 10005.
We also make our Annual Report on Form 10-K, Quarterly Reports on Form 10-Q, Current Reports on Form 8-K, and amendments to those reports filed or furnished to the SEC pursuant to Section 13(a) or 15(d) of the Exchange Act available free of charge on or through our internet website as soon as reasonably practicable after we electronically file such material with, or furnish it to, the SEC. PNC’s corporate internet address iswww.pnc.com and you can find this information under “About PNC – Investor Relations – Financial Information – SEC filings – Form 10-K. ” Shareholders and bondholders may also obtain copies of these filings without charge by contacting Shareholder Services at 800-982-7652 or via e-mail at web.queries@computershare.com for copies without exhibits, or by contacting Shareholder Relations at (800) 843-2206 or via e-mail at investor.relations@pnc.com for copies of exhibits. We filed the certifications of our Chairman and Chief Executive Officer and our Chief Financial Officer required pursuant to Section 302 of the Sarbanes-Oxley Act of 2002 with respect to our Annual Report on Form 10-K for 2005 with the SEC as exhibits to that Report and have filed the CEO and CFO certifications required by Section 302 of that Act with respect to this Form 10-K as exhibits to this Report.
Information about our Board and its committees and corporate governance at PNC is available on PNC’s corporate website at www.pnc.com under “About PNC – Investor Relations – Corporate Governance.” Shareholders who would like to request printed copies of the PNC Code of Business Conduct and Ethics or our Corporate Governance Guidelines or the charters of our Board’s Audit, Nominating and Governance, or Personnel and Compensation Committees (all of which are posted on the PNC corporate website) may do so by sending their requests to George P. Long, III, Corporate Secretary, at corporate headquarters at One PNC Plaza, 249 Fifth Avenue, Pittsburgh, Pennsylvania 15222-2707. Copies will be provided without charge to shareholders.
Our common stock is listed on the New York Stock Exchange (“NYSE”) under the symbol “PNC.” Our Chairman and Chief Executive Officer submitted the required annual CEO’s Certification regarding the NYSE’s corporate governance
8
listing standards (a Section 12(a) CEO Certification) to the NYSE within 30 days after our 2006 annual shareholders meeting.
ITEM 1A –RISKFACTORS
We are subject to a number of risks potentially impacting our business, financial condition, results of operations and cash flows. Indeed, as a financial services organization, certain elements of risk are inherent in every one of our transactions and are presented by every business decision we make. Thus, we encounter risk as part of the normal course of our business, and we design risk management processes to help manage these risks.
There are risks that are known to exist at the outset of a transaction. For example, every loan transaction presents credit risk (the risk that the borrower may not perform in accordance with contractual terms) and interest rate risk (a potential loss in earnings or economic value due to adverse movement in market interest rates or credit spreads), with the nature and extent of these risks principally depending on the identity of the borrower and overall economic conditions. These risks are inherent in every loan transaction; if we wish to make loans, we must manage these risks through the terms and structure of the loans and through management of our deposits and other funding sources. The success of our business is dependent on our ability to identify, understand and manage the risks presented by our business activities so that we can balance appropriately revenue generation and profitability with these inherent risks. We discuss our principal risk management processes and, in appropriate places, related historical performance in the Risk Management section included in Item 7 of this Report.
The following are the key risk factors that affect us. These risk factors are also discussed further in other parts of this Report.
A sustained weakness or weakening in business and economic conditions generally or specifically in the principal markets in which we do business could adversely affect our business and operating results.
PNC’s business could be adversely affected to the extent that weaknesses in business and economic conditions have direct or indirect impacts on us or on our customers and counterparties. These conditions could lead, for example, to one or more of the following:
| | • | | A decrease in the demand for loans and other products and services offered by us, |
| | • | | A decrease in the value of our loans held for sale, |
| | • | | A decrease in the usage of unfunded commitments, |
| | • | | A decrease in customer savings generally and in the demand for savings and investment products offered by us, and |
| | • | | An increase in the number of customers and counterparties who become delinquent, file for |
| | protection under bankruptcy laws, or default on their loans or other obligations to us. An increase in the number of delinquencies, bankruptcies or defaults could result in a higher level of nonperforming assets, net charge-offs, provision for credit losses, and valuation adjustments on loans held for sale. |
Although many of our businesses are national and some are international in scope, our retail banking business is concentrated within our retail branch network footprint (Delaware, Indiana, Kentucky, New Jersey, Ohio, Pennsylvania, and the greater Washington, D.C. area, including Maryland and Virginia), and thus that business is particularly vulnerable to adverse changes in economic conditions in these regions.
Changes in interest rates or in valuations in the debt or equity markets could directly impact our assets and liabilities and our performance.
Given our business mix, our traditional banking activities of gathering deposits and extending loans, and the fact that most of our assets and liabilities are financial in nature, we tend to be particularly sensitive to market interest rate movement and the performance of the financial markets.In addition to the impact on the economy generally, with some of the potential effects outlined above, changes in interest rates, in the shape of the yield curve, or in valuations in the debt or equity markets could directly impact us in one or more of the following ways:
| | • | | Such changes could affect the difference between the interest that we earn on assets and the interest that we pay on liabilities, as well as the value of some or all of our on-balance sheet and off-balance sheet financial instruments or the value of equity investments that we hold or of our equity funding obligations; |
| | • | | To the extent to which we access capital markets to raise funds to support our business, such changes could affect the cost of such funds or our ability to raise such funds; and |
| | • | | Such changes could affect the value of the assets that we manage or otherwise administer for others or the assets for which we provide processing services. Although we are not directly impacted by changes in the value of assets that we manage or administer for others or for which we provide processing services, decreases in the value of those assets would affect our fee income relating to those assets and could result in decreased demand for our services. |
As a result of the high percentage of our assets and liabilities that are in the form of interest-bearing instruments, the monetary, tax and other policies of the government and its agencies, including the Federal Reserve, which have a significant impact on interest rates and overall financial market performance, can affect the activities and results of
9
operations of bank holding companies and their subsidiaries, such as PNC and our subsidiaries. An important function of the Federal Reserve is to regulate the national supply of bank credit and market interest rates. The actions of the Federal Reserve influence the rates of interest that we charge on loans and that we pay on borrowings and interest-bearing deposits and can also affect the value of our on-balance sheet and off-balance sheet financial instruments. Both due to the impact on rates and by controlling access to direct funding from the Federal Reserve Banks, the Federal Reserve’s policies also influence, to a significant extent, our cost of funding. We cannot predict the nature or timing of future changes in monetary, tax and other policies or the effect that they may have on our activities and results of operations.
We operate in a highly competitive environment, both in terms of the products and services we offer, the geographic markets in which we conduct business, as well as our labor markets and competition for talented employees. Competition could adversely impact our customer acquisition, growth and retention, as well as our credit spreads and product pricing, causing us to lose market share and deposits and revenues.
We are subject to intense competition from various financial institutions and from non-bank entities that engage in similar activities without being subject to bank regulatory supervision and restrictions. This competition is described in Item 1 under “Competition.”
In all, the principal bases for competition are pricing (including the interest rates charged on loans or paid on interest-bearing deposits), structure, the range of products and services offered, and the quality of customer service (including convenience and responsiveness to customer needs and concerns). The ability to access and use technology is an increasingly important competitive factor in the financial services industry. Technology is important not only with respect to delivery of financial services but also in processing information. Each of our businesses consistently must make significant technological investments to remain competitive.
A failure to address adequately the competitive pressures we face could make it harder for us to attract and retain customers across our businesses. On the other hand, meeting these competitive pressures could require us to incur significant additional expenses or to accept risk beyond what we would otherwise view as desirable under the circumstances. In addition, in our interest sensitive businesses, pressures to increase rates on deposits or decrease rates on loans could reduce our net interest margin with a resulting negative impact on our net interest income. Any of these results would likely have an adverse effect on our overall financial performance.
We grow our business in part by acquiring from time to time other financial services companies, and these acquisitions present us with a number of risks and uncertainties related both to the acquisition transactions themselves and to the integration of the acquired businesses into PNC after closing.
Acquisitions of other financial services companies also present risks to PNC other than those presented by the nature of the business acquired. In particular, acquisitions may be substantially more expensive to complete (including costs incurred in connection with the integration of the acquired company) and the anticipated benefits (including anticipated cost savings and strategic gains) may be significantly harder or take longer to achieve than expected. In some cases, acquisitions involve our entry into new businesses or new geographic or other markets, and these situations also present risks resulting from our inexperience in these new areas. As a regulated financial institution, our pursuit of attractive acquisition opportunities could be negatively impacted due to regulatory delays or other regulatory issues. Regulatory and/or legal issues relating to the pre-acquisition operations of an acquired business may cause reputational harm to PNC following the acquisition and integration of the acquired business into ours and may result in additional future costs and expenses arising as a result of those issues.
Our pending acquisition of Mercantile presents many of the risks and uncertainties related to acquisition transactions themselves and to the integration of the acquired businesses into PNC after closing described above.
The performance of our asset management businesses may be adversely affected by the relative performance of our products compared with alternative investments.
Asset management revenue is primarily based on a percentage of the value of assets under management and, in some cases, performance fees, in most cases expressed as a percentage of the returns realized on assets under management, and thus is impacted by general changes in capital markets valuations and customer preferences. In addition, investment performance is an important factor influencing the level of assets under management. Poor investment performance could impair revenue and growth as existing clients might withdraw funds in favor of better performing products. Also, performance fees could be lower or nonexistent. Additionally, the ability to attract funds from existing and new clients might diminish.
The performance of our fund servicing business may be adversely affected by changes in investor preferences, or changes in existing or potential fund servicing clients or alternative providers.
Fund servicing fees are primarily derived from the market value of the assets and the number of shareholder accounts that we administer for our clients. The performance of our
10
fund processing business is thus partially dependent on the underlying performance of its fund clients and, in particular, their ability to attract and retain customers. Changes in interest rates or a sustained weakness, weakening or volatility in the debt and equity markets could (in addition to affecting directly the value of assets administered as discussed above) influence an investor’s decision to invest or maintain an investment in a particular mutual fund or other pooled investment product. Other factors beyond our control may impact the ability of our fund clients to attract or retain customers or customer funds, including changes in preferences as to certain investment styles. Further, to the extent that our fund clients’ businesses are adversely affected by ongoing governmental investigations into the practices of the mutual and hedge fund industries, our fund processing business’ results also could be adversely impacted. As a result of these types of factors, fluctuations may occur in the level or value of assets for which we provide processing services. In addition, this regulatory and business environment is likely to continue to result in operating margin pressure for our various services.
As a regulated financial services firm, we are subject to numerous governmental regulations and to comprehensive examination and supervision by regulators, which affects our business as well as our competitive position.
PNC is a bank and financial holding company and is subject to numerous governmental regulations involving both its business and organization. Our businesses are subject to regulation by multiple bank regulatory bodies as well as multiple securities industry regulators. Applicable laws and regulations restrict our ability to repurchase stock or to receive dividends from bank subsidiaries and impose capital adequacy requirements. They also restrict permissible activities and investments and require compliance with protections for loan, deposit, brokerage, fiduciary, mutual fund and other customers, and for the protection of customer information, among other things. The consequences of noncompliance can include substantial monetary and nonmonetary sanctions as well as damage to our reputation and business.
In addition, we are subject to comprehensive examination and supervision by banking and other regulatory bodies. Examination reports and ratings (which often are not publicly available) and other aspects of this supervisory framework can materially impact the conduct, growth, and profitability of our businesses.
We discuss these and other regulatory issues applicable to PNC in the Supervision and Regulation section included in Item 1 of this Report and in Note 4 Regulatory Matters in the Notes To Consolidated Financial Statements in Item 8 of this Report and here by reference.
Over the last several years, there has been an increasing regulatory focus on compliance with anti-money laundering laws and regulations, resulting in, among other things, several
significant publicly-announced enforcement actions. There has also been a heightened focus recently, by customers and the media as well as by regulators, on the protection of confidential customer information. A failure to have adequate procedures to comply with anti-money laundering laws and regulations or to protect the confidentiality of customer information could expose us to damages, fines and regulatory penalties, which could be significant, and could also injure our reputation with customers and others with whom we do business.
We must comply with generally accepted accounting principles established by the Financial Accounting Standards Board, rules set forth by the SEC, income tax regulations established by the Department of the Treasury, and revenue rulings and other guidance issued by the Internal Revenue Service, which affect our financial condition and results of operations.
Changes in accounting standards, or interpretations of those standards, can impact our revenue recognition and expense policies and affect our estimation methods used to prepare the consolidated financial statements. Changes in income tax regulations, revenue rulings, revenue procedures, and other guidance can impact our tax liability and alter the timing of cash flows associated with tax deductions and payments. New guidance often dictates how changes to standards and regulations are to be presented in our consolidated financial statements, as either an adjustment to beginning retained earnings for the period or as income or expense in current period earnings. Certain changes may also be required to be applied retrospectively.
Our business and financial performance could be adversely affected, directly or indirectly, by natural disasters, by terrorist activities or by international hostilities.
The impact of natural disasters, terrorist activities and international hostilities cannot be predicted with respect to severity or duration. However, any of these could impact us directly (for example, by causing significant damage to our facilities or preventing us from conducting our business in the ordinary course), or could impact us indirectly through a direct impact on our borrowers, depositors, other customers, suppliers or other counterparties. We could also suffer adverse consequences to the extent that natural disasters, terrorist activities or international hostilities affect the economy and financial and capital markets generally. These types of impacts could lead, for example, to an increase in delinquencies, bankruptcies or defaults that could result in our experiencing higher levels of nonperforming assets, net charge-offs and provisions for credit losses.
Our ability to mitigate the adverse consequences of such occurrences is in part dependent on the quality of our resiliency planning, including our ability to anticipate the
11
nature of any such event that occurs. The adverse impact of natural disasters or terrorist activities or international hostilities also could be increased to the extent that there is a lack of preparedness on the part of national or regional emergency responders or on the part of other organizations and businesses that we deal with, particularly those that we depend upon.
ITEM 1B ���UNRESOLVEDSTAFFCOMMENTS
There are no SEC staff comments regarding PNC’s periodic or current reports under the Exchange Act that are pending resolution.
ITEM 2 –PROPERTIES
Our executive and administrative offices are located at One PNC Plaza, Pittsburgh, Pennsylvania. The thirty-story structure is owned by PNC Bank, N. A. We occupy the entire building. In addition, PNC Bank, N.A. owns a thirty-four story structure adjacent to One PNC Plaza, known as Two PNC Plaza, that houses additional office space.
We own or lease numerous other premises for use in conducting business activities. We consider the facilities owned or occupied under lease by our subsidiaries to be adequate. We include here by reference the additional information regarding our properties in Note 10 Premises, Equipment and Leasehold Improvements in the Notes To Consolidated Financial Statements in Item 8 of this Report.
ITEM 3 –LEGALPROCEEDINGS
Some of our subsidiaries are defendants (or have potential contractual contribution obligations to other defendants) in several pending lawsuits brought during late 2002 and 2003 arising out of the bankruptcy of Adelphia Communications Corporation and its subsidiaries. There also are threatened additional proceedings arising out of the same matters. One of the lawsuits was brought on Adelphia’s behalf by the unsecured creditors’ committee and equity committee in Adelphia’s consolidated bankruptcy proceeding and was removed to the United States District Court for the Southern District of New York by order dated February 9, 2006. The other lawsuits, one of which is a putative consolidated class action, were brought by holders of debt and equity securities of Adelphia and have been consolidated for pretrial purposes in that district court. These lawsuits arise out of lending and securities underwriting activities engaged in by these PNC subsidiaries together with other financial services companies. In the aggregate, more than 400 other financial services companies and numerous other companies and individuals have been named as defendants in one or more of the lawsuits. Collectively, with respect to some or all of the defendants, the lawsuits allege federal law claims, including violations of federal securities and other federal laws, violations of common law duties, aiding and abetting such violations, voidable preference payments, and fraudulent transfers, among other matters. The lawsuits seek unquantified
monetary damages, interest, attorneys’ fees and other expenses, and a return of the alleged voidable preference and fraudulent transfer payments, among other remedies. The bank defendants, including the PNC defendants, have entered into a settlement of the consolidated class action referred to above. This settlement was approved by the district court in November 2006. In December 2006, a group of class members appealed the order approving the settlement agreement to the United States Court of Appeals for the Second Circuit. The amount for which we would be responsible under this settlement is insignificant. We believe that we have defenses to the claims against us in these lawsuits, as well as potential claims against third parties, and intend to defend the remaining lawsuits vigorously. These lawsuits involve complex issues of law and fact, presenting complicated relationships among the many financial and other participants in the events giving rise to these lawsuits, and have not progressed to the point where we can predict the outcome of the remaining lawsuits other than the one for which a settlement is pending. It is not possible to determine what the likely aggregate recoveries on the part of the plaintiffs in these remaining matters might be or the portion of any such recoveries for which we would ultimately be responsible, but the final consequences to PNC could be material.
In April 2005, an amended complaint was filed in the putative class action against PNC, PNC Bank, N.A., our Pension Plan and its Pension Committee in the United States District Court for the Eastern District of Pennsylvania (originally filed in December 2004). The complaint claims violations of the Employee Retirement Income Security Act of 1974, as amended (“ERISA”), arising out of the January 1, 1999 conversion of our Pension Plan from a traditional defined benefit formula into a “cash balance” formula, the design and continued operation of the Plan, and other related matters. Plaintiffs seek to represent a class of all current and former employee-participants in and beneficiaries of the Plan as of December 31, 1998 and thereafter. Plaintiffs also seek to represent a subclass of all current and former employee participants in and beneficiaries of the Plan as of December 31, 1998 and thereafter who were or would have become eligible for an early retirement subsidy under the former Plan at some time prior to the date of the amended complaint. The plaintiffs are seeking unquantified damages and equitable relief available under ERISA, including interest, costs, and attorneys’ fees. In November 2005, the court granted our motion to dismiss the amended complaint. Plaintiffs appealed this ruling to the United States Court of Appeals for the Third Circuit, which affirmed the district court ruling in an opinion dated January 30, 2007. On February 13, 2007, plaintiffs filed in the court of appeals a petition for rehearing. Plaintiffs may seek further judicial review of the dismissal of their complaint.
In March 2006, a first amended complaint was filed in the United States District Court for the Eastern District of Texas by Data Treasury Corporation against PNC and PNC Bank,
12
N.A., as well as more than 50 other financial institutions, vendors, and other companies, claiming that the defendants are infringing, and inducing or contributing to the infringement of, the plaintiff’s patents, which allegedly involve check imaging, storage and transfer. The plaintiff seeks unspecified damages and interest and trebling of both, attorneys’ fees and other expenses, and injunctive relief against the alleged infringement. We are not in a position to assess the likely outcome of this matter, including our exposure, if any. We believe that we have defenses to the claims against us in this lawsuit and intend to defend it vigorously. In January 2007, the district court entered an order staying the claims asserted against PNC under two of the four patents allegedly infringed by PNC, pending reexamination of these patents by the United States Patent and Trademark Office. The lawsuit will proceed with respect to the other two patents. Further, the stay may be lifted once the Patent and Trademark Office completes its reexamination.
In August 2006, a lawsuit was filed in the United States District Court for the Eastern District of Texas by Ronald A. Katz Technology Licensing L. P. (“RAKTL”) against PNC, PNC Bank, N.A., and other defendants. In September 2006, this lawsuit was divided into separate actions, and amended complaints were then filed, one of which was against PNC and PNC Bank, N.A. This lawsuit is one of many related RAKTL patent infringement actions pending in various federal district courts against a large number of defendants. Each of the actions involves a single family of related patents that RAKTL refers to as the “interactive call processing patents.” The amended complaint alleged that PNC and PNC Bank, N.A. are infringing, and inducing or contributing to the infringement of, certain of the plaintiff’s patents. In January 2007, the court dismissed the lawsuit against PNC following a settlement under which PNC and its affiliates received a non-exclusive license covering patents held by RAKTL. As part of the settlement, we agreed to pay a licensing fee to RAKTL. The amount of the fee is not material to PNC.
In its Form 10-Q for the quarter ended March 31, 2005, Riggs disclosed a number of pending lawsuits. All material lawsuits have been finally resolved, except one where a settlement agreement has been reached, subject to final documentation. The pending settlement is not material to PNC.
As a result of the acquisition of Riggs, PNC is now responsible for Riggs’ obligations to provide indemnification to its directors, officers, and, in some cases, employees and agents against certain liabilities incurred as a result of their service on behalf of or at the request of Riggs. PNC is also now responsible for Riggs’ obligations to advance on behalf of covered individuals costs incurred in connection with certain claims or proceedings, subject to written undertakings to repay all amounts so advanced if it is ultimately determined that the individual is not entitled to indemnification. Since the acquisition, we have advanced such costs on behalf of covered individuals from Riggs and expect to continue to do so in the
future at least with respect to lawsuits and other legal matters identified in Riggs’ first quarter 2005 Form 10-Q.
There are several pending judicial or administrative proceedings or other matters arising out of the three 2001 PAGIC transactions. These pending proceedings or other matters are described below. Among the requirements of a June 2003 Deferred Prosecution Agreement that one of our subsidiaries entered into relating to the PAGIC transactions was the establishment of a Restitution Fund through our $90 million contribution. The Restitution Fund will be available to satisfy claims, including for the settlement of the pending securities litigation referred to below. Louis W. Fryman, chairman of Fox Rothschild LLP in Philadelphia, Pennsylvania, is administering the Restitution Fund.
In December 2004 and January and March 2005, we entered into settlement agreements relating to certain of the lawsuits and other claims arising out of the PAGIC transactions. These settlements are described below, following a description of each of these pending proceedings and other matters.
The several putative class action complaints filed during 2002 in the United States District Court for the Western District of Pennsylvania arising out of the PAGIC transactions were consolidated in a consolidated class action complaint brought on behalf of purchasers of our common stock between July 19, 2001 and July 18, 2002 (the “Class Period”). The consolidated class action complaint names PNC, our Chairman and Chief Executive Officer, our former Chief Financial Officer, our Controller, and our independent auditors for 2001 as defendants and seeks unquantified damages, interest, attorneys’ fees and other expenses. The consolidated class action complaint alleges violations of federal securities laws related to disclosures regarding the PAGIC transactions and related matters.
In August 2002, the United States Department of Labor began a formal investigation of the Administrative Committee of our Incentive Savings Plan (“Plan”) in connection with the Administrative Committee’s conduct relating to our common stock held by the Plan. Both the Administrative Committee and PNC have cooperated fully with the investigation. In June 2003, the Administrative Committee retained Independent Fiduciary Services, Inc. (“IFS”) to serve as an independent fiduciary charged with the exclusive authority and responsibility to act on behalf of the Plan in connection with the pending securities class action litigation referred to above and to evaluate any legal rights the Plan might have against any parties relating to the PAGIC transactions. This authority includes representing the Plan’s interests in connection with the Restitution Fund set up under the Deferred Prosecution Agreement. The Department of Labor has communicated with IFS in connection with the engagement.
We received a letter in June 2003 on behalf of an alleged shareholder demanding that we take appropriate legal action
13
against our Chairman and Chief Executive Officer, our former Chief Financial Officer, and our Controller, as well as any other individuals or entities allegedly responsible for causing damage to PNC as a result of the PAGIC transactions. The Board referred this matter to a special committee of the Board for evaluation. The special committee completed its evaluation and reported its findings to the Board of Directors and to counsel for the alleged shareholder. The special committee recommended against bringing any claims against our current or former executive officers but made certain recommendations with respect to resolution of potential claims we had with respect to certain other third parties.
In July 2003, the lead underwriter on our Executive Blended Risk insurance coverage filed a lawsuit for a declaratory judgment against PNC and PNC ICLC in the United States District Court for the Western District of Pennsylvania. The complaint seeks a determination that the defendants breached the terms and conditions of the policy and, as a result, the policy does not provide coverage for any loss relating to or arising out of the Department of Justice investigation or the PAGIC transactions. Alternatively, the complaint seeks a determination that the policy does not provide coverage for the payments made pursuant to the Deferred Prosecution Agreement. The complaint also seeks attorneys’ fees and costs. In July 2004, the court granted our motion to stay the action until resolution of the claims against PNC in the pending consolidated class action described above.
In December 2004, we entered into a tentative settlement of the consolidated class action. In March 2005, the parties filed a stipulation of settlement of this lawsuit with the United States District Court for the Western District of Pennsylvania. This settlement also covered claims by the plaintiffs against AIG Financial Products and others related to the PAGIC transactions.
In July 2006, the district court approved this settlement. The defendant in that class action not participating in this settlement, our former independent auditors for the years ended 2001 and before, had objected to it and, on August 10, 2006, appealed the decision of the district court approving the settlement to the United States Court of Appeals for the Third Circuit.
On December 20, 2006, our former independent auditors for the years ended 2001 and before filed with the district court a tentative settlement agreement with the plaintiffs regarding the plaintiffs’ claims against it. This tentative settlement remains subject to court approval. If this tentative settlement agreement is finally approved by the court and after it becomes effective, this defendant will dismiss its appeal of the court’s approval of our settlement, which would then become final.
In December 2004, we also settled all claims between us, on the one hand, and AIG Financial Products and its affiliate, American International Surplus Lines Insurance Company (“AISLIC”), on the other hand, related to the PAGIC
transactions. AIG Financial Products was our counterparty in the PAGIC transactions, and AISLIC is one of the insurers under our Executive Blended Risk insurance coverage. Subsequently, we settled claims against two of the other insurers under our Executive Blended Risk insurance coverage, as described below. Each of the amounts in these settlements represents a portion of the insurer’s share of our overall claim against our insurers with respect to any amounts disbursed out of the Restitution Fund. We are preserving our claim against our insurers with which we have not settled.
The following are the key elements of these settlements that remain conditional at present, pending resolution of the appeal of the district court’s approval of the settlement of the consolidated class action:
| | • | | Payments into Settlement Fund. The insurers under our Executive Blended Risk insurance coverage have funded $30 million to be used for the benefit of the class. Third parties have funded additional amounts to be used for the same purpose. The plaintiffs have been in contact with Mr. Fryman, the administrator of the Restitution Fund, and intend to coordinate the administration and distribution of these settlement funds with the distribution of the Restitution Fund. Neither PNC nor any of our current or former officers, directors or employees will be required to contribute any funds to this settlement. |
| | • | | Assignment of Claims. We have assigned to the plaintiffs claims we may have against our former independent auditors for the years ended 2001 and before and all other unaffiliated third parties (other than AIG Financial Products and its predecessors, successors, parents, subsidiaries, affiliates and their respective directors, officers and employees (collectively, “AIG”)) relating to the subject matter of this lawsuit. |
| | • | | Insurance Claims. In March 2005, we settled our claim against one of our insurers under our Executive Blended Risk insurance coverage related to our contribution of $90 million to the Restitution Fund. Under this settlement, the insurer has paid us $11.25 million, but we are obligated to return this amount if the settlement of the consolidated class action referred to above does not receive court approval, does not become effective or becomes unenforceable. The amount of this settlement will not be recognized in our income statement until the potential obligation to return the funds has been eliminated. This settlement was in addition to settlements with AISLIC in December 2004 and with another of our insurers under the Executive Blended Risk policy in January 2005. |
| | • | | Other Claims. In connection with the settlement of the consolidated class action, the claims of IFS on |
14
| | behalf of our Incentive Savings Plan and its participants are being resolved and the class covered by the settlement has been expanded to include participants in the Plan. The Department of Labor is not, however, a party to this settlement and thus the settlement does not necessarily resolve its investigation. In addition, the derivative claims asserted by one of our putative shareholders and any other derivative demands that may be filed in connection with the PAGIC transactions are being resolved as a result of the settlement of the consolidated class action. |
| | • | | Releases. We are releasing the insurers providing our Executive Blended Risk insurance coverage from any further liability to PNC arising out of the events that gave rise to the consolidated class action, except for the claims against these insurers (other than those with whom we have settled) relating to the $90 million payment to the Restitution Fund. In addition, PNC and AIG are releasing each other with respect to all claims between us arising out of the PAGIC transactions. |
We will be responsible for the costs of administering the settlement and the Restitution Fund and may incur additional costs in the future in connection with the advancement of expenses and/or indemnification obligations related to the subject matter of this lawsuit. We do not expect such costs to be material.
In connection with industry-wide investigations of practices in the mutual fund industry including market timing, late day trading, employee trading in mutual funds and other matters, several of our subsidiaries have received requests for information and other inquiries from state and federal governmental and regulatory authorities. These subsidiaries are fully cooperating in all of these matters. In addition, as a result of the regulated nature of our business and that of a number of our subsidiaries, particularly in the banking and securities areas, we and our subsidiaries are the subject from time to time of investigations and other forms of regulatory inquiry, often as part of industry-wide regulatory reviews of specified activities. Our practice is to cooperate fully with these investigations and inquiries.
In addition to the proceedings or other matters described above, PNC and persons to whom we may have indemnification obligations, in the normal course of business, are subject to various other pending and threatened legal proceedings in which claims for monetary damages and other relief are asserted. We do not anticipate, at the present time, that the ultimate aggregate liability, if any, arising out of such other legal proceedings will have a material adverse effect on our financial position. However, we cannot now determine whether or not any claims asserted against us or others to whom we may have indemnification obligations, whether in
the proceedings or other matters specifically described above or otherwise, will have a material adverse effect on our results of operations in any future reporting period.
ITEM 4 –SUBMISSIONOFMATTERSTOAVOTEOFSECURITYHOLDERS
None during the fourth quarter of 2006.
EXECUTIVEOFFICERSOFTHEREGISTRANT Information regarding each of our executive officers as of February 16, 2007 is set forth below. Executive officers do not have a stated term of office. Each executive officer has held the position or positions indicated or another executive position with the same entity or one of its affiliates for the past five years unless otherwise indicated below.
| | | | | | |
| Name | | Age | | Position with PNC | | Year Employed(1) |
James E. Rohr | | 58 | | Chairman and Chief Executive Officer (2) | | 1972 |
| | | |
Joseph C. Guyaux | | 56 | | President | | 1972 |
| | | |
William S. Demchak | | 44 | | Vice Chairman | | 2002 |
| | | |
William C. Mutterperl | | 60 | | Vice Chairman | | 2002 |
| | | |
Timothy G. Shack | | 56 | | Executive Vice President and Chief Information Officer | | 1976 |
| | | |
Thomas K. Whitford | | 50 | | Executive Vice President and Chief Risk Officer | | 1983 |
| | | |
Michael J. Hannon | | 50 | | Senior Vice President and Chief Credit Policy Officer | | 1982 |
| | | |
Richard J. Johnson | | 50 | | Senior Vice President and Chief Financial Officer | | 2002 |
| | | |
Samuel R. Patterson | | 48 | | Senior Vice President and Controller | | 1986 |
| | | |
Helen P. Pudlin | | 57 | | Senior Vice President and General Counsel | | 1989 |
| | | |
John J. Wixted, Jr. | | 55 | | Senior Vice President and Chief Compliance and Regulatory Officer | | 2002 |
| (1) | Where applicable, refers to year employed by predecessor company. |
| (2) | Also serves as a director of PNC. |
William S. Demchak joined PNC as Vice Chairman and Chief Financial Officer in September 2002. In August 2005, he took on additional oversight responsibilities for the Corporation’s Corporate & Institutional Banking business and continued to oversee PNC’s asset and liability management and equity management activities while transitioning the responsibilities of Chief Financial Officer to Richard J. Johnson. From 1997 to 2002, he served as Global Head of Structured Finance and Credit Portfolio for J.P. Morgan Chase & Co.
15
William C. Mutterperl joined PNC as Vice Chairman in October 2002. From August 2002 to October 2002, he was a partner in the business law division of the international law firm of Brown Rudnick Berlack Israels LLP. From February 2002 to May 2002, he served as Executive Director of the Independent Oversight Board for Arthur Andersen LLP, headed by former Federal Reserve Chairman Paul Volcker.
Richard J. Johnson joined PNC in December 2002 and served as Senior Vice President and Director of Finance until his appointment as Chief Financial Officer of the Corporation effective in August 2005. From 1999 to 2002 he served as President and Chief Executive Officer for J.P. Morgan Services.
John J. Wixted, Jr. joined PNC as Senior Vice President and Chief Regulatory Officer in August 2002. From 1996 to 2002 he served as Senior Vice President for Banking Supervision and Regulation for the Federal Reserve Bank of Chicago.
DIRECTORSOFTHEREGISTRANT The name, age and principal occupation of each of our directors as of February 16, 2007, and the year he or she first became a director is set forth below:
| | • | | Paul W. Chellgren, 64, Operating Partner, SPG Partners, LLC, (1995), |
| | • | | Robert N. Clay, 60, President and Chief Executive Officer of Clay Holding Company (investments), (1987), |
| | • | | J. Gary Cooper, 70, Chairman of Commonwealth National Bank (community banking), (2002), |
| | • | | George A. Davidson, Jr., 68, Retired Chairman of Dominion Resources, Inc. (public utility holding company), (1988), |
| | • | | Kay Coles James, 57, President and Founder of The Gloucester Institute (non-profit), (2006), |
| | • | | Richard B. Kelson, 60, Operating Advisor, Pegasus Capital Advisors, L.P., (2002), |
| | • | | Bruce C. Lindsay, 65, Chairman and Managing Member of 2117 Associates, LLC (advisory company), (1995), |
| | • | | Anthony A. Massaro, 62, Retired Chairman and Chief Executive Officer of Lincoln Electric Holdings, Inc. (full-line manufacturer of welding and cutting products), (2002), |
| | • | | Jane G. Pepper, 61, President of Pennsylvania Horticultural Society (nonprofit membership organization), (1997), |
| | • | | James E. Rohr, 58, Chairman and Chief Executive Officer of PNC, (1990), |
| | • | | Lorene K. Steffes, 61, Independent Business Advisor, (2000), |
| | • | | Dennis F. Strigl, 60, President and Chief Operating Officer of Verizon Communications Inc. (telecommunications), (2001), |
| | • | | Stephen G. Thieke, 60, Retired Chairman, Risk Management Committee of JP Morgan Incorporated (financial and investment banking services), (2002), |
| | • | | Thomas J. Usher, 64, Retired Chairman of United States Steel Corporation (integrated steelmaker) and Chairman of Marathon Oil Corporation (oil and gas industry), (1992), |
| | • | | George H. Walls, Jr., 64, former Chief Deputy Auditor of the State of North Carolina, (2006), |
| | • | | Helge H. Wehmeier, 64, Retired President and Chief Executive Officer of Bayer Corporation (healthcare, crop protection, and chemicals), (1992). |
PART II
ITEM 5 –MARKETFORREGISTRANT’SCOMMONEQUITY,RELATEDSTOCKHOLDERMATTERSANDISSUERPURCHASESOFEQUITYSECURITIES
(a) Our common stock is listed on the New York Stock Exchange and is traded under the symbol “PNC.” At the close of business on February 16, 2007, there were 41,285 common shareholders of record.
Holders of PNC common stock are entitled to receive dividends when declared by the Board of Directors out of funds legally available for this purpose. Our Board of Directors may not pay or set apart dividends on the common stock until dividends for all past dividend periods on any series of outstanding preferred stock have been paid or declared and set apart for payment. The Board presently intends to continue the policy of paying quarterly cash dividends. However, the amount of any future dividends will depend on earnings, our financial condition and other factors, including contractual restrictions and applicable government regulations and policies (such as those relating to the ability of bank and non-bank subsidiaries to pay dividends to the parent company).
The Federal Reserve has the power to prohibit us from paying dividends without its approval. For further information concerning dividend restrictions and restrictions on loans or advances from bank subsidiaries to the parent company, you may review “Supervision and Regulation” in Item 1 of this Report, “Liquidity Risk Management” in the Risk
16
Management section and “Perpetual Trust Securities” in the Off-Balance Sheet Arrangements and VIEs section of Item 7 of this Report, and Note 4 Regulatory Matters in the Notes To Consolidated Financial Statements in Item 8 of this Report, which we include here by reference.
We include here by reference additional information relating to PNC common stock under the caption “Common Stock Prices/Dividends Declared” in the Statistical Information (Unaudited) section of Item 8 of this Report.
We include here by reference the information regarding our compensation plans under which PNC equity securities are authorized for issuance as of December 31, 2006 in the table (with introductory paragraph and notes) that appears under Item 12 of this Report.
Our registrar, stock transfer agent, and dividend disbursing agent is:
Computershare Investor Services, LLC
250 Royall Street
Canton, MA 02021
800-982-7652
(b) Not applicable.
(c) Details of our repurchases of PNC common stock during the fourth quarter of 2006 are included in the following table:
In thousands, except per share data
| | | | | | | | | | |
| | | 2006 period | | Total shares
purchased (a) | | Average
price
paid per
share | | Total shares
purchased as
part of
publicly
announced
programs (b) | | Maximum
number of
shares that
may yet be
purchased
under the
programs (b) |
| | | October 1 – October 31 | | 210 | | $70.95 | | 95 | | 15,732 |
| | | November 1 – November 30 | | 871 | | $69.50 | | 614 | | 15,118 |
| | | December 1 – December 31 | | 816 | | $73.09 | | 615 | | 14,503 |
| | | Total | | 1,897 | | $71.21 | | 1,324 | | |
| (a) | Includes PNC common stock purchased under the program referred to in note (b) to this table and PNC common stock purchased in connection with our various employee benefit plans. |
| (b) | Our current stock repurchase program, which was authorized as of February 16, 2005, allows us to purchase up to 20 million shares on the open market or in privately negotiated transactions. This program will remain in effect until fully utilized or until modified, superseded or terminated. |
Common Stock Performance Graph
This graph shows the cumulative total shareholder return (i.e., price change plus reinvestment of dividends) on our common stock during the five-year period ended December 31, 2006, as compared with: (1) a selected peer group of our competitors, called the “Peer Group;” (2) an overall stock
market index, the S&P 500 Index; and (3) a published industry index, the S&P 500 Banks. The yearly points marked on the horizontal axis of the graph correspond to December 31 of that year. The stock performance graph assumes that $100 was invested on January 1, 2002 for the five-year period and that any dividends were reinvested. The table below the graph shows the resultant compound annual growth rate for the performance period.
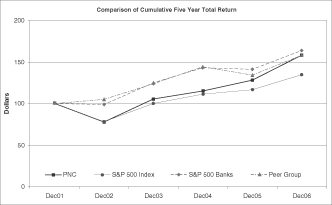
| | | | | | | | | | | | | | | | | |
| | | | | Base Period | | Assumes $100 investment at Close of
Market on December 31, 2001 Total Return = Price change plus reinvestment of dividends | | 5-Year
Compound
Growth
Rate | |
| | PNC | | $100 | | 77.60 | | 105.58 | | 115.04 | | 128.36 | | 158.53 | | 9.65 | % |
| | S&P 500 Index | | $100 | | 77.91 | | 100.24 | | 111.14 | | 116.59 | | 134.99 | | 6.18 | % |
| | S&P 500 Banks | | $100 | | 98.96 | | 125.34 | | 143.42 | | 141.37 | | 164.17 | | 10.42 | % |
| | | Peer Group | | $100 | | 105.16 | | 124.25 | | 144.53 | | 134.68 | | 158.53 | | 9.65 | % |
The Peer Group for the preceding chart and table consists of the following companies: The Bank of New York Company, Inc.; BB&T Corporation; Fifth Third Bancorp; KeyCorp; National City Corporation; The PNC Financial Services Group, Inc.; SunTrust Banks, Inc.; U.S. Bancorp.; Wachovia Corporation; Regions Financial; and Wells Fargo & Company. The Peer Group shown is the Peer Group approved by the Board’s Personnel and Compensation Committee in 2006. For 2007, the Peer Group will be revised to include Comerica Incorporated and exclude The Bank of New York Company, Inc.
Each yearly point for the Peer Group is determined by calculating the cumulative total shareholder return for each company in the Peer Group from December 31, 2001 to December 31 of that year (End of Month Dividend Reinvestment Assumed) and then using the median of these returns as the yearly plot point.
In accordance with the rules of the SEC, this section, captioned “Common Stock Performance Graph,” shall not be incorporated by reference into any of our future filings made under the Securities Exchange Act of 1934 or the Securities Act of 1933. The Common Stock Performance Graph, including its accompanying table and footnotes, is not deemed to be soliciting material or to be filed under the Exchange Act or the Securities Act.
17
ITEM 6 -SELECTEDFINANCIALDATA
| | | | | | | | | | | | | | | | |
| | | Year ended December 31 | |
Dollars in millions, except per share data | | 2006 (a) | | | | | | 2005 | | 2004 | | 2003 | | | 2002 | |
| | | | | | | |
SUMMARY OF OPERATIONS | | | | | | | | | | | | | | | | |
Interest income | | $4,612 | | | | | | $3,734 | | $2,752 | | $2,712 | | | $3,172 | |
Interest expense | | 2,367 | | | | | | 1,580 | | 783 | | 716 | | | 975 | |
Net interest income | | 2,245 | | | | | | 2,154 | | 1,969 | | 1,996 | | | 2,197 | |
Provision for credit losses | | 124 | | | | | | 21 | | 52 | | 177 | | | 309 | |
Noninterest income | | 6,327 | | | | | | 4,173 | | 3,572 | | 3,263 | | | 3,197 | |
Noninterest expense | | 4,443 | | | | | | 4,306 | | 3,712 | | 3,467 | | | 3,223 | |
Income before minority interests and income taxes | | 4,005 | | | | | | 2,000 | | 1,777 | | 1,615 | | | 1,862 | |
Minority interest in income of BlackRock | | 47 | | | | | | 71 | | 42 | | 47 | | | 41 | |
Income taxes | | 1,363 | | | | | | 604 | | 538 | | 539 | | | 621 | |
Income from continuing operations | | 2,595 | | | | | | 1,325 | | 1,197 | | 1,029 | | | 1,200 | |
(Loss) income from discontinued operations, net of tax | | | | | | | | | | | | | | | (16 | ) |
Income before cumulative effect of accounting change | | 2,595 | | | | | | 1,325 | | 1,197 | | 1,029 | | | 1,184 | |
Cumulative effect of accounting change, net of tax | | | | | | | | | | | | (28 | ) | | | |
Net income | | $2,595 | | | | | | $1,325 | | $1,197 | | $1,001 | | | $1,184 | |
| | | | | | | |
PER COMMON SHARE | | | | | | | | | | | | | | | | |
Basic earnings (loss) | | | | | | | | | | | | | | | | |
Continuing operations | | $8.89 | | | | | | $4.63 | | $4.25 | | $3.68 | | | $4.23 | |
Discontinued operations | | | | | | | | | | | | | | | (.05 | ) |
Before cumulative effect of accounting change | | 8.89 | | | | | | 4.63 | | 4.25 | | 3.68 | | | 4.18 | |
Cumulative effect of accounting change | | | | | | | | | | | | (.10 | ) | | | |
Net income | | $8.89 | | | | | | $4.63 | | $4.25 | | $3.58 | | | $4.18 | |
Diluted earnings (loss) | | | | | | | | | | | | | | | | |
Continuing operations | | $8.73 | | | | | | $4.55 | | $4.21 | | $3.65 | | | $4.20 | |
Discontinued operations | | | | | | | | | | | | | | | (.05 | ) |
Before cumulative effect of accounting change | | 8.73 | | | | | | 4.55 | | 4.21 | | 3.65 | | | 4.15 | |
Cumulative effect of accounting change | | | | | | | | | | | | (.10 | ) | | | |
Net income | | $8.73 | | | | | | $4.55 | | $4.21 | | $3.55 | | | $4.15 | |
Book value (At December 31) | | $36.80 | | | | | | $29.21 | | $26.41 | | $23.97 | | | $24.03 | |
Cash dividends declared | | $2.15 | | | | | | $2.00 | | $2.00 | | $1.94 | | | $1.92 | |
| (a) | See Note (a) on page 19. |
Certain prior-period amounts have been reclassified to conform with the current period presentation, which we believe is more meaningful to readers of our consolidated financial statements. See Note 2 Acquisitions in the Notes To Consolidated Financial Statements in Item 8 of this Report for information on significant recent and planned business acquisitions.
For information regarding certain business risks, see Item 1A Risk Factors and the Risk Management section of Item 7 of this Report. Also, see our Cautionary Statement Regarding Forward-Looking Information included in Item 7 of this Report for certain risks and uncertainties that could cause actual results to differ materially from those anticipated in forward-looking statements or from historical performance.
18
| | | | | | | | | | | | | | | | | |
| | | At or year ended December 31 | |
Dollars in millions, except as noted | | 2006 (a) | | | | | 2005 | | | 2004 | | | 2003 | | | 2002 | |
| | | | | | |
BALANCE SHEET HIGHLIGHTS | | | | | | | | | | | | | | | | | |
Assets | | $101,820 | | | | | $91,954 | | | $79,723 | | | $68,168 | | | $66,377 | |
Loans, net of unearned income | | 50,105 | | | | | 49,101 | | | 43,495 | | | 36,303 | | | 35,450 | |
Allowance for loan and lease losses | | 560 | | | | | 596 | | | 607 | | | 632 | | | 673 | |
Securities | | 23,191 | | | | | 20,710 | | | 16,761 | | | 15,690 | | | 13,763 | |
Loans held for sale | | 2,366 | | | | | 2,449 | | | 1,670 | | | 1,400 | | | 1,607 | |
Equity investments (b) | | 5,330 | | | | | 1,323 | | | 1,058 | | | 997 | | | 862 | |
Deposits | | 66,301 | | | | | 60,275 | | | 53,269 | | | 45,241 | | | 44,982 | |
Borrowed funds (c) | | 15,028 | | | | | 16,897 | | | 11,964 | | | 11,453 | | | 9,116 | |
Shareholders’ equity | | 10,788 | | | | | 8,563 | | | 7,473 | | | 6,645 | | | 6,859 | |
Common shareholders’ equity | | 10,781 | | | | | 8,555 | | | 7,465 | | | 6,636 | | | 6,849 | |
| | | | | | |
ASSETS ADMINISTERED (in billions) | | | | | | | | | | | | | | | | | |
Managed (d) | | $54 | | | | | $494 | | | $383 | | | $354 | | | $313 | |
Nondiscretionary | | 86 | | | | | 84 | | | 93 | | | 87 | | | 82 | |
| | | | | | |
FUNDASSETSSERVICED (in billions) | | | | | | | | | | | | | | | | | |
Accounting/administration net assets | | $837 | | | | | $835 | | | $721 | | | $654 | | | $510 | |
Custody assets | | 427 | | | | | 476 | | | 451 | | | 401 | | | 336 | |
| | | | | | | | | | | | | | | | | | |
SELECTED RATIOS | | | | | | | | | | | | | | | | | |
From Continuing Operations | | | | | | | | | | | | | | | | | |
Net interest margin | | 2.92 | % | | | | 3.00 | % | | 3.22 | % | | 3.64 | % | | 3.99 | % |
Noninterest income to total revenue | | 74 | | | | | 66 | | | 64 | | | 62 | | | 59 | |
Efficiency | | 52 | | | | | 68 | | | 67 | | | 66 | | | 60 | |
From Net Income | | | | | | | | | | | | | | | | | |
Return on | | | | | | | | | | | | | | | | | |
Average common shareholders’ equity | | 27.97 | | | | | 16.58 | | | 16.82 | | | 15.06 | | | 18.83 | |
Average assets | | 2.73 | | | | | 1.50 | | | 1.59 | | | 1.49 | | | 1.78 | |
| | | | | | |
Loans to deposits | | 76 | | | | | 81 | | | 82 | | | 80 | | | 79 | |
Dividend payout | | 24.4 | | | | | 43.4 | | | 47.2 | | | 54.5 | | | 46.1 | |
Leverage (e) | | 9.3 | | | | | 7.2 | | | 7.6 | | | 8.2 | | | 8.1 | |
Common shareholders’ equity to total assets | | 10.6 | | | | | 9.3 | | | 9.4 | | | 9.7 | | | 10.3 | |
Average common shareholders’ equity to average assets | | 9.8 | | | | | 9.0 | | | 9.4 | | | 9.9 | | | 9.4 | |
| (a) | Noninterest income for 2006 included the pretax impact of the following: gain on the BlackRock/Merrill Lynch Investment Managers (“MLIM”) transaction of $2.1 billion; securities portfolio rebalancing loss of $196 million; and mortgage loan portfolio repositioning loss of $48 million. Noninterest expense for 2006 included the pretax impact of BlackRock/MLIM transaction integration costs of $91 million. An additional $10 million of integration costs, recognized in the fourth quarter of 2006, were included in noninterest income as a negative component of the asset management line. The after-tax impact of these items was as follows: BlackRock/MLIM transaction gain - $1.3 billion; securities portfolio rebalancing loss - $127 million; mortgage loan portfolio repositioning loss - $31 million; and BlackRock/MLIM transaction integration costs - $47 million. |
| (b) | The balance at December 31, 2006 includes our investment in BlackRock. |
| (c) | Includes long-term borrowings of $6.6 billion, $6.8 billion, $5.7 billion, $5.8 billion and $6.0 billion for 2006, 2005, 2004, 2003 and 2002, respectively. |
| (d) | Assets under management at December 31, 2006 do not include BlackRock’s assets under management as we deconsolidated BlackRock effective September 29, 2006. |
| (e) | The leverage ratio represents tier 1 capital divided by adjusted average total assets as defined by regulatory capital requirements for bank holding companies. |
19
ITEM 7 -MANAGEMENT’SDISCUSSIONANDANALYSISOFFINANCIALCONDITIONANDRESULTSOFOPERATIONS
EXECUTIVE SUMMARY
THE PNC FINANCIAL SERVICES GROUP, INC.
PNC is one of the largest diversified financial services companies in the United States based on assets, with businesses engaged in retail banking, corporate and institutional banking, asset management and global fund processing services. We provide many of our products and services nationally and others in our primary geographic markets located in Pennsylvania; New Jersey; the greater Washington, DC area, including Maryland and Virginia; Ohio; Kentucky; and Delaware. We also provide certain global fund processing services internationally.
KEY STRATEGIC GOALS
Our strategy to enhance shareholder value centers on achieving revenue growth in our various businesses underpinned by prudent management of risk, capital and expenses. In each of our business segments, the primary drivers of growth are the acquisition, expansion and retention of customer relationships. We strive to achieve such growth in our customer base by providing convenient banking options, leading technological systems and a broad range of fee-based products and services. We also intend to grow through appropriate and targeted acquisitions and, in certain businesses, by expanding into new geographical markets.
In recent years, we have managed our interest rate risk to achieve a moderate risk profile with limited exposure to earnings volatility resulting from interest rate fluctuations and shape of the yield curve. Our actions have created a balance sheet characterized by strong asset quality and flexibility to adjust, where appropriate, to changing interest rates and market conditions.
BLACKROCK/MLIM TRANSACTION
On September 29, 2006, Merrill Lynch contributed its investment management business to BlackRock in exchange for 65 million shares of newly issued BlackRock common and preferred stock. BlackRock accounted for the MLIM transaction under the purchase method of accounting.
Immediately following the closing, PNC continued to own approximately 44 million shares of BlackRock common stock, representing an ownership interest of approximately 34% of the combined company after the closing (as compared with 69% immediately prior to the closing). Although PNC’s share ownership percentage declined, PNC’s investment in BlackRock increased due to the increase in total equity recorded by BlackRock as a result of the MLIM transaction.
Further information regarding the BlackRock/MLIM transaction is included in the BlackRock discussion within the Business Segments Review section of this Item 7.
MERCANTILE BANKSHARES ACQUISITION
On October 8, 2006, we entered into a definitive agreement with Mercantile Bankshares Corporation (“Mercantile”) for PNC to acquire Mercantile. Mercantile shareholders will be entitled to .4184 shares of PNC common stock and $16.45 in cash for each share of Mercantile, or in the aggregate approximately 53 million shares of PNC common stock and $2.1 billion in cash. Based on PNC’s recent stock prices, the transaction is valued at approximately $6.0 billion in the aggregate.
Mercantile is a bank holding company with approximately $18 billion in assets that provides banking and investment and wealth management services through 240 offices in Maryland, Virginia, the District of Columbia, Delaware and southeastern Pennsylvania. This transaction will enable us to significantly expand our presence in the mid-Atlantic region, particularly within the attractive Baltimore and Washington, DC markets.
Our Mercantile integration strategy development and planning is progressing on track and has achieved several important objectives, including identifying leadership personnel for certain key positions within the Mercantile service territory. Our priority for the integration is the retention of customers and customer-facing staff. The transaction is subject to customary closing conditions, including regulatory approvals, and is expected to close in March 2007.
THE ONE PNC INITIATIVE
The One PNC initiative began in January 2005 and is an ongoing, company-wide initiative with goals of moving closer to the customer, improving our overall efficiency and targeting resources to more value-added activities. PNC expects to realize $400 million of total annual pretax earnings benefit by mid-2007 from this initiative.
PNC plans to achieve approximately $300 million of cost savings through a combination of workforce reduction and other efficiencies. Approximately 3,000 positions had been eliminated through December 31, 2006. We recognized employee severance and other implementation costs of $11 million in 2006 and $54 million in 2005. Estimated remaining charges to be incurred in early 2007 are not significant. In addition, PNC intends to achieve at least $100 million in net revenue growth through the implementation of various pricing and business growth enhancements driven by the One PNC initiative. The initiative is progressing according to plan.
We realized a net pretax financial benefit from the One PNC program of approximately $265 million in 2006. We achieved an annualized run rate benefit of $320 million in the fourth quarter of 2006.
KEY FACTORS AFFECTING FINANCIAL PERFORMANCE
Our financial performance is substantially affected by several external factors outside of our control, including:
| | • | | General economic conditions, |
20
| | • | | Loan demand and utilization of credit commitments, |
| | • | | Movement of customer deposits from lower to higher rate accounts or to off-balance sheet accounts, |
| | • | | The level of interest rates, and the shape of the interest rate yield curve, |
| | • | | The performance of the capital markets, and |
| | • | | Customer demand for other products and services. |
In addition to changes in general economic conditions, including the direction, timing and magnitude of movement in interest rates and the performance of the capital markets, our success in 2007 will depend, among other things, upon:
| | • | | Further success in the acquisition, growth and retention of customers, |
| | • | | The successful consummation and integration of the planned Mercantile acquisition, |
| | • | | A sustained focus on expense management and efficiency, |
| | • | | Maintaining strong overall asset quality, and |
| | • | | Prudent risk and capital management. |
SUMMARY FINANCIAL RESULTS
| | | | | | |
| | | Year ended December 31 | |
In billions, except for per share data | | 2006 | | | 2005 | |
Net income | | $2.595 | | | $1.325 | |
Diluted earnings per share | | $8.73 | | | $4.55 | |
Return on | | | | | | |
Average common
shareholders’ equity | | 27.97 | % | | 16.58 | % |
Average assets | | 2.73 | % | | 1.50 | % |
Net income for 2006 included the after-tax impact of the following items:
| | • | | The third quarter gain on the BlackRock/MLIM transaction of $1.3 billion, or $4.36 per diluted share; |
| | • | | The third quarter securities portfolio rebalancing loss of $127 million, or $.43 per diluted share; |
| | • | | BlackRock/MLIM transaction integration costs of $47 million, or $.16 per diluted share, and |
| | • | | The third quarter mortgage loan portfolio repositioning loss of $31 million, or $.10 per diluted share. |
The aggregate impact of these items increased 2006 net income by $1.1 billion, or $3.67 per diluted common share.
We refer you to the Consolidated Income Statement Review portion of the 2005 Versus 2004 section of this Item 7 for significant items impacting 2005 results.
Our performance in 2006 included the following accomplishments:
| | • | | Our total assets at December 31, 2006 exceeded $100 billion for the first time, as further detailed in |
| | the Consolidated Balance Sheet Review section of this Item 7. |
| | • | | Average total loans of $49.6 billion for 2006 increased $2.2 billion, or 5%, compared with 2005. Amounts for 2005 included $1.7 billion of average loans related to the Market Street Funding LLC (“Market Street”) commercial paper conduit that we deconsolidated in October 2005, while total 2006 average loans were impacted by the $.5 billion decline in average residential mortgage loans related to PNC’s third quarter 2006 balance sheet repositioning. Apart from the impact of these actions, the increase was largely due to growth in commercial, residential mortgage and commercial real estate loans. |
| | • | | Average total deposits increased $5.7 billion, or 10%, compared with the prior year, primarily the result of an increase in interest-bearing deposits as customers continued to shift deposits to higher-return accounts and other products. |
| | • | | Asset quality remained very strong. Nonperforming loans totaled $147 million at December 31, 2006, a decline of $43 million, or 23%, compared with the balance at December 31, 2005. |
BALANCE SHEET HIGHLIGHTS
Total average assets were $95.0 billion for 2006 compared with $88.5 billion for 2005. Average interest-earning assets were $77.7 billion for 2006 compared with $73.0 billion in 2005, an increase of $4.7 billion or 6%. Increases of $2.2 billion in average loans and $2.0 billion in average securities were the primary factors for the increase in average interest-earning assets.
Average total loans were $49.6 billion in 2006 and $47.4 billion for 2005. This increase was driven by continued improvements in market loan demand and targeted sales efforts across our banking businesses, as well as the full year impact of our expansion into the greater Washington, D.C. area, which began in May 2005. The increase in average total loans reflected growth in commercial loans of $1.2 billion, residential mortgages of $.8 billion and commercial real estate loans of $.6 billion, partially offset by modest declines in consumer and lease financing loans. In addition, average total loans for 2005 included $1.7 billion related to Market Street for the period prior to our deconsolidation of that entity in October 2005. Loans represented 64% of average interest-earning assets for 2006 and 65% for 2005.
Average securities totaled $21.3 billion in 2006 and $19.3 billion for 2005. The overall higher average securities balances reflected our desire to continue investing through the interest rate cycle and the full year impact of our May 2005 Riggs acquisition. The $2.0 billion increase over 2005 reflected an increase of $4.0 billion in mortgage-backed, asset-backed and other debt securities, partially offset by a $2.0 billion decline in US Treasury and government agencies
21
securities. Our third quarter 2006 securities portfolio rebalancing actions are further described in the Consolidated Balance Sheet Review section of this Item 7. Securities comprised 27% of average interest-earning assets for 2006 and 26% for 2005.
Average total deposits were $63.3 billion for 2006 compared with $57.6 billion for 2005. The increase in average total deposits was driven primarily by the impact of higher certificates of deposit, money market account and noninterest-bearing deposit balances, and by higher Eurodollar deposits. Growth in deposits from commercial mortgage loan servicing activities also contributed to the increase compared with 2005. Similar to its impact on average loans and securities described above, our expansion into the greater Washington, DC area also contributed to the increase in average total deposits. Average total deposits represented 67% of total sources of funds for 2006 and 65% for 2005. Average transaction deposits were $42.3 billion for 2006 and $39.5 billion for 2005.
Average borrowed funds were $15.0 billion for 2006 and $16.2 billion for 2005. Commercial paper declined $2.1 billion in the comparison as 2005 included $1.8 billion of commercial paper related to Market Street, which was deconsolidated in October 2005. Apart from the decrease in commercial paper, average borrowed funds increased $.9 billion in 2006 compared with the prior year primarily due to net increases in fed funds purchased.
Shareholders’ equity totaled $10.8 billion at December 31, 2006, compared with $8.6 billion at December 31, 2005. The increase of $2.2 billion in total shareholders’ equity compared with December 31, 2005 reflected the impact of 2006 net income on retained earnings and an increase in capital surplus in connection with the BlackRock/MLIM transaction.
LINEOF BUSINESS HIGHLIGHTS
We refer you to Item 1 of this Report for an overview of our business segments in Review of Lines of Business and to the “Results of Businesses – Summary” table in the Business Segments Review section of this Item 7. Total business segment earnings were $1.5 billion for 2006 and $1.4 billion for 2005.
See Note 21 Segment Reporting in the Notes To Consolidated Financial Statements in Item 8 of this Report for a reconciliation of total business segment earnings to total PNC consolidated earnings as reported on a GAAP basis.
Retail Banking
Retail Banking’s 2006 earnings increased $83 million, or 12%, to $765 million compared with 2005. Revenue increased 9% and noninterest expense increased 6% compared with the prior year, creating positive operating leverage. The increase in earnings was driven by improved fee income from customers, higher taxable-equivalent net interest income fueled by continued customer and balance sheet growth, and a sustained focus on expense management. Positive operating leverage allows for annual earnings growth as well as the ability to reinvest in the business for future growth.
Corporate & Institutional Banking
Earnings from Corporate & Institutional Banking for 2006 totaled $463 million compared with $480 million for 2005. This decline was primarily attributable to the year-over- year $72 million change in the provision for credit losses principally as a result of a $53 million loan recovery recognized in the second quarter of 2005. The provision for credit losses was $42 million in 2006. In addition, the comparison was impacted by a $137 million increase in total revenue while noninterest expenses grew by $91 million in 2006 compared with 2005.
BlackRock
Our BlackRock business segment earned $187 million for 2006 and $152 million for 2005. These amounts represent BlackRock’s contribution to PNC’s earnings, including the impact of minority interest expense, as applicable, and additional income taxes recognized by PNC related to BlackRock’s earnings. For our BlackRock business segment reporting presentation in this Item 7, we have reflected our portion of the 2006 BlackRock/MLIM integration costs in “Other” rather than in earnings from our BlackRock investment. BlackRock business segment earnings for 2006 reflected higher investment advisory and administration fees due to an increase in assets under management and increased performance fees. These factors more than offset the increase in expense due to increased compensation and benefits and higher general and administration expense, and a one-time expense of $34 million incurred during the first quarter of 2006 related to the January 2005 acquisition of State Street Research and Management.
22
For 2004, 2005 and the nine months ended September 30, 2006, our Consolidated Income Statement included our former 69%-71% ownership interest in BlackRock’s net income through the BlackRock/MLIM transaction closing date. However, beginning September 30, 2006, our Consolidated Balance Sheet no longer reflected the consolidation of BlackRock’s balance sheet but recognized our 34% ownership interest in BlackRock as an investment accounted for under the equity method. Our share of BlackRock’s net income is now reported within asset management noninterest income in our Consolidated Income Statement.
PFPC
PFPC’s earnings of $124 million in 2006 increased $20 million, or 19%, compared with $104 million in 2005. Earnings for 2006 included the impact of a $14 million reversal of deferred taxes related to earnings from a foreign subsidiary following management’s determination that the earnings would be indefinitely reinvested outside of the United States. Earnings for 2005 included the after-tax impact of a one-time termination fee of $6 million and a prepayment penalty of $5 million, along with $4 million of various tax benefits. Higher earnings in 2006 reflected servicing revenue contributions from several growth areas of the business and the successful implementation of expense control initiatives.
Other
“Other” earnings for 2006 totaled $1.1 billion, while “Other” 2005 was a net loss of $93 million. “Other” earnings for 2006 included the $1.3 billion after-tax gain on the BlackRock/MLIM transaction recorded in the third quarter of 2006, partially offset by the impact of charges related to the following, on an after-tax basis:
| | • | | Third quarter 2006 balance sheet repositioning activities amounting to $158 million, and |
| | • | | BlackRock/MLIM integration costs of $47 million. |
“Other” for 2005 included the impact of implementation costs related to the One PNC initiative totaling $35 million after-tax, net securities losses of $27 million after-tax, and Riggs acquisition integration costs totaling $20 million after-tax. These factors were partially offset by the first quarter 2005 benefit recognized from a $45 million deferred tax liability reversal related to the internal transfer of our investment in BlackRock as described above under Summary Financial Results.
CONSOLIDATED INCOME
STATEMENT REVIEW
NET INTEREST INCOME - OVERVIEW
Changes in net interest income and margin result from the interaction of the volume and composition of interest-earning assets and related yields, interest-bearing liabilities and related rates paid, and noninterest-bearing sources.
See Statistical Information – Analysis of Year-To-Year Changes In Net Interest Income and Average Consolidated Balance Sheet and Net Interest Analysis in Item 8 of this Report for additional information.
NET INTEREST INCOME - GAAP RECONCILIATION
The interest income earned on certain assets is completely or partially exempt from federal income tax. As such, these tax-exempt instruments typically yield lower returns than a taxable investment. To provide more meaningful comparisons of yields and margins for all interest-earning assets, we also provide net interest income on a taxable-equivalent basis by increasing the interest income earned on tax-exempt assets to make it fully equivalent to interest income earned on other taxable investments. This adjustment is not permitted under GAAP.
A reconciliation of net interest income as reported in the Consolidated Income Statement (GAAP basis) to net interest income on a taxable-equivalent basis follows (in millions):
| | | | | | |
| | For the year ended December 31, |
| | | 2006 | | 2005 | | 2004 |
Net interest income, GAAP basis | | $2,245 | | $2,154 | | $1,969 |
Taxable-equivalent adjustment | | 25 | | 33 | | 20 |
Net interest income, taxable- equivalent basis | | $2,270 | | $2,187 | | $1,989 |
Taxable-equivalent net interest income increased $83 million, or 4%, in 2006 compared with 2005. The increase reflected the impact of the 6% increase in average interest-earning assets during 2006 partially offset by a decline in the net interest margin as further described below.
NET INTEREST MARGIN
The net interest margin was 2.92% in 2006 compared with 3.00% for 2005, an 8 basis point decline. The following factors contributed to the decline in net interest margin in 2006:
| | • | | An increase in the average rate paid on interest-bearing deposits of 104 basis points for 2006 compared with the 2005 period. The average rate paid on money market accounts, the largest single component of interest-bearing deposits, increased 111 basis points. |
| | • | | An increase in the average rate paid on borrowed funds of 147 basis points for 2006 compared with 2005. |
23
| | • | | By comparison, the yield on interest-earning assets increased only 81 basis points. Loans, the single largest component, increased 83 basis points. |
| | • | | These factors were partially offset by the favorable impact on net interest margin in 2006 of an increase of 20 basis points related to noninterest-bearing sources of funding. |
The average federal funds rate for 2006 was 4.97% compared with 3.21% for 2005.
We believe that net interest margins for our industry will continue to be challenged if the yield curve remains flat or inverted, as competition for loans and deposits remains intense, as customers continue to migrate from lower cost to higher cost deposits or other products and as the benefit of adding investment securities is diminished.
From PNC’s perspective, we believe that net interest income will increase and net interest margin will remain relatively stable in 2007 compared with 2006. However, due to seasonal factors in the first quarter of the year, we expect that our net interest margin will be pressured and that our net interest income will be relatively flat for the first quarter of 2007. These projections are based on assumptions underlying our most likely net interest income scenario, which may change over time.
PROVISION FOR CREDIT LOSSES
The provision for credit losses was $124 million for 2006 compared with $21 million for 2005. The provision for credit losses for 2005 included the benefit of a $53 million loan recovery in the second quarter of that year resulting from a litigation settlement. In addition to this item, the increase in the provision for credit losses in 2006 reflected the following factors:
| | • | | The impact of overall loan growth, as average total loans increased $2.2 billion in 2006 compared with the prior year; |
| | • | | The effect of a single large overdraft situation that occurred during the second quarter of 2006, and |
| | • | | Growth in unfunded commitments. |
We do not expect to sustain asset quality at its current level. However, based on the assets we currently hold and current business trends and activities, we believe that overall asset quality will remain strong by historical standards for at least the near term. To the extent actual outcomes differ from our estimates, additional provision for credit losses may be required that would reduce future earnings.
See the Credit Risk Management portion of the Risk Management section of this Item 7 for additional information regarding factors impacting the provision for credit losses.
NONINTEREST INCOME
Summary
Noninterest income was $6.327 billion for 2006 and $4.173 billion for 2005. Noninterest income for 2006 included the impact of the gain on the BlackRock/MLIM transaction, which totaled $2.078 billion, partially offset by the effects of our third quarter 2006 balance sheet repositioning activities that resulted in charges totaling $244 million.
Additional analysis
Asset management fees amounted to $1.420 billion for 2006 and $1.443 billion for 2005, a decline of $23 million. Our equity income from BlackRock was included in asset management fees beginning with the fourth quarter of 2006. Asset management fees for 2005 and the first nine months of 2006 reflected the impact of BlackRock’s revenue on a consolidated basis.
Assets managed at December 31, 2006 totaled $54 billion compared with $494 billion at December 31, 2005 and reflected the deconsolidation of BlackRock effective September 29, 2006. We refer you to the Retail Banking section of the Business Segments Review section of this Item 7 for further discussion of Retail Banking’s assets under management.
Fund servicing fees increased $23 million in 2006, to $893 million, compared with $870 million in the prior year. Included in these amounts were distribution/out-of-pocket revenue amounts at PFPC totaling $170 million in 2006 and $147 million in 2005, the impacts of which were offset by expenses in the same amounts in each year.
PFPC provided fund accounting/administration services for $837 billion of net fund assets and provided custody services for $427 billion of fund assets at December 31, 2006, compared with $835 billion and $476 billion, respectively, at December 31, 2005. The decrease in custody fund assets at December 31, 2006 compared with December 31, 2005 resulted primarily from the deconversion of a major client during the first quarter of 2006, which was partially offset by new business, asset inflows from existing customers, and equity market appreciation.
Service charges on deposits increased $40 million, to $313 million, for 2006 compared with 2005. Customer growth, expansion of the branch network, including our expansion into the greater Washington, DC area that began in May 2005, and various pricing actions resulting from the One PNC initiative all contributed to the increase in 2006.
Brokerage fees increased $21 million, to $246 million, for 2006 compared with the prior year. The increase was primarily due to higher annuity income and mutual fund-related revenues, including favorable production from the fee-based fund advisory business.
24
Consumer services fees increased $72 million, to $365 million, in 2006 compared with 2005. Higher fees reflected the impact of consolidating our merchant services activities in the fourth quarter of 2005 as a result of our increased ownership interest in the merchant services business. The increase was also due to higher debit card revenues resulting from higher transaction volumes, our expansion into the greater Washington, DC area, and pricing actions related to the One PNC initiative. These factors were partially offset by lower ATM surcharge revenue in 2006 resulting from changing customer behavior and a strategic decision to reduce the out-of-footprint ATM network.
Corporate services revenue was $626 million for 2006, compared with $485 million in 2005. The increase in corporate services revenue compared with the prior year was primarily due to the full year benefit in 2006 of our October 2005 acquisition of Harris Williams.
Equity management (private equity) net gains on portfolio investments totaled $107 million in 2006 and $96 million for 2005. Based on the nature of private equity activities, net gains or losses may be volatile from period to period.
Net securities losses totaled $207 million in 2006 and $41 million in 2005. Our discussion under the Consolidated Balance Sheet Review section of this Item 7 provides additional information regarding actions we took during the third quarter of 2006 that resulted in the sale of approximately $6 billion of securities available for sale at an aggregate pretax loss of $196 million during that quarter.
Noninterest revenue from trading activities, which is primarily customer-related, totaled $183 million in 2006 compared with $157 million for 2005. We provide additional information on our trading activities under Market Risk Management – Trading Risk in the Risk Management section of this Item 7.
Net gains related to our BlackRock investment were $2.066 billion for 2006, comprised of the $2.078 billion gain on the BlackRock/MLIM transaction partially offset by a fourth quarter mark-to-market adjustment of $12 million on our BlackRock long-term incentive plan (“LTIP”) obligation. See the BlackRock portion of the Business Segments Review section of Item 7 of this Report for further information.
Other noninterest income decreased $57 million, to $315 million, in 2006 compared with 2005. Other noninterest income for 2006 included the impact of the following:
| | • | | A $48 million pretax loss incurred in the third quarter of 2006 in connection with the rebalancing of our residential mortgage portfolio. Further information on these actions is included in the Loans Held For Sale portion of the Consolidated Balance Sheet Review section of this Item 7; |
| | • | | A $20 million charge for an accounting adjustment related to our trust preferred securities hedges recognized during the third quarter of 2006; and |
| | • | | Lower other equity management income. |
These factors were partially offset by higher gains on sales of education loans held for sale in 2006 compared with the prior year.
Other noninterest income typically fluctuates from period to period depending on the nature and magnitude of transactions completed.
PRODUCT REVENUE
In addition to credit products to commercial customers, Corporate & Institutional Banking offers treasury management and capital markets-related products and services, commercial loan servicing, and equipment leasing products that are marketed by several businesses across PNC.
Treasury management revenue, which includes fees as well as net interest income from customer deposit balances, totaled $424 million for 2006 and $410 million for 2005. The higher revenue in 2006 reflected continued expansion and client utilization of commercial payment card services, strong revenue growth in various electronic payment and information services, and a steady increase in business-to-business processing volumes, which more than offset the reduced net interest margin due to rising rates.
Revenue from capital markets-related products and services, including mergers and acquisitions advisory activities, was $283 million for 2006 compared with $175 million for 2005. The acquisition of Harris Williams in October 2005 together with improved customer and proprietary trading activities drove the increase in capital markets revenue in the comparison.
Midland Loan Services offers servicing, real estate advisory and technology solutions for the commercial real estate finance industry. Midland’s revenue, which includes servicing fees and net interest income from servicing portfolio deposit balances, totaled $184 million for 2006 and $144 million for 2005. Revenue growth was primarily driven by growth in the commercial mortgage servicing portfolio and related services.
As a component of our advisory services to clients, we provide a select set of insurance products to fulfill specific customer financial needs. Primary insurance offerings include:
| | • | | Commercial lines coverage. |
Client segments served by these insurance solutions include those in Retail Banking and Corporate & Institutional
25
Banking. Insurance products are sold by licensed PNC insurance agents and through licensed third-party arrangements. Revenue from these products was $71 million in 2006 and $61 million in 2005. The increase resulted from higher annuity fee revenue.
PNC, through subsidiary companies Alpine Indemnity Limited and PNC Insurance Corp., participates as a direct writer for its general liability, automobile liability, workers’ compensation, property and terrorism insurance programs.
In the normal course of business, Alpine Indemnity Limited and PNC Insurance Corp. maintain insurance reserves for reported claims and for claims incurred but not reported based on actuarial assessments. We believe these reserves were adequate at December 31, 2006.
NONINTEREST EXPENSE
Total noninterest expense was $4.443 billion for 2006, an increase of $137 million compared with $4.306 billion for 2005.
Item 6, Selected Financial Data, of this Report includes our efficiency ratios for 2006 and 2005 and notes regarding certain significant items impacting noninterest income and expense in 2006.
Noninterest expense for 2006 included the following:
| | • | | Our share of integration costs related to the BlackRock/MLIM transaction totaling $91 million, which were almost entirely offset by a decrease in other BlackRock expenses of $87 million due to our deconsolidation of BlackRock effective September 29, 2006, |
| | • | | An increase of $71 million of expenses related to Harris Williams, which we acquired in October 2005, |
| | • | | An increase of $60 million related to the consolidation of our merchant services activities in the fourth quarter of 2005, and |
| | • | | An increase of $23 million in PFPC’s distribution/out-of-pocket expenses, the increase of which was entirely offset in noninterest income and which had no impact on our earnings. |
Apart from the impact of these items, noninterest expense for 2006 decreased $21 million compared with 2005 as the benefit of the One PNC initiative more than offset the impact of our expansion into the greater Washington, DC area and other investments in the business.
We will have a continued emphasis on expense management in 2007 as we continue our focus on sustaining positive operating leverage.
EFFECTIVE TAX RATE
Our effective tax rate was 34% for 2006 and 30.2% for 2005. The higher effective tax rate in 2006 compared with 2005 reflected the impact of the following:
| | • | | An increase in income taxes related to the third quarter 2006 gain on the BlackRock/MLIM transaction, |
| | • | | A $57 million cumulative adjustment to increase deferred income taxes made in the third quarter of 2006 in connection with the BlackRock/MLIM transaction, and |
| | • | | The benefit in 2005 of a reversal of deferred tax liabilities in connection with the transfer of our ownership in BlackRock to our intermediate bank holding company. This transaction reduced our first quarter 2005 tax provision by $45 million, or $.16 per diluted share. See Note 2 Acquisitions in the Notes To Consolidated Financial Statements in Item 8 of this Report for additional information. |
Going forward, we believe that a more normal effective tax rate for PNC would be approximately 32%.
CONSOLIDATED BALANCE SHEET REVIEW
SUMMARIZED BALANCE SHEET DATA
| | | | |
| December 31 - in millions | | 2006 | | 2005 |
Assets | | | | |
Loans, net of unearned income | | $50,105 | | $49,101 |
Securities available for sale | | 23,191 | | 20,710 |
Loans held for sale | | 2,366 | | 2,449 |
Equity investments | | 5,330 | | 1,323 |
Other | | 20,828 | | 18,371 |
Total assets | | $101,820 | | $91,954 |
Liabilities | | | | |
Funding sources | | $81,329 | | $77,172 |
Other | | 8,818 | | 5,629 |
Total liabilities | | 90,147 | | 82,801 |
Minority and noncontrolling interests in consolidated entities | | 885 | | 590 |
Total shareholders’ equity | | 10,788 | | 8,563 |
Total liabilities, minority and noncontrolling interests, and shareholders’ equity | | $101,820 | | $91,954 |
The summarized balance sheet data above is based upon our Consolidated Balance Sheet in Item 8 of this Report.
Various seasonal and other factors impact our period-end balances whereas average balances (discussed under the Balance Sheet Highlights section of this Item 7 and included in the Statistical Information section of Item 8 of this Report) are normally more indicative of underlying business trends.
26
The increase in Equity investments above reflects BlackRock as an equity investment at December 31, 2006. BlackRock’s assets and liabilities were consolidated on our Consolidated Balance Sheet at December 31, 2005.
The impact of the deconsolidation of BlackRock’s balance sheet amounts and recognition of our ownership interest in BlackRock as an equity investment upon the closing of the BlackRock/MLIM transaction is discussed in the BlackRock portion of the Business Segments Review section of this Item 7.
An analysis of changes in selected other balance sheet categories follows.
LOANS, NETOF UNEARNED INCOME
Loans increased $1.0 billion, or 2%, as of December 31, 2006 compared with December 31, 2005. Increases in total commercial lending and consumer loans, driven by targeted sales efforts across our banking businesses, more than offset the decline in residential mortgage loans that resulted primarily from our third quarter 2006 mortgage loan repositioning.
Details Of Loans
| | | | | | |
| December 31 - in millions | | 2006 | | | 2005 | |
Commercial | | | | | | |
Retail/wholesale | | $5,301 | | | $4,854 | |
Manufacturing | | 4,189 | | | 4,045 | |
Other service providers | | 2,186 | | | 1,986 | |
Real estate related | | 2,825 | | | 2,577 | |
Financial services | | 1,324 | | | 1,438 | |
Health care | | 707 | | | 616 | |
Other | | 4,052 | | | 3,809 | |
Total commercial | | 20,584 | | | 19,325 | |
Commercial real estate | | | | | | |
Real estate projects | | 2,716 | | | 2,244 | |
Mortgage | | 816 | | | 918 | |
Total commercial real estate | | 3,532 | | | 3,162 | |
Equipment lease financing | | 3,556 | | | 3,628 | |
Total commercial lending | | 27,672 | | | 26,115 | |
Consumer | | | | | | |
Home equity | | 13,749 | | | 13,790 | |
Automobile | | 1,135 | | | 938 | |
Other | | 1,631 | | | 1,445 | |
Total consumer | | 16,515 | | | 16,173 | |
Residential mortgage | | 6,337 | | | 7,307 | |
Other | | 376 | | | 341 | |
Unearned income | | (795 | ) | | (835 | ) |
Total, net of unearned income | | $50,105 | | | $49,101 | |
As the table above indicates, the loans that we hold continued to be diversified among numerous industries and types of businesses. The loans that we hold are also concentrated in, and diversified across, the geographic areas where we do business. See Note 7 Loans, Commitments To Extend Credit and Concentrations of Credit Risk in the Notes To
Consolidated Financial Statements in Item 8 of this Report for additional information.
Commercial loans are the largest category and are the most sensitive to changes in assumptions and judgments underlying the determination of the allowance for loan and lease losses. We have allocated approximately $443 million, or 79%, of the total allowance for loan and lease losses at December 31, 2006 to the commercial loan category. This allocation also considers other relevant factors such as:
| | • | | Actual versus estimated losses, |
| | • | | Regional and national economic conditions, |
| | • | | Business segment and portfolio concentrations, |
| | • | | Industry competition and consolidation, |
| | • | | The impact of government regulations, and |
| | • | | Risk of potential estimation or judgmental errors, including the accuracy of risk ratings. |
Commercial Lending Exposure(a)
| | | | |
| December 31 - in millions | | 2006 | | 2005 |
Investment grade or equivalent | | 49% | | 46% |
Non-investment grade | | | | |
$50 million or greater | | 2% | | 2% |
All other non-investment grade | | 49% | | 52% |
Total | | 100% | | 100% |
| (a) | Includes total commercial, commercial real estate, and equipment lease financing categories. |
Net Unfunded Credit Commitments
| | | | |
| December 31 - in millions | | 2006 | | 2005 |
Commercial | | $31,009 | | $27,774 |
Consumer | | 10,495 | | 9,471 |
Commercial real estate | | 2,752 | | 2,337 |
Other | | 579 | | 596 |
Total | | $44,835 | | $40,178 |
Unfunded commitments are concentrated in our primary geographic markets. Commitments to extend credit represent arrangements to lend funds or provide liquidity subject to specified contractual conditions. Commercial commitments are reported net of participations, assignments and syndications, primarily to financial institutions, totaling $8.3 billion at December 31, 2006 and $6.7 billion at December 31, 2005. Consumer home equity lines of credit accounted for 74% of consumer unfunded credit commitments.
Unfunded liquidity facility commitments and standby bond purchase agreements totaled $6.0 billion at December 31, 2006 and $5.1 billion at December 31, 2005 and are included in the preceding table primarily within the “Commercial” and “Consumer” categories.
In addition to credit commitments, our net outstanding standby letters of credit totaled $4.4 billion at December 31, 2006 and $4.2 billion at December 31, 2005. Standby letters of credit commit us to make payments on behalf of our
27
customers if specified future events occur. At December 31, 2006, the largest industry concentration was for general medical and surgical hospitals, which accounted for approximately 5% of the total letters of credit and bankers’ acceptances.
Leases and Related Tax and Accounting Matters
The equipment lease portfolio totaled $3.6 billion at December 31, 2006. Aggregate residual value at risk on the lease portfolio at December 31, 2006 was $1.1 billion. We have taken steps to mitigate $.6 billion of this residual risk, including residual value insurance coverage with third parties, third party guarantees, and other actions. The portfolio included approximately $1.7 billion of cross-border leases at December 31, 2006. Cross-border leases are leveraged leases of equipment located in foreign countries, primarily in western Europe and Australia. We have not entered into cross-border lease transactions since 2003.
Upon completing an examination of our 1998-2000 and 2001-2003 consolidated federal income tax returns, the IRS provided us with examination reports which propose increases in our tax liability, principally arising from adjustments to the timing of tax deductions from several of our cross-border lease transactions.
While the situation with respect to these proposed adjustments remains unresolved, we believe our reserves for these exposures were appropriate at December 31, 2006.
In July 2006, the Financial Accounting Standards Board (“FASB”) issued FASB Staff Position No. FAS 13-2,Accounting for a Change or Projected Change in the Timing of Cash Flows Relating to Income Taxes Generated by a Leveraged Lease Transaction(“FSP 13-2”). FSP 13-2 became effective January 1, 2007 and requires a recalculation of the timing of income recognition and the reevaluation of lease classification for actual or projected changes in the timing of tax benefits for leveraged leases. Any cumulative adjustment must be recognized through retained earnings upon adoption of FSP 13-2. See Note 1 Accounting Policies in the Notes To Consolidated Financial Statements in Item 8 of this Report for additional information. Effective January 1, 2007, we recorded a cumulative adjustment to beginning retained earnings from the recalculations of $149 million, after-tax, as required by FSP 13-2. This adjustment was based on our best estimate as to the timing and amount of ultimate settlement of this exposure. Any immediate or future reductions in earnings from our adoption of FSP 13-2 would be recovered in subsequent years.
The US Senate has passed a bill that, if it became law, would have an adverse impact on the tax treatment for our cross-border lease transactions. The US House of Representatives has passed a different version of this legislation that does not contain any provisions relating to the taxation of cross-border lease transactions. The differences between the two versions of this legislation will be resolved in conference. We cannot predict whether or not any new law impacting the tax treatment for our cross-border lease transactions will be enacted.
In addition to these transactions, three lease-to-service contract transactions that we were party to were structured as partnerships for tax purposes. However, we do not believe that our exposure from these transactions is material to our consolidated results of operations or financial position.
SECURITIES
Details Of Securities (a)
| | | | |
| | | Amortized | | Fair |
| In millions | | Cost | | Value |
December 31, 2006 | | | | |
SECURITIES AVAILABLEFOR SALE | | | | |
Debt securities | | | | |
U.S. Treasury and government agencies | | $611 | | $608 |
Mortgage-backed | | 17,325 | | 17,208 |
Commercial mortgage-backed | | 3,231 | | 3,219 |
Asset-backed | | 1,615 | | 1,609 |
State and municipal | | 140 | | 139 |
Other debt | | 90 | | 87 |
Corporate stocks and other | | 321 | | 321 |
Total securities available for sale | | $23,333 | | $23,191 |
December 31, 2005 | | | | |
SECURITIES AVAILABLEFOR SALE | | | | |
Debt securities | | | | |
U.S. Treasury and government agencies | | $3,816 | | $3,744 |
Mortgage-backed | | 13,794 | | 13,544 |
Commercial mortgage-backed | | 1,955 | | 1,919 |
Asset-backed | | 1,073 | | 1,063 |
State and municipal | | 159 | | 158 |
Other debt | | 87 | | 86 |
Corporate stocks and other | | 196 | | 196 |
Total securities available for sale | | $21,080 | | $20,710 |
| (a) | Securities held to maturity at December 31, 2006 and 2005 were less than $.5 million. |
Securities represented 23% of total assets at both December 31, 2006 and December 31, 2005. The increase in total securities compared with December 31, 2005 was primarily due to higher balances of mortgage-backed and commercial mortgage-backed securities, which more than offset the decline in US Treasury and government agencies securities.
At December 31, 2006, the securities available for sale balance included a net unrealized loss of $142 million, which represented the difference between fair value and amortized cost. The comparable amount at December 31, 2005 was a net unrealized loss of $370 million. Net unrealized gains and losses in the securities available for sale portfolio are included in shareholders’ equity as accumulated other comprehensive income or loss, net of tax.
The fair value of securities available for sale generally decreases when interest rates increase and vice versa. Further increases in interest rates in 2007, if sustained, will adversely impact the fair value of securities available for sale going forward compared with the fair value at December 31, 2006.
The expected weighted-average life of securities available for sale was 3 years and 8 months at December 31, 2006 and 4 years and 1 month at December 31, 2005.
28
We estimate that at December 31, 2006 the effective duration of securities available for sale is 2.6 years for an immediate 50 basis points parallel increase in interest rates and 2.2 years for an immediate 50 basis points parallel decrease in interest rates. Comparable amounts at December 31, 2005 were 2.7 years and 2.4 years, respectively.
We evaluate our portfolio of securities available for sale in light of changing market conditions and other factors and, where appropriate, take steps intended to improve our overall positioning.
During mid-August through early September 2006, we performed a comprehensive review of our securities available for sale portfolio and, by the end of September 2006, completed the process of executing portfolio rebalancing actions in response to the changing economic landscape, recent statements and actions by the Federal Open Market Committee (in particular, the decision not to raise the Fed funds target rate), and our desire to position the securities portfolio to optimize total return performance over the long term.
As a result, we repositioned our securities portfolio according to our market views. This included reallocating exposure to certain sectors, selling securities holdings we believed would likely underperform on a relative value basis, and retaining certain existing securities and purchasing incremental securities all of which we believe will outperform the market going forward as further discussed below.
As part of the rebalancing, we assessed the entire securities available for sale portfolio of which, for the majority of positions, fair value was less than amortized cost. We executed a strategy to reduce our US government agency and mortgage-backed security sector allocations and increase our interest rate swap sector allocation. We sold substantially all of our US government agency securities to reduce our interest rate spread exposure to that asset class. The US government agency securities that we retained are characterized by relatively short terms to maturity and smaller individual security balances. We also sold specific securities in the mortgage-backed portfolio (i.e., all of our holdings of specific coupon US government agency pass-through securities and collateralized mortgage obligations having specific collateral characteristics), and in the commercial mortgage-backed portfolio (i.e., all of our holdings of specific vintage securities) that we believe, given the underlying collateral, will underperform on a relative value basis. We retained the remaining holdings in our mortgage-backed portfolio including all of our holdings of mortgage-backed securities collateralized by hybrid adjustable rate mortgage loans, our commercial mortgage-backed portfolio and our asset-backed portfolio. Our objective was to reduce the portfolio credit spread and interest rate volatility exposures, to position the portfolio for a steeper yield curve and to optimize the relative value performance of the portfolio. We assessed the securities retained relative to the same portfolio objectives, our market view and outlook, our desired sector allocations and our
expectation of performance relative to market benchmarks, and, given our assessment, we confirmed our intent to hold these remaining securities until either recovery of fair value or maturity.
The portfolio rebalancing resulted in the sale during the third quarter of 2006 of $6.0 billion of securities available for sale at an aggregate pretax loss of $196 million, or $127 million after-tax. In connection with this rebalancing, we purchased approximately $1.8 billion of securities and added approximately $4.0 billion of interest rate swaps to maintain our interest rate risk position. We also reduced wholesale funding as a result of the actions taken.
The resulting net realized losses on the sale of the securities during the third quarter of 2006 were previously reflected as net unrealized securities losses within accumulated other comprehensive loss in the shareholders’ equity section of PNC’s Consolidated Balance Sheet. Accordingly, total shareholders’ equity did not change as a result of these actions.
See the Consolidated Income Statement Review portion of the 2005 Versus 2004 section of this Item 7 for details of steps taken in the second quarter of 2005 regarding the sale of securities available for sale and related actions.
LOANS HELD FOR SALE
During the third quarter of 2006, we announced our plan to sell or securitize approximately $2.1 billion of loans from our residential mortgage portfolio. These transactions were substantially consummated during the fourth quarter of 2006. In accordance with GAAP, these loans were transferred to loans held for sale as of September 30, 2006. We recognized a pretax loss in the third quarter of 2006 of $48 million as a reduction of noninterest income, representing the mark to market valuation of these loans upon transfer to held for sale status. This loss, which is reported in the “Other” business segment, represented the decline in value of the loans almost entirely from the impact of increases in interest rates over the holding period.
Education loans held for sale totaled $1.3 billion at December 31, 2006 and $1.9 billion at December 31, 2005 and represented the majority of our loans held for sale at each date. We classify substantially all of our education loans as loans held for sale. Generally, we sell education loans when the loans are placed into repayment status. Gains on sales of education loans totaled $33 million for 2006, $19 million for 2005 and $30 million for 2004. These gains are reflected in the other noninterest income line item in our Consolidated Income Statement and in the results of the Retail Banking business segment.
OTHER ASSETS
The increase of $2.5 billion in “Assets-Other” in the preceding “Summarized Balance Sheet Data” table includes the impact
29
of a $1.4 billion increase in Federal funds sold and resale agreements and a $.6 billion increase in other short-term investments.
CAPITAL AND FUNDING SOURCES
Details Of Funding Sources
| | | | |
| December 31 - in millions | | 2006 | | 2005 |
Deposits | | | | |
Money market | | $28,580 | | $24,462 |
Demand | | 16,833 | | 17,157 |
Retail certificates of deposit | | 14,725 | | 13,010 |
Savings | | 1,864 | | 2,295 |
Other time | | 1,326 | | 1,313 |
Time deposits in foreign offices | | 2,973 | | 2,038 |
Total deposits | | 66,301 | | 60,275 |
Borrowed funds | | | | |
Federal funds purchased | | 2,711 | | 4,128 |
Repurchase agreements | | 2,051 | | 1,691 |
Bank notes and senior debt | | 3,633 | | 3,875 |
Subordinated debt | | 3,962 | | 4,469 |
Others | | 2,671 | | 2,734 |
Total borrowed funds | | 15,028 | | 16,897 |
Total | | $81,329 | | $77,172 |
Various seasonal and other factors impact our period-end deposit balances whereas average balances (discussed under the Balance Sheet Highlights section of this Item 7 above) are normally more indicative of underlying business trends.
The increase in deposits as of December 31, 2006 was driven primarily by the impact of higher money market and certificates of deposit balances. In addition to growth in retail deposit balances, growth in deposits from commercial mortgage loan servicing activities also contributed to the increase compared with the prior year-end.
The decline in borrowed funds compared with the balance at December 31, 2005 reflected a decrease in federal funds purchased, maturities of $2.0 billion of bank notes and senior debt during 2006, a decline in subordinated debt in connection with our December 2006 redemption of $453 million of Capital Securities, and the deconsolidation of BlackRock’s $250 million of convertible debentures. These factors were partially offset by the issuance of $1.5 billion of senior debt during the fourth quarter of 2006 and the issuance of $500 million of bank notes in June 2006.
Capital
We manage our capital position by making adjustments to our balance sheet size and composition, issuing debt and equity instruments, making treasury stock transactions, maintaining dividend policies and retaining earnings.
The increase of $2.2 billion in total shareholders’ equity at December 31, 2006 compared with December 31, 2005 reflected the impact of 2006 net income on retained earnings and an increase in capital surplus in connection with the BlackRock/MLIM transaction.
Common shares outstanding were 293 million at December 31, 2006 and December 31, 2005.
During 2006, we purchased 5 million common shares at a total cost of $354 million under our current common stock repurchase program, which offset net share issuances related to various employee stock-based compensation plans and the exercise of employee stock options and other share issuances. Our current program, which was authorized as of February 16, 2005, permits us to purchase up to 20 million shares on the open market or in privately negotiated transactions and will remain in effect until fully utilized or until modified, superseded or terminated. As of December 31, 2006, remaining availability for purchases under this program was 14.5 million shares. The extent and timing of additional share repurchases under this program will depend on a number of factors including, among others, market and general economic conditions, economic and regulatory capital considerations, alternative uses of capital, regulatory limitations resulting from merger activity, and the potential impact on our credit rating. We expect to continue to be active in share repurchases.
See “Mercantile Bankshares Acquisition” in the Executive Summary section of this Item 7 regarding our plans to issue PNC common stock and cash in connection with this pending acquisition. Also, our Liquidity Risk Management discussion in this Item 7 has further details on first quarter 2007 debt issuances related to funding the cash portion of this transaction.
30
Risk-Based Capital
| | | | | | |
December 31 - dollars in millions | | 2006 | | | 2005 | |
Capital components | | | | | | |
Shareholders’ equity | | | | | | |
Common | | $10,781 | | | $8,555 | |
Preferred | | 7 | | | 8 | |
Trust preferred capital securities | | 965 | | | 1,417 | |
Minority interest | | 494 | | | 291 | |
Goodwill and other intangibles (net of eligible deferred taxes) | | (3,540 | ) | | (4,122 | ) |
Pension, other postretirement and postemployment benefit plan adjustments | | 148 | | | | |
Net unrealized securities losses | | 91 | | | 240 | |
Net unrealized losses (gains) on cash flow hedge derivatives | | 13 | | | 26 | |
Equity investments in nonfinancial companies | | (30 | ) | | (40 | ) |
Other, net | | (5 | ) | | (11 | ) |
Tier 1 risk-based capital | | 8,924 | | | 6,364 | |
Subordinated debt | | 1,954 | | | 2,216 | |
Eligible allowance for credit losses | | 681 | | | 697 | |
Total risk-based capital | | $11,559 | | | $9,277 | |
Assets | | | | | | |
Risk-weighted assets, including off-balance-sheet instruments and market risk equivalent assets | | $85,539 | | | $76,673 | |
Adjusted average total assets | | 95,590 | | | 88,329 | |
Capital ratios | | | | | | |
Tier 1 risk-based | | 10.4 | % | | 8.3 | % |
Total risk-based | | 13.5 | | | 12.1 | |
Leverage | | 9.3 | | | 7.2 | |
Tangible common | | 7.4 | | | 5.0 | |
The access to, and cost of, funding new business initiatives including acquisitions, the ability to engage in expanded business activities, the ability to pay dividends, the level of deposit insurance costs, and the level and nature of regulatory oversight depend, in part, on a financial institution’s capital strength. The increases in the capital ratios at December 31, 2006 compared with the ratios at December 31, 2005 were primarily caused by the $1.6 billion increase in capital recognized in the third quarter of 2006 related to the BlackRock/MLIM transaction, partially offset by asset growth.
At December 31, 2006 and December 31, 2005, each of our bank subsidiaries was considered “well capitalized” based on regulatory capital ratio requirements. See the Supervision And Regulation section of Item 1 of this Report and Note 4 Regulatory Matters in the Notes To Consolidated Financial Statements in Item 8 of this Report for additional information. We believe our bank subsidiaries will continue to meet these requirements in 2007.
OFF-BALANCE SHEET
ARRANGEMENTS AND VIES
We engage in a variety of activities that involve unconsolidated entities or that are otherwise not reflected in our Consolidated Balance Sheet that are generally referred to as “off-balance sheet arrangements.” The following sections of this Report provide further information on these types of activities:
| | • | | Commitments, including contractual obligations and other commitments, included within the Risk Management section of this Item 7, and |
| | • | | Note 24 Commitments and Guarantees in the Notes To Consolidated Financial Statements included in Item 8 of this Report. |
The following provides a summary of variable interest entities (“VIEs”), including those in which we hold a significant variable interest but have not consolidated and those that we have consolidated into our financial statements as of December 31, 2006 and 2005.
Non-Consolidated VIEs – Significant Variable Interests
| | | | | | | |
In millions | | Aggregate
Assets | | Aggregate
Liabilities | | PNC Risk
of Loss |
|
December 31, 2006 | | | | | | | |
Market Street | | $4,020 | | $4,020 | | $6,117 | (a) |
Collateralized debt obligations | | 815 | | 570 | | 22 | |
Partnership interests in low income housing projects | | 33 | | 30 | | 8 | |
Total | | $4,868 | | $4,620 | | $6,147 | |
December 31, 2005 | | | | | | | |
Collateralized debt obligations (b) | | $6,290 | | $5,491 | | $51 | |
Private investment funds (b) | | 5,186 | | 1,051 | | 13 | |
Market Street | | 3,519 | | 3,519 | | 5,089 | (a) |
Partnership interests in low income housing projects | | 35 | | 29 | | 2 | |
Total | | $15,030 | | $10,090 | | $5,155 | |
| (a) | PNC’s risk of loss consists of off-balance sheet liquidity commitments to Market Street of $5.6 billion and other credit enhancements of $.6 at December 31, 2006. The comparable amounts at December 31, 2005 were $4.6 billion and $.4 billion, respectively. |
| (b) | Primarily held by BlackRock. We deconsolidated BlackRock effective September 29, 2006. See Note 2 Acquisitions in the Notes To Consolidated Financial Statements for additional information. Includes both PNC’s direct risk of loss and BlackRock’s risk of loss, limited to PNC’s ownership interest in BlackRock. |
31
The aggregate assets and liabilities of VIEs that we have consolidated in our financial statements are as follows:
Consolidated VIEs – PNC Is Primary Beneficiary
| | | | |
In millions | | Aggregate
Assets | | Aggregate
Liabilities |
December 31, 2006 | | | | |
Partnership interests in low income housing projects | | $834 | | $834 |
Total | | $834 | | $834 |
December 31, 2005 | | | | |
Partnership interests in low income housing projects | | $680 | | $680 |
Other | | 12 | | 10 |
Total | | $692 | | $690 |
Market Street
Market Street Funding LLC (“Market Street”), formerly Market Street Funding Corporation, is a multi-seller asset-backed commercial paper conduit that is owned by an independent third party. Market Street’s activities are limited to the purchasing of assets or making of loans secured by interests primarily in pools of receivables from US corporations that desire access to the commercial paper market. Market Street funds the purchases or loans by issuing commercial paper which has been rated A1/P1 by Standard & Poor’s and Moody’s, respectively, and is supported by pool-specific credit enhancement, liquidity facilities and program-level credit enhancement.
PNC Bank, N.A. provides certain administrative services, a portion of the program-level credit enhancement and the majority of liquidity facilities to Market Street in exchange for fees negotiated based on market rates. All of Market Street’s assets at December 31, 2006 and 2005 collateralize the commercial paper obligations. PNC views its credit exposure for the Market Street transactions as limited. Facilities requiring PNC to fund for defaulted assets totaled $850 million at December 31, 2006. For 85% of the liquidity facilities at December 31, 2006, PNC is not required to fund if the assets are in default. PNC may be liable for funding under liquidity facilities for events such as borrower bankruptcies, collateral deficiencies or covenant violations. Additionally, PNC’s obligations under the liquidity facilities are secondary to the risk of first loss provided by the borrower or another third party in the form of deal-specific credit enhancement – for example, by the over collateralization of the assets. Deal-specific credit enhancement that supports the commercial paper issued by Market Street is generally structured to cover a multiple of the expected historical losses for the pool of assets and is sized to generally meet rating agency standards for comparably structured transactions. Credit enhancement is provided in part by PNC Bank, N.A. in the form of a cash collateral account that is funded by a loan facility that expires March 25, 2011. See Note 7 Loans, Commitments To Extend Credit and Concentrations of Credit Risk and Note 24
Commitments and Guarantees included in Item 8 of this Report for additional information. Neither creditors nor equity investors in Market Street have any recourse to our general credit. PNC accrued program administrator fees and commitment fees related to PNC’s portion of the liquidity facilities of $11.3 million and $3.7 million, respectively, for the year ended December 31, 2006.
Under the provisions of FASB Interpretation No. 46, “Consolidation of Variable Interest Entities (“FIN 46”), we consolidated Market Street effective July 1, 2003 as we were deemed the primary beneficiary of Market Street. In October 2005, Market Street was restructured as a limited liability company and entered into a subordinated Note Purchase Agreement (“Note”) with an unrelated third party. Consistent with other market participants, PNC elected to restructure Market Street and Market Street issued the Note for the primary purpose of providing our customers access to the asset-backed commercial paper markets in a more capital-efficient manner.
The Note provides first loss coverage whereby the investor absorbs losses up to the amount of the Note, which is $5.7 million as of December 31, 2006. The Note has an original maturity of eight years and bears interest at 18% with any default-related interest/fees charged by Market Street on specific transactions accruing to the benefit of the Note holder. Proceeds from the issuance of the Note were placed in a first loss reserve account that may be used to reimburse any losses incurred by Market Street, PNC Bank, N.A. or other providers under the liquidity facilities and the credit enhancement arrangements.
As a result of the Note issuance, we reevaluated whether PNC continued to be the primary beneficiary of Market Street under the provisions of FIN 46R. PNC evaluated the design of Market Street, its capital structure and relationships among the variable interest holders. PNC also performed a quantitative analysis, which computes and allocates expected loss or residual returns to variable interest holders. PNC considered variability generated from the risks specific to Market Street such as expected credit losses, facility pricing (including default-related pricing), and fee volatility in determining that the Note investor absorbed the majority of the expected variability and therefore is the primary beneficiary and required to consolidate Market Street. Based on this analysis, we determined that we were no longer the primary beneficiary and deconsolidated Market Street from our Consolidated Balance Sheet effective October 17, 2005.
As required under FIN 46R, reconsideration events such as changes in the Note contractual terms, additional Note investors and or changes in the inherent Market Street risks would trigger PNC to determine if the primary beneficiary has changed.
Low Income Housing Projects
We make certain equity investments in various limited partnerships that sponsor affordable housing projects utilizing
32
the Low Income Housing Tax Credit (“LIHTC”) pursuant to Section 42 of the Internal Revenue Code. The purpose of these investments is to achieve a satisfactory return on capital, to facilitate the sale of additional affordable housing product offerings and to assist us in achieving goals associated with the Community Reinvestment Act. The primary activities of the limited partnerships include the identification, development and operation of multi-family housing that is leased to qualifying residential tenants. Generally, these types of investments are funded through a combination of debt and equity, with equity typically comprising 30% to 60% of the total project capital.
We consolidated those LIHTC investments in which we own a majority of the limited partnership interests. We also consolidated entities in which we, as a national syndicator of affordable housing equity, serve as the general partner (together with the aforementioned LIHTC investments), and no other entity owns a majority of the limited partnership interests. In these syndication transactions, we create funds in which our subsidiary is the general partner and sells limited partnership interests to third parties, and in some cases may also purchase a limited partnership interest in the fund. The fund’s limited partners can generally remove the general partner without cause at any time. The purpose of this business is to generate income from the syndication of these funds and to generate servicing fees by managing the funds. General partner activities include selecting, evaluating, structuring, negotiating, and closing the fund investments in operating limited partnerships, as well as oversight of the ongoing operations of the fund portfolio. The assets are primarily included in Equity Investments on our Consolidated Balance Sheet. Neither creditors nor equity investors in the LIHTC investments have any recourse to our general credit. The consolidated aggregate assets and debt of these LIHTC investments are provided in the Consolidated VIEs – PNC Is Primary Beneficiary table and reflected in the Corporate & Institutional Banking business segment.
We have a significant variable interest in certain other limited partnerships that sponsor affordable housing projects. We do not own a majority of the limited partnership interests in these entities and are not the primary beneficiary. We use the equity method to account for our investment in these entities. Information regarding these partnership interests is reflected in the Non-Consolidated VIEs – Significant Variable Interests table.
We also have subsidiaries that invest in and act as the investment manager for private equity funds organized as limited partnerships as part of our equity management activities. The funds invest in private equity investments to generate capital appreciation and profits. As permitted by FASB Interpretation No. 46 (Revised 2003), “Consolidation of Variable Interest Entities,” we have deferred applying the provisions of the interpretation for these entities pending further action by the FASB. Information on these entities follows:
Investment Company Accounting – Deferred Application
| | | | | | |
In millions | | Aggregate
Assets | | Aggregate
Equity | | PNC Risk
of Loss |
Private Equity Funds | | | | | | |
December 31, 2006 | | $102 | | $102 | | $104 |
December 31, 2005 | | $109 | | $109 | | $35 |
PNC’s risk of loss in the tables above includes both the value of our equity investments and any unfunded commitments to the respective entities.
Perpetual Trust Securities
In December 2006, one of our indirect subsidiaries, PNC REIT Corp., sold $500 million of 6.517% Fixed-to-Floating Rate Non-Cumulative Exchangeable Perpetual Trust Securities (the “Trust Securities”) of PNC Preferred Funding Trust I, in a private placement. PNC REIT Corp. had previously acquired the Trust Securities from the trust in exchange for an equivalent amount of Fixed-to-Floating Rate Non-Cumulative Perpetual Preferred Securities (the “LLC Preferred Securities”), of PNC Preferred Funding LLC (the “LLC”), held by PNC REIT Corp. The LLC’s initial material assets consist of indirect interests in mortgages and mortgage-related assets previously owned by PNC REIT Corp.
PNC REIT Corp. also owns 100% of the LLC’s common voting securities. As a result, the LLC is an indirect subsidiary of PNC Bank, N.A. and is consolidated in accordance with GAAP on our consolidated balance sheet. PNC Preferred Funding Trust I’s investment in the LLC Preferred Securities is characterized as a minority interest on our balance sheet since we are not the primary beneficiary of PNC Preferred Funding Trust I. This minority interest totaled approximately $490 million at December 31, 2006.
Each Trust Security is automatically exchangeable into a share of Series F Non-Cumulative Perpetual Preferred Stock of PNC Bank, N.A. (the “PNC Bank Preferred Stock”) under certain conditions relating to the capitalization or the financial condition of PNC Bank, N.A. and upon the direction of the OCC.
Simultaneously with the closing of the Trust Securities sale, we entered into a replacement capital covenant (the “Covenant”) for the benefit of holders of a specified series of our long-term indebtedness (the “Covered Debt”). As of December 31, 2006, Covered Debt consists of our
33
$200 million Floating Rate Junior Subordinated Notes issued on June 9, 1998. We agreed in the Covenant that neither we nor our subsidiaries (other than PNC Bank, N.A. and its subsidiaries) would purchase the Trust Securities, the LLC Preferred Securities or the PNC Bank Preferred Stock (collectively, the “Covenant Securities”) unless: (i) we have received the prior approval of the Federal Reserve Board, if such approval is then required by the Federal Reserve Board and (ii) during the 180-day period prior to the date of purchase, we or our subsidiaries, as applicable, have received proceeds from the sale of Qualifying Securities in the amounts specified in the Covenant (which amounts will vary based on the type of securities sold). “Qualifying Securities” means debt and equity securities having terms and provisions specified in the Covenant and that, generally described, are intended to contribute to our capital base in a manner that is similar to the contribution to our capital base made by the Covenant Securities. The Covenant does not apply to redemptions of the Covered Securities by the issuers of those securities. We filed a copy of the Covenant with the SEC as Exhibit 99.1 to PNC’s Form 8-K filed on December 8, 2006.
PNC Bank, N.A. has contractually committed to PNC Preferred Funding Trust I that if full dividends are not paid in a dividend period on the Trust Securities, LLC Preferred Securities or any other parity equity securities issued by the LLC, neither PNC Bank, N. A. nor its subsidiaries will declare or pay dividends or other distributions with respect to, or redeem, purchase or acquire or make a liquidation payment with respect to, any of its equity capital securities during the next succeeding dividend period (other than to holders of the LLC Preferred Securities and any parity equity securities issued by the LLC) except: (i) in the case of dividends payable to subsidiaries of PNC Bank, N.A., to PNC Bank, N.A. or another wholly-owned subsidiary of PNC Bank, N.A. or (ii) in the case of dividends payable to persons that are not subsidiaries of PNC Bank, N.A., to such persons only if, (A) in the case of a cash dividend, PNC has first irrevocably committed to contribute amounts at least equal to such cash dividend or (B) in the case of in-kind dividends payable by PNC REIT Corp., PNC has committed to purchase such in-kind dividend from the applicable PNC REIT Corp. holders in exchange for a cash payment representing the market value of such in-kind dividend, and PNC has committed to contribute such in-kind dividend to PNC Bank. N.A.
BUSINESS SEGMENTS REVIEW
We have four major businesses engaged in providing banking, asset management and global fund processing services: Retail Banking; Corporate & Institutional Banking; BlackRock; and PFPC.
Certain of our products and services are offered through Corporate & Institutional Banking and marketed by several businesses across PNC, such as our treasury management activities, which include cash and investment management, receivables management, disbursement services, funds
transfer services, information reporting, and global trade services; capital markets-related products and services, which include foreign exchange, derivatives, loan syndications, securities underwriting, securities sales and trading, and mergers and acquisitions advisory and related services to middle-market companies; commercial loan servicing, real estate advisory and technology solutions for the commercial real estate finance industry; and equipment leasing products.
Results of individual businesses are presented based on our management accounting practices and our operating structure. There is no comprehensive, authoritative body of guidance for management accounting equivalent to GAAP; therefore, the financial results of individual businesses are not necessarily comparable with similar information for any other company. We refine our methodologies from time to time as our management accounting practices are enhanced and our businesses and management structure change. Financial results are presented, to the extent practicable, as if each business operated on a stand-alone basis. As permitted under GAAP, we have aggregated the business results for certain operating segments for financial reporting purposes.
Our capital measurement methodology is based on the concept of economic capital for our banking businesses. However, we have increased the capital assigned to Retail Banking to 6% of funds to reflect the capital required for well-capitalized banks and to approximate market comparables for this business. The capital for PFPC has been increased to reflect its legal entity shareholders’ equity.
BlackRock business segment results for the nine months ended September 30, 2006 and full year 2005 reflected our majority ownership in BlackRock during those periods. Subsequent to the September 29, 2006 BlackRock/MLIM transaction closing, our investment in BlackRock and capital position increased significantly but our ownership interest was reduced to approximately 34%. BlackRock is now accounted for under the equity method and continues to be a separate reportable business segment. For our business segment reporting presentation, we have reclassified historical BlackRock segment results to conform to our current approach, as further described on page 41.
We have allocated the allowances for loan and lease losses and unfunded loan commitments and letters of credit based on our assessment of risk inherent in the loan portfolios. Our allocation of the costs incurred by operations and other support areas not directly aligned with the businesses is primarily based on the use of services.
Total business segment financial results differ from total consolidated results. The impact of these differences is reflected in the “Intercompany Eliminations” and “Other” categories. “Intercompany Eliminations” reflects activities conducted among our businesses that are eliminated in the consolidated results. “Other” includes residual activities that do not meet the criteria for disclosure as a separate reportable
34
business, such as gains or losses related to our BlackRock investment, 2006 BlackRock/MLIM integration costs, One PNC implementation costs, asset and liability management activities, related net securities gains or losses, certain trading activities, equity management activities and minority interest in income of BlackRock up to September 29, 2006, differences between business segment performance reporting and financial statement reporting (GAAP), and most corporate overhead.
Business segment results, including inter-segment revenues, are included in Note 21 Segment Reporting in the Notes To Consolidated Financial Statements in Item 8 of this Report.
Employee data as reported by each business segment in the tables that follow reflect staff directly employed by the respective businesses and excludes corporate and shared services employees. Prior period employee statistics generally are not restated for organizational changes.
Results Of Businesses - Summary
| | | | | | | | | | | | | |
| | Earnings | | | Revenue (a) | | Average Assets (b) |
Year ended December 31 - dollars in millions | | 2006 | | 2005 | | | 2006 | | 2005 | | 2006 | | 2005 |
Retail Banking | | $765 | | $682 | | | $3,125 | | $2,868 | | $29,248 | | $27,618 |
Corporate & Institutional Banking | | 463 | | 480 | | | 1,472 | | 1,335 | | 26,548 | | 25,309 |
BlackRock (c)(d) | | 187 | | 152 | | | 1,170 | | 1,229 | | 3,937 | | 1,848 |
PFPC (e) | | 124 | | 104 | | | 879 | | 846 | | 2,204 | | 2,128 |
Total business segments | | 1,539 | | 1,418 | | | 6,646 | | 6,278 | | 61,937 | | 56,903 |
Other | | 1,056 | | (93 | ) | | 1,951 | | 82 | | 33,075 | | 31,645 |
Total consolidated | | $2,595 | | $1,325 | | | $8,597 | | $6,360 | | $95,012 | | $88,548 |
| (a) | Business segment revenue is presented on a taxable-equivalent basis. The interest income earned on certain assets is completely or partially exempt from federal income tax. As such, these tax-exempt instruments typically yield lower returns than a taxable investment. To provide more meaningful comparisons of yields and margins for all interest-earning assets, we also provide revenue on a taxable-equivalent basis by increasing the interest income earned on tax-exempt assets to make it fully equivalent to interest income earned on other taxable investments. This adjustment is not permitted under GAAP. The following is a reconciliation of total consolidated revenue on a book (GAAP) basis to total consolidated revenue on a taxable-equivalent basis: |
| | | | |
Year ended December 31 - dollars in millions | | 2006 | | 2005 |
Total consolidated revenue, book (GAAP) basis | | $8,572 | | $6,327 |
Taxable-equivalent adjustment | | 25 | | 33 |
Total consolidated revenue, taxable-equivalent basis | | $8,597 | | $6,360 |
| (b) | Period-end balances for BlackRock and PFPC. BlackRock was an equity investment at December 31, 2006 and was consolidated at December 31, 2005. |
| (c) | These amounts have been reduced by minority interest in income of BlackRock, excluding MLIM integration costs, totaling $65 million and $71 million for the years ended December 31, 2006 and 2005, respectively. These amounts are also net of additional PNC income taxes recorded on PNC’s share of BlackRock’s earnings totaling $24 million and $11 million for the years ended December 31, 2006 and 2005, respectively that have been reclassified to BlackRock from “Other.” For this PNC business segment earnings presentation, integration costs incurred by BlackRock for the MLIM transaction totaling $47 for full year 2006 have been reclassified from BlackRock to “Other.” This amount is after-tax and net of minority interest as applicable. |
| (d) | For 2005 and the first nine months of 2006, revenue for BlackRock represents the sum of total operating revenue and nonoperating income. For the fourth quarter of 2006, revenue represents our equity income from BlackRock. |
| (e) | Amounts for PFPC represent the sum of total operating revenue and nonoperating income (expense) less debt financing costs. |
35
RETAIL BANKING
| | | | | | |
Year ended December 31 Taxable-equivalent basis Dollars in millions | | 2006 | | | 2005 | |
INCOME STATEMENT | | | | | | |
Net interest income | | $1,678 | | | $1,593 | |
Noninterest income | | | | | | |
Asset management | | 352 | | | 337 | |
Service charges on deposits | | 304 | | | 265 | |
Brokerage | | 236 | | | 217 | |
Consumer services | | 348 | | | 278 | |
Other | | 207 | | | 178 | |
Total noninterest income | | 1,447 | | | 1,275 | |
Total revenue | | 3,125 | | | 2,868 | |
Provision for credit losses | | 81 | | | 52 | |
Noninterest expense | | 1,827 | | | 1,726 | |
Pretax earnings | | 1,217 | | | 1,090 | |
Income taxes | | 452 | | | 408 | |
Earnings | | $765 | | | $682 | |
AVERAGE BALANCE SHEET | | | | | | |
Loans | | | | | | |
Consumer | | | | | | |
Home equity | | $13,813 | | | $13,351 | |
Indirect | | 1,052 | | | 936 | |
Other consumer | | 1,248 | | | 1,195 | |
Total consumer | | 16,113 | | | 15,482 | |
Commercial | | 5,721 | | | 5,094 | |
Floor plan | | 910 | | | 975 | |
Residential mortgage | | 1,440 | | | 1,405 | |
Other | | 242 | | | 261 | |
Total loans | | 24,426 | | | 23,217 | |
Goodwill and other intangible assets | | 1,581 | | | 1,394 | |
Loans held for sale | | 1,607 | | | 1,553 | |
Other assets | | 1,634 | | | 1,454 | |
Total assets | | $29,248 | | | $27,618 | |
Deposits | | | | | | |
Noninterest-bearing demand | | $7,841 | | | $7,639 | |
Interest-bearing demand | | 7,906 | | | 7,946 | |
Money market | | 14,750 | | | 13,635 | |
Total transaction deposits | | 30,497 | | | 29,220 | |
Savings | | 2,035 | | | 2,574 | |
Certificates of deposit | | 13,861 | | | 11,494 | |
Total deposits | | 46,393 | | | 43,288 | |
Other liabilities | | 553 | | | 392 | |
Capital | | 2,986 | | | 2,852 | |
Total funds | | $49,932 | | | $46,532 | |
PERFORMANCE RATIOS | | | | | | |
Return on average capital | | 26 | % | | 24 | % |
Noninterest income to total revenue | | 46 | | | 44 | |
Efficiency | | 58 | | | 60 | |
OTHER INFORMATION(a) | | | | | | |
Credit-related statistics: | | | | | | |
Nonperforming assets(b) | | $106 | | | $90 | |
Net charge-offs | | $85 | | | $53 | |
Net charge-off ratio | | .35 | % | | .23 | % |
Home equity portfolio credit statistics: | | | | | | |
% of first lien positions | | 43 | % | | 46 | % |
Weighted average loan-to-value ratios | | 70 | % | | 68 | % |
Weighted average FICO scores | | 728 | | | 728 | |
Loans 90 days past due | | .24 | % | | .21 | % |
| | | | | | |
At December 31 Dollars in millions | | 2006 | | | 2005 | |
OTHER INFORMATION(a) | | | | | | |
Checking-related statistics: | | | | | | |
Retail Banking checking relationships | | 1,954,000 | | | 1,934,000 | |
Consumer DDA households using online banking | | 938,000 | | | 855,000 | |
% of consumer DDA households using online banking | | 53 | % | | 49 | % |
Consumer DDA households using online bill payment | | 404,000 | | | 205,000 | |
% of consumer DDA households using online bill payment | | 23 | % | | 12 | % |
Small business managed deposits: | | | | | | |
On-balance sheet | | | | | | |
Noninterest-bearing demand | | $4,359 | | | $4,353 | |
Interest-bearing demand | | 1,529 | | | 1,560 | |
Money market | | 2,684 | | | 2,849 | |
Certificates of deposit | | 645 | | | 412 | |
Off-balance sheet(c) | | | | | | |
Small business sweep checking | | 1,619 | | | 1,305 | |
Total managed deposits | | 10,836 | | | 10,479 | |
Brokerage statistics: | | | | | | |
Margin loans | | $163 | | | $217 | |
Financial consultants(d) | | 758 | | | 779 | |
Full service brokerage offices | | 99 | | | 100 | |
Brokerage account assets (billions) | | $46 | | | $42 | |
Other statistics: | | | | | | |
Gains on sales of education loans(e) | | $33 | | | $19 | |
Full-time employees | | 9,549 | | | 9,679 | |
Part time employees | | 1,829 | | | 1,117 | |
ATMs | | 3,581 | | | 3,721 | |
Branches(f) | | 852 | | | 839 | |
ASSETS UNDER ADMINISTRATION
(in billions)(g) | | | | | | |
Assets under management | | | | | | |
Personal | | $44 | | | $40 | |
Institutional | | 10 | | | 9 | |
Total | | $54 | | | $49 | |
Asset Type | | | | | | |
Equity | | $34 | | | $31 | |
Fixed income | | 12 | | | 12 | |
Liquidity/other | | 8 | | | 6 | |
Total | | $54 | | | $49 | |
Nondiscretionary assets under administration | | | | | | |
Personal | | $25 | | | $27 | |
Institutional | | 61 | | | 57 | |
Total | | $86 | | | $84 | |
Asset Type | | | | | | |
Equity | | $33 | | | $33 | |
Fixed income | | 24 | | | 24 | |
Liquidity/other | | 29 | | | 27 | |
Total | | $86 | | | $84 | |
| (a) | Presented as of December 31 except for net charge-offs, net charge-off ratio, gains on sales of education loans, and small business managed deposits. |
| (b) | Includes nonperforming loans of $96 million at December 31, 2006 and $81 million at December 31, 2005. |
| (c) | Represents small business balances, a portion of which are calculated on a one-month lag. These balances are swept into liquidity products managed by other PNC business segments, the majority of which are off-balance sheet. |
| (d) | Financial consultants provide services in full service brokerage offices and PNC traditional branches. |
| (e) | Included in “Noninterest income-Other.” |
| (f) | Excludes certain satellite branches that provide limited products and service hours. |
| (g) | Excludes brokerage account assets. |
36
Retail Banking’s 2006 earnings increased $83 million, or 12%, to $765 million compared with 2005. Revenue increased 9% and noninterest expense increased 6% compared with the prior year, creating positive operating leverage. The increase in earnings was driven by improved fee income from customers, higher taxable-equivalent net interest income fueled by continued customer and balance sheet growth, and a sustained focus on expense management. Retail Banking’s sustained focus on expense management has allowed for additional investments in the business as described below.
Highlights of Retail Banking’s performance during 2006 include the following:
| • | | We made the following investments in the business: |
| | – | | Branch expansion and renovation, |
| | – | | Expansion of the private client group serving the mass affluent customer segment, |
| | – | | Execution on the fourth quarter 2005 purchase of majority ownership of our merchant services business, and |
| | – | | Introduction of a new simplified checking account line and PNC-branded credit card program. |
| • | | Retail Banking’s efficiency ratio improved to 58% in 2006 compared with 60% a year earlier, despite the investments made in the business. |
| • | | Consumer and small business checking relationships increased 20,000 compared with December 31, 2005. Checking relationship growth has been mitigated by our focus on consolidating low-activity and low-balance accounts, while seeking higher quality deposits. Since the launch of our new simplified product line, the average balances of new accounts increased approximately 20% and account activation is up 5% when compared with the same period of last year. |
| • | | Since December 31, 2005, consumer-related checking households using online banking increased 10% and checking households using online bill payment increased 97%. |
| • | | The small business area continued its positive momentum. Average small business loans increased 13% for the year compared with 2005 on the strength of increased demand from both existing customers and new relationships. Small business checking relationships increased 3%. |
| • | | The wealth management business sustained solid growth over 2005 as asset management fees increased $15 million, or 4%. Assets under management totaled $54 billion at December 31, 2006, a 10% increase compared with December 31, 2005 due to the positive market impact in the second half of 2006 and increased sales efforts. |
| • | | Customer assets in brokerage accounts totaled $46 billion at December 31, 2006 compared with $42 billion at December 31, 2005. Brokerage fees increased $19 million, or 9%, over the prior year. |
| • | | The branch network increased a net 13 branches to a total of 852 branches at December 31, 2006 compared with December 31, 2005. This increase was comprised of 24 new branches, offset by 11 branch consolidations. Our strategy is to continue to optimize our network by opening new branches in high growth areas, relocating branches to areas of higher opportunity and cost efficiency, and consolidating branches in areas of declining market opportunity. We relocated seven branches during 2006. |
Total revenue for 2006 was $3.125 billion compared with $2.868 billion for 2005. Taxable-equivalent net interest income of $1.678 billion increased $85 million, or 5%, compared with 2005 due to a 7% increase in average deposits and a 5% increase in average loan balances. Net interest income growth has been somewhat mitigated by declining spreads on the loan portfolio. In the current rate environment, we expect the spread we receive on both loans and deposits to be under pressure.
Noninterest income increased $172 million, or 13%, compared with the prior year primarily driven by increased asset management fees, brokerage fees, consumer services fees and service charges on deposits. This growth can be attributed primarily to the following:
| | • | | Consolidation of our merchant services activities, |
| | • | | Higher gains on asset sales, |
| | • | | Comparatively favorable equity markets, |
| | • | | Increased assets under management, |
| | • | | Increased brokerage account assets and activities, |
| | • | | Expansion of the branch network, including our new greater Washington, DC area market, |
| | • | | Increased third party loan servicing activities, and |
| | • | | Various pricing actions resulting from the One PNC initiative. |
The provision for credit losses increased $29 million in 2006 compared with 2005. The increased provision is primarily a result of a single large overdraft situation and growth within the commercial loan portfolio.
Noninterest expense for 2006 totaled $1.827 billion, an increase of $101 million, or 6%, compared with 2005. Expense increases were primarily attributable to continued growth of the company’s branch network, including our new greater Washington, DC area market, the consolidation of PNC’s merchant services activities, expansion of the private client group, investments in various initiatives such as the new simplified checking account product line and new PNC-branded credit card, and an increase in volume-related expenses tied to revenue, partially offset by lower staff-related expense as a result of One PNC initiatives.
The new simplified checking product line is expected to continue to increase checking account households and average
37
balances per account. Two features of the new product line, free access to ATMs worldwide and a first time overdraft fee waiver, will, however, negatively impact growth rates on service charges on deposits fee income and noninterest expenses.
Full-time employees at December 31, 2006 totaled 9,549, a decline of 130 from December 31, 2005. Part-time employees have increased by 712 since December 31, 2005. The decline in full-time employees and increase in part-time employees is a direct result of various customer service enhancement and efficiency initiatives. These initiatives include utilizing more part-time customer-facing employees during peak business hours versus full-time employees for the entire day.
We have adopted a relationship-based lending strategy to target specific customer sectors (homeowners, small businesses and auto dealerships) while seeking to maintain a moderate risk profile in the loan portfolio.
| • | | Average commercial loans grew $627 million, or 12%, on the strength of increased loan demand from existing small business customers and the acquisition of new relationships through our sales efforts. |
| • | | Average home equity loans grew by $462 million, or 3%, compared with 2005. Consumer loan demand has slowed as a result of the current rate environment. |
| • | | Average indirect loans grew $116 million, or 12%, compared with 2005. The indirect auto business benefited from increased sales and marketing efforts. |
| • | | Average residential mortgage loans increased $35 million, or 2%, primarily due to the addition of loans from our new greater Washington, DC area market. Payoffs in our existing portfolio, which will continue throughout 2007, reduced the impact of the additional loans acquired. Additionally, our transfer of residential mortgages to held for sale and subsequent sale of those loans at the end of September reduced the size of this loan portfolio. |
Growing core checking deposits as a lower cost-funding source and as the cornerstone product to build customer relationships is the primary objective of our deposit strategy. Average total deposits increased $3.1 billion, or 7%, compared with 2005. The deposit growth was driven by increases in the number of checking relationships and the recapture of consumer certificate of deposit balances as interest rates have risen.
During the current rate environment, we expect the rate of growth in demand deposit balances to be equal to or less than the rate of overall growth for customer checking relationships. Additionally, we expect to see customers shift their funds from lower yielding interest-bearing deposits to higher yielding deposits or investment products, and to pay off loans. The shift has been evident during the past year and has impacted the level of average demand deposits in that period.
| • | | Certificates of deposits increased $2.4 billion and money market deposits increased $1.1 billion. These increases were attributable to the current interest rate environment attracting customers back into these products. |
| • | | Average demand deposit growth of $162 million, or 1%, was impacted by customers shifting funds into higher yielding deposits, small business sweep checking products, and investment products. |
| • | | Small business and consumer-related checking relationships retention remained strong and stable. Consumer-related checking relationship retention has benefited from improved penetration rates of debit cards, online banking and online bill payment. |
Assets under management of $54 billion at December 31, 2006 increased $5 billion compared with the balance at December 31, 2005. Asset growth was driven by the effect of comparatively higher equity markets combined with a breakeven position in client net asset flows. Client net asset flows are the result of investment additions from new and existing clients net of ordinary course distributions from trust and investment management accounts and account closures.
Nondiscretionary assets under administration of $86 billion at December 31, 2006 increased $2 billion compared with the balance at December 31, 2005. The effect of comparatively higher equity markets was partially offset by the loss of one significant master custody account and a sizeable reduction of another client account with minimal earnings impact.
38
CORPORATE & INSTITUTIONAL BANKING
| | | | | | |
Year ended December 31 Taxable-equivalent basis Dollars in millions except as noted | | 2006 | | | 2005 | |
INCOME STATEMENT | | | | | | |
Net interest income | | $720 | | | $739 | |
Noninterest income | | | | | | |
Corporate service fees | | 526 | | | 398 | |
Other | | 226 | | | 198 | |
Noninterest income | | 752 | | | 596 | |
Total revenue | | 1,472 | | | 1,335 | |
Provision for (recoveries of) credit losses | | 42 | | | (30 | ) |
Noninterest expense | | 749 | | | 658 | |
Pretax earnings | | 681 | | | 707 | |
Income taxes | | 218 | | | 227 | |
Earnings | | $463 | | | $480 | |
AVERAGE BALANCE SHEET | | | | | | |
Loans | | | | | | |
Corporate (a) (b) | | $9,925 | | | $10,656 | |
Commercial real estate | | 2,876 | | | 2,289 | |
Commercial – real estate related | | 2,433 | | | 2,071 | |
Asset-based lending | | 4,467 | | | 4,203 | |
Total loans | | 19,701 | | | 19,219 | |
Loans held for sale | | 893 | | | 752 | |
Goodwill and other intangible assets | | 1,352 | | | 1,064 | |
Other assets | | 4,602 | | | 4,274 | |
Total assets | | $26,548 | | | $25,309 | |
Deposits | | | | | | |
Noninterest-bearing demand | | $6,771 | | | $6,025 | |
Money market | | 2,654 | | | 2,670 | |
Other | | 907 | | | 687 | |
Total deposits | | 10,332 | | | 9,382 | |
Commercial paper (b) | | | | | 1,838 | |
Other liabilities | | 3,771 | | | 3,348 | |
Capital | | 1,976 | | | 1,724 | |
Total funds | | $16,079 | | | $16,292 | |
PERFORMANCE RATIOS | | | | | | |
Return on average capital | | 23 | % | | 28 | % |
Noninterest income to total revenue | | 51 | | | 45 | |
Efficiency | | 51 | | | 49 | |
COMMERCIAL MORTGAGE SERVICING PORTFOLIO(in billions) | | | | | | |
Beginning of period | | $136 | | | $98 | |
Acquisitions/additions | | 102 | | | 74 | |
Repayments/transfers | | (38 | ) | | (36 | ) |
End of period | | $200 | | | $136 | |
OTHER INFORMATION | | | | | | |
Consolidated revenue from (c): | | | | | | |
Treasury management | | $424 | | | $410 | |
Capital markets | | $283 | | | $175 | |
Midland Loan Services | | $184 | | | $144 | |
Total loans (d) | | $20,054 | | | $18,817 | |
Nonperforming assets (d) (e) | | $63 | | | $124 | |
Net charge-offs (recoveries) | | $54 | | | $(23 | ) |
Full-time employees (d) | | 1,936 | | | 1,861 | |
Net gains on commercial mortgage loan sales | | $55 | | | $61 | |
Net carrying amount of commercial mortgage servicing rights (d) | | $471 | | | $344 | |
| (a) | Includes lease financing. |
| (b) | Includes Market Street as applicable for 2005. Market Street was deconsolidated from our Consolidated Balance Sheet effective October 17, 2005. |
| (c) | Represents consolidated PNC amounts. |
| (d) | Presented as of period end. |
| (e) | Includes nonperforming loans of $50 million at December 31, 2006 and $108 million at December 31, 2005. |
Earnings from Corporate & Institutional Banking for 2006 totaled $463 million compared with $480 million for 2005. This decline was primarily attributable to the year over year $72 million change in the provision for credit losses principally as a result of a $53 million loan recovery recognized in the second quarter of 2005. In addition, the comparison was impacted by a $137 million increase in total revenue, while noninterest expenses grew by $91 million in 2006 compared with 2005.
Highlights of 2006 for Corporate & Institutional Banking included:
| • | | Average loan balances increased $482 million, or 3%, over 2005. The prior year average of $19.2 billion included $1.7 billion in loans from the Market Street commercial paper conduit that was deconsolidated in October 2005. Excluding the impact of deconsolidating the conduit, average loan balances increased 12%. The growth in loans was driven by continuing customer demand for corporate, commercial real estate, and asset-based lending loans, and our expansion into the greater Washington, DC area beginning in May 2005. The large amount of liquidity in the credit markets has increased competitive pressures for risk-adjusted returns. This has resulted in shrinking loan spreads and a progressive slowing of loan growth. We expect this trend to continue into 2007 as we expect to maintain our moderate risk profile. |
| • | | Asset quality continued to be strong. Nonperforming assets at December 31, 2006 declined to $63 million compared with $124 million at December 31, 2005, while net charge-offs during 2006 were $54 million. Based on the assets we currently hold and current business trends and activities, we believe that overall asset quality will remain strong by historical standards, at least for the near term. We expect the provision to increase with loan growth in 2007. |
| • | | Average deposits increased $950 million, or 10%, over the comparable prior year period. The increase was primarily driven by noninterest-bearing deposit growth related to our commercial mortgage servicing portfolio and a modest increase in the sale of treasury management products. Money market deposits have remained relatively flat due to the attraction of customers to off-balance sheet sweep products in the current rate environment. Growth in deposits is expected to continue, however, at a moderate pace. |
| • | | Total revenue increased 10% compared with 2005 as strong growth in fee income offset a decline in taxable-equivalent net interest income. Fee income growth was driven by increases in merger and acquisition advisory activity, capital market-related activities, and treasury management products and services. |
Commercial mortgage servicing revenue, which includes fees and net interest income, totaled $184 million for 2006, an
39
increase of $40 million over 2005. The 28% revenue increase over 2005 was driven by growth in the commercial mortgage servicing portfolio, which increased to $200 billion. The associated increase in deposits with the business has increased the net interest income portion of Midland Loan Services’ total revenue.
Taxable-equivalent net interest income declined $19 million, or 3%, to $720 million, in 2006 compared with 2005.
Noninterest income totaled $752 million in 2006, an increase of $156 million, or 26%, compared with the prior year. Corporate service fees increased 32% primarily due to fee income attributable to Harris Williams (acquisition completed in October 2005) and growth of treasury management fees. Improved trading results drove the 14% increase in other noninterest income.
Noninterest expense increased 14% compared with 2005. The increases in noninterest expense and full-time employees were primarily due to acquisition activity, customer growth, continuing investments, and the increase in the commercial mortgage servicing portfolio.
See the additional revenue discussion regarding treasury management, capital markets and Midland Loan Services under the caption Product Revenue on page 25.
40
BLACKROCK
Our BlackRock business segment earned $187 million in 2006 and $152 million in 2005. For this PNC business segment presentation, our share of MLIM transaction integration costs for 2006 have been reclassified from BlackRock to “Other.” In addition, these business segment earnings have been reduced by minority interest in income of BlackRock, excluding MLIM transaction integration costs, totaling $65 million and $71 million in 2006 and 2005, respectively. Also, these business segment earnings are net of additional PNC income taxes recorded on PNC’s share of BlackRock’s earnings.
PNC’s BlackRock business segment earnings increased $35 million, or 23%, compared with 2005. We have modified the presentation of historical BlackRock business segment results as described above to conform with the current business segment reporting presentation in this Item 7. Higher earnings in 2006 reflected higher investment advisory and administrative fees due to an increase in assets under management, including BlackRock’s acquisition of MLIM at the end of the third quarter of 2006 as further discussed below.
PNC’s investment in BlackRock was $3.9 billion at December 31, 2006. Based upon BlackRock’s closing market price of $151.90 per common share at December 31, 2006, the market value of our investment in BlackRock was approximately $6.7 billion at that date. As such, an additional $2.8 billion of value was not recognized in our investment account at that date.
BLACKROCK/MLIM TRANSACTION
On September 29, 2006, Merrill Lynch contributed its investment management business to BlackRock in exchange for 65 million shares of newly issued BlackRock common and preferred stock. BlackRock accounted for the MLIM transaction under the purchase method of accounting.
Immediately following the closing, PNC continued to own approximately 44 million shares of BlackRock common stock, representing an ownership interest of approximately 34% of the combined company after the closing (as compared with 69% immediately prior to the closing). Although PNC’s share ownership percentage declined, PNC’s investment in BlackRock increased due to the increase in total equity recorded by BlackRock as a result of the MLIM transaction.
Upon the closing of the BlackRock/MLIM transaction, the carrying value of our investment in BlackRock increased by approximately $3.1 billion to $3.8 billion, primarily reflecting PNC’s portion of the increase in BlackRock’s equity resulting from the value of shares issued in that transaction.
We also recorded a liability at September 30, 2006 for deferred taxes of approximately $.9 billion, related to the excess of the book value over the tax basis of our investment in BlackRock, and a liability of approximately $.6 billion related to our obligation to provide shares of BlackRock
common stock to help fund BlackRock LTIP programs described below. The LTIP liability will be adjusted quarterly based on changes in BlackRock’s common stock price and the number of remaining committed shares. Accordingly, at each quarter-end PNC will record a charge to earnings if the market price of BlackRock’s common stock increases and will record a credit to earnings if BlackRock’s stock price declines.
The overall balance sheet impact of the BlackRock/MLIM transaction was an increase to our shareholders’ equity of approximately $1.6 billion. The increase to equity was comprised of an after-tax gain of approximately $1.3 billion, net of the expense associated with the LTIP liability and the deferred taxes, and an after-tax increase to capital surplus of approximately $.3 billion. The recognition of the gain is consistent with our existing accounting policy for the sale or issuance by subsidiaries of their stock to third parties. The gain represents the difference between our basis in BlackRock stock prior to the BlackRock/MLIM transaction and the new book value per share and resulting increase in value of our investment realized from the transaction. The direct increase to capital surplus rather than inclusion in the gain resulted from the accounting treatment required due to existing BlackRock repurchase commitments or programs.
For 2005 and the nine months ended September 30, 2006, our Consolidated Income Statement included our former approximately 69% - 70% ownership interest in BlackRock’s net income through the closing date. However, beginning September 30, 2006, our Consolidated Balance Sheet no longer reflected the consolidation of BlackRock’s balance sheet but recognized our ownership interest in BlackRock as an investment accounted for under the equity method. This accounting has resulted in a reduction in certain revenue and noninterest expense categories on PNC’s Consolidated Income Statement as our share of BlackRock’s net income is now reported within asset management noninterest income.
BLACKROCK LTIP PROGRAMS
BlackRock adopted the 2002 LTIP program to help attract and retain qualified professionals. At that time, we agreed to transfer 4 million of the shares of BlackRock common stock then held by us to fund the 2002 and future programs approved by BlackRock’s board of directors, subject to certain conditions and limitations. PNC’s noninterest income in the fourth quarter of 2006 included a $12 million charge related to our commitment to fund BlackRock LTIP programs. This charge represents the mark-to-market of our BlackRock LTIP obligation as of December 31, 2006 and is a result of the fourth quarter increase in the market value of BlackRock common shares. This increase in price also increased the unrecognized value of our investment in BlackRock at December 31, 2006 by approximately $128 million.
Prior to 2006, BlackRock granted awards under the 2002 LTIP program of approximately $230 million, of which approximately $210 million was paid on January 30, 2007.
41
The awards were funded by approximately 17% in cash from BlackRock and the remainder in BlackRock common stock transferred by us and distributed to LTIP participants (approximately 1 million shares). As permitted under the award agreements, employees elected to put approximately 95% of the stock portion of the awards back to BlackRock. These shares were retained by BlackRock as treasury stock.
We recognized a pretax gain of approximately $82 million in the first quarter of 2007 from the transfer of BlackRock shares to satisfy the majority of our 2002 LTIP obligation. The gain reflected the excess of market value over book value of approximately 1 million shares transferred in January 2007. We also expect to recognize a loss in the first quarter of 2007 on the mark-to-market adjustment on our remaining 3 million LTIP shares obligation. Each of these items will be recorded in noninterest income.
BlackRock granted additional restricted stock unit awards in January 2007, all of which are subject to achieving earnings performance goals prior to the vesting date of September 29, 2011. Of the shares of BlackRock common stock that we have agreed to transfer to fund their LTIP programs, approximately 1.6 million shares have been committed to fund the restricted stock unit awards vesting in 2011 and the amount remaining would then be available for future awards.
While we may continue to see volatility in earnings as we mark to market our LTIP shares obligation each quarter-end, we will not be able to recognize additional gains, if applicable, for the difference between the market value and the book value of the committed BlackRock common shares until the shares are distributed to LTIP participants. As of January 31, 2007, when the BlackRock closing market price was $167.76 per share, the unrecognized value related to the remaining 3 million LTIP shares was approximately $225 million and the unrecognized value of our total BlackRock investment was approximately $3.4 billion.
42
PFPC
| | | | | | |
Year ended December 31 Dollars in millions except as noted | | 2006 | | | 2005 | |
INCOME STATEMENT | | | | | | |
Servicing revenue | | $747 | | | $732 | |
Distribution/out-of-pocket revenue | | 170 | | | 147 | |
Other revenue | | | | | 10 | |
Total operating revenue | | 917 | | | 889 | |
Operating expense | | 519 | | | 524 | |
Distribution/out-of-pocket expenses | | 170 | | | 147 | |
Amortization of other intangibles, net | | 14 | | | 14 | |
Total expense | | 703 | | | 685 | |
Operating income | | 214 | | | 204 | |
Debt financing | | 42 | | | 38 | |
Nonoperating income (expense)(a) | | 4 | | | (5 | ) |
Pretax earnings | | 176 | | | 161 | |
Income taxes | | 52 | | | 57 | |
Earnings | | $124 | | | $104 | |
PERIOD-END BALANCE SHEET | | | | | | |
Goodwill and other intangible assets | | $1,012 | | | $1,025 | |
Other assets | | 1,192 | | | 1,103 | |
Total assets | | $2,204 | | | $2,128 | |
Debt financing | | $792 | | | $890 | |
Other liabilities | | 917 | | | 864 | |
Shareholder’s equity | | 495 | | | 374 | |
Total funds | | $2,204 | | | $2,128 | |
PERFORMANCE RATIOS | | | | | | |
Return on average equity | | 29 | % | | 32 | % |
Operating margin(b) | | 23 | | | 23 | |
Operating margin, as adjusted(c) | | 29 | | | 27 | |
SERVICING STATISTICS(d) | | | | | | |
Accounting/administration net fund assets(INBILLIONS)(e) | | | | | | |
Domestic | | $746 | | | $754 | |
Offshore | | 91 | | | 81 | |
Total | | $837 | | | $835 | |
Asset type(in billions) | | | | | | |
Money market | | $281 | | | $361 | |
Equity | | 354 | | | 305 | |
Fixed income | | 117 | | | 104 | |
Other | | 85 | | | 65 | |
Total | | $837 | | | $835 | |
Custody fund assets(in billions) | | $427 | | | $476 | |
Shareholder accounts(in millions) | | | | | | |
Transfer agency | | 18 | | | 19 | |
Subaccounting | | 50 | | | 43 | |
Total | | 68 | | | 62 | |
OTHERINFORMATION | | | | | | |
Full-time employees(d) | | 4,381 | | | 4,391 | |
| (a) | Net of nonoperating expense. |
| (b) | Total operating income divided by total operating revenue. |
| (c) | Reconciliation of reported amounts to amounts used in the non-GAAP calculation of the operating margin, as adjusted: |
| | | | | | |
| Total operating revenue | | $917 | | $889 |
Less: PFPC distribution/out-of-pocket revenue | | | 170 | | | 147 |
Total operating revenue, as adjusted | | $ | 747 | | $ | 742 |
Total expense | | $ | 703 | | $ | 685 |
Less: PFPC distribution/out-of-pocket expenses | | | 170 | | | 147 |
Total expense, as adjusted | | $ | 533 | | $ | 538 |
Total operating income, as adjusted | | $ | 214 | | $ | 204 |
PFPC distribution/out-of-pocket revenue and expenses are marketing, sales and servicing fees that we collect from pooled investment fund accounts and pass along to our fund clients. We do not earn any margin on this activity. Therefore, we believe that presenting the operating margin ratio as adjusted for these amounts, as well as the GAAP basis operating margin ratio, may be of assistance to shareholders, investor analysts, regulators and others in their evaluation of PFPC’s performance.
| (e) | Includes alternative investment net assets serviced. |
PFPC’s earnings of $124 million in 2006 increased $20 million, or 19%, compared with $104 million in 2005. Earnings for 2006 included the impact of a $14 million reversal of deferred taxes related to earnings from a foreign subsidiary following management’s determination that the earnings would be indefinitely reinvested outside of the United States. Earnings for 2005 included the after-tax impact of a one time termination fee of $6 million and a prepayment penalty of $5 million, along with $4 million of various tax benefits. Higher earnings in 2006 reflected servicing revenue contributions from several growth areas of the business and the successful implementation of expense control initiatives.
Highlights of PFPC’s performance in 2006 included:
| | • | | Offshore revenues increased 22% compared with 2005 fueled by new business in the alternative investment arena. |
| | • | | Managed account service revenue increased 29% as assets serviced increased by 71%. |
| | • | | Subaccounting revenues were up 15% as shareholder accounts in this area grew from 43 million to 50 million during the year. |
Servicing revenue for 2006 increased $15 million over 2005, to $747 million. Revenue increases related to offshore activities, custody, managed account services, subaccounting and securities lending drove the higher servicing revenue in 2006, partially offset by a decline in fund accounting and transfer agency revenue due to loss of clients and price concessions.
Operating expense declined $5 million, to $519 million, in 2006 compared with 2005. The decline was attributable to expense control and efficiencies implemented during the past year that resulted in a lower head count and associated lower compensation costs.
43
The impacts of distribution/out-of-pocket revenue and expenses entirely offset each other and have no net effect on PFPC’s earnings. The increases in these line items reflect the increased 12b-1 fees (marketing, sales and servicing fees associated with investment funds) during the fourth quarter of 2006 received by PFPC from fund accounts and then passed on to PFPC’s fund clients as a result of the BlackRock/MLIM transaction.
The decrease in custody fund assets at December 31, 2006 compared with December 31, 2005 resulted primarily from the deconversion of a major client during the first quarter of 2006, which was partially offset by new business, asset inflows from existing customers, and equity market appreciation. Subaccounting shareholder accounts serviced by PFPC increased over the year-earlier period due to net new business and growth in existing client accounts. Total assets serviced by PFPC amounted to $2.2 trillion at December 31, 2006 and $1.9 trillion at December 31, 2005.
CRITICAL ACCOUNTING POLICIES AND JUDGMENTS
Our consolidated financial statements are prepared by applying certain accounting policies. Note 1 Accounting Policies in the Notes To Consolidated Financial Statements in Item 8 of this Report describes the most significant accounting policies that we use. Certain of these policies require us to make estimates and strategic or economic assumptions that may prove inaccurate or be subject to variations that may significantly affect our reported results and financial position for the period or in future periods.
We must use estimates, assumptions, and judgments when financial assets and liabilities are required to be recorded at, or adjusted to reflect, fair value. Assets and liabilities carried at fair value inherently result in a higher degree of financial statement volatility. Fair values and the information used to record valuation adjustments for certain assets and liabilities are based on either quoted market prices or are provided by other independent third-party sources, when available. When such third-party information is not available, we estimate fair value primarily by using cash flow and other financial modeling techniques. Changes in underlying factors, assumptions, or estimates in any of these areas could materially impact our future financial condition and results of operations.
Allowances For Loan And Lease Losses And Unfunded Loan Commitments And Letters Of Credit
We maintain allowances for loan and lease losses and unfunded loan commitments and letters of credit at levels that we believe to be adequate to absorb estimated probable credit losses inherent in the loan portfolio. We determine the adequacy of the allowances based on periodic evaluations of the loan and lease portfolios and other relevant factors. However, this evaluation is inherently subjective as it requires material estimates, all of which may be susceptible to significant change, including, among others:
| | • | | Expected default probabilities, |
| | • | | Amounts and timing of expected future cash flows on impaired loans, |
| | • | | Estimated losses on consumer loans and residential mortgages, and |
| | • | | Amounts for changes in economic conditions and potential estimation or judgmental imprecision. |
In determining the adequacy of the allowance for loan and lease losses, we make specific allocations to significant impaired loans, to pools of watchlist and nonwatchlist loans and to consumer and residential mortgage loans. We also allocate reserves to provide coverage for probable losses not covered in specific, pool and consumer reserve methodologies related to qualitative and measurement factors. While
44
allocations are made to specific loans and pools of loans, the total reserve is available for all credit losses.
Commercial loans are the largest category of credits and are the most sensitive to changes in assumptions and judgments underlying the determination of the allowance for loan and lease losses. We have allocated approximately $443 million, or 79%, of the allowance for loan and lease losses at December 31, 2006 to the commercial loan category. Consumer and residential mortgage loan allocations are made at a total portfolio level based on historical loss experience adjusted for portfolio activity. Approximately $35 million, or 6.3%, of the allowance for loan and lease losses at December 31, 2006 have been allocated to these loans. The remainder of the allowance is allocated primarily to commercial real estate and lease financing loans.
To the extent actual outcomes differ from our estimates, additional provision for credit losses may be required that would reduce future earnings. See the following for additional information:
| | • | | Allowances For Loan And Lease Losses And Unfunded Loan Commitments And Letters Of Credit in the Credit Risk Management section of this Item 7 (which includes an illustration of the estimated impact on the aggregate of the allowance for loan and lease losses and allowance for unfunded loan commitments and letters of credit assuming we increased pool reserve loss rates for certain loan categories), and |
| | • | | In Item 8 of this Report, Note 8 Asset Quality in the Notes To Consolidated Financial Statements, and Allocation Of Allowance For Loan And Lease Losses in the Statistical Information (Unaudited) section. |
Private Equity Asset Valuation
At December 31, 2006, private equity investments carried at estimated fair value totaled $463 million compared with $449 million at December 31, 2005. We value private equity assets at each balance sheet date based primarily on either, in the case of limited partnership investments, the financial statements received from the general partner which reflect fair value or, for direct investments, the estimated fair value of the investments. There is a time lag in our receipt of the financial information that is the primary basis for the valuation of our limited partnership interests. We recognized in the fourth quarter of 2006 valuation changes related to limited partnership investments that reflected the impact of third quarter 2006 market conditions and performance of the underlying companies.
Due to the nature of the direct investments, we must make assumptions as to future performance, financial condition, liquidity, availability of capital, and market conditions, among others, to determine the estimated fair value of the investments. The valuation procedures that we apply to direct investments include techniques such as cash flow multiples for the entity, independent appraisals of the value of the entity
or the pricing used to value the entity in a recent financing transaction.
We value affiliated partnership interests based on the underlying investments of the partnership utilizing procedures consistent with those applied to direct investments.
We reflect changes in the value of equity management investments in our results of operations. Market conditions and actual performance of the companies that we invest in could differ from these assumptions, resulting in lower valuations that could reduce earnings in future periods. Accordingly, the valuations may not represent amounts that will ultimately be realized from these investments.
Lease Residuals
We provide financing for various types of equipment, aircraft, energy and power systems, and rolling stock through a variety of lease arrangements. Direct financing leases are carried at the sum of lease payments and the estimated residual value of the leased property, less unearned income. Residual value insurance or guarantees by governmental entities cover a significant portion of the residual value. Residual values are subject to judgments as to the value of the underlying equipment that can be affected by changes in economic and market conditions and the financial viability of the residual guarantors and insurers. To the extent not guaranteed or assumed by a third party, or otherwise insured against, we bear the risk of ownership of the leased assets. This includes the risk that the actual value of the leased assets at the end of the lease term will be less than the residual value, which could result in an impairment charge and reduce earnings in the future. These residual values are reviewed for impairment on a quarterly basis.
Goodwill
Goodwill arising from business acquisitions represents the value attributable to unidentifiable intangible elements in the business acquired. Most of our goodwill relates to value inherent in the fund servicing, Retail Banking and Corporate & Institutional Banking businesses. The value of this goodwill is dependent upon our ability to provide quality, cost effective services in the face of competition from other market participants on a national and international basis. We also rely upon continuing investments in processing systems, the development of value-added service features, and the ease of access to our services.
As such, goodwill value is supported ultimately by earnings, which is driven by the volume of business transacted and, for certain businesses, the market value of assets under administration or for which processing services are provided. Lower earnings resulting from a lack of growth or our inability to deliver cost-effective services over sustained periods can lead to impairment of goodwill, which could result in a charge and reduced earnings in the future. At least annually, management evaluates events or changes in circumstances that may indicate impairment in the carrying
45
amount of goodwill. See Note 9 Goodwill and Other Intangible Assets in the Notes To Consolidated Financial Statements in Item 8 of this Report for additional information.
Revenue Recognition
We derive net interest and noninterest income from various sources, including:
| | • | | Asset management and fund servicing, |
| | • | | Merger and acquisition advisory services, |
| | • | | Sale of loans and securities, |
| | • | | Certain private equity activities, and |
| | • | | Securities and derivatives trading activities including foreign exchange. |
We also earn fees and commissions from issuing loan commitments, standby letters of credit and financial guarantees, selling various insurance products, providing treasury management services and participating in certain capital markets transactions.
The timing and amount of revenue that we recognize in any period is dependent on estimates, judgments, assumptions, and interpretation of contractual terms. Changes in these factors can have a significant impact on revenue recognized in any period due to changes in products, market conditions or industry norms.
Income Taxes
In the normal course of business, we and our subsidiaries enter into transactions for which the tax treatment is unclear or subject to varying interpretations. In addition, filing requirements, methods of filing and the calculation of taxable income in various state and local jurisdictions are subject to differing interpretations.
We evaluate and assess the relative risks and merits of the appropriate tax treatment of transactions, filing positions, filing methods and taxable income calculations after considering statutes, regulations, judicial precedent, and other information, and maintain tax accruals consistent with our evaluation of these relative risks and merits. The result of our evaluation and assessment is by its nature an estimate. We and our subsidiaries are routinely subject to audit and challenges from taxing authorities. In the event we resolve a challenge for an amount different than amounts previously accrued, we will account for the difference in the period in which we resolve the matter.
Our tax treatment of certain leasing transactions is currently being challenged by the IRS, as described in greater detail in Cross-Border Leases and Related Tax and Accounting Matters in the Consolidated Balance Sheet Review section of this Item 7.
RECENT ACCOUNTING
PRONOUNCEMENTS
See Note 1 Accounting Policies in the Notes To Consolidated Financial Statements in Item 8 of this Report for additional information on the following recent accounting pronouncements that are relevant to our business, including a description of each new pronouncement, the required date of adoption, our planned date of adoption, and the expected impact on our consolidated financial statements. All of the following pronouncements were issued by the FASB unless otherwise noted.
The following was issued in 2007:
| | • | | SFAS 159, “The Fair Value Option for Financial Assets and Financial Liabilities – Including an amendment of FASB Statement No. 115” |
The following were issued during 2006:
| | • | | SFAS 158, “Employers’ Accounting for Defined Benefit Pension and Other Postretirement Benefit Plans – an amendment of FASB Statements No. 87, 88, 106 and 132(R)” |
| | • | | SFAS 157, “Fair Value Measurements” |
| | • | | SFAS 156, “Accounting for Servicing of Financial Assets – an amendment of FASB Statement No. 140” |
| | • | | SFAS 155, “Accounting for Certain Hybrid Financial Instruments – an amendment of FASB Statements No. 133 and 140” |
| | • | | FASB Interpretation (“FIN”) No. 48, “Accounting for Uncertainty in Income Taxes – an interpretation of FASB Statement No. 109” |
| | • | | FASB Staff Position No. (“FSP”) FAS 13-2, “Accounting for a Change or Projected Change in the Timing of Cash Flows Relating to Income Taxes Generated by a Leveraged Lease Transaction” |
Issued during 2005 with an effective date in 2006:
| | • | | In June 2005, the FASB’s Emerging Issues Task Force (“EITF”) issued EITF Issue 04-5, “Determining Whether a General Partner, or the General Partners as a Group, Controls a Limited Partnership or Similar Entity When the Limited Partners Have Certain Rights” |
STATUS OF DEFINED BENEFIT
PENSION PLAN
We have a noncontributory, qualified defined benefit pension plan (“plan” or “pension plan”) covering eligible employees. Benefits are derived from a cash balance formula based on compensation levels, age and length of service. Pension contributions are based on an actuarially determined amount necessary to fund total benefits payable to plan participants. Plan assets are currently approximately 60% invested in equity investments with most of the remainder invested in
46
fixed income instruments. Plan fiduciaries determine and review the plan’s investment policy.
We calculate the expense associated with the pension plan in accordance with SFAS 87, “Employers’ Accounting for Pensions,” and we use assumptions and methods that are compatible with the requirements of SFAS 87, including a policy of reflecting trust assets at their fair market value. On an annual basis, we review the actuarial assumptions related to the pension plan, including the discount rate, rate of compensation increase and the expected return on plan assets. Neither the discount rate nor the compensation increase assumptions significantly affect pension expense.
The expected long-term return on assets assumption does significantly affect pension expense. We decreased the expected long-term return on plan assets from the 8.50% used for 2005 to 8.25% for determining net periodic pension cost for 2006. Under current accounting rules, the difference between expected long-term returns and actual returns is accumulated and amortized to pension expense over future periods. Each one percentage point difference in actual return compared with our expected return causes expense in the following year to change by approximately $3 million.
The table below reflects the estimated effects on pension expense of certain changes in assumptions, using 2007 estimated expense as a baseline.
| | | |
Change in Assumption | | Estimated
Increase to 2007
Pension
Expense (In millions) |
.5% decrease in discount rate | | $ | 2 |
.5% decrease in expected long-term return on assets | | $ | 8 |
.5% increase in compensation rate | | $ | 2 |
We currently estimate a pretax pension benefit of $33 million in 2007 compared with a pretax benefit of $12 million in 2006.
In September 2006, the FASB issued SFAS 158, “Employers’ Accounting for Defined Benefit Pension and Other Postretirement Plans – an amendment of FASB Statements No. 87, 88, 106 and 132 (R).” This statement affects the accounting and reporting for our qualified pension plan, our nonqualified retirement plans, our postretirement welfare benefit plans, and our postemployment benefit plans. SFAS 158 requires recognition on the balance sheet of the over- or underfunded position of these plans as the difference between the fair value of plan assets and the related benefit obligations. To the extent that a plan’s net funded status differs from the amounts currently recognized on the balance sheet, the difference, net of tax, will be recorded as a part of accumulated other comprehensive income or loss (“AOCI”) within the shareholders’ equity section of the balance sheet.
This guidance also requires the recognition of any unrecognized actuarial gains and losses and unrecognized prior services costs to AOCI, net of tax. Post-adoption changes in unrecognized actuarial gains and losses as well as unrecognized prior service costs will be recognized in other comprehensive income, net of tax. The year-end 2006 adjustment to our plans’ funded status for all unamortized net actuarial losses and prior service costs was $132 million after tax. SFAS 158 was effective for PNC as of December 31, 2006, with no restatements permitted for prior year-end reporting periods.
Plan asset investment performance has the most impact on contribution requirements. However, contribution requirements are not particularly sensitive to actuarial assumptions. Investment performance will drive the amount of permitted contributions in future years. Also, current law, including the provisions of the Pension Protection Act of 2006, sets limits as to both minimum and maximum contributions to the plan. In any event, any large near-term contributions to the plan will be at our discretion, as we expect that the minimum required contributions under the law will be minimal or zero for several years.
During the second quarter of 2005, we acquired a frozen defined benefit pension plan as a result of the Riggs acquisition. Plan assets and projected benefit obligations of the Riggs plan were approximately $107 million and $116 million, respectively, at acquisition date. The $9 million funding deficit was recognized as part of the Riggs acquisition purchase price allocation. For determining contribution amounts to the plan, deficits are calculated using ERISA-mandated rules, and on this basis we contributed approximately $16 million to the Riggs plan during the third quarter of 2005. We integrated the Riggs plan into the PNC plan on December 30, 2005.
We maintain other defined benefit plans that have a less significant effect on financial results, including various nonqualified supplemental retirement plans for certain employees. See Note 17 Employee Benefit Plans in the Notes To Consolidated Financial Statements in Item 8 of this Report for additional information.
RISK MANAGEMENT
We encounter risk as part of the normal course of our business and we design risk management processes to help manage these risks. This Risk Management section first provides an overview of the risk measurement, control strategies, and monitoring aspects of our corporate-level risk management processes. Following that discussion is an analysis of the risk management process for what we view as our primary areas of risk: credit, operational, liquidity, and market. The discussion of market risk is further subdivided into interest rate, trading, and equity and other investment risk areas. Our use of financial derivatives as part of our overall asset and liability
47
risk management process is also addressed within the Risk Management section of this Item 7. In appropriate places within this section, historical performance is also addressed.
OVERVIEW
As a financial services organization, we take a certain amount of risk in every business decision. For example, every time we open an account or approve a loan for a customer, process a payment, hire a new employee, or implement a new computer system, we incur a certain amount of risk. As an organization, we must balance revenue generation and profitability with the risks associated with our business activities. Risk management is not about eliminating risks, but about identifying and accepting risks and then effectively managing them so as to optimize shareholder value.
The key to effective risk management is to be proactive in identifying, measuring, evaluating, and monitoring risk on an ongoing basis. Risk management practices support decision-making, improve the success rate for new initiatives, and strengthen the market’s confidence in an organization.
CORPORATE-LEVEL RISK MANAGEMENT OVERVIEW
We support risk management through a governance structure involving the Board, senior management and a corporate risk management organization.
Although our Board as a whole is responsible generally for oversight of risk management, committees of the Board provide oversight to specific areas of risk with respect to the level of risk and risk management structure.
We use management level risk committees to help ensure that business decisions are executed within our desired risk profile. The Executive Risk Management Committee (“ERMC”), consisting of senior management executives, provides oversight for the establishment and implementation of new comprehensive risk management initiatives, reviews enterprise level risk profiles and discusses key risk issues.
The corporate risk management organization has the following key roles:
| | • | | Facilitate the identification, assessment and monitoring of risk across PNC, |
| | • | | Provide support and oversight to the businesses, and |
| | • | | Identify and implement risk management best practices, as appropriate. |
Risk Measurement
We conduct risk measurement activities specific to each area of risk. The primary vehicle for aggregation of enterprise-wide risk is a comprehensive risk management methodology that is based on economic capital. This primary risk aggregation measure is supplemented with secondary measures of risk to arrive at an estimate of enterprise-wide risk. The economic capital framework is a measure of potential losses above and beyond expected losses. Potential one year losses are
capitalized to a level commensurate with a financial institution with an A rating by the credit rating agencies. Economic capital incorporates risk associated with potential credit losses (Credit Risk), fluctuations of the estimated market value of financial instruments (Market Risk), failure of people, processes or systems (Operational Risk), and income losses associated with declining volumes, margins and/or fees, and the fixed cost structure of the business (Business Risk). We estimate credit and market risks at an exposure level while we estimate the remaining risk types at an institution or business segment level. We routinely compare the output of our economic capital model with industry benchmarks.
Risk Control Strategies
We centrally manage policy development and exception oversight through corporate-level risk management. Corporate risk management is authorized to take action to either prevent or mitigate exceptions to policies and is responsible for monitoring compliance with risk management policies. The Corporate Audit function performs an independent assessment of the internal control environment. Corporate Audit plays a critical role in risk management, testing the operation of the internal control system and reporting findings to management and to the Audit Committee of the Board.
Risk Monitoring
Corporate risk management reports on a regular basis to our Board regarding the enterprise risk profile of the Corporation. These reports aggregate and present the level of risk by type of risk and communicate significant risk issues, including performance relative to risk tolerance limits. Both the Board and the ERMC provide guidance on actions to address key risk issues as identified in these reports.
CREDIT RISK MANAGEMENT
Credit risk represents the possibility that a customer, counterparty or issuer may not perform in accordance with contractual terms. Credit risk is inherent in the financial services business and results from extending credit to customers, purchasing securities, and entering into financial derivative transactions. Credit risk is one of the most common risks in banking and is one of our most significant risks.
Approved risk tolerances, in addition to credit policies and procedures, set portfolio objectives for the level of credit risk. We have established guidelines for acceptable levels of total borrower exposure, problem loans, and other credit measures. We seek to achieve our credit portfolio objectives by maintaining a customer base that is diverse in borrower exposure and industry types. We use loan participations with third parties, loan sales and syndications, and the purchase of credit derivatives to reduce risk concentrations.
The credit granting businesses maintain direct responsibility for monitoring credit risk within PNC. The Corporate Credit Policy area provides independent oversight to the measurement, monitoring and reporting of our credit risk and
48
reports to the Chief Risk Officer. Corporate Audit also provides an independent assessment of the effectiveness of the credit risk management process.
Nonperforming, Past Due And Potential Problem Assets
See the Nonperforming Assets And Related Information table in the Statistical Information (Unaudited) section of Item 8 of this Report and included here by reference for details of the types of nonperforming assets that we held at December 31, 2006, 2005, 2004, 2003 and 2002. In addition, certain performing assets that have interest payments that are past due or have the potential for future repayment problems.
Total nonperforming assets at December 31, 2006 decreased $45 million, to $171 million, compared with the prior year-end as nonperforming loans declined $43 million in the comparison.
The amount of nonperforming loans that was current as to principal and interest was $59 million at December 31, 2006 and $115 million at December 31, 2005. While we believe that overall asset quality will remain strong for the near term, the current level of asset quality is not sustainable for the foreseeable future.
Nonperforming Assets By Business
| | | | | | |
| In millions | | December 31
2006 | | December 31
2005 |
Retail Banking | | $ | 106 | | $ | 90 |
Corporate & Institutional Banking | | | 63 | | | 124 |
Other | | | 2 | | | 2 |
Total nonperforming assets | | $ | 171 | | $ | 216 |
Change In Nonperforming Assets
| | | | | | |
| In millions | | 2006 | | | 2005 | |
January 1 | | $216 | | | $175 | |
Transferred from accrual | | 225 | | | 340 | |
Returned to performing | | (17 | ) | | (10 | ) |
Principal reductions and payoffs | | (116 | ) | | (183 | ) |
Asset sales | | (17 | ) | | (16 | ) |
Charge-offs and valuation adjustments | | (120 | ) | | (90 | ) |
December 31 | | $171 | | | $216 | |
Accruing Loans And Loans Held For Sale Past Due 90 Days Or More
| | | | | | | | | | |
| | | Amount | | Percent of Total
Outstandings | |
Dollars in millions | | Dec. 31
2006 | | Dec. 31
2005 | | Dec. 31
2006 |
| | Dec. 31
2005 |
|
Commercial | | $9 | | $12 | | .04 | % | | .06 | % |
Commercial real estate | | 5 | | 2 | | .14 | | | .06 | |
Consumer | | 28 | | 22 | | .17 | | | .14 | |
Residential mortgage | | 7 | | 10 | | .11 | | | .14 | |
Other | | 1 | | | | .27 | | | | |
Total loans | | 50 | | 46 | | .10 | | | .09 | |
Loans held for sale | | 9 | | 47 | | .38 | | | 1.92 | |
Total loans and loans held for sale | | $59 | | $93 | | .11 | % | | .18 | % |
Loans that are not included in nonperforming or past due categories but cause us to be uncertain about the borrower’s ability to comply with existing repayment terms over the next six months totaled $41 million at December 31, 2006, compared with $67 million at December 31, 2005. Approximately 59% of these loans are in the Corporate & Institutional Banking portfolio.
Allowances For Loan And Lease Losses And Unfunded Loan Commitments And Letters Of Credit
We maintain an allowance for loan and lease losses to absorb losses from the loan portfolio. We determine the allowance based on quarterly assessments of the probable estimated losses inherent in the loan portfolio. While we make allocations to specific loans and pools of loans, the total reserve is available for all loan and lease losses.
In addition to the allowance for loan and lease losses, we maintain an allowance for unfunded loan commitments and letters of credit. We report this allowance as a liability on our Consolidated Balance Sheet. We determine this amount using estimates of the probability of the ultimate funding and losses related to those credit exposures. This methodology is similar to the one we use for determining the adequacy of our allowance for loan and lease losses.
We refer you to Note 8 Asset Quality in the Notes To Consolidated Financial Statements in Item 8 of this Report regarding changes in the allowance for loan and lease losses and in the allowance for unfunded loan commitments and letters of credit. Also see the Allocation Of Allowance For Loan And Lease Losses table in the Statistical Information (Unaudited) section of Item 8 of this Report for additional information included herein by reference.
We establish specific allowances for loans considered impaired using a method prescribed by SFAS 114,
49
“Accounting by Creditors for Impairment of a Loan.” All nonperforming loans are considered impaired under SFAS 114. Specific allowances for individual loans over a set dollar threshold are determined by our Special Asset Committee based on an analysis of the present value of expected future cash flows from the loans discounted at their effective interest rate, observable market price, or the fair value of the underlying collateral. We establish specific allowance on all other impaired loans based on the loss given default credit risk rating.
Allocations to non-impaired commercial and commercial real estate loans (pool reserve allocations) are assigned to pools of loans as defined by our business structure and are based on internal probability of default and loss given default credit risk ratings.
Key elements of the pool reserve methodology include:
| | • | | Probability of default (“PD”), which is based on historical default analyses and is derived from the borrower’s internal PD credit risk rating and expected loan term; |
| | • | | Exposure at default (“EAD”), which is derived from historical default data; and |
| | • | | Loss given default (“LGD”), which is based on historical loss data, collateral value and other structural factors that may affect our ultimate ability to collect on the loan and is derived from the loan’s internal LGD credit risk rating. |
Our pool reserve methodology is sensitive to changes in key risk parameters such as PDs, LGDs and EADs. In general, a given change in any of the major risk parameters will have a corresponding change in the pool reserve allocations for non-impaired commercial loans. Our commercial loans are the largest category of credits and are most sensitive to changes in the key risk parameters and pool reserve loss rates. To illustrate, if we increase the pool reserve loss rates by 5% for all categories of non-impaired commercial loans, then the aggregate of the allowance for loan and lease losses and allowance for unfunded loan commitments and letters of credit would increase by $29 million. Additionally, other factors such as the rate of migration in the severity of problem loans or changes in the maturity distribution of the loans will contribute to the final pool reserve allocations.
We make consumer (including residential mortgage) loan allocations at a total portfolio level by consumer product line based on historical loss experience. We compute a four-quarter average loss rate from net charge-offs for the prior four quarters as a percentage of the average loans outstanding in those quarters. We apply this loss rate to loans outstanding at the end of the current period to determine the consumer loan allocation.
Charge-Offs And Recoveries
| | | | | | | | | | | | | |
Year ended December 31
Dollars in millions | | Charge-offs | | Recoveries | | Net Charge-offs
(Recoveries) | | | Percent of
Average
Loans | |
2006 | | | | | | | | | | | | | |
Commercial | | $ | 108 | | $ | 19 | | $ | 89 | | | .44 | % |
Commercial real estate | | | 3 | | | 1 | | | 2 | | | .06 | |
Consumer | | | 52 | | | 15 | | | 37 | | | .23 | |
Residential mortgage | | | 3 | | | | | | 3 | | | .04 | |
Lease financing | | | 14 | | | 5 | | | 9 | | | .32 | |
Total | | $ | 180 | | $ | 40 | | $ | 140 | | | .28 | |
2005 | | | | | | | | | | | | | |
Commercial (a) | | $ | 52 | | $ | 82 | | $ | (30 | ) | | (.16 | )% |
Commercial real estate | | | 1 | | | 1 | | | | | | | |
Consumer | | | 45 | | | 15 | | | 30 | | | .19 | |
Residential mortgage | | | 2 | | | | | | 2 | | | .03 | |
Lease financing | | | 29 | | | 1 | | | 28 | | | .95 | |
Total | | $ | 129 | | $ | 99 | | $ | 30 | | | .06 | |
| (a) | Includes a $53 million loan recovery. |
We establish reserves to provide coverage for probable losses not considered in the specific, pool and consumer reserve methodologies, such as, but not limited to, industry concentrations and conditions, credit quality trends, recent loss experience in particular sectors of the portfolio, ability and depth of lending management, changes in risk selection and underwriting standards and the timing of available information. The amount of reserves for these qualitative factors is assigned to loan categories and to business segments primarily based on the relative specific and pool allocation amounts. The amount of reserve allocated for qualitative factors represented 8.0% of the total allowance and .09% of total loans at December 31, 2006.
The provision for credit losses for the year ended December 31, 2006 and the evaluation of the allowances for loan and lease losses and unfunded loan commitments and letters of credit as of December 31, 2006 reflected loan growth, changes in loan portfolio composition, the impact of refinements to our reserve methodology, and changes in asset quality. The provision includes amounts for probable losses on loans and credit exposure related to unfunded loan commitments and letters of credit.
We do not expect to sustain asset quality at its current level. However, based on the assets we currently hold and current business trends and activities, we believe that overall asset quality will remain strong by historical standards for at least the near term. This outlook, combined with expected loan growth, may result in an increase in the allowance for loan and lease losses in future periods.
The allowance as a percent of nonperforming loans was 381% and as a percent of total loans was 1.12% at December 31,
50
2006. The comparable percentages at December 31, 2005 were 314% and 1.21%.
CREDIT DEFAULT SWAPS
Credit default swaps provide, for a fee, an assumption by a third party of a portion of the credit risk related to the underlying financial instruments. We use the contracts to mitigate credit risk associated with commercial lending activities as well as proprietary derivative and convertible bond trading. Credit default swaps are included in the Free-Standing Derivatives table in the Financial Derivatives section of this Risk Management discussion. Net losses from credit default swaps are reflected in the Trading line item on our Consolidated Income Statement and were not significant in 2006 or 2005.
OPERATIONAL RISK MANAGEMENT
Operational risk is defined as the risk of financial loss or other damage to us resulting from inadequate or failed internal processes or systems, human factors, or from external events. Operational risk may occur in any of our business activities and manifests itself in various ways, including but not limited to the following:
| | • | | Errors related to transaction processing and systems, |
| | • | | Breaches of the system of internal controls and compliance requirements, and |
| | • | | Business interruptions and execution of unauthorized transactions and fraud by employees or third parties. |
Operational losses may arise from legal actions due to operating deficiencies or noncompliance with contracts, laws or regulations.
To monitor and control operational risk, we maintain a comprehensive framework including policies and a system of internal controls that is designed to manage risk and to provide management with timely and accurate information about the operations of PNC. Management at each business unit is primarily responsible for its operational risk management program, given that operational risk management is integral to direct business management and most easily effected at the business unit level. Corporate Operational Risk Management, reporting to the Chief Risk Officer, oversees day-to-day operational risk management activities.
Technology Risk
The technology risk management program is a significant component of the operational risk framework. We have an integrated security and technology risk management framework designed to help ensure a secure, sound, and compliant infrastructure for information management. The technology risk management process is aligned with the strategic direction of the businesses and is integrated into the technology management culture, structure and practices. The application of this framework across the enterprise helps to support comprehensive and reliable internal controls.
Our business resiliency program manages the organization’s capabilities to provide services in the case of an event that results in material disruption of business activities. Prioritization of investments in people, processes, technology and facilities are based on different types of events, business risk and criticality. Comprehensive testing validates our resiliency capabilities on an ongoing basis, and an integrated governance model is designed to help assure transparent management reporting.
Insurance
As a component of our risk management practices, we purchase insurance designed to protect us against accidental loss or losses which, in the aggregate, may significantly affect personnel, property, financial objectives, or our ability to continue to meet our responsibilities to our various stakeholder groups.
PNC, through subsidiary companies, Alpine Indemnity Limited and PNC Insurance Corp., participates as a direct writer for its general liability, automobile liability, workers’ compensation, property and terrorism programs. PNC’s risks associated with its participation as a direct writer for these programs are mitigated through policy limits and annual aggregate limits. Risks in excess of Alpine and PNC Insurance Corp. policy limits and annual aggregates are mitigated through the purchase of direct coverage provided by various insurers up to limits established by PNC’s Corporate Insurance Committee.
LIQUIDITY RISK MANAGEMENT
Liquidity risk is the risk of potential loss if we were unable to meet our funding requirements at a reasonable cost. We manage liquidity risk to help ensure that we can obtain cost-effective funding to meet current and future obligations under both normal “business as usual” and stressful circumstances.
Asset and Liability Management (“ALM”) is accountable for managing the liquidity position within the limits and guidelines set forth in our risk management policies. Market Risk Management provides independent oversight for the measurement, monitoring and reporting of PNC’s liquidity risk.
We typically maintain our liquidity position through:
| | • | | A large and stable deposit base derived from our retail and wholesale banking activities, |
| | • | | A portfolio of liquid investment securities, |
| | • | | Diversified sources of short-term and long-term wholesale funding, and |
| | • | | Significant unused borrowing capacity at both the Federal Home Loan Bank of Pittsburgh (“FHLB-Pittsburgh”) and the Federal Reserve discount window. |
Our largest source of liquidity on a consolidated basis is the deposit base that comes from our retail and wholesale banking
51
activities. Other borrowed funds come from a diverse mix of short and long-term funding sources. Liquid assets and unused borrowing capacity from a number of sources are also available to maintain our liquidity position. Liquid assets consist of short-term investments (federal funds sold, resale agreements and other short-term investments, including trading securities) and securities available for sale. At December 31, 2006, our liquid assets totaled $28.1 billion, with $10.6 billion pledged as collateral for borrowings, trust, and other commitments.
Bank Level Liquidity
PNC Bank, N.A. is a member of FHLB-Pittsburgh and as such has access to advances from FHLB-Pittsburgh secured generally by residential mortgages, other real estate related loans, and mortgage-backed securities. At December 31, 2006, we maintained significant unused borrowing capacity from the FHLB-Pittsburgh under current collateral requirements.
We can also obtain funding through alternative forms of borrowing, including federal funds purchased, repurchase agreements, and short and long-term debt issuances. In July 2004, PNC Bank, N.A. established a program to offer up to $20 billion in senior and subordinated unsecured debt obligations with maturities of more than nine months. Through December 31, 2006, PNC Bank, N.A. had issued $2.9 billion of debt under this program, including $500 million of 18-month floating rate notes, due January 2008, issued during the second quarter of 2006. None of the 2006 issuances outlined above is redeemable or subject to repayment at the option of the holder prior to maturity.
In December 2004, PNC Bank, N.A. established a program to offer up to $3.0 billion of its commercial paper. As of December 31, 2006, there were no issuances outstanding under this program.
Parent Company Liquidity
Our parent company’s routine funding needs consist primarily of dividends to PNC shareholders, share repurchases, debt service, the funding of non-bank affiliates, and acquisitions.
Parent company liquidity guidelines are designed to help ensure that sufficient liquidity is available to meet these requirements over the succeeding 12-month period. In managing parent company liquidity we consider funding sources, such as expected dividends to be received from PNC Bank, N.A. and potential debt issuance, and discretionary funding uses, the most significant of which is the external dividend to be paid on PNC’s stock.
The principal source of parent company cash flow is the dividends it receives from PNC Bank, N.A., which may be impacted by the following:
| | • | | Contractual restrictions, and |
Also, there are statutory and regulatory limitations on the ability of national banks to pay dividends or make other capital distributions or to extend credit to the parent company or its non-bank subsidiaries. We provide additional information on these limitations in Note 4 Regulatory Matters in the Notes To Consolidated Financial Statements included in Item 8 of this Report and include such information here by reference. Dividends may also be impacted by the bank’s capital needs and by contractual restrictions. The amount available for dividend payments to the parent company by PNC Bank, N.A. without prior regulatory approval was approximately $625 million at December 31, 2006.
In addition to dividends from PNC Bank, N.A., other sources of parent company liquidity include cash and short-term investments, as well as dividends and loan repayments from other subsidiaries and dividends or distributions from equity investments. As of December 31, 2006, the parent company had approximately $1.4 billion in funds available from its cash and short-term investments. During 2006, BlackRock dividends of approximately $74 million were paid to our intermediate bank holding company and were available for payment to the parent company.
We can also generate liquidity for the parent company and PNC’s non-bank subsidiaries through the issuance of securities in public or private markets.
| | • | | In October 2006, we issued $450 million of floating rate senior notes that mature in October 2008. Interest will be reset monthly to 1-month LIBOR plus 2 basis points and will be paid monthly. |
| | • | | In December 2006, we issued $1 billion of floating-rate exchangeable senior notes due December 2036 through a private placement. Interest is reset quarterly to 3-month LIBOR less 40 basis points and is paid quarterly. See Note 13 Borrowed Funds in the Notes To Consolidated Financial Statements in Item 8 of this Report for further information on this issuance. |
During 2006, $1.1 billion of parent company senior debt matured, all during the third quarter. As of December 31, 2006, there were $566 million of parent company obligations with maturities of less than one year.
In December 2006, we elected to redeem all of the underlying Capital Securities related to the following trusts, totaling $453 million:
| | • | | PNC Capital Trust A ($350 million), |
| | • | | Riggs Trust I ($73 million), and |
| | • | | UNB Trust II ($30 million). |
At December 31, 2006, we had unused capacity under effective shelf registration statements of approximately
52
$150 million of debt or equity securities. In January 2007, we filed two new shelf registration statements which will enable us to issue additional debt and equity securities, including certain hybrid capital instruments.
During February 2007, in connection with our planned acquisition of Mercantile, we issued $1.9 billion of debt to fund the cash portion of this transaction, comprised of the following:
| | • | | On February 1, 2007, we issued $775 million of floating rate senior notes due January 2012. Interest will be reset quarterly to 3-month LIBOR plus 14 basis points and interest will be paid quarterly. |
| | • | | Also on February 1, 2007, we issued $500 million of floating rate senior notes due January 2014. Interest will be reset quarterly to 3-month LIBOR plus 20 basis points and will be paid quarterly. |
| | • | | On February 8, 2007, we issued $600 million of subordinated notes due February 2017. These notes pay interest semiannually at a fixed rate of 5.625%. |
We currently expect to issue additional debt or hybrid capital instruments in March 2007 for the remainder of the financing for our planned acquisition of Mercantile.
53
Commitments
The following tables set forth contractual obligations and various other commitments representing required and potential cash outflows as of December 31, 2006.
| | | | | | | | | | |
Contractual Obligations | | | | Payment Due By Period |
December 31, 2006 - in millions | | Total | | Less than
one year | | One to three
years | | Four to five
years | | After five
years |
Remaining contractual maturities of time deposits | | $19,024 | | $16,464 | | $994 | | $255 | | $1,311 |
Borrowed funds | | 15,028 | | 8,410 | | 2,298 | | 764 | | 3,556 |
Minimum annual rentals on noncancellable leases | | 965 | | 140 | | 233 | | 178 | | 414 |
Nonqualified pension and post retirement benefits | | 293 | | 30 | | 62 | | 63 | | 138 |
Purchase obligations (a) | | 320 | | 116 | | 111 | | 44 | | 49 |
Total contractual cash obligations | | $35,630 | | $25,160 | | $3,698 | | $1,304 | | $5,468 |
| (a) | Includes purchase obligations for goods and services covered by noncancellable contracts and contracts including cancellation fees. |
| | | | | | | | | | |
Other Commitments (a) | | Total
Amounts
Committed | | Amount Of Commitment Expiration By Period |
December 31, 2006 - in millions | | | Less than
one year | | One to three
years | | Four to five
years | | After five
years |
Loan commitments | | $44,835 | | $15,940 | | $18,728 | | $9,729 | | $438 |
Standby letters of credit | | 4,360 | | 2,375 | | 1,202 | | 716 | | 67 |
Other commitments (b) | | 239 | | 102 | | 56 | | 10 | | 71 |
Total commitments | | $49,434 | | $18,417 | | $19,986 | | $10,455 | | $576 |
| (a) | Other commitments are funding commitments that could potentially require performance in the event of demands by third parties or contingent events. Loan commitments are reported net of participations, assignments and syndications. |
| (b) | Includes equity funding commitments related to equity management and affordable housing. |
MARKET RISK MANAGEMENT OVERVIEW
Market risk is the risk of a loss in earnings or economic value due to adverse movements in market factors such as interest rates, credit spreads, foreign exchange rates, and equity prices. We are exposed to market risk primarily by our involvement in the following activities, among others:
| | • | | Traditional banking activities of taking deposits and extending loans, |
| | • | | Private equity and other investments and activities whose economic values are directly impacted by market factors, and |
| | • | | Trading in fixed income products, equities, derivatives, and foreign exchange, as a result of customer activities, underwriting, and proprietary trading. |
We have established enterprise-wide policies and methodologies to identify, measure, monitor, and report market risk. Market Risk Management provides independent oversight by monitoring compliance with these limits and guidelines, and reporting significant risks in the business to the Joint Risk Committee of the Board.
MARKET RISK MANAGEMENT – INTEREST RATE RISK
Interest rate risk results primarily from our traditional banking activities of gathering deposits and extending loans. Many factors, including economic and financial conditions, movements in interest rates, and consumer preferences, affect the difference between the interest that we earn on assets and the interest that we pay on liabilities. Because of repricing term mismatches and embedded options inherent in certain of
these products, changes in market interest rates not only affect expected near-term earnings, but the economic values of these assets and liabilities as well.
ALM centrally manages interest rate risk within limits and guidelines set forth in our risk management policies approved by the Asset and Liability Committee and the Joint Risk Committee of the Board.
Sensitivity results and market interest rate benchmarks for the years ended December 31, 2006 and December 31, 2005 follow:
Interest Sensitivity Analysis
| | | | | | | | |
| | | Fourth
Quarter 2006 | | | Fourth
Quarter 2005 | |
Net Interest Income Sensitivity Simulation | | | | | | |
Effect on net interest income in first year from gradual interest rate change over following 12 months of: | | | | | | |
100 basis point increase | | (2.6 | )% | | (.5 | )% |
100 basis point decrease | | 2.5 | % | | .2 | % |
Effect on net interest income in second year from gradual interest rate change over the preceding 12 months of: | | | | | | |
100 basis point increase | | (5.5 | )% | | (1.2 | )% |
100 basis point decrease | | 3.7 | % | | (1.1 | )% |
Duration of Equity Model | | | | | | |
Base case duration of equity (in years): | | 1.5 | | | .3 | |
Key Period-End Interest Rates | | | | | | |
One month LIBOR | | 5.32 | % | | 4.39 | % |
Three-year swap | | 5.10 | % | | 4.84 | % |
54
In addition to measuring the effect on net interest income assuming parallel changes in current interest rates, we routinely simulate the effects of a number of nonparallel interest rate environments. The following Net Interest Income Sensitivity To Alternative Rate Scenarios table reflects the percentage change in net interest income over the next two 12-month periods assuming (i) the PNC Economist’s most likely rate forecast, (ii) implied market forward rates, and (iii) a Two-Ten Inversion (a 200 basis point inversion between two-year and ten-year rates superimposed on current base rates) scenario. We are inherently sensitive to a flatter or inverted yield curve.
Net Interest Income Sensitivity To Alternative Rate Scenarios (as of December 31, 2006)
| | | | | | | | | |
| | | PNC
Economist | | | Market
Forward | | | Two-Ten
Inversion | |
First year sensitivity | | 2.3 | % | | 1.6 | % | | (6.6 | )% |
| | | |
Second year sensitivity | | 8.4 | % | | 4.9 | % | | (6.1 | )% |
All changes in forecasted net interest income are relative to results in a base rate scenario where current market rates are assumed to remain unchanged over the forecast horizon.
When forecasting net interest income, we make assumptions about interest rates and the shape of the yield curve, the volume and characteristics of new business, and the behavior of existing positions. These assumptions determine the future level of simulated net interest income in the base interest rate scenario and the other interest rate scenarios presented in the following table. These simulations assume that as assets and liabilities mature, they are replaced or repriced at market rates.
The graph below presents the yield curves for the base rate scenario and each of the alternative scenarios one year forward.
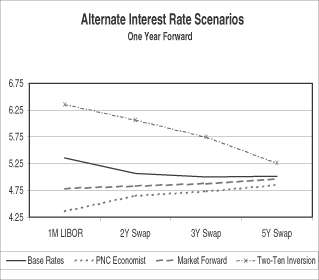
Our risk position has become increasingly liability sensitive in part due to the increase in market interest rates and in part due to our balance sheet management strategy. We believe that we have the deposit funding base and balance sheet flexibility to adjust, where appropriate, to changing interest rates and market conditions.
MARKET RISK MANAGEMENT – TRADING RISK
Our trading activities primarily include customer-driven trading in fixed income securities, equities, derivatives, and foreign exchange contracts. They also include the underwriting of fixed income and equity securities and proprietary trading.
We use value-at-risk (“VaR”) as the primary means to measure and monitor market risk in trading activities. The Joint Risk Committee of the Board establishes an enterprise-wide VaR limit on our trading activities.
During 2006, our VaR ranged between $3.8 million and $7.7 million, averaging $5.5 million.
To help ensure the integrity of the models used to calculate VaR for each portfolio and enterprise-wide, we use a process known as backtesting. The backtesting process consists of comparing actual observations of trading-related gains or losses against the VaR levels that were calculated at the close of the prior day. We would expect a maximum of two to three instances a year in which actual losses exceeded the prior day VaR measure. During 2006, there were no such instances at the enterprise-wide level.
The following graph shows a comparison of enterprise-wide trading-related gains and losses against prior day VaR for the period.
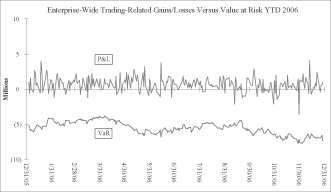
55
Total trading revenue for 2006, 2005 and 2004 was as follows:
| | | | | | | |
| Year end December 31 - in millions | | 2006 | | | 2005 | | 2004 |
Net interest income (expense) | | $(6 | ) | | $9 | | $13 |
Noninterest income | | 183 | | | 157 | | 113 |
Total trading revenue | | $177 | | | $166 | | $126 |
Securities underwriting and trading (a) | | $38 | | | $47 | | $48 |
Foreign exchange | | 55 | | | 39 | | 31 |
Financial derivatives | | 84 | | | 80 | | 47 |
Total trading revenue | | $177 | | | $166 | | $126 |
| (a) | Includes changes in fair value for certain loans accounted for at fair value. |
Average trading assets and liabilities consisted of the following:
| | | | | | |
| Year ended - in millions | | December 31 2006 | | December 31
2005 | | December 31
2004 |
Assets | | | | | | |
Securities (a) | | $1,712 | | $1,850 | | $871 |
Resale agreements (b) | | 623 | | 663 | | 166 |
Financial derivatives (c) | | 1,148 | | 772 | | 605 |
Loans at fair value (c) | | 128 | | | | |
Total assets | | $3,611 | | $3,285 | | $1,642 |
Liabilities | | | | | | |
Securities sold short (d) | | $965 | | $993 | | $275 |
Repurchase agreements and other borrowings (e) | | 833 | | 1,044 | | 249 |
Financial derivatives (f) | | 1,103 | | 825 | | 594 |
Borrowings at fair value (f) | | 31 | | | | |
Total liabilities | | $2,932 | | $2,862 | | $1,118 |
| (a) | Included in Interest-earning assets-Other on the Average Consolidated Balance Sheet And Net Interest Analysis. |
| (b) | Included in Federal funds sold and resale agreements. |
| (c) | Included in Noninterest-earning assets-Other. |
| (d) | Included in Other borrowed funds. |
| (e) | Included in Repurchase agreements and Other borrowed funds. |
| (f) | Included in Accrued expenses and other liabilities. |
MARKET RISK MANAGEMENT – EQUITY AND OTHER INVESTMENT RISK
Equity investment risk is the risk of potential losses associated with investing in both private and public equity markets. In addition to extending credit, taking deposits, and underwriting and trading financial instruments, we make and manage direct investments in a variety of transactions, including management buyouts, recapitalizations, and later-stage growth financings in a variety of industries. We also have investments in affiliated and non-affiliated funds that make similar investments in private equity and in debt and equity-oriented hedge funds. The economic and/or book value of these investments and other assets such as loan servicing rights are directly affected by changes in market factors.
The primary risk measurement for equity and other investments is economic capital. Economic capital is a common measure of risk for credit, market and operational risk. It is an estimate of the worst-case value depreciation over one year within a 99.9% confidence level. Given the illiquid
nature of many of these types of investments, it can be a challenge to determine their fair values. Market Risk Management and Finance provide independent oversight of the valuation process.
Various PNC business units manage our private equity and other investment activities. Our businesses are responsible for making investment decisions within the approved policy limits and associated guidelines.
Private Equity
The private equity portfolio is comprised of investments that vary by industry, stage and type of investment. Private equity investments are reported at fair value. Changes in the values of private equity investments are reflected in our results of operations. Due to the nature of the direct investments, we must make assumptions as to future performance, financial condition, liquidity, availability of capital, and market conditions, among other factors, to determine the estimated fair value of the investments. Market conditions and actual performance of the investments could differ from these assumptions. Accordingly, lower valuations may occur that could adversely impact earnings in future periods. Also, the valuations may not represent amounts that will ultimately be realized from these investments. See Private Equity Asset Valuation in the Critical Accounting Policies And Judgments section of this Item 7 for additional information.
At December 31, 2006, private equity investments carried at estimated fair value totaled $463 million compared with $449 million at December 31, 2005. As of December 31, 2006, approximately 45% of the amount is invested directly in a variety of companies and approximately 55% is invested in various limited partnerships. Private equity unfunded commitments totaled $123 million at December 31, 2006 compared with $78 million at December 31, 2005.
See Note 24 Commitments And Guarantees in the Notes To Consolidated Financial Statements regarding our commitment to PNC Mezzanine Partners III, LP, which is consolidated for financial reporting purposes as PNC has a 57% ownership interest.
Other Investments
We also make investments in affiliated and non-affiliated funds with both traditional and alternative investment strategies. The economic values could be driven by either the fixed-income market or the equity markets, or both.
PNC owns approximately 44 million shares of BlackRock common stock, accounted for under the equity method. The primary risk measurement, similar to other equity investments, is economic capital.
In November 2006, we invested an aggregate of $100 million in FIM Holdings, LLC (“FIM”) as a non-managing member with a 1.25% ownership interest. FIM acquired a 51%
56
ownership position in GMAC LLC from General Motors Corporation (“GM”) and purchased redeemable preferred stock from GMAC LLC.
IMPACTOF INFLATION
Our assets and liabilities are primarily monetary in nature. Accordingly, future changes in prices do not affect the obligations to pay or receive fixed and determinable amounts of money. During periods of inflation, monetary assets lose value in terms of purchasing power and monetary liabilities have corresponding purchasing power gains. The concept of purchasing power, however, is not an adequate indicator of the effect of inflation on banks because it does not take into account changes in interest rates, which are an important determinant of our earnings.
FINANCIAL DERIVATIVES
We use a variety of financial derivatives as part of the overall asset and liability risk management process to help manage interest rate, market and credit risk inherent in our business activities. Substantially all such instruments are used to manage risk related to changes in interest rates. Interest rate and total return swaps, interest rate caps and floors and futures contracts are the primary instruments we use for interest rate risk management.
Financial derivatives involve, to varying degrees, interest rate, market and credit risk. For interest rate swaps and total return swaps, options and futures contracts, only periodic cash payments and, with respect to options, premiums, are exchanged. Therefore, cash requirements and exposure to credit risk are significantly less than the notional amount on these instruments. Further information on our financial derivatives as of December 31, 2006 and December 31, 2005, is presented in Note 1 Accounting Policies and Note 16 Financial Derivatives in the Notes To Consolidated Financial Statements in Part I, Item 1 of this Report.
Not all elements of interest rate, market and credit risk are addressed through the use of financial or other derivatives, and such instruments may be ineffective for their intended purposes due to unanticipated market characteristics, among other reasons.
57
The following tables provide the notional amount and net fair value of financial derivatives used for risk management and designated as accounting hedges as well as free-standing derivatives at December 31, 2006 and 2005. Weighted-average interest rates presented are based on contractual terms, if fixed, or the implied forward yield curve at each respective date, if floating.
Financial Derivatives - 2006
| | | | | | | | | | | | | |
December 31, 2006 - dollars in millions | | Notional/
Contract
Amount | | Net
Fair Value |
| | Weighted
Average
Maturity | | Weighted-Average
Interest Rates |
|
| | | | | Paid | | | Received | |
Accounting Hedges | | | | | | | | | | | | | |
Interest rate risk management | | | | | | | | | | | | | |
Asset rate conversion | | | | | | | | | | | | | |
Interest rate swaps (a) | | | | | | | | | | | | | |
Receive fixed | | $7,815 | | $62 | | | 3 yrs. 9 mos. | | 5.30 | % | | 5.43 | % |
Interest rate floors (b) | | 6 | | | | | 4 yrs. 3 mos. | | NM | | | NM | |
Total asset rate conversion | | 7,821 | | 62 | | | | | | | | | |
Liability rate conversion | | | | | | | | | | | | | |
Interest rate swaps (a)
Receive fixed | | 4,245 | | 6 | | | 6 yrs. 11 mos. | | 5.15 | | | 5.43 | |
Total liability rate conversion | | 4,245 | | 6 | | | | | | | | | |
Total interest rate risk management | | 12,066 | | 68 | | | | | | | | | |
Commercial mortgage banking risk management
Pay fixed interest rate swaps (a) | | 745 | | (7 | ) | | 9 yrs. 11 mos. | | 5.25 | | | 5.09 | |
Total commercial mortgage banking risk management | | 745 | | (7 | ) | | | | | | | | |
Total accounting hedges (c) | | $12,811 | | $61 | | | | | | | | | |
Free-Standing Derivatives | | | | | | | | | | | | | |
Customer-related | | | | | | | | | | | | | |
Interest rate | | | | | | | | | | | | | |
Swaps | | $48,816 | | $9 | | | 4 yrs. 11 mos. | | 5.00 | % | | 5.01 | % |
Caps/floors | | | | | | | | | | | | | |
Sold | | 1,967 | | (3 | ) | | 7 yrs. 4 mos. | | NM | | | NM | |
Purchased | | 897 | | 3 | | | 7 yrs. 2 mos. | | NM | | | NM | |
Futures | | 2,973 | | 2 | | | 9 mos. | | NM | | | NM | |
Foreign exchange | | 5,245 | | | | | 6 mos. | | NM | | | NM | |
Equity | | 2,393 | | (63 | ) | | 1 yr. 6 mos. | | NM | | | NM | |
Swaptions | | 8,685 | | 16 | | | 6 yrs. 10 mos. | | NM | | | NM | |
Other | | 20 | | | | | 10 yrs. 6 mos. | | NM | | | NM | |
Total customer-related | | 70,996 | | (36 | ) | | | | | | | | |
Other risk management and proprietary | | | | | | | | | | | | | |
Interest rate | | | | | | | | | | | | | |
Swaps | | 19,631 | | 4 | | | 7 yrs. 8 mos. | | 4.81 | % | | 4.97 | % |
Caps/floors | | | | | | | | | | | | | |
Sold | | 6,500 | | (50 | ) | | 2 yrs. 11 mos. | | NM | | | NM | |
Purchased | | 7,010 | | 59 | | | 3 yrs. | | NM | | | NM | |
Futures | | 13,955 | | (3 | ) | | 1 yr. 4 mos. | | NM | | | NM | |
Foreign exchange | | 1,958 | | | | | 5 yrs. 2 mos. | | NM | | | NM | |
Credit derivatives | | 3,626 | | (11 | ) | | 7 yrs. | | NM | | | NM | |
Risk participation agreements | | 786 | | | | | 5 yrs. 5 mos. | | NM | | | NM | |
Commitments related to mortgage-related assets | | 2,723 | | 10 | | | 2 mos. | | NM | | | NM | |
Options | | | | | | | | | | | | | |
Futures | | 63,033 | | (2 | ) | | 8 mos. | | NM | | | NM | |
Swaptions | | 25,951 | | 54 | | | 6 yrs. 10 mos. | | NM | | | NM | |
Total other risk management and proprietary | | 145,173 | | 61 | | | | | | | | | |
Total free-standing derivatives | | $216,169 | | $25 | | | | | | | | | |
| (a) | The floating rate portion of interest rate contracts is based on money-market indices. As a percent of notional amount, 67% were based on 1-month LIBOR, 27% on 3-month LIBOR and 6% on Prime Rate. |
| (b) | Interest rate floors have a weighted-average strike of 3.21%. |
| (c) | Fair value amounts include accrued interest receivable of $94 million. |
NM Not meaningful
58
Financial Derivatives - 2005
| | | | | | | | | | | | | |
| December 31, 2005 - dollars in millions | | Notional/
Contract
Amount | | Net
Fair Value | | | Weighted
Average
Maturity | | Weighted-Average Interest Rates | |
| | | | | Paid | | | Received | |
Accounting Hedges | | | | | | | | | | | | | |
Interest rate risk management | | | | | | | | | | | | | |
Asset rate conversion | | | | | | | | | | | | | |
Interest rate swaps (a)
Receive fixed | | $2,926 | | $(9 | ) | | 2 yrs. 10 mos. | | 4.75 | % | | 4.42 | % |
Pay fixed | | 12 | | | | | 2 yrs. 1 mo. | | 3.68 | | | 4.77 | |
Futures contracts | | 42 | | | | | 1 yr. 1 mo. | | NM | | | NM | |
Total asset rate conversion | | 2,980 | | (9 | ) | | | | | | | | |
Liability rate conversion | | | | | | | | | | | | | |
Interest rate swaps (a)
Receive fixed | | 5,345 | | 84 | | | 6 yrs. 5 mos. | | 4.87 | | | 5.37 | |
Total liability rate conversion | | 5,345 | | 84 | | | | | | | | | |
Total interest rate risk management | | 8,325 | | 75 | | | | | | | | | |
Commercial mortgage banking risk management
Pay fixed interest rate swaps (a) | | 251 | | (4 | ) | | 10 yrs. 9 mos. | | 5.05 | | | 4.88 | |
Pay total return swaps designated to loans held for sale (a) | | 250 | | (2 | ) | | 1 mo. | | NM | | | 4.37 | |
Total commercial mortgage banking risk management | | 501 | | (6 | ) | | | | | | | | |
Total accounting hedges (b) | | $8,826 | | $69 | | | | | | | | | |
Free-Standing Derivatives | | | | | | | | | | | | | |
Customer-related | | | | | | | | | | | | | |
Interest rate | | | | | | | | | | | | | |
Swaps | | $43,868 | | $34 | | | 4 yrs. 2 mos. | | 4.69 | % | | 4.69 | % |
Caps/floors | | | | | | | | | | | | | |
Sold | | 1,710 | | (4 | ) | | 1 yr. 11 mos. | | NM | | | NM | |
Purchased | | 1,446 | | 3 | | | 11 mos. | | NM | | | NM | |
Futures | | 2,570 | | | | | 10 mos. | | NM | | | NM | |
Foreign exchange | | 4,687 | | 4 | | | 5 mos. | | NM | | | NM | |
Equity | | 2,744 | | (79 | ) | | 1 yr. 6 mos. | | NM | | | NM | |
Swaptions | | 2,559 | | (1 | ) | | 8 yrs. 11mos. | | NM | | | NM | |
Other | | 230 | | 1 | | | 10 yrs. 8 mos. | | NM | | | NM | |
Total customer-related | | 59,814 | | (42 | ) | | | | | | | | |
Other risk management and proprietary | | | | | | | | | | | | | |
Interest rate | | | | | | | | | | | | | |
Swaps | | 2,369 | | 1 | | | 4 yrs. 11 mos. | | 4.56 | % | | 4.65 | % |
Basis swaps | | 756 | | 1 | | | 6 yrs. 10 mos. | | 4.14 | | | 4.85 | |
Pay fixed swaps | | 2,474 | | (2 | ) | | 7 yrs. 7 mos. | | 4.37 | | | 4.57 | |
Caps/floors | | | | | | | | | | | | | |
Sold | | 2,000 | | (10 | ) | | 2 yrs. 7 mos. | | NM | | | NM | |
Purchased | | 2,310 | | 14 | | | 2 yrs. 10 mos. | | NM | | | NM | |
Futures | | 10,901 | | 2 | | | 1 yr. 2 mos. | | NM | | | NM | |
Credit derivatives | | 1,353 | | | | | 4 yrs. 7 mos. | | NM | | | NM | |
Risk participation agreements | | 461 | | | | | 3 yrs. 11 mos. | | NM | | | NM | |
Commitments related to mortgage-related assets | | 1,695 | | 1 | | | 2 mos. | | NM | | | NM | |
Options | | | | | | | | | | | | | |
Futures | | 33,384 | | 3 | | | 5 mos. | | NM | | | NM | |
Swaptions | | 15,440 | | 30 | | | 7 yrs. 7 mos. | | NM | | | NM | |
Other | | 24 | | 4 | | | 4 mos. | | NM | | | NM | |
Total other risk management and proprietary | | 73,167 | | 44 | | | | | | | | | |
Total free-standing derivatives | | $132,981 | | $2 | | | | | | | | | |
| (a) | The floating rate portion of interest rate contracts is based on money-market indices. As a percent of a notional amount, 67% were based on 1-month LIBOR, 33% on 3-month LIBOR. |
| (b) | Fair value amounts include accrued interest receivable of $81 million. |
59
2005 VERSUS 2004
CONSOLIDATED INCOME STATEMENT REVIEW
Summary Results
Consolidated net income for 2005 was $1.325 billion or $4.55 per diluted share and for 2004 was $1.197 billion or $4.21 per diluted share.
Results for 2005 included the impact of the following items:
| | • | | The reversal of deferred tax liabilities that benefited earnings by $45 million, or $.16 per diluted share, in the first quarter related to our transfer of ownership in BlackRock from PNC Bank, N.A. to our intermediate bank holding company, PNC Bancorp, Inc.; |
| | • | | Implementation costs totaling $35 million after-tax, or $.12 per diluted share, related to the One PNC initiative; |
| | • | | The $34 million after-tax benefit of a second quarter 2005 loan recovery; and |
| | • | | Integration costs of $20 million after-tax, or $.07 per diluted share, comprised of provision for credit losses, noninterest expense and deferred taxes, related to the May 2005 acquisition of Riggs. |
Results for 2004 reflected the impact of charges totaling $49 million after taxes, or $.17 per diluted share, related to the 2002 BlackRock LTIP.
Net Interest Income
Net interest income was $2.154 billion for 2005 and $1.969 billion for 2004. Net interest income on a taxable-equivalent basis was $2.187 billion for 2005 compared with $1.989 billion in 2004, an increase of $198 million, or 10%. The net interest margin was 3.00% for 2005, a decline of 22 basis points compared with 2004. Net interest income increased in 2005 compared with the prior year as strong growth in earning assets and deposits in 2005 more than offset the decline in the net interest margin.
Provision For Credit Losses
The provision for credit losses decreased $31 million, to $21 million, for 2005 compared with 2004. The decline in the provision for credit losses was primarily due to the benefit of a $53 million loan recovery in the second quarter of 2005 resulting from a litigation settlement, in addition to continued strong asset quality. The favorable impact of these factors on the provision was partially offset by the impact of total average loan and commitments growth in 2005 compared with the prior year.
Noninterest Income
Noninterest income was $4.173 billion for 2005 and $3.572 billion for 2004. An increase in asset management fees was the largest factor in the increase, driven largely by
BlackRock’s acquisition of SSRM in January 2005 and higher performance fees. In addition, noninterest income in 2005 reflected increases in all other major categories other than net securities losses in 2005 compared with net gains in 2004 and Other, which was flat.
Additional Analysis
Combined asset management and fund servicing fees amounted to $2.313 billion for 2005 compared with $1.811 billion for 2004. The increase reflected the impact of the first quarter 2005 SSRM acquisition, higher performance fees at BlackRock, and other growth in assets managed and serviced.
Assets under management at December 31, 2005 totaled $494 billion compared with $383 billion at December 31, 2004. In addition to the impact of net new business during 2005, the acquisition of SSRM added $50 billion of assets under management during the first quarter of 2005. PFPC provided fund accounting/administration services for $835 billion of net fund assets and provided custody services for $476 billion of fund assets at December 31, 2005, compared with $721 billion and $451 billion, respectively, at December 31, 2004. These increases were driven by net new business and asset inflows from existing customers, as well as comparatively favorable market conditions.
Service charges on deposits increased $21 million for 2005 compared with 2004. Although growth in service charges was limited due to our offering of free checking in both the consumer and small business channels, free checking positively impacted customer and demand deposit growth as well as other deposit-related fees.
Brokerage fees increased $6 million, to $225 million, for 2005 compared with the prior year. The increase was primarily due to higher mutual fund-related revenues in 2005.
Consumer services fees increased $34 million, to $293 million, in 2005 compared with 2004. Higher fees reflected additional fees from debit card transactions, primarily due to higher volumes and the expansion into the greater Washington, D.C. area in May 2005.
Corporate services revenue was $485 million for 2005, compared with $423 million in 2004. Corporate services revenue in 2005 benefited from the impact of higher net gains on commercial mortgage loan sales, higher fees related to commercial mortgage servicing activities, increased loan syndication fees and higher capital markets-related revenues, including revenues attributable to Harris Williams beginning in October 2005, compared with the prior year. These increases were partially offset by a $45 million decline in 2005 of net gains in excess of valuation adjustments related to our liquidation of institutional loans held for sale. Our liquidation of institutional loans held for sale is complete.
60
Equity management (private equity) net gains on portfolio investments totaled $96 million for 2005 and $67 million for 2004.
Net securities losses amounted to $41 million for 2005 compared with net securities gains of $55 million in 2004. In late April and early May 2005 we sold $2.1 billion of securities available for sale and terminated $1.0 billion of resale agreements that were most sensitive to extension risk due to rising short-term interest rates. We also purchased $2.1 billion of securities with higher yields and lower extension risk. These transactions resulted in realized net securities and other losses of approximately $31 million.
Noninterest revenue from trading activities totaled $157 million for 2005 and $113 million for 2004. While customer activity represented the majority of trading revenue, the increase compared with 2004 was primarily the result of proprietary trading activities. We provide additional information on our trading activities under Market Risk Management – Trading Risk in the Risk Management section of this Item 7.
Other noninterest income decreased $1 million, to $372 million, in 2005 compared with 2004. Other noninterest income typically fluctuates from period to period depending on the nature and magnitude of transactions completed.
Other noninterest income for 2005 included the following pretax items:
| | • | | A $33 million gain related to contributions of BlackRock stock to the PNC Foundation, transactions that also impacted noninterest expense, and |
| | • | | Income related to the 2005 SSRM and Riggs acquisitions. |
The factors above offset the impact of the following pretax gains in 2004:
| | • | | A first quarter $34 million gain related to the sale of our modified coinsurance contracts, and |
| | • | | A second quarter $13 million gain recognized in connection with BlackRock’s sale of its interest in Trepp LLC, a provider of commercial mortgage-backed security information, analytics and technology. |
Noninterest Expense
Total noninterest expense was $4.306 billion for 2005, an increase of $594 million compared with 2004. The efficiency ratio was 68% for 2005 and 67% for 2004.
Noninterest expense for 2005 included the following:
| | • | | An increase of $325 million in BlackRock non-LTIP operating expenses that reflected the impact of costs resulting from the first quarter 2005 SSRM acquisition and other investments to fund growth; |
| | • | | Costs totaling approximately $132 million resulting from our Riggs acquisition, including approximately $16 million of integration costs; |
| | • | | BlackRock LTIP charges of $64 million; |
| | • | | Implementation costs totaling $53 million related to the One PNC initiative; |
| | • | | Contributions of BlackRock stock to the PNC Foundation of $40 million; and |
| | • | | Costs totaling $17 million related to the Harris Williams acquisition. |
The effect of these increases was partially offset by cost reductions of approximately $90 million realized in 2005 from the One PNC initiative. The impact of the Riggs integration and One PNC implementation costs was reflected in several noninterest expense items in the Consolidated Income Statement.
Noninterest expense of $3.712 billion for 2004 included a $110 million charge associated with the BlackRock LTIP and conversion-related and other nonrecurring costs totaling approximately $11 million related to our acquisition of United National Bancorp, Inc.
Apart from the impact of these items, noninterest expense increased $174 million, or 5%, in 2005 compared with 2004. These higher expenses were driven by investments in our businesses and increased sales incentives.
EFFECTIVE TAX RATE
Our effective tax rate was 30.2% for 2005 and 30.3% for 2004. The low effective tax rate for 2005 was primarily attributable to the impact of the reversal of deferred tax liabilities that year in connection with the transfer of our ownership in BlackRock described under “Summary Results” above.
The following favorably impacted the effective tax rate for 2004:
| | • | | A reduced state and local tax expense due to tax benefits of $18 million recorded in connection with New York state and city audit findings, primarily associated with BlackRock, and |
| | • | | A $14 million reduction in income tax expense following our determination that we no longer required an income tax reserve related to bank-owned life insurance. |
CONSOLIDATED BALANCE SHEET REVIEW
Loans
Loans increased $5.6 billion, or 13%, as of December 31, 2005 compared with December 31, 2004. The increase in total loans reflected the following, in part due to our expansion into the greater Washington, DC market beginning in May 2005:
| | • | | Residential mortgage loans increased $2.5 billion, and |
61
| | • | | Demand for commercial loans, including commercial real estate loans grew during the year, reflected in the $3.1 billion increase in these loan categories. |
Securities
Total securities at December 31, 2005 were $20.7 billion compared with $16.8 billion at December 31, 2004. Securities represented 23% of total assets at December 31, 2005 compared with 21% at December 31, 2004. The increase in total securities compared with December 31, 2004 was primarily due to increases in mortgage-backed securities and commercial mortgage-backed securities, partially offset by declines in US Treasury and government agencies and asset- backed securities. The increase in 2005 also reflected the impact of Riggs.
At December 31, 2005, the securities available for sale balance included a net unrealized loss of $370 million, which represented the difference between fair value and amortized cost. The comparable amount at December 31, 2004 was a net unrealized loss of $102 million. The impact on bond prices of increases in interest rates during 2005 was reflected in the net unrealized loss position at December 31, 2005. The expected weighted-average life of securities available for sale was 4 years and 1 month at December 31, 2005 compared with 2 years and 8 months at December 31, 2004.
Loans Held For Sale
Education loans held for sale totaled $1.9 billion at December 31, 2005, and $1.1 billion at December 31, 2004 and represented the majority of our loans held for sale at each date. Gains on sales of education loans totaled $19 million for 2005 and $30 million for 2004. These gains are reflected in the other noninterest income line item in our Consolidated Income Statement.
Asset Quality
Nonperforming assets were $216 million at December 31, 2005, an increase of $41 million from December 31, 2004. The increase in nonperforming assets was primarily due to an increase in nonaccrual asset-based loans. The ratio of nonperforming assets to total loans, loans held for sale and foreclosed assets was .42% at December 31, 2005 compared with .39% at December 31, 2004. The allowance for loan and lease losses was $596 million and represented 1.21% of total loans and 314% of nonperforming loans at December 31, 2005. The comparable amounts were $607 million, 1.40% and 424%, respectively, at December 31, 2004.
Funding Sources
Total funding sources were $77.2 billion at December 31, 2005 and $65.2 billion at December 31, 2004. The increase of $12 billion in funding sources was comprised of a $7 billion increase in total deposits and a $5 billion increase in total borrowed funds. The increase in deposits reflected sales and retention efforts related to core deposits as well as the impact of our expansion into the greater Washington, DC area.
Higher borrowed funds at December 31, 2005 were driven in part by the following 2005 transactions:
| | • | | Senior bank note issuances totaling $925 million, |
| | • | | Senior debt issuances of $1.1 billion and BlackRock’s issuance of $250 million of convertible debentures, |
| | • | | Subordinated bank debt issuance of $500 million and the assumption of $345 million of subordinated debt related to the Riggs transaction, |
| | • | | $1 billion of FHLB advances, and |
| | • | | Higher short-term borrowings to fund asset growth. |
These increases were partially offset by maturities of $750 million of senior bank notes and $350 million of subordinated debt during 2005.
Shareholders’ Equity
The increase of $1.1 billion, to $8.6 billion, in total shareholders’ equity at December 31, 2005 compared with the prior year-end was primarily attributable to the impact of retained earnings of $750 million and the issuance of $356 million of shares in connection with the Riggs acquisition.
Regulatory capital ratios at December 31, 2005 were 7.2% for leverage, 8.3% for tier 1 risk-based and 12.1% for total risk-based capital. At December 31, 2004, the regulatory capital ratios were 7.6% for leverage, 9.0% for tier 1 risk-based and 13.0% for total risk-based capital.
Glossary of Terms
Accounting/administration net fund assets - Net domestic and foreign fund investment assets for which we provide accounting and administration services. We do not include these assets on our Consolidated Balance Sheet.
Adjusted average total assets - Primarily comprised of total average quarterly (or annual) assets plus (less) unrealized losses (gains) on available-for-sale debt securities, less goodwill and certain other intangible assets (net of eligible deferred taxes).
Annualized - Adjusted to reflect a full year of activity.
Assets under management - Assets over which we have sole or shared investment authority for our customers/clients. We do not include these assets on our Consolidated Balance Sheet.
Basis point - One hundredth of a percentage point.
Charge-off - Process of removing a loan or portion of a loan from our balance sheet because it is considered uncollectible. We also record a charge-off when a loan is transferred to held for sale by reducing the loan’s carrying amount by the allowance for loan losses associated with such loan or if the loan’s market value is less than its carrying amount.
62
Common shareholders’ equity to total assets - Common shareholders’ equity divided by total assets. Common shareholders’ equity equals total shareholders’ equity less the liquidation value of preferred stock.
Credit derivatives - Contractual agreements that provide protection against a credit event of one or more referenced credits. The nature of a credit event is established by the protection buyer and protection seller at the inception of a transaction, and such events include bankruptcy, insolvency and failure to meet payment obligations when due. The buyer of the credit derivative pays a periodic fee in return for a payment by the protection seller upon the occurrence, if any, of a credit event.
Custody assets - Investment assets held on behalf of clients under safekeeping arrangements. We do not include these assets on our Consolidated Balance Sheet. Investment assets held in custody at other institutions on our behalf are included in the appropriate asset categories on the Consolidated Balance Sheet as if physically held by us.
Derivatives -Financial contracts whose value is derived from publicly traded securities, interest rates, currency exchange rates or market indices. Derivatives cover a wide assortment of financial contracts, including forward contracts, futures, options and swaps.
Duration of equity - An estimate of the rate sensitivity of our economic value of equity. A negative duration of equity is associated with asset sensitivity (i.e., positioned for rising interest rates), while a positive value implies liability sensitivity (i.e.,positioned for declining interest rates). For example, if the duration of equity is +1.5 years, the economic value of equity declines by 1.5% for each 100 basis point increase in interest rates.
Earning assets - Assets that generate income, which include: federal funds sold; resale agreements; other short-term investments, including trading securities; loans held for sale; loans, net of unearned income; securities; and certain other assets.
Economic capital - Represents the amount of resources that our business segments should hold to guard against potentially large losses that could cause insolvency. It is based on a measurement of economic risk, as opposed to risk as defined by regulatory bodies. The economic capital measurement process involves converting a risk distribution to the capital that is required to support the risk, consistent with our target credit rating. As such, economic risk serves as a “common currency” of risk that allows us to compare different risks on a similar basis.
Economic value of equity (“EVE”) - The present value of the expected cash flows of our existing assets less the present value of the expected cash flows of our existing liabilities,
plus the present value of the net cash flows of our existing off-balance sheet positions.
Effective duration - A measurement, expressed in years, that, when multiplied by a change in interest rates, would approximate the percentage change in value of on- and off- balance sheet positions.
Efficiency - Noninterest expense divided by the sum of net interest income and noninterest income.
Foreign exchange contracts - Contracts that provide for the future receipt and delivery of foreign currency at previously agreed-upon terms.
Funds transfer pricing - A management accounting methodology designed to recognize the net interest income effects of sources and uses of funds provided by the assets and liabilities of our business segments. We assign these balances LIBOR-based funding rates at origination that represent the interest cost for us to raise/invest funds with similar maturity and repricing structures.
Futures and forward contracts - Contracts in which the buyer agrees to purchase and the seller agrees to deliver a specific financial instrument at a predetermined price or yield. May be settled either in cash or by delivery of the underlying financial instrument.
GAAP - Accounting principles generally accepted in the United States of America.
Interest rate floors and caps - Interest rate protection instruments that involve payment from the seller to the buyer of an interest differential, which represents the difference between a short-term rate (e.g., three-month LIBOR) and an agreed-upon rate (the strike rate) applied to a notional principal amount.
Interest rate swap contracts - Contracts that are entered into primarily as an asset/liability management strategy to reduce interest rate risk. Interest rate swap contracts are exchanges of interest rate payments, such as fixed-rate payments for floating-rate payments, based on notional principal amounts.
Intrinsic value - The amount by which the fair value of an underlying stock exceeds the exercise price of an option on that stock.
Leverage ratio - Tier 1 risk-based capital divided by adjusted average total assets.
Net interest margin - Annualized taxable-equivalent net interest income divided by average earning assets.
Nondiscretionary assets under administration - Assets we hold for our customers/clients in a non-discretionary, custodial
63
capacity. We do not include these assets on our Consolidated Balance Sheet.
Noninterest income to total revenue - Noninterest income divided by the sum of net interest income and noninterest income.
Nonperforming assets - Nonperforming assets include nonaccrual loans, troubled debt restructured loans, nonaccrual loans held for sale, foreclosed assets and other assets. We do not accrue interest income on assets classified as nonperforming.
Nonperforming loans - Nonperforming loans include loans to commercial, commercial real estate, equipment lease financing, consumer, and residential mortgage customers as well as troubled debt restructured loans. Nonperforming loans do not include nonaccrual loans held for sale or foreclosed and other assets. We do not accrue interest income on loans classified as nonperforming.
Notional amount - A number of currency units, shares, or other units specified in a derivatives contract.
Operating leverage - The period to period percentage change in total revenue less the percentage change in noninterest expense. A positive percentage indicates that revenue growth exceeded expense growth (i.e., positive operating leverage) while a negative percentage implies expense growth exceeded revenue growth (i.e., negative operating leverage).
Options - Contracts that grant the purchaser, for a premium payment, the right, but not the obligation, to either purchase or sell the associated financial instrument at a set price during a period or at a specified date in the future.
Recovery - Cash proceeds received on a loan that we had previously charged off. We credit the amount received to the allowance for loan and lease losses.
Return on average capital - Annualized net income divided by average capital.
Return on average assets - Annualized net income divided by average assets.
Return on average common equity - Annualized net income divided by average common shareholders’ equity.
Risk-weighted assets - Primarily computed by the assignment of specific risk-weights (as defined by The Board of Governors of the Federal Reserve System) to assets and off-balance sheet instruments.
Securitization - The process of legally transforming financial assets into securities.
Swaptions - Contracts that grant the purchaser, for a premium payment, the right, but not the obligation, to enter into an interest rate swap agreement during a period or at a specified date in the future.
Tangible common equity ratio - Period-end common shareholders’ equity less goodwill and other intangible assets (net of eligible deferred taxes), and excluding mortgage servicing rights, divided by period-end assets less goodwill and other intangible assets (net of eligible deferred taxes), and excluding mortgage servicing rights.
Taxable-equivalent interest - The interest income earned on certain assets is completely or partially exempt from federal income tax. As such, these tax-exempt instruments typically yield lower returns than a taxable asset. To provide more meaningful comparisons of yields and margins for all interest-earning assets, we also provide revenue on a taxable-equivalent basis by increasing the interest income earned on tax-exempt assets to make it fully equivalent to interest income earned on other taxable assets. This adjustment is not permitted under GAAP on the Consolidated Income Statement.
Tier 1 risk-based capital - Tier 1 risk-based capital equals: total shareholders’ equity, plus trust preferred capital securities, plus certain minority interests that are held by others; less goodwill and certain other intangible assets (net of eligible deferred taxes), less equity investments in nonfinancial companies and less net unrealized holding losses on available-for-sale equity securities. Net unrealized holding gains on available-for-sale equity securities, net unrealized holding gains (losses) on available-for-sale debt securities and net unrealized holding gains (losses) on cash flow hedge derivatives are excluded from total shareholders’ equity for tier 1 risk-based capital purposes.
Tier 1 risk-based capital ratio - Tier 1 risk-based capital divided by period-end risk-weighted assets.
Total fund assets serviced - Total domestic and offshore fund investment assets for which we provide related processing services. We do not include these assets on our Consolidated Balance Sheet.
Total return swap - A non-traditional swap where one party agrees to pay the other the “total return” of a defined underlying asset (e.g., a loan), usually in return for receiving a stream of LIBOR-based cash flows. The total returns of the asset, including interest and any default shortfall, are passed through to the counterparty. The counterparty is therefore assuming the credit and economic risk of the underlying asset.
Total risk-based capital - - Tier 1 risk-based capital plus qualifying subordinated debt and trust preferred securities, other minority interest not qualified as tier 1, and the allowance for loan and lease losses, subject to certain limitations.
64
Total risk-based capital ratio - Total risk-based capital divided by period-end risk-weighted assets.
Transaction deposits - The sum of money market and interest-bearing demand deposits and demand and other noninterest-bearing deposits.
Value-at-risk (“VaR”) - A statistically-based measure of risk which describes the amount of potential loss which may be incurred due to severe and adverse market movements. The measure is of the maximum loss which should not be exceeded on 99 out of 100 days.
Yield curve - A graph showing the relationship between the yields on financial instruments or market indices of the same credit quality with different maturities. For example, a “normal” or “positive” yield curve exists when long-term bonds have higher yields than short-term bonds. A “flat” yield curve exists when yields are the same for short-term and long-term bonds. A “steep” yield curve exists when yields on long-term bonds are significantly higher than on short-term bonds. An “inverted” or “negative” yield curve exists when short-term bonds have higher yields than long-term bonds.
CAUTIONARY STATEMENT REGARDING FORWARD-LOOKING INFORMATION
We make statements in this Report, and we may from time to time make other statements, regarding our outlook or expectations for earnings, revenues, expenses and/or other matters regarding or affecting PNC that are forward-looking statements within the meaning of the Private Securities Litigation Reform Act. Forward-looking statements are typically identified by words such as “believe,” “expect,” “anticipate,” “intend,” “outlook,” “estimate,” “forecast,” “project” and other similar words and expressions.
Forward-looking statements are subject to numerous assumptions, risks and uncertainties, which change over time. Forward-looking statements speak only as of the date they are made. We do not assume any duty and do not undertake to update our forward-looking statements. Because forward-looking statements are subject to assumptions and uncertainties, actual results or future events could differ, possibly materially, from those that we anticipated in our forward-looking statements, and future results could differ materially from our historical performance.
Our forward-looking statements are subject to the following principal risks and uncertainties. We provide greater detail regarding some of these factors elsewhere in this Report, including in the Risk Factors and Risk Management sections. Our forward-looking statements may also be subject to other risks and uncertainties, including those discussed elsewhere in this Report or in our other filings with the SEC.
| | • | | Our business and operating results are affected by business and economic conditions generally or specifically in the principal markets in which we do business. We are affected by changes in our customers’ and counterparties’ financial performance, as well as changes in customer preferences and behavior, including as a result of changing business and economic conditions. |
| | • | | The value of our assets and liabilities, as well as our overall financial performance, are also affected by changes in interest rates or in valuations in the debt and equity markets. Actions by the Federal Reserve and other government agencies, including those that impact money supply and market interest rates, can affect our activities and financial results. |
| | • | | Competition can have an impact on customer acquisition, growth and retention, as well as on our credit spreads and product pricing, which can affect market share, deposits and revenues. |
| | • | | Our ability to implement our business initiatives and strategies, including the final phases of our One PNC |
65
| | initiative, could affect our financial performance over the next several years. |
| | • | | Our ability to grow successfully through acquisitions is impacted by a number of risks and uncertainties related both to the acquisition transactions themselves and to the integration of the acquired businesses into PNC after closing. These uncertainties are present in transactions such as our pending acquisition of Mercantile Bankshares Corporation. |
| | • | | Legal and regulatory developments could have an impact on our ability to operate our businesses or our financial condition or results of operations or our competitive position or reputation. Reputational impacts, in turn, could affect matters such as business generation and retention, our ability to attract and retain management, liquidity and funding. These legal and regulatory developments could include: (a) the unfavorable resolution of legal proceedings or regulatory and other governmental inquiries; (b) increased litigation risk from recent regulatory and other governmental developments; (c) the results of the regulatory examination process, our failure to satisfy the requirements of agreements with governmental agencies, and regulators’ future use of supervisory and enforcement tools; (d) legislative and regulatory reforms, including changes to laws and regulations involving tax, pension, and the protection of confidential customer information; and (e) changes in accounting policies and principles. |
| | • | | Our business and operating results are affected by our ability to identify and effectively manage risks inherent in our businesses, including, where appropriate, through the effective use of third-party insurance and capital management techniques. |
| | • | | Our ability to anticipate and respond to technological changes can have an impact on our ability to respond to customer needs and to meet competitive demands. |
| | • | | The adequacy of our intellectual property protection, and the extent of any costs associated with obtaining rights in intellectual property claimed by others, can impact our business and operating results. |
| | • | | Our business and operating results can be affected by widespread natural disasters, terrorist activities or international hostilities, either as a result of the impact on the economy and financial and capital markets generally or on us or on our customers, suppliers or other counterparties specifically. |
Also, risks and uncertainties that could affect the results anticipated in forward-looking statements or from historical performance relating to our equity interest in BlackRock, Inc. are discussed in more detail in BlackRock’s filings with the SEC, including in the Risk Factors sections of BlackRock’s reports, accessible on the SEC’s website and on or through BlackRock’s website at www.blackrock.com.
In addition, our pending acquisition of Mercantile Bankshares presents us with a number of risks and uncertainties related both to the acquisition transaction itself and to the integration of the acquired businesses into PNC after closing. These risks and uncertainties include the following:
| | • | | Completion of the transaction remains dependent on customary closing conditions, including regulatory approvals. The impact of the completion of the transaction on PNC’s financial statements will be affected by the timing of the transaction. |
| | • | | The transaction may be more expensive to complete than anticipated, including as a result of unexpected factors or events. |
| | • | | The integration of Mercantile’s business and operations with those of PNC, which will include conversion of Mercantile’s different systems and procedures, may take longer than anticipated, may be more costly than anticipated, and may have unanticipated adverse results relating to Mercantile’s or PNC’s existing businesses. |
| | • | | The anticipated benefits, including anticipated strategic gains and anticipated cost savings and other synergies of the transaction, may be significantly harder or take longer to be realized than anticipated or may not be achieved in their entirety, including as a result of unexpected factors or events, and attrition in key client, partner and other relationships relating to the transaction may be greater than expected. |
| | • | | The anticipated benefits to PNC are dependent in part on Mercantile’s business performance in the future, and there can be no assurance as to actual future results, which could be impacted by various factors, including the risks and uncertainties generally related to PNC’s and Mercantile’s performance (with respect to Mercantile, see Mercantile’s SEC reports, accessible on the SEC’s website) or due to factors related to the acquisition of Mercantile and the process of integrating it into PNC. |
66
ITEM 7A –QUANTITATIVEANDQUALITATIVEDISCLOSURESABOUTMARKETRISK
This information is set forth in the Risk Management section of Item 7 of this Report.
ITEM 8 -FINANCIALSTATEMENTSANDSUPPLEMENTARYDATA
REPORT OF INDEPENDENT REGISTERED PUBLIC ACCOUNTING FIRM
To the Board of Directors and Shareholders of
The PNC Financial Services Group, Inc.
Pittsburgh, Pennsylvania
We have audited the accompanying consolidated balance sheet of The PNC Financial Services Group, Inc. and subsidiaries (the “Company”) as of December 31, 2006 and 2005, and the related consolidated statements of income, shareholders’ equity, and cash flows for each of the three years in the period ended December 31, 2006. These financial statements are the responsibility of the Company’s management. Our responsibility is to express an opinion on these financial statements based on our audits.
We conducted our audits in accordance with the standards of the Public Company Accounting Oversight Board (United States). Those standards require that we plan and perform the audit to obtain reasonable assurance about whether the financial statements are free of material misstatement. An audit includes examining, on a test basis, evidence supporting the amounts and disclosures in the financial statements. An audit also includes assessing the accounting principles used and significant estimates made by management, as well as evaluating the overall financial statement presentation. We believe that our audits provide a reasonable basis for our opinion.
In our opinion, such consolidated financial statements present fairly, in all material respects, the financial position of The PNC Financial Services Group, Inc. and subsidiaries as of December 31, 2006 and 2005, and the results of their operations and their cash flows for each of the three years in the period ended December 31, 2006, in conformity with accounting principles generally accepted in the United States of America.
As discussed in Note 1 to the consolidated financial statements, the Company adopted Statement of Financial Accounting Standard No. 158,“Employers’ Accounting for Defined Benefit Pension and Other Postretirement Plans – an amendment of FASB Statements No. 87, 88, 106, and 132(R)” as of December 31, 2006.
As a result of the transaction discussed in Note 2 to the consolidated financial statements, the Company no longer
consolidates BlackRock, Inc. (“BlackRock”). Beginning September 30, 2006, the Company recognized its investment in BlackRock using the equity method of accounting.
We have also audited, in accordance with the standards of the Public Company Accounting Oversight Board (United States), the effectiveness of the Company’s internal control over financial reporting as of December 31, 2006, based on the criteria established in Internal Control-Integrated Framework issued by the Committee of Sponsoring Organizations of the Treadway Commission and our report dated March 1, 2007 expressed an unqualified opinion on management’s assessment of the effectiveness of the Company’s internal control over financial reporting and an unqualified opinion on the effectiveness of the Company’s internal control over financial reporting.
|
/s/ Deloitte & Touche LLP |
| Pittsburgh, Pennsylvania |
| March 1, 2007 |
67
CONSOLIDATED INCOME STATEMENT
THE PNC FINANCIAL SERVICES GROUP, INC.
| | | | | | | | |
| | | Year ended December 31 |
| In millions, except per share data | | 2006 | | | 2005 | | | 2004 |
Interest Income | | | | | | | | |
Loans | | $3,203 | | | $2,669 | | | $2,043 |
Securities available for sale | | 1,049 | | | 822 | | | 568 |
Other | | 360 | | | 243 | | | 141 |
Total interest income | | 4,612 | | | 3,734 | | | 2,752 |
Interest Expense | | | | | | | | |
Deposits | | 1,590 | | | 981 | | | 484 |
Borrowed funds | | 777 | | | 599 | | | 299 |
Total interest expense | | 2,367 | | | 1,580 | | | 783 |
Net interest income | | 2,245 | | | 2,154 | | | 1,969 |
Provision for credit losses | | 124 | | | 21 | | | 52 |
Net interest income less provision for credit losses | | 2,121 | | | 2,133 | | | 1,917 |
Noninterest Income | | | | | | | | |
Asset management | | 1,420 | | | 1,443 | | | 994 |
Fund servicing | | 893 | | | 870 | | | 817 |
Service charges on deposits | | 313 | | | 273 | | | 252 |
Brokerage | | 246 | | | 225 | | | 219 |
Consumer services | | 365 | | | 293 | | | 259 |
Corporate services | | 626 | | | 485 | | | 423 |
Equity management gains | | 107 | | | 96 | | | 67 |
Net securities gains (losses) | | (207 | ) | | (41 | ) | | 55 |
Trading | | 183 | | | 157 | | | 113 |
Net gains related to BlackRock | | 2,066 | | | | | | |
Other | | 315 | | | 372 | | | 373 |
Total noninterest income | | 6,327 | | | 4,173 | | | 3,572 |
Noninterest Expense | | | | | | | | |
Compensation | | 2,128 | | | 2,061 | | | 1,755 |
Employee benefits | | 304 | | | 332 | | | 309 |
Net occupancy | | 310 | | | 313 | | | 267 |
Equipment | | 303 | | | 296 | | | 290 |
Marketing | | 104 | | | 106 | | | 87 |
Other | | 1,294 | | | 1,198 | | | 1,004 |
Total noninterest expense | | 4,443 | | | 4,306 | | | 3,712 |
Income before minority interest and income taxes | | 4,005 | | | 2,000 | | | 1,777 |
Minority interest in income of BlackRock | | 47 | | | 71 | | | 42 |
Income taxes | | 1,363 | | | 604 | | | 538 |
Net income | | $2,595 | | | $1,325 | | | $1,197 |
Earnings Per Common Share | | | | | | | | |
Basic | | $8.89 | | | $4.63 | | | $4.25 |
Diluted | | $8.73 | | | $4.55 | | | $4.21 |
Average Common Shares Outstanding | | | | | | | | |
Basic | | 292 | | | 286 | | | 281 |
Diluted | | 297 | | | 290 | | | 284 |
See accompanying Notes To Consolidated Financial Statements.
68
CONSOLIDATED BALANCE SHEET
THE PNC FINANCIAL SERVICES GROUP, INC.
| | | | | | |
| In millions, except par value | | December 31 | |
| | 2006 | | | 2005 | |
Assets | | | | | | |
Cash and due from banks | | $3,523 | | | $3,518 | |
Federal funds sold and resale agreements | | 1,763 | | | 350 | |
Other short-term investments, including trading securities | | 3,130 | | | 2,543 | |
Loans held for sale | | 2,366 | | | 2,449 | |
Securities available for sale | | 23,191 | | | 20,710 | |
Loans, net of unearned income of $795 and $835 | | 50,105 | | | 49,101 | |
Allowance for loan and lease losses | | (560 | ) | | (596 | ) |
Net loans | | 49,545 | | | 48,505 | |
Goodwill | | 3,402 | | | 3,619 | |
Other intangible assets | | 641 | | | 847 | |
Equity investments | | 5,330 | | | 1,323 | |
Other | | 8,929 | | | 8,090 | |
Total assets | | $101,820 | | | $91,954 | |
| | |
Liabilities | | | | | | |
Deposits | | | | | | |
Noninterest-bearing | | $16,070 | | | $14,988 | |
Interest-bearing | | 50,231 | | | 45,287 | |
Total deposits | | 66,301 | | | 60,275 | |
Borrowed funds | | | | | | |
Federal funds purchased | | 2,711 | | | 4,128 | |
Repurchase agreements | | 2,051 | | | 1,691 | |
Bank notes and senior debt | | 3,633 | | | 3,875 | |
Subordinated debt | | 3,962 | | | 4,469 | |
Other | | 2,671 | | | 2,734 | |
Total borrowed funds | | 15,028 | | | 16,897 | |
Allowance for unfunded loan commitments and letters of credit | | 120 | | | 100 | |
Accrued expenses | | 3,970 | | | 2,770 | |
Other | | 4,728 | | | 2,759 | |
Total liabilities | | 90,147 | | | 82,801 | |
| | |
Minority and noncontrolling interests in consolidated entities | | 885 | | | 590 | |
| | |
Shareholders’ Equity | | | | | | |
Preferred stock (a) | | | | | | |
Common stock - $5 par value | | | | | | |
Authorized 800 shares, issued 353 shares | | 1,764 | | | 1,764 | |
Capital surplus | | 1,651 | | | 1,299 | |
Retained earnings | | 10,985 | | | 9,023 | |
Accumulated other comprehensive loss | | (235 | ) | | (267 | ) |
Common stock held in treasury at cost: 60 and 60 shares | | (3,377 | ) | | (3,256 | ) |
Total shareholders’ equity | | 10,788 | | | 8,563 | |
Total liabilities, minority and noncontrolling interests, and
shareholders’ equity | | $101,820 | | | $91,954 | |
(a) Less than $.5 million at each date.
See accompanying Notes To Consolidated Financial Statements.
69
CONSOLIDATED STATEMENT OF SHAREHOLDERS’ EQUITY
THE PNC FINANCIAL SERVICES GROUP, INC.
| | | | | | | | | | | | | | | | | | | | | | | | | |
| | | Shares Outstanding | | Common
Stock | | Capital
Surplus | | | Retained
Earnings | | | Accumulated Other Comprehensive
Income (Loss) | | | Treasury
Stock | | | Total | |
| In millions | | Common Stock | | | | | | |
Balance at January 1, 2004 (a) | | 277 | | | 1,764 | | | 1,079 | | | | 7,642 | | | | 60 | | | | (3,900 | ) | | $ | 6,645 | |
Net income | | | | | | | | | | | | 1,197 | | | | | | | | | | | | 1,197 | |
Net unrealized securities losses | | | | | | | | | | | | | | | | (69 | ) | | | | | | | (69 | ) |
Net unrealized losses on cash flow hedge derivatives | | | | | | | | | | | | | | | | (42 | ) | | | | | | | (42 | ) |
Other | | | | | | | | | | | | | | | | (3 | ) | | | | | | | (3 | ) |
Comprehensive income | | | | | | | | | | | | | | | | | | | | | | | | 1,083 | |
Cash dividends declared | | | | | | | | | | | | | | | | | | | | | | | | | |
Common | | | | | | | | | | | | (565 | ) | | | | | | | | | | | (565 | ) |
Preferred | | | | | | | | | | | | (1 | ) | | | | | | | | | | | (1 | ) |
Treasury stock activity | | 6 | | | | | | 116 | | | | | | | | | | | | 176 | | | | 292 | |
Tax benefit of stock option plans | | | | | | | | 15 | | | | | | | | | | | | | | | | 15 | |
Stock options granted | | | | | | | | 22 | | | | | | | | | | | | | | | | 22 | |
Subsidiary stock transactions | | | | | | | | 4 | | | | | | | | | | | | | | | | 4 | |
Restricted stock transactions | | | | | | | | (22 | ) | | | | | | | | | | | | | | | (22 | ) |
Balance at December 31, 2004 (a) | | 283 | | | 1,764 | | | 1,214 | | | | 8,273 | | | | (54 | ) | | | (3,724 | ) | | | 7,473 | |
Net income | | | | | | | | | | | | 1,325 | | | | | | | | | | | | 1,325 | |
Net unrealized securities losses | | | | | | | | | | | | | | | | (174 | ) | | | | | | | (174 | ) |
Net unrealized losses on cash flow hedge derivatives | | | | | | | | | | | | | | | | (32 | ) | | | | | | | (32 | ) |
Other | | | | | | | | | | | | | | | | (7 | ) | | | | | | | (7 | ) |
Comprehensive income | | | | | | | | | | | | | | | | | | | | | | | | 1,112 | |
Cash dividends declared | | | | | | | | | | | | | | | | | | | | | | | | | |
Common | | | | | | | | | | | | (574 | ) | | | | | | | | | | | (574 | ) |
Preferred | | | | | | | | | | | | (1 | ) | | | | | | | | | | | (1 | ) |
Treasury stock activity | | 10 | | | | | | 61 | | | | | | | | | | | | 468 | | | | 529 | |
Tax benefit of stock option plans | | | | | | | | 7 | | | | | | | | | | | | | | | | 7 | |
Stock options granted | | | | | | | | 30 | | | | | | | | | | | | | | | | 30 | |
Subsidiary stock transactions | | | | | | | | (5 | ) | | | | | | | | | | | | | | | (5 | ) |
Restricted stock transactions | | | | | | | | (8 | ) | | | | | | | | | | | | | | | (8 | ) |
Balance at December 31, 2005 (a) | | 293 | | | 1,764 | | | 1,299 | | | | 9,023 | | | | (267 | ) | | | (3,256 | ) | | | 8,563 | |
Net income | | | | | | | | | | | | 2,595 | | | | | | | | | | | | 2,595 | |
Net unrealized securities gains | | | | | | | | | | | | | | | | 149 | | | | | | | | 149 | |
Net unrealized gains on cash flow hedge derivatives | | | | | | | | | | | | | | | | 13 | | | | | | | | 13 | |
Additional minimum pension liability under SFAS 87 | | | | | | | | | | | | | | | | (1 | ) | | | | | | | (1 | ) |
Other (b) | | | | | | | | | | | | | | | | 3 | | | | | | | | 3 | |
Comprehensive income | | | | | | | | | | | | | | | | | | | | | | | | 2,759 | |
Cash dividends declared | | | | | | | | | | | | | | | | | | | | | | | | | |
Common | | | | | | | | | | | | (632 | ) | | | | | | | | | | | (632 | ) |
Preferred | | | | | | | | | | | | (1 | ) | | | | | | | | | | | (1 | ) |
BlackRock/MLIM transaction (c) | | | | | | | | 262 | | | | | | | | ` | | | | | | | | 262 | |
Treasury stock activity (d) | | | | | | | | (12 | ) | | | | | | | | | | | (121 | ) | | | (133 | ) |
Tax benefit of stock option plans | | | | | | | | 29 | | | | | | | | | | | | | | | | 29 | |
Stock options granted | | | | | | | | 31 | | | | | | | | | | | | | | | | 31 | |
Subsidiary stock transactions | | | | | | | | 27 | | | | | | | | | | | | | | | | 27 | |
Restricted stock transactions | | | | | | | | 15 | | | | | | | | | | | | | | | | 15 | |
Net effect of adopting SFAS 158 | | | | | | | | | | | | | | | | (132 | ) | | | | | | | (132 | ) |
Balance at December 31, 2006 (a) | | 293 | | $ | 1,764 | | $ | 1,651 | | | $ | 10,985 | | | $ | (235 | ) | | $ | (3,377 | ) | | $ | 10,788 | |
| (a) | Our preferred stock outstanding as of December 31, 2006, 2005, and 2004 and January 1, 2004 was less than $.5 million at each date and, therefore, is excluded from this presentation. |
| (b) | Consists of interest-only strip valuation adjustments and foreign currency translation adjustments. |
| (c) | Represents the portion of our gain on the BlackRock/MLIM transaction that was credited to capital surplus. |
| (d) | Our net treasury stock activity in 2006 was less than .1 million shares issued and is excluded from this presentation. |
See accompanying Notes To Consolidated Financial Statements.
70
CONSOLIDATED STATEMENT OF CASH FLOWS
THE PNC FINANCIAL SERVICES GROUP, INC.
| | | | | | | | | | | | |
| | | Year ended December 31 | |
| In millions | | 2006 | | | 2005 | | | 2004 | |
Operating Activities | | | | | | | | | | | | |
Net income | | $ | 2,595 | | | $ | 1,325 | | | $ | 1,197 | |
Adjustments to reconcile net income to net cash provided by operating activities | | | | | | | | | | | | |
Provision for credit losses | | | 124 | | | | 21 | | | | 52 | |
Depreciation, amortization and accretion | | | 345 | | | | 375 | | | | 302 | |
Deferred income taxes | | | 752 | | | | 1 | | | | (194 | ) |
Net securities losses (gains) | | | 207 | | | | 41 | | | | (55 | ) |
Valuation adjustments | | | 45 | | | | (6 | ) | | | (37 | ) |
Net gains related to BlackRock | | | (2,066 | ) | | | | | | | | |
Undistributed earnings of BlackRock | | | (39 | ) | | | | | | | | |
Excess tax benefits from share-based payment arrangements | | | (29 | ) | | | (4 | ) | | | (3 | ) |
Net change in | | | | | | | | | | | | |
Loans held for sale | | | 435 | | | | (680 | ) | | | (265 | ) |
Other short-term investments | | | 156 | | | | (613 | ) | | | (1,191 | ) |
Accrued expenses and other liabilities | | | 83 | | | | (1,326 | ) | | | 2,432 | |
Other | | | 40 | | | | 186 | | | | (1,778 | ) |
Net cash provided (used) by operating activities | | | 2,648 | | | | (680 | ) | | | 460 | |
Investing Activities | | | | | | | | | | | | |
Repayment of securities | | | 3,667 | | | | 4,261 | | | | 4,297 | |
Sales | | | | | | | | | | | | |
Securities | | | 11,102 | | | | 13,304 | | | | 14,206 | |
Loans | | | 1,110 | | | | 39 | | | | 151 | |
Foreclosed and other nonperforming assets | | | 14 | | | | 20 | | | | 23 | |
Purchases | | | | | | | | | | | | |
Securities | | | (15,707 | ) | | | (21,484 | ) | | | (18,094 | ) |
Loans | | | (3,072 | ) | | | (2,746 | ) | | | (2,741 | ) |
Net change in | | | | | | | | | | | | |
Loans | | | (278 | ) | | | (219 | ) | | | (3,228 | ) |
Federal funds sold and resale agreements | | | (1,413 | ) | | | 1,775 | | | | 241 | |
Cash received from divestitures | | | | | | | 26 | | | | 512 | |
Net cash paid for acquisitions | | | (58 | ) | | | (530 | ) | | | (299 | ) |
Purchases of corporate and bank-owned life insurance | | | (425 | ) | | | | | | | | |
Other | | | (302 | ) | | | (242 | ) | | | (261 | ) |
Net cash used by investing activities | | | (5,362 | ) | | | (5,796 | ) | | | (5,193 | ) |
Financing Activities | | | | | | | | | | | | |
Net change in | | | | | | | | | | | | |
Noninterest-bearing deposits | | | 968 | | | | (280 | ) | | | 1,023 | |
Interest-bearing deposits | | | 4,940 | | | | 3,538 | | | | 4,724 | |
Federal funds purchased | | | (1,417 | ) | | | 3,908 | | | | | |
Repurchase agreements | | | 359 | | | | 5 | | | | 265 | |
Commercial paper | | | (10 | ) | | | (2,241 | ) | | | 25 | |
Other short-term borrowed funds | | | 249 | | | | (404 | ) | | | 775 | |
Sales/issuances | | | | | | | | | | | | |
Bank notes and senior debt | | | 1,964 | | | | 2,285 | | | | 500 | |
Subordinated debt | | | | | | | 494 | | | | 504 | |
Other long-term borrowed funds | | | 279 | | | | 1,641 | | | | 464 | |
Treasury stock | | | 343 | | | | 220 | | | | 159 | |
Repayments/maturities | | | | | | | | | | | | |
Bank notes and senior debt | | | (2,200 | ) | | | (755 | ) | | | (900 | ) |
Subordinated debt | | | (471 | ) | | | (351 | ) | | | (200 | ) |
Other long-term borrowed funds | | | (1,150 | ) | | | (559 | ) | | | (1,489 | ) |
Excess tax benefits from share-based payment arrangements | | | 29 | | | | 4 | | | | 3 | |
Acquisition of treasury stock | | | (531 | ) | | | (166 | ) | | | (292 | ) |
Cash dividends paid | | | (633 | ) | | | (575 | ) | | | (566 | ) |
Net cash provided by financing activities | | | 2,719 | | | | 6,764 | | | | 4,995 | |
Net Increase In Cash And Due From Banks | | | 5 | | | | 288 | | | | 262 | |
Cash and due from banks at beginning of period | | | 3,518 | | | | 3,230 | | | | 2,968 | |
Cash and due from banks at end of period | | $ | 3,523 | | | $ | 3,518 | | | $ | 3,230 | |
Cash Paid For | | | | | | | | | | | | |
Interest | | $ | 2,376 | | | $ | 1,515 | | | $ | 782 | |
Income taxes | | | 471 | | | | 504 | | | | 486 | |
Non-cash Items | | | | | | | | | | | | |
Investment in BlackRock, net | | | 3,179 | | | | | | | | | |
Transfer from (to) loans to (from) loans held for sale, net | | | 2,280 | | | | 93 | | | | (32 | ) |
Transfer from loans to other assets | | | 13 | | | | 16 | | | | 22 | |
See accompanying Notes To Consolidated Financial Statements.
71
NOTES TO CONSOLIDATED FINANCIAL STATEMENTS
THE PNC FINANCIAL SERVICES GROUP, INC.
BUSINESS
We are one of the largest diversified financial services companies in the United States based on assets, with businesses engaged in:
| | • | | Corporate and institutional banking, |
| | • | | Global fund processing services. |
We provide many of our products and services nationally and others in our primary geographic markets located in Pennsylvania; New Jersey; the greater Washington, DC area, including Maryland and Virginia; Ohio; Kentucky; and Delaware. We also provide certain global fund processing services internationally. We are subject to intense competition from other financial services companies and are subject to regulation by various domestic and international authorities.
NOTE 1 ACCOUNTING POLICIES
BASIS OF FINANCIAL STATEMENT PRESENTATION
Our consolidated financial statements include the accounts of the parent company and its subsidiaries, most of which are wholly owned, and certain partnership interests and variable interest entities. See Note 2 Acquisitions regarding the deconsolidation of BlackRock, Inc. (“BlackRock”) from PNC’s Consolidated Balance Sheet effective September 29, 2006. Our investment in BlackRock has been accounted for under the equity method of accounting since that date. We prepared these consolidated financial statements in accordance with accounting principles generally accepted in the United States of America (“generally accepted accounting principles” or “GAAP”). We have eliminated intercompany accounts and transactions. We have also reclassified certain prior year amounts to conform with the 2006 presentation. These reclassifications did not have a material impact on our consolidated financial condition or results of operations.
SPECIAL PURPOSES ENTITIES
Special purpose entities are broadly defined as legal entities structured for a particular purpose. We use special purpose entities in various legal forms to conduct normal business activities. Special purpose entities that meet the criteria for a Qualifying Special Purpose Entity (“QSPE”) as defined in Statement of Financial Accounting Standards No. (“SFAS”) 140, “Accounting for Transfers and Servicing of Financial Assets and Extinguishments of Liabilities,” are not required to be consolidated. We review special purpose entities that are not QSPEs for consolidation in accordance with Financial Accounting Standards Board (“FASB”) Interpretation No. 46 (Revised 2003), “Consolidation of Variable Interest Entities” (“FIN 46R”).
In general, a variable interest entity (“VIE”) is a special purpose entity formed as a corporation, partnership, limited liability corporation, or any other legal structure used to conduct activities or hold assets that either:
| | • | | Does not have equity investors with voting rights that can directly or indirectly make decisions about the entity’s activities through those voting rights or similar rights, or |
| | • | | Has equity investors that do not provide enough equity for the entity to finance its activities. |
A VIE often holds financial assets, including loans or receivables, real estate or other property.
We consolidate a VIE if we are considered to be its primary beneficiary. The primary beneficiary is subject to absorbing the majority of the expected losses from the VIE’s activities, is entitled to receive a majority of the entity’s residual returns, or both. Upon consolidation of a VIE, we generally record all of the VIE’s assets, liabilities and noncontrolling interests at fair value, with future changes based upon consolidation accounting principles. See Note 3 Variable Interest Entities for more information about non-consolidated VIEs in which we hold a significant interest.
BUSINESS COMBINATIONS
We record the net assets of companies that we acquire at their estimated fair value at the date of acquisition and we include the results of operations of the acquired business in our consolidated income statement from the date of acquisition. We recognize as goodwill the excess of the purchase price over the estimated fair value of the net assets acquired.
SUBSIDIARY STOCK TRANSACTIONS
We recognize as income, when appropriate, any gain from the sale or issuance by subsidiaries of their stock to third parties. The gain is the difference between our basis in the stock and the increase in the book value per share of the subsidiaries’ equity and is recorded in noninterest income in the Consolidated Income Statement. We provide applicable taxes on the gain.
USEOF ESTIMATES
We prepare the consolidated financial statements using financial information available at the time, which requires us to make estimates and assumptions that affect the amounts reported. Actual results may differ from these estimates and the differences may be material to the consolidated financial statements.
72
REVENUE RECOGNITION
We earn net interest and noninterest income from various sources, including:
| | • | | Asset management and fund servicing, |
| | • | | Brokerage services, and |
| | • | | Securities and derivatives trading activities, including foreign exchange. |
We also earn revenue from selling loans and securities, and we recognize income or loss from certain private equity activities. We earn fees and commissions from:
| | • | | Issuing loan commitments, standby letters of credit and financial guarantees, |
| | • | | Selling various insurance products, |
| | • | | Providing treasury management services, |
| | • | | Providing merger and acquisition advisory and related services, and |
| | • | | Participating in certain capital markets transactions. |
Revenue earned on interest-earning assets is recognized based on the effective yield of the financial instrument.
We recognize asset management and fund servicing fees primarily as the services are performed. Asset management fees are generally based on a percentage of the fair value of the assets under management and performance fees are generally based on a percentage of the returns on such assets. Certain performance fees are earned upon attaining specified investment return thresholds and are recorded as earned. Beginning in the fourth quarter of 2006, asset management fees also includes our proportionate share of the earnings of BlackRock under the equity method of accounting.
Fund servicing fees are primarily based on a percentage of the fair value of the fund assets and the number of shareholder accounts we service.
Service charges on deposit accounts are recognized as charged. Brokerage fees and gains on the sale of securities and certain derivatives are recognized on a trade-date basis.
We record private equity income or loss based on changes in the valuation of the underlying investments or when we dispose of our interest. Dividend income from private equity investments is generally recognized when received.
We recognize revenue from loan servicing, securities and derivatives and foreign exchange trading, and securities underwriting activities as they are earned based on contractual terms, as transactions occur or as services are provided. We recognize revenue from the sale of loans upon closing of the transaction.
In certain circumstances, revenue is reported net of associated expenses in accordance with GAAP.
CASHAND CASH EQUIVALENTS
Cash and due from banks are considered “cash and cash equivalents” for financial reporting purposes.
INVESTMENTS
We have interests in various types of investments. The accounting for these investments is dependent on a number of factors including, but not limited to, items such as:
| | • | | Marketability of the investment, |
| | • | | Our plans for the investment, and |
| | • | | The nature of the investment. |
Investment in BlackRock
As described in Note 2 Acquisitions, we deconsolidated the assets and liabilities of BlackRock from our Consolidated Balance Sheet at September 30, 2006 and now account for our investment in BlackRock under the equity method of accounting. Under the equity method, our investment in the equity of BlackRock is reflected on our Consolidated Balance Sheet in the caption Equity Investments, while our proportionate share of BlackRock’s earnings is reported on our Consolidated Income Statement in the caption Asset Management.
Private Equity Investments
We report private equity investments, which include direct investments in companies, interests in limited partnerships, and affiliated partnership interests, at estimated fair values. These estimates are based on available information and may not necessarily represent amounts that we will ultimately realize through distribution, sale or liquidation of the investments. The valuation procedures applied to direct investments include techniques such as multiples of cash flow of the entity, independent appraisals of the entity or the pricing used to value the entity in a recent financing transaction. We value affiliated partnership interests based on the underlying investments of the partnership using procedures consistent with those applied to direct investments. We generally value limited partnership investments based on the financial statements we receive from the general partner. We include all private equity investments on the Consolidated Balance Sheet in Equity Investments. Changes in the fair value of these assets are recognized in noninterest income.
We consolidate private equity funds when we are the sole general partner in a limited partnership and have determined that we have control of the partnership.
Equity Securities and Partnership Interests
We account for equity investments other than BlackRock and private equity investments under one of the following methods:
| | • | | Marketable equity securities are recorded on a trade-date basis and are accounted for at fair value based on the securities’ quoted market prices from a national securities exchange. Dividend income on |
73
| | these securities is recognized in net interest income. Those purchased with the intention of recognizing short-term profits are classified as trading, carried at market value and classified as short-term investments. Both realized and unrealized gains and losses on trading securities are included in noninterest income. Marketable equity securities not classified as trading are designated as securities available for sale and are carried at fair value with unrealized gains and losses, net of income taxes, reflected in accumulated other comprehensive income or loss. Any unrealized losses that we have determined to be other-than-temporary are recognized in the period that the determination is made. |
| | • | | Investments in nonmarketable equity securities are recorded using the cost method of accounting. The cost method is used for those investments since we do not have significant influence over the investee. Under this method, there is no change to the cost basis unless there is an other-than-temporary decline in value. If the decline is determined to be other than temporary, we write down the cost basis of the investment to a new cost basis that represents realizable value. The amount of the write-down is accounted for as a loss included in noninterest income in the period the determination is made. Distributions received from income on cost method investments are included in interest or noninterest income depending on the type of investment. We include nonmarketable equity securities in Other Assets on the Consolidated Balance Sheet. |
For investments in limited partnerships, limited liability companies and other minor investments that are not required to be consolidated, we use either the cost method or the equity method. The cost method is described above for nonmarketable equity securities. We use the cost method for minor investments in which we have no influence over the operations of the investee and when cost appropriately reflects our economic interest in the underlying investment. We use the equity method for all other general and limited partner ownership interests and limited liability company investments. Under the equity method, we record our equity ownership share of net income or loss of the investee in noninterest income. Investments described above are included in Equity Investments on the Consolidated Balance Sheet.
Debt Securities
Debt securities are recorded on a trade-date basis. We classify debt securities as held to maturity and carry them at amortized cost if we have the positive intent and ability to hold the securities to maturity. Debt securities that we purchase for short-term appreciation or other trading purposes are carried at market value and classified as short-term investments. Realized and unrealized gains and losses on trading securities are included in noninterest income.
Debt securities not classified as held to maturity or trading are designated as securities available for sale and carried at fair value with unrealized gains and losses, net of income taxes, reflected in accumulated other comprehensive income or loss. Other-than-temporary declines in the fair value of available for sale debt securities are recognized as a securities loss included in noninterest income in the period in which the determination is made. We review all debt securities that are in an unrealized loss position for other-than-temporary impairment on a quarterly basis.
We include all interest on debt securities, including amortization of premiums and accretion of discounts using the interest method, in net interest income. We compute gains and losses realized on the sale of debt securities available for sale on a specific security basis and include them in noninterest income.
LOANS AND LEASES
Except as described below, loans are stated at the principal amounts outstanding, net of unearned income, unamortized deferred fees and costs on originated loans, and premiums or discounts on loans purchased. Interest income related to loans other than nonaccrual loans is accrued based on the principal amount outstanding and credited to net interest income as earned using the interest method. Loan origination fees, direct loan origination costs, and loan premiums and discounts are deferred and amortized to income, over periods not exceeding the contractual life of the loan, using methods that are not materially different from the interest method.
As of January 1, 2006, we adopted SFAS 155, “Accounting for Certain Hybrid Financial Instruments – an amendment of FASB Statements No. 133 and 140,” which was issued in February 2006. SFAS 155 permits a fair value election for previously bifurcated hybrid financial instruments on an instrument-by-instrument basis, clarifies the scope of SFAS 133, “Accounting for Derivative Instruments and Hedging Activities,” regarding interest-only and principal-only strips, and provides further guidance on certain issues regarding beneficial interests in securitized financial assets, concentrations of credit risk and qualifying special purpose entities. Beginning January 1, 2006, we elected to account for certain previously bifurcated hybrid instruments under this standard. As such, certain loans are accounted for at fair value with changes in fair value reported in trading revenue. The fair value of these loans was $216 million, or less than .5% of the total loan portfolio, at December 31, 2006. The adoption of SFAS 155 did not have a significant impact on our accounting for beneficial interests.
We also provide financing for various types of equipment, aircraft, energy and power systems, and rolling stock through a variety of lease arrangements. Direct financing leases are carried at the aggregate of lease payments plus estimated residual value of the leased property, less unearned income. Leveraged leases, a form of financing lease, are carried net of nonrecourse debt. We recognize income over the term of the
74
lease using the interest method. Lease residual values are reviewed for other-than-temporary impairment on a quarterly basis. Gains or losses on the sale of leased assets are included in other noninterest income while valuation adjustments on lease residuals are included in other noninterest expense.
LOAN SALES, SECURITIZATIONS AND RETAINED INTERESTS
We recognize the sale of loans or other financial assets when the transferred assets are legally isolated from our creditors and the appropriate accounting criteria are met. We also sell mortgage and other loans through secondary market securitizations. In certain cases, we may retain a portion or all of the securities issued, interest-only strips, one or more subordinated tranches, servicing rights and, in some cases, cash reserve accounts, all of which are considered retained interests in the transferred assets. Our loan sales and securitizations are generally structured without recourse to us and with no restrictions on the retained interests. In the event we are obligated for recourse liabilities in a sale, our policy is to record such liabilities at fair value upon closing of the transaction. Gains or losses recognized on the sale of the loans depend on the allocation of carrying value between the loans sold and the retained interests, based on their relative fair market values at the date of sale. We generally estimate fair value based on the present value of future expected cash flows using assumptions as to discount rates, interest rates, prepayment speeds, credit losses and servicing costs, if applicable. Gains or losses on these transactions are reported in noninterest income.
As of January 1, 2006, we adopted SFAS 156, “Accounting for Servicing of Financial Assets – an amendment of FASB Statement No. 140.” SFAS 156 was issued in March 2006 and requires all newly recognized servicing rights and obligations to be initially measured at fair value. For each class of recognized servicing rights and obligations, the standard permits the election of either the amortization method or the fair value measurement method for subsequent measurement of the asset or obligation. For separately recognized servicing rights and obligations retained or purchased related to commercial loans and commercial mortgages, we have elected to account for them under the amortization method, which requires us to amortize the servicing assets or liabilities in proportion to and over the periods of estimated net servicing income or net servicing loss. For servicing rights or obligations related to residential mortgage loans, we have elected to account for subsequent adjustments using the fair value method with changes in the value of the right or obligation reflected in noninterest income.
Each quarter, we evaluate our servicing assets that are being carried at amortized cost for impairment by categorizing the pools of assets underlying servicing rights by product type. A valuation allowance is recorded and reduces current income when the carrying amount of a specific asset category exceeds its fair value.
We classify securities retained as debt securities available for sale or other assets, depending on the form of the retained interest. Retained interests that are subject to prepayment risk are reviewed on a quarterly basis for impairment. If the fair value of the retained interest is below its carrying amount and the decline is determined to be other-than-temporary, then the decline is reflected as a charge to noninterest income. We recognize other adjustments to the fair market value of retained interests classified as available for sale securities through accumulated other comprehensive income or loss.
LOANS AND COMMITMENTSHELDFORSALE
We designate loans and related loan commitments as held for sale when we have a positive intent to sell them. We transfer loans and commitments to the loans held for sale category at the lower of cost or fair market value. At the time of transfer, related write-downs on the loans and commitments are recorded as charge-offs or as a separate liability. We establish a new cost basis upon transfer and recognize any subsequent lower of cost or market adjustment as a valuation allowance with charges included in noninterest income. Gains or losses on the actual sale of these loans and commitments are included in noninterest income when realized.
We apply the lower of cost or market analysis on pools of homogeneous loans and commitments on a net aggregate basis. For non-homogeneous loans and commitments, we do this analysis on an individual loan and commitment basis.
Interest income with respect to loans held for sale other than those in nonaccrual status is accrued based on the principal amount outstanding.
In certain circumstances, loans and commitments designated as held for sale may be later transferred back to the loan portfolio based on a change in strategy to retain the credit exposure to those customers. We transfer these loans and commitments to the portfolio at the lower of cost or market value.
NONPERFORMING ASSETS
Nonperforming assets include:
| | • | | Troubled debt restructurings, |
| | • | | Nonaccrual loans held for sale, and |
Other than consumer loans, we generally classify loans and loans held for sale as nonaccrual when we determine that the collection of interest or principal is doubtful or when a default of interest or principal has existed for 90 days or more and the loans are not well-secured or in the process of collection. When the accrual of interest is discontinued, accrued but uncollected interest credited to income in the current year is reversed and unpaid interest accrued in the prior year, if any, is charged against the allowance for loan and lease losses. We charge off loans other than consumer loans based on the facts and circumstances of the individual loan.
75
Consumer loans well-secured by residential real estate, including home equity and home equity lines of credit, are classified as nonaccrual at 12 months past due. Loans are considered well secured if the fair market value of the property, less 15% to cover potential foreclosure expenses, is greater than or equal to the principal balance including any superior liens. A fair market value assessment of the property is initiated when the loan becomes 80 to 90 days past due. The procedures for foreclosure of these loans is consistent with our general foreclosure process discussed below. The classification of consumer loans well-secured by residential real estate as nonaccrual loans at 12 months past due is in accordance with Federal Financial Institutions Examination Council guidelines. We charge off these loans based on the facts and circumstances of the individual loan.
Consumer loans not well-secured or in the process of collection are classified as nonaccrual at 120 days past due if they are home equity loans and at 180 days past due if they are home equity lines of credit. These loans are recorded at the lower of cost or market value, less liquidation costs and the unsecured portion of these loans is generally charged off in the month they become nonaccrual.
A loan is categorized as a troubled debt restructuring in the period of restructuring if a significant concession is granted due to deterioration in the financial condition of the borrower.
Nonperforming loans are generally not returned to performing status until the obligation is brought current and the borrower has performed in accordance with the contractual terms for a reasonable period of time and collection of the contractual principal and interest is no longer doubtful. Nonaccrual commercial and commercial real estate loans and troubled debt restructurings are designated as impaired loans. We recognize interest collected on these loans on the cash basis or cost recovery method.
Foreclosed assets are comprised of any asset seized or property acquired through a foreclosure proceeding or acceptance of a deed-in-lieu of foreclosure. Depending on various state statutes, legal proceedings are initiated on or about the 65th day of delinquency. If no other remedies arise from the legal proceedings, the final outcome will result in the sheriff’s sale of the property. When PNC acquires the deed, the transfer of loans to other real estate owned (“OREO”) will be completed. These assets are recorded on the date acquired at the lower of the related loan balance or market value of the collateral less estimated disposition costs. We estimate market values primarily based on appraisals when available or quoted market prices on liquid assets. Subsequently, foreclosed assets are valued at the lower of the amount recorded at acquisition date or the current market value less estimated disposition costs. Valuation adjustments on these assets and gains or losses realized from disposition of such property are reflected in noninterest expense.
ALLOWANCE FOR LOAN AND LEASE LOSSES
We maintain the allowance for loan and lease losses at a level that we believe to be adequate to absorb estimated probable credit losses inherent in the loan portfolio. The allowance is increased by the provision for credit losses, which is charged against operating results, and decreased by the amount of charge-offs, net of recoveries. Our determination of the adequacy of the allowance is based on periodic evaluations of the loan and lease portfolios and other relevant factors. This evaluation is inherently subjective as it requires material estimates, all of which may be susceptible to significant change, including, among others:
| | • | | Expected default probabilities, |
| | • | | Amounts and timing of expected future cash flows on impaired loans, |
| | • | | Estimated losses on consumer loans and residential mortgages, and |
| | • | | Amounts for changes in economic conditions and potential estimation or judgmental imprecision. |
In determining the adequacy of the allowance for loan and lease losses, we make specific allocations to impaired loans, to pools of watchlist and nonwatchlist loans and to consumer and residential mortgage loans. We also allocate reserves to provide coverage for probable losses not covered in specific, pool and consumer reserve methodologies related to qualitative and measurement factors. While allocations are made to specific loans and pools of loans, the total reserve is available for all credit losses.
Specific allocations are made to significant individual impaired loans and are determined in accordance with SFAS 114, “Accounting by Creditors for Impairment of a Loan,” with impairment measured based on the present value of the loan’s expected cash flows, the loan’s observable market price or the fair value of the loan’s collateral. We establish a specific allowance on all other impaired loans based on their loss given default credit risk rating.
Allocations to loan pools are developed by business segment based on probability of default and loss given default risk ratings by using historical loss trends and our judgment concerning those trends and other relevant factors. These factors may include, among others:
| | • | | Actual versus estimated losses, |
| | • | | Regional and national economic conditions, and |
| | • | | Business segment and portfolio concentrations. |
Loss factors are based on industry and/or internal experience and may be adjusted for significant factors that, based on our judgment, impact the collectibility of the portfolio as of the balance sheet date. Consumer and residential mortgage loan allocations are made at a total portfolio level based on historical loss experience adjusted for portfolio activity.
76
While our pool reserve methodologies strive to reflect all risk factors, there continues to be a certain element of uncertainty associated with, but not limited to, potential estimation errors and imprecision in the estimation process due to the inherent lag of information. We provide additional reserves that are designed to provide coverage for expected losses attributable to such risks. In addition, these incremental reserves also include factors which may not be directly measured in the determination of specific or pooled reserves. These factors include:
| | • | | Industry concentration and conditions, |
| | • | | Recent loss experience in particular segments of the portfolio, |
| | • | | Ability and depth of lending management, |
| | • | | Changes in risk selection and underwriting standards, and |
| | • | | Bank regulatory considerations. |
ALLOWANCE FOR UNFUNDED LOAN COMMITMENTS AND LETTERS OF CREDIT
We maintain the allowance for unfunded loan commitments and letters of credit at a level we believe is adequate to absorb estimated probable losses related to these unfunded credit facilities. We determine the adequacy of the allowance based on periodic evaluations of the unfunded credit facilities including an assessment of the probability of commitment usage, credit risk factors for loans outstanding to these same customers, and the terms and expiration dates of the unfunded credit facilities. Net adjustments to the allowance for unfunded loan commitments and letters of credit are included in the provision for credit losses.
MORTGAGEANDOTHERLOAN SERVICING RIGHTS
We provide servicing under various commercial and residential loan servicing contracts. These contracts are either purchased in the open market or retained as part of a commercial mortgage loan securitization, residential mortgage loan sale or other commercial loan sale. Prior to January 1, 2006, purchased contracts were recorded at cost and the servicing rights retained from the sale or securitization of loans were recorded based on their relative fair value to all of the assets securitized or sold. As a result of the adoption of SFAS 156, beginning January 1, 2006 all newly acquired servicing rights were initially measured at fair value. Fair value is based on the present value of the expected future cash flows, including assumptions as to:
| | • | | Interest rates for escrow and deposit balance earnings, |
| | • | | Estimated prepayment speeds, and |
| | • | | Estimated servicing costs. |
For subsequent measurements of our servicing rights we have elected to account for our commercial mortgage and commercial loan servicing rights as a class of assets under the amortization method. This determination was made based on
the unique characteristics of the commercial mortgages and commercial loans underlying these servicing rights with regard to market inputs used in determining fair value and how we manage the risks inherent in the commercial servicing rights assets. Specific risk characteristics of the commercial mortgages include loan type, currency or exchange rate, prepayment speeds and expected cash flows. Specific risk characteristics of commercial loans include prepayment speeds and credit quality factors which could impact expected cash flows. We record the servicing assets as other intangible assets and amortize them over their estimated lives in proportion to estimated net servicing income. On a quarterly basis, we test the assets for impairment using various valuation models. If the estimated fair value of the assets is less than the carrying value, an impairment loss is recognized. Servicing fees are recognized as they are earned and are reported net of amortization expense in noninterest income. For residential mortgage servicing rights, we have elected to account for these assets under the fair value method. The primary risk of changes to the value of the residential mortgage servicing rights resides in the potential volatility in the economic assumptions used, primarily the prepayment speeds. The pricing methodology used by PNC to value residential mortgage servicing rights uses a combination of securities market data observations, model cash flow projections and anecdotal servicing observations and surveys. Changes in the fair values of these assets are reflected in net servicing revenue in noninterest income.
FAIR VALUEOF FINANCIAL INSTRUMENTS
The fair value of financial instruments and the methods and assumptions used in estimating fair value amounts are detailed in Note 23 Fair Value of Financial Instruments.
GOODWILL AND OTHER INTANGIBLE ASSETS
We test goodwill and indefinite-lived intangible assets for impairment at least annually, or when events or changes in circumstances indicate the assets might be impaired. Finite-lived intangible assets are amortized to expense using accelerated or straight-line methods over their respective estimated useful lives. We review finite-lived intangible assets for impairment when events or changes in circumstances indicate that the asset’s carrying amount is not recoverable from undiscounted future cash flows or it exceeds its fair value.
DEPRECIATION AND AMORTIZATION
For financial reporting purposes, we depreciate premises and equipment principally using the straight-line method over their estimated useful lives.
We use estimated useful lives for furniture and equipment ranging from one to 10 years, and depreciate buildings over an estimated useful life of up to 40 years. We amortize leasehold improvements over their estimated useful lives of up to 15 years or the respective lease terms, whichever is shorter.
We purchase, as well as internally develop and customize, certain software to enhance or perform internal business
77
functions. Software development costs incurred in the planning and post-development project stages are charged to noninterest expense. Costs associated with designing software configuration and interfaces, installation, coding programs and testing systems are capitalized and amortized using the straight-line method over periods ranging from one to seven years.
REPURCHASE AND RESALE AGREEMENTS
Repurchase and resale agreements are treated as collateralized financing transactions and are carried at the amounts at which the securities will be subsequently reacquired or resold, including accrued interest, as specified in the respective agreements. Our policy is to take possession of securities purchased under agreements to resell. We monitor the market value of securities to be repurchased and resold and additional collateral may be obtained where considered appropriate to protect against credit exposure.
OTHER COMPREHENSIVE INCOME
Other comprehensive income consists, on an after-tax basis, primarily of unrealized gains or losses on securities available for sale and derivatives designated as cash flow hedges, and changes in pension, postretirement and postemployment liability adjustments. Details of each component are included in Note 22 Other Comprehensive Income.
TREASURY STOCK
We record common stock purchased for treasury at cost. At the date of subsequent reissue, the treasury stock account is reduced by the cost of such stock on the first-in, first-out basis.
DERIVATIVE INSTRUMENTS AND HEDGING ACTIVITIES
We use a variety of financial derivatives as part of our overall asset and liability risk management process to manage interest rate, market and credit risk inherent in our business activities. We use substantially all such instruments to manage risk related to changes in interest rates. Interest rate and total return swaps, interest rate caps and floors and futures contracts are the primary instruments we use for interest rate risk management.
Financial derivatives involve, to varying degrees, interest rate, market and credit risk. We manage these risks as part of our asset and liability management process and through credit policies and procedures. We seek to minimize counterparty credit risk by entering into transactions with only high-quality institutions, establishing credit limits, and generally requiring bilateral netting and collateral agreements.
We recognize all derivative instruments at fair value as either assets or liabilities in other assets or other liabilities. The accounting for changes in the fair value of a derivative instrument depends on whether it has been designated and qualifies as part of a hedging relationship. For derivatives not designated as an accounting hedge, the gain or loss is recognized in trading noninterest income.
For those derivative instruments that are designated and qualify as hedging instruments, we must designate the hedging instrument, based on the exposure being hedged, as a fair value hedge, a cash flow hedge or a hedge of a net investment in a foreign operation. We have no derivatives that hedge the net investment in a foreign operation.
We formally document the relationship between the hedging instruments and hedged items, as well as the risk management objective and strategy before undertaking a hedge. To qualify for hedge accounting, the derivatives and related hedged items must be designated as a hedge. For hedging relationships in which effectiveness is measured, we formally assess, both at the inception of the hedge and on an ongoing basis, if the derivatives are highly effective in offsetting changes in fair values or cash flows of the hedged item. If it is determined that the derivative instrument is not highly effective as a hedge, hedge accounting is discontinued.
For derivatives that are designated as fair value hedges (i.e., hedging the exposure to changes in the fair value of an asset or a liability attributable to a particular risk), changes in the fair value of the hedging derivative are recognized in earnings and offset by recognizing changes in the fair value of the hedged item attributable to the hedged risk. To the extent the hedge is ineffective, the changes in fair value will not offset and the difference is reflected in the same financial statement category as the hedged item.
For derivatives designated as cash flow hedges (i.e., hedging the exposure to variability in expected future cash flows), the effective portions of the gain or loss on derivatives are reported as a component of accumulated other comprehensive income or loss and subsequently reclassified in interest income in the same period or periods during which the hedged transaction affects earnings. As a result, the change in fair value of any ineffective portion of the hedging derivative is recognized immediately in earnings.
We discontinue hedge accounting when it is determined that the derivative is no longer qualifying as an effective hedge; the derivative expires or is sold, terminated or exercised; or the derivative is de-designated as a fair value or cash flow hedge or it is no longer probable that the forecasted transaction will occur by the end of the originally specified time period. If we determine that the derivative no longer qualifies as a fair value or cash flow hedge and therefore hedge accounting is discontinued, the derivative will continue to be recorded on the balance sheet at its fair value with changes in fair value included in current earnings. For a discontinued fair value hedge, the previously hedged item is no longer adjusted for changes in fair value.
When hedge accounting is discontinued because it is no longer probable that a forecasted transaction will occur, the derivative will continue to be recorded on the balance sheet at its fair value with changes in fair value included in current
78
earnings, and the gains and losses in accumulated other comprehensive income or loss will be recognized immediately into earnings. When we discontinue hedge accounting because the hedging instrument is sold, terminated or no longer designated, the amount reported in other comprehensive income or loss up to the date of sale, termination or de-designation continues to be reported in other comprehensive income or loss until the forecasted transaction affects earnings.
We did not terminate any cash flow hedges in 2006, 2005 or 2004 due to a determination that a forecasted transaction was no longer probable of occurring.
We occasionally purchase or originate financial instruments that contain an embedded derivative. Prior to January 1, 2006, we assessed at the inception of the transaction if economic characteristics of the embedded derivative were clearly and closely related to the economic characteristics of the financial instrument (host contract), whether the financial instrument that embodied both the embedded derivative and the host contract were measured at fair value with changes in fair value reported in earnings, and whether a separate instrument with the same terms as the embedded instrument would not meet the definition of a derivative. If the embedded derivative did not meet these three conditions, the embedded derivative would qualify as a derivative and be recorded apart from the host contract and carried at fair value with changes recorded in current earnings. On January 1, 2006, we adopted SFAS 155, which, among other provisions, permits a fair value election for hybrid financial instruments requiring bifurcation on an instrument-by-instrument basis. Beginning January 1, 2006, we elected to account for certain previously bifurcated hybrid instruments and certain newly acquired hybrid instruments under this fair value election on an instrument-by-instrument basis. As such, certain previously reported embedded derivatives are now reported with their host contracts at fair value in loans or other borrowed funds.
We enter into commitments to make loans whereby the interest rate on the loan is set prior to funding (interest rate lock commitments). We also enter into commitments to purchase mortgage loans (purchase commitments). Both interest rate lock commitments and purchase commitments on mortgage loans that will be held for resale are accounted for as free-standing derivatives. Interest rate lock commitments and purchase commitments that are considered to be derivatives are recorded at fair value in other assets or other liabilities. Fair value of interest rate lock commitments and purchase commitments is determined as the change in value that occurs after the inception of the commitment considering the projected security price, fees collected from the borrower and costs to originate, adjusted for anticipated fallout risk. We recognize the gain or loss from the change in fair value of these derivatives in trading noninterest income.
INCOME TAXES
We account for income taxes under the asset and liability method. Deferred tax assets and liabilities are determined based on differences between the financial reporting and tax bases of assets and liabilities and are measured using the enacted tax rates and laws that we expect will apply at the time when we believe the differences will reverse.
EARNINGS PER COMMON SHARE
We calculate basic earnings per common share by dividing net income adjusted for preferred stock dividends declared by the weighted-average number of shares of common stock outstanding.
Diluted earnings per common share are based on net income available to common stockholders. We increase the weighted-average number of shares of common stock outstanding by the assumed conversion of outstanding convertible preferred stock and debentures from the beginning of the year or date of issuance, if later, and the number of shares of common stock that would be issued assuming the exercise of stock options and the issuance of incentive shares using the treasury stock method. These adjustments to the weighted-average number of shares of common stock outstanding are made only when such adjustments will dilute earnings per common share.
STOCK-BASED COMPENSATION
We did not recognize stock-based employee compensation expense related to stock options granted before 2003 under prior GAAP.
Effective January 1, 2003, we adopted the fair value recognition provisions of SFAS 123, “Accounting for Stock-Based Compensation,” as amended by SFAS 148, “Accounting for Stock-Based Compensation-Transition and Disclosure,” prospectively to all employee awards granted, modified or settled after January 1, 2003. We did not restate results for prior years upon our adoption of SFAS 123. Since we adopted SFAS 123 prospectively, the cost related to stock-based employee compensation included in net income for 2005 and 2004 was less than what we would have recognized if we had applied the fair value based method to all awards since the original effective date of the standard.
In December 2004, the FASB issued SFAS 123R “Share Based Payment,” which replaced SFAS 123 and superseded APB 25. SFAS 123R requires compensation cost related to share-based payments to employees to be recognized in the financial statements based on their fair value. We adopted SFAS 123R effective January 1, 2006, using the modified prospective method of transition, which requires the provisions of SFAS 123R be applied to new awards and awards modified, repurchased or cancelled after the effective date. It also requires changes in the timing of expense recognition for awards granted to retirement-eligible employees and clarifies the accounting for the tax effects of stock awards. The adoption of SFAS 123R did not have a significant impact on our consolidated financial statements.
79
The following table shows the effect on net income and earnings per share if we had applied the fair value recognition provisions of SFAS 123, as amended, to all outstanding and unvested awards in each period.
Pro Forma Net Income And Earnings Per Share
| | | | | | | | | |
| | | Year ended December 31 | |
| In millions, except for per share data | | 2006 | | | 2005 | | | 2004 | |
Net income | | $2,595 | | | $1,325 | | | $1,197 | |
Add: Stock-based employee compensation expense included in reported net income, net of related tax effects | | 63 | | | 54 | | | 33 | |
Deduct: Total stock-based employee compensation expense determined under the fair value method for all awards, net of related tax effects | | (63 | ) | | (60 | ) | | (50 | ) |
Pro forma net income | | $2,595 | | | $1,319 | | | $1,180 | |
Earnings per share | | | | | | | | | |
Basic-as reported | | $8.89 | | | $4.63 | �� | | $4.25 | |
Basic-pro forma | | 8.89 | | | 4.60 | | | 4.19 | |
Diluted-as reported | | $8.73 | | | $4.55 | | | $4.21 | |
Diluted-pro forma | | 8.73 | | | 4.52 | | | 4.15 | |
See Note 18 Stock-Based Compensation Plans for additional information.
RECENT ACCOUNTING PRONOUNCEMENTS
In February 2007, the FASB issued SFAS 159, “The Fair Value Option for Financial Assets and Financial Liabilities – Including an amendment of FASB Statement No. 115.” This statement permits entities to choose to measure many financial instruments and certain other items at fair value. The fair value option may be applied on an instrument by instrument basis with a few exceptions. The election is irrevocable and must be applied to entire instruments and not to portions of instruments. For PNC, the election to apply the standard and measure certain financial instruments at fair value would be effective prospectively beginning January 1, 2008.
During 2006, the FASB issued the following:
| | • | | SFAS 158, “Employers’ Accounting for Defined Benefit Pension and Other Postretirement Plans – an amendment of FASB Statements No. 87, 88, 106, and 132(R).” This statement affects the accounting and reporting for our qualified pension plan, our nonqualified retirement plans, our postretirement welfare benefit plans and our postemployment benefit plan. SFAS 158 requires recognition on the balance sheet of the over- or underfunded position of these plans as the difference between the fair value of plan assets and the related benefit obligations. To the extent that a plan’s net funded status differs from the amounts currently recognized on the balance sheet, the difference, net of tax, will be recorded as part of accumulated other comprehensive income or loss (“AOCI”) within the shareholders’ equity section of |
| | the balance sheet. This guidance also requires the recognition of any unrecognized actuarial gains and losses and unrecognized prior service costs to AOCI, net of tax. Post-adoption changes in unrecognized actuarial gains and losses as well as unrecognized prior service costs will be recognized in other comprehensive income, net of tax. SFAS 158 was effective for PNC as of December 31, 2006, with no restatements permitted for prior year-end reporting periods. The year-end 2006 adjustment to our plans’ funded status for all unamortized net actuarial losses and prior service costs was $132 million after tax. The following table summarizes the effect of the initial impact of adopting SFAS 158. |
Incremental Effect of Applying SFAS 158 on Individual Line Items in the Consolidated Balance Sheet December 31, 2006
| | | | | | | | | | | | |
| In millions | | Before
Application of SFAS 158 | | | Adjustments | | | After
Application of SFAS 158 | |
Other assets | | $ | 9,117 | | | $ | (188 | ) | | $ | 8,929 | |
Total assets | | | 102,008 | | | | (188 | ) | | | 101,820 | |
Other liabilities | | | 4,784 | | | | (56 | ) | | | 4,728 | |
Total liabilities | | | 90,203 | | | | (56 | ) | | | 90,147 | |
Accumulated other comprehensive loss | | | (103 | ) | | | (132 | ) | | | (235 | ) |
Total shareholders’ equity | | $ | 10,920 | | | $ | (132 | ) | | $ | 10,788 | |
| | • | | SFAS 157, “Fair Value Measurements,” defines fair value and establishes a framework for measuring fair value which includes permissible valuation techniques and a hierarchy of inputs utilized in the measurement process. This statement applies whenever other accounting standards require or permit fair value measurement. We anticipate applying SFAS 157 prospectively beginning January 1, 2008, as required. |
| | • | | FASB Interpretation No. 48 (“FIN 48”), “Accounting for Uncertainty in Income Taxes – an interpretation of FASB Statement No. 109.” FIN 48 clarifies the accounting for uncertainty in income taxes recognized in the financial statements and sets forth recognition, derecognition and measurement criteria for tax positions taken or expected to be taken in a tax filing. For PNC, this guidance will apply to all tax positions taken or expected to be taken beginning on January 1, 2007. We do not expect the adoption of FIN 48 to have a significant impact on our consolidated financial statements. |
80
| | • | | FASB Staff Position No. (“FSP”) FAS 13-2, “Accounting for a Change or Projected Change in the Timing of Cash Flows Relating to Income Taxes Generated by a Leveraged Lease Transaction.” This guidance requires a recalculation of the timing of income recognition for a leveraged lease under SFAS 13, “Accounting for Leases,” when a change in the timing of income tax deductions directly related to the leveraged lease transaction occurs or is projected to occur. Any tax positions taken regarding the leveraged lease transaction must be recognized and measured in accordance with FIN 48 described above. This guidance will be effective for PNC beginning January 1, 2007 with the cumulative effect of applying the provisions of this FSP being recognized through an adjustment to opening retained earnings. Any immediate or future reductions in earnings from the change in accounting would be recovered in subsequent years. Our adoption of the guidance in FSP FAS 13-2 resulted in an after-tax charge to beginning retained earnings at January 1, 2007 of approximately $149 million. |
As described under the Loans And Leases section of the Note 1, we adopted SFAS 155 as of January 1, 2006. As described under the Loan Sales, Securitizations And Retained Interest section of Note 1, we also adopted SFAS 156 as of January 1, 2006. The adoption of SFAS 155 and SFAS 156 did not have a material impact on our consolidated financial statements.
In June 2005, the Emerging Issues Task Force (“EITF”) of the FASB issued EITF Issue 04-5, “Determining Whether a General Partner, or the General Partners as a Group, Controls a Limited Partnership or Similar Entity When the Limited Partners Have Certain Rights.” EITF 04-5 provides that the general partner(s) is presumed to control the limited partnership (including certain limited liability companies), unless the limited partners possess either substantive participating rights or the substantive ability to dissolve the limited partnership or otherwise remove the general partner(s) without cause (“kick-out rights”). Kick-out rights are substantive if they can be exercised by a simple majority of the limited partners voting interests. The guidance was effective for all limited partnerships as of January 1, 2006. The adoption of this guidance did not have a material impact on our consolidated financial statements.
NOTE 2 ACQUISITIONS
2006
BLACKROCK/MLIM TRANSACTION
On September 29, 2006, Merrill Lynch contributed its investment management business (“MLIM”) to BlackRock in exchange for 65 million shares of newly issued BlackRock common and preferred stock. BlackRock accounted for the MLIM transaction under the purchase method of accounting.
Immediately following the closing, PNC continued to own approximately 44 million shares of BlackRock common stock
representing an ownership interest of approximately 34% of the combined company (as compared with 69% immediately prior to the closing). Although PNC’s share ownership percentage declined, PNC’s investment in BlackRock increased due to the increase in total equity recorded by BlackRock as a result of the MLIM transaction.
Upon the closing of the BlackRock/MLIM transaction, the carrying value of our investment in BlackRock increased by approximately $3.1 billion to $3.8 billion, primarily reflecting PNC’s portion of the increase in BlackRock’s equity resulting from the value of shares issued in the transaction.
We also recorded a liability at September 30, 2006 for deferred taxes of approximately $.9 billion, related to the excess of the book value over the tax basis of our investment in BlackRock, and a liability of approximately $.6 billion related to our obligation to provide shares of BlackRock common stock to help fund BlackRock long-term incentive plan (“LTIP”) programs. The LTIP liability will be adjusted quarterly based on changes in BlackRock’s common stock price and the number of remaining committed shares. Accordingly, at each quarter-end PNC will record a charge to earnings if the market price of BlackRock’s common stock increases and will record a credit to earnings if BlackRock’s stock price declines.
The overall balance sheet impact of the BlackRock/MLIM transaction was an increase to our shareholders’ equity of approximately $1.6 billion. The increase to equity was comprised of an after-tax gain of approximately $1.3 billion, net of the expense associated with the LTIP liability and the deferred taxes, and an after-tax increase to capital surplus of approximately $.3 billion. The recognition of the gain is consistent with our existing accounting policy for the sale or issuance by subsidiaries of their stock to third parties. The gain represents the difference between our basis in BlackRock stock prior to the BlackRock/MLIM transaction and the new book value per share and resulting increase in value of our investment realized from the transaction. The direct increase to capital surplus rather than inclusion in the gain resulted from the accounting treatment required due to existing BlackRock repurchase commitments or programs.
For 2004, 2005 and for the nine months ended September 30, 2006, our Consolidated Income Statement included our former approximately 69% - 71% ownership interest in BlackRock’s net income through the closing date. However, beginning September 30, 2006, our Consolidated Balance Sheet no longer reflected the consolidation of BlackRock’s balance sheet but recognized our ownership interest in BlackRock as an investment accounted for under the equity method. This accounting has resulted in a reduction in certain revenue and noninterest expense categories on PNC’s Consolidated Income Statement as our share of BlackRock’s net income is now reported within asset management noninterest income.
81
MERCANTILE BANKSHARES CORPORATION
On October 8, 2006 we entered into a definitive agreement with Mercantile Bankshares Corporation (“Mercantile”) for PNC to acquire Mercantile. Mercantile shareholders will be entitled to .4184 shares of PNC common stock and $16.45 in cash for each share of Mercantile, or in the aggregate approximately 53 million shares of PNC common stock and $2.1 billion in cash. Based on PNC’s recent stock prices, the transaction is valued at approximately $6.0 billion in the aggregate.
Mercantile is a bank holding company with approximately $18 billion in assets that provides banking and investment and wealth management services through 240 offices in Maryland, Virginia, the District of Columbia, Delaware and southeastern Pennsylvania. The transaction is expected to close in March 2007 and is subject to customary closing conditions, including regulatory approvals. See Note 13 Borrowed Funds regarding February 2007 debt issuances related to this planned acquisition.
2005
SSRM HOLDINGS, INC.
Effective January 31, 2005, BlackRock closed the acquisition of SSRM Holdings, Inc. (“SSRM”), the holding company of State Street Research & Management Company and SSR Realty Advisors Inc., from MetLife, Inc. for an adjusted purchase price of approximately $265 million in cash and approximately 550,000 shares of BlackRock restricted class A common stock valued at $37 million. SSRM, through its subsidiaries, actively manages stock, bond, balanced and real estate portfolios for both institutional and individual investors. Substantially all of SSRM’s operations were integrated into BlackRock as of the closing date. BlackRock acquired assets under management totaling $50 billion in connection with this transaction.
On January 18, 2005, our ownership in BlackRock was transferred from PNC Bank, N.A. to PNC Bancorp, Inc., our intermediate bank holding company. The transfer was effected primarily to give BlackRock more operating flexibility, particularly in connection with its acquisition of SSRM. As a result of the transfer, certain deferred tax liabilities recorded by PNC were reversed in the first quarter of 2005 in accordance with SFAS 109, “Accounting for Income Taxes.” The reversal of deferred tax liabilities increased our earnings by $45 million, or approximately $.16 per diluted share, in the first quarter of 2005.
RIGGS NATIONAL CORPORATION
We acquired Riggs National Corporation (“Riggs”), a Washington, D.C. based banking company, effective May 13, 2005. Under the terms of the agreement, Riggs merged into The PNC Financial Services Group, Inc. and PNC Bank,
National Association (“PNC Bank, N.A.”) acquired substantially all of the assets of Riggs Bank, National Association, the principal banking subsidiary of Riggs. The acquisition gave us a substantial presence on which to build a market leading franchise in the affluent Washington, D.C. metropolitan area. In connection with the acquisition, Riggs shareholders received an aggregate of approximately $297 million in cash and 6.6 million shares of PNC common stock valued at $356 million.
HARRIS WILLIAMS & CO.
On October 11, 2005, we acquired Harris Williams & Co., one of the nation’s largest firms focused on providing mergers and acquisitions advisory and related services to middle market companies, including private equity firms and private and public companies.
NOTE 3 VARIABLE INTEREST ENTITIES
We are involved with various entities in the normal course of business that may be deemed to be VIEs. We consolidated certain VIEs as of December 31, 2006 and 2005 for which we were determined to be the primary beneficiary.
We hold significant variable interests in VIEs that have not been consolidated because we are not considered the primary beneficiary. Information on these VIEs follows:
Non-Consolidated VIEs – Significant Variable Interests
| | | | | | | | | | |
| In millions | | Aggregate
Assets | | Aggregate
Liabilities | | PNC Risk of Loss | |
December 31, 2006 | | | | | | | | | | |
Market Street | | $ | 4,020 | | $ | 4,020 | | $ | 6,117 | (a) |
Collateralized debt obligations | | | 815 | | | 570 | | | 22 | |
Partnership interests in low income housing projects | | | 33 | | | 30 | | | 8 | |
Total | | $ | 4,868 | | $ | 4,620 | | $ | 6,147 | |
December 31, 2005 | | | | | | | | | | |
Collateralized debt obligations (b) | | $ | 6,290 | | $ | 5,491 | | $ | 51 | |
Private investment funds (b) | | | 5,186 | | | 1,051 | | | 13 | |
Market Street | | | 3,519 | | | 3,519 | | | 5,089 | (a) |
Partnership interests in low income housing projects | | | 35 | | | 29 | | | 2 | |
Total | | $ | 15,030 | | $ | 10,090 | | $ | 5,155 | |
| (a) | PNC’s risk of loss consists of off-balance sheet liquidity commitments to Market Street of $5.6 billion and other credit enhancements of $.6 billion at December 31, 2006. The comparable amounts at December 31, 2005 were $4.6 billion and $.4 billion, respectively. |
| (b) | Primarily held by BlackRock. We deconsolidated BlackRock effective September 29, 2006. See Note 2 Acquisitions for additional information. Includes both PNC’s direct risk of loss and BlackRock’s risk of loss, limited to PNC’s ownership interest in BlackRock. |
82
The aggregate assets and liabilities of VIEs that we have consolidated in our financial statements are as follows:
Consolidated VIEs – PNC Is Primary Beneficiary
| | | | | | |
| In millions | | Aggregate
Assets | | Aggregate
Liabilities |
December 31, 2006 | | | | | | |
Partnership interests in low income housing projects | | $ | 834 | | $ | 834 |
Total | | $ | 834 | | $ | 834 |
December 31, 2005 | | | | | | |
Partnership interests in low income housing projects | | $ | 680 | | $ | 680 |
Other | | | 12 | | | 10 |
Total | | $ | 692 | | $ | 690 |
MARKET STREET
Market Street Funding LLC (“Market Street”), formerly Market Street Funding Corporation, is a multi-seller asset-backed commercial paper conduit that is owned by an independent third party. Market Street’s activities are limited to the purchasing of assets or making of loans secured by interests primarily in pools of receivables from US corporations that desire access to the commercial paper market. Market Street funds the purchases or loans by issuing commercial paper which has been rated A1/P1 by Standard & Poor’s and Moody’s, respectively, and is supported by pool-specific credit enhancement, liquidity facilities and program-level credit enhancement.
PNC Bank, N.A. provides certain administrative services, a portion of the program-level credit enhancement and the majority of liquidity facilities to Market Street in exchange for fees negotiated based on market rates. All of Market Street’s assets at December 31, 2006 and 2005 collateralize the commercial paper obligations. PNC views its credit exposure for the Market Street transactions as limited. Facilities requiring PNC to fund for defaulted assets totaled $850 million at December 31, 2006. For 85% of the liquidity facilities at December 31, 2006, PNC is not required to fund if the assets are in default. PNC may be liable for funding under liquidity facilities for events such as borrower bankruptcies, collateral deficiencies or covenant violations. Additionally, PNC’s obligations under the liquidity facilities are secondary to the risk of first loss provided by the borrower or another third party in the form of deal-specific credit enhancement – for example, by the over collateralization of the assets. Deal-specific credit enhancement that supports the commercial paper issued by Market Street is generally structured to cover a multiple of the expected historical losses for the pool of assets and is sized to generally meet rating agency standards for comparably structured transactions.Credit enhancement is provided in part by PNC Bank, N.A. in the form of a cash collateral account that is funded by a loan facility that expires March 25, 2011. See Note 7 Loans, Commitments To Extend Credit and Concentrations of Credit Risk and Note 24 Commitments and Guarantees for additional information.
Neither creditors nor equity investors in Market Street have any recourse to our general credit. PNC accrued program administrator fees and commitment fees related to PNC’s portion of the liquidity facilities of $11.3 million and $3.7 million, respectively, for the year ended December 31, 2006.
Under the provisions of FASB Interpretation No. 46, “Consolidation of Variable Interest Entities (“FIN 46”), we consolidated Market Street effective July 1, 2003 as we were deemed the primary beneficiary of Market Street. In October 2005, Market Street was restructured as a limited liability company and entered into a subordinated Note Purchase Agreement (“Note”) with an unrelated third party. Consistent with other market participants PNC elected to restructure Market Street and Market Street issued the Note for the primary purpose of providing our customers access to the asset-backed commercial paper markets in a more capital-efficient manner.
The Note provides first loss coverage whereby the investor absorbs losses up to the amount of the Note, which is $5.7 million as of December 31, 2006. The Note has an original maturity of eight years and bears interest at 18% with any default-related interest/fees charged by Market Street on specific transactions accruing to the benefit of the Note holder. Proceeds from the issuance of the Note were placed in a first loss reserve account that may be used to reimburse any losses incurred by Market Street, PNC Bank, N.A. or other providers under the liquidity facilities and the credit enhancement arrangements.
As a result of the Note issuance, we reevaluated whether PNC continued to be the primary beneficiary of Market Street under the provisions of FIN 46R. PNC evaluated the design of Market Street, its capital structure and relationships among the variable interest holders. PNC also performed a quantitative analysis, which computes and allocates expected loss or residual returns to variable interest holders. PNC considered variability generated from the risks specific to Market Street such as expected credit losses, facility pricing (including default-related pricing), and fee volatility in determining that the Note investor absorbed the majority of the expected variability and therefore is the primary beneficiary and required to consolidate Market Street. Based on this analysis, we determined that we were no longer the primary beneficiary and deconsolidated Market Street from our Consolidated Balance Sheet effective October 17, 2005.
As required under FIN 46R, reconsideration events such as changes in the Note contractual terms, additional Note investors and or changes in the inherent Market Street risks would trigger PNC to determine if the primary beneficiary has changed.
LOW INCOME HOUSING PROJECTS
We make certain equity investments in various limited partnerships that sponsor affordable housing projects utilizing the Low Income Housing Tax Credit (“LIHTC”) pursuant to
83
Section 42 of the Internal Revenue Code. The purpose of these investments is to achieve a satisfactory return on capital, to facilitate the sale of additional affordable housing product offerings and to assist us in achieving goals associated with the Community Reinvestment Act. The primary activities of the limited partnerships include the identification, development and operation of multi-family housing that is leased to qualifying residential tenants. Generally, these types of investments are funded through a combination of debt and equity, with equity typically comprising 30% to 60% of the total project capital.
We consolidated those LIHTC investments in which we own a majority of the limited partnership interests. We also consolidated entities in which we, as a national syndicator of affordable housing equity, serve as the general partner (together with the aforementioned LIHTC investments), and no other entity owns a majority of the limited partnership interests. In these syndication transactions, we create funds in which our subsidiary is the general partner and sells limited partnership interests to third parties, and in some cases may also purchase a limited partnership interest in the fund. The fund’s limited partners can generally remove the general partner without cause at any time. The purpose of this business is to generate income from the syndication of these funds and to generate servicing fees by managing the funds. General partner activities include selecting, evaluating, structuring, negotiating, and closing the fund investments in operating limited partnerships, as well as oversight of the ongoing operations of the fund portfolio. The assets are primarily included in Equity Investments on our Consolidated Balance Sheet. Neither creditors nor equity investors in the LIHTC investments have any recourse to our general credit. The consolidated aggregate assets and debt of these LIHTC investments are provided in the Consolidated VIEs – PNC Is Primary Beneficiary table and reflected in the Corporate & Institutional Banking business segment.
We have a significant variable interest in certain other limited partnerships that sponsor affordable housing projects. We do not own a majority of the limited partnership interests in these entities and are not the primary beneficiary. We use the equity method to account for our investment in these entities. Information regarding these partnership interests is reflected in the Non-Consolidated VIEs – Significant Variable Interests table.
We also have subsidiaries that invest in and act as the investment manager for private equity funds organized as limited partnerships as part of our equity management activities. The funds invest in private equity investments to generate capital appreciation and profits. As permitted by FIN 46R, we have deferred applying the provisions of the interpretation for these entities pending further action by the FASB. Information on these entities follows:
Investment Company Accounting – Deferred Application
| | | | | | | | | |
| In millions | | Aggregate
Assets | | Aggregate
Equity | | PNC Risk of Loss |
Private Equity Funds | | | | | | | | | |
December 31, 2006 | | $ | 102 | | $ | 102 | | $ | 104 |
December 31, 2005 | | $ | 109 | | $ | 109 | | $ | 35 |
PNC’s risk of loss in the tables above includes both the value of our equity investments and any unfunded commitments to the respective entities.
PERPETUAL TRUST SECURITIES
In December 2006, one of our indirect subsidiaries, PNC REIT Corp., sold $500 million of 6.517% Fixed-to-Floating Rate Non-Cumulative Exchangeable Perpetual Trust Securities (the “Trust Securities”) of PNC Preferred Funding Trust I, in a private placement. PNC REIT Corp. had previously acquired the Trust Securities from the trust in exchange for an equivalent amount of Fixed-to-Floating Rate Non-Cumulative Perpetual Preferred Securities (the “LLC Preferred Securities”), of PNC Preferred Funding LLC, (the “LLC”), held by PNC REIT Corp. The LLC’s initial material assets consist of indirect interests in mortgages and mortgage-related assets previously owned by PNC REIT Corp.
PNC REIT Corp. also owns 100% of the LLC’s common voting securities. As a result, the LLC is an indirect subsidiary of PNC Bank, N.A. and is consolidated on our Consolidated Balance Sheet. PNC Preferred Funding Trust I’s investment in the LLC Preferred Securities is characterized as a minority interest on our Consolidated Balance Sheet since we are not the primary beneficiary of PNC Preferred Funding Trust I. This minority interest totaled $490 million at December 31, 2006.
NOTE 4 REGULATORY MATTERS
We are subject to the regulations of certain federal and state agencies and undergo periodic examinations by such regulatory authorities.
The access to and cost of funding new business initiatives including acquisitions, the ability to pay dividends, the level of deposit insurance costs, and the level and nature of regulatory oversight depend, in large part, on a financial institution’s capital strength. The minimum regulatory capital ratios are 4% for tier 1 risk-based, 8% for total risk-based and 4% for leverage. However, regulators may require higher capital levels when particular circumstances warrant. To qualify as “well capitalized,” regulators require banks to maintain capital ratios of at least 6% for tier 1 risk-based, 10% for total risk-based and 5% for leverage. At December 31, 2006 and December 31, 2005, each of our bank subsidiaries met the “well capitalized” capital ratio requirements. We believe our bank subsidiaries will continue to meet these requirements in 2007.
84
The following table sets forth regulatory capital ratios for PNC and its only significant bank subsidiary, PNC Bank, N.A.
Regulatory Capital
| | | | | | | | | | | | |
| | | Amount | | Ratios | |
December 31 Dollars in millions | | 2006 | | 2005 | | 2006 | | | 2005 | |
Risk-based capital | | | | | | | | | | | | |
Tier 1 | | | | | | | | | | | | |
PNC | | $ | 8,924 | | $ | 6,364 | | 10.4 | % | | 8.3 | % |
PNC Bank, N.A. | | | 6,159 | | | 5,694 | | 8.0 | | | 8.0 | |
Total | | | | | | | | | | | | |
PNC | | | 11,559 | | | 9,277 | | 13.5 | | | 12.1 | |
PNC Bank, N.A. | | | 8,541 | | | 8,189 | | 11.1 | | | 11.5 | |
Leverage | | | | | | | | | | | | |
PNC | | | NM | | | NM | | 9.3 | | | 7.2 | |
PNC Bank, N.A. | | | NM | | | NM | | 7.2 | | | 7.0 | |
NM - Not Meaningful
The principal source of parent company cash flow is the dividends it receives from PNC Bank, N.A., which may be impacted by the following:
| | • | | Contractual restrictions, and |
Also, there are statutory and regulatory limitations on the ability of national banks to pay dividends or make other capital distributions. The amount available for dividend payments to the parent company by PNC Bank, N.A. without prior regulatory approval was approximately $625 million at December 31, 2006.
Under federal law, bank subsidiaries generally may not extend credit to the parent company or its non-bank subsidiaries on terms and under circumstances that are not substantially the same as comparable extensions of credit to nonaffiliates. No extension of credit may be made to the parent company or a non-bank subsidiary which is in excess of 10% of the capital stock and surplus of such bank subsidiary or in excess of 20% of the capital and surplus of such bank subsidiary as to aggregate extensions of credit to the parent company and its non-bank subsidiaries. Such extensions of credit, with limited exceptions, must be fully collateralized by certain specified assets. In certain circumstances, federal regulatory authorities may impose more restrictive limitations.
Federal Reserve Board regulations require depository institutions to maintain cash reserves with the Federal Reserve Bank (“FRB”). During 2006, subsidiary banks maintained reserves which averaged $203 million.
NOTE 5 LEGAL PROCEEDINGS
Some of our subsidiaries are defendants (or have potential contractual contribution obligations to other defendants) in several pending lawsuits brought during late 2002 and 2003 arising out of the bankruptcy of Adelphia Communications Corporation and its subsidiaries. There also are threatened
additional proceedings arising out of the same matters. One of the lawsuits was brought on Adelphia’s behalf by the unsecured creditors’ committee and equity committee in Adelphia’s consolidated bankruptcy proceeding and was removed to the United States District Court for the Southern District of New York by order dated February 9, 2006. The other lawsuits, one of which is a putative consolidated class action, were brought by holders of debt and equity securities of Adelphia and have been consolidated for pretrial purposes in that district court. These lawsuits arise out of lending and securities underwriting activities engaged in by these PNC subsidiaries together with other financial services companies. In the aggregate, more than 400 other financial services companies and numerous other companies and individuals have been named as defendants in one or more of the lawsuits. Collectively, with respect to some or all of the defendants, the lawsuits allege federal law claims, including violations of federal securities and other federal laws, violations of common law duties, aiding and abetting such violations, voidable preference payments, and fraudulent transfers, among other matters. The lawsuits seek unquantified monetary damages, interest, attorneys’ fees and other expenses, and a return of the alleged voidable preference and fraudulent transfer payments, among other remedies. The bank defendants, including the PNC defendants, have entered into a settlement of the consolidated class action referred to above. This settlement was approved by the district court in November 2006. In December 2006, a group of class members appealed the order approving the settlement agreement to the United States Court of Appeals for the Second Circuit. The amount for which we would be responsible under this settlement is insignificant. We believe that we have defenses to the claims against us in these lawsuits, as well as potential claims against third parties, and intend to defend the remaining lawsuits vigorously. These lawsuits involve complex issues of law and fact, presenting complicated relationships among the many financial and other participants in the events giving rise to these lawsuits, and have not progressed to the point where we can predict the outcome of the remaining lawsuits other than the one for which a settlement is pending. It is not possible to determine what the likely aggregate recoveries on the part of the plaintiffs in these remaining matters might be or the portion of any such recoveries for which we would ultimately be responsible, but the final consequences to PNC could be material.
In April 2005, an amended complaint was filed in the putative class action against PNC, PNC Bank, N.A., our Pension Plan and its Pension Committee in the United States District Court for the Eastern District of Pennsylvania (originally filed in December 2004). The complaint claims violations of the Employee Retirement Income Security Act of 1974, as amended (“ERISA”), arising out of the January 1, 1999 conversion of our Pension Plan from a traditional defined benefit formula into a “cash balance” formula, the design and continued operation of the Plan, and other related matters. Plaintiffs seek to represent a class of all current and former
85
employee-participants in and beneficiaries of the Plan as of December 31, 1998 and thereafter. Plaintiffs also seek to represent a subclass of all current and former employee participants in and beneficiaries of the Plan as of December 31, 1998 and thereafter who were or would have become eligible for an early retirement subsidy under the former Plan at some time prior to the date of the amended complaint. The plaintiffs are seeking unquantified damages and equitable relief available under ERISA, including interest, costs, and attorneys’ fees. In November 2005, the court granted our motion to dismiss the amended complaint. Plaintiffs appealed this ruling to the United States Court of Appeals for the Third Circuit, which affirmed the district court ruling in an opinion dated January 30, 2007. On February 13, 2007, plaintiffs filed in the court of appeals a petition for rehearing. Plaintiffs may seek further judicial review of the dismissal of their complaint.
In March 2006, a first amended complaint was filed in the United States District Court for the Eastern District of Texas by Data Treasury Corporation against PNC and PNC Bank, N.A., as well as more than 50 other financial institutions, vendors, and other companies, claiming that the defendants are infringing, and inducing or contributing to the infringement of, the plaintiff’s patents, which allegedly involve check imaging, storage and transfer. The plaintiff seeks unspecified damages and interest and trebling of both, attorneys’ fees and other expenses, and injunctive relief against the alleged infringement. We are not in a position to assess the likely outcome of this matter, including our exposure, if any. We believe that we have defenses to the claims against us in this lawsuit and intend to defend it vigorously. In January 2007, the district court entered an order staying the claims asserted against PNC under two of the four patents allegedly infringed by PNC, pending reexamination of these patents by the United States Patent and Trademark Office. The lawsuit will proceed with respect to the other two patents. Further, the stay may be lifted once the Patent and Trademark Office completes its reexamination.
In August 2006, a lawsuit was filed in the United States District Court for the Eastern District of Texas by Ronald A. Katz Technology Licensing L. P. (“RAKTL”) against PNC, PNC Bank, N.A., and other defendants. In September 2006, this lawsuit was divided into separate actions, and amended complaints were then filed, one of which was against PNC and PNC Bank, N.A. This lawsuit is one of many related RAKTL patent infringement actions pending in various federal district courts against a large number of defendants. Each of the actions involves a single family of related patents that RAKTL refers to as the “interactive call processing patents.” The amended complaint alleged that PNC and PNC Bank, N.A. are infringing, and inducing or contributing to the infringement of, certain of the plaintiff’s patents. In January 2007, the court dismissed the lawsuit against PNC following a settlement under which PNC and its affiliates received a non-exclusive license covering patents held by RAKTL. As part of the
settlement, we agreed to pay a licensing fee to RAKTL. The amount of the fee is not material to PNC.
In its Form 10-Q for the quarter ended March 31, 2005, Riggs disclosed a number of pending lawsuits. All material lawsuits have been finally resolved, except one where a settlement agreement has been reached, subject to final documentation. The pending settlement is not material to PNC.
As a result of the acquisition of Riggs, PNC is now responsible for Riggs’ obligations to provide indemnification to its directors, officers, and, in some cases, employees and agents against certain liabilities incurred as a result of their service on behalf of or at the request of Riggs. PNC is also now responsible for Riggs’ obligations to advance on behalf of covered individuals costs incurred in connection with certain claims or proceedings, subject to written undertakings to repay all amounts so advanced if it is ultimately determined that the individual is not entitled to indemnification. Since the acquisition, we have advanced such costs on behalf of covered individuals from Riggs and expect to continue to do so in the future at least with respect to lawsuits and other legal matters identified in Riggs’ first quarter 2005 Form 10-Q.
There are several pending judicial or administrative proceedings or other matters arising out of the three 2001 PAGIC transactions. These pending proceedings or other matters are described below. Among the requirements of a June 2003 Deferred Prosecution Agreement that one of our subsidiaries entered into relating to the PAGIC transactions was the establishment of a Restitution Fund through our $90 million contribution. The Restitution Fund will be available to satisfy claims, including for the settlement of the pending securities litigation referred to below. Louis W. Fryman, chairman of Fox Rothschild LLP in Philadelphia, Pennsylvania, is administering the Restitution Fund.
In December 2004 and January and March 2005, we entered into settlement agreements relating to certain of the lawsuits and other claims arising out of the PAGIC transactions. These settlements are described below, following a description of each of these pending proceedings and other matters.
The several putative class action complaints filed during 2002 in the United States District Court for the Western District of Pennsylvania arising out of the PAGIC transactions were consolidated in a consolidated class action complaint brought on behalf of purchasers of our common stock between July 19, 2001 and July 18, 2002 (the “Class Period”). The consolidated class action complaint names PNC, our Chairman and Chief Executive Officer, our former Chief Financial Officer, our Controller, and our independent auditors for 2001 as defendants and seeks unquantified damages, interest, attorneys’ fees and other expenses. The consolidated class action complaint alleges violations of federal securities laws related to disclosures regarding the PAGIC transactions and related matters.
86
In August 2002, the United States Department of Labor began a formal investigation of the Administrative Committee of our Incentive Savings Plan (“Plan”) in connection with the Administrative Committee’s conduct relating to our common stock held by the Plan. Both the Administrative Committee and PNC have cooperated fully with the investigation. In June 2003, the Administrative Committee retained Independent Fiduciary Services, Inc. (“IFS”) to serve as an independent fiduciary charged with the exclusive authority and responsibility to act on behalf of the Plan in connection with the pending securities class action litigation referred to above and to evaluate any legal rights the Plan might have against any parties relating to the PAGIC transactions. This authority includes representing the Plan’s interests in connection with the Restitution Fund set up under the Deferred Prosecution Agreement. The Department of Labor has communicated with IFS in connection with the engagement.
We received a letter in June 2003 on behalf of an alleged shareholder demanding that we take appropriate legal action against our Chairman and Chief Executive Officer, our former Chief Financial Officer, and our Controller, as well as any other individuals or entities allegedly responsible for causing damage to PNC as a result of the PAGIC transactions. The Board referred this matter to a special committee of the Board for evaluation. The special committee completed its evaluation and reported its findings to the Board of Directors and to counsel for the alleged shareholder. The special committee recommended against bringing any claims against our current or former executive officers but made certain recommendations with respect to resolution of potential claims we had with respect to certain other third parties.
In July 2003, the lead underwriter on our Executive Blended Risk insurance coverage filed a lawsuit for a declaratory judgment against PNC and PNC ICLC in the United States District Court for the Western District of Pennsylvania. The complaint seeks a determination that the defendants breached the terms and conditions of the policy and, as a result, the policy does not provide coverage for any loss relating to or arising out of the Department of Justice investigation or the PAGIC transactions. Alternatively, the complaint seeks a determination that the policy does not provide coverage for the payments made pursuant to the Deferred Prosecution Agreement. The complaint also seeks attorneys’ fees and costs. In July 2004, the court granted our motion to stay the action until resolution of the claims against PNC in the pending consolidated class action described above.
In December 2004, we entered into a tentative settlement of the consolidated class action. In March 2005, the parties filed a stipulation of settlement of this lawsuit with the United States District Court for the Western District of Pennsylvania. This settlement also covered claims by the plaintiffs against AIG Financial Products and others related to the PAGIC transactions.
In July 2006, the district court approved this settlement. The defendant in that class action not participating in this
settlement, our former independent auditors for the years ended 2001 and before, had objected to it and, on August 10, 2006, appealed the decision of the district court approving the settlement to the United States Court of Appeals for the Third Circuit.
On December 20, 2006, our former independent auditors for the years ended 2001 and before filed with the district court a tentative settlement agreement with the plaintiffs regarding the plaintiffs’ claims against it. This tentative settlement remains subject to court approval. If this tentative settlement agreement is finally approved by the court and after it becomes effective, this defendant will dismiss its appeal of the court’s approval of our settlement, which would then become final.
In December 2004, we also settled all claims between us, on the one hand, and AIG Financial Products and its affiliate, American International Surplus Lines Insurance Company (“AISLIC”), on the other hand, related to the PAGIC transactions. AIG Financial Products was our counterparty in the PAGIC transactions, and AISLIC is one of the insurers under our Executive Blended Risk insurance coverage. Subsequently, we settled claims against two of the other insurers under our Executive Blended Risk insurance coverage, as described below. Each of the amounts in these settlements represents a portion of the insurer’s share of our overall claim against our insurers with respect to any amounts disbursed out of the Restitution Fund. We are preserving our claim against our insurers with which we have not settled.
The following are the key elements of these settlements that remain conditional at present, pending resolution of the appeal of the district court’s approval of the settlement of the consolidated class action:
| | • | | Payments into Settlement Fund. The insurers under our Executive Blended Risk insurance coverage have funded $30 million to be used for the benefit of the class. Third parties have funded additional amounts to be used for the same purpose. The plaintiffs have been in contact with Mr. Fryman, the administrator of the Restitution Fund, and intend to coordinate the administration and distribution of these settlement funds with the distribution of the Restitution Fund. Neither PNC nor any of our current or former officers, directors or employees will be required to contribute any funds to this settlement. |
| | • | | Assignment of Claims. We have assigned to the plaintiffs claims we may have against our former independent auditors for the years ended 2001 and before and all other unaffiliated third parties (other than AIG Financial Products and its predecessors, successors, parents, subsidiaries, affiliates and their respective directors, officers and employees (collectively, “AIG”)) relating to the subject matter of this lawsuit. |
87
| | • | | Insurance Claims. In March 2005, we settled our claim against one of our insurers under our Executive Blended Risk insurance coverage related to our contribution of $90 million to the Restitution Fund. Under this settlement, the insurer has paid us $11.25 million, but we are obligated to return this amount if the settlement of the consolidated class action referred to above does not receive court approval does not become effective or becomes unenforceable. The amount of this settlement will not be recognized in our income statement until the potential obligation to return the funds has been eliminated. This settlement was in addition to settlements with AISLIC in December 2004 and with another of our insurers under the Executive Blended Risk policy in January 2005. |
| | • | | Other Claims. In connection with the settlement of the consolidated class action, the claims of IFS on behalf of our Incentive Savings Plan and its participants are being resolved and the class covered by the settlement has been expanded to include participants in the Plan. The Department of Labor is not, however, a party to this settlement and thus the settlement does not necessarily resolve its investigation. In addition, the derivative claims asserted by one of our putative shareholders and any other derivative demands that may be filed in connection with the PAGIC transactions are being resolved as a result of the settlement of the consolidated class action. |
| | • | | Releases. We are releasing the insurers providing our Executive Blended Risk insurance coverage from any further liability to PNC arising out of the events that gave rise to the consolidated class action, except for the claims against these insurers (other than those with whom we have settled) relating to the $90 million payment to the Restitution Fund. In addition, PNC and AIG are releasing each other with respect to all claims between us arising out of the PAGIC transactions. |
We will be responsible for the costs of administering the settlement and the Restitution Fund and may incur additional costs in the future in connection with the advancement of expenses and/or indemnification obligations related to the subject matter of this lawsuit. We do not expect such costs to be material.
In connection with industry-wide investigations of practices in the mutual fund industry including market timing, late day trading, employee trading in mutual funds and other matters, several of our subsidiaries have received requests for information and other inquiries from state and federal governmental and regulatory authorities. These subsidiaries are fully cooperating in all of these matters. In addition, as a result of the regulated nature of our business and that of a number of our subsidiaries, particularly in the banking and securities areas, we and our subsidiaries are the subject from time to time of investigations and other forms of regulatory inquiry, often as part of industry-wide regulatory reviews of specified activities. Our practice is to cooperate fully with these investigations and inquiries.
In addition to the proceedings or other matters described above, PNC and persons to whom we may have indemnification obligations, in the normal course of business, are subject to various other pending and threatened legal proceedings in which claims for monetary damages and other relief are asserted. We do not anticipate, at the present time, that the ultimate aggregate liability, if any, arising out of such other legal proceedings will have a material adverse effect on our financial position. However, we cannot now determine whether or not any claims asserted against us or others to whom we may have indemnification obligations, whether in the proceedings or other matters specifically described above or otherwise, will have a material adverse effect on our results of operations in any future reporting period.
88
NOTE 6 SECURITIES
| | | | | | | | | |
| In millions | | Amortized
Cost | | Unrealized | | | Fair Value |
| | | Gains | | Losses | | |
December 31, 2006 | | | | | | | | | |
| | | | |
SECURITIES AVAILABLE FOR SALE (a) | | | | | | | | | |
| | | | |
Debt securities | | | | | | | | | |
U.S. Treasury and government agencies | | $611 | | | | $(3 | ) | | $608 |
Mortgage-backed | | 17,325 | | $39 | | (156 | ) | | 17,208 |
Commercial mortgage-backed | | 3,231 | | 13 | | (25 | ) | | 3,219 |
Asset-backed | | 1,615 | | 3 | | (9 | ) | | 1,609 |
State and municipal | | 140 | | 1 | | (2 | ) | | 139 |
Other debt | | 90 | | | | (3 | ) | | 87 |
Total debt securities | | 23,012 | | 56 | | (198 | ) | | 22,870 |
Corporate stocks and other | | 321 | | 1 | | (1 | ) | | 321 |
Total securities available for sale | | $23,333 | | $57 | | $(199 | ) | | $23,191 |
December 31, 2005 | | | | | | | | | |
| | | | |
SECURITIES AVAILABLE FOR SALE(a) | | | | | | | | | |
Debt securities | | | | | | | | | |
U.S. Treasury and government agencies | | $3,816 | | | | $(72 | ) | | $3,744 |
Mortgage-backed | | 13,794 | | $1 | | (251 | ) | | 13,544 |
Commercial mortgage-backed | | 1,955 | | 1 | | (37 | ) | | 1,919 |
Asset-backed | | 1,073 | | | | (10 | ) | | 1,063 |
State and municipal | | 159 | | 1 | | (2 | ) | | 158 |
Other debt | | 87 | | | | (1 | ) | | 86 |
Total debt securities | | 20,884 | | 3 | | (373 | ) | | 20,514 |
Corporate stocks and other | | 196 | | | | | | | 196 |
Total securities available for sale | | $21,080 | | $3 | | $(373 | ) | | $20,710 |
December 31, 2004 | | | | | | | | | |
SECURITIES AVAILABLE FOR SALE (a) | | | | | | | | | |
Debt securities | | | | | | | | | |
U.S. Treasury and government agencies | | $4,735 | | | | $(13 | ) | | $4,722 |
Mortgage-backed | | 8,506 | | $9 | | (82 | ) | | 8,433 |
Commercial mortgage-backed | | 1,380 | | 5 | | (15 | ) | | 1,370 |
Asset-backed | | 1,910 | | 5 | | (14 | ) | | 1,901 |
State and municipal | | 175 | | 2 | | (1 | ) | | 176 |
Other debt | | 33 | | | | | | | 33 |
Total debt securities | | 16,739 | | 21 | | (125 | ) | | 16,635 |
Corporate stocks and other | | 123 | | 2 | | | | | 125 |
Total securities available for sale | | $16,862 | | $23 | | $(125 | ) | | $16,760 |
| (a) | Securities held to maturity at December 31, 2006 and December 31, 2005 totaled less than $.5 million and at December 31, 2004 totaled $1 million. |
We evaluate our securities available for sale portfolio in light of changing market conditions and other factors and, where appropriate, take steps intended to improve our overall positioning.
At December 31, 2006 and 2005, our most significant concentration of credit risk related to investments issued by the US government and its agencies. This exposure amounted to $.6 billion at December 31, 2006 and $3.7 billion at December 31, 2005.
The fair value of securities available for sale generally decreases when interest rates increase and vice versa. Net unrealized gains and losses in the securities available for sale portfolio are included in shareholders’ equity as accumulated other comprehensive income or loss, net of tax.
The expected weighted-average life of securities available for sale was 3 years and 8 months at December 31, 2006, 4 years and 1 month at December 31, 2005, and 2 years and 8 months at December 31, 2004.
During mid-August through early September 2006, we performed a comprehensive review of our securities available for sale portfolio and, by the end of September 2006, completed the process of executing portfolio rebalancing actions in response to the changing economic landscape, recent statements and actions by the Federal Open Market Committee (in particular, the decision not to raise the federal funds target rate), and our desire to position the securities portfolio to optimize total return performance over the long term.
89
As a result, we repositioned our securities portfolio according to our market views. This included reallocating exposure to certain sectors, selling securities holdings we believed would likely underperform on a relative value basis, and retaining certain existing securities and purchasing incremental securities all of which we believe will outperform the market going forward as further discussed below.
As part of the rebalancing, we assessed the entire securities available for sale portfolio of which, for the majority of positions, fair value was less than amortized cost. We executed a strategy to reduce our US government agency and mortgage-backed security sector allocations and increase our interest rate swap sector allocation. We sold substantially all of our US government agency securities to reduce our interest rate spread exposure to that asset class. The US government agency securities that we retained are characterized by relatively short terms to maturity and smaller individual security balances. We also sold specific securities in the mortgage-backed portfolio (i.e., all of our holdings of specific coupon US government agency pass-through securities and collateralized mortgage obligations having specific collateral characteristics), and in the commercial mortgage-backed portfolio (i.e., all of our holdings of specific vintage securities) that we believe, given the underlying collateral, will underperform on a relative value basis. We retained the remaining holdings in our mortgage-backed portfolio including all of our holdings of mortgage-backed securities
collateralized by hybrid adjustable rate mortgage loans, our commercial mortgage-backed portfolio and our asset-backed portfolio. Our objective was to reduce the portfolio credit spread and interest rate volatility exposures, to position the portfolio for a steeper yield curve and to optimize the relative value performance of the portfolio. We assessed the securities retained relative to the same portfolio objectives, our market view and outlook, our desired sector allocations and our expectation of performance relative to market benchmarks, and, given our assessment, we confirmed our intent to hold these remaining securities until either recovery of fair value or maturity.
The portfolio rebalancing resulted in the sale during the third quarter of 2006 of $6.0 billion of securities available for sale at an aggregate pretax loss of $196 million, or $127 million after-tax. In connection with this rebalancing, we purchased approximately $1.8 billion of securities and added approximately $4.0 billion of interest rate swaps to maintain our interest rate risk position. We also reduced wholesale funding as a result of the actions taken.
The resulting net realized losses on the sale of the securities during the third quarter of 2006 were previously reflected as net unrealized securities losses within accumulated other comprehensive loss in the shareholders’ equity section of PNC’s Consolidated Balance Sheet. Accordingly, total shareholders’ equity did not change as a result of these actions.
The following table presents unrealized loss and fair value of securities at December 31, 2006 and December 31, 2005 for which an other-than-temporary impairment has not been recognized. These securities are segregated between investments that have been in a continuous unrealized loss position for less than twelve months and twelve months or more.
| | | | | | | | | | | | | | | |
In millions December 31, 2006 | | Unrealized loss position less than 12 months | | Unrealized loss position 12 months or more | | Total |
| | | Unrealized Loss | | | Fair Value | | Unrealized Loss | | | Fair Value | | Unrealized Loss | | | Fair Value |
Securities available for sale | | | | | | | | | | | | | | | |
Debt securities | | | | | | | | | | | | | | | |
U.S. Treasury and government agencies | | | | | $15 | | $(3 | ) | | $302 | | $(3 | ) | | $317 |
Mortgage-backed | | $(8 | ) | | 2,717 | | (148 | ) | | 6,925 | | (156 | ) | | 9,642 |
Commercial mortgage-backed | | (3 | ) | | 924 | | (22 | ) | | 778 | | (25 | ) | | 1,702 |
Asset-backed | | (1 | ) | | 414 | | (8 | ) | | 649 | | (9 | ) | | 1,063 |
State and municipal | | | | | 16 | | (2 | ) | | 88 | | (2 | ) | | 104 |
Other debt | | | | | 65 | | (3 | ) | | 59 | | (3 | ) | | 124 |
Total debt securities | | (12 | ) | | 4,151 | | (186 | ) | | 8,801 | | (198 | ) | | 12,952 |
Corporate stocks and other | | | | | | | (1 | ) | | 10 | | (1 | ) | | 10 |
Total | | $(12 | ) | | $4,151 | | $(187 | ) | | $8,811 | | $(199 | ) | | $12,962 |
December 31, 2005 | | | | | | | | | | | | | | | |
Securities available for sale | | | | | | | | | | | | | | | |
Debt securities | | | | | | | | | | | | | | | |
U.S. Treasury and government agencies | | $(33 | ) | | $1,898 | | $(39 | ) | | $1,553 | | $(72 | ) | | $3,451 |
Mortgage-backed | | (161 | ) | | 10,544 | | (90 | ) | | 2,321 | | (251 | ) | | 12,865 |
Commercial mortgage-backed | | (29 | ) | | 1,272 | | (8 | ) | | 339 | | (37 | ) | | 1,611 |
Asset-backed | | (8 | ) | | 835 | | (2 | ) | | 98 | | (10 | ) | | 933 |
State and municipal | | (1 | ) | | 58 | | (1 | ) | | 53 | | (2 | ) | | 111 |
Other debt | | (1 | ) | | 59 | | | | | 4 | | (1 | ) | | 63 |
Total | | $(233 | ) | | $14,666 | | $(140 | ) | | $4,368 | | $(373 | ) | | $19,034 |
90
We do not believe any individual unrealized loss as of December 31, 2006 represents an other-than-temporary impairment. The $156 million unrealized losses reported for mortgage-backed securities relate primarily to securities issued by the Federal National Mortgage Association, the Federal Home Loan Mortgage Corporation and private issuers whose credit rating is “AAA.” The $25 million unrealized losses reported for commercial mortgage-backed securities relate primarily to fixed rate securities. The $9 million unrealized losses associated with asset-backed securities relate primarily to securities collateralized by home equity, automobile and credit card loans. The majority of the unrealized losses associated with both mortgage and asset-backed securities are attributable to changes in interest rates and not from the deterioration of the credit quality of the issuer.
Of those securities in an unrealized loss position for 12 months or more as of December 31, 2006, sixteen (eleven mortgage-backed and five state and municipal) positions with fair value totaling $333 million had an unrealized loss of more than 5% when compared with their amortized cost. The unrealized loss on these positions totaled $26 million and the unrealized loss amount on any individual position did not exceed $5 million. These mortgage-backed securities are primarily collateralized mortgage obligations where amortized cost approximates the par value of the security. These securities are all rated “AAA.” The aggregate unrealized loss on the state and municipal securities positions was not significant.
Information relating to securities sold is set forth in the following table.
Securities Sold
| | | | | | | | | | | | |
Year ended December 31 In millions | | Proceeds | | Gross Gains | | Gross Losses | | Net Gains (Losses) | | | Tax
Expense (Benefit) | |
2006 | | $11,102 | | $2 | | $209 | | $(207 | ) | | $(72 | ) |
2005 | | 13,304 | | 19 | | 60 | | (41 | ) | | (14 | ) |
2004 | | 14,206 | | 94 | | 39 | | 55 | | | 19 | |
The fair value of securities pledged to secure public and trust deposits and repurchase agreements and for other purposes was $10.6 billion at December 31, 2006 and $10.8 billion at December 31, 2005. The pledged securities include positions held in our portfolio of securities available for sale, trading securities that are included in other short-term investments on our Consolidated Balance Sheet, and securities accepted as collateral from others that we are permitted by contract or custom to sell or repledge.
The fair value of securities accepted as collateral that we are permitted by contract or custom to sell or repledge was $1.4 billion at December 31, 2006 and $273 million at December 31, 2005 and is a component of federal funds sold and resale agreements on our Consolidated Balance Sheet. This change reflected an increase in securities sold short, included in other borrowed funds on our Consolidated Balance Sheet. Of the permitted amount, $1.3 billion was repledged to others at December 31, 2006 and all was repledged to others at December 31, 2005.
The following table presents, by remaining contractual maturity, the amortized cost, fair value and weighted-average yield of debt securities at December 31, 2006.
Contractual Maturity Of Debt Securities
| | | | | | | | | | | | | | | |
December 31, 2006 Dollars in millions | | 1 Year or Less | | | After 1 Year through 5 Years | | | After 5 Years through 10 Years | | | After 10
Years | | | Total | |
SECURITIES AVAILABLE FOR SALE | | | | | | | | | | | | | | | |
U.S. Treasury and government agencies | | $452 | | | $145 | | | $1 | | | $13 | | | $611 | |
Mortgage-backed | | 8 | | | 5 | | | 24 | | | 17,288 | | | 17,325 | |
Commercial mortgage-backed | | | | | | | | | | | 3,231 | | | 3,231 | |
Asset-backed | | 12 | | | 84 | | | 86 | | | 1,433 | | | 1,615 | |
State and municipal | | 6 | | | 60 | | | 71 | | | 3 | | | 140 | |
Other debt | | 6 | | | 17 | | | 6 | | | 61 | | | 90 | |
Total debt securities available for sale | | $484 | | | $311 | | | $188 | | | $22,029 | | | $23,012 | |
Fair value | | $484 | | | $307 | | | $185 | | | $21,894 | | | $22,870 | |
Weighted-average yield | | 4.57 | % | | 4.52 | % | | 4.95 | % | | 5.42 | % | | 5.38 | % |
Based on current interest rates and expected prepayment speeds, the total weighted-average expected maturity of mortgage-backed securities was 3 years and 6 months, of commercial mortgage-backed securities was 5 years and 8 months and of asset-backed securities was 2 years and 5 months at December 31, 2006. Weighted-average yields are based on historical cost with effective yields weighted for the contractual maturity of each security.
91
NOTE 7 LOANS, COMMITMENTS TO EXTEND CREDITAND CONCENTRATIONSOF CREDIT RISK
Loans outstanding were as follows:
| | | | | | | | |
| December 31 - in millions | | 2006 | | | 2005 | |
Commercial | | $ | 20,584 | | | $ | 19,325 | |
Commercial real estate | | | 3,532 | | | | 3,162 | |
Consumer | | | 16,515 | | | | 16,173 | |
Residential mortgage | | | 6,337 | | | | 7,307 | |
Lease financing | | | 3,556 | | | | 3,628 | |
Other | | | 376 | | | | 341 | |
Total loans | | | 50,900 | | | | 49,936 | |
Unearned income | | | (795 | ) | | | (835 | ) |
Total loans, net of unearned income | | $ | 50,105 | | | $ | 49,101 | |
We realized net gains from sales of commercial mortgages of $55 million in 2006, $61 million in 2005 and $50 million in 2004. Gains on sales of education loans totaled $33 million in 2006, $19 million in 2005 and $30 million in 2004. Net gains in excess of valuation adjustments related to the liquidation of our institutional loans held for sale totaled $7 million in 2005 and $52 million in 2004.
Concentrations of credit risk exist when changes in economic, industry or geographic factors similarly affect groups of counterparties whose aggregate exposure is material in relation to our total credit exposure. Loans outstanding and related unfunded commitments are concentrated in our primary geographic markets. At December 31, 2006, no specific industry concentration exceeded 3% of total commercial loans outstanding and unfunded commitments.
In the normal course of business, we originate or purchase loan products whose contractual features, when concentrated, may increase our exposure as a holder and servicer of those loan products. Possible product terms and features that may create a concentration of credit risk would include loan products whose terms permit negative amortization, a high loan-to-value ratio, features that may expose the borrower to future increases in repayments above increases in market interest rates, below-market interest rates and interest-only loans, among others.
We originate interest-only loans to commercial borrowers. These products are standard in the financial services industry and the features of these products are considered during the underwriting process to mitigate the increased risk of this product feature that may result in borrowers not being able to make interest and principal payments when due. We do not believe that these product features create a concentration of credit risk.
We also originate home equity loans and lines of credit that result in a credit concentration of high loan-to-value ratio loan products at the time of origination. In addition, these loans are concentrated in our primary geographic markets as discussed above. At December 31, 2006, $5.8 billion of the $15.4 billion of home equity and other consumer loans (included in “Consumer” in the table above) had a loan-to-value ratio greater than 80%. These loans are collateralized primarily by 1-4 family residential properties. As part of our asset and liability management activities, we also periodically purchase residential mortgage loans that are collateralized by 1-4 family residential properties. At December 31, 2006, $2.6 billion of the $6.3 billion of residential mortgage loans were interest-only loans.
During the third quarter of 2006, we announced our plan to sell or securitize approximately $2.1 billion of loans from our residential mortgage portfolio. These transactions were substantially consummated during the fourth quarter of 2006. In accordance with GAAP, these loans were transferred to loans held for sale as of September 30, 2006. We recognized a pretax loss in the third quarter of 2006 of $48 million as a reduction of noninterest income, representing the mark to market valuation of these loans upon transfer to held for sale status. This loss, which is reported in the “Other” business segment, represented the decline in value of the loans almost entirely from the impact of increases in interest rates over the holding period.
92
Net Unfunded Credit Commitments
| | | | | | |
| December 31 - in millions | | 2006 | | 2005 |
Commercial | | $ | 31,009 | | $ | 27,774 |
Consumer | | | 10,495 | | | 9,471 |
Commercial real estate | | | 2,752 | | | 2,337 |
Other | | | 579 | | | 596 |
Total | | $ | 44,835 | | $ | 40,178 |
Commitments to extend credit represent arrangements to lend funds subject to specified contractual conditions. At December 31, 2006, commercial commitments are reported net of $8.3 billion of participations, assignments and syndications, primarily to financial services companies. The comparable amount at December 31, 2005 was $6.7 billion. Commitments generally have fixed expiration dates, may require payment of a fee, and contain termination clauses in the event the customer’s credit quality deteriorates. Based on our historical experience, most commitments expire unfunded, and therefore cash requirements are substantially less than the total commitment. Consumer home equity lines of credit accounted for 74% of consumer unfunded credit commitments.
As a result of deconsolidating Market Street in October 2005, amounts related to Market Street were considered third party unfunded commitments at December 31, 2006 and 2005. These unfunded credit commitments totaled $5.6 billion at December 31, 2006 and $4.6 billion at December 31, 2005 and are included in the preceding table primarily within the “Commercial” and “Consumer” categories.
Net outstanding standby letters of credit totaled $4.4 billion at December 31, 2006 and $4.2 billion at December 31, 2005.
Standby letters of credit commit us to make payments on behalf of customers if certain specified future events occur. Such instruments are typically issued to support industrial revenue bonds, commercial paper, and bid-or-performance related contracts. Maturities for standby letters of credit ranged from 2007 to 2017. See Note 24 Commitments and Guarantees for additional information.
At December 31, 2006, the largest industry concentration was for general medical and surgical hospitals, which accounted for approximately 5% of the total letters of credit and bankers’ acceptances.
At December 31, 2006, we pledged $1.3 billion of loans to the FRB and $24.1 billion of loans to the Federal Home Loan Bank (“FHLB”) as collateral for the contingent ability to borrow, if necessary.
Certain directors and executive officers of PNC and its subsidiaries, as well as certain affiliated companies of these directors and officers, were customers of and had loans with subsidiary banks in the ordinary course of business. All such loans were on substantially the same terms, including interest rates and collateral, as those prevailing at the time for comparable transactions with other customers and did not involve more than a normal risk of collectibility or present other unfavorable features. The aggregate principal amounts of these loans were $18 million at December 31, 2006 and $21 million at December 31, 2005. During 2006, new loans of $58 million were funded and repayments totaled $61 million.
93
NOTE 8 ASSET QUALITY
The following table sets forth nonperforming assets and related information:
| | | | | | |
| December 31 - dollars in millions | | 2006 | | | 2005 | |
Nonaccrual loans | | | | | | |
Commercial | | $109 | | | $134 | |
Commercial real estate | | 12 | | | 14 | |
Consumer | | 13 | | | 10 | |
Residential mortgage | | 12 | | | 15 | |
Lease financing | | 1 | | | 17 | |
Total nonaccrual loans | | $147 | | | $190 | |
Total nonperforming loans | | 147 | | | 190 | |
Nonperforming loans held for sale (a) | | | | | 1 | |
Foreclosed and other assets | | | | | | |
Lease | | 12 | | | 13 | |
Residential mortgage | | 10 | | | 9 | |
Other | | 2 | | | 3 | |
Total foreclosed and other assets | | 24 | | | 25 | |
Total nonperforming assets (b) | | $171 | | | $216 | |
Nonperforming loans to total loans | | .29 | % | | .39 | % |
Nonperforming assets to total loans, loans held for sale and foreclosed assets | | .33 | | | .42 | |
Nonperforming assets to total assets | | .17 | | | .23 | |
Interest on nonperforming loans | | | | | | |
Computed on original terms | | $15 | | | $16 | |
Recognized | | 4 | | | 5 | |
Past due loans | | | | | | |
Accruing loans past due 90 days or more | | $50 | | | $46 | |
As a percentage of total loans | | .10 | % | | .09 | % |
Past due loans held for sale | | | | | | |
Accruing loans held for sale past due 90 days or more | | $9 | | | $47 | |
As a percentage of total loans held for sale | | .38 | % | | 1.92 | % |
| (a) | Includes $1 million of troubled debt restructured loans held for sale at December 31, 2005. |
| (b) | Excludes equity management assets that are carried at estimated fair value of $11 million (including $4 million of troubled debt restructured assets) at December 31, 2006 and $25 million (including $7 million of troubled debt restructured assets) at December 31, 2005. |
Changes in the allowance for loan and lease losses were as follows:
| | | | | | | | | |
| In millions | | 2006 | | | 2005 | | | 2004 | |
January 1 | | $596 | | | $607 | | | $632 | |
Charge-offs | | (180 | ) | | (129 | ) | | (166 | ) |
Recoveries (a) | | 40 | | | 99 | | | 51 | |
Net charge-offs (a) | | (140 | ) | | (30 | ) | | (115 | ) |
Provision for credit losses | | 124 | | | 21 | | | 52 | |
Acquired allowance (b) | | | | | 23 | | | 22 | |
Net change in allowance for unfunded loan commitments and letters of credit | | (20 | ) | | (25 | ) | | 16 | |
December 31 | | $560 | | | $596 | | | $607 | |
| (a) | Amounts for 2005 reflect the impact of a $53 million loan recovery in that year. |
| (b) | Riggs in 2005 and United National Bancorp in 2004. |
Changes in the allowance for unfunded loan commitments and letters of credit were as follows:
| | | | | | | |
| In millions | | 2006 | | 2005 | | 2004 | |
Allowance at January 1 | | $100 | | $75 | | $91 | |
Net change in allowance for unfunded loan commitments and letters of credit | | 20 | | 25 | | (16 | ) |
December 31 | | $120 | | $100 | | $75 | |
All nonperforming loans at December 31, 2006 and 2005 are considered impaired under SFAS 114. Of these totals, impaired loans amounting to $121 million at December 31, 2006 and $148 million at December 31, 2005 had a corresponding specific allowance for loan and lease losses of $32 million and $37 million, respectively. The average balance of impaired loans was $147 million in 2006, $106 million in 2005 and $141 million in 2004. We did not recognize any interest income on impaired loans in 2006, 2005 or 2004.
Loans that are not included in nonperforming or past due categories but cause us to be uncertain about the borrower’s ability to comply with existing repayment terms over the next six months totaled $41 million at December 31, 2006 compared with $67 million at December 31, 2005. Approximately 59% of these loans are in the Corporate & Institutional Banking portfolio.
94
NOTE 9 GOODWILLAND OTHER INTANGIBLE ASSETS
A summary of the changes in goodwill by business segment during 2006 follows:
Goodwill
| | | | | | | |
| In millions | | Dec. 31 2005 | | Additions/ Adjustments | | | Dec. 31 2006 |
Retail Banking | | $1,471 | | $(5 | ) | | $1,466 |
Corporate & Institutional Banking | | 935 | | 3 | | | 938 |
BlackRock | | 190 | | (160 | ) | | 30 |
PFPC | | 968 | | | | | 968 |
Other | | 55 | | (55 | ) | | |
Total | | $3,619 | | $(217 | ) | | $3,402 |
The gross carrying amount, accumulated amortization and net carrying amount of other intangible assets by major category consisted of the following:
Other Intangible Assets
| | | | | | |
| December 31 - in millions | | 2006 | | | 2005 | |
Customer-related and other intangibles | | | | | | |
Gross carrying amount (a) | | $342 | | | $646 | |
Accumulated amortization | | (178 | ) | | (143 | ) |
Net carrying amount | | $164 | | | $503 | |
Mortgage and other loan servicing rights | | | | | | |
Gross carrying amount | | $689 | | | $511 | |
Accumulated amortization | | (212 | ) | | (167 | ) |
Net carrying amount | | $477 | | | $344 | |
Total | | $641 | | | $847 | |
| (a) | Amounts for 2006 were reduced by $305 million related to the BlackRock deconsolidation. See Note 2 Acquisitions for additional information regarding our deconsolidation of BlackRock effective September 29, 2006. |
Most of our other intangible assets have finite lives and are amortized primarily on a straight-line basis or, in the case of mortgage and other loan servicing rights and certain core deposit intangibles, on an accelerated basis.
For customer-related intangibles, the estimated remaining useful lives range from less than one year to 11 years, with a weighted-average remaining useful life of approximately 5 years. Our mortgage and other loan servicing rights are amortized primarily over a period of five to 10 years in proportion to the estimated net servicing income from the related loans.
The changes in the carrying amount of goodwill and net other intangible assets during 2006 follows:
Changes in Goodwill and Other Intangibles
| | | | | | | | | |
| In millions | | Goodwill | | | Customer- Related | | | Servicing Rights | |
December 31, 2005 | | $3,619 | | | $503 | | | $344 | |
Additions/adjustments: | | | | | | | | | |
BlackRock (a) | | (190 | ) | | (305 | ) | | | |
BlackRock stock activity, net | | (25 | ) | | | | | | |
Retail Banking | | (5 | ) | | | | | 2 | |
Other | | | | | | | | 4 | |
Corporate & Institutional Banking | | 3 | | | 1 | | | 172 | |
Reduction in accumulated amortization | | | | | | | | 2 | |
Amortization (b) | | | | | (35 | ) | | (47 | ) |
December 31, 2006 | | $3,402 | | | $164 | | | $477 | |
| (a) | Reflects our deconsolidation of BlackRock. See also note (a) under the “Other Intangible Assets” table. |
| (b) | Amount is net of $17 million of accumulated amortization that was eliminated during the third quarter of 2006 in connection with the deconsolidation of BlackRock. |
Our investment in BlackRock changes when BlackRock repurchases its shares in the open market or issues shares for an acquisition or pursuant to its employee compensation plans. We recognize goodwill when BlackRock repurchases its shares at an amount greater than book value per share and this results in an increase in our percentage ownership interest.
We recognized a net reduction to goodwill of approximately $25 million related to BlackRock stock activity, primarily due to the decrease in our ownership interest in BlackRock from approximately 69% to approximately 34% as a result of the BlackRock/MLIM transaction in 2006. The reduction in goodwill reduced the gain realized by PNC from the transaction.
Servicing revenue from both commercial and residential mortgage servicing assets and liabilities generated contractually specified servicing fees, net interest income from servicing portfolio deposit balances and ancillary fees totaling $139 million for the year ended December 31, 2006. We also generate servicing revenue from fee-based activities provided to others.
Amortization expense on intangible assets for 2006, 2005 and 2004 was $99 million, $74 million and $52 million, respectively. Amortization expense on existing intangible assets for 2007 through 2011 is estimated to be as follows:
We conduct a goodwill impairment test on our reporting units at least annually or more frequently if any adverse triggering
95
events occur. Based on this review, no adjustment for goodwill impairment was deemed necessary for 2006. The fair value of our reporting units is determined by using discounted cash flow and market comparability methodologies.
NOTE 10 PREMISES, EQUIPMENTAND LEASEHOLD IMPROVEMENTS
Premises, equipment and leasehold improvements, stated at cost less accumulated depreciation and amortization, were as follows:
| | | | | | |
| December 31 - in millions | | 2006 | | | 2005 | |
Land | | $187 | | | $186 | |
Buildings | | 937 | | | 881 | |
Equipment | | 1,771 | | | 1,735 | |
Leasehold improvements | | 385 | | | 453 | |
Total | | 3,280 | | | 3,255 | |
Accumulated depreciation and amortization | | (1,578 | ) | | (1,538 | ) |
Net book value | | $1,702 | | | $1,717 | |
Depreciation expense on premises, equipment and leasehold improvements totaled $180 million in 2006, $192 million in 2005 and $159 million in 2004. Amortization expense, primarily for capitalized internally developed software, was $44 million in 2006 and $43 million for both 2005 and 2004.
We lease certain facilities and equipment under agreements expiring at various dates through the year 2071. We account for substantially all such leases as operating leases. Rental expense on such leases amounted to $193 million in 2006, $189 million in 2005 and $174 million in 2004.
Required minimum annual rentals that we owe on noncancelable leases having initial or remaining terms in excess of one year totaled $965 million at December 31, 2006 and $998 million at December 31, 2005. Minimum annual rentals for the years 2007 through 2012 and thereafter are as follows:
| | • | | 2012 and thereafter: $414 million. |
NOTE 11 SECURITIZATIONSAND RETAINED INTERESTS
During 2006, 2005 and 2004, we sold commercial mortgage loans totaling $307 million, $284 million and $460 million, respectively, in securitization transactions through programs with the Government National Mortgage Association (“GNMA”). The transactions and resulting receipt and subsequent sale of securities qualify as sales under the appropriate accounting criteria and resulted in pretax gains of $8 million in 2006, $7 million in 2005 and $8 million in 2004. In addition to the cash proceeds from the sales transactions above, net cash flows between the securitization vehicles and
PNC, including servicing fees, in 2006, 2005 and 2004 related to those transactions were not significant.
Additionally, we sold commercial mortgage and commercial loans of $2.9 billion in 2006, $3.1 billion in 2005 and $1.6 billion in 2004 for cash in other loan sales transactions. These transactions resulted in pretax gains of $55 million in 2006, $54 million in 2005 and $42 million in 2004. See Note 9 Goodwill and Other Intangible Assets for additional information regarding servicing assets.
For the transactions above, we continue to perform servicing and recognized servicing assets of $26 million in 2006, $23 million in 2005 and $14 million in 2004. We also purchased servicing rights for commercial mortgage loans from third parties of approximately $150 million in 2006, $112 million in 2005 and $47 million in 2004.
During the fourth quarter of 2006, we sold residential mortgage loans totaling $358 million in securitization transactions through third party programs. Additionally, we sold residential mortgage loans of $26 million in the fourth quarter of 2006 for cash in other loan sales transactions. For these transactions, we serve as the servicer of record and recognized servicing assets of $4 million in 2006. In accordance with SFAS 156, these servicing assets were initially measured at fair value and we have elected the fair value method to value these residential mortgage servicing assets. The changes in fair value during 2006 and the servicing fees received in 2006 were not significant.
Changes in the mortgage and other loan servicing assets were as follows:
Mortgage and Other Loan Servicing Assets
| | | | | | |
| In millions | | 2006 | | | 2005 | |
Balance at January 1 | | $344 | | | $242 | |
Additions | | 180 | | | 135 | |
Retirements (a) | | | | | | |
Amortization expense | | (47 | ) | | (33 | ) |
Balance at December 31 | | $477 | | | $344 | |
| (a) | 2006 and 2005 included $2 million and $25 million, respectively, of fully amortized retirements. |
Assuming a prepayment speed of 7%-16% for the respective strata discounted at 8%-10%, the estimated fair value of commercial mortgage servicing rights was $546 million at December 31, 2006. A 10% and 20% adverse change in all assumptions used to determine fair value at December 31, 2006, results in a $33 million and $66 million decrease in fair value, respectively. No valuation allowance was necessary at December 31, 2006 or December 31, 2005.
Assuming a prepayment speed of 12% for the respective strata discounted at 9.5%-10%, the estimated fair value of commercial loan servicing rights was $2 million at December 31, 2006. A 10% and 20% adverse change in all assumptions used to determine fair value at December 31, 2006, results in an insignificant decrease in fair value. No valuation allowance was necessary at December 31, 2006.
96
We also own an interest-only strip related to education loans totaling $59 million and $58 million, respectively, at December 31, 2006 and December 31, 2005. This strip was retained from the sales of education loans to a third party trust prior to 2003. Loans that are held by the trust supporting the value of the strip were $88 million and $123 million at December 31, 2006 and December 31, 2005, respectively. The principal of these loans is effectively guaranteed by the federal government. The trust related to the securitization will terminate in 2007.
NOTE 12 DEPOSITS
The aggregate amount of time deposits with a denomination of $100,000 or more was $8.7 billion at December 31, 2006 and $7.1 billion at December 31, 2005.
Contractual maturities of time deposits for the years 2007 through 2012 and thereafter are as follows:
| | • | | 2012 and thereafter: $1.3 billion. |
NOTE 13 BORROWED FUNDS
Bank notes at December 31, 2006 totaling $1.1 billion have interest rates ranging from 2.75% to 10.25% with approximately $575 million maturing in 2007. Senior and subordinated notes consisted of the following:
| | | | | | | |
December 31, 2006 Dollars in millions | | Outstanding | | Stated Rate | | Maturity |
Senior | | | | | | | |
Exchangeable | | $ | 1,000 | | 4.96% | | 2036 |
All other | | | 1,535 | | 4.20%–5.34% | | 2008-2010 |
Total senior | | | 2,535 | | | | |
Subordinated | | | | | | | |
Junior | | | 1,074 | | 5.94%–10.01% | | 2007-2033 |
All other | | | 2,888 | | 4.88%–9.65% | | 2007-2017 |
Total subordinated | | | 3,962 | | | | |
Total senior and subordinated | | $ | 6,497 | | | | |
Included in outstandings for the senior and subordinated notes in the table above are basis adjustments of $13 million and $3 million, respectively, related to fair value accounting hedges as of December 31, 2006.
Total borrowed funds at December 31, 2006 have scheduled or anticipated repayments for the years 2007 through 2012 and thereafter as follows:
| | • | | 2012 and thereafter: $3.6 billion. |
Included in borrowed funds at December 31, 2006 are $1 billion of Floating Rate Exchangeable Senior Notes (“Exchangeable Notes”) that were issued through PNC Funding Corp (“Funding”), a subsidiary of PNC. These notes commenced on December 20, 2006 and are due December 20, 2036. Interest will be paid at a floating rate equal to 3-month LIBOR, reset quarterly, minus 40 basis points, quarterly in arrears, provided that such interest rate will never be less than 0% per annum. The Exchangeable Notes are guaranteed by PNC.
Holders may exchange the Exchangeable Notes for, as specified by Funding, shares of PNC common stock, cash, or a combination of shares and cash at any time on or prior to maturity based on an initial exchange price per share of approximately $128.56, subject to adjustment. Holders have the right to require PNC to repurchase all or a portion of the Exchangeable Notes on December 20, 2007 and periodically thereafter for an amount equal to 100% of the principal plus accrued and unpaid interest. Beginning on December 26, 2007, PNC may redeem the Exchangeable Notes in whole at any time, or in part from time to time, for an amount equal to 100% of the principal plus accrued and unpaid interest.
In connection with the issuance of the Exchangeable Notes, PNC entered into a Registration Rights Agreement (“Agreement”) with the initial purchaser of the Exchangeable Notes. As part of the Agreement PNC agreed to file a registration statement with the SEC, as soon as practicable but in any event within 120 days after the issue date, to register for resale the Exchangeable Notes and the common stock deliverable upon exchange for the Exchangeable Notes. PNC also agreed, among other things, to use its best efforts to cause the registration statement to be declared effective as promptly as practicable but in any event within 240 days after the issue date and to keep the registration statement continuously effective until registration is no longer applicable.
If PNC does not meet these obligations, PNC will be subject to liquidated damages equal to 0.25% per annum of the principal amount of the Exchangeable Notes outstanding. Assuming the Exchangeable Notes remain outstanding through 2036 and PNC does not meet these obligations, the maximum consideration that PNC could be required to transfer under this Agreement is approximately $75 million. We have not recorded a liability for this Agreement at December 31, 2006.
See Note 14 Capital Securities of Subsidiary Trusts for information about the $1.1 billion of junior subordinated debt.
97
During February 2007, in connection with our planned acquisition of Mercantile, we issued $1.9 billion of debt to fund the cash portion of this transaction, comprised of the following:
| | • | | On February 1, 2007, we issued $775 million of floating rate senior notes due January 2012. Interest will be reset quarterly to 3-month LIBOR plus 14 basis points and interest will be paid quarterly. |
| | • | | Also on February 1, 2007, we issued $500 million of floating rate senior notes due January 2014. Interest will be reset quarterly to 3-month LIBOR plus 20 basis points and will be paid quarterly. |
| | • | | On February 8, 2007, we issued $600 million of subordinated notes due February 2017. These notes pay interest semiannually at a fixed rate of 5.625%. |
See Note 2 Acquisitions for additional information regarding Mercantile.
NOTE 14 CAPITAL SECURITIESOF SUBSIDIARY TRUSTS
In December 2006, we elected to redeem all of the underlying Capital Securities related to the PNC Institutional Capital Trust A, UNB Capital Statutory Trust II, and Riggs Capital Trust I. The total Capital Securities redeemed totaled $453 million.
At December 31, 2006, the following capital securities represent non-voting preferred beneficial interests in the assets of PNC Institutional Capital Trust B, PNC Capital Trusts C and D, UNB Capital Trust I, and the Riggs Capital Trust II (the “Trusts”). All of these Trusts are wholly owned finance subsidiaries of PNC. UNB Capital Trust I was acquired effective January 1, 2004 as part of the United National acquisition. Riggs Capital Trust II was acquired in May 2005 as part of the Riggs acquisition. In the event of certain changes or amendments to regulatory requirements or federal tax rules, the capital securities are redeemable in whole. The financial statements of the Trusts are not included in PNC’s consolidated financial statements in accordance with GAAP.
| | • | | Trust B, formed in May 1997, issued $300 million of 8.315% capital securities due May 15, 2027, that are redeemable after May 15, 2007 at a premium that declines from 104.1575% to par on or after May 15, 2017. |
| | • | | Trust C, formed in June 1998, issued $200 million of capital securities due June 1, 2028, bearing interest at a floating rate per annum equal to 3-month LIBOR plus 57 basis points. The rate in effect at December 31, 2006 was 5.94%. Trust C Capital Securities are redeemable on or after June 1, 2008 at par. |
| | • | | Trust D, formed in December 2003, issued $300 million of 6.125% capital securities due December 15, 2033 that are redeemable on or after December 18, 2008 at par. |
| | • | | UNB Capital Trust I, formed in March 1997 with $16 million outstanding of 10.01% capital securities due |
| | March 15, 2027, that are redeemable on or after March 15, 2007 at a premium that declines from 105.00% to par on or after March 15, 2017. PNC has delivered redemption notices to the related trustee to redeem all of these securities on March 15, 2007. |
| | • | | Riggs Capital Trust II was formed in March 1997 when $200 million of 8 7/8% capital securities were issued. These securities are due March 15, 2027, and are redeemable after March 15, 2007 at a premium that declines from 104.438% to par on or after March 15, 2017. Riggs had acquired less than 50% of the capital securities and, therefore, under FIN 46R PNC is not deemed to be the primary beneficiary. Accordingly, the financial statements of this Trust are not consolidated into PNC’s financial results. Junior subordinated debt of $206 million owed by PNC to this Trust is included in PNC’s balance sheet, with the related service cost included in interest expense. The $50 million of acquired capital securities are included as securities available for sale, with the related dividends included in interest income. PNC has delivered redemption notices to the related trustee to redeem all of these securities on March 15, 2007. |
At December 31, 2006, PNC’s junior subordinated debt of $1.1 billion represented debentures issued by PNC and purchased and held as assets by the Trusts.
The obligations of the respective parent of each Trust, when taken collectively, are the equivalent of a full and unconditional guarantee of the obligations of such Trust under the terms of the Capital Securities. Such guarantee is subordinate in right of payment in the same manner as other junior subordinated debt. There are certain restrictions on PNC’s overall ability to obtain funds from its subsidiaries. For additional disclosure on these funding restrictions, including an explanation of dividend and intercompany loan limitations, see Note 4 Regulatory Matters.
NOTE 15 SHAREHOLDERS’ EQUITY
Information related to preferred stock is as follows:
| | | | | | |
| | | | | Preferred Shares |
December 31 Shares in thousands | | Liquidation value per share | | 2006 | | 2005 |
Authorized | | | | | | |
$1 par value | | | | 17,012 | | 17,030 |
Issued and outstanding | | | | | | |
Series A | | $40 | | 7 | | 7 |
Series B | | 40 | | 2 | | 2 |
Series C | | 20 | | 144 | | 152 |
Series D | | 20 | | 196 | | 206 |
Total issued and outstanding | | | | 349 | | 367 |
Series A through D are cumulative and, except for Series B, are redeemable at our option. Annual dividends on Series A, B and D preferred stock total $1.80 per share and on Series C preferred stock total $1.60 per share. Holders of Series A
98
through D preferred stock are entitled to a number of votes equal to the number of full shares of common stock into which such preferred stock is convertible. Series A through D preferred stock have the following conversion privileges: (i) one share of Series A or Series B is convertible into eight shares of PNC common stock; and (ii) 2.4 shares of Series C or Series D are convertible into four shares of PNC common stock.
During 2000, our Board of Directors adopted a shareholder rights plan providing for issuance of share purchase rights. The rights plan provided that, except as otherwise provided in the plan, if a person or group becomes beneficial owner of 10% or more of PNC outstanding common stock, all holders of the rights, other than such person or group, may purchase our common stock or equivalent preferred stock at half of market value. On February 14, 2007, our Board of Directors agreed to amend the existing rights agreement for the shareholder rights plan in order to accelerate the final expiration date of the outstanding share purchase rights issued under the plan from May 25, 2010 to February 28, 2007. The effect of this amendment is that the outstanding share purchase rights expired on February 28, 2007, and the shareholder rights plan pursuant to which the rights were issued is of no further force or effect after that date.
We have a dividend reinvestment and stock purchase plan. Holders of preferred stock and PNC common stock may participate in the plan, which provides that additional shares of common stock may be purchased at market value with reinvested dividends and voluntary cash payments. Common shares issued pursuant to this plan were: 535,394 shares in 2006, 688,665 shares in 2005 and 744,266 shares in 2004.
At December 31, 2006, we had reserved approximately 44.3 million common shares to be issued in connection with certain stock plans and the conversion of certain debt and equity securities.
In February 2005, our Board of Directors authorized the purchase of up to 20 million shares of our common stock in open market or privately negotiated transactions. The 2005 repurchase authorization was a replacement and continuation of the 2004 repurchase program. The 2005 program will remain in effect until fully utilized or until modified, superseded or terminated. During 2006, we purchased 5 million common shares at a total cost of $354 million under the 2005 program. During 2005, we purchased .5 million common shares at a total cost of $26 million under both the 2005 and 2004 common stock repurchase programs, all of which occurred during the first quarter.
NOTE 16 FINANCIAL DERIVATIVES
We use a variety of derivative financial instruments to help manage interest rate, market and credit risk and reduce the effects that changes in interest rates may have on net income, fair value of assets and liabilities, and cash flows. These instruments include interest rate swaps, interest rate caps and floors, futures contracts, and total return swaps.
Fair Value Hedging Strategies
We enter into interest rate and total return swaps, interest rate caps, floors and futures derivative contracts to hedge designated commercial mortgage loans held for sale, commercial loans, bank notes, senior debt and subordinated debt for changes in fair value primarily due to changes in interest rates. Adjustments related to the ineffective portion of fair value hedging instruments are recorded in interest income, interest expense or noninterest income depending on the hedged item.
Cash Flow Hedging Strategy
We enter into interest rate swap contracts to modify the interest rate characteristics of designated commercial loans from variable to fixed in order to reduce the impact of interest rate changes on future interest income. We are hedging our exposure to the variability of future cash flows for all forecasted transactions for a maximum of 10 years for hedges converting floating-rate commercial loans to fixed. The fair value of these derivatives is reported in other assets or other liabilities and offset in accumulated other comprehensive income (loss) for the effective portion of the derivatives. When the hedged transaction culminates, any unrealized gains or losses related to these swap contracts are reclassified from accumulated other comprehensive income (loss) into earnings in the same period or periods during which the hedged forecasted transaction affects earnings and are included in interest income. Ineffectiveness of the strategy, as defined by risk management policies and procedures, if any, is reported in interest income.
During the next twelve months, we expect to reclassify to earnings $30 million of pretax net losses, or $19 million after-tax, on cash flow hedge derivatives currently reported in accumulated other comprehensive income (loss). This amount could differ from amounts actually recognized due to changes in interest rates and the addition of other hedges subsequent to December 31, 2006. These net losses are anticipated to result from net cash flows on receive fixed interest rate swaps that would impact interest income recognized on the related floating rate commercial loans.
As of December 31, 2006 we have determined that there were no hedging positions where it was probable that certain forecasted transactions may not occur within the originally designated time period.
For those hedge relationships that require testing for ineffectiveness, any ineffectiveness present in the hedge relationship is recognized in current earnings. The ineffective portion of the change in value of these derivatives resulted in a $4 million net loss in 2006 compared with a net loss of $3 million in 2005.
During the third quarter of 2006, we recognized a $20 million pretax loss charged to other noninterest income associated with our application of the “short-cut” method of fair value hedge accounting for trust preferred securities.
99
Free-Standing Derivatives
To accommodate customer needs, we also enter into financial derivative transactions primarily consisting of interest rate swaps, interest rate caps and floors, futures, swaptions, and foreign exchange and equity contracts. We primarily manage our market risk exposure from customer positions through transactions with third-party dealers. The credit risk associated with derivatives executed with customers is essentially the same as that involved in extending loans and is subject to normal credit policies. We may obtain collateral based on our assessment of the customer. For derivatives not designated as an accounting hedge, the gain or loss is recognized in trading noninterest income.
Also included in free-standing derivatives are transactions that we enter into for risk management and proprietary purposes that are not designated as accounting hedges, primarily interest rate and basis swaps, total return swaps, interest rate caps and floors, credit default swaps, option contracts and certain interest rate-locked loan origination commitments as well as commitments to buy or sell mortgage loans.
Basis swaps are agreements involving the exchange of payments, based on notional amounts, of two floating rate financial instruments denominated in the same currency, one pegged to one reference rate and the other tied to a second reference rate (e.g., swapping payments tied to one-month LIBOR for payments tied to three-month LIBOR). We use these contracts to mitigate the impact on earnings of exposure to a certain referenced interest rate.
We purchase and sell credit default swaps to mitigate the economic impact of credit losses on specifically identified existing lending relationships or to generate revenue from proprietary trading activities. The fair value of these derivatives typically is based on the change in value, due to changing credit spreads.
Interest rate lock commitments for, as well as commitments to buy or sell, mortgage loans that we intend to sell are considered free-standing derivatives. Our interest rate
exposure on certain commercial mortgage interest rate lock commitments is economically hedged with pay-fixed interest rate swaps and forward sales agreements. These contracts mitigate the impact on earnings of exposure to a certain referenced rate.
Free-standing derivatives also include positions we take based on market expectations or to benefit from price differentials between financial instruments and the market based on stated risk management objectives.
Derivative Counterparty Credit Risk
By purchasing and writing derivative contracts we are exposed to credit risk if the counterparties fail to perform. Our credit risk is equal to the fair value gain in the derivative contract. We minimize credit risk through credit approvals, limits, monitoring procedures and collateral requirements. We generally enter into transactions with counterparties that carry high quality credit ratings.
We enter into risk participation agreements to share some of the credit exposure with other counterparties related to interest rate derivative contracts or to take on credit exposure to generate revenue. We will make/receive payments under these guarantees if a customer defaults on its obligation to perform under certain credit agreements. Risk participation agreements entered into prior to July 1, 2003 were considered financial guarantees and therefore not included in derivatives. Agreements entered into subsequent to June 30, 2003 are included in the derivative table that follows. We determine that we meet our objective of reducing credit risk associated with certain counterparties to derivative contracts when the participation agreements share in their proportional credit losses of those counterparties.
We generally have established agreements with our major derivative dealer counterparties that provide for exchanges of marketable securities or cash to collateralize either party’s positions. At December 31, 2006 we held cash and US government and mortgage-backed securities with a fair value of $109 million and pledged cash with a fair value of $151 million under these agreements.
The total notional or contractual amounts, estimated net fair value and credit risk for derivatives were as follows:
| | | | | | | | | | | | | | |
| | | December 31, 2006 | | | | December 31, 2005 |
| In millions | | Notional/
Contract
amount | | Estimated net
fair value | | Credit risk | | | | Notional/ Contract
amount | | Estimated net fair value | | Credit risk |
ACCOUNTINGHEDGES | | | | | | | | | | | | | | |
Fair value hedges | | $4,996 | | $(1) | | $51 | | | | $5,900 | | $78 | | $108 |
Cash flow hedges | | 7,815 | | 62 | | 72 | | | | 2,926 | | (9) | | 5 |
Total | | $12,811 | | $61 | | $123 | | | | $8,826 | | $69 | | $113 |
FREE-STANDINGDERIVATIVES | | | | | | | | | | | | | | |
Interest rate contracts | | $101,749 | | $21 | | $533 | | | | $70,404 | | $39 | | $372 |
Equity contracts | | 2,393 | | (63) | | 134 | | | | 2,744 | | (79) | | 347 |
Foreign exchange contracts | | 7,203 | | | | 61 | | | | 4,687 | | 4 | | 60 |
Credit derivatives | | 3,626 | | (11) | | 5 | | | | 1,353 | | | | 7 |
Options | | 97,669 | | 68 | | 306 | | | | 51,383 | | 32 | | 168 |
Risk participation agreements | | 786 | | | | | | | | 461 | | | | |
Commitments related to mortgage-related assets | | 2,723 | | 10 | | 15 | | | | 1,695 | | 1 | | 6 |
Other | | 20 | | | | | | | | 254 | | 5 | | 9 |
Total | | $216,169 | | $25 | | $1,054 | | | | $132,981 | | $2 | | $969 |
100
NOTE 17 EMPLOYEE BENEFIT PLANS
PENSION AND POSTRETIREMENT PLANS
We have a noncontributory, qualified defined benefit pension plan covering eligible employees. Benefits are derived from a cash balance formula based on compensation levels, age and length of service. Pension contributions are based on an actuarially determined amount necessary to fund total benefits payable to plan participants.
We also maintain nonqualified supplemental retirement plans for certain employees. We also provide certain health care and life insurance benefits for qualifying retired employees (“postretirement benefits”) through various plans. The nonqualified pension and postretirement benefit plans are unfunded.
During the second quarter of 2005, we acquired a frozen defined benefit pension plan as a result of the Riggs acquisition. Plan assets and projected benefit obligations of the Riggs plan were approximately $107 million and $116 million, respectively, at acquisition date. The $9 million funding deficit was recognized as part of the Riggs acquisition purchase price allocation. For determining contribution amounts to the plan, deficits are calculated using ERISA-mandated rules, and on this basis we contributed approximately $16 million to the Riggs plan during the third quarter of 2005. We integrated the Riggs plan into the PNC plan on December 30, 2005.
We use a measurement date of December 31 for plan assets and benefit obligations. A reconciliation of the changes in the projected benefit obligation for qualified and nonqualified pension plans and postretirement benefit plans as well as the change in plan assets for the qualified pension plan is as follows:
| | | | | | | | | | | | | | | | | | |
| | | Qualified Pension | | | Nonqualified Pension | | | Postretirement Benefits | |
| December 31 (Measurement Date) – in millions | | 2006 | | | 2005 | | | 2006 | | | 2005 | | | 2006 | | | 2005 | |
Accumulated benefit obligation at end of year | | $1,186 | | | $1,232 | | | $73 | | | $69 | | | | | | | |
Projected benefit obligation at beginning of year | | $1,290 | | | $1,166 | | | $73 | | | $72 | | | $270 | | | $276 | |
Riggs acquisition | | | | | 116 | | | | | | 1 | | | | | | 26 | |
Service cost | | 34 | | | 33 | | | 1 | | | 1 | | | 2 | | | 2 | |
Interest cost | | 68 | | | 65 | | | 4 | | | 4 | | | 13 | | | 14 | |
Amendments | | 2 | | | | | | | | | | | | | | | 1 | |
Actuarial loss (gain) (including changes in assumptions) | | (47 | ) | | | | | 3 | | | 2 | | | (30 | ) | | (28 | ) |
Participant contributions | | | | | | | | | | | | | | 7 | | | 7 | |
Federal Medicare subsidy on benefits paid | | | | | | | | | | | | | | 2 | | | | |
Benefits paid | | (102 | ) | | (90 | ) | | (5 | ) | | (7 | ) | | (29 | ) | | (28 | ) |
Projected benefit obligation at end of year | | $1,245 | | | $1,290 | | | $76 | | | $73 | | | $235 | | | $270 | |
Fair value of plan assets at beginning of year | | $1,627 | | | $1,492 | | | | | | | | | | | | | |
Riggs acquisition | | | | | 107 | | | | | | | | | | | | | |
Actual return on plan assets | | 221 | | | 102 | | | | | | | | | | | | | |
Employer contribution | | | | | 16 | | | $5 | | | $7 | | | $20 | | | $21 | |
Participant contributions | | | | | | | | | | | | | | 7 | | | 7 | |
Federal Medicare subsidy on benefits paid | | | | | | | | | | | | | | 2 | | | | |
Benefits paid | | (102 | ) | | (90 | ) | | (5 | ) | | (7 | ) | | (29 | ) | | (28 | ) |
Fair value of plan assets at end of year | | $1,746 | | | $1,627 | | | | | | | | | | | | | |
Funded status | | $501 | | | $337 | | | $(76 | ) | | $(73 | ) | | $(235 | ) | | $(270 | ) |
Unrecognized net actuarial loss | | | | | 340 | | | | | | 26 | | | | | | 64 | |
Unrecognized prior service cost (credit) | | | | | (1 | ) | | | | | 1 | | | | | | (38 | ) |
Net amount recognized on the balance sheet | | $501 | | | $676 | | | $(76 | ) | | $(46 | ) | | $(235 | ) | | $(244 | ) |
Amounts recognized in the Consolidated Balance Sheet consist of: | | | | | | | | | | | | | | | | | | |
Other assets (Other liabilities) | | $501 | | | | | | $(76 | ) | | | | | $(235 | ) | | | |
Prepaid (accrued) pension cost | | | | | $676 | | | | | | $(46 | ) | | | | | $(244 | ) |
Additional minimum liability | | | | | | | | | | | (23 | ) | | | | | | |
Intangible asset | | | | | | | | | | | 1 | | | | | | | |
Accumulated other comprehensive loss | | | | | | | | | | | 22 | | | | | | | |
Net amount recognized in the Consolidated Balance Sheet | | $501 | | | $676 | | | $(76 | ) | | $(46 | ) | | $(235 | ) | | $(244 | ) |
Amounts recognized in accumulated other comprehensive income consist of: | | | | | | | | | | | | | | | | | | |
Prior service cost (credit) | | 2 | | | | | | | | | | | | (31 | ) | | | |
Net actuarial loss | | 184 | | | | | | 28 | | | | | | 33 | | | | |
Amount recognized in AOCI | | $186 | | | | | | $28 | | | | | | $2 | | | | |
The fair value of the qualified pension plan assets exceeds both the accumulated benefit obligation and the projected benefit obligation. The nonqualified pension plan, which contains several individual plans that are accounted for together, is unfunded. Contributions from us and, in the case of postretirement benefit plans, participant contributions cover all benefits paid under the nonqualified pension plan and postretirement benefit plans. The benefit obligations, asset values, funded status and balance sheet impacts are shown in the above table.
101
PENSION PLAN ASSETS
Assets related to our qualified pension plan (the “Plan”) are held in trust (the “Trust”). The trustee is PNC Bank, N.A. The Trust is exempt from tax pursuant to section 501(a) of the Internal Revenue Code (the “Code”). The Plan is qualified under section 401(a) of the Code. Plan assets consist primarily of listed domestic and international equity securities and US government, agency, and corporate debt securities and real estate investments. Plan assets do not include common or preferred stock or any debt of PNC.
The Pension Plan Administrative Committee (the “Committee”) adopted the current Pension Plan Investment Policy Statement, including the updated target allocations and allowable ranges shown below, on November 29, 2005.
The long-term investment strategy for pension plan assets is to:
| | • | | Meet present and future benefit obligations to all participants and beneficiaries, |
| | • | | Cover reasonable expenses incurred to provide such benefits, including expense incurred in the administration of the Trust and the Plan, |
| | • | | Provide sufficient liquidity to meet benefit and expense payment requirements on a timely basis, and |
| | • | | Provide a total return that, over the long term, maximizes the ratio of trust assets to liabilities by maximizing investment return, at an appropriate level of risk. |
The Plan’s specific investment objective is to meet or exceed the investment policy benchmark over the long term. The investment policy benchmark compares actual performance to a weighted market index, and measures the contribution of active investment management and policy implementation. This investment objective is expected to be achieved over the long term (one or more market cycles) and is measured over rolling five-year periods. Total return calculations are time-weighted and are net of investment-related fees and expenses.
The asset allocations for the Trust at the end of 2006 and 2005, and the target allocation for 2007, by asset category, are as follows:
| | | | | | | | | | | | |
| | | Target Allocation | | | Allowable Range | | | Percentage of Plan Assets at December 31 | |
| | | 2007 | | | | | | 2006 | | | 2005 | |
Asset Category | | | | | | | | | | | | |
Domestic Equity | | 35 | % | | 32-38 | % | | 39.3 | % | | 39.0 | % |
International Equity | | 20 | % | | 17-23 | % | | 21.3 | % | | 19.6 | % |
Private Equity | | 5 | % | | 0-8 | % | | 1.5 | % | | .9 | % |
Total Equity | | 60 | % | | | | | 62.1 | % | | 59.5 | % |
Domestic Fixed Income | | 30 | % | | 27-33 | % | | 28 | % | | 30.7 | % |
High Yield Fixed Income | | 5 | % | | 0-8 | % | | 4.9 | % | | 6.7 | % |
Total Fixed Income | | 35 | % | | | | | 32.9 | % | | 37.4 | % |
Real Estate | | 5 | % | | 0-8 | % | | 4.8 | % | | 2.5 | % |
Other | | 0 | % | | 0-1 | % | | .2 | % | | .6 | % |
Total | | 100 | % | | | | | 100 | % | | 100 | % |
The Asset Category represents the allocation of Plan assets in accordance with the investment objective of each of the Plan’s investment managers. Certain domestic equity investment managers utilize derivatives and fixed income securities as described in their investment management agreements to achieve their investment objective under the Investment Policy Statement.
The slight overweight in domestic equity at year-end 2005 and 2006 was attributable to the targeted allocation in Private Equity, which continues to be committed but which is funded over time as suitable opportunities for private equity investment are identified and as calls for funding are made. The Investment Policy Statement provides that, from time to time, domestic equity may serve as a proxy (substitute) for private equity. Additionally, target allocation changes, which were effective November 29, 2005, included reducing the High Yield Fixed Income allocation from 10% to 5% and creating a new Real Estate allocation of 5%. This transition was completed during 2006.
We believe that, over the long term, asset allocation is the single greatest determinant of risk. Asset allocation will deviate from the target percentages due to market movement, cash flows, and investment manager performance. Material deviations from the asset allocation targets can alter the expected return and risk of the Trust. On the other hand, frequent rebalancing to the asset allocation targets may result in significant transaction costs, which can impair the Trust’s ability to meet its investment objective. Accordingly, the Trust portfolio is periodically rebalanced to maintain asset allocation within the target ranges described above.
In addition to being diversified across asset classes, the Trust is diversified within each asset class. Secondary diversification provides a reasonable basis for the expectation that no single security or class of securities will have a disproportionate impact on the total risk and return of the Trust.
The Committee selects investment managers for the Trust based on the contributions that their respective investment styles and processes are expected to make to the investment performance of the overall portfolio. The managers’ Investment Objectives and Guidelines, which are a part of each manager’s Investment Management Agreement, document performance expectations and each manager’s role in the portfolio. The Committee uses the Investment Objectives and Guidelines to establish, guide, control and measure the strategy and performance for each manager.
The purpose of investment manager guidelines is to:
| | • | | Establish the investment objective and performance standards for each manager, |
| | • | | Provide the manager with the capability to evaluate the risks of all financial instruments or other assets in which the manager’s account is invested, and |
| | • | | Prevent the manager from exposing its account to excessive levels of risk, undesired or inappropriate risk, or disproportionate concentration of risk. |
102
The guidelines also indicate which investments and strategies the manager is permitted to use to achieve its performance objectives, and which investments and strategies it is prohibited from using.
Where public market investment strategies may include the use of derivatives and/or currency management, language is incorporated in the managers’ guidelines to define allowable and prohibited transactions and/or strategies. Derivatives are typically employed by investment managers to modify risk/return characteristics of their portfolio(s), implement asset allocation changes in a cost-effective manner, or reduce transaction costs. Under the managers’ investment guidelines, derivatives may not be used solely for speculation or leverage. Derivatives are used only in circumstances where they offer the most efficient economic means of improving the risk/reward profile of the portfolio.
BlackRock, PFPC and our Retail Banking business segment receive compensation for providing investment management, trustee and custodial services for the majority of the Trust portfolio. Compensation for such services is paid by PNC. Non-affiliate service providers for the Trust are compensated from plan assets.
The following table provides information regarding our estimated future cash flows related to our various plans:
Estimated Cash Flows
| | | | | | | | |
| | | | | | | Postretirement Benefits |
| In millions | | Qualified Pension | | Nonqualified Pension | | Gross PNC Benefit Payments | | Reduction in
PNC Benefit
Payments Due
to Medicare Part D Subsidy |
Estimated 2007 employer contributions | | None | | $8 | | $24 | | $2 |
Estimated future benefit payments | | | | | | | | |
| 2007 | | $107 | | $8 | | $24 | | $2 |
| 2008 | | 111 | | 9 | | 24 | | 2 |
| 2009 | | 117 | | 9 | | 24 | | 2 |
| 2010 | | 116 | | 10 | | 24 | | 2 |
| 2011 | | 121 | | 9 | | 24 | | 2 |
| 2012 – 2016 | | 589 | | 34 | | 113 | | 9 |
The qualified pension plan contributions are deposited into the Trust, and the qualified pension plan benefit payments are paid from the Trust. For the other plans, total contributions and the benefit payments are the same and represent expected benefit amounts, which are paid from general assets. Postretirement benefits are net of participant contributions.
The components of net periodic pension and postretirement benefit cost/(income) were as follows:
| | | | | | | | | | | | | | | | | | | | | | | | |
| | | Qualified Pension Plan | | | Nonqualified Pension Plan | | Postretirement Benefits | |
| Year ended December 31 – in millions | | 2006 | | | 2005 | | | 2004 | | | 2006 | | 2005 | | 2004 | | 2006 | | | 2005 | | | 2004 | |
Service cost | | $34 | | | $33 | | | $35 | | | $1 | | $1 | | $1 | | $2 | | | $2 | | | $3 | |
Interest cost | | 68 | | | 65 | | | 65 | | | 4 | | 4 | | 4 | | 13 | | | 14 | | | 17 | |
Expected return on plan assets | | (129 | ) | | (128 | ) | | (112 | ) | | | | | | | | | | | | | | | |
Amortization of prior service cost | | (1 | ) | | (1 | ) | | (1 | ) | | | | | | | | (6 | ) | | (7 | ) | | (6 | ) |
Amortization of actuarial losses (gains) | | 16 | | | 23 | | | 23 | | | 3 | | 3 | | 3 | | 1 | | | 4 | | | 5 | |
Curtailment (gain) | | | | | | | | (1 | ) | | | | | | | | | | | | | | | |
Net periodic cost | | $(12 | ) | | $(8 | ) | | $9 | | | $8 | | $8 | | $8 | | $10 | | | $13 | | | $19 | |
The weighted-average assumptions used (as of the beginning of each year) to determine net periodic costs shown above were as follows:
| | | | | | | | | |
| | | Net Periodic Cost Determination | |
| Year ended December 31 | | 2006 | | | 2005 | | | 2004 | |
Discount rate | | | | | | | | | |
Qualified pension | | 5.50 | % | | 5.25 | % | | 6.00 | % |
Nonqualified pension | | 5.40 | | | 5.25 | | | 6.00 | |
Postretirement benefits | | 5.60 | | | 5.25 | | | 6.00 | |
Rate of compensation increase (average) | | 4.00 | | | 4.00 | | | 4.00 | |
Assumed health care cost trend rate | | | | | | | | | |
Initial trend | | 10.00 | | | 10.00 | | | 11.00 | |
Ultimate trend | | 5.00 | | | 5.00 | | | 5.00 | |
Year ultimate reached | | 2011 | | | 2010 | | | 2010 | |
Expected long-term return on plan assets | | 8.25 | | | 8.50 | | | 8.50 | |
The weighted-average assumptions used (as of the end of each year) to determine year-end obligations for both pension and postretirement benefits were as follows:
| | | | | | |
| | | At December 31 | |
| | | 2006 | | | 2005 | |
Discount rate | | | | | | |
Qualified pension | | 5.70 | % | | 5.50 | % |
Nonqualified pension | | 5.60 | | | 5.40 | |
Postretirement benefits | | 5.80 | | | 5.60 | |
Rate of compensation increase | | 4.00 | | | 4.00 | |
Assumed health care cost trend rate | | | | | | |
Initial trend | | 10.00 | | | 10.00 | |
Ultimate trend | | 5.00 | | | 5.00 | |
Year to reach ultimate | | 2012 | | | 2011 | |
As of December 31, 2006 and December 31, 2005, the discount rate assumptions were determined independently for each plan reflecting the duration of each plan’s obligations.
103
Specifically, a yield curve was produced for a universe containing the majority of US-issued Aa grade corporate bonds, all of which were non-callable (or callable with make-whole provisions).
Excluded from this yield curve were the 10% of the bonds with the highest yields and the 10% with the lowest yields. For each plan, the discount rate was determined as the level equivalent rate that would produce the same present value obligation as that using spot rates aligned with the projected benefit payments.
The health care cost trend rate assumptions shown in the preceding tables relate only to the postretirement benefit plans. A one-percentage-point change in assumed health care cost trend rates would have the following effects:
| | | | | |
| | |
Year ended December 31, 2006 In millions | | Increase | | Decrease | |
Effect on total service and interest cost | | $1 | | $(1 | ) |
Effect on year-end benefit obligation | | 11 | | (9 | ) |
As discussed in Note 1 Accounting Policies, we adopted SFAS 158 at December 31, 2006. Under SFAS 158, beginning December 31, 2006, unamortized actuarial gains and losses and prior service costs and credits are recognized in AOCI each December 31, while amortization of these amounts through net periodic benefit cost will occur in accordance with FAS 87 and 106. The estimated amounts that will be amortized in 2007 are as follows:
| | | | | | | |
| | | 2007 Estimate | |
Year ended December 31 In millions | | Qualified
Pension | | Nonqualified
Pension | | Postretirement
Benefits | |
Prior service cost (credit) | | | | | | $ | (7) |
Net actuarial loss (gain) | | $1 | | $2 | | | 1 |
Total | | $1 | | $2 | | $ | (6) |
MEDICARE REFORM
In December 2003, the Medicare Prescription Drug Improvement and Modernization Act of 2003 (the “Act”) was enacted. The Act established a prescription drug benefit under Medicare, known as “Medicare Part D,” and a federal subsidy to sponsors of postretirement plans that provide a benefit that is at least actuarially equivalent to Medicare Part D. Our actuaries have attested that the benefits we provide to certain participants are at least actuarially equivalent to Medicare Part D, and, accordingly, we will be entitled to a subsidy.
DEFINED CONTRIBUTION PLANS
We have a contributory, qualified defined contribution plan that covers substantially all employees except those covered by other plans as identified below. Under this plan, employee contributions up to 6% of eligible compensation as defined by the plan are matched 100%, subject to Code limitations. The plan is a 401(k) plan and includes an employee stock ownership (“ESOP”) feature. Employee contributions are
invested in a number of investment options available under the plan, including a PNC common stock fund and several BlackRock mutual funds, at the direction of the employee. All shares of PNC common stock held by the plan are part of the ESOP. Employee contributions to the plan for 2006, 2005 and 2004 were matched primarily by shares of PNC common stock held in treasury, except in the case of those participants who have exercised their diversification election rights to have their matching portion in other investments available within the plan. Effective November 22, 2005, we amended the plan to provide all participants the ability to diversify the matching portion of their plan account invested in shares of PNC common stock into other investments available within the plan. Prior to this amendment, only participants age 50 or older were permitted to exercise this diversification option. Employee benefits expense related to this plan was $52 million in 2006, $47 million in 2005 and $48 million in 2004. We measured employee benefits expense as the fair value of the shares and cash contributed to the plan by PNC.
In conjunction with the BlackRock deconsolidation, BlackRock employees ceased participating in the plan September 30, 2006. On October 3, 2006, approximately $127 million in plan assets were transferred from the plan.
Additionally, Hilliard Lyons sponsors a contributory, qualified defined contribution plan that covers substantially all of its employees who are not covered by the plan described above. Contributions to this plan are made in cash and include a base contribution for those participants employed at December 31, a matching of employee contributions, and a discretionary profit sharing contribution as determined by Hilliard Lyons’ Executive Compensation Committee. Employee benefits expense for this plan was $5 million in 2006, $6 million in 2005 and $5 million in 2004.
Effective July 1, 2004, we adopted a separate qualified defined contribution plan that covers substantially all US-based PFPC employees not covered by our plan. The plan is a 401(k) plan and includes an ESOP feature. Under this plan, employee contributions of up to 6% of eligible compensation as defined by the plan may be matched annually based on PFPC performance levels. Participants must be employed as of December 31 of each year to receive this annual contribution. The performance-based employer matching contribution will be made primarily in shares of PNC common stock held in treasury, except in the case of those participants who have exercised their diversification election rights to have their matching portion in other investments available within the plan. Mandatory employer contributions to this plan are made in cash and include employer basic and transitional contributions. Employee-directed contributions are invested in a number of investment options available under the plan, including a PNC common stock fund and several BlackRock mutual funds, at the direction of the employee. Effective November 22, 2005, we amended the plan to provide all participants the ability to
104
diversify the matching portion of their plan account invested in shares of PNC common stock into other investments available within the plan. Prior to this amendment, only participants age 50 or older were permitted to exercise this diversification option. Employee benefits expense for this plan, which was effective July 1, 2004, was $9 million in 2006, $12 million in 2005 and $5 million for 2004. We measured employee benefits expense as the fair value of the shares and cash contributed to the plan.
We also maintain a nonqualified supplemental savings plan for certain employees.
NOTE 18 STOCK-BASED COMPENSATION PLANS
We have long-term incentive award plans (“Incentive Plans”) that provide for the granting of incentive stock options, nonqualified stock options, stock appreciation rights, incentive shares/performance units, restricted stock, other share-based awards and dollar-denominated awards to executives and, other than incentive stock options, to non-employee directors. As of December 31, 2006, no incentive stock options or stock appreciation rights were outstanding.
NONQUALIFIED STOCK OPTIONS
Options are granted at exercise prices not less than the market value of common stock on the grant date. Generally, options granted since 1999 become exercisable in installments after the grant date. Options granted prior to 1999 are mainly
exercisable 12 months after the grant date. No option may be exercisable after 10 years from its grant date. Payment of the option exercise price may be in cash or previously owned shares of common stock at market value on the exercise date.
Generally, options granted under the Incentive Plans vest ratably over a three-year period as long as the grantee remains an employee or, in certain cases, retires from PNC. For all options granted prior to the adoption of SFAS 123R, we recognized compensation expense over the three-year vesting period. If an employee retired prior to the end of the three-year vesting period, we accelerated the expensing of all unrecognized compensation costs at the retirement date. As required under SFAS 123R, we recognize compensation expense for options granted to retirement-eligible employees after January 1, 2006 in the period granted, in accordance with the service period provisions of the options.
A summary of stock option activity follows:
| | | | | | | |
| | | Per Option | | | |
Options outstanding at
December 31 Shares in thousands | | Exercise Price | | Weighted -Average
Exercise
Price | | Shares | |
December 31, 2005 | | $31.13 – $76.00 | | $55.30 | | 18,292 | |
Granted | | 62.71 – 71.38 | | 67.83 | | 2,410 | |
Exercised | | 31.13 – 66.97 | | 49.32 | | (5,462 | ) |
Forfeited | | 43.41 – 74.59 | | 66.49 | | (290 | ) |
December 31, 2006 | | $37.43 – $76.00 | | $59.29 | | 14,950 | |
Information about stock options outstanding at December 31, 2006 follows:
| | | | | | | | | | | | | | |
| | | Options Outstanding | | | | Options Exercisable |
December 31, 2006 Shares in thousands Range of exercise prices | | Shares | | Weighted-average
exercise price | | Weighted-average remaining
contractual life (in years) | | | | Shares | | Weighted-average
exercise price |
$37.43 – $42.99 | | 680 | | $ | 41.60 | | 3.5 | | | | 680 | | $ | 41.60 |
43.00 – 52.99 | | 2,003 | | | 46.70 | | 4.9 | | | | 1,949 | | | 46.55 |
53.00 – 59.99 | | 6,555 | | | 55.07 | | 6.1 | | | | 4,765 | | | 55.58 |
60.00 – 76.00 | | 5,712 | | | 70.64 | | 5.5 | | | | 3,349 | | | 72.65 |
Total | | 14,950 | | $ | 59.29 | | 5.6 | | | | 10,743 | | $ | 58.38 |
At December 31, 2006, there were approximately 14,304,000 options in total that were vested and are expected to vest. The weighted-average grant-date fair value of such options was $59.19 per share, the weighted-average remaining contractual life was approximately 5.5 years, and the aggregate intrinsic value at December 31, 2006 was approximately $219 million.
Options granted in 2005 and 2004 include options for 30,000 shares that were granted to non-employee directors in each year. No such options were granted in 2006.
The weighted-average grant-date fair value of options granted in 2006, 2005 and 2004 was $9.94, $8.72 and $9.64 per option, respectively. At December 31, 2005 and 2004 options for 13,582,000 and 12,693,000 shares of common stock,
respectively, were exercisable at a weighted-average price of $56.58 and $56.41, respectively. The total intrinsic value of options exercised during 2006, 2005 and 2004 was $111 million, $31 million and $17 million, respectively. At December 31, 2006 the aggregate intrinsic value of all options outstanding and exercisable was $227 million and $173 million, respectively.
Cash received from option exercises under all Incentive Plans for 2006, 2005 and 2004 was approximately $233 million, $98 million and $42 million, respectively. The actual tax benefit realized for tax deduction purposes from option exercises under all Incentive Plans for 2006, 2005 and 2004 was approximately $82 million, $34 million and $15 million, respectively.
105
There were no options granted in excess of market value in 2006, 2005 or 2004. Shares of common stock available during the next year for the granting of options and other awards under the Incentive Plans were 42,767,760 at December 31, 2006.
During 2006, we issued approximately 4.9 million shares from treasury stock in connection with stock option exercise activity. As with past exercise activity, we intend to utilize treasury stock for future stock option exercises.
As discussed in Note 1 Accounting Policies, we adopted the fair value recognition provisions of SFAS 123 prospectively to all employee awards including stock options granted, modified or settled after January 1, 2003. As permitted under SFAS 123, we recognized compensation expense for stock options on a straight-line basis over the pro rata vesting period. Total compensation expense recognized related to PNC stock options in 2006 was $31 million compared with $29 million in 2005 and $21 million in 2004.
PRO FORMA EFFECTS
A table is included in Note 1 Accounting Policies that sets forth pro forma net income and basic and diluted earnings per share as if compensation expense had been recognized under SFAS 123 and 123R, as amended, for stock options for 2006, 2005 and 2004.
For purposes of computing stock option expense and pro forma results, we estimated the fair value of stock options using the Black-Scholes option pricing model. The model requires the use of numerous assumptions, many of which are very subjective. Therefore, the pro forma results are estimates of results of operations as if compensation expense had been recognized for all stock-based compensation awards and are not indicative of the impact on future periods.
We used the following assumptions in the option pricing model for purposes of estimating pro forma results as well as to determine actual stock option expense:
| | • | | The risk-free interest rate is based on the US Treasury yield curve, |
| | • | | The dividend yield represents average yields over the previous three-year period, |
| | • | | Volatility is measured using the fluctuation in month-end closing stock prices over a five-year period, and |
| | • | | The expected life assumption represents the period of time that options granted are expected to be outstanding and is based on a weighted-average of historical option activity. |
Option Pricing Assumptions
| | | | | | | | | |
Weighted-average for the year ended December 31 | | 2006 | | | 2005 | | | 2004 | |
Risk-free interest rate | | 4.5 | % | | 3.8 | % | | 3.4 | % |
Dividend yield | | 3.7 | | | 3.8 | | | 3.6 | |
Volatility | | 20.5 | | | 25.7 | | | 28.9 | |
Expected life | | 5.1 | yrs. | | 4.8 | yrs. | | 4.9 | yrs. |
INCENTIVE/PERFORMANCE UNIT SHAREAND RESTRICTED STOCK AWARDS
The fair value of nonvested incentive/performance unit shares and restricted stock awards is initially determined based on the average of the high and low of our common stock price on the date of grant. Incentive/performance unit shares are subsequently valued subject to the achievement of one or more financial and other performance goals over a three-year period. The Personnel and Compensation Committee of the Board of Directors approves the final award of incentive/performance unit shares. Restricted stock awards have various vesting periods ranging from 36 months to 60 months. There are no financial or performance goals associated with any of our restricted stock awards.
The weighted-average grant-date fair value of incentive share and restricted stock awards granted in 2006, 2005 and 2004 was $67.36, $53.81 and $54.46 per share, respectively. We recognize compensation expense for incentive/performance unit shares and restricted stock awards ratably over the corresponding vesting and/or performance periods for each type of program. Total compensation expense recognized related to PNC incentive/performance unit share and restricted stock awards during 2006 was approximately $45 million compared with $44 million in 2005 and $25 million in 2004.
A summary of nonvested incentive/performance unit shares and restricted stock award activity follows:
| | | | | | | | | | | | |
| Shares in thousands | | Nonvested
Incentive/ Performance
Unit Shares | | | Weighted-
Average
Grant Date Fair
Value | | Nonvested
Restricted
Shares | | | Weighted-
Average
Grant
Date Fair
Value |
Dec. 31, 2005 | | 660 | | | $ | 41.01 | | 2,209 | | | $ | 50.84 |
Granted | | 186 | | | | 69.58 | | 595 | | | | 64.19 |
Awarded as restricted | | (649 | ) | | | 41.02 | | 649 | | | | 66.95 |
Vested | | | | | | | | (917 | ) | | | 53.14 |
Forfeited | | (11 | ) | | | 40.51 | | (111 | ) | | | 53.06 |
Dec. 31, 2006 | | 186 | | | $ | 69.58 | | 2,425 | | | $ | 57.45 |
At December 31, 2006, there was $47 million of unrecognized deferred compensation expense related to nonvested share-based compensation arrangements granted under the Incentive Plans. This cost is expected to be recognized as expense over a period of no longer than five years. The total fair value of incentive/performance unit share and restricted stock awards vested during 2006, 2005 and 2004 was approximately $63 million, $3 million and $5 million, respectively.
Additionally in 2006, we granted a performance unit incentive award to a certain senior executive. The grant is share-denominated with an initial specified target number of 30,000 share units. The potential award is dependent on the achievement of certain performance criteria over a three-year period ending December 31, 2008. Final awarded performance units will be paid only in cash. Total compensation expense recognized related to this incentive award during 2006 was approximately $1 million.
106
EMPLOYEE STOCK PURCHASE PLAN
Our ESPP has approximately 1.4 million shares available for issuance. Full-time employees with six months and part-time employees with 12 months of continuous employment with us are eligible to participate in the ESPP at the commencement of the next six-month offering period. Eligible participants may purchase our common stock at 95% of the fair market value on the last day of each six-month offering period. No charge to earnings is recorded with respect to the ESPP.
Shares issued pursuant to the ESPP were as follows:
| | | | | |
| Year ended December 31 | | Shares | | Price Per Share |
2006 | | 105,041 | | $ | 66.66 and $70.34 |
2005 | | 138,754 | | | 51.74 and 58.74 |
2004 | | 156,753 | | | 50.43 and 54.57 |
BLACKROCK LTIP PROGRAMS
BlackRock adopted the 2002 LTIP program to help attract and retain qualified professionals. At that time, we agreed to transfer 4 million of the shares of BlackRock common stock then held by us to fund the 2002 and future programs approved by BlackRock’s board of directors, subject to certain conditions and limitations. Prior to 2006, BlackRock granted awards under the 2002 LTIP program of approximately $230 million, of which approximately $210 million was paid on January 30, 2007. The awards were paid approximately 17%
in cash by BlackRock and the remainder in BlackRock common stock transferred by us to the LTIP participants (approximately 1 million shares). As permitted under the award agreements, employees elected to put approximately 95% of the stock portion of the awards back to BlackRock. These shares were retained by BlackRock as treasury stock.
BlackRock granted additional restricted stock unit awards in January 2007, all of which are subject to achieving earnings performance goals prior to the vesting date of September 29, 2011. Of the shares of BlackRock common stock that we have agreed to transfer to fund their LTIP programs, approximately 1.6 million shares have been committed to fund the restricted stock unit awards vesting in 2011 and the amount remaining would then be available for future awards.
We reported noninterest expense of $33 million, $64 million and $110 million for the years ended December 31, 2006, 2005 and 2004, respectively, related to the BlackRock LTIP awards. Additionally, noninterest income in the fourth quarter of 2006 included a $12 million charge related to our commitment to fund the BlackRock LTIP programs. This charge represents the mark-to-market of our BlackRock LTIP obligation as of December 31, 2006 and is a result of the fourth quarter increase in the market value of BlackRock common shares.
NOTE 19 EARNINGS PER SHARE
The following table sets forth basic and diluted earnings per common share calculations:
| | | | | | |
| Year ended December 31 - in millions, except share and per share data | | 2006 | | 2005 | | 2004 |
CALCULATION OF BASIC EARNINGS PER COMMON SHARE | | | | | | |
Net income | | $2,595 | | $1,325 | | $1,197 |
Less: Preferred dividends declared | | 1 | | 1 | | 1 |
Net income applicable to basic earnings per common share | | $2,594 | | $1,324 | | $1,196 |
Basic weighted-average common shares outstanding (in thousands) | | 291,758 | | 286,276 | | 281,248 |
Basic earnings per common share | | $8.89 | | $4.63 | | $4.25 |
CALCULATION OF DILUTED EARNINGS PER COMMON SHARE (a) | | | | | | |
Net income | | $2,595 | | $1,325 | | $1,197 |
Less: BlackRock adjustment for common stock equivalents | | 6 | | 7 | | 4 |
Net income applicable to diluted earnings per common share | | $2,589 | | $1,318 | | $1,193 |
Basic weighted-average common shares outstanding (in thousands) | | 291,758 | | 286,276 | | 281,248 |
Weighted-average common shares to be issued using average market price and assuming: | | | | | | |
Conversion of preferred stock Series A and B | | 70 | | 78 | | 85 |
Conversion of preferred stock Series C and D | | 584 | | 618 | | 663 |
Conversion of debentures | | 2 | | 2 | | 10 |
Exercise of stock options | | 2,178 | | 1,178 | | 992 |
Incentive share awards | | 1,930 | | 1,688 | | 634 |
Diluted weighted-average common shares outstanding (in thousands) | | 296,522 | | 289,840 | | 283,632 |
Diluted earnings per common share | | $8.73 | | $4.55 | | $4.21 |
(a) Excludes stock options considered to be anti-dilutive (in thousands) | | 4,230 | | 10,532 | | 10,762 |
107
NOTE 20 INCOME TAXES
The components of income taxes are as follows:
| | | | | | | | |
Year ended December 31 In millions | | 2006 | | 2005 | | | 2004 | |
Current | | | | | | | | |
Federal | | $565 | | $550 | | | $720 | |
State | | 46 | | 53 | | | 12 | |
Total current | | 611 | | 603 | | | 732 | |
Deferred | | | | | | | | |
Federal | | 752 | | (12 | ) | | (192 | ) |
State | | | | 13 | | | (2 | ) |
Total deferred | | 752 | | 1 | | | (194 | ) |
Total | | $1,363 | | $604 | | | $538 | |
Significant components of deferred tax assets and liabilities are as follows:
| | | | |
| December 31 - in millions | | 2006 | | 2005 |
Deferred tax assets | | | | |
Allowance for loan and lease losses | | $258 | | $311 |
Net unrealized securities losses | | 52 | | 135 |
Compensation and benefits | | 296 | | 56 |
Loan valuation | | 6 | | 10 |
Other | | 277 | | 240 |
Total deferred tax assets | | 889 | | 752 |
Deferred tax liabilities | | | | |
Leasing | | 1,025 | | 1,078 |
Depreciation | | 75 | | 103 |
Goodwill | | 205 | | 206 |
BlackRock basis difference | | 1,166 | | 6 |
Other | | 56 | | 15 |
Total deferred tax liabilities | | 2,527 | | 1,408 |
Net deferred tax liability | | $1,638 | | $656 |
A reconciliation between the statutory and effective tax rates follows:
| | | | | | |
| Year ended December 31 | | 2006 | | 2005 | | 2004 |
Statutory tax rate | | 35.0% | | 35.0% | | 35.0% |
Increases (decreases) resulting from | | | | | | |
State taxes | | .8 | | 2.1 | | .4 |
Tax-exempt interest | | (.3) | | (1.1) | | (.7) |
Life insurance | | (.6) | | (1.0) | | (1.1) |
Tax credits | | (.9) | | (1.8) | | (2.3) |
Reversal of deferred tax liabilities – BlackRock basis allocation | | | | (2.3) | | |
Other | | | | (.7) | | (1.0) |
Effective tax rate | | 34.0% | | 30.2% | | 30.3% |
At December 31, 2006 we had available $104 million of federal and $221 million of state income tax net operating loss carryforwards originating from acquired companies and $73 million in other state net operating losses which will expire from 2007 through 2026.
No deferred US income taxes have been provided on certain undistributed earnings of non-US subsidiaries, which
amounted to $39 million at December 31, 2006. As of September 30, 2006, these earnings are considered to be reinvested for an indefinite period of time or will be repatriated when it is tax effective to do so. It is not practicable to determine the deferred tax liability on these earnings.
See Note 1 Accounting Policies for a discussion of FIN 48.
NOTE 21 SEGMENT REPORTING
We have four major businesses engaged in providing banking, asset management and global fund processing products and services:
| | • | | Corporate & Institutional Banking, |
Results of individual businesses are presented based on our management accounting practices and our management structure. There is no comprehensive, authoritative body of guidance for management accounting equivalent to GAAP; therefore, the financial results of individual businesses are not necessarily comparable with similar information for any other company. We refine our methodologies from time to time as our management accounting practices are enhanced and our businesses and management structure change. Financial results are presented, to the extent practicable, as if each business, with the exception of our BlackRock segment, operated on a stand-alone basis. As permitted under GAAP, we have aggregated the business results for certain operating segments for financial reporting purposes.
Assets receive a funding charge and liabilities and capital receive a funding credit based on a transfer pricing methodology that incorporates product maturities, duration and other factors. Capital is intended to cover unexpected losses and is assigned to the banking and processing businesses using our risk-based economic capital model. We have increased the capital assigned to Retail Banking to 6% of funds to reflect the capital required for well-capitalized banks and to approximate market comparables for this business. The capital for PFPC has been increased to reflect its legal entity shareholders’ equity.
BlackRock business segment results for the nine months ended September 30, 2006 and full years 2005 and 2004 reflected our majority ownership in BlackRock during those periods. Subsequent to the September 29, 2006 BlackRock/MLIM transaction closing, which had the effect of reducing our ownership interest to approximately 34%, our investment in BlackRock was accounted for under the equity method but continues to be a separate reportable business segment of PNC. The fair value of our investment in BlackRock at December 31, 2006 was approximately $6.7 billion. Our prior period business segment information included in this Note 21 for BlackRock was not restated. See Note 2 Acquisitions regarding the BlackRock/MLIM transaction.
108
We have allocated the allowances for loan and lease losses and unfunded loan commitments and letters of credit based on our assessment of risk inherent in the loan portfolios. Our allocation of the costs incurred by operations and other support areas not directly aligned with the businesses is primarily based on the use of services.
Total business segment financial results differ from total consolidated results. The impact of these differences is reflected in the “Intercompany Eliminations” and “Other” categories. “Intercompany Eliminations” reflects activities conducted among our businesses that are eliminated in the consolidated results. “Other” includes residual activities that do not meet the criteria for disclosure as a separate reportable business, such as gains or losses related to BlackRock, 2006 BlackRock/MLIM integration costs, One PNC implementation costs, asset and liability management activities, related net securities gains or losses, certain trading activities, equity management activities and minority interest in income of BlackRock up to September 29, 2006, differences between business segment performance reporting and financial statement reporting (GAAP), and most corporate overhead.
Assets, revenue and earnings attributable to foreign activities were not material in the periods presented.
BUSINESS SEGMENT PRODUCTS AND SERVICES
Retail Bankingprovides deposit, lending, brokerage, trust, investment management, and cash management services to approximately 2.5 million consumer and small business customers within our primary geographic area. Our customers are serviced through approximately 850 offices in our branch network, the call center located in Pittsburgh and the Internet –www.pncbank.com. The branch network is located primarily in Pennsylvania; New Jersey; the greater Washington, DC area, including Maryland and Virginia; Ohio; Kentucky; and Delaware. Brokerage services are provided through PNC Investments, LLC, and J.J.B. Hilliard, W.L. Lyons, Inc. Retail Banking also serves as investment manager and trustee for employee benefit plans and charitable and endowment assets and provides nondiscretionary defined contribution plan services and investment options through itsVested Interest®product. These services are provided to individuals and corporations primarily within our primary geographic markets.
Corporate & Institutional Bankingprovides lending, treasury management, and capital markets products and services to mid-sized corporations, government entities, and selectively to large corporations. Lending products include secured and unsecured loans, letters of credit and equipment leases. Treasury management services include cash and investment management, receivables management, disbursement services, funds transfer services, information reporting, and global trade services. Capital markets-related products and services include foreign exchange, derivatives, loan syndications, mergers and acquisitions advisory and related services to middle-market companies, securities underwriting, and securities sales and trading. Corporate & Institutional Banking also provides commercial loan servicing, real estate advisory and technology solutions for the commercial real estate finance industry. Corporate & Institutional Banking provides products and services generally within our primary geographic markets, with certain products and services provided nationally.
BlackRockis one of the world’s largest publicly traded investment management firms. As of December 31, 2006, BlackRock’s assets under management were approximately $1.1 trillion. The firm manages assets on behalf of institutions and individuals worldwide through a variety of equity, fixed income, cash management and alternative investment products. In addition, BlackRock provides BlackRock Solutions® investment system, risk management, and financial advisory services to a growing number of institutional investors. The firm has a major presence in key global markets, including the United States, Europe, Asia, Australia and the Middle East.
See Note 2 Acquisitions regarding the BlackRock/MLIM transaction.
PFPC is a leading full service provider of processing, technology and business solutions for the global investment industry. Securities services include custody, securities lending, and accounting and administration for funds registered under the 1940 Act and alternative investments. Investor services include transfer agency, managed accounts, subaccounting, and distribution. PFPC serviced $2.2 trillion in total assets and 68 million shareholder accounts as of December 31, 2006 both domestically and internationally through its Ireland and Luxembourg operations.
109
Results Of Businesses
| | | | | | | | | | | | | | | | | | |
Year ended December 31 In millions | | Retail Banking | | Corporate & Institutional Banking | | | BlackRock | | PFPC | | | Other | | | Intercompany Eliminations | | | Consolidated |
2006 | | | | | | | | | | | | | | | | | | |
INCOME STATEMENT | | | | | | | | | | | | | | | | | | |
Net interest income (expense) | | $1,673 | | $711 | | | $20 | | $(38 | ) | | $(121 | ) | | | | | $2,245 |
Noninterest income | | 1,447 | | 752 | | | 1,135 | | 917 | | | 2,137 | | | $(61 | ) | | 6,327 |
Total revenue | | 3,120 | | 1,463 | | | 1,155 | | 879 | | | 2,016 | | | (61 | ) | | 8,572 |
Provision for credit losses | | 81 | | 42 | | | | | | | | 1 | | | | | | 124 |
Depreciation and amortization | | 67 | | 23 | | | 29 | | 57 | | | 99 | | | | | | 275 |
Other noninterest expense | | 1,760 | | 726 | | | 828 | | 646 | | | 266 | | | (58 | ) | | 4,168 |
Earnings before minority interests in BlackRock and income taxes | | 1,212 | | 672 | | | 298 | | 176 | | | 1,650 | | | (3 | ) | | 4,005 |
Minority interests in BlackRock | | | | | | | | | | | | 47 | | | | | | 47 |
Income taxes | | 447 | | 209 | | | 104 | | 52 | | | 552 | | | (1 | ) | | 1,363 |
Earnings | | $765 | | $463 | | | $194 | | $124 | | | $1,051 | | | $(2 | ) | | $2,595 |
Inter-segment revenue | | $13 | | $9 | | | $28 | | $12 | | | $(1 | ) | | $(61 | ) | | |
AVERAGE ASSETS (a) | | $29,248 | | $26,548 | | | $3,937 | | $2,204 | | | $35,611 | | | $(2,536 | ) | | $95,012 |
2005 | | | | | | | | | | | | | | | | | | |
INCOME STATEMENT | | | | | | | | | | | | | | | | | | |
Net interest income (expense) | | $1,588 | | $729 | | | $35 | | $(33 | ) | | $(165 | ) | | | | | $2,154 |
Noninterest income | | 1,275 | | 596 | | | 1,191 | | 879 | | | 312 | | | $(80 | ) | | 4,173 |
Total revenue | | 2,863 | | 1,325 | | | 1,226 | | 846 | | | 147 | | | (80 | ) | | 6,327 |
Provision for (recoveries of) credit losses | | 52 | | (30 | ) | | | | | | | (1 | ) | | | | | 21 |
Depreciation and amortization | | 62 | | 20 | | | 31 | | 56 | | | 107 | | | | | | 276 |
Other noninterest expense | | 1,664 | | 638 | | | 822 | | 629 | | | 329 | | | (52 | ) | | 4,030 |
Earnings before minority interests in BlackRock and income taxes | | 1,085 | | 697 | | | 373 | | 161 | | | (288 | ) | | (28 | ) | | 2,000 |
Minority interests in BlackRock | | | | | | | | | | | | 71 | | | | | | 71 |
Income taxes | | 403 | | 217 | | | 139 | | 57 | | | (202 | ) | | (10 | ) | | 604 |
Earnings | | $682 | | $480 | | | $234 | | $104 | | | $(157 | ) | | $(18 | ) | | $1,325 |
Inter-segment revenue | | $13 | | $7 | | | $32 | | $3 | | | $25 | | | $(80 | ) | | |
AVERAGE ASSETS (a) | | $27,618 | | $25,309 | | | $1,848 | | $2,128 | | | $33,315 | | | $(1,670 | ) | | $88,548 |
2004 | | | | | | | | | | | | | | | | | | |
INCOME STATEMENT | | | | | | | | | | | | | | | | | | |
Net interest income (expense) | | $1,479 | | $701 | | | $34 | | $(47 | ) | | $(198 | ) | | | | | $1,969 |
Noninterest income | | 1,223 | | 552 | | | 725 | | 810 | | | 324 | | | $(62 | ) | | 3,572 |
Total revenue | | 2,702 | | 1,253 | | | 759 | | 763 | | | 126 | | | (62 | ) | | 5,541 |
Provision for (recoveries of) credit losses | | 61 | | 5 | | | | | | | | (14 | ) | | | | | 52 |
Depreciation and amortization | | 53 | | 17 | | | 21 | | 45 | | | 80 | | | | | | 216 |
Other noninterest expense | | 1,630 | | 598 | | | 543 | | 601 | | | 184 | | | (60 | ) | | 3,496 |
Earnings before minority interests in BlackRock and income taxes | | 958 | | 633 | | | 195 | | 117 | | | (124 | ) | | (2 | ) | | 1,777 |
Minority interests in BlackRock | | | | | | | | | | | | 42 | | | | | | 42 |
Income taxes | | 348 | | 190 | | | 52 | | 47 | | | (98 | ) | | (1 | ) | | 538 |
Earnings | | $610 | | $443 | | | $143 | | $70 | | | $(68 | ) | | $(1 | ) | | $1,197 |
Inter-segment revenue | | $12 | | $7 | | | $33 | | | | | $10 | | | $(62 | ) | | |
AVERAGE ASSETS (a) | | $24,261 | | $21,589 | | | $1,145 | | $2,572 | | | $27,582 | | | $(1,883 | ) | | $75,266 |
| (a) | Period-end balances for BlackRock and PFPC. |
Certain revenue and expense amounts shown in the preceding table differ from amounts included in the Business Segments Review section of Item 7 of this Form 10-K due to the presentation in Item 7 of business revenues on a taxable-equivalent basis and classification differences related to BlackRock and PFPC. In addition, BlackRock income classified as net interest income in the preceding table represents the net of investment income and interest expense as presented in the Business Segments Review section. PFPC income classified as net interest income (expense) in the preceding table represents the interest components of nonoperating income (net of nonoperating expense) and debt financing as disclosed in the Business Segments Review section.
110
NOTE 22 OTHER COMPREHENSIVE INCOME
Details of other comprehensive income (loss) are as follows (in millions):
| | | | | | | | | |
| | | Pretax | | | Tax | | | After-tax | |
Net unrealized securities gains (losses) | | | | | | | | | |
Balance at January 1, 2004 | | | | | | | | $3 | |
2004 activity | | | | | | | | | |
Increase in net unrealized losses for securities held at year-end | | $(56 | ) | | $20 | | | (36 | ) |
Less: net gains realized in net income (a) | | 50 | | | (17 | ) | | 33 | |
Net unrealized securities losses | | (106 | ) | | 37 | | | (69 | ) |
Balance at December 31, 2004 | | | | | | | | (66 | ) |
2005 activity | | | | | | | | | |
Increase in net unrealized losses for securities held at year-end | | (312 | ) | | 109 | | | (203 | ) |
Less: net losses realized in net income (a) | | (44 | ) | | 15 | | | (29 | ) |
Net unrealized securities losses | | (268 | ) | | 94 | | | (174 | ) |
Balance at December 31, 2005 | | | | | | | | (240 | ) |
2006 activity | | | | | | | | | |
Increase in net unrealized gains for securities held at year-end | | 129 | | | (46 | ) | | 83 | |
Less: net losses realized in net income (a) | | (101 | ) | | 35 | | | (66 | ) |
Net unrealized securities gains | | 230 | | | (81 | ) | | 149 | |
Balance at December 31, 2006 | | | | | | | | $(91 | ) |
| (a) | Pretax amounts represent net unrealized gains (losses) as of the prior year-end date that were realized in the subsequent year when the related securities were sold. These amounts differ from net securities gains included in the Consolidated Income Statement primarily because they do not include gains or losses realized on securities that were purchased and then sold during the same year. |
| | | | | | | | | |
| | | Pretax | | | Tax | | | After-tax | |
Net unrealized gains (losses) on cash flow hedge derivatives | | | | | | | | | |
Balance at January 1, 2004 | | | | | | | | $48 | |
2004 activity | | | | | | | | | |
Increase in net unrealized losses on cash flow hedge derivatives | | $(30 | ) | | $11 | | | (19 | ) |
Less: net gains realized in net income | | 35 | | | (12 | ) | | 23 | |
Net unrealized losses on cash flow hedge derivatives | | (65 | ) | | 23 | | | (42 | ) |
Balance at December 31, 2004 | | | | | | | | 6 | |
2005 activity | | | | | | | | | |
Increase in net unrealized losses on cash flow hedge derivatives | | (49 | ) | | 17 | | | (32 | ) |
Less: net gains realized in net income | | | | | | | | | |
Net unrealized losses on cash flow hedge derivatives | | (49 | ) | | 17 | | | (32 | ) |
Balance at December 31, 2005 | | | | | | | | (26 | ) |
2006 activity | | | | | | | | | |
Increase in net unrealized gains on cash flow hedge derivatives | | 13 | | | (5 | ) | | 8 | |
Less: net gains realized in net income | | (7 | ) | | 2 | | | (5 | ) |
Net unrealized losses on cash flow hedge derivatives | | 20 | | | (7 | ) | | 13 | |
Balance at December 31, 2006 | | | | | | | | $(13 | ) |
| | | | | | | | | |
Pension, other postretirement and postemployment benefit plan adjustments | | | | | | | | | |
Balance at January 1, 2004 | | | | | | | | $(14 | ) |
2004 activity | | $(2 | ) | | $1 | | | (1 | ) |
Balance at December 31, 2004 | | | | | | | | (15 | ) |
2005 activity | | | | | | | | | |
Balance at December 31, 2005 | | | | | | | | (15 | ) |
2006 Activity | | | | | | | | | |
SFAS 87 adjustment | | (2 | ) | | 1 | | | (1 | ) |
SFAS 158 adjustment, net | | (203 | ) | | 71 | | | (132 | ) |
Total 2006 activity | | (205 | ) | | 72 | | | (133 | ) |
Balance at December 31, 2006 | | | | | | | | $(148 | ) |
Other (b) | | | | | | | | | |
Balance at January 1, 2004 | | | | | | | | $23 | |
2004 activity | | $(3 | ) | | $1 | | | (2 | ) |
Balance at December 31, 2004 | | | | | | | | 21 | |
2005 activity | | (11 | ) | | 4 | | | (7 | ) |
Balance at December 31, 2005 | | | | | | | | 14 | |
2006 Activity | | 6 | | | (3 | ) | | 3 | |
Balance at December 31, 2006 | | | | | | | | $17 | |
| (b) | Consists of interest-only strip valuation adjustments and foreign currency translation adjustments. |
The accumulated balances related to each component of other comprehensive income (loss) are as follows:
| | | | |
| December 31 – in millions | | 2006 | | 2005 |
Net unrealized securities gains (losses) | | $(91) | | $(240) |
Net unrealized gains (losses) on cash flow hedge derivatives | | (13) | | (26) |
Pension, other postretirement and postemployment benefit plan adjustments | | (148) | | (15) |
Other | | 17 | | 14 |
Accumulated other comprehensive income (loss) | | $(235) | | $(267) |
111
NOTE 23 FAIR VALUEOF FINANCIAL INSTRUMENTS
| | | | | | | | | | | | | | |
| | | 2006 | | | | 2005 |
| December 31 - in millions | | Carrying Amount | | Fair Value | | | | Carrying Amount | | Fair Value |
Assets | | | | | | | | | | | | | | |
Cash and short-term assets | | $ | 9,016 | | $ | 9,016 | | | | $ | 6,957 | | $ | 6,957 |
Securities | | | 23,191 | | | 23,191 | | | | | 20,710 | | | 20,710 |
Loans held for sale | | | 2,366 | | | 2,366 | | | | | 2,449 | | | 2,449 |
Net loans (excludes leases) | | | 46,757 | | | 46,878 | | | | | 45,713 | | | 45,883 |
Other assets | | | 892 | | | 892 | | | | | 965 | | | 965 |
Mortgage and other loan servicing rights | | | 477 | | | 552 | | | | | 344 | | | 403 |
Financial derivatives | | | | | | | | | | | | | | |
Fair value hedges | | | 51 | | | 51 | | | | | 108 | | | 108 |
Cash flow hedges | | | 72 | | | 72 | | | | | 5 | | | 5 |
Free-standing derivatives | | | 1,054 | | | 1,054 | | | | | 969 | | | 969 |
| | | | | |
Liabilities | | | | | | | | | | | | | | |
Demand, savings and money market deposits | | | 47,277 | | | 47,277 | | | | | 43,914 | | | 43,914 |
Time deposits | | | 19,024 | | | 18,959 | | | | | 16,361 | | | 16,215 |
Borrowed funds | | | 15,310 | | | 15,496 | | | | | 17,186 | | | 17,323 |
Financial derivatives | | | | | | | | | | | | | | |
Fair value hedges | | | 52 | | | 52 | | | | | 30 | | | 30 |
Cash flow hedges | | | 10 | | | 10 | | | | | 14 | | | 14 |
Free-standing derivatives | | | 1,029 | | | 1,029 | | | | | 967 | | | 967 |
Unfunded loan commitments and letters of credit | | | 101 | | | 122 | | | | | 77 | | | 98 |
The aggregate fair values in the table above do not represent our underlying market value as the table excludes the following:
| | • | | real and personal property, |
| | • | | loan customer relationships, |
| | • | | deposit customer intangibles, |
| | • | | retail branch networks, |
| | • | | fee-based businesses, such as asset management and brokerage, and |
| | • | | trademarks and brand names. |
Fair value is defined as the estimated amount at which a financial instrument could be exchanged in a current transaction between willing parties, or other than in a forced or liquidation sale. However, it is not our intention to immediately dispose of a significant portion of such financial instruments, and unrealized gains or losses should not be interpreted as a forecast of future earnings and cash flows. The derived fair values are subjective in nature and involve uncertainties and significant judgment. Therefore, they cannot be determined with precision. Changes in our assumptions could significantly impact the derived fair value estimates.
We used the following methods and assumptions to estimate fair value amounts for financial instruments.
GENERAL
For short-term financial instruments realizable in three months or less, the carrying amount reported in the consolidated
balance sheet approximates fair value. Unless otherwise stated, the rates used in discounted cash flow analyses are based on market yield curves.
CASH AND SHORT-TERM ASSETS
The carrying amounts reported in the consolidated balance sheet for cash and short-term investments approximate fair values primarily due to their short-term nature. For purposes of this disclosure only, short-term assets include the following:
| | • | | interest-earning deposits with banks, |
| | • | | federal funds sold and resale agreements, |
| | • | | customers’ acceptance liability, and |
| | • | | accrued interest receivable. |
SECURITIES
The fair value of securities is based on quoted market prices, where available. If quoted market prices are not available, fair value is estimated using the quoted market prices of comparable instruments.
NET LOANS AND LOANS HELD FOR SALE
Fair values are estimated based on the discounted value of expected net cash flows incorporating assumptions about prepayment rates, credit losses and servicing fees and costs. For revolving home equity loans, this fair value does not include any amount for new loans or the related fees that will
112
be generated from the existing customer relationships. In the case of nonaccrual loans, scheduled cash flows exclude interest payments. The carrying value of loans held for sale approximates fair value.
Loans are presented above net of the allowance for loan and lease losses.
OTHER ASSETS
Other assets as shown in the accompanying table include the following:
| | • | | noncertificated interest-only strips, |
| | • | | equity investments carried at cost and fair value, and |
| | • | | private equity investments carried at fair value. |
Investments accounted for under the equity method, including our investment in BlackRock, are not included in the accompanying table.
The carrying amounts of private equity investments are recorded at fair value. Fair value of the noncertificated interest-only strips is estimated based on the discounted value of expected net cash flows. The equity investments carried at cost, including the FHLB and FRB stock, have a carrying value of approximately $365 million as of December 31, 2006, and $321 million as of December 31, 2005, both of which approximate fair value at each date.
MORTGAGE AND OTHER LOAN SERVICING ASSETS
Fair value is based on the present value of the future cash flows, including assumptions as to prepayment speeds, discount rates, interest rates, cost to service and other factors.
DEPOSITS
The carrying amounts of noninterest-bearing demand and interest-bearing money market and savings deposits approximate fair values. For time deposits, which include foreign deposits, fair values are estimated based on the discounted value of expected net cash flows assuming current interest rates.
BORROWED FUNDS
The carrying amounts of federal funds purchased, commercial paper, acceptances outstanding and accrued interest payable are considered to be their fair value because of their short-term nature. For all other borrowed funds, fair values are estimated based on the discounted value of expected net cash flows assuming current interest rates.
UNFUNDED LOAN COMMITMENTS AND LETTERS OF CREDIT
The fair value of unfunded loan commitments and letters of credit is our estimate of the cost to terminate them. For purposes of this disclosure, this fair value is the sum of the deferred fees currently recorded by us on these facilities and the liability established on these facilities related to their creditworthiness.
FINANCIAL DERIVATIVES
For exchange-traded contracts, fair value is based on quoted market prices. For nonexchange-traded contracts, fair value is based on dealer quotes, pricing models or quoted prices for instruments with similar characteristics.
NOTE 24 COMMITMENTSAND GUARANTEES
EQUITY FUNDING COMMITMENTS
We had commitments to make additional equity investments in certain equity management entities of $123 million and affordable housing limited partnerships of $71 million at December 31, 2006.
Additionally, in October 2005, we committed $200 million to PNC Mezzanine Partners III, L.P., a $350 million mezzanine fund, that invests principally in subordinated debt securities with an equity component. Funding of this investment is expected to occur over a five-year period. The remaining unfunded commitment on December 31, 2006 was $155 million. The limited partnership is consolidated for financial reporting purposes as PNC has a 57% ownership interest.
STANDBY LETTERSOF CREDIT
We issue standby letters of credit and have risk participations in standby letters of credit and bankers’ acceptances issued by other financial institutions, in each case to support obligations of our customers to third parties. If the customer fails to meet its financial or performance obligation to the third party under the terms of the contract, then upon the request of the guaranteed party, we would be obligated to make payment to them. The standby letters of credit and risk participations in standby letters of credit and bankers’ acceptances outstanding on December 31, 2006 had terms ranging from less than one year to 10 years. The aggregate maximum amount of future payments we could be required to make under outstanding standby letters of credit and risk participations in standby letters of credit and bankers’ acceptances was $6.6 billion at December 31, 2006.
Assets valued as of December 31, 2006 of approximately $.9 billion secured certain specifically identified standby letters of credit. Approximately $2.2 billion in recourse provisions from third parties was also available for this purpose as of December 31, 2006. In addition, a portion of the remaining standby letters of credit and letter of credit risk participations issued on behalf of specific customers is also secured by collateral or guarantees that secure the customers’ other obligations to us. The carrying amount of the liability for our obligations related to standby letters of credit and risk participations in standby letters of credit and bankers’ acceptances was $57 million at December 31, 2006.
STANDBY BOND PURCHASE AGREEMENTSAND OTHER LIQUIDITY FACILITIES
We enter into standby bond purchase agreements to support municipal bond obligations. At December 31, 2006, the
113
aggregate of PNC’s commitments under these facilities was $240 million. PNC also enters into certain other liquidity facilities to support individual pools of receivables acquired by commercial paper conduits including Market Street. At December 31, 2006, our total commitments under these facilities were $5.7 billion, of which $5.6 billion was related to Market Street.
INDEMNIFICATIONS
We are a party to numerous acquisition or divestiture agreements under which we have purchased or sold, or agreed to purchase or sell, various types of assets. These agreements can cover the purchase or sale of:
| | • | | Partial interests in companies, or |
These agreements generally include indemnification provisions under which we indemnify the third parties to these agreements against a variety of risks to the indemnified parties as a result of the transaction in question. When PNC is the seller, the indemnification provisions will generally also provide the buyer with protection relating to the quality of the assets we are selling and the extent of any liabilities being assumed by the buyer. Due to the nature of these indemnification provisions, we cannot quantify the total potential exposure to us resulting from them.
We provide indemnification in connection with securities offering transactions in which we are involved. When we are the issuer of the securities, we provide indemnification to the underwriters or placement agents analogous to the indemnification provided to the purchasers of businesses from us, as described above. When we are an underwriter or placement agent, we provide a limited indemnification to the issuer related to our actions in connection with the offering and, if there are other underwriters, indemnification to the other underwriters intended to result in an appropriate sharing of the risk of participating in the offering. Due to the nature of these indemnification provisions, we cannot quantify the total potential exposure to us resulting from them.
We enter into certain types of agreements that include provisions for indemnifying third parties, such as:
| | • | | Agreements relating to providing various servicing and processing functions to third parties, |
| | • | | Agreements relating to the creation of trusts or other legal entities to facilitate leasing transactions, commercial mortgage-backed securities transactions (loan securitizations) and certain other off-balance sheet transactions, |
| | • | | Confidentiality agreements, |
| | • | | Syndicated credit agreements, as a syndicate member, |
| | • | | Sales of individual loans and equipment leases, |
| | • | | Arrangements with brokers to facilitate the hedging of derivative and convertible arbitrage activities, and |
| | • | | Litigation settlement agreements. |
Due to the nature of these indemnification provisions, we cannot calculate our aggregate potential exposure under them.
We enter into certain types of agreements, including leases, assignments of leases, and subleases, in which we agree to indemnify third parties for acts by our agents, assignees and/or sublessees, and employees. While we do not believe these indemnification liabilities are material, either individually or in total, we cannot calculate our potential exposure.
We enter into contracts for the delivery of technology service in which we indemnify the other party against claims of patent and copyright infringement by third parties. Due to the nature of these indemnification provisions, we cannot calculate our aggregate potential exposure under this type of indemnification.
We engage in certain insurance activities which require our employees to be bonded. We satisfy this bonding requirement by issuing letters of credit in a total amount of approximately $5 million.
In the ordinary course of business, we enter into contracts with third parties under which the third parties provide services on behalf of PNC. In many of these contracts, we agree to indemnify the third party service provider under certain circumstances. The terms of the indemnity vary from contract to contract and the amount of the indemnification liability, if any, cannot be determined.
We are a general or limited partner in certain asset management and investment limited partnerships, many of which contain indemnification provisions that would require us to make payments in excess of our remaining funding commitments. While in certain of these partnerships the maximum liability to us is limited to the sum of our unfunded commitments and partnership distributions received by us, in the others the indemnification liability is unlimited. As a result, we cannot determine our aggregate potential exposure for these indemnifications.
Pursuant to their bylaws, PNC and its subsidiaries provide indemnification to directors, officers and, in some cases, employees and agents against certain liabilities incurred as a result of their service on behalf of or at the request of PNC and its subsidiaries. PNC and its subsidiaries also advance on behalf of covered individuals costs incurred in connection with certain claims or proceedings, subject to written undertakings by each such individual to repay all amounts so advanced if it is ultimately determined that the individual is not entitled to indemnification. We generally are responsible for similar indemnifications and advancement obligations that companies we acquire, including Riggs, had to their officers,
114
directors and sometimes employees and agents at the time of acquisition. We advanced such costs on behalf of several such individuals (including some from Riggs) with respect to pending litigation or investigations during 2006. It is not possible for us to determine the aggregate potential exposure resulting from the obligation to provide this indemnity or to advance such costs.
In connection with the lending of securities held by PFPC as an intermediary on behalf of certain of its clients, we provide indemnification to those clients against the failure of the borrowers to return the securities. The market value of the securities lent is fully secured on a daily basis; therefore, the exposure to us is limited to temporary shortfalls in the collateral as a result of short-term fluctuations in trading prices of the loaned securities. At December 31, 2006, the total maximum potential exposure as a result of these indemnity obligations was approximately $13.0 billion, although we held collateral at the time in excess of that amount.
OTHER GUARANTEES
We write caps and floors for customers, risk management and proprietary trading purposes. At December 31, 2006, the fair value of the written caps and floors liability on our Consolidated Balance Sheet was $53 million. Our ultimate obligation under written options is based on future market conditions and is only quantifiable at settlement. We manage our market risk exposure from customer positions through transactions with third-party dealers.
We also enter into credit default swaps under which we buy loss protection from or sell loss protection to a counterparty for the occurrence of a credit event of a reference entity. The fair value of the contracts sold on our Consolidated Balance Sheet was a net asset of $4 million at December 31, 2006. The maximum amount we would be required to pay under the credit default swaps in which we sold protection, assuming all reference obligations experience a credit event at a total loss, without recoveries, was $933 million at December 31, 2006. We purchased $827 million notional of credit default swaps to mitigate the exposure of certain written credit default swaps at December 31, 2006.
We have entered into various contingent performance guarantees through credit risk participation arrangements with terms ranging from less than one year to 11 years. We will be required to make payments under these guarantees if a customer defaults on its obligation to perform under certain credit agreements with third parties. Our exposure under these agreements is approximately $372 million at December 31, 2006.
CONTINGENT PAYMENTS IN CONNECTION WITH CERTAIN ACQUISITIONS
A number of the acquisition agreements to which we are a party and under which we have purchased various types of assets, including the purchase of entire businesses, partial interests in companies, or other types of assets, require us to make additional payments in future years if certain
predetermined goals are achieved or not achieved within a specific time period. Due to the nature of the contract provisions, we cannot quantify our total exposure that may result from these agreements.
NOTE 25 PARENT COMPANY
Summarized financial information of the parent company is as follows:
Income Statement
| | | | | | | | | |
| Year ended December 31 - in millions | | 2006 | | | 2005 | | | 2004 | |
OPERATING REVENUE | | | | | | | | | |
Dividends from: | | | | | | | | | |
Bank subsidiaries and bank holding company | | $710 | | | $717 | | | $895 | |
Non-bank subsidiaries | | 69 | | | 72 | | | 187 | |
Interest income | | 16 | | | 8 | | | 4 | |
Noninterest income | | 9 | | | 6 | | | | |
Total operating revenue | | 804 | | | 803 | | | 1,086 | |
OPERATING EXPENSE | | | | | | | | | |
Interest expense | | 93 | | | 71 | | | 42 | |
Other expense | | 46 | | | 11 | | | 5 | |
Total operating expense | | 139 | | | 82 | | | 47 | |
Income before income taxes and equity in undistributed net income of subsidiaries | | 665 | | | 721 | | | 1,039 | |
Income tax benefits | | (60 | ) | | (24 | ) | | (17 | ) |
Income before equity in undistributed net income of subsidiaries | | 725 | | | 745 | | | 1,056 | |
Equity in undistributed net income of subsidiaries: | | | | | | | | | |
Bank subsidiaries and bank holding company | | 1,653 | | | 396 | | | 98 | |
Non-bank subsidiaries | | 217 | | | 184 | | | 43 | |
Net income | | $2,595 | | | $1,325 | | | $1,197 | |
Balance Sheet
| | | | |
| December 31 - in millions | | 2006 | | 2005 |
ASSETS | | | | |
Cash and due from banks | | $2 | | $3 |
Short-term investments with subsidiary bank | | 3 | | |
Securities available for sale | | 290 | | 293 |
Investments in: | | | | |
Bank subsidiaries and bank holding company | | 9,294 | | 7,140 |
Non-bank subsidiaries | | 2,038 | | 2,504 |
Other assets | | 559 | | 237 |
Total assets | | $12,186 | | $10,177 |
LIABILITIES | | | | |
Subordinated debt | | $1,147 | | $1,326 |
Accrued expenses and other liabilities | | 251 | | 288 |
Total liabilities | | 1,398 | | 1,614 |
SHAREHOLDERS’ EQUITY | | 10,788 | | 8,563 |
Total liabilities and shareholders’ equity | | $12,186 | | $10,177 |
115
Commercial paper and all other debt issued by PNC Funding Corp, a wholly owned finance subsidiary, is fully and unconditionally guaranteed by the parent company. In addition, in connection with certain affiliates’ commercial mortgage servicing operations, the parent company has committed to maintain such affiliates’ net worth above minimum requirements.
The parent company received net income tax refunds of $35 million in 2006 and $19 million in 2005. Such refunds represent the parent company’s portion of consolidated income taxes. The parent company made income tax payments of $9 million in 2004. The parent company paid interest of $113 million in 2006, $94 million in 2005 and $62 million in 2004.
Statement Of Cash Flows
| | | | | | | | | |
| Year ended December 31 - in millions | | 2006 | | | 2005 | | | 2004 | |
OPERATING ACTIVITIES | | | | | | | | | |
Net income | | $2,595 | | | $1,325 | | | $1,197 | |
Adjustments to reconcile net income to net cash provided (used) by operating activities: | | | | | | | | | |
Equity in undistributed net (earnings) loss of subsidiaries | | (1,870 | ) | | (580 | ) | | (141 | ) |
Other | | 103 | | | 130 | | | (18 | ) |
Net cash provided by operating activities | | 828 | | | 875 | | | 1,038 | |
INVESTING ACTIVITIES | | | | | | | | | |
Net capital returned from (contributed to) subsidiaries | | 300 | | | (271 | ) | | 495 | |
Securities available for sale | | | | | | | | | |
Sales and maturities | | 3,440 | | | 2,912 | | | 1,638 | |
Purchases | | (3,437 | ) | | (2,822 | ) | | (1,991 | ) |
Cash paid for acquisitions | | | | | (447 | ) | | (290 | ) |
Other | | (311 | ) | | 239 | | | | |
Net cash used in investing activities | | (8 | ) | | (389 | ) | | (148 | ) |
FINANCING ACTIVITIES | | | | | | | | | |
Borrowings from non-bank subsidiary | | 210 | | | 150 | | | 1,100 | |
Repayments on borrowings from non-bank subsidiary | | (210 | ) | | (150 | ) | | (1,318 | ) |
Acquisition of treasury stock | | (531 | ) | | (112 | ) | | (251 | ) |
Cash dividends paid to shareholders | | (633 | ) | | (575 | ) | | (566 | ) |
Issuance of treasury stock | | 343 | | | 203 | | | 144 | |
Net cash used in financing activities | | (821 | ) | | (484 | ) | | (891 | ) |
Increase (decrease) in cash and due from banks | | (1 | ) | | 2 | | | (1 | ) |
Cash and due from banks at beginning of year | | 3 | | | 1 | | | 2 | |
Cash and due from banks at end of year | | $2 | | | $3 | | | $1 | |
116
STATISTICAL INFORMATION (UNAUDITED)
THE PNC FINANCIAL SERVICES GROUP, INC.
SELECTED QUARTERLY FINANCIAL DATA (a)
| | | | | | | | | | | | | | | | | | | |
| | | 2006 | | | | 2005 |
Dollars in millions, except per share data | | Fourth | | Third | | Second | | First | | | | Fourth | | Third | | Second | | | First |
SUMMARY OF OPERATIONS | | | | | | | | | | | | | | | | | | | |
Interest income | | $1,217 | | $1,203 | | $1,126 | | $1,066 | | | | $1,034 | | $995 | | $901 | | | $804 |
Interest expense | | 651 | | 636 | | 570 | | 510 | | | | 479 | | 436 | | 367 | | | 298 |
Net interest income | | 566 | | 567 | | 556 | | 556 | | | | 555 | | 559 | | 534 | | | 506 |
Provision for (recoveries of) credit losses (b) | | 42 | | 16 | | 44 | | 22 | | | | 24 | | 16 | | (27 | ) | | 8 |
Noninterest income (c) (d) | | 969 | | 2,943 | | 1,230 | | 1,185 | | | | 1,154 | | 1,116 | | 929 | | | 974 |
Noninterest expense (e) | | 969 | | 1,167 | | 1,145 | | 1,162 | | | | 1,127 | | 1,154 | | 1,033 | | | 992 |
Income before minority interest and income taxes | | 524 | | 2,327 | | 597 | | 557 | | | | 558 | | 505 | | 457 | | | 480 |
Minority interest in income of BlackRock | | | | 6 | | 19 | | 22 | | | | 22 | | 19 | | 16 | | | 14 |
Income taxes (f) | | 148 | | 837 | | 197 | | 181 | | | | 181 | | 152 | | 159 | | | 112 |
Net income (g) | | $376 | | $1,484 | | $381 | | $354 | | | | $355 | | $334 | | $282 | | | $354 |
PER COMMON SHARE DATA | | | | | | | | | | | | | | | | | | | |
Book value | | $36.80 | | $36.60 | | $29.92 | | $29.70 | | | | $29.21 | | $28.54 | | $28.35 | | | $26.78 |
Basic earnings (g) | | 1.29 | | 5.09 | | 1.30 | | 1.21 | | | | 1.22 | | 1.16 | | .99 | | | 1.26 |
Diluted earnings (g) (h) | | 1.27 | | 5.01 | | 1.28 | | 1.19 | | | | 1.20 | | 1.14 | | .98 | | | 1.24 |
| | (a) | We have reclassified certain prior quarter amounts to conform with the fourth quarter 2006 presentation. |
| | (b) | Second quarter 2005 amount reflects the impact of a $53 million loan recovery recognized during that quarter. |
| | (c) | Noninterest income included equity management gains and net securities losses in each quarter as follows (in millions): |
| | | | | | | | | | | | | | | | | | | | | | | | | |
| | | 2006 | | | | | 2005 | |
| | | Fourth | | Third | | | Second | | | First | | | | | Fourth | | | Third | | | Second | | | First | |
Equity management gains | | $25 | | $21 | | | $54 | | | $7 | | | | | $16 | | | $36 | | | $12 | | | $32 | |
Net securities losses | | | | $(195 | ) | | $(8 | ) | | $(4 | ) | | | | $(4 | ) | | $(2 | ) | | $(26 | ) | | $(9 | ) |
| | (d) | Noninterest income for the third quarter of 2006 included the pretax impact of the following: gain on the BlackRock/MLIM transaction of $2.1 billion; securities portfolio rebalancing loss of $196 million; and mortgage loan portfolio repositioning loss of $48 million. |
| | (e) | Noninterest expense for the third quarter of 2006 included the pretax impact of BlackRock/MLIM transaction integration costs of $72 million. |
| | (f) | See Note 2 Acquisitions in the Notes To Consolidated Financial Statements regarding the $45 million reversal of deferred tax liabilities recognized in the first quarter of 2005. |
| | (g) | The net after-tax impact on third quarter 2006 net income of the items described in notes (d) and (e) above totaled $1.1 billion. The net impact of these items increased third quarter 2006 basic earnings per share by $3.79 and increased diluted earnings per share by $3.73. |
| | (h) | The sum of quarterly amounts for each year does not equal the respective year’s amount because the quarterly calculations are based on a changing number of average shares. |
117
Analysis Of Year-To-Year Changes In Net Interest Income
| | | | | | | | | | | | | | | | | | | | |
| | | 2006/2005 | | | 2005/2004 | |
| | | Increase/(Decrease) in Income/Expense Due to Changes in: | | | | | Increase/(Decrease) in Income/Expense Due to Changes in: | |
| Taxable-equivalent basis - in millions | | Volume | | | Rate | | | Total | | | | | Volume | | | Rate | | | Total | |
Interest-Earning Assets | | | | | | | | | | | | | | | | | | | | |
Securities available for sale | | | | | | | | | | | | | | | | | | | | |
Mortgage-backed, asset-backed, and other debt | | $188 | | | $107 | | | $295 | | | | | $130 | | | $66 | | | $196 | |
U.S. Treasury and government agencies | | (85 | ) | | 14 | | | (71 | ) | | | | 11 | | | 50 | | | 61 | |
State and municipal | | (1 | ) | | | | | (1 | ) | | | | (3 | ) | | (4 | ) | | (7 | ) |
Corporate stocks and other | | 4 | | | (2 | ) | | 2 | | | | | (3 | ) | | 5 | | | 2 | |
Total securities available for sale | | 92 | | | 133 | | | 225 | | | | | 135 | | | 117 | | | 252 | |
Loans, net of unearned income | | | | | | | | | | | | | | | | | | | | |
Commercial | | 76 | | | 233 | | | 309 | | | | | 130 | | | 174 | | | 304 | |
Commercial real estate | | 41 | | | 33 | | | 74 | | | | | 25 | | | 31 | | | 56 | |
Consumer | | (5 | ) | | 109 | | | 104 | | | | | 111 | | | 66 | | | 177 | |
Residential mortgage | | 41 | | | 13 | | | 54 | | | | | 110 | | | 1 | | | 111 | |
Lease financing | | (8 | ) | | (1 | ) | | (9 | ) | | | | (23 | ) | | (1 | ) | | (24 | ) |
Other | | (5 | ) | | 9 | | | 4 | | | | | (2 | ) | | 8 | | | 6 | |
Total loans, net of unearned income | | 129 | | | 407 | | | 536 | | | | | 345 | | | 285 | | | 630 | |
Loans held for sale | | 19 | | | 34 | | | 53 | | | | | 24 | | | 33 | | | 57 | |
Federal funds sold and resale agreements | | 5 | | | 28 | | | 33 | | | | | (15 | ) | | 10 | | | (5 | ) |
Other | | (4 | ) | | 27 | | | 23 | | | | | 60 | | | 1 | | | 61 | |
Total interest-earning assets | | $253 | | | $617 | | | $870 | | | | | $541 | | | $454 | | | $995 | |
Interest-Bearing Liabilities | | | | | | | | | | | | | | | | | | | | |
Interest-bearing deposits | | | | | | | | | | | | | | | | | | | | |
Money market | | $44 | | | $216 | | | $260 | | | | | $21 | | | $231 | | | $252 | |
Demand | | | | | 32 | | | 32 | | | | | 1 | | | 23 | | | 24 | |
Savings | | (3 | ) | | (3 | ) | | (6 | ) | | | | | | | 5 | | | 5 | |
Retail certificates of deposit | | 85 | | | 126 | | | 211 | | | | | 77 | | | 50 | | | 127 | |
Other time | | (8 | ) | | 15 | | | 7 | | | | | 33 | | | | | | 33 | |
Time deposits in foreign offices | | 52 | | | 53 | | | 105 | | | | | 21 | | | 35 | | | 56 | |
Total interest-bearing deposits | | 111 | | | 498 | | | 609 | | | | | 97 | | | 400 | | | 497 | |
Borrowed funds | | | | | | | | | | | | | | | | | | | | |
Federal funds purchased | | 41 | | | 45 | | | 86 | | | | | 2 | | | 43 | | | 45 | |
Repurchase agreements | | | | | 36 | | | 36 | | | | | 13 | | | 34 | | | 47 | |
Bank notes and senior debt | | (2 | ) | | 47 | | | 45 | | | | | 14 | | | 39 | | | 53 | |
Subordinated debt | | 19 | | | 53 | | | 72 | | | | | 23 | | | 35 | | | 58 | |
Commercial paper | | (87 | ) | | 24 | | | (63 | ) | | | | 6 | | | 38 | | | 44 | |
Other | | (14 | ) | | 16 | | | 2 | | | | | 45 | | | 8 | | | 53 | |
Total borrowed funds | | (46 | ) | | 224 | | | 178 | | | | | 105 | | | 195 | | | 300 | |
Total interest-bearing liabilities | | 95 | | | 692 | | | 787 | | | | | 187 | | | 610 | | | 797 | |
Change in net interest income | | $138 | | | $(55 | ) | | $83 | | | | | $342 | | | $(144 | ) | | $198 | |
Changes attributable to rate/volume are prorated into rate and volume components.
118
Average Consolidated Balance Sheet And Net Interest Analysis
| | | | | | | | | | | | | | | | | | | | | | | | |
| | | 2006 | | | 2005 | | | 2004 | |
Taxable-equivalent basis Dollars in millions | | Average
Balances | | | Interest
Income/Expense | | Average
Yields/Rates | | | Average
Balances | | | Interest
Income/Expense | | Average
Yields/Rates | | | Average
Balances | | | Interest
Income/Expense | | Average
Yields/Rates | |
Assets | | | | | | | | | | | | | | | | | | | | | | | | |
Interest-earning assets | | | | | | | | | | | | | | | | | | | | | | | | |
Securities available for sale | | | | | | | | | | | | | | | | | | | | | | | | |
Mortgage-backed, asset-backed, and other debt | | $18,587 | | | $926 | | 4.98 | % | | $14,627 | | | $631 | | 4.31 | % | | $11,483 | | | $435 | | 3.79 | % |
U.S. Treasury and government agencies | | 2,334 | | | 102 | | 4.37 | | | 4,308 | | | 173 | | 4.02 | | | 3,943 | | | 112 | | 2.84 | |
State and municipal | | 148 | | | 8 | | 5.41 | | | 167 | | | 9 | | 5.39 | | | 220 | | | 16 | | 7.27 | |
Corporate stocks and other | | 246 | | | 14 | | 5.69 | | | 173 | | | 12 | | 6.94 | | | 232 | | | 10 | | 4.31 | |
Total securities available for sale | | 21,315 | | | 1,050 | | 4.93 | | | 19,275 | | | 825 | | 4.28 | | | 15,878 | | | 573 | | 3.61 | |
Loans, net of unearned income | | | | | | | | | | | | | | | | | | | | | | | | |
Commercial | | 20,201 | | | 1,451 | | 7.18 | | | 19,007 | | | 1,142 | | 6.01 | | | 16,627 | | | 838 | | 5.04 | |
Commercial real estate | | 3,212 | | | 232 | | 7.22 | | | 2,609 | | | 158 | | 6.06 | | | 2,137 | | | 102 | | 4.77 | |
Consumer | | 16,125 | | | 1,009 | | 6.26 | | | 16,208 | | | 905 | | 5.58 | | | 14,165 | | | 728 | | 5.14 | |
Residential mortgage | | 6,888 | | | 375 | | 5.44 | | | 6,136 | | | 321 | | 5.23 | | | 4,040 | | | 210 | | 5.20 | |
Lease financing | | 2,777 | | | 123 | | 4.43 | | | 2,944 | | | 132 | | 4.48 | | | 3,470 | | | 156 | | 4.50 | |
Other | | 363 | | | 26 | | 7.16 | | | 453 | | | 22 | | 4.86 | | | 506 | | | 16 | | 3.16 | |
Total loans, net of unearned income | | 49,566 | | | 3,216 | | 6.49 | | | 47,357 | | | 2,680 | | 5.66 | | | 40,945 | | | 2,050 | | 5.01 | |
Loans held for sale | | 2,683 | | | 157 | | 5.85 | | | 2,301 | | | 104 | | 4.52 | | | 1,636 | | | 47 | | 2.87 | |
Federal funds sold and resale agreements | | 1,143 | | | 58 | | 5.07 | | | 985 | | | 25 | | 2.54 | | | 1,670 | | | 30 | | 1.80 | |
Other | | 2,985 | | | 156 | | 5.23 | | | 3,083 | | | 133 | | 4.31 | | | 1,692 | | | 72 | | 4.26 | |
Total interest-earning assets/interest income | | 77,692 | | | 4,637 | | 5.97 | | | 73,001 | | | 3,767 | | 5.16 | | | 61,821 | | | 2,772 | | 4.48 | |
Noninterest-earning assets | | | | | | | | | | | | | | | | | | | | | | | | |
Allowance for loan and lease losses | | (591 | ) | | | | | | | (632 | ) | | | | | | | (608 | ) | | | | | |
Cash and due from banks | | 3,121 | | | | | | | | 3,164 | | | | | | | | 2,895 | | | | | | |
Other | | 14,790 | | | | | | | | 13,015 | | | | | | | | 11,158 | | | | | | |
Total assets | | $95,012 | | | | | | | | $88,548 | | | | | | | | $75,266 | | | | | | |
Liabilities, Minority and Noncontrolling Interests, and Shareholders’ Equity | | | | | | | | | | | | | | | | | |
Interest-bearing liabilities | | | | | | | | | | | | | | | | | | | | | | | | |
Interest-bearing deposits | | | | | | | | | | | | | | | | | | | | | | | | |
Money market | | $19,745 | | | 663 | | 3.36 | | | $17,930 | | | 403 | | 2.25 | | | $15,964 | | | 151 | | .95 | |
Demand | | 8,187 | | | 88 | | 1.07 | | | 8,224 | | | 56 | | .68 | | | 7,902 | | | 32 | | .40 | |
Savings | | 2,081 | | | 10 | | .48 | | | 2,645 | | | 16 | | .60 | | | 2,684 | | | 11 | | .41 | |
Retail certificates of deposit | | 13,999 | | | 582 | | 4.16 | | | 11,623 | | | 371 | | 3.19 | | | 9,075 | | | 244 | | 2.69 | |
Other time | | 1,364 | | | 66 | | 4.84 | | | 1,559 | | | 59 | | 3.78 | | | 686 | | | 26 | | 3.79 | |
Time deposits in foreign offices | | 3,613 | | | 181 | | 5.01 | | | 2,347 | | | 76 | | 3.24 | | | 1,371 | | | 20 | | 1.46 | |
Total interest-bearing deposits | | 48,989 | | | 1,590 | | 3.25 | | | 44,328 | | | 981 | | 2.21 | | | 37,682 | | | 484 | | 1.28 | |
Borrowed funds | | | | | | | | | | | | | | | | | | | | | | | | |
Federal funds purchased | | 3,081 | | | 157 | | 5.10 | | | 2,098 | | | 71 | | 3.38 | | | 1,957 | | | 26 | | 1.33 | |
Repurchase agreements | | 2,205 | | | 101 | | 4.58 | | | 2,189 | | | 65 | | 2.97 | | | 1,433 | | | 18 | | 1.26 | |
Bank notes and senior debt | | 3,128 | | | 159 | | 5.08 | | | 3,198 | | | 114 | | 3.56 | | | 2,687 | | | 61 | | 2.27 | |
Subordinated debt | | 4,417 | | | 269 | | 6.09 | | | 4,044 | | | 197 | | 4.87 | | | 3,506 | | | 139 | | 3.96 | |
Commercial paper | | 166 | | | 8 | | 4.82 | | | 2,223 | | | 71 | | 3.19 | | | 1,887 | | | 27 | | 1.43 | |
Other | | 2,046 | | | 83 | | 4.06 | | | 2,447 | | | 81 | | 3.31 | | | 1,045 | | | 28 | | 2.68 | |
Total borrowed funds | | 15,043 | | | 777 | | 5.17 | | | 16,199 | | | 599 | | 3.70 | | | 12,515 | | | 299 | | 2.39 | |
Total interest-bearing liabilities/interest expense | | 64,032 | | | 2,367 | | 3.70 | | | 60,527 | | | 1,580 | | 2.61 | | | 50,197 | | | 783 | | 1.56 | |
Noninterest-bearing liabilities, minority and noncontrolling interests, and shareholders’ equity | | | | | | | | | | | | | | | | | | | | | | | | |
Demand and other noninterest-bearing deposits | | 14,320 | | | | | | | | 13,309 | | | | | | | | 12,015 | | | | | | |
Allowance for unfunded loan commitments and letters of credit | | 106 | | | | | | | | 80 | | | | | | | | 90 | | | | | | |
Accrued expenses and other liabilities | | 6,672 | | | | | | | | 6,098 | | | | | | | | 5,389 | | | | | | |
Minority and noncontrolling interests in consolidated entities | | 600 | | | | | | | | 542 | | | | | | | | 455 | | | | | | |
Shareholders’ equity | | 9,282 | | | | | | | | 7,992 | | | | | | | | 7,120 | | | | | | |
Total liabilities, minority and noncontrolling interests, and shareholders’ equity | | $95,012 | | | | | | | | $88,548 | | | | | | | | $75,266 | | | | | | |
Interest rate spread | | | | | | | 2.27 | | | | | | | | 2.55 | | | | | | | | 2.92 | |
Impact of noninterest-bearing sources | | | | | | | .65 | | | | | | | | .45 | | | | | | | | .30 | |
Net interest income/margin | | | | | $2,270 | | 2.92 | % | | | | | $2,187 | | 3.00 | % | | | | | $1,989 | | 3.22 | % |
Nonaccrual loans are included in loans, net of unearned income. The impact of financial derivatives used in interest rate risk management is included in the interest income/expense and average yields/rates of the related assets and liabilities. Basis adjustments related to hedged items are included in noninterest-earning assets and noninterest-bearing liabilities. Average balances of securities are based on amortized historical cost (excluding SFAS 115 adjustments to fair value which are included in other assets). Average balances for certain loans and borrowed funds accounted for at fair value, with changes in fair value recorded in trading noninterest income, are included in noninterest-earning assets and noninterest-bearing liabilities.
Loan fees for the years ended December 31, 2006, 2005 and 2004 were $35 million, $91 million and $109 million, respectively. Interest income includes the effects of taxable-equivalent adjustments using a marginal federal income tax rate of 35% to increase tax-exempt interest income to a taxable-equivalent basis. The taxable-equivalent adjustments to interest income for the years ended December 31, 2006, 2005 and 2004 were $25 million, $33 million and $20 million, respectively. Average securities held to maturity totaled less than $.5 million for the year ended December 31, 2006, $1 million for the year ended December 31, 2005 and $2 million for the year ended December 31, 2004 and are included in the “Mortgage-backed, asset-backed, and other debt” category.
119
LOANS OUTSTANDING
| | | | | | | | | | | | | | | |
| | | | | |
| December 31 - in millions | | 2006 | | | 2005 | | | 2004 | | | 2003 | | | 2002 | |
Commercial | | $20,584 | | | $19,325 | | | $17,438 | | | $15,082 | | | $14,987 | |
Commercial real estate | | 3,532 | | | 3,162 | | | 1,980 | | | 1,824 | | | 2,267 | |
Consumer | | 16,515 | | | 16,173 | | | 15,606 | | | 11,855 | | | 9,854 | |
Residential mortgage | | 6,337 | | | 7,307 | | | 4,772 | | | 2,886 | | | 3,921 | |
Lease financing | | 3,556 | | | 3,628 | | | 4,096 | | | 5,147 | | | 5,081 | |
Other | | 376 | | | 341 | | | 505 | | | 518 | | | 415 | |
Total loans | | 50,900 | | | 49,936 | | | 44,397 | | | 37,312 | | | 36,525 | |
Unearned income | | (795 | ) | | (835 | ) | | (902 | ) | | (1,009 | ) | | (1,075 | ) |
Total loans, net of unearned income (a) | | $50,105 | | | $49,101 | | | $43,495 | | | $36,303 | | | $35,450 | |
| (a) | Includes $2.3 billion at December 31, 2004 and $2.2 billion at December 31, 2003 related to Market Street, which was deconsolidated effective October 17, 2005. |
NONPERFORMING ASSETSAND RELATED INFORMATION
| | | | | | | | | | | | | | | |
| December 31 - dollars in millions | | 2006 | | | 2005 | | | 2004 | | | 2003 | | | 2002 | |
Nonaccrual loans | | | | | | | | | | | | | | | |
Commercial | | $109 | | | $134 | | | $89 | | | $213 | | | $226 | |
Lease financing | | 1 | | | 17 | | | 5 | | | 11 | | | 57 | |
Commercial real estate | | 12 | | | 14 | | | 14 | | | 6 | | | 7 | |
Consumer | | 13 | | | 10 | | | 11 | | | 11 | | | 11 | |
Residential mortgage | | 12 | | | 15 | | | 21 | | | 24 | | | 7 | |
Total nonaccrual loans | | $147 | | | $190 | | | $140 | | | $265 | | | $308 | |
Troubled debt restructured loan | | | | | | | | 3 | | | 1 | | | 1 | |
Total nonperforming loans | | 147 | | | 190 | | | 143 | | | 266 | | | 309 | |
Nonperforming loans held for sale (a) | | | | | 1 | | | 3 | | | 27 | | | 97 | |
Foreclosed and other assets | | | | | | | | | | | | | | | |
Lease | | 12 | | | 13 | | | 14 | | | 17 | | | | |
Residential mortgage | | 10 | | | 9 | | | 10 | | | 9 | | | 6 | |
Other | | 2 | | | 3 | | | 5 | | | 9 | | | 6 | |
| | | | | |
Total foreclosed and other assets | | 24 | | | 25 | | | 29 | | | 35 | | | 12 | |
| | | | | |
Total nonperforming assets (b) | | $171 | | | $216 | | | $175 | | | $328 | | | $418 | |
Nonperforming loans to total loans | | .29 | % | | .39 | % | | .33 | % | | .73 | % | | .87 | % |
Nonperforming assets to total loans, loans held for sale and foreclosed assets | | .33 | | | .42 | | | .39 | | | .87 | | | 1.13 | |
Nonperforming assets to total assets | | .17 | | | .23 | | | .22 | | | .48 | | | .63 | |
Interest on nonperforming loans | | | | | | | | | | | | | | | |
Computed on original terms | | $15 | | | $16 | | | $11 | | | $29 | | | $23 | |
Recognized | | 4 | | | 5 | | | 2 | | | 5 | | | 10 | |
Past due loans | | | | | | | | | | | | | | | |
Accruing loans past due 90 days or more | | $50 | | | $46 | | | $49 | | | $57 | | | $115 | |
As a percentage of total loans | | .10 | % | | .09 | % | | .11 | % | | .16 | % | | .32 | % |
Past due loans held for sale | | | | | | | | | | | | | | | |
Accruing loans held for sale past due 90 days or more | | $9 | | | $47 | | | $9 | | | $6 | | | $32 | |
As a percentage of total loans held for sale | | .38 | % | | 1.92 | % | | .54 | % | | .43 | % | | 1.99 | % |
| (a) | Includes $1 million, $2 million, $10 million, and $17 million of troubled debt restructured loans held for sale at December 31, 2005, 2004, 2003 and 2002, respectively. |
| (b) | Excludes equity management assets that are carried at estimated fair value of $11 million (including $4 million of troubled debt restructured assets) at December 31, 2006, $25 million (including $7 million of troubled debt restructured assets) at December 31, 2005, $32 million (including $11 million of troubled debt restructured assets) at December 31, 2004, $37 million (including $5 million of troubled debt restructured assets) at December 31, 2003 and $40 million (including $12 million of troubled debt restructured assets) at December 31, 2002. |
120
SUMMARY OF LOAN LOSS EXPERIENCE
| | | | | | | | | | | | | | | |
| Year ended December 31 - dollars in millions | | 2006 | | | 2005 | | | 2004 | | | 2003 | | | 2002 | |
Allowance for loan and lease losses at beginning of year | | $596 | | | $607 | | | $632 | | | $673 | | | $560 | |
Charge-offs | | | | | | | | | | | | | | | |
Commercial | | (108 | ) | | (52 | ) | | (113 | ) | | (168 | ) | | (194 | ) |
Commercial real estate | | (3 | ) | | (1 | ) | | (2 | ) | | (3 | ) | | (3 | ) |
Consumer | | (52 | ) | | (45 | ) | | (43 | ) | | (39 | ) | | (40 | ) |
Residential mortgage | | (3 | ) | | (2 | ) | | (3 | ) | | (4 | ) | | (5 | ) |
Lease financing | | (14 | ) | | (29 | ) | | (5 | ) | | (46 | ) | | (25 | ) |
Total charge-offs | | (180 | ) | | (129 | ) | | (166 | ) | | (260 | ) | | (267 | ) |
Recoveries | | | | | | | | | | | | | | | |
Commercial (a) | | 19 | | | 82 | | | 31 | | | 32 | | | 26 | |
Commercial real estate | | 1 | | | 1 | | | 1 | | | 1 | | | 1 | |
Consumer | | 15 | | | 15 | | | 12 | | | 12 | | | 14 | |
Residential mortgage | | | | | | | | 1 | | | 1 | | | 1 | |
Lease financing | | 5 | | | 1 | | | 6 | | | 3 | | | 2 | |
Total recoveries | | 40 | | | 99 | | | 51 | | | 49 | | | 44 | |
Net charge-offs (a) | | (140 | ) | | (30 | ) | | (115 | ) | | (211 | ) | | (223 | ) |
Provision for credit losses | | 124 | | | 21 | | | 52 | | | 177 | | | 309 | |
Acquisitions | | | | | 23 | | | 22 | | | | | | 41 | |
Net change in allowance for unfunded loan commitments and letters of credit | | (20 | ) | | (25 | ) | | 16 | | | (7 | ) | | (14 | ) |
Allowance for loan and lease losses at end of year | | $560 | | | $596 | | | $607 | | | $632 | | | $673 | |
Allowance as a percent of period-end | | | | | | | | | | | | | | | |
Loans | | 1.12 | % | | 1.21 | % | | 1.40 | % | | 1.74 | % | | 1.90 | % |
Nonperforming loans | | 381 | | | 314 | | | 424 | | | 238 | | | 218 | |
As a percent of average loans | | | | | | | | | | | | | | | |
Net charge-offs (a) | | .28 | | | .06 | | | .28 | | | .59 | | | .60 | |
Provision for credit losses | | .25 | | | .04 | | | .13 | | | .49 | | | .83 | |
Allowance for loan and lease losses | | 1.13 | | | 1.26 | | | 1.48 | | | 1.76 | | | 1.81 | |
Allowance as a multiple of net charge-offs (a) | | 4.00 | x | | 19.87 | x | | 5.28 | x | | 3.00 | x | | 3.02 | x |
| (a) | Amounts for 2005 reflect the impact of a $53 million loan recovery in that year. Excluding this recovery, net charge-offs would have been .18% of average loans and the allowance as a multiple of net charge-offs would have been 7.18x. |
The following table presents the assignment of the allowance for loan and lease losses and the categories of loans as a percentage of total loans. Changes in the allocation over time reflect the changes in loan portfolio composition, risk profile and refinements to reserve methodologies. For purposes of this presentation, a portion of the allowance for loan and lease losses has been assigned to loan categories based on the relative specific and pool allocation amounts to provide coverage for probable losses not covered in specific, pool and consumer reserve methodologies related to qualitative and measurement factors. At December 31, 2006, the portion of the reserves for these factors was $45 million.
ALLOCATION OF ALLOWANCE FOR LOANAND LEASE LOSSES
| | | | | | | | | | | | | | | | | | | | | | | | | | | | | | |
| | | 2006 | | | 2005 | | | 2004 | | | 2003 | | | 2002 | |
December 31 Dollars in millions | | Allowance | | Loans to Total Loans | | | Allowance | | Loans to Total Loans | | | Allowance | | Loans to
Total Loans | | | Allowance | | Loans to Total Loans | | | Allowance | | Loans to Total Loans | |
Commercial | | $ | 443 | | 40.9 | % | | $ | 489 | | 39.2 | % | | $ | 503 | | 40.1 | % | | $ | 514 | | 41.5 | % | | $ | 504 | | 42.3 | % |
Commercial real estate | | | 30 | | 7.0 | | | | 32 | | 6.4 | | | | 26 | | 4.5 | | | | 34 | | 5.1 | | | | 52 | | 6.4 | |
Consumer | | | 28 | | 33.1 | | | | 24 | | 33.1 | | | | 35 | | 35.9 | | | | 28 | | 32.6 | | | | 28 | | 27.8 | |
Residential mortgage | | | 7 | | 12.7 | | | | 7 | | 14.9 | | | | 6 | | 11.0 | | | | 7 | | 8.0 | | | | 10 | | 11.0 | |
Lease financing | | | 48 | | 5.6 | | | | 41 | | 5.7 | | | | 33 | | 7.3 | | | | 44 | | 11.4 | | | | 75 | | 11.3 | |
Other | | | 4 | | .7 | | | | 3 | | .7 | | | | 4 | | 1.2 | | | | 5 | | 1.4 | | | | 4 | | 1.2 | |
Total | | $ | 560 | | 100.0 | % | | $ | 596 | | 100.0 | % | | $ | 607 | | 100.0 | % | | $ | 632 | | 100.0 | % | | $ | 673 | | 100.0 | % |
121
SELECTED LOAN MATURITIESAND INTEREST SENSITIVITY
| | | | | | | | |
December 31, 2006 In millions | | 1 Year or Less | | 1 Through 5 Years | | After 5 Years | | Gross Loans |
Commercial | | $6,045 | | $10,324 | | $4,215 | | $20,584 |
Real estate projects | | 1,106 | | 1,474 | | 136 | | 2,716 |
Total | | $7,151 | | $11,798 | | $4,351 | | $23,300 |
Loans with Predetermined rate | | $762 | | $1,016 | | $1,667 | | $3,445 |
Floating or adjustable rate | | 6,389 | | 10,782 | | 2,684 | | 19,855 |
Total | | $7,151 | | $11,798 | | $4,351 | | $23,300 |
At December 31, 2006, $745 million notional of pay-fixed interest rate swaps were designated to commercial loans as part of fair value hedge strategies. The changes in fair value of the loans attributable to the hedged risk are included in the commercial loan amount in the above table. In addition, $7.8 billion notional amount of receive-fixed interest rate swaps were designated as part of cash flow hedging strategies that converted the floating rate (1 month LIBOR, 3 month LIBOR and Prime) on the underlying commercial loans to a fixed rate as part of risk management strategies.
TIME DEPOSITS OF $100,000 OR MORE
Time deposits in foreign offices totaled $3.0 billion at December 31, 2006, substantially all of which are in denominations of $100,000 or more. The following table sets forth maturities of domestic time deposits of $100,000 or more:
| | |
| December 31, 2006 – in millions | | Certificates of Deposit |
Three months or less | | $1,169 |
Over three through six months | | 2,185 |
Over six through twelve months | | 1,516 |
Over twelve months | | 880 |
Total | | $5,750 |
COMMON STOCK PRICES/DIVIDENDS DECLARED
The table below sets forth by quarter the range of high and low sale and quarter-end closing prices for our common stock and the cash dividends we declared per common share.
| | | | | | | | |
| | | High | | Low | | Close | | Cash Dividends
Declared |
2006 Quarter | | | | | | | | |
| | | | |
First | | $71.42 | | $61.78 | | $67.31 | | $.50 |
Second | | 72.00 | | 65.30 | | 70.17 | | .55 |
Third | | 73.55 | | 68.09 | | 72.44 | | .55 |
Fourth | | 75.15 | | 67.61 | | 74.04 | | .55 |
Total | | | | | | | | $2.15 |
| | | | |
2005 Quarter | | | | | | | | |
First | | $57.57 | | $50.30 | | $51.48 | | $.50 |
Second | | 55.90 | | 49.35 | | 54.46 | | .50 |
Third | | 58.95 | | 53.80 | | 58.02 | | .50 |
Fourth | | 65.66 | | 54.73 | | 61.83 | | .50 |
Total | | | | | | | | $2.00 |
122
ITEM 9 - CHANGES IN AND DISAGREEMENTS WITH ACCOUNTANTS ON ACCOUNTING AND FINANCIAL DISCLOSURE
ITEM 9A – CONTROLS AND PROCEDURES
| (a) | MANAGEMENT’S RESPONSIBILITY FOR INTERNAL CONTROL OVER FINANCIAL REPORTING |
The management of The PNC Financial Services Group, Inc. and subsidiaries (“PNC”) is responsible for establishing and maintaining effective internal control over financial reporting. The internal control system is augmented by written policies and procedures and by audits performed by an internal audit staff, which reports to the Audit Committee of the Board of Directors. Internal auditors test the operation of the internal control system and report findings to management and the Audit Committee, and appropriate corrective and other actions are taken to address identified control deficiencies and other opportunities for improving the system. The Audit Committee, composed solely of independent directors, provides oversight to management’s conduct of the financial reporting process.
There are inherent limitations in the effectiveness of any system of internal control, including the possibility of human error and circumvention or overriding of controls. Accordingly, even effective internal control can provide only reasonable assurance with respect to the reliability of financial reporting and financial statement preparation. Further, because of changes in conditions, the effectiveness of internal control may vary over time.
We performed an evaluation under the supervision and with the participation of our management, including the Chairman and Chief Executive Officer and the Chief Financial Officer, of the effectiveness of PNC’s internal control over financial reporting as of December 31, 2006. This assessment was based on criteria for effective internal control over financial reporting described inInternal Control-Integrated Frameworkissued by the Committee of Sponsoring Organizations of the Treadway Commission. Based on this assessment, management believes that PNC maintained effective internal control over financial reporting as of December 31, 2006.
Deloitte & Touche LLP, the Independent Registered Public Accounting Firm that audited the Consolidated Financial Statements included in this Report, has issued a
report on management’s assessment and on the effectiveness of PNC’s internal control over financial reporting as of December 31, 2006. The report of Deloitte & Touche LLP follows.
| (b) | REPORT OF INDEPENDENT REGISTERED PUBLIC ACCOUNTING FIRM |
To the Board of Directors and Shareholders of
The PNC Financial Services Group, Inc.
Pittsburgh, Pennsylvania
We have audited management’s assessment, included in the accompanying “Management’s Responsibility For Internal Control Over Financial Reporting” that The PNC Financial Services Group, Inc. and subsidiaries (the “Company”) maintained effective internal control over financial reporting as of December 31, 2006, based on criteria established inInternal Control-Integrated Framework issued by the Committee of Sponsoring Organizations of the Treadway Commission. The Company’s management is responsible for maintaining effective internal control over financial reporting and for its assessment of the effectiveness of internal control over financial reporting. Our responsibility is to express an opinion on management’s assessment and an opinion on the effectiveness of the Company’s internal control over financial reporting based on our audit.
We conducted our audit in accordance with the standards of the Public Company Accounting Oversight Board (United States). Those standards require that we plan and perform the audit to obtain reasonable assurance about whether effective internal control over financial reporting was maintained in all material respects. Our audit included obtaining an understanding of internal control over financial reporting, evaluating management’s assessment, testing and evaluating the design and operating effectiveness of internal control, and performing such other procedures as we considered necessary in the circumstances. We believe that our audit provides a reasonable basis for our opinions.
A company’s internal control over financial reporting is a process designed by, or under the supervision of, the company’s principal executive and principal financial officers, or persons performing similar functions, and effected by the company’s board of directors, management, and other personnel to provide reasonable assurance regarding the reliability of financial reporting and the preparation of financial statements for external purposes in accordance with generally accepted accounting principles. A company’s internal control over financial reporting includes those policies and procedures that (1) pertain to the maintenance of records that, in reasonable detail, accurately and fairly reflect the transactions and dispositions of the assets of the company; (2) provide reasonable assurance that transactions are recorded as necessary to permit preparation of financial statements in accordance with
123
generally accepted accounting principles, and that receipts and expenditures of the company are being made only in accordance with authorizations of management and directors of the company; and (3) provide reasonable assurance regarding prevention or timely detection of unauthorized acquisition, use, or disposition of the company’s assets that could have a material effect on the financial statements.
Because of the inherent limitations of internal control over financial reporting, including the possibility of collusion or improper management override of controls, material misstatements due to error or fraud may not be prevented or detected on a timely basis. Also, projections of any evaluation of the effectiveness of the internal control over financial reporting to future periods are subject to the risk that the controls may become inadequate because of changes in conditions, or that the degree of compliance with the policies or procedures may deteriorate.
In our opinion, management’s assessment that the Company maintained effective internal control over financial reporting as of December 31, 2006, is fairly stated, in all material respects, based on the criteria established inInternal Control-Integrated Framework issued by the Committee of Sponsoring Organizations of the Treadway Commission. Also in our opinion, the Company maintained, in all material respects, effective internal control over financial reporting as of December 31, 2006, based on the criteria established inInternal Control-Integrated Framework issued by the Committee of Sponsoring Organizations of the Treadway Commission.
We have also audited, in accordance with the standards of the Public Company Accounting Oversight Board (United States), the consolidated balance sheet as of December 31, 2006 and the related consolidated statements of income, shareholders’ equity and cash flows for the year then ended of the Company and our report dated March 1, 2007 expressed an unqualified opinion on those financial statements and included explanatory paragraphs regarding the Company’s adoption of Statement of Financial Accounting Standard No. 158,“Employers’ Accounting for Defined Benefit Pension and Other Postretirement Plans – an amendment of FASB Statements No. 87,88,106, and 132(R)” and the Company’s use of the equity method of accounting to recognize its investment in BlackRock, Inc.
/s/ Deloitte & Touche LLP
Pittsburgh, Pennsylvania
March 1, 2007
| (c) | Internal Controls and Disclosure Controls and Procedures |
As of December 31, 2006, we performed an evaluation under the supervision and with the participation of our
management, including the Chairman and Chief Executive Officer and the Chief Financial Officer, of the effectiveness of the design and operation of our disclosure controls and procedures and of changes in our internal control over financial reporting.
Based on that evaluation, our management, including the Chairman and Chief Executive Officer and the Chief Financial Officer, concluded that our disclosure controls and procedures were effective as of December 31, 2006, and that there has been no change in internal control over financial reporting that occurred during the fourth quarter of 2006 that has materially affected, or is reasonably likely to materially affect, our internal control over financial reporting.
ITEM 9B - OTHER INFORMATION
None.
PART III
ITEM 10 – DIRECTORS, EXECUTIVE OFFICERS AND CORPORATE GOVERNANCE
Certain of the information regarding our directors, nominees for director, executive officers, Audit Committee (and Audit Committee financial experts), and shareholder nomination process required by this item is included under the captions “Election of Directors –Information Concerning Nominees,” “Transactions Involving Directors And Executive Officers –Family Relationships,” and “Corporate Governance At PNC –The Audit Committee –Our Code of Business Conduct and Ethics,” and – “Shareholder Proposals And Nominations” in our Proxy Statement to be filed for the annual meeting of shareholders to be held on April 24, 2007 and is incorporated herein by reference. In accordance with Item 407(d)(3) of Regulation S-K, the information set forth under the caption “Report of the Audit Committee” in such Proxy Statement will be deemed to be furnished in this Report and will not be deemed to be incorporated by reference into any filing under the Securities Act or the Exchange Act as a result of furnishing the disclosure in this manner.
Information regarding our compliance with Section 16(a) of the Securities Exchange Act of 1934 is included under the caption “Section 16(a) Beneficial Ownership Reporting Compliance” in our Proxy Statement to be filed for the annual meeting of shareholders to be held on April 24, 2007 and is incorporated herein by reference.
Additional information regarding our executive officers and our directors is included in Part I of this Report under the captions “Executive Officers of the Registrant” and “Directors of the Registrant.”
Our PNC Code of Business Conduct and Ethics is available on our corporate website atwww.pnc.com under “About PNC – Investor Relations – Corporate Governance.” In addition, any future amendments to, or waivers from, a provision of the PNC Code of Business Conduct and Ethics that applies to our
124
directors or executive officers (including the Chairman and Chief Executive Officer, the Chief Financial Officer and the Controller) will be posted at this internet address.
ITEM 11 - EXECUTIVE COMPENSATION
The information required by this item is included under the captions “Board Of Directors And Committees Of The Board –Compensation Of Directors, –Deferred Compensation Plans, and –Other Director Benefits,” “Compensation Discussion and Analysis,” – “Compensation Committee Interlocks and Insider Participation,” “Compensation Committee Report,” and “Compensation Tables” in our Proxy Statement to be filed for the annual meeting of shareholders to be held on April 24, 2007 and is incorporated herein by reference. In accordance with Item 407(e)(5) of Regulation S-K, the information set forth under the caption “Compensation Committee Report” in such Proxy Statement will be deemed to be furnished in this Report and will not be deemed to be incorporated by reference into any filing under the Securities Act or the Exchange Act as a result of furnishing the disclosure in this manner.
ITEM 12 - SECURITY OWNERSHIP OF CERTAIN BENEFICIAL OWNERS AND MANAGEMENT AND RELATED STOCKHOLDER MATTERS
The information required by this item regarding security ownership of certain beneficial owners and management is included under the caption “Compensation Tables – Security Ownership of Directors, Nominees and Executive Officers” in our Proxy Statement to be filed for the annual meeting of shareholders to be held on April 24, 2007 and is incorporated herein by reference.
Information regarding our compensation plans under which PNC equity securities are authorized for issuance as of December 31, 2006 is included in the table which follows. Additional information regarding these plans is included in Note 18 Stock-Based Compensation Plans in the Notes To Consolidated Financial Statements in Item 8 of this Report.
Equity Compensation Plan Information
At December 31, 2006
| | | | | | | |
| | | (a) | | (b) | | | (c) |
| | | Number of securities to
be issued upon exercise
of outstanding options,
warrants and rights | | Weighted-average
exercise price of
outstanding
options, warrants
and rights | | | Number of securities
remaining available for
future issuance under
equity compensation plans
(excluding securities
reflected in column (a)) |
Equity compensation plans approved by security holders | | | | | | | |
1997 Long-Term Incentive Award Plan (Note 1) | | | | | | | |
Stock Options | | 14,925,733 | | $59.27 | | | |
Incentive Performance Unit Awards (Note 2) | | 371,734 | | N/A | | | |
Subtotal | | 15,297,467 | | | | | 2,574,979 |
2006 Incentive Award Plan (Note 3) | | | | | | | |
Stock Options | | 24,170 | | $68.85 | | | 40,192,781 |
1996 Executive Incentive Award Plan | | | | | | | |
Incentive Awards | | | | N/A | | | 152,553 |
Employee Stock Purchase Plan | | | | (Note 4 | ) | | 1,413,893 |
1992 Director Share Incentive Plan | | | | N/A | | | 369,614 |
Total approved by security holders | | 15,321,637 | | | | | 44,703,820 |
Equity compensation plans not approved by security holders | | None | | N/A | | | None |
Total | | 15,321,637 | | | | | 44,703,820 |
N/A – not applicable
Note 1 – After shareholder approval of the 2006 Incentive Award Plan at the 2006 annual meeting of PNC’s shareholders on April 25, 2006 (see Note 3 below), no further grants were permitted under the 1997 Long-Term Incentive Award Plan, other than for the exercise of reload or performance unit rights. As of December 31, 2006, the number of remaining shares reserved under this plan for that purpose was 2,574,979.
Note 2 – These incentive performance unit awards provide for the issuance of shares of common stock (up to a target number of shares) based on the degree to which corporate performance goals established by the Personnel and Compensation Committee have been achieved, and, if a premium level of such performance is achieved, for further payment in cash. This number reflects the current maximum number of shares that could be issued pursuant to grants outstanding at December 31, 2006 upon achievement of the performance goals and other conditions of the grants. These grants were all made on January 23, 2006.
Note 3 – The 2006 Incentive Award Plan was adopted by the Board on February 15, 2006 and approved by the PNC shareholders at the 2006 annual meeting on April 25, 2006. The plan initially authorized up to 40,000,000 shares of common stock for issuance under the plan, subject to adjustment in certain circumstances. If and to the extent that options and SARs granted under the plan, or granted under the prior plan and outstanding on the approval date of the plan, terminate, expire or are cancelled, forfeited, exchanged or surrendered after the effective date of the plan without being exercised or if any share awards, share units, dividend equivalents or other share-based awards are forfeited or terminated, or otherwise not paid in full, after the effective date of the plan, the shares subject to such grants become available again for purposes of the plan.
Note 4 – 95% of the fair market value on the last day of each six-month offering period.
125
ITEM 13 –CERTAINRELATIONSHIPSANDRELATEDTRANSACTIONS,ANDDIRECTORINDEPENDENCE
The information required by this item is included under the captions “Transactions Involving Directors And Executive Officers” and “Corporate Governance At PNC – Director Independence” in our Proxy Statement to be filed for the annual meeting of shareholders to be held on April 24, 2007 and is incorporated herein by reference.
ITEM 14 –PRINCIPALACCOUNTINGFEESANDSERVICES
The information required by this item is included under the caption “Independent Auditors,” excluding the information set forth under the caption “Report Of The Audit Committee,” in our Proxy Statement to be filed for the annual meeting of shareholders to be held on April 24, 2007 and is incorporated herein by reference.
PART IV
ITEM 15 –EXHIBITS,FINANCIALSTATEMENTSCHEDULES
(a) (1) FINANCIAL STATEMENTS
Our consolidated financial statements required in response to this Item are incorporated by reference from Item 8 of this Report.
(a) (2), (b), and (c) FINANCIAL STATEMENT SCHEDULES
No financial statement schedules are being filed.
(a)(3) and (b) EXHIBITS
Our exhibits listed on the Exhibit Index on pages E-1 through E-4 of this Form 10-K are filed with this Report or are incorporated herein by reference.
126
SIGNATURES
Pursuant to the requirements of Section 13 or 15(d) of the Securities Exchange Act of 1934, the registrant has duly caused this report to be signed on its behalf by the undersigned, thereunto duly authorized.
THE PNC FINANCIAL SERVICES GROUP, INC.
(Registrant)
| | |
| By: | | /s/ Richard J. Johnson |
| | Richard J. Johnson |
| | Chief Financial Officer |
| | March 1, 2007 |
Pursuant to the requirements of the Securities Exchange Act of 1934, this report has been signed below by the following persons on behalf of The PNC Financial Services Group, Inc. and in the capacities indicated on March 1, 2007.
| | | | |
| Signature | | | | Capacities |
| | |
| /s/ James E. Rohr | | | | Chairman, Chief Executive Officer and Director
(Principal Executive Officer) |
| James E. Rohr | | | |
| | |
| /s/ Richard J. Johnson | | | | Chief Financial Officer
(Principal Financial Officer) |
| Richard J. Johnson | | | |
| | |
| /s/ Samuel R. Patterson | | | | Controller
(Principal Accounting Officer) |
| Samuel R. Patterson | | | |
| | |
| * Paul W. Chellgren; Robert N. Clay; J. Gary Cooper; George A. Davidson, Jr.; Kay Coles James; Richard B. Kelson; Bruce C. Lindsay; Anthony A. Massaro; Jane G. Pepper; Lorene K. Steffes; Dennis F. Strigl; Stephen G. Thieke; Thomas J. Usher; George H. Walls, Jr.; and Helge H. Wehmeier | | | | Directors |
| | |
| *By: | | /s/ George P. Long, III |
| | George P. Long, III, Attorney-in-Fact, pursuant to Powers of Attorney filed herewith |
127
EXHIBIT INDEX
| | | | |
Exhibit
No. | | Description | | Method of Filing + |
| | |
| 2.1 | | Agreement and Plan of Merger dated as of October 8, 2006 by and between Mercantile Bankshares Corporation and the Corporation | | Incorporated by reference to Exhibit 2.1 of the Corporation’s Current Report on Form 8-K dated October 8, 2006, filed October 10, 2006 (“October 8, 2006 Form 8-K”) |
| 3.1 | | Articles of Incorporation of the Corporation, as amended and restated effective as of August 29, 2005 | | Incorporated herein by reference to Exhibit 3.3 of the Corporation’s Current Report on Form 8-K dated August 25, 2005 (“August 25, 2005 Form 8-K”) |
| 3.2 | | By-Laws of the Corporation, as amended and restated effective as of December 14, 2005 | | Incorporated herein by reference to Exhibit 3.5 of the Corporation’s Quarterly Report on Form 10-Q for the quarter ended September 30, 2005 (“3rd Quarter 2005 Form 10-Q”) |
| 4.1 | | There are no instruments with respect to long-term debt of the Corporation and its subsidiaries that involve securities authorized under the instrument in an amount exceeding 10 percent of the total assets of the Corporation and its subsidiaries on a consolidated basis. The Corporation agrees to provide the SEC with a copy of instruments defining the rights of holders of long-term debt of the Corporation and its subsidiaries on request. | | |
| 4.2 | | Terms of $1.80 Cumulative Convertible Preferred Stock, Series A | | Incorporated herein by reference to Exhibit 3.3 of the Corporation’s August 25, 2005 Form 8-K |
| 4.3 | | Terms of $1.80 Cumulative Convertible Preferred Stock, Series B | | Incorporated herein by reference to Exhibit 3.3 of the Corporation’s August 25, 2005 Form 8-K |
| 4.4 | | Terms of $1.60 Cumulative Convertible Preferred Stock, Series C | | Incorporated herein by reference to Exhibit 3.3 of the Corporation’s August 25, 2005 Form 8-K |
| 4.5 | | Terms of $1.80 Cumulative Convertible Preferred Stock, Series D | | Incorporated herein by reference to Exhibit 3.3 of the Corporation’s August 25, 2005 Form 8-K |
| 4.6 | | Terms of Series G Junior Participating Preferred Stock | | Incorporated herein by reference to Exhibit 3.3 of the Corporation’s August 25, 2005 Form 8-K |
| 4.7 | | Terms of 7.00% Non-Cumulative Preferred Stock, Series H | | Incorporated herein by reference to Exhibit 3.3 of the Corporation’s August 25, 2005 Form 8-K |
| 4.8 | | Rights Agreement between the Corporation and The Chase Manhattan Bank dated May 15, 2000 | | Incorporated herein by reference to Exhibit 1 to the Corporation’s Report on Form 8-A filed May 23, 2000 |
| 4.9 | | First Amendment to Rights Agreement between the Corporation, The Chase Manhattan Bank, and Computershare Investor Services, LLC dated January 1, 2003 | | Incorporated herein by reference to Exhibit 4.8 of the Corporation’s Annual Report on Form 10-K for the year ended December 31, 2002 (“2002 Form 10-K”) |
| 4.10 | | Form of PNC Bank, National Association Global Bank Note for Fixed Rate Global Senior Bank Note with Maturity of more than Nine Months from Date of Issuance | | Incorporated herein by reference to Exhibit 4.9 of the Corporation’s Quarterly Report on Form 10-Q for the quarter ended September 30, 2004 (“3rd Quarter 2004 Form 10-Q”) |
| 4.11 | | Form of PNC Bank, National Association Global Bank Note for Floating Rate Global Senior Bank Note with Maturity of more than Nine Months from Date of Issuance | | Incorporated herein by reference to Exhibit 4.10 of the Corporation’s 3rd Quarter 2004 Form 10-Q |
| 4.12 | | Form of PNC Bank, National Association Global Bank Note for Fixed Rate Global Subordinated Bank Note with Maturity of more than Nine Months from Date of Issuance | | Incorporated herein by reference to Exhibit 4.11 of the Corporation’s 3rd Quarter 2004 Form 10-Q |
| 4.13 | | Form of PNC Bank, National Association Global Bank Note for Floating Rate Global Subordinated Bank Note with Maturity of more than Nine Months from Date of Issuance | | Incorporated herein by reference to Exhibit 4.12 of the Corporation’s 3rd Quarter 2004 Form 10-Q |
E-1
| | | | |
| 4.14 | | Indenture, dated as of December 20, 2006 between PNC Funding Corp, the Corporation as guarantor, and The Bank of New York as trustee for $1,000,000,000 Floating Rate Exchangeable Senior Notes due December 20, 2036 | | Filed herewith |
| 10.1 | | The Corporation’s Supplemental Executive Retirement Plan, as amended and restated | | Incorporated herein by reference to Exhibit 10.1 of the Corporation’s Quarterly Report on Form 10-Q for the quarter ended June 30, 2004 (“2nd Quarter 2004 Form 10-Q”)* |
| 10.2 | | The Corporation’s ERISA Excess Pension Plan, as amended and restated | | Incorporated herein by reference to Exhibit 10.2 of the Corporation’s 2nd Quarter 2004 Form 10-Q* |
| 10.3 | | The Corporation’s Key Executive Equity Program, as amended and restated | | Incorporated herein by reference to Exhibit 10.3 of the Corporation’s 2nd Quarter 2004 Form 10-Q* |
| 10.4 | | The Corporation’s Supplemental Incentive Savings Plan, as amended and restated | | Incorporated herein by reference to Exhibit 10.4 of the Corporation’s 2nd Quarter 2004 Form 10-Q* |
| 10.5 | | The Corporation’s 2006 Incentive Award Plan | | Incorporated herein by reference to Exhibit 10.39 of the Corporation’s Quarterly Report on Form 10-Q for the quarter ended March 31, 2006* |
| 10.6 | | The Corporation’s 1997 Long-Term Incentive Award Plan, as amended and restated | | Incorporated herein by reference to Exhibit 10.5 of the Corporation’s 2nd Quarter 2004 Form 10-Q* |
| 10.7 | | The Corporation’s 1996 Executive Incentive Award Plan, as amended and restated | | Incorporated herein by reference to Exhibit 10.6 of the Corporation’s 2nd Quarter 2004 Form 10-Q* |
| 10.8 | | The Corporation and Affiliates Deferred Compensation Plan, as amended and restated | | Incorporated herein by reference to Exhibit 10.7 of the Corporation’s 2nd Quarter 2004 Form 10-Q* |
| 10.9 | | AJCA transition guidance amendments to the Corporation’s Supplemental Incentive Savings Plan and the Corporation and Affiliates Deferred Compensation Plan | | Incorporated by reference to Exhibit 10.8 of the Corporation’s Annual Report on Form 10-K for the year ended December 31, 2005 (“2005 Form 10-K”)* |
| 10.10 | | 1992 Director Share Incentive Plan | | Incorporated herein by reference to Exhibit 10.13 of the Corporation’s Annual Report on Form 10-K for the year ended December 31, 1999* |
| 10.11 | | The Corporation’s Directors Deferred Compensation Plan, as amended and restated | | Incorporated by reference to Exhibit 10.12 of the Corporation’s Quarterly Report on Form 10-Q for the quarter ended March 31, 2004 (“1st Quarter 2004 Form 10-Q”)* |
| 10.12 | | The Corporation’s Outside Directors Deferred Stock Unit Plan, as amended and restated | | Incorporated by reference to Exhibit 10.13 of the Corporation’s 1st Quarter 2004 Form 10-Q* |
| 10.13 | | Amended and Restated Trust Agreement between PNC Investment Corp., as Settler, and Hershey Trust Company, as trustee | | Incorporated herein by reference to Exhibit 10.35 of the Corporation’s 3rd Quarter 2005 Form 10-Q* |
| 10.14 | | Trust Agreement between PNC Investment Corp., as Settler, and PNC Bank, National Association, as trustee | | Incorporated herein by reference to Exhibit 10.34 of the Corporation’s 3rd Quarter 2005 Form 10-Q* |
| 10.15 | | The Corporation’s Employee Stock Purchase Plan, as amended and restated | | Incorporated herein by reference to Exhibit 10.8 of the Corporation’s 2nd Quarter 2004 Form 10-Q |
| 10.16 | | Forms of employee stock option, restricted stock, restricted deferral, and incentive share agreements | | Incorporated herein by reference to Exhibit 10.30 of the Corporation’s 3rd Quarter 2004 Form 10-Q* |
| 10.17 | | 2005 Forms of employee stock option, restricted stock and restricted deferral agreements | | Incorporated herein by reference to Exhibit 10.28 of the Corporation’s Annual Report on Form 10-K for the year ended December 31, 2004 (“2004 Form 10-K”)* |
| 10.18 | | 2006 Forms of employee stock option, restricted stock and restricted deferral agreements | | Incorporated by reference to Exhibit 10.17 of the 2005 Form 10-K* |
| 10.19 | | Forms of employee stock option and restricted stock agreements under 2006 Incentive Award Plan | | Incorporated by reference to Exhibit 10.39 of the Corporation’s Quarterly Report on Form 10-Q for the quarter ended June 30, 2006* |
E-2
| | | | |
| 10.20 | | 2006 Forms of employee incentive performance unit and senior officer change in control severance agreements | | Filed herewith* |
| 10.21 | | 2007 Forms of employee stock option and restricted stock agreements | | Filed herewith* |
| 10.22 | | Forms of director stock option and restricted stock agreements | | Incorporated herein by reference to Exhibit 10.32 of the Corporation’s 3rd Quarter 2004 Form 10-Q* |
| 10.23 | | 2005 Form of director stock option agreement | | Incorporated herein by reference to Exhibit 10.33 of the Corporation’s Quarterly Report on Form 10-Q for the quarter ended March 31, 2005* |
| 10.24 | | Form of time sharing agreements between the Corporation and certain executives | | Incorporated herein by reference to Exhibit 10.36 of the 3rd Quarter 2005 Form 10-Q* |
| 10.25 | | Form of senior officer change in control severance agreement | | Incorporated herein by reference to Exhibit 10.17 of the Corporation’s Annual Report on Form 10-K for the year ended December 31, 1996* |
| 10.26 | | Forms of first amendment to senior officer change in control severance agreements | | Incorporated herein by reference to Exhibit 10.9 of the Corporation’s Annual Report on Form 10-K for the year ended December 31, 2000* |
| 10.27 | | Forms of second amendment to senior officer change in control severance agreements | | Incorporated herein by reference to Exhibit 10.15 of the Corporation’s Quarterly Report on Form 10-Q for the quarter ended September 30, 2001* |
| 10.28 | | Forms of third amendment to senior officer change in control severance agreements | | Incorporated herein by reference to Exhibit 10.26 of the Corporation’s 1st Quarter 2004 Form 10-Q* |
| 10.29 | | Form of other officer change in control severance agreements | | Incorporated herein by reference to Exhibit 10.31 of the 3rd Quarter 2004 Form 10-Q* |
| 10.30 | | BlackRock, Inc. 2002 Long-Term Retention and Incentive Plan | | Incorporated by reference to BlackRock, Inc.’s Quarterly Report on Form 10-Q (Commission File No. 001-15305) for the quarter ended September 30, 2002 (“BlackRock 3rd Quarter 2002 Form 10-Q”) |
| 10.31 | | First Amendment to the BlackRock, Inc. 2002 Long-Term Retention and Incentive Plan | | Incorporated by reference to BlackRock, Inc.’s Quarterly Report on Form 10-Q (Commission File No. 001-15305) for the quarter ended March 31, 2004 |
| 10.32 | | Second Amendment to the BlackRock, Inc. 2002 Long-Term Retention and Incentive Plan | | Incorporated herein by reference to the BlackRock 2004 Form 10-K |
| 10.33 | | Share Surrender Agreement, dated October 10, 2002, among BlackRock, Inc., PNC Asset Management, Inc., and the Corporation | | Incorporated by reference to the BlackRock 3rd Quarter 2002 Form 10-Q |
| 10.34 | | First Amendment, dated as of February 15, 2006, to the Share Surrender Agreement among BlackRock, Inc., PNC Bancorp, Inc. and the Corporation | | Incorporated by reference to BlackRock, Inc.’s Current Report on Form 8-K (Commission File No. 001-15305) filed February 22, 2006 (“BlackRock February 22, 2006 Form 8-K”) |
| 10.35 | | Initial Public Offering Agreement, dated September 30, 1999, among BlackRock, Inc., The PNC Financial Services Group, Inc., formerly PNC Bank Corp., and PNC Asset Management, Inc. | | Incorporated by reference to BlackRock, Inc.’s Registration Statement on Form S-1 (Registration No. 333-78367), as amended, originally filed with the SEC on May 13, 1999 (“1999 BlackRock Form S-1 as amended”) |
| 10.36 | | Amendment No. 1 to the Initial Public Offering Agreement, dated October 10, 2002, among the Corporation, PNC Asset Management, Inc. and BlackRock, Inc. | | Incorporated by reference to the BlackRock 3rd Quarter 2002 Form 10-Q |
E-3
| | | | |
| 10.37 | | Amended and Restated Stockholders Agreement, dated September 30, 1999, by and among BlackRock, Inc., PNC Asset Management, Inc. and certain employees of BlackRock, Inc. and its affiliates | | Incorporated by reference to the 1999 BlackRock Form S-1 as amended |
| 10.38 | | Amendment No. 1 to the Amended and Restated Stockholders Agreement, dated October 10, 2002, by and among BlackRock, Inc., PNC Asset Management, Inc. and certain employees of BlackRock, Inc. and its affiliates | | Incorporated by reference to the BlackRock 3rd Quarter 2002 Form 10-Q |
| 10.39 | | Implementation and Stockholder Agreement, dated as of February 15, 2006, among BlackRock, Inc., New Boise, Inc. and the Corporation | | Incorporated by reference to the BlackRock February 22, 2006 Form 8-K |
| 10.40 | | PNC Bank, National Association US $20,000,000,000 Global Bank Note Program for the Issue of Senior and Subordinated Bank Notes with Maturities of more than Nine Months from Date of Issue Distribution Agreement dated July 30, 2004 | | Incorporated herein by reference to Exhibit 10.29 of the Corporation’s 3rd Quarter 2004 Form 10-Q |
| 10.41 | | Amended and Restated Agreement and Plan of Merger, dated as of February 10, 2005, between the Corporation and Riggs National Corporation | | Incorporated herein by reference to Exhibit 2.1 of the Corporation’s Current Report on Form 8-K dated February 10, 2005 |
| 10.42 | | Transaction Agreement and Plan of Merger, dated as of February 15, 2006, by and among Merrill Lynch & Co., Inc., BlackRock, Inc., New Boise, Inc. and Boise Merger Sub, Inc. | | Incorporated by reference to the BlackRock February 22, 2006 Form 8-K |
| 10.43 | | Agreement and Plan of Merger dated as of October 8, 2006 by and between Mercantile Bankshares Corporation and the Corporation | | Incorporated by reference to Exhibit 2.1 of the Corporation’s October 8, 2006 Form 8-K |
| 12.1 | | Computation of Ratio of Earnings to Fixed Charges | | Filed herewith |
| 12.2 | | Computation of Ratio of Earnings to Fixed Charges and Preferred Dividends | | Filed herewith |
| 21 | | Schedule of Certain Subsidiaries of the Corporation | | Filed herewith |
| 23 | | Consent of Deloitte & Touche LLP, Independent Registered Public Accounting Firm | | Filed herewith |
| 24 | | Powers of Attorney | | Filed herewith |
| 31.1 | | Certification of Chairman and Chief Executive Officer pursuant to Section 302 of the Sarbanes-Oxley Act of 2002 | | Filed herewith |
| 31.2 | | Certification of Chief Financial Officer pursuant to Section 302 of the Sarbanes-Oxley Act of 2002 | | Filed herewith |
| 32.1 | | Certification of Chairman and Chief Executive Officer pursuant to 18 U.S.C. Section 1350 | | Filed herewith |
| 32.2 | | Certification of Chief Financial Officer pursuant to 18 U.S.C. Section 1350 | | Filed herewith |
| 99.1 | | Form of Order of the Securities and Exchange Commission Instituting Public Administrative Procedures Pursuant to Section 8A of the Securities Act of 1933 and 21C of the Securities Exchange Act of 1934, Making Findings and Imposing Cease-and-Desist Order | | Incorporated herein by reference to Exhibit 99.3 of the Corporation’s Current Report on Form 8-K dated July 18, 2002 |
| | | | |
| | | | |
| | | | | |
| + | Incorporated document references to filings by the Corporation are to SEC File No. 001-09718 and to filings by BlackRock, Inc. are to SEC File No. 001-15305. |
| * | Denotes management contract or compensatory plan. |
You can obtain copies of these Exhibits electronically at the SEC’s website at www.sec.gov or by mail from the Public Reference Section of the SEC, at 100 F Street, N.E., Washington, D.C. 20549, at prescribed rates. The Exhibits are also available as part of this Form 10-K on or through PNC’s corporate website at www.pnc.com under “About PNC – Investor Relations – Financial Information – SEC filings – Form 10-K.” Shareholders and bondholders may also obtain copies without charge by contacting Shareholder Relations at (800) 843-2206 or via e-mail at investor.relations@pnc.com.
E-4