Exhibit 99.1
NASDAQ: NBBC www.newbridgebank.com KEEFE, BRUYETTE & WOODS Fourteenth Annual Community Bank Investor Conference 2013
Information in this presentation may contain forward - looking statements. Such statements involve known and unknown risks, uncertainties and other factors that may cause actual results to differ materially. Forward - looking statements are often characterized by the use of qualifying words such as “expects,” “anticipates,” “believes,” “estimates,” “plans,” “projects,” or other statements concerning opinions or judgments of the Company and its management about future events. The accuracy of such forward - looking statements could be affected by factors including, but not limited to, the financial success or changing conditions or strategies of the Company’s customers or vendors, fluctuations in interest rates, actions of government regulators, the availability of capital and personnel, or general economic conditions. Additional factors are discussed in the Company’s filings with the SEC, including without limitation, Forms 10 - K, 10 - Q and 8 - K. NewBridge Bancorp undertakes no obligations to revise these statements following the date of this presentation. 2 FORWARD - LOOKING STATEMENTS
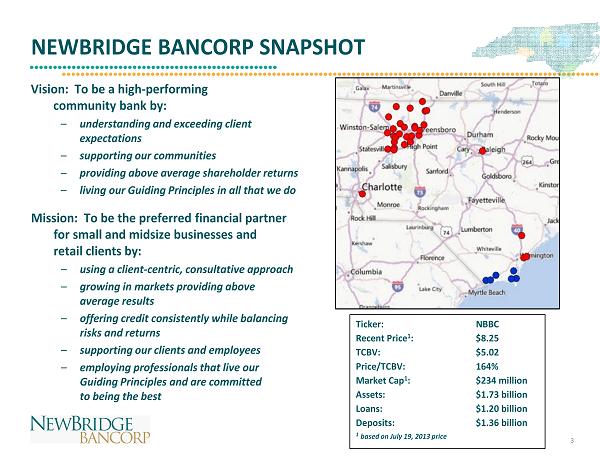
NEWBRIDGE BANCORP SNAPSHOT Vision: To be a high - performing community bank by: – understanding and exceeding client expectations – supporting our communities – providing above average shareholder returns – living our Guiding Principles in all that we do Mission: To be the preferred financial partner for small and midsize businesses and retail clients by: – using a client - centric, consultative approach – growing in markets providing above average results – offering credit consistently while balancing risks and returns – supporting our clients and employees – employing professionals that live our Guiding Principles and are committed to being the best Ticker: NBBC Recent Price 1 : $8.25 TCB V: $5.02 Price/TCBV: 164% Market Cap 1 : $234 million Assets: $1.73 billion Loans: $1.20 billion Deposits: $1.36 billion 1 based on July 19, 2013 price 3
PROGRESS SINCE 2007 FORMATION (MOE) • Assembled experienced management team • Changed balance sheet mix to maximize margins and position for growth • Established new Credit Culture and addressed legacy problem loans • Formed new Sales Culture and re - positioned talent in a LOB structure • Strengthened non - interest income lines (mortgage, wealth management) • Re - positioned existing branch footprint and expanded in growth markets • Eliminated costs and re - deployed resources to growth markets • Resolved capital structure 4
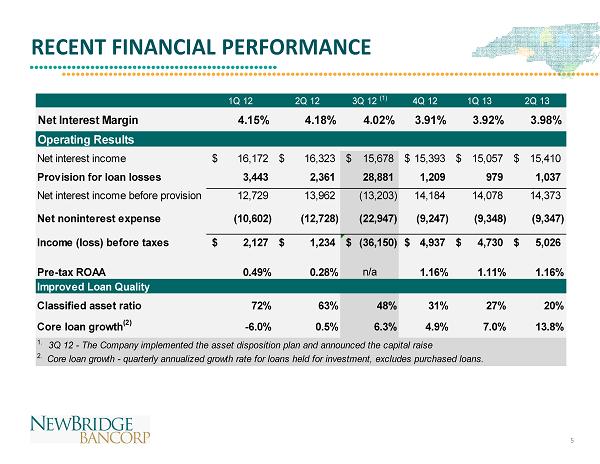
RECENT FINANCIAL PERFORMANCE 5 1Q 12 2Q 12 3Q 12 (1) 4Q 12 1Q 13 2Q 13 Net Interest Margin 4.15% 4.18% 4.02% 3.91% 3.92% 3.98% Operating Results Net interest income 16,172$ 16,323$ 15,678$ 15,393$ 15,057$ 15,410$ Provision for loan losses 3,443 2,361 28,881 1,209 979 1,037 Net interest income before provision 12,729 13,962 (13,203) 14,184 14,078 14,373 Net noninterest expense (10,602) (12,728) (22,947) (9,247) (9,348) (9,347) Income (loss) before taxes 2,127$ 1,234$ (36,150)$ 4,937$ 4,730$ 5,026$ Pre-tax ROAA 0.49% 0.28% n/a 1.16% 1.11% 1.16% Improved Loan Quality Classified asset ratio 72% 63% 48% 31% 27% 20% Core loan growth (2) -6.0% 0.5% 6.3% 4.9% 7.0% 13.8% 1. 3Q 12 - The Company implemented the asset disposition plan and announced the capital raise 2. Core loan growth - quarterly annualized growth rate for loans held for investment, excludes purchased loans.
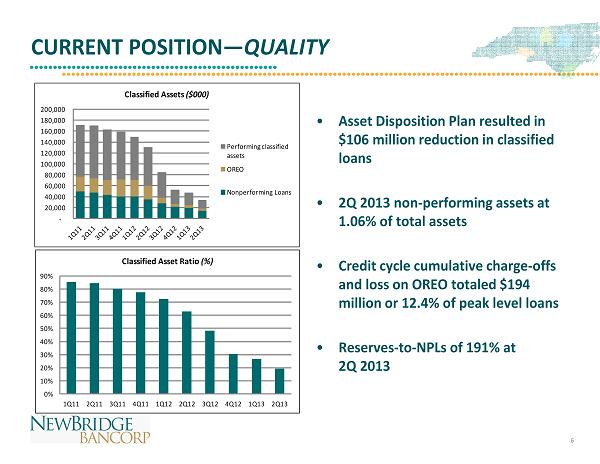
CURRENT POSITION — QUALITY • Asset Disposition Plan resulted in $106 million reduction in classified loans • 2Q 2013 non - performing assets at 1.06% of total assets • Credit cycle cumulative charge - offs and loss on OREO totaled $194 million or 12.4% of peak level loans • Reserves - to - NPLs of 191% at 2Q 2013 - 20,000 40,000 60,000 80,000 100,000 120,000 140,000 160,000 180,000 200,000 Classified Assets ($000) Performing classified assets OREO Nonperforming Loans 0% 10% 20% 30% 40% 50% 60% 70% 80% 90% 1Q11 2Q11 3Q11 4Q11 1Q12 2Q12 3Q12 4Q12 1Q13 2Q13 Classified Asset Ratio (%) 6
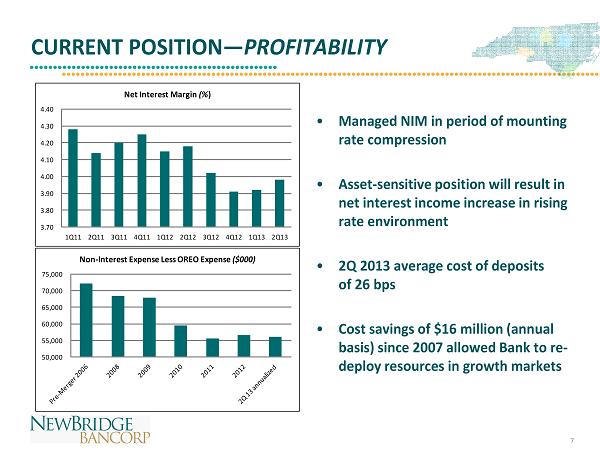
CURRENT POSITION — PROFITABILITY • Managed NIM in period of mounting rate compression • Asset - sensitive position will result in net interest income increase in rising rate environment • 2Q 2013 average cost of deposits of 26 bps • Cost savings of $16 million (annual basis) since 2007 allowed Bank to re - deploy resources in growth markets 3.70 3.80 3.90 4.00 4.10 4.20 4.30 4.40 1Q11 2Q11 3Q11 4Q11 1Q12 2Q12 3Q12 4Q12 1Q13 2Q13 Net Interest Margin (% ) 50,000 55,000 60,000 65,000 70,000 75,000 Non - Interest Expense Less OREO Expense ($000) 7
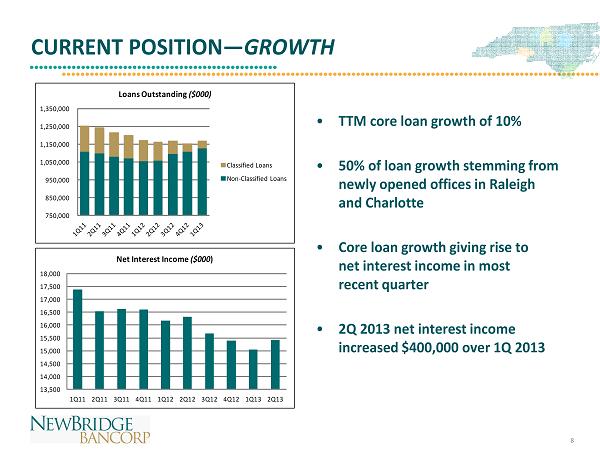
CURRENT POSITION — GROWTH • TTM core loan growth of 10% • 50% of loan growth stemming from newly opened offices in Raleigh and Charlotte • Core loan growth giving rise to net interest income in most recent quarter • 2Q 2013 net interest income increased $400,000 over 1Q 2013 13,500 14,000 14,500 15,000 15,500 16,000 16,500 17,000 17,500 18,000 1Q11 2Q11 3Q11 4Q11 1Q12 2Q12 3Q12 4Q12 1Q13 2Q13 Net Interest Income ($000 ) 8 750,000 850,000 950,000 1,050,000 1,150,000 1,250,000 1,350,000 Loans Outstanding ($000) Classified Loans Non - Classified Loans
GROWTH STRATEGIES • NBBC franchise is strategically located throughout high growth markets of North Carolina • Recent additions of the Raleigh and Charlotte markets and expansion of the Wilmington market have positioned NBBC for increased returns • Management continues to evaluate growth initiatives in NC and other regional markets through: – Organic growth – LPO / DeNovo – Mergers & Acquisitions 9
GROWTH STRATEGIES — ORGANIC • Moved from geographic - based structure to Lines of Businesses to better address client needs • Hired experienced banking professionals to grow existing markets – Commercial Banking Managers – CRE Specialists – Builder Finance Specialists • Wealth Management team offers services ranging from retail investments to in - house money management; assets under management tripled in just over 2 years • Other non - interest income driven by Mortgage Banking expansion and deposit product re - positioning (consolidation and revenue enhancements) 10
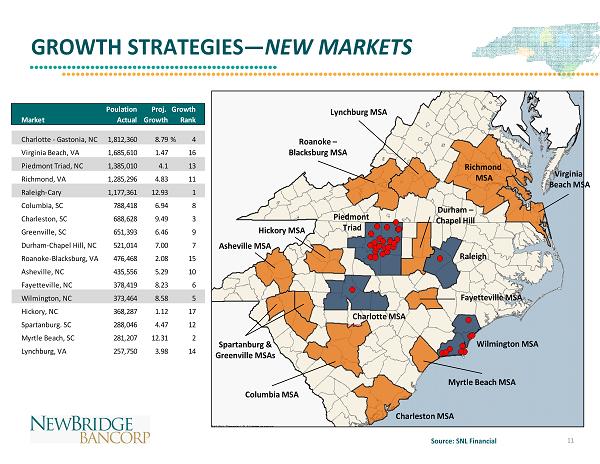
GROWTH STRATEGIES — NEW MARKETS Virginia Beach MSA Richmond MSA Columbia MSA Roanoke – Blacksburg MSA Charleston MSA Spartanburg & Greenville MSAs Myrtle Beach MSA Lynchburg MSA Source: SNL Financial Poulation Proj. Growth Market Actual Growth Rank Charlotte - Gastonia, NC 1,812,360 8.79% 4 Virginia Beach, VA 1,685,610 1.47 16 Piedmont Triad, NC 1,385,010 4.1 13 Richmond, VA 1,285,296 4.83 11 Raleigh-Cary 1,177,361 12.93 1 Columbia, SC 788,418 6.94 8 Charleston, SC 688,628 9.49 3 Greenville, SC 651,393 6.46 9 Durham-Chapel Hill, NC 521,014 7.00 7 Roanoke-Blacksburg, VA 476,468 2.08 15 Asheville, NC 435,556 5.29 10 Fayetteville, NC 378,419 8.23 6 Wilmington, NC 373,464 8.58 5 Hickory, NC 368,287 1.12 17 Spartanburg. SC 288,046 4.47 12 Myrtle Beach, SC 281,207 12.31 2 Lynchburg, VA 257,750 3.98 14 Piedmont Triad Durham – Chapel Hill Fayetteville MSA Asheville MSA Hickory MSA Wilmington MSA Raleigh Charlotte MSA 11
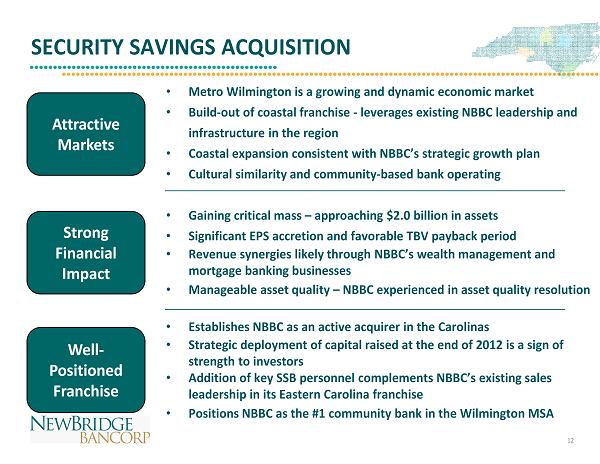
SECURITY SAVINGS ACQUISITION • Metro Wilmington is a growing and dynamic economic market • Build - out of coastal franchise - leverages existing NBBC leadership and infrastructure in the region • Coastal expansion consistent with NBBC’s strategic growth plan • Cultural similarity and community - based bank operating • Gaining critical mass – approaching $2.0 billion in assets • Significant EPS accretion and favorable TBV payback period • Revenue synergies likely through NBBC’s wealth management and mortgage banking businesses • Manageable asset quality – NBBC experienced in asset quality resolution • Establishes NBBC as an active acquirer in the Carolinas • Strategic deployment of capital raised at the end of 2012 is a sign of strength to investors • Addition of key SSB personnel complements NBBC’s existing sales leadership in its E astern C arolina franchise • Positions NBBC as the #1 community bank in the Wilmington MSA Attractive Markets Strong Financial Impact Well - Positioned Franchise 12
NBBC: POSITIONED FOR SUCCESS • QUALITY: Credit metrics show continued improvement and credit administration infrastructure capable of supporting sustained growth • PROFITABILITY: Balance sheet mix and product offerings re - tooled to maximize margins and earnings • GROWTH: Line of Business structure can be leveraged to support organic growth, acquisitions, and entry into new markets 13
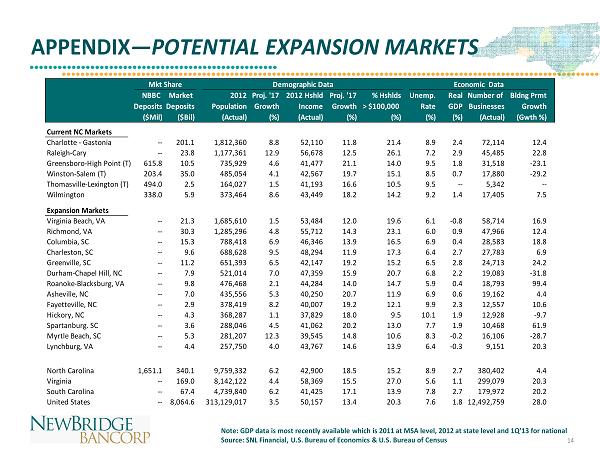
APPENDIX — POTENTIAL EXPANSION MARKETS Note: GDP data is most recently available which is 2011 at MSA level, 2012 at state level and 1Q’13 for national Source: SNL Financial, U.S. Bureau of Economics & U.S. Bureau of Census Mkt Share Demographic Data Economic Data NBBC Market 2012 Proj. '17 2012 Hshld Proj. '17 % Hshlds Unemp. Real Number of Bldng Prmt DepositsDeposits Population Growth Income Growth > $100,000 Rate GDP Businesses Growth ($Mil) ($Bil) (Actual) (%) (Actual) (%) (%) (%) (%) (Actual) (Gwth %) Current NC Markets Charlotte - Gastonia -- 201.1 1,812,360 8.8 52,110 11.8 21.4 8.9 2.4 72,114 12.4 Raleigh-Cary -- 23.8 1,177,361 12.9 56,678 12.5 26.1 7.2 2.9 45,485 22.8 Greensboro-High Point (T) 615.8 10.5 735,929 4.6 41,477 21.1 14.0 9.5 1.8 31,518 -23.1 Winston-Salem (T) 203.4 35.0 485,054 4.1 42,567 19.7 15.1 8.5 0.7 17,880 -29.2 Thomasville-Lexington (T) 494.0 2.5 164,027 1.5 41,193 16.6 10.5 9.5 -- 5,342 -- Wilmington 338.0 5.9 373,464 8.6 43,449 18.2 14.2 9.2 1.4 17,405 7.5 Expansion Markets Virginia Beach, VA -- 21.3 1,685,610 1.5 53,484 12.0 19.6 6.1 -0.8 58,714 16.9 Richmond, VA -- 30.3 1,285,296 4.8 55,712 14.3 23.1 6.0 0.9 47,966 12.4 Columbia, SC -- 15.3 788,418 6.9 46,346 13.9 16.5 6.9 0.4 28,583 18.8 Charleston, SC -- 9.6 688,628 9.5 48,294 11.9 17.3 6.4 2.7 27,783 6.9 Greenville, SC -- 11.2 651,393 6.5 42,147 19.2 15.2 6.5 2.8 24,713 24.2 Durham-Chapel Hill, NC -- 7.9 521,014 7.0 47,359 15.9 20.7 6.8 2.2 19,083 -31.8 Roanoke-Blacksburg, VA -- 9.8 476,468 2.1 44,284 14.0 14.7 5.9 0.4 18,793 99.4 Asheville, NC -- 7.0 435,556 5.3 40,250 20.7 11.9 6.9 0.6 19,162 4.4 Fayetteville, NC -- 2.9 378,419 8.2 40,007 19.2 12.1 9.9 2.3 12,557 10.6 Hickory, NC -- 4.3 368,287 1.1 37,829 18.0 9.5 10.1 1.9 12,928 -9.7 Spartanburg. SC -- 3.6 288,046 4.5 41,062 20.2 13.0 7.7 1.9 10,468 61.9 Myrtle Beach, SC -- 5.3 281,207 12.3 39,545 14.8 10.6 8.3 -0.2 16,106 -28.7 Lynchburg, VA -- 4.4 257,750 4.0 43,767 14.6 13.9 6.4 -0.3 9,151 20.3 North Carolina 1,651.1 340.1 9,759,332 6.2 42,900 18.5 15.2 8.9 2.7 380,402 4.4 Virginia -- 169.0 8,142,122 4.4 58,369 15.5 27.0 5.6 1.1 299,079 20.3 South Carolina -- 67.4 4,739,840 6.2 41,425 17.1 13.9 7.8 2.7 179,972 20.2 United States -- 8,064.6 313,129,017 3.5 50,157 13.4 20.3 7.6 1.8 12,492,759 28.0 14
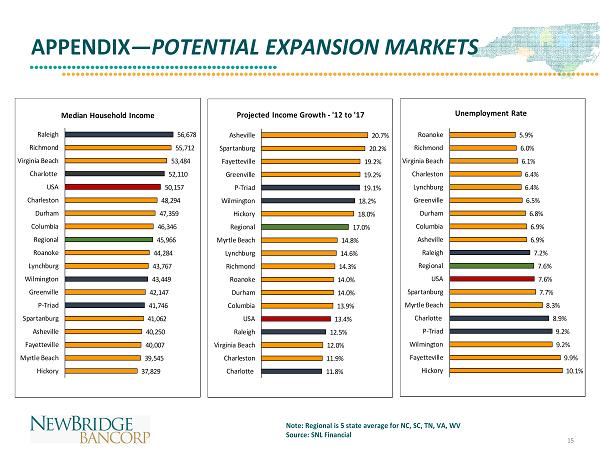
APPENDIX — POTENTIAL EXPANSION MARKETS Note: Regional is 5 state average for NC, SC, TN, VA, WV Source: SNL Financial 56,678 55,712 53,484 52,110 50,157 48,294 47,359 46,346 45,966 44,284 43,767 43,449 42,147 41,746 41,062 40,250 40,007 39,545 37,829 Raleigh Richmond Virginia Beach Charlotte USA Charleston Durham Columbia Regional Roanoke Lynchburg Wilmington Greenville P-Triad Spartanburg Asheville Fayetteville Myrtle Beach Hickory Median Household Income 5.9% 6.0% 6.1% 6.4% 6.4% 6.5% 6.8% 6.9% 6.9% 7.2% 7.6% 7.6% 7.7% 8.3% 8.9% 9.2% 9.2% 9.9% 10.1% Roanoke Richmond Virginia Beach Charleston Lynchburg Greenville Durham Columbia Asheville Raleigh Regional USA Spartanburg Myrtle Beach Charlotte P-Triad Wilmington Fayetteville Hickory Unemployment Rate 20.7% 20.2% 19.2% 19.2% 19.1% 18.2% 18.0% 17.0% 14.8% 14.6% 14.3% 14.0% 14.0% 13.9% 13.4% 12.5% 12.0% 11.9% 11.8% Asheville Spartanburg Fayetteville Greenville P-Triad Wilmington Hickory Regional Myrtle Beach Lynchburg Richmond Roanoke Durham Columbia USA Raleigh Virginia Beach Charleston Charlotte Projected Income Growth - '12 to '17 15
CONTACT INFORMATION • Pressley Ridgill President and Chief Executive Officer (336) 369 - 0903 pressley.ridgill@newbridgebank.com • Ramsey Hamadi Chief Financial Officer (336) 369 - 0975 ramsey.hamadi@newbridgebank.com • Additional information can be found at www.newbridgebank.com 16