UNITED STATES
SECURITIES AND EXCHANGE COMMISSION
Washington, D.C. 20549
FORM 10-K
[ X ] ANNUAL REPORT PURSUANT TO SECTION 13 or 15(d) OF
THE SECURITIES EXCHANGE ACT OF 1934
For the fiscal year ended December 31, 2005
or
[ ] TRANSITION REPORT PURSUANT TO SECTION 13 OR 15(d) OF
THE SECURITIES EXCHANGE ACT OF 1934
Commission File Number 001-11663
COMMUNITY BANKS, INC.
(Exact name of registrant as specified in its charter)
Pennsylvania | | 23-2251762 |
(State of Incorporation) | | (I.R.S. Employer Identification No.) |
| | | |
750 East Park Drive, Harrisburg, PA | | 17111 |
(Address of principal executive offices) | | (Zip Code) |
Registrant’s telephone number, including area code: (717) 920-1698
Securities registered pursuant to Section 12 (b) of the Act: None
Securities registered pursuant to Section 12 (g) of the Act: Common Stock, par value $5 per share
| Indicate by check mark if the registrant is a well-known seasoned issuer, as defined in Rule 405 of the Securities Act. | Yes | | | No | X |
| Indicate by check mark if the registrant is not required to file reports pursuant to Section 13 or Section 15(d) of the Act. | Yes | | | No | X |
Indicate by check mark whether the registrant (1) has filed all reports required to be filed by section 13 or 15(d) of the Securities Exchange Act of 1934 during the preceding 12 months (or for shorter period that the registrant was required to file such reports), and (2) has been subject to
| such filing requirements for the past 90 days. | Yes | X | | No | |
Indicate by check mark if disclosure of delinquent filers pursuant to Item 405 of Regulation S-K is not contained herein, and will not be contained, to the best of registrant’s knowledge, in definitive proxy or information statements incorporated by reference in Part III of the Form 10-K or any amendments to this Form 10-K. [ ]
| Indicate by check mark whether the registrant is an accelerated filer (as defined in Rule 12b-2 of the Act). | Yes | X | | No | |
| Indicate by check mark whether the registrant is a shell company (as defined in Rule 12b-2 of the Act). | Yes | | | No | X |
Aggregate market value of the Common Stock, $5 par value, held by non-affiliates, computed by reference to the closing price on June 30, 2005: $ 287,000,000
Number of shares of the Common Stock, $5 par value, outstanding as of the close of business on February 28, 2006: 23,300,000 shares.
Documents Incorporated by Reference:
Portions of the Proxy Statement for the 2006 Annual Meeting of Shareholders of Community Banks, Inc., have been incorporated by reference into Part III.
(This page intentionally blank)
COMMUNITY BANKS, INC.
FORM 10-K
INDEX
PART I | | Page |
| | | |
| Item 1 | | 4 - 7 |
| Item 1A | | 7 - 8 |
| Item 1B | | 9 |
| Item 2 | | 9 |
| Item 3 | | 9 |
| Item 4 | | 9 |
| | | |
| | | |
PART II | | |
| | | |
| Item 5 | | 10 |
| Item 6 | | 11 |
| Item 7 | | 12 - 50 |
| Item 7A | | 51 - 53 |
| Item 8 | | 54 - 84 |
| Item 9 | | 85 |
| Item 9A | | 85 |
| Item 9B | | 85 |
| | | |
| | | |
PART III | | |
| | | |
| Item 10 | | 88 |
| Item 11 | | 88 |
| Item 12 | | 88 |
| Item 13 | | 88 |
| Item 14 | | 88 |
| | | |
| | | |
PART IV | | |
| | | |
| Item 15 | | 89 - 90 |
| | | |
| | | |
| | 91 |
| | | |
| | | |
PART I
Community Banks, Inc., referred to in this report as the “Corporation” or “Community,” is a financial holding company that was formed as a Pennsylvania corporation in 1982. The executive offices of Community are located at 750 East Park Drive, Harrisburg, Pennsylvania 17111.
The common stock of Community is listed on the National Market System of the National Association of Securities Dealers Automated Quotation System under the symbol CMTY. Community’s internet address is www.communitybanks.com. Electronic copies of Annual Reports on Form 10-K, Quarterly Reports on Form 10-Q and Current Reports on Form 8-K, and amendments to those reports filed or furnished pursuant to Section 13(a) or 15(d) of the Exchange Act, are available through the “Investor Relations” section of Community’s website as soon as reasonably practicable after filing such material with, or furnishing it to, the Securities and Exchange Commission. Copies of such reports are also available at no charge.
Community’s wholly-owned banking subsidiary is CommunityBanks, referred to in this report as the “Bank” or “CommunityBanks.”
Acquisition of PennRock Financial Services Corp.
On July 1, 2005, Community completed the acquisition of PennRock Financial Services Corp. (PennRock), a bank holding company headquartered in Blue Ball, Pennsylvania. PennRock had approximately $1.2 billion in assets, $835 million in net loans, $250 million in investments, $880 million in deposits, $220 million in borrowings and $100 million of stockholders’ equity at the acquisition date. PennRock’s subsidiary bank was Blue Ball National Bank (Blue Ball), which operated in Lancaster, Berks, and Chester Counties, Pennsylvania.
Each PennRock shareholder received 1.4 shares of Community in exchange for each share of PennRock common stock. Community issued approximately 10.9 million shares and stock options (to convert outstanding PennRock options into Community stock options).
PennRock merged with and into Community, with Community being the surviving company. Blue Ball merged with and into CommunityBanks and operates as a division of the Bank.
Community’s non-banking subsidiaries are CommunityBanks Investments, Inc. (CBII) and Community Banks Life Insurance Company, Inc. (CBLIC). The subsidiaries of the Bank are UDNB Investments, Inc. (UDNB); PSB Realty Co., Inc.; The Sentinel Agency LLC; Community Banks Insurance Services LLC; CB Services LLC; and Community Mortgage Services LLC. At December 31, 2005, no non-bank subsidiaries have total assets that exceed 1% of consolidated total assets. CBII’s net income was approximately 1.5% of consolidated income for 2005 and UDNB’s net income was approximately 3.5% of consolidated income for 2005. Otherwise no non-bank subsidiary has net income exceeding 1% of consolidated net income.
On January 1, 2002, Community consolidated the charters of its then two banking subsidiaries pursuant to regulatory approvals. Prior to that time, Community’s separate banking organizations operated as Peoples State Bank (PSB), a state chartered bank with offices throughout York and Adams Counties; and Community Banks, N.A. (CBNA), a federally chartered bank headquartered in Dauphin County with offices in central and northeastern Pennsylvania. The consolidation was designed to facilitate a regional operational focus that would ease regulatory burdens while, at the same time, maintain a philosophy of local decision-making.
Community conducts a full service commercial and retail banking business and provides trust services through 72 banking offices in Pennsylvania and Maryland: 3 offices in Adams County, 6 offices in Berks County, 2 offices in Chester County, 5 offices in Cumberland County, 10 offices in Dauphin County, 12 offices in Lancaster County, 3 offices in Luzerne County, 2 offices in Northumberland County, 7 offices in Schuylkill County, 1 office in Snyder County, and 19 offices in York County, Pennsylvania and 2 offices in Carroll County, Maryland. At December 31,
2005, there were three additional offices in varying stages of completion including 1 each in Dauphin, Lancaster, and York counties. There are approximately 1,250 offices of commercial banks and savings and loan associations within the market area in which Community competes. Community currently has a 7% share of the deposit market in the primary metropolitan statistical areas (MSA) in which it conducts business. In addition to traditional banking business, Community conducts business through various direct or indirect, non-bank subsidiaries. These subsidiaries are engaged in activities related to the business of banking.
Over the years, Community has formed special purpose wholly-owned subsidiaries. In 1985, Community formed CBII to make investments primarily in equity securities of other banks. In 1986, Community formed CBLIC to provide credit life insurance to its consumer credit borrowers. Subsidiary trusts, which are not consolidated in the financial statements in accordance with provisions of Financial Accounting Standards Board (FASB) Interpretation No. 46, “Consolidation of Variable Interest Entities, An Interpretation of ARB No. 51,” have been formed to execute trust preferred issuances: CMTY Capital Trust I in December, 2002, for a pooled issuance of $15 million and CMTY Statutory Capital Trust II in December, 2003, for an issuance of $15 million. In January, 2006, Community formed CMTY Statutory Capital Trust III and CMTY Statutory Capital Trust IV for pooled issuances of $10 million each.
Community and its subsidiaries have approximately 933 full-time equivalent employees as of December, 2005, and Community considers its employee relations to be satisfactory.
Like other banking companies, Community has been subjected to competition from credit unions, brokerage firms, money market funds, consumer finance and credit card companies and other companies providing financial services and credit to consumers. The competition is especially fierce with the credit union industry, particularly in certain segments of Community’s markets. The expansion of credit union activity, now permitted by so-called “community-based” charters, continues to create mounting competitive pressure. The expansion of “fields of membership” and credit union activity is thought by most banks to be contributing to an increasingly unfair competitive situation, largely because of the tax-exempt status afforded credit unions. Initiatives to further expand the powers of credit unions to conduct business in areas that go far beyond the original intent of credit union charters continue to be pressed at both the state and federal levels.
Supervision and Regulation of Community
The banking industry is subject to extensive state and federal regulation. Proposals to change laws and regulations governing the banking industry are frequently raised in Congress, in state legislatures, and in various bank regulatory agencies. The likelihood and timing that any such changes may have on Community are difficult to determine with any certainty. Changes in laws or regulations, or changes in the interpretation of laws or regulations, may have a material impact on the business, operations and earnings of Community.
Community Banks, Inc. is registered as a financial holding company with the Federal Reserve Board in accordance with the requirements of the Gramm-Leach-Bliley Act. The Gramm-Leach-Bliley Act enables broad-scale consolidation among banks, securities firms and insurance companies for eligible bank holding companies that have elected and maintain “financial holding company” status. Financial holding companies can offer virtually any type of financial service, including banking, securities underwriting, insurance (both agency and underwriting) and merchant banking. If a bank holding company does not become a financial holding company, it will be limited to those activities previously determined by the Federal Reserve Board to be permissible; i.e., “closely related to banking” under the standard set forth in the Bank Holding Company Act. In order to become a financial holding company, all of a bank holding company’s bank subsidiaries must be well capitalized and well managed and have a rating under the Community Reinvestment Act of at least “satisfactory.”
Community is subject to regulation by the Federal Reserve Board. The Federal Reserve Board requires regular reports from Community and is authorized to make regular examinations of Community and its subsidiaries. The Bank is subject to supervision and regulation, and is examined regularly, by the Federal Deposit Insurance Corporation and the state banking departments in the states in which it operates. To the extent that the Bank’s subsidiaries are licensed to engage in the sale of insurance or the mortgage brokerage business, the subsidiaries are subject to examination by the respective licensing authorities. Community and its direct non-banking subsidiaries are affiliates, within the meaning of applicable banking laws and regulations of the Bank and its subsidiaries. As a result, the Bank and its subsidiaries are subject to restrictions on loans or extensions of credit to, purchase of assets from, investments in, and transactions
with Community and its direct non-banking subsidiaries and on certain other transactions with them or involving their securities.
Capital Adequacy
The Federal Reserve Board and the FDIC have adopted risk-based capital adequacy guidelines for financial holding companies and banks under their supervision. Under these guidelines, “Tier 1 capital” and “Total capital” as a percentage of risk-weighted assets and certain off-balance sheet instruments must be at least 4% and 8%, respectively. The regulators have also imposed a leverage standard, which focuses on the institution’s ratio of Tier 1 capital to average total assets, adjusted for goodwill and certain other items, to supplement their risk-based ratios. This minimum leverage ratio was set at 3% and would apply only to those banking organizations receiving a regulatory composite 1 rating. Most banking organizations will be required to maintain a leverage ratio ranging from 1 to 2 percentage points above the minimum standard.
Community and the Bank are subject to various regulatory capital requirements administered by federal and state banking agencies. Failure to meet minimum capital requirements can initiate certain mandatory and possibly additional discretionary actions by regulators that, if undertaken, could have a direct material effect on Community’s financial statements. Under capital adequacy guidelines and the regulatory framework for prompt corrective action, each subsidiary bank must meet specific capital guidelines that involve quantitative measures of assets, liabilities, and certain off-balance sheet items as calculated under regulatory accounting practices. The capital amounts and classification are also subject to qualitative judgments by the regulators about the risk weightings of components, and other factors.
Quantitative measures established by regulation to ensure capital adequacy require Community to maintain minimum amounts and ratios of total and Tier 1 capital to risk-weighted assets and of Tier 1 capital to average assets. Management believes, as of December 31, 2005, that Community and the Bank have met all capital adequacy requirements to which they are subject. For tables presenting Community’s capital ratios, see “Notes to Consolidated Financial Statements - Regulatory Matters” included in Part II, Item 8.
USA Patriot Act
The United and Strengthening America by Providing Appropriate Tools Required to Intercept and Obstruct Terrorism Act of 2001 (the USA Patriot Act) imposed additional obligations on financial institutions, including the Bank, to implement and maintain polices, procedures and controls which are reasonably designed to detect and report instances of money laundering and the financing of terrorism. Failure to comply with the Patriot Act’s requirements could have serious legal, financial, and reputational consequences for Community. Community has approved policies and procedures that are believed to be compliant with the Patriot Act and will continue to revise and update policies, procedures, and controls to reflect changes required, as necessary.
Sarbanes-Oxley Act of 2002
The Sarbanes-Oxley Act of 2002 (Sarbanes-Oxley) implemented a broad range of corporate governance, accounting, and reporting measures for companies that have securities registered under the Securities Exchange Act of 1934, including Community. Sarbanes-Oxley and the various regulations promulgated thereunder, established, among other things: (i) increased responsibility for Chief Executive Officers and Chief Financial Officers with respect to the content of filings with the SEC; (ii) enhanced requirements for audit committees, including independence and disclosure of expertise; (iii) enhanced requirements for auditor independence and the types of non-audit services that auditors can provide; (iv) accelerated filing requirements for SEC reports; (v) increased disclosure and reporting obligations for companies, their directors and their executive officers; and (vi) new and increased civil and criminal penalties for violation of securities laws.
Section 404 of Sarbanes-Oxley requires management to issue a report on the effectiveness of its internal controls over financial reporting. In addition, a reporting company’s independent registered public accountants are required to issue an opinion on management’s assessment and an opinion on the effectiveness of the reporting company’s internal control over financial reporting as of the end of the year. These reports for Community for 2005 can be found in Item 8, “Financial Statements and Supplementary Information.” Certifications of the Chief Executive Officer and the Chief Financial Officer as required by Sarbanes-Oxley and the resulting SEC rules can be found in the “Exhibits” section of this report.
Monetary and Fiscal Policy
Community and the Bank are significantly affected by the monetary and fiscal policies of government authorities, including the Federal Reserve Board (FRB), which regulates the national money supply in order to manage recessionary and inflationary pressures. Among the instruments of monetary policy used by the FRB are open-market operations in U.S. Government securities and federal funds, changes in the discount rate on member bank borrowings, and changes in reserve requirements against member bank deposits. These techniques are used in varying combinations to influence the overall level of bank loans, investments and deposits, and the interest rates charged on loans and paid for deposits. The monetary policies of the FRB have had a significant effect on the operating results of banking institutions in the past and are expected to continue to do so in the future. The nature of future changes in monetary and fiscal policies, or the effect which they may have on Community’s business and earnings, cannot be predicted.
Other Merger Activity
On March 30, 2001, Community completed a merger of the Glen Rock State Bank into Community’s bank subsidiary (then known as Peoples State Bank). As a result of the Glen Rock merger, Community acquired an additional 5 branch offices located in York and Adams Counties, Pennsylvania and assets of approximately $190 million.
Operating Segments
All of the operations of Community operate and are reported under its one reportable segment, community banking.
Concentrations, Seasonality
No portions of Community’s businesses are dependent on a single or limited number of customers, the loss of which would have a material adverse effect on our business. No substantial portions of loans or investments are concentrated within a single industry or group of related industries, although a significant amount of loans are secured by real estate located in south central Pennsylvania. Community’s businesses are not seasonal in nature.
Environmental Compliance
Community’s compliance with federal, state and local environmental protection laws had no material effect on capital expenditures, earnings or competitive position in 2005, and is not expected to have a material effect on such expenditures, earnings or competitive position in 2006.
Community’s financial results are subject to a number of risks. The factors discussed below will highlight risks that management believes are most relevant to Community’s current operating environment. The list does not capture all risks associated with Community’s business. Additional risks, including those generally affecting the banking industry and those that management currently deems immaterial may also negatively impact Community’s liquidity, financial position or results of operations.
When reviewing Community’s financial results, you should consider the following risk factors along with the other information contained in this document. You should keep these risk factors in mind when you read forward-looking statements in this document. Please refer to the section entitled “Forward-Looking Statements” included in Part I, Item 7.
Community may not fully realize the anticipated benefits of the PennRock merger.
Management’s anticipated expense savings to be realized from the merger, expected to be derived from the reconfiguration of duplicate internal operations and administrative functions, the elimination of redundant external contractual services and from the convergence and standardization of various retirement, bonus, and incentive programs in the first full year of operations after the merger, may not be fully realized or may take longer than estimated to be realized and have a significant effect on Community’s operations and its financial results.
Future loan losses may exceed Community’s allowance for loan losses.
Community is subject to credit risk, which is the risk of losing principal or interest due to borrowers’ failure to repay loans in accordance with their terms. A downturn in the economy or the real estate market in our market areas or a rapid change in interest rates could have a negative effect on collateral values and borrowers’ ability to repay. This deterioration in economic conditions could result in losses to Community in excess of loan loss allowances. To the extent loans are not paid timely, the loans are placed on non-accrual, thereby reducing interest income. To the extent loan charge-offs exceed our estimates, increased amounts charged to the provision for loan losses would reduce income.
Rapidly changing interest rate environments could reduce Community’s net interest margin, net interest income, fee income and net income.
Interest and fees on loans and securities, net of interest paid on deposits and borrowings, are a large part of Community’s net income. Interest rates are key drivers of net interest margin and subject to many factors beyond the control of management. As interest rates change, net interest income is affected. Rapid increases in interest rates in the future could result in interest expense increasing faster than interest income because of mismatches in financial instrument maturities. Further, substantially higher interest rates generally reduce loan demand and may result in slower loan growth. Decreases or increases in interest rates could have a negative effect on the spreads between the interest rates earned on assets and the rates of interest paid on liabilities, and therefore decrease net interest income.
Although management believes it has implemented effective asset and liability management strategies to reduce the potential effects of changes in interest rates on Community’s results of operations, any substantial, unexpected, prolonged change in market interest rates could have a significant effect on Community’s operations and its financial results.
Community’s profitability depends significantly on economic conditions in its local markets.
Community’s success depends primarily on the general economic conditions in its local markets in central Pennsylvania and northern Maryland. The local economic conditions in these areas have a significant impact on the demand for Community’s products and services as well as the ability of Community’s customers to repay loans, the value of the collateral securing loans and the stability of Community’s deposit funding sources. A significant decline in general economic conditions, caused by inflation, recession, acts of terrorism, outbreak of hostilities or other international or domestic occurrences, unemployment, changes in securities markets or other factors could impact these local economic conditions and, in turn, have a significant effect on Community’s operations and its financial results.
The financial services industry is very competitive.
We face competition in attracting and retaining deposits, making loans, and providing other financial services throughout our market area. Our competitors include other community banks, larger banking institutions, and a wide range of other financial institutions such as credit unions, government-sponsored enterprises, mutual fund companies, insurance companies and other non-bank businesses. Many of these competitors have substantially greater resources than us.
Supervision and Regulation
Community is subject to extensive state and federal laws and regulations governing the banking industry, in particular, and public companies, in general. Changes in those laws and regulations, or the degree of Community’s compliance with those laws and regulations as judged by any of several regulators that oversee Community, could have a significant effect on Community’s operations and its financial results.
Community’s stock price can be volatile.
The market price of Community common stock may fluctuate significantly in response to a number of other factors, including changes in securities analysts’ estimates of financial performance, volatility of stock market prices and volumes, rumors or erroneous information, changes in market valuations of similar companies and changes in accounting policies or procedures as may be required by the Financial Accounting Standards Board or other regulatory agencies.
None.
Community does not own or lease any property. As of December 31, 2005, the Bank owns 44 properties free and clear of encumbrances and leases 36 other properties. Community’s other direct and indirect subsidiaries own 5 properties free and clear of encumbrances and lease 5 properties. Five properties owned by Community’s indirect subsidiary, PSB Realty, are leased to the Bank.
The principal office of Community is located at 750 East Park Drive, Harrisburg Pennsylvania 17111. The principal office of the Bank is owned and located at 150 Market Square, Millersburg Pennsylvania 17061, with executive and administrative offices at 750 East Park Drive, Harrisburg PA 17111.
The Bank currently has 72 branch offices located in Adams, Berks, Chester, Cumberland, Dauphin, Lancaster, Luzerne, Northumberland, Schuylkill, Snyder, and York counties, Pennsylvania, and in Carroll County, Maryland. The Bank owns or leases 120 automated teller machines located throughout these counties.
In February, 2006, Community announced the signing of a lease for a new principal office at 777 East Park Drive, Harrisburg PA 17111. The new facility will provide additional space for administrative management of the Corporation and a state-of-the-art training facility.
From time to time, the Bank also acquires real estate by virtue of foreclosure proceedings, and such real estate is disposed of in the usual and ordinary course of business as expeditiously as is prudently possible.
Various actions and proceedings are presently pending to which Community and/or one or more of its subsidiaries is a party. These actions and proceedings arise out of routine operations and, in management’s opinion, will not have a material adverse effect on Community’s consolidated financial position or results of operations. Community has not been required to pay a penalty to the Internal Revenue Service for failing to make required disclosures with respect to certain transactions identified by the IRS as abusive or that have a significant tax avoidance purpose.
No matters were submitted to a vote of security holders during the fourth quarter of 2005.
PART II
Market Information
The shares of Community are traded on the NASDAQ National Market under the symbol CMTY and are transferred through local and regional brokerage houses. Community had approximately 5,203 shareholders of record as of December 31, 2005. The following table sets forth dividends declared per share and the high and low closing prices for Community common stock as reported by NASDAQ during the periods indicated.
| | 2005 | | 2004 |
| | Price Per Share | Dividends | | Price Per Share | Dividends |
| | Low | High | Declared | | Low | High | Declared |
| | | | | | | | |
| First Quarter | $23.70 | $28.51 | $0.17 | | $28.41 | $34.52 | $0.16 |
| Second Quarter | $23.04 | $26.50 | $0.19 | | $27.02 | $31.58 | $0.17 |
| Third Quarter | $26.66 | $28.85 | $0.19 | | $25.35 | $29.73 | $0.17 |
| Fourth Quarter | $25.09 | $29.84 | $0.20 | | $27.77 | $31.47 | $0.17 |
Holders of the common stock of Community are entitled to such dividends as may be declared from time to time by the Board of Directors out of funds legally available therefore. Community currently expects that it will continue to pay comparable dividends in the future, subject to regulatory requirements, Community’s financial condition and requirements, future prospects, business conditions and other factors deemed relevant by the Board of Directors. As noted in “Capital Adequacy” in Part I, Item 1, Community is subject to various regulatory capital requirements that limit the amount of capital available for dividends.
The market prices listed above are based on historical market quotations and have been restated to reflect stock dividends and splits.
Issuer Purchases of Equity Securities
During the fourth quarter of 2005, the following shares were purchased as part of Community’s Share Repurchase Program and Community did not sell any unregistered securities.
| | | Shares Purchased | | Average Price Paid Per Share | | Shares Purchased as part of Repurchase Program | | Capacity to Purchase More Shares | |
| | | | | | | | | | | | | | |
| 10/1/05-10/31/05 | | | 209,400 | | $ | 27.37 | | | 209,400 | | | 734,700 | |
| 11/1/05-11/30/05 | | | 50,000 | | $ | 28.06 | | | 50,000 | | | 684,700 | |
| 12/1/05-12/31/05 | | | --- | | | --- | | | --- | | | 684,700 | |
| | | At or for the Year Ended December 31, | |
| | | 2005 * | | 2004 | | 2003 | | 2002 | | 2001 | |
| | | (dollars in thousands except for per share data) | |
BALANCE SHEET DATA | | | | | | | | | | | | | | | | |
| At Period End: | | | | | | | | | | | | | | | | |
Investment securities | | $ | 628,585 | | $ | 619,110 | | $ | 646,961 | | $ | 667,801 | | $ | 543,901 | |
Total loans | | | 2,234,497 | | | 1,215,951 | | | 1,078,611 | | | 904,568 | | | 857,278 | |
Total assets | | | 3,332,430 | | | 1,954,799 | | | 1,861,063 | | | 1,680,362 | | | 1,509,734 | |
Total deposits | | | 2,294,367 | | | 1,305,537 | | | 1,230,685 | | | 1,132,913 | | | 1,003,225 | |
Long-term debt | | | 430,719 | | | 404,662 | | | 411,422 | | | 320,533 | | | 322,155 | |
Stockholders’ equity | | | 476,673 | | | 152,341 | | | 143,406 | | | 129,162 | | | 111,249 | |
| Average: | | | | | | | | | | | | | | | | |
Total assets | | | 2,668,605 | | | 1,941,096 | | | 1,780,679 | | | 1,580,046 | | | 1,398,521 | |
Total stockholders’ equity | | | 318,768 | | | 145,750 | | | 135,773 | | | 119,352 | | | 111,381 | |
| | | | | | | | | | | | | | | | | |
EARNINGS DATA: | | | | | | | | | | | | | | | | |
| Net interest income | | | 82,645 | | | 56,557 | | | 52,514 | | | 50,488 | | | 45,935 | |
| Provision for loan losses | | | 2,300 | | | 3,100 | | | 2,500 | | | 3,350 | | | 5,080 | |
| Net interest income after provision for loan losses | | | 80,345 | | | 53,457 | | | 50,014 | | | 47,138 | | | 40,855 | |
| Other income | | | 26,437 | | | 23,213 | | | 20,463 | | | 13,975 | | | 12,141 | |
| Other expense | | | 75,069 | | | 49,993 | | | 45,718 | | | 39,300 | | | 36,521 | |
| Provision for income taxes | | | 6,072 | | | 4,879 | | | 4,359 | | | 3,367 | | | 2,879 | |
| Net income | | | 25,641 | | | 21,798 | | | 20,400 | | | 18,446 | | | 13,596 | |
| | | | | | | | | | | | | | | | | |
PER SHARE DATA: | | | | | | | | | | | | | | | | |
| Basic earnings per share | | | 1.44 | | | 1.78 | | | 1.68 | | | 1.51 | | | 1.11 | |
| Diluted earnings per share | | | 1.42 | | | 1.73 | | | 1.63 | | | 1.48 | | | 1.09 | |
| Cash dividends declared | | | 0.75 | | | 0.67 | | | 0.63 | | | 0.54 | | | 0.48 | |
| Book value | | | 20.80 | | | 12.45 | | | 11.73 | | | 10.67 | | | 9.05 | |
| Average diluted shares outstanding | | | 18,071,833 | | | 12,574,908 | | | 12,497,372 | | | 12,491,320 | | | 12,461,996 | |
| | | | | | | | | | | | | | | | | |
PROFITABILITY RATIOS: | | | | | | | | | | | | | | | | |
| Return on average assets | | | 0.96 | % | | 1.12 | % | | 1.15 | % | | 1.17 | % | | 0.97 | % |
| Return on average stockholders’ equity | | | 8.04 | % | | 14.96 | % | | 15.03 | % | | 15.46 | % | | 12.21 | % |
| Net interest margin (FTE) | | | 3.76 | % | | 3.44 | % | | 3.50 | % | | 3.78 | % | | 3.83 | % |
| Efficiency ratio | | | 57.51 | % | | 60.42 | % | | 60.59 | % | | 56.92 | % | | 60.21 | % |
| | | | | | | | | | | | | | | | | |
CAPITAL AND LIQUIDITY RATIOS: | | | | | | | | | | | | | | | | |
| Stockholders’ equity to total assets | | | 14.30 | % | | 7.79 | % | | 7.71 | % | | 7.69 | % | | 7.37 | % |
| Average equity to average assets | | | 11.95 | % | | 7.51 | % | | 7.62 | % | | 7.55 | % | | 7.96 | % |
| Dividend payout ratio | | | 52.42 | % | | 37.69 | % | | 37.35 | % | | 36.07 | % | | 43.25 | % |
| Net loans to assets | | | 66.36 | % | | 61.47 | % | | 57.25 | % | | 53.10 | % | | 55.98 | % |
| | | | | | | | | | | | | | | | | |
ASSET QUALITY RATIOS: | | | | | | | | | | | | | | | | |
| Allowance for loan losses to total loans outstanding | | | 1.03 | % | | 1.19 | % | | 1.22 | % | | 1.36 | % | | 1.42 | % |
| Allowance for loan losses to non-accrual loans | | | 253 | % | | 266 | % | | 162 | % | | 131 | % | | 109 | % |
| Non-accrual loans to total loans outstanding | | | 0.41 | % | | 0.45 | % | | 0.76 | % | | 1.04 | % | | 1.29 | % |
| Non-performing assets to total assets | | | 0.32 | % | | 0.38 | % | | 0.70 | % | | 0.63 | % | | 0.78 | % |
| Net charge-offs to average loans outstanding | | | 0.05 | % | | 0.16 | % | | 0.17 | % | | 0.35 | % | | 0.39 | % |
* 2005 amounts include the impact of the July 1, 2005 merger with PennRock Financial Services Corp.
INTRODUCTION
Purpose of this Presentation
This presentation has been designed to provide a narrative explanation of the financial statements of Community Banks, Inc. (“Community” or “the Corporation”). The purpose of this presentation is to enhance the 2005 financial disclosures and to provide a framework for evaluating the extent to which historical performance can be relied upon to assess prospects for future performance.
Presentation Format
Throughout this presentation, net interest income and yields on earning assets have been presented on a fully-tax equivalent basis. Balances represent average daily balances, earnings per share are diluted, and all dollar amounts are presented in thousands, unless otherwise indicated.
2005 OVERVIEW
2005 Expansion
If the central theme of Community’s 2005 performance were to be condensed into one word, that word would be “expansion”. Although expansion and growth have occurred on a variety of fronts, the most impressive expansion centered on the acquisition and merger of PennRock Financial Services Corp. (PennRock), the former parent of Blue Ball National Bank (“Blue Ball”). Now operating as a division within the CommunityBanks franchise, Blue Ball has added assets totaling more than $1 billion, including 19 office locations, to Community’s current total of over $3.3 billion in consolidated assets and 71 office locations at the end of the year. More importantly, Blue Ball and its enthusiastic and exceedingly talented team of employees helped to complete Community’s dramatic entree into the highly desirable Berks, Chester, and Lancaster County regions of south-central and southeastern Pennsylvania. Community is now the eighth-largest financial services holding company headquartered in Pennsylvania, with a market capitalization well in excess of $600 million at the end of 2005.
At the beginning of business on July 1, 2005, Community completed its merger with PennRock, thus beginning an exciting chapter in the history of the growing Community franchise. PennRock’s primary subsidiary, Blue Ball, was integrated as a division of CommunityBanks, which is the sole banking subsidiary of the financial services holding company known as Community Banks, Inc. Under the terms of the merger announced on November 16, 2004, former shareholders of PennRock received more than 10,854,000 of common shares of Community in exchange for all of their outstanding shares in PennRock. This transaction was valued at an amount in excess of $325 million at the time of the announcement.
As required under generally accepted accounting principles (GAAP), the merger was accounted for under the purchase method of accounting for business combinations (“purchase accounting”). Consequently, Blue Ball results have been included in consolidated operating results of Community for only the second half of the year. The full year 2005 income statement offers a hybrid presentation of annual operating results consisting of pre-merger Community results for the first half of the year followed by post-merger combined results in the second half. Unfortunately, comparisons of the hybrid 2005 operating performance to prior periods (2004 and 2003) are noticeably distorted, owing to the fact that presentations of pre-2005 results exclude Blue Ball activity.
Throughout this presentation, certain pro forma financial information will be provided in order to make comparative results more meaningful to the reader. Such information will be clearly defined and labeled so as to provide presentations that, to the extent possible, are prepared on a consistent and comparable basis.
| · | Assets Acquired / “De-leverage” Strategy |
In the timeframe leading up to the merger, Community conducted an extensive review and analysis of the balance sheet posture of both Blue Ball and pre-merger Community. In connection with this review, management considered various alternative strategies designed to maximize the net interest margin and net interest income performance of the post-merger, combined entity. Pursuant to the review, Community executed a “de-leveraging strategy” that focused on three primary objectives:
| o | Reduce the combined company’s exposure to high cost, long-term wholesale funding. |
| o | Construct a post-merger balance sheet posture that would reduce interest rate risk associated with certain short-term wholesale funding sources. |
| o | Maximize combined investment portfolio performance in the post-merger environment. |
Concurrent with the periods immediately before and after the merger, Community executed its three-pronged “de-leveraging” strategy, which was timed to coincide with its acquisition of the net identifiable assets of Blue Ball. The first stage commenced with the late second quarter prepayment of $60 million of FHLB term advances, which resulted in a prepayment penalty of $6 million. These advances had a weighted average cost of 6.29%, well in excess of the Corporation’s incremental wholesale borrowing rate. Additionally, such borrowings contained conversion features and terms not necessarily expected to be favorable to Community in future periods. The second and third phases involved the retirement of certain variable-rate, short-term wholesale funding of Blue Ball, accompanied by the disposition of the acquired investment portfolio. These two phases were designed to: (1) reduce Community’s post-merger exposure to potential future increases in the cost of short-term funding sources and, (2) to improve the overall yields on the post-merger, combined investment portfolio.
As a result of the merger with Blue Ball, Community acquired assets of $1.2 billion. Pursuant to the guidance for applying the purchase method of accounting, these acquired assets and assumed liabilities were required to be restated at their fair market values at the date of the merger. Both the merger and “de-leverage” strategies, like all balance sheet management efforts, occurred in a dynamic environment. The synchronized execution of (1) the merger consummation, (2) the fair value restatement of acquired net assets, and (3) the “de-leverage” strategy, made it difficult to precisely isolate and quantify the impact of the individual components of those efforts on the post-merger combination. Management believes, however, that the following summary portrays a reasonable depiction of the strategies that were executed concurrently with the merger of Blue Ball, and provides an appropriate benchmark from which to isolate the level of “acquired” growth attributable to the merger.
| | | Net Assets Acquired in Merger | | Purchase Accounting Adjustments | | De-leverage Strategy | | “Pro Forma” Opening PennRock Balances | |
| | | | | | | | | | | | | | |
| Investment securities | | $ | 250,272 | | $ | --- | | $ | (100,000 | ) | $ | 150,272 | |
| Loans | | | 843,923 | | | (1,757 | ) | | --- | | | 842,166 | |
| Other assets | | | 106,515 | | | 7,976 | | | --- | | | 114,491 | |
| | | | | | | | | | | | | | |
| Total Deposits | | | 879,965 | | | 2,110 | | | --- | | | 882,075 | |
| Short-term borrowings | | | 91,010 | | | --- | | | (75,000 | ) | | 16,010 | |
| Long-term debt | | | 127,000 | | | 1,515 | | | (25,000 | ) | | 103,515 | |
| Other liabilities | | | 13,196 | | | --- | | | --- | | | 13,196 | |
This summary will be helpful in understanding additional analyses that are provided later in this presentation. These results help to draw a distinction between “acquired” growth (from the merger) versus growth attributable to “organic” sources. “Organic” growth has two elements: (1) growth from the underlying economic vitality of the geographic operating market and; (2) growth achieved by capturing existing market share from competitors. By isolating the “acquired” growth from the merger, trends regarding “organic” growth become more apparent and provide more meaningful comparisons to prior year reference points.
| · | Merger, Conversion, and Restructuring Issues |
In addition to the aforementioned expenses associated with the prepayment of FHLB advances, Community incurred certain other expenses associated with both the merger and with the adoption of a common operating platform for the newly-combined company. Including the $6 million FHLB prepayment expense, the aggregate expenses associated with the merger, the system conversion, and the balance sheet restructuring totaled $8.2 million, and were reflected primarily in results for the second quarter of 2005.
The merger of Blue Ball (the “target”) into Community (the “acquirer”) had characteristics that were atypical of other bank-related mergers that have occurred since the advent of mandatory purchase accounting. Blue Ball, with over $1 billion in assets, represented an immense increase of more than 60% over pre-combination assets of Community. In most transactions, it is common for the target to be substantially smaller than the acquirer. Accordingly, this merger transaction had specific terms and conditions that presented unique challenges.
In more conventional merger transactions, the employees of the target company who perform duplicative tasks are frequently identified for displacement, and are normally offered severance and/or retention payments following consummation. These payments are often a function of years of service, the need to ensure a smooth post-merger transition, or other relevant factors. Under purchase accounting, payments to the target bank’s employees are considered to be a component of the purchase price of the target and, by definition, do not affect near-term operating results. This same treatment is also afforded other incremental costs incurred by the target, including items such as contract cancellation fees or the cost of closing duplicative facilities In more conventional transactions, the workforce and facilities of the acquiring company are substantially unaffected by displacement issues because those employees and facilities are expected to remain in place following the merger.
The Community/PennRock transaction was distinctive in that both the acquirer and the target were affected by workforce displacement issues, duplicative contracts, and facility reconfiguration. As required, the costs incurred for severance and retention for displaced employees of Blue Ball were added to the purchase price, a treatment consistent with most mergers. Unlike many mergers, however, Community, the acquiring company, incurred certain incremental costs of the merger, including severance, retention and contract cancellation costs, which were required to be reported as an expense when incurred. During the second and third quarters, Community recorded expenses totaling $1.3 million, which reduced operating results in those periods, as follows: severance and retention payments to Community employees being displaced in the merger, $570,000; contract cancellations and closing of duplicate facilities, $555,000; other, $210,000.
Finally, Community incurred incremental costs totaling $800,000 related to the implementation of its Silverlake core processing platform in the second quarter of 2005. The implementation of this new core platform paved the way for a third quarter 2005 integration of the Blue Ball’s pre-existing Silverlake platform, which had been installed a number of years earlier. The fortuitous decision to migrate Community’s platform to Silverlake, a decision reached well in advance of merger discussions with PennRock, was a primary factor in ensuring a smooth transition in the combination of the two banks.
Aggregate merger, conversion and restructuring expenses totaled $8.2 million ($5.3 million on an after-tax basis) and reduced net income, primarily in the second quarter, by $0.29 of annual earnings per share. As noted throughout this presentation, “core” and “tangible” income, both of which are defined as non-GAAP measurements, have excluded the impact of these items.
2005 Performance: Executive Summary
Excluding the $5.3 million of after-tax merger, conversion and restructuring charges (“special charges”), Community recorded “core” net income of nearly $31.0 million, an increase of $9.2 million over the net income of $21.8 million achieved in 2004. This was an increase of 42% in year-over-year earnings. Even after reducing income for the aforementioned special charges, reported net income reached $25.6 million and reflected a 17% increase over 2004.
“Core” net income was comprised of $10.7 million in the first half of the year and $20.3 million in the second half. As previously noted, Blue Ball operating activity was included only in the second half of the year and was the primary driver of the increase in net income between the first and second halves of 2005.
On a per share basis, “core” net income reached $1.71 compared to $1.73 in 2004. Actual reported earnings per share were $1.42 and included $0.29 of earnings dilution directly attributable to the merger, conversion and restructuring expenses. Improvement in the second half performance was partially constrained as Community undertook deliberate strategies designed to achieve phased-in savings and efficiencies by the beginning of 2006.
The year 2005 was dominated by the preparations and efforts to absorb and integrate the operations of Community and its new Blue Ball division. The influence of internal, merger-related distractions required deft management of core operating activities to minimize the merger’s impact on existing customers. At the same time, dynamic changes in economic conditions, including changes in the interest rate environment, presented additional challenges to preserving and improving the earnings stream.
While plans with respect to the Blue Ball merger were completed, contemporaneous plans were also put into place to create a leveragable infrastructure for future expansion. The first component of those efforts was the replacement of the core processing system, which was completed in two phases to accommodate the Blue Ball integration. Capital levels and capital management plans related thereto, both of which are essential prerequisites for growth, are not expected to be a constraint on acquired or organic growth opportunities for the foreseeable future. Credit quality metrics continued to be sustained at historically low levels. Human capital, another essential precondition for growth, was bolstered by the staff additions and depth of experience provided by personnel from the Blue Ball franchise. And finally, both Blue Ball and Community continued to execute on their respective “de novo” expansion strategies.
All of these factors contributed to an elevated awareness of Community as an “acquirer of choice” in both core and contiguous markets of the franchise. Furthermore, these efforts also served to demonstrate the franchise’s ability to absorb and integrate merger partners in an effective and efficient manner.
GAAP REPORTING ISSUES
There remains a profusion of issues affecting the presentation of financial information in financial statements. In recent years, a strong emphasis has been placed on the adequacy, comparability, and transparency of financial information, particularly for publicly-traded companies that are subjected to recurring financial reporting requirements. The increased complexity associated with the measurement and presentation of financial information has been aggravated by the seemingly endless array of innovative and diverse financial transactions and structures. This has led to a regulatory environment predisposed to mandating enhancements to summarize, simplify, and analyze the vital information contained in financial reports.
In the aftermath of the corporate scandals of recent years, Congress and its designated oversight bodies have passed a wave of new legislation and regulations. These new regulations, and the related disclosure requirements, have been designed to be responsive to the intense scrutiny being applied to financial presentations by investors, creditors, and other users.
This section of the presentation will summarize the salient Generally Accepted Accounting Principals (GAAP) reporting issues associated with presentations of financial information for Community Banks, Inc., including: forward-looking statements; critical accounting policies; and GAAP versus non-GAAP presentations.
Forward-Looking Statements
Periodically, Community has made, and will continue to make statements that may include forward-looking information. The Corporation cautions that forward-looking information disseminated through financial presentations should not be construed as guarantees of future performance. Furthermore, actual results may differ from expectations contained in such forward-looking information as a result of factors that are not predictable. Financial performance can be affected by any number of factors that are not predictable or are out of management’s direct control. Examples include: the effect of prevailing economic conditions; unforeseen or dramatic changes in the general interest rate environment; actions or changes in policies of the Federal Reserve Board and other government agencies; business risk associated with the management of the credit extension function and fiduciary activities. Each of these factors could affect estimates, assumptions, uncertainties and risk used to develop forward-looking information, and could cause actual results to differ materially from management’s expectations regarding future performance.
Critical Accounting Policies
The identification of those accounting policies which are deemed to be critical to the application of GAAP on reported results of Community Banks, Inc. is an important facet of this presentation. Management has identified the applicable promulgations of GAAP that have particular relevance in connection with reporting results for 2005, as follows:
| o | Allowance for Loan Losses: Adequacy of Allowance |
| o | Allowance for Loan Losses: Accounting for Loans Acquired in a Transfer |
| o | Purchase Accounting for Business Combinations |
| o | “Other than Temporary” Impairment of Investment Securities |
Management believes that the application of its accounting policies and procedures for each of the above items should be considered to be a critical accounting policy to ensure the fair presentation of the Corporation’s 2005 financial statements.
The determination of the adequacy of the allowance for loan losses, and the related provision for loan losses is one major area affected by critical accounting policies and procedures. Community applies a systemic methodology in order to estimate the allowance for loan losses. This methodology incorporates management’s judgments about the credit quality of the loan portfolio through a disciplined, regimented methodology that is consistently applied. This process requires that a detailed analysis of the loan portfolio be performed on a quarterly basis. This analysis includes a specific individual loan review for any and all loans that meet specific materiality criteria. Such loans are evaluated for impairment under the provisions of Statement of Financial Accounting Standards (SFAS) No. 114, “Accounting by Creditors for Impairment of a Loan”. The portfolio is further stratified to analyze groups of homogenous loans with similar risk characteristics. Such loans are evaluated under the provisions of SFAS No. 5 “Accounting for Contingencies”.
Management considers all known relevant internal and external factors that may affect loan collectibility, as well as particular risks indigenous to specific types of lending. The process is further designed to consolidate the aggregate loss estimates and to ensure that the allowance for loan losses is recorded in accordance with generally accepted accounting principles. The final results are reviewed and approved by executive management. Results are regularly validated by a review of trends associated with loan volume, delinquencies, potential concentrations, or other factors that may influence the methodology used to estimate the allowance for loan losses.
| · | Accounting for Loans Acquired in a Transfer |
The merger of PennRock on July 1, 2005 required the application of the specific provisions of American Institute of Certified Public Accountants’ (AICPA) Statement of Position (SOP) 03-3, “Accounting for Certain Loans or Debt Securities Acquired in a Transfer”. This pronouncement addresses the accounting for differences between contractual cash flows and cash flows expected to be collected from loans acquired in a transfer where differences are due, at least in part, to credit quality. This SOP prohibits carrying over valuation allowances in the initial accounting of all loans acquired in a purchase business combination and was effective for years beginning after December 15, 2004. Community has given appropriate consideration to this guidance in establishing the accounting for the loans acquired as a result of the PennRock merger.
| · | Purchase Accounting for Business Combinations |
In June of 2001, the Financial Accounting Standards Board (FASB) issued Financial Accounting Standards No. 141, “Business Combinations”, and No. 142, “Goodwill and Other Intangible Assets”. These standards eliminated the pooling-of-interests method of accounting (“pooling”) in favor of purchase accounting. Further, these new standards were promulgated to ensure that post-merger financial statements of combined entities are prepared in a manner that best represents the underlying economics of a business combination.
These standards necessitate the application of accounting policies and procedures that entail the use of assumptions, estimates, and judgments that are critical to the presentation of financial information, including the ongoing valuation of intangibles. Where necessary and appropriate, Community has engaged independent outside consultants to provide objective and verifiable support for the use of certain estimates and assumptions in the application of those policies and procedures. The ultimate responsibility for the application of these standards and the adequacy of disclosures related thereto rests with management. While Community has applied these new standards to other business combinations completed since 2001, the magnitude of the PennRock merger on Community’s consolidated results suggests that the application of these standards is substantially more critical to the 2005 presentation of financial information.
| · | “Other than Temporary” Impairment of Investment Securities |
Investment securities are written down to their net realizable value when there is impairment in value that is considered to be “other than temporary”. The determination of whether or not an “other than temporary” impairment exists is a matter of judgment. Management reviews its investment securities portfolio regularly for possible impairment that is “other than temporary” by analyzing the facts and circumstances of each investment and the expectations for that investment’s performance.
Each of these critical accounting policies and procedures are highlighted later in this presentation and in the notes to the audited financial statements, as appropriate.
GAAP versus Non-GAAP
Like many financial institutions, Community had accounted for virtually all of its business combinations using the pooling-of-interests method of accounting (“pooling”) prior to 2002. Under pooling, historical pre-merger financial information of the combined companies was restated ‘as if’ the combination had occurred prior to the earliest period presented. This approach was advantageous in that it allowed for year-over-year financial performance comparisons that were prepared on a consistent basis. Under purchase accounting, financial statements for any periods prior to the date of the merger are not restated, creating the potential for comparisons that, in some respects, are inherently inconsistent. This contrast was especially apparent in presentations of Community financial performance in 2005, which included six months of Blue Ball activity, compared to 2004 and 2003, which excluded all historical Blue Ball results.
Like most other financial institutions that have made large acquisitions since the mandate of purchase accounting, Community is now providing certain “non-GAAP” information to assist investors in their understanding of the effect of acquisition activity on reported results. Many of these disclosures have been designed to overcome comparability issues related to the influence of intangibles (principally goodwill) created in mergers. The inherent “shortcomings” of purchase accounting, owing primarily to these comparability issues, has lead to an evolving practice of presenting non-GAAP financial information that utilizes terms such as “tangible income”, “tangible assets”, “operating return on average tangible equity”, and other relevant measures. Such information is not presented as a substitute for traditional GAAP measurements, but is provided as a supplemental enhancement to improve comparability and investor understanding.
Community has augmented its traditional GAAP presentation by providing an extensive reconciliation of relevant GAAP and non-GAAP measures to enhance its disclosures of comparative financial performance. The reconciliation appears on page 50. Below is a summary of critical GAAP measurements along with a brief description of the adjustments necessary to produce comparable non-GAAP measurements.
Traditional GAAP Measures | | Adjustments | | Comparable Non-GAAP Measures |
| | | | | |
Balance Sheet: | | | | |
| Average Assets | | Excludes Intangible Assets from Assets | | Average “Tangible” Assets |
| Average Equity | | Excludes Intangible Assets from Equity | | Average “Tangible” Equity |
| Equity to Assets | | Excludes Intangible Assets from Equity and Assets | | “Tangible” Equity to Assets |
| Book Value per Share | | Excludes Intangible Assets from Equity | | “Tangible” Book Value per Share |
| | | | | |
Performance: | | | | |
| Net Income / EPS | | Excludes After-Tax Effect of M&A and Other Special Charges | | “Core” Net Income / EPS |
| Net Income / EPS | | Excludes After-Tax Effect of CDI Amortization, M&A, and Other Special Charges | | “Tangible” or “Operating” Income / EPS |
| Return on Average Assets (ROA) | | “Tangible” Net Income divided by Average “Tangible” Assets | | Operating Return on Average “Tangible” Assets (ROTA) |
| Return on Average Equity (ROE) | | “Tangible” Net Income divided by Average “Tangible” Equity | | Operating Return on Average “Tangible” Equity (ROTE) |
Quarterly Presentation of GAAP / Non-GAAP
The timing of the merger of Community and Blue Ball provided one additional frame of reference that was useful in understanding the hybrid financial performance in 2005. Because the merger was consummated on July 1, 2005, operating results for the first and second quarters of the year consisted exclusively of “pre-merger” Community performance. The second half included the combined performance of Community and Blue Ball for the third and fourth quarters. The existence of these discrete periods provided an opportunity to compare “pre-merger” and “post-merger” operating performance within 2005.
Concurrent with the announcement of the merger in late 2004, Community indicated that the two companies would be combined in a manner that would facilitate realization of expense savings that would be fully operational by the onset of 2006. In this presentation, Community has provided certain comparative analyses designed to provide an indication of the relative effectiveness of those initiatives during the last half of 2005. Analysis of these results will be critical to any evaluation of the extent to which past performance can be used to evaluate the prospects for future performance beyond 2005.
2005 PERFORMANCE ANALYSIS
2005 Economic Conditions
During 2005, the United States and its leaders continued to be preoccupied with issues concerning domestic terror, the situation in Iraq, national and international natural disasters, and spiraling energy costs. At the same time, the domestic landscape continued to reflect the benefits of an economic policy steadfastly focused on controlling inflation and mitigating the prospects for a recession. This policy had been formulated in the wake of the year 2000 stock market bubble, the terrorist attacks of September, 2001, and the war in Iraq. For the last several years, the fiscal climate in the United States has been influenced by a monetary policy that was formulated to help sustain economic growth in the face of an abundance of adverse economic and political circumstances. This “policy accommodation” had been crafted to ensure accessibility to credit, funding, and liquidity, including credit vehicles for commercial and consumer borrowers. Ultimately, this policy accommodation led to the lowest fed funds rate in 46 years.
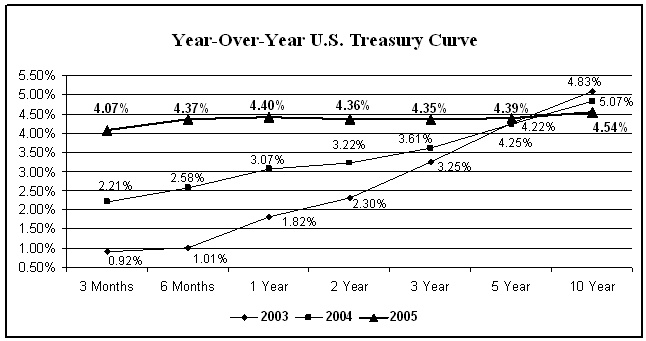
The fed funds rate, a key benchmark interest rate, reached its most recent trough of 1.0% near the beginning of 2004 and was followed by steady increases for the remainder of that year. By the end of 2004, the benchmark target for fed funds had risen steadily to 2.25%. During 2005, the Federal Reserve Board (the “Fed”) continued to reverse its previous policy accommodation through a more “neutral” interest rate policy that neither impeded nor over-stimulated growth. Throughout 2005, the Fed continued to hike the funds target, which resulted in thirteen straight increases, before it reached 4.25% on December 13 of 2005. These increases reflected a policy change based on continued concerns about upside risks of inflationary pressures, the impact of the national budget deficit, and domestic industrial production that appeared to be growing closer to full capacity. At the same time, mid- and short-term interest rates remained relatively constant and produced an increasingly “flat” yield curve. This “flattening” sustained affordable credit terms for commercial and consumer borrowers throughout most of the year.
Because of these favorable borrowing conditions, commercial and consumer loan demand remained robust throughout this period of low interest rates. At the same time, credit quality steadily improved as underlying growth and consumer confidence supported economic vitality and stability for most of 2005. This convergence of circumstances produced a period of sustained credit expansion accompanied by unprecedented improvement in credit quality conditions throughout the year.
Yield Curve Dynamics and Banking
The primary source of revenue for most financial institutions, particularly community banks, is derived from intermediation activities. Intermediation activities are defined as the net revenues generated from the process of gathering deposits, combined with the facilitation of credit extension to retail and commercial customers. Changing interest rates affect the pricing of amounts received on loans and investments as well as the amounts paid to acquire deposits and other funding sources. Banks must maintain a constant vigilance on monitoring and managing the effects of interest rate changes on this essential source of revenue production.
The “yield curve” for the various maturities of U. S. Treasury securities provides a fundamental barometer that gauges the prevailing interest rate profile and, simultaneously, acts as a guidepost for current loan and deposit pricing constraints. The yield curve also offers a reliable frame of reference from which to formulate cognitive assessments about future interest rate changes and their impact on intermediation-based revenue production. The slope of the yield curve is driven primarily by expectations for future interest rate increases and inflationary trends. A “normal” yield curve has a slope that reflects lower costs for shorter term financial instruments, accompanied by symmetrical increases in costs for longer term instruments all along the maturity continuum.
Short-term interest rates are highly influenced by the monetary policy of the Fed. The Federal Open Market Committee, a committee of the Fed, targets the “fed funds” rate, the overnight rate at which banks borrow or lend excess funds between financial institutions. This rate serves as a benchmark for the “overnight” money costs, and correspondingly influences the pricing of a significant portion of a bank’s deposit funding sources. Intermediate and longer term interest rates, unlike the fed funds rate, are more directly influenced by external “market” forces, including perceptions about future interest rates and inflation. These trends, in turn, influence the pricing on mid- and long-term loan commitments as well as deposits and bank borrowings that have scheduled maturities.
Generally speaking, a yield curve with a higher degree of slope provides more opportunity to increase the spread between earning asset yields and funding costs. A steeper yield curve, when combined with growth in earning assets and deposits, can be expected to yield expanded revenue performance. It should be emphasized that while the yield curve is a critical benchmark in setting prices for various monetary assets and liabilities in banks, its influence is not exerted in a vacuum. Credit risk, market risk, competitive issues, and other factors must all be considered, along with interest rate risk, in the pricing of financial instruments.
| · | Banking and the Yield Curve |
During 2005, the overall level of interest rates was considered very low by historical standards. During such a period, a “steep” or highly-sloped yield curve may be a precursor of higher interest rates or elevated inflation in the future. In that same low interest rate environment, a “flat” yield curve may be characteristic of a Fed policy designed to calm an overheated economy by tightening credit availability via increases in short term rates. If other rates along the maturity spectrum do not rise correspondingly, the yield curve can be expected to “flatten”. This scenario may reflect an economic outlook that has little or no expectation of higher future interest rates or higher rates of inflation.
The slope of the yield curve, whether “steep” or “flat”, exists in a highly dynamic environment and does not precisely predict the extent, velocity or direction of future interest rate changes or inflationary trends. The shape of the yield curve, however, remains a crucial barometer for financial institutions as they construct a strategic approach to pricing and revenue maximization in a variety of interest rate environments.
Interest rate risk, or the potential impact that interest rate changes may have on intermediation-based revenue production, is similar to other forms of risk in that it is inherently unpredictable. And while the impact of rate changes on revenue performance can be estimated, managed, and moderated, it can never be fully hedged or ameliorated. The ability to sustain or improve revenue streams from intermediation activities is vulnerable to unexpected or nontraditional shifts in interest rate dynamics. These shifts sometimes manifest themselves in variations from the “normal” slope of the yield curve.
To manage monetary assets and liabilities in a dynamic environment, banks utilize financial simulation models that are designed to quantify the effects of parallel shifts in the yield curve and measure their effect on the spread between earning asset yields and the cost of funding. These models serve to quantify the amount of intermediation-based revenue that is “at risk” if interest rates rise or fall. A parallel shift occurs when all of the interest rates along the yield curve move in the same direction and by the same order of magnitude. Unfortunately, these models are less capable of predicting the effects of interest rate changes when interest rate dynamics venture outside customary parameters. As an example, these models provide less predictable results in situations where benchmark rates change asymmetrically, or if changes occur at one end of the curve without directionally similar changes at the other. Furthermore, these models are also less proficient at forming assumptions about customer tendencies and product preferences during periods of dynamic interest rate change.
Late in 2005, many economists began assessing the potential fallout from an “inverted” yield curve. An inverted yield curve is the opposite of a “normal” yield curve and is characterized by short term rates that are higher than longer term rates. The presence of an inverted yield curve is considered to be an anomaly that is almost counterintuitive to the core business of banking. Inverted yield curves do not typically exist for more than a short period of time. In past economic cycles, the presence of an inverted yield curve has frequently foreshadowed a national recession. However, while virtually all recessions have been presaged by an inverted yield curve, the presence of an inverted curve in previous cycles has not guaranteed the onset of a recession.
A “flat” yield curve, such as the one in place at the end of 2005, has the potential to be sustained for a longer period of time. In addition, the U.S. economy has recently been confronted by the potential for a cooler post-2005 housing market and by higher energy and home-heating prices. To add further uncertainty, the economy is now confronted by a yield curve profile that has often been predictive of recessionary pressures. This combination of circumstances could exacerbate the anxiety currently felt by commercial and retail customers about the prospects for economic difficulties, higher inflation, or a possible recession beyond 2005.
For banks, the presence of a “flat” yield curve for a prolonged or sustained period could measurably lower expectations for expanding revenue from intermediation activities. More importantly, the possibility of recession may suppress future asset growth trends and/or increase the influence of other forms of risk, such as credit risk, which could hamper opportunities for revenue expansion and earnings growth in the near term.
2005 Performance Summary and Review
Against a backdrop of its landmark merger transaction and a multitude of other exogenous economic factors and trends, Community reported its performance results for 2005. That performance reflected the combination of results for a “pre-merger” Community for the first half of 2005, followed by a “post-merger” Community for the second half. This hybrid performance, which provided tangible signs of potential performance enhancements beyond 2005, was limited by the recognition of the special charges. Including these expenses, net income and earnings per share results for 2005 were $25.6 million and $1.42, respectively. This compared to net income of $21.8 million and earnings per share of $1.73 in 2004.
Important traditional measures of relative financial performance include return on average assets (ROA) and return on average equity (ROE), which declined to 0.96% and 8.04%, respectively, for 2005. Comparable measures in 2004 were 1.12% and 14.96%. The decline in these measures was dramatically influenced by the impact of the merger, conversion, and restructuring expenses, and by the impact of the application of purchase accounting in the merger of PennRock. As noted previously, comparable “non-GAAP” measures were cited as “return on tangible assets” (ROTA) and “return on tangible equity” (ROTE), which actually increased to 1.27% and 17.09%, respectively, compared to 1.13% and 15.55% a year ago.
Similar trends were noted with respect to earnings per share (EPS) trends. Excluding the impact of the special charges in the second and third quarter, “core” EPS reached $1.71 and was nearly equal to the 2004 performance of $1.73. While annual EPS performance was flat, quarterly trends in the third and fourth quarters provided indications of the accretive benefits of the merger. For example, while pre-merger first quarter results were $0.44 per share, the post-merger fourth quarter results rose to a record $0.47 per share as anticipated expense savings began to emerge from the combination of the two franchises. The fourth quarter results were the highest quarterly net income and EPS performance in the history of Community.
Growth in the various balance sheet categories was dramatically influenced by net assets added in the merger. Total loans grew 84% from one year ago, while total assets and deposits grew 70% and 76%, respectively. Loans are now at $2.2 billion at the end of 2005, while deposits stand at almost $2.3 billion.
The impressive growth rates achieved in 2005 included the “acquired” growth added through the Blue Ball merger. In order to quantify the extent of “organic” growth, it was necessary to isolate this “acquired” growth from the period-end balances at December 31, 2005. This analysis yielded pro forma balances that provided an indication of the extent of “acquired” growth achieved through expansion of market share or through the underlying vitality of Community’s marketplace. The following table serves to illustrate the impact of both the various balance sheet strategies discussed earlier and the influence of organic growth on overall growth levels.
| | | 2005 Year End Balances | | Less: “Pro Forma” Opening PennRock Balances | | Equals: “Pro Forma” 2005 Year End Balances | | 2004 Year End Balances | | Change | | | % | |
| | | | | | | | | | | | | | | | | | | | |
| Investment securities | | $ | 628,585 | | $ | 150,272 | | $ | 478,313 | | $ | 619,110 | | $ | (140,797 | ) | | (22.7 | )% |
| Loans | | | 2,234,497 | | | 842,166 | | | 1,392,331 | | | 1,215,951 | | | 176,380 | | | 14.5 | % |
| Other assets | | | 469,348 | | | 114,491 | | | 354,857 | | | 119,738 | | | 235,119 | | | 196.4 | % |
| Total Assets | | $ | 3,332,430 | | $ | 1,106,929 | | $ | 2,225,501 | | $ | 1,954,799 | | $ | 270,702 | | | 13.8 | % |
| | | | | | | | | | | | | | | | | | | | |
| Total Deposits | | $ | 2,294,367 | | $ | 882,075 | | $ | 1,412,292 | | $ | 1,305,537 | | $ | 106,755 | | | 8.2 | % |
| Short-term borrowings | | | 87,253 | | | 16,010 | | | 71,243 | | | 47,116 | | | 24,127 | | | 51.2 | % |
| Long-term debt | | | 461,647 | | | 103,515 | | | 358,132 | | | 435,590 | | | (77,458 | ) | | (17.8 | )% |
| Other liabilities | | | 12,490 | | | 13,196 | | | (706 | ) | | 14,215 | | | (14,921 | ) | | 105.0 | % |
| Total Liabilities | | $ | 2,855,757 | | $ | 1,014,796 | | $ | 1,840,961 | | $ | 1,802,458 | | $ | 38,503 | | | 2.1 | % |
| | | | | | | | | | | | | | | | | | | | |
Changes shown above serve to summarize the effect of the following balance sheet dynamics:
| o | Reductions in investment balances were influenced by both the de-leveraging strategy and the utilization of scheduled investment portfolio runoff to fund loan growth. |
| o | Organic loan growth reflected strong loan demand, which was affected by favorable pricing conditions throughout the year. |
| o | Growth in other assets was driven almost exclusively by the effect of intangibles added from the merger of Blue Ball. |
| o | Deposit growth, though steady, was not sufficient to fully fund loan demand. Interest rate conditions favored the utilization of scheduled investment runoff to fund excess loan demand. |
| o | While short term borrowings increased, such borrowings were reduced from the combination of pre-merger balances at Community and Blue Ball. |
| o | Long-term debt reductions were primarily effected by the prepayment of $60 million of FHLB advances from pre-merger Community. |
Community’s capital position was also affected by the merger. By the end of 2005, all post-merger, combined capital ratios were sufficient to sustain the Corporation’s “well-capitalized” designation and provided a strong base for future growth of the franchise. The “tangible” equity to assets ratio, which provides a vital measure of capital adequacy in the post-merger period, was 7.14% at the end of the 2005.
The four components of operating performance (net interest income; the provision for credit losses; non-interest income; and non-interest expenses) improved, primarily as a consequence of the additional six months of operating activity from Blue Ball. Excluding the impact of the “special charges”, each of the components reflected underlying metrics that underscore the efficacy of the post-merger operations of the combined entities.
| o | Net interest margin reached 3.76% for 2005, including margins of 3.89% and 3.96% in the third and fourth quarters, respectively. This was a marked improvement over the full year 2004 margin of 3.44%. Despite the impact of an increasingly flat yield curve, net interest margin expanded in the post-merger, second half of the year. The de-leveraging and balance sheet restructuring near the time of the merger helped to boost performance in the second half of 2005. |
| o | The provision for loan losses dropped from $3.1 million in 2004 to $2.3 million in 2005. The provision for 2005 exceeded net charge-offs of $824,000 by nearly $1.5 million, as asset quality improved despite higher overall loan balances. |
| o | Non-interest income reflected the revenue stream added from the Blue Ball merger in the second half of 2005. |
| o | The efficiency ratio fell to 57.5%, including 55.6% in the fourth quarter, despite the fact that operating expenses included over $1.2 million of increased intangible amortization in the second half of the year. This represented a measurable improvement over the 60.42% recorded for all of 2004. In addition, quarterly non-interest expenses declined from $20.8 million in the third quarter to $20.2 million in the fourth quarter, as phased-in efficiencies from the integration of Blue Ball were reflected in linked-quarter expense reductions. |
PERFORMANCE COMPONENTS
The purpose of this section of the presentation is to provide a more “in depth” comparative analysis of the four major components of performance during 2005.
Net Interest Income
Community’s major source of revenue continues to be derived from intermediation activities and is reported as net interest income. Net interest income is defined as the difference between interest income on earning assets and interest expense on deposits and borrowed funds. Net interest margin is a relative measure of a financial institution’s ability to efficiently deliver net interest income from a given level of earning assets. Both net interest income and net interest margin are influenced by the frequency, velocity, and extent of interest rate changes and by the composition and absolute volumes of earning assets and funding sources.
The following table compares net interest income and net interest margin components between 2005 and 2004 (in thousands):
| | | 2005 | | 2004 | | Change | |
| | | Amount | | Yield / Rate | | Amount | | Yield / Rate | | Amount | | Yield / Rate | |
| | | | | | | | | | | | | | | | | | | | |
| Interest income | | $ | 149,456 | | | 6.26 | % | $ | 106,338 | | | 5.80 | % | $ | 43,118 | | | 0.46 | % |
| Interest expense | | | 59,648 | | | 2.90 | % | | 43,242 | | | 2.70 | % | | 16,406 | | | 0.20 | % |
| Net interest income | | $ | 89,808 | | | | | $ | 63,096 | | | | | $ | 26,712 | | | | |
| | | | | | | | | | | | | | | | | | | | |
| Interest spread | | | | | | 3.36 | % | | | | | 3.10 | % | | | | | 0.26 | % |
| Impact of non-interest funds | | | | | | 0.40 | % | | | | | 0.34 | % | | | | | 0.06 | % |
| | | | | | | | | | | | | | | | | | | | |
| Net interest margin | | | | | | 3.76 | % | | | | | 3.44 | % | | | | | 0.32 | % |
| · | Influence of Interest Rate Trends |
The yield curve, and the changes that have occurred over the last three years, have had a substantial influence on net interest margin and net interest income performance. The following presentation of the yield curve, which depicts the rates in effect at the end of the last three years, provides some insight into the interest rate profile during those timeframes.
The presentation of the yield curve at the end of the past three years illustrates two primary issues that have affected interest rate trends since 2003. First, overall interest rates have increased, although such increases have been most significant at the short end of the curve, with little change in the longer maturities. Second, the yield curve at the end of 2005 had significantly less slope than the previous two year ends. This phenomenon has resulted in an overall flattening of the yield curve.
The above presentation provides an array of interest rates in place at discrete points in time. This comparison, while useful, serves to exaggerate actual rate trends as rates displayed at specific points in time are vulnerable to one-day swings. A more appropriate and inclusive comparison is provided by a presentation of an “average” yield curve for the last three years. The pricing and yields of loans, investments, deposits, and borrowings can be more effectively correlated to changes in average rates over time. The following is a presentation of the yield curve using average rates in place over the last three years.

While the yield curve presentation of average interest rates exhibited a more modest variation in rates than the presentation of year end rates, even the presentation of average rates portrayed an overall “flattening” of the yield curve. Ordinarily, these externally-driven rate trends could be expected to narrow the net interest margin and compress net interest income. These trends, and an evaluation of the combined interest rate risk profile of Blue Ball and Community, prompted the formulation and execution of the “three-pronged” de-leverage strategy at mid-year. These strategic initiatives were major contributors to a renascent net interest margin in the second half of the year, despite the impediments presented by a “flat” yield curve environment.
| · | Interest Income / Earning Assets |
Interest income reached nearly $150 million, an increase of almost 41% over the interest income of $106 million reported for 2004. This increase was driven by the six months of Blue Ball assets added in the second half of the year and by the improved yield, which rose from 5.80% in 2004 to 6.26% for 2005. Average earning assets grew from $1.8 billion to almost $2.4 billion over the two periods. The growth in total earning assets, however, was relatively constrained as loan growth was partially funded by scheduled runoff in the investment portfolio. While deposit growth was steady, it was inadequate to meet the funding requirements for loan growth. Investment portfolio balances as a percentage of total earning assets declined from 36% in 2004 to 26% in 2005. In addition to the use of scheduled investment runoff to fund loan growth, the relative size of the investment portfolio was also affected by the mid-year de-leveraging strategy. Both pre-merger Community and Blue Ball have historically focused their growth in the commercial and commercial real estate segments of their core markets. This growth was also augmented by expansion of retail lending, including the home equity segment.
| · | Interest Expense / Funding Sources |
Like interest income, interest expense was also influenced by changing interest rate dynamics and the growth attributable to the mid-year acquisition of Blue Ball. Interest expense grew almost 38%, from just over $43 million in 2004 to nearly $60 million in 2005. At the same time, the cost of aggregate funding rose from 2.70% to 2.90%. While increases in funding costs were mitigated by the prepayment of FHLB advances and the overall de-leveraging of rate-sensitive funding sources, the rise in interest rates drove the 20 basis point increase in the overall cost of funds. FHLB advances, which comprise one of the more expensive sources of funding, now aggregate less than 25% of funding sources compared to over 30% in 2004. The reduced dependency on higher cost FHLB advances constrained the level of increase in the overall cost of funds. The cost of deposit funding sources, however, increased as the pressure on short term interest rates required increases in rates offered on more rate-sensitive deposit products.
| · | Interest Spread / Net Interest Margin |
A financial institution’s ability to effectively blend the impact of changing rates, shifting rate indices, customer preferences, and product development initiatives can be measured by the performance of interest spread, defined as the difference between earning asset yield and the cost of funding sources. Net interest margin combines the impact of interest spread with both investment of non-interest bearing funding sources and management of non-earning assets.
The Corporation reported a notable improvement in net interest spread from 3.10% in 2004 to 3.36% in 2005, and a similar increase in net interest margin, from 3.44% to 3.76%, over the same periods. The increase in net interest margin was especially apparent after the mid-year acquisition of Blue Ball as margin reached 3.89% in the third quarter and 3.96% in the fourth quarter, well above the 3.55% and 3.46% recorded in the first and second quarters, respectively. The emergence of an improved margin was also linked to the impact of the growth in the contribution from non-interest funding sources, which rose from 0.34% to 0.40%. During periods of rising interest rates, the contribution from non-interest funds to net interest margin is increased because funds can be invested at progressively higher rates. During periods of declining rates, these funds can be expected to contribute to reductions in net interest margin.
A quarterly review of the components of net interest income provides a more significant analysis into the impact of: (1) the mid-year merger of Blue Ball; (2) the various de-leveraging strategies and; (3) their combined effect on net
interest spread, net interest margin and net interest income. The following table provides a comparison of earning asset yields, funding costs, and other information for each of the four quarters of 2005 and 2004.
| | | 2005 | |
| | | Fourth Quarter | | Third Quarter | | Second Quarter | | First Quarter | |
| Asset yield | | | 6.53 | % | | 6.25 | % | | 6.06 | % | | 6.04 | % |
| Funding cost | | | 3.00 | % | | 2.76 | % | | 2.97 | % | | 2.86 | % |
Interest spread | | | 3.53 | % | | 3.49 | % | | 3.09 | % | | 3.18 | % |
Net interest margin | | | 3.96 | % | | 3.89 | % | | 3.46 | % | | 3.55 | % |
| | | | | | | | | | | | | | |
| Net interest income | | $ | 28,571 | | $ | 28,208 | | $ | 16,650 | | $ | 16,379 | |
| | | 2004 | |
| | | Fourth Quarter | | Third Quarter | | Second Quarter | | First Quarter | |
| Asset yield | | | 5.90 | % | | 5.79 | % | | 5.75 | % | | 5.77 | % |
| Funding cost | | | 2.75 | % | | 2.68 | % | | 2.64 | % | | 2.70 | % |
Interest spread | | | 3.15 | % | | 3.11 | % | | 3.11 | % | | 3.07 | % |
Net interest margin | | | 3.51 | % | | 3.43 | % | | 3.44 | % | | 3.40 | % |
| | | | | | | | | | | | | | |
| Net interest income | | $ | 16,285 | | $ | 15,906 | | $ | 15,843 | | $ | 15,062 | |
For most of 2004, net interest spread and net interest margin operated within a relatively narrow band of performance. The Fed began to slowly reverse its accommodative monetary policy near the middle of 2004, which resulted in increases in asset yields that were partially offset by similar increases in the cost of funds. The gradual rise in rates began to provide modest expansion of spread and margin in the fourth quarter of 2004 and the first quarter of 2005. During this time, increases in net interest income were largely driven by volume increases, primarily within the loan portfolio.
As Community approached the merger consummation date, preparations were made to provide for the integration of the two companies, including plans to accommodate the balance sheet restructuring and de-leverage strategies. For most of the second quarter, Community delayed reinvestment of scheduled maturity runoff from the investment portfolio and, instead, used this liquidity to facilitate the early payoff of the FHLB advances. In the short term, this contributed to a slight compression of net interest margin in the second quarter of 2005.
In the post-merger timeframe, quarterly results exhibited the anticipated improvement in net interest spread and net interest margin. In the third quarter, for example, net interest margin grew to 3.89%, which was a 43 basis point improvement from the pre-merger second quarter. By the end of the fourth quarter, the Corporation was able to substantially complete the reinvestment of the proceeds from the liquidation of the Blue Ball investment portfolio, resulting in a further increase in margin to 3.96%. This expansion occurred despite the offsetting influence of the increasingly flat yield curve over the last half of 2005.
Provision for Credit Losses
Asset quality has been a mainstay of Community’s financial performance in recent years and 2005 proved to be no exception. Throughout the year, the Corporation experienced improved credit quality metrics which were reflected in operating results. The provision for loan losses declined from $3.1 million in 2004 to $2.3 million in 2005, which corresponded to reductions in net charge-offs. Net charge-offs declined from $1.9 million in 2004 to $824,000 in 2005. The ratio of net charge-offs to average loans declined from 0.16% in 2004 to 0.05% for 2005, the lowest level of charge-offs in recent history.
The ratio of the allowance for loan losses to loans declined from 1.19% at the end of 2004 to 1.03% at the end of 2005. In connection with the merger of Blue Ball, Community applied the provisions of SOP 03-3, “Accounting for Certain Loans or Debt Securities Acquired in a Transfer.” This pronouncement addressed the accounting for initial investments in loans acquired in a transfer in years after 2004, including those acquired in a merger. At the end of 2005, the allowance for credit losses reached almost $23 million and provided 253% coverage of non-accrual loans at
that date. Non-accrual loans, including those acquired in connection with the merger of Blue Ball totaled just $9 million at the end of 2005.
The provision and the allowance are recorded at levels which are responsive to both the ebb and flow of general credit quality patterns and, more specifically, to the risks inherent in both seasoned loans and in incremental additions to Community’s growing portfolio. Community undergoes a rigorous and consistently applied process on a quarterly basis in order to evaluate the allowance for loan losses and the determination of the quarterly provision for credit losses. See the section of this discussion entitled “Allowance for Loan Losses and Credit Quality” for additional information.
Non-Interest Income
Excluding investment-related gains, Community and Blue Ball each generated nearly 25% of their total revenues from non-interest income sources during pre-merger 2004. In the two quarters immediately following the merger, the ratio for the combined company declined to just over 21%. The lower relative level of non-interest income in the post-merger period was partially related to the disposal of the operations of Blue Ball’s actuarial, retirement and employee benefit consulting businesses at the time of the merger. These businesses, which had generated nearly $3 million in revenues in 2004, had been operating on an unprofitable basis in recent months, with negligible prospects for a turnaround. By excluding revenues from these businesses from pre-merger 2004 information, PennRock’s pro forma ratio of non-interest revenue to total revenues would have been under 20%. The planned disposal of these businesses, which facilitated similar reductions in related expenses, contributed to the lower, 21% ratio in the post-combination, second-half of 2005. The other major contributor to the lower ratio involved the impact of the cooler mortgage refinancing market and the related reduction in revenues from 2004 at both companies.
The following is a summary of the various categories of non-interest income, which includes six months of Blue Ball activity in 2005 but excludes Blue Ball from all of 2004:
| | | | | | | Change | |
| | | 2005 | | 2004 | | Amount | | % | |
| Investment management and trust services | | $ | 2,692 | | $ | 1,510 | | $ | 1,182 | | | 78 | % |
| Service charges on deposit accounts | | | 9,413 | | | 7,120 | | | 2,293 | | | 32 | % |
| Other service charges, commissions and fees | | | 5,452 | | | 3,357 | | | 2,095 | | | 62 | % |
| Insurance premium income and commissions | | | 3,350 | | | 3,260 | | | 90 | | | 3 | % |
| Mortgage banking activities | | | 2,354 | | | 2,665 | | | (311 | ) | | (12 | )% |
| Earnings on investment in life insurance | | | 2,063 | | | 1,593 | | | 470 | | | 30 | % |
| Other income | | | 854 | | | 1,238 | | | (384 | ) | | (31 | )% |
| | | | | | | | | | | | | | |
| | | | 26,178 | | | 20,743 | | | 5,435 | | | 26 | % |
| | | | | | | | | | | | | | |
| Investment security gains | | | 259 | | | 2,470 | | | (2,211 | ) | | (90 | )% |
| | | | | | | | | | | | | | |
| Total non-interest income | | $ | 26,437 | | $ | 23,213 | | $ | 3,224 | | | 14 | % |
Community recorded modest investment-related gains from security sales in 2005 compared to nearly $2.5 million in 2004. Excluding the impact of these gains, non-interest income rose 26% in 2005.
Despite the addition of Blue Ball activity for the last half of 2005, growth in all non-interest sources of revenue was constrained as compared to the rate of growth in net interest revenues from intermediation activities. Since combined results for 2005 and pre-merger results in 2004 both excluded income from Blue Ball’s actuarial, retirement and employee benefit consulting businesses, the disposal of that business had no impact on year-over-year growth rates. In contrast, revenues from mortgage banking activities declined in real terms in 2005 and did serve to muffle merger-related growth expectations. Revenues from mortgage banking declined from $2.7 million in 2004, to $2.4 million in 2005, in spite of the additional six months of Blue Ball activity in the last half of the year. Reduced activities in both refinance and purchased mortgages resulted in a 12% reduction in revenues. For different reasons, a reduction was also recorded in the “other” category, as results for 2004 had included a gain from the sale of Community’s credit card portfolio.
The remaining categories of non-interest income reflected increases associated with the merger. Furthermore, many of these increases may foreshadow revenue enhancement opportunities as revenue-producing activities become more coordinated in 2006. As an example, pre-merger Community had a modest trust department with just over $50 million in managed assets. At the end of 2005, assets under management had grown to nearly $300 million, primarily from assets added from Blue Ball’s more robust trust operation. Retail investment sales, another component of this category, remained vigorous throughout the year and accounted for a substantial portion of the overall increase.
Deposit service fees grew in line with expectations for the combined franchise. During the last half of 2005, Community avoided initiating any wholesale changes in the fee structure in the Blue Ball division in order to forestall any potential for customer dissatisfaction in the post-consummation period. Fee structures have been revisited in connection with 2006 planning but will continue to be considerate of customer retention issues.
Other service charges included the impact of both ATM surcharge fees and debit card income. Debit card income growth has been fueled by the continued use of this convenient electronic payment system. During 2006, Community expanded customer awareness by initiating programs designed to encourage increased usage of this fee-based payment medium. Fees from the separate, pre-existing overdraft privilege programs in the predecessor banks will be more fully integrated during 2006. This program continued to meet customer needs with this widely-accepted, consumer-centric service.
Growth in insurance commissions was subdued as insurance agency activities have not been fully extended throughout the Blue Ball market area. The modest increase was also affected by a decline in title insurance commissions that was linked to the drop-off in mortgage activity. Increases from bank-owned life insurance income related primarily to the addition of pre-existing programs that were in place at PennRock prior to the merger.
Non-Interest Expenses
Total non-interest expenses reached $75 million in 2005, including over $8 million of merger, conversion and restructuring expenses that were previously discussed. Excluding those special charges, non-interest expenses reached $66.9 million in 2005 compared to $50.0 million in the previous year, an increase of nearly $17 million or 34%. The mid-year 2005 acquisition of Blue Ball was the predominant factor contributing to the higher expense level in 2005. In addition, the merger resulted in the recognition of an additional $1.2 million in core deposit intangible amortization, all of which was recorded in the last half of 2005. The following is a summary of the various components of expenses for all of 2005 as compared to the previous year’s results.
| | | | | | | Change | |
| | | 2005 | | 2004 | | Amount | | % | |
| Salary and benefits | | $ | 36,998 | | $ | 28,337 | | $ | 8,661 | | | 31 | % |
| Occupancy expense | | | 11,355 | | | 8,287 | | | 3,068 | | | 37 | % |
| Marketing expense | | | 2,036 | | | 2,325 | | | (289 | ) | | (12 | )% |
| Telecommunications expense | | | 1,359 | | | 1,285 | | | 74 | | | 6 | % |
| Amortization of intangibles | | | 1,424 | | | 161 | | | 1,263 | | | 784 | % |
| Other expenses | | | 13,692 | | | 9,598 | | | 4,094 | | | 43 | % |
| | | | | | | | | | | | | | |
| Subtotal | | | 66,864 | | | 49,993 | | | 16,871 | | | 34 | % |
| | | | | | | | | | | | | | |
| Merger, conversion and restructuring | | | 8,205 | | | --- | | | 8,205 | | | --- | |
| | | | | | | | | | | | | | |
| | | $ | 75,069 | | $ | 49,993 | | $ | 25,076 | | | 50 | % |
| · | Overview of Merger Impact—Operating Expenses |
It is important to note that historical 2004 operating results included expenses only for pre-merger Community; there was no restatement of 2004 expenses to include Blue Ball. The 2005 results, on the other hand, reflected a combination of pre-merger Community expenses for the first half of the year, along with merged results for Community and Blue Ball for the second half. As would be expected, results between the two years displayed distorted year-over-year comparisons owing to the six months of Blue Ball activity included in 2005 results.
Despite the distortions attributable to anomalies associated with purchase accounting, certain expense trends provided
meaningful revelations. As discussed earlier, the efficiency ratio offers a sound basis to assess the effectiveness of operating expense controls relative to a given level of revenues. The efficiency ratio is defined as expenses divided by operating revenues (expressed on a fully-taxable equivalent basis). If expense levels were to rise at a faster pace than the rise in revenue growth, the efficiency ratio can be expected to increase. For all of 2004, the efficiency ratio was 60.42% and was consistent with the ratio of 60.59% in 2003. In 2005, after excluding the special charges, the efficiency ratio for the full year actually declined to 57.51%, reflecting the favorable impact of the mid-year combination. The 2005 ratio exhibited further improvement after excluding intangible amortization, a non-operating expense, from the computation. By excluding intangible amortization for 2005, the efficiency ratio declined to a more impressive 56.29%.
As further testimony to the expense savings achieved by the combination of the two franchises, efficiency ratios were computed for the discrete third and fourth quarter periods of post-merger 2005. Since integration efforts were phased-in and were substantially complete by the end of the fourth quarter, the efficiency ratio for the three months ended December 31, 2005 provided a reasonable gauge to assess the impact of the merger on expense management. The efficiency ratio for the fourth quarter of 2005 declined to 55.56%, the lowest quarterly ratio at Community since the third quarter of 2002.
The year 2004 was the last full year that Community and Blue Ball (and its parent company, PennRock) operated as separate companies. In that year, Community reported nearly $50 million in operating expenses (shown above) compared to almost $30 million at Blue Ball (not shown). Excluding any potential for expense savings, the addition of Blue Ball to Community’s results for a full year would have increased operating expenses by 60%. Since the acquisition occurred at mid-year, only one-half of the increase, or 30%, would have been expected in 2005. Excluding the increases associated with the special charges and the amortization of intangibles, the increase in year-over-year expenses reached 31%. This admittedly simplistic analysis ignores a number of relevant factors; however, it does provide an intuitive, benchmark validation of the expected expense increases for the combined entity in 2005. More importantly, the change in the efficiency ratio, which is considerate of factors unrelated to the merger (de novo branch expansion, inflationary increases, etc), served to demonstrate improved management of the combined operating expenses in the post-merger timeframe.
The largest single component of non-interest expenses is salary and benefits. Combined salary and benefit expenses comprised 57% of operating expenses (excluding both the special charges and intangible amortization) in both 2005 and 2004. At the end of 2004, the pro-forma combined number of full-time equivalent employees aggregated 987 and was reduced to 933 by the end of 2005. Community was seeking workforce reductions of 10% in connection with the consolidation of the operations and administration functions. Such reductions were largely achieved, but were offset by additional staffing for normal growth, including the employees added in the opening of five new office locations throughout the year.
Throughout 2005, Community made plans to blend the various incentive, insurance and other employee benefit plans in order to provide consistent benefits across the newly-combined organization. While consolidation of these plans was largely accomplished by the end of the year, certain of the plans were continued during the transition period of June to December to accommodate plan administration and continuity of benefits for Blue Ball employees. On January 1, 2006, one of the largest components of benefits, the group healthcare plan, was consolidated and represented the last major employee benefit plan to be integrated as a result of the merger.
Community has historically followed the intrinsic value accounting method of Accounting Principles Board Opinion No. 25, “Accounting for Stock Issued to Employees” (APB 25), which was permitted under SFAS No. 123, “Accounting for Stock Based Compensation” (SFAS No. 123). All options issued by Community have been issued at fair value and, accordingly, no compensation expense has been recognized in the financial statements for stock options issued to employees, executive officers or directors through the end of 2005. As discussed in the Notes to the Consolidated Financial Statements, Community has provided the required pro forma disclosures of the impact of stock compensation on net income and earnings per share by applying the fair value recognition provisions of SFAS No. 123. In 2004, the FASB issued SFAS No. 123(R), “Share-Based Payment” (SFAS No. 123(R)), which amended SFAS No. 123 and now requires financial statement recognition of compensation cost for stock options and other stock-based awards for fiscal periods beginning after 2005.
Community evaluated the various provisions of SFAS No. 123(R) and the optional transition methods and decided to adopt the modified prospective method. This method requires recognition of compensation expense for the unvested portion of existing awards and new grants, but does not require a restatement of prior periods. Stock compensation expense of approximately $100,000 will be recorded between the first quarter of 2006 and the last quarter of 2007 for the unvested portion of existing awards at December 31, 2005. In addition, in January 2006, Community granted 240,000 options that will vest over 3 years. The options have an estimated fair value of $1.6 million, of which approximately $500,000 will be recorded as compensation expense in 2006. The Company and its Board of Directors, through its Compensation Committee, will continue to review and evaluate the ongoing role of stock-based compensation in its overall compensation structure.
Occupancy expenses and increases therein are normally tied to the pace of office expansion efforts. In 2005, Community and Blue Ball opened a total of 5 new offices, which represented a 7% increase in the number of office locations. During 2005, occupancy expenses grew to $11.4 million, an increase of 37% over the amounts recorded during 2004 for the pre-merger Community. This rate of increase was evaluated in light of the expected, intuitive increase of 30% implied by the addition of Blue Ball facilities costs for the last six months of 2005. Incremental increases above 30% were attributed, in part, to the aforementioned office expansion.
During 2005, and in connection with the merger of Blue Ball, Community implemented a reconfiguration of its back office operations that was designed to accommodate merger-related expense savings and improve operating processes. This reconfiguration was an integral component of the Blue Ball integration plan and, at the same time, provided a structural platform for future expansion. During 2005, Community bifurcated its processing operations into two primary locations and now enjoys the depth of management and strategic duplication of facilities that will accommodate both franchise growth as well as certain of its disaster recovery needs.
During the two years preceding 2005, Community timed the expansion of its marketing efforts to coincide with the market disruption that had accompanied two high-profile mergers of larger, formerly locally-managed financial institutions. These expenses, in large measure, were incurred to improve the profile of Community in markets where competitors were deemed particularly vulnerable. During both 2003 and 2004, marketing expenses grew at rates well in excess of the overall growth in non-interest expenses, reaching growth of 85% and 15%, respectively, in those years. During 2005, the Corporation made a conscious decision to moderate increases in marketing efforts as the organization became, to some extent, inwardly focused on merger integration and customer retention issues. At the same time, the amalgamation of marketing initiatives between the newly-combined banks also helped pave the way for the aggregate reduction of 12% in marketing expenses from 2004.
The growth of Community’s franchise and the need for improved communications has elevated the importance of efficient and effective management of telecom expenses. For the last three years, the Corporation has incurred substantial expenses related to the costs of upgrades for communications and data connectivity improvements for Community’s growing office network. During 2004, the Corporation underwent an intensive study with an outside vendor specializing in the review and analysis of its telecommunications strategy. These efforts, which included renegotiation of telecom rates, identified cost savings that moderated telecom expense growth in 2004 and continued to reap benefits in 2005. Such initiatives were instrumental in offsetting the incremental expense increases that would have been expected with the addition of the Blue Ball network. Instead, telecom expenses grew modestly from 2004 to 2005, reflecting an increase of just under 6%.
| · | Amortization of Intangibles |
In connection with the merger of Blue Ball, Community recorded intangible assets of $255 million, including a core deposit intangible of $13 million. Under the provisions of FASB Statement No. 142, acquirers are no longer required to amortize the intangible asset associated with goodwill, which was the most significant portion of the intangibles recorded as a result of the Blue Ball merger. Instead, such amounts must be periodically tested for impairment. In contrast, certain other intangible assets are deemed to have finite lives and are required to be amortized over their assumed lives. The increase in intangible amortization reflects the impact of the Blue Ball-related core deposit intangible amortization recorded in the last half of 2004. Results in 2004 included amortization of intangible assets from previous acquisitions of smaller, integrated financial service companies.
Significant categories of expenses contained in this grouping include Pennsylvania bank shares tax, insurance, contributions, stationery, printing, postage and various other expenses. Virtually all of the increases were influenced by the incremental expenses arising from the merger of Blue Ball or by expenses associated with business volume increases.
Income taxes grew from $4.9 million in 2004 to $6.1 million in 2005, an increase of 24%. The increase was commensurate with the increase in pretax income, resulting in a nominal tax rate of 19% in 2005 versus 18% in 2005. The relative rate of tax exempt income influences the reported income tax rates and remains the primary reason for the difference between the nominal tax rate and the statutory federal tax rate for corporations.
STATEMENT OF CONDITION
Overview
At December 31, 2005, the Corporation’s total assets reached $3.33 billion, reflecting a change of 70% from the $1.95 billion of assets recorded at the end of 2004. Average assets reached $2.67 billion for 2005 compared to $1.94 billion for 2004, an increase that was substantially driven by the mid-year merger of Blue Ball. Average loans reached $1.71 billion, increasing 48% from 2004, while average investments actually declined 8%, to $615 million. Growth in the investment portfolio was curtailed by two factors: (1) the restructuring and de-leveraging strategies that were coordinated with the timing of the merger, and; (2) the use of scheduled investment runoff to fund loan growth. The decision to use scheduled investment runoff to fund loans was influenced by a lower deposit growth rate and by the opportunity to extract higher asset yields from loan demand. Deposits grew to $1.81 billion, but the increase of 39% was not sufficient to keep pace with the 48% growth in loans.
Loan growth benefited from increased demand for credit in both the consumer and commercial sectors. Consumer demand for credit was influenced by both low rates and sustained consumer confidence. Growth in the commercial sector was related to Community’s ability to garner market share from larger, less nimble financial institutions. Aside from the impact of the merger, the growth trends experienced in the last several years provided a validation of Community’s commitment to staying close to its core markets and to using local presence and responsiveness as a competitive advantage.
Investments
Community has established corporate investment policies that address various aspects of portfolio management, including quality standards, liquidity and maturity limits, investment concentrations and regulatory guidelines. The Corporation’s objective with respect to investment management includes maintenance of appropriate asset liquidity, facilitation of asset/liability strategy and maximization of return. Compliance with investment policy is regularly reported to the Board of Directors.
| · | Investment Classification |
Securities to be held for indefinite periods of time are classified as “available-for-sale” and carried at fair value. Community actively manages its investment portfolio and, accordingly, has classified a substantial portion of its portfolio as available-for-sale. Such securities are intended to be used as part of Community’s asset/liability management strategy, and may be sold in response to changes in interest rates, prepayment risk and other factors affecting overall investment strategy.
Under current policy, if management has the intent and the Corporation has the ability to hold securities until maturity, securities are classified as “held-to-maturity” investments at the time of purchase and carried at adjusted historical cost. During 2005, Community purchased $23 million of investments that were classified as held-to-maturity, which represented only 4% of the aggregate portfolio at the end of the year.
Investment activity during 2005 was affected by a multiplicity of factors, the combination of which resulted in an 8% decline in average investments. This decline occurred despite the acquisition of the pre-merger investment portfolio of Blue Ball. Some of the more significant dynamics included the following:
| o | The entire portfolio of investments acquired from the merger of Blue Ball was liquidated immediately after the merger. |
| o | Proceeds received from the liquidation of Blue Ball’s portfolio were coordinated with the de-leveraging strategy, described earlier. |
| o | Certain of the liquidation proceeds were reinvested at higher yields in the post-merger period. |
| o | Scheduled runoff from the investment portfolio was utilized to accommodate the de-leverage strategy and to facilitate the demand for credit funding, which outpaced the growth from deposit funding sources. |
At the end of 2005, the investment portfolio comprised 22% of earning assets, compared to 34% at December 31, 2004. The decline in the relative level of investments was directly influenced by the above factors.
The pretax unrealized net loss within the investment portfolio at December 31, 2005 was $2.6 million. As required to the extent it pertained to available for sale securities, this fair value adjustment was recorded in accumulated other comprehensive loss (adjusted for income taxes) in the stockholders’ equity section of the consolidated balance sheet. For those securities classified as available-for-sale, $220 million have a fair market value that exceeded the adjusted historical cost, with unrealized pretax gains totaling $7.6 million. Alternatively, available-for-sale securities totaling $386 million have a fair market value less than the adjusted historical cost, including unrealized losses of $10.2 million. Securities classified as “held-to-maturity” had fair market values $467,000 less than carrying values. Special consideration was given to those securities which were affected by unrealized losses.
| · | Other Than Temporary Impairment |
For several years, regulators have been addressing the issue of accounting for impairments of certain investments in debt and equity securities. The Emerging Issues Task Force (EITF) of the FASB issued authoritative guidance in its project known as EITF 03-1. Unfortunately, portions of the requirements of EITF 03-1 were not well received and resulted in a number of additional clarifications to the treatment for securities that meet the definition of “Other Than Temporary Impairment” (OTTI). In November of 2005, the FASB issued a final FASB Staff Position, which nullified and clarified certain provisions of existing accounting literature.
Community has established a process to apply the accounting requirements for those securities which are deemed to have the potential to be considered for OTTI. This process requires that all securities which have a decline in fair market value below the carrying value be reviewed on a quarterly basis. The review of those securities requires an analysis of the following:
| o | The length of time and the extent to which the fair value has been less than cost, |
| o | The financial condition and near-term prospects of the issuer, and |
| o | The intent and ability of the Corporation to retain its investment in the issuer for a period of time sufficient to allow for any anticipated recovery in fair value. |
At the end of 2005, Community reviewed $408 million of securities which had a fair market value which was less than amortized cost. Based upon its evaluation, which was considerate of the factors above, and the Corporation’s ability and intent to hold those investments for a reasonable period of time sufficient for a forecasted recovery of fair value, Community does not consider those investments to be other-than-temporarily-impaired at December 31, 2005.
The following tables summarize amortized cost and estimated fair values at December 31, 2005, 2004, and 2003 and maturity distribution of securities at December 31, 2005.
| | | 2005 | | 2004 | | 2003 | |
| | | Amortized Cost | | Fair Value | | Amortized Cost | | Fair Value | | Amortized Cost | | Fair Value | |
| | | | | | | | | | | | | | |
| U.S. government and federal agency | | $ | 125,938 | | $ | 123,124 | | $ | 126,056 | | $ | 125,541 | | $ | 173,651 | | $ | 173,292 | |
| Mortgage-backed, primarily federal agency | | | 186,871 | | | 182,813 | | | 178,437 | | | 179,314 | | | 121,853 | | | 123,395 | |
| State and municipal | | | 209,077 | | | 213,475 | | | 180,110 | | | 186,366 | | | 177,546 | | | 184,481 | |
| Corporate | | | 40,351 | | | 40,220 | | | 58,928 | | | 60,043 | | | 95,461 | | | 97,987 | |
| Equity | | | 68,909 | | | 68,486 | | | 67,085 | | | 67,846 | | | 65,070 | | | 67,806 | |
Total | | $ | 631,146 | | $ | 628,118 | | $ | 610,616 | | $ | 619,110 | | $ | 633,581 | | $ | 646,961 | |
Maturity Distribution of Securities
| | | Within One Year | | One Through Five Years | | Five Through Ten Years | | After Ten Years | | Total | | Average Maturity | | Weighted Average Yield(a) | |
| U.S. Government and federal agencies | | $ | 999 | | $ | 41,597 | | $ | 120,771 | | $ | 149,441 | | $ | 312,808 | | | 10yr. 7mos. | | | 4.69 | % |
| State and municipal | | | 657 | | | 1,065 | | | 16,025 | | | 188,330 | | | 206,077 | | | 15yr. 2mos. | | | 7.07 | % |
| Other | | | 4,007 | | | 8,269 | | | 9,148 | | | 21,928 | | | 43,352 | | | 13yr. 8 mos. | | | 6.49 | % |
| Total | | $ | 5,663 | | $ | 50,931 | | $ | 145,944 | | $ | 359,699 | | $ | 562,237 | | | 12yr. 6 mos. | | | 5.71 | % |
| | | | | | | | | | | | | | | | | | | | | | | |
| Percentage of total | | | 1.00 | % | | 9.06 | % | | 25.96 | % | | 63.98 | % | | 100.00 | % | | | | | | |
| | | | | | | | | | | | | | | | | | | | | | | |
| Weighted average yield (a) | | | 5.17 | % | | 4.82 | % | | 4.94 | % | | 6.15 | % | | 5.71 | % | | | | | | |
(a) Weighted average yields, based on amortized cost, were computed on a tax equivalent basis using a federal tax rate of 35%.
Loans
As has been the pattern for the last several years, overall earning asset growth has been concentrated in the expansion of commercial and commercial real estate lending. While loan balances acquired via the merger of Blue Ball would be expected to deliver a minimum average growth rate near the 30% benchmark, actual growth from 2004 to 2005 was 48%, summarized as follows:
| | | | | | | Change | |
| | | 2005 | | 2004 | | Amount | | % | |
| | | | | | | | | | | | | | |
| Commercial | | $ | 592,556 | | $ | 404,653 | | $ | 187,903 | | | 46 | % |
| Commercial real estate | | | 562,852 | | | 310,769 | | | 252,083 | | | 81 | % |
| Residential real estate | | | 128,120 | | | 95,547 | | | 32,573 | | | 34 | % |
| Consumer | | | 428,981 | | | 342,964 | | | 86,017 | | | 25 | % |
Total | | $ | 1,712,509 | | $ | 1,153,933 | | $ | 558,576 | | | 48 | % |
The pre-merger loan portfolios at Community and Blue Ball were similar in composition, with comparable credit quality attributes. As a consequence, the post-merger, combined loan profile was not substantially different than the historical loan profile of pre-merger Community at the end of 2004. The differences that did exist, such as Blue Ball’s lower concentration of consumer loans, were comparatively modest. The following table summarizes the relative mix of the loan portfolio between 2004 (pre-merger) and 2005 (post-merger):
| | | 2005 | | 2004 | |
| | | | | | | | |
| Commercial | | | 35 | % | | 35 | % |
| Commercial real estate | | | 33 | % | | 27 | % |
| Residential real estate | | | 7 | % | | 8 | % |
| Consumer | | | 25 | % | | 30 | % |
| Total | | | 100 | % | | 100 | % |
By excluding the loans added on the date of the merger, it was estimated that average loan balances would have grown by at least 12% from organic sources. Growth was also aided by loans added at Blue Ball during the first six months of 2005. For the last several years, the separate, pre-merger banks focused on leveraging their respective positions as two of the larger financial institutions that remained headquartered in the dynamic central Pennsylvania markets. Both companies had improved their visibility within core markets, particularly in the commercial and commercial real estate sectors. The addition of experienced lenders with long-term ties to the business communities in those markets enhanced the combined profile and increased access to additional commercial lending opportunities. Brisk activity in both construction and land development lending and in traditional commercial real estate financing contributed to substantial increases in these categories. Commercial lending activity continues to be driven almost exclusively by in-market transactions.
Residential real estate lending, which is composed primarily of loans to single-family creditors, has experienced a steady decline as a result of the increasing accessibility of secondary market liquidity through mortgage banking activities. Community-based banks continued to provide a convenient portal for consumers to access funding for residential lending, but most fixed-rate, conforming mortgages were sold into the secondary market. This strategy has reduced the interest rate risk associated with consumer preferences for long-term, fixed rate lending, and provided valuable liquidity for other forms of relationship lending. The influence of a cooling housing market in 2006 could limit, to some extent, the pace of mortgage lending activity in the near term.
Community has undertaken substantial efforts, particularly in recent years, to become a more competitive consumer lender within its historical footprint. Prior to the merger, Blue Ball had followed a more decentralized approach than Community in its efforts to escalate consumer lending volumes. In the post-merger environment, Community’s more centralized approach to consumer lending initiatives will be more fully integrated within the Blue Ball division. These efforts have been designed to identify consumer lending opportunities more proactively and to penetrate customer relationships more fully. The centralization of administration and oversight of consumer lending activities, inclusive of the Blue Ball division, is expected to result in a more strategic approach to expanded activity in the consumer lending sector.
Allowance for Loan Losses and Credit Quality
The following sets forth activity within the allowance for credit losses for the last three years.
| | | 2005 | | 2004 | | 2003 | |
| | | | | | | | | | | |
| Balance at January 1, | | $ | 14,421 | | $ | 13,178 | | $ | 12,343 | |
| Loans charged off | | | (2,323 | ) | | (2,910 | ) | | (2,839 | ) |
| Recoveries | | | 1,499 | | | 1,053 | | | 1,174 | |
| Provision charged to operations | | | 2,300 | | | 3,100 | | | 2,500 | |
| Allowance established for acquired credit risk | | | 7,068 | | | --- | | | --- | |
| Balance at December 31, | | $ | 22,965 | | $ | 14,421 | | $ | 13,178 | |
| | | | | | | | | | | |
| Allowance for credit losses to loans | | | 1.03 | % | | 1.19 | % | | 1.22 | % |
For the last several years, the credit quality profile of CommunityBanks has exhibited steady improvement, and the results for 2005 represented a continuation of these favorable trends. Despite the increase in credit risk that normally accompanies a rapidly growing loan portfolio, most loan quality metrics continued to reflect meaningful improvement from historical trends. The ratio of net charge-offs to loans for 2005 and 2004 was 0.05% and 0.16%, respectively. This performance was particularly notable as aggregate loan balances grew 16% in 2004 and 48% in 2005. As indicated earlier, the composition of the loans added as a result of the merger of Blue Ball had little impact on the overall credit risk profile, owing primarily to the similarity in the composition of loans at the two banks. More importantly, both the Community and Blue Ball franchises shared a common credit quality culture, evidenced by the favorable trends and metrics of the predecessor banks prior to the merger.
While the level of net charge-offs provides an important historical perspective, future prospects for sustaining asset quality can be better assessed by scrutinizing the level of problem credits and the relative coverage provided by the allowance for credit losses. At December 31, 2005, the allowance provided 2.53 times coverage of those loans included as non-accrual loans. At the end of 2004, this same ratio was 2.66 times. These measures, as well as a number of other key measures, serve to illustrate the prospects for sustaining the favorable credit quality profile of the post-combination loan portfolio.
The following sets forth loan loss experience for the last five years (in thousands):
| | | 2005 | | 2004 | | 2003 | | 2002 | | 2001 | |
| Loans at year-end | | $ | 2,234,497 | | $ | 1,215,951 | | $ | 1,078,611 | | $ | 904,568 | | $ | 857,278 | |
| | | | | | | | | | | | | | | | | |
| Average loans balance | | $ | 1,712,509 | | $ | 1,153,933 | | $ | 997,190 | | $ | 886,808 | | $ | 838,178 | |
| Balance, allowance for loan losses, January 1 | | $ | 14,421 | | $ | 13,178 | | $ | 12,343 | | $ | 12,132 | | $ | 10,328 | |
| | | | | | | | | | | | | | | | | |
| Loans charged off: | | | | | | | | | | | | | | | | |
| Commercial, financial and agricultural | | | 321 | | | 300 | | | 253 | | | 1,878 | | | 2,275 | |
| Real estate-commercial mortgage | | | 963 | | | 1,087 | | | 1,336 | | | 1,337 | | | 484 | * |
| Real estate-retail mortgage | | | 119 | | | 160 | | | 212 | | | 110 | | | --- | |
| Consumer and other | | | 920 | | | 1,363 | | | 1,038 | | | 855 | | | 1,017 | |
| | | | | | | | | | | | | | | | | |
| Total | | | 2,323 | | | 2,910 | | | 2,839 | | | 4,180 | | | 3,776 | |
| | | | | | | | | | | | | | | | | |
| Loans recovered: | | | | | | | | | | | | | | | | |
| Commercial, financial and agricultural | | | 286 | | | 324 | | | 240 | | | 644 | | | 120 | |
| Real estate-commercial mortgage | | | 703 | | | 240 | | | 606 | | | 7 | | | 108 | * |
| Real estate-retail mortgage | | | 68 | | | 17 | | | 83 | | | 18 | | | --- | |
| Consumer and other | | | 442 | | | 472 | | | 245 | | | 372 | | | 272 | |
| | | | | | | | | | | | | | | | | |
| Total | | | 1,499 | | | 1,053 | | | 1,174 | | | 1,041 | | | 500 | |
| | | | | | | | | | | | | | | | | |
| Net charge-offs | | | (824 | ) | | (1,857 | ) | | (1,665 | ) | | (3,139 | ) | | (3,276 | ) |
| | | | | | | | | | | | | | | | | |
| Provision for loan losses | | | 2,300 | | | 3,100 | | | 2,500 | | | 3,350 | | | 5,080 | |
| | | | | | | | | | | | | | | | | |
| Allowance established for acquired credit risk | | | 7,068 | | | --- | | | --- | | | --- | | | --- | |
| | | | | | | | | | | | | | | | | |
Balance, allowance for loan losses, December 31 | | $ | 22,965 | | $ | 14,421 | | $ | 13,178 | | $ | 12,343 | | $ | 12,132 | |
| | | | | | | | | | | | | | | | | |
| Net charge-offs to loans at year end | | | 0.04 | % | | 0.15 | % | | 0.15 | % | | 0.35 | % | | 0.38 | % |
| | | | | | | | | | | | | | | | | |
| Net charge-offs to average loans | | | 0.05 | % | | 0.16 | % | | 0.17 | % | | 0.35 | % | | 0.39 | % |
| | | | | | | | | | | | | | | | | |
Balance of allowance for loan losses to loans at year end | | | 1.03 | % | | 1.19 | % | | 1.22 | % | | 1.36 | % | | 1.42 | % |
* Prior breakouts of historical information could not be readily reconstructed from predecessor banks’ records. Breakouts from 2001 are assumed to approximate current mix trends. |
The ratio of the allowance to loans declined significantly from 1.19% at the end of 2004 to 1.03% at the end of 2005. As previously noted, Community applied the provisions of SOP 03-3, which governs the accounting treatment for expected differences between contractual cash flows and expected cash flows from loans acquired in a transfer if differences are due, at least in part, to credit quality. This SOP prohibits “carrying over’ valuation allowances in the initial accounting of all loans acquired in a purchase business combination and was effective for years beginning after December 15, 2004.
The application of this new guidance to those loans acquired from Blue Ball was the primary impetus for the reduction in the ratio of the allowance to loans from 1.19% to 1.03%. The review of acquired loans with credit quality issues produced a difference of $2.7 million between contractual cash flows and the estimate of expected cash flows. This difference was recorded as an adjustment of the carrying value of those loans and was excluded from the allowance.
While the “allowance to loans” ratio of 1.03% is the accepted GAAP measure, inclusion of the adjustment associated with SOP 03-3 in the allowance would have resulted in a comparable non-GAAP ratio of 1.15%.
The allowance for loan losses is based upon management’s continuing evaluation of the loan portfolio. Each quarter, a review is performed to address loan quality, current macro-economic conditions and delinquency status. The provision for loan losses is adjusted quarterly based upon that review. The following table presents an allocation by loan categories of the allowance for loan losses at December 31 for the last five years.
| | | 2005 | | 2004 | | 2003 | | 2002 | | 2001 | |
Loans: | | | | | | | | | | | | | | | | |
Commercial, financial and agricultural | | $ | 13,632 | | $ | 7,899 | | $ | 7,090 | | $ | 6,305 | | $ | 9,285 | |
Real estate-construction | | | --- | | | --- | | | --- | | | --- | | | 10 | |
Real estate-mortgage | | | 2,186 | | | 2,099 | | | 2,313 | | | 1,936 | | | 965 | |
Installment | | | 3,520 | | | 3,202 | | | 2,184 | | | 1,767 | | | 1,030 | |
Unallocated | | | 3,627 | | | 1,221 | | | 1,591 | | | 2,335 | | | 842 | |
| | | | | | | | | | | | | | | | | |
| Balance | | $ | 22,965 | | $ | 14,421 | | $ | 13,178 | | $ | 12,343 | | $ | 12,132 | |
The Corporation’s allowance for loan losses is based upon management’s quarterly review of loans utilizing a consistent valuation methodology. The purpose of the review is to assess loan quality, identify impaired loans, analyze delinquencies, ascertain loan growth, evaluate potential charge-offs and recoveries, and assess general economic conditions in the markets served. Commercial and commercial real estate loans are individually risk-rated by the Corporation’s loan officers and periodically reviewed by independent loan review personnel. Consumer and residential real estate loans are generally analyzed in homogeneous pools utilizing historical loan charge-off information.
To determine the allowance and corresponding loan loss provision, an amount is allocated to specific loans. For certain commercial and construction loans, this amount is based upon specific borrower data and supporting collateral determined by reviewing individual non-performing, delinquent, or potentially-troubled credits. For the majority of the loans that are individually reviewed for impairment, this analysis is based on a comparison of the loan’s carrying amount to the net realizable value of the collateral. The portion of the allowance attributable to specific impaired loans was $1.8 million at December 31, 2005. The remaining commercial, consumer, and residential real estate loans are evaluated as part of various pools. These pool reserves are based upon historical charge-offs and delinquency history, other known trends and expected losses over the remaining lives of these loans, as well as the condition of local, regional and national economies and other qualitative factors.
To ensure a higher degree of confidence in the adequacy of the allowance, a portion is considered unallocated. The unallocated portion of the allowance is intended to provide for: (1) probable losses that are not otherwise identifiable; (2) possible imprecise estimates in assessing potential losses on commercial loans or in the calculation of pool reserves; and (3) the extenuating influence of extraneous factors, such as economic uncertainties. This unallocated portion is available to absorb losses sustained anywhere within the loan portfolio. The combined allocated and unallocated portions bring the total allowance to an amount deemed prudent and reasonable by management at that time.
The allowance of $23.0 million at December 31, 2005, increased $8.5 million from December, 2004, due principally to establishing pool reserves of $7.1 million for loans acquired in the Blue Ball merger. The remaining increase resulted from quarterly adjustments under the processes described above. The unallocated portion of the allowance increased to $3.6 million at December 31, 2005, from $1.2 million at December 31, 2004, reflecting management’s consideration of the factors necessary to maintain a prudent and reasonable total allowance, particularly with the addition of approximately $840 million of loans in the Blue Ball merger.
The following sets forth information regarding various segments of the loan portfolio, collectively referred to as risk elements. These segments include both nonperforming assets and those loans past due for 90 days or more. Non-performing assets include non-accrual loans, restructurings, and other real estate. Non-accrual loans are loans for which interest income is not accrued due to concerns about the collection of interest and/or principal. Restructured loans may involve renegotiated interest rates, repayment terms, or both, because of deterioration in the financial condition of the borrower. Substantially all of the credits that would have qualified as restructured loans at the end of both years were already classified in the more severe non-accrual category. The following table provides a comparative summary of nonperforming assets and total risk elements at the end of each of the last five years.
| | | 2005 | | 2004 | | 2003 | | 2002 | | 2001 | |
| Loans on which accrual of interest has been discontinued: | | | | | | | | | | | | | | | | |
Commercial, financial and agricultural | | $ | 1,834 | | $ | 1,748 | | $ | 3,066 | | $ | 2,257 | | $ | 3,783 | |
Mortgages | | | 7,105 | | | 2,894 | | | 4,054 | | | 6,609 | | | 6,952 | |
Other | | | 121 | | | 786 | | | 1,031 | | | 527 | | | 355 | |
| Total non-accrual loans | | | 9,060 | | | 5,428 | | | 8,151 | | | 9,393 | | | 11,090 | |
| | | | | | | | | | | | | | | | | |
| Foreclosed real estate | | | 1,447 | | | 2,094 | | | 4,865 | | | 1,183 | | | 631 | |
| | | | | | | | | | | | | | | | | |
| Total non-performing assets | | | 10,507 | | | 7,522 | | | 13,016 | | | 10,576 | | | 11,721 | |
| Loans past due 90 days or more: | | | | | | | | | | | | | | | | |
Commercial, financial and agricultural | | | --- | | | --- | | | 4 | | | 97 | | | 1,002 | |
Mortgages | | | 6 | | | --- | | | 40 | | | 770 | | | 405 | |
Consumer and other | | | 16 | | | --- | | | 46 | | | 94 | | | 252 | |
| | | | | | | | | | | | | | | | | |
| | | | 22 | | | --- | | | 90 | | | 961 | | | 1,659 | |
| | | | | | | | | | | | | | | | | |
| Total risk elements | | $ | 10,529 | | $ | 7,522 | | $ | 13,106 | | $ | 11,537 | | $ | 13,380 | |
| | | | | | | | | | | | | | | | | |
| Ending allowance for loan losses | | $ | 22,965 | | $ | 14,421 | | $ | 13,178 | | $ | 12,343 | | $ | 12,132 | |
| | | | | | | | | | | | | | | | | |
| Ending allowance to non-accrual loans | | | 253 | % | | 266 | % | | 162 | % | | 131 | % | | 109 | % |
The increase in non-performing assets was almost entirely due to non-accrual loans added in connection with the merger. From an historical perspective, both Community and Blue Ball experienced modest levels of non-performing assets in recent years. Consequently, the combination of the two banks yielded a combined improvement in the relative level of non-performing assets. With the addition of Blue Ball, the year-end ratio of non-performing assets to period-end loans actually declined from 0.62% at the end of 2004 to 0.47% at the end of 2005. Of a total of $10.5 million in nonperforming assets, nearly $9.1 million were classified as non-accrual loans. The determination to discontinue the accrual of interest on non-performing loans is made on a case-by-case basis. Factors such as the character and size of the loan, quality of the collateral and the historical creditworthiness of the borrower and/or guarantors are considered by management in assessing the collectibility of such amounts.
The approximate amount that would have been accrued on those loans for which interest was discontinued in 2005 was $425,000.
Community has considered all of the above factors in the establishment of the allowance for loan losses. The determination as to the adequacy of the allowance reflects management’s judgment, and was based upon collateral, local market conditions, various estimates, and other information that requires subjective analysis. These factors, which are prone to change, are monitored by management to evaluate their potential impact on management’s assessment of the adequacy of the allowance. Based on its evaluation of loan quality, management believes that the allowance for loan losses at December 31, 2005 was adequate to absorb probable losses within the loan portfolio.
Intangible Assets
Community recorded $255 million of intangible assets in connection with the merger of Blue Ball, including $13 million in core deposit intangibles. The Corporation had recorded intangibles of $4.9 million from previous mergers, primarily from acquisitions of various integrated financial services companies. The acquisitions of these companies expanded Community’s ability to meet specialized customer needs in the areas of title insurance, mortgage brokerage services, property and casualty insurance, and other important financial services.
Under current GAAP, goodwill is no longer amortized as a charge to earnings. Instead, such amounts are evaluated for impairment on an annual basis. Other intangible assets, such as core deposit intangibles and acquired customer lists, must be recognized as an asset separate and distinct from goodwill and must be amortized over their expected useful lives. During 2005, Community recorded $1.4 million of intangible amortization, the majority of which related to amortization of the core deposit intangible arising from the acquisition of Blue Ball.
Intangible assets are generally excluded from the computation of the various regulatory capital ratios. At the end of 2005, Community reported capital ratios well within the guidelines that have been established to qualify as a “well-capitalized” financial institution. Intangible levels, therefore, are deemed to be well within acceptable guidelines. See the section entitled “Capital Adequacy” for further discussion.
Other Assets
The July 1 merger with PennRock and expansion of ongoing business activity resulted in increases in other asset categories from December 31, 2004 to December 31, 2005: cash and due from banks increased $33 million from $44 million to $77 million; premises and equipment increased $17 million from $26 million to $43 million; and accrued interest receivable and other assets increased $50 million from $56 million to $106 million.
Deposits
Deposit balances remain the primary source of funding for financial institutions. Total funding sources included both deposits and various forms of short-term and long-term wholesale borrowings. At the end of 2005, deposits represented 81% of total funding sources. This was an increase from the end of 2004, when deposits were 73% of total funding sources. The heavier weighting of deposit funding resulted from the impact of the Blue Ball acquisition and from the de-leveraging strategy, both of which contributed to reductions in Community’s dependence on wholesale funding. The following table presents the growth in average deposit balances as 2005 amounts include deposits added from Blue Ball for the last half of the year.
| | | | | | | Change | |
| | | 2005 | | 2004 | | Amount | | % | |
| | | | | | | | | | | | | | |
| Demand | | $ | 271,319 | | $ | 178,084 | | $ | 93,235 | | | 52 | % |
| Savings & NOW accounts | | | 683,316 | | | 495,968 | | | 187,348 | | | 38 | % |
| Time | | | 701,776 | | | 510,046 | | | 191,730 | | | 38 | % |
| Time $100,000 or more | | | 150,820 | | | 111,879 | | | 38,941 | | | 35 | % |
| | | $ | 1,807,231 | | $ | 1,295,977 | | $ | 511,254 | | | 39 | % |
As with loan balances, growth in deposit funding consisted of both “acquired” growth and “organic” growth. It was estimated that organic growth in deposits was between 5% and 6% during 2005. As previously discussed, organic loan growth was near 12% and exceeded organic deposit growth, creating a funding shortfall. For much of the year, Community utilized scheduled runoff in the investment portfolio to fund loan growth, obviating the need to aggressively pursue deposit growth as interest rates rose. As with loans, the composition of deposits was substantially the same in pre-merger 2004 as it was in post-merger 2005. The following table presents the average mix of deposits for the last two years:
| | | 2005 | | 2004 | |
| | | | | | | | |
| Demand | | | 15 | % | | 14 | % |
| Savings & NOW accounts | | | 38 | % | | 38 | % |
| Time | | | 39 | % | | 39 | % |
| Time $100,000 or more | | | 8 | % | | 9 | % |
| | | | 100 | % | | 100 | % |
Consumer preferences continued to be weighted in favor of maintaining adequate liquidity in anticipation of further interest rates increases. During much of 2005, consumers were largely unresponsive to incremental rate premiums on deposit categories with longer maturities. Expectations of further increases in the general level of interest rates continue to drive a preference for liquidity and an aversion to “locking up” funds in longer-term maturity categories. Consumers seem to believe that conditions such as the national budget deficit, higher oil prices, and other inflationary pressures are likely to result in more favorable pricing on deposits in the future. Furthermore, the relatively flat yield curve provided little incentive to extend maturities as rate premiums on longer maturities offered only a modest yield enhancement over short term rates.
The following table summarizes the maturity distribution of time deposits of $100,000 or more as of December 31, 2005 (in thousands).
Remaining Time to Maturity: | | | |
Less than three months | | $ | 24,831 | |
Three months to six months | | | 24,742 | |
Six months to twelve months | | | 60,922 | |
More than twelve months | | | 80,530 | |
| | | $ | 191,025 | |
Borrowed Funds
Community makes tactical use of Federal Home Loan Bank (FHLB) advances and other borrowed funds to augment its funding needs. The largest component of borrowed funds comes from FHLB advances. FHLB borrowings, which are collateralized by residential mortgages or other qualified securities, include a variety of credit products available to Community through its membership in the Federal Home Loan Bank. The use of advances and borrowed funds is a by-product of Community’s overall asset / liability management strategy and is influenced by a number of factors, which are discussed more fully in the section titled “Asset / Liability Management and Liquidity”. At the end of 2005, the Corporation had the capacity to borrow an additional $498 million from the FHLB.
Capital Adequacy
Capital strength is an important gauge to assess the overall stability of a financial institution. A strong capital base is a prerequisite for sustaining franchise growth through both internal expansion and strategic acquisition opportunities. Regulatory authorities impose constraints and restrictions on bank capital levels that are designed to help ensure the vitality of the nation’s banking system.
| · | Capital Management Policy |
Community believes that capital is a valuable, albeit limited resource whose availability moderates with changes in the business cycle. The Corporation has developed an extensive capital management policy designed to consider all aspects of capital management. This policy is mindful of the responsibilities to Community’s shareholders, employees, regulators, and other constituencies to ensure that capital is well-managed. The policy considers the impact of numerous capital management issues, including: the maintenance of key financial ratios; the need for an adequate return to shareholders in terms of both dividend payout and capital appreciation; the flexibility to apply techniques that will accommodate either equity expansion or contraction; and the restraint required to avoid accumulation of unsustainable levels of intangible assets. Community also continuously examines its options with regard to capital management in the context of intrinsic factors, including its prospects for growth, the potential for earnings disruption, and others. Maintenance of appropriate capital levels may require the application of techniques designed to help Community meet or exceed regulatory guidelines and to correlate capital levels with a given asset growth rate. The Corporation’s capital management and planning process is reviewed and approved by its Board of Directors.
In addition to internal guidelines, regulators have established standards for the monitoring and maintenance of appropriate levels of capital for financial institutions. All regulatory capital guidelines are based upon a risk-based supervisory approach that has been designed to ensure effective management of capital levels and associated business risk. Regulatory capital guidelines continue to evolve and financial institutions are anticipating the implementation of new standards from the Basel II accords in the not-too-distant future. The following table provides the current risk-based capital positions of Community and its principal banking subsidiary at the end of 2005, along with an indication of the current regulatory capital requirements.
| | | December 31, 2005 | | “Well Capitalized” | | “Regulatory Minimums” | |
| Leverage ratio | | | | | | | | | | |
Community Banks, Inc. | | | 8.2 | % | | 5 | % | | 4 | % |
Bank only | | | 8.0 | % | | 5 | % | | 4 | % |
| | | | | | | | | | | |
| Tier 1 capital ratio | | | | | | | | | | |
Community Banks, Inc. | | | 10.1 | % | | 6 | % | | 4 | % |
Bank only | | | 9.8 | % | | 6 | % | | 4 | % |
| | | | | | | | | | | |
| Total risk-based capital ratio | | | | | | | | | | |
Community Banks, Inc. | | | 11.0 | % | | 10 | % | | 8 | % |
Bank only | | | 10.7 | % | | 10 | % | | 8 | % |
The merger of Blue Ball presented special capital management challenges related to intangibles and their influence on capital levels. Despite the addition of $255 million of intangible assets, tangible capital levels following the merger of Blue Ball remained sufficient to ensure Community’s classification as a “well capitalized” institution.
The primary source of capital is earnings and, more specifically, earnings retention. Earnings retention is composed of quarterly earnings minus regular cash dividends to shareholders. Throughout 2005, the Corporation’s earnings trends supported a return of capital to existing shareholders in the form of a quarterly cash dividend.
Capital management is influenced primarily by earnings retention, but can be augmented by a number of other strategies designed to ensure that capital levels are maintained at optimum levels. In addition to cash dividends, another efficient means of returning capital to shareholders involves share repurchase, which reduces the level of capital by purchasing common shares in the open market. Following the merger, the Corporation announced two separate share repurchase plans in the third and fourth quarters. The third quarter plan called for the repurchase of 500,000 shares and was completed by October of 2005. The fourth quarter plan called for an additional 750,000 shares and resulted in the purchase of just over 65,000 shares before the end of 2005.
Capital management is also considerate of techniques that can be used to increase capital levels. At the end of both 2002 and 2003, Community executed separate issuances of $15.5 million of trust preferred stock. Total trust preferred balances remained at $30.9 million as of the end of 2005. These issuances of trust preferred stock qualified as “Tier 1 capital” (while meeting certain regulatory limitations) and are classified as long-term debt for financial statement purposes. In January of 2006, the Corporation issued approximately $20 million of additional trust preferred stock at favorable terms. Community will continue to make use of this and various other strategies and techniques to ensure an efficient use of this valuable resource and to maintain capital at levels that are considerate of its operating risk profile.
ASSET/LIABILITY MANAGEMENT AND LIQUIDITY
The process by which financial institutions manage earning assets and funding sources under different interest rate environments is called asset/liability management. The primary goal of asset/liability management is to increase net interest income through the prudent control of market risk, liquidity, interest rate risk and capital. Two important barometers of performance are net interest margin and liquidity. Net interest margin is increased by widening interest spread while controlling interest rate sensitivity. The adequacy of liquidity is determined by the ability to meet the cash flow requirements of both depositors and customers requesting credit. The Board of Directors and the Audit Committee of the Board govern and monitor asset/liability management processes and liquidity as part of the overall risk management process. The responsibility for management of these processes is delegated to the corporate Asset/Liability Management Committee (ALCO), which must adhere to parameters established in the Board-approved Asset / Liability Management Policy.
Liquidity
Liquidity is defined as the ability to meet maturing obligations and customers’ demand for funds on a continuous basis. Appropriate liquidity exists when an entity can meet its potential cash obligations without liquidating its franchise assets. Poor liquidity exists when a company lacks the liquid assets to cover short term liabilities. Liquidity is sustained by stable core deposits, a diversified mix of liabilities, strong credit perception and the presence of sufficient assets convertible to cash without material loss or disruption of normal operations. Adequate liquidity could contract if there were reversals in the historical trends that have contributed to the stability and growth of Community’s deposit base. The Corporation actively manages liquidity within a defined range and has developed reasonable liquidity contingency plans, ensuring the availability of alternate funding sources that are sufficient to maintain adequate liquidity under a variety of business conditions. The Corporation’s investing and financing activities are conducted within the overall constraints of its liquidity management policy and practices.
Rate Shock Simulation
Community utilizes a variety of techniques to assist management and the Board of Directors in the management and monitoring of interest rate risk. In order to quantify the impact of changes in interest rates on net interest income, the Corporation conducts quarterly interest rate shock simulations that project the impact of interest rate changes on net interest income over the next year. These simulations are utilized to assess whether management should consider corrective actions in order to minimize Community’s exposure or vulnerability to a particular trend in interest rates.
Management has established acceptable tolerance limits for the impact of changes in interest rates on the volatility of net interest income, and is authorized to pursue mitigating strategies in order to minimize unfavorable impact under a variety of scenarios. Such simulations are conducted under a variety of assumptions that require estimates of the velocity and extent of interest rate changes, including an assessment of the impact of such changes on those assets and liabilities that have indeterminate maturity or repricing characteristics. The impact of rate changes on revenue performance can be estimated, but such estimates remain vulnerable to unexpected or nontraditional shifts in interest rate dynamics.
Simulation of earnings is used primarily to measure Community’s earning exposure for the ensuing year. This exposure is estimated under assumptions which assume a parallel shift in the yield curve. The Asset / Liability Management Policy limits unfavorable exposure of simulated net interest income to 10% of the base case net interest income in either a rising or falling rate “shock” scenario (immediate repricing) of 200 basis points. The following is a summary of the rate “shock” results conducted under these various assumptions as December 31, 2005:
Simultaneous Rate “Shock” | Annual Change in Net Interest Income | % Change |
| | | |
| +300bp | + $3.2 million | + 3.01% |
| +200bp | + $2.7 million | + 2.50% |
| +100bp | + $1.7 million | + 1.57% |
| -100bp | - $2.0 million | - 1.87% |
GAP and EVE
Management augments its simulation process with two other techniques, GAP analysis and economic value of equity (EVE) computations. The most practical tool for day-to-day management of interest rate risk is GAP analysis, which provides an array of timeframes during which earning assets and funding sources can be expected to mature or reprice. This information is ordinarily examined in the context of the results derived from the quarterly rate shock simulations. Management uses such information to identify specific “cause and effect” relationships that can be reviewed, analyzed, managed, or changed to ensure maximization of net revenue from intermediation activities. The combination of GAP analysis and rate shock simulations provides the most practical measurement tools for monitoring and managing of the largest source of revenue for community banks. As with the simulation or “shock” analysis, Community has established a policy limit for the cumulative twelve month GAP of “plus or minus” 15% of total assets. At December 31, 2005, the twelve month GAP fell well within this policy limit for each of the time intervals less than one year, as shown in the following summary:
Interval | Cumulative GAP (Expressed as % of Assets) |
| | |
| 0-90 days | +10.65% |
| |
| 91-180 days | +8.79% |
| |
| 181-365 days | +4.91% |
EVE computations provide a longer-term assessment of interest rate risk, but are more practical for evaluating long-term, strategic decision-making. EVE has several limitations, including: (1) the intrinsic value of assets and liabilities does not necessarily represent the fair value of financial instruments since it does not include credit risk and liquidity; (2) estimated cash flows are required for non-maturity financial instruments and are, by their nature, inexact; and (3) the future structure of Community’s balance sheet does not consider increased loan and deposit activities from core business within its present value assessment.
The results derived from EVE computations, however, provide a valuable framework for managing longer-term balance sheet exposures and interest rate volatility trends. At the end of 2005, all measures of EVE fell within the policy limits established via the asset/liability management policy, as approved by the Board of Directors.
CONTRACTUAL OBLIGATIONS
Significant contractual obligations at December 31, 2005 are summarized in the following table:
| | | Payments due by period | |
Dollars in thousands | | Total | | Less than 1 year | | 1-3 years | | 3-5 years | | More than 5 years | |
| | | | | | | | | | | | |
| Long-term debt | | $ | 430,719 | | $ | 77,963 | | $ | 86,161 | | $ | 60,342 | | $ | 206,253 | |
| Operating lease obligations | | | 24,805 | | | 1,682 | | | 2,745 | | | 2,495 | | | 17,883 | |
| Subordinated debt | | | 30,928 | | | --- | | | --- | | | --- | | | 30,928 | |
| Time deposits | | | 1,076,423 | | | 606,186 | | | 319,147 | | | 148,916 | | | 2,174 | |
| | | | | | | | | | | | | | | | | |
| Total | | $ | 1,562,875 | | $ | 685,831 | | $ | 408,053 | | $ | 211,753 | | $ | 257,238 | |
OFF-BALANCE-SHEET COMMITMENTS
As of December 31, 2005, the Corporation had unfunded commitments totaling $695 million. For details of these off-balance-sheet commitments, see “Notes to Consolidated Financial Statements - Commitments and Contingencies” included in Part II, Item 9.
REGULATORY MATTERS
Community and its affiliates are subject to periodic examinations by the various regulatory agencies. These examinations include, but are not limited to, procedures designed to review lending practices, risk management, credit quality, liquidity, compliance and capital adequacy. During 2005, the Federal Deposit Insurance Corporation and the Federal Reserve Bank conducted examinations of Community and its banking subsidiaries pursuant to their regular, periodic regulatory reviews. No comments were received from these various bodies that would have a material adverse effect on Community’s liquidity, capital resources, or operations.
INFLATION
Community’s ability to cope with the impact of inflation is best measured by its ability to respond to changing interest rates and manage non-interest income and expense. Within its ALCO processes, the Corporation manages the mix of interest rate-sensitive assets and liabilities in order to limit the impact of changing interest rates on net interest income. Inflation also has a direct impact on non-interest income and expense such as service fee income, salary and benefits expenses, and other overhead expenses. Inflationary pressures over the last several years have been modest, though more recent trends suggest the potential for emerging inflationary pressure. Management will continue to monitor the potential for inflation and its impact on the pricing of products and services.
PERFORMANCE REVIEW: 2004 VERSUS 2003
Net income reached $21.8 million, a 7.0% increase from the net income of $20.4 million reported in 2003. Similarly, earnings per share reached $1.73 per share, a 6.1% improvement from the $1.63 reported in 2003. Return on average assets (ROA) and return on average equity (ROE) provided traditional benchmarks used to compare the relative operating performance of financial service companies. At the end of 2004, the Corporation produced an ROA of 1.12% and an ROE of 14.96%, which was comparable to the performances of 1.15% and 15.03%, respectively, in the prior year.
The primary driver of performance in 2004 was loan and deposit growth. While the opportunity for improved pricing and expanded interest spread was undermined by the compression of interest rates, Community’s ability to achieve organic growth, which includes market share penetration, resulted in an expansion of net interest income. The Corporation benefited from marketing efforts in its core markets and from its position as one of the larger franchises to sustain a deliberate and concentrated focus on central Pennsylvania. Loans grew 15.7% and deposits rose 10.1% and such growth contributed substantially to a 7.2% increase in net interest income.
Interest Income /Earning Assets
Interest income was $106.3 million in 2004 as compared to the $101.2 million recorded in 2003. This represented growth of 5.1% and was achieved despite the fact that earning asset yields declined from 6.02% in 2003 to 5.80% in 2004. From 2003 to 2004, earning assets grew $151.7 million, including $155.0 million in loans. Such growth was offset by a slight decline in investment portfolio balances. Growth in loans accelerated during the year and was funded by normal runoff in the investment portfolio and by a $118.6 million increase in the level of deposits, primarily in Community’s successful Power Checking offering. As in recent years, loan growth was focused in the commercial and commercial real estate categories and was augmented by continued penetration of the consumer home equity market.
Interest Expense / Funding Sources
Interest expense grew modestly during the year despite the overall growth in funding sources. The overall cost of funding, like the yield on earning assets, declined from 2.89% in 2003 to 2.70% in 2004. This decline in the relative cost of funds substantially offset the impact of increased funding levels on interest expense growth. Interest expense rose from $42.4 million in 2003 to just $43.2 million in 2004, a modest change of only $0.9 million. Total interest-bearing funding grew by $139.5 million and, combined with the growth in non-interest funds, provided substantially all of the funding needed for the $155.0 million in loan growth. Consumer preferences for liquidity and flexibility resulted in an increase in Community’s popular Power Checking account offering, which grew by $102.5 million and was the primary driver of overall deposit growth.
Community continued to make strategic use of other forms of funding in order to meet the consistent demand for credit extension that occurred throughout the year. During the year, Community made efforts to strategically realign its balance sheet. To this end, the Corporation gradually reduced its dependence on selected short-term funding sources, such as overnight fed funds, which are sensitive to increases in short term interest rates. At various times during the year, Community also increased its long-term borrowings, which are composed principally of term funding available through the Federal Home Loan Bank programs. This strategy permitted Community to “lock in” longer-term funds at or near a potential trough in the interest rate cycle.
Interest Spread and Net Interest Margin
As a result of rate trends and other dynamics specific to Community’s balance sheet, the Corporation reported a modest decline in net interest spread from 3.13% in 2003 to 3.10% in 2004, and a decline in net interest margin from 3.50% to 3.44% over the same period. The decline in margin was also linked to the impact of reduced contribution from non-interest funding sources, which declined from 0.37% to 0.34%.
Non-Interest Income
The continued expansion of banking service offerings also provided an increase to revenue in the form of higher non-interest income. The more widespread acceptance of the “OverdraftHonor” program and the success of other fee-based product distribution initiatives, including annuity sales, brokerage services and insurance-related commissions, provided measurable revenue expansion and income stream diversification. Community also recorded substantial increases in gains from the sale of portfolio securities, primarily gains from the sale of bank stocks. Recognition of these gains was coordinated with expanded marketing efforts to increase the visibility of the Community franchise. Community also decided to sell its credit card portfolio at a gain. The maturity of the mono-line credit card industry, combined with the relatively small size of the Corporation’s portfolio, created overwhelming competitive and scale disadvantages that precipitated the sale.
Offsetting these gains and other revenue expansion trends was the impact of subdued mortgage refinancing activity. Industry-wide, gains and fees from home mortgage refinancing declined. At the same time, purchase activity waned in the wake of a tepid economy and the concern over higher interest rates. Complementary fee-based activities, such as title and settlement services, also receded, due in some measure to the outsized mortgage origination activity experienced in previous years. The net effect of these offsetting trends was a 12% increase in income from non-interest sources (excluding security gains), and an 18% increase excluding nonrecurring gains from both years.
Provision for Loan Losses
The provision for loan losses was $3.1 million, which was only slightly higher than the provision of $2.5 million recorded in 2003. The relationship of the allowance to loan losses declined, albeit modestly, from 1.22% in 2003 to 1.19% in 2004. Community has experienced steadily improving metrics in loan quality, including net charge-offs to loans of only 0.16% in 2004. At the same time, the coverage of problem credits provided by the allowance reached 266%. As a consequence of these favorable trends, the increase in the provision for loan losses grew modestly, despite substantial growth in loan balances.
Non-Interest Expenses
Aggregate non-interest expenses grew to $50.0 million in 2004 compared to $45.7 in 2003, an increase of $4.3 million or 9.4%. The pace of growth in non-interest expenses was influenced by additional expenses from those businesses acquired in 2003 that were integrated with existing financial service activities. Because 2004 represented the first full year of operations for these businesses, half of the growth in non-interest expenses was directly attributable to the incremental expenses incurred from 2003 (partial year) to 2004 (full year). Excluding the growth attributed to the full year absorption of expenses from acquired businesses, adjusted year-over year increases totaled $2.1 million. This increase represented a more modest 4.7% increase in operating expenses from 2003.
Non-interest expenses in 2004 were also adversely impacted by increased marketing efforts, including both image and product specific advertising. Community, like most publicly-traded companies, also experienced another layer of regulatory burden in the form of compliance costs arising out of the Sarbanes-Oxley Act of 2002 (SOX), including specific increases associated with Section 404 of SOX. Despite these challenges, overall operating expenses grew only modestly as a result of close management of incremental spending during 2004. Concern over the impact of a compressed margin and less robust non-interest revenue projections in areas like mortgage banking necessitated more proactive and strategic cost control efforts, including temporary delays of office openings originally planned for 2004.
Income taxes grew from $4.4 million in 2003 to $4.9 million in 2004, an increase of nearly 12%. This increase was commensurate with the increase in pretax income, resulting in an effective tax rate of approximately 18% in both years.
The following tables are provided as a supplement to Management’s Discussion and Analysis of Financial Condition and Results of Operations:
| · | Distribution of Assets, Liabilities and Stockholders’ Equity; Interest Rates and Interest Differential |
| · | Rate/Volume Analysis - Tax Equivalent Basis |
| · | Loan Account Composition as of December 31, 2005, 2004, 2003, 2002, and 2001. |
| · | Maturities and Sensitivity to Changes in Interest Rates for Commercial, Financial, and Agricultural Loans as of December 31, 2005. |
Distribution of Assets, Liabilities, and Stockholders’ Equity; Interest Rates and Interest Differential | |
| | | | | | | | | | | | | | | | | | | | |
Income and Rates on a Tax Equivalent Basis (b) for the Years Ended December 31, 2005, 2004, and 2003 | |
| | | | | | | | | | | | | | | | | | | | |
| | | 2005 | | 2004 | | 2003 | |
| | | Average Balance(c) | | Interest Income/ Expense(a) | | Average Rates Earned/ Paid (a) | | Average Balance(c) | | Interest Income/ Expense(a) | | Average Rates Earned/ Paid (a) | | Average Balance(c) | | Interest Income/ Expense(a) | | Average Rates Earned/ Paid (a) | |
Assets: | | | | | | | | | | | | | | | | | | | |
| Earning assets: | | | | | | | | | | | | | | | | | | | | | | | | | | | | |
Interest-bearing deposits in other banks | | $ | 39,241 | | $ | 1,315 | | | 3.35 | % | $ | 2,325 | | $ | 20 | | | 0.86 | % | $ | 1,160 | | $ | 9 | | | 0.78 | % |
Investment securities: | | | | | | | | | | | | | | | | | | | | | | | | | | | | |
Taxable | | | 392,962 | | | 17,904 | | | 4.56 | | | 456,478 | | | 19,624 | | | 4.30 | | | 466,316 | | | 18,607 | | | 3.99 | |
Tax-exempt (b) | | | 221,960 | | | 16,514 | | | 7.44 | | | 209,170 | | | 15,856 | | | 7.58 | | | 207,627 | | | 15,957 | | | 7.69 | |
Total investment securities | | | 614,922 | | | | | | | | | 665,648 | | | | | | | | | 673,943 | | | | | | | |
Federal funds sold | | | 19,732 | | | 583 | | | 2.95 | | | 7,801 | | | 117 | | | 1.50 | | | 4,015 | | | 40 | | | 1.00 | |
Loans (b) (d) | | | 1,714,536 | | | 113,140 | | | 6.60 | | | 1,156,107 | | | 70,721 | | | 6.12 | | | 1,001,086 | | | 66,604 | | | 6.65 | |
Total earning assets | | | 2,388,431 | | | 149,456 | | | 6.26 | | | 1,831,881 | | | 106,338 | | | 5.80 | | | 1,680,204 | | | 101,217 | | | 6.02 | |
| Cash and due from banks | | | 48,721 | | | | | | | | | 37,316 | | | | | | | | | 36,451 | | | | | | | |
| Allowance for loan losses | | | (18,903 | ) | | | | | | | | (14,156 | ) | | | | | | | | (13,016 | ) | | | | | | |
| Premises, equipment, and other assets | | | 250,356 | | | | | | | | | 86,055 | | | | | | | | | 77,040 | | | | | | | |
Total assets | | $ | 2,668,605 | | | | | | | | $ | 1,941,096 | | | | | | | | $ | 1,780,679 | | | | | | | |
| | | | | | | | | | | | | | | | | | | | | | | | | | | | | |
Liabilities: | | | | | | | | | | | | | | | | | | | | | | | | | | | | |
| Interest-bearing liabilities: | | | | | | | | | | | | | | | | | | | | | | | | | | | | |
Savings deposits | | $ | 206,678 | | | 1,027 | | | 0.50 | | $ | 167,428 | | | 413 | | | 0.25 | | $ | 164,207 | | | 690 | | | 0.42 | |
Money market deposits | | | 181,279 | | | 3,668 | | | 2.02 | | | 62,591 | | | 377 | | | 0.60 | | | 74,156 | | | 624 | | | 0.84 | |
NOW accounts | | | 295,359 | | | 4,809 | | | 1.63 | | | 265,949 | | | 3,484 | | | 1.31 | | | 163,442 | | | 2,006 | | | 1.23 | |
Time deposits: | | | | | | | | | | | | | | | | | | | | | | | | | | | | |
$100,000 or greater | | | 150,820 | | | | | | | | | 111,879 | | | | | | | | | 110,231 | | | | | | | |
Other | | | 701,776 | | | | | | | | | 510,046 | | | | | | | | | 498,005 | | | | | | | |
Total time deposits | | | 852,596 | | | 26,927 | | | 3.16 | | | 621,925 | | | 18,249 | | | 2.93 | | | 608,236 | | | 19,777 | | | 3.25 | |
Total interest-bearing deposits | | | 1,535,912 | | | | | | | | | 1,117,893 | | | | | | | | | 1,010,041 | | | | | | | |
Short-term borrowings | | | 49,494 | | | 1,479 | | | 2.99 | | | 59,303 | | | 739 | | | 1.25 | | | 97,837 | | | 1,243 | | | 1.27 | |
Long-term debt | | | 443,509 | | | 19,700 | | | 4.44 | | | 394,944 | | | 18,382 | | | 4.65 | | | 339,564 | | | 17,256 | | | 5.08 | |
| Subordinated debt | | | 30,928 | | | 2,038 | | | 6.59 | | | 30,928 | | | 1,598 | | | 5.17 | | | 16,148 | | | 755 | | | 4.68 | |
Total interest-bearing liabilities | | | 2,059,843 | | | 59,648 | | | 2.90 | | | 1,603,068 | | | 43,242 | | | 2.70 | | | 1,463,590 | | | 42,351 | | | 2.89 | |
| Demand deposits | | | 271,319 | | | | | | | | | 178,084 | | | | | | | | | 167,315 | | | | | | | |
| Accrued interest, taxes and other liabilities | | | 18,675 | | | | | | | | | 14,194 | | | | | | | | | 14,001 | | | | | | | |
Total liabilities | | | 2,349,837 | | | | | | | | | 1,795,346 | | | | | | | | | 1,644,906 | | | | | | | |
| Stockholders’ equity | | | 318,768 | | | | | | | | | 145,750 | | | | | | | | | 135,773 | | | | | | | |
Total liabilities and stockholders’ equity | | $ | 2,668,605 | | | | | | | | $ | 1,941,096 | | | | | | | | $ | 1,780,679 | | | | | | | |
| | | | | | | | | | | | | | | | | | | | | | | | | | | | | |
| Interest income to earning assets | | | | | 6.26 | % | | | | | | | | 5.80 | % | | | | | | | | 6.02 | % |
| Interest expense to earning assets | | | | | 2.50 | | | | | | | | | 2.36 | | | | | | | | | 2.52 | |
| | | | | | | | | | | | | | | | | | | | | | | | | | | | | |
Effective interest differential | $ | 89,808 | | | 3.76 | % | | | | $ | 63,096 | | | 3.44 | % | | | | $ | 58,866 | | | 3.50 | % |
| | | | | | | | | | | | | | | | | | | | | | | | | | | | | |
| (a) Loan fees are included in interest income and rate calculations. |
| (b) Interest income on all tax-exempt securities and loans have been adjusted to a tax equivalent basis utilizing a Federal tax rate of 35% in 2005, 2004, and 2003 |
| (c) Averages are a combination of monthly and daily averages. |
| (d) Includes non-accrual loans and interest-earning education loans held for sale. |
Rate/Volume Analysis-Tax Equivalent Basis (a) | |
For the Years Ended December 31, 2005, 2004 and 2003 | |
| | | | | | | | | | | | | | |
| | | 2005 vs 2004 | | 2004 vs 2003 | |
| | | Volume | | Rate | | Total | | Volume | | Rate | | Total | |
| | | | | | | | | | | | | | |
| | | Favorable (Unfavorable) | |
| | | | | | | | | | | | | | |
Increase (decrease) in interest income: | | | | | | | | | | | | | | | | | | | |
Loans | | $ | 36,473 | | $ | 5,946 | | $ | 42,419 | | $ | 9,767 | | $ | (5,650 | ) | $ | 4,117 | |
Investment securities: | | | | | | | | | | | | | | | | | | | |
Taxable | | | (2,845 | ) | | 1,125 | | | (1,720 | ) | | (399 | ) | | 1,416 | | | 1,017 | |
Tax exempt | | | 956 | | | (298 | ) | | 658 | | | 118 | | | (219 | ) | | (101 | ) |
Total | | | (1,889 | ) | | 827 | | | (1,062 | ) | | (281 | ) | | 1,197 | | | 916 | |
Federal funds sold | | | 286 | | | 180 | | | 466 | | | 50 | | | 27 | | | 77 | |
Interest-bearing deposits in other banks | | | 1,095 | | | 200 | | | 1,295 | | | 10 | | | 1 | | | 11 | |
Total | | | 35,965 | | | 7,153 | | | 43,118 | | | 9,546 | | | (4,425 | ) | | 5,121 | |
| | | | | | | | | | | | | | | | | | | | |
| | | | | | | | | | | | | | | | | | | | |
| (Increase) decrease in interest expense: | | | | | | | | | | | | | | | | | | | |
Savings deposits | | | (1,992 | ) | | (3,238 | ) | | (5,230 | ) | | (806 | ) | | (148 | ) | | (954 | ) |
Time deposits | | | (7,197 | ) | | (1,481 | ) | | (8,678 | ) | | (437 | ) | | 1,965 | | | 1,528 | |
Short-term borrowings | | | 140 | | | (880 | ) | | (740 | ) | | 480 | | | 24 | | | 504 | |
Long-term debt | | | (2,185 | ) | | 867 | | | (1,318 | ) | | (2,658 | ) | | 1,532 | | | (1,126 | ) |
Subordinated debt | | | --- | | | (440 | ) | | (440 | ) | | (757 | ) | | (86 | ) | | (843 | ) |
Total | | | (11,234 | ) | | (5,172 | ) | | (16,406 | ) | | (4,178 | ) | | 3,287 | | | (891 | ) |
| | | | | | | | | | | | | | | | | | | | |
| | | | | | | | | | | | | | | | | | | | |
Increase (decrease) in effective interest differential | | $ | 24,731 | | $ | 1,981 | | $ | 26,712 | | $ | 5,368 | | $ | (1,138 | ) | $ | 4,230 | |
(a) Table shows approximate effect on the effective interest differential of volume and rate changes for the years 2005 and 2004. The effect of a change in average volume has been determined by applying the average yield or rate in the earlier period to the change in average volume during the period. The effect of a change in rate has been determined by applying the change in rate during the period to the average volume of the prior period. Any resulting unallocated amount was allocated ratably between the volume and rate components. Non-accrual loans have been included in the average volume of each period. Tax-exempt income is shown on a tax equivalent basis assuming a federal income tax rate of 35% in all years.
LOAN ACCOUNT COMPOSITION | |
as of December 31 | |
| | | | | | | | | | | | | | | | | | | | | | |
| | | 2005 | | 2004 | | 2003 | | 2002 | | 2001 | |
| | | Amount | | Percent | | Amount | | Percent | | Amount | | Percent | | Amount | | Percent | | Amount | | Percent | |
| Commercial, financial and agricultural | | $ | 782,946 | | | 35.0 | % | $ | 409,105 | | | 33.7 | % | $ | 367,444 | | | 34.1 | % | $ | 295,506 | | | 32.7 | % | $ | 158,223 | | | 18.4 | % |
| Real estate-construction | | | 4,532 | | | 0.2 | | | 8,703 | | | 0.7 | | | 7,338 | | | 0.7 | | | 2,615 | | | 0.3 | | | 21,225 | | | 2.5 | |
| Real estate-commercial mortgage | | | 793,969 | | | 35.5 | | | 356,871 | | | 29.3 | | | 283,661 | | | 26.3 | | | 246,533 | | | 27.2 | | | 554,354 | | | 64.7 | |
| Real estate-retail mortgage | | | 149,525 | | | 6.7 | | | 83,979 | | | 6.9 | | | 91,485 | | | 8.5 | | | 106,882 | | | 11.8 | | | --- | | | --- | |
| Consumer-home equity | | | 113,133 | | | 5.1 | | | 53,921 | | | 4.4 | | | 38,299 | | | 3.5 | | | 28,169 | | | 3.1 | | | --- | | | --- | |
| Consumer-installment and other | | | 390,392 | | | 17.5 | | | 303,372 | | | 25.0 | | | 290,384 | | | 26.9 | | | 224,863 | | | 24.9 | | | 123,476 | | | 14.4 | |
| Total loans | | | 2,234,497 | | | 100.0 | % | | 1,215,951 | | | 100.0 | % | | 1,078,611 | | | 100.0 | % | | 904,568 | | | 100.0 | % | | 857,278 | | | 100.0 | % |
| | | | | | | | | | | | | | | | | | | | | | | | | | | | | | | | |
| Allowance for loan losses | | | (22,965 | ) | | | | | (14,421 | ) | | | | | (13,178 | ) | | | | | (12,343 | ) | | | | | (12,132 | ) | | | |
| | | | | | | | | | | | | | | | | | | | | | | | | | | | | | | | |
| Loans, net | | $ | 2,211,532 | | | | | $ | 1,201,530 | | | | | $ | 1,065,433 | | | | | $ | 892,225 | | | | | $ | 845,146 | | | | |
* Prior breakouts of historical information could not be readily reconstructed from predecessor banks’ records. Breakouts of 2001 are assumed to approximate current mix trends.
Community’s loan activity is principally with customers located within its local market area. Community continues to maintain a diversified loan portfolio and has no significant loan concentration in any economic sector. Commercial, financial, and agricultural loans consist principally of commercial lending secured by financial assets of businesses including accounts receivable, inventories and equipment, and, in most cases, include liens on real estate. Real estate construction and mortgage loans are primarily 1 to 4 family residential loans secured by residential properties within the bank’s market area. Personal-installment loans consist principally of secured loans for items such as automobiles, property improvement, household and other consumer goods. Community continues to sell fixed rate mortgages in the secondary market to manage interest rate risk. Historically, relative credit risk of commercial, financial and agricultural loans has generally been greater than that of other types of loans.
MATURITIES AND SENSITIVITY TO CHANGES IN INTEREST | |
RATES FOR COMMERCIAL, FINANCIAL AND AGRICULTURAL | |
AND REAL-ESTATE CONSTRUCTION LOANS | |
as of December 31, 2005 | |
| | | | | | | | | | |
| | | Maturity Distribution | |
| | | One Year or Less | | One to Five Years | | Over Five Years | | Total | |
| | | | | | | | | | | | | | |
| Commercial, financial and agricultural | | $ | 163,591 | | $ | 287,540 | | $ | 331,815 | | $ | 782,946 | |
| Real estate-construction | | | 549 | | | 1,208 | | | 2,775 | | | 4,532 | |
| Real estate-commercial mortgage | | | 62,029 | | | 202,741 | | | 529,199 | | | 793,969 | |
| | | $ | 226,169 | | $ | 491,489 | | $ | 863,789 | | $ | 1,581,447 | |
| | | | | | | | | | | | | | |
| | | Interest Sensitivity | | | |
| | | | | | | | | | | | | | |
| | | | Variable | | | Fixed | | | Total | | | | |
| | | | | | | | | | | | | | |
| Due in one year or less | | $ | 137,461 | | $ | 88,708 | | $ | 226,169 | | | | |
| Due after one year | | | 1,000,234 | | | 355,044 | | | 1,355,278 | | | | |
| | | $ | 1,137,695 | | $ | 443,752 | | $ | 1,581,447 | | | | |
| | | | | | | | | | | | | | |
RECONCILIATION OF GAAP TO NON-GAAP MEASURES | |
| | | | | | | | |
| | | 2005 | | 2004 | | 2003 | |
| | | | | | | | | | | |
Income statement data: | | | | | | | | | | |
Net income | | | | | | | | | | |
| Net income | | $ | 25,641 | | $ | 21,798 | | $ | 20,400 | |
Amortization of core deposit and other intangible assets (1) | | | 1,153 | | | 105 | | | 94 | |
Merger, conversion and restructuring expenses (1) | | | 5,333 | | | --- | | | --- | |
| Net operating (tangible) income | | $ | 32,127 | | $ | 21,903 | | $ | 20,494 | |
| | | | | | | | | | | |
Earnings per share | | | | | | | | | | |
| Diluted earnings per common share | | $ | 1.42 | | $ | 1.73 | | $ | 1.63 | |
Amortization of core deposit and other intangible assets (1) | | | 0.06 | | | 0.01 | | | 0.01 | |
Merger, conversion and restructuring expenses (1) | | | 0.29 | | | --- | | | --- | |
| Diluted operating (tangible) earnings per share | | $ | 1.77 | | $ | 1.74 | | $ | 1.64 | |
| | | | | | | | | | | |
Balance sheet data: | | | | | | | | | | |
Average assets | | | | | | | | | | |
| Average assets | | $ | 2,668,605 | | $ | 1,941,096 | | $ | 1,780,679 | |
| Goodwill | | | (123,412 | ) | | (3,405 | ) | | (1,903 | ) |
| Core deposit and other intangible assets | | | (8,236 | ) | | (1,492 | ) | | (1,037 | ) |
| Average tangible assets | | $ | 2,536,957 | | $ | 1,936,199 | | $ | 1,777,739 | |
| | | | | | | | | | | |
Operating return on average tangible assets | | | 1.27 | % | | 1.13 | % | | 1.15 | % |
| | | | | | | | | | | |
Average equity | | | | | | | | | | |
| Average equity | | $ | 318,768 | | $ | 145,750 | | $ | 135,773 | |
| Goodwill | | | (123,412 | ) | | (3,405 | ) | | (1,903 | ) |
| Core deposit and other intangible assets | | | (8,236 | ) | | (1,492 | ) | | (1,037 | ) |
| Deferred taxes | | | 862 | | | --- | | | --- | |
| Average tangible equity | | $ | 187,982 | | $ | 140,853 | | $ | 132,833 | |
| | | | | | | | | | | |
Operating return on average tangible equity | | | 17.09 | % | | 15.55 | % | | 15.43 | % |
| | | | | | | | | | | |
At end of year: | | | | | | | | | | |
Total assets | | | | | | | | | | |
| Total assets | | $ | 3,332,430 | | $ | 1,954,799 | | $ | 1,861,063 | |
| Goodwill | | | (244,827 | ) | | (3,570 | ) | | (3,231 | ) |
| Core deposit and other intangible assets | | | (14,253 | ) | | (1,481 | ) | | (1,542 | ) |
| Total tangible assets | | $ | 3,073,350 | | $ | 1,949,748 | | $ | 1,856,290 | |
| | | | | | | | | | | |
Total equity | | | | | | | | | | |
| Total equity | | $ | 476,673 | | $ | 152,341 | | $ | 143,406 | |
| Goodwill | | | (244,827 | ) | | (3,570 | ) | | (3,231 | ) |
| Core deposit and other intangible assets | | | (14,253 | ) | | (1,481 | ) | | (1,542 | ) |
| Deferred taxes | | | 1,734 | | | --- | | | --- | |
| Total tangible equity | | $ | 219,327 | | $ | 147,290 | | $ | 138,633 | |
| | | | | | | | | | | |
Tangible book value at end of period | | $ | 9.57 | | $ | 12.04 | | $ | 11.90 | |
Tangible equity to assets | | | 7.14 | % | | 7.55 | % | | 7.47 | % |
| | | | | | | | | | | |
(1) Net of related tax effect | | | | | | | | | | |
A portion of the information related to quantitative and qualitative disclosures about market risk is included under Management’s Discussion and Analysis (MD&A) under the heading of Asset/Liability Management and Liquidity. The purpose of this presentation is to augment the discussion contained in MD&A.
Market risk is defined as the exposure to economic loss that arises from changes in the values of certain financial instruments pursuant to factors arising out of the various categories of market risk. Market risk can include a number of categories, including interest rate risk, foreign currency risk, exchange rate risk, commodity price risk, etc. For domestic, community-based banks, the vast majority of market risk is related to interest rate risk. Financial institutions use a number of techniques to attempt to measure the impact of interest rate risk which includes GAP analysis, interest rate “shock simulation” and economic value of equity. Each of these techniques is used to help quantify market risk attributable to the inherent sensitivity of both interest earning assets and interest bearing liabilities.
Interest rate sensitivity results when the maturity or repricing intervals of interest-earning assets, interest-bearing liabilities, and off-balance sheet financial instruments are different, creating a risk that changes in the level of market interest rates will result in disproportionate changes in the value of, and the net earnings generated from, Community’s interest-earning assets, interest-bearing liabilities, and off-balance sheet financial instruments. Community’s exposure to interest rate sensitivity is managed primarily through Community’s strategy of selecting the types and terms of interest-earning assets and interest-bearing liabilities which generate favorable earnings, while limiting the potential negative effects of changes in market interest rates. Since Community’s primary source of interest-bearing liabilities is customer deposits, its ability to manage the types and terms of such deposits may be somewhat limited by customer preferences in the market areas in which it operates. Borrowings, which include Federal Home Loan Bank (FHLB) advances and short-term loans, subordinated notes, and other short-term and long-term borrowings, are generally structured with specific terms which in management’s judgment, when aggregated with the terms for outstanding deposits and matched with interest-earning assets, mitigate Community’s exposure to interest rate sensitivity.
The rates, terms and interest rate indices of Community’s interest-earning assets result primarily from its strategy of investing in loans and securities (a substantial portion of which have adjustable-rate terms) which permit Community to limit its exposure to interest rate sensitivity, together with credit risk, while at the same time achieving a positive interest rate spread compared to the cost of interest-bearing liabilities.
The following table provides a measure of interest rate sensitivity for each category of interest earning assets and interest bearing liabilities at December 31, 2005.
Interest Rate Sensitivity | | | | | | | | | |
At December 31, 2005 | | 1-90 | | 90-180 | | 180-365 | | 1 year | | | |
Dollars in thousands | | days | | days | | days | | or more | | Total | |
Assets | | | | | | | | | | | | | | | | |
| Interest-bearing deposits in other banks | | $ | 4,423 | | $ | --- | | $ | --- | | $ | --- | | $ | 4,423 | |
| Loans held for sale | | | 95 | | | --- | | | --- | | | 2,473 | | | 2,568 | |
| Investment securities | | | 97,622 | | | 39,787 | | | 68,880 | | | 422,296 | | | 628,585 | |
Loans (a) | | | 823,602 | | | 98,781 | | | 184,373 | | | 1,127,741 | | | 2,234,497 | |
| Earning assets | | | 925,742 | | | 138,568 | | | 253,253 | | | 1,552,510 | | | 2,870,073 | |
| Non-earning assets | | | --- | | | --- | | | --- | | | 462,357 | | | 462,357 | |
| Total assets | | $ | 925,742 | | $ | 138,568 | | $ | 253,253 | | $ | 2,014,867 | | $ | 3,332,430 | |
| | | | | | | | | | | | | | | | | |
Liabilities | | | | | | | | | | | | | | | | |
| Savings | | $ | 312,907 | | $ | --- | | $ | --- | | $ | 529,202 | | $ | 842,109 | |
| Time | | | 109,289 | | | 122,587 | | | 265,368 | | | 388,154 | | | 885,398 | |
| Time in denominations of $100,000 or more | | | 24,831 | | | 24,742 | | | 60,922 | | | 80,530 | | | 191,025 | |
| Short-term borrowings | | | 87,253 | | | --- | | | --- | | | --- | | | 87,253 | |
| Long-term debt | | | 2,008 | | | 41,979 | | | 33,778 | | | 352,954 | | | 430,719 | |
| Subordinated debt | | | 23,196 | | | --- | | | --- | | | 7,732 | | | 30,928 | |
| Interest bearing liabilities | | | 559,484 | | | 189,308 | | | 360,068 | | | 1,358,572 | | | 2,467,432 | |
| Other liabilities and equity | | | 11,274 | | | 11,276 | | | 22,550 | | | 819,898 | | | 864,998 | |
| Total liabilities and equity | | $ | 570,758 | | $ | 200,584 | | $ | 382,618 | | $ | 2,178,470 | | $ | 3,332,430 | |
| | | | | | | | | | | | | | | | | |
| Interest Sensitivity GAP | | | | | | | | | | | | | | | | |
| Periodic | | $ | 354,984 | | $ | (62,016 | ) | $ | (129,365 | ) | $ | (163,603 | ) | | | |
| Cumulative | | | | | $ | 292,968 | | $ | 163,603 | | | --- | | | | |
| Cumulative GAP as a percentage of total assets | | | 10.65 | % | | 8.79 | % | | 4.91 | % | | 0 | % | | | |
| | | | | | | | | | | | | | | | | |
(a) Includes non-accrual loans. |
Community seeks to maximize net interest income and minimize earnings volatility by managing the level of interest rate sensitivity. Interest rate sensitivity is influenced by the repricing characteristic of both assets and liabilities and includes the volume of assets and liabilities repricing, the timing of repricing and the relative magnitude of the repricing. While GAP measurement provides an important tool to quantify the level of interest rate sensitivity at a specific point in time, its utility is constrained by the inherent limitations of GAP measurement for a number of reasons. First, changes in the level of interest rates cannot be expected to affect all assets and liabilities equally nor will they all be impacted at the same time. Second, assets and liabilities that are eligible to be repriced within a specific time frame may, in fact, not reprice or may not reprice to the same extent. Third, the measurement of GAP is inherently limited in that it provides a representation of the repricing characteristics of assets and liabilities at a specific point in time while actual sensitivity of assets and liabilities are undergoing constant change. Finally, much of the presentation of GAP is, by necessity, based upon estimates and assumptions for certain assets and liabilities. For example, savings, NOW accounts, and other forms of core deposits do not have defined maturities or repricing dates and therefore require estimates to be made based upon historical deposit decay rate analysis or other forms of approximation.
Interest rate sensitivity and the measurement thereof are also influenced by the optionality of certain earning assets and interest bearing liabilities. For example, a substantial portion of Community’s loans and mortgage-backed securities and residential mortgage loans contain significant embedded options, which permit the borrower to prepay the principal balance of the loan prior to maturity (“prepayments”) without penalty. A loan’s propensity for prepayment is dependent upon a number of factors, including the current interest rate and interest rate index (if any) of the loan, the financial ability of the borrower to refinance, the economic benefit to be obtained from refinancing, availability of refinancing at attractive terms, as well as economic and other factors in specific geographic areas which affect the sales
and price levels of residential property. In a changing interest rate environment, prepayments may increase or decrease on fixed and adjustable-rate loans pursuant to the current relative levels and expectations of future short and long-term interest rates.
Investment securities, other than mortgage-backed securities and those with early call provisions generally do not have significant embedded options and repay pursuant to specific terms until maturity. While savings and checking deposits generally may be withdrawn upon the customer’s request without prior notice, a continuing relationship with such customers is generally predictable resulting in a dependable and uninterrupted source of funds. Time deposits generally have early withdrawal penalties, while term FHLB borrowings and subordinated notes have prepayment penalties, which discourage customer withdrawal of time deposits and prepayment by Community of FHLB borrowings and subordinated notes prior to maturity.
In addition to periodic GAP reports comparing the sensitivity of interest-earning assets and interest-bearing liabilities to changes in interest rates, management also utilizes a report which measures the exposure of Community’s economic value of equity to interest rate risk. The model calculates the present value of assets, liabilities and equity at current interest rates, and at hypothetically higher and lower interest rates at one percent intervals. The present value of each major category of financial instruments is calculated by the model using estimated cash flows based on prepayments, early withdrawals, weighted average contractual rates and terms, and discount rates for similar financial instruments. The resulting present value of longer term fixed-rate financial instruments is more sensitive to change in a higher or lower interest rate scenario, while adjustable-rate financial instruments largely reflect only a change in present value representing the difference between the contractual and discounted rates until the next interest rate repricing date. The information provided by these analyses provides some indication of the potential for interest rate adjustment, but does not necessarily mean that the rate adjustment will occur or that it will occur in accordance with the assumptions. Despite these inherent limitations, Community believes that the tools used to manage its level of interest rate risk provide an appropriate measure of market risk exposure.
The following table reflects the estimated present value of assets, liabilities and equity using the model for Community as of December 31, 2005 at current interest rates and hypothetically, higher and lower interest rates of one and two percent.
| | | | | | | Base | | | | | |
| | | -2% | | -1% | | Present Value | | +1% | | +2% | |
Assets: | | (dollars in thousands) | |
| Cash, interest-bearing time deposits, and federal funds sold | | $ | 81,243 | | $ | 81,243 | | $ | 81,243 | | $ | 81,243 | | $ | 81,243 | |
| Loans held for sale | | | 3,536 | | | 2,963 | | | 2,568 | | | 2,161 | | | 1,879 | |
| Investment securities | | | 677,536 | | | 653,110 | | | 628,585 | | | 604,251 | | | 579,822 | |
| Loans | | | 2,248,320 | | | 2,230,771 | | | 2,211,532 | | | 2,176,073 | | | 2,148,017 | |
| Other assets | | | 408,502 | | | 408,502 | | | 408,502 | | | 408,502 | | | 408,502 | |
| | | | | | | | | | | | | | | | | |
| Total assets | | $ | 3,419,137 | | $ | 3,376,589 | | $ | 3,332,430 | | $ | 3,272,230 | | $ | 3,219,463 | |
| | | | | | | | | | | | | | | | | |
Liabilities: | | | | | | | | | | | | | | | | |
| Deposits | | $ | 2,319,600 | | $ | 2,305,880 | | $ | 2,294,367 | | $ | 2,279,757 | | $ | 2,267,314 | |
| Short-term borrowings | | | 87,254 | | | 87,254 | | | 87,253 | | | 87,254 | | | 87,254 | |
| Long-term debt | | | 463,408 | | | 448,307 | | | 430,719 | | | 424,549 | | | 421,241 | |
| Subordinated debt | | | 30,928 | | | 30,928 | | | 30,928 | | | 30,928 | | | 30,928 | |
| Other liabilities | | | 12,490 | | | 12,490 | | | 12,490 | | | 12,490 | | | 12,490 | |
| | | | | | | | | | | | | | | | | |
| Total liabilities | | | 2,913,680 | | | 2,884,859 | | | 2,855,757 | | | 2,834,978 | | | 2,819,227 | |
| | | | | | | | | | | | | | | | | |
| Total stockholders’ equity | | | 505,457 | | | 491,730 | | | 476,673 | | | 437,252 | | | 400,236 | |
| Total liabilities and stockholders’ equity | | $ | 3,419,137 | | $ | 3,376,589 | | $ | 3,332,430 | | $ | 3,272,230 | | $ | 3,219,463 | |
| | | | | | | | | | | | | | | | | |
Community Banks, Inc. and Subsidiaries
CONSOLIDATED BALANCE SHEETS
At December 31, 2005 and 2004
(Dollars in thousands except per share data)
| | | 2005 | | 2004 | |
ASSETS | | | | | |
| | | | | | | | |
| Cash and due from banks | | $ | 76,820 | | $ | 43,486 | |
| Interest-bearing deposits in other banks | | | 4,423 | | | 1,787 | |
| Investment securities, available for sale | | | 605,555 | | | 619,110 | |
Investment securities, held to maturity (fair value approximates $22,563) | | | 23,030 | | | --- | |
| Loans held for sale | | | 2,568 | | | 1,505 | |
| Loans, net of allowance for loan losses of $22,965 and $14,421 | | | 2,211,532 | | | 1,201,530 | |
| Premises and equipment, net | | | 43,283 | | | 26,369 | |
| Goodwill and other intangible assets | | | 259,080 | | | 5,051 | |
| Accrued interest receivable and other assets | | | 106,139 | | | 55,961 | |
| Total assets | | $ | 3,332,430 | | $ | 1,954,799 | |
| | | | | | | | |
LIABILITIES | | | | | | | |
| | | | | | | | |
| Deposits: | | | | | | | |
| Non-interest bearing | | $ | 375,835 | | $ | 184,359 | |
| Interest bearing | | | 1,918,532 | | | 1,121,178 | |
| Total deposits | | | 2,294,367 | | | 1,305,537 | |
| Short-term borrowings | | | 87,253 | | | 47,116 | |
| Long-term debt | | | 430,719 | | | 404,662 | |
| Subordinated debt | | | 30,928 | | | 30,928 | |
| Accrued interest payable and other liabilities | | | 12,490 | | | 14,215 | |
| Total liabilities | | | 2,855,757 | | | 1,802,458 | |
| | | | | | | | |
STOCKHOLDERS’ EQUITY | | | | | | | |
| | | | | | | | |
| Preferred stock, no par value; 500,000 shares | | | | | | | |
| authorized; no shares issued and outstanding | | | --- | | | --- | |
| Common stock-$5.00 par value; 50,000,000 shares | | | | | | | |
| authorized; 23,314,000 and 12,421,000 shares issued | | | 116,572 | | | 62,107 | |
| Surplus | | | 347,827 | | | 73,304 | |
| Retained Earnings | | | 27,031 | | | 18,134 | |
| Accumulated other comprehensive income (loss), net of tax | | | (3,779 | ) | | 3,211 | |
| Treasury stock; 399,000 and 185,000 shares, at cost | | | (10,978 | ) | | (4,415 | ) |
| Total stockholders’ equity | | | 476,673 | | | 152,341 | |
| Total liabilities and stockholders’ equity | | $ | 3,332,430 | | $ | 1,954,799 | |
The accompanying notes are an integral part of the consolidated financial statements.
Community Banks, Inc. and Subsidiaries
CONSOLIDATED STATEMENTS OF INCOME
For the Years Ended December 31, 2005, 2004, and 2003
(Dollars in thousands except per share data)
| | | 2005 | | 2004 | | 2003 | |
INTEREST INCOME: | | | | | | | |
| Loans, including fees | | $ | 111,757 | | $ | 69,732 | | $ | 65,837 | |
| Investment securities: | | | | | | | | | | |
| Taxable | | | 17,198 | | | 18,999 | | | 17,532 | |
| Tax exempt | | | 9,087 | | | 8,847 | | | 8,957 | |
| Dividends | | | 2,353 | | | 2,084 | | | 2,490 | |
| Other | | | 1,898 | | | 137 | | | 49 | |
| Total interest income | | | 142,293 | | | 99,799 | | | 94,865 | |
| | | | | | | | | | | |
INTEREST EXPENSE: | | | | | | | | | | |
| Deposits | | | 36,431 | | | 22,523 | | | 23,097 | |
| Short-term borrowings | | | 1,479 | | | 739 | | | 1,243 | |
| Long-term debt | | | 19,700 | | | 18,382 | | | 17,256 | |
| Subordinated debt | | | 2,038 | | | 1,598 | | | 755 | |
| Total interest expense | | | 59,648 | | | 43,242 | | | 42,351 | |
| Net interest income | | | 82,645 | | | 56,557 | | | 52,514 | |
| Provision for loan losses | | | 2,300 | | | 3,100 | | | 2,500 | |
| Net interest income after provision for loan losses | | | 80,345 | | | 53,457 | | | 50,014 | |
| | | | | | | | | | | |
NON-INTEREST INCOME: | | | | | | | | | | |
| Investment management and trust services | | | 2,692 | | | 1,510 | | | 1,326 | |
| Service charges on deposit accounts | | | 9,413 | | | 7,120 | | | 5,128 | |
| Other service charges, commissions and fees | | | 5,452 | | | 3,357 | | | 2,958 | |
| Investment security gains | | | 259 | | | 2,470 | | | 1,927 | |
| Insurance premium income and commissions | | | 3,350 | | | 3,260 | | | 2,822 | |
| Mortgage banking activities | | | 2,354 | | | 2,665 | | | 2,532 | |
| Earnings on investment in life insurance | | | 2,063 | | | 1,593 | | | 1,455 | |
| Other | | | 854 | | | 1,238 | | | 2,315 | |
| Total non-interest income | | | 26,437 | | | 23,213 | | | 20,463 | |
| | | | | | | | | | | |
NON-INTEREST EXPENSES: | | | | | | | | | | |
| Salaries and employee benefits | | | 36,998 | | | 28,337 | | | 25,397 | |
| Net occupancy | | | 11,355 | | | 8,287 | | | 7,447 | |
| Merger, conversion and restructuring expenses | | | 8,205 | | | --- | | | --- | |
| Marketing expense | | | 2,036 | | | 2,325 | | | 2,018 | |
| Telecommunications expense | | | 1,359 | | | 1,285 | | | 1,302 | |
| Amortization of intangibles | | | 1,424 | | | 161 | | | 94 | |
| Other | | | 13,692 | | | 9,598 | | | 9,460 | |
| Total non-interest expenses | | | 75,069 | | | 49,993 | | | 45,718 | |
| | | | | | | | | | | |
| Income before income taxes | | | 31,713 | | | 26,677 | | | 24,759 | |
| Income taxes | | | 6,072 | | | 4,879 | | | 4,359 | |
| Net income | | $ | 25,641 | | $ | 21,798 | | $ | 20,400 | |
| | | | | | | | | | | |
EARNINGS PER SHARE: | | | | | | | | | | |
| Basic | | $ | 1.44 | | $ | 1.78 | | $ | 1.68 | |
| Diluted | | $ | 1.42 | | $ | 1.73 | | $ | 1.63 | |
The accompanying notes are an integral part of the consolidated financial statements.
Community Banks, Inc. and Subsidiaries
CONSOLIDATED STATEMENTS OF CHANGES IN STOCKHOLDERS’ EQUITY
For the Years Ended December 31, 2005, 2004, and 2003
(Dollars in thousands except per share data)
| | | Outstanding | | Common | | | | Retained | | Accumulated Other Comprehensive | | Treasury | | Total | |
| | | Shares | | Stock | | Surplus | | Earnings | | Income (Loss) | | Stock | | Equity | |
Balance, December 31, 2002 | | | 9,151 | | $ | 47,053 | | $ | 46,418 | | $ | 35,344 | | $ | 6,538 | | $ | (6,191 | ) | $ | 129,162 | |
| Comprehensive income: | | | | | | | | | | | | | | | | | | | | | | |
| Net income | | | | | | | | | | | | 20,400 | | | | | | | | | 20,400 | |
| Unrealized gain on securities, net of reclassification adjustment and tax effect | | | | | | | | | | | | | | | 626 | | | | | | 626 | |
| Change in unfunded pension liability, net of tax | | | | | | | | | | | | | | | (568 | ) | | | | | (568 | ) |
| Total comprehensive income | | | | | | | | | | | | | | | | | | | | | 20,458 | |
| Cash dividends ($.63 per share) | | | | | | | | | | | | (7,619 | ) | | | | | | | | (7,619 | ) |
| 5% stock dividend | | | 458 | | | 2,346 | | | 10,612 | | | (12,984 | ) | | | | | | | | (26 | ) |
| Stock split paid in the form of a 20% stock dividend | | | 1,944 | | | 9,878 | | | | | | (9,878 | ) | | | | | | | | --- | |
| Purchases of treasury stock | | | (125 | ) | | | | | | | | | | | | | | (3,627 | ) | | (3,627 | ) |
| Stock issued in connection with acquisition | | | 26 | | | | | | 106 | | | | | | | | | 644 | | | 750 | |
| Exercise of common stock options and issuances under stock purchase plan | | | 194 | | | (21 | ) | | | | | (966 | ) | | | | | 4,868 | | | 3,881 | |
| Tax benefits from employee stock transactions | | | | | | | | | 427 | | | | | | | | | | | | 427 | |
Balance, December 31, 2003 | | | 11,648 | | | 59,256 | | | 57,563 | | | 24,297 | | | 6,596 | | | (4,306 | ) | | 143,406 | |
| Comprehensive income: | | | | | | | | | | | | | | | | | | | | | | |
| Net income | | | | | | | | | | | | 21,798 | | | | | | | | | 21,798 | |
| Unrealized loss on securities, net of reclassification adjustment and tax effect | | | | | | | | | | | | | | | (3,140 | ) | | | | | (3,140 | ) |
| Change in unfunded pension liability, net of tax | | | | | | | | | | | | | | | (245 | ) | | | | | (245 | ) |
| Total comprehensive income | | | | | | | | | | | | | | | | | | | | | 18,413 | |
| Cash dividends ($.67 per share) | | | | | | | | | | | | (8,215 | ) | | | | | | | | (8,215 | ) |
| 5% stock dividend | | | 584 | | | 2,949 | | | 15,103 | | | (18,110 | ) | | | | | | | | (58 | ) |
| Purchases of treasury stock | | | (144 | ) | | | | | | | | | | | | | | (4,151 | ) | | (4,151 | ) |
| Exercise of common stock options and issuances under stock purchase plan | | | 148 | | | (98 | ) | | | | | (1,636 | ) | | | | | 4,042 | | | 2,308 | |
| Tax benefits from employee stock transactions | | | | | | | | | 638 | | | | | | | | | | | | 638 | |
Balance, December 31, 2004 | | | 12,236 | | | 62,107 | | | 73,304 | | | 18,134 | | | 3,211 | | | (4,415 | ) | | 152,341 | |
| Comprehensive income: | | | | | | | | | | | | | | | | | | | | | | |
| Net income | | | | | | | | | | | | 25,641 | | | | | | | | | 25,641 | |
| Unrealized loss on securities, net of reclassification adjustment and tax effect | | | | | | | | | | | | | | | (7,043 | ) | | | | | (7,043 | ) |
| Change in unfunded pension liability, net of tax | | | | | | | | | | | | | | | 53 | | | | | | 53 | |
| Total comprehensive income | | | | | | | | | | | | | | | | | | | | | 18,651 | |
| Cash dividends ($.75 per share) | | | | | | | | | | | | (13,440 | ) | | | | | | | | (13,440 | ) |
| Purchases of treasury stock | | | (598 | ) | | | | | | | | | | | | | | (16,489 | ) | | (16,489 | ) |
| Exercise of common stock options and issuances under stock purchase plan | | | 423 | | | 193 | | | 873 | | | (2,980 | ) | | | | | 9,926 | | | 8,012 | |
| Tax benefits from employee stock transactions | | | | | | | | | 514 | | | | | | | | | | | | 514 | |
| Acquisition of PennRock Financial Services Corp.: | | | | | | | | | | | | | | | | | | | | | | |
| Common stock issued | | | 10,854 | | | 54,272 | | | 269,733 | | | | | | | | | | | | 324,005 | |
| Fair value of stock options | | | | | | | | | 3,079 | | | | | | | | | | | | 3,079 | |
| Other | | | | | | | | | 324 | | | (324 | ) | | | | | | | | --- | |
Balance, December 31, 2005 | | | 22,915 | | $ | 116,572 | | $ | 347,827 | | $ | 27,031 | | $ | (3,779 | ) | $ | (10,978 | ) | $ | 476,673 | |
The accompanying notes are an integral part of the consolidated financial statements.
Community Banks, Inc. and Subsidiaries
CONSOLIDATED STATEMENTS OF CASH FLOWS
For the Years Ended December 31, 2005 2004, and 2003
(Dollars in thousands)
| | | 2005 | | 2004 | | 2003 | |
Operating Activities: | | | | | | | |
| Net income | | $ | 25,641 | | $ | 21,798 | | $ | 20,400 | |
| Adjustments to reconcile net income to net cash | | | | | | | | | | |
| provided by operating activities: | | | | | | | | | | |
| Provision for loan losses | | | 2,300 | | | 3,100 | | | 2,500 | |
| Deferred income tax expense (benefit) | | | 1,559 | | | (481 | ) | | (152 | ) |
| Depreciation and amortization | | | 5,344 | | | 3,310 | | | 3,075 | |
| Net amortization of securities | | | 983 | | | 1,106 | | | 2,431 | |
| Realized gains on sales of available-for-sale securities, net | | | (259 | ) | | (2,470 | ) | | (1,927 | ) |
| Loans originated for sale | | | (8,163 | ) | | (10,959 | ) | | (66,976 | ) |
| Proceeds from sales of loans held for sale | | | 7,324 | | | 15,923 | | | 73,957 | |
| Gains on loan sales | | | (225 | ) | | (1,125 | ) | | (1,565 | ) |
| Earnings on investment in life insurance | | | (2,063 | ) | | (1,593 | ) | | (1,455 | ) |
| Pension curtailment gain | | | --- | | | --- | | | (497 | ) |
| Net change in other assets | | | 6,489 | | | 3,646 | | | 1,799 | |
| Net change in accrued interest payable and other liabilities | | | (16,385 | ) | | (2,982 | ) | | 2,848 | |
| Tax benefits from employee stock transactions | | | 514 | | | 638 | | | 427 | |
| Net cash provided by operating activities | | | 23,059 | | | 29,911 | | | 34,865 | |
| | | | | | | | | | | |
Investing Activities: | | | | | | | | | | |
| Net change in interest-bearing deposits in other banks | | | 3,740 | | | 1,515 | | | (2,350 | ) |
| Activity in available-for-sale securities: | | | | | | | | | | |
| Sales | | | 307,874 | | | 119,390 | | | 165,513 | |
| Maturities, prepayments and calls | | | 69,654 | | | 125,440 | | | 145,221 | |
| Purchases | | | (125,286 | ) | | (220,501 | ) | | (289,398 | ) |
| Purchases of securities held to maturity | | | (23,020 | ) | | --- | | | --- | |
| Net increase in total loans | | | (178,220 | ) | | (144,509 | ) | | (180,725 | ) |
| Proceeds from sale of credit card portfolio | | | --- | | | 4,556 | | | --- | |
| Investment in life insurance | | | --- | | | (5,000 | ) | | --- | |
| Additions to premises and equipment | | | (6,892 | ) | | (4,206 | ) | | (2,677 | ) |
| Cash acquired in acquisition | | | 34,564 | | | --- | | | --- | |
| Other | | | (3,646 | ) | | (325 | ) | | (2,717 | ) |
| Net cash provided (used) by investing activities | | | 78,768 | | | (123,640 | ) | | (167,133 | ) |
| | | | | | | | | | | |
Financing Activities: | | | | | | | | | | |
| Net increase in deposits | | | 106,755 | | | 74,852 | | | 97,773 | |
| Net change in short-term borrowings | | | (50,873 | ) | | (5,648 | ) | | (41,361 | ) |
| Proceeds from issuance of long-term debt | | | 50,000 | | | 35,000 | | | 98,751 | |
| Proceeds from subordinated debt | | | --- | | | --- | | | 15,464 | |
| Repayment of long-term debt | | | (152,458 | ) | | (16,760 | ) | | (7,862 | ) |
| Cash dividends and cash paid in lieu of fractional shares | | | (13,440 | ) | | (8,273 | ) | | (7,645 | ) |
| Payments to acquire treasury stock | | | (16,489 | ) | | (4,151 | ) | | (3,627 | ) |
| Proceeds from issuance of common stock | | | 8,012 | | | 2,308 | | | 4,525 | |
| Net cash provided (used) by financing activities | | | (68,493 | ) | | 77,328 | | | 156,018 | |
| | | | | | | | | | | |
| Net change in cash and cash equivalents | | | 33,334 | | | (16,401 | ) | | 23,750 | |
| | | | | | | | | | | |
| Cash and cash equivalents at beginning of period | | | 43,486 | | | 59,887 | | | 36,137 | |
| Cash and cash equivalents at end of period | | $ | 76,820 | | $ | 43,486 | | $ | 59,887 | |
| | | | | | | | | | | |
| Cash paid during the year for: | | | | | | | | | | |
| Interest | | $ | 57,452 | | $ | 42,426 | | $ | 42,311 | |
| Income taxes | | $ | 3,623 | | $ | 3,738 | | $ | 4,170 | |
The accompanying notes are an integral part of the consolidated financial statements.
Community Banks, Inc. and Subsidiaries
NOTES TO CONSOLIDATED FINANCIAL STATEMENTS
1. SUMMARY OF SIGNIFICANT ACCOUNTING POLICIES:
ORGANIZATION AND BASIS OF PRESENTATION:
Community Banks, Inc. (“Community” or the “Corporation”) is a financial holding company whose wholly-owned subsidiaries include CommunityBanks, CommunityBanks Investments, Inc. (CBII), and Community Banks Life Insurance Company (CBLIC). All significant intercompany transactions have been eliminated in consolidation. Community operates through its executive office in Harrisburg, Pennsylvania, and through 71 branch banking offices located in Adams, Berks, Chester, Cumberland, Dauphin, Lancaster, Luzerne, Northumberland, Schuylkill, Snyder, and York Counties in Pennsylvania, and Carroll County in Maryland. CommunityBanks provides a wide range of services through its network of offices. Lending services include secured and unsecured commercial loans, residential and commercial mortgages and various forms of consumer lending. Deposit services include a variety of checking, savings, time and money market deposits. Community also provides specialized services through its wholly-owned subsidiaries. Community and its subsidiaries are subject to the regulations of certain Federal and state agencies and undergo periodic examinations by such regulatory authorities.
USE OF ESTIMATES:
The preparation of financial statements in accordance with accounting principles generally accepted in the United States of America requires management to make estimates and assumptions that affect the reported amounts of assets and liabilities and disclosure of contingent assets and liabilities at the date of the financial statements and reported amounts of revenues and expenses during the reporting period. Actual results could differ from those estimates. The principal material estimates that are particularly susceptible to significant change in the near term relate to: the allowance for loan losses; certain intangible assets, such as goodwill and core deposit intangible; and the evaluation of other than temporary impairment of investment securities.
CASH FLOWS INFORMATION:
Cash and cash equivalents include cash and due from banks and federal funds sold. Noncash transactions included the issuance of $750,000 of common stock for an acquisition in 2003. During 2004, $25 million of maturing long-term FHLB advances were repaid through short term borrowings with the FHLB. Refer to Note 2, “Acquisitions,” for the terms of a non-cash transaction in 2005. During 2005, 2004, and 2003 transfers from loans to foreclosed real estate totaled $1.0 million, $1.5 million, and $5.0 million.
SIGNIFICANT GROUP CONCENTRATIONS OF CREDIT RISK:
Most of Community’s activities are with customers located within Central Pennsylvania and Northern Maryland. Note 3 discusses the types of securities in which Community invests. Note 4 discusses the types of lending engaged in by Community. Community does not have any significant concentrations to any one industry or customer.
INVESTMENT SECURITIES:
Community classifies debt and equity securities as either “held-to-maturity,” “available-for-sale,” or “trading.” Investments for which management has the intent, and Community has the ability, to hold to maturity are carried at cost adjusted for amortization of premium and accretion of discount. Securities bought and held primarily for the purpose of selling them in the near term are classified as trading and reported at fair value. Changes in unrealized gains and losses on trading securities are recognized in the Consolidated Statements of Income. At December 31, 2005 and 2004, there were no securities identified as trading. All other securities are classified as available-for-sale securities and reported at fair value. Changes in unrealized gains and losses on available-for-sale securities, net of applicable taxes, are recorded as a component of stockholders’ equity. Quoted market values, when available, are used to determine the fair value of securities. If quoted market prices are not available, then fair values are estimated using quoted prices of instruments with similar characteristics. Amortization and accretion are calculated principally on the interest method.
Securities classified as available-for-sale include those investments management intends to use as part of its asset/liability management strategy and may be sold in response to changes in interest rates, resultant prepayment risk and other factors. Declines in the fair value of available-for-sale or held to maturity securities below their cost that are deemed to be “other-than-temporary” are reflected in the Consolidated Statements of Income as realized losses. In estimating “other-than-temporary” impairment losses, management considers (1) the length of time and the extent to
which the fair value has been less than cost, (2) the financial condition and near-term prospects of the issuer, and (3) the intent and ability of Community to retain its investment in the issuer for a period of time sufficient to allow for any anticipated recovery in fair value. Realized gains and losses on the sale of securities are recognized using the specific identification method and are included in “non-interest income” in the Consolidated Statements of Income.
Equity securities include Federal Home Loan Bank (FHLB) stock at December 31, 2005 and 2004 of $23.1 million and $22.3 million, and represent equity interests in the FHLB. Such securities, which are carried at cost, do not have a readily determinable fair value because ownership is restricted and can be sold back only to the FHLB or to another member institution. The FHLB requires Community to maintain certain amounts of FHLB stock based on its balance of FHLB advances.
LOANS HELD FOR SALE:
Loans held for sale, consisting primarily of fixed rate mortgages and education loans, are valued at the lower of cost or fair value, determined on an aggregate basis.
LOANS AND REVENUE RECOGNITION:
Loans are stated at their principal amount outstanding adjusted for charge-offs and certain origination fees or costs. Interest income on loans is recorded on the interest method. Non-accrual loans are those on which the accrual of interest has ceased and where all previously accrued and unpaid interest is reversed. Loans, other than consumer loans, are placed on non-accrual status when principal or interest is past due 90 days or more and the collateral may be inadequate to recover principal and interest, or immediately, if in the opinion of management, full collection is doubtful. Generally, the uncollateralized portions of consumer loans past due 90 days or more are charged-off. Interest accrued but not collected as of the date of placement on non-accrual status is reversed and charged against current income. Subsequent cash payments received are applied either to the outstanding principal balance or recorded as interest income, depending upon management’s assessment of the ultimate collectibility of principal and interest. Nonaccrual loans are restored to accrual status when all delinquent principal and interest become current or the loan is considered secured and in the process of collection. Delinquency status is based on the contractual terms of the loan. Loan origination fees and certain direct origination costs are being deferred and the net amount amortized as an adjustment of the yield on the related loan under the interest method, generally over the contractual life.
ALLOWANCE FOR LOAN LOSSES:
The allowance for loan losses is established as losses are estimated to have occurred through a provision for loan losses charged to earnings. Loan losses are charged against the allowance when management believes the uncollectibility of a loan balance is confirmed. Subsequent recoveries, if any, are credited to the allowance.
The allowance for loan losses is evaluated on a quarterly basis by management using a systemic methodology that incorporates management’s judgments about the credit quality of the loan portfolio through a disciplined process that is consistently applied. Management considers all known relevant internal and external factors that may affect loan collectibility, as well as particular risks indigenous to specific types of lending. The final results of the process are reviewed and approved by executive management. Results are regularly validated by a review of trends associated with loan volume, delinquencies, and other factors that may influence the methodology used to estimate the allowance for loan losses. This evaluation is inherently subjective as it requires estimates that are susceptible to significant revision as additional information becomes available.
The allowance consists of specific, general and unallocated components. The specific component relates to loans that are classified as doubtful, substandard or special mention. For such loans that are also classified as impaired, an allowance is established when the realizable value of the collateral, or discounted cash flows, or obtainable market price, is lower than the carrying value of that loan. The general component covers non-classified loans that are evaluated as part of various pools. The allowance for these pools is based on historical loss experience adjusted for qualitative factors. An unallocated component is maintained in the allowance to cover uncertainties that could affect management’s estimate of probable losses. The unallocated component of the allowance reflects the margin of imprecision inherent in the underlying assumptions used in the methodologies for estimating specific and general losses in the portfolio.
A loan is considered impaired when, based on current information and events, it is probable that Community will be unable to collect the scheduled payments of principal or interest when due, according to the contractual terms of the loan agreement. Factors considered by management in determining impairment include payment status, collateral
Community Banks, Inc. and Subsidiaries
NOTES TO CONSOLIDATED FINANCIAL STATEMENTS
1. SUMMARY OF SIGNIFICANT ACCOUNTING POLICIES (Continued):
value, and the probability of collecting scheduled principal and interest payments when due. Loans that experience insignificant payment delays and payment shortfalls generally are not classified as impaired. Management determines
the significance of payment delays and payment shortfalls on a case-by-case basis, taking into consideration all of the circumstances surrounding the loan and the borrower, including the length of the delay, the reasons for the delay, the borrower’s prior payment record, and the amount of the shortfall in relation to the principal and interest owed. Impairment is measured on a loan-by-loan basis for commercial and construction loans over $250,000 by either the fair value of the collateral if the loan is collateral dependent, the present value of expected future cash flows discounted at the loan’s effective interest rate, or the loan’s obtainable market price.
Large groups of smaller balance homogeneous loans are collectively evaluated for impairment. Accordingly, Community does not separately identify individual consumer and residential loans for impairment disclosures, unless such loans are part of a restructuring agreement.
Loans continue to be classified as impaired unless they are brought fully current and the collection of scheduled interest and principal is considered probable of being collected when due. When an impaired loan or portion of an impaired loan is determined to be uncollectible, the portion deemed uncollectible is charged against the related valuation allowance, and subsequent recoveries, if any, are credited to the valuation allowance.
PREMISES AND EQUIPMENT:
Premises and equipment are stated at cost, less accumulated depreciation and amortization. Depreciation is calculated using straight-line methods over the estimated useful lives of the related assets as follows: banking premises, 20 to 40 years; furniture, fixtures, and equipment, 3 to 5 years. Leasehold improvements are amortized over the shorter of the lease term or 20 years. Long-lived assets are reviewed for impairment whenever events or changes in business circumstances indicate the carrying value of the assets may not be recovered. Maintenance and repairs are expensed as incurred, while major additions and improvements are capitalized. Gain or loss on retirement or disposal of individual assets is recorded as income or expense in the period of retirement or disposal.
GOODWILL AND OTHER INTANGIBLE ASSETS:
Community accounts for its acquisitions using the purchase accounting method required by Statement of Financial Accounting Standards (SFAS) No. 141, “Business Combinations.” Purchase accounting requires the total purchase price to be allocated to the estimated fair values of assets and liabilities acquired, including certain intangible assets that must be recognized. Generally, this results in a residual amount in excess of the net fair values, which is recorded as goodwill.
SFAS No. 142, “Goodwill and Other Intangible Assets,” requires that goodwill is not amortized to expense, but rather that it be tested for impairment at least annually. Impairment write-downs are charged to results of operations in the period in which the impairment is determined. Community did not identify any impairment on its outstanding goodwill from its most recent testing, which was performed at December 31, 2005. If certain events occur which might indicate goodwill has been impaired, the goodwill is tested when such events occur. Other acquired intangible assets with finite lives, such as core deposit intangibles, are required to be amortized over their estimated lives. Core deposit and other intangibles are generally amortized using accelerated methods over estimated useful lives of ten to fifteen years.
FORECLOSED REAL ESTATE:
Real estate acquired through foreclosure is initially carried at fair value, typically derived from the current appraised value of the property at transfer date less estimated selling cost. Prior to foreclosure, the recorded amount of the loan is written down, if necessary, to the appraised value of the real estate to be acquired by charging the allowance for loan losses.
Subsequent to foreclosure, gains or losses on the sale of and losses on the periodic revaluation of foreclosed real estate are credited or charged to other expense. Costs of maintaining and operating foreclosed property are expensed as incurred.
RETIREMENT PLANS:
Community maintains a 401(k) savings plan covering substantially all employees which allows employees to invest a percentage of their earnings, matched to a certain amount specified by Community. The expense related to this savings plan was $1.6 million in 2005, $1.5 million in 2004, and $1.1 million in 2003, and has been included in salaries and benefits expense.
Community maintains supplemental retirement plans and life insurance for selected executives. The supplemental life insurance plans replaced other insurance coverage. The expense associated with these plans was $484,000 for 2005, $379,000 for 2004, and $181,000 for 2003. The accrued liability was $5.3 million at December 31, 2005, and $1.9 million at December 31, 2004. Investment in bank owned life insurance policies was used to finance the supplemental benefit plans, and provide a tax-exempt return to Community.
Community has a noncontributory defined benefit pension plan covering employees of a predecessor bank. The pension plan was amended during 2001 to discontinue the admittance of any future participants into the plan. During the third quarter of 2003, the plan was further amended to curtail future eligibility services and affected participants will no longer accrue benefits. Community uses a September 30 measurement date for its plan. Pension costs are funded currently subject to the full funding limitation imposed under federal income tax regulations.
INCOME TAXES:
Deferred income taxes are accounted for by the liability method, wherein deferred tax assets and liabilities are calculated on the differences between the basis of assets and liabilities for financial statement purposes versus tax purposes (temporary differences) using enacted tax rates in effect for the year in which the differences are expected to reverse.
STOCK-BASED COMPENSATION:
At December 31, 2005, Community has a stock-based compensation plan, which is described more fully in Note 14. Community has accounted for this plan under the recognition and measurement principles of APB No. 25, “Accounting for Stock Issued to Employees,” and related Interpretations. No stock-based compensation cost has been reflected in net income, as all options granted under this plan had an exercise price equal to the market value of the underlying common stock on the date of grant. The following table illustrates the effect on net income and earnings per share if Community had applied the fair value recognition provisions of SFAS No. 123, “Accounting for Stock-Based Compensation,” to stock-based compensation.
| | | Years Ended December 31, | |
| | | (In Thousands, Except Per Share Data) | |
| | | 2005 | | 2004 | | 2003 | |
| | | | | | | | |
| Net income, as reported | | $ | 25,641 | | $ | 21,798 | | $ | 20,400 | |
| Deduct: Total stock-based compensation | | | | | | | | | | |
| expense determined under fair value based | | | | | | | | | | |
| method for all awards, net of related tax effect | | | (1,488 | ) | | (1,418 | ) | | (822 | ) |
| | | | | | | | | | | |
| Pro forma net income | | $ | 24,153 | | $ | 20,380 | | $ | 19,578 | |
| | | | | | | | | | | |
| Earnings per share: | | | | | | | | | | |
| Basic - as reported | | $ | 1.44 | | $ | 1.78 | | $ | 1.68 | |
| Basic - pro forma | | $ | 1.36 | | $ | 1.67 | | $ | 1.61 | |
| | | | | | | | | | | |
| Diluted - as reported | | $ | 1.42 | | $ | 1.73 | | $ | 1.63 | |
| Diluted - pro forma | | $ | 1.34 | | $ | 1.62 | | $ | 1.57 | |
In late 2004, SFAS No. 123 was replaced by the issuance of SFAS No. 123(R), “Share-Based Payment,” which requires Community to begin recognizing stock-based compensation costs in the income statement effective January 1, 2006. In March 2005, the SEC issued Staff Accounting Bulletin No. 107 (“SAB No. 107”), “Share-Based Payment”, providing guidance on option valuation methods, the accounting for income tax effects of share-based payment
Community Banks, Inc. and Subsidiaries
NOTES TO CONSOLIDATED FINANCIAL STATEMENTS
1. SUMMARY OF SIGNIFICANT ACCOUNTING POLICIES (Continued):
arrangements upon adoption of SFAS No. 123(R), and the disclosures subsequent to adoption. Community will adopt SFAS No. 123(R) and provide SAB No. 107 required disclosures effective January 1, 2006, using the modified prospective method with no restatement and will record stock compensation expense of approximately $100,000 between the first quarter of 2006 and the last quarter of 2007 for the unvested portion of existing awards at December 31, 2005. In January 2006, Community granted 240,000 options that will vest over 3 years. The options have an estimated fair value of $1.6 million, of which approximately $500,000 will be recorded as compensation expense in 2006. The impact of future option or stock grants is dependent upon the quantity and nature of future stock-based compensation grants.
EARNINGS PER SHARE:
Basic earnings per share represents income available to common stockholders divided by the weighted-average number of common shares outstanding during the period. Diluted earnings per share reflects additional common shares that would have been outstanding if potentially dilutive common shares had been issued, as well as any adjustment to income that would result from the assumed issuance. Potentially dilutive common shares that may be issued by Community relate solely to outstanding stock options, and are determined using the treasury stock method. All share and per share amounts are restated for stock splits and stock dividends that occur prior to the issuance of the financial statements.
Earnings per share for the years ended December 31, 2005, 2004 and 2003 have been computed as follows (in thousands, except per share data):
| | | 2005 | | 2004 | | 2003 | |
| | | | | | | | |
| Net income | | $ | 25,641 | | $ | 21,798 | | $ | 20,400 | |
| | | | | | | | | | | |
| Weighted average shares outstanding (basic) | | | 17,757 | | | 12,231 | | | 12,139 | |
| Effect of dilutive stock options | | | 315 | | | 344 | | | 358 | |
| | | | | | | | | | | |
| Weighted average shares outstanding (diluted) | | | 18,072 | | | 12,575 | | | 12,497 | |
| | | | | | | | | | | |
| Per share information: | | | | | | | | | | |
| Basic earnings per share | | $ | 1.44 | | $ | 1.78 | | $ | 1.68 | |
| Diluted earnings per share | | | 1.42 | | | 1.73 | | | 1.63 | |
Antidilutive options excluded from the above earnings per share calculations totaled 365,000 for 2005, 168,000 for 2004, and 10,000 for 2003.
COMPREHENSIVE INCOME:
Community reports comprehensive income in accordance with Statement of Financial Accounting Standard No. 130, “Reporting Comprehensive Income.” The components of other comprehensive income (loss) and related tax effects for years ended December 31 are as follows (in thousands):
| | | 2005 | | 2004 | | 2003 | |
| | | | | | | | |
| Unrealized holding gains (losses) | | | | | | | | | | |
| on available-for-sale securities | | $ | (10,576 | ) | $ | (2,362 | ) | $ | 2,891 | |
| Reclassification adjustments for | | | | | | | | | | |
| (gains) included in net income | | | (259 | ) | | (2,470 | ) | | (1,927 | ) |
| Net unrealized gains (losses) | | | (10,835 | ) | | (4,832 | ) | | 964 | |
| Tax effect | | | 3,792 | | | 1,692 | | | (338 | ) |
| | | | | | | | | | | |
| Net-of-tax amount | | | (7,043 | ) | | (3,140 | ) | | 626 | |
| | | | | | | | | | | |
| (Increase) decrease in unfunded pension liability | | | 82 | | | (377 | ) | | (874 | ) |
| Tax effect | | | (29 | ) | | 132 | | | 306 | |
| | | | | | | | | | | |
| Net-of-tax amount | | | 53 | | | (245 | ) | | (568 | ) |
| | | | | | | | | | | |
| | | $ | (6,990 | ) | $ | (3,385 | ) | $ | 58 | |
The components of accumulated other comprehensive income, included in stockholders’ equity, are as follows at December 31 (in thousands):
| | | 2005 | | 2004 | |
| Net unrealized gain (loss) on | | | | | | | |
| available-for-sale securities | | $ | (2,320 | ) | $ | 8,515 | |
| Tax effect | | | 812 | | | (2,980 | ) |
| Net-of-tax amount | | | (1,508 | ) | | 5,535 | |
| | | | | | | | |
| Unfunded pension liability | | | (3,494 | ) | | (3,576 | ) |
| Tax effect | | | 1,223 | | | 1,252 | |
| Net-of-tax amount | | | (2,271 | ) | | (2,324 | ) |
| | | | | | | | |
| Accumulated other comprehensive income (loss) | | $ | (3,779 | ) | $ | 3,211 | |
SEGMENT REPORTING:
Community has determined its only reportable segment is community banking. Community’s non-banking activities have been determined to be insignificant and do not require separate disclosure.
TRANSFERS OF FINANCIAL ASSETS:
Transfers of financial assets are accounted for as sales, when control over the assets has been surrendered. Control over transferred assets is deemed to be surrendered when (1) the assets have been isolated from Community, (2) the transferee obtains the right (free of conditions that constrain it from taking advantage of that right) to pledge or exchange the transferred assets, and (3) Community does not maintain effective control over the transferred assets through an agreement to repurchase them before their maturity.
OFF-BALANCE SHEET CREDIT RELATED FINANCIAL INSTRUMENTS:
In the ordinary course of business, Community has entered into commitments to extend credit, including commitments under credit card arrangements, commercial letters of credit, and standby letters of credit. Such financial instruments are recorded when they are funded.
Community Banks, Inc. and Subsidiaries
NOTES TO CONSOLIDATED FINANCIAL STATEMENTS
1. SUMMARY OF SIGNIFICANT ACCOUNTING POLICIES (Continued):
RECENT ACCOUNTING PROUNCEMENTS:
FSP SFAS No. 115-1 and SFAS No. 124-1
In March 2004, the Emerging Issues Task Force (“EITF”) reached a consensus on Issue No. 03-1, “The Meaning of Other-Than-Temporary Impairment and Its Application to Certain Investments.” EITF 03-1 provided guidance on other-than-temporary impairment models for marketable debt and equity securities accounted for under SFAS No. 115 and non-marketable equity securities accounted for under the cost method. The EITF developed a basic three-step model to evaluate whether an investment is other-than-temporarily impaired. In November 2005, the Financial Accounting Standards board (FASB) approved the issuance of FASB Staff Position (“FSP”) SFAS No. 115-1 and SFAS No. 124-1, “The Meaning of Other-Than-Temporary Impairment and Its Application to Certain Investments.” The FSP, which in part nullified EITF 03-1, addresses when an investment is considered impaired, whether the impairment is other-than-temporary and the measurement of an impairment loss. The FSP also includes accounting considerations subsequent to the recognition of an other-than-temporary impairment and requires certain disclosures about unrealized losses that have not been recognized as other-than-temporary. The FSP is effective for reporting periods beginning after December 15, 2005. For Community, the effective date will be January 1, 2006. The adoption of this accounting principle is not expected to have a significant impact on Community’s financial position or results of operations.
RECLASSIFICATIONS:
Certain amounts reported in prior years have been reclassified to conform with the 2005 presentation. These reclassifications did not materially impact Community’s financial condition or results of operations.
2. ACQUISITIONS:
On July 1, 2005, Community and PennRock Financial Services Corp. (PennRock), parent company of Blue Ball National Bank (Blue Ball) completed a merger in which PennRock was merged into Community. Also on that date, Blue Ball was merged into CommunityBanks, Community’s banking subsidiary. At the time of the merger, PennRock had 19 banking offices in Lancaster, Berks and Chester counties of Pennsylvania. Management expects the merger will enhance Community’s banking franchise by establishing a presence within these markets.
In connection with the transaction, Community acquired all of the outstanding shares of PennRock common stock for shares of Community’s common stock valued at $324 million and the exchange of stock options for Community’s options fair valued at $3.1 million. In addition, shares of PennRock valued at $44,000 owned by Community were not exchanged into Community shares, but are included in the acquisition cost.
The following table summarizes the purchase price allocation based on fair values of the assets acquired and liabilities assumed at the date of acquisition (in thousands).
| Assets: | | | |
| Cash and due from banks | | $ | 34,564 | |
| Investment securities | | | 250,272 | |
| Net loans | | | 835,126 | |
| Core deposit intangible | | | 13,135 | |
| Other assets | | | 73,832 | |
| Total identifiable assets | | $ | 1,206,929 | |
| | | | | |
| Liabilities: | | | | |
| Total deposits | | $ | 882,075 | |
| Short-term borrowings | | | 91,010 | |
| Long-term borrowings | | | 128,515 | |
| Other liabilities | | | 13,196 | |
| Total liabilities | | $ | 1,114,796 | |
In accordance with SFAS No. 141, Community used the purchase method of accounting to record this transaction. Accordingly, the results of operations of Community include PennRock’s results from and after July 1, 2005. Goodwill recorded in connection with the acquisition of PennRock is calculated below. The goodwill recorded was allocated to the banking subsidiary in accordance with SFAS No. 142 as all of the assets and liabilities acquired are related to the banking subsidiary (in thousands, except per share amounts).
| Community common stock issued | | | 10,854,435 | | | | |
| Average purchase price per Community common share | | $ | 29.85 | | | | |
| | | | | | $ | 324,005 | |
| Transaction costs | | | | | | 6,306 | |
| Fair value of vested employee stock options | | | | | | 3,079 | |
| Total Purchase Price | | | | | | 333,390 | |
| Net Assets Acquired: | | | | | | | |
| PennRock stockholders’ equity | | | 103,690 | | | | |
| PennRock goodwill and intangibles | | | (10,037 | ) | | | |
| Adjustments to reflect assets acquired at fair value: | | | | | | | |
| Investments | | | (6,330 | ) | | | |
| Loans (14 year weighted average life) | | | (1,757 | ) | | | |
| Core deposit intangible (10 year accelerated amortization) | | | 13,135 | | | | |
| Bank premises (35 year weighted average life) | | | (3,482 | ) | | | |
| Deferred tax assets (12 year weighted average life) | | | 539 | | | | |
| Adjustments to reflect liabilities acquired at fair value: | | | | | | | |
| Time deposits (2 year weighted average life) | | | (2,110 | ) | | | |
| FHLB advances (2.5 year weighted average life) | | | (1,515 | ) | | | |
| | | | | | | 92,133 | |
| Goodwill resulting from merger | | | | | $ | 241,257 | |
The goodwill acquired in connection with PennRock will not be deductible for tax purposes. The net effect on income before taxes for the year ended December 31, 2005, of amortization and accretion of the premiums, discounts, and intangible assets indicated above was income of $171,000.
Disclosed below is certain pro forma information for 2005 as if PennRock had been acquired on January 1, 2005, and for 2004 as if PennRock had been acquired on January 1, 2004. These results combine historical results of PennRock into Community’s consolidated statement of income. Pro forma amounts for 2005 include the impact of $8.2 million of merger, conversion and restructuring expenses. While certain adjustments have been made for the estimated impact of purchase accounting adjustments, they are not necessarily indicative of what would have occurred had the merger taken place on the indicated dates.
| | | Year Ended December 31 | |
| (in thousands, except per share data) | | 2005 | | 2004 | |
| | | | | | | | |
| Net interest income | | $ | 101,763 | | $ | 95,425 | |
| Other income | | | 32,365 | | | 35,448 | |
| Net income | | | 33,011 | | | 34,632 | |
| Diluted earnings per common share | | $ | 1.41 | | $ | 1.48 | |
Community Banks, Inc. and Subsidiaries
NOTES TO CONSOLIDATED FINANCIAL STATEMENTS
3. INVESTMENT SECURITIES:
The amortized cost and fair value of investment securities at December 31, 2005 and 2004 are as follows (in thousands):
| | | 2005 | | 2004 | |
| | | Amortized Cost | | Gross Unrealized Gains | | Gross Unrealized Losses | | Fair Value | | Amortized Cost | | Gross Unrealized Gains | | Gross Unrealized Losses | | Fair Value | |
| Securities Available-For-Sale | | | | | | | | | | | | | | | | | |
| Debt securities: | | | | | | | | | | | | | | | | | | | | | | | | | |
| U.S. Government and federal agency | | $ | 125,938 | | $ | --- | | $ | (2,814 | ) | $ | 123,124 | | $ | 126,056 | | $ | 807 | | $ | (1,322 | ) | $ | 125,541 | |
| Mortgage-backed, primarily federal agency | | | 186,871 | | | 102 | | | (4,160 | ) | | 182,813 | | | 178,437 | | | 1,517 | | | (640 | ) | | 179,314 | |
| State and municipal | | | 186,047 | | | 5,899 | | | (1,034 | ) | | 190,912 | | | 180,110 | | | 6,616 | | | (360 | ) | | 186,366 | |
| Corporate | | | 40,351 | | | 830 | | | (961 | ) | | 40,220 | | | 58,928 | | | 1,388 | | | (273 | ) | | 60,043 | |
| Total debt securities | | | 539,207 | | | 6,831 | | | (8,969 | ) | | 537,069 | | | 543,531 | | | 10,328 | | | (2,595 | ) | | 551,264 | |
| Equity securities | | | 68,909 | | | 789 | | | (1,212 | ) | | 68,486 | | | 67,085 | | | 1,390 | | | (629 | ) | | 67,846 | |
| Total securities available-for-sale | | $ | 608,116 | | $ | 7,620 | | $ | (10,181 | ) | $ | 605,555 | | $ | 610,616 | | $ | 11,718 | | $ | (3,224 | ) | $ | 619,110 | |
| | | | | | | | | | | | | | | | | | | | | | | | | | |
| Securities Held-to-Maturity | | | | | | | | | | | | | | | | | | | | | | | | | |
| | | | | | | | | | | | | | | | | | | | | | | | | | |
| State and municipal | | $ | 23,030 | | $ | --- | | $ | (467 | ) | $ | 22,563 | | $ | --- | | $ | --- | | $ | --- | | $ | --- | |
The following table shows gross unrealized losses and fair value, aggregated by investment category and length of time that individual securities have been in a continuous unrealized loss position, at December 31, 2005 and 2004 (in thousands):
| | | 2005 | | 2004 | |
| | | Less Than 12 Months | | 12 Months or More | | Less Than 12 Months | | 12 Months or More | |
| | | Fair Value | | Unrealized Losses | | Fair Value | | Unrealized Losses | | Fair Value | | Unrealized Losses | | Fair Value | | Unrealized Losses | |
| Securities Available-For-Sale | | | | | | | | | | | | | | | | | |
| Debt securities: | | | | | | | | | | | | | | | | | | | | | | | | | |
| U.S. Government and federal agency | | $ | 87,614 | | $ | (1,036 | ) | $ | 34,838 | | $ | (1,777 | ) | $ | 31,125 | | $ | (315 | ) | $ | 29,866 | | $ | (1,007 | ) |
| Mortgage-backed, primarily federal agency | | | 128,799 | | | (2,589 | ) | | 44,646 | | | (1,572 | ) | | 84,099 | | | (552 | ) | | 11,170 | | | (88 | ) |
| State and municipal | | | 37,103 | | | (722 | ) | | 8,806 | | | (312 | ) | | 20,171 | | | (185 | ) | | 5,451 | | | (175 | ) |
| Corporate | | | 9,270 | | | (396 | ) | | 6,116 | | | (565 | ) | | 6,688 | | | (60 | ) | | 6,189 | | | (213 | ) |
| Total debt securities | | | 262,786 | | | (4,743 | ) | | 94,406 | | | (4,226 | ) | | 142,083 | | | (1,112 | ) | | 52,676 | | | (1,483 | ) |
| Equity securities | | | 26,919 | | | (808 | ) | | 1,497 | | | (404 | ) | | 16,085 | | | (209 | ) | | 1,080 | | | (420 | ) |
| Total temporarily impaired securities | | $ | 289,705 | | $ | (5,551 | ) | $ | 95,903 | | $ | (4,630 | ) | $ | 158,168 | | $ | (1,321 | ) | $ | 53,756 | | $ | (1,903 | ) |
| | | | | | | | | | | | | | | | | | | | | | | | | | |
| Securities Held-to-Maturity | | | | | | | | | | | | | | | | | | | | | | | | | |
| | | | | | | | | | | | | | | | | | | | | | | | | | |
| State and municipal | | $ | 22,563 | | $ | (467 | ) | $ | --- | | $ | --- | | $ | --- | | $ | --- | | $ | --- | | $ | --- | |
The above table for December 31, 2005, represents 207 investment securities (184 debt and 23 equity securities) where the current fair value is less than the related amortized cost. Management believes that the unrealized losses reflect changes in interest rates subsequent to the acquisition of specific securities and do no reflect any deterioration of the credit worthiness of the issuing entities. Generally, securities with an unrealized loss are investment grade debt securities with a maturity date and are expected to be paid in full at maturity or are equity securities with characteristics of debt securities, including a specific repricing date. As management has the ability and intent to hold securities for the foreseeable future, no declines are deemed to be other than temporary.
The amortized cost and fair value of debt securities by contractual maturity, at December 31, 2005, follows. Expected maturities will differ from contractual maturities because obligors may have the right to call or repay obligations with or without call or prepayment penalties.
| | | Available for Sale | | Held to Maturity | |
| | | Amortized Cost | | Fair Value | | Amortized Cost | | Fair Value | |
| | | (in thousands) | |
| Within 1 year | | $ | 5,663 | | $ | 5,656 | | $ | --- | | $ | --- | |
| Over 1 year and through 5 years | | | 45,311 | | | 44,094 | | | --- | | | --- | |
| Over 5 years through 10 years | | | 108,624 | | | 106,430 | | | 511 | | | 502 | |
| Over 10 years | | | 192,738 | | | 198,076 | | | 22,519 | | | 22,061 | |
| | | | 352,336 | | | 354,256 | | | 23,030 | | | 22,563 | |
| Mortgage-backed securities | | | 186,871 | | | 182,813 | | | --- | | | --- | |
| | | $ | 539,207 | | $ | 537,069 | | $ | 23,030 | | $ | 22,563 | |
Gross investment security gains of $1.4 million and losses of $1.1 million were recognized in 2005. Gross gains of $4.1 million and losses of $1.6 million were recognized in 2004. Gross gains of $2.8 million and losses of $907,000 were recognized in 2003. The tax provision applicable to these net realized gains amounted to $91,000 in 2005, $865,000 in 2004 and $674,000 in 2003.
At December 31, 2005 and 2004, investment securities with carrying amounts of $176 million and $198 million, respectively, were pledged to collateralize public deposits and for other purposes required or permitted by law. At December 31, 2005 and 2004, the carrying amount of securities pledged to secure repurchase agreements was $84 million and $43 million.
4. LOANS:
The composition of loans outstanding by lending classification as of December 31 is as follows (in thousands):
| | | 2005 | | 2004 | |
| Commercial | | $ | 782,946 | | $ | 409,105 | |
| Real estate-construction | | | 4,532 | | | 8,703 | |
| Real estate-mortgage | | | | | | | |
| Residential | | | 149,525 | | | 83,979 | |
| Commercial | | | 793,969 | | | 356,871 | |
| Consumer | | | 503,525 | | | 357,293 | |
| | | $ | 2,234,497 | | $ | 1,215,951 | |
Changes in the allowance for loan losses for years ended December 31 are as follows (in thousands):
| | | 2005 | | 2004 | | 2003 | |
| Balance, January 1 | | $ | 14,421 | | $ | 13,178 | | $ | 12,343 | |
| Provision for loan losses | | | 2,300 | | | 3,100 | | | 2,500 | |
| Loan charge-offs | | | (2,323 | ) | | (2,910 | ) | | (2,839 | ) |
| Recoveries | | | 1,499 | | | 1,053 | | | 1,174 | |
| Allowance established for acquired credit risk | | | 7,068 | | | --- | | | --- | |
| Balance, December 31 | | $ | 22,965 | | $ | 14,421 | | $ | 13,178 | |
Community Banks, Inc. and Subsidiaries
NOTES TO CONSOLIDATED FINANCIAL STATEMENTS
4. LOANS (Continued):
The following table summarizes risk elements as of December 31 (in thousands):
| | | 2005 | | 2004 | |
| Loans on which accrual of interest has been discontinued | | $ | 9,060 | | $ | 5,428 | |
| Foreclosed real estate | | | 1,447 | | | 2,094 | |
| | | | | | | | |
| Total non-performing assets | | | 10,507 | | | 7,522 | |
| | | | | | | | |
| Loans past due 90 days or more and still accruing interest | | | 22 | | | --- | |
| | | | | | | | |
| Total risk elements | | $ | 10,529 | | $ | 7,522 | |
The following is a summary of information pertaining to impaired loans as of December 31 (in thousands):
| | | 2005 | | 2004 | |
| Impaired loans without a valuation allowance | | $ | 3,120 | | $ | 1,927 | |
| Impaired loans with a valuation allowance | | | 4,164 | | | 2,018 | |
| Total impaired loans | | $ | 7,284 | | $ | 3,945 | |
| | | | | | | | |
| Valuation allowance related to impaired loans | | $ | 1,848 | | $ | 593 | |
Impaired loans are included in nonaccrual loans. For the years ended December 31, 2005, 2004 and 2003, the average recorded investment in impaired loans approximated $6.5 million, $4.2 million, and $7.8 million. Interest recognized on impaired loans for the years ending December 31, 2005, 2004 and 2003 was not significant.
In July, 2005, in connection with the merger with Blue Ball, Community acquired loans for which there was evidence of deterioration of credit quality since origination and for which it was probable, at the merger date, that all contractually required payments would not be collected, as follows (in thousands):
| Contractually required payments receivable at acquisition: | | | |
Commercial | | $ | 17,351 | |
Commercial mortgages | | | 5,470 | |
| | | $ | 22,821 | |
| Cash flows expected to be collected at acquisition | | $ | 20,151 | |
| Basis in acquired loans at acquisition | | $ | 14,167 | |
No significant activity occurred in these accounts between the acquisition date and year-end.
5. PREMISES AND EQUIPMENT:
Premises and equipment are comprised of the following as of December 31 (in thousands):
| | | 2005 | | 2004 | |
| | | | | | |
| Banking premises | | $ | 41,684 | | $ | 27,017 | |
| Furniture, fixture, and equipment | | | 28,526 | | | 24,169 | |
| Leasehold improvements | | | 2,206 | | | 1,924 | |
| Construction-in-progress | | | 1,746 | | | 951 | |
| | | | 74,162 | | | 54,061 | |
| Less accumulated depreciation and amortization | | | (30,879 | ) | | (27,692 | ) |
| | | | | | | | |
| | | $ | 43,283 | | $ | 26,369 | |
Depreciation and amortization expense related to premises and equipment charged to operations totaled $3.9 million, $3.1 million, and $3.0 million in 2005, 2004, and 2003.
Certain branch offices, land, and equipment are leased under agreements which expire at varying dates through 2036. Most leases contain renewal provisions at Community’s option. Total rental expense was approximately $1.9 million in 2005, $1.2 million in 2004 and $1.1 million in 2003. Future minimum payments as of December 31, 2005 under noncancelable operating leases are as follows (in thousands):
| 2006 | | $ | 1,682 | |
| 2007 | | | 1,466 | |
| 2008 | | | 1,279 | |
| 2009 | | | 1,289 | |
| 2010 | | | 1,206 | |
| Thereafter | | | 17,883 | |
| | | | | |
| | | $ | 24,805 | |
Community Banks, Inc. and Subsidiaries
NOTES TO CONSOLIDATED FINANCIAL STATEMENTS
| 6. | GOODWILL AND OTHER INTANGIBLE ASSETS: |
The following table summarizes changes in goodwill (in thousands):
| | | 2005 | | 2004 | | 2003 | |
| | | | |
| Balance at beginning of year | | $ | 3,570 | | $ | 3,231 | | $ | 1,031 | |
| Goodwill acquired | | | 241,257 | | | 339 | | | 2,200 | |
| Balance at end of year | | $ | 244,827 | | $ | 3,570 | | $ | 3,231 | |
The following table summarizes intangible assets at December 31 (in thousands):
| | | 2005 | | 2004 | |
| | | Gross | | Accumulated Amortization | | Net | | Gross | | Accumulated Amortization | | Net | |
| | | | | | | | | | | | | | |
| Core deposit | | $ | 14,236 | | $ | 1,786 | | $ | 12,450 | | $ | 1,101 | | $ | 519 | | $ | 582 | |
| Other | | | 2,069 | | | 265 | | | 1,804 | | | 1,008 | | | 108 | | | 900 | |
Total | | $ | 16,305 | | $ | 2,051 | | $ | 14,254 | | $ | 2,109 | | $ | 627 | | $ | 1,482 | |
Amortization of core deposit and other intangible assets was generally computed using accelerated methods over original amortization periods of ten to fifteen years. The remaining weighted average amortization period as of December 31, 2005, was approximately 10 years. Amortization expense for core deposit and other intangibles was $1.4 million for 2005, $161,000 for 2004, and $94,000 for 2003. Estimated amortization expense for the next five years is as follows (in thousands):
| 2006 | | $ | 2,500 | |
| 2007 | | | 2,250 | |
| 2008 | | | 2,025 | |
| 2009 | | | 1,800 | |
| 2010 | | | 1,550 | |
7. DEPOSITS:
Deposits consisted of the following as of December 31 (in thousands):
| | | 2005 | | 2004 | |
| | | | | | |
| Non-interest bearing deposits | | $ | 375,835 | | $ | 184,359 | |
| Savings deposits | | | 243,174 | | | 160,505 | |
| Money market deposits | | | 288,418 | | | 52,718 | |
| NOW accounts | | | 310,517 | | | 284,152 | |
| Time deposits | | | 1,076,423 | | | 623,803 | |
| | | | | | | | |
| Total | | $ | 2,294,367 | | $ | 1,305,537 | |
The aggregate amount of time deposits with minimum denominations of $100,000 or more totaled $191 million and $106 million at December 31, 2005 and 2004.
At December 31, 2005 scheduled maturities of time deposits were as follows (in thousands):
| 2006 | | $ | 606,186 | |
| 2007 | | | 222,493 | |
| 2008 | | | 96,654 | |
| 2009 | | | 65,367 | |
| 2010 | | | 83,549 | |
| Thereafter | | | 2,174 | |
| | | | | |
| | | $ | 1,076,423 | |
8. SHORT-TERM BORROWINGS AND LONG-TERM DEBT:
Short-term borrowings consist of the following as of December 31 (in thousands):
| | | 2005 | | Rate | | 2004 | | Rate | |
| | | | | | | | | | |
| Securities sold under agreements to repurchase | | $ | 62,631 | | | 4.78 | % | $ | 25,472 | | | 1.81 | % |
| Treasury tax and loan note | | | 1,804 | | | 3.98 | % | | 1,926 | | | 1.94 | % |
| FHLB borrowings | | | 17,818 | | | 4.23 | % | | 19,718 | | | 2.21 | % |
| Other | | | 5,000 | | | 5.54 | % | | --- | | | --- | |
| | | $ | 87,253 | | | | | $ | 47,116 | | | | |
| | | | | | | | | | | | | | |
Securities sold under agreements to repurchase, which are classified as secured borrowings, generally mature within one to four days from the transaction date. Securities sold under agreements to repurchase are reflected at the amount of cash received in connection with the transaction. Community may be required to provide additional collateral based on the fair value of the underlying securities.
The maximum short-term FHLB borrowings outstanding at any month-end during 2005 and 2004 was $17.8 million and $48.1 million; the average amounts outstanding during the year were $1.5 million and $8.2 million; and the weighted average interest rate during the year approximated 4.23% and 1.50%.
At December 31, 2005, additional amounts available for borrowing under non-FHLB line of credit arrangements totaled approximately $67 million. Additional amounts available for borrowing at the FHLB totaled $498 million at December 31, 2005.
Community Banks, Inc. and Subsidiaries
NOTES TO CONSOLIDATED FINANCIAL STATEMENTS
8. SHORT-TERM BORROWINGS AND LONG-TERM DEBT (Continued):
Long-term debt consists of the following as of December 31 (in thousands):
| | | 2005 | | 2004 | |
| Outstanding advances from the FHLB of Pittsburgh are currently fixed rate and mature from 2006 to 2016. The advances are collateralized by FHLB stock, certain first mortgage loans and both agency and mortgage-backed securities. The advance rates range from 2.41% to 6.35%, with a weighted average interest rate of 4.37%. Advances totaling $266.5 million are convertible advances. Under the terms of these arrangements, the FHLB retains the option to convert the advances from fixed to variable rate. If the FHLB were to convert their options, Community has the ability to prepay the advances at no penalty. At the current time no advances have been converted, and remain at a fixed rate of interest. | | $ | 430,428 | | $ | 404,364 | |
| | | | | | | | |
| Other long-term debt has an interest rate of 4% and matures in 2017. | | | 291 | | | 298 | |
| | | $ | 430,719 | | $ | 404,662 | |
Maturities on long-term debt at December 31, 2005 are as follows (in thousands):
| 2006 | | $ | 77,963 | |
| 2007 | | | 43,261 | |
| 2008 | | | 42,900 | |
| 2009 | | | 40,165 | |
| 2010 | | | 20,177 | |
| Thereafter | | | 206,253 | |
| | | $ | 430,719 | |
9. SUBORDINATED DEBT:
Community has issued floating rate junior subordinated deferrable interest debentures to two non-consolidated subsidiary trusts, CMTY Capital Trust I (Trust I) for $15.5 million and CMTY Statutory Capital Trust II (Trust II) for $15.4 million. Community owns all of the common equity of each trust. The debentures held by each trust are the sole assets of that trust.
The trusts issued mandatorily redeemable preferred securities to third-party investors. Community’s obligations under the debentures and related documents, taken together, constitute a full and unconditional guarantee by Community of the Trusts’ obligations under the preferred securities. The securities pay interest quarterly; Trust I at 3-month LIBOR plus 3.35% and Trust II at 3-month LIBOR plus 2.84%. The securities are redeemable by Community at 100% of principal plus accrued interest; Trust I on or after January 7, 2008 and Trust II on or after December 16, 2008. The securities must be redeemed upon maturity of the debentures; Trust I on January 7, 2033, and Trust II on December 16, 2033.
In January 2006, Community issued floating rate junior subordinated deferrable interest debentures to two new non-consolidated subsidiary trusts, CMTY Statutory Capital Trust III (Trust III) for $10 million and CMTY Statutory Capital Trust IV (Trust IV) for $10 million. The securities pay interest quarterly, must be redeemed upon the maturity of the debentures in 2036, and may be redeemed at 100% of principal and accrued interest at specified dates prior to maturity.
10. INCOME TAXES:
The provision for income taxes for the years ended December 31 consists of the following (in thousands):
| | | 2005 | | 2004 | | 2003 | |
| Current | | $ | 4,513 | | $ | 5,360 | | $ | 4,511 | |
| Deferred | | | 1,559 | | | (481 | ) | | (152 | ) |
| | | $ | 6,072 | | $ | 4,879 | | $ | 4,359 | |
A reconciliation of income tax expense and the amounts which would have been recorded based upon statutory
rates (35%) is as follows (in thousands):
| | | 2005 | | 2004 | | 2003 | |
| Provision on pre-tax income at statutory rate | | $ | 11,100 | | $ | 9,337 | | $ | 8,666 | |
| Tax-exempt interest income | | | (3,740 | ) | | (3,409 | ) | | (3,284 | ) |
| Earnings on investment in insurance | | | (656 | ) | | (514 | ) | | (473 | ) |
| Other, net | | | (632 | ) | | (535 | ) | | (550 | ) |
| | | | | | | | | | | |
| Total provision for income taxes | | $ | 6,072 | | $ | 4,879 | | $ | 4,359 | |
The components of the net deferred tax asset, included in other assets as of December 31, were as follows (in thousands):
| | | 2005 | | 2004 | |
| Deferred tax assets: | | | | | | | |
| Allowance for loan losses | | $ | 8,972 | | $ | 5,047 | |
| Non-accrual loan interest income | | | 170 | | | 136 | |
| Unfunded pension adjustment | | | 1,223 | | | 1,252 | |
| Deferred loan fees | | | 340 | | | 233 | |
| Deferred compensation | | | 1,856 | | | 752 | |
| Alternative minimum tax | | | 900 | | | 225 | |
| Unrealized loss on available for sale securities | | | 812 | | | --- | |
| Other | | | 488 | | | 42 | |
| Total deferred tax assets | | | 14,761 | | | 7,687 | |
| | | | | | | | |
| Deferred tax liabilities | | | | | | | |
| Depreciation | | | 842 | | | 898 | |
| Unrealized gain on available for sale securities | | | --- | | | 2,980 | |
| Prepaid pension cost | | | 785 | | | 738 | |
| Life insurance company reserves | | | 87 | | | 163 | |
| Prepaid expenses | | | 529 | | | 290 | |
| Purchase accounting adjustments | | | 1,736 | | | --- | |
| Other | | | 418 | | | 144 | |
| Total deferred tax liabilities | | | 4,397 | | | 5,213 | |
| | | | | | | | |
| Net deferred tax asset | | $ | 10,364 | | $ | 2,474 | |
As of December 31, 2005 and 2004, Community had not established any valuation allowance against deferred tax assets since these tax benefits are realizable either through carry-back availability against prior years’ taxable income or the reversal of existing deferred tax liabilities.
Community Banks, Inc. and Subsidiaries
NOTES TO CONSOLIDATED FINANCIAL STATEMENTS
11. COMMITMENTS AND CONTINGENCIES:
In the normal course of business, Community is a party to financial instruments with off-balance sheet risk to meet the financing needs of its customers and to reduce its own exposure to fluctuations in interest rates. These financial instruments include commitments to originate loans and standby letters of credit, which involve, to varying degrees, elements of credit and interest rate risk in excess of the amount recognized in the Consolidated Balance Sheets.
Financial instruments with off-balance sheet risk at December 31 are as follows (in thousands):
| | | Contract Amount | |
| | | 2005 | | 2004 | |
| Commitments to fund loans | | $ | 99,988 | | $ | 55,672 | |
| Unused lines of credit | | $ | 365,076 | | $ | 338,313 | |
| Standby letters of credit | | $ | 100,523 | | $ | 36,256 | |
| Unadvanced portions of construction loans | | $ | 129,845 | | $ | 53,962 | |
Substantially all of Community’s unused commitments to originate loans and unused lines of credit are at variable rates or will be provided at the prevailing fixed rate when the loans are originated or the lines are used.
Commitments to extend credit are agreements to lend to a customer provided there is no violation of any condition established in the contract. Commitments generally have fixed expiration dates or other termination clauses and may require payment of a fee. Lines of credit are similar to commitments as they have fixed expiration dates and are driven by certain criteria contained within the loan agreement. Lines of credit normally do not extend beyond a period of one year. Community evaluates each customer’s credit worthiness on a case-by-case basis. The amount of collateral obtained, if deemed necessary by Community upon extension of credit, is based on management’s credit evaluation of the borrower. Collateral held varies but may include accounts receivable, inventory, and plant and equipment and personal guarantees.
Standby letters of credit are conditional commitments issued by the subsidiary bank to guarantee the financial or performance obligation of a customer to a third party. Community’s exposure to credit loss in the event of nonperformance by the other party to the financial instrument for standby letters of credit is represented by the contractual amount of those instruments. The subsidiary bank uses the same credit policies in making conditional obligations as it does for on-balance sheet instruments. The majority of these standby letters of credit expire within the next twelve months. The credit risk involved in issuing letters of credit is essentially the same as that involved in extending other loan commitments. The subsidiary bank requires collateral and personal guarantees supporting these letters of credit as deemed necessary. Management believes that the proceeds obtained through a liquidation of such collateral and the enforcement of personal guarantees would be sufficient to cover the maximum potential amount of future payments required under the corresponding guarantees. The amount of the liability as of December 31, 2005 and 2004 for guarantees under standby letters of credit issued is not material.
Since a portion of the commitments are expected to expire without being drawn upon, the total commitment amount does not necessarily represent future cash requirements.
From time to time, Community and its subsidiaries may be defendants in legal proceedings relating to the conduct of their business. Most of such legal proceedings are a normal part of doing business, and in management’s opinion, the financial position and results of operations of Community would not be affected materially by the outcome of such legal proceedings.
12. REGULATORY MATTERS:
The dividends that may be paid by CommunityBanks, the subsidiary bank, to Community are subject to certain legal and regulatory limitations. Under such limitations, the total amount available for payment of dividends by CommunityBanks was approximately $165 million at December 31, 2005. Dividends by CommunityBanks to Community would also be prohibited if payment would reduce CommunityBank’s capital below applicable minimum capital requirements presented below.
Under current Federal Reserve regulations, CommunityBanks is limited in the amount it may loan to affiliates, including Community. Loans to a single affiliate may not exceed 10%, and the aggregate of loans to all affiliates may not exceed 20% of bank capital and surplus. At December 31, 2005, the maximum amount available for transfer from CommunityBanks to Community in the form of loans was approximately $233 million.
CommunityBanks and Community are subject to various regulatory capital requirements administered by banking regulators. Failure to meet minimum capital requirements can initiate certain mandatory - and possibly additional discretionary - actions by regulators that, if undertaken, could have a direct material effect on Community’s financial statements. Under capital adequacy guidelines and the regulatory framework for prompt corrective action, CommunityBanks must meet specific capital guidelines that involve quantitative measures of the bank’s assets, liabilities, and certain off-balance sheet items as calculated under regulatory accounting practices. CommunityBanks capital amounts and classification are also subject to qualitative judgments by the regulators about components, risk weightings and other factors.
Quantitative measures established by regulations to ensure capital adequacy require CommunityBanks and Community to maintain minimum amounts and ratios of total and Tier 1 capital to risk-weighted assets, and of Tier 1 capital to average assets (as defined in the regulations). Management believes, as of December 31, 2005, that CommunityBanks and Community meet the capital adequacy requirements to which they are subject.
As of December 31, 2005, the most recent notification from the Federal Deposit Insurance Corporation categorized CommunityBanks as “well capitalized” under the regulatory framework for prompt corrective action. In order to be “well capitalized”, the bank must maintain minimum total risk-based, Tier 1 risk-based, and Tier 1 leverage ratios as set forth in the following table. There are no conditions or events since December 31, 2005 that management believes have changed the bank’s classification.
The following tables present the total risk-based, Tier 1 risk-based and Tier 1 leverage requirements for Community and CommunityBanks as of December 31, 2005 and 2004 (dollars in thousands):
| | | As of December 31, 2005 | |
| | | Actual | | Regulatory Minimum | | “Well Capitalized” | |
| | | Amount | | Ratio | | Amount | | Ratio | | Amount | | Ratio | |
| Leverage ratio | | | | | | | | | | | | | |
| Community Banks, Inc. | | $ | 249,692 | | | 8.2 | % | $ | 122,231 | | | 4 | % | $ | 152,789 | | | 5 | % |
| Bank only | | $ | 242,696 | | | 8.0 | % | $ | 121,777 | | | 4 | % | $ | 152,221 | | | 5 | % |
| | | | | | | | | | | | | | | | | | | | |
| Tier 1 capital ratio | | | | | | | | | | | | | | | | | | | |
| Community Banks, Inc. | | $ | 249,692 | | | 10.1 | % | $ | 99,207 | | | 4 | % | $ | 148,811 | | | 6 | % |
| Bank only | | $ | 242,696 | | | 9.8 | % | $ | 99,498 | | | 4 | % | $ | 149,247 | | | 6 | % |
| | | | | | | | | | | | | | | | | | | | |
| Total risk-based capital ratio | | | | | | | | | | | | | | | | | | | |
| Community Banks, Inc. | | $ | 272,657 | | | 11.0 | % | $ | 198,414 | | | 8 | % | $ | 248,018 | | | 10 | % |
| Bank only | | $ | 265,661 | | | 10.7 | % | $ | 198,996 | | | 8 | % | $ | 248,746 | | | 10 | % |
Community Banks, Inc. and Subsidiaries
NOTES TO CONSOLIDATED FINANCIAL STATEMENTS
12. REGULATORY MATTERS (Continued):
| | | As of December 31, 2004 | |
| | | Actual | | Regulatory Minimum | | “Well Capitalized” | |
| | | Amount | | Ratio | | Amount | | Ratio | | Amount | | Ratio | |
| Leverage ratio | | | | | | | | | | | | | | | | | | | |
| Community Banks, Inc. | | $ | 171,755 | | | 8.8 | % | $ | 78,088 | | | 4 | % | $ | 97,609 | | | 5 | % |
| Bank only | | $ | 159,677 | | | 8.2 | % | $ | 77,712 | | | 4 | % | $ | 97,140 | | | 5 | % |
| | | | | | | | | | | | | | | | | | | | |
| Tier 1 capital ratio | | | | | | | | | | | | | | | | | | | |
| Community Banks, Inc. | | $ | 171,755 | | | 11.6 | % | $ | 59,135 | | | 4 | % | $ | 88,702 | | | 6 | % |
| Bank only | | $ | 159,677 | | | 10.8 | % | $ | 58,881 | | | 4 | % | $ | 88,322 | | | 6 | % |
| | | | | | | | | | | | | | | | | | | | |
| Total risk-based capital ratio | | | | | | | | | | | | | | | | | | | |
| Community Banks, Inc. | | $ | 186,513 | | | 12.6 | % | $ | 118,269 | | | 8 | % | $ | 147,837 | | | 10 | % |
| Bank only | | $ | 174,098 | | | 11.8 | % | $ | 117,762 | | | 8 | % | $ | 147,203 | | | 10 | % |
CommunityBanks is required to maintain reserves, in the form of cash and balances with the Federal Reserve Bank, against its deposit liabilities. The amounts of such reserves totaled $16.4 million at December 31, 2005 and $5.6 million at December 31, 2004.
13. PENSION PLAN:
Community maintains a defined benefit pension plan for employees of a predecessor bank which covers less than 20% of the current aggregate employee base. Effective at the end of the third quarter of 2003, the Board of Directors of Community approved a curtailment of this pension plan.
The determination of pension expense for each of the last three years is as follows:
(dollars in thousands) | | 2005 | | 2004 | | 2003 | |
| Components of net periodic benefit cost: | | | | | | | | | | |
| Service cost benefit earned during the year | | $ | --- | | $ | --- | | $ | 115 | |
| Interest cost on projected benefit obligation | | | 414 | | | 416 | | | 428 | |
| Expected return on plan assets | | | (448 | ) | | (249 | ) | | (549 | ) |
| Net amortization and deferral: | | | | | | | | | | |
| Prior service benefit | | | --- | | | --- | | | (103 | ) |
| Net loss | | | 284 | | | 252 | | | 239 | |
| Gain (loss) deferred | | | 16 | | | (161 | ) | | 150 | |
| Pension cost | | $ | 266 | | $ | 258 | | $ | 280 | |
| | | | | | | | | | | |
Increase in minimum liability included in other comprehensive income | | $ | 82 | | $ | 377 | | $ | 874 | |
The following table sets forth the pension plan’s funded status:
(dollars in thousands) | | 2005 | | 2004 | |
| | | | | | |
| Change in benefit obligation: | | | | | |
| Benefit obligation at beginning of year | | $ | 7,400 | | $ | 6,807 | |
| Interest cost | | | 414 | | | 416 | |
| Benefits paid | | | (379 | ) | | (291 | ) |
| Change in assumptions | | | 242 | | | 452 | |
| Experience (gain) loss | | | (23 | ) | | 16 | |
| Benefit obligation at end of year | | | 7,654 | | | 7,400 | |
| Change in plan assets: | | | | | | | |
| Fair value of plan assets at beginning of year | | | 5,794 | | | 4,904 | |
| Actual return on plan assets | | | 448 | | | 249 | |
| Employer contributions | | | 538 | | | 932 | |
| Benefits paid | | | (379 | ) | | (291 | ) |
| Fair value of plan assets at end of year | | | 6,401 | | | 5,794 | |
| | | | | | | | |
| Funded status, end of year | | | (1,253 | ) | | (1,606 | ) |
| Unrecognized net cost | | | 3,494 | | | 3,576 | |
| Recognition of additional minimum liability | | | (3,494 | ) | | (3,576 | ) |
| Accrued pension liability | | $ | (1,253 | ) | $ | (1,606 | ) |
| | | | | | | | |
| Amounts recognized in the consolidated balance sheet consist of: | | | |
| Prepaid benefit cost | | $ | 2,241 | | $ | 1,970 | |
| Accumulated other comprehensive income adjustment | | | (3,494 | ) | | (3,576 | ) |
| Net accrued pension liability | | $ | (1,253 | ) | $ | (1,606 | ) |
| | | | | | | | |
| Accumulated benefit obligation | | $ | 7,654 | | $ | 7,400 | |
Assumptions used in the determination of the funded status of the plan at December 31, 2005 and 2004 and pension expense for each of the last three years were as follows:
| | | 2005 | | 2004 | | 2003 | |
| Discount rate | | | 5.50 | % | | 5.75 | % | | 6.25 | % |
| Expected long-term return on plan assets | | | 7.5 | % | | 8.5 | % | | 9.0 | % |
| Annual salary increase | | | n/a | | | n/a | | | 4.0 | % |
Estimated future benefit payments are as follows (in thousands):
| 2006 | | $ | 386 | |
| 2007 | | | 382 | |
| 2008 | | | 394 | |
| 2009 | | | 396 | |
| 2010 | | | 423 | |
| Years 2011 - 2015 | | | 2,370 | |
Community Banks, Inc. and Subsidiaries
NOTES TO CONSOLIDATED FINANCIAL STATEMENTS
13. PENSION PLAN (Continued):
Community maintains a pension investment policy which addresses the assumptions required for the various aspects of plan management and plan accounting. Plan assumptions are determined by management pursuant to the guidance provided by the investment policy and through consultation with plan actuaries.
Targeted allocations of plan assets have been developed as a component of the investment policy and are responsive to the investment goals, risk management practices and the relationship between plan assets and benefit obligations. The current investment style favors an emphasis on growth given that the plan has been curtailed and a substantial portion of the benefited employees are not receiving pension benefits at the current time. Pursuant to that policy, the following targeted allocations and actual asset allocations at the end of each of the last two years are provided.
| | | Target Asset | | | | At December 31, | |
| | | Allocation | | Range | | 2005 | | 2004 | |
| Equity | | | 60 | % | | 50-70 | % | | 61 | % | | 63 | % |
| Fixed income | | | 35 | % | | 25-45 | % | | 31 | % | | 25 | % |
| Cash and/or equivalents | | | 5 | % | | 2-10 | % | | 8 | % | | 12 | % |
| | | | | | | | | | | | | | |
| | | | 100 | % | | | | | | | | | |
The expected long-term rate of return on plan assets is based upon historical returns of specified benchmark investment categories that are weighted by targeted allocations of plan assets. The following presentation provides an indication of targeted asset allocation, which is specified within the investment policy, and a comparison to historical annualized returns that provide support for the assumed expected long term rate of return on plan assets.
| | | Targeted Asset Allocation | | Benchmarks | | 10 yrs (12/31/05) Annualized Returns | | 15 yrs (12/31/05) Annualized Returns | |
| Equities | | | 60 | % | | S&P 500 | | | 9.07 | % | | 11.52 | % |
| Fixed income | | | 35 | % | | Lehman Bros Aggregate | | | 6.16 | % | | 7.26 | % |
| Cash equivalents | | | 5 | % | | 3 mo T-Bill | | | 3.78 | % | | 4.03 | % |
| | | | | | | | | | | | | | |
| Total pension | | | 100 | % | | | | | 7.78 | % | | 9.66 | % |
The plan currently maintains no investment in the common stock of Community and contributions to the plan during 2006 are currently estimated to be $400,000. The Corporation anticipates no adverse funding issues associated with the plan. The 2003 curtailment of the plan is expected to limit future increases in pension expense as eligible employees are no longer accruing benefits associated with future service.
14. STOCK-BASED PLANS:
Community has a Long-term Incentive Plan (the “Plan”) that allows Community to grant to employees, executive officers and directors stock awards in the form of Incentive Stock Options, Nonqualified Stock Options or Stock Appreciation Rights. The stock options can be granted at prices not less than the fair market value in the case of Incentive Stock Options and not less than 80% of the fair market value in the case of Nonqualified Stock Options. Community has elected to follow Accounting Principles Board Opinion No. 25, “Accounting for Stock Issued to Employees” (“APB 25"), and related interpretations in accounting for its stock-based compensation and to provide the disclosures required under SFAS No. 123, “Accounting for Stock Based Compensation” (“SFAS No. 123"). All options to date have been issued at fair value. Accordingly, no compensation expense has been recognized for stock options issued under the Plan.
In electing to follow APB 25 for expense recognition purposes, Community is obliged to provide the expanded disclosures required under SFAS No. 123 for stock-based compensation granted. The weighted average fair values at date of grant for options granted during fiscal years 2005, 2004, and 2003 were $6.59, $9.45, and $7.90, and were estimated using the Black-Scholes option valuation model with the following weighted average assumptions for 2005, 2004, and 2003: dividend yield of 2.7%, 2.4%, and 2.0%; volatility of 23%, 33%, and 22%; risk free interest rates of 4.4%, 4.0%, and 3.9%; and expected life in years of 7.4, 7.8, and 7.9.
As of December 31, 2005, 816,000 shares were authorized but not awarded under the Plan. The stock options generally vest from six months to five years from the date of grant, and expire no later than ten years after the date of grant. The changes in outstanding options are as follows:
| | | 2005 | | 2004 | | 2003 | |
| | | Shares Under Option (000’s) | | Weighted Average Exercise Price Per Share | | Shares Under Option (000’s) | | Weighted Average Exercise Price Per Share | | Shares Under Option (000’s) | | Weighted Average Exercise Price Per Share | |
| Balance, beginning of year | | | 1,073 | | $ | 20.44 | | | 1,027 | | $ | 17.90 | | | 1,040 | | $ | 14.95 | |
| Issued | | | 14 | | | 27.01 | | | 193 | | | 28.89 | | | 170 | | | 30.40 | |
| Exercised | | | (254 | ) | | 14.82 | | | (142 | ) | | 13.34 | | | (173 | ) | | 12.30 | |
| Exchanged in merger | | | 229 | | | 16.53 | | | --- | | | --- | | | --- | | | --- | |
| Forfeited | | | (1 | ) | | 19.99 | | | (5 | ) | | 23.06 | | | (10 | ) | | 17.87 | |
| Balance, end of year | | | 1,061 | | $ | 21.02 | | | 1,073 | | $ | 20.44 | | | 1,027 | | $ | 17.90 | |
The following table provides certain information about stock options outstanding and exercisable at December 31, 2005:
| | | Options Outstanding | | Options Exercisable | |
Range of exercise prices per share | | Number Outstanding (in thousands) | | Weighted Average Exercise Price Per Share | | Weighted Average Remaining Contractual Life in Years | | Number Exercisable (in thousands) | | Weighted Average Exercise Price Per Share | |
| Under $12.16 | | | 59 | | $ | 8.06 | | | 1.6 | | | 59 | | $ | 8.06 | |
| $12.17 - $15.20 | | | 244 | | $ | 14.02 | | | 4.0 | | | 244 | | $ | 14.02 | |
| $15.21 - $18.24 | | | 76 | | $ | 15.70 | | | 3.0 | | | 76 | | $ | 15.70 | |
| $18.25 - $21.28 | | | 307 | | $ | 20.06 | | | 6.6 | | | 238 | | $ | 19.98 | |
| $27.36 - $30.40 | | | 375 | | $ | 29.50 | | | 8.4 | | | 361 | | $ | 29.59 | |
| $6.08 - $30.40 | | | 1,061 | | $ | 21.02 | | | 6.1 | | | 978 | | $ | 20.99 | |
Community has a dividend reinvestment plan for shareholders under which additional shares of Community common stock may be purchased at a 5% discount off market prices with reinvested dividends and voluntary cash payments. Approximately 1.4 million shares of common stock have been reserved for this plan and approximately 1.1 million shares remain unissued. Purchases of Community common stock pursuant to this plan totaled 155,000 shares in 2005, 45,000 shares in 2004, and 64,000 shares in 2003.
Community Banks, Inc. and Subsidiaries
NOTES TO CONSOLIDATED FINANCIAL STATEMENTS
14. STOCK-BASED PLANS (Continued):
Community has an Employee Stock Purchase Plan under which shares of Community common stock may be purchased at a 10% discount off market prices with voluntary cash payments. Approximately 116,000 shares of common stock have been reserved for this plan and approximately 77,000 shares remain unissued. Purchases of Community common stock pursuant to this plan totaled 11,000 shares in 2005, 9,000 shares in 2004, and 6,000 shares in 2003.
15. RELATED PARTY TRANSACTIONS:
Certain directors and their business affiliates (defined as the beneficial ownership of at least a 10 percent interest), executive officers and their families are indebted to CommunityBanks for loans made in the ordinary course of business. In the opinion of management, such loans are consistent with sound banking practices and are within applicable regulatory lending limitations. The aggregate dollar amount of these loans was $23.7 million and $13.0 million at December 31, 2005 and 2004. During 2005, $6.7 million of new advances were made, repayments totaled $8.0 million and $12.0 million of related party loans were acquired in the PennRock merger.
Certain directors are owners or employees of entities that provide services to Community in the ordinary course of business. Fees for those services totaled $431,000 in 2005, $334,000 in 2004, and $310,000 in 2003.
Community has employment agreements with its executive officers that, among other provisions, provide for certain payments to the executives if they terminate their employment for certain reasons, primarily a change in the nature of their duties, a reduction in compensation, or a change in control of Community.
16. FAIR VALUES OF FINANCIAL INSTRUMENTS:
The following methodologies and assumptions were used by Community to estimate its fair value disclosures:
CASH AND DUE FROM BANKS, INTEREST-BEARING DEPOSITS, AND FEDERAL FUNDS SOLD:
The fair values for cash and due from banks, interest-bearing deposits, and federal funds sold is deemed to be the same as those assets’ carrying amounts.
INVESTMENT SECURITIES:
Fair values for investment securities are based on quoted market prices, where available. If quoted market prices are not available, fair values are based on quoted market prices of comparable instruments. The carrying value of Federal Home Loan Bank stock approximates fair value based on the redemption provision of the Federal Home Loan Bank.
ACCRUED INTEREST RECEIVABLE AND PAYABLE:
The fair values of accrued interest receivable and payable approximate their carrying amounts.
LOANS:
For variable-rate loans that reprice frequently with no significant change in credit risk, fair value equals carrying amount. The fair values of all other loans held in portfolio and loans held for sale are estimated by discounting the future cash flows using comparable current rates at which similar loans would be made to borrowers with similar credit risk.
DEPOSIT LIABILITIES:
The fair values of demand and savings deposits equal their carrying values. The carrying amounts for variable rate money market accounts approximate their fair values at the reporting date. Fair values for fixed-rate certificates of deposit are estimated by discounting expected future cash flows using rates currently offered for similar deposits.
SHORT-TERM BORROWINGS AND TRUST PREFERRED SECURITIES:
The fair values of short-term borrowings and trust preferred securities approximate their carrying amounts.
LONG-TERM DEBT:
The fair values of Community’s long-term borrowings are estimated using discounted cash flows analyses, based on rates available to Community for similar types of borrowings. The carrying amounts for variable rate subordinated debentures approximate their fair values at the reporting date.
OFF-BALANCE SHEET INSTRUMENTS:
Fair values for off-balance sheet, credit-related financial instruments are based on fees currently charged to enter into similar agreements, taking into account the remaining terms of the agreements and the counterparties’ credit standing.
The following table summarizes the carrying amounts and fair values of financial instruments at December 31, 2005 and 2004:
| | | 2005 | | 2004 | |
| | | Carrying Amount | | Estimated Fair Value | | Carrying Amount | | Estimated Fair Value | |
| | | (in thousands) | |
Financial assets: | | | | | | | | | |
Cash and due from banks, interest-bearing deposits, and federal funds sold | | $ | 81,243 | | $ | 81,243 | | $ | 45,273 | | $ | 45,273 | |
| Investment securities | | | 628,585 | | | 628,118 | | | 619,110 | | | 619,110 | |
| Loans held for sale | | | 2,568 | | | 2,568 | | | 1,505 | | | 1,505 | |
| Net loans | | | 2,211,532 | | | 2,204,611 | | | 1,201,530 | | | 1,198,973 | |
| Accrued interest receivable | | | 13,316 | | | 13,316 | | | 9,077 | | | 9,077 | |
| | | | | | | | | | | | | | |
Financial liabilities: | | | | | | | | | | | | | |
| Deposits | | $ | 2,294,367 | | $ | 2,292,606 | | $ | 1,305,537 | | $ | 1,305,486 | |
| Short-term borrowings | | | 87,253 | | | 87,253 | | | 47,116 | | | 47,116 | |
| Long-term debt | | | 430,719 | | | 435,065 | | | 404,662 | | | 408,168 | |
| Subordinated debt | | | 30,928 | | | 30,928 | | | 30,928 | | | 30,928 | |
| Accrued interest payable | | | 6,301 | | | 6,301 | | | 4,105 | | | 4,105 | |
| Off-balance sheet instruments | | | --- | | | --- | | | --- | | | --- | |
17. CONDENSED FINANCIAL INFORMATION OF COMMUNITY BANKS, INC. (PARENT ONLY)
| | | 2005 | | 2004 | |
| | | (in thousands) | |
Condensed Balance Sheets: | | | | | | | |
| Cash | | $ | 1,579 | | $ | 4,256 | |
| Interest bearing deposits in other banks | | | 53 | | | 72 | |
| Investment securities, available for sale | | | 2,338 | | | 1,324 | |
| Investment in banking subsidiary | | | 499,508 | | | 169,773 | |
| Investment in nonbank subsidiaries | | | 6,440 | | | 6,147 | |
| Other assets | | | 3,382 | | | 1,906 | |
| Total assets | | $ | 513,300 | | $ | 183,478 | |
| | | | | | | | |
| Short-term borrowings | | $ | 5,000 | | $ | --- | |
| Long-term debt | | | 30,928 | | | 30,928 | |
| Other liabilities | | | 699 | | | 209 | |
| Stockholders’ equity | | | 476,673 | | | 152,341 | |
| Total liabilities and stockholders’ equity | | $ | 513,300 | | $ | 183,478 | |
Community Banks, Inc. and Subsidiaries
NOTES TO CONSOLIDATED FINANCIAL STATEMENTS
17. CONDENSED FINANCIAL INFORMATION OF COMMUNITY BANKS, INC. (PARENT ONLY) (Continued):
| | | 2005 | | 2004 | | 2003 | |
| | | (in thousands) | |
Condensed Statements of Income: | | | | | | | | | | |
| Dividends from: | | | | | | | | | | |
| Banking subsidiary | | $ | 19,000 | | $ | --- | | $ | --- | |
| Nonbank subsidiaries | | | 2,263 | | | --- | | | --- | |
| Other income (expense) | | | (2,693 | ) | | (1,215 | ) | | (830 | ) |
| Income(loss) before equity in undistributed earnings of subsidiaries | | | 18,570 | | | (1,215 | ) | | (830 | ) |
| Equity in undistributed earnings of: | | | | | | | | | | |
| Banking subsidiary | | | 8,915 | | | 21,861 | | | 20,118 | |
| Nonbank subsidiaries | | | (1,844 | ) | | 1,152 | | | 1,112 | |
| | | | 7,071 | | | 23,013 | | | 21,230 | |
| Net income | | $ | 25,641 | | $ | 21,798 | | $ | 20,400 | |
| | | | | | | | | | | |
Condensed Statements of Cash Flows: | | | | | | | | | | |
Operating activities: | | | | | | | | | | |
| Net income | | $ | 25,641 | | $ | 21,798 | | $ | 20,400 | |
| Adjustments to reconcile net cash provided by operating activities: | | | | | | | | | | |
| Undistributed earnings of: | | | | | | | | | | |
| Banking subsidiary | | | (8,915 | ) | | (21,861 | ) | | (20,118 | ) |
| Nonbank subsidiaries | | | 1,844 | | | (1,152 | ) | | (1,112 | ) |
| Other, net | | | 709 | | | 391 | | | (398 | ) |
| Net cash provided (used) by operating activities | | | 19,279 | | | (824 | ) | | (1,228 | ) |
Investing activities: | | | | | | | | | | |
| Purchases of investment securities | | | (1,073 | ) | | (2,706 | ) | | (17,304 | ) |
| Proceeds from maturities and sales of investment securities | | | --- | | | 18,661 | | | 8,862 | |
| Payments for investments in and advances to subsidiaries | | | (3,966 | ) | | --- | | | --- | |
| Investment in unconsolidated trust subsidiaries | | | --- | | | --- | | | (464 | ) |
| Net cash provided (used) by investing activities | | | (5,039 | ) | | 15,955 | | | (8,906 | ) |
Financing activities: | | | | | | | | | | |
| Net change in short-term borrowings | | | 5,000 | | | (2,000 | ) | | 2,000 | |
| Proceeds from issuance of long term debt | | | --- | | | --- | | | 15,464 | |
| Proceeds from issuance of common stock | | | 8,012 | | | 2,308 | | | 4,525 | |
| Purchases of treasury stock | | | (16,489 | ) | | (4,151 | ) | | (3,627 | ) |
| Cash dividends | | | (13,440 | ) | | (8,273 | ) | | (7,645 | ) |
| Net cash provided (used) by financing activities | | | (16,917 | ) | | (12,116 | ) | | 10,717 | |
| | | | | | | | | | | |
| Net change in cash and cash equivalents | | | (2,677 | ) | | 3,015 | | | 583 | |
| Cash and cash equivalents at beginning of period | | | 4,256 | | | 1,241 | | | 658 | |
| Cash and cash equivalents at end of period | | $ | 1,579 | | $ | 4,256 | | $ | 1,241 | |
18. QUARTERLY RESULTS OF OPERATIONS (UNAUDITED):
The following is a summary of the quarterly results of operations for the years ended December 31, 2005 and 2004:
| | | Three Months Ended | |
| | | 2005 | | 2004 | |
| | | Dec. 31 | | Sept. 30 (1) | | June 30 | | Mar. 31 | | Dec. 31 | | Sept. 30 | | June 30 | | Mar. 31 | |
| | | (dollars in thousands, except per share data) | |
| Interest income | | $ | 45,242 | | $ | 43,478 | | $ | 27,390 | | $ | 26,183 | | $ | 25,710 | | $ | 25,227 | | $ | 24,882 | | $ | 23,980 | |
| Interest expense | | | 18,593 | | | 17,081 | | | 12,481 | | | 11,493 | | | 11,089 | | | 10,934 | | | 10,678 | | | 10,541 | |
| Net interest income | | | 26,649 | | | 26,397 | | | 14,909 | | | 14,690 | | | 14,621 | | | 14,293 | | | 14,204 | | | 13,439 | |
| Provision for loan losses | | | 600 | | | 400 | | | 750 | | | 550 | | | 750 | | | 750 | | | 750 | | | 850 | |
| Net interest income after provision for loan losses | | | 26,049 | | | 25,997 | | | 14,159 | | | 14,140 | | | 13,871 | | | 13,543 | | | 13,454 | | | 12,589 | |
| Investment security gains, net | | | 12 | | | 29 | | | 167 | | | 51 | | | 186 | | | 108 | | | 844 | | | 1,332 | |
| Mortgage banking activities | | | 631 | | | 660 | | | 548 | | | 515 | | | 652 | | | 558 | | | 828 | | | 627 | |
| Other income | | | 7,120 | | | 7,177 | | | 4,883 | | | 4,644 | | | 4,584 | | | 5,346 | | | 4,484 | | | 3,664 | |
| Other expenses | | | 20,180 | | | 20,836 | | | 13,189 | | | 12,659 | | | 12,618 | | | 12,530 | | | 12,962 | | | 11,883 | |
| Merger, conversion and restructuring expenses | | | --- | | | 248 | | | 7,957 | | | --- | | | --- | | | --- | | | --- | | | --- | |
| Income (loss) before income taxes | | | 13,632 | | | 12,779 | | | (1,389 | ) | | 6,691 | | | 6,675 | | | 7,025 | | | 6,648 | | | 6,329 | |
| Income taxes | | | 2,671 | | | 2,447 | | | (250 | ) | | 1,204 | | | 1,135 | | | 1,379 | | | 1,211 | | | 1,154 | |
| Net income (loss) | | $ | 10,961 | | $ | 10,332 | | $ | (1,139 | ) | $ | 5,487 | | $ | 5,540 | | $ | 5,646 | | $ | 5,437 | | $ | 5,175 | |
| | | | | | | | | | | | | | | | | | | | | | | | | | |
| Basic earnings (loss) per share | | $ | 0.48 | | $ | 0.44 | | $ | (0.09 | ) | $ | 0.45 | | $ | 0.45 | | $ | 0.46 | | $ | 0.45 | | $ | 0.42 | |
| Diluted earnings (loss) per share | | $ | 0.47 | | $ | 0.44 | | $ | (0.09 | ) | $ | 0.44 | | $ | 0.44 | | $ | 0.45 | | $ | 0.43 | | $ | 0.41 | |
| Cash dividends declared | | $ | 0.20 | | $ | 0.19 | | $ | 0.19 | | $ | 0.17 | | $ | 0.17 | | $ | 0.17 | | $ | 0.17 | | $ | 0.16 | |
| (1) Results beginning with the quarter ended September 30, 2005 include PennRock acquired July 1, 2005 |
19. MERGER, CONVERSION AND RESTRUCTURING EXPENSES
Primarily during the second quarter of 2005, Community recognized expenses for the prepayment of FHLB advances in conjunction with: a balance sheet restructuring; the merger with PennRock Financial Services Corp.; and the conversion of its core operating system. The expenses totaled $8.2 million and appear on a separately captioned line in non-interest expenses on the Statement of Income, and include the following:
(a) A prepayment penalty of $6 million was incurred and paid during the second quarter as a result of retiring $60 million of FHLB advances that had a weighted average cost in excess of Community’s incremental wholesale borrowing rate and conversion features that could result in maturities beyond the stated maturity at terms not necessarily favorable to Community. No additional expenses are expected to be incurred.
(b) Merger-related expenses totaling $1.3 million year-to-date were incurred for the following: severance and retention payments to Community employees being displaced in the merger, $570,000; contract cancellations and closing of duplicate facilities, $555,000; other, $210,000. No additional expenses are expected to be incurred. At December 31, 2005, accrued and unpaid expenses total $417,000.
(c) Conversion expenses incurred during the second quarter totaled approximately $800,000 and related to training, asset dispositions, and other costs incurred in connection with the conversion and updating of Community’s core operating system. The conversion was completed in the second quarter. During the third quarter, all accrued balances were paid. No other additional expenses are expected to be incurred.
REPORT OF INDEPENDENT REGISTERED
PUBLIC ACCOUNTING FIRM
To the Board of Directors and Stockholders
Community Banks, Inc.
Harrisburg, Pennsylvania
We have audited the accompanying consolidated balance sheets of Community Banks, Inc. and subsidiaries as of December 31, 2005 and 2004, and the related consolidated statements of income, changes in stockholders’ equity, and cash flows for each of the years in the three-year period ended December 31, 2005. These consolidated financial statements are the responsibility of the Company’s management. Our responsibility is to express an opinion on these consolidated financial statements based on our audits.
We conducted our audits in accordance with the standards of the Public Company Accounting Oversight Board (United States). Those standards require that we plan and perform the audits to obtain reasonable assurance about whether the financial statements are free of material misstatement. An audit includes examining, on a test basis, evidence supporting the amounts and disclosures in the financial statements. An audit also includes assessing the accounting principles used and significant estimates made by management, as well as evaluating the overall financial statement presentation. We believe that our audits provide a reasonable basis for our opinion.
In our opinion, the consolidated financial statements referred to above present fairly, in all material respects, the consolidated financial position of Community Banks, Inc. and its subsidiaries as of December 31, 2005 and 2004, and the results of its operations and its cash flows for each of the years in the three-year period ended December 31, 2005 in conformity with accounting principles generally accepted in the United States of America.
We also have audited, in accordance with the standards of the Public Company Accounting Oversight Board (United States), the effectiveness of Community Banks Inc.’s internal control over financial reporting as of December 31, 2005, based on criteria established in Internal Control—Integrated Framework issued by the Committee of Sponsoring Organizations of the Treadway Commission (COSO), and our report dated March 9, 2006 expressed an unqualified opinion on management’s assessment of internal control over financial reporting and an unqualified opinion on the effectiveness of internal control over financial reporting.
Beard Miller Company LLP | |
| Harrisburg, Pennsylvania | |
| March 9, 2006 | |
None.
Under the supervision and with the participation of Community’s management, including its Chief Executive Officer and Chief Financial Officer, Community has evaluated the effectiveness of its disclosure controls and procedures as of December 31, 2005. Based upon this evaluation, the Chief Executive Officer and Chief Financial Officer have concluded that Community’s disclosure controls and procedures are adequate and effective to ensure that material information relating to Community and its consolidated subsidiaries is made known to them by others within those entities, particularly during the period in which this report was prepared. There have not been any changes in Community’s internal control over financial reporting (as such term is defined in Rules 13a-15(f) and 15d-15(f) under the Exchange Act) during the most recent fiscal quarter that have materially affected, or are reasonably likely to materially affect, Community’s internal control over financial reporting.
Because of inherent limitations, our disclosure controls and procedures may not prevent or detect misstatements. A control system, no matter how well conceived and operated, can provide only reasonable, not absolute, assurance that the objectives of the control system are met. Because of the inherent limitations in all control systems, no evaluation of controls can provide absolute assurance that all control issues and instances of fraud, if any, have been detected.
Management’s report on internal controls can be found at page 86.
None.
Management’s Report on Internal Controls
The management of Community Banks, Inc. is responsible for designing, implementing, documenting, and maintaining an adequate system of internal control over financial reporting. An adequate system of internal control over financial reporting encompasses the processes and procedures that have been established by management to:
| · | maintain records that accurately reflect the company’s transactions; |
| · | prepare financial statement and footnote disclosures in accordance with GAAP that can be relied upon by external users; |
| · | prevent and detect unauthorized acquisition, use, or disposition of the company’s assets that could have a material effect on the financial statements. |
Management is also responsible to perform an annual evaluation of the system of internal control over financial reporting, including an assessment of the effectiveness of that system. Management’s assessment is based upon the control framework established by the Committee of Sponsoring Organizations of the Treadway Commission (COSO). The COSO framework identifies five defining characteristics of a system of internal control as follows: an appropriate control environment; an adequate risk assessment process; sufficient control activities; satisfactory communication of pertinent information; and proper monitoring controls.
Management performed an assessment of the effectiveness of its internal control over financial reporting in accordance with the COSO framework. As part of this process, consideration was given to the potential existence of deficiencies in either the design or operating effectiveness of controls. Based on this assessment, management believes that Community maintained effective internal controls over financial reporting, including disclosure controls and procedures, as of December 31, 2005. Furthermore, during the conduct of its assessment, management identified no material weakness in its financial reporting control system.
The Board of Directors of Community, through its Audit Committee, provides oversight to management’s conduct of the financial reporting process. The Audit Committee, which is composed entirely of independent directors, is also responsible to recommend the appointment of independent public accountants. The Audit Committee also meets with management, the internal audit staff, and the independent public accountants throughout the year to provide assurance as to the adequacy of the financial reporting process and to monitor the overall scope of the work performed by the internal audit staff and the independent public accountants.
The consolidated financial statements of Community have been audited by Beard Miller Company LLP, an independent registered public accounting firm, who was engaged to express an opinion as to the fairness of presentation of such financial statements. In connection therewith, Beard Miller Company LLP is required to issue an attestation report on management’s assessment of internal control over financial reporting and, in addition, is required to form its own opinion as to the effectiveness of those controls. Their opinion on the fairness of the financial statement presentation, and their attestation and opinion on internal controls over financial reporting are included herein.
Chairman of the Board and Executive Vice President and
Chief Executive Officer Chief Financial Officer
Community Banks, Inc. • 750 East Park Drive, 2nd Floor • Harrisburg, PA 17111 • Phone 717-920-1698
REPORT OF INDEPENDENT REGISTERED
PUBLIC ACCOUNTING FIRM
To the Board of Directors and Stockholders
Community Banks, Inc.
Harrisburg, Pennsylvania
We have audited management’s assessment, included in the accompanying Management’s Report on Internal Control, that Community Banks, Inc. maintained effective internal control over financial reporting as of December 31, 2005, based on criteria established in Internal Control—Integrated Framework issued by the Committee of Sponsoring Organizations of the Treadway Commission (COSO). Community Banks Inc.’s management is responsible for maintaining effective internal control over financial reporting and for its assessment of the effectiveness of internal control over financial reporting. Our responsibility is to express an opinion on management’s assessment and an opinion on the effectiveness of the Company’s internal control over financial reporting based on our audit.
We conducted our audit in accordance with the standards of the Public Company Accounting Oversight Board (United States). Those standards require that we plan and perform the audit to obtain reasonable assurance about whether effective internal control over financial reporting was maintained in all material respects. Our audit included obtaining an understanding of internal control over financial reporting, evaluating management’s assessment, testing and evaluating the design and operating effectiveness of internal control, and performing such other procedures as we considered necessary in the circumstances. We believe that our audit provides a reasonable basis for our opinion.
A company’s internal control over financial reporting is a process designed to provide reasonable assurance regarding the reliability of financial reporting and the preparation of financial statements for external purposes in accordance with generally accepted accounting principles. A company’s internal control over financial reporting includes those policies and procedures that (1) pertain to the maintenance of records that, in reasonable detail, accurately and fairly reflect the transactions and dispositions of the assets of the company; (2) provide reasonable assurance that transactions are recorded as necessary to permit preparation of financial statements in accordance with generally accepted accounting principles, and that receipts and expenditures of the company are being made only in accordance with authorizations of management and directors of the company; and (3) provide reasonable assurance regarding prevention or timely detection of unauthorized acquisition, use, or disposition of the company’s assets that could have a material effect on the financial statements.
Because of its inherent limitations, internal control over financial reporting may not prevent or detect misstatements. Also, projections of any evaluation of effectiveness to future periods are subject to the risk that controls may become inadequate because of changes in conditions, or that the degree of compliance with the policies or procedures may deteriorate.
In our opinion, management’s assessment that Community Banks Inc. maintained effective internal control over financial reporting as of December 31, 2005, is fairly stated, in all material respects, based on criteria established in Internal Control—Integrated Framework issued by the Committee of Sponsoring Organizations of the Treadway Commission (COSO). Also in our opinion, Community Banks Inc. maintained, in all material respects, effective internal control over financial reporting as of December 31, 2005, based on criteria established in Internal Control—Integrated Framework issued by the Committee of Sponsoring Organizations of the Treadway Commission (COSO).
We have also audited, in accordance with the standards of the Public Company Accounting Oversight Board (United States), the consolidated balance sheets and the related consolidated statements of income, changes in stockholders’ equity, and cash flows of Community Banks Inc., and our report dated March 9, 2006 expressed an unqualified opinion.
Beard Miller Company LLP | |
| Harrisburg, Pennsylvania | |
| March 9, 2006 | |
PART III
Incorporated by reference to the Corporation’s definitive Proxy Statement for its 2006 Annual Meeting of Shareholders, which will be filed on or before April 28, 2006.
Copies of Community’s Code of Ethics for the Chief Executive Officer and Financial Professionals are available on Community’s website, www.communitybanks.com, or by writing to Donald F. Holt, EVP/CFO, Community Banks, Inc., 750 East Park Drive, Harrisburg, PA 17111.
Incorporated by reference to the Corporation’s definitive Proxy Statement for its 2006 Annual Meeting of Shareholders, which will be filed on or before April 28, 2006.
Incorporated by reference to the Corporation’s definitive Proxy Statement for its 2006 Annual Meeting of Shareholders, which will be filed on or before April 28, 2006.
Incorporated by reference to the Corporation’s definitive Proxy Statement for its 2006 Annual Meeting of Shareholders, which will be filed on or before April 28, 2006.
Information concerning the fees billed by our independent auditor and the nature of services comprising the fees for each of the two most recent fiscal years in each of the following categories: (i) audit fees, (ii) audit - related fees, (iii) tax fees and (iv) all other fees, is set forth under the caption “Relationship with Independent Certified Public Accountants” in the Corporation’s definitive Proxy Statement for its 2006 Annual Meeting of Shareholders and is incorporated herein by reference.
Information concerning our Audit Committee’s policies and procedures pertaining to pre-approval of audit and non-audit services rendered by our independent auditor is set forth in the Audit Committee segment of the Corporation’s definitive Proxy Statement for its 2006 Annual Meeting of Shareholder and is incorporated herein by reference.
PART IV
| (a) | The following documents are filed as part of this report. |
| | 1. | Financial Statements - The following consolidated financial statements of Community Banks, Inc. and Subsidiaries are incorporated herein by reference in response to Item 8 above: |
| | | |
| | (i) | Consolidated Balance Sheets at December 31, 2005 and 2004 |
| | (ii) | Consolidated Statements of Income for the Years Ended December 31, 2005, 2004 and 2003 |
| | (iii) | Consolidated Statements of Changes in Stockholders’ Equity for the Years Ended December 2005, 2004, and 2003. |
| | (iv) | Consolidated Statements of Cash Flows for the Years Ended December 31, 2005, 2004 and 2003. |
| | (v) | Notes to Consolidated Financial Statements |
| | (vi) | Report of Beard Miller Company LLP, Independent Registered Public Accounting Firm |
| | | |
| | 2. | Financial Statements Schedules - All financial statement schedules for which provision is made in the applicable accounting regulations of the Securities and Exchange Commission are not required under the related instructions or are inapplicable and have therefore been omitted. |
| | | |
| | 3. | Exhibits |
| | | |
| | 2.1 | Agreement and Plan of Reorganization, dated November 7, 2000, among Community Banks, Inc.; The Peoples State Bank; and The Glen Rock State Bank, not including schedules. Community will furnish the omitted schedules to the Securities and Exchange Commission upon request. (Incorporated by reference to Exhibit 2 to Community’s registration statement on Form S-4, filed on January 17, 2001) |
| | 2.2 | Merger agreement between PennRock Financial Services Corp. and Community Banks, Inc., dated November 16, 2004, not including schedules. Community will furnish the omitted schedules to the Securities and Exchange Commission upon request. (Incorporated by reference to Exhibit 10.1 to Community’s Current Report on Form 8-K, filed with the Commission on November 22, 2004) |
| | 3(i) | Amended and Restated Articles of Incorporation (Incorporated by reference to Annex B, attached to Community’s registration statement on Form S-4/A, filed on April 26, 2005) |
| | 3(ii) | Amended Bylaws (Incorporated by reference to Exhibit 3(ii), attached to Community’s Current Report on Form 8-K, filed with the Commission on March 9, 2006) |
| | 4 | Instruments defining the rights of the holders of trust capital securities and sold by Community in December 2002, December 2003 and January 2006 are not attached, as the amount of such securities is less than 10% of the consolidated assets of Community and its subsidiaries, and the securities have not been registered. Community agrees to provide copies of such instruments to the SEC upon request. |
| | 10.1 | 2000 Directors’ Stock Option Plan (Incorporated by reference to Exhibit 4 to Community’s registration statement no. 333-37232 on Form S-8, filed on May 17, 2000) |
| | 10.2 | 1998 Long-Term Incentive Plan (Incorporated by reference to Exhibit 4 to Community’s registration statement no. 333-57121 on Form S-8 filed on June 18, 1998) |
| | 10.3 | Form of Stock Option Agreement - Directors Stock Option Plan (Incorporated by reference to 10.3 to Community’s Annual Report on Form 10-K for the year ended December 31, 2002, filed with the Commission on March 28, 2003) |
| | 10.4 | Form of Stock Option Agreement - Long-Term Incentive Plan (Incorporated by reference to Exhibit 10.4 to Community’s Annual Report on Form 10-K for the year ended December 31, 2002, filed with the Commission on March 28, 2003) |
| | 10.5 | Employment Agreement for Eddie L. Dunklebarger (Incorporated by reference to Exhibit 10.1 to Community’s Quarterly Report on Form 10-Q for the quarter ended September 30, 2004, filed with the Commission on November 9, 2004)* |
| | 10.6 | Employment Agreement for Donald F. Holt (Incorporated by reference to Exhibit 10.2 to Community’s Quarterly Report on Form 10-Q for the quarter ended September 30, 2004, filed with the Commission on November 9, 2004)* |
| | 10.7 | Employment Agreement for Robert W. Lawley (Incorporated by reference to Exhibit 10.3 to Community’s Quarterly Report on Form 10-Q for the quarter ended September 30, 2004, filed with the Commission on November 9, 2004)* |
| | 10.8 | Employment Agreement for Anthony N. Leo (Incorporated by reference to Exhibit 10.4 to Community’s Quarterly Report on Form 10-Q for the quarter ended September 30, 2004, filed with the Commission on November 9, 2004)* |
| | 10.9 | Employment Agreement for Jeffrey M. Seibert (Incorporated by reference to Exhibit 10.5 to Community’s Quarterly Report on Form 10-Q for the quarter ended September 30, 2004, filed with the Commission on November 9, 2004)* |
| | 10.10 | Amended and Restated Salary Continuation Agreement of Eddie L. Dunklebarger (Incorporated by reference to Exhibit 10.1 to Community’s Quarterly Report on Form 10-Q for the quarter ended March 31, 2004, filed with the Commission on May 10, 2004)* |
| | 10.11 | Salary Continuation Agreement of Donald F. Holt (Incorporated by reference to Exhibit 10.2 to Community’s Quarterly Report on Form 10-Q for the quarter ended March 31, 2004, filed with the Commission on May 10, 2004)* |
| | 10.12 | Amended and Restated Salary Continuation Agreement of Robert W. Lawley (Incorporated by reference to Exhibit 10.3 to Community’s Quarterly Report on Form 10-Q for the quarter ended March 31, 2004, filed with the Commission on May 10, 2004)* |
| | 10.13 | Amended and Restated Salary Continuation Agreement of Anthony N. Leo (Incorporated by reference to Exhibit 10.4 to Community’s Quarterly Report on Form 10-Q for the quarter ended March 31, 2004, filed with the Commission on May 10, 2004)* |
| | 10.14 | Amended and Restated Salary Continuation Agreement of Jeffrey M. Seibert (Incorporated by reference to Exhibit 10.5 to Community’s Quarterly Report on Form 10-Q for the quarter ended March 31, 2004, filed with the Commission on May 10, 2004)* |
| | 10.15 | Rights Agreement between Community Banks, Inc. and CommunityBanks, dated February 28, 2002 (Incorporated by reference to Exhibit 1 to Community’s registration on Form 8-A, filed on February 27, 2002) |
| | 10.16 | Community Banks, Inc. 401(k) Plan (Incorporated by reference to Exhibit 10.15 to Community’s Annual Report on Form 10-K for the year ended December 31, 2002, filed with the Commission on March 28, 2003) |
| | 10.17 | Survivor Income Agreement, with Split Dollar Addendum thereto, of Eddie L. Dunklebarger (Incorporated by reference to Exhibit to 3.2, attached to Community’s Quarterly Report on Form 10-Q for the quarter ended September 30, 2003)* |
| | 10.18 | Survivor Income Agreement, with Split Dollar Addendum thereto, of Donald F. Holt (Incorporated by reference to Exhibit to 10.6, attached to Community’s Quarterly Report on Form 10-Q for the quarter ended March 31, 2004)* |
| | 10.19 | Survivor Income Agreement, with Split Dollar Addendum thereto, of Robert W. Lawley (Incorporated by reference to Exhibit to 3.2, attached to Community’s Quarterly Report on Form 10-Q for the quarter ended September 30, 2003)* |
| | 10.20 | Survivor Income Agreement, with Split Dollar Addendum thereto, of Anthony N. Leo (Incorporated by reference to Exhibit to 3.2, attached to Community’s Quarterly Report on Form 10-Q for the quarter ended September 30, 2003)* |
| | 10.21 | Survivor Income Agreement, with Split Dollar Addendum thereto, of Jeffrey M. Seibert (Incorporated by reference to Exhibit to 3.2, attached to Community’s Quarterly Report on Form 10-Q for the quarter ended September 30, 2003)* |
| | 10.22 | Employment and Consulting Agreement with Melvin Pankuch (Incorporated by reference to Exhibit 10.7 to Community’s registration statement on Form S-4, filed on April 1, 2005)* |
| | 10.23 | Community Banks, Inc. Substitute PennRock Financial Services Corp. Stock Incentive Plan of 2002 (Incorporated by reference to Exhibit 4 to Community’s registration statement no. 333-126508 on Form S-8, filed on July 11, 2005) |
| | 10.24 | Community Banks, Inc. Substitute PennRock Financial Services Corp. Omnibus Stock Plan (Incorporated by reference to Exhibit 4 to Community’s registration statement no. 333-126507 on Form S-8, filed on July 11, 2005) |
| | 21 | Subsidiaries of the Registrant (See Item 1, page #4) |
| | 23.1 | Consent of Independent Registered Public Accounting Firm - Beard Miller Company LLP |
| | 31.1 | Rule 13a-14(a)/15d-14(a) Certification (Chief Executive Officer) |
| | 31.2 | Rule 13a-14(a)/15d-14(a) Certification (Chief Financial Officer) |
| | 32.1 | Section 1350 Certification (Chief Executive Officer) |
| | 32.2 | Section 1350 Certification (Chief Financial Officer) |
* identifies a management contract or compensatory plan or arrangement
| (b) | Exhibits - The exhibits required to be filed as part of this report are submitted as a separate section of this report. |
| (c) | Financial Statements Schedules - None required. |
Pursuant to the requirements of Section 13 or 15(d) of the Securities Exchange Act of 1934, the Registrant has duly caused this report to be signed on its behalf by the undersigned, thereunto duly authorized.
Community Banks, Inc.
By: /S/ (Eddie L. Dunklebarger)
(Eddie L. Dunklebarger)
Chairman of the Board, President, Chief Executive Officer and Director
Date: March 16, 2006
Pursuant to the requirements of the Securities Exchange Act of 1934, this report has been signed below by the following persons on behalf of the registrant and in the capacities and on the dates indicated.
| /S/ | (Donald F. Holt) | Executive Vice President and Chief Financial Officer (Principal Financial Officer and Principal Accounting Officer) | 3/16/06 |
| | (Donald F. Holt) | |
| | | | |
| /S/ | (Ronald E. Boyer) | Director | 3/16/06 |
| | (Ronald E. Boyer) | | |
| | | | |
| /S/ | (Sandra J, Bricker) | Director | 3/16/06 |
| | (Sandra J. Bricker) | | |
| | | | |
| /S/ | (Peter DeSoto) | Director | 3/16/06 |
| | (Peter DeSoto) | | |
| | | | |
| /S/ | (Aaron S. Kurtz) | Director | 3/16/06 |
| | (Aaron S. Kurtz) | | |
| | | | |
| /S/ | (Earl L. Mummert) | Director | 3/16/06 |
| | (Earl L. Mummert) | | |
| | | | |
| /S/ | (Scott J. Newkam) | Director | 3/16/06 |
| | (Scott J. Newkam) | | |
| | | | |
| /S/ | (Melvin Pankuch) | Director | 3/16/06 |
| | (Melvin Pankuch) | | |
| | | | |
| /S/ | (Robert W. Rissinger) | Director | 3/16/06 |
| | (Robert W. Rissinger) | | |
| | | | |
| /S/ | (Christine Sears) | Director | 3/16/06 |
| | (Christine Sears) | | |
| | | | |
| /S/ | (Allen Shaffer) | Director | 3/16/06 |
| | (Allen Shaffer) | | |
| | | | |
| /S/ | (John W. Taylor, Jr.) | Director | 3/16/06 |
| | (John W. Taylor, Jr.) | | |
| | | | |
| /S/ | (James A. Ulsh) | Director | 3/16/06 |
| | (James A. Ulsh) | | |
| | | | |
| /S/ | (Dale M. Weaver) | Director | 3/16/06 |
| | (Dale M. Weaver) | | |
| | | | |
| /S/ | (Glenn H. Weaver) | Director | 3/16/06 |
| | (Glenn H. Weaver) | | |
| | | | |
| /S/ | (Robert K. Weaver) | Director | 3/16/06 |
| | (Robert K. Weaver) | | |