UNITED STATES
SECURITIES AND EXCHANGE COMMISSION
Washington, D.C. 20549
FORM 10-K
[ X ] ANNUAL REPORT PURSUANT TO SECTION 13 or 15(d) OF
THE SECURITIES EXCHANGE ACT OF 1934
For the fiscal year ended December 31, 2006
or
[ ] TRANSITION REPORT PURSUANT TO SECTION 13 OR 15(d) OF
THE SECURITIES EXCHANGE ACT OF 1934
Commission File Number 001-11663
COMMUNITY BANKS, INC.
(Exact name of registrant as specified in its charter)
Pennsylvania | | 23-2251762 |
(State of Incorporation) | | (I.R.S. Employer Identification No.) |
| | | |
777 East Park Drive, Harrisburg, PA | | 17111 |
(Address of principal executive offices) | | (Zip Code) |
Registrant’s telephone number, including area code: (717) 920-5800
Securities registered pursuant to Section 12 (b) of the Act:
Title of Each Class | | Name of Each Exchange on Which Registered |
Common Stock, par value $5 per share | | NASDAQ Global Select Market |
Securities registered pursuant to Section 12 (g) of the Act: None
| Indicate by check mark if the registrant is a well-known seasoned issuer, as defined in Rule 405 of the Securities Act. | Yes | | | No | X |
| Indicate by check mark if the registrant is not required to file reports pursuant to Section 13 or Section 15(d) of the Act. | Yes | | | No | X |
Indicate by check mark whether the registrant (1) has filed all reports required to be filed by section 13 or 15(d) of the Securities Exchange Act of 1934 during the preceding 12 months (or for shorter period that the registrant was required to file such reports), and (2) has been subject to
| such filing requirements for the past 90 days. | Yes | X | | No | |
Indicate by check mark if disclosure of delinquent filers pursuant to Item 405 of Regulation S-K is not contained herein, and will not be contained, to the best of registrant’s knowledge, in definitive proxy or information statements incorporated by reference in Part III of the Form 10-K or any amendments to this Form 10-K. [X ]
| Indicate by check mark whether the registrant is a large accelerated filer, an accelerated filer, or a non-accelerated filer. See definition of “accelerated filer and larger accelerated filer” in Rule 12b-2 of the Exchange Act. |
| Large accelerated filer | | | Accelerated filer | X | | Non-accelerated filer | |
| Indicate by check mark whether the registrant is a shell company (as defined in Rule 12b-2 of the Act). | Yes | | | No | X |
Aggregate market value of the Common Stock, $5 par value, held by non-affiliates, computed by reference to the closing price on June 30, 2006: $576,000,000
Number of shares of the Common Stock, $5 par value, outstanding as of the close of business on February 28, 2007: 23,541,000 shares.
Documents Incorporated by Reference:
Portions of the Proxy Statement for the 2007 Annual Meeting of Shareholders of Community Banks, Inc., have been incorporated by reference into Part III.
(This page intentionally blank)
COMMUNITY BANKS, INC.
FORM 10-K
INDEX
PART I | | Page |
| | | |
| Item 1 | | 4 - 10 |
| Item 1A | | 10 - 12 |
| Item 1B | | 13 |
| Item 2 | | 13 |
| Item 3 | | 13 |
| Item 4 | | 13 |
| | | |
| | | |
PART II | | |
| | | |
| Item 5 | | 14 - 15 |
| Item 6 | | 16 |
| Item 7 | | 17 - 54 |
| Item 7A | | 55 - 57 |
| Item 8 | | 58 - 90 |
| Item 9 | | 91 |
| Item 9A | | 91 |
| Item 9B | | 91 |
| | | |
| | | |
PART III | | |
| | | |
| Item 10 | | 94 |
| Item 11 | | 94 |
| Item 12 | | 94 |
| Item 13 | | 94 |
| Item 14 | | 94 |
| | | |
| | | |
PART IV | | |
| | | |
| Item 15 | | 95 - 96 |
| | | |
| | | |
| | 97 - 98 |
| | | |
| | | |
PART I
General
Business Overview
Community Banks, Inc., (the “Corporation” or “Community”) is a financial holding company that was formed as a Pennsylvania corporation in 1982. Community directly owns 100% of its operating subsidiaries. Its major operating entity is its wholly-owned banking subsidiary, referred to in this report as CommunityBanks (or the “Bank”), and includes several other subsidiaries of both the holding company and the Bank, each of which was formed to facilitate delivery of non-banking services to its customers and the Bank. Community’s banking subsidiary has nearly $3.5 billion in assets and aggregate annual revenues exceeding $140 million at December 31, 2006. The executive offices of Community are located at 777 East Park Drive, Harrisburg, Pennsylvania 17111. Community provides its services primarily through its community banking offices that are located throughout the central portion of Pennsylvania stretching from the Pocono Mountains in northeastern Pennsylvania to just over the Pennsylvania border in Carroll County, Maryland.
The common stock of Community is listed on the Global Select Market Tier of the Nasdaq Stock Market under the symbol CMTY. Community’s internet address is www.communitybanks.com. Electronic copies of Annual Reports on Form 10-K, Quarterly Reports on Form 10-Q and Current Reports on Form 8-K, and amendments to those reports filed or furnished pursuant to Section 13(a) or 15(d) of the Exchange Act, are available through the “Investor Relations” section of Community’s website as soon as reasonably practicable after filing such material with, or furnishing it to, the Securities and Exchange Commission. Copies of such reports are also available at no charge.
Community conducts a traditional and full service commercial and retail banking business and also provides trust services through 74 retail banking offices located throughout Pennsylvania and Maryland. The delivery of customer services has been constructed around a regional operating and management structure which emphasizes local delivery of customer services combined with centralized support functions. Currently, the Bank operates six individual regions. Community conducts its business within 11 counties in Pennsylvania and Maryland. The following is a summary of the number of offices operating in each county of Community’s market, presented in the order of the highest deposit balances per county. This information is provided pursuant to a formal request of the Federal Deposit Insurance Corporation (“FDIC”) as of June 30th of each year.
Pennsylvania Counties | | Number of Offices | | Deposits at June 30, 2006 | |
| | | | | | | (in thousands) | |
| York | | | 20 | | $ | 595,412 | |
| Lancaster | | | 12 | | | 547,810 | |
| Dauphin | | | 11 | | | 293,887 | |
| Berks | | | 6 | | | 286,328 | |
| Schuylkill | | | 7 | | | 195,910 | |
| Adams | | | 3 | | | 132,978 | |
| Luzerne | | | 3 | | | 109,338 | |
| Cumberland | | | 5 | | | 78,208 | |
| Northumberland | | | 2 | | | 68,581 | |
| Chester | | | 2 | | | 63,075 | |
| Snyder | | | 1 | | | 17,736 | |
| | | | | | | | |
Maryland Counties | | | | | | | |
| | | | | | | | |
| Carroll | | | 2 | | $ | 25,105 | |
The Bank operates in a geographic market that is home to a wide range of construction, manufacturing, distribution, health care, and agricultural industries and also includes various other service industry components. The Corporation’s headquarters is located in Harrisburg Pennsylvania, which is the state capital of Pennsylvania, and is the hub of the Commonwealth’s various governmental departments, units, and agencies. The Bank offers a wide range of personal banking services, including a variety of checking and savings products, time deposits and individual retirement accounts. Retail customers are also served by a product line that includes secured loan products, such as home equity loans and lines of credit, construction loans and residential mortgage loans. Residential loans are generally underwritten based on secondary market standards and the vast majority of originations are sold in the secondary market. Consumer loan products also include automobile loans, personal lines of credit and a checking account overdraft protection service.
Commercial banking services are provided to small and medium-sized businesses almost all of which are operated within Community’s footprint. Commercial lending offerings include commercial, commercial real estate, commercial construction and agricultural loans. Commercial loans, by their nature carry higher risk than credit extensions to individual consumers. Ongoing changes in a commercial borrowers’ financial condition and cash flow, plus the potential for volatility in the value of collateral has an inherently higher risk profile. The Corporation also offers letters of credit, traditional deposit products, and cash management services.
Non-banking subsidiaries
Over the years, Community has formed various special purpose wholly-owned subsidiaries, including companies formed to provide specialized services to its customers. All of these subsidiaries are engaged in activities related to the business of banking. In addition to the Bank, the financial services holding company maintains two special purpose subsidiaries, which include CommunityBanks Investments, Inc. (CBII), an investment holding company and Community Banks Life Insurance Company, Inc. (CBLIC), a credit life reinsurance company. In addition to its traditional business banking, retail banking and trust services offered through the Bank, the Bank itself operates additional specialized subsidiaries to facilitate delivery of non-banking services to customers. Banking subsidiaries include: Community Banks Insurance Services LLC, which offers property and casualty and personal insurance lines to businesses and consumers; and Community Settlement, LLC, which provides title and real estate settlement services. Other non-bank subsidiaries have been formed to facilitate operations of the Bank and include UDNB Inc., an investment holding company; CB Services LLC, a payroll services provider and PSB Realty Company, a real estate holding company. On July 1, 2005, Community acquired Blue Ball National Bank (“Blue Ball”) through its acquisition of PennRock Financial Services Corp. (“PennRock”). Blue Ball, which was PennRock’s major operating subsidiary, was merged into the Bank and now operates as a separate division in the Lancaster, Berks and Chester County segments of the franchise.
Subsidiary trusts, which are not consolidated in the financial statements in accordance with provisions of Financial Accounting Standards Board (FASB) Interpretation No. 46, “Consolidation of Variable Interest Entities, An Interpretation of ARB No. 51,” have been formed to execute trust preferred issuances: CMTY Capital Trust I in December, 2002, for a pooled issuance of $15 million and CMTY Statutory Capital Trust II in December, 2003, for an issuance of $15 million. In January, 2006, Community formed CMTY Statutory Capital Trust III and CMTY Statutory Capital Trust IV for pooled issuances of $10 million each.
At December 31, 2006 no single non-banking subsidiary had net income exceeding 5% of consolidated net income.
Operating Segments
All of the operations of Community operate and are reported under its one reportable segment, community banking.
Employees
At December 31, 2006, Community had 993 full-time equivalent employees and Community considers its employee relations to be satisfactory.
History and Pending Acquisitions
The current charter for the Bank’s primary predecessor bank was originally granted in 1911. Community was formed from several predecessor banks pursuant to mergers that took place over a number of years prior to the advent of interstate banking. These historical mergers were subject to geographical limitations imposed by state and federal banking regulations that significantly limited bank merger activity until the 1980’s. In 1998, Community entered into a benchmark merger agreement that provided the foundation for the current organization. At that time, People’s State Bank, a state-chartered bank with offices throughout Pennsylvania’s York and Adams county region and Community Banks, N.A, a federally-chartered bank with headquarters in Dauphin County, Pennsylvania were merged as subsidiaries of Community Banks, Inc. These two banks would eventually come together under a common management team and under the common identity of “CommunityBanks”. The consolidation of these two banks was designed to facilitate the aforementioned regional operating focus, ease regulatory burdens and, at the same time, sustain an operating philosophy that adhered to a philosophy of local decision-making.
Subsequent to the 1998 merger, management focused on continuing to build the franchise through smaller banking mergers, the formation or acquisition of specialized financial services businesses, and de novo office expansion. The Corporation’s most recent transformational merger occurred on July 1, 2005, when Community completed its acquisition of PennRock. At the time of the announcement of the merger, Community had nearly $2 billion of assets and $1.3 billion in deposits. The acquisition of PennRock, and its primary operating subsidiary, Blue Ball Bank, added $1.2 billion in assets, $880 million in deposits, and extended Community’s banking market into the vibrant Lancaster, Berks and Chester counties of southeastern Pennsylvania. At the time of the merger, Blue Ball was legally merged into the Bank but continues to operate as a separate division within its core markets.
During 2006, Community completed two smaller mergers: the Wiley Agency, an insurance agency located in Lancaster County, Pennsylvania and; Sentry Trust, a separate trust services division of a competitor bank. Each of these acquisitions was designed to leverage existing platforms of the insurance and trust segments of the Corporation’s existing businesses.
In the third quarter of 2006, Community announced mergers of BUCS Financial Corp (BUCS) and East Prospect State Bank (East Prospect). BUCS is a former credit union that now operates as BUCS Federal Bank. BUCS has four offices that are located just north of the Baltimore, Maryland beltway, in Baltimore and Howard Counties. At the time of the announcement BUCS had just over $140 million in assets and will serve as Community’s first significant entry into the northern Maryland market. East Prospect is a single unit bank with approximately $45 million of deposits and operates within the heart of Community’s York county market. East Prospect will be operated as a retail office within Community’s York County region. Each of the acquired banks will be merged into the Bank and both mergers are expected to be completed in the second quarter of 2007.
Competition
There are approximately 1,265 offices of commercial and savings banks operating within the market area in which Community competes. The following presentation provides an indication of Community’s share of the market at June 30, 2006, in each of the counties in which it operates:
Pennsylvania Counties | | Branches of Other Institutions Located in County | | Total Deposits within County (in thousands) | | Community’s Share of Market (%) | | Rank within Market | |
| | | | | | | | | | |
| York | | | 156 | | $ | 5,888,860 | | | 10 | | | 4 | |
| Lancaster | | | 203 | | | 8,103,302 | | | 7 | | | 5 | |
| Dauphin | | | 105 | | | 4,272,070 | | | 7 | | | 9 | |
| Berks | | | 144 | | | 6,864,002 | | | 4 | | | 7 | |
| Schuylkill | | | 73 | | | 1,860,886 | | | 11 | | | 4 | |
| Adams | | | 32 | | | 1,170,286 | | | 11 | | | 4 | |
| Luzerne | | | 130 | | | 5,218,371 | | | 2 | | | 11 | |
| Cumberland | | | 104 | | | 3,682,476 | | | 2 | | | 11 | |
| Northumberland | | | 34 | | | 1,172,803 | | | 6 | | | 9 | |
| Chester | | | 201 | | | 8,638,784 | | | 1 | | | 21 | |
| Snyder | | | 20 | | | 500,042 | | | 4 | | | 6 | |
Maryland Counties | | | | | | | | | | | | | |
| | | | | | | | | | | | | | |
| Carroll | | | 63 | | $ | 2,585,676 | | | 1 | | | 14 | |
The banking and financial services industries are highly competitive, particularly in the region in which Community’s office network is located. Competition comes from a variety of competitors ranging in size from small unit banks, de novo banks, large regional banks and, finally, from banks which operate on a national level. Many of the Corporation’s competitors are significantly larger than Community and therefore have greater lending limits, larger branch networks, greater resources, and a wider array of banking and other financial services.
In addition to the competition from traditional financial institutions, Community has been subjected to competition from credit unions, brokerage firms, money market funds, consumer finance and credit card companies and other companies providing financial services and credit to consumers. The competition is especially fierce with the credit union industry, particularly in certain segments of Community’s markets. The expansion of credit union activity, now permitted by so-called “community-based” charters, continues to create mounting competitive pressure. The expansion of “fields of membership” is thought by most banks to be contributing to an increasingly unfair competitive situation, largely because of the tax-exempt status afforded credit unions. Initiatives to further expand the powers of credit unions to conduct business in areas that go far beyond the original intent of credit union charters continue to be pressed at both the state and federal levels.
Concentrations, Seasonality
No portions of Community’s businesses are dependent on a single or limited number of customers, the loss of which would have a material adverse effect on our business. No substantial portions of loans or investments are concentrated within a single industry or group of related industries, although a significant amount of loans are secured by real estate located in south central Pennsylvania. Community’s businesses are not seasonal in nature.
Environmental Compliance
Community’s compliance with federal, state and local environmental protection laws had no material effect on capital expenditures, earnings or competitive position in 2006, and is not expected to have a material effect on such expenditures, earnings or competitive position in 2007.
Supervision and Regulation
The banking industry is subject to extensive state and federal regulation. Proposals to change laws and regulations governing the banking industry are frequently raised in Congress, in state legislatures, and within the various bank regulatory agencies. The likelihood and timing that such changes may have on Community are difficult to determine with any certainty. Changes in laws or regulations, or changes in the interpretation of laws or regulations, may have a material impact on the business, operations and earnings of Community.
Regulation of the Holding Company
Community Banks, Inc. is registered as a financial holding company with the Federal Reserve Board in accordance with the requirements of the Gramm-Leach-Bliley Act. The Gramm-Leach-Bliley Act enables broad-scale consolidation among banks, securities firms and insurance companies for eligible bank holding companies that have elected and maintain “financial holding company” status. Financial holding companies can offer virtually any type of financial service, including banking, securities underwriting, insurance (both agency and underwriting) and merchant banking. If a bank holding company does not become a financial holding company, it will be limited to those activities previously determined by the Federal Reserve Board to be permissible; i.e., “closely related to banking” under the standard set forth in the Bank Holding Company Act. In order to become a financial holding company, all of a bank holding company’s bank subsidiaries must be well capitalized and well managed and have a rating under the Community Reinvestment Act of at least “satisfactory.” The Corporation is subject to the ongoing oversight of the Federal Reserve Board, which requires regular reports from Community and is authorized to make regular examinations of Community and its subsidiaries.
Regulation of the Bank
The wholly-owned banking subsidiary, CommunityBanks, is subject to supervision and regulation, and is examined regularly, by the Federal Deposit Insurance Corporation (FDIC) and the state banking departments in the states in which it operates, which thus far has been limited to examinations conducted under the auspices of Pennsylvania Department of Banking. To the extent that the Bank’s subsidiaries are licensed to engage in the sale of insurance or the mortgage brokerage business, the subsidiaries are subject to examination by the respective licensing authorities. Community and its direct non-banking subsidiaries are affiliates, within the meaning of applicable banking laws and regulations of the Bank and its subsidiaries. As a result, the Bank and its subsidiaries are subject to restrictions on loans or extensions of credit to, purchase of assets from, investments in, and transactions with Community and its direct non-banking subsidiaries and on certain other transactions with them or involving their securities.
FDIC Insurance Assessment
The Bank is subject to deposit insurance assessments by the FDIC. These assessments are designed to fund both the Bank Insurance Fund (“BIF”) for banks and the Savings Association Insurance Fund (“SAIF”) for savings associations. The assessments by the FDIC for deposit insurance are based upon the risk classifications of depository institutions. Insurance premiums assessed for the last several years have not had a significant impact on operations.
In 2006, the FDIC announced a substantial increase in deposit insurance assessment rates to be effective January 1, 2007. At the same time, the FDIC also announced a One-Time Assessment Credit for those institutions that were in existence at December 31, 1996, and had paid a deposit insurance assessment prior to that date. Based upon the most current information available from the FDIC, it is expected that the annual assessment increase for the Bank will be in excess of $1 million per year at announced rates. For 2007, virtually all of the increase should be offset by the one-time credit. For years beyond 2007, anticipated rate changes are expected to increase the annual assessment expense, subject to any changes in prospective assessments that may be announced by the FDIC at some future date.
Capital Adequacy
The Federal Reserve Board and the FDIC have adopted risk-based capital adequacy guidelines for financial holding companies and banks under their supervision. Under these guidelines, “Tier 1 capital” and “Total capital” as a percentage of risk-weighted assets and certain off-balance sheet instruments must be at least 4% and 8%, respectively. The regulators have also imposed a leverage standard, which focuses on the institution’s ratio of Tier 1 capital to average total assets, adjusted for goodwill and certain other items, to supplement their risk-based ratios. This minimum leverage ratio was set at 3% and would apply only to those banking organizations receiving a regulatory composite 1 rating. Most banking organizations will be required to maintain a leverage ratio ranging from 1 to 2 percentage points above the minimum standard.
Community and the Bank are subject to various regulatory capital requirements administered by federal and state banking agencies. Failure to meet minimum capital requirements can initiate certain mandatory and possibly additional discretionary actions by regulators that, if undertaken, could have a direct material effect on Community’s financial statements. Under capital adequacy guidelines and the regulatory framework for prompt corrective action, each subsidiary bank must meet specific capital guidelines that involve quantitative measures of assets, liabilities, and certain off-balance sheet items as calculated under regulatory accounting practices. The capital amounts and classification are also subject to qualitative judgments by the regulators about the risk weightings of components, and other factors.
Quantitative measures established by regulation to ensure capital adequacy require Community to maintain minimum amounts and ratios of Total and Tier 1 capital to risk-weighted assets and of Tier 1 capital to average assets. Management believes, as of December 31, 2006, that Community and the Bank have met all capital adequacy requirements to which they are subject. For tables presenting Community’s capital ratios, see “Notes to Consolidated Financial Statements - Regulatory Matters” included in Part II, Item 8.
Monetary and Fiscal Policy
Community and the Bank are significantly affected by the monetary and fiscal policies of government authorities, including the Federal Reserve Board (FRB), which regulates the national money supply in order to manage recessionary and inflationary pressures. Among the instruments of monetary policy used by the FRB are open-market operations in U.S. Government securities and federal funds, changes in the discount rate on member bank borrowings, and changes in reserve requirements against member bank deposits. These techniques are used in varying combinations to influence the overall level of bank loans, investments and deposits, and the interest rates charged on loans and paid for deposits. The interest rate environment during 2006 was particularly challenging for most banks, particularly since the middle of the year. For most of 2006, Community and other banks operated in a flat yield curve environment which served to compress net returns from intermediation activities, which remains as the industry’s largest source of revenue. During the later half of the year, the curve remained in an inverted position, which has further compressed intermediation income and created an unprecedented competitive environment for the interest rates charged on loans and received on deposits. For additional discussion of the interest rate environment and its impact on operating results see the section entitled “2006 Economic Conditions and Yield Curve Dynamics” in Part II, Item 7 for further information.
The monetary policies of the FRB have had a significant effect on the operating results of banking institutions in the past and are expected to continue to do so in the future. The nature of future changes in monetary and fiscal policies, or the effect which they may have on Community’s business and earnings, cannot be predicted.
Compliance with Legislation
In addition to the ongoing supervision and regulation of the various bank regulatory authorities, Community has recently been subject to other forms of broader legislation which has had a profound effect on the operations of the Corporation in recent years. Two of the most significant have been the Sarbanes-Oxley Act of 2002 and the USA Patriot Act.
Sarbanes-Oxley Act of 2002
The Sarbanes-Oxley Act of 2002 (Sarbanes-Oxley) implemented a broad range of corporate governance, accounting, and reporting measures for companies that have securities registered under the Securities Exchange Act of 1934, including Community. Sarbanes-Oxley and its various promulgated regulations, established, among other things: (i) increased responsibility for Chief Executive Officers and Chief Financial Officers with respect to the content of filings with the SEC; (ii) enhanced requirements for audit committees, including independence and disclosure of expertise; (iii) enhanced requirements for auditor independence and the types of non-audit services that auditors can provide; (iv) accelerated filing requirements for SEC reports; (v) increased disclosure and reporting obligations for companies, their directors and their executive officers; and (vi) new and increased civil and criminal penalties for violation of securities laws.
Section 404 of Sarbanes-Oxley requires management to issue a report on the effectiveness of its internal controls over financial reporting. In addition, a reporting company’s independent registered public accountants are required to issue an opinion on management’s assessment and an opinion on the effectiveness of the reporting company’s internal control over financial reporting as of the end of the year. These reports for Community for 2006 can be found in Item 8, “Financial Statements and Supplementary Information.” Certifications of the Chief Executive Officer and the Chief Financial Officer as required by Sarbanes-Oxley and the resulting SEC rules can be found in the “Exhibits” section of this report.
USA Patriot Act
The United and Strengthening America by Providing Appropriate Tools Required to Intercept and Obstruct Terrorism Act of 2001 (the USA Patriot Act) imposed additional obligations on financial institutions, including the Bank, to implement and maintain polices, procedures and controls which are reasonably designed to detect and report instances of money laundering and the financing of terrorism. It also substantially broadened the scope of federal anti-money laundering laws and regulations by imposing significant new compliance and due diligence policies. Failure to comply with the Patriot Act’s requirements could have serious legal, financial, and reputation consequences for Community. Community has approved policies and procedures that are believed to be compliant with the Patriot Act and will continue to revise and update policies, procedures, and controls to reflect changes required, as necessary.
Community’s operations and financial results are subject to any number of both internal and external risk factors. This presentation will serve to highlight those risks that management believes are most relevant to Community’s current operating environment. The list is not exhaustive and may not capture all risks associated with Community’s business. Community is subject to a broad array of risks that affect the overall health of the economy and the banking industry as a whole. Consequently, there may be unidentified risks not discussed herein that have the potential to negatively impact Community’s liquidity, financial position or results of operations.
The presentation of risk factors should be read in conjunction with Community’s financial results presented in Part II, Item 7. The following risk factors should also be considered along with the other information concerning risk that is contained in this document. Risk factors contained herein have particular relevance when read in connection with any forward-looking statement presented throughout this Form 10-K. Please refer to the section entitled “Forward-Looking Statements” included in Part II, Item 7.
Future loan losses may exceed Community’s allowance for loan losses.
Credit risk is, perhaps, the single most significant risk to a community bank. Community is subject to credit risk, which is the risk of losing principal or interest due to borrowers’ failure to repay loans in accordance with their terms. A downturn in the economy or the real estate market in our market areas or a rapid change in interest rates could have a negative effect on collateral values and borrowers’ ability to repay. This deterioration in economic conditions could result in losses to Community in excess of loan loss allowances. To the extent loans are not paid timely, the loans are placed on non-accrual, thereby reducing interest income. To the extent loan charge-offs exceed our estimates, increased amounts charged to the provision for loan losses would reduce income.
Rapidly changing interest rate environments could reduce Community’s net interest margin, net interest income, fee income and net income.
Interest and fees on loans and securities, net of interest paid on deposits and borrowings, comprise the major source of revenue for Community. Interest rates are key drivers of net interest margin and subject to many factors beyond the control of management. For most of 2006, the banking industry experienced the impact of a “flat” or “inverted” yield curve, which significantly hampered efforts to expand net interest income in the second half of the year. The shape of the yield curve influences the interest rates that can be charged on loans or paid on deposits. The prolonged presence of a flat or inverted yield curve could significantly impact the potential for sustaining or improving net interest income in ensuing years or until the yield curve returns to a more normal position. Additionally, unexpected increases in interest rates in the future could result in interest expense increasing faster than interest income because of mismatches in financial instrument maturities. Further, substantially higher interest rates generally reduce loan demand and may result in slower loan growth. Decreases or increases in interest rates could have a negative effect on the spreads between the interest rates earned on assets and the rates of interest paid on liabilities, and therefore decrease net interest income.
The interest rate environment and the shape of the yield curve took on increased importance for the banking industry in 2006 and beyond. Although management believes it has implemented effective asset and liability management strategies to reduce the potential effects of changes in interest rates on Community’s results of operations, any substantial, unexpected, or prolonged deviations in market interest rates could have a significant effect on Community’s operations and its financial results. For a more complete description of the risks associated with interest rates and changes in rates, please refer to the section entitled “Net Interest Income” of Part II, Item 7.
Community’s profitability depends significantly on economic conditions in its local markets.
Community’s success depends primarily on the general economic conditions in its local markets of central Pennsylvania and northern Maryland. The local economic conditions in these areas have a significant impact on the demand for Community’s products and services as well as the ability of Community’s customers to repay loans, the value of the collateral securing loans and the stability of Community’s deposit funding sources. A significant decline in general economic conditions, caused by inflation, recession, acts of terrorism, outbreak of hostilities or other international or domestic occurrences, unemployment, changes in securities markets or other factors could impact these local economic conditions and, in turn, have a significant effect on Community’s operations and its financial results.
The financial services industry is very competitive
Community faces competition in attracting and retaining deposits, making loans, and providing other financial services throughout its market area. Competitors include other community banks, larger banking institutions, and a wide range of other financial institutions such as credit unions, government-sponsored enterprises, mutual fund companies, insurance companies and other non-bank businesses. Many of these competitors are national in scope and have substantially greater resources with which to service their customers.
Supervision, Regulation and Compliance
Community is subject to extensive state and federal laws and regulations governing the banking industry, in particular, and public companies, in general. Changes in those laws and regulations, or the degree of Community’s compliance with those laws and regulations as judged by any of several regulators that oversee Community, could have a significant effect on Community’s operations and its financial results.
Acquisitions
Over the last several years, the Corporation has entered into a number of mergers or acquisitions of both banks and other financial services companies. In connection with these transactions, estimates and assumptions were used to assess whether expense savings and other synergies could be realized from the merger and were considered in the determination of the acquisition price. The Corporation’s single largest merger was its acquisition of PennRock
Financial Services Corp. and its primary subsidiary, Blue Ball National Bank (Blue Ball) on July 1, 2005. Additionally, Community currently has pending mergers of two smaller financial institutions that are expected to be completed in the second quarter of 2007.
The success of these mergers, and all future mergers, is largely dependent on the level of efficiencies gained from a number of standard initiatives, including: the reconfiguration of duplicate internal operations; the removal of certain administrative functions; the elimination of redundant external contractual services and; the convergence and standardization of various retirement, bonus, and incentive programs. Each transaction includes risks that these expected savings, efficiencies, or synergies will not be fully realized or may take longer than estimated to be realized and could have a significant effect on Community’s operations and its financial results. Furthermore, a failure to realize these efficiencies, expense savings and other synergies in any single merger transaction may affect Community’s ability to acquire complementary businesses in future periods and, consequently, could seriously impact its ability to expand its franchise through acquisitions.
Goodwill Impairment
Current accounting standards require that the purchase method of accounting be used for all business combinations. Under purchase accounting, if the consideration exchanged in the acquisition of a company exceeds the fair market value of the net identifiable assets of that company, the excess amount must be reflected on the records of the acquirer as goodwill. At the end of 2006, Community had recorded approximately $246 million of goodwill, the majority of which was recognized in connection with the merger of PennRock. Under purchase accounting, the Corporation is required to evaluate goodwill for impairment on an annual basis. Recognition of any impairment in the carrying amount of goodwill must be included in the results of operations in the period in which a determination of impairment has been made. Based upon its most recent analysis, management has determined that the carrying amount of goodwill has not been impaired as of December 31, 2006. The carrying amount of goodwill will continue to be analyzed in subsequent periods and there is no assurance that goodwill or some portion thereof will not be considered impaired pursuant to an evaluation conducted at a future date.
Ability to Pay Dividends
Community’s ability to pay dividends depends, to a large extent, on its receipt of dividends from its direct or indirect subsidiaries. Currently, the Corporation’s primary source of dividends for distribution to shareholders is dependent upon the receipt of dividends from its primary banking subsidiary, CommunityBanks. The ability of the Bank to pay dividends to the Corporation is subject to its profitability, financial condition, and other cash flow requirements. There is no absolute assurance that the Bank or any of the other subsidiaries of the Corporation will be able to pay dividends in the future or that the Corporation will generate adequate cash flow to pay dividends in the future. Community’s failure to pay dividends on its common stock could have a material adverse effect on the market price of its stock.
Community’s stock price can be volatile.
The market price of Community common stock may fluctuate significantly in response to a number of other factors, including changes in securities analysts’ estimates of financial performance, volatility of stock market prices and volumes, rumors or erroneous information, changes in market valuations of similar companies and changes in accounting policies or procedures as may be required by the Financial Accounting Standards Board or other regulatory agencies.
None.
Community Banks, Inc., does not own or lease any property. As of December 31, 2006, the Bank owns 42 unencumbered properties and leases 40 other properties. Community’s other direct and indirect subsidiaries own 6 unencumbered properties and lease 4 properties. Five properties owned by Community’s indirect subsidiary, PSB Realty, are leased to the Bank.
The principal office of Community is located at 777 East Park Drive, Harrisburg Pennsylvania 17111. The principal office of the Bank is owned and located at 150 Market Square, Millersburg Pennsylvania 17061, with executive and administrative offices at 777 East Park Drive, Harrisburg PA 17111.
The Bank currently has 74 branch offices located in Adams, Berks, Chester, Cumberland, Dauphin, Lancaster, Luzerne, Northumberland, Schuylkill, Snyder, and York counties, Pennsylvania, and in Carroll County, Maryland. The Bank owns or leases 88 automated teller machines located throughout these counties.
From time to time, the Bank also acquires real estate by virtue of foreclosure proceedings, and such real estate is disposed of in the usual and ordinary course of business as expeditiously as is prudently possible.
Various actions and proceedings are presently pending to which Community and/or one or more of its subsidiaries is a party. These actions and proceedings arise out of routine operations and, in management’s opinion, will not have a material adverse effect on Community’s consolidated financial position or results of operations. Community is not required to make any disclosures pursuant to Section 6707A(e) of the Internal Revenue Code.
No matters were submitted to a vote of security holders during the fourth quarter of 2006.
PART II
Market Information
The shares of Community are traded on the Global Select Market Tier of the Nasdaq Stock Market under the symbol CMTY and are transferred through local and regional brokerage houses. Community had approximately 5,450 shareholders of record as of December 31, 2006. The following table sets forth dividends declared per share and the high and low closing prices for Community common stock as reported on the Nasdaq during the periods indicated.
| | 2006 | | 2005 |
| | Price Per Share | Dividends | | Price Per Share | Dividends |
| | Low | High | Declared | | Low | High | Declared |
| | | | | | | | |
| First Quarter | $25.67 | $27.85 | $0.19 | | $22.57 | $27.15 | $0.16 |
| Second Quarter | $24.38 | $27.39 | $0.20 | | $21.94 | $25.24 | $0.18 |
| Third Quarter | $24.58 | $27.29 | $0.20 | | $25.39 | $27.48 | $0.18 |
| Fourth Quarter | $25.74 | $28.48 | $0.20 | | $23.90 | $28.42 | $0.19 |
Holders of the common stock of Community are entitled to such dividends as may be declared from time to time by the Board of Directors out of funds legally available. Community currently expects that it will continue to pay comparable dividends in the future, subject to regulatory requirements, Community’s financial condition and requirements, future prospects, business conditions and other factors deemed relevant by the Board of Directors. As noted in “Capital Adequacy” in Part I, Item 1, Community is subject to various regulatory capital requirements that limit the amount of capital available for dividends.
The market prices listed above are based on historical market quotations and have been restated to reflect stock dividends and splits. Information concerning securities authorized for issuance under equity compensation plans is set forth in Note 14 to the Consolidated Financial Statements included in this report at Item 8 and is incorporated herein by reference.
Issuer Purchases of Equity Securities
During the fourth quarter of 2006, Community repurchased the following shares of its common stock pursuant to its employee benefit plans. During this period, Community did not purchase any shares pursuant to its Share Repurchase Program. Community did not sell any unregistered securities during the fourth quarter of 2006.
| | | Total Number of Shares Purchased | | Average Price Paid Per Share | | Total Number of Shares Purchased as part of Publicly Announced Plans or Programs | | Capacity to Purchase More Shares Under Repurchase Program | |
| | | | | | | | | | |
| 10/1/06-10/31/06 | | | 1,963 | | $ | 27.06 | | | 1,963 | | | 53,900 | |
| 11/1/06-11/30/06 | | | 450 | | $ | 27.16 | | | 450 | | | 53,900 | |
| 12/1/06-12/31/06 | | | 299 | | $ | 28.34 | | | 299 | | | 53,900 | |
| 1. | In July 2003, Community registered 50,000 shares of its common stock for purchase by employees pursuant to the 401(k) savings plan and the Board of Directors authorized the repurchase of shares of Community common stock to fund the plan. No timetable was set for these repurchases. |
| 2. | In the fourth quarter of 2005, Community announced a plan to repurchase 787,500 (restated for 5% stock dividend in 2006) of its shares. No expiration date was given for the repurchase. As of December 31, 2006, 53,900 shares remain to be purchased pursuant to this plan. |
| 3. | During the fourth quarter of 2006, no plan or program expired and Community did not determine to terminate any repurchase program. |
STOCK PERFORMANCE GRAPH
The following graph shows the yearly percentage change in Community’s cumulative total shareholder return on its common stock from December 31, 2001, to December 31, 2006, compared with the cumulative total return of the Nasdaq Stock Market (U.S. Companies), and a self-determined peer group consisting of thirteen bank holding companies. The bank holding companies in the peer group are Bryn Mawr Bank Corporation, Citizens & Northern Corporation, Comm Bancorp, Inc., Community Bank System, Inc., FNB Financial Corporation, Harleysville National Corporation, KNBT Bancorp, Inc., Leesport Financial Corp., National Penn Bancshares, Inc., Omega Financial Corporation, S&T Bancorp, Inc., Sandy Spring Bancorp, Inc., and Sterling Financial Corporation. Community selected these companies because they conduct a community banking business in similar markets and they are similar to Community in asset size and market capitalization.


| | | At or for the Year Ended December 31, | |
| | | 2006 | | 2005 * | | 2004 | | 2003 | | 2002 | |
| | | (dollars in thousands except for per share data) | |
BALANCE SHEET DATA | | | | | | | | | | | |
| At Period End: | | | | | | | | | | | | | | | | |
Investment securities | | $ | 659,136 | | $ | 628,585 | | $ | 619,110 | | $ | 646,961 | | $ | 667,801 | |
Total loans | | | 2,370,889 | | | 2,237,065 | | | 1,217,456 | | | 1,084,678 | | | 916,051 | |
Total assets | | | 3,496,370 | | | 3,332,430 | | | 1,954,799 | | | 1,861,063 | | | 1,680,362 | |
Total deposits | | | 2,513,182 | | | 2,294,367 | | | 1,305,537 | | | 1,230,685 | | | 1,132,913 | |
Long-term debt | | | 315,079 | | | 430,719 | | | 404,662 | | | 411,422 | | | 320,533 | |
Stockholders’ equity | | | 486,161 | | | 476,673 | | | 152,341 | | | 143,406 | | | 129,162 | |
| Average: | | | | | | | | | | | | | | | | |
Total assets | | | 3,403,421 | | | 2,668,605 | | | 1,941,096 | | | 1,780,679 | | | 1,580,046 | |
Total stockholders’ equity | | | 475,710 | | | 318,768 | | | 145,750 | | | 135,773 | | | 119,352 | |
| | | | | | | | | | | | | | | | | |
EARNINGS DATA: | | | | | | | | | | | | | | | | |
| Net interest income | | | 106,900 | | | 82,645 | | | 56,557 | | | 52,514 | | | 50,488 | |
| Provision for loan losses | | | 2,050 | | | 2,300 | | | 3,100 | | | 2,500 | | | 3,350 | |
| Net interest income after provision for loan losses | | | 104,850 | | | 80,345 | | | 53,457 | | | 50,014 | | | 47,138 | |
| Other income | | | 34,967 | | | 26,437 | | | 23,213 | | | 20,463 | | | 13,975 | |
| Other expense | | | 84,885 | | | 75,069 | | | 49,993 | | | 45,718 | | | 39,300 | |
| Provision for income taxes | | | 13,901 | | | 6,072 | | | 4,879 | | | 4,359 | | | 3,367 | |
| Net income | | | 41,031 | | | 25,641 | | | 21,798 | | | 20,400 | | | 18,446 | |
| | | | | | | | | | | | | | | | �� | |
PER SHARE DATA: | | | | | | | | | | | | | | | | |
| Basic earnings per share | | | 1.74 | | | 1.38 | | | 1.70 | | | 1.59 | | | 1.45 | |
| Diluted earnings per share | | | 1.72 | | | 1.35 | | | 1.65 | | | 1.54 | | | 1.42 | |
| Cash dividends declared | | | 0.79 | | | 0.71 | | | 0.64 | | | 0.60 | | | 0.52 | |
| Book value | | | 20.67 | | | 19.81 | | | 11.86 | | | 11.17 | | | 10.16 | |
| Average diluted shares outstanding | | | 23,918,486 | | | 18,975,425 | | | 13,203,653 | | | 13,122,240 | | | 13,115,886 | |
| | | | | | | | | | | | | | | | | |
PROFITABILITY RATIOS: | | | | | | | | | | | | | | | | |
| Return on average assets | | | 1.21 | % | | 0.96 | % | | 1.12 | % | | 1.15 | % | | 1.17 | % |
| Return on average stockholders’ equity | | | 8.63 | % | | 8.04 | % | | 14.96 | % | | 15.03 | % | | 15.46 | % |
| Net interest margin (FTE) | | | 3.88 | % | | 3.76 | % | | 3.44 | % | | 3.50 | % | | 3.78 | % |
| Efficiency ratio | | | 57.33 | % | | 57.51 | % | | 60.42 | % | | 60.59 | % | | 56.92 | % |
| | | | | | | | | | | | | | | | | |
CAPITAL AND LIQUIDITY RATIOS: | | | | | | | | | | | | |
| Stockholders’ equity to total assets | | | 13.90 | % | | 14.30 | % | | 7.79 | % | | 7.71 | % | | 7.69 | % |
| Average equity to average assets | | | 13.98 | | | 11.95 | % | | 7.51 | % | | 7.62 | % | | 7.55 | % |
| Dividend payout ratio | | | 45.52 | | | 52.42 | % | | 37.69 | % | | 37.35 | % | | 36.07 | % |
| Net loans to assets | | | 67.13 | % | | 66.36 | % | | 61.47 | % | | 57.25 | % | | 53.10 | % |
| | | | | | | | | | | | | | | | | |
ASSET QUALITY RATIOS: | | | | | | | | | | | | | | | | |
| Allowance for loan losses to total loans outstanding | | | 1.00 | % | | 1.03 | % | | 1.18 | % | | 1.22 | % | | 1.35 | % |
| Allowance for loan losses to non-accrual loans | | | 188 | % | | 253 | % | | 266 | % | | 162 | % | | 131 | % |
| Non-accrual loans to total loans outstanding | | | 0.53 | % | | 0.41 | % | | 0.45 | % | | 0.76 | % | | 1.04 | % |
| Non-performing assets to total assets | | | 0.36 | % | | 0.32 | % | | 0.38 | % | | 0.70 | % | | 0.63 | % |
| Net charge-offs to average loans outstanding | | | 0.06 | % | | 0.05 | % | | 0.16 | % | | 0.17 | % | | 0.35 | % |
* 2005 amounts include the impact of the July 1, 2005 merger with PennRock Financial Services Corp.
INTRODUCTION
Purpose of this Presentation
This presentation has been designed to provide a narrative explanation of the financial statements of Community Banks, Inc. (“Community” or “the Corporation”). The purpose of this presentation is to enhance 2006 financial disclosures and to provide a framework for evaluating the extent to which historical performance can be relied upon to assess prospects for future performance.
Presentation Format
Throughout this presentation, net interest income and yields on earning assets have been presented on a fully-tax equivalent basis. Unless otherwise indicated, balances represent average daily balances, earnings per share are presented on a fully-diluted basis, and all dollar amounts are presented in thousands.
Background
The July 1, 2005, merger with PennRock Financial Services Corp (“PennRock”) represented a milestone in the expansion of the Community franchise. As required under generally accepted accounting principles (“GAAP”), the merger was accounted for under the purchase method of accounting for business combinations (“purchase accounting”). Prior to the merger, PennRock’s financial performance was derived principally from activities of its primary operating subsidiary, Blue Ball National Bank (“Blue Ball”).
For 2006, annual results reflected “combined” operating activities of Community and the former Blue Ball for the entire year. In 2005, operating results of historical Community were combined with the operating results of the former Penn Rock beginning on July 1, 2005, to form the newly-combined Community. In accordance with GAAP, financial results for the six month period prior to the July 1, 2005, merger date did not include Blue Ball-related financial activity and reflected only the pre-merger financial results for historical Community. Consequently, presentations of annual results for the twelve month period ended December 31, 2005, reflect a “hybrid” presentation consisting of six months of pre-merger Community activity and six months of post-merger combined results.
Virtually all comparisons of full year 2006 financial results to the hybrid results of 2005 will reflect distortions owing to the hybrid presentation of 2005 financial statements. Similarly, all financial presentations prior to 2005 are exclusively those of pre-merger, historical Community and will also yield distortions when compared to both the 2006 combined results and the 2005 hybrid results.
To the extent practical, alternate presentations of financial information will be made in order to make comparative results more meaningful to the reader. Such information will be clearly defined and labeled so as to provide consistent and comparable presentations, despite the inherent limitations of comparability resulting from the merger. As an intuitive baseline, the addition of Blue Ball activities would ordinarily be expected to increase combined operations by 50% for full year comparisons, based upon the comparative size of the separate companies prior to the merger. Because of the mid-year 2005 consummation date, however, increases from 2005 to 2006 would be expected to reflect general increases of half that amount, or 25%, exclusive of the effects of operational improvements and organic balance sheet growth.
GAAP REPORTING ISSUES
This section of the presentation will summarize the salient GAAP reporting issues associated with presentations of financial information for Community, including: forward-looking statements; critical accounting policies; and GAAP versus “non-GAAP” presentations.
Forward-Looking Statements
Periodically, Community has made, and will continue to make, assertions that may include forward-looking information. Community cautions that forward-looking information disseminated through financial presentations should not be construed as guarantees of future performance. Furthermore, actual results may differ from expectations contained in such forward-looking information as a result of factors that are not predictable. Financial performance can be affected by any number of factors that are not predictable or are out of management’s direct control. Examples include: the effect of prevailing economic conditions; unforeseen or dramatic changes in the general interest rate environment; actions or changes in policies of the Federal Reserve Board and other government agencies; the risk associated with global instability; business risk associated with the management of the credit extension function and fiduciary activities. Each of these factors could affect estimates, assumptions, uncertainties and risk used to develop forward-looking information, and could cause actual results to differ materially from management’s expectations regarding future performance.
Critical Accounting Policies
The identification of those accounting policies which are deemed to be critical to the application of GAAP on reported results of Community is an important facet of this presentation. Management has identified the applicable promulgations of GAAP that have particular relevance in connection with reported results:
| § | Allowance for Loan Losses: Adequacy of Allowance |
| § | Purchase Accounting for Business Combinations |
| § | “Other than Temporary” Impairment of Investment Securities |
Management believes that the application of its accounting policies and procedures for each of the above items should be considered to be a critical accounting policy to ensure the fair presentation of Community’s financial statements.
Community applies a systemic methodology in order to estimate the allowance for loan losses. This methodology incorporates management’s judgments about the credit quality of the loan portfolio and a disciplined, regimented methodology that is consistently applied. This process requires that a detailed analysis of the loan portfolio be performed on a quarterly basis. This analysis includes a specific individual loan review for any and all loans that meet specific materiality criteria. Such loans are evaluated for impairment under the provisions of Statement of Financial Accounting Standards (“SFAS”) No. 114, “Accounting by Creditors for Impairment of a Loan.” The portfolio is further stratified to analyze groups of homogeneous loans with similar risk characteristics. Such loans are evaluated under the provisions of SFAS No. 5 “Accounting for Contingencies.”
Management considers all known relevant internal and external factors that may affect loan collectibility, as well as particular risks indigenous to specific types of lending. The process is further designed to consolidate the aggregate loss estimates and to ensure that the allowance for loan losses is recorded in accordance with generally accepted accounting principles. The final results are reviewed and approved by executive management. Results are regularly validated by a review of trends associated with loan volume, delinquencies, potential concentrations, or other factors that may influence the methodology used to estimate the allowance for loan losses.
| · | Purchase Accounting for Business Combinations |
In June of 2001, the Financial Accounting Standards Board (“FASB”) issued SFAS No. 141, “Business Combinations,” and SFAS No. 142, “Goodwill and Other Intangible Assets.” These standards eliminated the pooling-of-interests method of accounting (“pooling”) in favor of purchase accounting. Further, these standards were promulgated to ensure that post-merger financial statements of combined entities are prepared in a manner that best represents the underlying economics of a business combination.
These standards necessitate the application of accounting policies and procedures that entail the use of assumptions, estimates, and judgments that are critical to the presentation of financial information, including the ongoing valuation of intangibles. The ultimate responsibility for the application of these standards and the adequacy of disclosures related thereto rests with management. While Community has applied these standards to other business combinations completed since 2001, the magnitude of the PennRock merger on Community’s consolidated results suggests that the application of these standards since the date of that merger is substantially more critical to the presentation of financial information.
| · | Other than Temporary Impairment of Investment Securities |
Investment securities are written down to their net realizable value when there is impairment in value that is considered to be other than temporary. The determination of whether or not other than temporary impairment exists is a matter of judgment. Management reviews its investment securities portfolio regularly for possible impairment that is other than temporary by analyzing the facts and circumstances of each investment and the expectations for that investment’s performance.
GAAP versus Non-GAAP
Like many financial institutions, Community had accounted for virtually all of its business combinations using the pooling method of accounting prior to 2002. Under pooling, historical pre-merger financial information of the combined companies was restated “as if” the combination had occurred prior to the earliest period presented. This approach was advantageous in that it allowed for year-over-year financial performance comparisons that were prepared on a consistent basis. Under purchase accounting, financial statements for any periods prior to the date of the merger are not restated, creating the potential for comparisons that, in some respects, are inherently inconsistent.
Like most other financial institutions that have made large acquisitions since the mandate of purchase accounting, Community is now providing certain non-GAAP information to assist investors in their understanding of the effect of acquisition activity on reported results. Many of these disclosures have been designed to overcome comparability issues related to the influence of intangibles (principally goodwill) created in mergers. Such information is not presented as a substitute for traditional GAAP measurements, but is provided as a supplemental enhancement to improve comparability and investor understanding.
Community has augmented its traditional GAAP presentation by providing an extensive reconciliation of relevant GAAP and non-GAAP measures to enhance its disclosures of comparative financial performance. The reconciliation appears at the end of Part II, Item 7, of this filing. Below is a summary of critical GAAP measurements along with a brief description of the adjustments necessary to produce comparable non-GAAP measurements.
Traditional GAAP Measures | | Adjustments | | Comparable Non-GAAP Measures |
| | | | | |
Balance Sheet: | | | | |
| Average Assets | | Excludes Intangible Assets from Assets | | Average “Tangible” Assets |
| Average Equity | | Excludes Intangible Assets from Equity | | Average “Tangible” Equity |
| Equity to Assets | | Excludes Intangible Assets from Equity and Assets | | “Tangible” Equity to Assets |
| Book Value per Share | | Excludes Intangible Assets from Equity | | “Tangible” Book Value per Share |
| | | | | |
Performance: | | | | |
| Net Income / EPS | | Excludes After-Tax Effect of Mergers & Acquisitions (M&A) Expense and Other Special Charges | | “Core” Net Income / EPS |
| Net Income / EPS | | Excludes After-Tax Effect of CDI Amortization, M&A Expense, and Other Special Charges | | “Tangible” or “Operating” Income / EPS |
| Return on Average Assets (ROA) | | “Tangible” Net Income divided by Average “Tangible” Assets | | Operating Return on Average “Tangible” Assets (ROTA) |
| Return on Average Equity (ROE) | | “Tangible” Net Income divided by Average “Tangible” Equity | | Operating Return on Average “Tangible” Equity (ROTE) |
2006 PERFORMANCE OVERVIEW AND SUMMARY
Executive Overview
In the first full year of combined operations with Blue Ball, Community reported 2006 net income of $41 million and earnings per share of $1.72. Results for the year improved dramatically from 2005 when net income and earnings per share were $25.6 million and $1.35, respectively. While 2006 earnings per share grew 27% from 2005, performance in the previous year had been adversely affected by $8.2 million in pre-tax merger, conversion, and restructuring expenses that had been recorded prior to the consummation of the 2005 mid-year merger with Blue Ball. On July 1, 2005, Community completed the acquisition of Blue Ball and, as required under GAAP, combined Blue Ball’s operating activities for only the last six months of that year. The addition of the Blue Ball Division has facilitated Community’s ongoing transformation to a more strategically relevant franchise in the Mid-Atlantic region.
During the third quarter of 2006, Community announced two pending mergers with future banking partners when it revealed its plans to acquire BUCS Financial Corp and East Prospect State Bank. These two combinations are expected to be completed in the second quarter of 2007 and will provide an important market extension into the desirable, adjacent Central Maryland region and will bolster Community’s existing position in the vibrant York County, Pennsylvania, market. Earlier in 2006, Community completed a smaller acquisition of an insurance agency operating within its Blue Ball market and then subsequently acquired the trust business of a competing financial institution. Each of these acquisitions were fully absorbed by Community by the end of 2006 and will allow the Corporation to further leverage the existing infrastructure that was designed to serve the specialized needs of these customers.
By the end of 2006, Community’s operating footprint boasted assets of $3.5 billion and 74 banking offices that extend throughout the center of Pennsylvania from the Pocono region to just over the Maryland border. Blue Ball operates as a separate division in the attractive Lancaster, Berks and Chester county markets of south-central Pennsylvania. Community is the 8th largest financial services holding company headquartered in Pennsylvania and the largest financial institution headquartered in its capital city of Harrisburg. The pending mergers will add 5 offices and approximately $200 million in assets upon completion.
2006 Economic Conditions and Yield Curve Dynamics
The dominant economic theme for the banking industry throughout 2006 was the ongoing influence of “yield curve dynamics.” The primary source of revenue for most financial institutions, particularly community banks, is derived from intermediation activities. Intermediation activities are defined as the net revenues generated from the process of gathering deposits, combined with the facilitation of credit extension to retail and commercial customers. Banks must maintain a constant vigilance on monitoring and managing the effects of interest rate changes on this essential source of revenue production. Much of this effort focuses on future expectations regarding the shape of the yield curve, or yield curve dynamics, and its impact on pricing activities.
Yield curve dynamics begins with the notion that current interest rate offerings on various maturities of U. S. Treasury securities provide the fundamental indicator of the prevailing interest rate profile and, simultaneously, act as a guidepost for incremental loan and deposit pricing decisions. The traditional, or “normal” yield curve, has some level of slope and is typified by steadily increasing rate offerings on instruments with longer maturities. The slope of the yield curve is driven primarily by expectations for both inflationary trends and the implied future interest rate expectations for these instruments. Generally speaking, a yield curve with a steeper degree of slope provides more opportunity for banks to increase the spread between earning asset yields and funding costs. A steeper yield curve, when combined with growth in earning assets and deposits, can be expected to yield expanded revenue performance.
Since the beginning of 2004, the Federal Reserve executed a series of rate hikes that created a yield curve that was considered essentially “flat” by the end of 2005. By explanation, a flat yield curve is characterized by a negligible disparity between interest rate offerings across the maturity spectrum of the yield curve. By the middle of 2006, the yield curve had actually reached an “inverted” condition. An inverted yield curve is characterized by key short-term interest rates that are higher than the rate offerings on instruments with longer maturities; the opposite condition of a normal yield curve. This phenomenon, which is infrequent in occurrence, is normally unsustainable for more than a short period of time. Uncharacteristically, during the entire second half of 2006, the yield curve remained in an inverted position. For banks, the presence of a flat or inverted yield curve for a prolonged or sustained period can measurably reduce future opportunities to expand revenue from intermediation activities.
During the course of 2006, yield curve conditions contributed to a gradual compression in net interest margins and net interest income growth for Community, the two key metrics for top-line revenue expansion. The prolonged presence of an inverted yield curve presented special earnings challenges for Community, as well as throughout the banking industry, as rising deposit funding costs, which are influenced primarily by short-term interest rate trends, have experienced continuous increases. Alternatively, the portion of the earning asset base whose rates are derived from the longer end of the curve, most notably the investment portfolio and loans with fixed long-term maturities, have not kept pace with the increased cost of funding. Additionally, Community has been increasingly reluctant to extend credit maturities without a rate premium commensurate with the incremental interest rate risk associated with longer-term loans. This confluence of conditions was particularly apparent during the fourth quarter of 2006 when, for the first time in recent history, net interest income experienced a slight decline. Consequently, it is believed that the entire banking industry faces a meaningful challenge in the form of further net interest margin compression absent favorable and timely changes in yield curve dynamics in the coming year.
2006 Performance Summary
The four major components of operating performance are net interest income; the provision for credit losses; non-interest income; and non-interest expenses.
Net interest income, which remains Community’s single largest revenue source, grew to $115 million 2006 versus $90 million in 2005, an increase of 28%. Growth was attributed primarily to the full year addition of Blue Ball activity in 2006.
In addition to the yield curve dynamics and associated interest rate trends previously discussed, expansion of net interest income was hampered by constrained loan demand that began to emerge in the third quarter of 2006. Additionally, the presence of a flat or inverted yield curve minimized the opportunities to expand investment yields commensurate with the rise in funding costs. On the funding side, Community experienced both a measurable shift in consumer preference for time deposits and a lack of growth in lower-cost core deposit balances. During the course of the year, rates paid on short-term time deposits rose at levels commensurate with the general rise in short-term interest rates. The upward pressure on short-term rates influenced time deposit pricing for Community and its competitors. The differential in rates between core deposit balances and retail time deposits precluded any opportunity to increase lower-cost core deposit balances and, simultaneously, increased Community’s mix of higher-cost, short-term certificate of deposit balances. All of these factors influenced an increase in funding costs.
Despite these conditions, Community was able to avoid any meaningful deterioration in net interest income performance throughout most of the year. Late in the third and into the fourth quarter of 2006, Community experienced trends that, absent future changes in yield curve trends, are likely to dampen meaningful revenue expansion from intermediation activities in the near term.
| · | Provision for Credit Losses |
Community’s credit profile remained largely unchanged from 2005 as most vital metrics remained stable. Credit quality metrics have been stellar for the last three years and reflect an overall industry trend. The provision for credit losses was $2.1 million for 2006 versus $2.3 million for 2005. The 2006 provision exceeded net charge-offs for the year, which reached $1.4 million, or 0.06% of loans. The comparable numbers in 2005 were $0.8 million and 0.05% of loans.
Non-interest income, which included the additional fees from the acquired insurance and trust businesses, grew to $35.0 million in 2006 (inclusive of modest security gains), versus $26.4 million in 2005, a growth rate of 32%. The growth rate in this important source of revenues exceeded expectations beyond the incremental Blue Ball contribution, due partially to the favorable influence of the fees from acquired businesses. Expenses associated with these acquired operations were similarly influenced. Other fees, including retail investment sales and consolidated overdraft program fees, also experienced steady improvements. The various non-interest income sources of revenue now provide 23% of aggregate corporate revenues.
Non-interest expenses for the year reached $84.9 million versus $75.1 million in 2005. Exclusive of merger, conversion and restructuring expenses totaling $8.2 million related to the Blue Ball merger, 2005 expenses would have totaled $66.9 million. Expenses in 2006 grew nearly 27% from the adjusted 2005 expense total. The growth rate was substantially attributed to the full year addition of Blue Ball operations and, to a far lesser extent, to the comparatively modest additions from the acquired businesses. The efficiency ratio for 2006 was 57.33%. While Community was able to achieve substantial efficiencies from combining core operating activities of pre-merger Community and Blue Ball, more significant reductions were precluded by continued investments in organic office expansion efforts.
| · | Comparative Performance Measures |
Important traditional measures of relative financial performance between financial institutions include return on average assets (ROA) and return on average equity (ROE), which were 1.21% and 8.63%, respectively, for 2006. Comparable measures in 2005 were 0.96% and 8.04%. The 2005 GAAP measures of relative performance were inclusive of the merger, conversion and restructuring expenses that suppressed 2005 performance. Additionally, the relative magnitude of the acquisition of PennRock to Community’s historical franchise has distorted any comparisons to Community’s pre-merger performance prior to 2005.
Since the consummation of the PennRock merger, Community has been providing certain non-GAAP measures designed to assist investors in their understanding of the effect of acquisition activity on reported results. The comparable non-GAAP measures to traditional ROA and ROE metrics exclude certain non-cash expenses, unusual charges and certain intangible assets from the computation, and have been designated as “operating return on tangible assets” (ROTA) and “operating return on tangible equity” (ROTE). ROTA and ROTE increased to 1.36% and 19.57%, respectively, compared to 1.27% and 17.09% for the year ago period.
PERFORMANCE COMPONENTS
The purpose of this section of the presentation is to provide a more in-depth comparative analysis of the four major components of performance during 2006.
Net Interest Income
As with most financial institutions, Community’s major source of revenue is derived from intermediation activities and is reported as net interest income. Net interest income is defined as the difference between interest income on earning assets and interest expense on deposits and borrowed funds. Net interest margin is a relative measure of a financial institution’s ability to efficiently deliver net interest income from a given level of earning assets. Both net interest income and net interest margin are influenced by the frequency, velocity, and extent of interest rate changes, including the slope of the yield curve, and by the composition and absolute volumes of earning assets and funding sources.
The following table compares net interest income and net interest margin components between 2005 and 2006 (in thousands):
| | | 2006 | | 2005 | | Change | |
| | | Amount | | Yield / Rate | | Amount | | Yield / Rate | | Amount | | Yield / Rate | |
| | | | | | | | | | | | | | | | | | | | |
| Interest income | | $ | 205,436 | | | 6.95 | % | $ | 149,456 | | | 6.26 | % | $ | 55,980 | | | 0.69 | % |
| Interest expense | | | 90,734 | | | 3.56 | % | | 59,648 | | | 2.90 | % | | 31,086 | | | 0.66 | % |
| Net interest income | | $ | 114,702 | | | | | $ | 89,808 | | | | | $ | 24,894 | | | | |
| | | | | | | | | | | | | | | | | | | | |
| Interest spread | | | | | | 3.39 | % | | | | | 3.36 | % | | | | | 0.03 | % |
| Impact of non-interest funds | | | | | | 0.49 | % | | | | | 0.40 | % | | | | | 0.09 | % |
| | | | | | | | | | | | | | | | | | | | |
| Net interest margin | | | | | | 3.88 | % | | | | | 3.76 | % | | | | | 0.12 | % |
| · | Overview--2006 versus 2005 |
Comparisons of net interest income and net interest margin for 2005 and 2006 were disproportionately influenced by the fact that only six months of Blue Ball activity is included in 2005 results, while 2006 included the combined twelve months’ results. The majority of the volume increases in both interest income and interest expense can be attributed to the additional six months of Blue Ball activity included in 2006 results.
Quarterly presentations of asset yields, cost of funds, net interest margin, net interest income and other key metrics provide a more meaningful analysis of underlying trends in this component of performance. These trends, when observed in combination with yield curve movements, provide insight into the increases in annual results shown above. To begin this analysis, it is important to take an historical view of the interdependency of incremental pricing decisions and the influence of yield curve dynamics over the last several years.
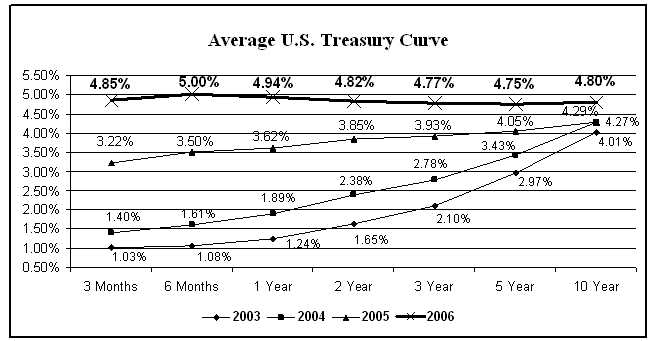
| · | Yield Curve Dynamics: Quantitative Comparisons |
The following presentation of the yield curve at the end of the past four years provides a dramatic illustration of two primary issues that have affected interest rate trends since 2003. First, overall interest rates have increased, although
such increases have been most significant at the short end of the curve, with little or no change in the longer maturities. These increases coincided with the series of interest rate increases in the benchmark Fed Funds rate that the Federal Reserve commenced at the beginning of 2004. Secondly, the yield curves at the end of both 2005 and 2006 had remarkably less slope than the previous two year ends. This dynamic forced the yield curve into a nearly flat position by the end of 2005 and into an inverted position by the end of 2006. This is illustrated in the following table:
The above presentation provides an array of interest rates in place at discrete points in time. While useful, this comparison may exaggerate rate trend movements because it displays interest rates at specific points in time. Rates displayed at discrete points in time are vulnerable to one-day swings and variations, and may not be indicative of general or average trends.
A more appropriate and inclusive comparison can be provided by a presentation of an average yield curve for the last four years. The incremental pricing of loans, investments, deposits, and borrowings can be more effectively correlated to changes in average rates over time because, as previously discussed, the yield curve serves as a benchmark for the incremental pricing of loans and deposits. The following is a presentation of the yield curve using average rates in place over the last four years.
The above yield curve presentation of average interest rates exhibited interest rate trends similar to those exhibited at the discrete year end periods. This presentation of average rates suggests that a flat and / or inverted yield curve position was in place for prolonged periods throughout 2006, which constrained a more significant expansion of net interest income.
| · | Quarterly Net Interest Income Performance: 2006 / 2005 |
A more illustrative presentation of trends within this vital source of revenue was revealed in the quarterly presentation of results for the four quarters of each of the last two years. The following table provides a comparison of earning asset yields, funding costs, and other information for each of the four quarters of 2006 and 2005:
| | | 2006 | |
| | | Fourth Quarter | | Third Quarter | | Second Quarter | | First Quarter | |
| Asset yield | | | 7.05 | % | | 7.08 | % | | 6.93 | % | | 6.74 | % |
| Funding cost | | | 3.85 | % | | 3.66 | % | | 3.46 | % | | 3.24 | % |
Interest spread | | | 3.20 | % | | 3.42 | % | | 3.47 | % | | 3.50 | % |
Net interest margin | | | 3.71 | % | | 3.90 | % | | 3.94 | % | | 3.98 | % |
| | | | | | | | | | | | | | |
| Net interest income | | $ | 28,089 | | $ | 28,854 | | $ | 28,917 | | $ | 28,842 | |
| | | 2005 Post-combination Pre-combination | |
| | | Fourth Quarter | | Third Quarter | | Second Quarter | | First Quarter | |
| Asset yield | | | 6.53 | % | | 6.25 | % | | 6.06 | % | | 6.04 | % |
| Funding cost | | | 3.00 | % | | 2.76 | % | | 2.97 | % | | 2.86 | % |
Interest spread | | | 3.53 | % | | 3.49 | % | | 3.09 | % | | 3.18 | % |
Net interest margin | | | 3.96 | % | | 3.89 | % | | 3.46 | % | | 3.55 | % |
| | | | | | | | | | | | | | |
| Net interest income | | $ | 28,571 | | $ | 28,208 | | $ | 16,650 | | $ | 16,379 | |
A chronological review of results, beginning in the first quarter of 2005, revealed the following trends:
| · | Results in the first half of 2005, which included only historical Community, revealed a trend of compressing interest spreads driven primarily by an increasing cost of funds. While net interest margin compressed, increases in loan volume produced only modest increases in net interest income. |
| · | Coincident with the mid-year 2005 merger of Blue Ball, Community incurred a merger, conversion and restructuring charge of $8.2 million, the largest portion of which resulted from the expense associated with the restructuring of Community’s wholesale borrowings. The restructuring portion of this charge, which resulted in a prepayment penalty of $6 million, facilitated the prepayment of $60 million of FHLB term advances. These advances had a weighted average cost of 6.29%, well in excess of the Corporation’s incremental wholesale borrowing rate, and contributed to the reduction in aggregate funding cost from 2.97% in the second quarter of 2005 to 2.76% in the initial, post-merger third quarter of 2005. |
| · | The third and fourth quarters of 2005 represented the first two quarterly periods of post-merger, combined results. Despite the benefits of the mid-year restructuring effort, rising short term interest rates and the reduced slope of the yield curve exerted concurrent upward pricing pressure on both rate sensitive earning asset yields and funding costs. Due to robust loan growth, overall net interest income continued to increase, but at a modest pace. |
| · | The first half of 2006 produced trends similar to those in the second half of 2005: (1) rising short-term interest rates; (2) an increasingly “flat” yield curve; (3) slightly slower loan growth; and (4) parallel increases in both earning asset yields and funding costs. The increase in funding costs, however, was disproportionately being driven by the steadily increasing velocity and volume of re-pricing for maturing time deposits. These re-pricings were occurring at interest rates disparately higher than those on the maturing balances, largely due to: (1) the influence of yield curve dynamics on incremental rate offerings, most particularly those for maturities under two years and (2) associated competitive pressures. |
| · | While the 2006 third quarter results mirrored those in the first half of that year, supplemental trends continued to emerge. Growth in low-cost core deposit balances was being curtailed by consumer preferences for the now measurably higher rates offered on short-term time deposits. Additionally, steadily increasing volumes of maturing time deposits were being re-priced at new rates that were far higher than the original rate offerings on the maturing balances. |
Generally, Community was experiencing a heavier dependency on time deposits for incremental funding of loan growth and was no longer using investment runoff as an alternate source of loan funding. In the first quarter of 2006, time deposits comprised 43.9% of funding sources. By the third quarter, this dependency had risen to 47.9%. Loan growth was more modest than in the first half of the year. More significant downturns in net interest margin and net interest income were partially deferred and offset by a lag in the favorable re-pricing of rate-sensitive assets. This lag in the re-pricing of rate-sensitive assets slowed during the quarter, coincident with the Fed pause in tightening the benchmark Fed Funds rate at the end of June, 2006.
| · | By the fourth quarter of 2006, many of these same underlying trends were exacerbated. The beginning of the quarter marked the end of favorable re-pricing opportunities for rate-sensitive earning assets. At the same time, the relative composition of funding sources continued to migrate toward an increasing dependency on higher-cost, short-term time deposits. By the fourth quarter, time deposits comprised 49.1% of funding sources. |
The following chart illustrates a number of the observations noted above, and focuses on trends associated with earning asset yields, certificate of deposit costs, and the increasing dependency on time deposits as a source of funding during each of the four quarters of 2006:
| | | Change from Previous Quarter—Increase / (Decrease) | |
| | | [expressed in basis points-bp] | |
| | | | |
| | | Fourth Quarter | | Third Quarter | | Second Quarter | | First Quarter | |
| Earning Asset yield | | | ( 3 bp | ) | | 15 bp | | | 19 bp | | | 21 bp | |
| Funding cost - time deposits | | | 26 bp | | | 25 bp | | | 29 bp | | | 25 bp | |
| | | | | | | | | | | | | | |
| % of funding from time deposits | | | 49.1 | % | | 47.9 | % | | 47.5 | % | | 43.9 | % |
| · | Interest Income / Earning Assets |
For all of 2006, interest income reached $205 million, an increase of $56 million, or 37% over the interest income of $149 million reported for 2005. This increase was driven by: (1) the full year addition of Blue Ball average assets versus only six months in 2005; and (2) improved earning asset yield, which rose from 6.26% in 2005 to 6.95% for 2006, an increase of 69 basis points. Average earning assets grew from $2.4 billion to almost $3.0 billion between the two periods. Excluding the acquired growth attributed to Blue Ball, organic growth in total earning assets was constrained as loan growth was increasingly funded by scheduled runoff in the investment portfolio, particularly in the first half of 2006. As the balance of the investment portfolio approached functional liquidity and pledging limits,
Community was required to become more competitive in price offerings on time deposits to fund more modest levels of loan growth that occurred in the second half of the year. Investment portfolio balances as a percentage of total earning assets declined from 26% in 2005 to 20% in 2006. Community has historically focused its loan growth in the commercial and commercial real estate segments of its core markets. This growth was also augmented by expansion of retail lending, including the vital home equity segment.
| · | Interest Expense / Funding Sources |
Interest expense was more dramatically influenced by the changing yield curve dynamics, including the funding added from the acquisition of Blue Ball. Interest expense grew 52%, from almost $60 million in 2005 to nearly $91 million in 2006. At the same time, the cost of aggregate funding rose from 2.90% to 3.56%, or 66 basis points. The rise in short term interest rates, and the increased reliance on higher-cost short term time deposits, dramatically increased the overall cost of funds.
| · | Interest Spread / Net Interest Margin |
A financial institution’s ability to effectively blend the impact of changing rates, shifting rate indices, customer preferences, and product development initiatives can be measured by the performance of interest spread, defined as the difference between earning asset yield and the cost of funding sources. Net interest margin combines the impact of interest spread with both investment of non-interest bearing funding sources and management of non-earning assets.
The Corporation reported modest overall improvement in net interest spread from 3.36% in 2005 to 3.39% in 2006. Net interest margin, which includes the impact of both net interest spread and the impact of non-interest funds, grew at a slightly higher rate, from 3.76% to 3.88%, over the same periods. Net interest margin reached its zenith in the post-merger period during the first quarter of 2006, followed by slight declines in the second and third quarter. By the fourth quarter of 2006, the margin declined to its lowest level since the merger, primarily due to the trends cited in the quarterly review of net interest income. Most of the observable increase in year-over year margin was linked to the impact of the growth in the contribution from non-interest funding sources, which rose from 0.40% to 0.49%. During periods of rising interest rates, the contribution from non-interest funds to net interest margin is increased because funds can be invested at progressively higher rates. During periods of declining rates, these funds can be expected to contribute to reductions in net interest margin.
Provision for Credit Losses
For most of the last three years, asset quality has been a mainstay of both Community’s financial performance and that of pre-merger Blue Ball. Throughout 2006, the Corporation sustained this trend of high quality credit metrics, highlighted by the almost negligible net-charge offs of 0.06% of loans. The provision for loan losses declined only slightly, from $2.3 million in 2005 to $2.1 million in 2006, which corresponded to the consistently low level of net charge-offs in both years. Net charge-offs grew from $0.8 million in 2005 to $1.4 million in 2006, but relative levels remained exceptionally low by historical standards. The ratio of net charge-offs to average loans was constant in both years, at 0.06% in 2006 and 0.05% in 2005, the two lowest level of annual charge-offs in the last five years.
The ratio of the allowance for loan losses to loans revealed little change, from 1.03% at the end of 2005 to 1.00% at the end of 2006. At the end of 2006, the allowance for credit losses reached $23.6 million and provided 188% coverage of non-accrual loans at that date. Non-accrual loans totaled $12.5 million at the end of 2006.
The provision and the allowance are recorded at levels which are responsive to both the ebb and flow of general credit quality patterns and, more specifically, to the risks inherent in both seasoned loans and in incremental additions to Community’s growing portfolio. Community undergoes a rigorous and consistently applied process on a quarterly basis in order to evaluate the allowance for loan losses and the determination of the quarterly provision for credit losses. See the section of this discussion entitled “Allowance for Loan Losses and Credit Quality” for additional information.
Non-Interest Income (excluding investment gains)
Community’s non-interest income grew to $34.2 million in 2006 versus $26.2, an increase of $8.0 million or 31%. This growth can be attributed to four major elements:
| § | Instinctively, the additional six months of Ball activity would ordinarily be expected to account for a minimum increase of 25% between the two years, after giving effect to both (1) the relatively similar contributions of non-interest income for the pre-merger companies and; (2) the mid-year 2005 merger timing. |
| § | The mid-May, 2006 acquisition of the Wiley Insurance Agency, a small south-central Pennsylvania insurance agency, combined with the mid-September addition of the acquired trust assets of a competing bank, fueled incremental growth in both insurance commissions and income from trust services. As expected, each of these operations also resulted in increases in expenses that are described in the section marked as “Non-Interest Expenses”. |
The addition of these complementary businesses continued to incrementally reduce reliance on revenues from intermediation activities. In the fourth quarter, the first full quarter of additional revenues from these acquired businesses, the ratio of non-interest revenues to total revenues rose to 23.8% versus 21.3% in the fourth quarter of 2005.
| § | The successful coordination and consolidation of the previously separate, pre-merger fee businesses, such as retail investment sales and the overdraft honors programs, provided an additional boost in both revenues and improved operational delivery. |
| § | Finally, Community experienced two favorable events involving the acceleration of discount accretion from purchase accounting adjustments that had arisen at the PennRock merger date. These two occurrences produced “one-off” revenues that were reflected in the first and third quarters of 2006. First quarter results included a nonrecurring gain attributed to the early retirement of certain FHLB advances that had been scheduled to re-price at higher floating rates. In the third quarter, Community recognized a gain on the sale of loans that had been acquired in the Blue Ball merger. The basis of these loans had been adjusted at acquisition for contractually required payments that were not considered collectible. These two occurrences contributed approximately $927,000 to aggregate increases in non-interest income. |
.
The following is a detailed summary of the various categories of non-interest income, including the full twelve months of Blue Ball activity in 2006 and six months in 2005:
| | | | | | | Change | |
| | | 2006 | | 2005 | | Amount | | % | |
| Investment management and trust services | | $ | 4,394 | | $ | 2,692 | | $ | 1,702 | | | 63 | % |
| Service charges on deposit accounts | | | 11,507 | | | 9,413 | | | 2,094 | | | 22 | % |
| Other service charges, commissions and fees | | | 7,272 | | | 5,452 | | | 1,820 | | | 33 | % |
| Insurance premium income and commissions | | | 4,120 | | | 3,350 | | | 770 | | | 23 | % |
| Mortgage banking activities | | | 2,172 | | | 2,354 | | | (182 | ) | | (8 | )% |
| Earnings on investment in life insurance | | | 2,725 | | | 2,063 | | | 662 | | | 32 | % |
| Other income | | | 2,045 | | | 854 | | | 1,191 | | | 139 | % |
| | | | | | | | | | | | | | |
| | | | 34,235 | | | 26,178 | | | 8,057 | | | 31 | % |
| | | | | | | | | | | | | | |
| Investment security gains | | | 732 | | | 259 | | | 473 | | | 183 | % |
| | | | | | | | | | | | | | |
| Total non-interest income | | $ | 34,967 | | $ | 26,437 | | $ | 8,530 | | | 32 | % |
Investment management and trust services grew 63%, largely due to the more robust trust activities acquired from the PennRock merger. Pre-merger Community had a modest trust department with just over $50 million in managed assets. At the end of 2006, assets under management had grown to nearly $415 million, which included the effect of assets added from both Blue Ball and those added in the fourth quarter acquisition. Retail investment sales, another component of this category, remained vigorous throughout the year and were favorably affected by the coordination and consolidation of the previously separate activities of the pre-merger banks.
Service charges on deposit accounts consist primarily of revenues from traditional overdraft activity and those from the overdraft privilege programs. Since the last half of 2005, Community avoided initiating any wholesale changes in the fee structure in the Blue Ball division in order to forestall any potential for customer dissatisfaction in the post-consummation period. Fee structures were re-evaluated in the last half of 2006 and are expected to yield increases related to rate changes in 2007.
Other service charges included the impact of both ATM surcharge fees and debit card income. Debit card activity has been fueled by consumer acceptance of this convenient electronic payment medium. During 2006, Community expanded customer awareness programs designed to encourage usage of signature-based debit card transactions. The increased usage of this fee-generating service is consistent with an industry-wide consumer preference for the convenience of debit card-based transactions. These fee increases were more than adequate to offset a decrease in ATM surcharge fees resulting from the termination of Community’s proprietary arrangement with a local convenience store chain.
Insurance commissions are comprised of agency fees from various commercial and personal lines. Growth in commissions was partially offset by declines in title insurance activity. Title insurance activity, which is closely tied to mortgage activity, reflected the major declines in refinancings that began to emerge in 2005.
Fees from mortgage banking slowed considerably, particularly considering that 2005 included only 6 months of activity from the Blue Ball market. Industry-wide declines in mortgage refinancing activity restricted fees to those associated with purchase mortgages.
Other income included the aforementioned occurrences involving acceleration of merger-related discount accretion.
Security gains had a comparatively benign impact on both 2005 and 2006.
Non-Interest Expenses
Total non-interest expenses reached $85 million in 2006 versus $75 million in 2005. Results in 2005, however, included $8.2 million of special charges for merger, conversion and restructuring expenses associated with the mid-year acquisition of PennRock and its banking subsidiary, Blue Ball. Excluding those special charges, non-interest expenses reached $66.9 million in 2005. As a result, core operating expenses grew 27% largely due to twelve months of Blue Ball expenses in 2006 versus just six months in 2005. In addition, the merger resulted in the recognition of the full year increment of intangible amortization (primarily core deposit intangible amortization), versus just six months in the last half of 2005.
| | | | | | | Change | |
| | | 2006 | | 2005 | | Amount | | % | |
| Salaries and benefits | | $ | 46,434 | | $ | 36,998 | | $ | 9,436 | | | 26 | % |
| Occupancy and equipment expense | | | 14,117 | | | 11,355 | | | 2,762 | | | 24 | % |
| Marketing expense | | | 1,752 | | | 2,036 | | | (284 | ) | | (14 | )% |
| Telecommunications expense | | | 2,243 | | | 1,359 | | | 884 | | | 65 | % |
| Amortization of intangibles | | | 2,639 | | | 1,424 | | | 1,215 | | | 85 | % |
| Other expenses | | | 17,700 | | | 13,692 | | | 4,008 | | | 29 | % |
| | | | | | | | | | | | | | |
| Subtotal | | | 84,885 | | | 66,864 | | | 18,021 | | | 27 | % |
| | | | | | | | | | | | | | |
| Merger, conversion and restructuring | | | --- | | | 8,205 | | | (8,205 | ) | | --- | |
| | | | | | | | | | | | | | |
| | | $ | 84,885 | | $ | 75,069 | | $ | 9,816 | | | 13 | % |
| · | Overview—Operating Expense (excluding merger, conversion and restructuring) |
The efficiency ratio is defined as expenses divided by operating revenues (expressed on a fully-taxable equivalent basis). If expense levels were to rise at a faster pace than the rise in revenue growth, the efficiency ratio can be expected to increase and impede profitability. For all of 2005, the efficiency ratio was 57.51% and was consistent with the ratio of 57.33 % in 2006. The 2006 ratio exhibited more dramatic improvement after excluding intangible amortization, a non-cash operating expense, from the computation. By excluding intangible amortization for 2006 and 2005 (a non-GAAP treatment), the efficiency ratios for those periods reached 55.55 %, and 56.29%, respectively.
The largest single component of non-interest expenses is salary and benefits. Combined salary and benefit expenses comprised 56% of operating expenses (excluding intangible amortization) in 2006 and 57% in 2005. For the month of December, 2006, the pro-forma combined number of full-time equivalent employees (FTE’s) aggregated 993 versus 933 at December of 2005. Increases in the number of FTE’s were driven principally by (1) two new office openings and (2) the acquisitions of the acquired insurance agency and trust operations. These business expansion efforts accounted for 48 of the total of 60 FTE additions since the end of 2005.
Community continues its migration toward a compensation system that is weighted toward team-based performance awards in lieu of annual salary increases that are based upon subjectively-based performance criteria. The plan design for these awards emphasizes a “needs-based” assessment of a customer’s financial situation but more closely links performance compensation with product sales and pre-determined performance goals. Additionally, Community offers a management-based incentive program that is directly tied to year-over-year profit performance. 2006 represents the first full year that this program was extended to management personnel who joined Community after the date of the merger with Blue Ball. On a relative basis, management-based incentives were reduced from 2005 levels reflecting the lower year-over-year improvement in core-operating performance during 2006.
Salary and benefits expenses include the expenses associated with stock option grants. Prior to 2006, Community followed the intrinsic value accounting method of Accounting Principles Board (“APB”) Opinion No. 25, “Accounting for Stock Issued to Employees,” which was permitted under SFAS No. 123, “Accounting for Stock Based Compensation.” Options granted by Community prior to 2006 were issued with an exercise price equal to the fair value of the stock at the date of issuance. Accordingly, no compensation expense was recognized in the financial statements for stock options issued to employees, executive officers or directors through the end of 2005. As discussed in the Notes to the Consolidated Financial Statements in Item 8 of this filing, Community has provided the required pro forma disclosures for the impact of stock compensation on net income and earnings per share by applying the fair value recognition provisions of SFAS No. 123 in years prior to 2006.
In 2006, Community commenced expense recognition of options now required under SFAS No. 123(R), “Share-Based Payment”. SFAS No. 123(R), which amended SFAS No. 123, now mandates financial statement recognition of compensation cost for stock options and other stock-based awards. In connection with its implementation of the new standard, Community adopted the modified prospective method. This method required recognition of compensation expense for the unvested portion of existing awards and new grants, but does not require a transitional restatement of prior periods. Stock compensation expense of $655,000 was recorded in 2006, the bulk of which was related to the January 2006, grant of 255,000 options with a 3-year vesting period. These options had a grant date estimated fair value of $1.7 million. The remaining unrecognized expense of approximately $1.2 million is scheduled to be recorded in 2007 and 2008, the final two years of the vesting period.
In January of 2007, the Board approved an additional grant of 273,000 options, which will also be recognized as a component of expense over the vesting period prescribed in the 2007 grant. Unlike the 2006 grant, however, these options were granted with a 5-year vesting period that will reduce the amount of annual expenses recorded to comply with SFAS No. 123(R) for the 2007 option grants. Nonetheless, expense recognition for 2007 and 2008 will reflect the incremental expenses associated with options issued in 2006 as well as those issued in 2007 until all remaining are fully vested. Thereafter, annual expense is expected to peak at nearly $1.2 million and remain stable, subject to the Board’s prerogative to continue to provide option grants in future periods. The Board intends to regularly study and evaluate the on-going effectiveness of the stock-based component of employee compensation.
| · | Occupancy and Equipment Expense |
As with other expense categories, increases in occupancy and equipment expense increased proportionately to the impact of twelve months of expenses associated with Blue Ball operations versus six months in 2005. Actual expenses grew 24%, from $11.4 million in 2005 to $14.1 million in 2006. While operating savings resulted from the combination of Community and Blue Ball operations, such savings were offset by the incremental full year costs of the of the office additions in 2005 and 2006.
Increases in organic occupancy and equipment expenses are directly tied to the pace of office expansion and the increased cost of technology, particularly those initiatives that represent enhancements to efficiency, internal controls, and service delivery. In 2005, Community and Blue Ball opened a total of 5 new offices that experienced their first full year of operation in 2006. During 2006, Community limited its openings to an additional office in the first quarter and another in the fourth quarter, each within Community’s existing market footprint. On a combined basis, the new office openings of the past two years represented nearly a 10% increase from organic office expansion.
Incremental office openings planned for both 2007 and periods beyond 2007 are currently being re-evaluated. Although firm commitments remain in place for 2 new offices and 2 office relocations in 2007, further office expansion is likely to be curtailed pending the emergence of conditions more favorable to organic branch expansion.
Marketing expense in 2006 was favorably influenced by the efficiencies gained through the combination of the marketing operations of the two combined franchises. Expenses in the second half of 2005 had risen due to costs associated with the introduction of Community to those customers acquired through the Blue Ball merger. Expenses reached $2.0 million for all of 2005 and dropped to $1.8 million in 2006, despite a full twelve months of Blue Ball activity. Profitability concerns narrowed the Corporation’s appetite for extraneous image advertising and other discretionary forms of marketing expense. Earnings pressures will continue to drive a marketing focus which emphasizes leveraging of internal marketing efforts and minimize the use of expensive, external forms of advertising.
| · | Telecommunication Expense |
Both the organic and acquisition-based growth of Community’s franchise, and consumer emphasis on technology-driven accessibility, has created a need for improved communications over a disparate geographic area. For the last several years, the Corporation has incurred substantial expenses related to the costs of upgrades for communications and data connectivity improvements for Community’s growing franchise. These expenses included capacity enhancements necessary to accommodate both the acquisition of PennRock and the organic growth of offices. Telecommunications expense reached $2.2 million for 2006 compared to $1.4 million in 2005, an increase of 65%. Even with the addition of six months activity from Blue Ball, the 2006 increase was disproportionately high. Expenses in 2006 comprised 2.6% of total expenses versus 2.0 % in 2005. These expenses are expected to stabilize in 2007 as excess capacity created from recent investments are expected to accommodate growth planned in the immediate future.
| · | Amortization of Intangibles |
In connection with the merger of Blue Ball, Community recorded intangible assets of $254 million, including a core deposit intangible of $13 million. Under the provisions of SFAS No. 142, acquirers are no longer required to amortize the intangible asset associated with goodwill, which was the most significant portion of the intangibles created as a result of the Blue Ball merger. Instead, such amounts must be periodically tested for impairment. In contrast, certain other intangible assets are deemed to have finite lives and are required to be amortized over their assumed lives. The increase in intangible amortization reflects the full twelve month impact of the Blue Ball-related core deposit intangible amortization versus the one-half year amount reflected in 2005.
Significant categories of expenses contained in this grouping include Pennsylvania bank shares tax, insurance, contributions, stationery, printing, postage and various other expenses. Virtually all of the increases were influenced by the incremental expenses arising from the merger of Blue Ball or by expenses associated with business volume increases.
In 2006, the FDIC announced a substantial increase in deposit insurance assessment rates to be effective January 1, 2007. At the same time, the FDIC also announced a One-Time Assessment Credit for those institutions that were in existence at December 31, 1996, and had paid a deposit insurance assessment prior to that date. Based upon the most current information available from the FDIC, it is expected that the annual assessment increase for the Bank will be in excess of $1 million per year at announced rates. For 2007, virtually all of the increase should be offset by the one-time credit. For years beyond 2007, anticipated rate changes are expected to increase the annual assessment expense, subject to any changes in prospective assessments that may be announced by the FDIC at some future date.
Income taxes grew from $6.1 million in 2005 to $13.9 million in 2006. Comparisons to 2005 are distorted by the influence of the $8.2 million of special charges, the incremental Blue Ball activity in 2006, and the relative levels of tax-free income. Relative levels of tax-free income were reduced from levels reported for pre-merger Community, which had a higher proportion of tax-free investments than the post-combination Corporation. Community maintains additional capacity to increase the level of tax-free investment as interest rate conditions improve.
BALANCE SHEET
Overview
At December 31, 2006, the Corporation’s period end assets reached $3.50 billion, reflecting a change of 5% from the $3.33 billion of assets recorded at the end of 2005. Average assets reached $3.40 billion for all of 2006 compared to $2.67 billion for 2005, an increase that was substantially driven by the mid-year 2005 merger of Blue Ball. Average loans reached $2.32 billion, increasing 36% from 2005, while average investments actually declined 4%, to $592 million. Growth in the investment portfolio was limited by the continued use of scheduled investment runoff to fund loan growth, particularly in the second half of 2005 and the first half of 2006. The decision to use scheduled investment runoff to fund loan demand was influenced by lower deposit growth rates and by the opportunity to extract higher asset yields from loan demand versus investment yields. Average deposits grew to $2.41 billion for all of 2006 with much of the growth occurring in the second half of the year. By mid-year 2006, opportunities to utilize scheduled investment runoff to fund loan growth were constrained by liquidity and pledging limitations; this resulted in more aggressive pricing on certificate of deposit offerings to fund asset growth in the third and fourth quarters.
Loan growth, which was strong in the first half of 2006, was relatively constrained in the second half of the year due, in part, to unexpected loan payoffs which partially offset new loan generation. Growth in commercial borrowings, while reasonably strong through mid-year, decelerated during the second half of 2006 as mixed reports regarding economic growth created uncertainty, particularly within the real estate development sector. Conversely, consumer demand for credit was steady throughout the year and was influenced by both comparatively low rates and sustained consumer confidence.
Investments
Community has established corporate investment policies that address various aspects of portfolio management, including quality standards, liquidity and maturity limits, investment concentrations and regulatory guidelines. The Corporation’s objective with respect to investment management includes maintenance of appropriate asset liquidity, facilitation of asset/liability strategy, and maximization of return. Compliance with investment policy is regularly reported to the Board of Directors.
| · | Investment Classification |
Securities to be held for indefinite periods of time are classified as “available-for-sale” and carried at fair value. Community actively manages its investment portfolio and, accordingly, has classified a substantial portion of its portfolio as available-for-sale. Such securities are intended to be used as part of Community’s asset/liability management strategy, and may be sold in response to changes in interest rates, prepayment risk and other factors affecting overall investment strategy.
Under current policy, if management has the intent and the Corporation has the ability to hold securities until maturity, securities are classified as “held-to-maturity” investments at the time of purchase and carried at adjusted historical cost. Community has added no securities to this category since 2005.
| · | 2006 Investment Activity and Funding Trends |
In the post-merger period beginning July 1, 2005, Community began utilizing scheduled runoff from the investment portfolio to facilitate the demand for credit funding, which was outpacing the growth from deposit funding sources. Changes in the interest rate environment had exerted upward pressure on the pricing of incremental time deposit offerings and Community made a decision to be less competitive in order to minimize the upward re-pricing of its funding base in a higher rate environment. Loan growth remained steady during the first half of 2006, with a portion of the funding coming from the continuing portfolio runoff.
In the second half of 2006, while overall rate levels stabilized, the yield curve continued its migration to an inverted position. At the same time, absolute dollar levels of the investment portfolio had declined toward practical limitations established by management to ensure on-going compliance with internal liquidity and pledging policies. Loan growth began to slow during the second half of the year, and given the practical limitation on the use of the investment portfolio as a funding source, changed the funding dynamics. By the end of the third quarter of 2006, a higher reliance was placed upon time deposits as a source of incremental funding and investment balances were stabilized.
The Corporation reflected a modest pretax unrealized net gain of $202 thousand within the investment portfolio at December 31, 2006. As required, since this unrealized gain pertained to available for sale securities, the fair value adjustment was recorded in accumulated other comprehensive loss (adjusted for income taxes) contained in the stockholders’ equity section of the consolidated balance sheet. For those securities classified as available-for-sale, investments totaling $297 million have a fair market value that exceeded the adjusted historical cost, with unrealized pretax gains totaling $6.7 million. Alternatively, available-for-sale securities totaling $339 million have a fair market value less than the adjusted historical cost, reflecting unrealized losses of $6.5 million. Securities classified as held-to-maturity had fair market values slightly in excess of carrying values. Special consideration was given to securities which were affected by unrealized losses.
| · | Other Than Temporary Impairment |
For several years, regulators have been addressing the issue of accounting for impairments of certain investments in debt and equity securities. In November of 2005, the FASB issued a final FASB Staff Position, which nullified and clarified certain provisions of accounting literature regarding the treatment of other than temporary impairment (OTTI).
Community has established a process to apply the accounting requirements for those securities which are deemed to have the potential to be considered for OTTI. This process requires that all securities which have a decline in fair market value below the carrying value be reviewed on a quarterly basis. The review of those securities requires an analysis of the following:
| o | The length of time and the extent to which the fair value has been less than cost, |
| o | The financial condition and near-term prospects of the issuer, and |
| o | The intent and ability of the Corporation to retain its investment in the issuer for a period of time sufficient to allow for any anticipated recovery in fair value. |
At the end of 2006, Community reviewed $341 million of securities which had a fair market value which was less than amortized cost. The vast majority of unrealized losses related to changes in interest rates subsequent to acquisition and do not reflect any form of credit deterioration. Of those securities with identified unrealized losses, approximately $18 million were subjected to a more intensive review to determine the potential for OTTI pursuant to the parameters outlined above. Based upon this evaluation, and the Corporation’s ability and intent to hold those investments for a reasonable period of time sufficient for a forecasted recovery of fair value, Community does not consider these investments to be other-than-temporarily-impaired at December 31, 2006.
The following tables summarize amortized cost and estimated fair values at December 31, 2006, 2005, and 2004 and maturity distribution of securities at December 31, 2006.
| | | 2006 | | 2005 | | 2004 | |
| | | Amortized Cost | | Fair Value | | Amortized Cost | | Fair Value | | Amortized Cost | | Fair Value | |
| | | | | | | | | | | | | | | | | | | | |
| U.S. government and federal agency | | $ | 128,660 | | $ | 126,772 | | $ | 125,938 | | $ | 123,124 | | $ | 126,056 | | $ | 125,541 | |
| Mortgage-backed, primarily federal agency | | | 204,887 | | | 201,972 | | | 186,871 | | | 182,813 | | | 178,437 | | | 179,314 | |
| State and municipal | | | 219,949 | | | 225,590 | | | 209,077 | | | 213,475 | | | 180,110 | | | 186,366 | |
| Corporate | | | 42,403 | | | 42,558 | | | 40,351 | | | 40,220 | | | 58,928 | | | 60,043 | |
| Equity | | | 63,035 | | | 62,589 | | | 68,909 | | | 68,486 | | | 67,085 | | | 67,846 | |
Total | | $ | 658,934 | | $ | 659,481 | | $ | 631,146 | | $ | 628,118 | | $ | 610,616 | | $ | 619,110 | |
Maturity Distribution of Securities
| | | Within One Year | | One Through Five Years | | Five Through Ten Years | | After Ten Years | | Total | | Average Maturity | | Weighted Average Yield(a) | |
| U.S. Government and federal agencies | | $ | 1,130 | | $ | 76,370 | | $ | 79,935 | | $ | 176,111 | | $ | 333,546 | | | 10yr. 8mos. | | | 4.95 | % |
| State and municipal | | | --- | | | 1,866 | | | 22,318 | | | 195,765 | | | 219,949 | | | 15yr. 0mos. | | | 6.84 | % |
| Other | | | --- | | | 16,382 | | | 9,000 | | | 17,021 | | | 42,403 | | | 12yr. 1 mos. | | | 7.00 | % |
| Total | | $ | 1,130 | | $ | 94,618 | | $ | 111,253 | | $ | 388,897 | | $ | 595,898 | | | 12yr. 4 mos. | | | 5.80 | % |
| | | | | | | | | | | | | | | | | | | | | | | |
| Percentage of total | | | 0.19 | % | | 15.88 | % | | 18.67 | % | | 65.26 | % | | 100.00 | % | | | | | | |
| | | | | | | | | | | | | | | | | | | | | | | |
| Weighted average yield (a) | | | 4.35 | % | | 5.11 | % | | 5.33 | % | | 6.10 | % | | 5.80 | % | | | | | | |
(a) Weighted average yields are based on amortized cost which does not give effect to changes in fair value that are reflected as a component of stockholders’ equity. Yields were computed on a tax equivalent basis using a federal tax rate of 35%.
Loans
The pre-merger loan portfolios at Community and Blue Ball were similar in composition, with comparable credit quality characteristics. As a consequence, the post-merger, combined loan profile was not substantially different than the historical loan profile of Community prior to the merger. The differences that did exist, such as Blue Ball’s lower concentration of consumer loans, were comparatively modest.
Since the time of the merger, growth trends reflected both acquired growth (via the PennRock merger) and organic growth (attributable to incremental loan production), the combination of which yielded absolute growth. The following table of loans presents the absolute growth level of average loans between 2005 (six months of Blue Ball included) and 2006 (twelve months of Blue Ball included):
| | | | | | | Change | |
| | | 2006 | | 2005 | | Amount | | % | |
| | | | | | | | | | | | | | |
| Commercial | | $ | 830,141 | | $ | 592,556 | | $ | 237,585 | | | 40 | % |
| Commercial real estate | | | 820,181 | | | 562,852 | | | 257,329 | | | 46 | % |
| Residential real estate | | | 151,329 | | | 128,120 | | | 23,209 | | | 18 | % |
| Consumer | | | 522,567 | | | 431,477 | | | 91,090 | | | 21 | % |
Total | | $ | 2,324,218 | | $ | 1,715,005 | | $ | 609,213 | | | 36 | % |
Because of the distortions of purchase accounting, a more reliable and meaningful gauge of organic growth trends is illustrated by observing the rate of growth in the various categories of loans for the 2005 fourth quarter average versus the 2006 fourth quarter average. This comparison provides a proxy for organic growth trends because the 2005 base period includes the acquired Blue Ball loans. The following growth trends were noted:
| | | Fourth Quarter | | Fourth Quarter | | Change | |
| | | 2006 | | 2005 | | Amount | | % | |
| | | | | | | | | | | | | | |
| Commercial | | $ | 840,982 | | $ | 766,532 | | $ | 74,450 | | | 10 | % |
| Commercial real estate | | | 822,007 | | | 779,459 | | | 42,548 | | | 5 | % |
| Residential real estate | | | 150,132 | | | 154,716 | | | (4,584 | ) | | (3 | )% |
| Consumer | | | 540,653 | | | 502,064 | | | 38,589 | | | 8 | % |
Total | | $ | 2,353,774 | | $ | 2,202,771 | | $ | 151,003 | | | 7 | % |
Generally speaking, the growth in commercial and commercial real estate lending prior to 2006 had been robust. Total loan growth rates at pre-merger Community had been in the range of 12% to 15% for most of pre-merger 2005 and 2004, the vast majority of which was attributable to expanded commercial and commercial real estate production. Growth rates continued to exhibit double-digit growth trends through the end of the first half of 2006. By mid-year 2006, however, growth in these categories began to abate, largely as a result of factors such as borrower de-leveraging, credit risk consideration, and re-financings with other financial institutions. Given the uncertainty in the real estate development sector, borrower financing of housing tracts, hotels, and other forms of real estate lending waned from the levels experienced in the first half of 2006. Loan payoff activity was especially vibrant in the fourth quarter of 2006 and, despite reasonably strong new loan generation, caused balances to reflect only modest growth on a net basis.
Residential real estate lending, which is composed primarily of loans to single-family creditors, has experienced a steady decline as a result of the increasing accessibility of secondary market liquidity through mortgage banking activities. Community-based banks continued to provide a convenient portal for consumers to access funding for residential lending, but most fixed-rate, conforming mortgages were sold into the secondary market. This strategy has reduced the interest rate risk associated with consumer preferences for long-term, fixed-rate lending, and provided valuable liquidity for other forms of relationship lending. The influence of a cooling housing market has limited the pace of mortgage lending activity in the near term.
Community has undertaken substantial efforts, particularly in recent years, to become a more competitive consumer lender within its historical footprint. Community has employed a more centralized consumer lending effort that has fueled a more proactive lending approach to identifying and leveraging consumer lending needs. These efforts have been designed to identify incremental consumer lending opportunities and to penetrate customer relationships more fully. The centralization of administration and oversight of consumer lending activities, inclusive of the Blue Ball division, has resulted in a more strategic approach to expanded activity in the consumer lending sector.
Allowance for Loan Losses and Credit Quality
The following sets forth activity within the allowance for credit losses for the last three years.
| | | 2006 | | 2005 | | 2004 | |
| | | | | | | | | | | |
| Balance at January 1, | | $ | 22,965 | | $ | 14,421 | | $ | 13,178 | |
| Loans charged off | | | (2,290 | ) | | (2,323 | ) | | (2,910 | ) |
| Recoveries | | | 901 | | | 1,499 | | | 1,053 | |
| Provision charged to operations | | | 2,050 | | | 2,300 | | | 3,100 | |
| Allowance established for acquired credit risk | | | --- | | | 7,068 | | | --- | |
| Balance at December 31, | | $ | 23,626 | | $ | 22,965 | | $ | 14,421 | |
| | | | | | | | | | | |
| Allowance for credit losses to loans | | | 1.00 | % | | 1.03 | % | | 1.18 | % |
The credit quality profile of Community has remained stable for each of the last three years, the last two of which were among the best in the history of the Corporation. A critical metric to assess credit quality trends is the relative level of recent net charge-off activity. While absolute dollar levels of net charge-offs increased from 2005, the relative levels of net charge-offs to loans remained very low in both 2005 and 2006, at 0.05% and 0.06% of aggregate loans, respectively. These trends were considered remarkable given the pace of loan growth over the past two years. As indicated earlier, the composition of the loans added as a result of the merger of Blue Ball had little impact on the overall credit risk profile, owing primarily to the similarity in the composition of loans at the two banks. More importantly, both the Community and Blue Ball franchises shared a common credit quality culture, evidenced by the favorable trends and metrics of the predecessor banks prior to the merger and the consistency of trends in the first full year of activity in 2006.
At December 31, 2006, the allowance provided 1.88 times coverage of those loans included as non-accrual loans. At the end of 2005, this same ratio reflected 2.53 times coverage. While credit trends throughout the year reflected generally stable asset quality, Community did experience an increase in non-accrual loans at year end. The increase was attributed primarily to a limited number of loans and was not deemed to reflect any negative trend with regard to overall asset quality. At the end of year, management reviewed the components of those loans included as non-accrual loans as part of its normal quarterly review. Pursuant to that review, there is no expectation that the individual loans responsible for the increase in the relative level of non-accrual loans would require a loan loss provision beyond the amounts already reflected in the financial statements. Management continuously monitors those loans which reach non-accrual status and believes that such loans are reflected at realizable value.
The following sets forth loan loss experience for the last five years (in thousands):
| | | 2006 | | 2005 | | 2004 | | 2003 | | 2002 | |
| Loans at year-end | | $ | 2,370,889 | | $ | 2,237,065 | | $ | 1,217,456 | | $ | 1,084,678 | | $ | 916,051 | |
| | | | | | | | | | | | | | | | | |
| Average loans balance | | $ | 2,324,218 | | $ | 1,715,005 | | $ | 1,156,514 | | $ | 1,004,781 | | $ | 894,132 | |
| Balance, allowance for loan losses, January 1 | | $ | 22,965 | | $ | 14,421 | | $ | 13,178 | | $ | 12,343 | | $ | 12,132 | |
| | | | | | | | | | | | | | | | | |
| Loans charged off: | | | | | | | | | | | | | | | | |
| Commercial, financial and agricultural | | | 576 | | | 321 | | | 300 | | | 253 | | | 1,878 | |
| Real estate-commercial mortgage | | | 676 | | | 963 | | | 1,087 | | | 1,336 | | | 1,337 | |
| Real estate-retail mortgage | | | 91 | | | 119 | | | 160 | | | 212 | | | 110 | |
| Consumer and other | | | 947 | | | 920 | | | 1,363 | | | 1,038 | | | 855 | |
| | | | | | | | | | | | | | | | | |
| Total | | | 2,290 | | | 2,323 | | | 2,910 | | | 2,839 | | | 4,180 | |
| | | | | | | | | | | | | | | | | |
| Loans recovered: | | | | | | | | | | | | | | | | |
| Commercial, financial and agricultural | | | 86 | | | 286 | | | 324 | | | 240 | | | 644 | |
| Real estate-commercial mortgage | | | 420 | | | 703 | | | 240 | | | 606 | | | 7 | |
| Real estate-retail mortgage | | | 15 | | | 68 | | | 17 | | | 83 | | | 18 | |
| Consumer and other | | | 380 | | | 442 | | | 472 | | | 245 | | | 372 | |
| | | | | | | | | | | | | | | | | |
| Total | | | 901 | | | 1,499 | | | 1,053 | | | 1,174 | | | 1,041 | |
| | | | | | | | | | | | | | | | | |
| Net charge-offs | | | (1,389 | ) | | (824 | ) | | (1,857 | ) | | (1,665 | ) | | (3,139 | ) |
| | | | | | | | | | | | | | | | | |
| Provision for loan losses | | | 2,050 | | | 2,300 | | | 3,100 | | | 2,500 | | | 3,350 | |
| | | | | | | | | | | | | | | | | |
| Allowance established for acquired credit risk | | | --- | | | 7,068 | | | --- | | | --- | | | --- | |
| | | | | | | | | | | | | | | | | |
Balance, allowance for loan losses, December 31 | | $ | 23,626 | | $ | 22,965 | | $ | 14,421 | | $ | 13,178 | | $ | 12,343 | |
| | | | | | | | | | | | | | | | | |
| Net charge-offs to loans at year end | | | 0.06 | % | | 0.04 | % | | 0.15 | % | | 0.15 | % | | 0.34 | % |
| | | | | | | | | | | | | | | | | |
| Net charge-offs to average loans | | | 0.06 | % | | 0.05 | % | | 0.16 | % | | 0.17 | % | | 0.35 | % |
| | | | | | | | | | | | | | | | | |
Balance of allowance for loan losses to loans at year end | | | 1.00 | % | | 1.03 | % | | 1.18 | % | | 1.22 | % | | 1.35 | % |
| · | Allowance for Loan Losses Ratio |
The ratio of the allowance to loans declined from 1.03% at the end of 2005 to 1.00% at the end of 2006. This modest decline was indicative of the overall stability of Community’s credit quality trends and the inherently positive view of loan collectibility.
The allowance for loan losses is based upon management’s continuing evaluation of the loan portfolio. Each quarter, a review is performed to address loan quality, current macro-economic conditions and delinquency status. The provision for loan losses is adjusted quarterly based upon that review. The following table presents an allocation by loan categories of the allowance for loan losses at December 31 for the last five years.
| | | 2006 | | 2005 | | 2004 | | 2003 | | 2002 | |
Loans: | | | | | | | | | | | |
Commercial, financial and agricultural | | $ | 16,668 | | $ | 13,632 | | $ | 7,899 | | $ | 7,090 | | $ | 6,305 | |
Real estate-construction | | | --- | | | --- | | | --- | | | --- | | | --- | |
Real estate-mortgage | | | 2,012 | | | 2,186 | | | 2,099 | | | 2,313 | | | 1,936 | |
Consumer | | | 3,580 | | | 3,520 | | | 3,202 | | | 2,184 | | | 1,767 | |
Unallocated | | | 1,366 | | | 3,627 | | | 1,221 | | | 1,591 | | | 2,335 | |
| | | | | | | | | | | | | | | | | |
| Balance | | $ | 23,626 | | $ | 22,965 | | $ | 14,421 | | $ | 13,178 | | $ | 12,343 | |
The Corporation’s allowance for loan losses is based upon management’s quarterly review of loans utilizing a consistent valuation methodology. The purpose of the review is to assess loan quality, identify impaired loans, analyze delinquencies, evaluate loan growth, consider potential charge-offs and recoveries, and assess general economic conditions in the markets served.
Commercial and commercial real estate loans are individually risk-rated by the Corporation’s loan officers and periodically reviewed by independent loan review personnel. Consumer and residential real estate loans are generally analyzed in homogeneous pools utilizing historical loan charge-off information.
To determine the allowance and corresponding loan loss provision, an amount is allocated to specific loans. For certain commercial and construction loans, this amount is based upon specific borrower data and supporting collateral determined by reviewing individual non-performing, delinquent, or potentially-troubled credits. For the majority of the loans that are individually reviewed for impairment, this analysis is based on a comparison of the loan’s carrying amount to the net realizable value of the collateral. The portion of the allowance attributable to specific impaired loans was $2.3 million at December 31, 2006. The remaining commercial, consumer, and residential real estate loans are evaluated as part of various pools. These pool reserves are based upon historical charge-offs and delinquency history, other known trends and expected losses over the remaining lives of these loans, as well as the condition of local, regional and national economies and other qualitative factors.
To ensure a higher degree of confidence in the adequacy of the allowance, a portion is considered unallocated. The unallocated portion of the allowance is intended to provide for: (1) probable losses that are not otherwise identifiable; (2) possible imprecise estimates in assessing potential losses on commercial loans or in the calculation of pool reserves; and (3) the extenuating influence of extraneous factors, such as economic uncertainties. This unallocated portion is available to absorb losses sustained anywhere within the loan portfolio. The combined allocated and unallocated portions bring the total allowance to an amount deemed prudent and reasonable by management at that time.
The allowance of $23.6 million at December 31, 2006, compared favorably with the balance of $23.0 million at the end of December, 2005. The unallocated portion of the allowance was $1.4 million at December 31, 2006, versus $3.6 million at December 31, 2005, reflecting management’s consideration of the factors necessary to maintain a prudent and reasonable total allowance.
The following sets forth information regarding various segments of the loan portfolio, collectively referred to as risk elements. These segments include both non-performing assets and those loans past due for 90 days or more. Non-performing assets include non-accrual loans, restructurings, and other real estate. Non-accrual loans are loans for which interest income is not accrued due to concerns about the collection of interest and/or principal. Restructured loans may involve renegotiated interest rates, repayment terms, or both, because of deterioration in the financial condition of the borrower. Substantially all of the credits that would have qualified as restructured loans at the end of each period were already classified in the more severe non-accrual category. The following table provides a comparative summary of non-performing assets and total risk elements at the end of each of the last five years.
| | | 2006 | | 2005 | | 2004 | | 2003 | | 2002 | |
| Loans on which accrual of interest has been discontinued: | | | | | | | | | | | | | | | | |
Commercial, financial and agricultural | | $ | 3,139 | | $ | 1,834 | | $ | 1,748 | | $ | 3,066 | | $ | 2,257 | |
Construction loans | | | 147 | | | --- | | | --- | | | --- | | | --- | |
Mortgages | | | 8,902 | | | 7,105 | | | 2,894 | | | 4,054 | | | 6,609 | |
Other | | | 357 | | | 121 | | | 786 | | | 1,031 | | | 527 | |
| Total non-accrual loans | | | 12,545 | | | 9,060 | | | 5,428 | | | 8,151 | | | 9,393 | |
| | | | | | | | | | | | | | | | | |
| Foreclosed real estate | | | 37 | | | 1,447 | | | 2,094 | | | 4,865 | | | 1,183 | |
| | | | | | | | | | | | | | | | | |
| Total non-performing assets | | | 12,582 | | | 10,507 | | | 7,522 | | | 13,016 | | | 10,576 | |
| Loans past due 90 days or more: | | | | | | | | | | | | | | | | |
Commercial, financial and agricultural | | | 95 | | | --- | | | --- | | | 4 | | | 97 | |
Mortgages | | | 564 | | | 6 | | | --- | | | 40 | | | 770 | |
Consumer and other | | | --- | | | 16 | | | --- | | | 46 | | | 94 | |
| | | | | | | | | | | | | | | | | |
| | | | 659 | | | 22 | | | --- | | | 90 | | | 961 | |
| | | | | | | | | | | | | | | | | |
| Total risk elements | | $ | 13,241 | | $ | 10,529 | | $ | 7,522 | | $ | 13,106 | | $ | 11,537 | |
| | | | | | | | | | | | | | | | | |
| Ending allowance for loan losses | | $ | 23,626 | | $ | 22,965 | | $ | 14,421 | | $ | 13,178 | | $ | 12,343 | |
| | | | | | | | | | | | | | | | | |
| Ending allowance to non-accrual loans | | | 188 | % | | 253 | % | | 266 | % | | 162 | % | | 131 | % |
When viewed from an historical perspective, Community had experienced dramatically lower levels of non-performing assets in both 2005 and 2004. Such levels were deemed to be substantially lower than prior historical trends, owing to the unusually strong loan quality metrics experienced during those periods. At the end of 2006, Community reported an increase in non-accrual loans and a reduction in the ratio of the allowance to non-accrual loans. However, the relative level of non-accrual loans remained at lower levels than in years prior to 2004 and, based on analysis of the trends noted above, reflects a return to non-accrual levels not inconsistent with normalized historical trends.
The determination to discontinue the accrual of interest on non-performing loans is made on a case-by-case basis. Factors such as the character and size of the loan, quality of the collateral and the historical creditworthiness of the borrower and/or guarantors are considered by management in assessing the collectibility of such amounts. At the end of 2006, Community had a single credit included as 90 days past due category. The collateral value for this credit was deemed more than adequate to recover all accrued, yet unpaid, interest.
The approximate amount that would have been accrued on those loans for which interest was discontinued was $1.0 million in 2006, $425,000 in 2005 and $360,000 in 2003.
Community has considered all of the above factors in the establishment of the allowance for loan losses. The determination as to the adequacy of the allowance reflects management’s judgment, and was based upon collateral, local market conditions, various estimates, and other information that requires subjective analysis. These factors, which are prone to change, are monitored by management to evaluate their potential impact on management’s assessment of the adequacy of the allowance. Based on its evaluation of loan quality, management believes that the allowance for loan losses at December 31, 2006, was adequate to absorb probable losses within the loan portfolio.
Intangible Assets
Community recorded $254 million of intangible assets in connection with the 2005 merger of Blue Ball, including $13 million in core deposit intangibles. The Corporation has recorded cumulative amortizing intangibles of approximately $5.0 million from the mergers of integrated financial services companies, including those acquired in 2006. A portion of those intangibles are reflected as customer list intangibles and are being amortized over their useful life. The acquisitions of these companies expanded Community’s ability to meet specialized customer needs in the areas of title insurance, mortgage brokerage services, property and casualty insurance, and other important financial services. At the end of 2006, the balance of goodwill and other intangible assets aggregated $259 million.
Under current GAAP, goodwill is no longer amortized as a charge to earnings. Instead, such amounts are evaluated for impairment on an annual basis. Other intangible assets, such as core deposit intangibles and acquired customer lists, must be recognized as an asset separate and distinct from goodwill and must be amortized over their expected useful lives. Amortization of intangibles, primarily the amortization of core deposit intangible acquired in the Blue Ball merger, aggregated $2.6 million in 2006.
Intangible assets are generally excluded from the computation of the various regulatory capital ratios. At the end of 2006, Community reported capital ratios well within the guidelines that have been established to qualify as a “well-capitalized” financial institution. Intangible levels, therefore, are deemed to be well within acceptable guidelines. See the section entitled “Capital Adequacy” for further discussion.
Deposits
Deposit balances remain the primary source of funding for financial institutions. Total funding sources included both deposits and various forms of short-term and long-term wholesale borrowings. At the end of 2006, deposits represented 84% of total funding sources. The following table presents the growth in average deposit balances, including a full year of balances acquired in the Blue Ball merger in 2006:
| | | | | | | Change | |
| | | 2006 | | 2005 | | Amount | | % | |
| | | | | | | | | | | | | | |
| Demand | | $ | 352,814 | | $ | 271,319 | | $ | 81,495 | | | 30 | % |
| Savings & NOW accounts | | | 849,473 | | | 683,316 | | | 166,157 | | | 24 | % |
| Time | | | 969,525 | | | 701,776 | | | 267,749 | | | 38 | % |
| Time $100,000 or more | | | 233,380 | | | 150,820 | | | 82,560 | | | 55 | % |
| | | $ | 2,405,192 | | $ | 1,807,231 | | $ | 597,961 | | | 33 | % |
As with loan balances, growth in deposit funding consisted of both “acquired” growth and “organic” growth. Because of the distortions of purchase accounting, a more reliable and meaningful gauge of organic growth trends is illustrated by observing the rate of growth in the various categories of deposits for the 2005 fourth quarter average versus the 2006 fourth quarter average. Like loan portfolio comparisons, this approach provides a proxy for organic growth trends because the 2005 base period included the acquired Blue Ball deposits. The following growth trends were noted:
| | | Fourth Quarter | | Fourth Quarter | | Change | |
| | | 2006 | | 2005 | | Amount | | % | |
| | | | | | | | | | | | | | |
| Demand | | $ | 342,766 | | $ | 358,822 | | $ | (16,056 | ) | | (4 | )% |
| Savings & NOW accounts | | | 876,404 | | | 848,320 | | | 28,084 | | | 3 | % |
| Time | | | 1,010,249 | | | 869,096 | | | 141,153 | | | 16 | % |
| Time $100,000 or more | | | 267,747 | | | 186,514 | | | 81,233 | | | 44 | % |
| | | $ | 2,497,166 | | $ | 2,262,752 | | $ | 234,414 | | | 10 | % |
For much of the year, Community utilized scheduled runoff in the investment portfolio to fund loan growth, obviating the need to aggressively pursue deposit growth as interest rates rose. During the latter half of 2006, the practical limitations on the use of scheduled investment runoff as a source of funding, and the changes in the yield curve, required more aggressive pricing of deposit balances. Such pricing was also influenced by competitive pressures. Utilizing the two quarterly averages shown above, the following represents a comparison of the relative composition of the deposit base and illustrates the increased dependence on time deposits, including large balance time deposits, near the end of 2006.
Average Balances: | | Fourth Quarter 2006 | | Fourth Quarter 2005 | |
| | | | | | | | |
| Demand | | | 14 | % | | 16 | % |
| Savings & NOW accounts | | | 35 | % | | 38 | % |
| Time | | | 40 | % | | 38 | % |
| Time $100,000 or more | | | 11 | % | | 8 | % |
| | | | 100 | % | | 100 | % |
Consumer preferences changed dramatically during 2006, especially during the second half of the year. Prior to mid-year 2006, consumer preferences seemed to be weighted in favor of maintaining liquidity in anticipation of more attractive future interest rate offerings. This explained the higher relative weighting of demand savings and NOW balances in the fourth quarter of 2005. By mid-year 2006, the continuing upward pressure on interest rate indices under two years (a direct consequence of the yield curve inversion) helped to congeal three adverse trends that contributed to increases in deposit funding costs:
| 1) | The realization of an inflection point on short-term, time deposit rate offerings that provided sufficient stimulus for consumers to move incremental “core “funding into time deposits; |
| 2) | Increased competitive pressures on time deposit pricing, and; |
| 3) | Higher incremental re-pricing of scheduled runoff from existing time deposit relationships. |
The disparity in interest rates offered on core deposits, as compared to those available on time deposits with comparatively short maturity horizons contributed to changes in the composition of the deposit base. Such changes, which appear subtle on the surface, were magnified when considered in the context of the yield curve inversion and the impact on funding costs.
The following table summarizes the maturity distribution of time deposits of $100,000 or more as of December 31, 2006 (in thousands):
Remaining Time to Maturity: | | | |
Less than three months | | $ | 78,874 | |
Three months to six months | | | 72,211 | |
Six months to twelve months | | | 45,027 | |
More than twelve months | | | 71,267 | |
| | | $ | 267,379 | |
It is notable that an increasing proportion of time deposits remained in shorter-term maturity categories at the end of 2006. Not withstanding competitive pressures, this shorter maturity duration should permit a more rapid re-pricing of the time deposit base in the six months to one-year timeframe following a return to a more normally-sloped yield curve.
Borrowed Funds
Community makes tactical use of Federal Home Loan Bank (FHLB) advances and other borrowed funds to augment its funding needs. The largest component of borrowed funds comes from FHLB advances. FHLB borrowings, which are collateralized by residential mortgages or other qualified securities, include a variety of credit products available to Community through its membership in the Federal Home Loan Bank. The use of advances and borrowed funds is a by-product of Community’s overall asset / liability management strategy and is influenced by a number of factors, which are discussed more fully in the section titled “Asset / Liability Management and Liquidity”. At the end of 2006, the Corporation had the capacity to borrow an additional $564 million from the FHLB.
Long-term debt decreased by $136 million from December 31, 2005, to December 31, 2006. Increased deposit balances provided funding for loan growth in 2006, reducing Community’s dependence on wholesale funding sources to fund earning asset growth.
Capital Adequacy
Capital strength is an important gauge to assess the overall stability of a financial institution. A strong capital base is a prerequisite for sustaining franchise growth through both internal expansion and strategic acquisition opportunities. Regulatory authorities impose constraints and restrictions on bank capital levels that are designed to help ensure the vitality of the nation’s banking system.
| · | Capital Management Policy |
Community believes that capital is a valuable, albeit limited, resource whose availability moderates with changes in the business cycle. The Corporation has developed an extensive capital management policy designed to consider all aspects of capital management. This policy is mindful of the responsibilities to Community’s shareholders, employees, regulators, and other constituencies to ensure that capital is well-managed. The policy considers the impact of numerous capital management issues, including: the maintenance of key financial ratios; the need for an adequate return to shareholders in terms of both dividend payout and capital appreciation; the flexibility to apply techniques that will accommodate either equity expansion or contraction; and the restraint required to avoid accumulation of unsustainable levels of intangible assets.
Since the advent of mandatory purchase accounting, cash is more frequently used as a component of consideration in merger transactions. Accordingly, the capital policy has been revised to require an evaluation of the form of consideration used to accommodate acquisitions, and is attentive to the relative mix of cash and stock on post-merger capital levels.
Community also continuously examines its options with regard to capital management in the context of intrinsic factors, including its prospects for growth, the potential for earnings disruption, and others. Maintenance of appropriate capital levels may require the application of techniques designed to help Community meet or exceed regulatory
guidelines and to correlate capital levels with a given asset growth rate. The Corporation’s capital management and planning process is reviewed and approved by its Board of Directors. The most recent version of the Capital Management Policy was approved at the December, 2006, meeting of the Board of Directors.
In addition to internal guidelines, regulators have established standards for the monitoring and maintenance of appropriate levels of capital for financial institutions. All regulatory capital guidelines are based upon a risk-based supervisory approach that has been designed to ensure effective management of capital levels and associated business risk. Regulatory capital guidelines continue to evolve and financial institutions are anticipating the implementation of new standards from the Basel II accords. While Basel II changes are oriented toward larger international and money-center banks, there is the potential of ancillary impact on banks the size and complexity of Community as regulatory adoption progresses.
The following table provides the current risk-based capital positions of Community and its principal banking subsidiary at the end of 2006, along with an indication of the current regulatory capital requirements.
| | | December 31, 2006 | | “Well Capitalized” | | “Regulatory Minimums” | |
| Leverage ratio | | | | | | | | | | |
Community Banks, Inc. | | | 8.7 | % | | 5 | % | | 4 | % |
Bank only | | | 8.3 | % | | 5 | % | | 4 | % |
| | | | | | | | | | | |
| Tier 1 capital ratio | | | | | | | | | | |
Community Banks, Inc. | | | 10.6 | % | | 6 | % | | 4 | % |
Bank only | | | 10.1 | % | | 6 | % | | 4 | % |
| | | | | | | | | | | |
| Total risk-based capital ratio | | | | | | | | | | |
Community Banks, Inc. | | | 11.5 | % | | 10 | % | | 8 | % |
Bank only | | | 11.0 | % | | 10 | % | | 8 | % |
The merger of Blue Ball presented special capital management challenges related to intangibles and their influence on capital levels. Despite the creation of $254 million of intangible assets, tangible capital levels following the merger of Blue Ball remained more than adequate to ensure Community’s classification as a “well capitalized” institution.
The primary source of capital is earnings and, more specifically, earnings retention. Earnings retention is composed of quarterly earnings minus regular cash dividends to shareholders. Throughout 2006, the Corporation’s earnings trends supported a return of capital to existing shareholders in the form of a quarterly cash dividend.
Capital management is influenced primarily by earnings retention, but can be augmented by a number of other strategies designed to ensure that capital levels are maintained at optimum levels. In addition to cash dividends, another efficient means of returning capital to shareholders involves share repurchase, which reduces the level of capital by purchasing common shares in the open market. In the fourth quarter of 2005, the Corporation had announced a plan that called for the repurchase of 788,000 shares. By the end of 2006, virtually all of these shares had been repurchased.
Capital management is also considerate of techniques that can be used to increase capital levels. In the past several years, Community executed three separate issuances of trust preferred stock totaling $52 million as of December 31, 2006. At the beginning of 2006, the Corporation issued $20.6 million of additional trust preferred stock which is included in the outstanding balance at the end of 2006. These issuances of trust preferred stock qualified as “Tier 1 capital” (by meeting regulatory restrictions) and are classified as subordinated debt for financial statement purposes. Community will continue to make use of this and various other strategies and techniques to ensure an efficient use of this valuable resource and to maintain capital at levels that are considerate of its operating risk profile.
ASSET/LIABILITY MANAGEMENT AND LIQUIDITY
The process by which financial institutions manage earning assets and funding sources under different interest rate environments is called asset/liability management. The primary goal of asset/liability management is to increase net interest income through the prudent control of market risk, liquidity, interest rate risk and capital. Two important barometers of performance are net interest margin and liquidity. Net interest margin is increased by widening interest spread while controlling interest rate sensitivity. The adequacy of liquidity is determined by the ability to meet the cash flow requirements of both depositors and customers requesting credit. The Board of Directors and the Audit Committee of the Board govern and monitor asset/liability management processes and liquidity as part of the overall risk management process. The responsibility for management of these processes is delegated to the corporate Asset/Liability Management Committee (ALCO), which must adhere to parameters established in the Board-approved Asset / Liability Management Policy.
Liquidity
Liquidity is defined as the ability to meet maturing obligations and customers’ demand for funds on a continuous basis. Appropriate liquidity exists when an entity can meet its potential cash obligations without liquidating its franchise assets. Poor liquidity exists when a company lacks the liquid assets to cover short-term liabilities. Liquidity is sustained by stable core deposits, a diversified mix of liabilities, strong credit perception and the presence of sufficient assets convertible to cash without material loss or disruption of normal operations. Liquidity could contract if there were reversals in the historical trends that have contributed to the stability and growth of Community’s deposit base. The Corporation actively manages liquidity within a defined range and has developed reasonable liquidity contingency plans, ensuring the availability of alternate funding sources that are sufficient to maintain adequate liquidity under a variety of business conditions.
During the first half of 2006, Community opted to utilize scheduled investment runoff as a means to fund incremental loan growth and improve yield performance. Because of pre-defined ALCO policy constraints for both liquidity and pledged assets, this strategy was reversed at mid-year in favor of more aggressive pricing of deposits to secure incremental funding. This change in strategy, which was a direct result of pre-defined policy limitations, serves to illustrate the effectiveness of this important aspect of ALCO management. The Corporation’s investing and financing activities are conducted within the overall constraints of its liquidity management policy and practices.
Rate “Shock” Simulation
Community utilizes a variety of techniques to assist management and the Board of Directors in the management and monitoring of interest rate risk. In order to quantify the impact of changes in interest rates on net interest income, the Corporation conducts quarterly interest rate shock simulations that project the impact of interest rate changes on net interest income over the next year. These simulations are utilized to assess whether management should consider corrective actions in order to minimize Community’s exposure or vulnerability to a particular trend in interest rates.
Management has established acceptable tolerance limits for the impact of changes in interest rates on the volatility of net interest income, and is authorized to pursue mitigating strategies in order to minimize unfavorable impact under a variety of scenarios. Simulations are conducted under a variety of assumptions that require estimates of the velocity and extent of interest rate changes, including an assessment of the impact of such changes on those assets and liabilities that have indeterminate maturity or repricing characteristics. The impact of rate changes on revenue performance can be estimated, but such estimates remain vulnerable to unexpected or nontraditional shifts in interest rate dynamics.
Rate shock simulation is the primary technique used to measure Community’s net interest income exposure. This exposure is estimated under assumptions which assume a parallel shift in the yield curve that provides a measure of deviation from a base case scenario. The Asset / Liability Management Policy limits unfavorable exposure of simulated net interest income to 10% of the base case net interest income in either a rising or falling rate shock scenario (immediate repricing) of 200 basis points. The following is a summary of the rate shock results conducted under these various assumptions as December 31, 2006:
Simultaneous Rate “Shock” | Annual Change in Net Interest Income | % Change |
| | | |
| +300bp | - $7.9 million | - 7.54% |
| +200bp | - $4.7 million | - 4.52% |
| +100bp | - $2.3 million | - 2.18% |
| -100bp | + $1.0 million | + 1.00% |
| -200bp | + $0.2 million | + 0.19% |
As noted, rate shock simulations are customarily prepared by assuming a parallel shift in the yield curve. These simulations lend themselves to the establishment of reasonable policy limitations as measured against baseline conditions. Other more abnormal interest rate dynamics (such as a yield curve inversion) do not lend themselves to the establishment of policy standards or acceptable baseline controls. As a consequence, analysis of abnormal dynamics is limited to interest rate simulations that are designed to project and analyze the effect on current net interest income projections.
GAP and EVE
Management augments its simulation process with two other techniques: GAP analysis and economic value of equity (EVE) computations. The most practical tool for day-to-day management of interest rate risk is GAP analysis, which provides an array of timeframes during which earning assets and funding sources can be expected to mature or re-price. This information is ordinarily examined in the context of the results derived from the quarterly rate shock simulations. Management uses such information to identify specific “cause and effect” relationships that can be reviewed, analyzed, managed, or changed to ensure maximization of net revenue from intermediation activities. The combination of GAP analysis and rate shock simulations provides the most practical measurement tools for monitoring and managing of the largest source of revenue for community banks. As with the simulation or shock analysis, Community has established a policy limit for the cumulative twelve month GAP of “plus or minus” 15% of total assets. At December 31, 2006, the twelve month GAP fell well within this policy limit for each of the time intervals less than one year, as shown in the following summary:
Interval | Cumulative GAP (Expressed as % of Assets) |
| | |
| 0-90 days | +4.29% |
| | |
| 91-180 days | -4.76% |
| | |
| 181-365 days | -9.23% |
EVE computations provide a longer-term assessment of interest rate risk, but are more practical for evaluating long-term, strategic decision-making. EVE has several limitations, including: (1) the intrinsic value of assets and liabilities does not necessarily represent the fair value of financial instruments since it does not include credit risk and liquidity; (2) estimated cash flows are required for non-maturity financial instruments and are, by their nature, inexact; and (3) the future structure of Community’s balance sheet does not consider increased loan and deposit activities from core business within its present value assessment.
The results derived from EVE computations, however, provide a valuable framework for managing longer-term balance sheet exposures and interest rate volatility trends. At the end of 2006, all measures of EVE fell within the policy limits established via the asset/liability management policy, as approved by the Board of Directors.
CONTRACTUAL OBLIGATIONS
Significant contractual obligations at December 31, 2006 are summarized in the following table:
| | | Payments due by period | |
Dollars in thousands | | Total | | Less than 1 year | | 1-3 years | | 3-5 years | | More than 5 years | |
| | | | | | | | | | | | | | | | | |
| Long-term debt | | $ | 315,079 | | $ | 68,177 | | $ | 62,852 | | $ | 70,054 | | $ | 113,996 | |
| Operating lease obligations | | | 40,141 | | | 2,234 | | | 4,261 | | | 4,095 | | | 29,551 | |
| Subordinated debt | | | 51,548 | | | --- | | | --- | | | --- | | | 51,548 | |
| Time deposits | | | 1,265,510 | | | 881,596 | | | 280,904 | | | 101,566 | | | 1,444 | |
| | | | | | | | | | | | | | | | | |
| Total | | $ | 1,672,278 | | $ | 952,007 | | $ | 348,017 | | $ | 175,715 | | $ | 196,539 | |
OFF-BALANCE-SHEET COMMITMENTS
As of December 31, 2006, the Corporation had unfunded commitments totaling $835 million. For details of these off-balance-sheet commitments, see “Notes to Consolidated Financial Statements - Commitments and Contingencies” included in Part II, Item 8.
REGULATORY MATTERS
Community and its affiliates are subject to periodic examinations by various regulatory agencies. These examinations include, but are not limited to, procedures designed to review lending practices, risk management, credit quality, liquidity, compliance and capital adequacy. During 2006, there were no examinations of Community or its banking subsidiary. Examinations were, however, conducted in 2005 and no comments were received from regulators that would have a material adverse effect on Community’s liquidity, capital resources, or operations. A regularly scheduled examination by the Pennsylvania Department of Banking is scheduled for early 2007.
INFLATION
Community’s ability to cope with the impact of inflation is best measured by its ability to respond to changing interest rates and manage non-interest income and expense. Within its ALCO processes, the Corporation manages the mix of interest rate-sensitive assets and liabilities in order to limit the impact of changing interest rates on net interest income. Inflation also has a direct impact on non-interest income and expense such as service fee income, salary and benefits expenses, and other overhead expenses. Inflationary pressures over the last several years have been modest, though more recent trends suggest the potential for emerging inflationary pressure. Management will continue to monitor the potential for inflation and its impact on the pricing of products and services.
PERFORMANCE REVIEW: 2005 VERSUS 2004
Overview
Excluding the $5.3 million of after-tax merger, conversion and restructuring charges (“special charges”), Community recorded “core” net income of nearly $31.0 million, an increase of $9.2 million over the net income of $21.8 million achieved in 2004. This was an increase of 42% in year-over-year earnings. Even after reducing income for the aforementioned special charges, reported net income reached $25.6 million and reflected a 17% increase over 2004.
Core net income was comprised of $10.7 million in the first half of the year and $20.3 million in the second half. As previously noted, Blue Ball operating activity was included only in the second half of the year and was the primary driver of the increase in net income between the first and second halves of 2005.
On a per share basis, core net income reached $1.63 compared to $1.65 in 2004. Actual reported earnings per share for 2005 were $1.35 and included $0.28 of earnings dilution directly attributable to the merger, conversion and restructuring expenses. The year 2005 was dominated by the preparations and efforts to absorb and integrate the operations of Community and its new Blue Ball division. The influence of internal, merger-related distractions required deft management of core operating activities to minimize the merger’s impact on existing customers. At the same time, dynamic changes in economic conditions, including changes in the interest rate environment, presented additional challenges to preserving and improving the earnings stream.
Interest Income / Earning Assets
Interest income reached nearly $150 million, an increase of almost 41% over the interest income of $106 million reported for 2004. This increase was driven by the six months of Blue Ball assets added in the second half of the year and by the improved yield, which rose from 5.80% in 2004 to 6.26% for 2005. Average earning assets grew from $1.8 billion to almost $2.4 billion between the two periods. The growth in total earning assets, however, was relatively constrained as loan growth was partially funded by scheduled runoff in the investment portfolio. While deposit growth was steady, it was inadequate to meet the funding requirements for loan growth. Investment portfolio balances as a percentage of total earning assets declined from 36% in 2004 to 26% in 2005. Both pre-merger Community and Blue Ball have historically focused their growth in the commercial and commercial real estate segments of their core markets. This growth was also augmented by expansion of retail lending, including the home equity segment.
Interest Expense / Funding Sources
Like interest income, interest expense was also influenced by changing interest rate dynamics and the growth attributable to the mid-year acquisition of Blue Ball. Interest expense grew almost 38%, from just over $43 million in 2004 to nearly $60 million in 2005. At the same time, the cost of aggregate funding rose from 2.70% to 2.90%. While increases in funding costs were mitigated by the $60 million prepayment of FHLB advances and the overall de-leveraging of rate-sensitive funding sources, the rise in interest rates drove the 20 basis point increase in the overall cost of funds. FHLB advances, which comprise one of the more expensive sources of funding, now aggregate less than 25% of funding sources compared to over 30% in 2004. The reduced dependency on higher cost FHLB advances constrained the level of increase in the overall cost of funds. The cost of deposit funding sources, however, increased as the pressure on short term interest rates required increases in the rates offered on more rate-sensitive deposit products.
Interest Spread / Net Interest Margin
The Corporation reported a notable improvement in net interest spread from 3.10% in 2004 to 3.36% in 2005, and a similar increase in net interest margin, from 3.44% to 3.76%, over the same periods. The increase in net interest margin was especially apparent after the mid-year acquisition of Blue Ball as margin reached 3.89% in the third quarter and 3.96% in the fourth quarter, well above the 3.55% and 3.46% recorded in the first and second quarters of 2005. The emergence of an improved margin was also linked to the impact of the growth in the contribution from non-interest funding sources, which rose from 0.34% to 0.40%. During periods of rising interest rates, the contribution from non-interest funds to net interest margin is increased because funds can be invested at progressively higher rates.
Provision for Credit Losses
Throughout 2005, the Corporation experienced improved credit quality metrics which were reflected in operating results. The provision for loan losses declined from $3.1 million in 2004 to $2.3 million in 2005, which corresponded to reductions in net charge-offs. Net charge-offs declined from $1.9 million in 2004 to $824,000 in 2005. The ratio of net charge-offs to average loans declined from 0.16% in 2004 to 0.05% for 2005.
The ratio of the allowance for loan losses to loans declined from 1.18% at the end of 2004 to 1.03% at the end of 2005. In connection with the merger of Blue Ball, Community applied the provisions of SOP 03-3, “Accounting for Certain Loans or Debt Securities Acquired in a Transfer.” This pronouncement addressed the accounting for initial investments in loans acquired in a transfer in years after 2004, including those acquired in a merger. At the end of 2005, the allowance for credit losses reached almost $23 million and provided 253% coverage of non-accrual loans at that date. Non-accrual loans, including those acquired in connection with the merger of Blue Ball totaled just $9 million at the end of 2005.
Non-Interest Income
Excluding investment-related gains, Community and Blue Ball each generated nearly 25% of their total revenues from non-interest income sources during pre-merger 2004. In the two quarters immediately following the merger, the ratio for the combined company declined to just over 21%. The lower relative level of non-interest income in the post-merger period was partially related to the disposal of the operations of Blue Ball’s actuarial, retirement and employee benefit consulting businesses at the time of the merger. By excluding revenues from these businesses from pre-merger 2004 information, PennRock’s stand-alone ratio of non-interest revenue to total revenues would have been under 20%. The planned disposal of these businesses, which facilitated similar reductions in related expenses, contributed to the lower, 21% ratio in the post-combination, second-half of 2005. The other major contributor to the lower ratio involved the impact of the cooler mortgage refinancing market and the related reduction in revenues from 2004 at the predecessor companies.
The following is a summary of the various categories of non-interest income, which includes six months of Blue Ball activity in 2005 but excludes Blue Ball from all of 2004:
| | | | | | | Change | |
| | | 2005 | | 2004 | | Amount | | % | |
| Investment management and trust services | | $ | 2,692 | | $ | 1,510 | | $ | 1,182 | | | 78 | % |
| Service charges on deposit accounts | | | 9,413 | | | 7,120 | | | 2,293 | | | 32 | % |
| Other service charges, commissions and fees | | | 5,452 | | | 3,357 | | | 2,095 | | | 62 | % |
| Insurance premium income and commissions | | | 3,350 | | | 3,260 | | | 90 | | | 3 | % |
| Mortgage banking activities | | | 2,354 | | | 2,665 | | | (311 | ) | | (12 | )% |
| Earnings on investment in life insurance | | | 2,063 | | | 1,593 | | | 470 | | | 30 | % |
| Other income | | | 854 | | | 1,238 | | | (384 | ) | | (31 | )% |
| | | | | | | | | | | | | | |
| | | | 26,178 | | | 20,743 | | | 5,435 | | | 26 | % |
| | | | | | | | | | | | | | |
| Investment security gains | | | 259 | | | 2,470 | | | (2,211 | ) | | (90 | )% |
| | | | | | | | | | | | | | |
| Total non-interest income | | $ | 26,437 | | $ | 23,213 | | $ | 3,224 | | | 14 | % |
Community recorded modest investment-related gains from security sales in 2005 compared to nearly $2.5 million in 2004. Excluding the impact of these gains, non-interest income rose 26% in 2005.
Despite the addition of Blue Ball activity for the last half of 2005, growth in all non-interest sources of revenue was constrained as compared to the rate of growth in net interest revenues from intermediation activities. Since combined results for 2005 and pre-merger results in 2004 both excluded income from Blue Ball’s actuarial, retirement and employee benefit consulting businesses, the disposal of that business had no impact on year-over-year growth rates. In contrast, revenues from mortgage banking activities declined in real terms in 2005. Revenues from mortgage banking declined from $2.7 million in 2004, to $2.4 million in 2005, in spite of the additional six months of Blue Ball activity in the last half of the year. Reduced activities in both refinance and purchased mortgages resulted in a 12% reduction in revenues. For different reasons, a reduction was also recorded in the “other” category, as results for 2004 had included a gain from the sale of Community’s credit card portfolio.
The remaining categories of non-interest income reflected increases associated with the merger. For example, pre-merger Community had a modest trust department with just over $50 million in managed assets. At the end of 2005, assets under management had grown to nearly $300 million, primarily from assets added from Blue Ball’s more robust trust operation. Retail investment sales also remained vigorous throughout the year and accounted for a substantial portion of the overall increase.
Deposit service fees grew in line with expectations for the combined franchise. During the last half of 2005, Community avoided initiating any wholesale changes in the fee structure in the Blue Ball division in order to forestall any potential for customer dissatisfaction in the post-consummation period.
Other service charges included the impact of both ATM surcharge fees and debit card income. Debit card income growth has been fueled by the continued use of this convenient electronic payment system. Fees from the separate, pre-existing overdraft privilege programs in the predecessor banks continued to meet customer needs with this widely-accepted, consumer-centric service.
Growth in insurance commissions was subdued as insurance agency activities have not been fully extended throughout the Blue Ball market area. The modest increase was also affected by a decline in title insurance commissions that was linked to the drop-off in mortgage activity. Increases from bank-owned life insurance income related primarily to the addition of pre-existing programs that were in place at PennRock prior to the merger.
Non-Interest Expenses
Total non-interest expenses reached $75 million in 2005, including over $8 million of merger, conversion and restructuring expenses. Excluding those special charges, non-interest expenses reached $66.9 million in 2005 compared to $50.0 million in the previous year, an increase of nearly $17 million or 34%. The mid-year 2005 acquisition of Blue Ball was the predominant factor contributing to the higher expense level in 2005. In addition, the merger resulted in the recognition of an additional $1.2 million in core deposit intangible amortization, all of which was recorded in the last half of 2005. The following is a summary of the various components of expenses for all of 2005 as compared to the previous year’s results.
| | | | | | | Change | |
| | | | 2005 | | | 2004 | | | Amount | | | % | |
| Salary and benefits | | $ | 36,998 | | $ | 28,337 | | $ | 8,661 | | | 31 | % |
| Occupancy and equipment expense | | | 11,355 | | | 8,287 | | | 3,068 | | | 37 | % |
| Marketing expense | | | 2,036 | | | 2,325 | | | (289 | ) | | (12 | )% |
| Telecommunications expense | | | 1,359 | | | 1,285 | | | 74 | | | 6 | % |
| Amortization of intangibles | | | 1,424 | | | 161 | | | 1,263 | | | 784 | % |
| Other expenses | | | 13,692 | | | 9,598 | | | 4,094 | | | 43 | % |
| | | | | | | | | | | | | | |
| Subtotal | | | 66,864 | | | 49,993 | | | 16,871 | | | 34 | % |
| | | | | | | | | | | | | | |
| Merger, conversion and restructuring | | | 8,205 | | | --- | | | 8,205 | | | --- | |
| | | | | | | | | | | | | | |
| | | $ | 75,069 | | $ | 49,993 | | $ | 25,076 | | | 50 | % |
It is important to note that historical 2004 operating results included expenses only for pre-merger Community; there was no restatement of 2004 expenses to include Blue Ball. The 2005 results, on the other hand, reflected a combination of pre-merger Community expenses for the first half of the year, along with merged results for Community and Blue Ball for the second half.
Despite the distortions attributable to anomalies associated with purchase accounting, certain expense trends provided meaningful revelations. For all of 2004, the efficiency ratio was 60.42%. In 2005, after excluding the special charges, the efficiency ratio for the full year actually declined to 57.51%, reflecting the favorable impact of the mid-year combination. The 2005 ratio exhibited further improvement after excluding intangible amortization, a non-operating expense, from the computation. By excluding intangible amortization for 2005, the efficiency ratio was a more impressive 56.29%.
Income taxes grew from $4.9 million in 2004 to $6.1 million in 2005, an increase of 24%. The increase was commensurate with the increase in pretax income, resulting in a nominal tax rate of 19% in 2005 versus 18% in 2005. The relative rate of tax exempt income influences the reported income tax rates and remains the primary reason for the difference between the nominal tax rate and the statutory federal tax rate for corporations.
The following tables are provided as a supplement to Management’s Discussion and Analysis of Financial Condition and Results of Operations:
| · | Distribution of Assets, Liabilities and Stockholders’ Equity; Interest Rates and Interest Differential |
| · | Rate/Volume Analysis - Tax Equivalent Basis |
| · | Loan Account Composition as of December 31, 2006, 2005, 2004, 2003, and 2002. |
| · | Maturities and Sensitivity to Changes in Interest Rates for Commercial, Financial, and Agricultural Loans as of December 31, 2006. |
Distribution of Assets, Liabilities, and Stockholders’ Equity; Interest Rates and Interest Differential | |
| | | | | | | | | | | | | | | | | | | | |
Income and Rates on a Tax Equivalent Basis (b) for the Years Ended December 31, 2006, 2005, and 2004 | |
| | | | | | | | | | | | | | | | | | | | |
| | | 2006 | | 2005 | | 2004 | |
| | | Average Balance(c) | | Interest Income/ Expense(a) | | Average Rates Earned/ Paid (a) | | Average Balance(c) | | Interest Income/ Expense(a) | | Average Rates Earned/ Paid (a) | | Average Balance(c) | | Interest Income/ Expense(a) | | Average Rates Earned/ Paid (a) | |
Assets: | | | | | | | | | | | | | | | | | | | | | | | | | | | | |
| Earning assets: | | | | | | | | | | | | | | | | | | | | | | | | | | | | |
Interest-bearing deposits in other banks | | $ | 31,312 | | $ | 1,527 | | | 4.88 | % | $ | 39,241 | | $ | 1,315 | | | 3.35 | % | $ | 2,325 | | $ | 20 | | | 0.86 | % |
| Investment securities: | | | | | | | | | | | | | | | | | | | | | | | | | | | | |
Taxable | | | 362,540 | | | 18,874 | | | 5.21 | | | 392,962 | | | 17,904 | | | 4.56 | | | 456,478 | | | 19,624 | | | 4.30 | |
Tax-exempt (b) | | | 229,520 | | | 16,609 | | | 7.24 | | | 221,960 | | | 16,514 | | | 7.44 | | | 209,170 | | | 15,856 | | | 7.58 | |
Total investment securities | | | 592,060 | | | 35,483 | | | 5.99 | | | 614,922 | | | 34,418 | | | 5.60 | | | 665,648 | | | 35,480 | | | 5.33 | |
Federal funds sold | | | 7,453 | | | 377 | | | 5.06 | | | 19,732 | | | 583 | | | 2.95 | | | 7,801 | | | 117 | | | 1.50 | |
Loans (b) (d) | | | 2,324,218 | | | 168,049 | | | 7.23 | | | 1,714,536 | | | 113,140 | | | 6.60 | | | 1,156,107 | | | 70,721 | | | 6.12 | |
Total earning assets | | | 2,955,043 | | | 205,436 | | | 6.95 | | | 2,388,431 | | | 149,456 | | | 6.26 | | | 1,831,881 | | | 106,338 | | | 5.80 | |
| Cash and due from banks | | | 60,929 | | | | | | | | | 48,721 | | | | | | | | | 37,316 | | | | | | | |
| Allowance for loan losses | | | (23,889 | ) | | | | | | | | (18,903 | ) | | | | | | | | (14,156 | ) | | | | | | |
Premises, equipment, and other assets | | | 411,338 | | | | | | | | | 250,356 | | | | | | | | | 86,055 | | | | | | | |
Total assets | | $ | 3,403,421 | | | | | | | | $ | 2,668,605 | | | | | | | | $ | 1,941,096 | | | | | | | |
| | | | | | | | | | | | | | | | | | | | | | | | | | | | | |
Liabilities: | | | | | | | | | | | | | | | | | | | | | | | | | | | | |
| Interest-bearing liabilities: | | | | | | | | | | | | | | | | | | | | | | | | | | | | |
Savings deposits | | $ | 235,991 | | | 1,441 | | | 0.61 | | $ | 206,678 | | | 1,027 | | | 0.50 | | $ | 167,428 | | | 413 | | | 0.25 | |
Money market deposits | | | 265,750 | | | 7,753 | | | 2.92 | | | 181,279 | | | 3,668 | | | 2.02 | | | 62,591 | | | 377 | | | 0.60 | |
NOW accounts | | | 347,732 | | | 8,430 | | | 2.42 | | | 295,359 | | | 4,809 | | | 1.63 | | | 265,949 | | | 3,484 | | | 1.31 | |
Time deposits: | | | | | | | | | | | | | | | | | | | | | | | | | | | | |
$100,000 or greater | | | 233,380 | | | | | | | | | 150,820 | | | | | | | | | 111,879 | | | | | | | |
Other | | | 969,525 | | | | | | | | | 701,776 | | | | | | | | | 510,046 | | | | | | | |
Total time deposits | | | 1,202,905 | | | 49,026 | | | 4.08 | | | 852,596 | | | 26,927 | | | 3.16 | | | 621,925 | | | 18,249 | | | 2.93 | |
Total interest-bearing deposits | | | 2,052,378 | | | | | | | | | 1,535,912 | | | | | | | | | 1,117,893 | | | | | | | |
Short-term borrowings | | | 66,264 | | | 3,021 | | | 4.56 | | | 49,494 | | | 1,479 | | | 2.99 | | | 59,303 | | | 739 | | | 1.25 | |
Long-term debt | | | 382,214 | | | 17,380 | | | 4.55 | | | 443,509 | | | 19,700 | | | 4.44 | | | 394,944 | | | 18,382 | | | 4.65 | |
| Subordinated debt | | | 49,853 | | | 3,683 | | | 7.39 | | | 30,928 | | | 2,038 | | | 6.59 | | | 30,928 | | | 1,598 | | | 5.17 | |
Total interest-bearing liabilities | | | 2,550,709 | | | 90,734 | | | 3.56 | | | 2,059,843 | | | 59,648 | | | 2.90 | | | 1,603,068 | | | 43,242 | | | 2.70 | |
| Demand deposits | | | 352,814 | | | | | | | | | 271,319 | | | | | | | | | 178,084 | | | | | | | |
| Accrued interest, taxes and other liabilities | | | 24,188 | | | | | | | | | 18,675 | | | | | | | | | 14,194 | | | | | | | |
Total liabilities | | | 2,927,711 | | | | | | | | | 2,349,837 | | | | | | | | | 1,795,346 | | | | | | | |
| Stockholders’ equity | | | 475,710 | | | | | | | | | 318,768 | | | | | | | | | 145,750 | | | | | | | |
Total liabilities and stockholders’ equity | | $ | 3,403,421 | | | | | | | | $ | 2,668,605 | | | | | | | | $ | 1,941,096 | | | | | | | |
| | | | | | | | | | | | | | | | | | | | | | | | | | | | | |
| Interest income to earning assets | | | | | 6.95 | % | | | | | | | | 6.26 | % | | | | | | | | 5.80 | % |
| Interest expense to earning assets | | | | | 3.07 | | | | | | | | | 2.50 | | | | | | | | | 2.36 | |
| | | | | | | | | | | | | | | | | | | | | | | | | | | | | |
Effective interest differential | $ | 114,702 | | | 3.88 | % | | | | $ | 89,808 | | | 3.76 | % | | | | $ | 63,096 | | | 3.44 | % |
| | | | | | | | | | | | | | | | | | | | | | | | | | | | | |
| (a) Loan fees are included in interest income and rate calculations. |
| (b) Interest income on all tax-exempt securities and loans have been adjusted to a tax equivalent basis utilizing a Federal tax rate of 35% in each year. |
| (c) Averages are a combination of monthly and daily averages. |
| (d) Includes non-accrual loans. |
Rate/Volume Analysis-Tax Equivalent Basis (a) | |
For the Years Ended December 31, 2006, 2005 and 2004 | |
| | | | | | | | | | | | | | |
| | | 2006 vs. 2005 | | 2005 vs. 2004 | |
| | | Volume | | Rate | | Total | | Volume | | Rate | | Total | |
| | | | | | | | | | | | | | | | | | | | |
| | | Favorable (Unfavorable) |
Increase (decrease) in interest income: | | | | | | | | | | | | | | | | | | | |
Loans | | $ | 43,266 | | $ | 11,643 | | $ | 54,909 | | $ | 36,473 | | $ | 5,946 | | $ | 42,419 | |
Investment securities | | | (1,311 | ) | | 2,376 | | | 1,065 | | | (1,889 | ) | | 827 | | | (1,062 | ) |
Federal funds sold | | | (483 | ) | | 277 | | | (206 | ) | | 286 | | | 180 | | | 466 | |
Interest-bearing deposits in other banks | | | (303 | ) | | 515 | | | 212 | | | 1,095 | | | 200 | | | 1,295 | |
Total | | | 41,169 | | | 14,811 | | | 55,980 | | | 35,965 | | | 7,153 | | | 43,118 | |
| | | | | | | | | | | | | | | | | | | | |
| | | | | | | | | | | | | | | | | | | | |
| (Increase) decrease in interest expense: | | | | | | | | | | | | | | | | | | | |
Savings deposits | | | (2,687 | ) | | (5,433 | ) | | (8,120 | ) | | (1,992 | ) | | (3,238 | ) | | (5,230 | ) |
Time deposits | | | (12,946 | ) | | (9,153 | ) | | (22,099 | ) | | (7,197 | ) | | (1,481 | ) | | (8,678 | ) |
Short-term borrowings | | | (604 | ) | | (938 | ) | | (1,542 | ) | | 140 | | | (880 | ) | | (740 | ) |
Long-term debt | | | 2,778 | | | (458 | ) | | 2,320 | | | (2,185 | ) | | 867 | | | (1,318 | ) |
Subordinated debt | | | (1,373 | ) | | (272 | ) | | (1,645 | ) | | --- | | | (440 | ) | | (440 | ) |
Total | | | (14,832 | ) | | (16,254 | ) | | (31,086 | ) | | (11,234 | ) | | (5,172 | ) | | (16,406 | ) |
| | | | | | | | | | | | | | | | | | | | |
| | | | | | | | | | | | | | | | | | | | |
Increase (decrease) in effective interest differential | | $ | 26,337 | | $ | (1,443 | ) | $ | 24,894 | | $ | 24,731 | | $ | 1,981 | | $ | 26,712 | |
(a) Table shows approximate effect on the effective interest differential of volume and rate changes for the years 2006 and 2005. The effect of a change in average volume has been determined by applying the average yield or rate in the earlier period to the change in average volume during the period. The effect of a change in rate has been determined by applying the change in rate during the period to the average volume of the prior period. Any resulting unallocated amount was allocated ratably between the volume and rate components. Non-accrual loans have been included in the average volume of each period. Tax-exempt income is shown on a tax equivalent basis assuming a federal income tax rate of 35% in all years.
LOAN ACCOUNT COMPOSITION | |
as of December 31 | |
| | | | | | | | | | | | | | | | | | | | | | |
| | | 2006 | | 2005 | | 2004 | | 2003 | | 2002 | |
| | | | Amount | | | Percent | | | Amount | | | Percent | | | Amount | | | Percent | | | Amount | | | Percent | | | Amount | | | Percent | |
| Commercial, financial and agricultural | | $ | 865,355 | | | 36.5 | % | $ | 782,946 | | | 35.0 | % | $ | 409,105 | | | 33.7 | % | $ | 367,444 | | | 33.9 | % | $ | 295,506 | | | 32.2 | % |
| Real estate-construction | | | 7,290 | | | 0.3 | | | 4,532 | | | 0.2 | | | 8,703 | | | 0.7 | | | 7,338 | | | 0.7 | | | 2,615 | | | 0.3 | |
| Real estate-commercial mortgage | | | 815,028 | | | 34.4 | | | 793,969 | | | 35.5 | | | 356,871 | | | 29.3 | | | 283,661 | | | 26.2 | | | 246,533 | | | 26.9 | |
| Real estate-retail mortgage | | | 141,826 | | | 6.0 | | | 149,525 | | | 6.7 | | | 83,979 | | | 6.9 | | | 91,485 | | | 8.4 | | | 106,882 | | | 11.7 | |
| Consumer-home equity lines of credit | | | 92,163 | | | 3.9 | | | 113,133 | | | 5.1 | | | 53,921 | | | 4.4 | | | 38,299 | | | 3.5 | | | 28,169 | | | 3.1 | |
| Consumer-installment and other | | | 449,227 | | | 18.9 | | | 392,960 | | | 17.5 | | | 304,877 | | | 25.0 | | | 296,451 | | | 27.3 | | | 236,346 | | | 25.8 | |
| Total loans | | | 2,370,889 | | | 100.0 | % | | 2,237,065 | | | 100.0 | % | | 1,217,456 | | | 100.0 | % | | 1,084,678 | | | 100.0 | % | | 916,051 | | | 100.0 | % |
| | | | | | | | | | | | | | | | | | | | | | | | | | | | | | | | |
| Allowance for loan losses | | | (23,626 | ) | | | | | (22,965 | ) | | | | | (14,421 | ) | | | | | (13,178 | ) | | | | | (12,343 | ) | | | |
| | | | | | | | | | | | | | | | | | | | | | | | | | | | | | | | |
| Loans, net | | $ | 2,347,263 | | | | | $ | 2,214,100 | | | | | $ | 1,203,035 | | | | | $ | 1,071,500 | | | | | $ | 903,708 | | | | |
Community’s loan activity is principally with customers located within its local market area. Community continues to maintain a diversified loan portfolio and has no significant loan concentration in any economic sector. Commercial, financial, and agricultural loans consist principally of commercial lending secured by financial assets of businesses including accounts receivable, inventories and equipment, and, in most cases, include liens on real estate. Real estate construction and mortgage loans are primarily 1 to 4 family residential loans secured by residential properties within the bank’s market area. Personal-installment loans consist principally of secured loans for items such as automobiles, property improvement, household and other consumer goods. Community continues to sell fixed rate mortgages in the secondary market to manage interest rate risk. Historically, relative credit risk of commercial, financial and agricultural loans has generally been greater than that of other types of loans.
MATURITIES AND SENSITIVITY TO CHANGES IN INTEREST | |
RATES FOR COMMERCIAL, FINANCIAL AND AGRICULTURAL | |
AND REAL-ESTATE CONSTRUCTION LOANS | |
as of December 31, 2006 | |
| | | | | | | | | | |
| | | Maturity Distribution | |
| | | One Year or Less | | One to Five Years | | Over Five Years | | Total | |
| | | | | | | | | | | | | | |
| Commercial, financial and agricultural | | $ | 178,055 | | $ | 278,675 | | $ | 408,625 | | $ | 865,355 | |
| Real estate-construction | | | 1,015 | | | 2,202 | | | 4,073 | | | 7,290 | |
| Real estate-commercial mortgage | | | 63,703 | | | 204,770 | | | 546,555 | | | 815,028 | |
| | | $ | 242,773 | | $ | 485,647 | | $ | 959,253 | | $ | 1,687,673 | |
| | | | | | | | | | | | | | |
| | | Interest Sensitivity | | | |
| | | | | | | | | | | | | | |
| | | | Variable | | | Fixed | | | Total | | | | |
| | | | | | | | | | | | | | |
| Due in one year or less | | $ | 145,580 | | $ | 97,193 | | $ | 242,773 | | | | |
| Due after one year | | | 1,086,632 | | | 358,268 | | | 1,444,900 | | | | |
| | | $ | 1,232,212 | | $ | 455,461 | | $ | 1,687,673 | | | | |
| | | | | | | | | | | | | | |
RECONCILIATION OF GAAP TO NON-GAAP MEASURES | |
| | | | | | | | |
| | | 2006 | | 2005 | | 2004 | |
| | | | | | | | | | | |
Income statement data: | | | | | | | | | | |
Net income | | | | | | | | | | |
| Net income | | $ | 41,031 | | $ | 25,641 | | $ | 21,798 | |
Amortization of core deposit and other intangible assets (1) | | | 1,715 | | | 1,153 | | | 105 | |
Merger, conversion and restructuring expenses (1) | | | --- | | | 5,333 | | | --- | |
| Net operating (tangible) income | | $ | 42,746 | | $ | 32,127 | | $ | 21,903 | |
| | | | | | | | | | | |
Earnings per share | | | | | | | | | | |
| Diluted earnings per common share | | $ | 1.72 | | $ | 1.35 | | $ | 1.65 | |
Amortization of core deposit and other intangible assets (1) | | | 0.07 | | | 0.06 | | | 0.01 | |
Merger, conversion and restructuring expenses (1) | | | --- | | | 0.28 | | | --- | |
| Diluted operating (tangible) earnings per share | | $ | 1.79 | | $ | 1.69 | | $ | 1.66 | |
| | | | | | | | | | | |
Balance sheet data: | | | | | | | | | | |
Average assets | | | | | | | | | | |
| Average assets | | $ | 3,403,421 | | $ | 2,668,605 | | $ | 1,941,096 | |
| Goodwill | | | (245,652 | ) | | (123,412 | ) | | (3,405 | ) |
| Core deposit and other intangible assets | | | (13,368 | ) | | (8,236 | ) | | (1,492 | ) |
| Average tangible assets | | $ | 3,144,401 | | $ | 2,536,957 | | $ | 1,936,199 | |
| | | | | | | | | | | |
Operating return on average tangible assets | | | 1.36 | % | | 1.27 | % | | 1.13 | % |
| | | | | | | | | | | |
Average equity | | | | | | | | | | |
| Average equity | | $ | 475,710 | | $ | 318,768 | | $ | 145,750 | |
| Goodwill | | | (245,652 | ) | | (123,412 | ) | | (3,405 | ) |
| Core deposit and other intangible assets | | | (13,368 | ) | | (8,236 | ) | | (1,492 | ) |
| Deferred taxes | | | 1,744 | | | 862 | | | --- | |
| Average tangible equity | | $ | 218,434 | | $ | 187,982 | | $ | 140,853 | |
| | | | | | | | | | | |
Operating return on average tangible equity | | | 19.57 | % | | 17.09 | % | | 15.55 | % |
| | | | | | | | | | | |
At end of year: | | | | | | | | | | |
Total assets | | | | | | | | | | |
| Total assets | | $ | 3,496,370 | | $ | 3,332,430 | | $ | 1,954,799 | |
| Goodwill | | | (246,383 | ) | | (244,827 | ) | | (3,570 | ) |
| Core deposit and other intangible assets | | | (13,023 | ) | | (14,253 | ) | | (1,481 | ) |
| Total tangible assets | | $ | 3,236,964 | | $ | 3,073,350 | | $ | 1,949,748 | |
| | | | | | | | | | | |
Total equity | | | | | | | | | | |
| Total equity | | $ | 486,161 | | $ | 476,673 | | $ | 152,341 | |
| Goodwill | | | (246,383 | ) | | (244,827 | ) | | (3,570 | ) |
| Core deposit and other intangible assets | | | (13,023 | ) | | (14,253 | ) | | (1,481 | ) |
| Deferred taxes | | | 1,591 | | | 1,734 | | | --- | |
| Total tangible equity | | $ | 228,346 | | $ | 219,327 | | $ | 147,290 | |
| | | | | | | | | | | |
Tangible book value at end of period | | $ | 9.71 | | $ | 9.12 | | $ | 11.46 | |
Tangible equity to assets | | | 7.05 | % | | 7.14 | % | | 7.55 | % |
| | | | | | | | | | | |
(1) Net of related tax effect | | | | | | | | | | |
A portion of the information related to quantitative and qualitative disclosures about market risk is included under Management’s Discussion and Analysis (“MD&A”) under the heading of Asset/Liability Management and Liquidity. The purpose of this presentation is to augment the discussion contained in MD&A.
Market risk is defined as the exposure to economic loss that arises from changes in the values of certain financial instruments pursuant to factors arising out of the various categories of market risk. Market risk can include a number of categories, including interest rate risk, foreign currency risk, exchange rate risk, commodity price risk, etc. For domestic, community-based banks, the vast majority of market risk is related to interest rate risk. Financial institutions use a number of techniques to attempt to measure the impact of interest rate risk which includes GAP analysis, interest rate “shock” simulation and economic value of equity. Each of these techniques is used to help quantify market risk attributable to the inherent sensitivity of both interest earning assets and interest bearing liabilities.
Interest rate sensitivity results when the maturity or repricing intervals of interest-earning assets, interest-bearing liabilities, and off-balance sheet financial instruments are different, creating a risk that changes in the level of market interest rates will result in disproportionate changes in the value of, and the net earnings generated from, Community’s interest-earning assets, interest-bearing liabilities, and off-balance sheet financial instruments. Community’s exposure to interest rate sensitivity is managed primarily through Community’s strategy of selecting the types and terms of interest-earning assets and interest-bearing liabilities which generate favorable earnings, while limiting the potential negative effects of changes in market interest rates. Since Community’s primary source of interest-bearing liabilities is customer deposits, its ability to manage the types and terms of such deposits may be somewhat limited by customer preferences in the market areas in which it operates. Borrowings, which include Federal Home Loan Bank (“FHLB”) advances and short-term loans, subordinated notes, and other short-term and long-term borrowings, are generally structured with specific terms which in management’s judgment, when aggregated with the terms for outstanding deposits and matched with interest-earning assets, mitigate Community’s exposure to interest rate sensitivity.
The rates, terms and interest rate indices of Community’s interest-earning assets result primarily from its strategy of investing in loans and securities (a substantial portion of which have adjustable-rate terms) which permit Community to limit its exposure to interest rate sensitivity, together with credit risk, while at the same time achieving a positive interest rate spread compared to the cost of interest-bearing liabilities.
The following table provides a measure of interest rate sensitivity for each category of interest earning assets and interest bearing liabilities at December 31, 2006.
Interest Rate Sensitivity | | | | | | | | | | | |
Dollars in thousands | | 1-90 days | | 90-180 days | | 180-365 days | | 1 year or more | | Total | |
| | | | | | | | | | | | | | | | | |
Assets | | | | | | | | | | | | | | | | |
| Interest-bearing deposits in other banks | | $ | 3,561 | | $ | --- | | $ | --- | | $ | --- | | $ | 3,561 | |
| Investment securities | | | 76,200 | | | 14,770 | | | 50,599 | | | 517,567 | | | 659,136 | |
Loans(1) | | | 736,576 | | | 101,391 | | | 193,994 | | | 1,338,928 | | | 2,370,889 | |
| Earning assets | | | 816,337 | | | 116,161 | | | 244,593 | | | 1,856,495 | | | 3,033,586 | |
| Non-earning assets | | | 630 | | | 630 | | | 1,142 | | | 460,382 | | | 462,784 | |
| Total assets | | $ | 816,967 | | $ | 116,791 | | $ | 245,735 | | $ | 2,316,877 | | $ | 3,496,370 | |
Liabilities | | | | | | | | | | | | | | | | |
| Savings, money market and NOW accounts | | $ | 259,685 | | $ | 38,324 | | $ | 76,624 | | $ | 504,711 | | $ | 879,344 | |
| Time | | | 183,445 | | | 298,679 | | | 205,003 | | | 311,004 | | | 998,131 | |
| Time in denominations of $100,000 or more | | | 78,874 | | | 72,211 | | | 45,027 | | | 71,267 | | | 267,379 | |
| Short-term borrowings | | | 108,927 | | | --- | | | --- | | | --- | | | 108,927 | |
| Long-term debt | | | 1,963 | | | 12,956 | | | 53,259 | | | 246,901 | | | 315,079 | |
| Subordinated debt | | | 23,196 | | | --- | | | --- | | | 28,352 | | | 51,548 | |
| Interest bearing liabilities | | | 656,090 | | | 422,170 | | | 379,913 | | | 1,162,235 | | | 2,620,408 | |
| Other liabilities and equity | | | 11,050 | | | 11,050 | | | 22,100 | | | 831,762 | | | 875,962 | |
| Total liabilities and equity | | $ | 667,140 | | $ | 433,220 | | $ | 402,013 | | $ | 1,993,997 | | $ | 3,496,370 | |
| | | | | | | | | | | | | | | | | |
(1) includes non-accrual loans | | | | | | | | | | | | | | | | |
Interest Sensitivity GAP | | | | | | | |
Dollars in thousands | | 1-90 days | | 90-180 Days | | 180-365 days | |
| | | | | | | | | | | |
| Periodic | | $ | 149,827 | | $ | (316,429 | ) | $ | (156,278 | ) |
| Cumulative | | | | | | (166,602 | ) | | (322,880 | ) |
Cumulative GAP as a percentage of total assets | | | 4.3 | % | | (4.8 | )% | | (9.2 | )% |
Community seeks to maximize net interest income and minimize earnings volatility by managing the level of interest rate sensitivity. Interest rate sensitivity is influenced by the repricing characteristic of both assets and liabilities and includes the volume of assets and liabilities repricing, the timing of repricing and the relative magnitude of the repricing. While GAP measurement provides an important tool to quantify the level of interest rate sensitivity at a specific point in time, its utility is constrained by the inherent limitations of GAP measurement for a number of reasons. First, changes in the level of interest rates cannot be expected to affect all assets and liabilities equally nor will they all be impacted at the same time. Second, assets and liabilities that are eligible to be repriced within a specific time frame may, in fact, not reprice or may not reprice to the same extent. Third, the measurement of GAP is inherently limited in that it provides a representation of the repricing characteristics of assets and liabilities at a specific point in time while actual sensitivity of assets and liabilities are undergoing constant change. Finally, much of the presentation of GAP is, by necessity, based upon estimates and assumptions for certain assets and liabilities. For example, savings, NOW accounts, and other forms of core deposits do not have defined maturities or repricing dates and therefore require estimates to be made based upon historical deposit decay rate analysis or other forms of approximation.
Interest rate sensitivity and the measurement thereof are also influenced by the optionality of certain earning assets and interest bearing liabilities. For example, a substantial portion of Community’s loans and mortgage-backed securities and residential mortgage loans contain significant embedded options, which permit the borrower to prepay the principal balance of the loan prior to maturity (“prepayments”) without penalty. A loan’s propensity for prepayment is dependent upon a number of factors, including the current interest rate and interest rate index (if any) of the loan, the financial ability of the borrower to refinance, the economic benefit to be obtained from refinancing, availability of refinancing at attractive terms, as well as economic and other factors in specific geographic areas which affect the sales and price levels of residential property. In a changing interest rate environment, prepayments may increase or decrease on fixed and adjustable-rate loans pursuant to the current relative levels and expectations of future short and long-term interest rates.
Investment securities, other than mortgage-backed securities and those with early call provisions, generally do not have significant embedded options and repay pursuant to specific terms until maturity. While savings and checking deposits generally may be withdrawn upon the customer’s request without prior notice, a continuing relationship with such customers is generally predictable resulting in a dependable and uninterrupted source of funds. Time deposits generally have early withdrawal penalties, while term FHLB borrowings and subordinated notes have prepayment penalties, which discourage customer withdrawal of time deposits and prepayment by Community of FHLB borrowings and subordinated notes prior to maturity.
In order to monitor interest rate risk beyond the one-year time horizon of shocks and rate ramps, Community also performs economic value of equity (“EVE”) analysis. EVE represents the present value of all asset cash flows minus the present value of all liability cash flows. As with rate shock analysis, EVE incorporates management assumptions regarding prepayment behavior of fixed rate loans and securities with optionality and core deposit behavior. Community’s policy is to limit the change in EVE to -34% given changes in rates up to +/-200 basis points. The December 2006 results reflect a -6.2% and -0.5% decrease to EVE given a -200 and +200 basis point change in interest rates, respectively.
Community Banks, Inc. and Subsidiaries
CONSOLIDATED BALANCE SHEETS
At December 31, 2006 and 2005
(Dollars in thousands except per share data)
| | | 2006 | | 2005 | |
ASSETS | | | | | |
| | | | | | | | |
| Cash and due from banks | | $ | 73,608 | | $ | 76,820 | |
| Interest-bearing deposits in other banks | | | 3,561 | | | 4,423 | |
| Investment securities, available for sale | | | 636,066 | | | 605,555 | |
Investment securities, held to maturity (fair value approximates $23,415 and $22,563) | | | 23,070 | | | 23,030 | |
| Loans, net of allowance for loan losses of $23,626 and $22,965 | | | 2,347,263 | | | 2,214,100 | |
| Premises and equipment, net | | | 46,335 | | | 43,283 | |
| Goodwill and other intangible assets | | | 259,406 | | | 259,080 | |
| Accrued interest receivable and other assets | | | 107,061 | | | 106,139 | |
| Total assets | | $ | 3,496,370 | | $ | 3,332,430 | |
| | | | | | | | |
LIABILITIES | | | | | | | |
| | | | | | | | |
| Deposits: | | | | | | | |
| Non-interest bearing | | $ | 368,329 | | $ | 375,835 | |
| Interest bearing | | | 2,144,853 | | | 1,918,532 | |
| Total deposits | | | 2,513,182 | | | 2,294,367 | |
| Short-term borrowings | | | 108,927 | | | 87,253 | |
| Long-term debt | | | 315,079 | | | 430,719 | |
| Subordinated debt | | | 51,548 | | | 30,928 | |
| Accrued interest payable and other liabilities | | | 21,473 | | | 12,490 | |
| Total liabilities | | | 3,010,209 | | | 2,855,757 | |
| | | | | | | | |
STOCKHOLDERS’ EQUITY | | | | | | | |
| | | | | | | | |
| Preferred stock, no par value; 500,000 shares | | | | | | | |
| authorized; no shares issued and outstanding | | | --- | | | --- | |
| Common stock-$5.00 par value; 50,000,000 shares | | | | | | | |
| authorized; 24,478,000 and 23,314,000 shares issued | | | 122,391 | | | 116,572 | |
| Surplus | | | 373,142 | | | 347,827 | |
| Retained Earnings | | | 17,609 | | | 27,031 | |
| Accumulated other comprehensive income (loss), net of tax | | | (1,806 | ) | | (3,779 | ) |
| Treasury stock; 959,000 and 399,000 shares, at cost | | | (25,175 | ) | | (10,978 | ) |
| Total stockholders’ equity | | | 486,161 | | | 476,673 | |
| Total liabilities and stockholders’ equity | | $ | 3,496,370 | | $ | 3,332,430 | |
The accompanying notes are an integral part of the consolidated financial statements.
Community Banks, Inc. and Subsidiaries
CONSOLIDATED STATEMENTS OF INCOME
For the Years Ended December 31, 2006, 2005, and 2004
(Dollars in thousands except per share data)
| | | 2006 | | 2005 | | 2004 | |
INTEREST INCOME: | | | | | | | | | | |
| Loans, including fees | | $ | 166,061 | | $ | 111,757 | | $ | 69,732 | |
| Investment securities: | | | | | | | | | | |
| Taxable | | | 18,143 | | | 17,198 | | | 18,999 | |
| Tax exempt | | | 9,089 | | | 9,087 | | | 8,847 | |
| Dividends | | | 2,438 | | | 2,353 | | | 2,084 | |
| Other | | | 1,903 | | | 1,898 | | | 137 | |
| Total interest income | | | 197,634 | | | 142,293 | | | 99,799 | |
| | | | | | | | | | | |
INTEREST EXPENSE: | | | | | | | | | | |
| Deposits | | | 66,650 | | | 36,431 | | | 22,523 | |
| Short-term borrowings | | | 3,021 | | | 1,479 | | | 739 | |
| Long-term debt | | | 17,380 | | | 19,700 | | | 18,382 | |
| Subordinated debt | | | 3,683 | | | 2,038 | | | 1,598 | |
| Total interest expense | | | 90,734 | | | 59,648 | | | 43,242 | |
| Net interest income | | | 106,900 | | | 82,645 | | | 56,557 | |
| Provision for loan losses | | | 2,050 | | | 2,300 | | | 3,100 | |
| Net interest income after provision for loan losses | | | 104,850 | | | 80,345 | | | 53,457 | |
| | | | | | | | | | | |
NON-INTEREST INCOME: | | | | | | | | | | |
| Investment management and trust services | | | 4,394 | | | 2,692 | | | 1,510 | |
| Service charges on deposit accounts | | | 11,507 | | | 9,413 | | | 7,120 | |
| Other service charges, commissions and fees | | | 7,272 | | | 5,452 | | | 3,357 | |
| Investment security gains | | | 732 | | | 259 | | | 2,470 | |
| Insurance premium income and commissions | | | 4,120 | | | 3,350 | | | 3,260 | |
| Mortgage banking activities | | | 2,172 | | | 2,354 | | | 2,665 | |
| Earnings on investment in life insurance | | | 2,725 | | | 2,063 | | | 1,593 | |
| Other | | | 2,045 | | | 854 | | | 1,238 | |
| Total non-interest income | | | 34,967 | | | 26,437 | | | 23,213 | |
| | | | | | | | | | | |
NON-INTEREST EXPENSES: | | | | | | | | | | |
| Salaries and employee benefits | | | 46,434 | | | 36,998 | | | 28,337 | |
| Net occupancy and equipment expense | | | 14,117 | | | 11,355 | | | 8,287 | |
| Merger, conversion and restructuring expenses | | | --- | | | 8,205 | | | --- | |
| Marketing expense | | | 1,752 | | | 2,036 | | | 2,325 | |
| Telecommunications expense | | | 2,243 | | | 1,359 | | | 1,285 | |
| Amortization of intangibles | | | 2,639 | | | 1,424 | | | 161 | |
| Other | | | 17,700 | | | 13,692 | | | 9,598 | |
| Total non-interest expenses | | | 84,885 | | | 75,069 | | | 49,993 | |
| | | | | | | | | | | |
| Income before income taxes | | | 54,932 | | | 31,713 | | | 26,677 | |
| Income taxes | | | 13,901 | | | 6,072 | | | 4,879 | |
| Net income | | $ | 41,031 | | $ | 25,641 | | $ | 21,798 | |
| | | | | | | | | | | |
EARNINGS PER SHARE: | | | | | | | | | | |
| Basic | | $ | 1.74 | | $ | 1.38 | | $ | 1.70 | |
| Diluted | | $ | 1.72 | | $ | 1.35 | | $ | 1.65 | |
The accompanying notes are an integral part of the consolidated financial statements.
Community Banks, Inc. and Subsidiaries
CONSOLIDATED STATEMENTS OF CHANGES IN STOCKHOLDERS’ EQUITY
For the Years Ended December 31, 2006, 2005, and 2004
(Dollars in thousands except per share data)
| | | Outstanding | | Common | | | | Retained | | Accumulated Other Comprehensive | | Treasury | | Total | |
| | | Shares | | Stock | | Surplus | | Earnings | | Income (Loss) | | Stock | | Equity | |
Balance, December 31, 2003 | | | 11,648 | | $ | 59,256 | | $ | 57,563 | | $ | 24,297 | | $ | 6,596 | | $ | (4,306 | ) | $ | 143,406 | |
| Comprehensive income: | | | | | | | | | | | | | | | | | | | | | | |
| Net income | | | | | | | | | | | | 21,798 | | | | | | | | | 21,798 | |
| Unrealized loss on securities, net of reclassification adjustment and tax effect | | | | | | | | | | | | | | | (3,140 | ) | | | | | (3,140 | ) |
| Change in unfunded pension liability, net of tax | | | | | | | | | | | | | | | (245 | ) | | | | | (245 | ) |
| Total comprehensive income | | | | | | | | | | | | | | | | | | | | | 18,413 | |
| Cash dividends ($.64 per share) | | | | | | | | | | | | (8,215 | ) | | | | | | | | (8,215 | ) |
| 5% stock dividend | | | 584 | | | 2,949 | | | 15,103 | | | (18,110 | ) | | | | | | | | (58 | ) |
| Purchases of treasury stock | | | (144 | ) | | | | | | | | | | | | | | (4,151 | ) | | (4,151 | ) |
| Exercise of common stock options and issuances under stock purchase plan | | | 148 | | | (98 | ) | | | | | (1,636 | ) | | | | | 4,042 | | | 2,308 | |
| Tax benefits from employee stock transactions | | | | | | | | | 638 | | | | | | | | | | | | 638 | |
Balance, December 31, 2004 | | | 12,236 | | | 62,107 | | | 73,304 | | | 18,134 | | | 3,211 | | | (4,415 | ) | | 152,341 | |
| Comprehensive income: | | | | | | | | | | | | | | | | | | | | | | |
| Net income | | | | | | | | | | | | 25,641 | | | | | | | | | 25,641 | |
| Unrealized loss on securities, net of reclassification adjustment and tax effect | | | | | | | | | | | | | | | (7,043 | ) | | | | | (7,043 | ) |
| Change in unfunded pension liability, net of tax | | | | | | | | | | | | | | | 53 | | | | | | 53 | |
| Total comprehensive income | | | | | | | | | | | | | | | | | | | | | 18,651 | |
| Cash dividends ($.71 per share) | | | | | | | | | | | | (13,440 | ) | | | | | | | | (13,440 | ) |
| Purchases of treasury stock | | | (598 | ) | | | | | | | | | | | | | | (16,489 | ) | | (16,489 | ) |
| Exercise of common stock options and issuances under stock purchase plan | | | 423 | | | 193 | | | 873 | | | (2,980 | ) | | | | | 9,926 | | | 8,012 | |
| Tax benefits from employee stock transactions | | | | | | | | | 514 | | | | | | | | | | | | 514 | |
| Acquisition of PennRock Financial Services Corp.: | | | | | | | | | | | | | | | | | | | | | | |
| Common stock issued | | | 10,854 | | | 54,272 | | | 269,733 | | | | | | | | | | | | 324,005 | |
| Fair value of stock options | | | | | | | | | 3,079 | | | | | | | | | | | | 3,079 | |
| Other | | | | | | | | | 324 | | | (324 | ) | | | | | | | | --- | |
Balance, December 31, 2005 | | | 22,915 | | | 116,572 | | | 347,827 | | | 27,031 | | | (3,779 | ) | | (10,978 | ) | | 476,673 | |
| Comprehensive income: | | | | | | | | | | | | | | | | | | | | | | |
| Net income | | | | | | | | | | | | 41,031 | | | | | | | | | 41,031 | |
| Unrealized gain on securities, net of reclassification adjustment and tax effect | | | | | | | | | | | | | | | 1,790 | | | | | | 1,790 | |
| Change in unfunded pension liability, net of tax | | | | | | | | | | | | | | | 183 | | | | | | 183 | |
| Total comprehensive income | | | | | | | | | | | | | | | | | | | | | 43,004 | |
| Cash dividends ($.79 per share) | | | | | | | | | | | | (18,676 | ) | | | | | | | | (18,676 | ) |
| 5% stock dividend | | | 1,133 | | | 5,820 | | | 24,162 | | | (29,982 | ) | | | | | | | | --- | |
| Purchases of treasury stock | | | (668 | ) | | | | | | | | | | | | | | (17,922 | ) | | (17,922 | ) |
| Exercise of common stock options and issuances under stock purchase plan | | | 139 | | | (1 | ) | | | | | (1,795 | ) | | | | | 3,725 | | | 1,929 | |
| Compensation and tax benefits from employee stock transactions | | | | | | | | | 1,153 | | | | | | | | | | | | 1,153 | |
Balance, December 31, 2006 | | | 23,519 | | $ | 122,391 | | $ | 373,142 | | $ | 17,609 | | $ | (1,806 | ) | $ | (25,175 | ) | $ | 486,161 | |
The accompanying notes are an integral part of the consolidated financial statements.
Community Banks, Inc. and Subsidiaries
CONSOLIDATED STATEMENTS OF CASH FLOWS
For the Years Ended December 31, 2006 2005, and 2004
| (Dollars in thousands) | | 2006 | | 2005 | | 2004 | |
Operating Activities: | | | | | | | | | | |
| Net income | | $ | 41,031 | | $ | 25,641 | | $ | 21,798 | |
| Adjustments to reconcile net income to net cash | | | | | | | | | | |
| provided by operating activities: | | | | | | | | | | |
| Provision for loan losses | | | 2,050 | | | 2,300 | | | 3,100 | |
| Deferred income tax expense (benefit) | | | (251 | ) | | 1,559 | | | (481 | ) |
| Depreciation and amortization | | | 7,293 | | | 5,344 | | | 3,310 | |
| Stock option expense | | | 655 | | | --- | | | --- | |
| Net amortization of securities | | | 351 | | | 983 | | | 1,106 | |
| Realized gains on sales of available-for-sale securities, net | | | (732 | ) | | (259 | ) | | (2,470 | ) |
| Loans originated for sale | | | (12,452 | ) | | (8,163 | ) | | (10,959 | ) |
| Proceeds from sales of loans held for sale | | | 11,738 | | | 7,324 | | | 15,923 | |
| Gains on loan sales | | | (689 | ) | | (225 | ) | | (1,125 | ) |
| Earnings on investment in life insurance | | | (2,725 | ) | | (2,063 | ) | | (1,593 | ) |
| Net change in other assets | | | 1,525 | | | 6,489 | | | 3,646 | |
| Net change in accrued interest payable and other liabilities | | | 9,265 | | | (16,385 | ) | | (2,982 | ) |
| Tax benefits from employee stock transactions | | | --- | | | 514 | | | 638 | |
| Net cash provided by operating activities | | | 57,059 | | | 23,059 | | | 29,911 | |
| | | | | | | | | | | |
Investing Activities: | | | | | | | | | | |
| Net change in interest-bearing deposits in other banks | | | 862 | | | 3,740 | | | 1,515 | |
| Activity in available-for-sale securities: | | | | | | | | | | |
| Sales | | | 68,804 | | | 307,874 | | | 119,390 | |
| Maturities, prepayments and calls | | | 65,652 | | | 69,654 | | | 125,440 | |
| Purchases | | | (161,829 | ) | | (125,286 | ) | | (220,501 | ) |
| Activity in held to maturity securities: | | | | | | | | | | |
| Maturities, prepayments and calls | | | (34 | ) | | --- | | | --- | |
| Purchases | | | --- | | | (23,020 | ) | | --- | |
| Net increase in total loans | | | (135,620 | ) | | (178,220 | ) | | (144,509 | ) |
| Proceeds from sale of loans | | | 1,267 | | | --- | | | 4,556 | |
| Investment in life insurance | | | --- | | | --- | | | (5,000 | ) |
| Additions to premises and equipment | | | (7,706 | ) | | (6,892 | ) | | (4,206 | ) |
| Cash acquired in acquisition | | | --- | | | 34,564 | | | --- | |
| Other | | | (2,965 | ) | | (3,646 | ) | | (325 | ) |
| Net cash provided (used) by investing activities | | | (171,569 | ) | | 78,768 | | | (123,640 | ) |
| | | | | | | | | | | |
Financing Activities: | | | | | | | | | | |
| Net increase in deposits | | | 218,815 | | | 106,755 | | | 74,852 | |
| Net change in short-term borrowings | | | 21,674 | | | (50,873 | ) | | (5,648 | ) |
| Proceeds from issuance of long-term debt | | | 55,000 | | | 50,000 | | | 35,000 | |
| Proceeds from subordinated debt | | | 20,620 | | | --- | | | --- | |
| Repayment of long-term debt | | | (170,640 | ) | | (152,458 | ) | | (16,760 | ) |
| Cash dividends and cash paid in lieu of fractional shares | | | (18,676 | ) | | (13,440 | ) | | (8,273 | ) |
| Payments to acquire treasury stock | | | (17,922 | ) | | (16,489 | ) | | (4,151 | ) |
| Tax benefits from employee stock transactions | | | 498 | | | --- | | | --- | |
| Proceeds from issuance of common stock | | | 1,929 | | | 8,012 | | | 2,308 | |
| Net cash provided (used) by financing activities | | | 111,298 | | | (68,493 | ) | | 77,328 | |
| | | | | | | | | | | |
| Net change in cash and cash equivalents | | | (3,212 | ) | | 33,334 | | | (16,401 | ) |
| | | | | | | | | | | |
| Cash and cash equivalents at beginning of period | | | 76,820 | | | 43,486 | | | 59,887 | |
| Cash and cash equivalents at end of period | | $ | 73,608 | | $ | 76,820 | | $ | 43,486 | |
| | | | | | | | | | | |
| Cash paid during the year for: | | | | | | | | | | |
| Interest | | $ | 90,001 | | $ | 57,452 | | $ | 42,426 | |
| Income taxes | | $ | 15,160 | | $ | 3,623 | | $ | 3,738 | |
The accompanying notes are an integral part of the consolidated financial statements.
Community Banks, Inc. and Subsidiaries
NOTES TO CONSOLIDATED FINANCIAL STATEMENTS
1. SUMMARY OF SIGNIFICANT ACCOUNTING POLICIES:
ORGANIZATION AND BASIS OF PRESENTATION:
Community Banks, Inc. (“Community” or the “Corporation”) is a financial holding company whose wholly-owned subsidiaries include CommunityBanks, CommunityBanks Investments, Inc. (CBII), and Community Banks Life Insurance Company (CBLIC). All significant intercompany transactions have been eliminated in consolidation. Community operates through its executive office in Harrisburg, Pennsylvania, and through 74 branch banking offices located in Adams, Berks, Chester, Cumberland, Dauphin, Lancaster, Luzerne, Northumberland, Schuylkill, Snyder, and York Counties in Pennsylvania, and Carroll County in Maryland. CommunityBanks provides a wide range of services through its network of offices. Lending services include secured and unsecured commercial loans, residential and commercial mortgages and various forms of consumer lending. Deposit services include a variety of checking, savings, time and money market deposits. Community also provides specialized services through its wholly-owned subsidiaries. Community and its subsidiaries are subject to the regulations of certain Federal and state agencies and undergo periodic examinations by such regulatory authorities.
USE OF ESTIMATES:
The preparation of financial statements in accordance with accounting principles generally accepted in the United States of America requires management to make estimates and assumptions that affect the reported amounts of assets and liabilities and disclosure of contingent assets and liabilities at the date of the financial statements and reported amounts of revenues and expenses during the reporting period. Actual results could differ from those estimates. The principal material estimates that are particularly susceptible to significant change in the near term relate to: the allowance for loan losses; certain intangible assets, such as goodwill and core deposit intangible; and the evaluation of other than temporary impairment of investment securities.
CASH FLOWS INFORMATION:
Cash and cash equivalents include cash and due from banks and federal funds sold. During 2004, $25 million of maturing long-term FHLB advances were repaid through short term borrowings with the FHLB. Refer to Note 2, “Acquisitions,” for the terms of a non-cash transaction in 2005. During 2006, 2005, and 2004 transfers from loans to foreclosed real estate totaled $543,000, $1.0 million, and $1.5 million.
SIGNIFICANT GROUP CONCENTRATIONS OF CREDIT RISK:
Most of Community’s activities are with customers located within Central Pennsylvania and Northern Maryland. Note 3 discusses the types of securities in which Community invests. Note 4 discusses the types of lending engaged in by Community. Community does not have any significant concentrations to any one industry or customer.
INVESTMENT SECURITIES:
Community classifies debt and equity securities as either “held-to-maturity,” “available-for-sale,” or “trading.” Investments for which management has the intent, and Community has the ability, to hold to maturity are carried at cost adjusted for amortization of premium and accretion of discount. Securities bought and held primarily for the purpose of selling them in the near term are classified as trading and reported at fair value. Changes in unrealized gains and losses on trading securities are recognized in the Consolidated Statements of Income. At December 31, 2006 and 2005, there were no securities identified as trading. All other securities are classified as available-for-sale securities and reported at fair value. Changes in unrealized gains and losses on available-for-sale securities, net of applicable taxes, are recorded as a component of stockholders’ equity. Quoted market values, when available, are used to determine the fair value of securities. If quoted market prices are not available, then fair values are estimated using quoted prices of instruments with similar characteristics. Amortization and accretion are calculated principally on the interest method.
Securities classified as available-for-sale include those investments management intends to use as part of its asset/liability management strategy and may be sold in response to changes in interest rates, resultant prepayment risk and other factors. Declines in the fair value of available-for-sale or held to maturity securities below their cost that are deemed to be “other-than-temporary” are reflected in the Consolidated Statements of Income as realized losses. In estimating other-than-temporary impairment losses, management considers (1) the length of time and the extent to which the fair value has been less than cost, (2) the financial condition and near-term prospects of the issuer, and (3) the intent and ability of Community to retain its investment in the issuer for a period of time sufficient to allow for any anticipated recovery in fair value. Realized gains and losses on the sale of securities are recognized using the specific identification method and are included in “non-interest income” in the Consolidated Statements of Income.
Equity securities include Federal Home Loan Bank (“FHLB”) stock at December 31, 2006 and 2005 of $19.8 million and $23.1 million, and represent equity interests in the FHLB. Such securities, which are carried at cost, do not have a readily determinable fair value because ownership is restricted and can be sold back only to the FHLB or to another member institution. The FHLB requires Community to maintain certain amounts of FHLB stock based on its balance of FHLB advances.
LOANS HELD FOR SALE:
Loans held for sale, consisting primarily of fixed rate mortgages and education loans, are valued at the lower of cost or fair value, determined on an aggregate basis.
LOANS AND REVENUE RECOGNITION:
Loans are stated at their principal amount outstanding adjusted for charge-offs and certain origination fees or costs. Interest income on loans is recorded on the interest method. Non-accrual loans are those on which the accrual of interest has ceased and where all previously accrued and unpaid interest is reversed. Loans, other than consumer loans, are placed on non-accrual status when principal or interest is past due 90 days or more and the collateral may be inadequate to recover principal and interest, or immediately, if in the opinion of management, full collection is doubtful. Generally, the uncollateralized portions of consumer loans past due 90 days or more are charged-off. Interest accrued but not collected as of the date of placement on non-accrual status is reversed and charged against current income. Subsequent cash payments received are applied either to the outstanding principal balance or recorded as interest income, depending upon management’s assessment of the ultimate collectibility of principal and interest. Non-accrual loans are restored to accrual status when all delinquent principal and interest become current or the loan is considered secured and in the process of collection. Delinquency status is based on the contractual terms of the loan. Loan origination fees and certain direct origination costs are being deferred and the net amount amortized as an adjustment of the yield on the related loan under the interest method, generally over the contractual life.
ALLOWANCE FOR LOAN LOSSES:
The allowance for loan losses is established as losses are estimated to have occurred through a provision for loan losses charged to earnings. Loan losses are charged against the allowance when management believes the uncollectibility of a loan balance is confirmed. Subsequent recoveries, if any, are credited to the allowance.
The allowance for loan losses is evaluated on a quarterly basis by management using a systemic methodology that incorporates management’s judgments about the credit quality of the loan portfolio through a disciplined process that is consistently applied. Management considers all known relevant internal and external factors that may affect loan collectibility, as well as particular risks indigenous to specific types of lending. The final results of the process are reviewed and approved by executive management. Results are regularly validated by a review of trends associated with loan volume, delinquencies, and other factors that may influence the methodology used to estimate the allowance for loan losses. This evaluation is inherently subjective as it requires estimates that are susceptible to significant revision as additional information becomes available.
The allowance consists of specific, general and unallocated components. The specific component relates to loans that are classified as doubtful, substandard or special mention. For such loans that are also classified as impaired, an allowance is established when the realizable value of the collateral, or discounted cash flows, or obtainable market price, is lower than the carrying value of that loan. The general component covers non-classified loans that are evaluated as part of various pools. The allowance for these pools is based on historical loss experience adjusted for
Community Banks, Inc. and Subsidiaries
NOTES TO CONSOLIDATED FINANCIAL STATEMENTS
1. SUMMARY OF SIGNIFICANT ACCOUNTING POLICIES (Continued):
qualitative factors. An unallocated component is maintained in the allowance to cover uncertainties that could affect management’s estimate of probable losses. The unallocated component of the allowance reflects the margin of imprecision inherent in the underlying assumptions used in the methodologies for estimating specific and general losses in the portfolio.
A loan is considered impaired when, based on current information and events, it is probable that Community will be unable to collect the scheduled payments of principal or interest when due, according to the contractual terms of the loan agreement. Factors considered by management in determining impairment include payment status, collateral value, and the probability of collecting scheduled principal and interest payments when due. Loans that experience insignificant payment delays and payment shortfalls generally are not classified as impaired. Management determines the significance of payment delays and payment shortfalls on a case-by-case basis, taking into consideration all of the circumstances surrounding the loan and the borrower, including the length of the delay, the reasons for the delay, the borrower’s prior payment record, and the amount of the shortfall in relation to the principal and interest owed. Impairment is measured on a loan-by-loan basis for commercial and construction loans over $250,000 by either the fair value of the collateral if the loan is collateral dependent, the present value of expected future cash flows discounted at the loan’s effective interest rate, or the loan’s obtainable market price.
Large groups of smaller balance homogeneous loans are collectively evaluated for impairment. Accordingly, Community does not separately identify individual consumer and residential loans for impairment disclosures, unless such loans are part of a restructuring agreement.
Loans continue to be classified as impaired unless they are brought fully current and the collection of scheduled interest and principal is considered probable of being collected when due. When an impaired loan or portion of an impaired loan is determined to be uncollectible, the portion deemed uncollectible is charged against the related valuation allowance, and subsequent recoveries, if any, are credited to the valuation allowance.
Purchased loans with evidence of credit quality deterioration for which it is probable at purchase that all contractually required payments will not be collected are accounted for under AICPA Statement of Position (“SOP”) 03-3, “Accounting for Certain Loans or Debt Securities Acquired in a Transfer.” SOP 03-3 addresses accounting for differences between contractual cash flows and cash flows expected to be collected from an investor’s initial investment in loans acquired in a transfer if those differences are attributable, at least in part, to credit quality. SOP 03-3 requires impaired loans to be recorded at fair value and prohibits carrying over valuation allowances in the initial accounting for loans acquired in a transfer, including loans acquired in a purchase business combination. Under SOP 03-3, the excess of cash flows expected at purchase over the purchase price is recognized as interest income over the life of the loans. Subsequent increases in cash flows expected to be collected are recognized prospectively through an adjustment of the loan’s yield over its remaining life. Decreases in expected cash flows are recognized as impairments.
PREMISES AND EQUIPMENT:
Premises and equipment are stated at cost, less accumulated depreciation and amortization. Depreciation is calculated using straight-line methods over the estimated useful lives of the related assets as follows: banking premises, 20 to 40 years; furniture, fixtures, and equipment, 3 to 5 years. Leasehold improvements are amortized over the shorter of the lease term or estimated lives. Long-lived assets are reviewed for impairment whenever events or changes in business circumstances indicate the carrying value of the assets may not be recovered. Maintenance and repairs are expensed as incurred, while major additions and improvements are capitalized. Gain or loss on retirement or disposal of individual assets is recorded as income or expense in the period of retirement or disposal.
GOODWILL AND OTHER INTANGIBLE ASSETS:
Community accounts for its acquisitions using the purchase accounting method required by Statement of Financial Accounting Standards (SFAS) No. 141, “Business Combinations.” Purchase accounting requires the total purchase price to be allocated to the estimated fair values of assets and liabilities acquired, including certain intangible assets that must be recognized. Generally, this results in a residual amount in excess of the net fair values, which is recorded as goodwill.
SFAS No. 142, “Goodwill and Other Intangible Assets,” requires that goodwill is not amortized to expense, but rather that it be tested for impairment at least annually. Impairment write-downs are charged to results of operations in the period in which the impairment is determined. Community did not identify any impairment on its outstanding goodwill from its most recent testing, which was performed at December 31, 2006. If certain events occur which might indicate goodwill has been impaired, the goodwill is tested when such events occur. Other acquired intangible assets with finite lives, such as core deposit intangibles, are required to be amortized over their estimated lives. Core deposit and other intangibles are generally amortized using accelerated methods over estimated useful lives of ten to fifteen years.
FORECLOSED REAL ESTATE:
Real estate acquired through foreclosure is initially carried at fair value, typically derived from the current appraised value of the property at transfer date less estimated selling cost. Prior to foreclosure, the recorded amount of the loan is written down, if necessary, to the appraised value of the real estate to be acquired by charging the allowance for loan losses.
Subsequent to foreclosure, gains or losses on the sale of and losses on the periodic revaluation of foreclosed real estate are credited or charged to other expense. Costs of maintaining and operating foreclosed property are expensed as incurred.
RETIREMENT PLANS:
Community maintains a 401(k) savings plan covering substantially all employees which allows employees to invest a percentage of their earnings, matched to a certain amount specified by Community. The expense related to this savings plan was $1.7 million in 2006, $1.6 million in 2005, and $1.5 million in 2004, and has been included in salaries and benefits expense.
Community maintains supplemental retirement plans and life insurance for selected executives. The supplemental life insurance plans replaced other insurance coverage. The expense associated with these plans was $404,000 for 2006, $407,000 for 2005, and $379,000 for 2004. The accrued liability was $2.6 million at December 31, 2006, and $2.4 million at December 31, 2005. Investment in bank owned life insurance policies was used to finance the supplemental benefit plans, and provide a tax-exempt return to Community.
Community has a noncontributory defined benefit pension plan covering employees of a predecessor bank. The pension plan was amended during 2001 to discontinue the admittance of any future participants into the plan. During the third quarter of 2003, the plan was further amended to curtail future eligibility services and affected participants will no longer accrue benefits. Community uses a September 30 measurement date for its plan. Pension costs are funded currently subject to the full funding limitation imposed under federal income tax regulations. Community adopted the recognition provisions of SFAS No. 158, “Employers’ Accounting for Defined Benefit Pension and Other Postretirement Plans,” at December 31, 2006. There was no impact to the consolidated financial statements upon adoption as unrecognized net costs were previously reflected in other comprehensive income through the recognition of an additional minimum liability in prior years.
Community Banks, Inc. and Subsidiaries
NOTES TO CONSOLIDATED FINANCIAL STATEMENTS
1. SUMMARY OF SIGNIFICANT ACCOUNTING POLICIES (Continued):
INCOME TAXES:
Deferred income taxes are accounted for by the liability method, wherein deferred tax assets and liabilities are calculated on the differences between the basis of assets and liabilities for financial statement purposes versus tax purposes (temporary differences) using enacted tax rates in effect for the year in which the differences are expected to reverse.
STOCK-BASED COMPENSATION:
Effective January 1, 2006, Community adopted the provisions of Statement of Financial Accounting Standards (“SFAS”) No. 123, “Accounting for Stock-Based Compensation” as revised by SFAS No. 123(R), “Share-Based Payments,” using the modified prospective method. Under this method, the share-based compensation cost recognized beginning January 1, 2006, includes compensation cost for (1) all share-based payments granted prior to, but not vested as of January 1, 2006, based on the grant date fair value originally estimated in accordance with the provisions of SFAS No. 123 and (ii) all share-based payments granted subsequent to December 31, 2005, based on the grant date fair value estimated in accordance with the provisions of SFAS No. 123(R). Compensation cost under SFAS No. 123(R) is recognized ratably using the straight-line attribution method over the expected vesting period or to the retirement eligibility date, if less than the vesting period when vesting is not contingent upon any future performance. Community generally issues treasury shares to satisfy share option exercises.
EARNINGS PER SHARE:
Basic earnings per share represents income available to common stockholders divided by the weighted-average number of common shares outstanding during the period. Diluted earnings per share reflects additional common shares that would have been outstanding if potentially dilutive common shares had been issued, as well as any adjustment to income that would result from the assumed issuance. Potentially dilutive common shares that may be issued by Community relate solely to outstanding stock options, and are determined using the treasury stock method. All share and per share amounts are restated for stock splits and stock dividends that occur prior to the issuance of the financial statements.
Earnings per share for the years ended December 31, 2006, 2005 and 2004 have been computed as follows (in thousands, except per share data):
| | | 2006 | | 2005 | | 2004 | |
| | | | | | | | | | | |
| Net income | | $ | 41,031 | | $ | 25,641 | | $ | 21,798 | |
| | | | | | | | | | | |
| Weighted average shares outstanding (basic) | | | 23,645 | | | 18,645 | | | 12,843 | |
| Effect of dilutive stock options | | | 273 | | | 330 | | | 361 | |
| | | | | | | | | | | |
| Weighted average shares outstanding (diluted) | | | 23,918 | | | 18,975 | | | 13,204 | |
| | | | | | | | | | | |
| Per share information: | | | | | | | | | | |
| Basic earnings per share | | $ | 1.74 | | $ | 1.38 | | $ | 1.70 | |
| Diluted earnings per share | | | 1.72 | | | 1.35 | | | 1.65 | |
Antidilutive options excluded from the above earnings per share calculations totaled 633,000 for 2006, 365,000 for 2005, and 168,000 for 2004.
COMPREHENSIVE INCOME:
Community reports comprehensive income in accordance with Statement of Financial Accounting Standard No. 130, “Reporting Comprehensive Income.” The components of other comprehensive income (loss) and related tax effects for years ended December 31 are as follows (in thousands):
| | | 2006 | | 2005 | | 2004 | |
| | | | | | | | |
| Unrealized holding gains (losses) | | | | | | | | | | |
| on available-for-sale securities | | $ | 3,486 | | $ | (10,576 | ) | $ | (2,362 | ) |
| Reclassification adjustments for | | | | | | | | | | |
| gains included in net income | | | (732 | ) | | (259 | ) | | (2,470 | ) |
| Net unrealized gains (losses) | | | 2,754 | | | (10,835 | ) | | (4,832 | ) |
| Tax effect | | | (964 | ) | | 3,792 | | | 1,692 | |
| | | | | | | | | | | |
| Net-of-tax amount | | | 1,790 | | | (7,043 | ) | | (3,140 | ) |
| | | | | | | | | | | |
| (Increase) decrease in unfunded pension liability | | | 282 | | | 82 | | | (377 | ) |
| Tax effect | | | (99 | ) | | (29 | ) | | 132 | |
| | | | | | | | | | | |
| Net-of-tax amount | | | 183 | | | 53 | | | (245 | ) |
| | | | | | | | | | | |
| | | $ | 1,973 | | $ | (6,990 | ) | $ | (3,385 | ) |
The components of accumulated other comprehensive income, included in stockholders’ equity, are as follows at December 31 (in thousands):
| | | 2006 | | 2005 | |
| Net unrealized gain (loss) on | | | | | | | |
| available-for-sale securities | | $ | 434 | | $ | (2,320 | ) |
| Tax effect | | | (152 | ) | | 812 | |
| Net-of-tax amount | | | 282 | | | (1,508 | ) |
| | | | | | | | |
| Unfunded pension liability | | | (3,213 | ) | | (3,494 | ) |
| Tax effect | | | 1,125 | | | 1,223 | |
| Net-of-tax amount | | | (2,088 | ) | | (2,271 | ) |
| | | | | | | | |
| Accumulated other comprehensive income (loss) | | $ | (1,806 | ) | $ | (3,779 | ) |
SEGMENT REPORTING:
Community has determined its only reportable segment is community banking. Community’s non-banking activities have been determined to be insignificant and do not require separate disclosure.
TRANSFERS OF FINANCIAL ASSETS:
Transfers of financial assets are accounted for as sales, when control over the assets has been surrendered. Control over transferred assets is deemed to be surrendered when (1) the assets have been isolated from Community, (2) the transferee obtains the right (free of conditions that constrain it from taking advantage of that right) to pledge or exchange the transferred assets, and (3) Community does not maintain effective control over the transferred assets through an agreement to repurchase them before their maturity.
Community Banks, Inc. and Subsidiaries
NOTES TO CONSOLIDATED FINANCIAL STATEMENTS
1. SUMMARY OF SIGNIFICANT ACCOUNTING POLICIES (Continued):
OFF-BALANCE SHEET CREDIT RELATED FINANCIAL INSTRUMENTS:
In the ordinary course of business, Community has entered into commitments to extend credit, including commitments under credit card arrangements, commercial letters of credit, and standby letters of credit. Such financial instruments are recorded when they are funded.
RECLASSIFICATIONS:
Certain amounts reported in prior years have been reclassified to conform with the 2006 presentation. These reclassifications did not materially impact Community’s financial condition or results of operations.
NEW ACCOUNTING PRONOUNCEMENTS:
SFAS No. 155 - In February 2006, the Financial Accounting Standards Board (“FASB”) issued FASB Statement (“SFAS”) No. 155, “Accounting for Certain Hybrid Financial Instruments.” SFAS No. 155 amends SFAS No. 133 and SFAS No. 140, and improves the financial reporting of certain hybrid financial instruments by requiring more consistent accounting that eliminates exemptions and provides a means to simplify the accounting for these instruments. Specifically, SFAS No. 155 allows financial instruments that have embedded derivatives to be accounted for as a whole (eliminating the need to bifurcate the derivative from its host) if the holder elects to account for the whole instrument on a fair value basis. SFAS No. 155 is effective for all financial instruments acquired or issued after the beginning of an entity's first fiscal year that begins after September 15, 2006. For Community, the effective date was January 1, 2007. The adoption of SFAS No. 155 will not have a significant impact on Community’s financial position or results of operations.
FASB Interpretation No. 48 - In June, 2006, the FASB issued FASB Interpretation No. 48, “Accounting for Uncertainty in Income Taxes—an interpretation of FASB Statement No. 109” (FIN 48), which clarifies the accounting for uncertainty in tax positions. This Interpretation requires that companies recognize in their financial statements the impact of a tax position, if that position is more likely than not of being sustained on audit, based on the technical merits of the position. The provisions of FIN 48 are effective for fiscal years beginning after December 15, 2006, with the cumulative effect of the change in accounting principle recorded as an adjustment to opening retained earnings. The adoption of FIN 48 will not have a significant impact on Community’s financial position or results of operations.
EITF 06-4 - In September 2006, the Financial Accounting Standards Board's Emerging Issues Task Force (“EITF”) issued EITF Issue No. 06-4, "Accounting for Deferred Compensation and Postretirement Benefit Aspects of Endorsement Split Dollar Life Insurance Arrangements." EITF 06-4 requires the recognition of a liability related to the postretirement benefits covered by an endorsement split-dollar life insurance arrangement. The consensus highlights that the employer (who is also the policyholder) has a liability for the benefit it is providing to its employee. As such, if the policyholder has agreed to maintain the insurance policy in force for the employee's benefit during his or her retirement, then the liability recognized during the employee's active service period should be based on the future cost of insurance to be incurred during the employee's retirement. Alternatively, if the policy holder has agreed to provide the employee with a death benefit, then the liability for the future death benefit should be recognized by following the guidance in SFAS No. 106 or Accounting Principals Board Opinion No. 12, as appropriate. For transition, an entity can choose to apply the guidance using either of the following approaches: (a) a change in accounting principle through retrospective application to all periods presented or (b) a change in accounting principle through a cumulative-effect adjustment to the balance in retained earnings at the beginning of the year of adoption. Adoption is required in fiscal years beginning after December 15, 2007, with early adoption permitted. Community is currently analyzing the effects of EITF 06-4 but does not expect its implementation will have a significant impact on Community’s consolidated financial position or results of operations.
SFAS No. 157 - In September, 2006, the FASB issued FASB No. 157, “Fair Value Measurements,” which defines fair value, establishes a framework for measuring fair value under Generally Accepted Accounting Principles, and expands disclosures about fair value measurements. SFAS No. 157 applies to other accounting pronouncements that require or permit fair value measurements. The new guidance is effective for financial statements issued for fiscal years beginning after November 15, 2007, and for interim periods within those fiscal years. Community is currently evaluating the potential impact, if any, of the adoption of FASB Statement No. 157 on Community’s consolidated financial position or results of operations.
SFAS No. 159 - In February 2007, the FASB issued SFAS No. 159, "The Fair Value Option for Financial Assets and Financial Liabilities-Including an Amendment of FASB Statement No. 115." SFAS No. 159 permits entities to choose to measure many financial instruments and certain other items at fair value. Unrealized gains and losses on items for which the fair value option has been elected will be recognized in earnings at each subsequent reporting date. For Community, the effective date will be January 1, 2008. Community is currently analyzing the effect, if any, on consolidated financial position or results of operations.
2. ACQUISITIONS:
PennRock Financial Services Corp. - On July 1, 2005, Community and PennRock Financial Services Corp. (PennRock), parent company of Blue Ball National Bank (Blue Ball) completed a merger in which PennRock was merged into Community. Also on that date, Blue Ball was merged into CommunityBanks, Community’s banking subsidiary.
In connection with the transaction, Community acquired all of the outstanding shares of PennRock common stock for shares of Community’s common stock valued at $324 million and the exchange of stock options for Community’s options valued at $3.1 million. In addition, shares of PennRock valued at $44,000 owned by Community were not exchanged into Community shares, but were included in the acquisition cost. Fair values of significant assets acquired and liabilities assumed at the date of acquisition were: investment securities $250 million; loans $835 million; deposits $882 million; short-term borrowings $91 million; and long-term debt $129 million.
In accordance with SFAS No. 141, Community used the purchase method of accounting to record this transaction. Goodwill recorded in connection with the acquisition of PennRock is calculated below. The goodwill recorded was allocated to the banking subsidiary in accordance with SFAS No. 142, as all of the assets and liabilities acquired were related to the banking subsidiary. The goodwill acquired in connection with PennRock will not be amortized for tax purposes.
| | | (dollars in thousands, except per share data) | |
| Community common stock issued (restated for 5% stock dividend in 2006) | | | | | | 11,397,157 | | | | |
| Average purchase price per Community common share | | | | | $ | 28.4286 | | | | |
| | | | | | | | | $ | 324,005 | |
| Transaction costs | | | | | | | | | 6,065 | |
| Fair value of vested employee stock options | | | | | | | | | 3,079 | |
| Total Purchase Price | | | | | 333,149 | |
| Net Assets Acquired: | | | | | | |
| PennRock stockholders’ equity | | | | | | 103,690 | | | | |
| PennRock goodwill and intangibles | | | | | | (10,037 | ) | | | |
| Adjustments to reflect assets acquired at fair value: | | | | | | | | | | |
| Investments | | | | | | (6,330 | ) | | | |
| Loans (14 year weighted average life) | | | | | | (1,757 | ) | | | |
| Core deposit intangible (10 year accelerated amortization) | | | | | | 13,135 | | | | |
| Bank premises (35 year weighted average life) | | | | | | (3,482 | ) | | | |
| Deferred tax assets (12 year weighted average life) | | | | | | 539 | | | | |
| Adjustments to reflect liabilities acquired at fair value: | | | | | | | | | | |
| Time deposits (2 year weighted average life) | | | | | | (2,110 | ) | | | |
| FHLB advances (2.5 year weighted average life) | | | | | | (1,515 | ) | | | |
| | | | | | | | | | 92,133 | |
| Goodwill resulting from merger | | | | | | | | $ | 241,016 | |
Community Banks, Inc. and Subsidiaries
NOTES TO CONSOLIDATED FINANCIAL STATEMENTS
2. ACQUISITIONS (Continued):
Wiley Insurance Agency and Sentry Trust Company - Two cash acquisitions were completed in 2006: In May, Community acquired Wiley Insurance Agency, an insurance agency providing both commercial and personal lines of insurance; and in September, Community acquired Sentry Trust Company, located in Chambersburg, Pennsylvania. Each of these acquisitions was accounted for using the purchase method of accounting, and, accordingly, the results of operations of each entity are included in Community’s consolidated statements of income from the date of acquisition. The acquisitions, individually and in the aggregate, are immaterial to Community’s consolidated financial position and results of operations. Goodwill arising from the acquisitions is subject to periodic impairment testing and other intangibles are amortized over their estimated useful lives.
Pending acquisitions:
BUCS Financial Corp - In September, 2006, Community and BUCS Financial Corp (“BUCS”) announced the signing of a definitive agreement pursuant to which Community and BUCS will combine under Community’s charter. BUCS, the parent company of BUCS Federal Bank, is a financial holding company with approximately $150 million in assets at December 31, 2006. Community will acquire all outstanding shares of BUCS common stock for a total purchase price of approximately $24 million. The purchase price will consist of cash of approximately $10.5 million and common stock, with the number of shares issued to be determined near the date of consummation. Community currently anticipates the issuance of approximately 550,000 shares of common stock in the merger. The merger has been approved by regulatory authorities but is subject to approval by the shareholders of BUCS.
East Prospect State Bank - In September, 2006, Community and East Prospect State Bank (“East Prospect”) announced the signing of a definitive agreement pursuant to which CommunityBanks and East Prospect will combine under CommunityBanks’ charter. East Prospect is a Pennsylvania-chartered banking institution with approximately $60 million in assets at December 31, 2006. Under the terms of the Agreement, Community will acquire all of the outstanding shares of East Prospect common stock for a total purchase price of approximately $22 million. The purchase price will consist of cash of approximately $6 million and common stock, with the number of shares issued to be determined near the date of consummation. Community currently anticipates the issuance of approximately 645,000 shares of common stock in the merger. The merger has been approved by regulatory authorities but is subject to approval by the shareholders of East Prospect.
3. INVESTMENT SECURITIES:
The amortized cost and fair value of investment securities at December 31, 2006 and 2005 are as follows (in thousands):
| | | 2006 | | 2005 | |
| | | Amortized Cost | | Gross Unrealized Gains | | Gross Unrealized Losses | | Fair Value | | Amortized Cost | | Gross Unrealized Gains | | Gross Unrealized Losses | | Fair Value | |
| Securities Available-For-Sale | | | | | | | | | | | | | | | | | | | | | | | | | |
| Debt securities: | | | | | | | | | | | | | | | | | | | | | | | | | |
| U.S. Government and federal agency | | $ | 128,660 | | $ | 34 | | $ | (1,922 | ) | $ | 126,772 | | $ | 125,938 | | $ | --- | | $ | (2,814 | ) | $ | 123,124 | |
| Mortgage-backed, primarily federal agency | | | 204,887 | | | 361 | | | (3,276 | ) | | 201,972 | | | 186,871 | | | 102 | | | (4,160 | ) | | 182,813 | |
| State and municipal | | | 196,879 | | | 5,642 | | | (346 | ) | | 202,175 | | | 186,047 | | | 5,899 | | | (1,034 | ) | | 190,912 | |
| Corporate | | | 42,403 | | | 465 | | | (310 | ) | | 42,558 | | | 40,351 | | | 830 | | | (961 | ) | | 40,220 | |
| Total debt securities | | | 572,829 | | | 6,502 | | | (5,854 | ) | | 573,477 | | | 539,207 | | | 6,831 | | | (8,969 | ) | | 537,069 | |
| Equity securities | | | 63,035 | | | 151 | | | (597 | ) | | 62,589 | | | 68,909 | | | 789 | | | (1,212 | ) | | 68,486 | |
| Total securities available-for-sale | | $ | 635,864 | | $ | 6,653 | | $ | (6,451 | ) | $ | 636,066 | | $ | 608,116 | | $ | 7,620 | | $ | (10,181 | ) | $ | 605,555 | |
| | | | | | | | | | | | | | | | | | | | | | | | | | |
| Securities Held-to-Maturity | | | | | | | | | | | | | | | | | | | | | | | | | |
| | | | | | | | | | | | | | | | | | | | | | | | | | |
| State and municipal | | $ | 23,070 | | $ | 351 | | $ | (6 | ) | $ | 23,415 | | $ | 23,030 | | $ | --- | | $ | (467 | ) | $ | 22,563 | |
The following table shows gross unrealized losses and fair value, aggregated by investment category and length of time that individual securities have been in a continuous unrealized loss position, at December 31, 2006 and 2005 (in thousands):
| | | 2006 | | 2005 | |
| | | Less Than 12 Months | | 12 Months or More | | Less Than 12 Months | | 12 Months or More | |
| | | Fair Value | | Unrealized Losses | | Fair Value | | Unrealized Losses | | Fair Value | | Unrealized Losses | | Fair Value | | Unrealized Losses | |
| Securities Available-For-Sale | | | | | | | | | | | | | | | | | | | | | | | | | |
| Debt securities: | | | | | | | | | | | | | | | | | | | | | | | | | |
| U.S. Government and federal agency | | $ | 41,228 | | $ | (97 | ) | $ | 69,729 | | $ | (1,824 | ) | $ | 87,614 | | $ | (1,036 | ) | $ | 34,838 | | $ | (1,777 | ) |
| Mortgage-backed, primarily federal agency | | | 22,767 | | | (330 | ) | | 125,068 | | | (2,946 | ) | | 128,799 | | | (2,589 | ) | | 44,646 | | | (1,572 | ) |
| State and municipal | | | 20,826 | | | (154 | ) | | 13,036 | | | (192 | ) | | 37,103 | | | (722 | ) | | 8,806 | | | (312 | ) |
| Corporate | | | 5,116 | | | (32 | ) | | 12,884 | | | (278 | ) | | 9,270 | | | (396 | ) | | 6,116 | | | (565 | ) |
| Total debt securities | | | 89,937 | | | (613 | ) | | 220,717 | | | (5,240 | ) | | 262,786 | | | (4,743 | ) | | 94,406 | | | (4,226 | ) |
| Equity securities | | | 26,572 | | | (308 | ) | | 2,237 | | | (290 | ) | | 26,919 | | | (808 | ) | | 1,497 | | | (404 | ) |
| | | $ | 116,509 | | $ | (921 | ) | $ | 222,954 | | $ | (5,530 | ) | $ | 289,705 | | $ | (5,551 | ) | $ | 95,903 | | $ | (4,630 | ) |
| | | | | | | | | | | | | | | | | | | | | | | | | | |
| Securities Held-to-Maturity | | | | | | | | | | | | | | | | | | | | | | | | | |
| | | | | | | | | | | | | | | | | | | | | | | | | | |
| State and municipal | | $ | 353 | | $ | (1 | ) | $ | 1,451 | | $ | (5 | ) | $ | 22,563 | | $ | (467 | ) | $ | --- | | $ | --- | |
The above table for December 31, 2006, represents 152 investment securities (127 debt and 25 equity securities) where the current fair value is less than the related amortized cost. Management believes that the unrealized losses reflect changes in interest rates subsequent to the acquisition of specific securities and do not reflect any deterioration of the credit worthiness of the issuing entities. Generally, securities with an unrealized loss are investment grade debt securities with a maturity date and are expected to be paid in full at maturity or are equity securities with characteristics of debt securities, including a specific repricing date. As management has the ability and intent to hold securities for the foreseeable future, no declines are deemed to be other than temporary.
Community Banks, Inc. and Subsidiaries
NOTES TO CONSOLIDATED FINANCIAL STATEMENTS
3. INVESTMENT SECURITIES (Continued):
The amortized cost and fair value of debt securities by contractual maturity, at December 31, 2006, follows. Expected maturities will differ from contractual maturities because obligors may have the right to call or repay obligations with or without call or prepayment penalties.
| | | Available for Sale | | Held to Maturity | |
| | | Amortized Cost | | Fair Value | | Amortized Cost | | Fair Value | |
| | | (in thousands) |
| Within 1 year | | $ | 1,130 | | $ | 1,126 | | $ | --- | | $ | --- | |
| Over 1 year and through 5 years | | | 89,958 | | | 89,285 | | | --- | | | --- | |
| Over 5 years through 10 years | | | 81,626 | | | 80,785 | | | 511 | | | 512 | |
| Over 10 years | | | 195,228 | | | 200,309 | | | 22,559 | | | 22,903 | |
| | | | 367,942 | | | 371,505 | | | 23,070 | | | 23,415 | |
| Mortgage-backed securities | | | 204,887 | | | 201,972 | | | --- | | | --- | |
| | | $ | 572,829 | | $ | 573,477 | | $ | 23,070 | | $ | 23,415 | |
Gross investment security gains of $1.7 million and losses of $1.0 million were recognized in 2006. Gross gains of $1.4 million and losses of $1.1 million were recognized in 2005. Gross gains of $4.1 million and losses of $1.6 million were recognized in 2004. The tax provision applicable to these net realized gains amounted to $256,000 in 2006, $91,000 in 2005, and $865,000 in 2004.
At December 31, 2006 and 2005, investment securities with carrying amounts of $247 million and $176 million, respectively, were pledged to collateralize public deposits and for other purposes required or permitted by law. At December 31, 2006 and 2005, the carrying amount of securities pledged to secure repurchase agreements was $101 million and $84 million.
4. LOANS:
The composition of loans outstanding by lending classification as of December 31 is as follows (in thousands):
| | | 2006 | | 2005 | |
| Commercial | | $ | 865,355 | | $ | 782,946 | |
| Real estate-construction | | | 7,290 | | | 4,532 | |
| Real estate-mortgage | | | | | | | |
| Residential | | | 141,826 | | | 149,525 | |
| Commercial | | | 815,028 | | | 793,969 | |
| Consumer | | | 541,390 | | | 506,093 | |
| | | $ | 2,370,889 | | $ | 2,237,065 | |
Changes in the allowance for loan losses for years ended December 31 are as follows (in thousands):
| | | 2006 | | 2005 | | 2004 | |
| Balance, January 1 | | $ | 22,965 | | $ | 14,421 | | $ | 13,178 | |
| Provision for loan losses | | | 2,050 | | | 2,300 | | | 3,100 | |
| Loan charge-offs | | | (2,290 | ) | | (2,323 | ) | | (2,910 | ) |
| Recoveries | | | 901 | | | 1,499 | | | 1,053 | |
| Allowance established for acquired credit risk | | | --- | | | 7,068 | | | --- | |
| Balance, December 31 | | $ | 23,626 | | $ | 22,965 | | $ | 14,421 | |
The following table summarizes risk elements as of December 31 (in thousands):
| | | 2006 | | 2005 | |
| Loans on which accrual of interest has been discontinued | | $ | 12,545 | | $ | 9,060 | |
| Foreclosed real estate | | | 37 | | | 1,447 | |
| | | | | | | | |
| Total non-performing assets | | | 12,582 | | | 10,507 | |
| | | | | | | | |
| Loans past due 90 days or more and still accruing interest | | | 659 | | | 22 | |
| | | | | | | | |
| Total risk elements | | $ | 13,241 | | $ | 10,529 | |
The following is a summary of information pertaining to impaired loans as of December 31 (in thousands):
| | | 2006 | | 2005 | |
| Impaired loans without a valuation allowance | | $ | 6,215 | | $ | 3,120 | |
| Impaired loans with a valuation allowance | | | 4,336 | | | 4,164 | |
| Total impaired loans | | $ | 10,551 | | $ | 7,284 | |
| | | | | | | | |
| Valuation allowance related to impaired loans | | $ | 2,301 | | $ | 1,848 | |
Impaired loans are included in non-accrual loans. For the years ended December 31, 2006, 2005 and 2004, the average recorded investment in impaired loans approximated $8.9 million, $6.5 million, and $4.2 million. Interest recognized on impaired loans for the years ending December 31, 2006, 2005 and 2004 was not significant.
Loans within the scope of SOP 03-3 were purchased in Community’s acquisition of PennRock. Those loans had an outstanding contractual balance of $9.5 million and a carrying amount of $6.7 million at December 31, 2006, an outstanding contractual balance of $15.8 million and a carrying amount of $12.2 million at December 31, 2005, and an outstanding contractual balance of $16.8 million and a carrying amount of $13.2 million at July 1, 2005, the acquisition date of PennRock. Contractually required payments receivable totaled $22.8 million and cash flows expected to be collected totaled $20.2 million at the July 1, 2005 acquisition date. During 2006, $370,000 was accreted into interest income and $485,000 was recognized as other income from the sale of loans. There was no significant activity in accretable yield in 2005.
5. PREMISES AND EQUIPMENT:
Premises and equipment are comprised of the following as of December 31 (in thousands):
| | | 2006 | | 2005 | |
| | | | | | | | |
| Banking premises | | $ | 46,213 | | $ | 41,684 | |
| Furniture, fixtures, and equipment | | | 29,872 | | | 28,526 | |
| Leasehold improvements | | | 2,385 | | | 2,206 | |
| Construction-in-progress | | | 1,274 | | | 1,746 | |
| | | | 79,744 | | | 74,162 | |
| Less accumulated depreciation and amortization | | | (33,409 | ) | | (30,879 | ) |
| | | | | | | | |
| | | $ | 46,335 | | $ | 43,283 | |
Community Banks, Inc. and Subsidiaries
NOTES TO CONSOLIDATED FINANCIAL STATEMENTS
5. PREMISES AND EQUIPMENT (Continued):
Depreciation and amortization expense related to premises and equipment charged to operations totaled $4.7 million, $3.9 million, and $3.1 million in 2006, 2005, and 2004.
Certain branch offices, land, and equipment are leased under agreements which expire at varying dates through 2047. Most leases contain renewal provisions at Community’s option. Total rental expense was approximately $2.7 million in 2006, $1.9 million in 2005 and $1.2 million in 2004. Future minimum payments as of December 31, 2006 under noncancelable operating leases are as follows (in thousands):
| 2007 | | $ | 2,234 | |
| 2008 | | | 2,118 | |
| 2009 | | | 2,143 | |
| 2010 | | | 2,077 | |
| 2011 | | | 2,018 | |
| Thereafter | | | 29,551 | |
| | | | | |
| | | $ | 40,141 | |
| 6. | GOODWILL AND OTHER INTANGIBLE ASSETS: |
The following table summarizes changes in goodwill (in thousands):
| | | 2006 | | 2005 | | 2004 | |
| | | | |
| Balance at beginning of year | | $ | 244,827 | | $ | 3,570 | | $ | 3,231 | |
| Goodwill acquired | | | 1,556 | | | 241,257 | | | 339 | |
| Balance at end of year | | $ | 246,383 | | $ | 244,827 | | $ | 3,570 | |
The following table summarizes intangible assets at December 31 (in thousands):
| | | 2006 | | 2005 | |
| | | Gross | | Accumulated Amortization | | Net | | Gross | | Accumulated Amortization | | Net | |
| | | | | | | | | | | | | | | | | | | | |
| Core deposit | | $ | 14,236 | | $ | 4,128 | | $ | 10,108 | | $ | 14,236 | | $ | 1,786 | | $ | 12,450 | |
| Other | | | 3,478 | | | 563 | | | 2,915 | | | 2,069 | | | 265 | | | 1,804 | |
Total | | $ | 17,714 | | $ | 4,691 | | $ | 13,023 | | $ | 16,305 | | $ | 2,051 | | $ | 14,254 | |
Amortization of core deposit and other intangible assets was generally computed using accelerated methods over original amortization periods of ten to fifteen years. The remaining weighted average amortization period as of December 31, 2006, was approximately 8 years. Amortization expense for core deposit and other intangibles was $2.6 million for 2006, $1.4 million for 2005, and $161,000 for 2004. Estimated amortization expense for the next five years is as follows (in thousands):
| 2007 | | $ | 2,450 | |
| 2008 | | | 2,200 | |
| 2009 | | | 1,975 | |
| 2010 | | | 1,725 | |
| 2011 | | | 1,500 | |
7. DEPOSITS:
Deposits consisted of the following as of December 31 (in thousands):
| | | 2006 | | 2005 | |
| | | | | | | | |
| Non-interest bearing deposits | | $ | 368,329 | | $ | 375,835 | |
| Savings deposits | | | 229,311 | | | 243,174 | |
| Money market deposits | | | 250,733 | | | 288,418 | |
| NOW accounts | | | 399,299 | | | 310,517 | |
| Time deposits | | | 1,265,510 | | | 1,076,423 | |
| | | | | | | | |
| Total | | $ | 2,513,182 | | $ | 2,294,367 | |
The aggregate amount of time deposits with minimum denominations of $100,000 or more totaled $267 million and $191 million at December 31, 2006 and 2005.
At December 31, 2006 scheduled maturities of time deposits were as follows (in thousands):
| 2007 | | $ | 881,596 | |
| 2008 | | | 210,213 | |
| 2009 | | | 70,691 | |
| 2010 | | | 85,794 | |
| 2011 | | | 15,771 | |
| Thereafter | | | 1,445 | |
| | | | | |
| | | $ | 1,265,510 | |
8. SHORT-TERM BORROWINGS AND LONG-TERM DEBT:
Short-term borrowings consist of the following as of December 31 (in thousands):
| | | 2006 | | Rate | | 2005 | | Rate | | 2004 | | Rate | |
| | | | | | | | | | | | | | |
| Securities sold under agreements to repurchase | | $ | 72,201 | | | 4.87 | % | $ | 62,631 | | | 4.78 | % | $ | 25,472 | | | 1.81 | % |
| Treasury tax and loan note | | | 1,256 | | | 5.04 | % | | 1,804 | | | 3.98 | % | | 1,926 | | | 1.94 | % |
| FHLB borrowings | | | 35,470 | | | 5.41 | % | | 17,818 | | | 4.23 | % | | 19,718 | | | 2.21 | % |
| Other | | | --- | | | --- | | | 5,000 | | | 5.54 | % | | --- | | | --- | |
| | | $ | 108,927 | | | | | $ | 87,253 | | | | | $ | 47,116 | | | | |
Securities sold under agreements to repurchase, which are classified as secured borrowings, generally mature within one to four days from the transaction date. Securities sold under agreements to repurchase are reflected at the amount of cash received in connection with the transaction. Community may be required to provide additional collateral based on the fair value of the underlying securities.
The maximum short-term FHLB borrowings outstanding at any month-end during 2006, 2005, and 2004 was $35.5 million, $17.8 million, and $48.1 million; the average amounts outstanding during the year were $4.7 million, $1.5 million and $8.2 million; and the weighted average interest rate during the year approximated 4.95%, 4.23%, and 1.50%.
At December 31, 2006, additional amounts available for borrowing under non-FHLB line of credit arrangements totaled approximately $125 million. Additional amounts available for borrowing at the FHLB totaled $564 million at December 31, 2006.
Community Banks, Inc. and Subsidiaries
NOTES TO CONSOLIDATED FINANCIAL STATEMENTS
8. SHORT-TERM BORROWINGS AND LONG-TERM DEBT (Continued):
Long-term debt consists of the following as of December 31 (in thousands):
| | | 2006 | | 2005 | |
| Outstanding advances from the FHLB of Pittsburgh are currently fixed rate and mature from 2007 to 2016. The advances are collateralized by FHLB stock, certain first mortgage loans and both agency and mortgage-backed securities. The advance rates range from 2.70% to 6.35%, with a weighted average interest rate of 4.65%. Advances totaling $229 million are convertible advances. Under the terms of these arrangements, the FHLB retains the option to convert the advances from fixed to variable rate. If the FHLB were to convert their options, Community has the ability to prepay the advances at no penalty. At the current time no advances have been converted, and remain at a fixed rate of interest. | | $ | 314,795 | | $ | 430,428 | |
| | | | | | | | |
| Other long-term debt has an interest rate of 4% and matures in 2017. | | | 284 | | | 291 | |
| | | $ | 315,079 | | $ | 430,719 | |
Maturities on long-term debt at December 31, 2006 are as follows (in thousands):
| 2007 | | $ | 68,177 | |
| 2008 | | | 12,833 | |
| 2009 | | | 50,019 | |
| 2010 | | | 45,025 | |
| 2011 | | | 25,029 | |
| Thereafter | | | 113,996 | |
| | | $ | 315,079 | |
9. SUBORDINATED DEBT:
At December 31, 2006, Community had formed four wholly-owned, unconsolidated grantor trusts for the purpose of issuing $52 million of trust preferred securities to third-party investors. These trust preferred securities accrue and pay distributions at specified interest rates as provided in each indenture. The net proceeds from the issuance of these trust preferred securities were used by the trusts to facilitate the purchase of a similar amount of subordinated debentures from Community. The subordinated debentures are the sole assets of the trusts.
Community’s obligations under these debentures and related documents constitute a full and unconditional guarantee of the obligations of the trusts. The trust preferred securities are mandatorily redeemable upon the maturity of the subordinated debentures and may be subject to earlier redemptions as set forth in the indentures. Community has the right to redeem the subordinated debentures on or after specified dates at 100% of principal plus accrued interest.
The grantor trusts are not consolidated for financial reporting. As a result, the subordinated debentures issued by Community to the grantor trusts are reflected in the consolidated balance sheets under the caption “subordinated debt.” Community records interest expense on the subordinated debentures in the consolidated statements of income.
The following summarizes current trust preferred securities at December 31, 2006 (in thousands):
Issuance Trust | | Issuance date | | Preferred security amount | | Rate | | Repricing date | | Rate @ repricing | | Call date | | Maturity | |
CMTY Capital Trust I | | | December 2002 | | $ | 15,500 | | | 3-month LIBOR + 3.35 | % | | Quarterly | | | 3-month LIBOR + 3.35 | % | | 1/7/2008 | | | 1/7/2033 | |
CMTY Statutory Capital Trust II | | | December 2003 | | | 15,400 | | | 3-month LIBOR + 2.84 | % | | Quarterly | | | 3-month LIBOR + 2.84 | % | | 12/16/2008 | | | 12/16/2033 | |
CMTY Statutory Capital Trust III | | | January 2006 | | | 10,300 | | | 6.35 | % | | 3/15/2011 | | | 3-month LIBOR + 1.40 | % | | 3/15/2011 | | | 3/15/2036 | |
CMTY Statutory Capital Trust IV | | | January 2006 | | | 10,300 | | | 6.44 | % | | 3/15/2016 | | | 3-month LIBOR + 1.40 | % | | 3/15/2016 | | | 3/15/2036 | |
Community Banks, Inc. and Subsidiaries
NOTES TO CONSOLIDATED FINANCIAL STATEMENTS
10. INCOME TAXES:
The provision for income taxes for the years ended December 31 consists of the following (in thousands):
| | | 2006 | | 2005 | | 2004 | |
| Current | | $ | 14,152 | | $ | 4,513 | | $ | 5,360 | |
| Deferred | | | (251 | ) | | 1,559 | | | (481 | ) |
| | | $ | 13,901 | | $ | 6,072 | | $ | 4,879 | |
A reconciliation of income tax expense and the amounts which would have been recorded based upon statutory
rates (35%) is as follows (in thousands):
| | | 2006 | | 2005 | | 2004 | |
| Provision on pre-tax income at statutory rate | | $ | 19,226 | | $ | 11,100 | | $ | 9,337 | |
| Tax-exempt interest income | | | (4,017 | ) | | (3,740 | ) | | (3,409 | ) |
| Earnings on investment in insurance | | | (865 | ) | | (656 | ) | | (514 | ) |
| Other, net | | | (443 | ) | | (632 | ) | | (535 | ) |
| | | | | | | | | | | |
| Total provision for income taxes | | $ | 13,901 | | $ | 6,072 | | $ | 4,879 | |
The components of the net deferred tax asset, included in other assets as of December 31, were as follows (in thousands):
| | | 2006 | | 2005 | |
| Deferred tax assets: | | | | | |
| Allowance for loan losses | | $ | 8,268 | | $ | 8,038 | |
| Unfunded pension adjustment | | | 1,124 | | | 1,223 | |
| Deferred loan fees | | | 585 | | | 340 | |
| Deferred compensation | | | 2,092 | | | 1,856 | |
| Alternative minimum tax | | | --- | | | 900 | |
| Unrealized loss on available for sale securities | | | --- | | | 812 | |
| Other | | | 492 | | | 658 | |
| Total deferred tax assets | | | 12,561 | | | 13,827 | |
| | | | | | | | |
| Deferred tax liabilities | | | | | | | |
| Depreciation | | | 616 | | | 842 | |
| Unrealized gain on available for sale securities | | | 152 | | | --- | |
| Prepaid pension cost | | | 850 | | | 785 | |
| Prepaid expenses | | | 402 | | | 529 | |
| Purchase accounting adjustments | | | 629 | | | 802 | |
| Other | | | 290 | | | 505 | |
| Total deferred tax liabilities | | | 2,939 | | | 3,463 | |
| | | | | | | | |
| Net deferred tax asset | | $ | 9,622 | | $ | 10,364 | |
As of December 31, 2006 and 2005, Community had not established any valuation allowance against deferred tax assets since these tax benefits are realizable either through carry-back availability against prior years’ taxable income or the reversal of existing deferred tax liabilities.
11. COMMITMENTS AND CONTINGENCIES:
In the normal course of business, Community is a party to financial instruments with off-balance sheet risk to meet the financing needs of its customers and to reduce its own exposure to fluctuations in interest rates. These financial instruments include commitments to originate loans and standby letters of credit, which involve, to varying degrees, elements of credit and interest rate risk in excess of the amount recognized in the Consolidated Balance Sheets.
Financial instruments with off-balance sheet risk at December 31 are as follows (in thousands):
| | | Contract Amount | |
| | | 2006 | | 2005 | |
| Commitments to fund loans | | $ | 161,707 | | $ | 99,988 | |
| Unused lines of credit | | $ | 450,540 | | $ | 365,076 | |
| Standby letters of credit | | $ | 84,213 | | $ | 100,523 | |
| Unadvanced portions of construction loans | | $ | 138,525 | | $ | 129,845 | |
Substantially all of Community’s unused commitments to originate loans and unused lines of credit are at variable rates or will be provided at the prevailing fixed rate when the loans are originated or the lines are used.
Commitments to extend credit are agreements to lend to a customer provided there is no violation of any condition established in the contract. Commitments generally have fixed expiration dates or other termination clauses and may require payment of a fee. Lines of credit are similar to commitments as they have fixed expiration dates and are driven by certain criteria contained within the loan agreement. Lines of credit normally do not extend beyond a period of one year. Community evaluates each customer’s credit worthiness on a case-by-case basis. The amount of collateral obtained, if deemed necessary by Community upon extension of credit, is based on management’s credit evaluation of the borrower. Collateral held varies but may include accounts receivable, inventory, and plant and equipment and personal guarantees.
Standby letters of credit are conditional commitments issued by the subsidiary bank to guarantee the financial or performance obligation of a customer to a third party. Community’s exposure to credit loss in the event of nonperformance by the other party to the financial instrument for standby letters of credit is represented by the contractual amount of those instruments. The subsidiary bank uses the same credit policies in making conditional obligations as it does for on-balance sheet instruments. The majority of these standby letters of credit expire within the next twelve months. The credit risk involved in issuing letters of credit is essentially the same as that involved in extending other loan commitments. The subsidiary bank requires collateral and personal guarantees supporting these letters of credit as deemed necessary. Management believes that the proceeds obtained through a liquidation of such collateral and the enforcement of personal guarantees would be sufficient to cover the maximum potential amount of future payments required under the corresponding guarantees. The amount of the liability as of December 31, 2006 and 2005 for guarantees under standby letters of credit issued is not material.
Since a portion of the commitments are expected to expire without being drawn upon, the total commitment amount does not necessarily represent future cash requirements.
From time to time, Community and its subsidiaries may be defendants in legal proceedings relating to the conduct of their business. Most of such legal proceedings are a normal part of doing business, and in management’s opinion, the financial position and results of operations of Community would not be affected materially by the outcome of such legal proceedings.
Community Banks, Inc. and Subsidiaries
NOTES TO CONSOLIDATED FINANCIAL STATEMENTS
12. REGULATORY MATTERS:
The dividends that may be paid by CommunityBanks, the subsidiary bank, to Community are subject to certain legal and regulatory limitations. Under such limitations, the total amount available for payment of dividends by CommunityBanks was approximately $185 million at December 31, 2006. Dividends by CommunityBanks to Community would also be prohibited if payment would reduce CommunityBanks’ capital below applicable minimum capital requirements presented below.
Under current Federal Reserve regulations, CommunityBanks is limited in the amount it may loan to affiliates, including Community. Loans to a single affiliate may not exceed 10%, and the aggregate of loans to all affiliates may not exceed 20% of bank capital and surplus. At December 31, 2006, the maximum amount available for transfer from CommunityBanks to Community in the form of loans was approximately $253 million.
CommunityBanks and Community are subject to various regulatory capital requirements administered by banking regulators. Failure to meet minimum capital requirements can initiate certain mandatory - and possibly additional discretionary - actions by regulators that, if undertaken, could have a direct material effect on Community’s financial statements. Under capital adequacy guidelines and the regulatory framework for prompt corrective action, CommunityBanks must meet specific capital guidelines that involve quantitative measures of the bank’s assets, liabilities, and certain off-balance sheet items as calculated under regulatory accounting practices. CommunityBanks capital amounts and classification are also subject to qualitative judgments by the regulators about components, risk weightings and other factors.
Quantitative measures established by regulations to ensure capital adequacy require CommunityBanks and Community to maintain minimum amounts and ratios of total and Tier 1 capital to risk-weighted assets, and of Tier 1 capital to average assets (as defined in the regulations). Management believes, as of December 31, 2006, that CommunityBanks and Community meet the capital adequacy requirements to which they are subject.
As of December 31, 2006, the most recent notification from the Federal Deposit Insurance Corporation categorized CommunityBanks as “well capitalized” under the regulatory framework for prompt corrective action. In order to be “well capitalized”, the bank must maintain minimum total risk-based, Tier 1 risk-based, and Tier 1 leverage ratios as set forth in the following table. There are no conditions or events since December 31, 2006 that management believes have changed the bank’s classification.
The following tables present the total risk-based, Tier 1 risk-based and Tier 1 leverage requirements for Community and CommunityBanks as of December 31, 2006 and 2005 (dollars in thousands):
| | | As of December 31, 2006 | |
| | | Actual | | Regulatory Minimum | | “Well Capitalized” | |
| | | Amount | | Ratio | | Amount | | Ratio | | Amount | | Ratio | |
| Leverage ratio | | | | | | | | | | | | | | | | | | | |
| Community Banks, Inc. | | $ | 279,023 | | | 8.7 | % | $ | 127,740 | | | 4 | % | $ | 159,674 | | | 5 | % |
| Bank only | | $ | 265,765 | | | 8.4 | % | $ | 127,212 | | | 4 | % | $ | 159,015 | | | 5 | % |
| | | | | | | | | | | | | | | | | | | | |
| Tier 1 capital ratio | | | | | | | | | | | | | | | | | | | |
| Community Banks, Inc. | | $ | 279,023 | | | 10.7 | % | $ | 104,235 | | | 4 | % | $ | 156,353 | | | 6 | % |
| Bank only | | $ | 265,765 | | | 10.2 | % | $ | 104,118 | | | 4 | % | $ | 156,177 | | | 6 | % |
| | | | | | | | | | | | | | | | | | | | |
| Total risk-based capital ratio | | | | | | | | | | | | | | | | | | | |
| Community Banks, Inc. | | $ | 302,649 | | | 11.6 | % | $ | 208,470 | | | 8 | % | $ | 260,588 | | | 10 | % |
| Bank only | | $ | 289,391 | | | 11.1 | % | $ | 208,237 | | | 8 | % | $ | 260,296 | | | 10 | % |
| | | As of December 31, 2005 | |
| | | Actual | | Regulatory Minimum | | “Well Capitalized” | |
| | | Amount | | Ratio | | Amount | | Ratio | | Amount | | Ratio | |
| Leverage ratio | | | | | | | | | | | | | | | | | | | |
| Community Banks, Inc. | | $ | 249,692 | | | 8.2 | % | $ | 122,231 | | | 4 | % | $ | 152,789 | | | 5 | % |
| Bank only | | $ | 242,696 | | | 8.0 | % | $ | 121,777 | | | 4 | % | $ | 152,221 | | | 5 | % |
| | | | | | | | | | | | | | | | | | | | |
| Tier 1 capital ratio | | | | | | | | | | | | | | | | | | | |
| Community Banks, Inc. | | $ | 249,692 | | | 10.1 | % | $ | 99,207 | | | 4 | % | $ | 148,811 | | | 6 | % |
| Bank only | | $ | 242,696 | | | 9.8 | % | $ | 99,498 | | | 4 | % | $ | 149,247 | | | 6 | % |
| | | | | | | | | | | | | | | | | | | | |
| Total risk-based capital ratio | | | | | | | | | | | | | | | | | | | |
| Community Banks, Inc. | | $ | 272,657 | | | 11.0 | % | $ | 198,414 | | | 8 | % | $ | 248,018 | | | 10 | % |
| Bank only | | $ | 265,661 | | | 10.7 | % | $ | 198,996 | | | 8 | % | $ | 248,746 | | | 10 | % |
CommunityBanks is required to maintain reserves, in the form of cash and balances with the Federal Reserve Bank, against its deposit liabilities. The amounts of such reserves totaled $16.9 million at December 31, 2006 and $16.4 million at December 31, 2005.
In 2006, the FDIC announced a substantial increase in deposit insurance assessment rates to be effective January 1, 2007. At the same time, the FDIC also announced a One-Time Assessment Credit for those institutions that were in existence at December 31, 1996, and had paid a deposit insurance assessment prior to that date. Based upon the most current information available from the FDIC, it is expected that the annual assessment increase for the Bank will be in excess of $1 million per year at announced rates. For 2007, virtually all of the increase should be offset by the one-time credit. For years beyond 2007, anticipated rate changes are expected to increase the annual assessment expense, subject to any changes in prospective assessments that may be announced by the FDIC at some future date.
13. PENSION PLAN:
Community maintains a defined benefit pension plan for employees of a predecessor bank which covers less than 20% of the current aggregate employee base. Effective at the end of the third quarter of 2003, the Board of Directors of Community approved a curtailment of this pension plan.
The determination of pension expense for each of the last three years is as follows:
(dollars in thousands) | | 2006 | | 2005 | | 2004 | |
| Components of net periodic benefit cost: | | | | | | | |
| Interest cost on projected benefit obligation | | $ | 409 | | $ | 414 | | $ | 416 | |
| Expected return on plan assets | | | (469 | ) | | (448 | ) | | (249 | ) |
| Net amortization and deferral: | | | | | | | | | | |
| Net loss | | | 273 | | | 284 | | | 252 | |
| Gain (loss) deferred | | | --- | | | 16 | | | (161 | ) |
| Pension cost | | $ | 213 | | $ | 266 | | $ | 258 | |
| | | | | | | | | | | |
Increase (decrease) in minimum liability included in other comprehensive income | | $ | (282 | ) | $ | ( 82 | ) | $ | 377 | |
Community Banks, Inc. and Subsidiaries
NOTES TO CONSOLIDATED FINANCIAL STATEMENTS
13. PENSION PLAN (Continued):
At December 31, 2006, a net loss totaling $2.1 million, net of taxes, is recorded in accumulated other comprehensive income and is the only item not yet recognized as a component of net periodic pension cost. Approximately $250,000 of that balance is expected to be recognized as a component of net periodic pension expense in 2007.
The following table sets forth the pension plan’s funded status:
(dollars in thousands) | | 2006 | | 2005 | |
| | | | | | |
| Change in benefit obligation: | | | | | |
| Benefit obligation at beginning of year | | $ | 7,654 | | $ | 7,400 | |
| Interest cost | | | 409 | | | 414 | |
| Benefits paid | | | (399 | ) | | (379 | ) |
| Change in assumptions | | | (234 | ) | | 242 | |
| Experience (gain) loss | | | 121 | | | (23 | ) |
| Benefit obligation at end of year | | | 7,551 | | | 7,654 | |
| Change in plan assets: | | | | | | | |
| Fair value of plan assets at beginning of year | | | 6,401 | | | 5,794 | |
| Actual return on plan assets | | | 364 | | | 448 | |
| Employer contributions | | | 400 | | | 538 | |
| Benefits paid | | | (399 | ) | | (379 | ) |
| Fair value of plan assets at end of year | | | 6,766 | | | 6,401 | |
| | | | | | | | |
| Funded status, end of year | | | (785 | ) | | (1,253 | ) |
| Unrecognized net cost | | | 3,213 | | | 3,494 | |
| Recognition of additional minimum liability | | | (3,213 | ) | | (3,494 | ) |
| Accrued pension liability | | $ | (785 | ) | $ | (1,253 | ) |
| | | | | | | | |
| Amounts recognized in the consolidated balance sheet consist of: | | | |
| Prepaid benefit cost | | $ | 2,428 | | $ | 2,241 | |
| Accumulated other comprehensive income adjustment | | | (3,213 | ) | | (3,494 | ) |
| Net accrued pension liability | | $ | (785 | ) | $ | (1,253 | ) |
| | | | | | | | |
| Accumulated benefit obligation | | $ | 7,551 | | $ | 7,654 | |
Assumptions used in the determination of the funded status of the plan at December 31, 2006 and 2005 and pension expense for each of the last three years were as follows:
| | | 2006 | | 2005 | | 2004 | |
| Discount rate | | | 5.75 | % | | 5.50 | % | | 5.75 | % |
| Expected long-term return on plan assets | | | 7.5 | % | | 7.5 | % | | 8.5 | % |
| Annual salary increase | | | n/a | | | n/a | | | n/a | |
Estimated future benefit payments are as follows (in thousands):
| 2007 | | $ | 406 | |
| 2008 | | | 408 | |
| 2009 | | | 432 | |
| 2010 | | | 443 | |
| 2011 | | | 445 | |
| Years 2012 - 2016 | | | 2,528 | |
Community maintains a pension investment policy which addresses the assumptions required for the various aspects of plan management and plan accounting. Plan assumptions are determined by management pursuant to the guidance provided by the investment policy and through consultation with plan actuaries.
Targeted allocations of plan assets have been developed as a component of the investment policy and are responsive to the investment goals, risk management practices and the relationship between plan assets and benefit obligations. The current investment style favors an emphasis on growth given that the plan has been curtailed and a substantial portion of the benefited employees are not receiving pension benefits at the current time. Pursuant to that policy, the following targeted allocations and actual asset allocations at the end of each of the last two years are provided.
| | | Target Asset | | | | At December 31, | |
| | | Allocation | | Range | | 2006 | | 2005 | |
| Equity | | | 60 | % | | 50-70 | % | | 67 | % | | 61 | % |
| Fixed income | | | 35 | % | | 25-45 | % | | 28 | % | | 31 | % |
| Cash and/or equivalents | | | 5 | % | | 2-10 | % | | 5 | % | | 8 | % |
| | | | | | | | | | | | | | |
| | | | 100 | % | | | | | | | | | |
The expected long-term rate of return on plan assets is based upon historical returns of specified benchmark investment categories that are weighted by targeted allocations of plan assets. The following presentation provides an indication of targeted asset allocation, which is specified within the investment policy, and a comparison to historical annualized returns that provide support for the assumed expected long term rate of return on plan assets.
| | | Targeted Asset Allocation | | Benchmarks | | 10 yrs (12/31/06) Annualized Returns | | 15 yrs (12/31/06) Annualized Returns | |
| Equities | | | 60 | % | | S&P 500 | | | 8.42 | % | | 10.64 | % |
| Fixed income | | | 35 | % | | Lehman Bros Aggregate | | | 6.24 | % | | 6.50 | % |
| Cash equivalents | | | 5 | % | | 3 mo T-Bill | | | 3.76 | % | | 3.99 | % |
| | | | | | | | | | | | | | |
| Total pension | | | 100 | % | | | | | 7.42 | % | | 8.86 | % |
The plan currently maintains no investment in the common stock of Community. Contributions to the plan during 2007 are currently estimated to be $400,000. The Corporation anticipates no adverse funding issues associated with the plan. The 2003 curtailment of the plan is expected to limit future increases in pension expense as eligible employees are no longer accruing benefits associated with future service.
Community Banks, Inc. and Subsidiaries
NOTES TO CONSOLIDATED FINANCIAL STATEMENTS
14. STOCK-BASED PLANS:
Under long-term incentive plans (the “Plans”) approved by Community’s stockholders from time to time, Community may grant to employees, executive officers and directors stock awards in the form of Incentive Stock Options, Nonqualified Stock Options or Stock Appreciation Rights. The stock options can be granted at prices not less than the fair market value in the case of Incentive Stock Options and not less than 80% of the fair market value in the case of Nonqualified Stock Options.
Prior to January 1, 2006, Community elected to follow Accounting Principals Board (“APB”) Opinion No. 25, “Accounting for Stock Issued to Employees,” and related interpretations in accounting for its stock-based compensation and to provide the disclosures required under SFAS No. 123, “Accounting for Stock Based Compensation.” Accordingly, no compensation expense was recognized for stock option grants issued prior to January 1, 2006, under the Plans.
The following pro forma information for the years ended December 31, 2005 and 2004, shows net income and earnings per basic and diluted share if compensation expense for Community’s employee stock options had been determined on a fair value method of accounting (in thousands, except per share data).
| | | December 31, 2005 | | December 31, 2004 | |
| | | | | | |
| Net income, as reported | | $ | 25,641 | | $ | 21,798 | |
| Deduct: Total stock-based compensation | | | | | | | |
| expense determined under fair value based | | | | | | | |
| method for all awards, net of related tax effect | | | (1,488 | ) | | (1,418 | ) |
| Pro forma net income | | $ | 24,153 | | $ | 20,380 | |
| | | | | | | | |
| Earnings per share: | | | | | | | |
| Basic - as reported | | $ | 1.38 | | $ | 1.70 | |
| Basic - pro forma | | $ | 1.30 | | $ | 1.59 | |
| | | | | | | | |
| Diluted - as reported | | $ | 1.35 | | $ | 1.65 | |
| Diluted - pro forma | | $ | 1.27 | | $ | 1.54 | |
Effective January 1, 2006, Community adopted SFAS No. 123(R), “Share-Based Payments,” using the modified prospective method. Under the modified prospective method, compensation expense recognized beginning January 1, 2006, includes all share-based payments granted prior to, but not yet vested as of December 31, 2005, and all share-based payments granted subsequent to December 31, 2005. For share-based payments granted prior to December 31, 2005, expense recognition was based upon the grant-date fair value estimated in accordance with the original provisions of SFAS No. 123. For share-based payments granted after December 31, 2005, expense recognition was based on the grant-date fair value estimated in accordance with the provisions of SFAS No. 123(R). Prior periods were not restated to reflect the impact of adopting the new standard.
As a result of adopting SFAS No. 123(R) on January 1, 2006, Community’s income before taxes and net income were, respectively, $655,000 and $606,000 lower for the year ended December 31, 2006, than if Community had continued to use APB Opinion No. 25 to account for stock-based compensation. Basic and diluted earnings per share were decreased by $.02 for the year ended December 31, 2006.
Community receives a tax deduction for certain stock option exercises during the period the options are exercised, generally for the excess of the related stock price over the exercise price of the options. Prior to adopting SFAS No. 123(R), all tax benefits resulting from the exercise of stock options were reported as operating cash flows on the consolidated statement of cash flows. In accordance with SFAS No. 123(R), reporting of tax benefits from the exercise of stock options has been revised to report them as financing cash flows on the consolidated statement of cash flows. For the year ended December 31, 2006, $498,000 was reported as financing cash flows rather than operating cash flows.
Net cash proceeds from the exercise of stock options totaled $1.7 million for the year ended December 31, 2006.
At December 31, 2006, there was $1.2 million of unrecognized compensation expense related to share-based payments which will be recognized over 2 years.
Community uses the Black-Scholes option pricing model to estimate the fair value of stock-based awards. Awards were estimated with the following assumptions:
| | | 2006 | | 2005 | | 2004 | |
| Dividend yield | | | 2.7 | % | | 2.7 | % | | 2.4 | % |
| Volatility | | | 26 | % | | 23 | % | | 33 | % |
| Risk-free interest rate | | | 4.5 | % | | 4.4 | % | | 4.0 | % |
| Expected life (years) | | | 6.3 | | | 7.4 | | | 7.8 | |
| Resulting grant-date fair value | | $ | 6.85 | | $ | 6.28 | | $ | 9.00 | |
These assumptions are based on multiple factors, including historical exercise patterns of employees in relatively homogeneous groups with respect to exercise and post-vesting employment termination behaviors, expected future exercising patterns for the same homogeneous groups and the historical volatility of Community’s stock price.
As of December 31, 2006, 607,000 shares were authorized but not awarded under the Plans. The stock options generally vest from six months to five years from the date of grant, and expire no later than ten years after the date of grant. The changes in outstanding options are as follows:
| | | 2006 | | 2005 | | 2004 | |
| | | Shares Under Option (000’s) | | Weighted Average Exercise Price Per Share | | Shares Under Option (000’s) | | Weighted Average Exercise Price Per Share | | Shares Under Option (000’s) | | Weighted Average Exercise Price Per Share | |
| Balance, beginning of year | | | 1,110 | | $ | 20.03 | | | 1,126 | | $ | 19.47 | | | 1,077 | | $ | 17.05 | |
| Issued | | | 255 | | | 27.41 | | | 14 | | | 25.72 | | | 203 | | | 27.51 | |
| Exercised | | | (126 | ) | | 13.57 | | | (268 | ) | | 14.11 | | | (149 | ) | | 12.70 | |
| Exchanged in merger | | | --- | | | --- | | | 239 | | | 15.74 | | | --- | | | --- | |
| Forfeited | | | (1 | ) | | 25.57 | | | (1 | ) | | 19.04 | | | (5 | ) | | 21.96 | |
| Balance, end of year | | | 1,238 | | $ | 22.20 | | | 1,110 | | $ | 20.03 | | | 1,126 | | $ | 19.47 | |
At December 31, 2006, outstanding stock options consist of the following:
| | | Options Outstanding | | Options Exercisable | |
Range of exercise prices per share | | Vested (in thousands) | | Unvested (in thousands) | | Weighted Average Exercise Price Per Share | | Weighted Average Remaining Contractual Life in Years | | Number Exercisable (in thousands) | | Weighted Average Exercise Price Per Share | |
| Under $8.69 | | | 33 | | | --- | | $ | 7.68 | | | 1.1 | | | 33 | | $ | 7.68 | |
| $8.69 - $14.47 | | | 208 | | | --- | | $ | 13.40 | | | 3.0 | | | 208 | | $ | 13.40 | |
| $14.48 - $17.37 | | | 59 | | | --- | | $ | 14.80 | | | 1.7 | | | 59 | | $ | 14.80 | |
| $17.38 - $20.26 | | | 265 | | | 26 | | $ | 19.14 | | | 5.5 | | | 265 | | $ | 19.05 | |
| $20.27 - $28.95 | | | 393 | | | 254 | | $ | 27.82 | | | 6.8 | | | 393 | | $ | 28.09 | |
| $7.33 - $28.95 | | | 958 | | | 280 | | $ | 22.20 | | | 5.5 | | | 958 | | $ | 20.87 | |
Community Banks, Inc. and Subsidiaries
NOTES TO CONSOLIDATED FINANCIAL STATEMENTS
14. STOCK-BASED PLANS (Continued):
At December 31, 2006, outstanding options, substantially all of which are expected to vest, have a weighted average remaining contractual life of 5.5 years and an aggregate intrinsic value of $7.1 million. Vested and currently exercisable options have a weighted average remaining contractual life of 5.3 years and an aggregate intrinsic value of $6.8 million. Total intrinsic value of options exercised was $1.6 million for the year ended December 31, 2006.
Weighted-average grant-date fair value of unvested options during the year ended December 31, 2006, were as follows:
| | | Shares Under Option | | Weighted-average grant-date fair value | |
| Unvested options, December 31, 2005 | | | 81 | | $ | 5.59 | |
| Granted | | | 255 | | | 3.37 | |
| Vested | | | (55 | ) | | 3.37 | |
| Canceled | | | (1 | ) | | 6.54 | |
| Unvested options, December 31, 2006 | | | 280 | | $ | 3.54 | |
Community has a dividend reinvestment plan for shareholders under which additional shares of Community common stock may be purchased at a 5% discount off market prices with reinvested dividends and voluntary cash payments. Approximately 1.4 million shares of common stock have been reserved for this plan and approximately 1.1 million shares remain unissued. Purchases of Community common stock pursuant to this plan totaled 3,000 shares in 2006, 155,000 shares in 2005, and 45,000 shares in 2004.
Community has an Employee Stock Purchase Plan under which shares of Community common stock may be purchased at a 10% discount off market prices with voluntary cash payments. Approximately 116,000 shares of common stock have been reserved for this plan and approximately 63,000 shares remain unissued. Purchases of Community common stock pursuant to this plan totaled 14,000 shares in 2006, 11,000 shares in 2005, and 9,000 shares in 2004.
15. RELATED PARTY TRANSACTIONS:
Certain directors and their business affiliates (defined as the beneficial ownership of at least a 10 percent interest), executive officers and their families are indebted to CommunityBanks for loans made in the ordinary course of business. In the opinion of management, such loans are consistent with sound banking practices and are within applicable regulatory lending limitations. The aggregate dollar amount of these loans was $21.9 million and $23.7 million at December 31, 2006 and 2005. During 2006, $1.9 million of new advances were made and repayments totaled $3.7 million.
Certain directors are owners or employees of entities that provide services to Community in the ordinary course of business. Fees for those services totaled $507,000 in 2006, $431,000 in 2005, and $334,000 in 2004.
Community has employment agreements with its executive officers that, among other provisions, provide for certain payments to the executives if they terminate their employment for certain reasons, primarily a change in the nature of their duties, a reduction in compensation, or a change in control of Community.
16. FAIR VALUES OF FINANCIAL INSTRUMENTS:
The following methodologies and assumptions were used by Community to estimate its fair value disclosures:
Cash and due from banks, interest-bearing deposits, and federal funds sold: The fair values for cash and due from banks, interest-bearing deposits, and federal funds sold is deemed to be the same as those assets’ carrying amounts.
Investment securities: Fair values for investment securities are based on quoted market prices, where available. If quoted market prices are not available, fair values are based on quoted market prices of comparable instruments. The carrying value of Federal Home Loan Bank stock approximates fair value based on the redemption provision of the Federal Home Loan Bank.
Accrued interest receivable and payable: The fair values of accrued interest receivable and payable approximate their carrying amounts.
Loans: For variable-rate loans that reprice frequently with no significant change in credit risk, fair value equals carrying amount. The fair values of all other loans held in portfolio and loans held for sale are estimated by discounting the future cash flows using comparable current rates at which similar loans would be made to borrowers with similar credit risk.
Deposits: The fair values of demand and savings deposits equal their carrying values. The carrying amounts for variable rate money market accounts approximate their fair values at the reporting date. Fair values for fixed-rate certificates of deposit are estimated by discounting expected future cash flows using rates currently offered for similar deposits.
Short-term borrowings: The fair values of short-term borrowings approximate their carrying amounts.
Long-term debt and subordinated debentures: The fair values of Community’s long-term fixed rate borrowings are estimated using discounted cash flows analyses, based on rates available to Community for similar types of borrowings. The carrying amounts for variable rate subordinated debentures approximate their fair values at the reporting date.
Off-balance sheet instruments: Fair values for off-balance sheet, credit-related financial instruments are based on fees currently charged to enter into similar agreements, taking into account the remaining terms of the agreements and the counterparties’ credit standing.
The following table summarizes the carrying amounts and fair values of financial instruments at December 31, 2006 and 2005:
| | | 2006 | | 2005 | |
| | | Carrying Amount | | Estimated Fair Value | | Carrying Amount | | Estimated Fair Value | |
| | | (in thousands) | |
Financial assets: | | | | | | | | | | | | | |
| Cash and due from banks, interest-bearing deposits, and federal funds sold | | $ | 77,169 | | $ | 77,169 | | $ | 81,243 | | $ | 81,243 | |
| Investment securities | | | 659,136 | | | 659,481 | | | 628,585 | | | 628,118 | |
| Net loans | | | 2,347,263 | | | 2,336,467 | | | 2,214,100 | | | 2,207,179 | |
| Accrued interest receivable | | | 14,537 | | | 14,537 | | | 13,316 | | | 13,316 | |
| | | | | | | | | | | | | | |
Financial liabilities: | | | | | | | | | | | | | |
| Deposits | | $ | 2,513,182 | | $ | 2,451,375 | | $ | 2,294,367 | | $ | 2,292,606 | |
| Short-term borrowings | | | 108,927 | | | 108,927 | | | 87,253 | | | 87,253 | |
| Long-term debt | | | 315,079 | | | 316,150 | | | 430,719 | | | 435,065 | |
| Subordinated debt | | | 51,548 | | | 49,745 | | | 30,928 | | | 30,928 | |
| Accrued interest payable | | | 7,034 | | | 7,034 | | | 6,301 | | | 6,301 | |
| Off-balance sheet instruments | | | --- | | | --- | | | --- | | | --- | |
Community Banks, Inc. and Subsidiaries
NOTES TO CONSOLIDATED FINANCIAL STATEMENTS
17. CONDENSED FINANCIAL INFORMATION OF COMMUNITY BANKS, INC. (PARENT ONLY)
(in thousands) | | 2006 | | 2005 | |
| | | | |
Condensed Balance Sheets: | | | | | | | |
| Cash | | $ | 1,916 | | $ | 1,579 | |
| Interest bearing deposits in other banks | | | 784 | | | 53 | |
| Investment securities, available for sale | | | 2,704 | | | 2,338 | |
| Investment in banking subsidiary | | | 522,770 | | | 499,508 | |
| Investment in nonbank subsidiaries | | | 6,807 | | | 6,440 | |
| Other assets | | | 3,146 | | | 3,382 | |
| Total assets | | $ | 538,127 | | $ | 513,300 | |
| | | | | | | | |
| Short-term borrowings | | $ | --- | | $ | 5,000 | |
| Long-term debt | | | 51,548 | | | 30,928 | |
| Other liabilities | | | 418 | | | 699 | |
| Stockholders’ equity | | | 486,161 | | | 476,673 | |
| Total liabilities and stockholders’ equity | | $ | 538,127 | | $ | 513,300 | |
| | | 2006 | | 2005 | | 2004 | |
Condensed Statements of Income: | | | | | | | |
| Dividends from: | | | | | | | | | | |
| Banking subsidiary | | $ | 24,000 | | $ | 19,000 | | $ | --- | |
| Nonbank subsidiaries | | | --- | | | 2,263 | | | --- | |
| Other income (expense) | | | (3,059 | ) | | (2,693 | ) | | (1,215 | ) |
| Income(loss) before equity in undistributed earnings of subsidiaries | | | 20,941 | | | 18,570 | | | (1,215 | ) |
| Equity in undistributed earnings of: | | | | | | | | | | |
| Banking subsidiary | | | 19,361 | | | 8,915 | | | 21,861 | |
| Nonbank subsidiaries | | | 729 | | | (1,844 | ) | | 1,152 | |
| | | | 20,090 | | | 7,071 | | | 23,013 | |
| Net income | | $ | 41,031 | | $ | 25,641 | | $ | 21,798 | |
| | | | | | | | | | | |
Condensed Statements of Cash Flows: | | | | | | | | | | |
Operating activities: | | | | | | | | | | |
| Net income | | $ | 41,031 | | $ | 25,641 | | $ | 21,798 | |
| Adjustments to reconcile net cash provided by operating activities: | | | | | | |
| Undistributed earnings of: | | | | | | | | | | |
| Banking subsidiary | | | (19,361 | ) | | (8,915 | ) | | (21,861 | ) |
| Nonbank subsidiaries | | | (729 | ) | | 1,844 | | | (1,152 | ) |
| Other, net | | | 832 | | | 709 | | | 391 | |
| Net cash provided (used) by operating activities | | | 21,773 | | | 19,279 | | | (824 | ) |
Investing activities: | | | | | | | | | | |
| Purchases of investment securities | | | (2,785 | ) | | (1,073 | ) | | (2,706 | ) |
| Proceeds from maturities and sales of investment securities | | | 1,931 | | | --- | | | 18,661 | |
| Payments for investments in and advances to subsidiaries | | | (913 | ) | | (3,966 | ) | | --- | |
| Investment in unconsolidated trust subsidiaries | | | (620 | ) | | --- | | | --- | |
| Net cash provided (used) by investing activities | | | (2,387 | ) | | (5,039 | ) | | 15,955 | |
Financing activities: | | | | | | | | | | |
| Net change in short-term borrowings | | | (5,000 | ) | | 5,000 | | | (2,000 | ) |
| Proceeds from issuance of subordinated debt | | | 20,620 | | | --- | | | --- | |
| Proceeds from issuance of common stock | | | 1,929 | | | 8,012 | | | 2,308 | |
| Payments to acquire treasury stock | | | (17,922 | ) | | (16,489 | ) | | (4,151 | ) |
| Cash dividends and cash paid in lieu of fractional shares | | | (18,676 | ) | | (13,440 | ) | | (8,273 | ) |
| Net cash used by financing activities | | | (19,049 | ) | | (16,917 | ) | | (12,116 | ) |
| | | | | | | | | | | |
| Net change in cash and cash equivalents | | | 337 | | | (2,677 | ) | | 3,015 | |
| Cash and cash equivalents at beginning of period | | | 1,579 | | | 4,256 | | | 1,241 | |
| Cash and cash equivalents at end of period | | $ | 1,916 | | $ | 1,579 | | $ | 4,256 | |
18. QUARTERLY RESULTS OF OPERATIONS (UNAUDITED):
The following is a summary of the quarterly results of operations for the years ended December 31, 2006 and 2005:
| | | Three Months Ended | |
| | | 2006 | | 2005 | |
| | | Dec. 31 | | Sept. 30 | | June 30 | | Mar. 31 | | Dec. 31 | | Sept. 30 (1) | | June 30 | | Mar. 31 | |
| | | (dollars in thousands, except per share data) | |
| Interest income | | $ | 51,364 | | $ | 50,443 | | $ | 48,938 | | $ | 46,889 | | $ | 45,242 | | $ | 43,478 | | $ | 27,390 | | $ | 26,183 | |
| Interest expense | | | 25,273 | | | 23,505 | | | 21,931 | | | 20,025 | | | 18,593 | | | 17,081 | | | 12,481 | | | 11,493 | |
| Net interest income | | | 26,091 | | | 26,938 | | | 27,007 | | | 26,864 | | | 26,649 | | | 26,397 | | | 14,909 | | | 14,690 | |
| Provision for loan losses | | | 650 | | | 250 | | | 650 | | | 500 | | | 600 | | | 400 | | | 750 | | | 550 | |
| Net interest income after provision for loan losses | | | 25,441 | | | 26,688 | | | 26,357 | | | 26,364 | | | 26,049 | | | 25,997 | | | 14,159 | | | 14,140 | |
| Investment security gains, net | | | 415 | | | 28 | | | 6 | | | 283 | | | 12 | | | 29 | | | 167 | | | 51 | |
| Mortgage banking activities | | | 591 | | | 533 | | | 580 | | | 468 | | | 631 | | | 660 | | | 548 | | | 515 | |
| Other income | | | 8,194 | | | 8,279 | | | 7,957 | | | 7,633 | | | 7,120 | | | 7,177 | | | 4,883 | | | 4,644 | |
| Other expenses | | | 22,482 | | | 21,172 | | | 20,698 | | | 20,533 | | | 20,180 | | | 20,836 | | | 13,189 | | | 12,659 | |
| Merger, conversion and restructuring expenses | | | --- | | | --- | | | --- | | | --- | | | --- | | | 248 | | | 7,957 | | | --- | |
| Income (loss) before income taxes | | | 12,159 | | | 14,356 | | | 14,202 | | | 14,215 | | | 13,632 | | | 12,779 | | | (1,389 | ) | | 6,691 | |
| Income taxes | | | 2,759 | | | 3,798 | | | 3,698 | | | 3,646 | | | 2,671 | | | 2,447 | | | (250 | ) | | 1,204 | |
| Net income (loss) | | $ | 9,400 | | $ | 10,558 | | $ | 10,504 | | $ | 10,569 | | $ | 10,961 | | $ | 10,332 | | $ | (1,139 | ) | $ | 5,487 | |
| | | | | | | | | | | | | | | | | | | | | | | | | | |
| Basic earnings (loss) per share | | $ | 0.40 | | $ | 0.45 | | $ | 0.44 | | $ | 0.44 | | $ | 0.45 | | $ | 0.42 | | $ | (0.09 | ) | $ | 0.43 | |
| Diluted earnings (loss) per share | | $ | 0.40 | | $ | 0.45 | | $ | 0.44 | | $ | 0.44 | | $ | 0.45 | | $ | 0.42 | | $ | (0.09 | ) | $ | 0.42 | |
| Cash dividends declared | | $ | 0.20 | | $ | 0.20 | | $ | 0.20 | | $ | 0.19 | | $ | 0.19 | | $ | 0.18 | | $ | 0.18 | | $ | 0.16 | |
| (1) Results beginning with the quarter ended September 30, 2005 include PennRock acquired July 1, 2005 |
19. MERGER, CONVERSION AND RESTRUCTURING EXPENSES
Primarily during the second quarter of 2005, Community recognized expenses for the prepayment of FHLB advances in conjunction with: a balance sheet restructuring; the merger with PennRock Financial Services Corp.; and the conversion of its core operating system. The expenses totaled $8.2 million and appear on a separately captioned line in non-interest expenses on the Consolidated Statements of Income, and include the following:
(a) A prepayment penalty of $6 million was incurred as a result of retiring $60 million of FHLB advances that had a weighted average cost in excess of Community’s incremental wholesale borrowing rate and conversion features that could result in maturities beyond the stated maturity at terms not necessarily favorable to Community.
(b) Merger-related expenses totaling $1.3 million were incurred for the following: severance and retention payments to Community employees being displaced in the merger, $570,000; contract cancellations and closing of duplicate facilities, $555,000; other, $210,000.
(c) Conversion expenses incurred totaled approximately $800,000 and related to training, asset dispositions, and other costs incurred in connection with the conversion and updating of Community’s core operating system.
Report of Independent Registered Public Accounting Firm
To the Board of Directors and Stockholders
Community Banks, Inc.
Harrisburg, Pennsylvania
We have audited the accompanying consolidated balance sheets of Community Banks, Inc. and subsidiaries as of December 31, 2006 and 2005, and the related consolidated statements of income, changes in stockholders’ equity, and cash flows for each of the years in the three-year period ended December 31, 2006. These consolidated financial statements are the responsibility of the Company’s management. Our responsibility is to express an opinion on these consolidated financial statements based on our audits.
We conducted our audits in accordance with the standards of the Public Company Accounting Oversight Board (United States). Those standards require that we plan and perform the audits to obtain reasonable assurance about whether the financial statements are free of material misstatement. An audit includes examining, on a test basis, evidence supporting the amounts and disclosures in the financial statements. An audit also includes assessing the accounting principles used and significant estimates made by management, as well as evaluating the overall financial statement presentation. We believe that our audits provide a reasonable basis for our opinion.
In our opinion, the consolidated financial statements referred to above present fairly, in all material respects, the consolidated financial position of Community Banks, Inc. and its subsidiaries as of December 31, 2006 and 2005, and the results of their operations and their cash flows for each of the years in the three-year period ended December 31, 2006 in conformity with accounting principles generally accepted in the United States of America.
As discussed in Note 1 to the consolidated financial statements, Community Banks, Inc. changed its method of accounting for its defined benefit pension plan and for share-based payments in 2006.
We also have audited, in accordance with the standards of the Public Company Accounting Oversight Board (United States), the effectiveness of Community Banks, Inc.’s internal control over financial reporting as of December 31, 2006, based on criteria established in Internal Control—Integrated Framework issued by the Committee of Sponsoring Organizations of the Treadway Commission (COSO), and our report dated March 5, 2007 expressed an unqualified opinion on management’s assessment of internal control over financial reporting and an unqualified opinion on the effectiveness of internal control over financial reporting.
/s/ Beard Miller Company LLP
Beard Miller Company LLP | |
| Harrisburg, Pennsylvania | |
| March 5, 2007 | |
Under the supervision and with the participation of Community’s management, including its Chief Executive Officer and Chief Financial Officer, Community has evaluated the effectiveness of its disclosure controls and procedures as of December 31, 2006. Based upon this evaluation, the Chief Executive Officer and Chief Financial Officer have concluded that Community’s disclosure controls and procedures are adequate and effective to ensure that material information relating to Community and its consolidated subsidiaries is made known to them by others within those entities, particularly during the period in which this report was prepared.
During 2006, management reported two unrelated deficiencies in internal controls involving loan disbursement processes and procedures. Given the potential for material misstatements that could arise from the potential ineffective functioning of loan disbursement controls, management expanded its review and testing of internal controls throughout 2006. Pursuant to its review of these separate events in periods subsequent to their detection, management identified no material losses related to either of these identified deficiencies in internal control. Additionally, these deficiencies were not deemed to meet the criteria necessary for classification as a “material weakness” as of December 31, 2006.
The first deficiency involved the disbursement of loan proceeds in a manner that did not comply with loan approval policy. This event was initially reported in Community’s Form 10-Q for the quarter ended March 31, 2006. As a consequence, management initiated an extensive investigation of controls over loan disbursements and the loan authorization functions to ensure that all proceeds were distributed in a manner consistent with the terms and conditions of the loan approval process. Management instituted a plan of remediation that involved the establishment of various controls designed to detect or prevent any material misstatement of financial information. This plan was reviewed and approved by Community’s Disclosure Committee and was reviewed and approved by executive management and the Audit Committee of the Board of Directors. In addition, management conducted subsequent testing of the effectiveness of these controls in the second half of 2006 and identified no material weaknesses in internal control over loan disbursements and related loan approvals.
In connection with the filing of Community’s Form 10-Q for the quarter ended September 30, 2006, management identified an additional, but unrelated, occurrence involving a deficiency in internal controls over the disbursement of loan proceeds in connection with a construction loan advance. This isolated occurrence resulted in the distribution of loan proceeds in a manner that was inconsistent with current loan policy involving construction loan disbursements. This deficiency was identified after the end of the third quarter but prior to the filing of Form 10-Q for the quarter ended September 30, 2006. During the fourth quarter, management conducted a more thorough review of the internal controls over loan disbursements for construction loan advances. Based upon this review, management determined that adequate compensating controls were in place to ensure that there was a remote likelihood that any material misstatement of the financial statements would not have been prevented or detected. Consequently, the identified deficiency did not meet the criteria necessary for classification as a material weakness. This deficiency, however, was reported to the Disclosure Committee, executive management, and the Audit Committee of the Board of Directors.
There have been no changes in Community’s internal control over financial reporting (as such term is defined in Rules 13a-15(f) and 15d-1(f) under the Exchange Act) during the most recent fiscal quarter that have materially affected, or are reasonably likely to materially affect, Community’s internal control over financial reporting.
Because of inherent limitations, our disclosure controls and procedures may not prevent or detect misstatements. A control system, no matter how well conceived and operated, can provide only reasonable, not absolute, assurance that the objectives of the control system are met. Because of the inherent limitations in all control systems, no evaluation of controls can provide absolute assurance that all control issues and instances of fraud, if any, have been detected.
Management’s report on internal controls can be found on the following page of this report.
Management’s Report on Internal Controls
The management of Community Banks, Inc. is responsible for designing, implementing, documenting, and maintaining an adequate system of internal control over financial reporting. An adequate system of internal control over financial reporting encompasses the processes and procedures that have been established by management to:
| · | maintain records that accurately reflect the company’s transactions; |
| · | prepare financial statement and footnote disclosures in accordance with GAAP that can be relied upon by external users; |
| · | prevent and detect unauthorized acquisition, use, or disposition of the company’s assets that could have a material effect on the financial statements. |
Management is also responsible to perform an annual evaluation of the system of internal control over financial reporting, including an assessment of the effectiveness of that system. Management’s assessment is based upon the control framework established by the Committee of Sponsoring Organizations of the Treadway Commission (COSO). The COSO framework identifies five defining characteristics of a system of internal control as follows: an appropriate control environment; an adequate risk assessment process; sufficient control activities; satisfactory communication of pertinent information; and proper monitoring controls.
Management performed an assessment of the effectiveness of its internal control over financial reporting in accordance with the COSO framework. As part of this process, consideration was given to the potential existence of deficiencies in either the design or operating effectiveness of controls. Based on this assessment, management believes that Community maintained effective internal controls over financial reporting, including disclosure controls and procedures, as of December 31, 2006. Furthermore, during the conduct of its assessment, management identified no material weakness in its financial reporting control system.
The Board of Directors of Community, through its Audit Committee, provides oversight to management’s conduct of the financial reporting process. The Audit Committee, which is composed entirely of independent directors, is also responsible to recommend the appointment of independent public accountants. The Audit Committee also meets with management, the internal audit staff, and the independent public accountants throughout the year to provide assurance as to the adequacy of the financial reporting process and to monitor the overall scope of the work performed by the internal audit staff and the independent public accountants.
The consolidated financial statements of Community have been audited by Beard Miller Company LLP, an independent registered public accounting firm, who was engaged to express an opinion as to the fairness of presentation of such financial statements. In connection therewith, Beard Miller Company LLP is required to issue an attestation report on management’s assessment of internal control over financial reporting and, in addition, is required to form its own opinion as to the effectiveness of those controls. Their opinion on the fairness of the financial statement presentation, and their attestation and opinion on internal controls over financial reporting are included herein.
/s/ Eddie L. Dunklebarger /s/ Donald F. Holt
Chairman of the Board, President and Executive Vice President and
Chief Executive Officer Chief Financial Officer
Community Banks, Inc. • 777 East Park Drive, 2nd Floor • Harrisburg, PA 17111 • Phone 717-920-5800
Report of Independent Registered Public Accounting Firm
To the Board of Directors and Stockholders
Community Banks, Inc.
Harrisburg, Pennsylvania
We have audited management’s assessment, included in the accompanying Management’s Report on Internal Control, that Community Banks, Inc. maintained effective internal control over financial reporting as of December 31, 2006, based on criteria established in Internal Control—Integrated Framework issued by the Committee of Sponsoring Organizations of the Treadway Commission (COSO). Community Banks Inc.’s management is responsible for maintaining effective internal control over financial reporting and for its assessment of the effectiveness of internal control over financial reporting. Our responsibility is to express an opinion on management’s assessment and an opinion on the effectiveness of the Company’s internal control over financial reporting based on our audit.
We conducted our audit in accordance with the standards of the Public Company Accounting Oversight Board (United States). Those standards require that we plan and perform the audit to obtain reasonable assurance about whether effective internal control over financial reporting was maintained in all material respects. Our audit included obtaining an understanding of internal control over financial reporting, evaluating management’s assessment, testing and evaluating the design and operating effectiveness of internal control, and performing such other procedures as we considered necessary in the circumstances. We believe that our audit provides a reasonable basis for our opinion.
A company’s internal control over financial reporting is a process designed to provide reasonable assurance regarding the reliability of financial reporting and the preparation of financial statements for external purposes in accordance with generally accepted accounting principles. A company’s internal control over financial reporting includes those policies and procedures that (1) pertain to the maintenance of records that, in reasonable detail, accurately and fairly reflect the transactions and dispositions of the assets of the company; (2) provide reasonable assurance that transactions are recorded as necessary to permit preparation of financial statements in accordance with generally accepted accounting principles, and that receipts and expenditures of the company are being made only in accordance with authorizations of management and directors of the company; and (3) provide reasonable assurance regarding prevention or timely detection of unauthorized acquisition, use, or disposition of the company’s assets that could have a material effect on the financial statements.
Because of its inherent limitations, internal control over financial reporting may not prevent or detect misstatements. Also, projections of any evaluation of effectiveness to future periods are subject to the risk that controls may become inadequate because of changes in conditions, or that the degree of compliance with the policies or procedures may deteriorate.
In our opinion, management’s assessment that Community Banks Inc. maintained effective internal control over financial reporting as of December 31, 2006, is fairly stated, in all material respects, based on criteria established in Internal Control—Integrated Framework issued by the Committee of Sponsoring Organizations of the Treadway Commission (COSO). Also in our opinion, Community Banks, Inc. maintained, in all material respects, effective internal control over financial reporting as of December 31, 2006, based on criteria established in Internal Control—Integrated Framework issued by the Committee of Sponsoring Organizations of the Treadway Commission (COSO).
We have also audited, in accordance with the standards of the Public Company Accounting Oversight Board (United States), the consolidated balance sheets and the related consolidated statements of income, changes in stockholders’ equity, and cash flows of Community Banks Inc., and our report dated March 5, 2007 expressed an unqualified opinion.
/s/ Beard Miller Company LLP
Beard Miller Company LLP | |
| Harrisburg, Pennsylvania | |
| March 5, 2007 | |
PART III
Incorporated by reference to the Corporation’s definitive Proxy Statement for its 2007 Annual Meeting of Shareholders, which will be filed on or before April 30, 2007.
Copies of Community’s Code of Ethics for the Chief Executive Officer and Financial Professionals are available on Community’s website, www.communitybanks.com, or by writing to Donald F. Holt, EVP/CFO, Community Banks, Inc., 777 East Park Drive, Harrisburg, PA 17111.
Incorporated by reference to the Corporation’s definitive Proxy Statement for its 2007 Annual Meeting of Shareholders, which will be filed on or before April 30, 2007.
Incorporated by reference to the Corporation’s definitive Proxy Statement for its 2007 Annual Meeting of Shareholders, which will be filed on or before April 30, 2007.
Incorporated by reference to the Corporation’s definitive Proxy Statement for its 2007 Annual Meeting of Shareholders, which will be filed on or before April 30, 2007.
Information concerning the fees billed by our independent auditor and the nature of services comprising the fees for each of the two most recent fiscal years in each of the following categories: (i) audit fees, (ii) audit - related fees, (iii) tax fees and (iv) all other fees, is set forth under the caption “Relationship with Independent Certified Public Accountants” in the Corporation’s definitive Proxy Statement for its 2007 Annual Meeting of Shareholders and is incorporated herein by reference.
Information concerning our Audit Committee’s policies and procedures pertaining to pre-approval of audit and non-audit services rendered by our independent auditor is set forth in the Audit Committee segment of the Corporation’s definitive Proxy Statement for its 2007 Annual Meeting of Shareholders and is incorporated herein by reference.
PART IV
| (a) | The following documents are filed as part of this report. |
| | 1. | Financial Statements - The following consolidated financial statements of Community Banks, Inc. and Subsidiaries are incorporated herein by reference in response to Item 8 above: |
| | | |
| | (i) | Consolidated Balance Sheets at December 31, 2006 and 2005 |
| | (ii) | Consolidated Statements of Income for the Years Ended December 31, 2006, 2005 and 2004 |
| | (iii) | Consolidated Statements of Changes in Stockholders’ Equity for the Years Ended December 2006, 2005, and 2004. |
| | (iv) | Consolidated Statements of Cash Flows for the Years Ended December 31, 2006, 2005 and 2004. |
| | (v) | Notes to Consolidated Financial Statements |
| | (vi) | Report of Beard Miller Company LLP, Independent Registered Public Accounting Firm |
| | | |
| | 2. | Financial Statements Schedules - All financial statement schedules for which provision is made in the applicable accounting regulations of the Securities and Exchange Commission are not required under the related instructions or are inapplicable and have therefore been omitted. |
| | | |
| | 3. | Exhibits |
| | | |
| | 2.1 | Amended and Restated Agreement by and between Community Banks, Inc. and BUCS Financial Corp, dated as of February 1, 2007, not including schedules. Community will furnish the omitted schedules to the Commission upon request. (Incorporated by reference to Appendix A to the prospectus/proxy statement forming a part of Community’s registration statement number 333-139152 on Form S-4/A filed with the Commission on February 1, 2007) |
| | 2.2 | Agreement and Plan of Merger by and between Community Banks, Inc. and CommunityBanks and East Prospect State Bank dated as of September 12, 2006 and amended and restated as of December 29, 2006 not including schedules. Community will furnish the omitted schedules to the Commission upon request. (Incorporated by reference to Annex A to the proxy statement/prospectus forming a part of Community’s registration statement number 333-139301 on Form S-4/A filed with the Commission on January 26, 2007 |
| | 2.3 | Merger Agreement by and between PennRock Financial Services Corp. and Community Banks, Inc., dated November 16, 2004, not including schedules. Community will furnish the omitted schedules to the Securities and Exchange Commission upon request. (Incorporated by reference to Exhibit 10.1 to Community’s Current Report on Form 8-K, filed with the Commission on November 22, 2004) |
| | 3(i) | Amended and Restated Articles of Incorporation. (Incorporated by reference to Appendix A to Community’s 2006 Proxy Statement filed with the Commission on March 31, 2006).) |
| | 3(ii) | Amended Bylaws (Incorporated by reference to Exhibit 3(ii), attached to Community’s Current Report on Form 8-K, filed with the Commission on December 14, 2006) |
| | 4 | Instruments defining the rights of the holders of trust capital securities and sold by Community in December 2002, December 2003 and January 2006 are not attached, as the amount of such securities is less than 10% of the consolidated assets of Community and its subsidiaries, and the securities have not been registered. Community agrees to provide copies of such instruments to the Commission upon request. |
| | 10.1 | 2000 Directors’ Stock Option Plan (Incorporated by reference to Exhibit 4 to Community’s registration statement no. 333-37232 on Form S-8, filed on May 17, 2000) * |
| | 10.2 | 1998 Long-Term Incentive Plan (Incorporated by reference to Exhibit 4 to Community’s registration statement no. 333-57121 on Form S-8 filed on June 18, 1998) * |
| | 10.3 | Form of Stock Option Agreement - Directors Stock Option Plan (Incorporated by reference to Exhibit 10.3 to Community’s Annual Report on Form 10-K for the year ended December 31, 2002, filed with the Commission on March 28, 2003) * |
| | 10.4 | Form of Stock Option Agreement - Long-Term Incentive Plan (Incorporated by reference to Exhibit 10.4 to Community’s Annual Report on Form 10-K for the year ended December 31, 2002, filed with the Commission on March 28, 2003) * |
| | 10.5 | Form of First Amendment to Stock Option Agreement entered into with Messrs. Dunklebarger, Holt, Lawley, Leo and Seibert (Incorporated by reference to Exhibit 10.1 to Community’s Current Report on Form 8-K, filed with the Commission on January 31, 2007) * |
| | 10.6 | Employment Agreement for Eddie L. Dunklebarger (Incorporated by reference to Exhibit 10.1 to Community’s Quarterly Report on Form 10-Q for the quarter ended September 30, 2004, filed with the Commission on November 9, 2004) * |
| | 10.7 | Employment Agreement for Donald F. Holt (Incorporated by reference to Exhibit 10.2 to Community’s Quarterly Report on Form 10-Q for the quarter ended September 30, 2004, filed with the Commission on November 9, 2004) * |
| | | |
| | 10.8 | Employment Agreement for Robert W. Lawley (Incorporated by reference to Exhibit 10.3 to Community’s Quarterly Report on Form 10-Q for the quarter ended September 30, 2004, filed with the Commission on November 9, 2004) * |
| | 10.9 | Employment Agreement for Anthony N. Leo (Incorporated by reference to Exhibit 10.4 to Community’s Quarterly Report on Form 10-Q for the quarter ended September 30, 2004, filed with the Commission on November 9, 2004) * |
| | 10.10 | Employment Agreement for Jeffrey M. Seibert (Incorporated by reference to Exhibit 10.5 to Community’s Quarterly Report on Form 10-Q for the quarter ended September 30, 2004, filed with the Commission on November 9, 2004) * |
| | 10.11 | Amended and Restated Salary Continuation Agreement of Eddie L. Dunklebarger (Incorporated by reference to Exhibit 10.1 to Community’s Quarterly Report on Form 10-Q for the quarter ended March 31, 2004, filed with the Commission on May 10, 2004) * |
| | 10.12 | Salary Continuation Agreement of Donald F. Holt (Incorporated by reference to Exhibit 10.2 to Community’s Quarterly Report on Form 10-Q for the quarter ended March 31, 2004, filed with the Commission on May 10, 2004) * |
| | 10.13 | Amended and Restated Salary Continuation Agreement of Robert W. Lawley (Incorporated by reference to Exhibit 10.3 to Community’s Quarterly Report on Form 10-Q for the quarter ended March 31, 2004, filed with the Commission on May 10, 2004) * |
| | 10.14 | Amended and Restated Salary Continuation Agreement of Anthony N. Leo (Incorporated by reference to Exhibit 10.4 to Community’s Quarterly Report on Form 10-Q for the quarter ended March 31, 2004, filed with the Commission on May 10, 2004) * |
| | 10.15 | Amended and Restated Salary Continuation Agreement of Jeffrey M. Seibert (Incorporated by reference to Exhibit 10.5 to Community’s Quarterly Report on Form 10-Q for the quarter ended March 31, 2004, filed with the Commission on May 10, 2004) * |
| | 10.16 | Rights Agreement between Community Banks, Inc. and CommunityBanks, dated February 28, 2002 (Incorporated by reference to Exhibit 1 to Community’s registration on Form 8-A, filed on February 27, 2002) |
| | 10.17 | Community Banks, Inc. 401(k) Plan (Incorporated by reference to Exhibit 10.15 to Community’s Annual Report on Form 10-K for the year ended December 31, 2002, filed with the Commission on March 28, 2003) * |
| | 10.18 | Survivor Income Agreement, with Split Dollar Addendum thereto, of Eddie L. Dunklebarger (Incorporated by reference to Exhibit to 3.2, attached to Community’s Quarterly Report on Form 10-Q for the quarter ended September 30, 2003) * |
| | 10.19 | Survivor Income Agreement, with Split Dollar Addendum thereto, of Donald F. Holt (Incorporated by reference to Exhibit to 10.6, attached to Community’s Quarterly Report on Form 10-Q for the quarter ended March 31, 2004) * |
| | 10.20 | Survivor Income Agreement, with Split Dollar Addendum thereto, of Robert W. Lawley (Incorporated by reference to Exhibit to 3.2, attached to Community’s Quarterly Report on Form 10-Q for the quarter ended September 30, 2003) * |
| | 10.21 | Survivor Income Agreement, with Split Dollar Addendum thereto, of Anthony N. Leo (Incorporated by reference to Exhibit to 3.2, attached to Community’s Quarterly Report on Form 10-Q for the quarter ended September 30, 2003) * |
| | 10.22 | Survivor Income Agreement, with Split Dollar Addendum thereto, of Jeffrey M. Seibert (Incorporated by reference to Exhibit to 3.2, attached to Community’s Quarterly Report on Form 10-Q for the quarter ended September 30, 2003) * |
| | 10.23 | Employment and Consulting Agreement with Melvin Pankuch (Incorporated by reference to Exhibit 10.7 to Community’s registration statement on Form S-4, filed on April 1, 2005) * |
| | 10.24 | Community Banks, Inc. Substitute PennRock Financial Services Corp. Stock Incentive Plan of 2002 (Incorporated by reference to Exhibit 4 to Community’s registration statement no. 333-126508 on Form S-8, filed on July 11, 2005) * |
| | 10.25 | Community Banks, Inc. Substitute PennRock Financial Services Corp. Omnibus Stock Plan (Incorporated by reference to Exhibit 4 to Community’s registration statement no. 333-126507 on Form S-8, filed on July 11, 2005) * |
| | 21 | Subsidiaries of the Registrant (See Part I, Item 1 - “Business Overview” and “Non-banking Subsidiaries”) |
| | 23.1 | Consent of Independent Registered Public Accounting Firm - Beard Miller Company LLP |
| | 24 | Powers of Attorney (included on signature page) |
| | 31.1 | Rule 13a-14(a)/15d-14(a) Certification (Chief Executive Officer) |
| | 31.2 | Rule 13a-14(a)/15d-14(a) Certification (Chief Financial Officer) |
| | 32 | Section 1350 Certifications (Chief Executive Officer and Chief Financial Officer) |
* identifies a management contract or compensatory plan or arrangement
| (b) | Exhibits - The exhibits required to be filed as part of this report are submitted as a separate section of this report. |
| (c) | Financial Statements Schedules - None required. |
Pursuant to the requirements of Section 13 or 15(d) of the Securities Exchange Act of 1934, the Registrant has duly caused this report to be signed on its behalf by the undersigned, thereunto duly authorized.
Community Banks, Inc.
By: /S/ (Eddie L. Dunklebarger)
(Eddie L. Dunklebarger)
Chairman of the Board, President, Chief Executive Officer and Director
Date: March 16, 2007
Pursuant to the requirements of the Securities Exchange Act of 1934, this report has been signed below by the following persons on behalf of the registrant and in the capacities and on the dates indicated.
KNOW ALL MEN BY THESE PRESENTS, that each person whose signature appears below constitutes and appoints Eddie L. Dunklebarger, Donald F. Holt, Timothy A. Hoy, and each of them, his or her true and lawful attorney-in-fact, as agent with full power of substitution and resubstitution for him or her and in his or her name, place and stead, in any and all capacity, to sign any or all amendments to this report and to file the same, with all exhibits thereto, and other documents in connection therewith, with the Securities and Exchange Commission, granting unto such attorney-in-fact and agent full power and authority to do and perform each and every act and thing requisite and necessary to be done in and about the premises, as fully and to all intents and purposes as they might or could do in person, hereby ratifying and confirming all that said attorneys-in-fact and agents, or their substitute or substitutes, may lawfully do or cause to be done by virtue hereof.
| /S/ | (Eddie L. Dunklebarger) | President, Chairman, Chief Executive Officer (Principal Executive Officer) and Director | 3/16/07 |
| | (Eddie L. Dunklebarger) | |
| | | | |
| /S/ | (Donald F. Holt) | Executive Vice President and Chief Financial Officer (Principal Financial Officer and Principal Accounting Officer) | 3/16/07 |
| | (Donald F. Holt) | |
| | | | |
| /S/ | (Ronald E. Boyer) | Director | 3/16/07 |
| | (Ronald E. Boyer) | | |
| | | | |
| /S/ | (Sandra J, Bricker) | Director | 3/16/07 |
| | (Sandra J. Bricker) | | |
| | | | |
| /S/ | (Peter DeSoto) | Director | 3/16/07 |
| | (Peter DeSoto) | | |
| | | | |
| /S/ | (Aaron S. Kurtz) | Director | 3/16/07 |
| | (Aaron S. Kurtz) | | |
| | | | |
| /S/ | (Scott J. Newkam) | Director | 3/16/07 |
| | (Scott J. Newkam) | | |
| | | | |
| /S/ | (Melvin Pankuch) | Director | 3/16/07 |
| | (Melvin Pankuch) | | |
| | | | |
| /S/ | (Robert W. Rissinger) | Director | 3/16/07 |
| | (Robert W. Rissinger) | | |
| | | | |
| /S/ | (Christine Sears) | Director | 3/16/07 |
| | (Christine Sears) | | |
| | | | |
| /S/ | (Allen Shaffer) | Director | 3/16/07 |
| | (Allen Shaffer) | | |
| | | | |
| | | | |
| | | | |
| | | | |
| /S/ | (James A. Ulsh) | Director | 3/16/07 |
| | (James A. Ulsh) | | |
| | | | |
| /S/ | (Dale M. Weaver) | Director | 3/16/07 |
| | (Dale M. Weaver) | | |
| | | | |
| /S/ | (Glenn H. Weaver) | Director | 3/16/07 |
| | (Glenn H. Weaver) | | |
| | | | |
| /S/ | (Robert K. Weaver) | Director | 3/16/07 |
| | (Robert K. Weaver) | | |
(This page intentionally blank)