UNITED STATES
SECURITIES AND EXCHANGE COMMISSION
Washington, D.C. 20549
FORM N-CSR
Certified Shareholder Report of
Registered Management Investment Companies
Investment Company Act File Number: 811-02333
New Perspective Fund
(Exact Name of Registrant as Specified in Charter)
333 South Hope Street
Los Angeles, California 90071
(Address of Principal Executive Offices)
Registrant's telephone number, including area code: (213) 486-9200
Date of fiscal year end: September 30
Date of reporting period: March 31, 2014
Michael W. Stockton
New Perspective Fund
333 South Hope Street
Los Angeles, California 90071
(Name and Address of Agent for Service)
Copies to:
Mark D. Perlow
K&L Gates LLP
Four Embarcadero Center, Suite 1200
San Francisco, California 94111
(Counsel for the Registrant)
ITEM 1 – Reports to Stockholders

 | | New Perspective Fund®
Semi-annual report
for the six months ended
March 31, 2014 |
New Perspective Fund seeks to provide long-term growth of capital. Future income is a secondary objective.
This fund is one of more than 40 offered by one of the nation’s largest mutual fund families, American Funds, from Capital Group. For more than 80 years, Capital has invested with a long-term focus based on thorough research and attention to risk.
Fund results shown in this report, unless otherwise indicated, are for Class A shares at net asset value. If a sales charge (maximum 5.75%) had been deducted, the results would have been lower. Results are for past periods and are not predictive of results for future periods. Current and future results may be lower or higher than those shown. Share prices and returns will vary, so investors may lose money. Investing for short periods makes losses more likely. Investments are not FDIC-insured, nor are they deposits of or guaranteed by a bank or any other entity, so they may lose value. For current information and month-end results, visit americanfunds.com.
Here are the average annual total returns on a $1,000 investment with all distributions reinvested for periods ended March 31, 2014:
| Class A shares | | 1 year | | | 5 years | | | 10 years | |
| | | | | | | | | | | | | |
| Reflecting 5.75% maximum sales charge | | | 12.79% | | | | 17.41% | | | | 8.24% | |
For other share class results, visit americanfunds.com and americanfundsretirement.com.
The total annual fund operating expense ratio was 0.79% for Class A shares as of the prospectus dated December 1, 2013.
Investment results assume all distributions are reinvested and reflect applicable fees and expenses. When applicable, investment results reflect fee waivers, without which results would have been lower. Visit americanfunds.com for more information.
Investing outside the United States may be subject to risks, such as currency fluctuations, periods of illiquidity and price volatility. These risks may be heightened in connection with investments in developing countries. Refer to the fund prospectus and the Risk Factors section of this report for more information on these and other risks associated with investing in the fund.

A selective
approach drives
fund results.
Fellow investors:
For the six months ended March 31, 2014, New Perspective Fund gained 8.8% for those who reinvested the 30.0 cents per share dividend paid in December 2013. This return exceeded the 8.5% increase recorded by the fund’s primary benchmark, the unmanaged MSCI All Country World Index (ACWI), which measures returns of equity markets in 44 countries.
The fund also outpaced its peers, as measured by the Lipper Global Funds Average, which climbed 8.5%. As seen in the table below, the fund has surpassed its benchmarks over longer time frames as well.
Global markets advance
World markets ended the period with strong gains as an accelerating U.S. economy and improved corporate earnings supported higher valuations in the U.S., Europe and much of Asia. U.S. markets were robust through year-end, supported by stronger-than-anticipated job growth in the private sector and rising consumer confidence. Despite earlier misgivings, investors cheered the Federal Reserve’s announcement of
Results at a glance
For periods ended March 31, 2014, with all distributions reinvested
| | | Cumulative total returns | | Average annual total returns |
| | | 6 months | | 1 year | | 5 years | | 10 years | | Lifetime
(since 3/13/73) |
| | | | | | | | | | | |
| New Perspective Fund (Class A shares) | | | 8.8 | % | | | 19.7 | % | | | 18.8 | % | | | 8.9 | % | | | 12.6 | % |
| MSCI ACWI* | | | 8.5 | | | | 16.6 | | | | 17.8 | | | | 7.0 | | | | — | † |
| Standard & Poor’s 500 Composite Index* | | | 12.5 | | | | 21.8 | | | | 21.1 | | | | 7.4 | | | | 10.4 | |
| Lipper Global Funds Average | | | 8.5 | | | | 17.9 | | | | 18.0 | | | | 6.6 | | | | 10.7 | |
| * | The market indexes are unmanaged and, therefore, have no expenses. Investors cannot invest directly in an index. |
| † | The MSCI All Country World Index began operations on December 31, 1987. Results reflect dividends net of withholding taxes. |
a $10 billion monthly reduction in its bond buying program — a move widely interpreted as a positive sign that the U.S. economy has improved to a point where stimulus can be gradually withdrawn. Growth was more moderate in the second half of the reporting period, as bitter winter weather slowed retail sales and construction activity. Nevertheless, major market indexes touched all-time highs in February on strong corporate earnings and M&A activity. In all, U.S.* equities advanced 12.3%.
Gains in Europe (10.1%) were supported by central bank stimulus and slow but steady economic growth. Signs of improvement in Europe’s weakest economies also boosted investor sentiment as markets in Italy, Portugal and Ireland posted healthy gains. In Japan, a weakening yen and vows by the Bank of Japan to continue expanding its monetary easing policy could not overcome the headwind of slower-than-expected economic growth and worries over a sales tax hike slated for April 2014. Having risen sharply during the first three quarters of 2013, Japanese equities finished 3.4% lower. Returns in emerging markets (1.4%) were modest, tempered by a slowdown in manufacturing activity in China and increased political tensions between Ukraine and Russia.
All sectors rise — but results vary
Amid an improving outlook in most of the developed world, all 10 sectors that make up the MSCI ACWI posted gains for the period. Health care recorded the biggest advance, followed by information technology and utilities. Materials trailed as demand from emerging markets — China in particular — waned. Consumer stocks also lagged, but industrials did better, finishing slightly ahead of the market.
A focus on companies drives results
Our focus on fundamental, company-by-company analysis helped the fund outpace the broader markets. Stock selection was supported by a diverse portfolio. Health care firms made a meaningful contribution to results. In particular, European pharmaceutical companies Novo Nordisk (34.4%), Bayer (14.7%) and Roche (11.5%) all notched strong gains, helped by burgeoning sales of popular new drugs and an improving outlook for innovative treatments for many of the world’s unmet medical conditions.
Industrials were another area of strength, most notably airlines. Delta and United Continental both realized impressive increases, climbing 46.9% and 45.3%, respectively. Historically, U.S. airlines have not been viewed as well-managed, high-quality operations, making them appear at odds with the companies that tend to characterize the fund. However, they illustrate our ability to be nimble and identify areas of the market that can benefit from more cyclical trends. In the current environment, the airlines are improving their balance sheets, reducing their debt and planning for greater demand as consumers return to strength. They are also beginning to refurbish and replace aging fleets. We believe these dynamics should provide a tailwind for other companies in the portfolio, including electrical systems makers and engine manufacturers.
| * | Unless otherwise noted, country stock returns are based on MSCI indexes, expressed in U.S. dollars, and assume the reinvestment of dividends. Results reflect dividends net of withholding taxes, except the MSCI USA Index, which reflects dividends gross of withholding taxes. |
Other sizable contributors to the fund included investments in the information technology sector. Shares of Google (27.2%) hit an all-time high as the internet search giant’s revenue and profits accelerated during the fourth quarter. Microsoft (23.1%) also rose. For the most part, businesses tied to the continued expansion of mobile computing/technology performed well, including Avago Technologies (49.4%), Texas Instruments (17.1%) and Taiwan Semiconductor Manufacturing (15.2%). Conversely, Dutch semiconductor equipment maker ASML trailed, falling 6.0%.
As a group, consumer discretionary stocks were decidedly mixed. Companies that benefit from the migration of consumers to online shopping, including Priceline (17.9%) and Expedia (40.0%), soared on growth in travel bookings. Amazon (7.6%) advanced but trailed the broader market after reporting sluggish sales volume growth during the holiday season. Also delivering positive returns among the fund’s top 10 holdings were South Africa–headquartered media conglomerate Naspers (19.3%) and Home Depot (4.3%).
The power of vision and patience
Sometimes the reasons for investing in a company can be fairly straightforward. In many instances, though, we are required to envision a company’s potential for future success. The ability of our analysts and managers to look beyond current market conditions to identify companies that could thrive in tomorrow’s global landscape, combined with the patience to see investment theses unfold, has been a powerful driver of fund results over the long term.
Today’s complex global backdrop underscores the need for a nuanced, research-driven approach to investing. We will, as always, be selective. But more importantly, we will be patient, recognizing that it often takes more than a quarter, or a year, for companies with global outlooks and ambitions to be fully appreciated by the market.
We thank you for your continuing commitment to New Perspective Fund.
Sincerely,

Robert W. Lovelace
President

Michael Thawley
Vice Chairman of the Board
May 8, 2014
For current information about the fund, visit americanfunds.com.
| Summary investment portfolio March 31, 2014 | unaudited |
| Country diversification | | Percent of
net assets |
| United States | | | 44.6 | % |
| Euro zone* | | | 15.5 | |
| United Kingdom | | | 8.9 | |
| Japan | | | 6.0 | |
| Denmark | | | 4.6 | |
| Switzerland | | | 3.9 | |
| Canada | | | 1.8 | |
| South Africa | | | 1.6 | |
| Hong Kong | | | 1.6 | |
| Other countries | | | 5.5 | |
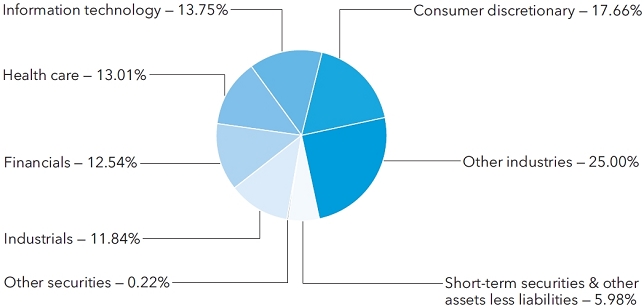
| Short-term securities & other assets less liabilities | | | 6.0 | |
| * | Countries using the euro as a common currency; those represented in the fund’s portfolio are Belgium, Finland, France, Germany, Ireland, the Netherlands and Spain. |
| Common stocks 93.80% | | Shares | | | Value
(000) | | | Percent of
net assets | |
| Consumer discretionary 17.66% | | | | | | | | | | | | |
| Amazon.com, Inc.1 | | | 4,149,000 | | | $ | 1,396,221 | | | | 2.49 | % |
| Home Depot, Inc. | | | 8,808,100 | | | | 696,985 | | | | 1.24 | |
| Naspers Ltd., Class N2 | | | 5,612,500 | | | | 619,244 | | | | 1.10 | |
| priceline.com Inc.2 | | | 501,000 | | | | 597,137 | | | | 1.06 | |
| Burberry Group PLC2 | | | 20,416,991 | | | | 475,860 | | | | .85 | |
| Toyota Motor Corp.2 | | | 7,853,400 | | | | 441,980 | | | | .79 | |
| Swatch Group Ltd, non-registered shares2 | | | 565,568 | | | | 355,460 | | | | | |
| Swatch Group Ltd2 | | | 681,770 | | | | 79,136 | | | | .78 | |
| adidas AG2 | | | 3,336,478 | | | | 361,464 | | | | .64 | |
| Industria de Diseño Textil, SA2 | | | 2,186,557 | | | | 328,650 | | | | .59 | |
| Other securities | | | | | | | 4,561,162 | | | | 8.12 | |
| | | | | | | | 9,913,299 | | | | 17.66 | |
| | | | | | | | | | | | | |
| Information technology 13.75% | | | | | | | | | | | | |
| Google Inc., Class A1 | | | 994,400 | | | | 1,108,269 | | | | 1.97 | |
| ASML Holding NV2 | | | 5,538,381 | | | | 512,750 | | | | | |
| ASML Holding NV (New York registered) | | | 2,564,870 | | | | 239,456 | | | | 1.34 | |
| Taiwan Semiconductor Manufacturing Co. Ltd.2 | | | 161,757,994 | | | | 632,047 | | | | | |
| Taiwan Semiconductor Manufacturing Co. Ltd. (ADR) | | | 3,000,000 | | | | 60,060 | | | | 1.23 | |
| Microsoft Corp. | | | 15,485,000 | | | | 634,730 | | | | 1.13 | |
| Texas Instruments Inc. | | | 9,617,791 | | | | 453,479 | | | | .81 | |
| VeriSign, Inc.1,3 | | | 7,991,624 | | | | 430,828 | | | | .77 | |
| Avago Technologies Ltd. | | | 5,560,000 | | | | 358,120 | | | | .64 | |
| Naver Corp.2 | | | 453,000 | | | | 329,790 | | | | .59 | |
| Other securities | | | | | | | 2,960,821 | | | | 5.27 | |
| | | | | | | | 7,720,350 | | | | 13.75 | |
| | | | | | | | | | | | | |
| Health care 13.01% | | | | | | | | | | | | |
| Novo Nordisk A/S, Class B2 | | | 56,236,585 | | | | 2,565,487 | | | | 4.57 | |
| Bayer AG2 | | | 6,524,860 | | | | 882,401 | | | | 1.57 | |
| Gilead Sciences, Inc.1 | | | 7,629,700 | | | | 540,641 | | | | .96 | |
| Merck & Co., Inc. | | | 7,730,000 | | | | 438,832 | | | | .78 | |
| Regeneron Pharmaceuticals, Inc.1 | | | 1,372,000 | | | | 411,984 | | | | .74 | |
| Novartis AG2 | | | 4,055,000 | | | | 344,413 | | | | .61 | |
| Bristol-Myers Squibb Co. | | | 6,567,500 | | | | 341,182 | | | | .61 | |
| Roche Holding AG2 | | | 1,126,300 | | | | 338,551 | | | | .60 | |
| Other securities | | | | | | | 1,440,751 | | | | 2.57 | |
| | | | | | | | 7,304,242 | | | | 13.01 | |
| | | | | | | | | | | | | |
| Financials 12.54% | | | | | | | | | | | | |
| American Express Co. | | | 6,750,000 | | | | 607,702 | | | | 1.08 | |
| AIA Group Ltd.2 | | | 126,571,400 | | | | 601,360 | | | | 1.07 | |
| CME Group Inc., Class A | | | 7,999,732 | | | | 592,060 | | | | 1.05 | |
| ACE Ltd. | | | 5,403,800 | | | | 535,300 | | | | .95 | |
| Prudential PLC2 | | | 24,530,041 | | | | 519,649 | | | | .93 | |
| Goldman Sachs Group, Inc. | | | 2,801,500 | | | | 459,026 | | | | .82 | |
| Common stocks (continued) | | Shares | | | Value
(000) | | | Percent of
net assets | |
| Financials (continued) | | | | | | | | | | | | |
| JPMorgan Chase & Co. | | | 7,220,000 | | | $ | 438,326 | | | | .78 | % |
| ORIX Corp.2 | | | 24,392,440 | | | | 342,596 | | | | .61 | |
| Other securities | | | | | | | 2,947,887 | | | | 5.25 | |
| | | | | | | | 7,043,906 | | | | 12.54 | |
| | | | | | | | | | | | | |
| Industrials 11.84% | | | | | | | | | | | | |
| Delta Air Lines, Inc. | | | 20,000,000 | | | | 693,000 | | | | 1.23 | |
| United Continental Holdings, Inc.1 | | | 12,300,000 | | | | 548,949 | | | | .98 | |
| United Technologies Corp. | | | 4,429,900 | | | | 517,589 | | | | .92 | |
| Airbus Group NV2 | | | 7,116,724 | | | | 510,371 | | | | .91 | |
| Boeing Co. | | | 3,933,300 | | | | 493,590 | | | | .88 | |
| KONE Oyj, Class B2 | | | 9,172,700 | | | | 385,228 | | | | .68 | |
| American Airlines Group Inc.1 | | | 9,165,000 | | | | 335,439 | | | | .60 | |
| Other securities | | | | | | | 3,166,649 | | | | 5.64 | |
| | | | | | | | 6,650,815 | | | | 11.84 | |
| | | | | | | | | | | | | |
| Consumer staples 11.02% | | | | | | | | | | | | |
| Nestlé SA2 | | | 8,018,700 | | | | 604,200 | | | | 1.08 | |
| Associated British Foods PLC2 | | | 12,945,056 | | | | 600,293 | | | | 1.07 | |
| British American Tobacco PLC2 | | | 10,747,500 | | | | 598,357 | | | | 1.07 | |
| Pernod Ricard SA2 | | | 4,263,991 | | | | 496,777 | | | | .88 | |
| Philip Morris International Inc. | | | 5,903,474 | | | | 483,317 | | | | .86 | |
| Anheuser-Busch InBev NV2 | | | 3,393,850 | | | | 356,725 | | | | .63 | |
| SABMiller PLC2 | | | 6,584,008 | | | | 328,860 | | | | .59 | |
| Other securities | | | | | | | 2,717,540 | | | | 4.84 | |
| | | | | | | | 6,186,069 | | | | 11.02 | |
| | | | | | | | | | | | | |
| Energy 3.98% | | | | | | | | | | | | |
| Oil Search Ltd.2 | | | 44,839,747 | | | | 352,382 | | | | .63 | |
| Other securities | | | | | | | 1,880,408 | | | | 3.35 | |
| | | | | | | | 2,232,790 | | | | 3.98 | |
| | | | | | | | | | | | | |
| Telecommunication services 0.99% | | | | | | | | | | | | |
| SoftBank Corp.2 | | | 5,124,700 | | | | 386,502 | | | | .69 | |
| Other securities | | | | | | | 170,445 | | | | .30 | |
| | | | | | | | 556,947 | | | | .99 | |
| | | | | | | | | | | | | |
| Other 4.58% | | | | | | | | | | | | |
| Other securities | | | | | | | 2,569,599 | | | | 4.58 | |
| | | | | | | | | | | | | |
| Miscellaneous 4.43% | | | | | | | | | | | | |
| Other common stocks in initial period of acquisition | | | | | | | 2,487,684 | | | | 4.43 | |
| | | | | | | | | | | | | |
| Total common stocks (cost: $31,981,818,000) | | | | | | | 52,665,701 | | | | 93.80 | |
| Rights 0.00% | | | | | Value
(000) | | | Percent of
net assets | |
| Miscellaneous 0.00% | | | | | | | | | | | | |
| Other rights in initial period of acquisition | | | | | | $ | 655 | | | | .00 | % |
| Total rights (cost: $647,000) | | | | | | | 655 | | | | .00 | |
| | | | | | | | | | | | | |
| Convertible securities 0.01% | | | | | | | | | | | | |
| Consumer staples 0.01% | | | | | | | | | | | | |
| Other securities | | | | | | | 4,624 | | | | .01 | |
| | | | | | | | | | | | | |
Total convertible securities
(cost: $5,605,000) | | | | | | | 4,624 | | | | .01 | |
| | | | | | | | | | | | | |
Bonds, notes & other debt
instruments 0.21% | | | | | | | | | | | | |
| U.S. Treasury bonds & notes 0.21% | | | | | | | | | | | | |
| Other securities | | | | | | | 117,826 | | | | .21 | |
| | | | | | | | | | | | | |
Total bonds, notes & other debt instruments
(cost: $117,696,000) | | | | | | | 117,826 | | | | .21 | |
| | | | | | | | | | | | | |
| Short-term securities 5.63% | | | Principal amount
(000) | | | | | | | | | |
| Freddie Mac 0.055%–0.17% due 4/1/2014–1/16/2015 | | $ | 1,113,668 | | | | 1,113,290 | | | | 1.98 | |
| Federal Home Loan Bank 0.06%–0.18% due 4/2–8/13/2014 | | | 667,004 | | | | 666,923 | | | | 1.19 | |
| Other securities | | | | | | | 1,384,193 | | | | 2.46 | |
| | | | | | | | | | | | | |
| Total short-term securities (cost: $3,164,110,000) | | | | | | | 3,164,406 | | | | 5.63 | |
| Total investment securities (cost: $35,269,876,000) | | | | | | | 55,953,212 | | | | 99.65 | |
| Other assets less liabilities | | | | | | | 194,453 | | | | .35 | |
| | | | | | | | | | | | | |
| Net assets | | | | | | $ | 56,147,665 | | | | 100.00 | % |
This summary investment portfolio is designed to streamline the report and help investors better focus on the fund’s principal holdings. See the inside back cover for details on how to obtain a complete schedule of portfolio holdings.
As permitted by U.S. Securities and Exchange Commission regulations, “Miscellaneous” securities include holdings in their first year of acquisition that have not previously been publicly disclosed.
“Other securities” includes all issues that are not disclosed separately in the summary investment portfolio. Some of these securities (with an aggregate value of $686,306,000, which represented 1.22% of the net assets of the fund) were acquired in transactions exempt from registration under section 4(2) of the Securities Act of 1933 and may be resold in the U.S. in transactions exempt from registration, normally to qualified institutional buyers.“Other securities” also includes a portion of a security which was pledged as collateral. The total value of pledged collateral was $857,000, which represented less than .01% of the net assets of the fund.
Forward currency contracts
The fund has entered into forward currency contracts to sell currency as shown in the following table. The average notional amount of open forward currency contracts was $417,471,000 over the prior 12-month period.
| | | | | | | | | | | Unrealized | |
| | | | | | | | | | | (depreciation) | |
| | | | | | | Contract amount | | appreciation | |
| | | | | | | Receive | | Deliver | | at 3/31/2014 | |
| | | Settlement date | | Counterparty | | (000) | | (000) | | (000) | |
| Sales: | | | | | | | | | | | | |
| Japanese yen | | 4/10/2014 | | HSBC Bank | | $36,723 | | ¥3,850,000 | | | $(580 | ) |
| Japanese yen | | 4/24/2014 | | Bank of America, N.A. | | $29,223 | | ¥3,000,000 | | | 153 | |
| Japanese yen | | 4/28/2014 | | Citibank | | $91,930 | | ¥9,400,000 | | | 844 | |
| Japanese yen | | 5/14/2014 | | Citibank | | $40,513 | | ¥4,150,000 | | | 296 | |
| Japanese yen | | 5/14/2014 | | Bank of New York Mellon | | $59,218 | | ¥6,065,000 | | | 443 | |
| Japanese yen | | 6/4/2014 | | Bank of America, N.A. | | $208,762 | | ¥21,300,000 | | | 2,325 | |
| | | | | | | | | | | | $3,481 | |
Investments in affiliates
A company is an affiliate of the fund under the Investment Company Act of 1940 if the fund’s holdings in that company represent 5% or more of the outstanding voting shares. The value of the fund’s affiliated-company holdings is shown in the summary investment portfolio under the respective sectors. Further details on such holdings and related transactions during the six months ended March 31, 2014, appear below.
| | | | | | | | | | | | | | | | | | Value of | |
| | | | | | | | | | | | | | | Dividend | | | affiliate at | |
| | | Beginning | | | | | | | | | Ending | | | income | | | 3/31/2014 | |
| | shares | | | Additions | | | Reductions | | | shares | | | (000) | | | (000) | |
| VeriSign, Inc.1 | | | 6,152,044 | | | | 1,839,580 | | | | — | | | | 7,991,624 | | | $ | — | | | $ | 430,828 | |
| Burberry Group PLC2,4 | | | 22,300,991 | | | | 400,000 | | | | 2,284,000 | | | | 20,416,991 | | | | 3,265 | | | | — | |
| | | | | | | | | | | | | | | | | | | $ | 3,265 | | | $ | 430,828 | |
The following footnotes apply to either the individual securities noted or one or more of the securities aggregated and listed as a single line item.
| 1 | Security did not produce income during the last 12 months. |
| 2 | Valued under fair value procedures adopted by authority of the board of trustees. The total value of all such securities, including those in “Miscellaneous” and “Other securities,” was $25,306,888,000, which represented 45.07% of the net assets of the fund. This amount includes $25,259,889,000 related to certain securities trading outside the U.S. whose values were adjusted as a result of significant market movements following the close of local trading. |
| 3 | Represents an affiliated company as defined under the Investment Company Act of 1940. |
| 4 | Unaffiliated issuer at 3/31/2014. |
Key to abbreviation and symbol
ADR = American Depositary Receipts
¥ = Japanese yen
See Notes to Financial Statements
Financial statements
| Statement of assets and liabilities | | unaudited | |
| at March 31, 2014 | | (dollars in thousands) | |
| | | | | | | | | |
| Assets: | | | | | | | | |
| Investment securities, at value: | | | | | | | | |
| Unaffiliated issuers (cost: $34,905,892) | | $ | 55,522,384 | | | | | |
| Affiliated issuers (cost: $363,984) | | | 430,828 | | | $ | 55,953,212 | |
| Cash denominated in currencies other than U.S. dollars (cost: $187) | | | | | | | 187 | |
| Cash | | | | | | | 297 | |
| Unrealized appreciation on open forward currency contracts | | | | | | | 4,061 | |
| Receivables for: | | | | | | | | |
| Sales of investments | | | 275,405 | | | | | |
| Sales of fund’s shares | | | 93,437 | | | | | |
| Dividends and interest | | | 130,030 | | | | 498,872 | |
| | | | | | | | 56,456,629 | |
| Liabilities: | | | | | | | | |
| Unrealized depreciation on open forward currency contracts | | | | | | | 580 | |
| Payables for: | | | | | | | | |
| Purchases of investments | | | 162,003 | | | | | |
| Repurchases of fund’s shares | | | 102,641 | | | | | |
| Investment advisory services | | | 18,292 | | | | | |
| Services provided by related parties | | | 17,292 | | | | | |
| Trustees’ deferred compensation | | | 4,175 | | | | | |
| Other | | | 3,981 | | | | 308,384 | |
| Net assets at March 31, 2014 | | | | | | $ | 56,147,665 | |
| | | | | | | | | |
| Net assets consist of: | | | | | | | | |
| Capital paid in on shares of beneficial interest | | | | | | $ | 33,251,020 | |
| Undistributed net investment income | | | | | | | 201,451 | |
| Undistributed net realized gain | | | | | | | 2,011,325 | |
| Net unrealized appreciation | | | | | | | 20,683,869 | |
| Net assets at March 31, 2014 | | | | | | $ | 56,147,665 | |
(dollars and shares in thousands, except per-share amounts)
Shares of beneficial interest issued and outstanding (no stated par value) —
unlimited shares authorized (1,494,871 total shares outstanding)
| | | | | | Shares | | | Net asset value | |
| | | Net assets | | | outstanding | | | per share | |
| Class A | | $ | 36,801,918 | | | | 977,257 | | | $ | 37.66 | |
| Class B | | | 249,453 | | | | 6,693 | | | | 37.27 | |
| Class C | | | 1,412,479 | | | | 38,581 | | | | 36.61 | |
| Class F-1 | | | 1,439,854 | | | | 38,425 | | | | 37.47 | |
| Class F-2 | | | 1,636,135 | | | | 43,502 | | | | 37.61 | |
| Class 529-A | | | 1,515,093 | | | | 40,600 | | | | 37.32 | |
| Class 529-B | | | 35,201 | | | | 953 | | | | 36.96 | |
| Class 529-C | | | 344,036 | | | | 9,397 | | | | 36.61 | |
| Class 529-E | | | 73,228 | | | | 1,979 | | | | 37.01 | |
| Class 529-F-1 | | | 58,028 | | | | 1,557 | | | | 37.26 | |
| Class R-1 | | | 102,552 | | | | 2,821 | | | | 36.35 | |
| Class R-2 | | | 622,151 | | | | 16,985 | | | | 36.63 | |
| Class R-3 | | | 1,721,701 | | | | 46,584 | | | | 36.96 | |
| Class R-4 | | | 1,858,021 | | | | 49,881 | | | | 37.25 | |
| Class R-5 | | | 1,445,885 | | | | 38,405 | | | | 37.65 | |
| Class R-6 | | | 6,831,930 | | | | 181,251 | | | | 37.69 | |
See Notes to Financial Statements
| Statement of operations | | unaudited | |
| for the six months ended March 31, 2014 | | (dollars in thousands) | |
| | | | | | | | | |
| Investment income: | | | | | | | | |
| Income: | | | | | | | | |
| Dividends (net of non-U.S. taxes of $25,795; also includes $3,265 from affiliates) | | $ | 477,646 | | | | | |
| Interest | | | 2,408 | | | $ | 480,054 | |
| Fees and expenses*: | | | | | | | | |
| Investment advisory services | | | 104,657 | | | | | |
| Distribution services | | | 65,252 | | | | | |
| Transfer agent services | | | 28,361 | | | | | |
| Administrative services | | | 6,360 | | | | | |
| Reports to shareholders | | | 1,166 | | | | | |
| Registration statement and prospectus | | | 414 | | | | | |
| Trustees’ compensation | | | 699 | | | | | |
| Auditing and legal | | | 52 | | | | | |
| Custodian | | | 1,593 | | | | | |
| Other | | | 1,122 | | | | 209,676 | |
| Net investment income | | | | | | | 270,378 | |
| | | | | | | | | |
| Net realized gain and unrealized appreciation on investments, forward currency contracts and currency: | | | | | | | | |
| Net realized gain on: | | | | | | | | |
| Investments (includes $965 net gain from affiliates) | | | 2,037,947 | | | | | |
| Forward currency contracts | | | 12,330 | | | | | |
| Currency transactions | | | 8,061 | | | | 2,058,338 | |
| Net unrealized appreciation (depreciation) on: | | | | | | | | |
| Investments (net of non-U.S. taxes of $3,241) | | | 2,217,619 | | | | | |
| Forward currency contracts | | | 6,477 | | | | | |
| Currency translations | | | (928 | ) | | | 2,223,168 | |
| Net realized gain and unrealized appreciation on investments, forward currency contracts and currency | | | | | | | 4,281,506 | |
| | | | | | | | | |
| Net increase in net assets resulting from operations | | | | | | $ | 4,551,884 | |
*Additional information related to class-specific fees and expenses is included in the Notes to Financial Statements.
See Notes to Financial Statements
Statements of changes in net assets
(dollars in thousands)
| | | Six months | | | Year ended | |
| | | ended March 31, | | | September 30, | |
| | | 2014* | | | 2013 | |
| | | | | | | | | |
| Operations: | | | | | | | | |
| Net investment income | | $ | 270,378 | | | $ | 484,366 | |
Net realized gain on investments, forward
currency contracts and currency transactions | | | 2,058,338 | | | | 3,074,847 | |
Net unrealized appreciation on investments, forward
currency contracts and currency translations | | | 2,223,168 | | | | 5,647,781 | |
| Net increase in net assets resulting from operations | | | 4,551,884 | | | | 9,206,994 | |
| | | | | | | | | |
| Dividends and distributions paid to shareholders: | | | | | | | | |
| | | | | | | | | |
| Dividends from net investment income | | | (426,410 | ) | | | (460,157 | ) |
| Distributions from net realized gain on investments | | | (2,488,191 | ) | | | — | |
| Total dividends and distributions paid to shareholders | | | (2,914,601 | ) | | | (460,157 | ) |
| | | | | | | | | |
| Net capital share transactions | | | 2,816,346 | | | | (311,024 | ) |
| | | | | | | | | |
| Total increase in net assets | | | 4,453,629 | | | | 8,435,813 | |
| | | | | | | | | |
| Net assets: | | | | | | | | |
| Beginning of period | | | 51,694,036 | | | | 43,258,223 | |
| End of period (including undistributed net investment income: $201,451 and $357,483, respectively) | | $ | 56,147,665 | | | $ | 51,694,036 | |
*Unaudited.
See Notes to Financial Statements
| Notes to financial statements | unaudited |
1. Organization
New Perspective Fund (the “fund”) is registered under the Investment Company Act of 1940 as an open-end, diversified management investment company. The fund seeks to provide long-term growth of capital. Future income is a secondary objective.
The fund has 16 share classes consisting of five retail share classes (Classes A, B and C, as well as two F share classes, F-1 and F-2), five 529 college savings plan share classes (Classes 529-A, 529-B, 529-C, 529-E and 529-F-1) and six retirement plan share classes (Classes R-1, R-2, R-3, R-4, R-5 and R-6). The 529 college savings plan share classes can be used to save for college education. The retirement plan share classes are generally offered only through eligible employer-sponsored retirement plans. The fund’s share classes are described further in the following table:
| Share class | | Initial sales
charge | | Contingent deferred sales
charge upon redemption | | Conversion feature | |
| Classes A and 529-A | | Up to 5.75% | | None (except 1% for certain redemptions within one year of purchase without an initial sales charge) | | None | |
| Classes B and 529-B* | | None | | Declines from 5% to 0% for redemptions within six years of purchase | | Classes B and 529-B convert to Classes A and 529-A, respectively, after eight years | |
| Class C | | None | | 1% for redemptions within one year of purchase | | Class C converts to Class F-1 after 10 years | |
| Class 529-C | | None | | 1% for redemptions within one year of purchase | | None | |
| Class 529-E | | None | | None | | None | |
| Classes F-1, F-2 and 529-F-1 | | None | | None | | None | |
| Classes R-1, R-2, R-3, R-4, R-5 and R-6 | | None | | None | | None | |
* Class B and 529-B shares of the fund are not available for purchase.
Holders of all share classes have equal pro rata rights to assets, dividends and liquidation proceeds. Each share class has identical voting rights, except for the exclusive right to vote on matters affecting only its class. Share classes have different fees and expenses (“class-specific fees and expenses”), primarily due to different arrangements for distribution, administrative and shareholder services. Differences in class-specific fees and expenses will result in differences in net investment income and, therefore, the payment of different per-share dividends by each share class.
2. Significant accounting policies
The financial statements have been prepared to comply with accounting principles generally accepted in the United States of America. These principles require
management to make estimates and assumptions that affect reported amounts and disclosures. Actual results could differ from those estimates. The fund follows the significant accounting policies described in this section, as well as the valuation policies described in the next section on valuation.
Security transactions and related investment income — Security transactions are recorded by the fund as of the date the trades are executed with brokers. Realized gains and losses from security transactions are determined based on the specific identified cost of the securities. In the event a security is purchased with a delayed payment date, the fund will segregate liquid assets sufficient to meet its payment obligations. Dividend income is recognized on the ex-dividend date and interest income is recognized on an accrual basis. Market discounts, premiums and original issue discounts on fixed-income securities are amortized daily over the expected life of the security.
Class allocations — Income, fees and expenses (other than class-specific fees and expenses) and realized and unrealized gains and losses are allocated daily among the various share classes based on their relative net assets. Class-specific fees and expenses, such as distribution, administrative and shareholder services, are charged directly to the respective share class.
Dividends and distributions to shareholders — Dividends and distributions to shareholders are recorded on the ex-dividend date.
Currency translation — Assets and liabilities, including investment securities, denominated in currencies other than U.S. dollars are translated into U.S. dollars at the exchange rates supplied by one or more pricing vendors on the valuation date. Purchases and sales of investment securities and income and expenses are translated into U.S. dollars at the exchange rates on the dates of such transactions. The effects of changes in exchange rates on investment securities are included with the net realized gain or loss and net unrealized appreciation or depreciation on investments in the fund’s statement of operations. The realized gain or loss and unrealized appreciation or depreciation resulting from all other transactions denominated in currencies other than U.S. dollars are disclosed separately.
3. Valuation
Capital Research and Management Company (“CRMC”), the fund’s investment adviser, values the fund’s investments at fair value as defined by accounting principles generally accepted in the United States of America. The net asset value of each share class of the fund is generally determined as of approximately 4:00 p.m. New York time each day the New York Stock Exchange is open.
Methods and inputs — The fund’s investment adviser uses the following methods and inputs to establish the fair value of the fund’s assets and liabilities. Use of particular methods and inputs may vary over time based on availability and relevance as market and economic conditions evolve.
Equity securities are generally valued at the official closing price of, or the last reported sale price on, the exchange or market on which such securities are traded, as of the close of business on the day the securities are being valued or, lacking any sales, at the last available bid price. Prices for each security are taken from the principal exchange or market on which the security trades.
Fixed-income securities, including short-term securities purchased with more than 60 days left to maturity, are generally valued at prices obtained from one or more pricing vendors. Vendors value such securities based on one or more of the inputs described in the following table. The table provides examples of inputs that are commonly relevant for valuing particular classes of fixed-income securities in which the fund is authorized to invest. However, these classifications are not exclusive, and any of the inputs may be used to value any other class of fixed-income security.
| Fixed-income class | Examples of standard inputs |
| All | Benchmark yields, transactions, bids, offers, quotations from dealers and trading systems, new issues, spreads and other relationships observed in the markets among comparable securities; and proprietary pricing models such as yield measures calculated using factors such as cash flows, financial or collateral performance and other reference data (collectively referred to as “standard inputs”) |
| Corporate bonds & notes; convertible securities | Standard inputs and underlying equity of the issuer |
| Bonds & notes of governments & government agencies | Standard inputs and interest rate volatilities |
When the fund’s investment adviser deems it appropriate to do so (such as when vendor prices are unavailable or not deemed to be representative), fixed-income securities will be valued in good faith at the mean quoted bid and ask prices that are reasonably and timely available (or bid prices, if ask prices are not available) or at prices for securities of comparable maturity, quality and type.
Securities with both fixed-income and equity characteristics, or equity securities traded principally among fixed-income dealers, are generally valued in the manner described for either equity or fixed-income securities, depending on which method is deemed most appropriate by the fund’s investment adviser. Short-term securities purchased within 60 days to maturity are valued at amortized cost, which approximates fair value. The value of short-term securities originally purchased with maturities greater than 60 days is determined based on an amortized value to par when they reach 60 days. Forward currency contracts are valued at the mean of representative quoted bid and ask prices, generally based on prices supplied by one or more pricing vendors.
Securities and other assets for which representative market quotations are not readily available or are considered unreliable by the fund’s investment adviser are fair valued as determined in good faith under fair valuation guidelines adopted by authority of the fund’s board of trustees as further described. The investment adviser follows fair valuation guidelines, consistent with U.S. Securities and Exchange Commission rules and guidance,
to consider relevant principles and factors when making fair value determinations. The investment adviser considers relevant indications of value that are reasonably and timely available to it in determining the fair value to be assigned to a particular security, such as the type and cost of the security; contractual or legal restrictions on resale of the security; relevant financial or business developments of the issuer; actively traded similar or related securities; conversion or exchange rights on the security; related corporate actions; significant events occurring after the close of trading in the security; and changes in overall market conditions. In addition, the closing prices of equity securities that trade in markets outside U.S. time zones may be adjusted to reflect significant events that occur after the close of local trading but before the net asset value of each share class of the fund is determined. Fair valuations and valuations of investments that are not actively trading involve judgment and may differ materially from valuations that would have been used had greater market activity occurred.
Processes and structure — The fund’s board of trustees has delegated authority to the fund’s investment adviser to make fair value determinations, subject to board oversight. The investment adviser has established a Joint Fair Valuation Committee (the “Fair Valuation Committee”) to administer, implement and oversee the fair valuation process, and to make fair value decisions. The Fair Valuation Committee regularly reviews its own fair value decisions, as well as decisions made under its standing instructions to the investment adviser’s valuation teams. The Fair Valuation Committee reviews changes in fair value measurements from period to period and may, as deemed appropriate, update the fair valuation guidelines to better reflect the results of back testing and address new or evolving issues. The Fair Valuation Committee reports any changes to the fair valuation guidelines to the board of trustees with supplemental information to support the changes. The fund’s board and audit committee also regularly review reports that describe fair value determinations and methods.
The fund’s investment adviser has also established a Fixed-Income Pricing Review Group to administer and oversee the fixed-income valuation process, including the use of fixed-income pricing vendors. This group regularly reviews pricing vendor information and market data. Pricing decisions, processes and controls over security valuation are also subject to additional internal reviews, including an annual control self-evaluation program facilitated by the investment adviser’s compliance group.
Classifications — The fund’s investment adviser classifies the fund’s assets and liabilities into three levels based on the inputs used to value the assets or liabilities. Level 1 values are based on quoted prices in active markets for identical securities. Level 2 values are based on significant observable market inputs, such as quoted prices for similar securities and quoted prices in inactive markets. Certain securities trading outside the U.S. may transfer between Level 1 and Level 2 due to valuation adjustments resulting from significant market movements following the close of local trading. Level 3 values are based on significant unobservable inputs that reflect the investment adviser’s determination of assumptions that market participants might reasonably use in valuing the securities. The valuation levels are not necessarily an indication of the risk or liquidity associated with the underlying investment. For example, U.S. government securities are reflected as Level 2 because the inputs used to determine fair value may not always be
quoted prices in an active market. The following tables present the fund’s valuation levels as of March 31, 2014 (dollars in thousands):
| | | Investment securities | |
| | | Level 1 | | | Level 2* | | | Level 3 | | | Total | |
| Assets: | | | | | | | | | | | | | | | | |
| Common stocks: | | | | | | | | | | | | | | | | |
| Consumer discretionary | | $ | 6,235,815 | | | $ | 3,677,484 | | | $ | — | | | $ | 9,913,299 | |
| Information technology | | | 4,959,113 | | | | 2,761,237 | | | | — | | | | 7,720,350 | |
| Health care | | | 2,644,636 | | | | 4,659,606 | | | | — | | | | 7,304,242 | |
| Financials | | | 3,570,424 | | | | 3,473,482 | | | | — | | | | 7,043,906 | |
| Industrials | | | 3,902,976 | | | | 2,747,839 | | | | — | | | | 6,650,815 | |
| Consumer staples | | | 2,018,970 | | | | 4,167,099 | | | | — | | | | 6,186,069 | |
| Energy | | | 1,713,811 | | | | 518,979 | | | | — | | | | 2,232,790 | |
| Telecommunication services | | | 56,758 | | | | 500,189 | | | | — | | | | 556,947 | |
| Other | | | 1,207,975 | | | | 1,361,624 | | | | — | | | | 2,569,599 | |
| Miscellaneous | | | 1,048,335 | | | | 1,439,349 | | | | — | | | | 2,487,684 | |
| Rights | | | 655 | | | | — | | | | — | | | | 655 | |
| Convertible securities | | | — | | | | 4,624 | | | | — | | | | 4,624 | |
| Bonds, notes & other debt instruments | | | — | | | | 117,826 | | | | — | | | | 117,826 | |
| Short-term securities | | | — | | | | 3,164,406 | | | | — | | | | 3,164,406 | |
| Total | | $ | 27,359,468 | | | $ | 28,593,744 | | | $ | — | | | $ | 55,953,212 | |
| | | Other investments† | |
| | | Level 1 | | | Level 2 | | | Level 3 | | | Total | |
| Assets: | | | | | | | | | | | | | | | | |
| Unrealized appreciation on open forward currency contracts | | $ | — | | | $ | 4,061 | | | $ | — | | | $ | 4,061 | |
| Liabilities: | | | | | | | | | | | | | | | | |
| Unrealized depreciation on open forward currency contracts | | | — | | | | (580 | ) | | | — | | | | (580 | ) |
| Total | | $ | — | | | $ | 3,481 | | | $ | — | | | $ | 3,481 | |
| * | Securities with a value of $24,036,467,000, which represented 42.81% of the net assets of the fund, transferred from Level 1 to Level 2 since the prior fiscal year-end, primarily due to significant market movements following the close of local trading. |
| † | Forward currency contracts are not included in the investment portfolio. |
4. Risk factors
Investing in the fund may involve certain risks including, but not limited to, those described below.
Market conditions — The prices of, and the income generated by, the securities held by the fund may decline due to market conditions and other factors, including those directly involving the issuers of securities held by the fund.
Investing in growth-oriented stocks — Growth-oriented stocks may involve larger price swings and greater potential for loss than other types of investments.
Investing outside the U.S. — Securities of issuers domiciled outside the U.S., or with significant operations outside the U.S., may lose value because of adverse political, social, economic or market developments in the countries or regions in which the issuers operate. These securities may also lose value due to changes in foreign currency exchange rates against the U.S. dollar and/or currencies of other countries. Securities markets in certain countries may be more volatile and/or less liquid than those in the U.S. Investments outside the U.S. may also be subject to different settlement and accounting practices and different regulatory, legal and reporting standards, and may be more difficult to value, than those in the U.S. The risks of investing outside the U.S. may be heightened in connection with investments in emerging markets.
Management — The investment adviser to the fund actively manages the fund’s investments. Consequently, the fund is subject to the risk that the methods and analyses employed by the investment adviser in this process may not produce the desired results. This could cause the fund to lose value or its investment results to lag relevant benchmarks or other funds with similar objectives.
5. Certain investment techniques
Forward currency contracts — The fund has entered into forward currency contracts, which represent agreements to exchange currencies on specific future dates at predetermined rates. The fund’s investment adviser uses forward currency contracts to manage the fund’s exposure to changes in exchange rates. Upon entering into these contracts, risks may arise from the potential inability of counterparties to meet the terms of their contracts and from possible movements in exchange rates.
On a daily basis, the fund’s investment adviser values forward currency contracts and records unrealized appreciation or depreciation for open forward currency contracts in the fund’s statement of assets and liabilities. Realized gains or losses are recorded at the time the forward currency contract is closed or offset by another contract with the same broker for the same settlement date and currency.
Closed forward currency contracts that have not reached their settlement date are included in the respective receivables or payables for closed forward currency contracts in the fund’s statement of assets and liabilities. Net realized gains or losses from closed forward currency contracts and net unrealized appreciation or depreciation from open forward currency contracts are recorded in the fund’s statement of operations.
The following tables present the financial statement impacts resulting from the fund’s use of forward currency contracts as of March 31, 2014 (dollars in thousands):
| | | Asset | | | Liability | |
| Contract | | Location on statement
of assets and liabilities | | Value | | | Location on statement
of assets and liabilities | | Value | |
| Forward currency | | Unrealized appreciation on open forward currency contracts | | $ | 4,061 | | | Unrealized depreciation on open forward currency contracts | | $ | 580 | |
| |
| | | Net realized gain | | | Net unrealized appreciation | |
| | | Location on statement | | | | | | Location on statement | | | | |
| Contract | | of operations | | | Value | | | of operations | | | Value | |
| Forward currency | | Net realized gain on forward currency contracts | | $ | 12,330 | | | Net unrealized appreciation on forward currency contracts | | $ | 6,477 | |
Collateral — The fund has entered into a collateral program due to its use of forward currency contracts. The program calls for the fund to either receive or pledge collateral based on the net gain or loss on unsettled forward currency contracts by counterparty. The purpose of the collateral is to cover potential losses that could occur in the event that either party cannot meet its contractual obligations.
6. Taxation and distributions
Federal income taxation — The fund complies with the requirements under Subchapter M of the Internal Revenue Code applicable to mutual funds and intends to distribute substantially all of its net taxable income and net capital gains each year. The fund is not subject to income taxes to the extent such distributions are made. Therefore, no federal income tax provision is required.
As of and during the period ended March 31, 2014, the fund did not have a liability for any unrecognized tax benefits. The fund recognizes interest and penalties, if any, related to unrecognized tax benefits as income tax expense in the statement of operations. During the period, the fund did not incur any interest or penalties.
The fund is not subject to examination by U.S. federal tax authorities for tax years before 2009, by state tax authorities for tax years before 2008 and by tax authorities outside the U.S. for tax years before 2006.
Non-U.S. taxation — Dividend and interest income are recorded net of non-U.S. taxes paid. Gains realized by the fund on the sale of securities in certain countries are subject to non-U.S. taxes. The fund records a liability based on unrealized gains to provide for potential non-U.S. taxes payable upon the sale of these securities.
Distributions — Distributions paid to shareholders are based on net investment income and net realized gains determined on a tax basis, which may differ from net investment income and net realized gains for financial reporting purposes. These differences are due primarily to different treatment for items such as currency gains
and losses; short-term capital gains and losses; capital losses related to sales of certain securities within 30 days of purchase; and unrealized appreciation of certain investments in securities outside the U.S. The fiscal year in which amounts are distributed may differ from the year in which the net investment income and net realized gains are recorded by the fund for financial reporting purposes.
The components of distributable earnings on a tax basis are reported as of the fund’s most recent year-end. As of September 30, 2013, the fund had tax basis undistributed ordinary income of $396,081,000 and undistributed long-term capital gains of $2,485,486,000.
As of March 31, 2014, the tax basis unrealized appreciation (depreciation) and cost of investment securities were as follows (dollars in thousands):
| Gross unrealized appreciation on investment securities | | $ | 21,224,673 | |
| Gross unrealized depreciation on investment securities | | | (642,471 | ) |
| Net unrealized appreciation on investment securities | | | 20,582,202 | |
| Cost of investment securities | | | 35,371,010 | |
The tax character of distributions paid to shareholders was as follows (dollars in thousands):
| | | Six months ended March 31, 2014 | | | Year ended September 30, 2013 | |
| | | | | | | | | Total | | | | | | | | | Total | |
| | | | | | Long-term | | | distributions | | | | | | Long-term | | | distributions | |
| | | Ordinary | | | capital | | | paid or | | | Ordinary | | | capital | | | paid or | |
| Share class | | income | | | gains | | | accrued | | | income | | | gains | | | accrued | |
| Class A | | $ | 280,895 | | | $ | 1,640,428 | | | $ | 1,921,323 | | | $ | 317,926 | | | $ | — | | | $ | 317,926 | |
| Class B | | | — | | | | 12,764 | | | | 12,764 | | | | 323 | | | | — | | | | 323 | |
| Class C | | | 848 | | | | 65,440 | | | | 66,288 | | | | 3,414 | | | | — | | | | 3,414 | |
| Class F-1 | | | 9,609 | | | | 60,511 | | | | 70,120 | | | | 10,848 | | | | — | | | | 10,848 | |
| Class F-2 | | | 15,742 | | | | 69,454 | | | | 85,196 | | | | 11,587 | | | | — | | | | 11,587 | |
| Class 529-A | | | 10,501 | | | | 66,973 | | | | 77,474 | | | | 11,820 | | | | — | | | | 11,820 | |
| Class 529-B | | | — | | | | 1,782 | | | | 1,782 | | | | — | | | | — | | | | — | |
| Class 529-C | | | 80 | | | | 15,689 | | | | 15,769 | | | | 777 | | | | — | | | | 777 | |
| Class 529-E | | | 353 | | | | 3,311 | | | | 3,664 | | | | 461 | | | | — | | | | 461 | |
| Class 529-F-1 | | | 499 | | | | 2,473 | | | | 2,972 | | | | 470 | | | | — | | | | 470 | |
| Class R-1 | | | 121 | | | | 4,581 | | | | 4,702 | | | | 272 | | | | — | | | | 272 | |
| Class R-2 | | | 621 | | | | 28,798 | | | | 29,419 | | | | 1,870 | | | | — | | | | 1,870 | |
| Class R-3 | | | 8,712 | | | | 79,005 | | | | 87,717 | | | | 10,925 | | | | — | | | | 10,925 | |
| Class R-4 | | | 13,609 | | | | 79,980 | | | | 93,589 | | | | 14,941 | | | | — | | | | 14,941 | |
| Class R-5 | | | 14,172 | | | | 62,229 | | | | 76,401 | | | | 16,866 | | | | — | | | | 16,866 | |
| Class R-6 | | | 70,648 | | | | 294,773 | | | | 365,421 | | | | 57,657 | | | | — | | | | 57,657 | |
| Total | | $ | 426,410 | | | $ | 2,488,191 | | | $ | 2,914,601 | | | $ | 460,157 | | | $ | — | | | $ | 460,157 | |
7. Fees and transactions with related parties
CRMC, the fund’s investment adviser, is the parent company of American Funds Distributors,® Inc. (“AFD”), the principal underwriter of the fund’s shares, and American Funds Service Company® (“AFS”), the fund’s transfer agent. CRMC, AFD and AFS are considered related parties to the fund.
Investment advisory services — The fund has an investment advisory and service agreement with CRMC that provides for monthly fees accrued daily. These fees are based on a series of decreasing annual rates beginning with 0.600% on the first $500 million of daily net assets and decreasing to 0.360% on such assets in excess of $55 billion. For the six months ended March 31, 2014, the investment advisory services fee was $104,657,000, which was equivalent to an annualized rate of 0.384% of average daily net assets.
Class-specific fees and expenses — Expenses that are specific to individual share classes are accrued directly to the respective share class. The principal class-specific fees and expenses are described below:
Distribution services — The fund has plans of distribution for all share classes, except Class F-2, R-5 and R-6 shares. Under the plans, the board of trustees approves certain categories of expenses that are used to finance activities primarily intended to sell fund shares and service existing accounts. The plans provide for payments, based on an annualized percentage of average daily net assets, ranging from 0.25% to 1.00% as noted in this section. In some cases, the board of trustees has limited the amounts that may be paid to less than the maximum allowed by the plans. All share classes with a plan may use up to 0.25% of average daily net assets to pay service fees, or to compensate AFD for paying service fees, to firms that have entered into agreements with AFD to provide certain shareholder services. The remaining amounts available to be paid under each plan are paid to dealers to compensate them for their sales activities.
For Class A and 529-A shares, distribution-related expenses include the reimbursement of dealer and wholesaler commissions paid by AFD for certain shares sold without a sales charge. These share classes reimburse AFD for amounts billed within the prior 15 months but only to the extent that the overall annual expense limit of 0.25% is not exceeded. As of March 31, 2014, there were no unreimbursed expenses subject to reimbursement for Class A or 529-A shares.
| Share class | | Currently approved limits | | Plan limits |
| Class A | | | 0.25 | % | | | 0.25 | % |
| Class 529-A | | | 0.25 | | | | 0.50 | |
| Classes B and 529-B | | | 1.00 | | | | 1.00 | |
| Classes C, 529-C and R-1 | | | 1.00 | | | | 1.00 | |
| Class R-2 | | | 0.75 | | | | 1.00 | |
| Classes 529-E and R-3 | | | 0.50 | | | | 0.75 | |
| Classes F-1, 529-F-1 and R-4 | | | 0.25 | | | | 0.50 | |
Transfer agent services — The fund has a shareholder services agreement with AFS under which the fund compensates AFS for providing transfer agent services to each of the fund’s share classes. These services include recordkeeping, shareholder communications and transaction processing. In addition, the fund reimburses AFS for amounts paid to third parties for performing transfer agent services on behalf of fund shareholders.
Administrative services — The fund has an administrative services agreement with CRMC under which the fund compensates CRMC for providing administrative services to Class A, C, F, 529 and R shares. These services include, but are not limited to, coordinating, monitoring, assisting and overseeing third parties that provide services to fund shareholders. Under the agreement, Class A shares pay an annual fee of 0.01% and Class C, F, 529 and R shares pay an annual fee of 0.05% of their respective average daily net assets.
529 plan services — Each 529 share class is subject to service fees to compensate the Commonwealth of Virginia for the maintenance of the 529 college savings plan. For the six months ended March 31, 2014, the quarterly fee was based on a series of decreasing annual rates beginning with 0.10% on the first $30 billion of the net assets invested in Class 529 shares of the American Funds and decreasing to 0.06% on such assets between $120 billion and $150 billion. Effective April 1, 2014, the quarterly fee was amended to provide for reduced annual rates of 0.07%, 0.06% and 0.05% over $30 billion, $50 billion and $70 billion, respectively, of the net assets invested in Class 529 shares of the American Funds. The fee for any given calendar quarter is accrued and calculated on the basis of the average net assets of Class 529 shares of the American Funds for the last month of the prior calendar quarter. The fee is included in other expenses in the fund’s statement of operations. The Commonwealth of Virginia is not considered a related party.
For the six months ended March 31, 2014, class-specific expenses under the agreements were as follows (dollars in thousands):
| | | Distribution | | | Transfer agent | | | Administrative | | | 529 plan |
| Share class | | services | | | services | | | services | | | services |
| Class A | | | $42,411 | | | | $21,358 | | | | $1,802 | | | Not applicable |
| Class B | | | 1,362 | | | | 163 | | | | Not applicable | | | Not applicable |
| Class C | | | 6,954 | | | | 795 | | | | 349 | | | Not applicable |
| Class F-1 | | | 1,726 | | | | 858 | | | | 345 | | | Not applicable |
| Class F-2 | | | Not applicable | | | | 646 | | | | 366 | | | Not applicable |
| Class 529-A | | | 1,593 | | | | 665 | | | | 366 | | | $710 |
| Class 529-B | | | 189 | | | | 21 | | | | 9 | | | 19 |
| Class 529-C | | | 1,660 | | | | 164 | | | | 84 | | | 162 |
| Class 529-E | | | 178 | | | | 22 | | | | 18 | | | 35 |
| Class 529-F-1 | | | — | | | | 24 | | | | 14 | | | 26 |
| Class R-1 | | | 489 | | | | 51 | | | | 24 | | | Not applicable |
| Class R-2 | | | 2,281 | | | | 1,060 | | | | 154 | | | Not applicable |
| Class R-3 | | | 4,217 | | | | 1,348 | | | | 423 | | | Not applicable |
| Class R-4 | | | 2,192 | | | | 874 | | | | 441 | | | Not applicable |
| Class R-5 | | | Not applicable | | | | 301 | | | | 343 | | | Not applicable |
| Class R-6 | | | Not applicable | | | | 11 | | | | 1,622 | | | Not applicable |
| Total class-specific expenses | | | $65,252 | | | | $28,361 | | | | $6,360 | | | $952 |
Trustees’ deferred compensation — Trustees who are unaffiliated with CRMC may elect to defer the cash payment of part or all of their compensation. These deferred amounts, which remain as liabilities of the fund, are treated as if invested in shares of the fund or other American Funds. These amounts represent general, unsecured liabilities of the fund and vary according to the total returns of the selected funds. Trustees’ compensation of $699,000 in the fund’s statement of operations includes $188,000 in current fees (either paid in cash or deferred) and a net increase of $511,000 in the value of the deferred amounts.
Affiliated officers and trustees — Officers and certain trustees of the fund are or may be considered to be affiliated with CRMC, AFD and AFS. No affiliated officers or trustees received any compensation directly from the fund.
8. Capital share transactions
Capital share transactions in the fund were as follows (dollars and shares in thousands):
| | | | | | Reinvestments | | | | | | | |
| | | | | | of dividends | | | | | | Net increase | |
| | | Sales* | | | and distributions | | | Repurchases* | | | (decrease) | |
| Share class | | Amount | | | Shares | | | Amount | | | Shares | | | Amount | | | Shares | | | Amount | | | Shares | |
| | | | | | | | | | | | | | | | | | | | | | | | | |
| Six months ended March 31, 2014 | | | | | | | | | | | | | | | | | | | | | | | | |
| | | | | | | | | | | | | | | | | | | | | | | | | |
| Class A | | $ | 1,372,359 | | | | 36,574 | | | $ | 1,873,691 | | | | 50,300 | | | $ | (2,057,307 | ) | | | (54,764 | ) | | $ | 1,188,743 | | | | 32,110 | |
| Class B | | | 3,473 | | | | 93 | | | | 12,665 | | | | 343 | | | | (64,012 | ) | | | (1,724 | ) | | | (47,874 | ) | | | (1,288 | ) |
| Class C | | | 130,787 | | | | 3,587 | | | | 64,888 | | | | 1,788 | | | | (182,283 | ) | | | (4,996 | ) | | | 13,392 | | | | 379 | |
| Class F-1 | | | 271,939 | | | | 7,278 | | | | 68,901 | | | | 1,859 | | | | (334,022 | ) | | | (8,836 | ) | | | 6,818 | | | | 301 | |
| Class F-2 | | | 492,441 | | | | 12,998 | | | | 80,259 | | | | 2,158 | | | | (144,877 | ) | | | (3,862 | ) | | | 427,823 | | | | 11,294 | |
| Class 529-A | | | 88,810 | | | | 2,385 | | | | 77,457 | | | | 2,098 | | | | (74,032 | ) | | | (1,985 | ) | | | 92,235 | | | | 2,498 | |
| Class 529-B | | | 361 | | | | 10 | | | | 1,781 | | | | 49 | | | | (8,348 | ) | | | (227 | ) | | | (6,206 | ) | | | (168 | ) |
| Class 529-C | | | 21,658 | | | | 593 | | | | 15,767 | | | | 434 | | | | (20,822 | ) | | | (570 | ) | | | 16,603 | | | | 457 | |
| Class 529-E | | | 4,347 | | | | 118 | | | | 3,663 | | | | 100 | | | | (5,203 | ) | | | (140 | ) | | | 2,807 | | | | 78 | |
| Class 529-F-1 | | | 7,984 | | | | 214 | | | | 2,972 | | | | 80 | | | | (4,338 | ) | | | (116 | ) | | | 6,618 | | | | 178 | |
| Class R-1 | | | 12,519 | | | | 347 | | | | 4,701 | | | | 130 | | | | (9,617 | ) | | | (265 | ) | | | 7,603 | | | | 212 | |
| Class R-2 | | | 67,521 | | | | 1,851 | | | | 29,403 | | | | 810 | | | | (93,343 | ) | | | (2,558 | ) | | | 3,581 | | | | 103 | |
| Class R-3 | | | 191,109 | | | | 5,187 | | | | 87,653 | | | | 2,396 | | | | (233,265 | ) | | | (6,344 | ) | | | 45,497 | | | | 1,239 | |
| Class R-4 | | | 278,022 | | | | 7,496 | | | | 93,570 | | | | 2,539 | | | | (207,435 | ) | | | (5,603 | ) | | | 164,157 | | | | 4,432 | |
| Class R-5 | | | 171,851 | | | | 4,591 | | | | 76,276 | | | | 2,050 | | | | (120,087 | ) | | | (3,206 | ) | | | 128,040 | | | | 3,435 | |
| Class R-6 | | | 929,511 | | | | 24,711 | | | | 364,456 | | | | 9,784 | | | | (527,458 | ) | | | (14,060 | ) | | | 766,509 | | | | 20,435 | |
| Total net increase (decrease) | | $ | 4,044,692 | | | | 108,033 | | | $ | 2,858,103 | | | | 76,918 | | | $ | (4,086,449 | ) | | | (109,256 | ) | | $ | 2,816,346 | | | | 75,695 | |
| | | Sales* | | | Reinvestments
of dividends | | | Repurchases* | | | Net (decrease)
increase | |
| Share class | | Amount | | | Shares | | | Amount | | | Shares | | | Amount | | | Shares | | | Amount | | | Shares | |
| | | | | | | | | | | | | | | | | | | | |
| Year ended September 30, 2013 | | | | | | | | | | | | | | | | | | | |
| | | | | | | | | | | | | | | | | | | | |
| Class A | | $ | 2,345,405 | | | | 70,567 | | | $ | 307,830 | | | | 9,911 | | | $ | (3,971,360 | ) | | | (121,062 | ) | | $ | (1,318,125 | ) | | | (40,584 | ) |
| Class B | | | 5,972 | | | | 182 | | | | 320 | | | | 10 | | | | (149,315 | ) | | | (4,614 | ) | | | (143,023 | ) | | | (4,422 | ) |
| Class C | | | 178,914 | | | | 5,499 | | | | 3,329 | | | | 110 | | | | (268,401 | ) | | | (8,359 | ) | | | (86,158 | ) | | | (2,750 | ) |
| Class F-1 | | | 378,029 | | | | 11,397 | | | | 10,615 | | | | 343 | | | | (353,424 | ) | | | (11,082 | ) | | | 35,220 | | | | 658 | |
| Class F-2 | | | 538,509 | | | | 16,543 | | | | 10,449 | | | | 337 | | | | (227,008 | ) | | | (6,819 | ) | | | 321,950 | | | | 10,061 | |
| Class 529-A | | | 150,966 | | | | 4,616 | | | | 11,816 | | | | 383 | | | | (153,707 | ) | | | (4,694 | ) | | | 9,075 | | | | 305 | |
| Class 529-B | | | 875 | | | | 27 | | | | — | | | | — | | | | (19,629 | ) | | | (610 | ) | | | (18,754 | ) | | | (583 | ) |
| Class 529-C | | | 36,198 | | | | 1,124 | | | | 777 | | | | 26 | | | | (42,307 | ) | | | (1,317 | ) | | | (5,332 | ) | | | (167 | ) |
| Class 529-E | | | 6,830 | | | | 210 | | | | 461 | | | | 15 | | | | (9,766 | ) | | | (302 | ) | | | (2,475 | ) | | | (77 | ) |
| Class 529-F-1 | | | 13,027 | | | | 396 | | | | 470 | | | | 16 | | | | (7,812 | ) | | | (235 | ) | | | 5,685 | | | | 177 | |
| Class R-1 | | | 16,836 | | | | 525 | | | | 272 | | | | 9 | | | | (24,022 | ) | | | (766 | ) | | | (6,914 | ) | | | (232 | ) |
| Class R-2 | | | 130,762 | | | | 4,064 | | | | 1,867 | | | | 61 | | | | (178,211 | ) | | | (5,562 | ) | | | (45,582 | ) | | | (1,437 | ) |
| Class R-3 | | | 391,534 | | | | 12,091 | | | | 10,920 | | | | 357 | | | | (366,015 | ) | | | (11,328 | ) | | | 36,439 | | | | 1,120 | |
| Class R-4 | | | 384,883 | | | | 11,848 | | | | 14,938 | | | | 486 | | | | (359,685 | ) | | | (11,051 | ) | | | 40,136 | | | | 1,283 | |
| Class R-5 | | | 353,755 | | | | 10,770 | | | | 16,834 | | | | 543 | | | | (584,025 | ) | | | (17,603 | ) | | | (213,436 | ) | | | (6,290 | ) |
| Class R-6 | | | 1,557,652 | | | | 46,728 | | | | 57,475 | | | | 1,850 | | | | (534,857 | ) | | | (16,065 | ) | | | 1,080,270 | | | | 32,513 | |
| Total net increase (decrease) | | $ | 6,490,147 | | | | 196,587 | | | $ | 448,373 | | | | 14,457 | | | $ | (7,249,544 | ) | | | (221,469 | ) | | $ | (311,024 | ) | | | (10,425 | ) |
| * | Includes exchanges between share classes of the fund. |
9. Investment transactions
The fund made purchases and sales of investment securities, excluding short-term securities and U.S. government obligations, if any, of $7,110,791,000 and $7,389,465,000, respectively, during the six months ended March 31, 2014.
Financial highlights
| | | | | | | | Income (loss) from investment operations1 | |
| | | | | Net asset
value,
beginning
of period | | | Net
investment
income | | | Net gains
(losses) on
securities
(both
realized and
unrealized) | | | Total from
investment
operations | |
| Class A: | | Six months ended 3/31/20144,5 | | $ | 36.52 | | | $ | .19 | | | $ | 3.00 | | | $ | 3.19 | |
| | | Year ended 9/30/2013 | | | 30.34 | | | | .34 | | | | 6.17 | | | | 6.51 | |
| | | Year ended 9/30/2012 | | | 24.88 | | | | .31 | | | | 5.44 | | | | 5.75 | |
| | | Year ended 9/30/2011 | | | 26.54 | | | | .29 | | | | (1.66 | ) | | | (1.37 | ) |
| | | Year ended 9/30/2010 | | | 24.63 | | | | .29 | | | | 1.93 | | | | 2.22 | |
| | | Year ended 9/30/2009 | | | 26.30 | | | | .31 | | | | .15 | | | | .46 | |
| Class B: | | Six months ended 3/31/20144,5 | | | 36.02 | | | | .03 | | | | 2.97 | | | | 3.00 | |
| | | Year ended 9/30/2013 | | | 29.86 | | | | .09 | | | | 6.10 | | | | 6.19 | |
| | | Year ended 9/30/2012 | | | 24.42 | | | | .08 | | | | 5.37 | | | | 5.45 | |
| | | Year ended 9/30/2011 | | | 26.02 | | | | .07 | | | | (1.63 | ) | | | (1.56 | ) |
| | | Year ended 9/30/2010 | | | 24.15 | | | | .08 | | | | 1.91 | | | | 1.99 | |
| | | Year ended 9/30/2009 | | | 25.70 | | | | .15 | | | | .18 | | | | .33 | |
| Class C: | | Six months ended 3/31/20144,5 | | | 35.43 | | | | .03 | | | | 2.92 | | | | 2.95 | |
| | | Year ended 9/30/2013 | | | 29.44 | | | | .08 | | | | 6.00 | | | | 6.08 | |
| | | Year ended 9/30/2012 | | | 24.12 | | | | .08 | | | | 5.29 | | | | 5.37 | |
| | | Year ended 9/30/2011 | | | 25.76 | | | | .06 | | | | (1.62 | ) | | | (1.56 | ) |
| | | Year ended 9/30/2010 | | | 23.95 | | | | .08 | | | | 1.88 | | | | 1.96 | |
| | | Year ended 9/30/2009 | | | 25.52 | | | | .15 | | | | .17 | | | | .32 | |
| Class F-1: | | Six months ended 3/31/20144,5 | | | 36.34 | | | | .17 | | | | 2.99 | | | | 3.16 | |
| | | Year ended 9/30/2013 | | | 30.19 | | | | .33 | | | | 6.14 | | | | 6.47 | |
| | | Year ended 9/30/2012 | | | 24.76 | | | | .31 | | | | 5.40 | | | | 5.71 | |
| | | Year ended 9/30/2011 | | | 26.42 | | | | .28 | | | | (1.65 | ) | | | (1.37 | ) |
| | | Year ended 9/30/2010 | | | 24.53 | | | | .28 | | | | 1.92 | | | | 2.20 | |
| | | Year ended 9/30/2009 | | | 26.20 | | | | .31 | | | | .15 | | | | .46 | |
| Class F-2: | | Six months ended 3/31/20144,5 | | | 36.52 | | | | .24 | | | | 3.00 | | | | 3.24 | |
| | | Year ended 9/30/2013 | | | 30.35 | | | | .44 | | | | 6.15 | | | | 6.59 | |
| | | Year ended 9/30/2012 | | | 24.90 | | | | .39 | | | | 5.42 | | | | 5.81 | |
| | | Year ended 9/30/2011 | | | 26.57 | | | | .36 | | | | (1.67 | ) | | | (1.31 | ) |
| | | Year ended 9/30/2010 | | | 24.67 | | | | .36 | | | | 1.92 | | | | 2.28 | |
| | | Year ended 9/30/2009 | | | 26.31 | | | | .28 | | | | .25 | | | | .53 | |
| Class 529-A: | | Six months ended 3/31/20144,5 | | | 36.20 | | | | .17 | | | | 2.97 | | | | 3.14 | |
| | | Year ended 9/30/2013 | | | 30.08 | | | | .32 | | | | 6.11 | | | | 6.43 | |
| | | Year ended 9/30/2012 | | | 24.68 | | | | .29 | | | | 5.38 | | | | 5.67 | |
| | | Year ended 9/30/2011 | | | 26.35 | | | | .27 | | | | (1.66 | ) | | | (1.39 | ) |
| | | Year ended 9/30/2010 | | | 24.46 | | | | .27 | | | | 1.92 | | | | 2.19 | |
| | | Year ended 9/30/2009 | | | 26.14 | | | | .30 | | | | .15 | | | | .45 | |
| Dividends and distributions | | | | | | | | | | | | | | | | | | | |
| | | | | | | | | | | | | | | | | | | Ratio of | | | Ratio of | | | | |
| | | | | | | | | | | | | | | | | | | expenses | | | expenses | | | Ratio | |
| Dividends | | | Distributions | | | Total | | | Net asset | | | | | | Net assets, | | | to average | | | to average | | | of net | |
| (from net | | | (from | | | dividends | | | value, | | | | | | end of | | | net assets | | | net assets | | | income to | |
| investment | | | capital | | | and | | | end of | | | Total | | | period | | | before | | | after | | | average | |
| income) | | | gains) | | | distributions | | | period | | | return2,3 | | | (in millions) | | | waivers | | | waivers3 | | | net assets3 | |
| $ | (.30 | ) | | $ | (1.75 | ) | | $ | (2.05 | ) | | $ | 37.66 | | | | 8.80 | % | | $ | 36,802 | | | | .76 | %6 | | | .76 | %6 | | | .99 | %6 |
| | (.33 | ) | | | — | | | | (.33 | ) | | | 36.52 | | | | 21.65 | | | | 34,514 | | | | .79 | | | | .79 | | | | 1.04 | |
| | (.29 | ) | | | — | | | | (.29 | ) | | | 30.34 | | | | 23.27 | | | | 29,906 | | | | .80 | | | | .80 | | | | 1.11 | |
| | (.29 | ) | | | — | | | | (.29 | ) | | | 24.88 | | | | (5.30 | ) | | | 26,896 | | | | .77 | | | | .77 | | | | 1.02 | |
| | (.31 | ) | | | — | | | | (.31 | ) | | | 26.54 | | | | 9.05 | | | | 31,425 | | | | .79 | | | | .79 | | | | 1.14 | |
| | (.55 | ) | | | (1.58 | ) | | | (2.13 | ) | | | 24.63 | | | | 4.66 | | | | 31,925 | | | | .85 | | | | .84 | | | | 1.54 | |
| | — | | | | (1.75 | ) | | | (1.75 | ) | | | 37.27 | | | | 8.38 | | | | 249 | | | | 1.51 | 6 | | | 1.51 | 6 | | | .18 | 6 |
| | (.03 | ) | | | — | | | | (.03 | ) | | | 36.02 | | | | 20.75 | | | | 287 | | | | 1.54 | | | | 1.54 | | | | .27 | |
| | (.01 | ) | | | — | | | | (.01 | ) | | | 29.86 | | | | 22.31 | | | | 370 | | | | 1.56 | | | | 1.56 | | | | .31 | |
| | (.04 | ) | | | — | | | | (.04 | ) | | | 24.42 | | | | (6.00 | ) | | | 507 | | | | 1.54 | | | | 1.54 | | | | .24 | |
| | (.12 | ) | | | — | | | | (.12 | ) | | | 26.02 | | | | 8.25 | | | | 769 | | | | 1.55 | | | | 1.55 | | | | .34 | |
| | (.30 | ) | | | (1.58 | ) | | | (1.88 | ) | | | 24.15 | | | | 3.85 | | | | 1,031 | | | | 1.60 | | | | 1.59 | | | | .78 | |
| | (.02 | ) | | | (1.75 | ) | | | (1.77 | ) | | | 36.61 | | | | 8.39 | | | | 1,413 | | | | 1.56 | 6 | | | 1.56 | 6 | | | .19 | 6 |
| | (.09 | ) | | | — | | | | (.09 | ) | | | 35.43 | | | | 20.69 | | | | 1,354 | | | | 1.59 | | | | 1.59 | | | | .24 | |
| | (.05 | ) | | | — | | | | (.05 | ) | | | 29.44 | | | | 22.27 | | | | 1,206 | | | | 1.60 | | | | 1.60 | | | | .30 | |
| | (.08 | ) | | | — | | | | (.08 | ) | | | 24.12 | | | | (6.08 | ) | | | 1,191 | | | | 1.58 | | | | 1.58 | | | | .22 | |
| | (.15 | ) | | | — | | | | (.15 | ) | | | 25.76 | | | | 8.19 | | | | 1,404 | | | | 1.59 | | | | 1.59 | | | | .34 | |
| | (.31 | ) | | | (1.58 | ) | | | (1.89 | ) | | | 23.95 | | | | 3.85 | | | | 1,365 | | | | 1.62 | | | | 1.61 | | | | .77 | |
| | (.28 | ) | | | (1.75 | ) | | | (2.03 | ) | | | 37.47 | | | | 8.76 | | | | 1,440 | | | | .82 | 6 | | | .82 | 6 | | | .93 | 6 |
| | (.32 | ) | | | — | | | | (.32 | ) | | | 36.34 | | | | 21.62 | | | | 1,385 | | | | .82 | | | | .82 | | | | 1.00 | |
| | (.28 | ) | | | — | | | | (.28 | ) | | | 30.19 | | | | 23.24 | | | | 1,131 | | | | .82 | | | | .82 | | | | 1.11 | |
| | (.29 | ) | | | — | | | | (.29 | ) | | | 24.76 | | | | (5.34 | ) | | | 946 | | | | .81 | | | | .81 | | | | 1.00 | |
| | (.31 | ) | | | — | | | | (.31 | ) | | | 26.42 | | | | 9.04 | | | | 1,002 | | | | .81 | | | | .81 | | | | 1.13 | |
| | (.55 | ) | | | (1.58 | ) | | | (2.13 | ) | | | 24.53 | | | | 4.67 | | | | 924 | | | | .83 | | | | .82 | | | | 1.55 | |
| | (.40 | ) | | | (1.75 | ) | | | (2.15 | ) | | | 37.61 | | | | 8.93 | | | | 1,636 | | | | .54 | 6 | | | .54 | 6 | | | 1.29 | 6 |
| | (.42 | ) | | | — | | | | (.42 | ) | | | 36.52 | | | | 21.97 | | | | 1,176 | | | | .54 | | | | .54 | | | | 1.31 | |
| | (.36 | ) | | | — | | | | (.36 | ) | | | 30.35 | | | | 23.56 | | | | 672 | | | | .54 | | | | .54 | | | | 1.37 | |
| | (.36 | ) | | | — | | | | (.36 | ) | | | 24.90 | | | | (5.10 | ) | | | 508 | | | | .55 | | | | .55 | | | | 1.28 | |
| | (.38 | ) | | | — | | | | (.38 | ) | | | 26.57 | | | | 9.32 | | | | 390 | | | | .55 | | | | .55 | | | | 1.42 | |
| | (.59 | ) | | | (1.58 | ) | | | (2.17 | ) | | | 24.67 | | | | 4.97 | | | | 282 | | | | .58 | | | | .57 | | | | 1.29 | |
| | (.27 | ) | | | (1.75 | ) | | | (2.02 | ) | | | 37.32 | | | | 8.75 | | | | 1,515 | | | | .85 | 6 | | | .85 | 6 | | | .91 | 6 |
| | (.31 | ) | | | — | | | | (.31 | ) | | | 36.20 | | | | 21.57 | | | | 1,379 | | | | .87 | | | | .87 | | | | .96 | |
| | (.27 | ) | | | — | | | | (.27 | ) | | | 30.08 | | | | 23.16 | | | | 1,137 | | | | .88 | | | | .88 | | | | 1.05 | |
| | (.28 | ) | | | — | | | | (.28 | ) | | | 24.68 | | | | (5.40 | ) | | | 911 | | | | .85 | | | | .85 | | | | .96 | |
| | (.30 | ) | | | — | | | | (.30 | ) | | | 26.35 | | | | 9.01 | | | | 911 | | | | .85 | | | | .85 | | | | 1.10 | |
| | (.55 | ) | | | (1.58 | ) | | | (2.13 | ) | | | 24.46 | | | | 4.62 | | | | 788 | | | | .89 | | | | .88 | | | | 1.50 | |
See page 29 for footnotes.
Financial highlights (continued)
| | | | | | | | Income (loss) from investment operations1 | |
| | | | | | | | | | | Net gains | | | | |
| | | | | | | | | | | (losses) on | | | | |
| | | | | Net asset | | | | | | securities | | | | |
| | | | | value, | | | Net | | | (both | | | Total from | |
| | | | | beginning | | | investment | | | realized and | | | investment | |
| | | | | of period | | | income | | | unrealized) | | | operations | |
| Class 529-B: | | Six months ended 3/31/20144,5 | | $ | 35.75 | | | $ | .01 | | | $ | 2.95 | | | $ | 2.96 | |
| | | Year ended 9/30/2013 | | | 29.64 | | | | .05 | | | | 6.06 | | | | 6.11 | |
| | | Year ended 9/30/2012 | | | 24.26 | | | | .05 | | | | 5.33 | | | | 5.38 | |
| | | Year ended 9/30/2011 | | | 25.87 | | | | .04 | | | | (1.63 | ) | | | (1.59 | ) |
| | | Year ended 9/30/2010 | | | 24.04 | | | | .06 | | | | 1.89 | | | | 1.95 | |
| | | Year ended 9/30/2009 | | | 25.64 | | | | .14 | | | | .16 | | | | .30 | |
| Class 529-C: | | Six months ended 3/31/20144,5 | | | 35.43 | | | | .02 | | | | 2.92 | | | | 2.94 | |
| | | Year ended 9/30/2013 | | | 29.46 | | | | .06 | | | | 6.00 | | | | 6.06 | |
| | | Year ended 9/30/2012 | | | 24.17 | | | | .07 | | | | 5.28 | | | | 5.35 | |
| | | Year ended 9/30/2011 | | | 25.82 | | | | .05 | | | | (1.62 | ) | | | (1.57 | ) |
| | | Year ended 9/30/2010 | | | 24.01 | | | | .07 | | | | 1.88 | | | | 1.95 | |
| | | Year ended 9/30/2009 | | | 25.62 | | | | .14 | | | | .16 | | | | .30 | |
| Class 529-E: | | Six months ended 3/31/20144,5 | | | 35.87 | | | | .12 | | | | 2.96 | | | | 3.08 | |
| | | Year ended 9/30/2013 | | | 29.81 | | | | .23 | | | | 6.07 | | | | 6.30 | |
| | | Year ended 9/30/2012 | | | 24.46 | | | | .22 | | | | 5.33 | | | | 5.55 | |
| | | Year ended 9/30/2011 | | | 26.11 | | | | .19 | | | | (1.63 | ) | | | (1.44 | ) |
| | | Year ended 9/30/2010 | | | 24.26 | | | | .20 | | | | 1.89 | | | | 2.09 | |
| | | Year ended 9/30/2009 | | | 25.91 | | | | .24 | | | | .16 | | | | .40 | |
| Class 529-F-1: | | Six months ended 3/31/20144,5 | | | 36.18 | | | | .21 | | | | 2.97 | | | | 3.18 | |
| | | Year ended 9/30/2013 | | | 30.07 | | | | .39 | | | | 6.10 | | | | 6.49 | |
| | | Year ended 9/30/2012 | | | 24.68 | | | | .36 | | | | 5.37 | | | | 5.73 | |
| | | Year ended 9/30/2011 | | | 26.34 | | | | .35 | | | | (1.67 | ) | | | (1.32 | ) |
| | | Year ended 9/30/2010 | | | 24.44 | | | | .33 | | | | 1.92 | | | | 2.25 | |
| | | Year ended 9/30/2009 | | | 26.15 | | | | .34 | | | | .14 | | | | .48 | |
| Class R-1: | | Six months ended 3/31/20144,5 | | | 35.21 | | | | .04 | | | | 2.90 | | | | 2.94 | |
| | | Year ended 9/30/2013 | | | 29.27 | | | | .08 | | | | 5.96 | | | | 6.04 | |
| | | Year ended 9/30/2012 | | | 24.01 | | | | .10 | | | | 5.24 | | | | 5.34 | |
| | | Year ended 9/30/2011 | | | 25.66 | | | | .07 | | | | (1.61 | ) | | | (1.54 | ) |
| | | Year ended 9/30/2010 | | | 23.87 | | | | .09 | | | | 1.87 | | | | 1.96 | |
| | | Year ended 9/30/2009 | | | 25.51 | | | | .15 | | | | .15 | | | | .30 | |
| Dividends and distributions | | | | | | | | | | | | | | | | | | | |
| | | | | | | | | | | | | | | | | | | Ratio of | | | Ratio of | | | | |
| | | | | | | | | | | | | | | | | | | expenses | | | expenses | | | Ratio | |
| Dividends | | | Distributions | | | Total | | | Net asset | | | | | | Net assets, | | | to average | | | to average | | | of net | |
| (from net | | | (from | | | dividends | | | value, | | | | | | end of | | | net assets | | | net assets | | | income to | |
| investment | | | capital | | | and | | | end of | | | Total | | | period | | | before | | | after | | | average | |
| income) | | | gains) | | | distributions | | | period | | | return2,3 | | | (in millions) | | | waivers | | | waivers3 | | | net assets3 | |
| $ | — | | | $ | (1.75 | ) | | $ | (1.75 | ) | | $ | 36.96 | | | | 8.33 | % | | $ | 35 | | | | 1.65 | %6 | | | 1.65 | %6 | | | .05 | %6 |
| | — | | | | — | | | | — | | | | 35.75 | | | | 20.61 | | | | 40 | | | | 1.66 | | | | 1.66 | | | | .15 | |
| | — | | | | — | | | | — | | | | 29.64 | | | | 22.18 | | | | 51 | | | | 1.68 | | | | 1.68 | | | | .20 | |
| | (.02 | ) | | | — | | | | (.02 | ) | | | 24.26 | | | | (6.15 | ) | | | 64 | | | | 1.65 | | | | 1.65 | | | | .13 | |
| | (.12 | ) | | | — | | | | (.12 | ) | | | 25.87 | | | | 8.14 | | | | 92 | | | | 1.65 | | | | 1.65 | | | | .26 | |
| | (.32 | ) | | | (1.58 | ) | | | (1.90 | ) | | | 24.04 | | | | 3.77 | | | | 109 | | | | 1.71 | | | | 1.70 | | | | .69 | |
| | (.01 | ) | | | (1.75 | ) | | | (1.76 | ) | | | 36.61 | | | | 8.35 | | | | 344 | | | | 1.64 | 6 | | | 1.64 | 6 | | | .12 | 6 |
| | (.09 | ) | | | — | | | | (.09 | ) | | | 35.43 | | | | 20.61 | | | | 317 | | | | 1.66 | | | | 1.66 | | | | .17 | |
| | (.06 | ) | | | — | | | | (.06 | ) | | | 29.46 | | | | 22.16 | | | | 268 | | | | 1.67 | | | | 1.67 | | | | .25 | |
| | (.08 | ) | | | — | | | | (.08 | ) | | | 24.17 | | | | (6.11 | ) | | | 220 | | | | 1.64 | | | | 1.64 | | | | .17 | |
| | (.14 | ) | | | — | | | | (.14 | ) | | | 25.82 | | | | 8.13 | | | | 227 | | | | 1.65 | | | | 1.65 | | | | .30 | |
| | (.33 | ) | | | (1.58 | ) | | | (1.91 | ) | | | 24.01 | | | | 3.77 | | | | 205 | | | | 1.70 | | | | 1.69 | | | | .70 | |
| | (.19 | ) | | | (1.75 | ) | | | (1.94 | ) | | | 37.01 | | | | 8.64 | | | | 73 | | | | 1.10 | 6 | | | 1.10 | 6 | | | .65 | 6 |
| | (.24 | ) | | | — | | | | (.24 | ) | | | 35.87 | | | | 21.27 | | | | 68 | | | | 1.12 | | | | 1.12 | | | | .71 | |
| | (.20 | ) | | | — | | | | (.20 | ) | | | 29.81 | | | | 22.81 | | | | 59 | | | | 1.14 | | | | 1.14 | | | | .78 | |
| | (.21 | ) | | | — | | | | (.21 | ) | | | 24.46 | | | | (5.62 | ) | | | 49 | | | | 1.13 | | | | 1.13 | | | | .68 | |
| | (.24 | ) | | | — | | | | (.24 | ) | | | 26.11 | | | | 8.66 | | | | 51 | | | | 1.14 | | | | 1.14 | | | | .81 | |
| | (.47 | ) | | | (1.58 | ) | | | (2.05 | ) | | | 24.26 | | | | 4.34 | | | | 45 | | | | 1.19 | | | | 1.18 | | | | 1.21 | |
| | (.35 | ) | | | (1.75 | ) | | | (2.10 | ) | | | 37.26 | | | | 8.87 | | | | 58 | | | | .64 | 6 | | | .64 | 6 | | | 1.14 | 6 |
| | (.38 | ) | | | — | | | | (.38 | ) | | | 36.18 | | | | 21.80 | | | | 50 | | | | .65 | | | | .65 | | | | 1.18 | |
| | (.34 | ) | | | — | | | | (.34 | ) | | | 30.07 | | | | 23.43 | | | | 36 | | | | .67 | | | | .67 | | | | 1.27 | |
| | (.34 | ) | | | — | | | | (.34 | ) | | | 24.68 | | | | (5.18 | ) | | | 26 | | | | .64 | | | | .64 | | | | 1.22 | |
| | (.35 | ) | | | — | | | | (.35 | ) | | | 26.34 | | | | 9.25 | | | | 20 | | | | .64 | | | | .64 | | | | 1.32 | |
| | (.61 | ) | | | (1.58 | ) | | | (2.19 | ) | | | 24.44 | | | | 4.83 | | | | 15 | | | | .69 | | | | .68 | | | | 1.70 | |
| | (.05 | ) | | | (1.75 | ) | | | (1.80 | ) | | | 36.35 | | | | 8.39 | | | | 103 | | | | 1.55 | 6 | | | 1.55 | 6 | | | .22 | 6 |
| | (.10 | ) | | | — | | | | (.10 | ) | | | 35.21 | | | | 20.70 | | | | 92 | | | | 1.56 | | | | 1.56 | | | | .26 | |
| | (.08 | ) | | | — | | | | (.08 | ) | | | 29.27 | | | | 22.30 | | | | 83 | | | | 1.57 | | | | 1.57 | | | | .36 | |
| | (.11 | ) | | | — | | | | (.11 | ) | | | 24.01 | | | | (6.06 | ) | | | 67 | | | | 1.57 | | | | 1.57 | | | | .25 | |
| | (.17 | ) | | | — | | | | (.17 | ) | | | 25.66 | | | | 8.24 | | | | 69 | | | | 1.58 | | | | 1.58 | | | | .39 | |
| | (.36 | ) | | | (1.58 | ) | | | (1.94 | ) | | | 23.87 | | | | 3.84 | | | | 53 | | | | 1.61 | | | | 1.60 | | | | .78 | |
See page 29 for footnotes.
Financial highlights (continued)
| | | | | | | | Income (loss) from investment operations1 | |
| | | | | | | | | | | Net gains | | | | |
| | | | | | | | | | | (losses) on | | | | |
| | | | | Net asset | | | | | | securities | | | | |
| | | | | value, | | | Net | | | (both | | | Total from | |
| | | | | beginning | | | investment | | | realized and | | | investment | |
| | | | | of period | | | income | | | unrealized) | | | operations | |
| Class R-2: | | Six months ended 3/31/20144,5 | | $ | 35.46 | | | $ | .04 | | | $ | 2.92 | | | $ | 2.96 | |
| | | Year ended 9/30/2013 | | | 29.47 | | | | .10 | | | | 6.00 | | | | 6.10 | |
| | | Year ended 9/30/2012 | | | 24.15 | | | | .09 | | | | 5.29 | | | | 5.38 | |
| | | Year ended 9/30/2011 | | | 25.79 | | | | .07 | | | | (1.62 | ) | | | (1.55 | ) |
| | | Year ended 9/30/2010 | | | 23.97 | | | | .08 | | | | 1.88 | | | | 1.96 | |
| | | Year ended 9/30/2009 | | | 25.58 | | | | .13 | | | | .17 | | | | .30 | |
| Class R-3: | | Six months ended 3/31/20144,5 | | | 35.83 | | | | .12 | | | | 2.95 | | | | 3.07 | |
| | | Year ended 9/30/2013 | | | 29.79 | | | | .24 | | | | 6.05 | | | | 6.29 | |
| | | Year ended 9/30/2012 | | | 24.43 | | | | .22 | | | | 5.34 | | | | 5.56 | |
| | | Year ended 9/30/2011 | | | 26.08 | | | | .20 | | | | (1.64 | ) | | | (1.44 | ) |
| | | Year ended 9/30/2010 | | | 24.23 | | | | .20 | | | | 1.90 | | | | 2.10 | |
| | | Year ended 9/30/2009 | | | 25.88 | | | | .25 | | | | .15 | | | | .40 | |
| Class R-4: | | Six months ended 3/31/20144,5 | | | 36.14 | | | | .18 | | | | 2.98 | | | | 3.16 | |
| | | Year ended 9/30/2013 | | | 30.04 | | | | .34 | | | | 6.10 | | | | 6.44 | |
| | | Year ended 9/30/2012 | | | 24.64 | | | | .31 | | | | 5.37 | | | | 5.68 | |
| | | Year ended 9/30/2011 | | | 26.30 | | | | .29 | | | | (1.66 | ) | | | (1.37 | ) |
| | | Year ended 9/30/2010 | | | 24.43 | | | | .28 | | | | 1.91 | | | | 2.19 | |
| | | Year ended 9/30/2009 | | | 26.12 | | | | .31 | | | | .14 | | | | .45 | |
| Class R-5: | | Six months ended 3/31/20144,5 | | | 36.55 | | | | .24 | | | | 3.01 | | | | 3.25 | |
| | | Year ended 9/30/2013 | | | 30.37 | | | | .45 | | | | 6.15 | | | | 6.60 | |
| | | Year ended 9/30/2012 | | | 24.91 | | | | .40 | | | | 5.43 | | | | 5.83 | |
| | | Year ended 9/30/2011 | | | 26.57 | | | | .37 | | | | (1.66 | ) | | | (1.29 | ) |
| | | Year ended 9/30/2010 | | | 24.66 | | | | .32 | | | | 1.97 | | | | 2.29 | |
| | | Year ended 9/30/2009 | | | 26.36 | | | | .38 | | | | .14 | | | | .52 | |
| Class R-6: | | Six months ended 3/31/20144,5 | | | 36.60 | | | | .25 | | | | 3.01 | | | | 3.26 | |
| | | Year ended 9/30/2013 | | | 30.41 | | | | .46 | | | | 6.17 | | | | 6.63 | |
| | | Year ended 9/30/2012 | | | 24.95 | | | | .41 | | | | 5.43 | | | | 5.84 | |
| | | Year ended 9/30/2011 | | | 26.61 | | | | .40 | | | | (1.68 | ) | | | (1.28 | ) |
| | | Year ended 9/30/2010 | | | 24.67 | | | | .41 | | | | 1.89 | | | | 2.30 | |
| | | Period from 5/1/2009 to 9/30/20094,7 | | | 19.28 | | | | .17 | | | | 5.22 | | | | 5.39 | |
| | | Six months ended | | Year ended September 30 |
| | | March 31, 20144,5 | | 2013 | | 2012 | | 2011 | | 2010 | | 2009 |
| Portfolio turnover rate for all share classes | | | 14 | % | | | 30 | % | | | 16 | % | | | 24 | % | | | 24 | % | | | 32 | % |
| Dividends and distributions | | | | | | | | | | | | | | | | | | | |
| | | | | | | | | | | | | | | | | | | Ratio of | | | Ratio of | | | | |
| | | | | | | | | | | | | | | | | | | expenses | | | expenses | | | Ratio | |
| Dividends | | | Distributions | | | Total | | | Net asset | | | | | | Net assets, | | | to average | | | to average | | | of net | |
| (from net | | | (from | | | dividends | | | value, | | | | | | end of | | | net assets | | | net assets | | | income to | |
| investment | | | capital | | | and | | | end of | | | Total | | | period | | | before | | | after | | | average | |
| income) | | | gains) | | | distributions | | | period | | | return2,3 | | | (in millions) | | | waivers | | | waivers3 | | | net assets3 | |
| $ | (.04 | ) | | $ | (1.75 | ) | | $ | (1.79 | ) | | $ | 36.63 | | | | 8.39 | % | | $ | 622 | | | | 1.54 | %6 | | | 1.54 | %6 | | | .21 | %6 |
| | (.11 | ) | | | — | | | | (.11 | ) | | | 35.46 | | | | 20.74 | | | | 599 | | | | 1.53 | | | | 1.53 | | | | .30 | |
| | (.06 | ) | | | — | | | | (.06 | ) | | | 29.47 | | | | 22.32 | | | | 540 | | | | 1.58 | | | | 1.58 | | | | .33 | |
| | (.09 | ) | | | — | | | | (.09 | ) | | | 24.15 | | | | (6.07 | ) | | | 492 | | | | 1.57 | | | | 1.57 | | | | .24 | |
| | (.14 | ) | | | — | | | | (.14 | ) | | | 25.79 | | | | 8.20 | | | | 563 | | | | 1.61 | | | | 1.61 | | | | .33 | |
| | (.33 | ) | | | (1.58 | ) | | | (1.91 | ) | | | 23.97 | | | | 3.77 | | | | 544 | | | | 1.71 | | | | 1.70 | | | | .68 | |
| | (.19 | ) | | | (1.75 | ) | | | (1.94 | ) | | | 36.96 | | | | 8.64 | | | | 1,722 | | | | 1.11 | 6 | | | 1.11 | 6 | | | .65 | 6 |
| | (.25 | ) | | | — | | | | (.25 | ) | | | 35.83 | | | | 21.25 | | | | 1,625 | | | | 1.11 | | | | 1.11 | | | | .73 | |
| | (.20 | ) | | | — | | | | (.20 | ) | | | 29.79 | | | | 22.87 | | | | 1,317 | | | | 1.12 | | | | 1.12 | | | | .80 | |
| | (.21 | ) | | | — | | | | (.21 | ) | | | 24.43 | | | | (5.62 | ) | | | 1,068 | | | | 1.11 | | | | 1.11 | | | | .70 | |
| | (.25 | ) | | | — | | | | (.25 | ) | | | 26.08 | | | | 8.71 | | | | 1,159 | | | | 1.12 | | | | 1.12 | | | | .82 | |
| | (.47 | ) | | | (1.58 | ) | | | (2.05 | ) | | | 24.23 | | | | 4.36 | | | | 1,095 | | | | 1.15 | | | | 1.14 | | | | 1.25 | |
| | (.30 | ) | | | (1.75 | ) | | | (2.05 | ) | | | 37.25 | | | | 8.81 | | | | 1,858 | | | | .80 | 6 | | | .80 | 6 | | | .98 | 6 |
| | (.34 | ) | | | — | | | | (.34 | ) | | | 36.14 | | | | 21.63 | | | | 1,643 | | | | .80 | | | | .80 | | | | 1.03 | |
| | (.28 | ) | | | — | | | | (.28 | ) | | | 30.04 | | | | 23.25 | | | | 1,327 | | | | .81 | | | | .81 | | | | 1.12 | |
| | (.29 | ) | | | — | | | | (.29 | ) | | | 24.64 | | | | (5.34 | ) | | | 1,039 | | | | .81 | | | | .81 | | | | 1.01 | |
| | (.32 | ) | | | — | | | | (.32 | ) | | | 26.30 | | | | 9.01 | | | | 1,039 | | | | .81 | | | | .81 | | | | 1.12 | |
| | (.56 | ) | | | (1.58 | ) | | | (2.14 | ) | | | 24.43 | | | | 4.68 | | | | 905 | | | | .83 | | | | .82 | | | | 1.54 | |
| | (.40 | ) | | | (1.75 | ) | | | (2.15 | ) | | | 37.65 | | | | 8.96 | | | | 1,446 | | | | .49 | 6 | | | .49 | 6 | | | 1.28 | 6 |
| | (.42 | ) | | | — | | | | (.42 | ) | | | 36.55 | | | | 21.99 | | | | 1,278 | | | | .50 | | | | .50 | | | | 1.35 | |
| | (.37 | ) | | | — | | | | (.37 | ) | | | 30.37 | | | | 23.64 | | | | 1,253 | | | | .50 | | | | .50 | | | | 1.41 | |
| | (.37 | ) | | | — | | | | (.37 | ) | | | 24.91 | | | | (5.04 | ) | | | 1,037 | | | | .51 | | | | .51 | | | | 1.29 | |
| | (.38 | ) | | | — | | | | (.38 | ) | | | 26.57 | | | | 9.34 | | | | 1,241 | | | | .51 | | | | .51 | | | | 1.29 | |
| | (.64 | ) | | | (1.58 | ) | | | (2.22 | ) | | | 24.66 | | | | 5.00 | | | | 2,386 | | | | .53 | | | | .52 | | | | 1.87 | |
| | (.42 | ) | | | (1.75 | ) | | | (2.17 | ) | | | 37.69 | | | | 8.98 | | | | 6,832 | | | | .45 | 6 | | | .45 | 6 | | | 1.33 | 6 |
| | (.44 | ) | | | — | | | | (.44 | ) | | | 36.60 | | | | 22.05 | | | | 5,887 | | | | .45 | | | | .45 | | | | 1.38 | |
| | (.38 | ) | | | — | | | | (.38 | ) | | | 30.41 | | | | 23.67 | | | | 3,902 | | | | .46 | | | | .46 | | | | 1.47 | |
| | (.38 | ) | | | — | | | | (.38 | ) | | | 24.95 | | | | (4.99 | ) | | | 2,896 | | | | .46 | | | | .46 | | | | 1.38 | |
| | (.36 | ) | | | — | | | | (.36 | ) | | | 26.61 | | | | 9.40 | | | | 2,437 | | | | .46 | | | | .46 | | | | 1.63 | |
| | — | | | | — | | | | — | | | | 24.67 | | | | 27.96 | | | | 450 | | | | .21 | | | | .21 | | | | .76 | |
| 1 | Based on average shares outstanding. |
| 2 | Total returns exclude any applicable sales charges, including contingent deferred sales charges. |
| 3 | This column reflects the impact, if any, of certain waivers from CRMC. During one of the periods shown, CRMC reduced fees for investment advisory services. |
| 4 | Based on operations for the period shown and, accordingly, is not representative of a full year. |
| 5 | Unaudited. |
| 6 | Annualized. |
| 7 | Class R-6 shares were offered beginning May 1, 2009. |
See Notes to Financial Statements
As a fund shareholder, you incur two types of costs: (1) transaction costs, such as initial sales charges on purchase payments and contingent deferred sales charges on redemptions (loads), and (2) ongoing costs, including management fees, distribution and service (12b-1) fees, and other expenses. This example is intended to help you understand your ongoing costs (in dollars) of investing in the fund so you can compare these costs with the ongoing costs of investing in other mutual funds. The example is based on an investment of $1,000 invested at the beginning of the period and held for the entire six-month period (October 1, 2013, through March 31, 2014).
Actual expenses:
The first line of each share class in the table on the following page provides information about actual account values and actual expenses. You may use the information in this line, together with the amount you invested, to estimate the expenses that you paid over the period. Simply divide your account value by $1,000 (for example, an $8,600 account value divided by $1,000 = 8.6), then multiply the result by the number in the first line under the heading entitled “Expenses paid during period” to estimate the expenses you paid on your account during this period.
Hypothetical example for comparison purposes:
The second line of each share class in the table on the following page provides information about hypothetical account values and hypothetical expenses based on the actual expense ratio for the share class and an assumed rate of return of 5.00% per year before expenses, which is not the actual return of the share class. The hypothetical account values and expenses may not be used to estimate the actual ending account balance or expenses you paid for the period. You may use this information to compare the ongoing costs of investing in the fund and other funds. To do so, compare this 5.00% hypothetical example with the 5.00% hypothetical examples that appear in the shareholder reports of the other funds.
Notes:
There are some account fees that are charged to certain types of accounts, such as individual retirement accounts and 529 college savings plan accounts (generally, a $10 fee is charged to set up the account and an additional $10 fee is charged to the account annually), that would increase the amount of expenses paid on your account. In addition, retirement plan participants may be subject to certain fees charged by the plan sponsor, and Class F-1, F-2 and 529-F-1 shareholders may be subject to fees charged by financial intermediaries, typically ranging from 0.75% to 1.50% of assets annually depending on services offered. You can estimate the impact of these fees by adding the amount of the fees to the total estimated expenses you paid on your account during the period as calculated above. In addition, your ending account value would be lower by the amount of these fees.
Note that the expenses shown in the table on the following page are meant to highlight your ongoing costs only and do not reflect any transactional costs, such as sales charges (loads). Therefore, the second line of each share class in the table is useful in comparing ongoing costs only and will not help you determine the relative total costs of owning different funds. In addition, if these transactional costs were included, your costs would have been higher.
| | | Beginning
account value
10/1/2013 | | | Ending
account value
3/31/2014 | | | Expenses
paid during
period* | | | Annualized
expense
ratio | |
| Class A — actual return | | $ | 1,000.00 | | | $ | 1,088.04 | | | $ | 3.96 | | | | .76 | % |
| Class A — assumed 5% return | | | 1,000.00 | | | | 1,021.14 | | | | 3.83 | | | | .76 | |
| Class B — actual return | | | 1,000.00 | | | | 1,083.77 | | | | 7.84 | | | | 1.51 | |
| Class B — assumed 5% return | | | 1,000.00 | | | | 1,017.40 | | | | 7.59 | | | | 1.51 | |
| Class C — actual return | | | 1,000.00 | | | | 1,083.88 | | | | 8.10 | | | | 1.56 | |
| Class C — assumed 5% return | | | 1,000.00 | | | | 1,017.15 | | | | 7.85 | | | | 1.56 | |
| Class F-1 — actual return | | | 1,000.00 | | | | 1,087.60 | | | | 4.27 | | | | .82 | |
| Class F-1 — assumed 5% return | | | 1,000.00 | | | | 1,020.84 | | | | 4.13 | | | | .82 | |
| Class F-2 — actual return | | | 1,000.00 | | | | 1,089.34 | | | | 2.81 | | | | .54 | |
| Class F-2 — assumed 5% return | | | 1,000.00 | | | | 1,022.24 | | | | 2.72 | | | | .54 | |
| Class 529-A — actual return | | | 1,000.00 | | | | 1,087.54 | | | | 4.42 | | | | .85 | |
| Class 529-A — assumed 5% return | | | 1,000.00 | | | | 1,020.69 | | | | 4.28 | | | | .85 | |
| Class 529-B — actual return | | | 1,000.00 | | | | 1,083.30 | | | | 8.57 | | | | 1.65 | |
| Class 529-B — assumed 5% return | | | 1,000.00 | | | | 1,016.70 | | | | 8.30 | | | | 1.65 | |
| Class 529-C — actual return | | | 1,000.00 | | | | 1,083.47 | | | | 8.52 | | | | 1.64 | |
| Class 529-C — assumed 5% return | | | 1,000.00 | | | | 1,016.75 | | | | 8.25 | | | | 1.64 | |
| Class 529-E — actual return | | | 1,000.00 | | | | 1,086.35 | | | | 5.72 | | | | 1.10 | |
| Class 529-E — assumed 5% return | | | 1,000.00 | | | | 1,019.45 | | | | 5.54 | | | | 1.10 | |
| Class 529-F-1 — actual return | | | 1,000.00 | | | | 1,088.70 | | | | 3.33 | | | | .64 | |
| Class 529-F-1 — assumed 5% return | | | 1,000.00 | | | | 1,021.74 | | | | 3.23 | | | | .64 | |
| Class R-1 — actual return | | | 1,000.00 | | | | 1,083.88 | | | | 8.05 | | | | 1.55 | |
| Class R-1 — assumed 5% return | | | 1,000.00 | | | | 1,017.20 | | | | 7.80 | | | | 1.55 | |
| Class R-2 — actual return | | | 1,000.00 | | | | 1,083.92 | | | | 8.00 | | | | 1.54 | |
| Class R-2 — assumed 5% return | | | 1,000.00 | | | | 1,017.25 | | | | 7.75 | | | | 1.54 | |
| Class R-3 — actual return | | | 1,000.00 | | | | 1,086.37 | | | | 5.77 | | | | 1.11 | |
| Class R-3 — assumed 5% return | | | 1,000.00 | | | | 1,019.40 | | | | 5.59 | | | | 1.11 | |
| Class R-4 — actual return | | | 1,000.00 | | | | 1,088.07 | | | | 4.16 | | | | .80 | |
| Class R-4 — assumed 5% return | | | 1,000.00 | | | | 1,020.94 | | | | 4.03 | | | | .80 | |
| Class R-5 — actual return | | | 1,000.00 | | | | 1,089.63 | | | | 2.55 | | | | .49 | |
| Class R-5 — assumed 5% return | | | 1,000.00 | | | | 1,022.49 | | | | 2.47 | | | | .49 | |
| Class R-6 — actual return | | | 1,000.00 | | | | 1,089.81 | | | | 2.34 | | | | .45 | |
| Class R-6 — assumed 5% return | | | 1,000.00 | | | | 1,022.69 | | | | 2.27 | | | | .45 | |
| * | The “expenses paid during period” are equal to the “annualized expense ratio,” multiplied by the average account value over the period, multiplied by the number of days in the period, and divided by 365 (to reflect the one-half year period). |
Approval of Investment Advisory and Service Agreement
New Perspective Fund’s board has approved the fund’s Investment Advisory and Service Agreement (the “agreement”) with Capital Research and Management Company (“CRMC”) for an additional one-year term through December 31, 2014. The board approved the agreement following the recommendation of the fund’s Contracts Committee (the “committee”), which is composed of all of the fund’s independent board members. The board and the committee determined that the fund’s advisory fee structure was fair and reasonable in relation to the services provided and that approving the agreement was in the best interests of the fund and its shareholders.
In reaching this decision, the board and the committee took into account information furnished to them throughout the year and otherwise provided to them, as well as information prepared specifically in connection with their review of the agreement, and were advised by their independent counsel. They considered the following factors, among others, but did not identify any single issue or particular piece of information that, in isolation, was the controlling factor, and each board and committee member did not necessarily attribute the same weight to each factor.
1. Nature, extent and quality of services
The board and the committee considered the depth and quality of CRMC’s investment management process, including its global research capabilities; the experience, capability and integrity of its senior management and other personnel; the low turnover rates of its key personnel; the overall financial strength and stability of it and the Capital organization; and the ongoing evolution of CRMC’s organizational structure designed to maintain and strengthen these qualities. The board and the committee also considered the nature, extent and quality of administrative, compliance and shareholder services provided by CRMC to the fund under the agreement and other agreements, as well as the benefits to fund shareholders from investing in a fund that is part of a large family of funds. The board and the committee concluded that the nature, extent and quality of the services provided by CRMC have benefited and should continue to benefit the fund and its shareholders.
2. Investment results
The board and the committee considered the investment results of the fund in light of its objective of providing long-term growth of capital and secondary objective of future income. They compared the fund’s investment results with those of other relevant funds (including funds that form the basis of the Lipper index for the category in which the fund is included), and data such as relevant market and fund indexes, over various periods through June 30, 2013. This report, including the letter to shareholders and related disclosures, contains certain information about the fund’s investment results. The board and the committee reviewed the fund’s investment results measured against various indexes, including the Lipper Global Funds Index, the MSCI All Country World Index and the MSCI World Index. They noted that the investment results of the fund compared favorably to those of these indexes for the 20-year, 10-year and five-year periods. The board and the committee concluded that the fund’s investment results have been satisfactory and that CRMC’s record in managing the fund indicated that its continued management should benefit the fund and its shareholders.
3. Advisory fees and total expenses
The board and the committee compared the advisory fees and total expense levels of the fund to those of other relevant funds. They observed that the fund’s advisory fees and expenses generally compared favorably to those of other similar funds included in the Lipper Global Funds Index category. The board and the committee also considered the breakpoint discounts in the fund’s advisory fee structure that reduce the level of fees charged by CRMC to the fund as fund assets increase. In addition, they reviewed information regarding the effective advisory fees charged to non-mutual fund clients by CRMC and its affiliates. They noted that, to the extent there were differences between the advisory fees paid by the fund and the advisory fees paid by those clients, the differences appropriately reflected the investment, operational and regulatory differences between advising the fund and the other clients. The board and the committee concluded that the fund’s cost structure was fair and reasonable in relation to the services provided, and that the fund’s shareholders receive reasonable value in return for the advisory fees and other amounts paid to CRMC by the fund.
4. Ancillary benefits
The board and the committee considered a variety of other benefits that CRMC and its affiliates receive as a result of CRMC’s relationship with the fund and the other American Funds, including fees for administrative services provided to certain share classes; fees paid to CRMC’s affiliated transfer agent; sales charges and distribution fees received and retained by the fund’s principal underwriter, an affiliate of CRMC; and possible ancillary benefits to CRMC and its institutional management affiliates in managing other investment vehicles. The board and the committee reviewed CRMC’s portfolio trading practices, noting that while CRMC receives the benefit of research provided by broker-dealers executing portfolio transactions on behalf of the fund, it does not obtain third-party research or other services in return for allocating brokerage to such broker-dealers. The board and the committee took these ancillary benefits into account in evaluating the reasonableness of the advisory fees and other amounts paid to CRMC by the fund.
5. Adviser financial information
The board and the committee reviewed information regarding CRMC’s costs of providing services to the American Funds, including personnel, systems and resources of investment, compliance, trading, accounting and other administrative operations. They considered CRMC’s costs and willingness to invest in technology, infrastructure and staff to maintain and expand services and capabilities, respond to industry and regulatory developments, and attract and retain qualified personnel. They noted information regarding the compensation structure for CRMC’s investment professionals. The board and the committee also compared CRMC’s profitability and compensation data to the reported results and data of several large, publicly-held investment management companies. The board and the committee noted the competitiveness and cyclicality of both the mutual fund industry and the capital markets, and the importance in that environment of CRMC’s long-term profitability for maintaining its independence, company culture and management continuity. They further considered the breakpoint discounts in the fund’s advisory fee structure. The board and the committee concluded that the fund’s advisory fee structure reflected a reasonable sharing of benefits between CRMC and the fund’s shareholders.
Offices of the fund and of the investment adviser
Capital Research and Management Company
333 South Hope Street
Los Angeles, CA 90071-1406
6455 Irvine Center Drive
Irvine, CA 92618-4518
Transfer agent for shareholder accounts
American Funds Service Company
(Write to the address near you.)
P.O. Box 6007
Indianapolis, IN 46206-6007
P.O. Box 2280
Norfolk, VA 23501-2280
Custodian of assets
JPMorgan Chase Bank
270 Park Avenue
New York, NY 10017-2070
Counsel
K&L Gates LLP
Four Embarcadero Center, Suite 1200
San Francisco, CA 94111-5994
Independent registered public accounting firm
PricewaterhouseCoopers LLP
601 South Figueroa Street
Los Angeles, CA 90017-3874
Principal underwriter
American Funds Distributors, Inc.
333 South Hope Street
Los Angeles, CA 90071-1406
This page was intentionally left blank.
This page was intentionally left blank.
Investors should carefully consider investment objectives, risks, charges and expenses. This and other important information is contained in the fund prospectus and summary prospectus, which can be obtained from your financial professional and should be read carefully before investing. You may also call American Funds Service Company (AFS) at (800) 421-4225 or visit the American Funds website at americanfunds.com.
“American Funds Proxy Voting Procedures and Principles” — which describes how we vote proxies relating to portfolio securities — is available on the American Funds website or upon request by calling AFS. The fund files its proxy voting record with the U.S. Securities and Exchange Commission (SEC) for the 12 months ended June 30 by August 31. The proxy voting record is available free of charge on the SEC website at sec.gov and on the American Funds website.
A complete March 31, 2014, portfolio of New Perspective Fund’s investments is available free of charge by calling AFS or visiting the SEC website (where it is part of Form N-CSR).
New Perspective Fund files a complete list of its portfolio holdings with the SEC for the first and third quarters of each fiscal year on Form N-Q. This filing is available free of charge on the SEC website. You may also review or, for a fee, copy this filing at the SEC’s Public Reference Room in Washington, D.C. Additional information regarding the operation of the Public Reference Room may be obtained by calling the SEC’s Office of Investor Education and Advocacy at (800) SEC-0330. Additionally, the list of portfolio holdings is available by calling AFS.
This report is for the information of shareholders of New Perspective Fund, but it also may be used as sales literature when preceded or accompanied by the current prospectus or summary prospectus, which gives details about charges, expenses, investment objectives and operating policies of the fund. If used as sales material after June 30, 2014, this report must be accompanied by an American Funds statistical update for the most recently completed calendar quarter.
The American Funds Advantage
Since 1931, American Funds, part of Capital Group, has helped investors pursue long-term investment success. Our consistent approach — in combination with The Capital SystemSM — has resulted in a superior long-term track record.
| | Aligned with investor success |
| | We base our decisions on a long-term perspective, which we believe aligns our goals with the interests of our clients. Our portfolio managers average 25 years of investment experience, including 21 years at our company, reflecting a career commitment to our long-term approach.1 |
| | |
| | The Capital SystemSM |
| | Our investment process, The Capital System, combines individual accountability with teamwork. Each fund is divided into portions that are managed independently by investment professionals with diverse backgrounds, ages and investment approaches. An extensive global research effort is the backbone of our system. |
| | |
| | Superior long-term track record |
| | Our equity funds have beaten their Lipper peer indexes in 90% of 10-year periods and 96% of 20-year periods. Our fixed-income funds have beaten their Lipper indexes in 56% of 10-year periods and 57% of 20-year periods.2 Our fund management fees have been among the lowest in the industry.3 |
| | 1 | Portfolio manager experience as of December 31, 2013. |
| | 2 | Based on Class A share results for rolling periods through December 31, 2013. Periods covered are the shorter of the fund’s lifetime or since the comparable Lipper index inception date (except SMALLCAP World Fund, for which the Lipper average was used). |
| | 3 | Based on management fees for the 20-year period ended December 31, 2013, versus comparable Lipper categories, excluding funds of funds. |
 | Printed on paper containing 10% post-consumer waste Printed with inks containing soy and/or vegetable oil |
| Lit. No. MFGESRX-007-0514P Litho in USA DD/ALD/8092-S37084 |
ITEM 2 – Code of Ethics
Not applicable for filing of semi-annual reports to shareholders.
ITEM 3 – Audit Committee Financial Expert
Not applicable for filing of semi-annual reports to shareholders.
ITEM 4 – Principal Accountant Fees and Services
Not applicable for filing of semi-annual reports to shareholders.
ITEM 5 – Audit Committee of Listed Registrants
Not applicable to this Registrant, insofar as the Registrant is not a listed issuer as defined in Rule 10A-3 under the Securities Exchange Act of 1934.
ITEM 6 – Schedule of Investments
 | New Perspective Fund® Investment portfolio March 31, 2014 |
unaudited
| Common stocks 93.80% | | |
| | | Value |
| Consumer discretionary 17.66% | Shares | (000) |
| | | |
| Amazon.com, Inc.1 | 4,149,000 | $ 1,396,221 |
| Home Depot, Inc. | 8,808,100 | 696,985 |
| Naspers Ltd., Class N2 | 5,612,500 | 619,244 |
| priceline.com Inc.1 | 501,000 | 597,137 |
| Burberry Group PLC2 | 20,416,991 | 475,860 |
| Toyota Motor Corp.2 | 7,853,400 | 441,980 |
| Swatch Group Ltd, non-registered shares2 | 565,568 | 355,460 |
| Swatch Group Ltd2 | 681,770 | 79,136 |
| adidas AG2 | 3,336,478 | 361,464 |
| Liberty Global PLC, Class C1 | 5,108,200 | 207,955 |
| Liberty Global PLC, Class A1 | 3,380,000 | 140,608 |
| Industria de Diseño Textil, SA2 | 2,186,557 | 328,650 |
| Carnival Corp., units | 8,285,000 | 313,670 |
| Walt Disney Co. | 3,800,000 | 304,266 |
| MGM Resorts International1 | 11,625,000 | 300,623 |
| Time Warner Inc. | 4,491,700 | 293,443 |
| CBS Corp., Class B | 4,465,000 | 275,937 |
| Tiffany & Co. | 2,695,100 | 232,183 |
| Honda Motor Co., Ltd.2 | 6,229,800 | 219,045 |
| Starbucks Corp. | 2,800,000 | 205,464 |
| Publicis Groupe SA2 | 2,245,544 | 203,096 |
| Delphi Automotive PLC | 2,575,800 | 174,794 |
| Las Vegas Sands Corp. | 2,000,000 | 161,560 |
| Johnson Controls, Inc. | 3,178,400 | 150,402 |
| Royal Caribbean Cruises Ltd. | 2,650,000 | 144,584 |
| Ford Motor Co. | 9,000,000 | 140,400 |
| Wynn Macau, Ltd.2 | 29,265,200 | 121,839 |
| Expedia, Inc. | 1,650,000 | 119,625 |
| ASOS PLC1,2 | 1,229,600 | 106,439 |
| Coach, Inc. | 2,103,500 | 104,460 |
| LVMH Moët Hennessey-Louis Vuitton SA2 | 548,000 | 99,759 |
| lululemon athletica inc.1 | 1,546,100 | 81,309 |
| NIKE, Inc., Class B | 1,000,000 | 73,860 |
| Christian Dior SA2 | 370,000 | 71,331 |
| Arcos Dorados Holdings Inc., Class A | 6,200,600 | 62,502 |
| Suzuki Motor Corp.2 | 2,285,200 | 59,531 |
| DIRECTV1 | 756,700 | 57,827 |
| Nikon Corp.2 | 3,300,000 | 53,048 |
| Hyundai Mobis Co., Ltd.2 | 140,700 | 41,736 |
| AB Electrolux, Series B2 | 1,826,700 | 39,866 |
| | | 9,913,299 |
| | | |
| Information technology 13.75% | | |
| | | |
| Google Inc., Class A1 | 994,400 | 1,108,269 |
| ASML Holding NV2 | 5,538,381 | 512,750 |
| Common stocks | | |
| | | Value |
| Information technology (continued) | Shares | (000) |
| | | �� |
| ASML Holding NV (New York registered) | 2,564,870 | $ 239,456 |
| Taiwan Semiconductor Manufacturing Co. Ltd.2 | 161,757,994 | 632,047 |
| Taiwan Semiconductor Manufacturing Co. Ltd. (ADR) | 3,000,000 | 60,060 |
| Microsoft Corp. | 15,485,000 | 634,730 |
| Texas Instruments Inc. | 9,617,791 | 453,479 |
| VeriSign, Inc.1,3 | 7,991,624 | 430,828 |
| Avago Technologies Ltd. | 5,560,000 | 358,120 |
| Naver Corp.2 | 453,000 | 329,790 |
| Cisco Systems, Inc. | 13,500,000 | 302,535 |
| Murata Manufacturing Co., Ltd.2 | 3,008,300 | 283,106 |
| Oracle Corp. | 5,945,500 | 243,230 |
| Alcatel-Lucent1,2 | 59,502,728 | 235,111 |
| ARM Holdings PLC2 | 13,185,783 | 222,346 |
| OMRON Corp.2 | 5,125,000 | 210,934 |
| Amphenol Corp., Class A | 1,820,000 | 166,803 |
| Hewlett-Packard Co. | 5,000,000 | 161,800 |
| Apple Inc. | 298,000 | 159,949 |
| salesforce.com, inc.1 | 2,387,000 | 136,274 |
| Nintendo Co., Ltd.2 | 1,120,800 | 133,497 |
| Visa Inc., Class A | 616,300 | 133,035 |
| MasterCard Inc., Class A | 1,600,000 | 119,520 |
| Jabil Circuit, Inc. | 6,048,500 | 108,873 |
| Samsung Electronics Co. Ltd.2 | 76,500 | 96,739 |
| Analog Devices, Inc. | 1,700,000 | 90,338 |
| Infineon Technologies AG2 | 4,767,300 | 56,881 |
| TDK Corp.2 | 1,152,400 | 48,036 |
| Rackspace Hosting, Inc.1 | 896,508 | 29,423 |
| TE Connectivity Ltd. | 371,875 | 22,391 |
| | | 7,720,350 |
| | | |
| Health care 13.01% | | |
| | | |
| Novo Nordisk A/S, Class B2 | 56,236,585 | 2,565,487 |
| Bayer AG2 | 6,524,860 | 882,401 |
| Gilead Sciences, Inc.1 | 7,629,700 | 540,641 |
| Merck & Co., Inc. | 7,730,000 | 438,832 |
| Regeneron Pharmaceuticals, Inc.1 | 1,372,000 | 411,984 |
| Novartis AG2 | 4,055,000 | 344,413 |
| Bristol-Myers Squibb Co. | 6,567,500 | 341,182 |
| Roche Holding AG2 | 1,126,300 | 338,551 |
| Vertex Pharmaceuticals Inc.1 | 3,691,000 | 261,027 |
| Grifols, SA, Class B (ADR) | 3,829,500 | 158,158 |
| Grifols, SA, Class B, non-registered shares2 | 1,576,222 | 64,986 |
| Intuitive Surgical, Inc.1 | 467,000 | 204,541 |
| AstraZeneca PLC2 | 2,965,000 | 192,111 |
| UCB SA2 | 1,720,954 | 137,989 |
| Mindray Medical International Ltd., Class A (ADR) | 2,674,000 | 86,531 |
| BioMarin Pharmaceutical Inc.1 | 1,120,000 | 76,395 |
| Sonic Healthcare Ltd.2 | 4,753,304 | 76,171 |
| Hospira, Inc.1 | 1,000,000 | 43,250 |
| Fresenius SE & Co. KGaA2 | 275,200 | 43,063 |
| Hologic, Inc.1 | 1,990,000 | 42,785 |
| Edwards Lifesciences Corp.1 | 530,000 | 39,310 |
| Sonova Holding AG2 | 98,658 | 14,434 |
| | | 7,304,242 |
| | | |
| Common stocks | | |
| | | Value |
| Financials 12.54% | Shares | (000) |
| | | |
| American Express Co. | 6,750,000 | $ 607,702 |
| AIA Group Ltd.2 | 126,571,400 | 601,360 |
| CME Group Inc., Class A | 7,999,732 | 592,060 |
| ACE Ltd. | 5,403,800 | 535,300 |
| Prudential PLC2 | 24,530,041 | 519,649 |
| Goldman Sachs Group, Inc. | 2,801,500 | 459,026 |
| JPMorgan Chase & Co. | 7,220,000 | 438,326 |
| ORIX Corp.2 | 24,392,440 | 342,596 |
| Sumitomo Mitsui Financial Group, Inc.2 | 6,400,000 | 272,809 |
| ICICI Bank Ltd. (ADR) | 4,758,700 | 208,431 |
| ICICI Bank Ltd.2 | 2,800,000 | 58,739 |
| HSBC Holdings PLC2 | 23,794,461 | 240,922 |
| AXA SA2 | 8,612,650 | 224,245 |
| Deutsche Bank AG2 | 4,655,000 | 208,222 |
| Moody’s Corp. | 2,624,400 | 208,167 |
| Morgan Stanley | 6,500,000 | 202,605 |
| Allianz SE2 | 1,039,800 | 175,725 |
| BNP Paribas SA2 | 2,100,200 | 162,359 |
| Barclays PLC2 | 40,019,125 | 156,100 |
| Sampo Oyj, Class A2 | 2,980,000 | 154,824 |
| ING Groep NV, depository receipts1,2 | 8,060,000 | 114,554 |
| Standard Chartered PLC2 | 5,080,500 | 106,255 |
| Weyerhaeuser Co.1 | 3,605,000 | 105,807 |
| McGraw Hill Financial, Inc. | 1,300,000 | 99,190 |
| Bank of Nova Scotia | 1,605,334 | 92,980 |
| DNB ASA2 | 5,094,318 | 88,654 |
| Tokio Marine Holdings, Inc.2 | 1,550,000 | 46,469 |
| Citigroup Inc. | 437,600 | 20,830 |
| | | 7,043,906 |
| | | |
| Industrials 11.84% | | |
| | | |
| Delta Air Lines, Inc. | 20,000,000 | 693,000 |
| United Continental Holdings, Inc.1 | 12,300,000 | 548,949 |
| United Technologies Corp. | 4,429,900 | 517,589 |
| Airbus Group NV2 | 7,116,724 | 510,371 |
| Boeing Co. | 3,933,300 | 493,590 |
| KONE Oyj, Class B2 | 9,172,700 | 385,228 |
| American Airlines Group Inc.1 | 9,165,000 | 335,439 |
| General Electric Co. | 11,965,300 | 309,782 |
| Schneider Electric SA2 | 3,442,858 | 306,092 |
| Rolls-Royce Holdings PL1,2 | 16,873,000 | 302,673 |
| Ryanair Holdings PLC (ADR)1 | 3,869,499 | 227,565 |
| ASSA ABLOY AB, Class B2 | 3,484,100 | 186,087 |
| Intertek Group PLC2 | 3,410,428 | 175,023 |
| Towers Watson & Co., Class A | 1,500,300 | 171,109 |
| Union Pacific Corp. | 760,000 | 142,622 |
| Honeywell International Inc. | 1,500,000 | 139,140 |
| Geberit AG2 | 423,000 | 138,693 |
| Eaton Corp. PLC | 1,707,100 | 128,237 |
| Vallourec SA2 | 2,258,000 | 122,745 |
| FANUC CORP.2 | 675,000 | 118,849 |
| Michael Page International PLC2 | 14,279,900 | 117,018 |
| Siemens AG2 | 861,800 | 115,979 |
| W.W. Grainger, Inc. | 419,500 | 105,991 |
| Common stocks | | |
| | | Value |
| Industrials (continued) | Shares | (000) |
| | | |
| Experian PLC2 | 5,270,000 | $ 95,058 |
| Cummins Inc. | 603,817 | 89,963 |
| Marubeni Corp.2 | 8,470,000 | 56,779 |
| Atlas Copco AB, Class B2 | 2,008,900 | 55,086 |
| Komatsu Ltd.2 | 1,516,700 | 31,366 |
| Mitsubishi Heavy Industries, Ltd.2 | 5,290,000 | 30,792 |
| | | 6,650,815 |
| | | |
| Consumer staples 11.02% | | �� |
| | | |
| Nestlé SA2 | 8,018,700 | 604,200 |
| Associated British Foods PLC2 | 12,945,056 | 600,293 |
| British American Tobacco PLC2 | 10,747,500 | 598,357 |
| Pernod Ricard SA2 | 4,263,991 | 496,777 |
| Philip Morris International Inc. | 5,903,474 | 483,317 |
| Anheuser-Busch InBev NV2 | 3,393,850 | 356,725 |
| SABMiller PLC2 | 6,584,008 | 328,860 |
| PepsiCo, Inc. | 3,880,900 | 324,055 |
| Unilever NV, depository receipts2 | 7,546,500 | 310,292 |
| Japan Tobacco Inc.2 | 7,529,000 | 236,082 |
| Shoprite Holdings Ltd.2 | 15,585,952 | 235,701 |
| Procter & Gamble Co. | 2,715,200 | 218,845 |
| Costco Wholesale Corp. | 1,600,000 | 178,688 |
| Coca-Cola Co. | 4,558,700 | 176,239 |
| Mondelez International, Inc. | 4,217,700 | 145,722 |
| Kimberly-Clark Corp. | 1,277,800 | 140,877 |
| Avon Products, Inc. | 7,898,100 | 115,628 |
| Danone SA2 | 1,558,800 | 110,259 |
| Colgate-Palmolive Co. | 1,624,000 | 105,349 |
| Seven & i Holdings Co., Ltd.2 | 2,220,000 | 84,673 |
| Wal-Mart de México, SAB de CV, Series V | 29,667,984 | 70,401 |
| Imperial Tobacco Group PLC2 | 1,707,000 | 69,031 |
| Alimentation Couche-Tard Inc., Class B | 740,000 | 59,849 |
| Casino, Guichard-Perrachon SA2 | 493,253 | 58,795 |
| Coca-Cola Amatil Ltd.2 | 4,704,261 | 48,139 |
| Unilever PLC2 | 677,000 | 28,915 |
| | | 6,186,069 |
| | | |
| Materials 4.39% | | |
| | | |
| Linde AG2 | 1,577,300 | 315,723 |
| Monsanto Co. | 2,348,600 | 267,200 |
| Rio Tinto PLC2 | 4,745,000 | 264,627 |
| First Quantum Minerals Ltd. | 13,902,700 | 256,926 |
| FMC Corp. | 2,816,000 | 215,593 |
| Holcim Ltd2 | 2,104,235 | 174,736 |
| Koninklijke DSM NV2 | 2,098,400 | 144,122 |
| Dow Chemical Co. | 2,780,000 | 135,080 |
| Potash Corp. of Saskatchewan Inc. | 3,295,000 | 119,345 |
| Akzo Nobel NV2 | 1,325,000 | 108,563 |
| Glencore Xstrata PLC2 | 20,985,000 | 108,243 |
| Praxair, Inc. | 800,000 | 104,776 |
| Mosaic Co. | 1,352,800 | 67,640 |
| Syngenta AG2 | 124,648 | 47,280 |
| L’Air Liquide SA2 | 268,843 | 36,466 |
| L’Air Liquide SA, bonus shares2 | 77,656 | 10,533 |
| Common stocks | | |
| | | Value |
| Materials (continued) | Shares | (000) |
| | | |
| Impala Platinum Holdings Ltd.2 | 3,865,000 | $ 44,001 |
| United States Steel Corp. | 1,500,000 | 41,415 |
| | | 2,462,269 |
| | | |
| Energy 3.98% | | |
| | | |
| Oil Search Ltd.2 | 44,839,747 | 352,382 |
| EOG Resources, Inc. | 1,381,608 | 271,030 |
| Enbridge Inc. | 4,876,203 | 221,469 |
| Noble Energy, Inc. | 3,020,000 | 214,541 |
| Canadian Natural Resources, Ltd. | 5,105,000 | 195,657 |
| Schlumberger Ltd. | 1,750,000 | 170,625 |
| Occidental Petroleum Corp. | 1,470,000 | 140,076 |
| FMC Technologies, Inc.1 | 2,493,000 | 130,359 |
| Technip SA2 | 997,262 | 102,966 |
| Halliburton Co. | 1,637,399 | 96,426 |
| Cenovus Energy Inc. | 2,797,600 | 80,946 |
| Cobalt International Energy, Inc.1 | 4,353,912 | 79,764 |
| Royal Dutch Shell PLC, Class B2 | 1,630,998 | 63,631 |
| Royal Dutch Shell PLC, Class B (ADR) | 200,000 | 15,622 |
| Chevron Corp. | 600,600 | 71,417 |
| Petróleo Brasileiro SA – Petrobras, ordinary nominative (ADR) | 1,968,000 | 25,879 |
| | | 2,232,790 |
| | | |
| Telecommunication services 0.99% | | |
| | | |
| SoftBank Corp.2 | 5,124,700 | 386,502 |
| Vodafone Group PLC2 | 30,880,145 | 113,687 |
| América Móvil, SAB de CV, Series L (ADR) | 2,525,800 | 50,213 |
| NII Holdings, Inc., Class B1 | 5,500,000 | 6,545 |
| | | 556,947 |
| | | |
| Utilities 0.19% | | |
| | | |
| Cheung Kong Infrastructure Holdings Ltd.2 | 16,732,000 | 107,330 |
| | | |
| | | |
| Miscellaneous 4.43% | | |
| | | |
| Other common stocks in initial period of acquisition | | 2,487,684 |
| Total common stocks (cost: $31,981,818,000) | | 52,665,701 |
| Rights 0.00% | | |
| | | |
| Miscellaneous 0.00% | | |
| | | |
| Other rights in initial period of acquisition | | 655 |
| Total rights (cost: $647,000) | | 655 |
| Convertible securities 0.01% | | |
| | Principal amount | |
| Consumer staples 0.01% | (000) | |
| | | |
| Shoprite Holdings Ltd. 6.50% convertible notes 2017 | ZAR43,260 | 4,624 |
| Total convertible securities (cost: $5,605,000) | | 4,624 |
| Bonds, notes & other debt instruments 0.21% | | |
| | Principal amount | Value |
| U.S. Treasury bonds & notes 0.21% | (000) | (000) |
| | | |
| U.S. Treasury 0.25% 2015 | $ 31,325 | $ 31,360 |
| U.S. Treasury 0.25% 2015 | 9,000 | 8,999 |
| U.S. Treasury 4.00% 20154 | 74,925 | 77,467 |
| Total bonds, notes & other debt instruments (cost: $117,696,000) | | 117,826 |
| | | |
| Short-term securities 5.63% | | |
| | | |
| Freddie Mac 0.055%–0.17% due 4/1/2014–1/16/2015 | 1,113,668 | 1,113,290 |
| Federal Home Loan Bank 0.06%–0.18% due 4/2–8/13/2014 | 667,004 | 666,923 |
| Fannie Mae 0.12%–0.14% due 5/1–9/22/2014 | 253,600 | 253,549 |
| U.S. Treasury Bills 0.096%–0.103% due 5/15–6/5/2014 | 179,700 | 179,691 |
| International Bank for Reconstruction and Development 0.10%–0.14% due 4/14–8/22/2014 | 126,000 | 125,983 |
| Svenska Handelsbanken Inc. 0.155%–0.16% due 5/7–6/6/20145 | 124,800 | 124,773 |
| Victory Receivables Corp. 0.15%–0.16% due 5/13–5/28/20145 | 95,400 | 95,377 |
| Bank of Tokyo-Mitsubishi UFJ, Ltd. 0.15% due 4/7/2014 | 22,800 | 22,799 |
| KfW 0.12% due 5/14/20145 | 76,700 | 76,690 |
| Bank of Nova Scotia 0.18% due 7/8/2014 | 75,000 | 74,966 |
| Toronto-Dominion Holdings USA Inc. 0.15%–0.17% due 6/25–7/14/20145 | 72,300 | 72,271 |
| ANZ National (International) Ltd. 0.16% due 5/8/20145 | 60,000 | 59,990 |
| Sumitomo Mitsui Banking Corp. 0.20% due 6/10-6/17/20145 | 51,700 | 51,678 |
| Old Line Funding, LLC 0.17% due 6/19/20145 | 50,000 | 49,991 |
| Nordea Bank AB 0.205% due 8/26/20145 | 44,800 | 44,763 |
| National Australia Funding (Delaware) Inc. 0.125% due 7/21/20145 | 39,900 | 39,881 |
| Shell International Finance BV 0.07% due 4/25/20145 | 30,000 | 29,999 |
| GlaxoSmithKline Finance PLC 0.11% due 5/20/20145 | 26,900 | 26,894 |
| Province of Ontario 0.10% due 4/17/2014 | 26,000 | 25,999 |
| General Electric Co. 0.05% due 4/1/2014 | 14,900 | 14,900 |
| Private Export Funding Corp. 0.245% due 4/29/20145 | 14,000 | 13,999 |
| Total short-term securities (cost: $3,164,110,000) | | 3,164,406 |
| Total investment securities (cost: $35,269,876,000) | | 55,953,212 |
| Other assets less liabilities | | 194,453 |
| Net assets | | $56,147,665 |
As permitted by U.S. Securities and Exchange Commission regulations, “Miscellaneous” securities include holdings in their first year of acquisition that have not previously been publicly disclosed.
1Security did not produce income during the last 12 months.
2Valued under fair value procedures adopted by authority of the board of trustees. The total value of all such securities, including those in “Miscellaneous,” was $25,306,888,000, which represented 45.07% of the net assets of the fund. This amount includes $25,259,889,000 related to certain securities trading outside the U.S. whose values were adjusted as a result of significant market movements following the close of local trading.
3Represents an affiliated company as defined under the Investment Company Act of 1940.
4A portion of this security was pledged as collateral. The total value of pledged collateral was $857,000, which represented less than .01% of the net assets of the fund.
5Acquired in a transaction exempt from registration under section 4(2) of the Securities Act of 1933. May be resold in the U.S. in transactions exempt from registration, normally to qualified institutional buyers. The total value of all such securities was $686,306,000, which represented 1.22% of the net assets of the fund.
Key to abbreviations
ADR = American Depositary Receipts
ZAR = South African rand
Investments are not FDIC-insured, nor are they deposits of or guaranteed by a bank or any other entity, so they may lose value.
Investors should carefully consider investment objectives, risks, charges and expenses. This and other important information is contained in the fund prospectus and summary prospectus, which can be obtained from your financial professional and should be read carefully before investing. You may also call American Funds Service Company (AFS) at (800) 421-4225 or visit the American Funds website at americanfunds.com.
MFGEFPX-007-0514O-S37672
ITEM 7 – Disclosure of Proxy Voting Policies and Procedures for Closed-End Management Investment Companies
Not applicable to this Registrant, insofar as the Registrant is not a closed-end management investment company.
ITEM 8 – Portfolio Managers of Closed-End Management Investment Companies
Not applicable to this Registrant, insofar as the Registrant is not a closed-end management investment company.
ITEM 9 – Purchases of Equity Securities by Closed-End Management Investment Company and Affiliated Purchasers
Not applicable to this Registrant, insofar as the Registrant is not a closed-end management investment company.
ITEM 10 – Submission of Matters to a Vote of Security Holders
There have been no material changes to the procedures by which shareholders may recommend nominees to the Registrant’s board of trustees since the Registrant last submitted a proxy statement to its shareholders. The procedures are as follows. The Registrant has a nominating and governance committee comprised solely of persons who are not considered ‘‘interested persons’’ of the Registrant within the meaning of the Investment Company Act of 1940, as amended. The committee periodically reviews such issues as the board’s composition, responsibilities, committees, compensation and other relevant issues, and recommends any appropriate changes to the full board of trustees. While the committee normally is able to identify from its own resources an ample number of qualified candidates, it will consider shareholder suggestions of persons to be considered as nominees to fill future vacancies on the board. Such suggestions must be sent in writing to the nominating and governance committee of the Registrant, c/o the Registrant’s Secretary, and must be accompanied by complete biographical and occupational data on the prospective nominee, along with a written consent of the prospective nominee for consideration of his or her name by the nominating and governance committee.
ITEM 11 – Controls and Procedures
| (a) | The Registrant’s Principal Executive Officer and Principal Financial Officer have concluded, based on their evaluation of the Registrant’s disclosure controls and procedures (as such term is defined in Rule 30a-3 under the Investment Company Act of 1940), that such controls and procedures are adequate and reasonably designed to achieve the purposes described in paragraph (c) of such rule. |
| | |
| (b) | There were no changes in the Registrant’s internal controls over financial reporting (as defined in Rule 30a-3(d) under the Investment Company Act of 1940) that occurred during the Registrant’s second fiscal quarter of the period covered by this report that has materially affected, or is reasonably likely to materially affect, the Registrant’s internal control over financial reporting. |
ITEM 12 – Exhibits
| (a)(1) | Not applicable for filing of semi-annual reports to shareholders. |
| | |
| (a)(2) | The certifications required by Rule 30a-2 of the Investment Company Act of 1940 and Sections 302 and 906 of the Sarbanes-Oxley Act of 2002 are attached as exhibits hereto. |
SIGNATURES
Pursuant to the requirements of the Securities Exchange Act of 1934 and the Investment Company Act of 1940, the Registrant has duly caused this report to be signed on its behalf by the undersigned, thereunto duly authorized.
| | NEW PERSPECTIVE FUND |
| | |
| | By /s/ Michael J. Thawley |
| | Michael J. Thawley, Vice Chairman and Principal Executive Officer |
| | |
| | Date: May 30, 2014 |
Pursuant to the requirements of the Securities Exchange Act of 1934 and the Investment Company Act of 1940, this report has been signed below by the following persons on behalf of the Registrant and in the capacities and on the dates indicated.
| By /s/ Michael J. Thawley |
Michael J. Thawley, Vice Chairman and Principal Executive Officer |
| |
| Date: May 30, 2014 |
| By /s/ Brian C. Janssen |
Brian C. Janssen, Treasurer and Principal Financial Officer |
| |
| Date: May 30, 2014 |