Free signup for more
- Track your favorite companies
- Receive email alerts for new filings
- Personalized dashboard of news and more
- Access all data and search results
Filing tables
Filing exhibits
Related financial report
BDWGP similar filings
- 14 Jun 24 Entry into a Material Definitive Agreement
- 31 May 24 Entry into a Material Definitive Agreement
- 16 May 24 Results of Operations and Financial Condition
- 10 May 24 Departure of Directors or Certain Officers
- 2 Apr 24 Departure of Directors or Certain Officers
- 2 Apr 24 Departure of Directors or Certain Officers
Filing view
External links
Exhibit 99.1

Investor PresentationMay 2024

altafiber Overview
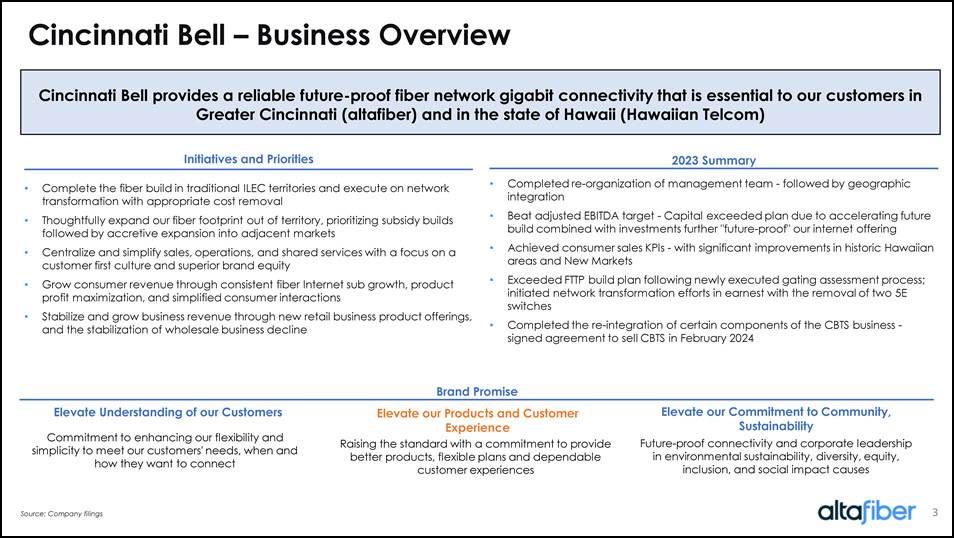
Cincinnati Bell – Business Overview Initiatives and Priorities Complete the fiber build in traditional ILEC territories and execute on network transformation with appropriate cost removal Thoughtfully expand our fiber footprint out of territory, prioritizing subsidy builds followed by accretive expansion into adjacent markets Centralize and simplify sales, operations, and shared services with a focus on a customer first culture and superior brand equity Grow consumer revenue through consistent fiber Internet sub growth, product profit maximization, and simplified consumer interactions Stabilize and grow business revenue through new retail business product offerings, and the stabilization of wholesale business decline Cincinnati Bell provides a reliable future-proof fiber network gigabit connectivity that is essential to our customers in Greater Cincinnati (altafiber) and in the state of Hawaii (Hawaiian Telcom) Completed re-organization of management team - followed by geographic integration Beat adjusted EBITDA target - Capital exceeded plan due to accelerating future build combined with investments further "future-proof" our internet offering Achieved consumer sales KPls - with significant improvements in historic Hawaiian areas and New Markets Exceeded FTTP build plan following newly executed gating assessment process; initiated network transformation efforts in earnest with the removal of two 5E switches Completed the re-integration of certain components of the CBTS business - signed agreement to sell CBTS in February 2024 2023 Summary Elevate Understanding of our Customers Elevate our Products and Customer Experience Elevate our Commitment to Community, Sustainability Commitment to enhancing our flexibility and simplicity to meet our customers' needs, when and how they want to connect Raising the standard with a commitment to provide better products, flexible plans and dependable customer experiences Future-proof connectivity and corporate leadership in environmental sustainability, diversity, equity, inclusion, and social impact causes Brand Promise Source: Company filings
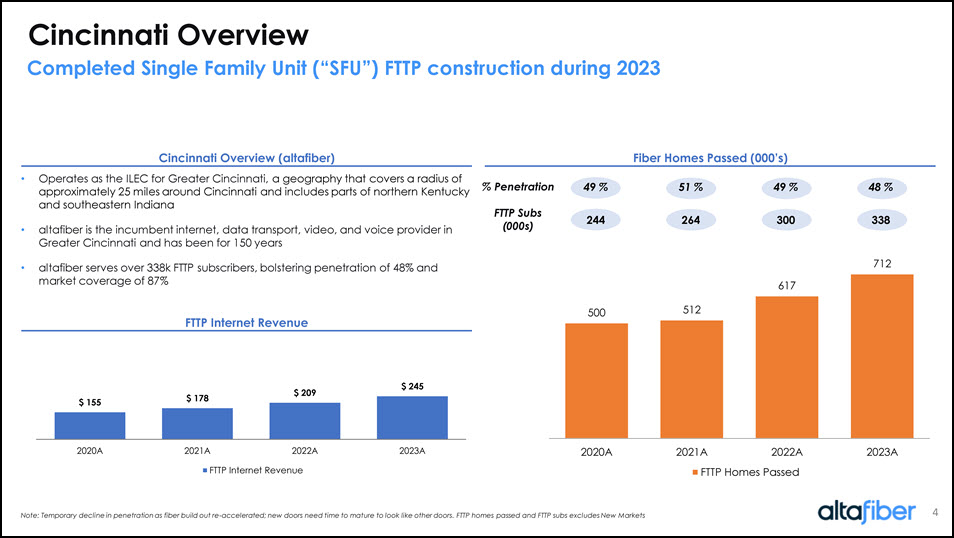
Cincinnati Overview Cincinnati Overview (altafiber) Fiber Homes Passed (000’s) Operates as the ILEC for Greater Cincinnati, a geography that covers a radius of approximately 25 miles around Cincinnati and includes parts of northern Kentucky and southeastern Indiana altafiber is the incumbent internet, data transport, video, and voice provider in Greater Cincinnati and has been for 150 years altafiber serves over 338k FTTP subscribers, bolstering penetration of 48% and market coverage of 87% % Penetration FTTP Subs (000s) 4 49 % 51 % 49 % 48 % 244 264 300 338 Note: Temporary decline in penetration as fiber build out re-accelerated; new doors need time to mature to look like other doors. FTTP homes passed and FTTP subs excludes New Markets Completed Single Family Unit (“SFU”) FTTP construction during 2023 FTTP Internet Revenue $ 155 $178 $209 $ 245 500 512 617 712 2020A 2021A 2022A 2023A FTTP Homes Passed Note: Temporary decline in penetration as fiber build out re-accelerated; new doors need time to mature to look like other doors. FTTP homes passed and FTTP subs excludes New Markets
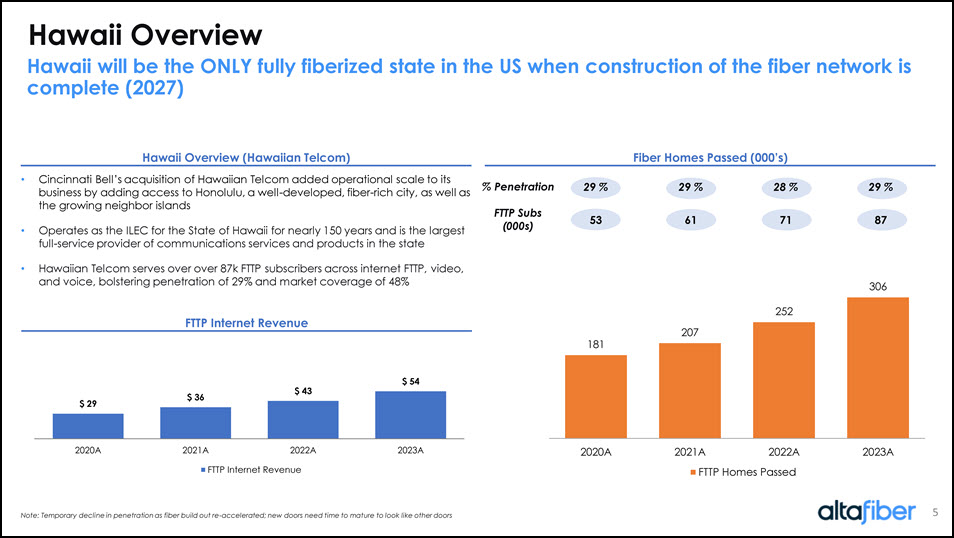
Hawaii Overview Hawaii Overview (Hawaiian Telcom) Fiber Homes Passed (000’s) Cincinnati Bell’s acquisition of Hawaiian Telcom added operational scale to its business by adding access to Honolulu, a well-developed, fiber-rich city, as well as the growing neighbor islands Operates as the ILEC for the State of Hawaii for nearly 150 years and is the largest full-service provider of communications services and products in the state Hawaiian Telcom serves over over 87k FTTP subscribers across internet FTTP, video, and voice, bolstering penetration of 29% and market coverage of 48% 5 % Penetration FTTP Subs (000s) 5 29 % 29 % 28 % 29 % 53 61 71 87 Hawaii will be the ONLY fully fiberized state in the US when construction of the fiber network is complete (2027) FTTP Internet Revenue Note: Temporary decline in penetration as fiber build out re-accelerated; new doors need time to mature to look like other doors $ 29 $36 $43 $ 54 2020A 2021A 2022A 2023A FTTP Internet Revenue 181 207 252 306 2020A 2021A 2022A 2023A FTTP Homes Passed
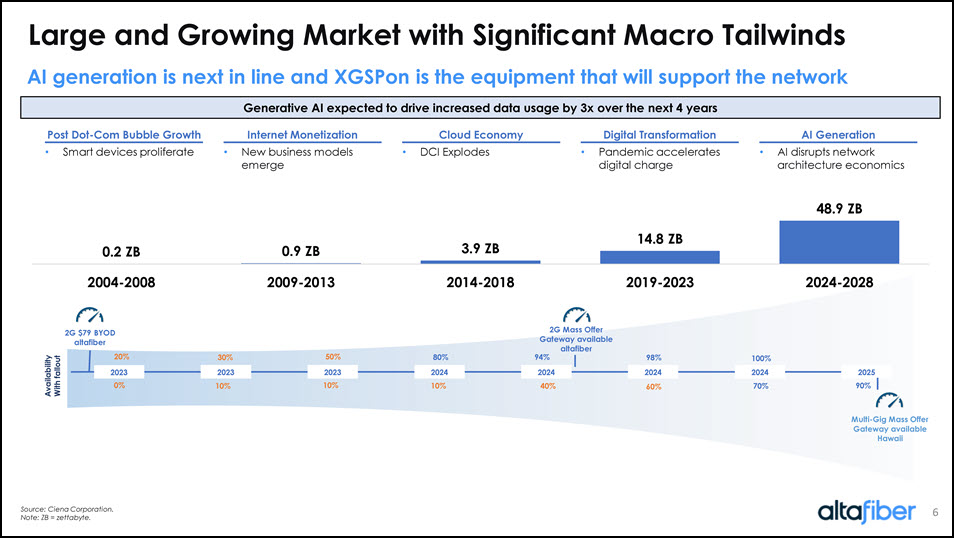
Large and Growing Market with Significant Macro Tailwinds 6 Generative AI expected to drive increased data usage by 3x over the next 4 years Source: Ciena Corporation. Note: ZB = zettabyte. AI generation is next in line and XGSPon is the equipment that will support the network Post Dot-Com Bubble Growth Smart devices proliferate Internet Monetization New business models emerge Cloud Economy DCI Explodes Digital Transformation Pandemic accelerates digital charge AI Generation AI disrupts network architecture economics 2023 2023 2023 2024 2024 2024 2024 2025 20% 30% 50% 80% 94% 98% 100% 2G $79 BYOD altafiber 2G Mass Offer Gateway available altafiber Multi-Gig Mass Offer Gateway available Hawaii 0% 10% 10% 10% 40% 70% 90% 60% Availability With fallout

Proven Management Team with Deep Industry Expertise altafiber Leadership Division Presidents Leigh Fox President & CEO20+ years with altafiber Josh Duckworth Chief Financial Officer10+ years with altafiber Christi Cornette Chief Culture Officer20+ years with altafiber Mary E. Talbott Chief Legal Officer1+ year with altafiber Kevin Murray Chief Information Officer20+ years with altafiber Ron Beerman Chief Network Officer30+ years with altafiber Jason Praeter President, altafiber15+ years with altafiber Su Shin President, Hawaiian Telcom10+ years with Hawaiian Telcom Jeff Lackey President, CBTS5+ years with altafiber 7 Greg Wheeler President, Business Markets20+ years with altafiber

Key Credit Highlights
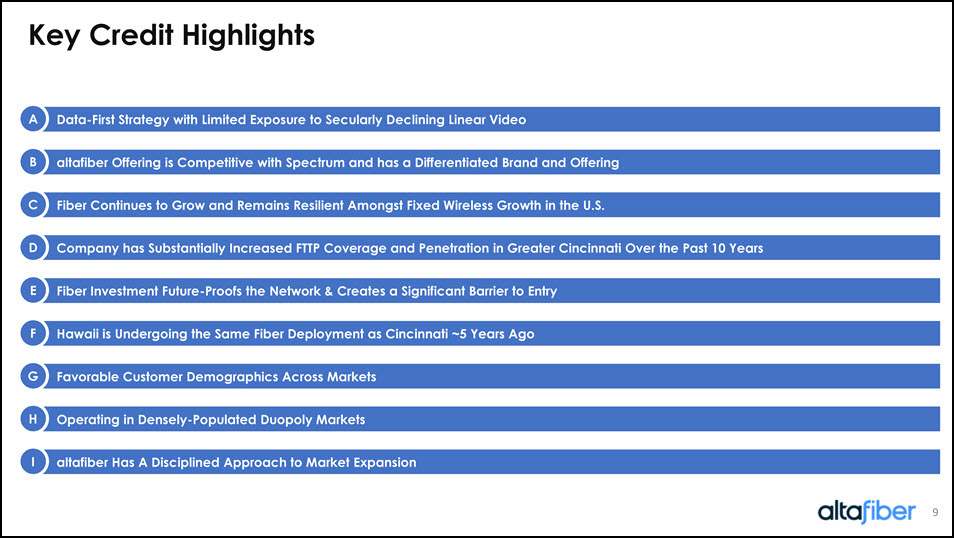
Key Credit Highlights Data-First Strategy with Limited Exposure to Secularly Declining Linear Video A altafiber Offering is Competitive with Spectrum and has a Differentiated Brand and Offering B Fiber Continues to Grow and Remains Resilient Amongst Fixed Wireless Growth in the U.S. C Company has Substantially Increased FTTP Coverage and Penetration in Greater Cincinnati Over the Past 10 Years D Fiber Investment Future-Proofs the Network & Creates a Significant Barrier to Entry E Hawaii is Undergoing the Same Fiber Deployment as Cincinnati ~5 Years Ago F Favorable Customer Demographics Across Markets G Operating in Densely-Populated Duopoly Markets H 9 altafiber Has A Disciplined Approach to Market Expansion I
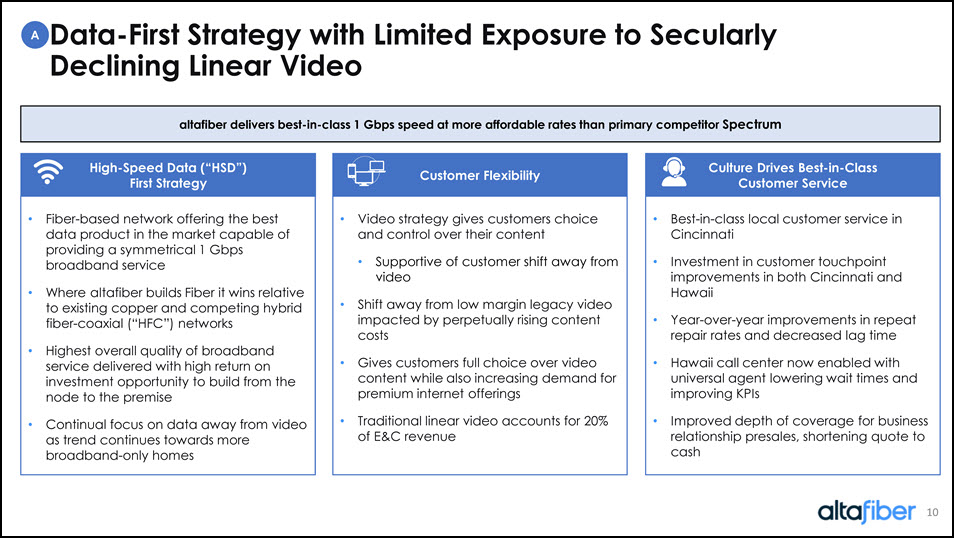
Fiber-based network offering the best data product in the market capable of providing a symmetrical 1 Gbps broadband service Where altafiber builds Fiber it wins relative to existing copper and competing hybrid fiber-coaxial (“HFC”) networks Highest overall quality of broadband service delivered with high return on investment opportunity to build from the node to the premise Continual focus on data away from video as trend continues towards more broadband-only homes Video strategy gives customers choice and control over their content Supportive of customer shift away from video Shift away from low margin legacy video impacted by perpetually rising content costs Gives customers full choice over video content while also increasing demand for premium internet offerings Traditional linear video accounts for 20% of E&C revenue Best-in-class local customer service in Cincinnati Investment in customer touchpoint improvements in both Cincinnati and Hawaii Year-over-year improvements in repeat repair rates and decreased lag time Hawaii call center now enabled with universal agent lowering wait times and improving KPIs Improved depth of coverage for business relationship presales, shortening quote to cash Data-First Strategy with Limited Exposure to Secularly Declining Linear Video altafiber delivers best-in-class 1 Gbps speed at more affordable rates than primary competitor Spectrum A High-Speed Data (“HSD”) First Strategy Customer Flexibility Culture Drives Best-in-Class Customer Service 10
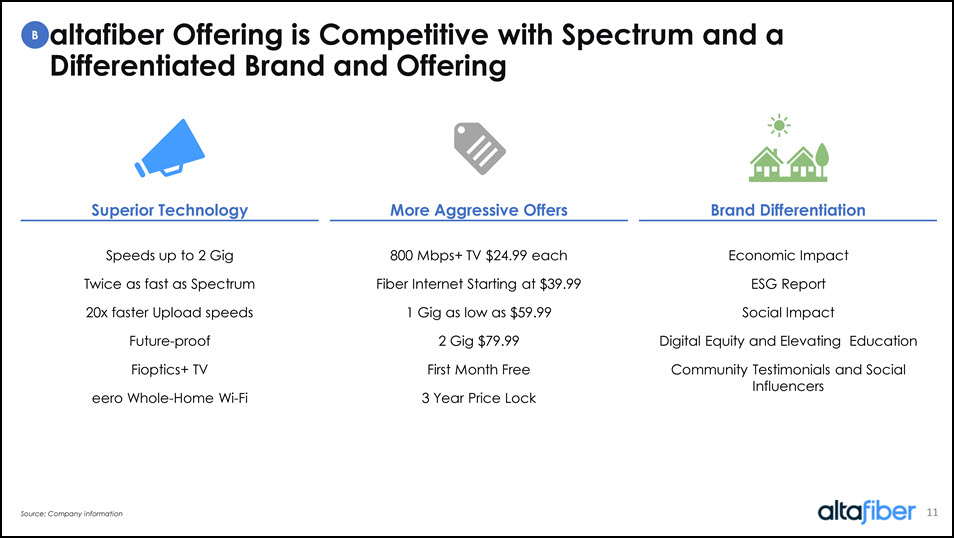
altafiber Offering is Competitive with Spectrum and a Differentiated Brand and Offering B 11 Superior Technology More Aggressive Offers Brand Differentiation Speeds up to 2 Gig Twice as fast as Spectrum 20x faster Upload speeds Future-proof Fioptics+ TV eero Whole-Home Wi-Fi 800 Mbps+ TV $24.99 each Fiber Internet Starting at $39.99 1 Gig as low as $59.99 2 Gig $79.99 First Month Free 3 Year Price Lock Economic Impact ESG Report Social Impact Digital Equity and Elevating Education Community Testimonials and Social Influencers Source: Company information
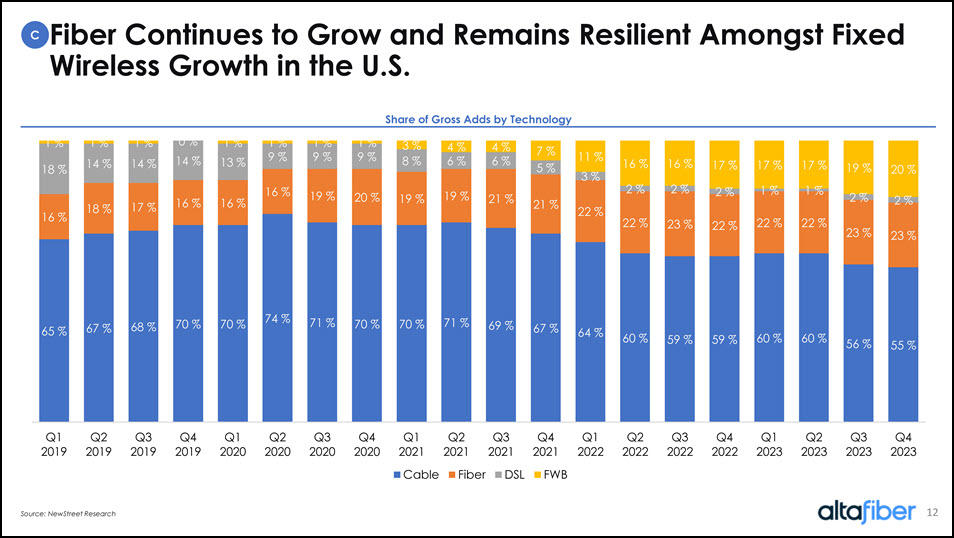
Fiber Continues to Grow and Remains Resilient Amongst Fixed Wireless Growth in the U.S. C Source: NewStreetResearch 12 Share of Gross Adds by Technology 65 % 67 % 68 % 70 % 70 % 74 % 71 % 70 % 70 % 71 % 69 % 67 % 64 % 60 % 59 % 59 % 60 % 60 % 56 % 55 % 16 % 18 % 17 % 16 % 16 % 16 % 19 % 20 % 19 % 19 % 21 % 21 % 22 % 22 % 23 % 22 % 22 % 22 % 23 % 23 % 18 % 14 % 14 % 14 % 13 % 9 % 9 % 9 % 8 % 6 % 6 % 5 % 3 % 2 % 2 % 2 % 1 % 1 % 2 % 2 % 1 % 1 % 1 % 0 % 1 % 1 % 1 % 1 % 3 % 4 % 4 % 7 % 11 % 16 % 16 % 17 % 17 % 17 % 19 % 20 % Q12019 Q22019 Q32019 Q42019 Q12020 Q22020 Q32020 Q42020 Q12021 Q22021 Q32021 Q42021 Q12022 Q22022 Q32022 Q42022 Q12023 Q22023 Q32023 Q42023
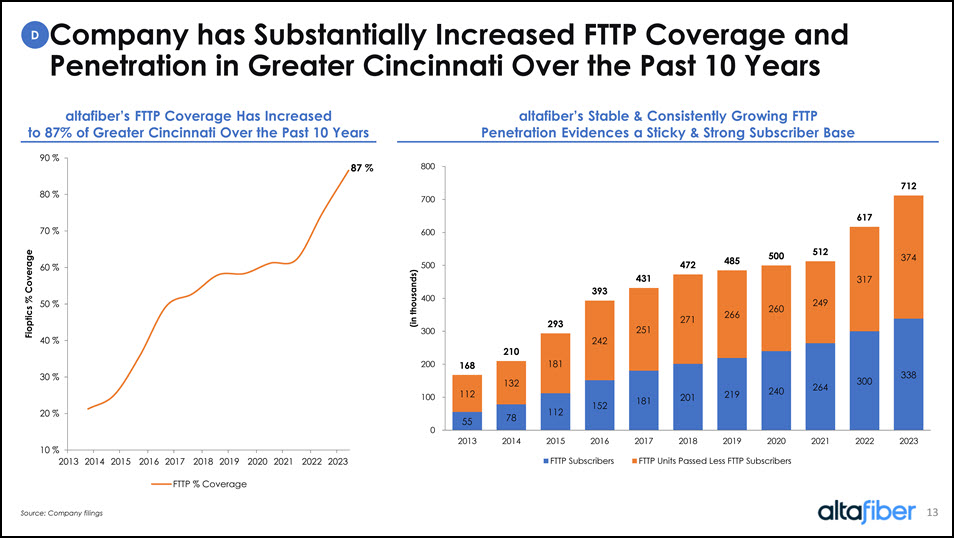
Company has Substantially Increased FTTP Coverage and Penetration in Greater Cincinnati Over the Past 10 Years D Source: Company filings altafiber’sFTTP Coverage Has Increasedto 87% of Greater Cincinnati Over the Past 10 Years altafiber’sStable & Consistently Growing FTTPPenetration Evidences a Sticky & Strong Subscriber Base 87 %10 %20 %30 %40 %50 %60 %70 %80 %90 %20132014201520162017201820192020202120222023Fioptics 5578112152181201219240264300338112132181242251271266260249317374168210293393431472485500512617712010020030040050060070080020132014201520162017201820192020202120222023(in thousands)FTTP SubscribersFTTP Units Passed Less FTTP Subscribers
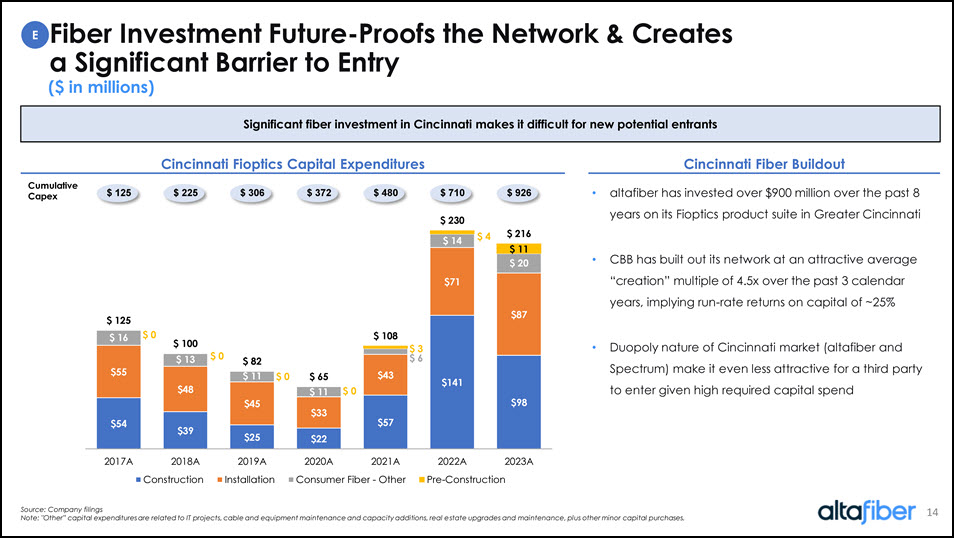
Fiber Investment Future-Proofs the Network & Createsa Significant Barrier to Entry E Source: Company filings Note: "Other” capital expenditures are related to IT projects, cable and equipment maintenance and capacity additions, real estate upgrades and maintenance, plus other minor capital purchases. Cincinnati Fioptics Capital Expenditures Cincinnati Fiber Buildout Significant fiber investment in Cincinnati makes it difficult for new potential entrants altafiber has invested over $900 million over the past 8 years on its Fioptics product suite in Greater Cincinnati CBB has built out its network at an attractive average “creation” multiple of 4.5x over the past 3 calendar years, implying run-rate returns on capital of ~25% Duopoly nature of Cincinnati market (altafiber and Spectrum) make it even less attractive for a third party to enter given high required capital spend Cumulative Capex ($ in millions) 14 $ 125 $ 225 $ 306 $ 372 $ 480 $ 710 $ 926 $ 125 $ 100 $ 82 $ 65 $ 108 $ 230 $ 216 2017A2018A2019A2020A2021A2022A2023AConstructionInstallationConsumer Fiber - OtherPre-Construction
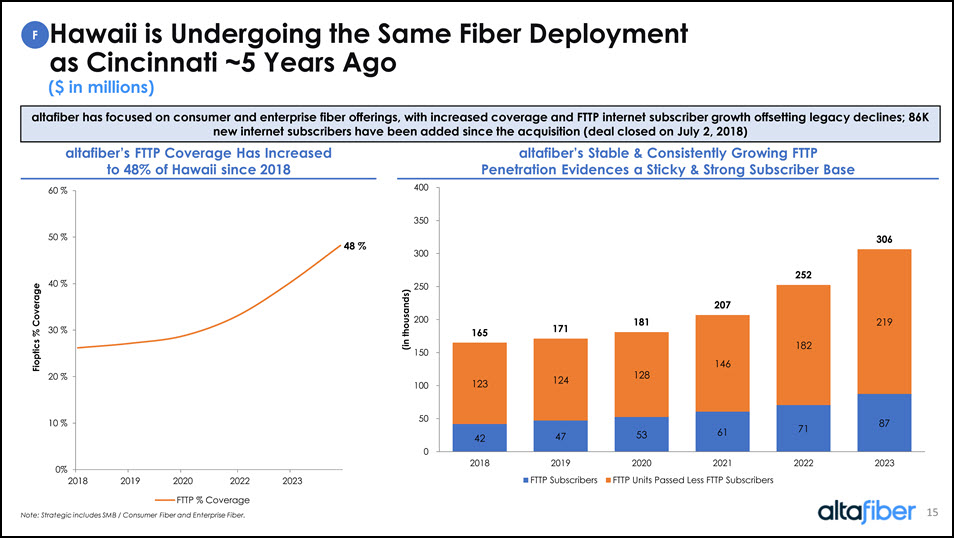
Hawaii is Undergoing the Same Fiber Deploymentas Cincinnati ~5 Years Ago F altafiber has focused on consumer and enterprise fiber offerings, with increased coverage and FTTP internet subscriber growthoffsetting legacy declines; 86K new internet subscribers have been added since the acquisition (deal closed on July 2, 2018) ($ in millions) 15 Note: Strategic includes SMB / Consumer Fiber and Enterprise Fiber. altafiber’sFTTP Coverage Has Increasedto 48% of Hawaii since 2018 altafiber’s Stable & Consistently Growing FTTP Penetration Evidences a Sticky & Strong Subscriber Base 48 %0%10 %20 %30 %40 %50 %60 %20182019202020222023Fioptics % CoverageFTTP % Coverage 424753617187123124128146182219165171181207252306050100150200250300350400201820192020202120222023(in thousands)FTTP SubscribersFTTP Units Passed Less FTTP Subscribers

Favorable Customer Demographics Across Markets G Source: FRED 1 As of 2023. Location Total Network Addresses1 Total Sellable Coverage1 2022 Population 2012 Population 2012-2022 CAGR 2022 Med. HH Income 2012 Med. HH Income 2012-2022 CAGR Ohio 795k 617k 11.8M 11.5M 0.3% 67.5K 55.1K 2.1% Hawaii 335k 252k 1.4M 1.3M 0.7% 91.0K 69.9K 2.7% United States 1,171k 1,350k 333.5M 314.7M 0.6% 74.6K 72.1K 0.3% Top Employers by Market Cincinnati Hawaii Cincinnati Fiber Coverage Hawaii Fiber Coverage 16 Core markets bolster above average household income relative to the national median Market Overview Hawaii Telcom Adjusted EBITDA altafiber operates in relatively high-density markets in Cincinnati and Honolulu Footprint incudes dense but attractive markets including the entire Cincinnati metro area as well as across the Hawaiian islands with a focus on O’ahu and the Honolulu metro area The Ohio and Hawaii markets exceed the median national household income CAGR while population growth is roughly in line
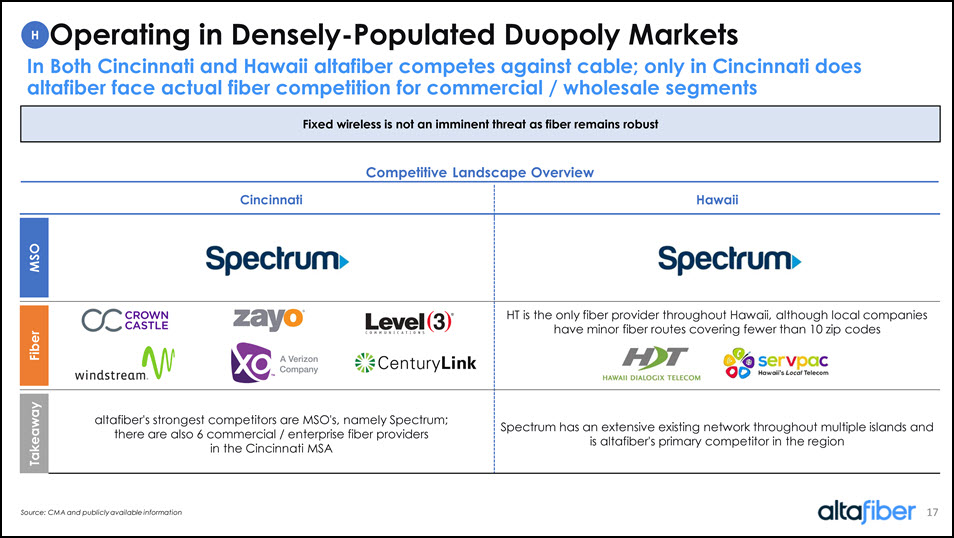
Operating in Densely-Populated Duopoly Markets H Competitive Landscape Overview Cincinnati Hawaii MSO Fiber HT is the only fiber provider throughout Hawaii, although local companies have minor fiber routes covering fewer than 10 zip codes Takeaway altafiber's strongest competitors are MSO's, namely Spectrum; there are also 6 commercial / enterprise fiber providers in the Cincinnati MSA Spectrum has an extensive existing network throughout multiple islands and is altafiber's primary competitor in the region Source: CMA and publicly available information In Both Cincinnati and Hawaii altafiber competes against cable; only in Cincinnati does altafiber face actual fiber competition for commercial / wholesale segments 17 Fixed wireless is not an imminent threat as fiber remains robust
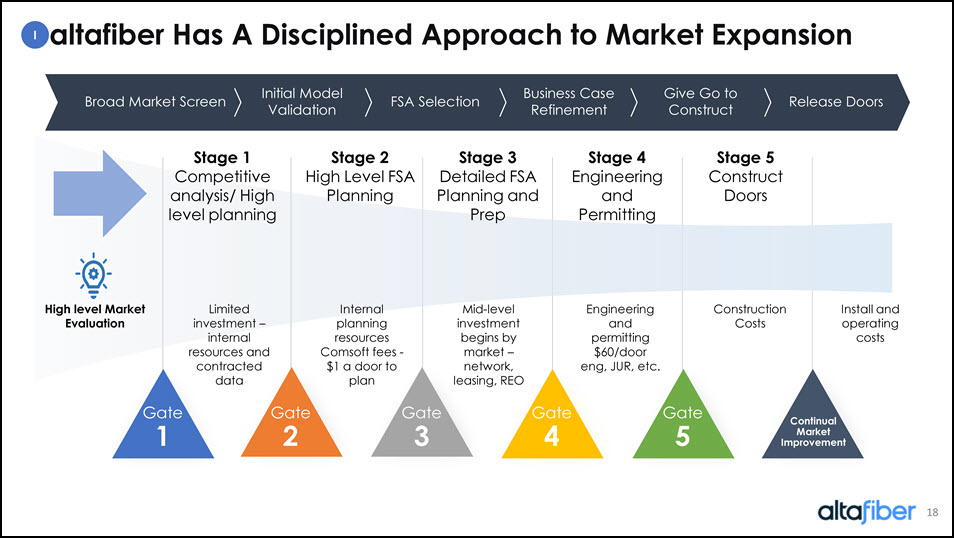
altafiber Has A Disciplined Approach to Market Expansion I Gate 1 Step 02 Gate 2 Step 03 Gate 3 Gate 4 Gate 5 Internal planning resources Comsoftfees -$1 a door to plan Limited investment –internal resources and contracted data Mid-level investment begins by market –network, leasing, REO Engineering and permitting $60/door eng, JUR, etc. Continual Market Improvement Construction Costs High level Market Evaluation Install and operating costs Broad Market Screen Initial Model Validation FSA Selection Business Case Refinement Give Go to Construct Release Doors Stage 2 High Level FSA Planning Stage 1 Competitive analysis/ High level planning Stage 3 Detailed FSA Planning and Prep Stage 4 Engineering and Permitting Stage 5 Construct D

Markets Identified provide robust returns I 19 • Pursue subsidized opportunities –private / public partnerships / BEAD as well as ARPA •Rural edge-out and gap fill-in opportunities to be pursued with BEAD •Avoid scaled overbuilders Targeting leveraged IRR returns of 20%+ in markets identified 20242025202620272028Dayton16,500 71,000 44,000 8,000 - Columbus7,500 28,000 28,700 24,800 - South Central Ohio- 6,500 8,000 8,000 8,000 BEAD- - 2,500 2,500 2,500 Tri-State- - 3,500 6,000 5,000 Unidentified New Markets- 500 19,300 10,700 79,500 Total24,000 106,000 106,000 60,000 95,000 Subsidy Projects South Central Ohio New Markets Under Consideration Source: Company information

Financial Overview
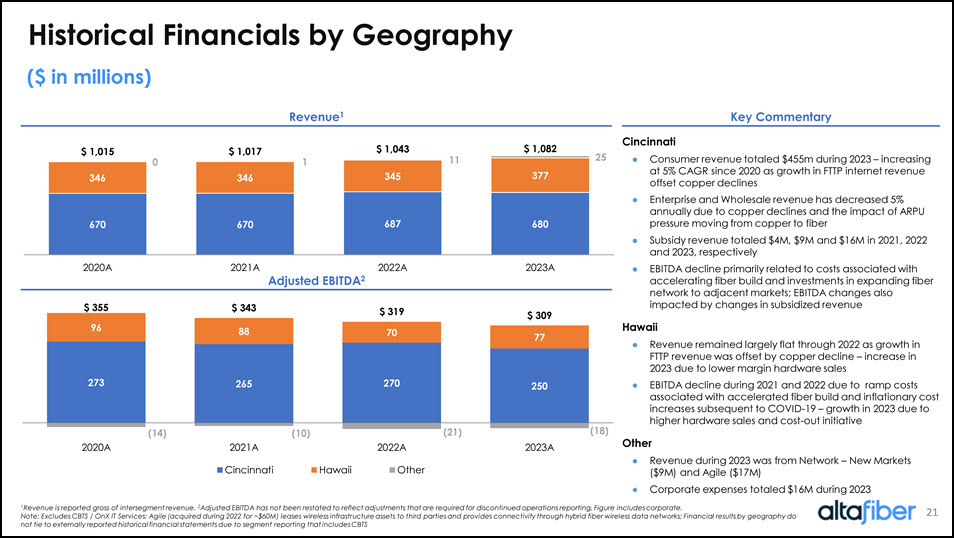
Historical Financials by Geography ($ in millions) Revenue1 Key Commentary Adjusted EBITDA2 1Revenue is reported gross of intersegment revenue. 2Adjusted EBITDA has not been restated to reflect adjustments that are required for discontinued operations reporting. Figure includes corporate. Note: Excludes CBTS / OnX IT Services; Agile (acquired during 2022 for ~$60M) leases wireless infrastructure assets to third parties and provides connectivity through hybrid fiber wireless data networks; Financial results by geography do not tie to externally reported historical financial statements due to segment reporting that includes CBTS Cincinnati Consumer revenue totaled $455m during 2023 – increasing at 5% CAGR since 2020 as growth in FTTP internet revenue offset copper declines Enterprise and Wholesale revenue has decreased 5% annually due to copper declines and the impact of ARPU pressure moving from copper to fiber Subsidy revenue totaled $4M, $9M and $16M in 2021, 2022 and 2023, respectively EBITDA decline primarily related to costs associated with accelerating fiber build and investments in expanding fiber network to adjacent markets; EBITDA changes also impacted by changes in subsidized revenue Hawaii Revenue remained largely flat through 2022 as growth in FTTP revenue was offset by copper decline – increase in 2023 due to lower margin hardware sales EBITDA decline during 2021 and 2022 due to ramp costs associated with accelerated fiber build and inflationary cost increases subsequent to COVID-19 – growth in 2023 due to higher hardware sales and cost-out initiative Other Revenue during 2023 was from Network – New Markets ($9M) and Agile ($17M) Corporate expenses totaled $16M during 2023
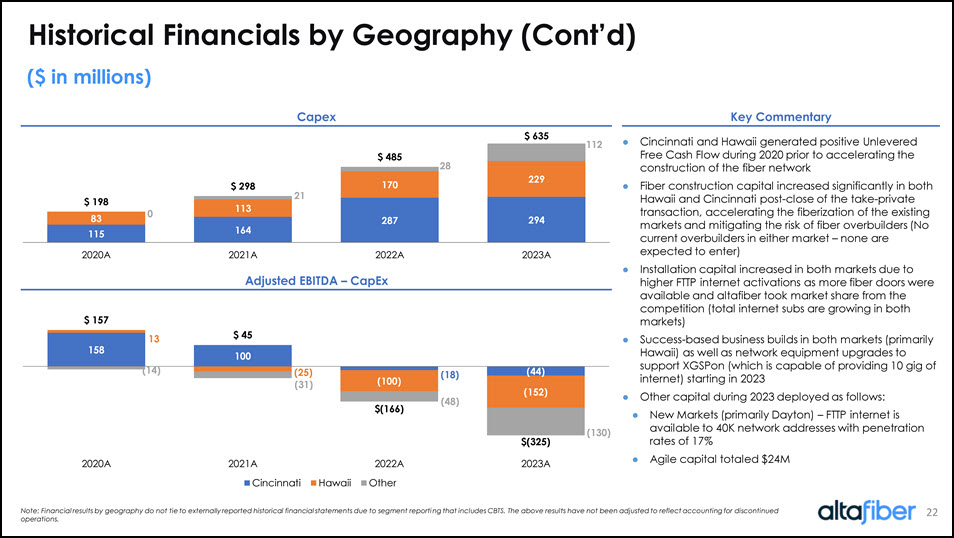
Historical Financials by Geography (Cont’d) ($ in millions) Capex Key Commentary Adjusted EBITDA –CapEx 115 164 287 294 83 113 170 229 0 21 28 112 $ 198 $ 298 $ 485 $ 635 2020A2021A2022A2023A Note: Financial results by geography do not tie to externally reported historical financial statements due to segment reporting that includes CBTS. The above results have not been adjusted to reflect accounting for discontinued operations. ●Cincinnati and Hawaii generated positive Unlevered Free Cash Flow during 2020 prior to accelerating the construction of the fiber network ●Fiber construction capital increased significantly in both Hawaii and Cincinnati post-close of the take-private transaction, accelerating the fiberization of the existing markets and mitigating the risk of fiber overbuilders (No current overbuilders in either market –none are expected to enter) ●Installation capital increased in both markets due to higher FTTP internet activations as more fiber doors were available and altafiber took market share from the competition (total internet subs are growing in both markets) ●Success-based business builds in both markets (primarily Hawaii) as well as network equipment upgrades to support XGSPon(which is capable of providing 10 gig of internet) starting in 2023 ●Other capital during 2023 deployed as follows: ●New Markets (primarily Dayton) –FTTP internet is available to 40K network addresses with penetration rates of 17% ●Agile capital totaled $24M 158 100 (18)(44)13 (25)(100)(152)(14)(31)(48)(130)$ 157 $ 45 $(166)$(325)2020A2021A2022A2023ACincinnatiHawaiiOther
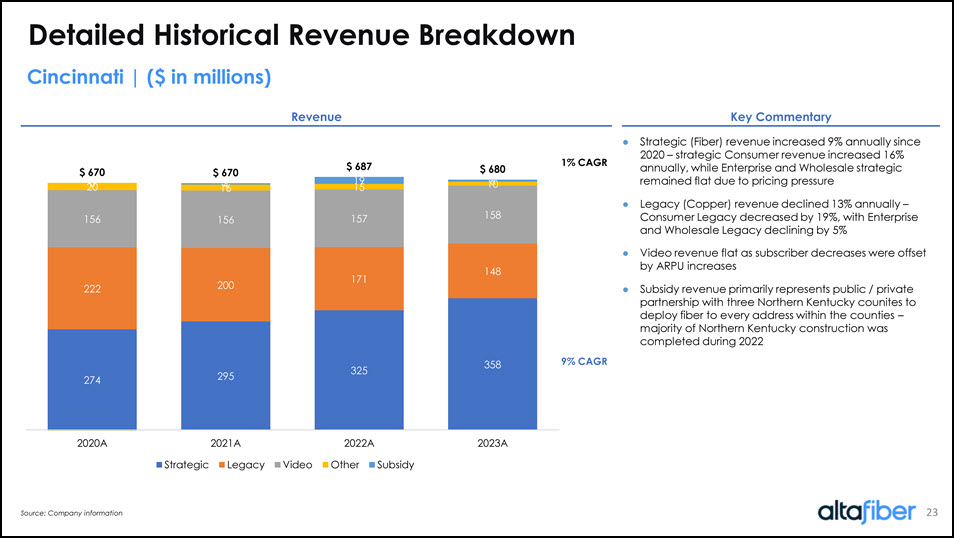
23 274 295 325 358 222 200 171 148 156 156 157 158 20 16 15 10 0 4 19 6 $ 670 $ 670 $ 687 $ 680 2020A2021A2022A2023AStrategicLegacyVideoOtherSubsidy 23 274 295 325 358 222 200 171 148 156 156 157 158 20 16 15 10 0 4 19 6 $ 670 $ 670 $ 687 $ 680 2020A2021A2022A2023AStrategicLegacyVideoOtherSubsidy Detailed Historical Revenue Breakdown Cincinnati | ($ in millions) Revenue Key Commentary ● Strategic (Fiber) revenue increased 9% annually since 2020 –strategic Consumer revenue increased 16% annually, while Enterprise and Wholesale strategic remained flat due to pricing pressure ●Legacy (Copper) revenue declined 13% annually –Consumer Legacy decreased by 19%, with Enterprise and Wholesale Legacy declining by 5% ●Video revenue flat as subscriber decreases were offset by ARPU increases ●Subsidy revenue primarily represents public / private partnership with three Northern Kentucky counites to deploy fiber to every address within the counties –majority of Northern Kentucky construction was completed during 2022 StrategicLegacyVideoOtherSubsidy Source: Company information
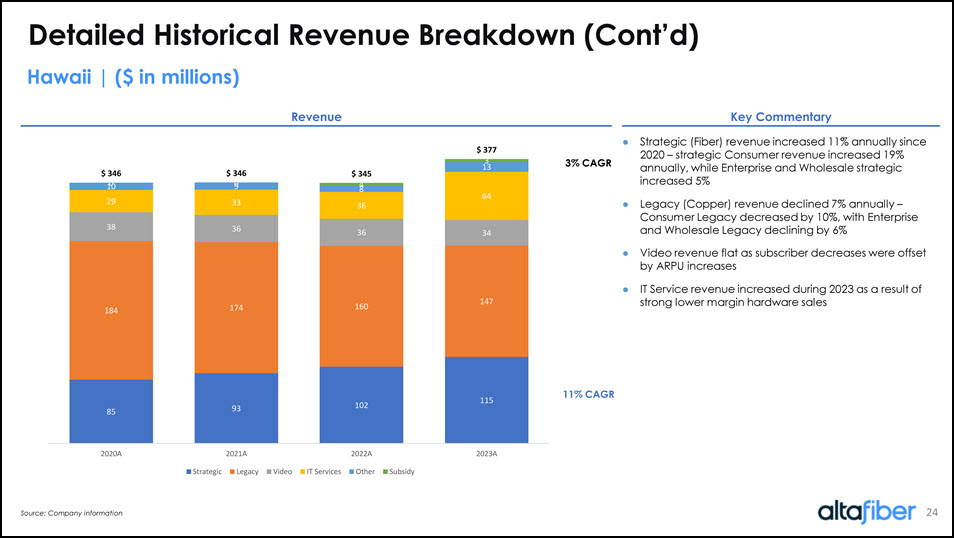
Revenue Key Commentary 3% CAGR 11% CAGR 85 93 102 115 184 174 160 147 38 36 36 34 29 33 36 64 10 9 8 13 0 0 4 3 $ 346 $ 346 $ 345 $ 377 2020A2021A2022A2023AStrategicLegacyVideoIT ServicesOtherSubsidy Strategic (Fiber) revenue increased 11% annually since 2020 –strategic Consumer revenue increased 19% annually, while Enterprise and Wholesale strategic increased 5% ●Legacy (Copper) revenue declined 7% annually –Consumer Legacy decreased by 10%, with Enterprise and Wholesale Legacy declining by 6% ●Video revenue flat as subscriber decreases were offset by ARPU increases ●IT Service revenue increased during 2023 as a result of strong lower margin hardware sales Detailed Historical Revenue Breakdown (Cont’d) Hawaii | ($ in millions)

Appendix
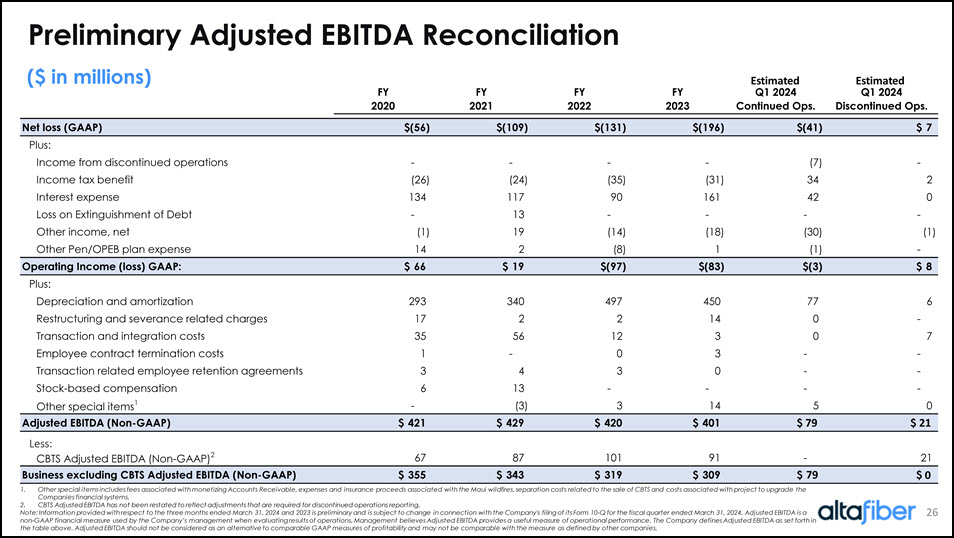
26 Preliminary Adjusted EBITDA Reconciliation ($ in millions) 1. Other special items includes fees associated with monetizing Accounts Receivable, expenses and insurance proceeds associated with the Maui wildfires, separation costs related to the sale of CBTS and costs associated with project to upgrade the Companies financial systems. 2. CBTS Adjusted EBITDA has not been restated to reflect adjustments that are required for discontinued operations reporting. Note: Information provided with respect to the three months ended March 31, 2024 and 2023 is preliminary and is subject to ch ang e in connection with the Company's filing of its Form 10 - Q for the fiscal quarter ended March 31, 2024. Adjusted EBITDA is a non - GAAP financial measure used by the Company’s management when evaluating results of operations. Management believes Adjusted EBITDA provides a useful measure of operational performance. The Company defines Adjusted EBITDA as set forth in the table above. Adjusted EBITDA should not be considered as an alternative to comparable GAAP measures of profitability and may not be comparable with the measure as defined by other companies. Type:GsData;FilePath:\\firmwide.corp.gs.com\ibdroot\projects\IBD-NY\archaean2024\926462_1\4. Lender Presentations\1. Excel\Slides.xlsx;SheetName:EBITDA Recon Annual; FYFYFYFYQ1 2024Q1 20242020202120222023Continued Ops.Discontinued Ops. Net loss (GAAP)$(56)$(109)$(131)$(196)$(41)$7Plus: Income from discontinued operations- - - - (7) - Income tax benefit(26) (24) (35) (31) 34 2 Interest expense134 117 90 161 42 0 Loss on Extinguishment of Debt- 13 - - - - Other income, net(1) 19 (14) (18) (30) (1) Other Pen/OPEB plan expense14 2 (8) 1 (1) - Operating Income (loss) GAAP:$66$19$(97)$(83)$(3)$8Plus: Depreciation and amortization293 340 497 450 77 6 Restructuring and severance related charges17 2 2 14 0 - Transaction and integration costs35 56 12 3 0 7 Employee contract termination costs1 - 0 3 - - Transaction related employee retention agreements3 4 3 0 - - Stock-based compensation6 13 - - - - Other special items1- (3) 3 14 5 0 Adjusted EBITDA (Non-GAAP)$421$429$420$401$81$19Plus: CBTS Adjusted EBITDA (Non-GAAP)267 87 101 91 - 21 Business excluding CBTS Adjusted EBITDA (Non-GAAP)$355$343$319$309$81$(2) Estimated Estimated Less: 21 1 1 1 79 79 21 0
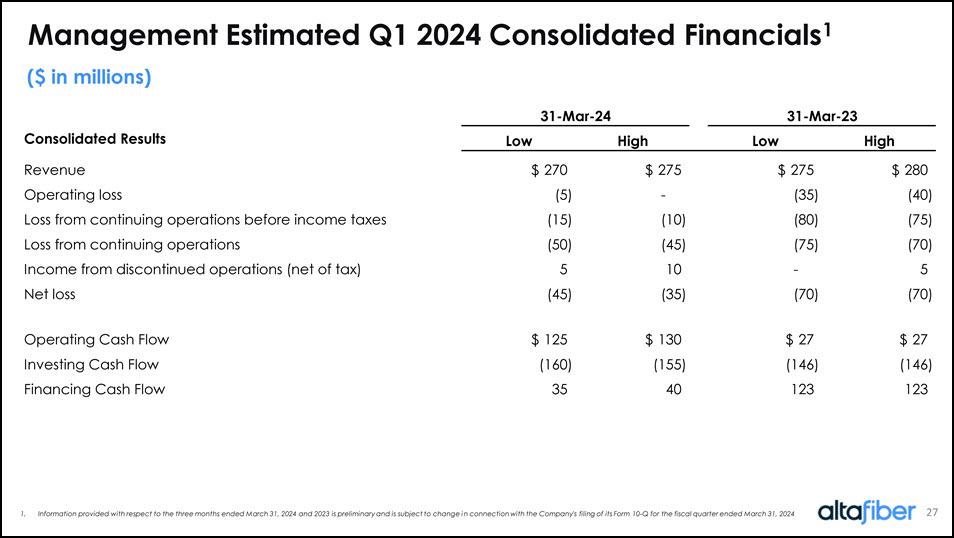
Management Estimated Q1 2024 Consolidated Financials1 ($ in millions) Consolidated Results LowHighLowHighRevenue$270$275$275$280Operating loss(5) - (35) (40) Loss from continuing operations before income taxes(15) (10) (80) (75) Loss from continuing operations(50) (45) (75) (70) Income from discontinued operations (net of tax)5 10 - 5 Net loss(45) (35) (70) (70) Operating Cash Flow$125$130$27$27Investing Cash Flow(160) (155) (146) (146) Financing Cash Flow35 40 123 123 31-Mar-2431-Mar-23 1. Information provided with respect to the three months ended March 31, 2024 and 2023 is preliminary and is subject to change in connection with the Company's filing of its Form 10-Q for the fiscal quarter ended March 31, 2024
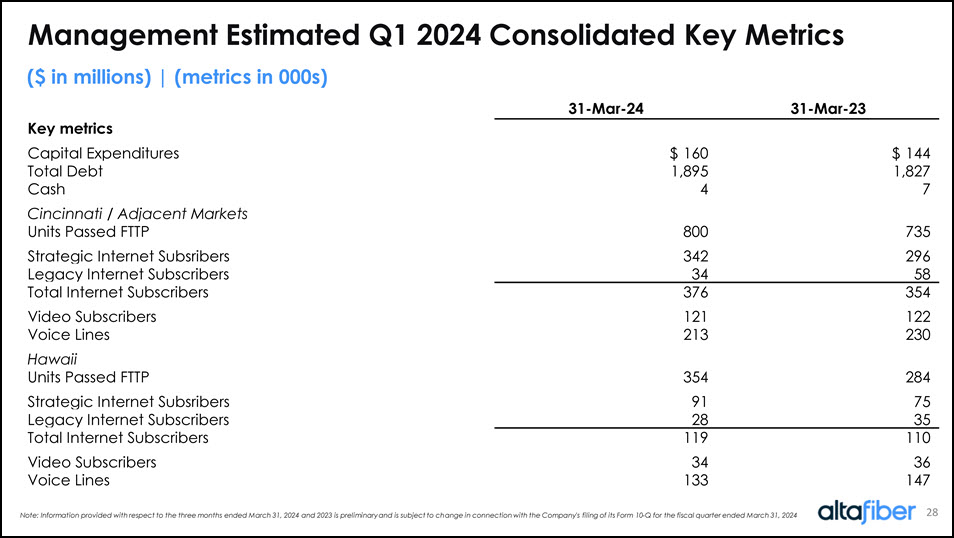
Management Estimated Q1 2024 Consolidated Key Metrics ($ in millions) | (metrics in 000s) 31-Mar-2431-Mar-23Key metricsCapital Expenditures$160$144Total Debt1,895 1,827 Cash4 7 Cincinnati / Adjacent MarketsUnits Passed FTTP800 735 Strategic Internet Subsribers342 296 Legacy Internet Subscribers34 58 Total Internet Subscribers376 354 Video Subscribers121 122 Voice Lines213 230 HawaiiUnits Passed FTTP354 284 Strategic Internet Subsribers91 75 Legacy Internet Subscribers28 35 Total Internet Subscribers119 110 Video Subscribers34 36 Voice Lines133 147 Note: Information provided with respect to the three months ended March 31, 2024 and 2023 is preliminary and is subject to change in connection with the Company's filing of its Form 10-Q for the fiscal quarter ended March 31, 2024