
Ron Brown
Chairman, President & CEO
INVESTOR PRESENTATION
MAY 2005
Beginning of Plastics Industry Recovery in U.S.
Capacity is being stretched in certain end markets.
Average utilization rates now approaching 84-85%.
U.S. dollar is very low in relation to euro and yen.
Plastics processors’ earnings and cash flow continue to improve,
enabling new investment.
Average age of existing plastics machinery estimated at 10+ years.
Pent up demand growing since 2001.
Today’s machines are more energy efficient and productive.
Plastics manufacturers need to improve efficiency and competitiveness.
2
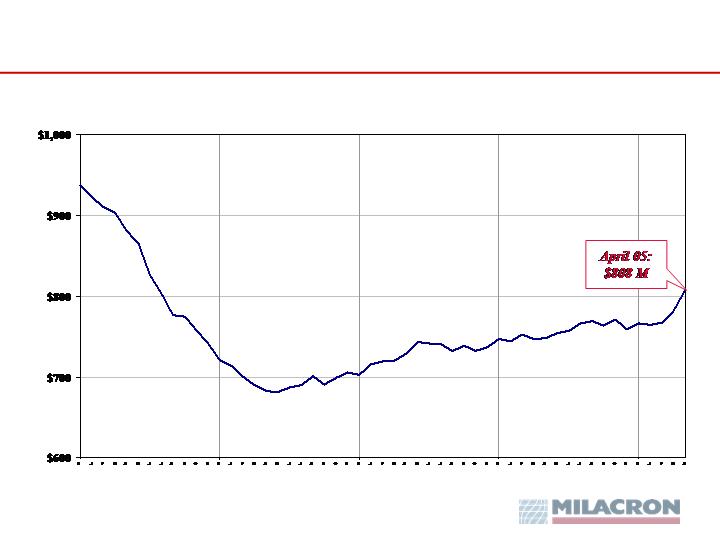
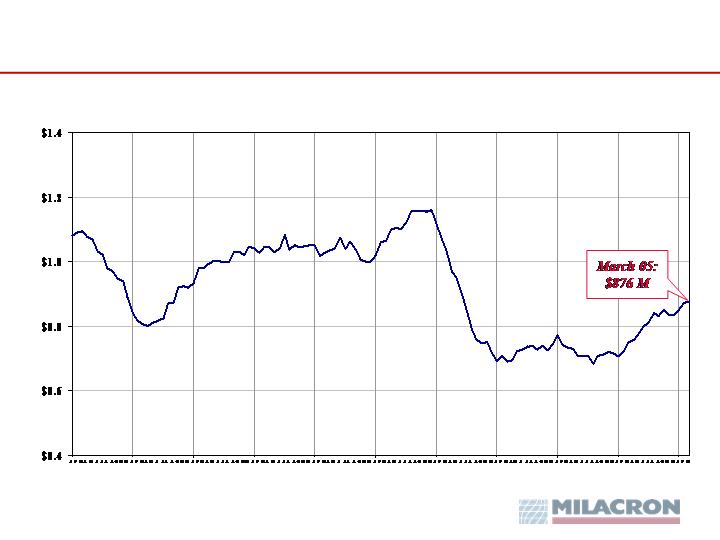
Milacron Consolidated New Orders
12-Month Moving Total
(In millions)
2001
2002
2003
2004
2005
3

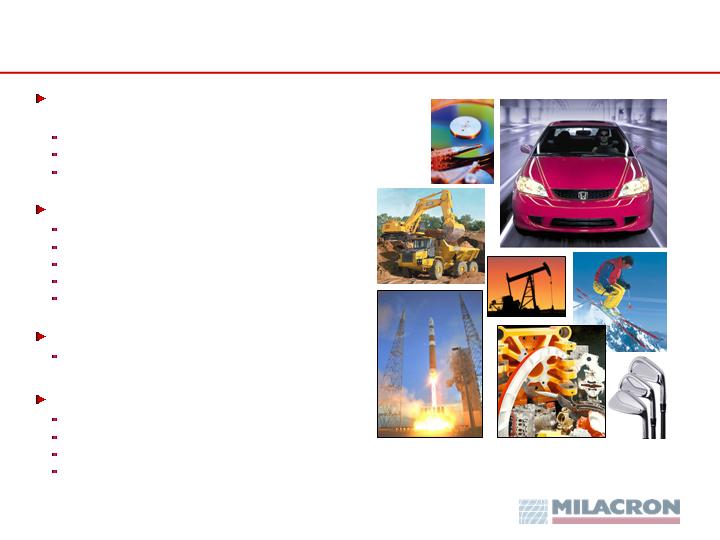
Milacron: A Leader in Two Major Technologies
Plastics Processing
Industrial Fluids
Broadest line supplier of equipment
and supplies - all 3 top processing
methods: injection molding, blow
molding and extrusion
#1 in North America; #2 or #3
worldwide
Global reputation for advanced
technology and excellent service
2004 sales: $665 M - 86%
2004 total segment earnings: $22 M*
Coolants, lubricants and process
cleaners used in metalcutting and
metalforming
#1 in North America in water-based
fluids; #3 or #4 worldwide
Global reputation for advanced
technology and excellent service
2004 sales: $109 M - 14%
2004 segment earnings : $9 M
* Sum of three plastics technologies segments’ earnings
4
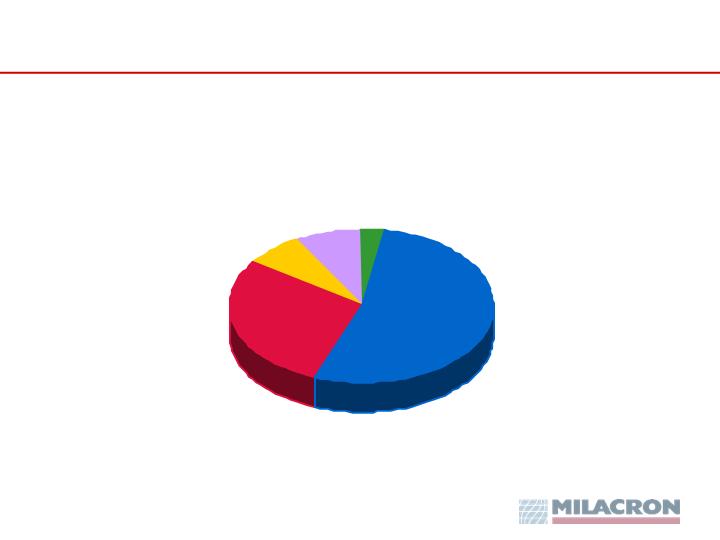
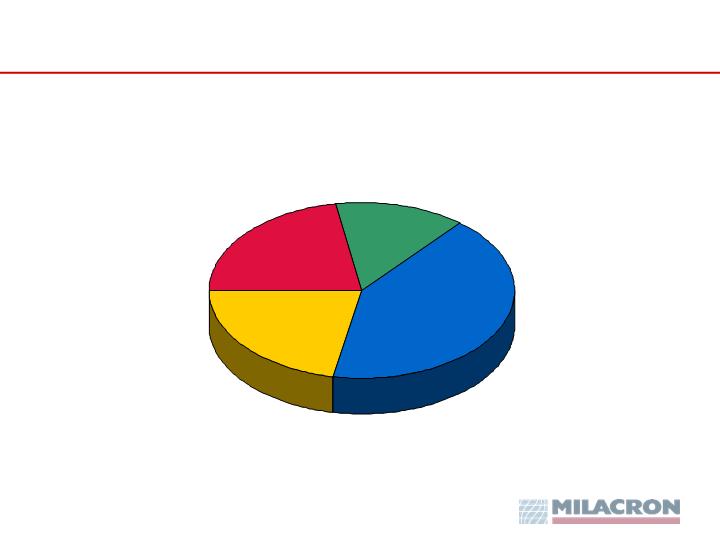
2004 Consolidated Sales - $774 Million
5
Geographic Diversity
United States
53%
Europe
29%
Canada & Mexico
7%
Asia
8%
ROW
3%
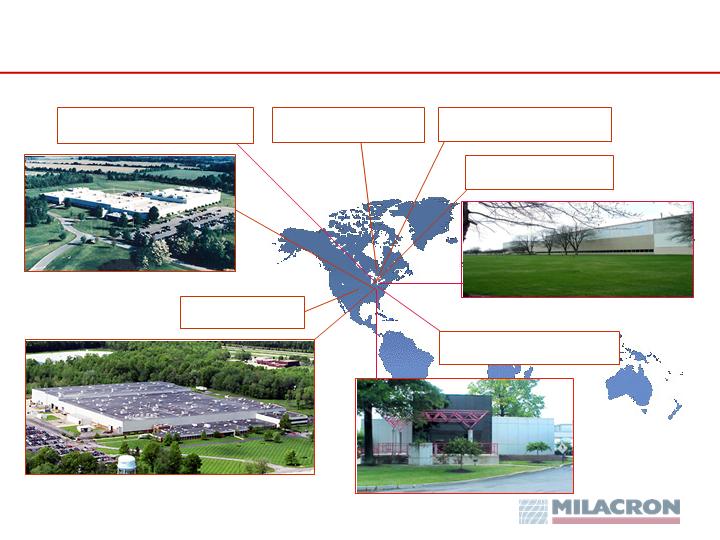
Global Presence: North America - 2,050 Employees
North American Machinery Manufacturing Center
Batavia, OH, USA
Cincinnati Milacron Parts Manufacturing
Mt. Orab, OH, USA
Tecumseh, MI, USA
Uniloy Milacron North America
Madison Heights, MI, USA
D-M-E North America
Wear Technology
McPherson, KS, USA
D-M-E & Master Unit Die
Charlevoix & Greenville, MI, USA
Progress Precision
Mississauga, ONT, Canada
Cimcool Industrial Fluids
Oak Int’l & Producto Chemicals
Sturgis & Livonia, MI, USA
D-M-E North America
Youngwood & Lewistown, PA, USA
Cincinnati, OH, USA
6
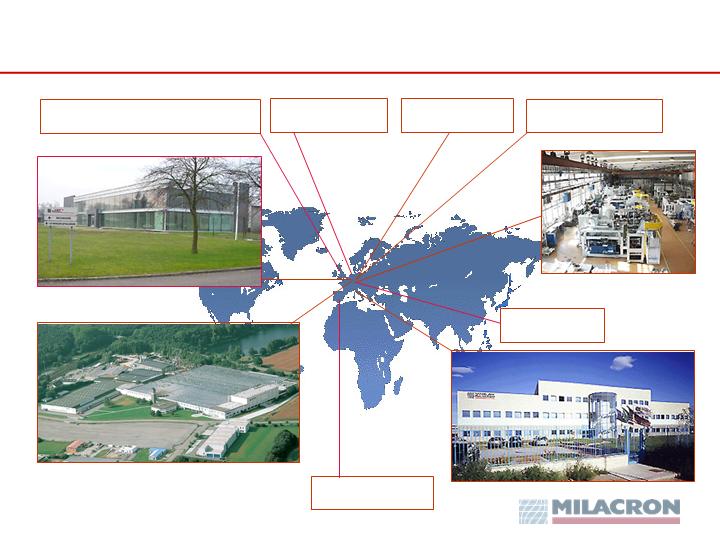
Global Presence: Europe - 1,100 Employees
Expulsores Girona
Barcelona, Spain
Ferromatik Milacron Europe
Malterdingen, Germany
D-M-E Europe
Mechelen, Belgium
Magenta, Italy
Uniloy Milacron Europe
Policka, Czech Republic
Uniloy Milacron Europe
Uniloy Milacron B&W
Berlin, Germany
D-M-E Normalien
Fulda, Germany
Cimcool Europe
Vlaardingen, Holland
Oak Int’l & Plastic Moulding Supplies
Corby, England
Cimcool Europe
Freiburg, Gemany
7
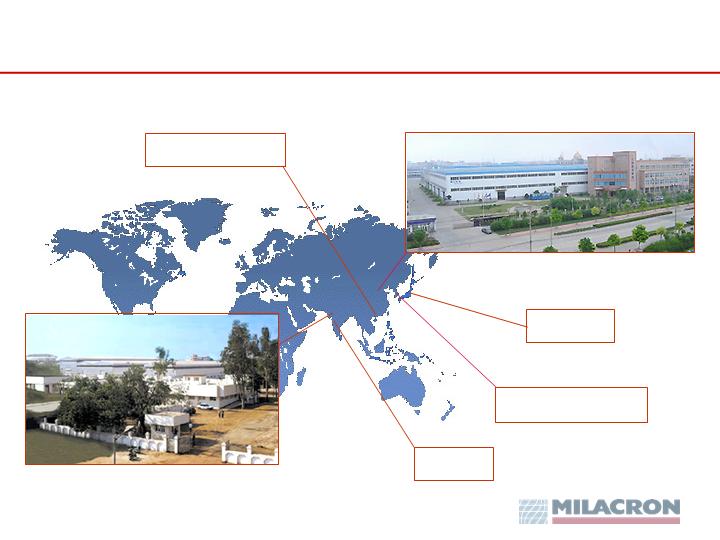
Global Presence: Asia - 350 Employees
Milacron Plastics Machinery
Jiangyin, China
Ferromatik Milacron India
Ahmedabad
(Jiangyin) Company
D-M-E China
Hong Kong, Dongguan City
D-M-E Japan
Tokyo
D-M-E India
Belgaum
Cimcool Asia
Ulsan, South Korea
8
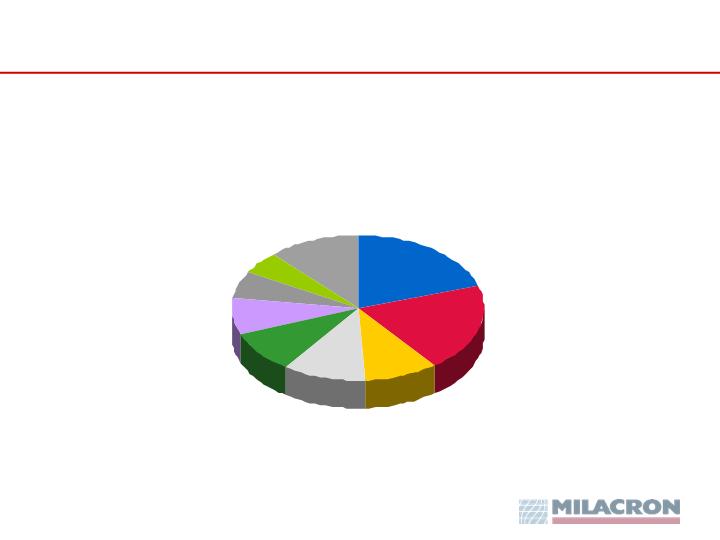
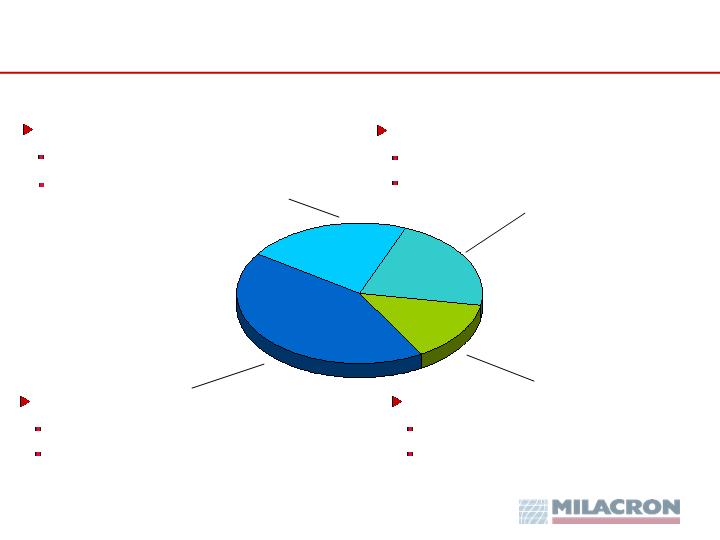
2004 Consolidated Sales - $774 Million
9
End Market Diversity
Packaging
20%
Automotive
20%
Components
9%
Consumer
Goods
11%
Building
Materials
9%
Custom
Molders
8%
Medical
6%
Appliances
5%
Other
12%
Partial Customer List
Abbott Labs
Alcoa/Alpine
Allen Bradley
American Plastic Toys
Bausch & Lomb
Baxter Healthcare
Becton Dickinson
Bemis Manufacturing
Bic Group
Black & Decker
Bosch
Boston Scientific
Braun
Briggs & Stratton
Brown Medical
Burpee
Cascade Engineering/
CK Technologies
Charlotte Pipe
Clorox
Colgate-Palmolive
Consolidated
Container
Crane Plastics
Crown Group
Daimler-Chrysler
Keytronics
Kohler
Kroger Company
Lancer
Lear
Louisiana Pacific
Lucent Technologies
Mattel/Fisher-Price
Maytag/Amana
Mercury Marine
Merle Norman
Cosmetics
Mobil Chemical
Motorola
Mountain Pure Water
Newell/Rubbermaid
Nike
Nummi
Nypro
Oracle Lens
Osram/Sylvania
Owens-Illinois
Papermate
Parket Hannifin
Pitney Bowes
Playtex
Dean Foods
Delphi
Deutsch ECD
Diamond Plastic
Dow/Union Carbide
Dupont
Electrolux Home
Products
Emerson Elec./ Mallory
Evenflo
Fiat
General Electric
General Motors
Gillette
Graco
Harley Davidson
Hasbro
Honda
Honeywell
Hoover
IPEX Inc.
ITW Delpro
Johnson & Johnson
Johnson Controls
KW Plastics
Keter (Resin Partners)
PlayMobil
Polaris Industries
Procter & Gamble
Rayovac
Shop Vac
Siegel Robert
Siemens
Spalding Sports
Stanley Electric
Sunoco/Crellin
Tenneco Packaging
Timken
Toro
Toyota
Tupperware
Tyco / AMP
U.S. Fence
Valeo
VisionTech
Volvo
West Pharmaceuticals/
The Tech Group
Whirlpool
10
Product Type Diversity
2004 Mix of Sales
Durables
Services
&
Aftermarket
Industrial
Fluids
Machinery
42%
22%
14%
22%
11
Milacron Segments
Industrial Fluids - Global
2004: sales $109 M; segment earnings $9 M
Metalworking fluids, solvents
and process cleaners
Mold Technologies - Global
2004: sales $167 M; segment earnings $4 M
Mold bases, hot-runner systems, mold
components, MRO supplies
Machinery Technologies - N.A.
2004: sales $334 M; segment earnings $16 M
Injection molding, blow molding
and extrusion
Machinery Technologies - Europe
2004: sales $167 M; segment earnings $2 M
Injection molding and blow molding
14%
43%
21%
22%
12
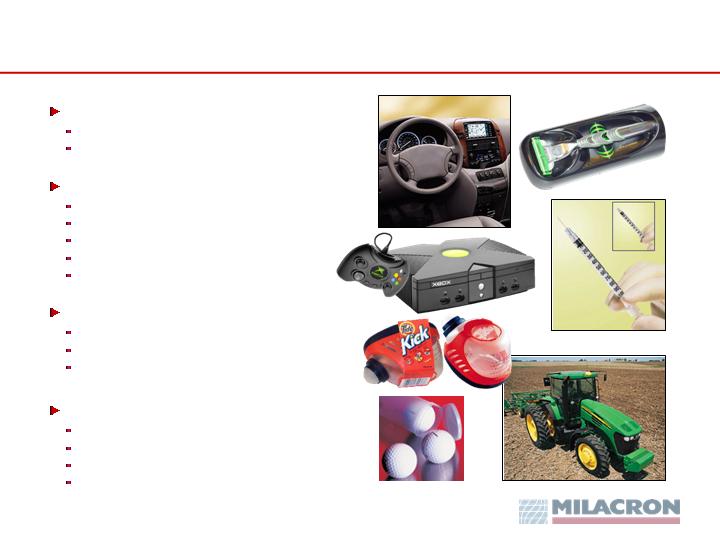
Plastics Technologies – Injection Molding
Most common, versatile process
Accounts for over half of the market
Used in wide variety of applications
Customer categories
Automotive
Consumer goods
Packaging
Electrical/Electronic
Medical/Scientific
Milacron’s rank
#1 in North America
#3 in Europe
#3 worldwide
Milacron’s technology leadership
All-electric designs
Multi-material, multi-component molding
High-speed, thin-wall molding
Insert molding
13
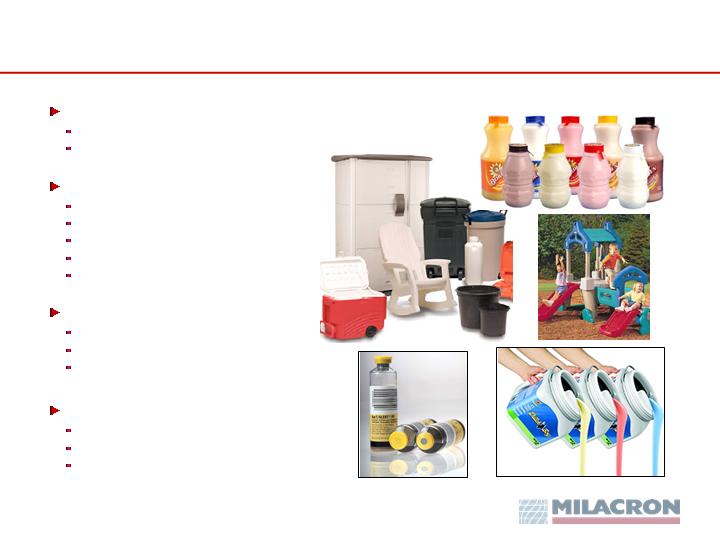
Plastics Technologies – Blow Molding
For hollow, semi-hollow shapes
Containers of all sorts
Industrial and commercial parts
Customer categories
Packaging
Automotive
Housewares/furniture
Building products
Medical/scientific
Milacron’s rank
#1 in North America
#3 in Europe
#3 worldwide
Milacron’s technology leadership
HDPE (non-PET) containers
Industrial applications
Structural foam molding
14

Plastics Technologies – Extrusion
For continuous profiles
Building materials: pipe, siding, decking
Tubing, conduit
Cylindrical parts
Customer categories
Building products
Electrical cable
Medical
Packaging
Appliances
Milacron’s rank
#1 in twin-screw extrusion
in North America
Milacron’s technology leadership
PVC pipe, siding, door and window frames
Wood flour, plastic lumber
15

Plastics Technologies – Mold Tooling
Mold tooling and supplies for injection
molding, the most common, versatile
process
Accounts for over half of the market
Used in wide variety of applications
Customer categories
Automotive
Consumer goods
Packaging
Electrical/Electronic
Medical/Scientific
Milacron’s rank
#1 in North America
#2 in Europe
#2 worldwide
Milacron’s technology leadership
Mold components
Mold making equipment and supplies
Hot runner systems
Mold control systems
16

Plastics Businesses – Global Breadth and Depth
Plastics Technologies
($ in millions)
Broadest line supplier of equipment and supplies - all three top
processing methods: injection molding, blow molding and extrusion
#1 in North America; #2 or #3 worldwide
Broad customer base
Packaging, automotive, consumer, construction, electric/electronic, medical, etc.
No customer = more than 2% of sales; top ten customers = less than 10% of sales
Global reputation for advanced technology and excellent service
* Total of three plastics technologies segments’ earnings
17
Industrial Fluids for Metalworking
Coolants, lubricants and process cleaners
for a variety of metalworking applications
Metalcutting: milling, drilling, turning, sawing, etc.
Metalforming: stamping
Grinding
Customer categories
Automotive
Agricultural and industrial equipment
Industrial components
Appliances
Medical
Milacron’s rank
#1 in North America in water-based fluids
Milacron’s technology leadership
Premium, high-performance fluids
Fluids for machining aluminum, titanium, etc.
Synthetic and semi-synthetics fluids
Green (vegetable oil-based) fluids
18
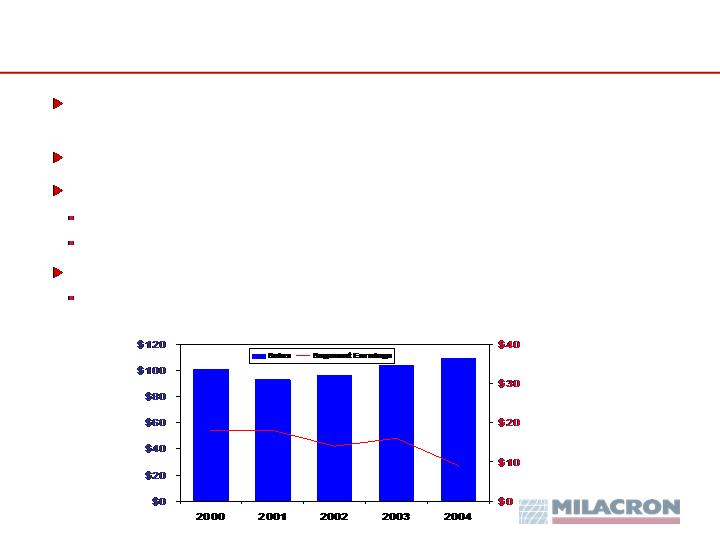
Industrial Fluids Business Consistent
Industrial Fluids
($ in millions)
Coolants, lubricants and process cleaners used in metalcutting (e.g.
machining, grinding) and metalforming (e.g. stamping)
Segment operates as an independent, stand-alone business
In pronounced downturn, maintained its revenue stream
Broad use and consumable nature of fluids result in steady sales
Fluids required to manufacture products
In 2004, margins impacted by higher material costs
Price increase taking hold in 2005
18
18
14
16
9
19
U.S. Injection Machinery Industry New Orders
12-Month Moving Total
(In billions)
Source: The Society of the Plastics Industry
1995
1996
1997
1998
1999
2000
2001
2002
2003
2004
20
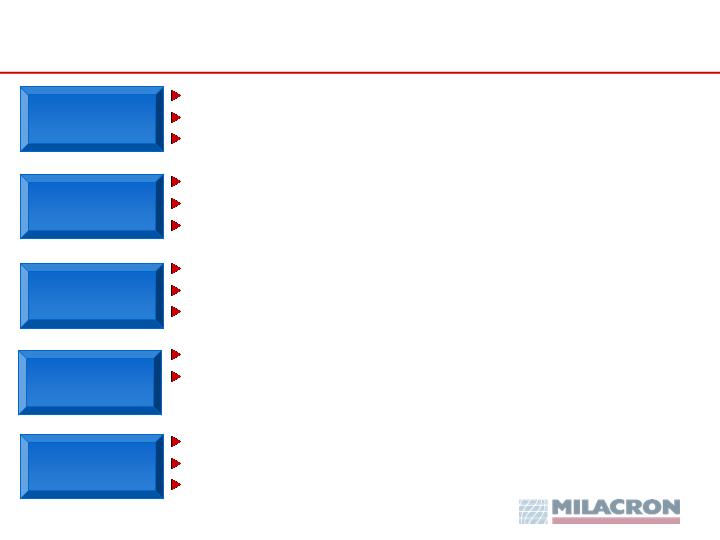
Closed 9 manufacturing facilities from ongoing operations
Divested non-core assets: cutting tools, grinding wheels
Generated $75 M of annual restructuring cost benefits
Drove Lean and Six Sigma throughout the organization
Cut primary working capital from 40% to 25% of sales
Lowered inventory by $119 M
Reduced debt by $350 million
Secured $100 million new equity infusion
Refinanced long-term debt: Notes & revolver
Continued steady flow of new product introductions
Half our machinery sales in 2004 were products
introduced since 2001
Grew aftermarket sales by 14%
Expanded new service organization
Improved our industry-leading response times
Actions Taken Since 2001
Restructured
Operations
Improved
Capital
Structure
Maintained
Technological
Leadership
Increased
Operating
Efficiency
Expanded
Aftermarket
& Service
21
Provide needed technology and aftermarket support
for traditional markets
Expand presence in developing markets, such as
Eastern Europe and Asia
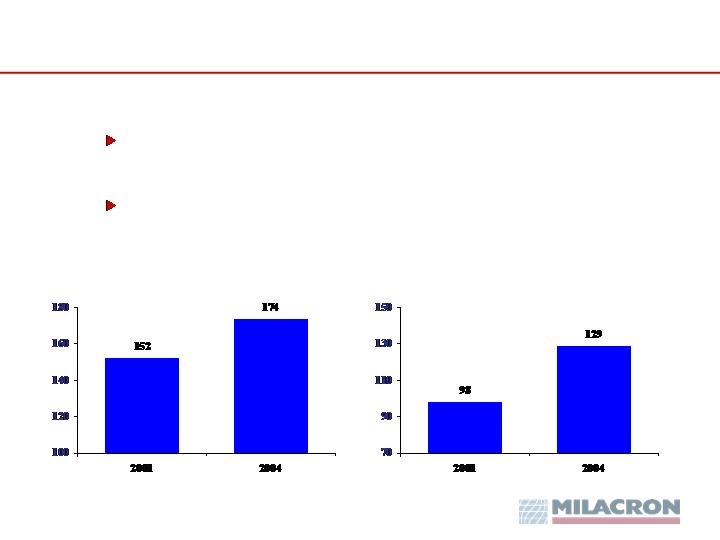
Maximize Value through Growth in Key Markets
Machinery Aftermarket Sales
($ in millions)
Sales to Non-Traditional Markets*
($ in millions)
Continuing to Execute Long-Term Strategy
* All markets excluding U.S., Canada and Western Europe.
22
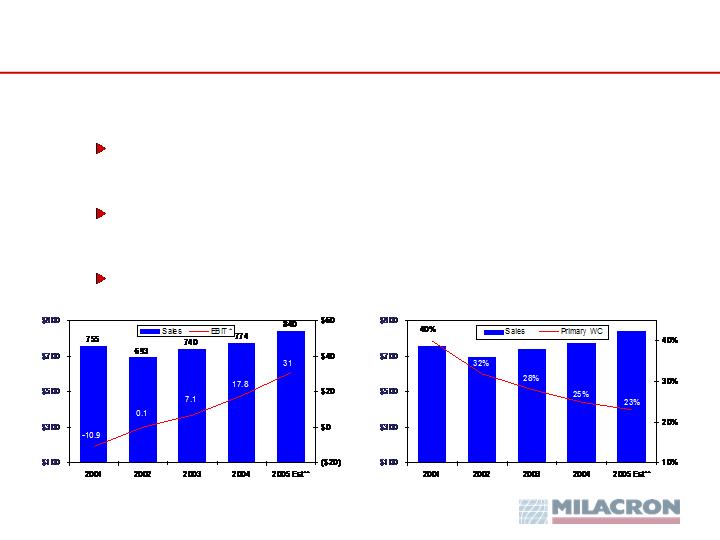
Continuing to Execute Long-Term Strategy
Profitable Growth through Operational Excellence
Continue to improve efficiencies and optimize working capital
through implementation of Lean and Six Sigma
Reduce product costs through standardization and strategic
sourcing
Earn technology- and service-based pricing
($ in millions)
* Ex certain items (see page 30). ** Mid-point of guidance issued 5/5/05.
($ in millions)
23
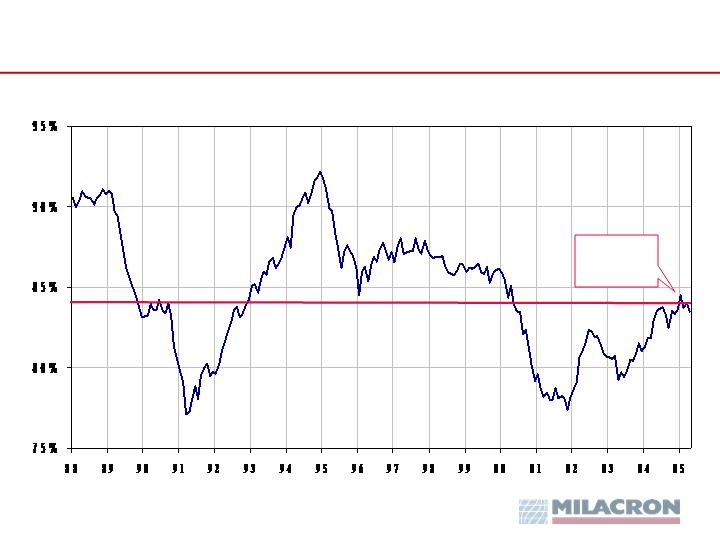
Sources: U.S. Federal Reserve Board
(Utilization)
U.S. Plastics Processors’ Capacity Utilization
April 05:
83.5%
24
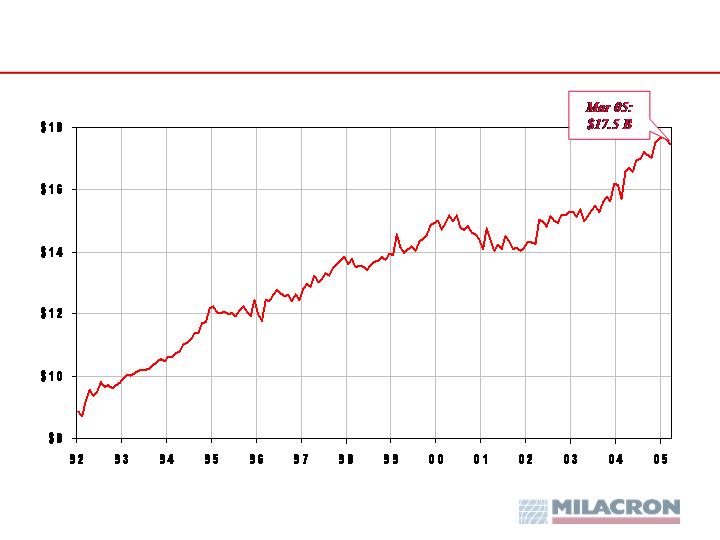
U.S. Plastics & Rubber Shipments
(In Billions - Seasonally Adjusted)
Source: U.S. Census Bureau
25
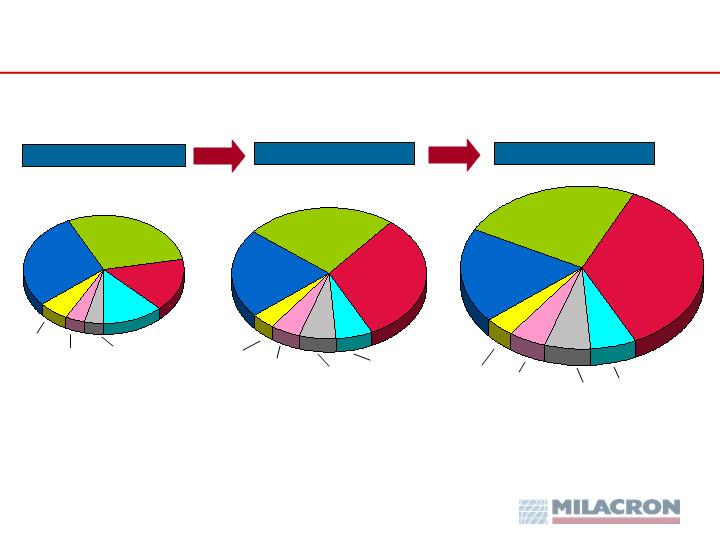
Global Plastics Consumption - Projected Growth
2003 – 176 M Tons
1990 – 86 M Tons
Western
Europe
29%
North
America
29%
Southeast
Asia 16%
Japan
12%
North
America
25%
Western
Europe
22%
Southeast
Asia 32%
Southeast
Asia 36%
North
America
24%
Western
Europe
19%
Eastern
Europe
6%
Latin
America
4%
Africa/
Middle
East
4%
Eastern
Europe
4%
Latin
America
5%
Africa/
Middle
East
6%
Japan
6%
Eastern
Europe
4%
Latin
America
5%
Africa/
Middle
East
6%
Japan
6%
2010 – 250 M Tons
Source: VKE, June 2004
5.7%
5.1%
26
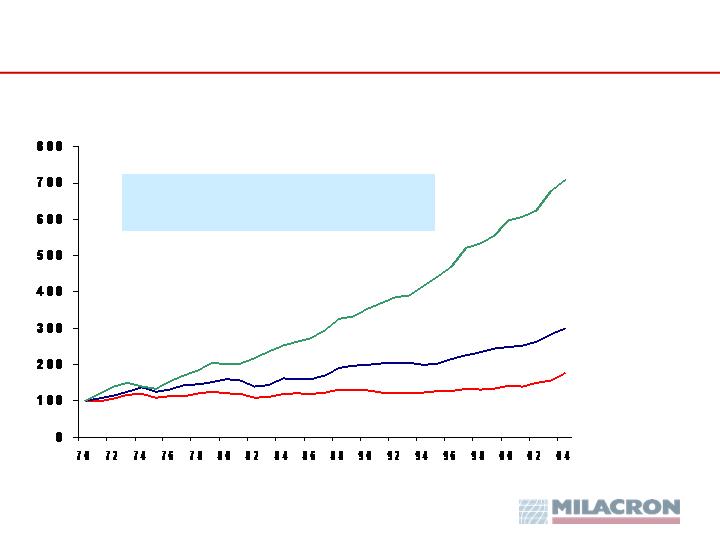
Plastics
Aluminum
Steel
Plastics: The Global Material of Choice
Indexed Production in Weight
(1970 = 100)
Compound Annual Growth Rates 1970-2004
Steel: 2% Aluminum: 3% Plastics: 6%
Source: SPI, Milacron
27

FINANCIAL REVIEW
Bob Lienesch
Senior Vice President - Finance
Controller & CFO

Forward-Looking Statements
Any forward-looking statements made at this meeting by their
nature involve risks, assumptions and uncertainties that could
significantly impact operations, markets, products and
expected and actual results.
For further information, please refer to the Cautionary
Statement included in our most recent Form 10-Q on file with
the Securities and Exchange Commission.
29
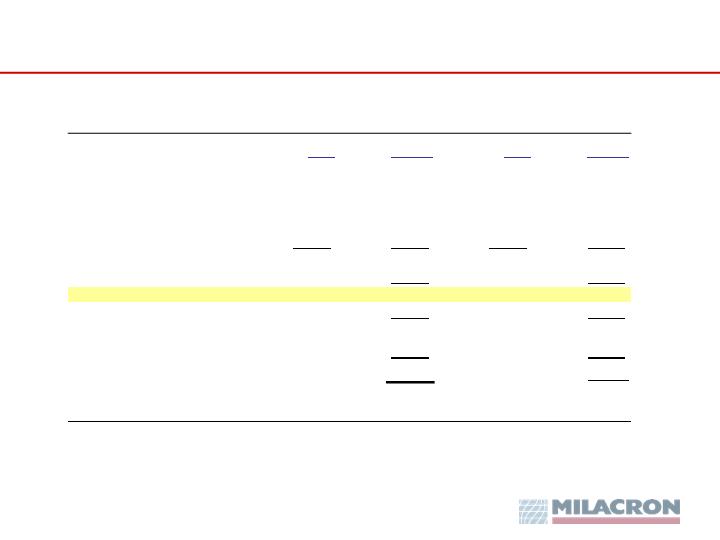
Five-Year Financial Summary
From Continuing Operations
* Ex items: Excludes restructuring and refinancing costs as well as
the writedown of goodwill and deferred tax assets.
30
(Dollars in millions)
2004
2003
2002
2001
2000
Sales
774
$
740
$
693
$
755
$
975
$
EBIT*
18
7
0
(11)
90
* Excludes restructuring and refinancing costs as well as
First Quarter Comparison
From Continuing Operations
* Excludes restructuring and refinancing costs
31
(Dollars in millions)
Sales
Earnings
Sales
Earnings
Machinery Technologies - N. America
87
$
1.9
$
77
$
(0.6)
$
Machinery Technologies - Europe
34
(2.2)
43
1.1
Mold Technologies
44
2.3
43
1.4
Industrial Fluids
27
1.4
26
2.5
Segment Totals
192
3.4
189
4.4
Corporate and Unallocated
(3.7)
(3.9)
EBIT *
(0.3)
0.5
Restructuring and Refinancing
(0.4)
(7.5)
Interest
(8.2)
(7.9)
Loss before Tax
(8.9)
(14.9)
Q1 - 2005
Q1 - 2004
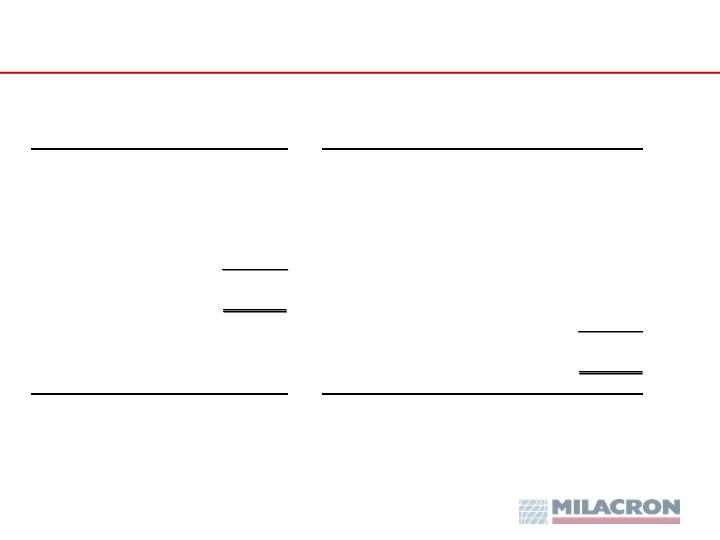
Q1-05 vs. Q1-04 Sales and EBIT* Bridges
* Ex certain items (see page 30).
From Continuing Operations
32
(Dollars in millions)
(Dollars in millions)
Q1-04 SALES
189
$
Q1-04 EBIT
0.5
$
Volume
(2)
Volume/Mix/Price
2.5
Price
1
Material Cost Increases
(5.4)
Currency
4
Cost Reduction Benefits
3.6
Pension & Insurance
(1.2)
Q1-05 SALES
192
$
Sarbanes Oxley Compliance
(1.5)
Other
1.2
Q1-05 EBIT
(0.3)
$
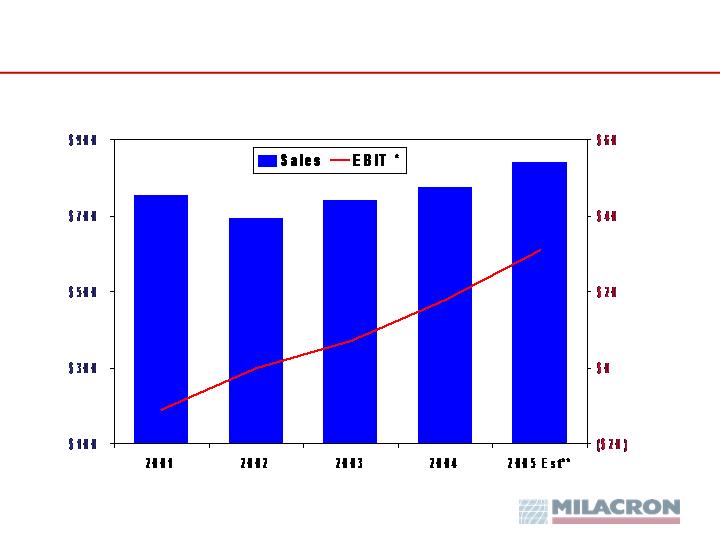
Sales and EBIT Trend
($ in millions)
From Continuing Operations
* Ex certain items (see page 30). ** Mid-point of guidance issued 5/5/05.
33
2004 - 2005 Sales and EBIT* Bridges
34
From Continuing Operations
* Ex certain items (see page 30). ** Mid-point of guidance issued 5/5/05.
(Dollars in millions)
(Dollars in millions)
2004 SALES
774
$
2004 EBIT
17.8
$
Volume
40
Volume/Price/Mix
30.3
Price
12
Material Cost Increases
(16.8)
Currency
14
Cost Reduction Benefits
15.7
Pension & Insurance
(6.4)
2005 SALES
840
$
Sarbanes Oxley Compliance
(4.0)
ERP Implementation
(2.0)
Other
(4.1)
2005 EBIT **
30.5
$

Sales and Working Capital Trend
($ in millions)
From Continuing Operations
* Mid-point of guidance issued 5/5/05.
** Primary working capital = inventory + accounts receivable
less accounts payable - advance payments.
35

Capitalization – as of March 31, 2005
36
($ in millions)
Cash
44
$
Debt
Asset-Based Loan (~$40 M borrowing capactiy)
-
Senior Secured Notes 11.5% due 2011
(1)
220
Capital Leases and Other
19
Total Debt
239
Net Debt
195
Equity
4% Preferred Stock
6
6% Series B Convertible Preferred Stock
(2)
113
Common Shares and Capital in Excess of Par
348
Contingent Warrants
1
Accumulated Deficit
(324)
Accumulated Comprehensive Loss
(3)
(109)
Total Equity
35
Total Capitalization
274
$
(1)
Net of original issue discount
(2)
Mandatory conversion into common shares in 2011; represents 51% of outstanding shares on as-converted basis
(3)
Includes pension liability adjustment of $86 M
Note: Diluted shares outstanding on an as-converted basis were approximately 100 M at 3/31/05
and are projected to be approximately 107 M at 6/30/05.
Financial Summary
New order pattern in U.S. improving
Major cost reductions complete;
break-even point lowered
Material costs stabilizing; pricing improving
Balance sheet and liquidity improved
Outlook positive
37

APPENDIX

Detailed Five-Year Financial Summary
From Continuing Operations
* Ex certain items: Excludes restructuring and refinancing costs
as well as the writedown of goodwill and deferred tax assets.
39
(Dollars in millions except per-share data)
2004
2003
2002
2001
2000
Sales
774.2
$
739.7
$
693.2
$
755.2
$
974.5
$
A/T Earnings (Loss) from Continuing
Operations before Restructuring,
Refinancing and Goodwill Charges
(16.9)
(20.0)
(8.9)
(17.6)
49.1
Restructuring Costs
(13.0)
(25.5)
(8.8)
(11.0)
(0.9)
Refinancing Costs
(21.4)
(1.8)
-
-
-
Goodwill Impairment Charge
-
(65.6)
(188.7)
-
-
Writedown of Deferred Tax Assets
-
(70.8)
-
-
-
Earnings (Loss) from
Discontinued Operations
(0.5)
(7.2)
(16.8)
(7.0)
22.8
Net Earnings (Loss)
(51.8)
(190.9)
(223.2)
(35.6)
71.0
Per Share
(1.34)
(5.21)
(6.13)
(0.99)
1.85
EBIT*
17.8
7.1
0.0
(10.9)
89.5
EBITDA*
38.1
$
28.8
$
23.1
$
24.0
$
124.8
$
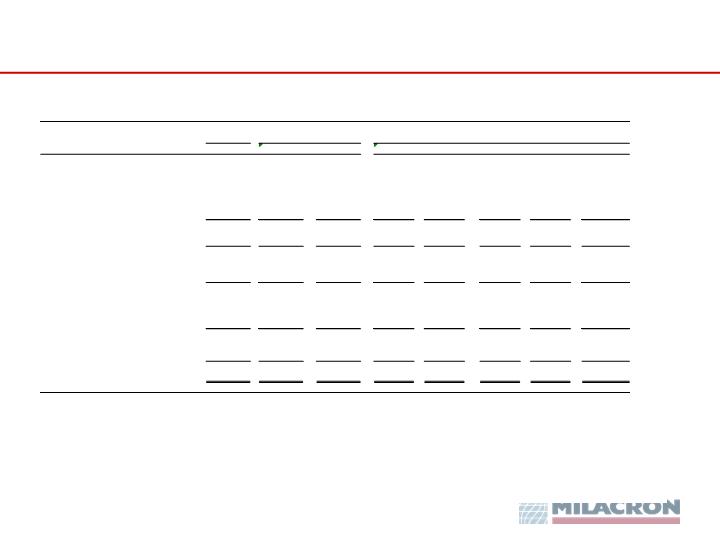
2004 vs. 2003
* Ex certain items (see page 30).
From Continuing Operations
40
Sales
Earnings
Sales
Earnings
Machinery Technologies - N. America
334
$
16.0
$
321
$
8.1
$
Machinery Technologies - Europe
167
1.9
151
(1.4)
Mold Technologies
167
4.3
169
1.8
Industrial Fluids
109
9.2
104
15.7
Eliminations
(3)
-
(5)
-
Segment Totals
774
31.4
740
24.2
Unallocated and Corporate
(13.6)
(17.1)
EBIT *
17.8
7.1
Interest
(37.3)
(23.0)
Loss before Tax
(19.5)
(15.9)
Provision (benefit) for income taxes
(2.6)
4.1
Loss after Tax
(16.9)
(20.0)
* From continuing operations before one-time items
2004
2003
2003 - 2004 Sales and EBIT* Bridges
41
From Continuing Operations
* Ex certain items (see page 30).
(Dollars in millions)
(Dollars in millions)
2003 SALES
740
$
2003 EBIT
7.1
$
Volume
4
Volume/Mix/Price
9.6
Currency
25
Material Cost Increases
(10.3)
Price
5
Cost Reduction Benefits
29.8
Pension & Insurance
(10.7)
2004 SALES
774
$
Sarbanes Oxley
(1.9)
Other
(5.8)
2004 EBIT
17.8
$

Guidance: Profit & Loss Items
Issued on May 5
42
and year ended Dec. 31, 2004, respectively).
2005 and year ended Dec. 31, 2005, respectively (versus $0.1 million and $2.0 million in quarter ended Jun. 30, 2004
Includes $1.9 million and $6.0 million of expenses related to Sarbanes-Oxley compliance in quarter ended Jun. 30,
quarter ended Jun. 30, 2004 and year ended Dec. 31 2004, respectively).
in quarter ended Jun. 30, 2005 and year ended Dec. 31, 2005, respectively (versus $1.6 million and $6.4 million in
Includes $2.8 million and $11.3 million of expenses related to the U.S defined benefit plan
Earnings (loss) after tax
2
$5 million and $14 million in quarter ended Jun. 30, 2005, and year ended Dec. 31, 2005, respectively.
Includes increased sales over the same periods a year ago due to the strengthening of the Euro of approximately
Sales
1
Quarter Ended
Year Ended
(In millions)
June 30, 2005
Dec. 31, 2005
Projected profit & loss items
Sales (1)
$198 - 212
$825 - 855
Total plastics technologies
170 - 180
710 - 730
Industrial fluids
28 - 32
115 - 125
Segment earnings
Total plastics technologies
3 - 5
25 - 32
Industrial fluids
3 - 5
13 - 16
Corporate expenses
3 - 4
12 - 13
Interest expense - net
7 - 8
31 - 32
Provision for income taxes
< 1
4 - 5
Restructuring charges
< 1
1
Earnings (loss) after tax from continuing operations (2)
(6) - 0
(13) - 0
Guidance: Cash Flow & Balance
Sheet Items
Issued on May 5
43
3 Working capital = inventory + receivables – trade payables –advance billings
Dec. 31, 2005
June 30, 2005
(In millions)
Year Ended
Quarter Ended
Projected cash flow & balance sheet items
Depreciation
4 - 5
20 - 21
Working capital - increase (decrease)
(3)
(6) - (2)
0 - 10
Cash pension contribution
< 1
2 - 3
Capital expenditures
4 - 5
14 - 16
Cash interest
13 - 14
27 - 28
Cash dividends
1.5
6
Cash taxes
-
< 1
Cash restructuring
-
< 1
Average shares outstanding - basic
47 - 48
47 - 48
Average shares outstanding - diluted
97 - 98
100 - 102
44
Reconciliation of Net Earnings (Loss) to EBIT and EBITDA
Reconciliation of Consolidated Earnings to Internal Reporting Measures
Milacron Inc. and Subsidiaries
($ in millions)
Year Ended
December 31,
2005 (a)
2005
2004 (b)
2004
2003 (b)
2002 (b)
2001 (b)
2000
Net loss
(6.5)
$
(9.1)
$
(16.6)
$
(51.8)
$
(190.9)
$
(223.2)
$
(35.6)
$
71.0
$
Cumulative effect of change
in method of accounting (c)
-
-
-
-
-
187.7
-
-
Discontinued operations-
net of income taxes (d)
-
-
0.6
0.5
7.2
16.8
7.0
(22.8)
Loss from continuing operations
(6.5)
(9.1)
(16.0)
(51.3)
(183.7)
(18.7)
(28.6)
48.2
Benefit (provision) for income taxes (e)
(4.5)
(0.2)
(1.1)
2.6
(73.3)
18.4
22.3
19.0
��
Loss from continuing operations before
income taxes
(2.0)
(8.9)
(14.9)
(53.9)
(110.4)
(37.1)
(50.9)
67.2
Interest expense - net (f)
31.5
8.2
7.9
37.3
23.0
23.3
22.5
20.9
Operating earnings (loss)
29.5
(0.7)
(7.0)
(16.6)
(87.4)
(13.8)
(28.4)
88.1
Goodwill impairment charge (g)
-
-
-
-
65.6
-
-
-
Refinancing costs (h)
-
-
6.4
21.4
1.8
-
-
-
Restructuring costs
1.0
0.4
1.1
13.0
27.1
13.9
17.5
1.4
EBIT*
30.5
(0.3)
0.5
17.8
7.1
0.1
(10.9)
89.5
Depreciation and amortization
20.5
4.5
5.3
20.3
21.7
23.0
34.9
35.3
EBITDA*
51.0
$
4.2
$
5.8
$
38.1
$
28.8
$
23.1
$
24.0
$
124.8
$
* Ex certain items: Excludes restructuring and refinancing costs as well as the writedown of goodwill and deferred tax assets.
(a) Based on midpoint of guidance issued May 5, 2005. See pages 42-43.
(b) In 2004, certain operations changed from LIFO to FIFO inventory accounting, so prior results have been restated to conform to FIFO presentation.
(c) Represents goodwill impairment charge related to the adoption of a new accounting standard.
(d) Discontinued operations include Grinding Wheels in 2001-2004 and Round Tools in 2001-2003.
(e) 2003 includes a charge of $70.8 M to establish valuation allowances for deferred tax assets.
(f) 2004 includes a charge of $6.4 million to write-off beneficial conversion for holders of convertible debt.
(g) Represents adjustment of carrying value of goodwill in the mold technologies segment.
(h) Represents costs of refinancing and recapitalizing the company including pursuit of various alternatives.
Three Months Ended
Year Ended
March 31,
December 31,

THANK YOU!