UNITED STATES
SECURITIES AND EXCHANGE COMMISSION
WASHINGTON, D.C. 20549
FORM N-CSR
CERTIFIED SHAREHOLDER REPORT OF REGISTERED
MANAGEMENT INVESTMENT COMPANIES
Investment Company Act file number 811-3694
Oppenheimer Gold & Special Minerals Fund
(Exact name of registrant as specified in charter)
6803 South Tucson Way, Centennial, Colorado 80112-3924
(Address of principal executive offices) (Zip code)
Arthur S. Gabinet
OppenheimerFunds, Inc.
Two World Financial Center, New York, New York 10281-1008
(Name and address of agent for service)
Registrant’s telephone number, including area code: (303) 768-3200
Date of fiscal year end: June 30
Date of reporting period: 6/29/2012
Item 1. Reports to Stockholders.
June 30, 2012
| | | | |
| | | Oppenheimer Gold & Special Minerals Fund | | Management Commentary and Annual Report |

MANAGEMENT COMMENTARY
An Interview With Your Fund’s Portfolio Manager
ANNUAL REPORT
Listing of Top Holdings
Fund Performance Discussion
Financial Statements

TOP HOLDINGS AND ALLOCATIONS
| | | | |
| |
Top Ten Common Stock Holdings
| |
| |
Newmont Mining Corp.
| |
| 6.1
| %
|
Goldcorp, Inc.
| |
| 5.2
|
|
Barrick Gold Corp.
| |
| 5.2
|
|
Eldorado Gold Corp.
| |
| 4.8
|
|
Silver Wheaton Corp.
| |
| 4.3
|
|
New Gold, Inc.
| |
| 4.1
|
|
Agnico-Eagle Mines Ltd.
| |
| 4.1
|
|
Alamos Gold, Inc.
| |
| 3.6
|
|
Royal Gold, Inc.
| |
| 3.2
|
|
| Kinross Gold Corp. | | | 3.2 | |
|
| Portfolio holdings and allocations are subject to change. Percentages are as of June 29, 2012, and are based on net assets. For more current Top 10 Fund Holdings, please visit oppenheimerfunds.com. | |
Regional Allocation
Portfolio holdings and allocations are subject to change. Percentages are as of June 29, 2012, and are based on the total market value of investments.
6 | OPPENHEIMER GOLD & SPECIAL MINERALS FUND
|
FUND PERFORMANCE DISCUSSION
How has the Fund performed? Below is a discussion of the Fund’s performance during its fiscal year ended June 29, 2012, followed by a graphical comparison of the Fund’s performance to an appropriate broad-based market index.1
Management’s Discussion of Fund Performance. For the 12-month period, Oppenheimer Gold & Special Minerals Fund produced returns that were lower than the MSCI World Index, and lower than most indices that track gold stocks exclusively.
The Fund’s disappointing performance relative to most gold stock indices was primarily the result of its focus on small- and mid-cap gold producers that were punished more severely than their large-cap counterparts over the reporting period. Historically, smaller companies exhibit higher growth rates than more mature mining businesses, but they also tend to be more sensitive to bouts of market volatility. In addition, the Fund held small positions in gold and no U.S. Treasury securities or large cash positions that might have dampened the industry group’s decline.
Weakness was especially severe for Kinross Gold Corp., which encountered difficulties in integrating a recent acquisition. Newcrest Mining Ltd., an Australian-based holding, suffered operational problems during a cyclical downturn. Osisko Mining Corp. was hurt by a fire that disrupted operations in a key location. Agnico-Eagle Mines Ltd. also struggled with temporary production disruptions. Detour Gold Corp. fell out of favor with investors along with other early-stage gold producers that have not yet achieved significant production levels. On the other hand, the Fund scored better results with European Goldfields Ltd. and Extorre Gold Mines Ltd., which received acquisition offers at substantial premiums to their stock prices at the time. European Goldfields was acquired by Eldorado Gold Corp., another holding of the Fund. Randgold Resources Ltd., Royal Gold, Inc., Yamana Gold, Inc. and New Gold, Inc. also contributed positively to the Fund’s relative performance.
In response to unusually volatile market conditions, we took steps during the spring of 2012 to reduce the Fund’s exposure to certain risks. We reduced the number of stocks in the Fund by selling some of its smaller holdings and focused more intently on larger companies. This change also positioned the Fund to benefit more fully from rising dividend payments by some of the industry’s larger, more fundamentally sound members. We have continued to establish opportunistic positions in early-stage gold producers that appear poised to benefit from catalysts expected to unlock shareholder value. In our view, these are prudent strategies in an uncertain market environment that will enable to Fund to participate in market rallies when valuations of gold stocks move closer to historical norms.
1. June 29, 2012 represents the last business day of the Fund’s fiscal year. See Note 1 of the accompanying Notes to Financial Statements.
7 | OPPENHEIMER GOLD & SPECIAL MINERALS FUND
|
FUND PERFORMANCE DISCUSSION Continued
Comparing the Fund’s Performance to the Market. The graphs that follow show the performance of a hypothetical $10,000 investment in each class of shares of the Fund held until June 29, 2012. In the case of Class A, B, C and N shares, performance is measured over a ten fiscal-year period. In the case of Class Y shares, performance is measured from inception of the Class on September 7, 2010. The Fund’s performance reflects the deduction of the maximum initial sales charge on Class A shares, the applicable contingent deferred sales charge on Class B, Class C and Class N shares, and reinvestments of all dividends and capital gains distributions. Past performance cannot guarantee future results.
The Fund’s performance is compared to the performance of the Morgan Stanley Capital International (MSCI) World Index, an unmanaged index of issuers listed on the stock exchanges of a select number of foreign countries and the U.S. Index performance reflects the reinvestment of income but does not consider the effect of transaction costs, fees, expenses or taxes and none of the data in the graphs shows the effect of taxes. The Fund’s performance reflects the effects of the Fund’s business and operating expenses. While index comparisons may be useful to provide a benchmark for the Fund’s performance, it must be noted that the Fund’s investments are not limited to the investments in the index.
8 | OPPENHEIMER GOLD & SPECIAL MINERALS FUND
|
FUND PERFORMANCE DISCUSSION
Class A Shares
Comparison of Change in Value of $10,000 Hypothetical Investments in:
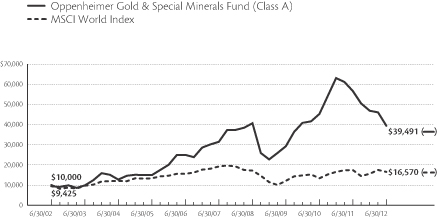
Average Annual Total Returns of Class A Shares With Sales Charge of the Fund at 6/29/121
1-Year –34.48% 5-Year 3.39% 10-Year 14.72%
The performance data quoted represents past performance, which does not guarantee future results. The investment return and principal value of an investment in the Fund will fluctuate so that an investor’s shares, when redeemed, may be worth more or less than their original cost. Current performance may be lower or higher than the performance quoted. Returns do not consider capital gains or income taxes on an individual’s investment. For performance data current to the most recent month-end, visit oppenheimerfunds.com or call 1.800.CALL OPP (225.5677). Fund returns include changes in share price, reinvested distributions, and the applicable sales charge: for Class A shares, the current maximum initial sales charge of 5.75%; for Class B shares, the contingent deferred sales charge of 5% (1-year) and 2% (5-year); and for Class C and N shares, the 1% contingent deferred sales charge for the 1-year period. Because Class B shares convert to Class A shares 72 months after purchase, the 10-year return for Class B shares use Class A performance for the period after conversion. There is no sales charge for Class Y shares. See page 14 for further information.
1. June 29, 2012 represents the last business day of the Fund’s fiscal year. See Note 1 of the accompanying Notes to Financial Statements. Index returns are calculated through June 30, 2012.
9 | OPPENHEIMER GOLD & SPECIAL MINERALS FUND |
FUND PERFORMANCE DISCUSSION
Class B Shares
Comparison of Change in Value of $10,000 Hypothetical Investments in:
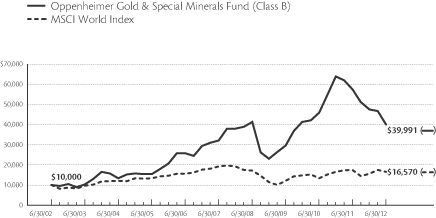
Average Annual Total Returns of Class B Shares With Sales Charge of the Fund at 6/29/121
1-Year –34.28% 5-Year 3.45% 10-Year 14.87%
10 | OPPENHEIMER GOLD & SPECIAL MINERALS FUND |
Class C Shares
Comparison of Change in Value of $10,000 Hypothetical Investments in:
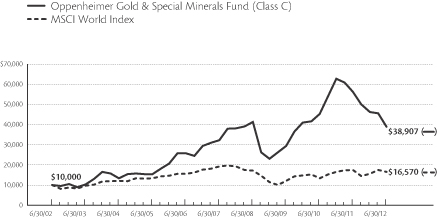
Average Annual Total Returns of Class C Shares With Sales Charge of the Fund at 6/29/121
1-Year –31.60% 5-Year 3.85% 10-Year 14.55%
The performance data quoted represents past performance, which does not guarantee future results. The investment return and principal value of an investment in the Fund will fluctuate so that an investor’s shares, when redeemed, may be worth more or less than their original cost. Current performance may be lower or higher than the performance quoted. Returns do not consider capital gains or income taxes on an individual’s investment. For performance data current to the most recent month-end, visit oppenheimerfunds.com or call 1.800.CALL OPP (225.5677). Fund returns include changes in share price, reinvested distributions, and the applicable sales charge: for Class A shares, the current maximum initial sales charge of 5.75%; for Class B shares, the contingent deferred sales charge of 5% (1-year) and 2% (5-year); and for Class C and N shares, the 1% contingent deferred sales charge for the 1-year period. Because Class B shares convert to Class A shares 72 months after purchase, the 10-year return for Class B shares use Class A performance for the period after conversion. There is no sales charge for Class Y shares. See page 14 for further information.
1. June 29, 2012 represents the last business day of the Fund’s fiscal year. See Note 1 of the accompanying Notes to Financial Statements. Index returns are calculated through June 30, 2012.
11 | OPPENHEIMER GOLD & SPECIAL MINERALS FUND |
FUND PERFORMANCE DISCUSSION
Class N Shares
Comparison of Change in Value of $10,000 Hypothetical Investments in:
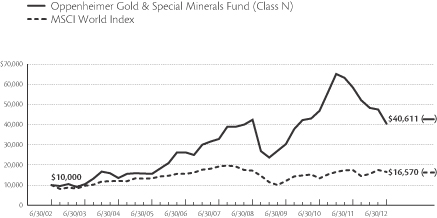
Average Annual Total Returns of Class N Shares With Sales Charge of the Fund at 6/29/121
1-Year –31.32% 5-Year 4.28% 10-Year 15.04%
12 | OPPENHEIMER GOLD & SPECIAL MINERALS FUND |
Class Y Shares
Comparison of Change in Value of $10,000 Hypothetical Investments in:
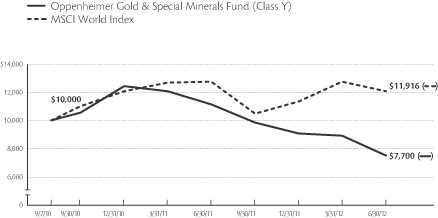
Average Annual Total Return of Class Y Shares of the Fund at 6/29/121
1-Year –30.34% Since Inception (9/7/10) –13.58%
The performance data quoted represents past performance, which does not guarantee future results. The investment return and principal value of an investment in the Fund will fluctuate so that an investor’s shares, when redeemed, may be worth more or less than their original cost. Current performance may be lower or higher than the performance quoted. Returns do not consider capital gains or income taxes on an individual’s investment. For performance data current to the most recent month-end, visit oppenheimerfunds.com or call 1.800.CALL OPP (225.5677). Fund returns include changes in share price, reinvested distributions, and the applicable sales charge: for Class A shares, the current maximum initial sales charge of 5.75%; for Class B shares, the contingent deferred sales charge of 5% (1-year) and 2% (5-year); and for Class C and N shares, the 1% contingent deferred sales charge for the 1-year period. Because Class B shares convert to Class A shares 72 months after purchase, the 10-year return for Class B shares use Class A performance for the period after conversion. There is no sales charge for Class Y shares. See page 14 for further information.
1. June 29, 2012 represents the last business day of the Fund’s fiscal year. See Note 1 of the accompanying Notes to Financial Statements. Index returns are calculated through June 30, 2012.
13 | OPPENHEIMER GOLD & SPECIAL MINERALS FUND |
NOTES
Total returns and the ending account values in the graphs include changes in share price and reinvestment of dividends and capital gains distributions in a hypothetical investment for the periods shown. The Fund’s total returns shown do not reflect the deduction of income taxes on an individual’s investment. Taxes may reduce your actual investment returns on income or gains paid by the Fund or any gains you may realize if you sell your shares.
Before investing in any of the Oppenheimer funds, investors should carefully consider a fund’s investment objectives, risks, charges and expenses. Fund prospectuses and summary prospectuses contain this and other information about the funds, and may be obtained by asking your financial advisor, visiting oppenheimerfunds.com, or calling 1.800.CALL OPP (225.5677). Read prospectuses and summary prospectuses carefully before investing.
The Fund’s investment strategy and focus can change over time. The mention of specific fund holdings does not constitute a recommendation by OppenheimerFunds, Inc.
Class A shares of the Fund were first publicly offered on 7/19/83. Unless otherwise noted, Class A returns include the current maximum initial sales charge of 5.75%.
Class B shares of the Fund were first publicly offered on 11/1/95. Unless otherwise noted, Class B returns include the applicable contingent deferred sales charge of 5% (1-year) and 2% (5-year). Because Class B shares convert to Class A shares 72 months after purchase, the 10-year return for Class B shares uses Class A performance for the period after conversion. Class B shares are subject to an annual 0.75% asset-based sales charge.
Class C shares of the Fund were first publicly offered on 11/1/95. Unless otherwise noted, Class C returns include the contingent deferred sales charge of 1% for the 1-year period. Class C shares are subject to an annual 0.75% asset-based sales charge.
Class N shares of the Fund were first publicly offered on 3/1/01. Class N shares are offered only through retirement plans. Unless otherwise noted, Class N returns include the contingent deferred sales charge of 1% for the 1-year period. Class N shares are subject to an annual 0.25% asset-based sales charge.
Class Y shares of the Fund were first publicly offered on 9/7/10. Class Y shares are offered only to fee-based clients of dealers that have a special agreement with the Distributor, to certain institutional investors under a special agreement with the Distributor, and to present or former officers, directors, trustees or employees (and their eligible family members) of the Fund, the Manager, its affiliates, its parent company and the subsidiaries of its parent company, and retirement plans established for the benefit of such individuals. There is no sales charge for Class Y shares.
14 | OPPENHEIMER GOLD & SPECIAL MINERALS FUND
|
FUND EXPENSES
Fund Expenses. As a shareholder of the Fund, you incur two types of costs: (1) transaction costs, which may include sales charges (loads) on purchase payments, contingent deferred sales charges on redemptions and (2) ongoing costs, including management fees; distribution and service fees; and other Fund expenses. These examples are intended to help you understand your ongoing costs (in dollars) of investing in the Fund and to compare these costs with the ongoing costs of investing in other mutual funds.
The examples are based on an investment of $1,000.00 invested at the beginning of the period and held for the entire 6-month period ended June 29, 2012.
Actual Expenses. The first section of the table provides information about actual account values and actual expenses. You may use the information in this section for the class of shares you hold, together with the amount you invested, to estimate the expense that you paid over the period. Simply divide your account value by $1,000.00 (for example, an $8,600.00 account value divided by $1,000.00 = 8.60), then multiply the result by the number in the first section under the heading entitled “Expenses Paid During Period” to estimate the expenses you paid on your account during this period.
Hypothetical Example for Comparison Purposes. The second section of the table provides information about hypothetical account values and hypothetical expenses based on the Fund’s actual expense ratio for each class of shares, and an assumed rate of return of 5% per year for each class before expenses, which is not the actual return. The hypothetical account values and expenses may not be used to estimate the actual ending account balance or expenses you paid for the period. You may use this information to compare the ongoing costs of investing in the Fund and other funds. To do so, compare this 5% hypothetical example for the class of shares you hold with the 5% hypothetical examples that appear in the shareholder reports of the other funds.
Please note that the expenses shown in the table are meant to highlight your ongoing costs only and do not reflect any transactional costs, such as front-end or contingent deferred sales charges (loads), or a $12.00 fee imposed annually on accounts valued at less than $500.00 (subject to exceptions described in the Statement of Additional Information). Therefore, the “hypothetical” section of the table is useful in comparing ongoing costs only, and will not help you determine the relative total costs of owning different funds. In addition, if these transactional costs were included, your costs would have been higher.
15 | OPPENHEIMER GOLD & SPECIAL MINERALS FUND
|
FUND EXPENSES Continued
| | | | | | | | | | | | |
| Actual | | Beginning
Account
Value
January 1, 2012 | | | Ending
Account
Value
June 29, 2012 | | | Expenses
Paid During
6 Months Ended
June 29, 2012 | |
| Class A | | $ | 1,000.00 | | | $ | 842.60 | | | $ | 5.12 | |
| Class B | | | 1,000.00 | | | | 839.20 | | | | 9.14 | |
| Class C | | | 1,000.00 | | | | 839.50 | | | | 8.55 | |
| Class N | | | 1,000.00 | | | | 841.40 | | | | 6.81 | |
| Class Y | | | 1,000.00 | | | | 842.60 | | | | 5.44 | |
| | | |
Hypothetical
(5% return before expenses) | | | | | | | | | |
| Class A | | | 1,000.00 | | | | 1,019.19 | | | | 5.61 | |
| Class B | | | 1,000.00 | | | | 1,014.84 | | | | 10.01 | |
| Class C | | | 1,000.00 | | | | 1,015.48 | | | | 9.36 | |
| Class N | | | 1,000.00 | | | | 1,017.36 | | | | 7.46 | |
| Class Y | | | 1,000.00 | | | | 1,018.84 | | | | 5.96 | |
Expenses are equal to the Fund’s annualized expense ratio for that class, multiplied by the average account value over the period, multiplied by 181/366 (to reflect the one-half year period). Those annualized expense ratios, excluding indirect expenses from affiliated funds, based on the 6-month period ended June 29, 2012 are as follows:
| | | | |
| Class | | Expense Ratios | |
| Class A | | | 1.12 | % |
| Class B | | | 2.00 | |
| Class C | | | 1.87 | |
| Class N | | | 1.49 | |
| Class Y | | | 1.19 | |
The expense ratios reflect voluntary waivers and/or reimbursements of expenses by the Fund’s Manager and Transfer Agent. Some of these undertakings may be modified or terminated at any time, as indicated in the Fund’s prospectus. The “Financial Highlights” tables in the Fund’s financial statements, included in this report, also show the gross expense ratios, without such waivers or reimbursements and reduction to custodian expenses, if applicable.
16 | OPPENHEIMER GOLD & SPECIAL MINERALS FUND
|
STATEMENT OF INVESTMENTS June 29, 2012*
| | | | | | | | |
| | | Shares | | | Value | |
| Wholly-Owned Subsidiary—5.1% | |
| Oppenheimer Gold & Special Minerals Fund (Cayman) Ltd.1,2 | | | | | |
| (Cost $157,514,487) | | | 4,056 | | | $ | 150,751,769 | |
| | | | | | | |
| Common Stocks—95.1% | |
| Energy—0.3% | |
| Oil, Gas & Consumable Fuels—0.3% | |
| Uranium Energy Corp.1,2,3 | | | 3,974,196 | | | | 9,100,906 | |
| Materials—94.8% | | | | | | | | |
| Metals & Mining—94.8% | | | | | |
| Agnico-Eagle Mines Ltd.3 | | | 2,975,218 | | | | 120,377,320 | |
| Alacer Gold Corp.2 | | | 5,208,200 | | | | 28,186,997 | |
| Alamos Gold, Inc.1 | | | 6,841,769 | | | | 106,850,140 | |
| Allied Nevada Gold Corp.2,4 | | | 2,581,300 | | | | 73,222,615 | |
| Allied Nevada Gold Corp.2,4 | | | 1,447,800 | | | | 41,088,564 | |
| AngloGold Ashanti Ltd., Sponsored ADR3 | | | 1,120,000 | | | | 38,460,800 | |
| Argonaut Gold, Inc.1,2 | | | 4,962,697 | | | | 37,435,923 | |
| AuRico Gold, Inc.2,3 | | | 5,459,100 | | | | 43,727,391 | |
| Aurizon Mines Ltd.2 | | | 5,062,757 | | | | 22,974,106 | |
| Avion Gold Corp.2 | | | 10,699,933 | | | | 4,781,917 | |
| B2Gold Corp.2 | | | 6,311,108 | | | | 18,968,658 | |
| Banro Corp.1,2,4 | | | 7,085,052 | | | | 25,957,415 | |
| Banro Corp.1,2,3,4 | | | 3,127,268 | | | | 11,414,528 | |
| Barrick Gold Corp.3 | | | 4,017,075 | | | | 150,921,508 | |
| Centamin plc2 | | | 23,045,976 | | | | 25,352,611 | |
| Centerra Gold, Inc. | | | 3,003,851 | | | | 21,007,189 | |
| China Gold International Resources Corp. Ltd.2 | | | 500,000 | | | | 1,576,466 | |
| Coeur d’Alene Mines Corp.2 | | | 1,983,100 | | | | 34,823,236 | |
| Detour Gold Corp.2 | | | 3,714,800 | | | | 74,836,016 | |
| Duluth Metals Ltd.1,2 | | | 7,804,800 | | | | 11,422,406 | |
| Dundee Precious Metals, Inc.2 | | | 4,308,100 | | | | 25,939,154 | |
| Eldorado Gold Corp.3 | | | 11,301,546 | | | | 139,201,834 | |
| Evolution Mining Ltd.2 | | | 3,200,000 | | | | 4,830,918 | |
| Extorre Gold Mines Ltd.1,2,3 | | | 4,173,200 | | | | 17,256,823 | |
| | | | | | | | |
| | | Shares | | | Value | |
| Metals & Mining Continued | | | | | |
| Extorre Gold Mines Ltd., Legend Shares1,2 | | | 985,300 | | | $ | 4,074,367 | |
| First Majestic Silver Corp.2 | | | 2,360,000 | | | | 34,075,238 | |
| Franco-Nevada Corp.4 | | | 1,008,523 | | | | 45,606,914 | |
| Franco-Nevada Corp.3,4 | | | 1,167,100 | | | | 52,752,920 | |
| Freeport-McMoRan Copper & Gold, Inc., Cl. B3 | | | 300,000 | | | | 10,221,000 | |
| Fresnillo plc | | | 1,600,000 | | | | 36,719,969 | |
| Gold Fields Ltd., Sponsored ADR | | | 340,000 | | | | 4,355,400 | |
| Gold Standard Ventures Corp.2 | | | 2,000,000 | | | | 3,960,000 | |
| Goldcorp, Inc.3 | | | 4,028,561 | | | | 151,393,322 | |
| IAMGOLD Corp. | | | 5,819,845 | | | | 68,674,171 | |
| Kingsgate Consolidated Ltd. | | | 3,585,840 | | | | 17,917,580 | |
| Kinross Gold Corp.3 | | | 11,377,771 | | | | 92,868,360 | |
| Kirkland Lake Gold, Inc.1,2 | | | 3,770,300 | | | | 40,587,848 | |
| Koza Altin Isletmeleri AS | | | 1,904,382 | | | | 36,855,610 | |
| Koza Anadolu Metal Madencilik Isletmeleri AS2 | | | 800,000 | | | | 1,719,317 | |
| Lake Shore Gold Corp.1,2 | | | 18,175,687 | | | | 16,245,826 | |
| McEwen Mining, Inc.2 | | | 700,000 | | | | 2,107,000 | |
| Medusa Mining Ltd. | | | 900,000 | | | | 4,464,200 | |
| Mineral Deposits Ltd.2 | | | 200,000 | | | | 898,413 | |
| New Gold, Inc.2,3 | | | 12,693,570 | | | | 121,063,319 | |
| Newcrest Mining Ltd. | | | 3,339,013 | | | | 77,719,820 | |
| Newmont Mining Corp.3 | | | 3,698,728 | | | | 179,425,295 | |
| Osisko Mining Corp.2 | | | 9,325,653 | | | | 64,119,017 | |
| Pan American Silver Corp.3 | | | 1,874,641 | | | | 31,662,686 | |
| Perseus Mining Ltd.2 | | | 1,400,000 | | | | 3,630,292 | |
| Pretium Resources, Inc.2 | | | 855,174 | | | | 11,860,384 | |
| Ramelius Resources Ltd.2 | | | 4,000,000 | | | | 2,003,042 | |
| Randgold Resources Ltd., ADR3 | | | 686,494 | | | | 61,791,325 | |
| Real Gold Mining Ltd. | | | 10,400,000 | | | | 3,563,209 | |
| Regis Resources Ltd.2 | | | 300,000 | | | | 1,210,244 | |
| Resolute Mining Ltd.2 | | | 1,000,000 | | | | 1,386,470 | |
17 | OPPENHEIMER GOLD & SPECIAL MINERALS FUND
|
STATEMENT OF INVESTMENTS Continued
| | | | | | | | |
| | | Shares | | | Value | |
| Metals & Mining Continued | | | | | |
| Richmont Mines, Inc.2 | | | 200,000 | | | $ | 929,182 | |
| Romarco Minerals, Inc.1,2 | | | 30,127,000 | | | | 15,683,440 | |
| Royal Gold, Inc.3 | | | 1,209,750 | | | | 94,844,400 | |
| Rubicon Minerals Corp.1,2,3 | | | 14,371,727 | | | | 43,690,050 | |
| San Gold Corp.1,2 | | | 16,300,000 | | | | 14,889,500 | |
| Sandstorm Gold Ltd.2 | | | 190,000 | | | | 1,548,964 | |
| SEMAFO, Inc. | | | 12,089,748 | | | | 55,455,381 | |
Silver Lake Resources Ltd.2 | | | 1,154,225 | | | | 3,334,515 | |
| Silver Standard Resources, Inc.2,3 | | | 10,000 | | | | 112,400 | |
| Silver Wheaton Corp.3 | | | 4,648,500 | | | | 124,765,740 | |
| Tahoe Resources, Inc.2 | | | 1,825,000 | | | | 25,221,245 | |
| Timmins Gold Corp.2 | | | 5,781,224 | | | | 10,618,691 | |
| Yamana Gold, Inc. | | | 5,388,900 | | | | 83,154,522 | |
| Zhaojin Mining Industry Co. Ltd. | | | 26,694,000 | | | | 35,137,162 | |
| | | | | | |
|
|
|
| | | | | | |
| 2,774,932,285
|
|
| Total Common Stocks (Cost $2,778,300,727) | | | | | | | 2,784,033,191 | |
| | | | | | | | |
| | | Units | | | Value | |
| Rights, Warrants and Certificates—0.0% | |
| Duluth Metals Ltd. Wts., Strike Price $0.001, Exp. 1/18/131,2 | | | 513,653 | | | $ | — | |
| Kinross Gold Corp. Wts., Strike Price 21.939CAD, Exp. 9/17/142 | | | 483,450 | | | | 189,942 | |
| Silver Range Resources Ltd. Wts., Strike Price $0.85, Exp. 2/10/132 | | | 83,328 | | | | 20,462 | |
| | | | | | |
|
|
|
Total Rights, Warrants and Certificates
(Cost $148,711) | | | | | | | 210,404 | |
| | | Shares | | | | |
| Investment Company—0.2% | |
Oppenheimer Institutional Money Market Fund,
Cl. E, 0.20%1,5 (Cost $6,319,454) | | | 6,319,454 | | | $ | 6,319,454 | |
Total Investments, at Value
(Cost $2,942,283,379) | | | 100.4 | % | | | 2,941,314,818 | |
| Liabilities in Excess of Other Assets | | | (0.4 | ) | | | (12,627,185 | ) |
| | |
|
|
| |
|
|
|
| Net Assets | | | 100.0 | % | | $ | 2,928,687,633 | |
| | |
|
|
| |
|
|
|
Footnotes to Statement of Investments
*June 29, 2012 represents the last business day of the Fund’s 2012 fiscal year. See Note 1 of the accompanying Notes.
Strike price is reported in U.S. Dollars, except for those denoted in the following currency:
CAD Canadian Dollar
1. Is or was an affiliate, as defined in the Investment Company Act of 1940, at or during the period ended June 29, 2012, by virtue of the Fund owning at least 5% of the voting securities of the issuer or as a result of the Fund and the issuer having the same investment adviser. Transactions during the period in which the issuer was an affiliate are as follows:
| | | | | | | | | | | | | | | | | | | | |
| | | Shares/Units
June 30, 2011 | | Gross
Additions | | Gross
Reductions | | Shares/Units
June 29, 2012 |
| Alamos Gold, Inc. | | | | 4,507,350 | | | | | 2,334,419 | | | | | — | | | | | 6,841,769 | |
| Argonaut Gold, Inc. | | | | — | | | | | 4,962,697 | | | | | — | | | | | 4,962,697 | |
| Banro Corp. | | | | 2,727,268 | | | | | 400,000 | | | | | — | | | | | 3,127,268 | |
| Banro Corp. | | | | 4,138,800 | | | | | 2,946,252 | | | | | — | | | | | 7,085,052 | |
| Duluth Metals Ltd. | | | | 7,704,800 | | | | | 100,000 | | | | | — | | | | | 7,804,800 | |
| Duluth Metals Ltd. Wts., Strike Price $0.001, Exp. 1/18/13 | | | | — | | | | | 513,653 | | | | | — | | | | | 513,653 | |
| East Asia Minerals Corp. | | | | 5,679,700 | | | | | — | | | | | 5,679,700 | | | | | — | |
| Extorre Gold Mines Ltd. | | | | 3,646,400 | | | | | 526,800 | | | | | — | | | | | 4,173,200 | |
18 | OPPENHEIMER GOLD & SPECIAL MINERALS FUND
|
| | | | | | | | | | | | | | | | | | | | |
| | | Shares/Units
June 30, 2011 | | Gross
Additions | | Gross
Reductions | | Shares/Units
June 29, 2012 |
| Extorre Gold Mines Ltd., Legend Shares | | | | 4,942,922 | | | | | — | | | | | 3,957,622 | | | | | 985,300 | |
| Golden Minerals Co. | | | | 454,000 | | | | | — | | | | | 454,000 | | | | | — | |
| Golden Minerals Co. | | | | 335,952 | | | | | — | | | | | 335,952 | | | | | — | |
| Kirkland Lake Gold, Inc. | | | | 2,100,300 | | | | | 1,670,000 | | | | | — | | | | | 3,770,300 | |
| Lake Shore Gold Corp.a | | | | 16,803,718 | | | | | 2,859,500 | | | | | 1,487,531 | | | | | 18,175,687 | |
| Lake Shore Gold Corp., Legend Shares | | | | 2,906,171 | | | | | — | | | | | 2,906,171 | | | | | — | |
| Lydian International Ltd. | | | | 4,757,937 | | | | | 50,000 | | | | | 4,807,937 | | | | | — | |
| Lydian International Ltd., Legend Shares | | | | 1,313,454 | | | | | — | | | | | 1,313,454 | | | | | — | |
| Oppenheimer Gold & Special Minerals Fund (Cayman) Ltd.b | | | | 4,056 | | | | | — | | | | | — | | | | | 4,056 | |
| Oppenheimer Institutional Money Market Fund, Cl. E | | | | 22,339,401 | | | | | 714,027,215 | | | | | 730,047,162 | | | | | 6,319,454 | |
| Premier Gold Mines Ltd. | | | | 7,058,900 | | | | | 100,000 | | | | | 7,158,900 | | | | | — | |
| Premier Gold Mines Ltd., Legend Shares | | | | 835,000 | | | | | — | | | | | 835,000 | | | | | — | |
| Rainy River Resources Ltd. | | | | 3,489,800 | | | | | 50,000 | | | | | 3,539,800 | | | | | — | |
| Rainy River Resources Ltd., Legend Shares | | | | 1,786,514 | | | | | — | | | | | 1,786,514 | | | | | — | |
| Romarco Minerals, Inc. | | | | 29,927,000 | | | | | 200,000 | | | | | — | | | | | 30,127,000 | |
| Romarco Minerals, Inc., Legend Shares | | | | 4,200,000 | | | | | — | | | | | 4,200,000 | | | | | — | |
| Rubicon Minerals Corp. | | | | 14,371,727 | | | | | — | | | | | — | | | | | 14,371,727 | |
| Rubicon Minerals Corp., Legend Shares | | | | 1,099,000 | | | | | — | | | | | 1,099,000 | | | | | — | |
| San Gold Corp. | | | | 19,989,712 | | | | | 600,000 | | | | | 4,289,712 | | | | | 16,300,000 | |
| San Gold Corp., Legend Shares | | | | 2,000,000 | | | | | — | | | | | 2,000,000 | | | | | — | |
| Uranium Energy Corp.a | | | | 5,229,508 | | | | | 100,000 | | | | | 1,355,312 | | | | | 3,974,196 | |
| | | | |
| | | | | Value | | Income | | Realized
Gain (Loss) |
| Alamos Gold, Inc. | | | | | | | | $ | 106,850,140 | | | | $ | 878,227 | | | | $ | — | |
| Argonaut Gold, Inc. | | | | | | | | | 37,435,923 | | | | | — | | | | | — | |
| Banro Corp. | | | | | | | | | 11,414,528 | | | | | — | | | | | — | |
| Banro Corp. | | | | | | | | | 25,957,415 | | | | | — | | | | | — | |
| Duluth Metals Ltd. | | | | | | | | | 11,422,406 | | | | | 53,358 | | | | | — | |
| Duluth Metals Ltd. Wts., Strike Price $0.001, Exp. 1/18/13 | | | | | | | | | — | | | | | — | | | | | — | |
| East Asia Minerals Corp. | | | | | | | | | — | | | | | 577,873 | | | | | (15,217,979 | ) |
| Extorre Gold Mines Ltd. | | | | | | | | | 17,256,823 | | | | | — | | | | | — | |
| Extorre Gold Mines Ltd., Legend Shares | | | | | | | | | 4,074,367 | | | | | — | | | | | 7,271,297 | |
| Golden Minerals Co. | | | | | | | | | — | | | | | — | | | | | (5,137,088 | ) |
| Golden Minerals Co. | | | | | | | | | — | | | | | — | | | | | (3,363,424 | ) |
| Kirkland Lake Gold, Inc. | | | | | | | | | 40,587,848 | | | | | — | | | | | — | |
| Lake Shore Gold Corp.a | | | | | | | | | — | c | | | | — | | | | | (4,106,127 | ) |
| Lake Shore Gold Corp., Legend Shares | | | | | | | | | — | | | | | — | | | | | (5,238,958 | ) |
| Lydian International Ltd. | | | | | | | | | — | | | | | — | | | | | 368,456 | |
| Lydian International Ltd., Legend Shares | | | | | | | | | — | | | | | — | | | | | 385,001 | |
| Oppenheimer Gold & Special Minerals Fund (Cayman) Ltd.b | | | | | | | | | 150,751,769 | | | | | — | | | | | 51,210 | |
| Oppenheimer Institutional Money Market Fund, Cl. E | | | | | | | | | 6,319,454 | | | | | 32,150 | | | | | — | |
| Premier Gold Mines Ltd. | | | | | | | | | — | | | | | — | | | | | (1,660,414 | ) |
| Premier Gold Mines Ltd., Legend Shares | | | | | | | | | — | | | | | — | | | | | 1,777,118 | |
| Rainy River Resources Ltd. | | | | | | | | | — | | | | | — | | | | | (7,353,037 | ) |
19 | OPPENHEIMER GOLD & SPECIAL MINERALS FUND
|
STATEMENT OF INVESTMENTS Continued
| | | | | | | | | | | | | | | | | | | | |
| | | | | Value | | Income | | Realized Gain
(Loss) |
| Rainy River Resources Ltd., Legend Shares | | | | | $ | — | | | | $ | — | | | | $ | 554,915 | |
| Romarco Minerals, Inc. | | | | | | 15,683,440 | | | | | — | | | | | — | |
| Romarco Minerals, Inc., Legend Shares | | | | | | — | | | | | — | | | | | (2,926,145 | ) |
| Rubicon Minerals Corp. | | | | | | 43,690,050 | | | | | — | | | | | — | |
| Rubicon Minerals Corp., Legend Shares | | | | | | — | | | | | — | | | | | (950,804 | ) |
| San Gold Corp. | | | | | | 14,889,500 | | | | | — | | | | | (11,487,315 | ) |
| San Gold Corp., Legend Shares | | | | | | — | | | | | — | | | | | (3,723,894 | ) |
| Uranium Energy Corp.a | | | | | | — | c | | | | — | | | | | (3,790,738 | ) |
| | | | | | |
|
|
| | |
|
|
| | |
|
|
|
| | | | | | $ | 486,333,663 | | | | $ | 1,541,608 | | | | $ | (54,547,926 | ) |
| | | | | | |
|
|
| | |
|
|
| | |
|
|
|
a. No longer an affiliate as of June 29, 2012.
b. Investment in a wholly-owned subsidiary. See Note 1 of the accompanying Notes and individual financial statements of the entity included herein.
c. The security is no longer an affiliate, therefore, the value has been excluded from this table.
2. Non-income producing security.
3. All or a portion of the security position is held in segregated accounts and pledged to cover margin requirements with respect to outstanding written options. The aggregate market value of such securities is $384,087,733 . See Note 6 of the accompanying Notes.
4. The Fund holds securities which have been issued by the same entity and that trade on separate exchanges.
5. Rate shown is the 7-day yield as of June 29, 2012.
Distribution of investments representing geographic holdings, as a percentage of total investments at value, is as follows:
| | | | | | | | | | |
| Geographic Holdings | | Value | | Percent |
| Canada | | | $ | 1,824,994,545 | | | | | 62.0 | % |
| United States | | | | 754,969,376 | | | | | 25.7 | |
| Australia | | | | 142,748,105 | | | | | 4.9 | |
| Jersey, Channel Islands | | | | 61,791,325 | | | | | 2.1 | |
| South Africa | | | | 42,816,200 | | | | | 1.5 | |
| Turkey | | | | 38,574,927 | | | | | 1.3 | |
| United Kingdom | | | | 36,719,969 | | | | | 1.2 | |
| China | | | | 35,137,162 | | | | | 1.2 | |
| Mongolia | | | | 3,563,209 | | | | | 0.1 | |
| | | |
|
|
|
| Total | | | $ | 2,941,314,818 | | | | | 100.0 | % |
| | | |
|
|
|
| | | | | | | | | | | | | | | | | | | | | | | | | |
| Foreign Currency Exchange Contracts as of June 29, 2012 are as follows: | |
| Counterparty/Contract Description | | Buy/Sell | | Contract
Amount
(000’s) | | Expiration
Dates | | Value | | Unrealized
Depreciation |
| Barclay’s Capital | | | | | | | | | | | | | | | | | | | | | | | | | |
| Canadian Dollar (CAD) | | | | Sell | | | | | 343 | CAD | | | | 7/5/12 | | | | $ | 336,421 | | | | $ | 4,915 | |
| JP Morgan Chase | | | | | | | | | | | | | | | | | | | | | | | | | |
| Canadian Dollar (CAD) | | | | Sell | | | | | 748 | CAD | | | | 7/3/12-7/5/12 | | | | | 734,054 | | | | | 3,774 | |
| | | | | | | | | | | | | | | | | | | | | | | |
|
|
|
| Total unrealized depreciation | | | | | | | | | | | | | | | | | | | | | | | $ | 8,689 | |
| | | | | | | | | | | | | | | | | | | | | | | |
|
|
|
20 | OPPENHEIMER GOLD & SPECIAL MINERALS FUND
|
| | | | | | | | | | | | | | | | | | | | | | | | | | | | |
| Written Options as of June 29, 2012 are as follows: | |
| Description | | Type | | | Number of
Contracts | | | Exercise
Price | | | Expiration
Date | | | Premiums
Received | | | Value | | | Unrealized
Appreciation/
(Depreciation) | |
| Agnico-Eagle Mines Ltd. | | | Call | | | | 2,000 | | | $ | 42.500 | | | | 8/20/12 | | | $ | 270,385 | | | $ | (308,000 | ) | | $ | (37,615 | ) |
| Agnico-Eagle Mines Ltd. | | | Call | | | | 2,000 | | | | 45.000 | | | | 8/20/12 | | | | 274,765 | | | | (154,000 | ) | | | 120,765 | |
| Agnico-Eagle Mines Ltd. | | | Call | | | | 2,000 | | | | 50.000 | | | | 11/19/12 | | | | 207,646 | | | | (216,000 | ) | | | (8,354 | ) |
| Agnico-Eagle Mines Ltd. | | | Call | | | | 2,000 | | | | 55.000 | | | | 11/19/12 | | | | 232,786 | | | | (94,000 | ) | | | 138,786 | |
| Alamos Gold, Inc. | | | Call | | | | 4,000 | | | | 20.000 | CAD | | | 10/22/12 | | | | 433,714 | | | | (108,044 | ) | | | 325,670 | |
| Allied Nevada Gold Corp. | | | Put | | | | 2,000 | | | | 25.000 | | | | 12/24/12 | | | | 353,943 | | | | (440,000 | ) | | | (86,057 | ) |
| Allied Nevada Gold Corp. | | | Put | | | | 1,000 | | | | 25.000 | CAD | | | 7/23/12 | | | | 163,150 | | | | (16,207 | ) | | | 146,943 | |
AngloGold Ashanti Ltd.,
Sponsored ADR | | | Call | | | | 2,000 | | | | 42.000 | | | | 10/22/12 | | | | 200,946 | | | | (70,000 | ) | | | 130,946 | |
AngloGold Ashanti Ltd.,
Sponsored ADR | | | Call | | | | 2,000 | | | | 43.000 | | | | 10/22/12 | | | | 226,186 | | | | (60,000 | ) | | | 166,186 | |
AngloGold Ashanti Ltd.,
Sponsored ADR | | | Put | | | | 2,000 | | | | 36.000 | | | | 7/23/12 | | | | 213,947 | | | | (415,000 | ) | | | (201,053 | ) |
| Barrick Gold Corp. | | | Call | | | | 2,000 | | | | 42.000 | | | | 10/22/12 | | | | 225,306 | | | | (212,000 | ) | | | 13,306 | |
| Barrick Gold Corp. | | | Call | | | | 2,000 | | | | 47.000 | | | | 10/22/12 | | | | 232,146 | | | | (59,000 | ) | | | 173,146 | |
| Barrick Gold Corp. | | | Call | | | | 2,000 | | | | 50.000 | | | | 10/22/12 | | | | 224,126 | | | | (24,000 | ) | | | 200,126 | |
| Barrick Gold Corp. | | | Put | | | | 2,000 | | | | 38.000 | | | | 7/23/12 | | | | 217,627 | | | | (270,000 | ) | | | (52,373 | ) |
Companhia de Minas
Buenaventura SA, Sponsored ADR | | | Put | | | | 2,000 | | | | 36.000 | | | | 9/24/12 | | | | 293,944 | | | | (330,000 | ) | | | (36,056 | ) |
| Detour Gold Corp. | | | Call | | | | 2,000 | | | | 26.000 | CAD | | | 7/23/12 | | | | 188,534 | | | | (14,733 | ) | | | 173,801 | |
| Franco-Nevada Corp. | | | Call | | | | 1,000 | | | | 50.000 | | | | 10/22/12 | | | | 115,473 | | | | (140,000 | ) | | | (24,527 | ) |
| Franco-Nevada Corp. | | | Put | | | | 1,000 | | | | 38.000 | CAD | | | 10/22/12 | | | | 151,879 | | | | (56,478 | ) | | | 95,401 | |
| Freeport-McMoRan Copper & Gold, Inc., Cl. B | | | Call | | | | 2,000 | | | | 39.000 | | | | 11/19/12 | | | | 288,180 | | | | (196,000 | ) | | | 92,180 | |
| Freeport-McMoRan Copper & Gold, Inc., Cl. B | | | Put | | | | 2,000 | | | | 30.000 | | | | 8/20/12 | | | | 235,846 | | | | (114,000 | ) | | | 121,846 | |
| Freeport-McMoRan Copper & Gold, Inc., Cl. B | | | Put | | | | 2,000 | | | | 34.000 | | | | 8/20/12 | | | | 402,824 | | | | (376,000 | ) | | | 26,824 | |
| Gold Fields Ltd., Sponsored ADR | | | Put | | | | 2,000 | | | | 13.000 | | | | 10/22/12 | | | | 195,287 | | | | (222,000 | ) | | | (26,713 | ) |
| Goldcorp, Inc. | | | Call | | | | 2,000 | | | | 55.000 | | | | 7/23/12 | | | | 220,587 | | | | (2,000 | ) | | | 218,587 | |
| Goldcorp, Inc. | | | Call | | | | 2,000 | | | | 48.000 | | | | 10/22/12 | | | | 277,625 | | | | (64,000 | ) | | | 213,625 | |
| Goldcorp, Inc. | | | Put | | | | 2,000 | | | | 35.000 | | | | 7/23/12 | | | | 194,507 | | | | (80,000 | ) | | | 114,507 | |
| Ivanhoe Mines Ltd. | | | Put | | | | 3,000 | | | | 8.000 | | | | 9/24/12 | | | | 296,920 | | | | (180,000 | ) | | | 116,920 | |
| Newmont Mining Corp. | | | Call | | | | 2,000 | | | | 57.500 | | | | 9/24/12 | | | | 207,286 | | | | (74,000 | ) | | | 133,286 | |
| Newmont Mining Corp. | | | Call | | | | 2,000 | | | | 55.000 | | | | 12/24/12 | | | | 270,445 | | | | (338,000 | ) | | | (67,555 | ) |
| Pan American Silver Corp. | | | Put | | | | 4,000 | | | | 21.000 | | | | 7/23/12 | | | | 497,893 | | | | (1,680,000 | ) | | | (1,182,107 | ) |
| Randgold Resources Ltd., ADR | | | Call | | | | 2,000 | | | | 105.000 | | | | 9/24/12 | | | | 566,158 | | | | (320,000 | ) | | | 246,158 | |
| Royal Gold, Inc. | | | Call | | | | 2,000 | | | | 72.500 | | | | 7/23/12 | | | | 243,945 | | | | (1,260,000 | ) | | | (1,016,055 | ) |
| Royal Gold, Inc. | | | Call | | | | 2,000 | | | | 87.500 | | | | 7/23/12 | | | | 197,947 | | | | (20,000 | ) | | | 177,947 | |
| Royal Gold, Inc. | | | Call | | | | 2,000 | | | | 80.000 | | | | 10/22/12 | | | | 223,286 | | | | (960,000 | ) | | | (736,714 | ) |
| Royal Gold, Inc. | | | Call | | | | 2,000 | | | | 85.000 | | | | 10/22/12 | | | | 217,646 | | | | (580,000 | ) | | | (362,354 | ) |
| Silver Wheaton Corp. | | | Put | | | | 1,000 | | | | 23.000 | | | | 9/24/12 | | | | 133,752 | | | | (77,000 | ) | | | 56,752 | |
| Stillwater Mining Co. | | | Put | | | | 2,000 | | | | 8.000 | | | | 10/22/12 | | | | 209,426 | | | | (150,000 | ) | | | 59,426 | |
| | | | | | | | | | | | | | | | | | |
|
|
| |
|
|
| |
|
|
|
| | | | | | | | | | | | | | | | | | | $ | 9,106,063 | | | $ | (9,680,462 | ) | | $ | (574,399 | ) |
| | | | | | | | | | | | | | | | | | |
|
|
| |
|
|
| |
|
|
|
21 | OPPENHEIMER GOLD & SPECIAL MINERALS FUND
|
STATEMENT OF INVESTMENTS Continued
Exercise price is reported in U.S. Dollars (USD), except for those denoted in the following currency:
CAD Canadian Dollar
See accompanying Notes to Financial Statements.
22 | OPPENHEIMER GOLD & SPECIAL MINERALS FUND
|
STATEMENT OF ASSETS AND LIABILITIES June 29, 20121
| | | | |
| Assets | | | |
| Investments, at value—see accompanying statement of investments: | | | | |
| Unaffiliated companies (cost $2,407,994,742) | | $ | 2,454,981,155 | |
| Affiliated companies (cost $376,774,150) | | | 335,581,894 | |
| Wholly-owned subsidiary (cost $157,514,487) | |
| 150,751,769
|
|
| | | | 2,941,314,818 | |
| Cash | | | 552,865 | |
| Cash—foreign currencies (cost $798,843) | | | 798,843 | |
| Receivables and other assets: | | | | |
| Shares of beneficial interest sold | | | 2,719,959 | |
| Investments sold | | | 1,101,404 | |
| Dividends | | | 1,078,199 | |
| Expense waivers/reimbursements due from manager | | | 4,500 | |
| Other | |
| 132,259
|
|
| Total assets | | | 2,947,702,847 | |
| Liabilities | | | |
| Appreciated options written, at value (premiums received $5,784,596) | | | 2,521,462 | |
| Depreciated options written, at value (premiums received $3,321,467) | | | 7,159,000 | |
| Unrealized depreciation on foreign currency exchange contracts | | | 8,689 | |
| Payables and other liabilities: | | | | |
| Shares of beneficial interest redeemed | | | 6,704,920 | |
| Transfer and shareholder servicing agent fees | | | 838,432 | |
| Investments purchased | | | 735,158 | |
| Distribution and service plan fees | | | 494,774 | |
| Shareholder communications | | | 218,993 | |
| Trustees’ compensation | | | 214,077 | |
| Other | |
| 119,709
|
|
| Total liabilities | | | 19,015,214 | |
| Net Assets | | $
| 2,928,687,633
|
|
| Composition of Net Assets | | | |
| Paid-in capital | | $ | 3,189,904,026 | |
| Accumulated net investment loss | | | (215,927,011 | ) |
| Accumulated net realized loss on investments and foreign currency transactions | | | (43,752,828 | ) |
Net unrealized depreciation on investments and translation
of assets and liabilities denominated in foreign currencies | |
| (1,536,554
| )
|
| Net Assets | | $
| 2,928,687,633
|
|
23 | OPPENHEIMER GOLD & SPECIAL MINERALS FUND
|
STATEMENT OF ASSETS AND LIABILITIES Continued
| | | | |
| Net Asset Value Per Share | | | |
| Class A Shares: | | | | |
Net asset value and redemption price per share (based on net assets of $1,611,924,286
and 55,157,206 shares of beneficial interest outstanding) | | $ | 29.22 | |
| Maximum offering price per share (net asset value plus sales charge of 5.75% of offering price) | | $ | 31.00 | |
| Class B Shares: | | | | |
Net asset value, redemption price (excludes applicable contingent deferred sales charge) and offering price per share (based on net assets of $95,198,018 and 3,428,211 shares of beneficial interest outstanding) | | $ | 27.77 | |
| Class C Shares: | | | | |
Net asset value, redemption price (excludes applicable contingent deferred sales charge)
and offering price per share (based on net assets of $416,485,170 and 15,132,124 shares of beneficial interest outstanding) | | $ | 27.52 | |
| Class N Shares: | | | | |
Net asset value, redemption price (excludes applicable contingent deferred sales charge)
and offering price per share (based on net assets of $199,153,717 and 7,055,195 shares of beneficial interest outstanding) | | $ | 28.23 | |
| Class Y Shares: | | | | |
| Net asset value, redemption price and offering price per share (based on net assets of $605,926,442 and 20,851,308 shares of beneficial interest outstanding) | | $ | 29.06 | |
1. June 29, 2012 represents the last business day of the Fund’s 2012 fiscal year. See Note 1 of the accompanying Notes.
See accompanying Notes to Financial Statements.
24 | OPPENHEIMER GOLD & SPECIAL MINERALS FUND
|
STATEMENT OF OPERATIONS For the Year Ended June 29, 20121
| | | | |
| Investment Income | | | |
| Dividends: | | | | |
| Unaffiliated companies (net of foreign withholding taxes of $2,796,762) | | $ | 25,943,301 | |
| Affiliated companies (net of foreign withholding taxes of $283,722) | | | 1,541,608 | |
| Interest | | | 2,334 | |
| Other income | |
| 17,374
|
|
| Total investment income | | | 27,504,617 | |
| Expenses | | | |
| Management fees | | | 24,130,593 | |
| Distribution and service plan fees: | | | | |
| Class A | | | 5,782,542 | |
| Class B | | | 1,396,871 | |
| Class C | | | 5,602,322 | |
| Class N | | | 1,230,292 | |
| Transfer and shareholder servicing agent fees: | | | | |
| Class A | | | 7,236,027 | |
| Class B | | | 444,896 | |
| Class C | | | 1,172,494 | |
| Class N | | | 833,937 | |
| Class Y | | | 2,068,585 | |
| Shareholder communications: | | | | |
| Class A | | | 390,821 | |
| Class B | | | 39,130 | |
| Class C | | | 84,944 | |
| Class N | | | 28,031 | |
| Class Y | | | 171,489 | |
| Custodian fees and expenses | | | 182,109 | |
| Trustees’ compensation | | | 79,786 | |
| Administration service fees | | | 1,500 | |
| Other | |
| 511,489
|
|
| Total expenses | | | 51,387,858 | |
| Less waivers and reimbursements of expenses | |
| (711,835
| )
|
| Net expenses | | | 50,676,023 | |
| Net Investment Loss | | | (23,171,406 | ) |
25 | OPPENHEIMER GOLD & SPECIAL MINERALS FUND
|
STATEMENT OF OPERATIONS Continued
| | | | |
| Realized and Unrealized Gain (Loss) | | | |
| Net realized gain (loss) on: | | | | |
| Investments from: | | | | |
Unaffiliated companies (Including premiums on options exercised) | | $ | 157,648,706 | |
Affiliated companies | | | (54,599,136 | ) |
| Wholly-owned subsidiary | | | 51,210 | |
| Closing and expiration of option contracts written | | | 25,419,163 | |
| Foreign currency transactions | | | 14,015,684 | |
| Short positions | |
| (207,401
| )
|
| Net realized gain | | | 142,328,226 | |
| Net change in unrealized appreciation/depreciation on: | | | | |
| Investments | | | (1,327,353,407 | ) |
| Translation of assets and liabilities denominated in foreign currencies | | | (111,937,952 | ) |
| Option contracts written | |
| (4,129,166
| )
|
| Net change in unrealized appreciation/depreciation | | | (1,443,420,525 | ) |
| Net Decrease in Net Assets Resulting from Operations | | $
| (1,324,263,705
| )
|
1. June 29, 2012 represents the last business day of the Fund’s 2012 fiscal year. See Note 1 of the accompanying Notes.
See accompanying Notes to Financial Statements.
26 | OPPENHEIMER GOLD & SPECIAL MINERALS FUND
|
STATEMENTS OF CHANGES IN NET ASSETS
| | | | | | | | |
| | | Year Ended
June 29,
20121 | | | Year Ended
June 30,
2011 | |
| Operations | | | | | | |
| Net investment loss | | $ | (23,171,406 | ) | | $ | (33,221,979 | ) |
| Net realized gain | | | 142,328,226 | | | | 627,230,028 | |
| Net change in unrealized appreciation/depreciation | |
| (1,443,420,525
| )
| |
| 249,128,839
|
|
| Net increase (decrease) in net assets resulting from operations | | | (1,324,263,705 | ) | | | 843,136,888 | |
| Dividends and/or Distributions to Shareholders | | | | | | |
| Dividends from net investment income: | | | | | | | | |
| Class A | | | (34,087,309 | ) | | | (314,109,268 | ) |
| Class B | | | (1,146,887 | ) | | | (16,107,603 | ) |
| Class C | | | (5,946,394 | ) | | | (56,763,254 | ) |
| Class N | | | (3,651,392 | ) | | | (21,907,883 | ) |
| Class Y | |
| (15,972,462
| )
| |
| (4,636,534
| )
|
| | | | (60,804,444 | ) | | | (413,524,542 | ) |
| Tax return of capital distribution: | | | | | | | | |
| Class A | | | (723,134 | ) | | | — | |
| Class B | | | (24,330 | ) | | | — | |
| Class C | | | (126,148 | ) | | | — | |
| Class N | | | (77,461 | ) | | | — | |
| Class Y | |
| (338,842
| )
| |
| —
|
|
| | | | (1,289,915 | ) | | | — | |
| Distributions from net realized gain: | | | | | | | | |
| Class A | | | (98,600,909 | ) | | | (69,442,499 | ) |
| Class B | | | (6,564,893 | ) | | | (3,870,155 | ) |
| Class C | | | (26,543,724 | ) | | | (13,387,420 | ) |
| Class N | | | (11,306,684 | ) | | | (4,974,613 | ) |
| Class Y | |
| (31,961,445
| )
| |
| (988,470
| )
|
| | | | (174,977,655 | ) | | | (92,663,157 | ) |
| Beneficial Interest Transactions | | | | | | |
| Net increase (decrease) in net assets resulting from beneficial interest transactions: | | | | | | | | |
| Class A | | | (632,300,015 | ) | | | 357,261,110 | |
| Class B | | | (22,238,424 | ) | | | 6,893,331 | |
| Class C | | | 5,007,149 | | | | 116,160,181 | |
| Class N | | | 37,154,199 | | | | 92,585,780 | |
| Class Y | |
| 667,090,488
|
| |
| 241,731,148
|
|
| | | | 54,713,397 | | | | 814,631,550 | |
| Net Assets | | | | | | |
| Total increase (decrease) | | | (1,506,622,322 | ) | | | 1,151,580,739 | |
| Beginning of period | |
| 4,435,309,955
|
| |
| 3,283,729,216
|
|
| End of period (including accumulated net investment loss of $215,927,011 and $391,393,936, respectively) | | $
| 2,928,687,633
|
| | $
| 4,435,309,955
|
|
1. June 29, 2012 represents the last business day of the Fund’s 2012 fiscal year. See Note 1 of the accompanying Notes.
See accompanying Notes to Financial Statements.
27 | OPPENHEIMER GOLD & SPECIAL MINERALS FUND
|
FINANCIAL HIGHLIGHTS
| | | | | | | | | | | | | | | | | | | | |
| | | Year Ended
June 29, | | | Year Ended June 30, | |
| Class A | | 20121 | | | 2011 | | | 2010 | | | 2009 | | | 2008 | |
| | | | | | | | | | | | | | | | | | | | | |
| Per Share Operating Data | | | | | | | | | | | | | | | |
| Net asset value, beginning of period | | $ | 44.89 | | | $ | 39.93 | | | $ | 26.21 | | | $ | 38.79 | | | $ | 31.81 | |
| Income (loss) from investment operations: | | | | | | | | | | | | | | | | | | | | |
| Net investment income (loss)2 | | | (.19 | ) | | | (.28 | ) | | | (.26 | ) | | | .78 | 3 | | | (.09 | ) |
| Net realized and unrealized gain (loss) | |
| (13.07
| )
| |
| 10.76
|
| |
| 14.65
|
| |
| (12.42
| )
| |
| 9.31
|
|
| Total from investment operations | | | (13.26 | ) | | | 10.48 | | | | 14.39 | | | | (11.64 | ) | | | 9.22 | |
| Dividends and/or distributions to shareholders: | | | | | | | | | | | | | | | | | | | | |
| Dividends from net investment income | | | (.62 | ) | | | (4.52 | ) | | | (.67 | ) | | | (.49 | ) | | | (.76 | ) |
| Tax return of capital distribution | | | (.01 | ) | | | — | | | | — | | | | — | | | | — | |
| Distributions from net realized gain | |
| (1.78
| )
| |
| (1.00
| )
| |
| —
|
| |
| (.45
| )
| |
| (1.48
| )
|
| Total dividends and/or distributions to shareholders | | | (2.41 | ) | | | (5.52 | ) | | | (.67 | ) | | | (.94 | ) | | | (2.24 | ) |
| Net asset value, end of period | | $
| 29.22
|
| | $
| 44.89
|
| | $
| 39.93
|
| | $
| 26.21
|
| | $
| 38.79
|
|
| Total Return, at Net Asset Value4 | | | (30.49 | )% | | | 25.22 | % | | | 55.18 | % | | | (28.29 | )% | | | 29.43 | % |
| | | | | | | | | | | | | | | | | | | | | |
| Ratios/Supplemental Data | | | | | | | | | | | | | | | |
| Net assets, end of period (in thousands) | | | $1,611,924 | | | | $3,140,551 | | | | $2,500,205 | | | | $1,439,082 | | | | $1,919,047 | |
| Average net assets (in thousands) | | | $2,376,520 | | | | $3,277,921 | | | | $1,983,223 | | | | $1,184,093 | | | | $1,518,510 | |
| Ratios to average net assets:5 | | | | | | | | | | | | | | | | | | | | |
| Net investment income (loss) | | | (0.49 | )% | | | (0.61 | )% | | | (0.74 | )% | | | 3.35 | %3 | | | (0.24 | )% |
| Total expenses6 | | | 1.20 | % | | | 1.07 | % | | | 1.12 | % | | | 1.20 | % | | | 1.06 | % |
| Expenses after payments, waivers and/or reimbursements and reduction to custodian expenses7 | | | 1.18 | % | | | 1.07 | % | | | 1.12 | % | | | 1.19 | % | | | 1.06 | % |
| Portfolio turnover rate | | | 44 | % | | | 37 | % | | | 20 | % | | | 81 | % | | | 45 | % |
1. June 29, 2012 represents the last business day of the Fund’s 2012 fiscal year. See Note 1 of the accompanying Notes.
2. Per share amounts calculated based on the average shares outstanding during the period.
3. Net investment income per share and the net investment income ratio include $0.67 and 2.89%, respectively, resulting from a special dividend from Anglo Ferrous Brazil SA in July 2008.
4. Assumes an initial investment on the business day before the first day of the fiscal period, with all dividends and distributions reinvested in additional shares on the reinvestment date, and redemption at the net asset value calculated on the last business day of the fiscal period. Sales charges are not reflected in the total returns. Total returns are not annualized for periods less than one full year. Returns do not reflect the deduction of taxes that a shareholder would pay on fund distributions or the redemption of fund shares.
5. Annualized for periods less than one full year.
6. Ratio including all expenses of the wholly-owned subsidiary and indirect expenses from affiliated fund were as follows:
| | | | |
| Year Ended June 29, 2012 | | | 1.22 | % |
| Year Ended June 30, 2011 | | | 1.07 | % |
| Year Ended June 30, 2010 | | | 1.12 | % |
| Year Ended June 30, 2009 | | | 1.20 | % |
| Year Ended June 30, 2008 | | | 1.06 | % |
7. Ratio including expenses of the wholly-owned subsidiary and indirect expenses from affiliated fund were as follows:
| | | | |
| Year Ended June 29, 2012 | | | 1.20 | % |
| Year Ended June 30, 2011 | | | 1.07 | % |
| Year Ended June 30, 2010 | | | 1.12 | % |
| Year Ended June 30, 2009 | | | 1.19 | % |
| Year Ended June 30, 2008 | | | 1.06 | % |
See accompanying Notes to Financial Statements.
28 | OPPENHEIMER GOLD & SPECIAL MINERALS FUND
|
| | | | | | | | | | | | | | | | | | | | |
| | | Year Ended
June 29, | | | Year Ended June 30, | |
| Class B | | 20121 | | | 2011 | | | 2010 | | | 2009 | | | 2008 | |
| | | | | | | | | | | | | | | | | | | | | |
| Per Share Operating Data | | | | | | | | | | | | | | | |
| Net asset value, beginning of period | | $ | 42.76 | | | $ | 38.26 | | | $ | 25.17 | | | $ | 37.00 | | | $ | 30.44 | |
| Income (loss) from investment operations: | | | | | | | | | | | | | | | | | | | | |
| Net investment income (loss)2 | | | (.47 | ) | | | (.64 | ) | | | (.54 | ) | | | .62 | 3 | | | (.36 | ) |
| Net realized and unrealized gain (loss) | |
| (12.42
| )
| |
| 10.30
|
| |
| 14.06
|
| |
| (11.78
| )
| |
| 8.90
|
|
| Total from investment operations | | | (12.89 | ) | | | 9.66 | | | | 13.52 | | | | (11.16 | ) | | | 8.54 | |
| Dividends and/or distributions to shareholders: | | | | | | | | | | | | | | | | | | | | |
| Dividends from net investment income | | | (.31 | ) | | | (4.16 | ) | | | (.43 | ) | | | (.22 | ) | | | (.50 | ) |
| Tax return of capital distribution | | | (.01 | ) | | | — | | | | — | | | | — | | | | — | |
| Distributions from net realized gain | |
| (1.78
| )
| |
| (1.00
| )
| |
| —
|
| |
| (.45
| )
| |
| (1.48
| )
|
| Total dividends and/or distributions to shareholders | | | (2.10 | ) | | | (5.16 | ) | | | (.43 | ) | | | (.67 | ) | | | (1.98 | ) |
| Net asset value, end of period | | $
| 27.77
|
| | $
| 42.76
|
| | $
| 38.26
|
| | $
| 25.17
|
| | $
| 37.00
|
|
| Total Return, at Net Asset Value4 | | | (31.03 | )% | | | 24.19 | % | | | 53.86 | % | | | (28.91 | )% | | | 28.44 | % |
| | | | | | | | | | | | | | | | | | | | | |
| Ratios/Supplemental Data | | | | | | | | | | | | | | | |
| Net assets, end of period (in thousands) | | | $ 95,198 | | | | $171,961 | | | | $149,228 | | | | $111,935 | | | | $176,880 | |
| Average net assets (in thousands) | | | $139,623 | | | | $178,499 | | | | $137,358 | | | | $101,129 | | | | $167,286 | |
| Ratios to average net assets:5 | | | | | | | | | | | | | | | | | | | | |
| Net investment income (loss) | | | (1.27 | )% | | | (1.44 | )% | | | (1.61 | )% | | | 2.79 | %3 | | | (1.03 | )% |
| Total expenses6 | | | 1.99 | % | | | 1.91 | % | | | 1.98 | % | | | 2.09 | % | | | 1.86 | % |
| Expenses after payments, waivers and/or reimbursements and reduction to custodian expenses7 | | | 1.97 | % | | | 1.91 | % | | | 1.98 | % | | | 2.03 | % | | | 1.86 | % |
| Portfolio turnover rate | | | 44 | % | | | 37 | % | | | 20 | % | | | 81 | % | | | 45 | % |
1. June 29, 2012 represents the last business day of the Fund’s 2012 fiscal year. See Note 1 of the accompanying Notes.
2. Per share amounts calculated based on the average shares outstanding during the period.
3. Net investment income per share and the net investment income ratio include $0.65 and 2.89%, respectively, resulting from a special dividend from Anglo Ferrous Brazil SA in July 2008.
4. Assumes an initial investment on the business day before the first day of the fiscal period, with all dividends and distributions reinvested in additional shares on the reinvestment date, and redemption at the net asset value calculated on the last business day of the fiscal period. Sales charges are not reflected in the total returns. Total returns are not annualized for periods less than one full year. Returns do not reflect the deduction of taxes that a shareholder would pay on fund distributions or the redemption of fund shares.
5. Annualized for periods less than one full year.
6. Ratio including all expenses of the wholly-owned subsidiary and indirect expenses from affiliated fund were as follows:
| | | | |
| Year Ended June 29, 2012 | | | 2.01 | % |
| Year Ended June 30, 2011 | | | 1.91 | % |
| Year Ended June 30, 2010 | | | 1.98 | % |
| Year Ended June 30, 2009 | | | 2.09 | % |
| Year Ended June 30, 2008 | | | 1.86 | % |
7. Ratio including expenses of the wholly-owned subsidiary and indirect expenses from affiliated fund were as follows:
| | | | |
| Year Ended June 29, 2012 | | | 1.99 | % |
| Year Ended June 30, 2011 | | | 1.91 | % |
| Year Ended June 30, 2010 | | | 1.98 | % |
| Year Ended June 30, 2009 | | | 2.03 | % |
| Year Ended June 30, 2008 | | | 1.86 | % |
See accompanying Notes to Financial Statements.
29 | OPPENHEIMER GOLD & SPECIAL MINERALS FUND
|
FINANCIAL HIGHLIGHTS Continued
| | | | | | | | | | | | | | | | | | | | |
| | | Year Ended
June 29, | | | Year Ended June 30, | |
| Class C | | 20121 | | | 2011 | | | 2010 | | | 2009 | | | 2008 | |
| | | | | | | | | | | | | | | | | | | | | |
| Per Share Operating Data | | | | | | | | | | | | | | | |
| Net asset value, beginning of period | | $ | 42.46 | | | $ | 38.04 | | | $ | 25.05 | | | $ | 36.89 | | | $ | 30.41 | |
| Income (loss) from investment operations: | | | | | | | | | | | | | | | | | | | | |
| Net investment income (loss)2 | | | (.42 | ) | | | (.60 | ) | | | (.50 | ) | | | .61 | 3 | | | (.35 | ) |
| Net realized and unrealized gain (loss) | |
| (12.33
| )
| |
| 10.26
|
| |
| 13.98
|
| |
| (11.74
| )
| |
| 8.88
|
|
| Total from investment operations | | | (12.75 | ) | | | 9.66 | | | | 13.48 | | | | (11.13 | ) | | | 8.53 | |
| Dividends and/or distributions to shareholders: | | | | | | | | | | | | | | | | | | | | |
| Dividends from net investment income | | | (.40 | ) | | | (4.24 | ) | | | (.49 | ) | | | (.26 | ) | | | (.57 | ) |
| Tax return of capital distribution | | | (.01 | ) | | | — | | | | — | | | | — | | | | — | |
| Distributions from net realized gain | |
| (1.78
| )
| |
| (1.00
| )
| |
| —
|
| |
| (.45
| )
| |
| (1.48
| )
|
| Total dividends and/or distributions to shareholders | | | (2.19 | ) | | | (5.24 | ) | | | (.49 | ) | | | (.71 | ) | | | (2.05 | ) |
| Net asset value, end of period | | $
| 27.52
|
| | $
| 42.46
|
| | $
| 38.04
|
| | $
| 25.05
|
| | $
| 36.89
|
|
| Total Return, at Net Asset Value4 | | | (30.96 | )% | | | 24.31 | % | | | 53.98 | % | | | (28.84 | )% | | | 28.45 | % |
| | | | | | | | | | | | | | | | | | | | | |
| Ratios/Supplemental Data | | | | | | | | | | | | | | | |
| Net assets, end of period (in thousands) | | | $416,485 | | | | $637,676 | | | | $476,835 | | | | $288,407 | | | | $422,169 | |
| Average net assets (in thousands) | | | $559,825 | | | | $620,759 | | | | $396,328 | | | | $252,930 | | | | $343,807 | |
| Ratios to average net assets:5 | | | | | | | | | | | | | | | | | | | | |
| Net investment income (loss) | | | (1.14 | )% | | | (1.35 | )% | | | (1.51 | )% | | | 2.76 | %3 | | | (1.00 | )% |
| Total expenses6 | | | 1.87 | % | | | 1.81 | % | | | 1.88 | % | | | 1.98 | % | | | 1.82 | % |
| Expenses after payments, waivers and/or reimbursements and reduction to custodian expenses7 | | | 1.85 | % | | | 1.81 | % | | | 1.88 | % | | | 1.96 | % | | | 1.82 | % |
| Portfolio turnover rate | | | 44 | % | | | 37 | % | | | 20 | % | | | 81 | % | | | 45 | % |
1. June 29, 2012 represents the last business day of the Fund’s 2012 fiscal year. See Note 1 of the accompanying Notes.
2. Per share amounts calculated based on the average shares outstanding during the period.
3. Net investment income per share and the net investment income ratio include $0.64 and 2.89%, respectively, resulting from a special dividend from Anglo Ferrous Brazil SA in July 2008.
4. Assumes an initial investment on the business day before the first day of the fiscal period, with all dividends and distributions reinvested in additional shares on the reinvestment date, and redemption at the net asset value calculated on the last business day of the fiscal period. Sales charges are not reflected in the total returns. Total returns are not annualized for periods less than one full year. Returns do not reflect the deduction of taxes that a shareholder would pay on fund distributions or the redemption of fund shares.
5. Annualized for periods less than one full year.
6. Ratio including all expenses of the wholly-owned subsidiary and indirect expenses from affiliated fund were as follows:
| | | | |
| Year Ended June 29, 2012 | | | 1.89 | % |
| Year Ended June 30, 2011 | | | 1.81 | % |
| Year Ended June 30, 2010 | | | 1.88 | % |
| Year Ended June 30, 2009 | | | 1.98 | % |
| Year Ended June 30, 2008 | | | 1.82 | % |
7. Ratio including expenses of the wholly-owned subsidiary and indirect expenses from affiliated fund were as follows:
| | | | |
| Year Ended June 29, 2012 | | | 1.87 | % |
| Year Ended June 30, 2011 | | | 1.81 | % |
| Year Ended June 30, 2010 | | | 1.88 | % |
| Year Ended June 30, 2009 | | | 1.96 | % |
| Year Ended June 30, 2008 | | | 1.82 | % |
See accompanying Notes to Financial Statements.
30 | OPPENHEIMER GOLD & SPECIAL MINERALS FUND
|
| | | | | | | | | | | | | | | | | | | | |
| | | Year Ended
June 29, | | | Year Ended June 30, | |
| Class N | | 20121 | | | 2011 | | | 2010 | | | 2009 | | | 2008 | |
| | | | | | | | | | | | | | | | | | | | | |
| Per Share Operating Data | | | | | | | | | | | | | | | |
| Net asset value, beginning of period | | $ | 43.53 | | | $ | 38.88 | | | $ | 25.58 | | | $ | 37.94 | | | $ | 31.18 | |
| Income (loss) from investment operations: | | | | | | | | | | | | | | | | | | | | |
| Net investment income (loss)2 | | | (.28 | ) | | | (.44 | ) | | | (.39 | ) | | | .57 | 3 | | | (.21 | ) |
| Net realized and unrealized gain (loss) | |
| (12.65
| )
| |
| 10.49
|
| |
| 14.30
|
| |
| (12.04
| )
| |
| 9.13
|
|
| Total from investment operations | | | (12.93 | ) | | | 10.05 | | | | 13.91 | | | | (11.47 | ) | | | 8.92 | |
| Dividends and/or distributions to shareholders: | | | | | | | | | | | | | | | | | | | | |
| Dividends from net investment income | | | (.58 | ) | | | (4.40 | ) | | | (.61 | ) | | | (.44 | ) | | | (.68 | ) |
| Tax return of capital distribution | | | (.01 | ) | | | — | | | | — | | | | — | | | | — | |
| Distributions from net realized gain | |
| (1.78
| )
| |
| (1.00
| )
| |
| —
|
| |
| (.45
| )
| |
| (1.48
| )
|
| Total dividends and/or distributions to shareholders | | | (2.37 | ) | | | (5.40 | ) | | | (.61 | ) | | | (.89 | ) | | | (2.16 | ) |
| Net asset value, end of period | | $
| 28.23
|
| | $
| 43.53
|
| | $
| 38.88
|
| | $
| 25.58
|
| | $
| 37.94
|
|
| Total Return, at Net Asset Value4 | | | (30.67 | )% | | | 24.79 | % | | | 54.60 | % | | | (28.55 | )% | | | 29.04 | % |
| | | | | | | | | | | | | | | | | | | | | |
| Ratios/Supplemental Data | | | | | | | | | | | | | | | |
| Net assets, end of period (in thousands) | | | $199,154 | | | | $263,079 | | | | $157,461 | | | | $72,805 | | | | $71,049 | |
| Average net assets (in thousands) | | | $246,052 | | | | $236,220 | | | | $115,927 | | | | $54,016 | | | | $49,137 | |
| Ratios to average net assets:5 | | | | | | | | | | | | | | | | | | | | |
| Net investment income (loss) | | | (0.75 | )% | | | (0.96 | )% | | | (1.12 | )% | | | 2.55 | %3 | | | (0.59 | )% |
| Total expenses6 | | | 1.49 | % | | | 1.43 | % | | | 1.55 | % | | | 1.63 | % | | | 1.39 | % |
| Expenses after payments, waivers and/or reimbursements and reduction to custodian expenses7 | | | 1.47 | % | | | 1.43 | % | | | 1.49 | % | | | 1.52 | % | | | 1.39 | % |
| Portfolio turnover rate | | | 44 | % | | | 37 | % | | | 20 | % | | | 81 | % | | | 45 | % |
1. June 29, 2012 represents the last business day of the Fund’s 2012 fiscal year. See Note 1 of the accompanying Notes.
2. Per share amounts calculated based on the average shares outstanding during the period.
3. Net investment income per share and the net investment income ratio include $0.65 and 2.89%, respectively, resulting from a special dividend from Anglo Ferrous Brazil SA in July 2008.
4. Assumes an initial investment on the business day before the first day of the fiscal period, with all dividends and distributions reinvested in additional shares on the reinvestment date, and redemption at the net asset value calculated on the last business day of the fiscal period. Sales charges are not reflected in the total returns. Total returns are not annualized for periods less than one full year. Returns do not reflect the deduction of taxes that a shareholder would pay on fund distributions or the redemption of fund shares.
5. Annualized for periods less than one full year.
6. Ratio including all expenses of the wholly-owned subsidiary and indirect expenses from affiliated fund were as follows:
| | | | |
| Year Ended June 29, 2012 | | | 1.51 | % |
| Year Ended June 30, 2011 | | | 1.43 | % |
| Year Ended June 30, 2010 | | | 1.55 | % |
| Year Ended June 30, 2009 | | | 1.63 | % |
| Year Ended June 30, 2008 | | | 1.39 | % |
7. Ratio including expenses of the wholly-owned subsidiary and indirect expenses from affiliated fund were as follows:
| | | | |
| Year Ended June 29, 2012 | | | 1.49 | % |
| Year Ended June 30, 2011 | | | 1.43 | % |
| Year Ended June 30, 2010 | | | 1.49 | % |
| Year Ended June 30, 2009 | | | 1.52 | % |
| Year Ended June 30, 2008 | | | 1.39 | % |
See accompanying Notes to Financial Statements.
31 | OPPENHEIMER GOLD & SPECIAL MINERALS FUND
|
FINANCIAL HIGHLIGHTS Continued
| | | | | | | | |
| Class Y | | Year Ended
June 29,
20121 | | | Period Ended
June 30,
20112 | |
| | | | | | | | | |
| Per Share Operating Data | | | | | | |
| Net asset value, beginning of period | | $ | 44.90 | | | $ | 45.55 | |
| Income (loss) from investment operations: | | | | | | | | |
| Net investment loss3 | | | (.09 | ) | | | (.05 | ) |
| Net realized and unrealized gain (loss) | |
| (13.06
| )
| |
| 5.09
|
|
| Total from investment operations | | | (13.15 | ) | | | 5.04 | |
| Dividends and/or distributions to shareholders: | | | | | | | | |
| Dividends from net investment income | | | (.89 | ) | | | (4.69 | ) |
| Tax return of capital distribution | | | (.02 | ) | | | — | |
| Distributions from net realized gain | |
| (1.78
| )
| |
| (1.00
| )
|
| Total dividends and/or distributions to shareholders | | | (2.69 | ) | | | (5.69 | ) |
| Net asset value, end of period | | $
| 29.06
|
| | $
| 44.90
|
|
| Total Return, at Net Asset Value4 | | | (30.34 | )% | | | 10.16 | % |
| | | | | | | | | |
| Ratios/Supplemental Data | | | | | | |
| Net assets, end of period (in thousands) | | | $605,927 | | | | $222,043 | |
| Average net assets (in thousands) | | | $568,371 | | | | $89,984 | |
| Ratios to average net assets:5 | | | | | | | | |
| Net investment loss | | | (0.25 | )% | | | (0.13 | )% |
| Total expenses6 | | | 1.04 | % | | | 0.66 | % |
| Expenses after payments, waivers and/or reimbursements and reduction to custodian expenses7 | | | 1.01 | % | | | 0.66 | % |
| Portfolio turnover rate | | | 44 | % | | | 37 | % |
1. June 29, 2012 represents the last business day of the Fund’s 2012 fiscal year. See Note 1 of the accompanying Notes.
2. For the period from September 7, 2010 (inception of offering) to June 30, 2011.
3. Per share amounts calculated based on the average shares outstanding during the period.
4. Assumes an initial investment on the business day before the first day of the fiscal period, with all dividends and distributions reinvested in additional shares on the reinvestment date, and redemption at the net asset value calculated on the last business day of the fiscal period. Sales charges are not reflected in the total returns. Total returns are not annualized for periods less than one full year. Returns do not reflect the deduction of taxes that a shareholder would pay on fund distributions or the redemption of fund shares.
5. Annualized for periods less than one full year.
6. Ratio including all expenses of the wholly-owned subsidiary and indirect expenses from affiliated fund were as follows:
| | | | |
| Year Ended June 29, 2012 | | | 1.06 | % |
| Period Ended June 30, 2011 | | | 0.66 | % |
7. Ratio including expenses of the wholly-owned subsidiary and indirect expenses from affiliated fund were as follows:
| | | | |
| Year Ended June 29, 2012 | | | 1.03 | % |
| Period Ended June 30, 2011 | | | 0.66 | % |
See accompanying Notes to Financial Statements.
32 | OPPENHEIMER GOLD & SPECIAL MINERALS FUND
|
NOTES TO FINANCIAL STATEMENTS
1. Significant Accounting Policies
Oppenheimer Gold & Special Minerals Fund (the “Fund”) is registered under the Investment Company Act of 1940, as amended, as a non-diversified open-end management investment company. The Fund’s investment objective is to seek capital appreciation. The Fund’s investment adviser is OppenheimerFunds, Inc. (the “Manager”).
The Fund offers Class A, Class C, Class N and Class Y shares. Class B shares are no longer offered for new purchase after June 29, 2012. Class A shares are sold at their offering price, which is normally net asset value plus a front-end sales charge. Class B, Class C and Class N shares are sold without a front-end sales charge but may be subject to a contingent deferred sales charge (“CDSC”). Class N shares are sold only through retirement plans. Retirement plans that offer Class N shares may impose charges on those accounts. Class Y shares are sold to certain institutional investors or intermediaries without either a front-end sales charge or a CDSC, however, the intermediaries may impose charges on their accountholders who beneficially own Class Y shares. All classes of shares have identical rights and voting privileges with respect to the Fund in general and exclusive voting rights on matters that affect that class alone. Earnings, net assets and net asset value per share may differ due to each class having its own expenses, such as transfer and shareholder servicing agent fees and shareholder communications, directly attributable to that class. Class A, B, C and N shares have separate distribution and/or service plans under which they pay fees. Class Y shares do not pay such fees. Class B shares will automatically convert to Class A shares 72 months after the date of purchase.
The following is a summary of significant accounting policies consistently followed by the Fund.
Fiscal Year End. The last day of the Fund’s fiscal year was the last day the New York Stock Exchange was open for trading. The Fund’s financial statements have been presented through that date to maintain consistency with the Fund’s net asset value calculations used for shareholder transactions.
Securities Sold Short. The Fund sells securities that it does not own, and it will therefore be obligated to purchase such securities at a future date. Upon entering into a short position, the Fund is required to segregate cash or securities at its custodian which are pledged for the benefit of the lending broker and/or to deposit and pledge cash directly at the lending broker, with a value equal to a certain percentage, exceeding 100%, of the value of the securities that it sold short. Cash that has been segregated and pledged for this purpose will be disclosed on the Statement of Assets and Liabilities; securities that have been segregated and pledged for this purpose are disclosed as such in the Statement of Investments. The value of the open short position is recorded as a liability, and the Fund records an unrealized gain or loss to the extent of the difference between the proceeds received and the change in value of the open short position. The Fund records a realized gain or loss when the short position is closed out. By entering into short sales, the Fund bears the market risk of increases in value of the security sold short in excess of the proceeds received. Until the security is replaced, the Fund is required to pay the lender any
33 | OPPENHEIMER GOLD & SPECIAL MINERALS FUND
|
NOTES TO FINANCIAL STATEMENTS Continued
1. Significant Accounting Policies Continued
dividend or interest earned. Dividend expense on short sales is treated as an expense in the Statement of Operations.
As of June 29, 2012 the Fund had no outstanding securities sold short.
Investment in Oppenheimer Gold & Special Minerals Fund (Cayman) Ltd. The Fund may invest up to 25% of its total assets in Oppenheimer Gold & Special Minerals Fund (Cayman) Ltd., a wholly-owned and controlled Cayman Islands subsidiary (the “Subsidiary”), which is expected to invest primarily in shares of exchange-traded funds that invest in gold bullion (“Gold ETFs”), commodity-linked derivatives related to gold or other special minerals (including commodity futures, financial futures, options and swap contracts), and certain fixed-income securities and other investments that may serve as margin or collateral for the Subsidiary’s derivatives positions. Investments in the Subsidiary are intended to provide the Fund with exposure to minerals commodities market returns within the limitations of the federal tax requirements that apply to the Fund. The Subsidiary will be subject to the same investment restrictions and guidelines, and follow the same compliance policies and procedures, as the Fund. The Fund wholly owns and controls the Subsidiary, and the Fund and Subsidiary are both managed by the Manager.
The Fund does not consolidate the assets, liabilities, capital or operations of the Subsidiary into its financial statements. Rather, the Subsidiary is separately presented as an investment in the Fund’s Statement of Investments. Shares of the Subsidiary are valued at their net asset value per share. Gains or losses on withdrawals of capital from the Subsidiary by the Fund are recognized on an average cost basis. Unrealized appreciation or depreciation on the Fund’s investment in the Subsidiary is recorded in the Fund’s Statement of Assets and Liabilities and the Fund’s Statement of Operations. Distributions received from the Subsidiary are recorded as income on the ex-dividend date.
For tax purposes, the Subsidiary is an exempted Cayman investment company. The Subsidiary has received an undertaking from the Government of the Cayman Islands exempting it from all local income, profits and capital gains taxes through September of 2030. No such taxes are levied in the Cayman Islands at the present time. For U.S. income tax purposes, the Subsidiary is a Controlled Foreign Corporation and as such is not subject to U.S. income tax. However, as a wholly-owned Controlled Foreign Corporation, the Subsidiary’s net income and capital gain, to the extent of its earnings and profits, will be included each year in the Fund’s investment company taxable income. For the year ended June 29, 2012, the Subsidiary has a surplus of $2,560,606 in its taxable earnings and profits. In addition, any in-kind capital contributions made by the Fund to the Subsidiary will result in the Fund recognizing taxable gain to the extent of unrealized gain, if any, on securities transferred to the Subsidiary while any unrealized losses on securities so transferred will not be recognized at the time of transfer.
Investment in Oppenheimer Institutional Money Market Fund. The Fund is permitted to invest daily available cash balances in an affiliated money market fund. The Fund may invest the available cash in Class E shares of Oppenheimer Institutional Money Market
34 | OPPENHEIMER GOLD & SPECIAL MINERALS FUND
|
Fund (“IMMF”) to seek current income while preserving liquidity. IMMF is a registered open-end management investment company, regulated as a money market fund under the Investment Company Act of 1940, as amended. The Manager is also the investment adviser of IMMF. When applicable, the Fund’s investment in IMMF is included in the Statement of Investments. Shares of IMMF are valued at their net asset value per share. As a shareholder, the Fund is subject to its proportional share of IMMF’s Class E expenses, including its management fee. The Manager will waive fees and/or reimburse Fund expenses in an amount equal to the indirect management fees incurred through the Fund’s investment in IMMF.
Concentration Risk. Concentration risk is the risk that the Fund’s investments in securities of companies in one industry may cause it to be more exposed to changes in that industry or market sector as compared to a more broadly diversified fund.
The Fund invests primarily in the mining and metals industry.
Foreign Currency Translation. The Fund’s accounting records are maintained in U.S. dollars. The values of securities denominated in foreign currencies and amounts related to the purchase and sale of foreign securities and foreign investment income are translated into U.S. dollars as of the close of the Exchange, normally 4:00 P.M. Eastern time, on each day the Exchange is open for trading. Foreign exchange rates may be valued primarily using a reliable bank, dealer or service authorized by the Board of Trustees.
Reported net realized gains and losses from foreign currency transactions arise from sales of portfolio securities, sales and maturities of short-term securities, sales of foreign currencies, exchange rate fluctuations between the trade and settlement dates on securities transactions, and the difference between the amounts of dividends, interest, and foreign withholding taxes recorded on the Fund’s books and the U.S. dollar equivalent of the amounts actually received or paid. Net unrealized appreciation and depreciation on the translation of assets and liabilities denominated in foreign currencies arise from changes in the values of assets and liabilities, including investments in securities at fiscal period end, resulting from changes in exchange rates.
The effect of changes in foreign currency exchange rates on investments is separately identified from the fluctuations arising from changes in market values of securities held and reported with all other foreign currency gains and losses in the Fund’s Statement of Operations.
Allocation of Income, Expenses, Gains and Losses. Income, expenses (other than those attributable to a specific class), gains and losses are allocated on a daily basis to each class of shares based upon the relative proportion of net assets represented by such class. Operating expenses directly attributable to a specific class are charged against the operations of that class.
Federal Taxes. The Fund intends to comply with provisions of the Internal Revenue Code applicable to regulated investment companies and to distribute substantially all of its investment company taxable income, including any net realized gain on investments not offset by capital loss carryforwards, if any, to shareholders. Therefore, no federal income or
35 | OPPENHEIMER GOLD & SPECIAL MINERALS FUND
|
NOTES TO FINANCIAL STATEMENTS Continued
1. Significant Accounting Policies Continued
excise tax provision is required. The Fund files income tax returns in U.S. federal and applicable state jurisdictions. The statute of limitations on the Fund’s tax return filings generally remain open for the three preceding fiscal reporting period ends.
The tax components of capital shown in the following table represent distribution requirements the Fund must satisfy under the income tax regulations, losses the Fund may be able to offset against income and gains realized in future years and unrealized appreciation or depreciation of securities and other investments for federal income tax purposes.
| | | | | | | | | | | | |
Undistributed
Net Investment
Income1 | | Undistributed
Long-Term
Gain | | | Accumulated
Loss
Carryforward2,3,4,5 | | | Net Unrealized
Depreciation
Based on Cost of
Securities and Other
Investments for Federal
Income Tax Purposes | |
| $— | | $ | — | | | $ | 34,688,190 | | | $ | 126,695,024 | |
1. As of June 29, 2012, the Fund elected to defer $97,074,639 of late year ordinary losses.
2. As of June 29, 2012, the Fund had $34,310,023 of net capital loss carryforwards available to offset future realized capital gains, if any, and thereby reduce future taxable gain distributions. Details of the capital loss carryforwards are included in the table below. Capital loss carryovers with no expiration, if any, must be utilized prior to those with expiration dates.
| | | | |
| Expiring | | | |
| No expiration | | $ | 34,310,023 | |
3. The Fund had $378,167 of straddle losses which were deferred.
4. During the fiscal year ended June 29, 2012, the Fund did not utilize any capital loss carryforward.
5. During the fiscal year ended June 30, 2011, the Fund utilized $212,935,676 of capital loss carryforward to offset capital gains realized in that fiscal year.
Net investment income (loss) and net realized gain (loss) may differ for financial statement and tax purposes. The character of dividends and distributions made during the fiscal year from net investment income or net realized gains may differ from their ultimate characterization for federal income tax purposes. Also, due to timing of dividends and distributions, the fiscal year in which amounts are distributed may differ from the fiscal year in which the income or net realized gain was recorded by the Fund.
Accordingly, the following amounts have been reclassified for June 30, 2012. Net assets of the Fund were unaffected by the reclassifications.
| | | | | | | | |
Reduction to
Paid-in Capital | | Reduction
to Accumulated
Net Investment
Loss | | | Reduction to
Accumulated Net
Realized Gain
on Investments | |
| $81,152,456 | | $ | 260,732,690 | | | $ | 179,580,234 | |
36 | OPPENHEIMER GOLD & SPECIAL MINERALS FUND
|
The tax character of distributions paid during the years ended June 30, 2012 and June 30, 2011 was as follows:
| | | | | | | | |
| | | Year Ended
June 30, 2012 | | | Year Ended
June 30, 2011 | |
| Distributions paid from: | | | | | | | | |
| Ordinary income | | $ | 61,695,962 | | | $ | 413,524,542 | |
| Long-term capital gain | | | 174,086,137 | | | | 92,663,157 | |
| Return of capital | | | 1,289,915 | | | | — | |
| | |
|
|
|
| Total | | $ | 237,072,014 | | | $ | 506,187,699 | |
| | |
|
|
|
The aggregate cost of securities and other investments and the composition of unrealized appreciation and depreciation of securities and other investments for federal income tax purposes as of June 29, 2012 are noted in the following table. The primary difference between book and tax appreciation or depreciation of securities and other investments, if applicable, is attributable to the tax deferral of losses or tax realization of financial statement unrealized gain or loss.
| | | | |
| Federal tax cost of securities | | $ | 3,067,450,390 | |
| Federal tax cost of other investments | | | (9,952,792 | ) |
| | |
|
|
|
| Total federal tax cost | | $ | 3,057,497,598 | |
| | |
|
|
|
| Gross unrealized appreciation | | $ | 337,699,673 | |
| Gross unrealized depreciation | | | (464,394,697 | ) |
| | |
|
|
|
| Net unrealized depreciation | | $ | (126,695,024 | ) |
| | |
|
|
|
Trustees’ Compensation. The Fund has adopted an unfunded retirement plan (the “Plan”) for the Fund’s independent trustees. Benefits are based on years of service and fees paid to each trustee during their period of service. The Plan was frozen with respect to adding new participants effective December 31, 2006 (the “Freeze Date”) and existing Plan Participants as of the Freeze Date will continue to receive accrued benefits under the Plan. Active independent trustees as of the Freeze Date have each elected a distribution method with respect to their benefits under the Plan. During the year ended June 29, 2012, the Fund’s projected benefit obligations, payments to retired trustees and accumulated liability were as follows:
| | | | |
| Projected Benefit Obligations Increased | | $ | 9,723 | |
| Payments Made to Retired Trustees | | | 13,137 | |
| Accumulated Liability as of June 29, 2012 | | | 94,834 | |
The Board of Trustees has adopted a compensation deferral plan for independent trustees that enables trustees to elect to defer receipt of all or a portion of the annual compensation they are entitled to receive from the Fund. For purposes of determining the amount owed to the Trustee under the plan, deferred amounts are treated as though equal dollar amounts had been invested in shares of the Fund or in other Oppenheimer funds selected by the Trustee. The Fund purchases shares of the funds selected for deferral by the Trustee in amounts equal to his or her deemed investment, resulting in a Fund asset equal to the deferred compensation liability. Such assets are included as a component of “Other”
37 | OPPENHEIMER GOLD & SPECIAL MINERALS FUND
|
NOTES TO FINANCIAL STATEMENTS Continued
1. Significant Accounting Policies Continued
within the asset section of the Statement of Assets and Liabilities. Deferral of trustees’ fees under the plan will not affect the net assets of the Fund, and will not materially affect the Fund’s assets, liabilities or net investment income per share. Amounts will be deferred until distributed in accordance with the compensation deferral plan.
Dividends and Distributions to Shareholders. Dividends and distributions to shareholders, which are determined in accordance with income tax regulations and may differ from U.S. generally accepted accounting principles, are recorded on the ex-dividend date. Income and capital gain distributions, if any, are declared and paid annually or at other times as deemed necessary by the Manager.
Investment Income. Dividend income is recorded on the ex-dividend date or upon ex-dividend notification in the case of certain foreign dividends where the ex-dividend date may have passed. Non-cash dividends included in dividend income, if any, are recorded at the fair market value of the securities received. Interest income is recognized on an accrual basis. Discount and premium, which are included in interest income on the Statement of Operations, are amortized or accreted daily.
Custodian Fees. “Custodian fees and expenses” in the Statement of Operations may include interest expense incurred by the Fund on any cash overdrafts of its custodian account during the period. Such cash overdrafts may result from the effects of failed trades in portfolio securities and from cash outflows resulting from unanticipated shareholder redemption activity. The Fund pays interest to its custodian on such cash overdrafts, to the extent they are not offset by positive cash balances maintained by the Fund, at a rate equal to the Federal Funds Rate plus 0.50%. The “Reduction to custodian expenses” line item, if applicable, represents earnings on cash balances maintained by the Fund during the period. Such interest expense and other custodian fees may be paid with these earnings.
Security Transactions. Security transactions are recorded on the trade date. Realized gains and losses on securities sold (except for the investments in the Subsidiary) are determined on the basis of identified cost.
Indemnifications. The Fund’s organizational documents provide current and former trustees and officers with a limited indemnification against liabilities arising in connection with the performance of their duties to the Fund. In the normal course of business, the Fund may also enter into contracts that provide general indemnifications. The Fund’s maximum exposure under these arrangements is unknown as this would be dependent on future claims that may be made against the Fund. The risk of material loss from such claims is considered remote.
Other. The preparation of financial statements in conformity with accounting principles generally accepted in the United States of America requires management to make estimates and assumptions that affect the reported amounts of assets and liabilities and
38 | OPPENHEIMER GOLD & SPECIAL MINERALS FUND
|
disclosure of contingent assets and liabilities at the date of the financial statements and the reported amounts of increases and decreases in net assets from operations during the reporting period. Actual results could differ from those estimates.
2. Securities Valuation
The Fund calculates the net asset value of its shares as of the close of the New York Stock Exchange (the “Exchange”), normally 4:00 P.M. Eastern time, on each day the Exchange is open for trading.
The Fund’s Board has adopted procedures for the valuation of the Fund’s securities and has delegated the day-to-day responsibility for valuation determinations under those procedures to the Manager. The Manager has established a Valuation Committee which is responsible for determining a “fair valuation” for any security for which market quotations are not “readily available.” The Valuation Committee’s fair valuation determinations are subject to review, approval and ratification by the Fund’s Board at its next regularly scheduled meeting covering the calendar quarter in which the fair valuation was determined.
Valuation Methods and Inputs
Securities are valued using unadjusted quoted market prices, when available, as supplied primarily by third party pricing services or dealers.
The following methodologies are used to determine the market value or the fair value of the types of securities described below:
Securities traded on a registered U.S. securities exchange (including exchange-traded derivatives other than futures and futures options) are valued based on the last sale price of the security reported on the principal exchange on which it is traded, prior to the time when the Fund’s assets are valued. In the absence of a sale, the security is valued at the last sale price on the prior trading day, if it is within the spread of the current day’s closing “bid” and “asked” prices, and if not, at the current day’s closing bid price. A security of a foreign issuer traded on a foreign exchange but not listed on a registered U.S. securities exchange is valued based on the last sale price on the principal exchange on which the security is traded, as identified by the third party pricing service used by the Manager, prior to the time when the Fund’s assets are valued. If the last sale price is unavailable, the security is valued at the most recent official closing price on the principal exchange on which it is traded. If the last sales price or official closing price for a foreign security is not available, the security is valued at the mean between the bid and asked price per the exchange or, if not available from the exchange, obtained from two dealers. If bid and asked prices are not available from either the exchange or two dealers, the security is valued by using one of the following methodologies (listed in order of priority); (1) using a bid from the exchange, (2) the mean between the bid and asked price as provided by a single dealer, or (3) a bid from a single dealer.
Shares of a registered investment company that are not traded on an exchange are valued at that investment company’s net asset value per share.
39 | OPPENHEIMER GOLD & SPECIAL MINERALS FUND
|
NOTES TO FINANCIAL STATEMENTS Continued
2. Securities Valuation Continued
Corporate and government debt securities (of U.S. or foreign issuers) and municipal debt securities, event-linked bonds, loans, mortgage-backed securities, collateralized mortgage obligations, and asset-backed securities are valued at the mean between the “bid” and “asked” prices utilizing evaluated prices obtained from third party pricing services or broker-dealers who may use matrix pricing methods to determine the evaluated prices.
Short-term money market type debt securities with a remaining maturity of sixty days or less are valued at cost adjusted by the amortization of discount or premium to maturity (amortized cost), which approximates market value. Short-term debt securities with a remaining maturity in excess of sixty days are valued at the mean between the “bid” and “asked” prices utilizing evaluated prices obtained from third party pricing services or broker-dealers.
Forward foreign currency exchange contracts are valued utilizing current and forward currency rates obtained from third party pricing services. When the settlement date of a contract is an interim date for which a quotation is not available, interpolated values are derived using the nearest dated forward currency rate.
A description of the standard inputs that may generally be considered by the third party pricing vendors in determining their evaluated prices is provided below.
| | |
| Security Type | | Standard Inputs Generally Considered by Third-Party Pricing Vendors |
| Corporate debt, government debt, municipal, mortgage-backed and asset-backed securities | | Reported trade data, broker-dealer price quotations, benchmark yields, issuer spreads on comparable securities, the credit quality, yield, maturity, and other appropriate factors. |
| Loans | | Information obtained from market participants regarding reported trade data and broker-dealer price quotations. |
| Event-linked bonds | | Information obtained from market participants regarding reported trade data and broker-dealer price quotations. |
If a market value or price cannot be determined for a security using the methodologies described above, or if, in the “good faith” opinion of the Manager, the market value or price obtained does not constitute a “readily available market quotation,” or a significant event has occurred that would materially affect the value of the security the security is fair valued either (i) by a standardized fair valuation methodology applicable to the security type or the significant event as previously approved by the Valuation Committee and the Fund’s Board or (ii) as determined in good faith by the Manager’s Valuation Committee. The Valuation Committee considers all relevant facts that are reasonably available, through either public information or information available to the Manager, when determining the fair value of a security. Fair value determinations by the Manager are subject to review, approval and ratification by the Fund’s Board at its next regularly scheduled meeting covering the calendar quarter in which the fair valuation was determined. Those fair valuation standardized methodologies include, but are not limited to, valuing securities at the last sale price or initially at cost and subsequently adjusting the value based on: changes in company specific fundamentals, changes in an appropriate securities index, or
40 | OPPENHEIMER GOLD & SPECIAL MINERALS FUND
|
changes in the value of similar securities which may be further adjusted for any discounts related to security-specific resale restrictions. When possible, such methodologies use observable market inputs such as unadjusted quoted prices of similar securities, observable interest rates, currency rates and yield curves. The methodologies used for valuing securities are not necessarily an indication of the risks associated with investing in those securities nor can it be assured that the Fund can obtain the fair value assigned to a security if it were to sell the security.
To assess the continuing appropriateness of security valuations, the Manager, or its third party service provider who is subject to oversight by the Manager, regularly compares prior day prices, prices on comparable securities, and sale prices to the current day prices and challenges those prices exceeding certain tolerance levels with the third party pricing service or broker source. For those securities valued by fair valuations, whether through a standardized fair valuation methodology or a fair valuation determination, the Valuation Committee reviews and affirms the reasonableness of the valuations based on such methodologies and fair valuation determinations on a regular basis after considering all relevant information that is reasonably available.
Classifications
Each investment asset or liability of the Fund is assigned a level at measurement date based on the significance and source of the inputs to its valuation. Various data inputs are used in determining the value of each of the Fund’s investments as of the reporting period end. These data inputs are categorized in the following hierarchy under applicable financial accounting standards:
1) Level 1—unadjusted quoted prices in active markets for identical assets or liabilities (including securities actively traded on a securities exchange)
2) Level 2—inputs other than unadjusted quoted prices that are observable for the asset or liability (such as unadjusted quoted prices for similar assets and market corroborated inputs such as interest rates, prepayment speeds, credit risks, etc.)
3) Level 3—significant unobservable inputs (including the Manager’s own judgments about assumptions that market participants would use in pricing the asset or liability).
The inputs used for valuing securities are not necessarily an indication of the risks associated with investing in those securities.
41 | OPPENHEIMER GOLD & SPECIAL MINERALS FUND
|
NOTES TO FINANCIAL STATEMENTS Continued
2. Securities Valuation Continued
The table below categorizes amounts that are included in the Fund’s Statement of Assets and Liabilities as of June 29, 2012 based on valuation input level:
| | | | | | | | | | | | | | | | |
| | | Level 1—
Unadjusted
Quoted Prices | | | Level 2—
Other Significant
Observable Inputs | | | Level 3—
Significant
Unobservable
Inputs | | | Value | |
| Assets Table | | | | | | | | | | | | | | | | |
| Investments, at Value: | | | | | | | | | | | | | | | | |
| Wholly-Owned Subsidiary | | $ | — | | | $ | 150,751,769 | | | $ | — | | | $ | 150,751,769 | |
| Common Stocks | | | | | | | | | | | | | | | | |
Energy | | | 9,100,906 | | | | — | | | | — | | | | 9,100,906 | |
Materials | | | 2,584,783,977 | | | | 186,585,099 | | | | 3,563,209 | | | | 2,774,932,285 | |
| Rights, Warrants and Certificates | | | 210,404 | | | | — | | | | — | | | | 210,404 | |
| Investment Company | | | 6,319,454 | | | | — | | | | — | | | | 6,319,454 | |
| | |
|
|
|
| Total Assets | | $ | 2,600,414,741 | | | $ | 337,336,868 | | | $ | 3,563,209 | | | $ | 2,941,314,818 | |
| | |
|
|
|
| | | | |
| Liabilities Table | | | | | | | | | | | | | | | | |
| Other Financial Instruments: | | | | | | | | | | | | | | | | |
| Appreciated options written, at value | | $ | (2,521,462 | ) | | $ | — | | | $ | — | | | $ | (2,521,462 | ) |
| Depreciated options written, at value | | | (7,159,000 | ) | | | — | | | | — | | | | (7,159,000 | ) |
| Foreign currency exchange contracts | | | — | | | | (8,689 | ) | | | — | | | | (8,689 | ) |
| | |
|
|
|
| Total Liabilities | | $ | (9,680,462 | ) | | $ | (8,689 | ) | | $ | — | | | $ | (9,689,151 | ) |
| | |
|
|
|
Currency contracts and forwards, if any, are reported at their unrealized appreciation/depreciation at measurement date, which represents the change in the contract’s value from trade date. Futures, if any, are reported at their variation margin at measurement date, which represents the amount due to/from the Fund at that date. All additional assets and liabilities included in the above table are reported at their market value at measurement date.
The table below shows the significant transfers between Level 1 and Level 2. The Fund’s policy is to recognize transfers in and transfers out as of the beginning of the reporting period.
| | | | | | | | |
| | | Transfers out of Level 1* | | | Transfers into Level 2* | |
| Assets Table | | | | | | | | |
| Investments, at Value: | | | | | | | | |
| Common Stocks | | | | | | | | |
Materials | | $ | (9,746,019 | ) | | $ | 9,746,019 | |
| | |
|
|
|
| Total Assets | | $ | (9,746,019 | ) | | $ | 9,746,019 | |
| | |
|
|
|
*Transferred from Level 1 to Level 2 because of the absence of a readily available unadjusted quoted market price due to a significant event occurring before the Fund’s assets were valued but after the close of the securities’ respective exchanges.
There have been no significant changes to the fair valuation methodologies of the Fund during the period.
The net asset value per share of the Subsidiary is determined as of the close of the Exchange, on each day the Exchange is open for trading. The net asset value per share is determined by dividing the value of the Subsidiary’s net assets by the number of shares that are outstanding. The Subsidiary values its investments in the same manner as the Fund as described above.
42 | OPPENHEIMER GOLD & SPECIAL MINERALS FUND
|
3. Shares of Beneficial Interest
The Fund has authorized an unlimited number of no par value shares of beneficial interest of each class. Transactions in shares of beneficial interest were as follows:
| | | | | | | | | | | | | | | | |
| | | Year Ended June 29, 2012 | | | Year Ended June 30, 20111 | |
| | | Shares | | | Amount | | | Shares | | | Amount | |
| Class A | | | | | | | | | | | | | | | | |
| Sold | | | 20,958,385 | | | $ | 835,924,699 | | | | 35,306,719 | | | $ | 1,654,658,860 | |
Dividends and/or
distributions reinvested | | | 3,441,415 | | | | 121,757,573 | | | | 5,521,055 | | | | 268,488,537 | |
| Redeemed | | | (39,199,153 | ) | | | (1,589,982,287 | ) | | | (33,491,892 | ) | | | (1,565,886,287 | ) |
| | |
|
|
|
| Net increase (decrease) | | | (14,799,353 | ) | | $ | (632,300,015 | ) | | | 7,335,882 | | | $ | 357,261,110 | |
| | |
|
|
|
| | | | | | | | | | | | | | | | | |
| Class B | | | | | | | | | | | | | | | | |
| Sold | | | 720,014 | | | $ | 26,853,010 | | | | 1,121,235 | | | $ | 50,449,505 | |
Dividends and/or
distributions reinvested | | | 203,537 | | | | 6,873,440 | | | | 369,042 | | | | 17,116,156 | |
| Redeemed | | | (1,516,887 | ) | | | (55,964,874 | ) | | | (1,369,311 | ) | | | (60,672,330 | ) |
| | |
|
|
|
| Net increase (decrease) | | | (593,336 | ) | | $ | (22,238,424 | ) | | | 120,966 | | | $ | 6,893,331 | |
| | |
|
|
|
| | | | | | | | | | | | | | | | | |
| Class C | | | | | | | | | | | | | | | | |
| Sold | | | 3,963,948 | | | $ | 147,928,177 | | | | 5,160,896 | | | $ | 232,029,649 | |
Dividends and/or
distributions reinvested | | | 769,666 | | | | 25,745,334 | | | | 1,154,815 | | | | 53,156,150 | |
| Redeemed | | | (4,620,892 | ) | | | (168,666,362 | ) | | | (3,832,423 | ) | | | (169,025,618 | ) |
| | |
|
|
|
| Net increase | | | 112,722 | | | $ | 5,007,149 | | | | 2,483,288 | | | $ | 116,160,181 | |
| | |
|
|
|
| | | | | | | | | | | | | | | | | |
| Class N | | | | | | | | | | | | | | | | |
| Sold | | | 3,453,805 | | | $ | 131,085,946 | | | | 3,849,915 | | | $ | 175,742,106 | |
Dividends and/or
distributions reinvested | | | 403,337 | | | | 13,809,943 | | | | 517,587 | | | | 24,378,323 | |
| Redeemed | | | (2,845,550 | ) | | | (107,741,690 | ) | | | (2,373,526 | ) | | | (107,534,649 | ) |
| | |
|
|
|
| Net increase | | | 1,011,592 | | | $ | 37,154,199 | | | | 1,993,976 | | | $ | 92,585,780 | |
| | |
|
|
|
| | | | | | | | | | | | | | | | | |
| Class Y | | | | | | | | | | | | | | | | |
| Sold | | | 22,845,326 | | | $ | 918,049,864 | | | | 5,710,742 | | | $ | 276,643,602 | |
Dividends and/or
distributions reinvested | | | 245,220 | | | | 8,626,852 | | | | 115,881 | | | | 5,606,301 | |
| Redeemed | | | (7,184,951 | ) | | | (259,586,228 | ) | | | (880,910 | ) | | | (40,518,755 | ) |
| | |
|
|
|
| Net increase | | | 15,905,595 | | | $ | 667,090,488 | | | | 4,945,713 | | | $ | 241,731,148 | |
| | |
|
|
|
1. For the year ended June 30, 2011, for Class A, Class B, Class C and Class N shares, and for the period from September 7, 2010 (inception of offering) to June 30, 2011, for Class Y shares.
4. Purchases and Sales of Securities
The aggregate cost of purchases and proceeds from sales of securities, other than short-term obligations and investments in the Subsidiary and IMMF, for the year ended June 29, 2012, were as follows:
| | | | | | | | |
| | | Purchases | | | Sales | |
| Investment securities | | $ | 1,694,653,430 | | | $ | 1,851,255,397 | |
43 | OPPENHEIMER GOLD & SPECIAL MINERALS FUND
|
NOTES TO FINANCIAL STATEMENTS Continued
5. Fees and Other Transactions with Affiliates
Management Fees. Under the investment advisory agreement, the Fund pays the Manager a management fee based on the daily net assets of the Fund at an annual rate as shown in the following table:
| | | | | | | | | | | | |
| Fee Schedule Effective October 1, 2011 | | | | | Fee Schedule Thru Sept. 30, 2011 | |
| Up to $200 million | | | 0.75 | % | | | | Up to $200 million | | | 0.75 | % |
| Next $200 million | | | 0.72 | | | | | Next $200 million | | | 0.72 | |
| Next $200 million | | | 0.69 | | | | | Next $200 million | | | 0.69 | |
| Next $200 million | | | 0.66 | | | | | Next $200 million | | | 0.66 | |
| Next $2.2 billion | | | 0.60 | | | | | Next $2.2 billion | | | 0.60 | |
| Next $1 billion | | | 0.59 | | | | | Next $1 billion | | | 0.59 | |
| Next $2 billion | | | 0.58 | | | | | Over $4 billion | | | 0.58 | |
| Next $4 billion | | | 0.57 | | | | | | | | | |
| Over $10 billion | | | 0.56 | | | | | | | | | |
Administration Service Fees. The Fund pays the Manager a fee of $1,500 per year for preparing and filing the Fund’s tax returns.
Transfer Agent Fees. OppenheimerFunds Services (“OFS”), a division of the Manager, acts as the transfer and shareholder servicing agent for the Fund. The Fund pays OFS a per account fee. For the year ended June 29, 2012, the Fund paid $11,587,147 to OFS for services to the Fund.
Additionally, Class Y shares are subject to minimum fees of $10,000 annually for assets of $10 million or more. The Class Y shares are subject to the minimum fees in the event that the per account fee does not equal or exceed the applicable minimum fees. OFS may voluntarily waive the minimum fees.
Distribution and Service Plan (12b-1) Fees. Under its General Distributor’s Agreement with the Fund, OppenheimerFunds Distributor, Inc. (the “Distributor”) acts as the Fund’s principal underwriter in the continuous public offering of the Fund’s classes of shares.
Service Plan for Class A Shares. The Fund has adopted a Service Plan (the “Plan”) for Class A shares under Rule 12b-1 of the Investment Company Act of 1940. Under the Plan, the Fund reimburses the Distributor for a portion of its costs incurred for services provided to accounts that hold Class A shares. Reimbursement is made periodically at an annual rate of up to 0.25% of the daily net assets of Class A shares of the Fund. The Distributor currently uses all of those fees to pay dealers, brokers, banks and other financial institutions periodically for providing personal service and maintenance of accounts of their customers that hold Class A shares. Any unreimbursed expenses the Distributor incurs with respect to Class A shares in any fiscal year cannot be recovered in subsequent periods. Fees incurred by the Fund under the Plan are detailed in the Statement of Operations.
Distribution and Service Plans for Class B, Class C and Class N Shares. The Fund has adopted Distribution and Service Plans (the “Plans”) for Class B, Class C and Class N shares under Rule 12b-1 of the Investment Company Act of 1940 to compensate the Distributor for its services in connection with the distribution of those shares and servicing accounts.
44 | OPPENHEIMER GOLD & SPECIAL MINERALS FUND
|
Under the Plans, the Fund pays the Distributor an annual asset-based sales charge of 0.75% on Class B and Class C shares daily net assets and 0.25% on Class N shares daily net assets. The Distributor also receives a service fee of 0.25% per year under each plan. If either the Class B, Class C or Class N plan is terminated by the Fund or by the shareholders of a class, the Board of Trustees and its independent trustees must determine whether the Distributor shall be entitled to payment from the Fund of all or a portion of the service fee and/or asset-based sales charge in respect to shares sold prior to the effective date of such termination. Fees incurred by the Fund under the Plans are detailed in the Statement of Operations. The Distributor determines its uncompensated expenses under the Plans at calendar quarter ends. The Distributor’s aggregate uncompensated expenses under the Plans at June 29, 2012 were as follows:
| | | | |
| Class B | | $ | 467,861 | |
| Class C | | | 6,948,650 | |
| Class N | | | 3,334,600 | |
Sales Charges. Front-end sales charges and contingent deferred sales charges (“CDSC”) do not represent expenses of the Fund. They are deducted from the proceeds of sales of Fund shares prior to investment or from redemption proceeds prior to remittance, as applicable. The sales charges retained by the Distributor from the sale of shares and the CDSC retained by the Distributor on the redemption of shares is shown in the following table for the period indicated.
| | | | | | | | | | | | | | | | | | | | |
| Year Ended | | Class A Front-End
Sales Charges
Retained by
Distributor | | | Class A
Contingent
Deferred
Sales Charges
Retained by
Distributor | | | Class B Contingent
Deferred
Sales Charges
Retained by
Distributor | | | Class C
Contingent
Deferred
Sales Charges
Retained by
Distributor | | | Class N
Contingent
Deferred
Sales Charges
Retained by
Distributor | |
| June 29, 2012 | | $ | 704,933 | | | $ | 70,502 | | | $ | 350,526 | | | $ | 133,383 | | | $ | 2,486 | |
Waivers and Reimbursements of Expenses. The Manager has contractually agreed to waive the management fee it receives from the Fund in an amount equal to the management fee it receives from the Subsidiary. This undertaking will continue in effect for so long as the Fund invests in the Subsidiary and may not be terminated unless approved by the Fund’s Board of Trustees. During the year ended June 29, 2012, the Manager waived $632,688.
The Manager will waive fees and/or reimburse Fund expenses in an amount equal to the indirect management fees incurred through the Fund’s investment in IMMF. During the year ended June 29, 2012, the Manager waived fees and/or reimbursed the Fund $17,634 for IMMF management fees.
OFS has voluntarily agreed to limit transfer and shareholder servicing agent fees for Classes B, C, N and Y shares to 0.35% of average annual net assets per class; this limit also applied to Class A shares prior to September 1, 2011. Effective September 1, 2011, OFS has voluntarily agreed to limit its fees for Class A shares to 0.30% of average annual net assets of the class.
45 | OPPENHEIMER GOLD & SPECIAL MINERALS FUND
|
NOTES TO FINANCIAL STATEMENTS Continued
5. Fees and Other Transactions with Affiliates Continued
During the year ended June 29, 2012, OFS waived transfer and shareholder servicing agent fees as follows:
| | | | |
| Class N | | $ | 10,574 | |
| Class Y | | | 50,939 | |
Some of these undertakings may be modified or terminated at any time; some may not be modified or terminated until after one year from the date of the current prospectus, as indicated therein.
6. Risk Exposures and the Use of Derivative Instruments
The Fund’s investment objectives not only permit the Fund to purchase investment securities, they also allow the Fund to enter into various types of derivatives contracts, including, but not limited to, futures contracts, forward foreign currency exchange contracts, credit default swaps, interest rate swaps, total return swaps, and purchased and written options. In doing so, the Fund will employ strategies in differing combinations to permit it to increase, decrease, or change the level or types of exposure to market risk factors. Central to those strategies are features inherent to derivatives that make them more attractive for this purpose than equity and debt securities: they require little or no initial cash investment, they can focus exposure on only certain selected risk factors, and they may not require the ultimate receipt or delivery of the underlying security (or securities) to the contract. This may allow the Fund to pursue its objectives more quickly and efficiently than if it were to make direct purchases or sales of securities capable of effecting a similar response to market factors.
Market Risk Factors. In accordance with its investment objectives, the Fund may use derivatives to increase or decrease its exposure to one or more of the following market risk factors:
Commodity Risk. Commodity risk relates to the change in value of commodities or commodity indexes as they relate to increases or decreases in the commodities market. Commodities are physical assets that have tangible properties. Examples of these types of assets are crude oil, heating oil, metals, livestock, and agricultural products.
Credit Risk. Credit risk relates to the ability of the issuer to meet interest and principal payments, or both, as they come due. In general, lower-grade, higher-yield bonds are subject to credit risk to a greater extent than lower-yield, higher-quality bonds.
Equity Risk. Equity risk relates to the change in value of equity securities as they relate to increases or decreases in the general market.
Foreign Exchange Rate Risk. Foreign exchange rate risk relates to the change in the U.S. dollar value of a security held that is denominated in a foreign currency. The U.S. dollar value of a foreign currency denominated security will decrease as the dollar appreciates against the currency, while the U.S. dollar value will increase as the dollar depreciates against the currency.
Interest Rate Risk. Interest rate risk refers to the fluctuations in value of fixed-income securities resulting from the inverse relationship between price and yield. For example,
46 | OPPENHEIMER GOLD & SPECIAL MINERALS FUND
|
an increase in general interest rates will tend to reduce the market value of already issued fixed-income investments, and a decline in general interest rates will tend to increase their value. In addition, debt securities with longer maturities, which tend to have higher yields, are subject to potentially greater fluctuations in value from changes in interest rates than obligations with shorter maturities.
Volatility Risk. Volatility risk refers to the magnitude of the movement, but not the direction of the movement, in a financial instrument’s price over a defined time period. Large increases or decreases in a financial instrument’s price over a relative time period typically indicate greater volatility risk, while small increases or decreases in its price typically indicate lower volatility risk.
The Fund’s actual exposures to these market risk factors during the period are discussed in further detail, by derivative type, below.
Risks of Investing in Derivatives. The Fund’s use of derivatives can result in losses due to unanticipated changes in the market risk factors and the overall market. In instances where the Fund is using derivatives to decrease, or hedge, exposures to market risk factors for securities held by the Fund, there are also risks that those derivatives may not perform as expected resulting in losses for the combined or hedged positions.
Derivatives may have little or no initial cash investment relative to their market value exposure and therefore can produce significant gains or losses in excess of their cost. This use of embedded leverage allows the Fund to increase its market value exposure relative to its net assets and can substantially increase the volatility of the Fund’s performance.
Additional associated risks from investing in derivatives also exist and potentially could have significant effects on the valuation of the derivative and the Fund. Typically, the associated risks are not the risks that the Fund is attempting to increase or decrease exposure to, per its investment objectives, but are the additional risks from investing in derivatives. Examples of these associated risks are liquidity risk, which is the risk that the Fund will not be able to sell the derivative in the open market in a timely manner, and counterparty credit risk, which is the risk that the counterparty will not fulfill its obligation to the Fund. Associated risks can be different for each type of derivative and are discussed by each derivative type in the notes that follow.
Counterparty Credit Risk. Certain derivative positions are subject to counterparty credit risk, which is the risk that the counterparty will not fulfill its obligation to the Fund. The Fund’s derivative counterparties are financial institutions who are subject to market conditions that may weaken their financial position. The Fund intends to enter into financial transactions with counterparties that the Manager believes to be creditworthy at the time of the transaction.
Credit Related Contingent Features. The Fund’s agreements with derivative counterparties have several credit related contingent features that if triggered would allow its derivatives counterparties to close out and demand payment or additional collateral to cover their exposure from the Fund. Credit related contingent features are established between the Fund and its derivatives counterparties to reduce the risk that
47 | OPPENHEIMER GOLD & SPECIAL MINERALS FUND
|
NOTES TO FINANCIAL STATEMENTS Continued
6. Risk Exposures and the Use of Derivative Instruments Continued
the Fund will not fulfill its payment obligations to its counterparties. These triggering features include, but are not limited to, a percentage decrease in the Fund’s net assets and or a percentage decrease in the Fund’s Net Asset Value or NAV. The contingent features are established within the Fund’s International Swap and Derivatives Association, Inc. master agreements which govern certain positions in swaps, over-the-counter options and swaptions, and forward currency exchange contracts for each individual counterparty.
Valuations of derivative instruments as of June 29, 2012 are as follows:
| | | | | | |
| Liability Derivatives | |
Derivatives Not Accounted
for as Hedging Instruments | | Statement of Assets and
Liabilities Location | | Value | |
| Foreign exchange contracts | | Unrealized depreciation on foreign currency exchange contracts | | $ | 8,689 | |
| Equity contracts | | Appreciated options written, at value | | | 2,521,462 | |
| Equity contracts | | Depreciated options written, at value | | | 7,159,000 | |
| | | | |
|
|
|
| Total | | | | $ | 9,689,151 | |
| | | | |
|
|
|
The effect of derivative instruments on the Statement of Operations is as follows:
| | | | | | | | | | | | | | | | |
| Amount of Realized Gain or (Loss) Recognized on Derivatives | |
Derivatives
Not Accounted
for as Hedging
Instruments | | Investments
from unaffiliated
companies (including
premiums on
options exercised)* | | | Closing and
expiration
of option
contracts
written | | | Foreign
currency
transactions | | | Total | |
| Equity contracts | | $ | 7,205,091 | | | $ | 25,419,163 | | | $ | — | | | $ | 32,624,254 | |
| Foreign exchange contracts | | | — | | | | — | | | | 1,346,565 | | | | 1,346,565 | |
| | |
|
|
|
| Total | | $ | 7,205,091 | | | $ | 25,419,163 | | | $ | 1,346,565 | | | $ | 33,970,819 | |
| | |
|
|
|
*Includes purchased option contracts, purchased swaption contracts and written option contracts exercised, if any.
| | | | | | | | | | | | |
| Amount of Change in Unrealized Gain or (Loss) Recognized on Derivatives | |
Derivatives Not Accounted
for as Hedging Instruments | | Option
contracts
written | | | Translation
of assets and
liabilities
denominated
in foreign
currencies | | | Total | |
| Equity contracts | | $ | (4,129,166 | ) | | $ | — | | | $ | (4,129,166 | ) |
| Foreign exchange contracts | | | — | | | | 57,525 | | | | 57,525 | |
| | |
|
|
|
| Total | | $ | (4,129,166 | ) | | $ | 57,525 | | | $ | (4,071,641 | ) |
| | |
|
|
|
Foreign Currency Exchange Contracts
The Fund may enter into foreign currency exchange contracts (“forward contracts”) for the purchase or sale of a foreign currency at a negotiated rate at a future date.
48 | OPPENHEIMER GOLD & SPECIAL MINERALS FUND
|
Forward contracts are reported on a schedule following the Statement of Investments. The unrealized appreciation (depreciation) is reported in the Statement of Assets and Liabilities as a receivable or payable and in the Statement of Operations within the change in unrealized appreciation (depreciation). At contract close, the difference between the original cost of the contract and the value at the close date is recorded as a realized gain (loss) in the Statement of Operations.
The Fund has purchased and sold certain forward foreign currency exchange contracts of different currencies in order to acquire currencies to pay for or sell currencies to acquire related foreign securities purchase and sale transactions, respectively, or to convert foreign currencies to U.S. dollars from related foreign securities transactions. These foreign currency exchange contracts are negotiated at the current spot exchange rate with settlement typically within two business days thereafter.
During the year ended June 29, 2012, the Fund had daily average contract amounts on forward foreign currency contracts to buy and sell of $7,256,553 and $8,702,275, respectively.
Additional associated risk to the Fund includes counterparty credit risk. Counterparty credit risk arises from the possibility that the counterparty will default.
Option Activity
The Fund may buy and sell put and call options, or write put and call options. When an option is written, the Fund receives a premium and becomes obligated to sell or purchase the underlying security at a fixed price, upon exercise of the option.
Options are valued daily based upon the last sale price on the principal exchange on which the option is traded. The difference between the premium received or paid, and market value of the option, is recorded as unrealized appreciation or depreciation. The net change in unrealized appreciation or depreciation is reported in the Statement of Operations. When an option is exercised, the cost of the security purchased or the proceeds of the security sale are adjusted by the amount of premium received or paid. Upon the expiration or closing of the option transaction, a gain or loss is reported in the Statement of Operations.
Options written, if any, are reported in a schedule following the Statement of Investments and as a liability in the Statement of Assets and Liabilities. Securities held in collateralized accounts to cover potential obligations with respect to outstanding written options are noted in the Statement of Investments.
The risk in writing a call option is that the Fund gives up the opportunity for profit if the market price of the security increases and the option is exercised. The risk in writing a put option is that the Fund may incur a loss if the market price of the security decreases and the option is exercised. The risk in buying an option is that the Fund pays a premium whether or not the option is exercised. The Fund also has the additional risk that there may be an illiquid market where the Fund is unable to close the contract.
The Fund has written put options on individual equity securities and/or equity indexes to increase exposure to equity risk. A written put option becomes more valuable as the price of the underlying financial instrument appreciates relative to the strike price.
49 | OPPENHEIMER GOLD & SPECIAL MINERALS FUND
|
NOTES TO FINANCIAL STATEMENTS Continued
6. Risk Exposures and the Use of Derivative Instruments Continued
The Fund has written call options on individual equity securities and/or equity indexes to decrease exposure to equity risk. A written call option becomes more valuable as the price of the underlying financial instrument depreciates relative to the strike price.
During the year ended June 29, 2012, the Fund had an ending monthly average market value of $4,887,041 and $6,320,900 on written call options and written put options, respectively.
Additional associated risks to the Fund include counterparty credit risk for over-the-counter options and liquidity risk.
Written option activity for the year ended June 29, 2012 was as follows:
| | | | | | | | | | | | | | | | |
| | | Call Options
| | | Put Options
| |
| | | Number of
Contracts | | | Amount of
Premiums | | | Number of
Contracts | | | Amount of
Premiums | |
| Options outstanding as of | | | | | | | | | | | | | | | | |
| June 30, 2011 | | | 72,000 | | | $ | 9,166,073 | | | | 94,500 | | | $ | 11,825,430 | |
| Options written | | | 147,000 | | | | 17,550,752 | | | | 120,000 | | | | 14,688,757 | |
| Options closed or expired | | | (151,000 | ) | | | (17,971,829 | ) | | | (153,955 | ) | | | (18,948,029 | ) |
| Options exercised | | | (23,000 | ) | | | (3,199,878 | ) | | | (32,545 | ) | | | (4,005,213 | ) |
| | |
|
|
|
| Options outstanding as of June 29, 2012 | | | 45,000 | | | $ | 5,545,118 | | | | 28,000 | | | $ | 3,560,945 | |
| | |
|
|
|
7. Pending Litigation
Since 2009, a number of class action, derivative and individual lawsuits have been pending in federal and state courts against OppenheimerFunds, Inc., the Fund’s investment advisor (the “Manager”), OppenheimerFunds Distributor, Inc., the Fund’s principal underwriter and distributor (the “Distributor”), and certain funds (but not including the Fund) advised by the Manager and distributed by the Distributor (the “Defendant Funds”). Several of these lawsuits also name as defendants certain officers and current and former trustees of the respective Defendant Funds. The lawsuits raise claims under federal securities laws and various states’ securities, consumer protection and common law and allege, among other things, that the disclosure documents of the respective Defendant Funds contained misrepresentations and omissions and that the respective Defendant Funds’ investment policies were not followed. The plaintiffs in these actions seek unspecified damages, equitable relief and awards of attorneys’ fees and litigation expenses.
Other class action and individual lawsuits have been filed since 2008 in various state and federal courts against the Manager and certain of its affiliates by investors seeking to recover investments they allegedly lost as a result of the “Ponzi” scheme run by Bernard L. Madoff and his firm, Bernard L. Madoff Investment Securities, LLC (“BLMIS”). Plaintiffs in these suits allege that they suffered losses as a result of their investments in several funds managed by an affiliate of the Manager and assert a variety of claims, including breach of fiduciary duty, fraud, negligent misrepresentation, unjust enrichment, and violation of federal and state securities laws and regulations, among others. They seek unspecified
50 | OPPENHEIMER GOLD & SPECIAL MINERALS FUND
|
damages, equitable relief and awards of attorneys’ fees and litigation expenses. Neither the Distributor, nor any of the Oppenheimer mutual funds, their independent trustees or directors are named as defendants in these lawsuits. None of the Oppenheimer mutual funds invested in any funds or accounts managed by Madoff or BLMIS. On February 28, 2011, a stipulation of partial settlement of three groups of consolidated putative class action lawsuits relating to these matters was filed in the U.S. District Court for the Southern District of New York. On August 19, 2011, the court entered an order and final judgment approving the settlement as fair, reasonable and adequate. In September 2011, certain parties filed notices of appeal from the court’s order approving the settlement. On July 29, 2011, a stipulation of settlement between certain affiliates of the Manager and the Trustee appointed under the Securities Investor Protection Act to liquidate BLMIS was filed in the U.S. Bankruptcy Court for the Southern District of New York to resolve purported preference and fraudulent transfer claims by the Trustee. On September 22, 2011, the court entered an order approving the settlement as fair, reasonable and adequate. In October 2011, certain parties filed notices of appeal from the court’s order approving the settlement. The aforementioned settlements do not resolve other outstanding lawsuits against the Manager and its affiliates relating to BLMIS.
On April 16, 2010, a lawsuit was filed in New York state court against the Manager, an affiliate of the Manager and AAArdvark IV Funding Limited (“AAArdvark IV”), an entity advised by the Manager’s affiliate, in connection with investments made by the plaintiffs in AAArdvark IV. Plaintiffs allege breach of contract against the defendants and seek compensatory damages, costs and disbursements, including attorney fees. On July 15, 2011, a lawsuit was filed in New York state court against the Manager, an affiliate of the Manager and AAArdvark Funding Limited (“AAArdvark I”), an entity advised by the Manager’s affiliate, in connection with investments made by the plaintiffs in AAArdvark I. The complaint alleges breach of contract against the defendants and seeks compensatory damages, costs and disbursements, including attorney fees. On November 9, 2011, a lawsuit was filed in New York state court against the Manager, an affiliate of the Manager and AAArdvark XS Funding Limited (“AAArdvark XS”), an entity advised by the Manager’s affiliate, in connection with investments made by the plaintiffs in AAArdvark XS. The complaint alleges breach of contract against the defendants and seeks compensatory damages, costs and disbursements, including attorney fees.
The Manager believes the lawsuits and appeals described above are without legal merit and, with the exception of actions it has settled, is defending against them vigorously. The Defendant Funds’ Boards of Trustees have also engaged counsel to represent the Funds and the present and former Independent Trustees named in those suits. While it is premature to render any opinion as to the outcome in these lawsuits, or whether any costs that the Defendant Funds may bear in defending the suits might not be reimbursed by insurance, the Manager believes that these suits should not impair the ability of the Manager or the Distributor to perform their respective duties to the Fund, and that the outcome of all of the suits together should not have any material effect on the operations of any of the Oppenheimer mutual funds.
51 | OPPENHEIMER GOLD & SPECIAL MINERALS FUND
|
REPORT OF INDEPENDENT REGISTERED PUBLIC ACCOUNTING FIRM
The Board of Trustees and Shareholders of Oppenheimer Gold & Special Minerals Fund:
We have audited the accompanying statement of assets and liabilities of Oppenheimer Gold & Special Minerals Fund, including the statement of investments, as of June 29, 2012, and the related statement of operations for the year then ended, the statements of changes in net assets for each of the years in the two-year period then ended, and the financial highlights for each of the years or periods in the five-year period then ended. These financial statements and financial highlights are the responsibility of the Fund’s management. Our responsibility is to express an opinion on these financial statements and financial highlights based on our audits.
We conducted our audits in accordance with the standards of the Public Company Accounting Oversight Board (United States). Those standards require that we plan and perform the audit to obtain reasonable assurance about whether the financial statements and financial highlights are free of material misstatement. An audit includes examining, on a test basis, evidence supporting the amounts and disclosures in the financial statements. Our procedures included confirmation of securities owned as of June 29, 2012, by correspondence with the custodian, transfer agent and brokers, or by other appropriate auditing procedures where replies from brokers were not received. An audit also includes assessing the accounting principles used and significant estimates made by management, as well as evaluating the overall financial statement presentation. We believe that our audits provide a reasonable basis for our opinion.
In our opinion, the financial statements and financial highlights referred to above present fairly, in all material respects, the financial position of Oppenheimer Gold & Special Minerals Fund as of June 29, 2012, the results of its operations for the year then ended, the changes in its net assets for each of the years in the two-year period then ended, and the financial highlights for each of the years or periods in the five-year period then ended, in conformity with U.S. generally accepted accounting principles.
KPMGLLP
Denver, Colorado
August 16, 2012
52 | OPPENHEIMER GOLD & SPECIAL MINERALS FUND
|
FEDERAL INCOME TAX INFORMATION Unaudited
In early 2012, if applicable, shareholders of record received information regarding all dividends and distributions paid to them by the Fund during calendar year 2011.
Capital gain distributions of $1.77606 per share were paid to Class A, Class B, Class C, Class N and Class Y shareholders, respectively, on December 21, 2011. Whether received in stock or in cash, the capital gain distribution should be treated by shareholders as a gain from the sale of the capital assets held for more than one year (long-term capital gains).
None of the dividends paid by the Fund during the fiscal year ended June 29, 2012 are eligible for the corporate dividend-received deduction.
A portion, if any, of the dividends paid by the Fund during the fiscal year ended June 29, 2012 which are not designated as capital gain distributions are eligible for lower individual income tax rates to the extent that the Fund has received qualified dividend income as stipulated by recent tax legislation. The maximum amount allowable but not less than $27,229,066 of the Fund’s fiscal year taxable income may be eligible for the lower individual income tax rates. In early 2012, shareholders of record received information regarding the percentage of distributions that are eligible for lower individual income tax rates.
The foregoing information is presented to assist shareholders in reporting distributions received from the Fund to the Internal Revenue Service. Because of the complexity of the federal regulations which may affect your individual tax return and the many variations in state and local tax regulations, we recommend that you consult your tax advisor for specific guidance.
53 | OPPENHEIMER GOLD & SPECIAL MINERALS FUND
|
PORTFOLIO PROXY VOTING POLICIES AND PROCEDURES;
UPDATES TO STATEMENTS OF INVESTMENTS Unaudited
The Fund has adopted Portfolio Proxy Voting Policies and Procedures under which the Fund votes proxies relating to securities (“portfolio proxies”) held by the Fund. A description of the Fund’s Portfolio Proxy Voting Policies and Procedures is available (i) without charge, upon request, by calling the Fund toll-free at 1.800.CALL OPP (225.5677), (ii) on the Fund’s website at oppenheimerfunds.com, and (iii) on the SEC’s website at www.sec.gov. In addition, the Fund is required to file Form N-PX, with its complete proxy voting record for the 12 months ended June 30th, no later than August 31st of each year. The Fund’s voting record is available (i) without charge, upon request, by calling the Fund toll-free at 1.800.CALL OPP (225.5677), and (ii) in the Form N-PX filing on the SEC’s website at www.sec.gov.
The Fund files its complete schedule of portfolio holdings with the SEC for the first quarter and the third quarter of each fiscal year on Form N-Q. The Fund’s Form N-Q filings are available on the SEC’s website at www.sec.gov. Those forms may be reviewed and copied at the SEC’s Public Reference Room in Washington, D.C. Information on the operation of the Public Reference Room may be obtained by calling 1-800-SEC-0330.
Householding—Delivery of Shareholder Documents
This is to inform you about OppenheimerFunds’ “householding” policy. If more than one member of your household maintains an account in a particular fund, OppenheimerFunds will mail only one copy of the fund’s prospectus (or, if available, the fund’s summary prospectus), annual and semiannual report and privacy policy. The consolidation of these mailings, called householding, benefits your fund through reduced mailing expense, and benefits you by reducing the volume of mail you receive from OppenheimerFunds. Householding does not affect the delivery of your account statements.
Please note that we will continue to household these mailings for as long as you remain an OppenheimerFunds shareholder, unless you request otherwise. If you prefer to receive multiple copies of these materials, please call us at 1.800.CALL-OPP (225-5677). You may also notify us in writing or via email. We will begin sending you individual copies of the prospectus (or, if available, the summary prospectus), reports and privacy policy within 30 days of receiving your request to stop householding.
54 | OPPENHEIMER GOLD & SPECIAL MINERALS FUND
|
TRUSTEES AND OFFICERS
| | |
| Name, Position(s) Held with the Fund, Length of Service, Age | | Principal Occupation(s) During the Past 5 Years; Other Trusteeships/Directorships Held; Number of Portfolios in the Fund Complex Currently Overseen |
| |
| INDEPENDENT TRUSTEES | | The address of each Trustee in the chart below is 6803 S. Tucson Way, Centennial, Colorado 80112-3924. Each Trustee serves for an indefinite term, or until his or her resignation, retirement, death or removal. |
| |
Brian F. Wruble, Chairman of the Board of Trustees (since 2007), Trustee (since 2005) Age: 69 | | Director of Community Foundation of the Florida Keys (non-profit) (July 2012-June 2013); Chairman Emeritus and Non-Voting Trustee of The Jackson Laboratory (non-profit) (since August 2011); Director of Special Value Opportunities Fund, LLC (registered investment company) (affiliate of the Manager’s parent company) (since September 2004); Member of Zurich Financial Investment Management Advisory Council (insurance) (since 2004); Treasurer (since 2007) and Trustee of the Institute for Advanced Study (non-profit educational institute) (since May 1992); Chairman (August 2007-July 2011) and Trustee (August 1991-July 2011) of the Board of Trustees of The Jackson Laboratory (non-profit); General Partner of Odyssey Partners, L.P. (hedge fund) (September 1995-December 2007); Special Limited Partner of Odyssey Investment Partners, LLC (private equity investment) (January 1999-September 2004). Oversees 58 portfolios in the OppenheimerFunds complex. Mr. Wruble has served on the Boards of certain Oppenheimer funds since April 2001, during which time he has become familiar with the Fund’s (and other Oppenheimer funds’) financial, accounting, regulatory and investment matters and has contributed to the Boards’ deliberations. |
| |
David K. Downes, Trustee (since 2007) Age: 72 | | Director of THL Credit Inc. (since June 2009); Independent Chairman GSK Employee Benefit Trust (since April 2006); Trustee of Employee Trusts (since January 2006); Chief Executive Officer and Board Member of Community Capital Management (investment management company) (since January 2004); President of The Community Reinvestment Act Qualified Investment Fund (investment management company) (since 2004); Director of Internet Capital Group (information technology company) (since October 2003); Director of Correctnet (January 2006-2007); Independent Chairman of the Board of Trustees of Quaker Investment Trust (registered investment company) (2004-2007); Chief Operating Officer and Chief Financial Officer of Lincoln National Investment Companies, Inc. (subsidiary of Lincoln National Corporation, a publicly traded company) and Delaware Investments U.S., Inc. (investment management subsidiary of Lincoln National Corporation) (1993-2003); President, Chief Executive Officer and Trustee of Delaware Investment Family of Funds (1993-2003); President and Board Member of Lincoln National Convertible Securities Funds, Inc. and the Lincoln National Income Funds, TDC (1993-2003); Chairman and Chief Executive Officer of Retirement Financial Services, Inc. (registered transfer agent and investment adviser and subsidiary of Delaware Investments U.S., Inc.) (1993-2003); President and Chief Executive Officer of Delaware Service Company, Inc. (1995-2003); Chief Administrative Officer, Chief Financial Officer, Vice Chairman and Director of Equitable Capital Management Corporation (investment subsidiary of Equitable Life Assurance Society) (1985-1992); Corporate Controller of Merrill Lynch Company (financial services holding company) (1977-1985); held the following positions at the Colonial Penn Group, Inc. (insurance company): Corporate Budget Director (1974-1977), Assistant Treasurer (1972-1974) and Director of Corporate Taxes (1969-1972); held the following positions at Price Waterhouse Company (financial services firm): Tax Manager (1967-1969), Tax Senior (1965-1967) and Staff Accountant (1963-1965); United States Marine Corps (1957-1959). Oversees 58 portfolios in the OppenheimerFunds complex. Mr. Downes has served on the Boards of certain Oppenheimer funds since December 2005, during which time he has become familiar with the Fund’s (and other Oppenheimer funds’) financial, accounting, regulatory and investment matters and has contributed to the Boards’ deliberations. |
55 | OPPENHEIMER GOLD & SPECIAL MINERALS FUND
|
TRUSTEES AND OFFICERS Continued
| | |
Matthew P. Fink, Trustee (since 2005) Age: 71 | | Trustee of the Committee for Economic Development (policy research foundation) (2005-2011); Director of ICI Education Foundation (education foundation) (October 1991-August 2006); President of the Investment Company Institute (trade association) (October 1991-June 2004); Director of ICI Mutual Insurance Company (insurance company) (October 1991-June 2004); Author of The Rise of Mutual Funds: An Insider’s View published by Oxford University Press (second edition 2010). Oversees 58 portfolios in the OppenheimerFunds complex. Mr. Fink has served on the Boards of certain Oppenheimer funds since January 2005, during which time he has become familiar with the Fund’s (and other Oppenheimer funds’) financial, accounting, regulatory and investment matters and has contributed to the Boards’ deliberations. |
| |
Phillip A. Griffiths, Trustee (since 1999) Age: 73 | | Fellow of the Carnegie Corporation (since 2007); Member of the National Academy of Sciences (since 1979); Council on Foreign Relations (since 2002); Foreign Associate of Third World Academy of Sciences (since 2002); Chair of Science Initiative Group (since 1999); Member of the American Philosophical Society (since 1996); Trustee of Woodward Academy (since 1983); Director of GSI Lumonics Inc. (precision technology products company) (2001-2010); Senior Advisor of The Andrew W. Mellon Foundation (2001-2010); Distinguished Presidential Fellow for International Affairs of the National Academy of Science (2002-2010); Director of the Institute for Advanced Study (1991-2004); Director of Bankers Trust New York Corporation (1994-1999); Provost at Duke University (1983-1991). Oversees 58 portfolios in the OppenheimerFunds complex. Mr. Griffiths has served on the Boards of certain Oppenheimer funds since June 1999, during which time he has become familiar with the Fund’s (and other Oppenheimer funds’) financial, accounting, regulatory and investment matters and has contributed to the Boards’ deliberations. |
| |
Mary F. Miller, Trustee (since 2004) Age: 69 | | Trustee of International House (not-for-profit) (since June 2007); Trustee of the American Symphony Orchestra (not-for-profit) (October 1998-November 2011); and Senior Vice President and General Auditor of American Express Company (financial services company) (July 1998-February 2003). Oversees 58 portfolios in the OppenheimerFunds complex. Ms. Miller has served on the Boards of certain Oppenheimer funds since August 2004, during which time she has become familiar with the Fund’s (and other Oppenheimer funds’) financial, accounting, regulatory and investment matters and has contributed to the Boards’ deliberations. |
| |
Joel W. Motley, Trustee (since 2002) Age: 60 | | Director of Southern Africa Legal Services Foundation (since March 2012); Board Member of Pulitzer Center for Crisis Reporting (non-profit journalism) (since December 2010); Managing Director of Public Capital Advisors, LLC (privately-held financial advisor) (since January 2006); Managing Director of Carmona Motley, Inc. (privately-held financial advisor) (since January 2002); Director of Columbia Equity Financial Corp. (privately-held financial advisor) (2002-2007); Managing Director of Carmona Motley Hoffman Inc. (privately-held financial advisor) (January 1998-December 2001); Member of the Finance and Budget Committee of the Council on Foreign Relations, Chairman of the Investment Committee of the Episcopal Church of America, Member of the Investment Committee and Board of Human Rights Watch and Member of the Investment Committee and Board of Historic Hudson Valley. Oversees 58 portfolios in the OppenheimerFunds complex. Mr. Motley has served on the Boards of certain Oppenheimer funds since October 2002, during which time he has become familiar with the Fund’s (and other Oppenheimer funds’) financial, accounting, regulatory and investment matters and has contributed to the Boards’ deliberations. |
56 | OPPENHEIMER GOLD & SPECIAL MINERALS FUND
|
| | |
Mary Ann Tynan, Trustee (since 2008) Age: 66 | | Director and Secretary of the Appalachian Mountain Club (non-profit outdoor organization) (since January 2012); Director of Opera House Arts (non-profit arts organization) (since October 2011); Independent Director of the ICI Board of Governors (since October 2011); Vice Chair of Board of Trustees of Brigham and Women’s/Faulkner Hospitals (non-profit hospital) (since 2000); Chair of Board of Directors of Faulkner Hospital (non-profit hospital) (since 1990); Member of Audit and Compliance Committee of Partners Health Care System (non-profit) (since 2004); Board of Trustees of Middlesex School (educational institution) (since 1994); Board of Directors of Idealswork, Inc. (financial services provider) (since 2003); Partner, Senior Vice President and Director of Regulatory Affairs of Wellington Management Company, LLP (global investment manager) (1976-2002); Vice President and Corporate Secretary, John Hancock Advisers, Inc. (mutual fund investment adviser) (1970-1976). Oversees 58 portfolios in the OppenheimerFunds complex. Ms. Tynan has served on the Boards of certain Oppenheimer funds since October 2008, during which time she has become familiar with the Fund’s (and other Oppenheimer funds’) financial, accounting, regulatory and investment matters and has contributed to the Boards’ deliberations. |
| |
Joseph M. Wikler, Trustee (since 2005) Age: 71 | | Director of C-TASC (bio-statistics services) (2007-2012); formerly, Director of the following medical device companies: Medintec (1992-2011) and Cathco (1996-2011); Member of the Investment Committee of the Associated Jewish Charities of Baltimore (since 1994); Director of Lakes Environmental Association (environmental protection organization) (1996-2008); Director of Fortis/Hartford mutual funds (1994-December 2001). Oversees 58 portfolios in the OppenheimerFunds complex. Mr. Wikler has served on the Boards of certain Oppenheimer funds since August 2005, during which time he has become familiar with the Fund’s (and other Oppenheimer funds’) financial, accounting, regulatory and investment matters and has contributed to the Boards’ deliberations. |
| |
Peter I. Wold, Trustee (since 2005) Age: 64 | | Director of Arch Coal, Inc. (since 2010); Director and Chairman of Wyoming Enhanced Oil Recovery Institute Commission (enhanced oil recovery study) (since 2004); President of Wold Oil Properties, Inc. (oil and gas exploration and production company) (since 1994); Vice President of American Talc Company, Inc. (talc mining and milling) (since 1999); Managing Member of Hole-in-the-Wall Ranch (cattle ranching) (since 1979); Director and Chairman of the Denver Branch of the Federal Reserve Bank of Kansas City (1993-1999); and Director of PacifiCorp. (electric utility) (1995-1999). Oversees 58 portfolios in the OppenheimerFunds complex. Mr. Wold has served on the Boards of certain Oppenheimer funds since August 2005, during which time he has become familiar with the Fund’s (and other Oppenheimer funds’) financial, accounting, regulatory and investment matters and has contributed to the Boards’ deliberations. |
| OFFICERS OF THE FUND | | The addresses of the Officers in the chart below are as follows: for Messrs. Li, Glavin, Gabinet and Ms. Nasta, Two World Financial Center, 225 Liberty Street, New York, New York 10281-1008, for Messrs. Vandehey and Wixted, 6803 S. Tucson Way, Centennial, Colorado 80112-3924. Each Officer serves for an indefinite term or until his or her resignation, retirement, death or removal. |
| |
Shanquan Li, Vice President (since 1997) Age: 57 | | Senior Vice President of the Manager (since June 2011); Vice President of the Manager (November 1998-May 2011). An officer of 1 portfolio in the OppenheimerFunds complex. |
57 | OPPENHEIMER GOLD & SPECIAL MINERALS FUND
|
TRUSTEES AND OFFICERS Continued
| | |
William F. Glavin, Jr., President and Principal Executive Officer (since 2009) Age: 53 | | Chairman of the Manager (since December 2009); Chief Executive Officer and Director of the Manager (since January 2009); President of the Manager (since May 2009); Director of Oppenheimer Acquisition Corp. (“OAC”) (the Manager’s parent holding company) (since June 2009); Executive Vice President (March 2006-February 2009) and Chief Operating Officer (July 2007-February 2009) of Massachusetts Mutual Life Insurance Company (OAC’s parent company); Director (May 2004-March 2006) and Chief Operating Officer and Chief Compliance Officer (May 2004-January 2005), President (January 2005-March 2006) and Chief Executive Officer (June 2005-March 2006) of Babson Capital Management LLC; Director (March 2005-March 2006), President (May 2003-March 2006) and Chief Compliance Officer (July 2005-March 2006) of Babson Capital Securities, Inc. (a broker-dealer); President (May 2003-March 2006) of Babson Investment Company, Inc.; Director (May 2004-August 2006) of Babson Capital Europe Limited; Director (May 2004-October 2006) of Babson Capital Guernsey Limited; Director (May 2004-March 2006) of Babson Capital Management LLC; Non-Executive Director (March 2005-March 2007) of Baring Asset Management Limited; Director (February 2005-June 2006) Baring Pension Trustees Limited; Director and Treasurer (December 2003-November 2006) of Charter Oak Capital Management, Inc.; Director (May 2006-September 2006) of C.M. Benefit Insurance Company; Director (May 2008-June 2009) and Executive Vice President (June 2007-July 2009) of C.M. Life Insurance Company; President (March 2006-May 2007) of MassMutual Assignment Company; Director (January 2005-December 2006), Deputy Chairman (March 2005-December 2006) and President (February 2005-March 2005) of MassMutual Holdings (Bermuda) Limited; Director (May 2008-June 2009) and Executive Vice President (June 2007-July 2009) of MML Bay State Life Insurance Company; Chief Executive Officer and President (April 2007-January 2009) of MML Distributors, LLC; and Chairman (March 2006-December 2008) and Chief Executive Officer (May 2007-December 2008) of MML Investors Services, Inc. Oversees 63 portfolios as a Trustee/Director and 95 portfolios as an officer in the OppenheimerFunds complex. |
| |
Arthur S. Gabinet, Secretary and Chief Legal Officer (since 2011) Age: 54 | | Executive Vice President (since May 2010) and General Counsel (since January 2011) of the Manager; General Counsel of the Distributor (since January 2011); General Counsel of Centennial Asset Management Corporation (since January 2011); Executive Vice President and General Counsel of HarbourView Asset Management Corporation (since January 2011); Assistant Secretary (since January 2011) and Director (since January 2011) of OppenheimerFunds International Ltd. and OppenheimerFunds plc; Vice President and Director of Oppenheimer Partnership Holdings, Inc. (since January 2011); Director of Oppenheimer Real Asset Management, Inc. (since January 2011); Executive Vice President and General Counsel of Shareholder Financial Services, Inc. and Shareholder Services, Inc. (since January 2011); Executive Vice President and General Counsel of OFI Private Investments, Inc. (since January 2011); Vice President of OppenheimerFunds Legacy Program (January 2011-January 2012); Executive Vice President and General Counsel of OFI Institutional Asset Management, Inc. (since January 2011); General Counsel, Asset Management of the Manager (May 2010-December 2010); Principal, The Vanguard Group (November 2005-April 2010); District Administrator, U.S. Securities and Exchange Commission (January 2003-October 2005). An officer of 95 portfolios in the OppenheimerFunds complex. |
58 | OPPENHEIMER GOLD & SPECIAL MINERALS FUND
|
| | |
Christina M. Nasta, Vice President and Chief Business Officer (since 2011) Age: 39 | | Senior Vice President of the Manager (since July 2010); Vice President of the Manager (since January 2003); Vice President of OppenheimerFunds Distributor, Inc. (since January 2003). An officer of 95 portfolios in the OppenheimerFunds complex. |
| |
Mark S. Vandehey, Vice President and Chief Compliance Officer (since 2004) Age: 61 | | Senior Vice President and Chief Compliance Officer of the Manager (since March 2004); Chief Compliance Officer of OppenheimerFunds Distributor, Inc., Centennial Asset Management and Shareholder Services, Inc. (since March 2004); Vice President of OppenheimerFunds Distributor, Inc., Centennial Asset Management Corporation and Shareholder Services, Inc. (since June 1983). An officer of 95 portfolios in the OppenheimerFunds complex. |
| |
Brian W. Wixted, Treasurer and Principal Financial & Accounting Officer (since 1999) Age: 52 | | Senior Vice President of the Manager (since March 1999); Treasurer of the Manager and the following: HarbourView Asset Management Corporation, Shareholder Financial Services, Inc., Shareholder Services, Inc., Oppenheimer Real Asset Management, Inc. and Oppenheimer Partnership Holdings, Inc. (March 1999-June 2008), OFI Private Investments, Inc. (March 2000-June 2008), OppenheimerFunds International Ltd. and OppenheimerFunds plc (since May 2000), OFI Institutional Asset Management, Inc. (since November 2000), and OppenheimerFunds Legacy Program (charitable trust program established by the Manager) (June 2003-January 2012); Treasurer and Chief Financial Officer of OFI Trust Company (trust company subsidiary of the Manager) (since May 2000); Assistant Treasurer of OAC (March 1999-June 2008). An officer of 95 portfolios in the OppenheimerFunds complex. |
The Fund’s Statement of Additional Information contains additional information about the Fund’s Trustees and Officers and is available without charge upon request by calling 1.800.CALL OPP (225.5677).
59 | OPPENHEIMER GOLD & SPECIAL MINERALS FUND
|
OPPENHEIMER GOLD & SPECIAL MINERALS FUND
| | |
| Manager | | OppenheimerFunds, Inc. |
| Distributor | | OppenheimerFunds Distributor, Inc. |
| Transfer and Shareholder Servicing Agent | | OppenheimerFunds Services |
Independent
Registered Public Accounting Firm | | KPMG LLP |
| Legal Counsel | | Kramer Levin Naftalis & Frankel LLP |
©2012 OppenheimerFunds, Inc. All rights reserved.
60 | OPPENHEIMER GOLD & SPECIAL MINERALS FUND
|
61 | OPPENHEIMER GOLD & SPECIAL MINERALS FUND
|
OPPENHEIMER GOLD & SPECIAL MINERALS FUND (CAYMAN) LTD.
STATEMENT OF INVESTMENTS June 29, 2012*
| | | | | | | | |
| | | Shares | | | Value | |
| Investment Company—99.3% | |
| SPDR Gold Trust1,2 (Cost $159,463,491) | | | 965,000 | | | $ | 149,758,350 | |
| Total Investments, at Value (Cost $159,463,491) | | | 99.3 | % | | | 149,758,350 | |
| Other Assets Net of Liabilities | | | 0.7 | | | | 993,419 | |
| | |
|
|
|
| Net Assets | | | 100.0 | % | | $ | 150,751,769 | |
| | |
|
|
|
Footnotes to Statement of Investments
*June 29, 2012 represents the last business day of the Fund’s 2012 fiscal year. See Note 1 of the accompanying Notes.
1. All or a portion of the security position is held in segregated accounts and pledged to cover margin requirements with respect to outstanding written options. The aggregate market value of such securities is $21,198,954 . See Note 6 of the accompanying Notes.
2. Non-income producing security.
| | | | | | | | | | | | | | | | | | | | | | | | | | | | | | |
| | | | | | | | | | | | | | | | | | | | | | | | |
| Written Options as of June 29, 2012 are as follows: | |
| Description | | Type | | | Number of
Contracts | | | Exercise
Price | | | Expiration
Date | | | | | Premiums
Received | | | Value | | | Unrealized
Appreciation | |
| SPDR Gold Trust | | | Call | | | | 1,000 | | | $ | 157.000 | | | | 7/23/12 | | | | | $ | 187,971 | | | $ | (171,000 | ) | | $ | 16,971 | |
| SPDR Gold Trust | | | Call | | | | 1,000 | | | | 168.000 | | | | 7/23/12 | | | | | | 213,001 | | | | (17,000 | ) | | | 196,001 | |
| SPDR Gold Trust | | | Put | | | | 1,000 | | | | 142.000 | | | | 7/23/12 | | | | | | 198,971 | | | | (20,000 | ) | | | 178,971 | |
| SPDR Gold Trust | | | Put | | | | 1,000 | | | | 152.000 | | | | 7/23/12 | | | | | | 214,051 | | | | (131,000 | ) | | | 83,051 | |
| | | | | | | | | | | | | | | | | | | | |
|
|
| |
|
|
| |
|
|
|
| | | | | | | | | | | | | | | | | | | | | $ | 813,994 | | | $ | (339,000 | ) | | $ | 474,994 | |
| | | | | | | | | | | | | | | | | | | | |
|
|
| |
|
|
| |
|
|
|
See accompanying Notes to Financial Statements.
62 | OPPENHEIMER GOLD & SPECIAL MINERALS FUND
|
OPPENHEIMER GOLD & SPECIAL MINERALS FUND (CAYMAN) LTD.
STATEMENT OF ASSETS AND LIABILITIES June 29, 20121
| | | | |
| Assets | | | |
| Investments, at value (cost $159,463,491)—see accompanying statement of investments | | $ | 149,758,350 | |
| Cash | | | 1,345,107 | |
| Receivables and other assets: | | | | |
| Other | |
| 7,302
|
|
| Total assets | | | 151,110,759 | |
| Liabilities | | | |
| Appreciated options written, at value (premiums received $813,994) | | | 339,000 | |
| Payables and other liabilities: | | | | |
| Legal, auditing and other professional fees | | | 19,372 | |
| Other | |
| 618
|
|
| Total liabilities | | | 358,990 | |
| Net Assets | | $
| 150,751,769
|
|
| Composition of Net Assets | | | |
| Par value of shares of beneficial interest | | $ | 41 | |
| Additional paid-in capital | | | 157,463,236 | |
| Accumulated net investment loss | | | (701,763 | ) |
| Accumulated net realized gain on investments | | | 3,220,402 | |
| Net unrealized depreciation on investments | |
| (9,230,147
| )
|
| Net Assets—applicable to 4,056 shares of beneficial interest outstanding | | $
| 150,751,769
|
|
| Net Asset Value, Redemption Price Per Share and Offering Price Per Share | | $ | 37,167.60 | |
1. June 29, 2012 represents the last business day of the Fund’s 2012 fiscal year. See Note 1 of the accompanying Notes.
See accompanying Notes to Financial Statements.
63 | OPPENHEIMER GOLD & SPECIAL MINERALS FUND
|
OPPENHEIMER GOLD & SPECIAL MINERALS FUND (CAYMAN) LTD.
STATEMENT OF OPERATIONS For the Year Ended June 29, 20121
| | | | |
| Expenses | | | |
| Management fees | | $ | 633,825 | |
| Directors’ compensation | | | 9,781 | |
| Custodian fees and expenses | | | 2,320 | |
| Other | |
| 14,797
|
|
| Total expenses | | | 660,723 | |
| Net Investment Loss | | | (660,723 | ) |
| Realized and Unrealized Gain (Loss) | | | |
| Net realized gain on: | | | | |
| Investments (including premiums on options exercised) | | | 1,130,748 | |
| Closing and expiration of option contracts written | |
| 2,089,654
|
|
| Net realized gain | | | 3,220,402 | |
| Net change in unrealized appreciation/depreciation on: | | | | |
| Investments | | | (9,833,687 | ) |
| Option contracts written | |
| 474,994
|
|
| Net change in unrealized appreciation/depreciation | | | (9,358,693 | ) |
| Net Decrease in Net Assets Resulting from Operations | | $
| (6,799,014
| )
|
1. June 29, 2012 represents the last business day of the Fund’s 2012 fiscal year. See Note 1 of the accompanying Notes.
See accompanying Notes to Financial Statements.
64 | OPPENHEIMER GOLD & SPECIAL MINERALS FUND
|
OPPENHEIMER GOLD & SPECIAL MINERALS FUND (CAYMAN) LTD.
STATEMENTS OF CHANGES IN NET ASSETS
| | | | | | | | |
| | | Year Ended
June 29,
20121 | | | Period Ended
June 30,
20112 | |
| Operations | | | | | | |
| Net investment loss | | $ | (660,723 | ) | | $ | (41,040 | ) |
| Net realized gain | | | 3,220,402 | | | | — | |
| Net change in unrealized appreciation/depreciation | |
| (9,358,693
| )
| |
| 128,546
|
|
| Net increase (decrease) in net assets resulting from operations | | | (6,799,014 | ) | | | 87,506 | |
| Capital Transactions | | | | | | |
| Net increase in net assets resulting from capital transactions | | | 155,962,906 | | | | 1,500,371 | |
| Net Assets | | | | | | |
| Total increase | | | 149,163,892 | | | | 1,587,877 | |
| Beginning of period | |
| 1,587,877
|
| |
| —
|
|
| End of period (including accumulated net investment loss of $701,763 and $41,040, respectively) | | $
| 150,751,769
|
| | $
| 1,587,877
|
|
1. June 29, 2012 represents the last business day of the Fund’s 2012 fiscal year. See Note 1 of the accompanying Notes.
2. For the period from December 8, 2010 (commencement of operations) to June 30, 2011.
See accompanying Notes to Financial Statements.
65 | OPPENHEIMER GOLD & SPECIAL MINERALS FUND
|
OPPENHEIMER GOLD & SPECIAL MINERALS FUND (CAYMAN) LTD.
NOTES TO FINANCIAL STATEMENTS
1. Significant Accounting Policies
Oppenheimer Gold & Special Minerals Fund (Cayman) Ltd. (the “Fund”) is organized as a Cayman Islands Company Limited by Shares. The Fund intends to carry on the business of an investment company and to acquire, invest in and hold by way of investment, sell and deal primarily in commodity-linked derivatives (including commodity futures, financial futures, options and swap contracts) and exchange traded funds (“ETF”) related to gold or other special minerals. The Subsidiary may also invest in certain fixed-income securities and other investments that may serve as margin or collateral for its derivatives positions. The Fund’s investment adviser is OppenheimerFunds, Inc. (the “Manager”). The Sub-Adviser is Oppenheimer Real Asset Management, Inc. (“ORAMI” or the “Sub-Adviser”), a wholly-owned subsidiary of the Manager. As of June 29, 2012, 100% of the Fund was owned by Oppenheimer Gold & Special Minerals Fund (“OGSMF”). The Manager is also the investment adviser of OGSMF.
The beneficial interest of each investor in the Fund is represented by units of participating shares. The Fund’s directors may further designate classes of participating shares and series within each class. As of June 29, 2012, the directors have not designated classes or series of outstanding participating shares. During the year ended June 29, 2012, all income, profits, losses and expenses, if any, of the Fund were allocated pro rata to all participating shares of the Fund. Issuance of additional participating shares is at the discretion of the Fund’s directors.
The following is a summary of significant accounting policies consistently followed by the Fund.
Fiscal Year End. The last day of the Fund’s fiscal year was the last day the New York Stock Exchange was open for trading. The Fund’s financial statements have been presented through that date to maintain consistency with the Fund’s net asset value calculations used for shareholder transactions.
Income Taxes. The Fund has received an undertaking from the Government of the Cayman Islands exempting it from all local income, profits and capital gains taxes through September of 2030. No such taxes are levied in the Cayman Islands at the present time. The Fund is a Controlled Foreign Corporation under U.S. tax laws and as such is not subject to U.S. income tax. Therefore, the Fund is not required to record a tax provision.
Dividends and Distributions to Shareholders. Dividends and distributions to shareholders, if any, are declared and paid annually from the Fund’s tax basis earnings and profits. Distributions are recorded on ex-dividend date.
Investment Income. Dividend income is recorded on the ex-dividend date or upon ex-dividend notification in the case of certain foreign dividends where the ex-dividend date may have passed. Non-cash dividends included in dividend income, if any, are recorded at the fair market value of the securities received. Interest income is recognized on an accrual basis. Discount and premium, which are included in interest income on the Statement of Operations, are amortized or accreted daily.
66 | OPPENHEIMER GOLD & SPECIAL MINERALS FUND
|
Custodian Fees. “Custodian fees and expenses” in the Statement of Operations may include interest expense incurred by the Fund on any cash overdrafts of its custodian account during the period. Such cash overdrafts may result from the effects of failed trades in portfolio securities and from cash outflows resulting from unanticipated shareholder redemption activity. The Fund pays interest to its custodian on such cash overdrafts, to the extent they are not offset by positive cash balances maintained by the Fund, at a rate equal to the Federal Funds Rate plus 0.50%. The “Reduction to custodian expenses” line item, if applicable, represents earnings on cash balances maintained by the Fund during the period. Such interest expense and other custodian fees may be paid with these earnings.
Security Transactions. Security transactions are recorded on the trade date. Realized gains and losses on securities sold are determined on the basis of identified cost.
Indemnifications. The Fund’s organizational documents provide current and former trustees and officers with a limited indemnification against liabilities arising in connection with the performance of their duties to the Fund. In the normal course of business, the Fund may also enter into contracts that provide general indemnifications. The Fund’s maximum exposure under these arrangements is unknown as this would be dependent on future claims that may be made against the Fund. The risk of material loss from such claims is considered remote.
Other. The preparation of financial statements in conformity with accounting principles generally accepted in the United States of America requires management to make estimates and assumptions that affect the reported amounts of assets and liabilities and disclosure of contingent assets and liabilities at the date of the financial statements and the reported amounts of increases and decreases in net assets from operations during the reporting period. Actual results could differ from those estimates.
2. Securities Valuation
The Fund calculates the net asset value of its shares as of the close of the New York Stock Exchange (the “Exchange”), normally 4:00 P.M. Eastern time, on each day the Exchange is open for trading.
The Fund’s Board has adopted procedures for the valuation of the Fund’s securities and has delegated the day-to-day responsibility for valuation determinations under those procedures to the Manager. The Manager has established a Valuation Committee which is responsible for determining a “fair valuation” for any security for which market quotations are not “readily available.” The Valuation Committee’s fair valuation determinations are subject to review, approval and ratification by the Fund’s Board at its next regularly scheduled meeting covering the calendar quarter in which the fair valuation was determined.
Valuation Methods and Inputs
Securities are valued using unadjusted quoted market prices, when available, as supplied primarily by third party pricing services or dealers.
67 | OPPENHEIMER GOLD & SPECIAL MINERALS FUND
|
OPPENHEIMER GOLD & SPECIAL MINERALS FUND (CAYMAN) LTD.
NOTES TO FINANCIAL STATEMENTS Continued
2. Securities Valuation Continued
The following methodologies are used to determine the market value or the fair value of the types of securities described below:
Securities traded on a registered U.S. securities exchange (including exchange-traded derivatives other than futures and futures options) are valued based on the last sale price of the security reported on the principal exchange on which it is traded, prior to the time when the Fund’s assets are valued. In the absence of a sale, the security is valued at the last sale price on the prior trading day, if it is within the spread of the current day’s closing “bid” and “asked” prices, and if not, at the current day’s closing bid price. A security of a foreign issuer traded on a foreign exchange but not listed on a registered U.S. securities exchange is valued based on the last sale price on the principal exchange on which the security is traded, as identified by the third party pricing service used by the Manager, prior to the time when the Fund’s assets are valued. If the last sale price is unavailable, the security is valued at the most recent official closing price on the principal exchange on which it is traded. If the last sales price or official closing price for a foreign security is not available, the security is valued at the mean between the bid and asked price per the exchange or, if not available from the exchange, obtained from two dealers. If bid and asked prices are not available from either the exchange or two dealers, the security is valued by using one of the following methodologies (listed in order of priority); (1) using a bid from the exchange, (2) the mean between the bid and asked price as provided by a single dealer, or (3) a bid from a single dealer.
Shares of a registered investment company that are not traded on an exchange are valued at that investment company’s net asset value per share.
Corporate and government debt securities (of U.S. or foreign issuers) and municipal debt securities, event-linked bonds, loans, mortgage-backed securities, collateralized mortgage obligations, and asset-backed securities are valued at the mean between the “bid” and “asked” prices utilizing evaluated prices obtained from third party pricing services or broker-dealers who may use matrix pricing methods to determine the evaluated prices.
Short-term money market type debt securities with a remaining maturity of sixty days or less are valued at cost adjusted by the amortization of discount or premium to maturity (amortized cost), which approximates market value. Short-term debt securities with a remaining maturity in excess of sixty days are valued at the mean between the “bid” and “asked” prices utilizing evaluated prices obtained from third party pricing services or broker-dealers.
A description of the standard inputs that may generally be considered by the third party pricing vendors in determining their evaluated prices is provided below.
| | |
| Security Type | | Standard inputs generally considered by third-party
pricing vendors |
| Corporate debt, government debt, municipal, mortgage-backed and asset-backed securities | | Reported trade data, broker-dealer price quotations, benchmark yields, issuer spreads on comparable securities, the credit quality, yield, maturity, and other appropriate factors. |
| Loans | | Information obtained from market participants regarding reported trade data and broker-dealer price quotations. |
| Event-linked bonds | | Information obtained from market participants regarding reported trade data and broker-dealer price quotations. |
68 | OPPENHEIMER GOLD & SPECIAL MINERALS FUND
|
If a market value or price cannot be determined for a security using the methodologies described above, or if, in the “good faith” opinion of the Manager, the market value or price obtained does not constitute a “readily available market quotation,” or a significant event has occurred that would materially affect the value of the security the security is fair valued either (i) by a standardized fair valuation methodology applicable to the security type or the significant event as previously approved by the Valuation Committee and the Fund’s Board or (ii) as determined in good faith by the Manager’s Valuation Committee. The Valuation Committee considers all relevant facts that are reasonably available, through either public information or information available to the Manager, when determining the fair value of a security. Fair value determinations by the Manager are subject to review, approval and ratification by the Fund’s Board at its next regularly scheduled meeting covering the calendar quarter in which the fair valuation was determined. Those fair valuation standardized methodologies include, but are not limited to, valuing securities at the last sale price or initially at cost and subsequently adjusting the value based on: changes in company specific fundamentals, changes in an appropriate securities index, or changes in the value of similar securities which may be further adjusted for any discounts related to security-specific resale restrictions. When possible, such methodologies use observable market inputs such as unadjusted quoted prices of similar securities, observable interest rates, currency rates and yield curves. The methodologies used for valuing securities are not necessarily an indication of the risks associated with investing in those securities nor can it be assured that the Fund can obtain the fair value assigned to a security if it were to sell the security.
To assess the continuing appropriateness of security valuations, the Manager, or its third party service provider who is subject to oversight by the Manager, regularly compares prior day prices, prices on comparable securities, and sale prices to the current day prices and challenges those prices exceeding certain tolerance levels with the third party pricing service or broker source. For those securities valued by fair valuations, whether through a standardized fair valuation methodology or a fair valuation determination, the Valuation Committee reviews and affirms the reasonableness of the valuations based on such methodologies and fair valuation determinations on a regular basis after considering all relevant information that is reasonably available.
Classifications
Each investment asset or liability of the Fund is assigned a level at measurement date based on the significance and source of the inputs to its valuation. Various data inputs are used in determining the value of each of the Fund’s investments as of the reporting period end. These data inputs are categorized in the following hierarchy under applicable financial accounting standards:
| 1) | | Level 1—unadjusted quoted prices in active markets for identical assets or liabilities (including securities actively traded on a securities exchange) |
| 2) | | Level 2—inputs other than unadjusted quoted prices that are observable for the asset or liability (such as unadjusted quoted prices for similar assets and market corroborated inputs such as interest rates, prepayment speeds, credit risks, etc.) |
69 | OPPENHEIMER GOLD & SPECIAL MINERALS FUND
|
OPPENHEIMER GOLD & SPECIAL MINERALS FUND (CAYMAN) LTD.
NOTES TO FINANCIAL STATEMENTS Continued
2. Securities Valuation Continued
| 3) | | Level 3—significant unobservable inputs (including the Manager’s own judgments about assumptions that market participants would use in pricing the asset or liability). |
The inputs used for valuing securities are not necessarily an indication of the risks associated with investing in those securities.
The table below categorizes amounts that are included in the Fund’s Statement of Assets and Liabilities as of June 29, 2012 based on valuation input level:
| | | | | | | | | | | | | | | | | | | | |
| | | Level 1—
Unadjusted
Quoted Prices | | Level 2—
Other Significant
Observable Inputs | | Level 3—
Significant
Unobservable
Inputs | | Value |
| Assets Table | | | | | | | | | | | | | | | | | | | | |
| Investments, at Value: | | | | | | | | | | | | | | | | | | | | |
| Investment Company | | | $ | 149,758,350 | | | | $ | — | | | | $ | — | | | | $ | 149,758,350 | |
| | | |
|
|
|
| Total Assets | | | $ | 149,758,350 | | | | $ | — | | | | $ | — | | | | $ | 149,758,350 | |
| | | |
|
|
|
| | | | |
| Liabilities Table | | | | | | | | | | | | | | | | | | | | |
| Other Financial Instruments: | | | | | | | | | | | | | | | | | | | | |
| Appreciated options written, at value | | | $ | (339,000 | ) | | | $ | — | | | | $ | — | | | | $ | (339,000 | ) |
| | | |
|
|
|
| Total Liabilities | | | $ | (339,000 | ) | | | $ | — | | | | $ | — | | | | $ | (339,000 | ) |
| | | |
|
|
|
Currency contracts and forwards, if any, are reported at their unrealized appreciation/depreciation at measurement date, which represents the change in the contract’s value from trade date. Futures, if any, are reported at their variation margin at measurement date, which represents the amount due to/from the Fund at that date. All additional assets and liabilities included in the above table are reported at their market value at measurement date.
There have been no significant changes to the fair valuation methodologies of the Fund during the period.
3. Capital Transactions
The Fund has authorized 5,000,000 participating shares of $0.01 par value per share. The Fund issued 4,055.82 participating shares for $405,582 on December 8, 2010 in conjunction with OGSMF’s initial capitalization of the Fund. All subsequent capital contributions and withdrawals did not have participating shares associated with the transaction.
Capital transactions were as follows:
| | | | | | | | |
| | | Year Ended
June 29, 2012
Amount | | | Period Ended
June 30, 20111
Amount | |
| Contributions | | $ | 156,840,091 | | | $ | 1,500,371 | |
| Withdrawals | | | (877,185 | ) | | | — | |
| | |
|
|
|
| Net increase | | $ | 155,962,906 | | | $ | 1,500,371 | |
| | |
|
|
|
1. For the period from December 8, 2010 (commencement of operations) to June 30, 2011.
70 | OPPENHEIMER GOLD & SPECIAL MINERALS FUND
|
4. Expenses
Management Fees. Under the investment advisory agreement, the Fund pays the Manager a management fee based on the daily net assets of the Fund at an annual rate as shown in the following table:
| | | | |
| Fee Schedule | |
| Up to $200 million | | | 0.75 | % |
| Next $200 million | | | 0.72 | |
| Next $200 million | | | 0.69 | |
| Next $200 million | | | 0.66 | |
| Next $2.2 billion | | | 0.60 | |
| Next $1 billion | | | 0.59 | |
| Over $4 billion | | | 0.58 | |
| | | | | |
| | | | | |
Sub-Adviser Fees. The Manager retains the Sub-Adviser to provide the day-to-day portfolio management of the Fund. Under the Sub-Advisory Agreement, the Manager pays the Sub-Adviser a fee in monthly installments, based on the daily net assets of the Fund at an annual rate as shown in the following table:
| | | | |
| Fee Schedule | |
| Up to $200 million | | | 0.375 | % |
| Next $200 million | | | 0.360 | |
| Next $200 million | | | 0.345 | |
| Next $200 million | | | 0.330 | |
| Next $2.2 billion | | | 0.300 | |
| Next $1 billion | | | 0.295 | |
| Over $4 billion | | | 0.290 | |
| | | | | |
| | | | | |
The Fund shall bear all fees and expenses related to the business and affairs of the Fund, including among others, directors’ fees, audit fees, custodian fees and expenses in connection with the purchase and sale of securities and other Fund assets.
5. Financial Highlights
The following represents the total return of the Fund for the year ended June 29, 2012. Total return was calculated based upon the daily returns of the Fund during this period. The calculation has not been annualized for reporting purposes:
| | | | |
| Year Ended June 29, 2012 | | | (48.51 | )% |
| Period Ended June 30, 20111 | | | 2.34 | % |
71 | OPPENHEIMER GOLD & SPECIAL MINERALS FUND
|
OPPENHEIMER GOLD & SPECIAL MINERALS FUND (CAYMAN) LTD.
NOTES TO FINANCIAL STATEMENTS Continued
5. Financial Highlights Continued
The following represents certain financial ratios of the Fund for the periods noted. The computation of the net investment income and total expense ratios was based upon the daily net assets of the Fund during these periods. The calculations have been annualized for reporting purposes:
| | | | | | | | |
| | | Year Ended
June 29, 2012 | | | Period Ended
June 30, 20111 | |
| Ratios to average net assets: | | | | | | | | |
| Net investment loss | | | (0.78 | )% | | | (6.18 | )% |
| Total expenses | | | 0.78 | % | | | 6.18 | % |
1. For the period from December 8, 2010 (commencement of operations) through June 30, 2011.
6. Risk Exposures and the Use of Derivative Instruments
The Fund’s investment objectives not only permit the Fund to purchase investment securities, they also allow the Fund to enter into various types of derivatives contracts, including, but not limited to, futures contracts, forward foreign currency exchange contracts, credit default swaps, interest rate swaps, total return swaps, and purchased and written options. In doing so, the Fund will employ strategies in differing combinations to permit it to increase, decrease, or change the level or types of exposure to market risk factors. Central to those strategies are features inherent to derivatives that make them more attractive for this purpose than equity and debt securities: they require little or no initial cash investment, they can focus exposure on only certain selected risk factors, and they may not require the ultimate receipt or delivery of the underlying security (or securities) to the contract. This may allow the Fund to pursue its objectives more quickly and efficiently than if it were to make direct purchases or sales of securities capable of effecting a similar response to market factors.
Market Risk Factors. In accordance with its investment objectives, the Fund may use derivatives to increase or decrease its exposure to one or more of the following market risk factors:
Commodity Risk. Commodity risk relates to the change in value of commodities or commodity indexes as they relate to increases or decreases in the commodities market. Commodities are physical assets that have tangible properties. Examples of these types of assets are crude oil, heating oil, metals, livestock, and agricultural products.
Credit Risk. Credit risk relates to the ability of the issuer to meet interest and principal payments, or both, as they come due. In general, lower-grade, higher-yield bonds are subject to credit risk to a greater extent than lower-yield, higher-quality bonds.
Equity Risk. Equity risk relates to the change in value of equity securities as they relate to increases or decreases in the general market.
Foreign Exchange Rate Risk. Foreign exchange rate risk relates to the change in the U.S. dollar value of a security held that is denominated in a foreign currency. The U.S. dollar value of a foreign currency denominated security will decrease as the dollar appreciates against the currency, while the U.S. dollar value will increase as the dollar depreciates against the currency.
72 | OPPENHEIMER GOLD & SPECIAL MINERALS FUND
|
Interest Rate Risk. Interest rate risk refers to the fluctuations in value of fixed-income securities resulting from the inverse relationship between price and yield. For example, an increase in general interest rates will tend to reduce the market value of already issued fixed-income investments, and a decline in general interest rates will tend to increase their value. In addition, debt securities with longer maturities, which tend to have higher yields, are subject to potentially greater fluctuations in value from changes in interest rates than obligations with shorter maturities.
Volatility Risk. Volatility risk refers to the magnitude of the movement, but not the direction of the movement, in a financial instrument’s price over a defined time period. Large increases or decreases in a financial instrument’s price over a relative time period typically indicate greater volatility risk, while small increases or decreases in its price typically indicate lower volatility risk.
The Fund’s actual exposures to these market risk factors during the period are discussed in further detail, by derivative type, below.
Risks of Investing in Derivatives. The Fund’s use of derivatives can result in losses due to unanticipated changes in the market risk factors and the overall market. In instances where the Fund is using derivatives to decrease, or hedge, exposures to market risk factors for securities held by the Fund, there are also risks that those derivatives may not perform as expected resulting in losses for the combined or hedged positions.
Derivatives may have little or no initial cash investment relative to their market value exposure and therefore can produce significant gains or losses in excess of their cost. This use of embedded leverage allows the Fund to increase its market value exposure relative to its net assets and can substantially increase the volatility of the Fund’s performance.
Additional associated risks from investing in derivatives also exist and potentially could have significant effects on the valuation of the derivative and the Fund. Typically, the associated risks are not the risks that the Fund is attempting to increase or decrease exposure to, per its investment objectives, but are the additional risks from investing in derivatives. Examples of these associated risks are liquidity risk, which is the risk that the Fund will not be able to sell the derivative in the open market in a timely manner, and counterparty credit risk, which is the risk that the counterparty will not fulfill its obligation to the Fund. Associated risks can be different for each type of derivative and are discussed by each derivative type in the notes that follow.
Counterparty Credit Risk. Certain derivative positions are subject to counterparty credit risk, which is the risk that the counterparty will not fulfill its obligation to the Fund. The Fund’s derivative counterparties are financial institutions who are subject to market conditions that may weaken their financial position. The Fund intends to enter into financial transactions with counterparties that the Manager believes to be creditworthy at the time of the transaction.
Credit Related Contingent Features. The Fund’s agreements with derivative counterparties have several credit related contingent features that if triggered would allow its derivatives counterparties to close out and demand payment or additional
73 | OPPENHEIMER GOLD & SPECIAL MINERALS FUND
|
OPPENHEIMER GOLD & SPECIAL MINERALS FUND (CAYMAN) LTD.
NOTES TO FINANCIAL STATEMENTS Continued
6. Risk Exposures and the Use of Derivative Instruments Continued
collateral to cover their exposure from the Fund. Credit related contingent features are established between the Fund and its derivatives counterparties to reduce the risk that the Fund will not fulfill its payment obligations to its counterparties. These triggering features include, but are not limited to, a percentage decrease in the Fund’s net assets and or a percentage decrease in the Fund’s Net Asset Value or NAV. The contingent features are established within the Fund’s International Swap and Derivatives Association, Inc. master agreements which govern certain positions in swaps, over-the-counter options and swaptions, and forward currency exchange contracts for each individual counterparty.
Valuations of derivative instruments as of June 29, 2012 are as follows:
| | | | | | |
Liability Derivatives | |
Derivatives Not Accounted
for as Hedging Instruments | | Statement of Assets and
Liabilities Location | | Value | |
| Commodity contracts | | Appreciated options written, at value | | | $339,000 | |
The effect of derivative instruments on the Statement of Operations is as follows:
| | | | | | | | | | | | |
| Amount of Realized Gain or (Loss) Recognized on Derivatives | |
Derivatives
Not Accounted
for as Hedging
Instruments | | Investments
from unaffiliated
companies (including premiums on options exercised)* | | | Closing and
expiration
of option
contracts
written | | | Total | |
| Commodity contracts | | $ | 640,998 | | | $ | 2,089,654 | | | $ | 2,730,652 | |
*Includes purchased option contracts, purchased swaption contracts and written option contracts exercised, if any.
| | | | |
| Amount of Change in Unrealized Gain or (Loss) Recognized on Derivatives | |
Derivatives Not Accounted
for as Hedging Instruments | | Option contracts written | |
| Commodity contracts | | $ | 474,994 | |
Option Activity
The Fund may buy and sell put and call options, or write put and call options. When an option is written, the Fund receives a premium and becomes obligated to sell or purchase the underlying security at a fixed price, upon exercise of the option.
Options are valued daily based upon the last sale price on the principal exchange on which the option is traded. The difference between the premium received or paid, and market value of the option, is recorded as unrealized appreciation or depreciation. The net change in unrealized appreciation or depreciation is reported in the Statement of Operations. When an option is exercised, the cost of the security purchased or the proceeds of the security sale are adjusted by the amount of premium received or paid. Upon the expiration or closing of the option transaction, a gain or loss is reported in the Statement of Operations.
Options written, if any, are reported in a schedule following the Statement of Investments and as a liability in the Statement of Assets and Liabilities. Securities held in
74 | OPPENHEIMER GOLD & SPECIAL MINERALS FUND
|
collateralized accounts to cover potential obligations with respect to outstanding written options are noted in the Statement of Investments.
The risk in writing a call option is that the Fund gives up the opportunity for profit if the market price of the security increases and the option is exercised. The risk in writing a put option is that the Fund may incur a loss if the market price of the security decreases and the option is exercised. The risk in buying an option is that the Fund pays a premium whether or not the option is exercised. The Fund also has the additional risk that there may be an illiquid market where the Fund is unable to close the contract.
The Fund has written put options on individual equity securities and/or commodity indexes to increase exposure to commodity risk. A written put option becomes more valuable as the price of the underlying financial instrument appreciates relative to the strike price.
The Fund has written call options on individual equity securities and/or commodity indexes to decrease exposure to commodity risk. A written call option becomes more valuable as the price of the underlying financial instrument depreciates relative to the strike price.
During the year ended June 29, 2012, the Fund had an ending monthly average market value of $169,000 and $235,615 on written call options and written put options, respectively.
Additional associated risks to the Fund include counterparty credit risk for over-the-counter options and liquidity risk.
Written option activity for the year ended June 29, 2012 was as follows:
| | | | | | | | | | | | | | | | |
| | | Call Options
| | | Put Options
| |
| | | Number of
Contracts | | | Amount of
Premiums | | | Number of
Contracts | | | Amount of
Premiums | |
| Options outstanding as of June 30, 2011 | | | — | | | $ | — | | | | — | | | $ | — | |
| Options written | | | 9,000 | | | | 1,824,441 | | | | 9,000 | | | | 1,955,191 | |
| Options closed or expired | | | (7,000 | ) | | | (1,423,469 | ) | | | (4,000 | ) | | | (901,171 | ) |
| Options exercised | | | — | | | | — | | | | (3,000 | ) | | | (640,998 | ) |
| | |
|
|
|
| Options outstanding as of June 29, 2012 | | | 2,000 | | | $ | 400,972 | | | | 2,000 | | | $ | 413,022 | |
| | |
|
|
|
7. Pending Litigation
Since 2009, a number of class action, derivative and individual lawsuits have been pending in federal and state courts against OppenheimerFunds, Inc., the Fund’s investment advisor (the “Manager”), OppenheimerFunds Distributor, Inc., the Fund’s principal underwriter and distributor (the “Distributor”), and certain funds (but not including the Fund) advised by the Manager and distributed by the Distributor (the “Defendant Funds”). Several of these lawsuits also name as defendants certain officers and current and former trustees of the respective Defendant Funds. The lawsuits raise claims under federal securities laws and various states’ securities, consumer protection and common law and allege, among other things, that the disclosure documents of the respective Defendant Funds contained misrepresentations and omissions and that the respective Defendant Funds’ investment policies were not followed. The plaintiffs in these actions seek unspecified damages, equitable relief and awards of attorneys’ fees and litigation expenses.
75 | OPPENHEIMER GOLD & SPECIAL MINERALS FUND
|
OPPENHEIMER GOLD & SPECIAL MINERALS FUND (CAYMAN) LTD.
NOTES TO FINANCIAL STATEMENTS Continued
7. Pending Litigation Continued
Other class action and individual lawsuits have been filed since 2008 in various state and federal courts against the Manager and certain of its affiliates by investors seeking to recover investments they allegedly lost as a result of the “Ponzi” scheme run by Bernard L. Madoff and his firm, Bernard L. Madoff Investment Securities, LLC (“BLMIS”). Plaintiffs in these suits allege that they suffered losses as a result of their investments in several funds managed by an affiliate of the Manager and assert a variety of claims, including breach of fiduciary duty, fraud, negligent misrepresentation, unjust enrichment, and violation of federal and state securities laws and regulations, among others. They seek unspecified damages, equitable relief and awards of attorneys’ fees and litigation expenses. Neither the Distributor, nor any of the Oppenheimer mutual funds, their independent trustees or directors are named as defendants in these lawsuits. None of the Oppenheimer mutual funds invested in any funds or accounts managed by Madoff or BLMIS. On February 28, 2011, a stipulation of partial settlement of three groups of consolidated putative class action lawsuits relating to these matters was filed in the U.S. District Court for the Southern District of New York. On August 19, 2011, the court entered an order and final judgment approving the settlement as fair, reasonable and adequate. In September 2011, certain parties filed notices of appeal from the court’s order approving the settlement. On July 29, 2011, a stipulation of settlement between certain affiliates of the Manager and the Trustee appointed under the Securities Investor Protection Act to liquidate BLMIS was filed in the U.S. Bankruptcy Court for the Southern District of New York to resolve purported preference and fraudulent transfer claims by the Trustee. On September 22, 2011, the court entered an order approving the settlement as fair, reasonable and adequate. In October 2011, certain parties filed notices of appeal from the court’s order approving the settlement. The aforementioned settlements do not resolve other outstanding lawsuits against the Manager and its affiliates relating to BLMIS.
On April 16, 2010, a lawsuit was filed in New York state court against the Manager, an affiliate of the Manager and AAArdvark IV Funding Limited (“AAArdvark IV”), an entity advised by the Manager’s affiliate, in connection with investments made by the plaintiffs in AAArdvark IV. Plaintiffs allege breach of contract against the defendants and seek compensatory damages, costs and disbursements, including attorney fees. On July 15, 2011, a lawsuit was filed in New York state court against the Manager, an affiliate of the Manager and AAArdvark Funding Limited (“AAArdvark I”), an entity advised by the Manager’s affiliate, in connection with investments made by the plaintiffs in AAArdvark I. The complaint alleges breach of contract against the defendants and seeks compensatory damages, costs and disbursements, including attorney fees. On November 9, 2011, a lawsuit was filed in New York state court against the Manager, an affiliate of the Manager and AAArdvark XS Funding Limited (“AAArdvark XS”), an entity advised by the Manager’s affiliate, in connection with investments made by the plaintiffs in AAArdvark XS. The complaint alleges breach of contract against the defendants and seeks compensatory damages, costs and disbursements, including attorney fees.
76 | OPPENHEIMER GOLD & SPECIAL MINERALS FUND
|
The Manager believes the lawsuits and appeals described above are without legal merit and, with the exception of actions it has settled, is defending against them vigorously. The Defendant Funds’ Boards of Trustees have also engaged counsel to represent the Funds and the present and former Independent Trustees named in those suits. While it is premature to render any opinion as to the outcome in these lawsuits, or whether any costs that the Defendant Funds may bear in defending the suits might not be reimbursed by insurance, the Manager believes that these suits should not impair the ability of the Manager or the Distributor to perform their respective duties to the Fund, and that the outcome of all of the suits together should not have any material effect on the operations of any of the Oppenheimer mutual funds.
8. Subsequent Events Evaluation
The Fund has evaluated the need for disclosures and/or adjustments resulting from subsequent events through August 16, 2012, the date the financial statements were available to be issued. This evaluation determined that there are no subsequent events that necessitated disclosures and/or adjustments.
77 | OPPENHEIMER GOLD & SPECIAL MINERALS FUND
|
OPPENHEIMER GOLD & SPECIAL MINERALS FUND (CAYMAN) LTD.
Report of Independent Registered Public Accounting Firm
The Board of Directors and Shareholders of Oppenheimer Gold & Special Minerals Fund (Cayman) Ltd.:
We have audited the accompanying statement of assets and liabilities of Oppenheimer Gold & Special Minerals Fund (Cayman) Ltd., including the statement of investments, as of June 29, 2012, and the related statement of operations for the year then ended, the statements of changes in net assets for the year then ended and the period December 8, 2010 (commencement of operations) to June 30, 2011. These financial statements are the responsibility of the Fund’s management. Our responsibility is to express an opinion on these financial statements based on our audits.
We conducted our audits in accordance with the standards of the Public Company Accounting Oversight Board (United States). Those standards require that we plan and perform the audit to obtain reasonable assurance about whether the financial statements are free of material misstatement. An audit includes examining, on a test basis, evidence supporting the amounts and disclosures in the financial statements. Our procedures included confirmation of securities owned as of June 29, 2012, by correspondence with the custodian. An audit also includes assessing the accounting principles used and significant estimates made by management, as well as evaluating the overall financial statement presentation. We believe that our audits provide a reasonable basis for our opinion.
In our opinion, the financial statements referred to above present fairly, in all material respects, the financial position of Oppenheimer Gold & Special Minerals Fund (Cayman) Ltd. as of June 29, 2012, the results of its operations for the year then ended, the changes in its net assets for the year then ended, and the period December 8, 2010 (commencement of operations) to June 30, 2011, in conformity with U.S. generally accepted accounting principles.
KPMG LLP
Denver, Colorado
August 16, 2012
78 | OPPENHEIMER GOLD & SPECIAL MINERALS FUND
|
PRIVACY POLICY
As an Oppenheimer fund shareholder, you are entitled to know how we protect your personal information and how we limit its disclosure.
Information Sources
We obtain nonpublic personal information about our shareholders from the following sources:
| l | | Applications or other forms |
| l | | When you create a user ID and password for online account access |
| l | | When you enroll in eDocs Direct, our electronic document delivery service |
| l | | Your transactions with us, our affiliates or others |
| l | | A software program on our website, often referred to as a “cookie,” which indicates which parts of our site you’ve visited |
| l | | When you set up challenge questions to reset your password online |
If you visit oppenheimerfunds.com and do not log on to the secure account information areas, we do not obtain any personal information about you. When you do log on to a secure area, we do obtain your user ID and password to identify you. We also use this information to provide you with products and services you have requested, to inform you about products and services that you may be interested in and assist you in other ways.
We do not collect personal information through our website unless you willingly provide it to us, either directly by email or in those areas of the website that request information. In order to update your personal information (including your mailing address, email address and phone number) you must first log on and visit your user profile.
If you have set your browser to warn you before accepting cookies, you will receive the warning message with each cookie. You can refuse cookies by turning them off in your browser. However, doing so may limit your access to certain sections of our website.
We use cookies to help us improve and manage our website. For example, cookies help us recognize new versus repeat visitors to the site, track the pages visited, and enable some special features on the website. This data helps us provide a better service for our website visitors.
Protection of Information
We do not disclose any non-public personal information (such as names on a customer list) about current or former customers to anyone, except as permitted by law.
Disclosure of Information
We send your financial advisor (as designated by you) copies of confirmations, account statements and other documents reporting activity in your fund accounts. We may also use details about you and your investments to help us, our financial service affiliates, or firms that jointly market their financial products and services with ours, to better serve your investment needs or suggest financial services or educational material that may be of interest to you. If this requires us to provide you with an opportunity to “opt in” or “opt out” of such information sharing with a firm not affiliated with us, you will receive notification on how to do so, before any such sharing takes place.
Right of Refusal
We will not disclose your personal information to unaffiliated third parties (except as permitted by law), unless we first offer you a reasonable opportunity to refuse or “opt out” of such disclosure.
Internet Security and Encryption
In general, the email services provided by our website are encrypted and provide a secure and private means of communication with us. To protect your own privacy, confidential and/or personal information should only be communicated via email when you are advised that you are using a secure website.
79 | OPPENHEIMER GOLD & SPECIAL MINERALS FUND
|
PRIVACY POLICY
As a security measure, we do not include personal or account information in non-secure emails, and we advise you not to send such information to us in non-secure emails. Instead, you may take advantage of the secure features of our website to encrypt your email correspondence. To do this, you will need to use a browser that supports Secure Sockets Layer (SSL) protocol.
We do not guarantee or warrant that any part of our website, including files available for download, are free of viruses or other harmful code. It is your responsibility to take appropriate precautions, such as use of an anti-virus software package, to protect your computer hardware and software.
| l | | All transactions, including redemptions, exchanges and purchases, are secured by SSL and 128-bit encryption. SSL is used to establish a secure connection between your PC and OppenheimerFunds’ server. It transmits information in an encrypted and scrambled format. |
| l | | Encryption is achieved through an electronic scrambling technology that uses a “key” to code and then decode the data. Encryption acts like the cable converter box you may have on your television set. It scrambles data with a secret code so that no one can make sense of it while it is being transmitted. When the data reaches its destination, the same software unscrambles the data. |
| l | | You can exit the secure area by either closing your browser, or for added security, you can use the Log Out button before you close your browser. |
Other Security Measures
We maintain physical, electronic and procedural safeguards to protect your personal account information. Our employees and agents have access to that information only so that they may offer you products or provide services, for example, when responding to your account questions.
How You Can Help
You can also do your part to keep your account information private and to prevent unauthorized transactions. If you obtain a user ID and password for your account, do not allow it to be used by anyone else. Also, take special precautions when accessing your account on a computer used by others.
Who We Are
This joint notice describes the privacy policies of the Oppenheimer funds, OppenheimerFunds Distributor, Inc., the trustee of OppenheimerFunds Individual Retirement Accounts (IRAs) and the custodian of the OppenheimerFunds 403(b)(7) tax sheltered custodial accounts. It applies to all Oppenheimer fund accounts you presently have, or may open in the future, using your Social Security number—whether or not you remain a shareholder of our funds. This notice was last updated January 16, 2004. In the event it is updated or changed, we will post an updated notice on our website at oppenheimerfunds.com. If you have any questions about these privacy policies, write to us at P.O. Box 5270, Denver, CO 80217-5270, email us by clicking on the Contact Us section of our website at oppenheimerfunds.com or call us at 1.800.CALL OPP (225.5677).
80 | OPPENHEIMER GOLD & SPECIAL MINERALS FUND
|
Item 2. Code of Ethics.
The registrant has adopted a code of ethics that applies to the registrant’s principal executive officer, principal financial officer, principal accounting officer or controller or persons performing similar functions.
Item 3. Audit Committee Financial Expert.
The Board of Trustees of the registrant has determined that David Downes, the Board’s Audit Committee Chairman, is an audit committee financial expert and that Mr. Downes is “independent” for purposes of this Item 3.
Item 4. Principal Accountant Fees and Services.
The principal accountant for the audit of the registrant’s annual financial statements billed $48,500 in fiscal 2012 and $48,500 in fiscal 2011.
The principal accountant for the audit of the registrant’s annual financial statements billed no such fees in fiscal 2012 and $1,500 in fiscal 2011.
The principal accountant for the audit of the registrant’s annual financial statements billed $371,806 in fiscal 2012 and $206,000 in fiscal 2011 to the registrant’s investment adviser or any entity controlling, controlled by, or under common control with the adviser that provides ongoing services to the registrant.
Such services include: internal control reviews and professional services for GIPs attestation procedures.
The principal accountant for the audit of the registrant’s annual financial statements billed $11,200 in fiscal 2012 and $7,650 in fiscal 2011.
The principal accountant for the audit of the registrant’s annual financial statements billed $317,764 in fiscal 2012 and no such fees in fiscal 2011 to the registrant’s investment adviser or any entity controlling, controlled by, or under common control with the adviser that provides ongoing services to the registrant.
Such services include: tax compliance, tax planning and tax advice. Tax compliance generally involves preparation of original and amended tax returns, claims for a refund and tax payment-planning services. Tax planning and tax advice includes assistance with tax audits and appeals, tax advice related to mergers and acquisitions and requests for rulings or technical advice from taxing authorities.
The principal accountant for the audit of the registrant’s annual financial statements billed no such fees during the last two fiscal years.
The principal accountant for the audit of the registrant’s annual financial statements billed no such fees during the last two fiscal years to the registrant’s investment adviser or any entity controlling, controlled by, or under common control with the adviser that provides ongoing services to the registrant.
Such fees would include the cost to the principal accountant of attending audit committee meetings and consultations regarding the registrant’s retirement plan with respect to its trustees.
| (e) | (1) During its regularly scheduled periodic meetings, the registrant’s audit committee will pre-approve all audit, audit-related, tax and other services to be provided by the principal accountants of the registrant. |
The audit committee has delegated pre-approval authority to its Chairman for any subsequent new engagements that arise between regularly scheduled meeting dates provided that any fees such pre-approved are presented to the audit committee at its next regularly scheduled meeting.
Under applicable laws, pre-approval of non-audit services maybe waived provided that: 1) the aggregate amount of all such services provided constitutes no more than five percent of the total amount of fees paid by the registrant to it principal accountant during the fiscal year in which services are provided 2) such services were not recognized by the registrant at the time of engagement as non-audit services and 3) such services are promptly brought to the attention of the audit committee of the registrant and approved prior to the completion of the audit.
(2) 100%
| (f) | Not applicable as less than 50%. |
| (g) | The principal accountant for the audit of the registrant’s annual financial statements billed $700,770 in fiscal 2012 and $215,150 in fiscal 2011 to the registrant and the registrant’s investment adviser or any entity controlling, controlled by, or under common control with the adviser that provides ongoing services to the registrant related to non-audit fees. Those billings did not include any prohibited non-audit services as defined by the Securities Exchange Act of 1934. |
| (h) | The registrant’s audit committee of the board of trustees has considered whether the provision of non-audit services that were rendered to the registrant’s investment adviser, and any entity controlling, controlled by, or under common control with the investment adviser that provides ongoing services to the registrant that were not pre-approved pursuant to paragraph (c)(7)(ii) of Rule 2-01 of Regulation S-X is compatible with maintaining the principal accountant’s independence. No such services were rendered. |
Item 5. Audit Committee of Listed Registrants
Not applicable.
Item 6. Schedule of Investments.
a) Not applicable. The complete schedule of investments is included in Item 1 of this Form N-CSR.
b) Not applicable.
Item 7. Disclosure of Proxy Voting Policies and Procedures for Closed-End Management Investment Companies.
Not applicable.
Item 8. Portfolio Managers of Closed-End Management Investment Companies.
Not applicable.
Item 9. Purchases of Equity Securities by Closed-End Management Investment Company and Affiliated Purchasers.
Not applicable.
Item 10. Submission of Matters to a Vote of Security Holders.
The Fund’s Governance Committee Provisions with Respect to Nominations of Directors/Trustees to the Respective Boards
| 1. | The Fund’s Governance Committee (the “Committee”) will evaluate potential Board candidates to assess their qualifications. The Committee shall have the authority, upon approval of the Board, to retain an executive search firm to assist in this effort. The Committee may consider recommendations by business and personal contacts of current Board members and by executive search firms which the Committee may engage from time to time and may also consider shareholder recommendations. The Committee may consider the advice and recommendation of the Funds’ investment manager and its affiliates in making the selection. |
| 2. | The Committee shall screen candidates for Board membership. The Committee has not established specific qualifications that it believes must be met by a trustee nominee. In evaluating trustee nominees, the Committee considers, among other things, an individual’s background, skills, and experience; whether the individual is an “interested person” as defined in the Investment Company Act of 1940; and whether the individual would be deemed an “audit committee financial expert” within the meaning of applicable SEC rules. The Committee also considers whether the individual’s background, skills, and experience will complement the background, skills, and experience of other nominees and will contribute to the Board. There are no differences in the manner in which the Committee evaluates nominees for trustees based on whether the nominee is recommended by a shareholder. |
| 3. | The Committee may consider nominations from shareholders for the Board at such times as the Committee meets to consider new nominees for the Board. The Committee shall have the sole discretion to determine the candidates to present to the Board and, in such cases where required, to shareholders. Recommendations for trustee nominees should, at a minimum, be accompanied by the following: |
| | • | | the name, address, and business, educational, and/or other pertinent background of the person being recommended; |
| | • | | a statement concerning whether the person is an “interested person” as defined in the Investment Company Act of 1940; |
| | • | | any other information that the Funds would be required to include in a proxy statement concerning the person if he or she was nominated; and |
| | • | | the name and address of the person submitting the recommendation and, if that person is a shareholder, the period for which that person held Fund shares. |
The recommendation also can include any additional information which the person submitting it believes would assist the Committee in evaluating the recommendation.
| 4. | Shareholders should note that a person who owns securities issued by Massachusetts Mutual Life Insurance Company (the parent company of the Funds’ investment adviser) would be deemed an “interested person” under the Investment Company Act of 1940. In addition, certain other relationships with Massachusetts Mutual Life Insurance Company or its subsidiaries, with registered broker-dealers, or with the Funds’ outside legal counsel may cause a person to be deemed an “interested person.” |
| 5. | Before the Committee decides to nominate an individual as a trustee, Committee members and other directors customarily interview the individual in person. In addition, the individual customarily is asked to complete a detailed questionnaire which is designed to elicit information which must be disclosed under SEC and stock exchange rules and to determine whether the individual is subject to any statutory disqualification from serving as a trustee of a registered investment company. |
Item 11. Controls and Procedures.
Based on their evaluation of the registrant’s disclosure controls and procedures (as defined in rule 30a-3(c) under the Investment Company Act of 1940 (17 CFR 270.30a-3(c)) as of 6/29/2012, the registrant’s principal executive officer and principal financial officer found the registrant’s disclosure controls and procedures to provide reasonable assurances that information required to be disclosed by the registrant in the reports that it files under the Securities Exchange Act of 1934 (a) is accumulated and communicated to registrant’s management, including its principal executive officer and principal financial officer, to allow timely decisions regarding required disclosure, and (b) is recorded, processed, summarized and reported, within the time periods specified in the rules and forms adopted by the U.S. Securities and Exchange Commission.
There have been no changes in the registrant’s internal controls over financial reporting that occurred during the registrant’s second fiscal quarter of the period covered by this report that have materially affected, or are reasonably likely to materially affect, the registrant’s internal control over financial reporting.
Item 12. Exhibits.
| (a) | (1) Exhibit attached hereto. |
(2) Exhibits attached hereto.
(3) Not applicable.
| (b) | Exhibit attached hereto. |
SIGNATURES
Pursuant to the requirements of the Securities Exchange Act of 1934 and the Investment Company Act of 1940, the registrant has duly caused this report to be signed on its behalf by the undersigned, thereunto duly authorized.
Oppenheimer Gold & Special Minerals Fund
| | |
| |
| By: | | /s/ William F. Glavin, Jr. |
| | William F. Glavin, Jr. |
| | Principal Executive Officer |
| |
Date: | | 8/9/2012 |
Pursuant to the requirements of the Securities Exchange Act of 1934 and the Investment Company Act of 1940, this report has been signed below by the following persons on behalf of the registrant and in the capacities and on the dates indicated.
| | |
| |
| By: | | /s/ William F. Glavin, Jr. |
| | William F. Glavin, Jr. |
| | Principal Executive Officer |
| |
Date: | | 8/9/2012 |
| | |
| |
| By: | | /s/ Brian W. Wixted |
| | Brian W. Wixted |
| | Principal Financial Officer |
| |
Date: | | 8/9/2012 |