UNITED STATES
SECURITIES AND EXCHANGE COMMISSION
WASHINGTON, D.C. 20549
FORM N-CSR
CERTIFIED SHAREHOLDER REPORT OF REGISTERED
MANAGEMENT INVESTMENT COMPANIES
Investment Company Act file number 811-3694
Oppenheimer Gold & Special Minerals Fund
(Exact name of registrant as specified in charter)
6803 South Tucson Way, Centennial, Colorado 80112-3924
(Address of principal executive offices) (Zip code)
Arthur S. Gabinet
OFI Global Asset Management, Inc.
Two World Financial Center, New York, New York 10281-1008
(Name and address of agent for service)
Registrant’s telephone number, including area code: (303) 768-3200
Date of fiscal year end: June 30
Date of reporting period: 6/30/2014
| Item 1. | Reports to Stockholders. |
Table of Contents
Class A Shares
AVERAGE ANNUAL TOTAL RETURNS AT 6/30/14
| | | | | | | | |
| | | Class A Shares of the Fund | | |
| | | Without Sales Charge | | With Sales Charge | | | | MSCI World Index |
1-Year | | 20.91% | | 13.96% | | | | 24.05% |
5-Year | | -1.67 | | -2.82 | | | | 14.99 |
10-Year | | 7.72 | | 7.08 | | | | 7.25 |
Performance data quoted represents past performance, which does not guarantee future results. The investment return and principal value of an investment in the Fund will fluctuate so that an investor’s shares, when redeemed, may be worth more or less than their original cost. Fund returns include changes in share price, reinvested distributions, and a 5.75% maximum applicable sales charge except where “without sales charge” is indicated. Current performance may be lower or higher than the performance quoted. Returns do not consider capital gains or income taxes on an individual’s investment. Returns for periods less than one year are cumulative and not annualized. For performance data current to the most recent month-end, visit oppenheimerfunds.com or call 1.800.CALL OPP (225.5677).
2 OPPENHEIMER GOLD & SPECIAL MINERALS FUND
Fund Performance Discussion
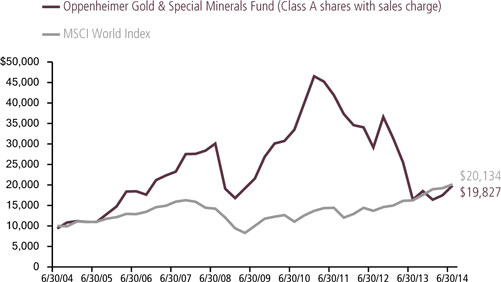
The Fund’s Class A shares (without sales charge) produced a total return of 20.91% during the 12-month reporting period, underperforming its benchmark, the MSCI World Index (the “Index”), which returned 24.05%. The Fund’s underperformance to the broader global equity market occurred over the first half of the reporting period, when gold stocks and gold bullion remained out of favor among investors, mainly due to their preference for companies that are more leveraged to recovering U.S. and global economies. However, despite bouts of volatility in the price of gold, gold and mining equities produced strong results over the second half of the reporting period due to a variety of factors, including concerns in emerging markets, rising geopolitical risks in Russia and Ukraine, and the Middle East, and falling real interest rates. This rally helped drive the Fund’s strong absolute performance during the reporting period. The Fund also significantly outperformed the Index over the second half of the reporting period, with the Fund’s Class A shares (without sales charge) producing a cumulative total return of 20.99%, versus the Index’s return of 6.18%.
MARKET OVERVIEW
After a sharp rally over the summer of 2013 amid global economic weakness and in the wake of news that the Federal Reserve (the “Fed”) would begin to back away from its
massive quantitative easing program sooner than expected, gold prices declined sharply through the end of the year. Investors at the time turned away from gold bullion and gold
COMPARISON OF CHANGE IN VALUE OF $10,000 HYPOTHETICAL INVESTMENTS IN:
3 OPPENHEIMER GOLD & SPECIAL MINERALS FUND
stocks as economic conditions appeared to improve in most developed markets. Falling unemployment rates and recovering housing markets in the United States, the end of a long recession and banking crisis in Europe, and newly stimulative fiscal and monetary policies in Japan caused investors to move away from traditional safe havens such as gold in favor of riskier investments.
Investor sentiment shifted again soon after the start of 2014, when renewed concerns about economic instability in the emerging markets caused some analysts to question the sustainability of the global economic recovery. In addition, unusually severe winter weather throughout the United States contributed to a 2.1% (annualized) domestic economic contraction over the first quarter of the year, and newly risk-averse investors responded negatively to rising geopolitical tensions between Russia and Ukraine. As a result, by mid-March, gold prices had regained many of the losses incurred over the previous months.
However, gold prices fell again as the U.S. and global economic recoveries seemed to get back on track in the spring. Robust U.S. employment gains and mildly encouraging economic data in Europe helped address investors’ concerns. Nonetheless, gold prices remained volatile through the end of the reporting period, alternately gaining and losing value in the midst of frequent changes in investor sentiment stemming from changing economic, inflation, and geopolitical expectations. Meanwhile, the
stocks of gold producers benefited from the growing realization among investors that many were selling at attractive valuations, as evidenced by increased levels of mergers-and-acquisitions activity in the industry group as larger producers sought to replace depleted reserves by purchasing smaller companies.
In this tumultuous market environment, well-established gold producers with track records of success generally outperformed early-stage companies with greater growth potential.
FUND PERFORMANCE
Over much of the reporting period, we maintained a conservative investment posture in which we favored the stocks of larger, better known gold producers. This strategy supported the Fund’s relative performance and sheltered it to a degree from heightened market volatility over the first half of the reporting period.
We began to adopt a more opportunistic approach in early 2014, when market volatility presented a number of short-term trading opportunities in gold stocks that we believed had been punished more severely than was warranted. We also began to shift our longer-term investment focus from the largest gold producers to mid-sized companies with good liquidity characteristics and high-quality assets. In our judgment, mid-sized companies generally offered greater growth potential and more attractive valuations, while larger companies were relatively richly valued and likely to grow more slowly. Indeed, this adjustment
4 OPPENHEIMER GOLD & SPECIAL MINERALS FUND
positioned the Fund to participate more fully in gains posted by some of the Fund’s better performers over the first six months of 2014, as strong growth potential and high-quality assets buoyed the stock prices of holdings such as Eldorado Gold Corp., New Gold, Inc., Nevsun Resources Ltd., and OceanaGold Corp. In addition, the Fund benefited from gains in Australia-based Papillon Resources Ltd. when the company received a takeover offer at a premium to its stock price at the time.
While the Fund focused primarily on gold producers, it also held positions in companies producing silver and copper. Silver Wheaton Corp., a silver mining company, benefited from robust demand for a limited supply of the precious metal, and the stock fared better than market averages over the reporting period.
On the other hand, company-specific developments affecting other positions produced shortfalls that offset gains from the winners discussed above. For example, base metals producer Duluth Metals Ltd. struggled with geopolitical risks in many of the developing countries in which it operates. Turkey-based gold company Koza Altin Isletmeleri AS declined despite strong
business fundamentals due to political problems in its home country. In Australia, Regis Resources Ltd. was hurt by production issues.
STRATEGY & OUTLOOK
As of the reporting period’s end, the gold market appears to be at a crossroads, and we intend to monitor the market carefully for potential challenges and opportunities. Near-term developments in international relations, central bank policies, inflationary pressures, and the direction of the global economy seem likely to influence both the price of gold bullion and the prospects for gold stocks over the months ahead.
In the meantime, recent economic data has led us to establish a generally constructive investment posture. As investors’ risk appetites increase, we believe gold stocks could produce higher returns over the coming months than gold bullion, and we expect smaller, earlier stage companies to outpace their larger counterparts. Therefore, as of the end of the reporting period, we have continued to gradually increase the Fund’s exposure to faster growing, mid-sized companies while maintaining the Fund’s core positions in industry leaders.
| | |
 | |  |
| | Shanquan Li Portfolio Manager |
5 OPPENHEIMER GOLD & SPECIAL MINERALS FUND
Top Holdings and Allocations
TOP TEN COMMON STOCK HOLDINGS
| | |
Randgold Resources Ltd., ADR | | 6.7% |
Franco-Nevada Corp. | | 6.2 |
Royal Gold, Inc. | | 5.4 |
Goldcorp, Inc. | | 4.8 |
Silver Wheaton Corp. | | 4.1 |
Eldorado Gold Corp. | | 3.5 |
Agnico Eagle Mines Ltd. | | 3.5 |
B2Gold Corp. | | 3.5 |
New Gold, Inc. | | 2.9 |
Detour Gold Corp. | | 2.9 |
Portfolio holdings and allocations are subject to change. Percentages are as of June 30, 2014, and are based on net assets. For more current Fund holdings, please visit oppenheimerfunds.com.
REGIONAL ALLOCATION
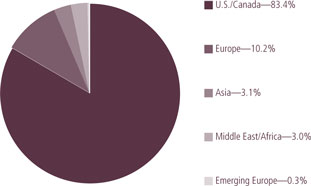
Portfolio holdings and allocations are subject to change. Percentages are as of June 30, 2014, and are based on the total market value of investments.
6 OPPENHEIMER GOLD & SPECIAL MINERALS FUND
Share Class Performance
AVERAGE ANNUAL TOTAL RETURNS WITHOUT SALES CHARGE AS OF 6/30/14
| | | | | | | | | | |
| | | Inception Date | | 1-Year | | 5-Year | | 10-Year | | |
Class A (OPGSX) | | 7/19/83 | | 20.91% | | -1.67% | | 7.72% | | |
Class B (OGMBX) | | 11/1/95 | | 19.87% | | -2.49% | | 7.20% | | |
Class C (OGMCX) | | 11/1/95 | | 19.90% | | -2.40% | | 6.91% | | |
Class I (OGMIX) | | 10/26/12 | | 21.55% | | -28.50%* | | N/A | | |
Class N (OGMNX) | | 3/1/01 | | 20.57% | | -1.97% | | 7.39% | | |
Class Y (OGMYX) | | 9/7/10 | | 21.18% | | -15.58%* | | N/A | | |
AVERAGE ANNUAL TOTAL RETURNS WITH SALES CHARGE AS OF 6/30/14 |
| | | Inception Date | | 1-Year | | 5-Year | | 10-Year | | |
Class A (OPGSX) | | 7/19/83 | | 13.96% | | -2.82% | | 7.08% | | |
Class B (OGMBX) | | 11/1/95 | | 14.87% | | -2.81% | | 7.20% | | |
Class C (OGMCX) | | 11/1/95 | | 18.90% | | -2.40% | | 6.91% | | |
Class I (OGMIX) | | 10/26/12 | | 21.55% | | -28.50%* | | N/A | | |
Class N (OGMNX) | | 3/1/01 | | 19.57% | | -1.97% | | 7.39% | | |
Class Y (OGMYX) | | 9/7/10 | | 21.18% | | -15.58%* | | N/A | | |
| *Shows performance since inception. |
Performance data quoted represents past performance, which does not guarantee future results. The investment return and principal value of an investment in the Fund will fluctuate so that an investor’s shares, when redeemed, may be worth more or less than their original cost. Current performance may be lower or higher than the performance quoted. Returns do not consider capital gains or income taxes on an individual’s investment. For performance data current to the most recent month-end, visit oppenheimerfunds.com or call 1.800.CALL OPP (225.5677). Fund returns include changes in share price, reinvested distributions, and the applicable sales charge: for Class A shares, the current maximum initial sales charge of 5.75%; for Class B shares, the contingent deferred sales charge (“CDSC”) of 5% (1-year) and 2% (5-year); and for Class C and N shares, CDSC of 1% for the 1-year period. As of July 1, 2014, Class N shares will be renamed Class R shares. Beginning July 1, 2014, new purchases of Class R shares will no longer be subject to a CDSC upon redemption (any CDSC will remain in effect for purchases prior to July 1, 2014). There is no sales charge for Class I and Class Y shares. Because Class B shares convert to Class A shares 72 months after purchase, the 10-year return for Class B shares uses Class A performance for the period after conversion.
The Fund’s performance is compared to the performance of the MSCI World Index, an index of issuers listed on the stock exchanges of foreign countries and the United States. It is widely recognized as a measure of global stock market performance. The Index is unmanaged and cannot be purchased directly by investors. While index comparisons may be useful to provide a benchmark for the Fund’s performance, it must be noted that the Fund’s investments are not limited to the investments comprising the indices. Index performance includes reinvestment of income, but does not reflect transaction costs, fees, expenses or taxes. Index
7 OPPENHEIMER GOLD & SPECIAL MINERALS FUND
performance is shown for illustrative purposes only as a benchmark for the Fund’s performance, and does not predict or depict performance of the Fund. The Fund’s performance reflects the effects of the Fund’s business and operating expenses.
The Fund’s investment strategy and focus can change over time. The mention of specific fund holdings does not constitute a recommendation by OppenheimerFunds, Inc. or its affiliates.
Before investing in any of the Oppenheimer funds, investors should carefully consider a fund’s investment objectives, risks, charges and expenses. Fund prospectuses and summary prospectuses contain this and other information about the funds, and may be obtained by asking your financial advisor, visiting oppenheimerfunds.com, or calling 1.800.CALL OPP (225.5677). Read prospectuses and summary prospectuses carefully before investing.
Shares of Oppenheimer funds are not deposits or obligations of any bank, are not guaranteed by any bank, are not insured by the FDIC or any other agency, and involve investment risks, including the possible loss of the principal amount invested.
8 OPPENHEIMER GOLD & SPECIAL MINERALS FUND
Fund Expenses
Fund Expenses. As a shareholder of the Fund, you incur two types of costs: (1) transaction costs, which may include sales charges (loads) on purchase payments, contingent deferred sales charges on redemptions; and (2) ongoing costs, including management fees; distribution and service fees; and other Fund expenses. These examples are intended to help you understand your ongoing costs (in dollars) of investing in the Fund and to compare these costs with the ongoing costs of investing in other mutual funds.
The examples are based on an investment of $1,000.00 invested at the beginning of the period and held for the entire 6-month period ended June 30, 2014.
Actual Expenses. The first section of the table provides information about actual account values and actual expenses. You may use the information in this section for the class of shares you hold, together with the amount you invested, to estimate the expense that you paid over the period. Simply divide your account value by $1,000.00 (for example, an $8,600.00 account value divided by $1,000.00 = 8.60), then multiply the result by the number in the first section under the heading entitled “Expenses Paid During Period” to estimate the expenses you paid on your account during this period.
Hypothetical Example for Comparison Purposes. The second section of the table provides information about hypothetical account values and hypothetical expenses based on the Fund’s actual expense ratio for each class of shares, and an assumed rate of return of 5% per year for each class before expenses, which is not the actual return. The hypothetical account values and expenses may not be used to estimate the actual ending account balance or expenses you paid for the period. You may use this information to compare the ongoing costs of investing in the Fund and other funds. To do so, compare this 5% hypothetical example for the class of shares you hold with the 5% hypothetical examples that appear in the shareholder reports of the other funds.
Please note that the expenses shown in the table are meant to highlight your ongoing costs only and do not reflect any transactional costs, such as front-end or contingent deferred sales charges (loads). Therefore, the “hypothetical” section of the table is useful in comparing ongoing costs only, and will not help you determine the relative total costs of owning different funds. In addition, if these transactional costs were included, your costs would have been higher.
9 OPPENHEIMER GOLD & SPECIAL MINERALS FUND
| | | | | | | | | | | | | | | | | | |
| Actual | | Beginning Account Value January 1, 2014 | | Ending Account Value June 30, 2014 | | Expenses Paid During 6 Months Ended June 30, 2014 |
Class A | | $ | 1,000.00 | | | | | $ | 1,209.90 | | | | | $ | 6.43 | | | |
Class B | | | 1,000.00 | | | | | | 1,204.90 | | | | | | 10.98 | | | |
Class C | | | 1,000.00 | | | | | | 1,205.20 | | | | | | 10.60 | | | |
Class I | | | 1,000.00 | | | | | | 1,213.20 | | | | | | 3.85 | | | |
Class N | | | 1,000.00 | | | | | | 1,208.70 | | | | | | 7.64 | | | |
Class Y | | | 1,000.00 | | | | | | 1,211.10 | | | | | | 5.44 | | | |
| | | | | | |
| Hypothetical | | | | | | | | | | | | | | | | | | |
(5% return before expenses) | | | | | | | | | | | | | | | | | | |
Class A | | | 1,000.00 | | | | | | 1,018.99 | | | | | | 5.87 | | | |
Class B | | | 1,000.00 | | | | | | 1,014.88 | | | | | | 10.04 | | | |
Class C | | | 1,000.00 | | | | | | 1,015.22 | | | | | | 9.69 | | | |
Class I | | | 1,000.00 | | | | | | 1,021.32 | | | | | | 3.51 | | | |
Class N | | | 1,000.00 | | | | | | 1,017.90 | | | | | | 6.98 | | | |
Class Y | | | 1,000.00 | | | | | | 1,019.89 | | | | | | 4.97 | | | |
Expenses are equal to the Fund’s annualized expense ratio for that class, multiplied by the average account value over the period, multiplied by 181/365 (to reflect the one-half year period). Those annualized expense ratios, excluding indirect expenses from affiliated funds, based on the 6-month period ended June 30, 2014 are as follows:
| | | | | | |
| Class | | Expense Ratios | | | |
Class A | | | 1.17 | % | | |
Class B | | | 2.00 | | | |
Class C | | | 1.93 | | | |
Class I | | | 0.70 | | | |
Class N | | | 1.39 | | | |
Class Y | | | 0.99 | | | |
The expense ratios reflect voluntary and/or contractual waivers and/or reimbursements of expenses by the Fund’s Manager and Transfer Agent. Some of these undertakings may be modified or terminated at any time, as indicated in the Fund’s prospectus. The “Consolidated Financial Highlights” tables in the Fund’s consolidated financial statements, included in this report, also show the gross expense ratios, without such waivers or reimbursements and reduction to custodian expenses, if applicable.
10 OPPENHEIMER GOLD & SPECIAL MINERALS FUND
CONSOLIDATED
STATEMENT OF INVESTMENTS June 30, 2014
| | | | | | | | |
| | | Shares | | | Value | |
| |
Common Stocks—93.2% | | | | | | | | |
| |
Materials—93.2% | | | | | | | | |
| |
Metals & Mining—93.2% | | | | | | | | |
| |
Agnico Eagle Mines Ltd.1 | | | 1,350,000 | | | $ | 51,705,000 | |
| |
Alamos Gold, Inc.1 | | | 3,085,187 | | | | 31,208,582 | |
| |
Allied Nevada Gold Corp.2 | | | 600,000 | | | | 2,256,000 | |
| |
Alrosa AO2 | | | 3,600,000 | | | | 4,429,138 | |
| |
AngloGold Ashanti Ltd., Sponsored ADR1,2 | | | 418,590 | | | | 7,203,934 | |
| |
Argonaut Gold, Inc.2 | | | 4,000,000 | | | | 16,569,046 | |
| |
Asanko Gold, Inc.2 | | | 422,708 | | | | 1,101,287 | |
| |
AuRico Gold, Inc. | | | 3,300,000 | | | | 14,058,000 | |
| |
B2Gold Corp.2 | | | 17,607,749 | | | | 51,333,236 | |
| |
Barrick Gold Corp.1 | | | 50,000 | | | | 915,000 | |
| |
Beadell Resources Ltd.2 | | | 14,300,000 | | | | 8,363,417 | |
| |
Centamin plc2 | | | 3,100,000 | | | | 3,393,359 | |
| |
Centerra Gold, Inc. | | | 4,900,000 | | | | 30,904,831 | |
| |
Continental Gold Ltd.2 | | | 3,357,004 | | | | 11,011,212 | |
| |
Detour Gold Corp.2 | | | 3,103,331 | | | | 42,461,583 | |
| |
Dominion Diamond Corp.2 | | | 250,000 | | | | 3,612,500 | |
| |
Duluth Metals Ltd.2,4 | | | 3,700,000 | | | | 2,045,827 | |
| |
Eldorado Gold Corp.1,3 | | | 6,800,000 | | | | 52,001,312 | |
| |
Eldorado Gold Corp.1,3 | | | 4,120,000 | | | | 31,476,800 | |
| |
First Majestic Silver Corp.2 | | | 1,800,000 | | | | 19,449,885 | |
| |
First Quantum Minerals Ltd. | | | 700,000 | | | | 14,970,245 | |
| |
Franco-Nevada Corp.1 | | | 1,581,974 | | | | 90,710,389 | |
| |
Freeport-McMoRan Copper & Gold, Inc. | | | 10,000 | | | | 365,000 | |
| |
Fresnillo plc | | | 1,870,000 | | | | 27,880,876 | |
| |
Gold Standard Ventures Corp.2 | | | 2,000,000 | | | | 1,580,000 | |
| |
Goldcorp, Inc.1 | | | 2,500,000 | | | | 69,775,000 | |
| |
IAMGOLD Corp. | | | 6,100,500 | | | | 25,134,060 | |
| |
Ivanhoe Mines Ltd., Cl. A2 | | | 5,336,600 | | | | 6,801,721 | |
| |
Ivanhoe Mines Ltd., Legend Shares, Cl. A2 | | | 1,991,340 | | | | 2,538,046 | |
| |
Kinross Gold Corp.1,2 | | | 4,419,950 | | | | 18,298,593 | |
| |
Klondex Mines Ltd.2 | | | 3,453,087 | | | | 6,472,212 | |
| |
Koza Altin Isletmeleri AS | | | 2,100,000 | | | | 23,989,530 | |
| |
Lake Shore Gold Corp.2 | | | 3,338,402 | | | | 3,034,769 | |
| |
Lundin Mining Corp.2 | | | 1,600,000 | | | | 8,801,837 | |
| |
MAG Silver Corp.2 | | | 1,405,092 | | | | 13,286,517 | |
| |
McEwen Mining, Inc.2 | | | 2,000,000 | | | | 5,760,000 | |
| |
Nevsun Resources Ltd. | | | 7,120,000 | | | | 26,700,000 | |
| |
New Gold, Inc.1,2,3 | | | 5,060,000 | | | | 32,232,200 | |
| |
New Gold, Inc.2,3 | | | 6,800,000 | | | | 43,143,245 | |
| |
Newcrest Mining Ltd.2 | | | 1,400,000 | | | | 14,160,468 | |
| |
Newmont Mining Corp.1 | | | 300,000 | | | | 7,632,000 | |
| |
Northern Star Resources Ltd. | | | 5,800,000 | | | | 7,017,442 | |
| |
Novagold Resources, Inc.2 | | | 1,900,000 | | | | 7,999,000 | |
| |
OceanaGold Corp.2 | | | 3,176,464 | | | | 9,853,424 | |
| |
Orocobre Ltd.2 | | | 1,000,000 | | | | 2,132,484 | |
| |
Osisko Gold Royalties Ltd.2 | | | 600,000 | | | | 9,024,882 | |
| |
Pan American Silver Corp. | | | 860,000 | | | | 13,201,000 | |
| |
Papillon Resources Ltd.2 | | | 2,000,000 | | | | 3,657,784 | |
11 OPPENHEIMER GOLD & SPECIAL MINERALS FUND
CONSOLIDATED STATEMENT OF INVESTMENTS Continued
| | | | | | | | |
| | | Shares | | | Value | |
| |
Metals & Mining Continued | | | | | | | | |
| |
Polymetal International plc | | | 2,105,500 | | | $ | 20,817,649 | |
| |
Pretium Resources, Inc.2 | | | 629,781 | | | | 5,211,533 | |
| |
Primero Mining Corp.2 | | | 5,248,800 | | | | 42,057,298 | |
| |
Primero Mining Corp., Legend Shares2,5 | | | 217,418 | | | | 1,742,115 | |
| |
Randgold Resources Ltd., ADR1 | | | 1,161,686 | | | | 98,278,636 | |
| |
Real Gold Mining Ltd.2 | | | 10,400,000 | | | | 13,419 | |
| |
Regis Resources Ltd. | | | 5,500,000 | | | | 8,646,941 | |
| |
Rio Alto Mining Ltd.2 | | | 6,500,000 | | | | 15,107,071 | |
| |
Romarco Minerals, Inc.2,4 | | | 30,127,000 | | | | 25,128,185 | |
| |
Royal Gold, Inc.1 | | | 1,042,797 | | | | 79,377,708 | |
| |
Rubicon Minerals Corp.2 | | | 3,000,000 | | | | 4,442,154 | |
| |
Sandstorm Gold Ltd.2 | | | 800,000 | | | | 5,536,000 | |
| |
SEMAFO, Inc.1,2,4 | | | 5,099,292 | | | | 23,942,133 | |
| |
Sibanye Gold Ltd., Sponsored ADR | | | 1,250,000 | | | | 13,787,500 | |
| |
Silver Wheaton Corp.1 | | | 2,300,000 | | | | 60,421,000 | |
| |
Tahoe Resources, Inc.1,2 | | | 1,077,229 | | | | 28,223,400 | |
| |
Torex Gold Resources, Inc.2 | | | 5,010,702 | | | | 7,654,228 | |
| |
Turquoise Hill Resources Ltd.2 | | | 1,600,000 | | | | 5,344,000 | |
| |
Yamana Gold, Inc.1 | | | 5,100,000 | | | | 41,922,000 | |
| | | | | | | | |
Total Common Stocks (Cost $1,200,196,942) | | | | | | | 1,369,305,643 | |
| | |
| | | Units | | | | |
| |
Rights, Warrants and Certificates—0.0% | | | | | | | | |
| |
Ivanhoe Mines Ltd., Cl. A Wts., Strike Price 1.80CAD, 12/10/152 | | | 1,991,340 | | | | 373,242 | |
| |
Kinross Gold Corp. Wts., Strike Price $21.30, Exp. 9/17/141,2 | | | 483,450 | | | | 11,327 | |
| | | | | | | | |
Total Rights, Warrants and Certificates (Cost $289,049) | | | | | | | 384,569 | |
| | | | | | | | | | | | | | | | | | | | | | | | |
| | | | | | Exercise
Price | | | Expiration
Date | | | | | | Contracts | | | | |
| |
Exchange-Traded Options Purchased—0.0% | | | | | | | | | | | | | | | | | | | | | | | | |
| |
Gold Fields Ltd. Call2 | | | USD | | | | 4.000 | | | | 10/18/14 | | | | USD | | | | 4000 | | | | 88,000 | |
| |
Kinross Gold Corp. Call2 | | | USD | | | | 5.000 | | | | 8/16/14 | | | | USD | | | | 3000 | | | | 24,000 | |
| | | | | | | | | | | | | | | | | | | | | | | | |
Total Exchange-Traded Options Purchased (Cost $374,494) | | | | | | | | 112,000 | |
| | | | | | | | |
| | | Shares | | | | |
| |
Investment Companies—6.6% | | | | | | | | |
| |
Oppenheimer Institutional Money Market Fund, Cl. E, 0.09%4,6 | | | 26,353,105 | | | | 26,353,105 | |
| |
SPDR Gold Trust Exchange Traded Fund2 | | | 555,000 | | | | 71,062,200 | |
| | | | | | | | |
Total Investment Companies (Cost $96,932,756) | | | | | | | 97,415,305 | |
| |
Total Investments, at Value (Cost $1,297,793,241) | | | 99.8% | | | | 1,467,217,517 | |
| |
Net Other Assets (Liabilities) | | | 0.2 | | | | 2,475,868 | |
| | | | |
Net Assets | | | 100.0% | | | $ | 1,469,693,385 | |
| | | | |
Footnotes to Consolidated Statement of Investments
1. All or a portion of the security position is held in segregated accounts and pledged to cover margin requirements with respect to outstanding written options. The aggregate market value of such securities is $299,083,423. See Note 6 of the accompanying Notes.
2. Non-income producing security.
3. The Fund holds securities which have been issued by the same entity and that trade on separate exchanges.
12 OPPENHEIMER GOLD & SPECIAL MINERALS FUND
Footnotes to Consolidated Statement of Investments Continued
4. Is or was an affiliate, as defined in the Investment Company Act of 1940, at or during the period ended June 30, 2014, by virtue of the Fund owning at least 5% of the voting securities of the issuer or as a result of the Fund and the issuer having the same investment adviser. Transactions during the period in which the issuer was an affiliate are as follows:
| | | | | | | | | | | | | | | | |
| | | Shares/Units | | | Gross | | | Gross | | | Shares/Units | |
| | | June 28, 2013a | | | Additions | | | Reductions | | | June 30, 2014 | |
| |
Duluth Metals Ltd.b | | | 7,804,800 | | | | — | | | | 4,104,800 | | | | 3,700,000 | |
Duluth Metals Ltd. Wts., Strike Price | | | | | | | | | | | | | | | | |
$0.001, Exp. 7/31/13 | | | 513,653 | | | | — | | | | 513,653 | | | | — | |
Kirkland Lake Gold, Inc. | | | 4,382,900 | | | | — | | | | 4,382,900 | | | | — | |
Oppenheimer Institutional Money | | | | | | | | | | | | | | | | |
Market Fund, Cl. E | | | — | | | | 613,849,324 | | | | 587,496,219 | | | | 26,353,105 | |
Romarco Minerals, Inc b | | | 30,127,000 | | | | — | | | | — | | | | 30,127,000 | |
SEMAFO, Inc. b | | | 14,789,748 | | | | 320,000 | | | | 10,010,456 | | | | 5,099,292 | |
| | | | |
| | | | | | Value | | | Income | | | Realized Loss | |
| |
Duluth Metals Ltd.b | | | | | | $ | — c | | | $ | — | | | $ | 6,307,256 | |
Duluth Metals Ltd. Wts., Strike Price $0.001, Exp. 7/31/13 | | | | | | | — | | | | — | | | | 64,947 | |
Kirkland Lake Gold, Inc. | | | | | | | — | | | | — | | | | 35,273,270 | |
Oppenheimer Institutional Money Market Fund, Cl. E | | | | | | | 26,353,105 | | | | 20,211 | | | | — | |
Romarco Minerals, Inc b | | | | | | | — c | | | | — | | | | — | |
SEMAFO, Inc. b | | | | | | | — c | | | | — | | | | 48,203,833 | |
| | | | | | | | |
Total | | | | | | $ | 26,353,105 | | | $ | 20,211 | | | $ | 89,849,306 | |
| | | | | | | | |
a. June 28, 2013 represents the last business day of the Fund’s reporting period. See Note 1 of the accompanying Consolidated Notes.
b. No longer an affiliate as of June 30, 2014.
c. The security is no longer an affiliate, therefore the value has been excluded from this table.
5. Restricted security. The aggregate value of restricted securities as of June 30, 2014 was $1,742,115, which represents 0.12% of the Fund’s net assets. See Note 7 of the accompanying Notes. Information concerning restricted securities is as follows:
| | | | | | | | | | | | | | | | |
| Security | | Acquisition Date | | | Cost | | | Value | | | Unrealized Appreciation | |
| |
Primero Mining Corp., Legend | | | | | | | | | | | | | | | | |
Shares | | | 3/6/14 | | | $ | 1,427,707 | | | $ | 1,742,115 | | | $ | 314,408 | |
6. Rate shown is the 7-day yield as of June 30, 2014.
Distribution of investments representing geographic holdings, as a percentage of total investments at value, is as follows:
| | | | | | |
| Geographic Holdings | | Value | | | Percent |
|
Canada | | $ | 1,030,550,928 | | | 70.2% |
United States | | | 192,806,012 | | | 13.2 |
United Kingdom | | | 150,370,520 | | | 10.2 |
Australia | | | 43,978,536 | | | 3.1 |
Turkey | | | 23,989,530 | | | 1.6 |
South Africa | | | 21,079,434 | | | 1.4 |
Russia | | | 4,429,138 | | | 0.3 |
China | | | 13,419 | | | 0.0 |
| | | |
Total | | $ | 1,467,217,517 | | | 100.0% |
| | | |
13 OPPENHEIMER GOLD & SPECIAL MINERALS FUND
CONSOLIDATED STATEMENT OF INVESTMENTS Continued
| | | | | | | | | | | | | | | | | | | | | | | | |
| |
| Exchange-Traded Options Written at June 30, 2014 | |
| | | | | | Exercise | | | Expiration | | | Number of | | | Premiums | | | | |
| Description | | | | | Price | | | Date | | | Contracts | | | Received | | | Value | |
| |
Agnico Eagle Mines Ltd. Call | | | USD | | | | 40.000 | | | | 1/17/15 USD | | | | (2,000) | | | $ | 301,514 | | | $ | (630,000) | |
| |
Agnico Eagle Mines Ltd. Call | | | USD | | | | 32.500 | | | | 8/16/14 USD | | | | (2,000) | | | | 234,016 | | | | (1,130,000) | |
| |
Agnico Eagle Mines Ltd. Call | | | USD | | | | 47.500 | | | | 1/17/15 USD | | | | (2,000) | | | | 203,756 | | | | (206,000) | |
| |
Agnico Eagle Mines Ltd. Call | | | USD | | | | 42.500 | | | | 11/22/14 USD | | | | (2,000) | | | | 323,914 | | | | (372,000) | |
| |
Agnico Eagle Mines Ltd. Call | | | USD | | | | 35.000 | | | | 1/17/15 USD | | | | (2,000) | | | | 1,025,582 | | | | (1,120,000) | |
| |
Agnico Eagle Mines Ltd. Put | | | USD | | | | 30.000 | | | | 1/17/15 USD | | | | (2,000) | | | | 206,236 | | | | (188,000) | |
| |
Alamos Gold, Inc. Put | | | CAD | | | | 11.000 | | | | 7/19/14 CAD | | | | (2,000) | | | | 182,143 | | | | (84,345) | |
| |
AngloGold Ashanti Ltd. Call | | | USD | | | | 18.000 | | | | 1/17/15 USD | | | | (2,000) | | | | 203,916 | | | | (300,000) | |
| |
Coeur D Alene Mines Put | | | USD | | | | 10.000 | | | | 9/20/14 USD | | | | (1,000) | | | | 114,458 | | | | (160,000) | |
| |
Detour Gold Corp. Call | | | CAD | | | | 16.000 | | | | 1/17/15 CAD | | | | (2,000) | | | | 279,579 | | | | (337,379) | |
| |
Detour Gold Corp. Call | | | CAD | | | | 18.000 | | | | 1/17/15 CAD | | | | (2,000) | | | | 236,819 | | | | (215,547) | |
| |
Detour Gold Corp. Put | | | CAD | | | | 11.000 | | | | 1/17/15 CAD | | | | (2,000) | | | | 187,612 | | | | (159,318) | |
| |
Detour Gold Corp. Put | | | CAD | | | | 9.000 | | | | 10/18/14 CAD | | | | (2,000) | | | | 170,270 | | | | (28,115) | |
| |
Detour Gold Corp. Put | | | CAD | | | | 12.000 | | | | 1/17/15 CAD | | | | (2,000) | | | | 280,171 | | | | (224,919) | |
| |
Detour Gold Corp. Call | | | CAD | | | | 17.000 | | | | 10/18/14 CAD | | | | (2,000) | | | | 192,956 | | | | (168,689) | |
| |
First Majestic Silver Corp. Call | | | CAD | | | | 12.000 | | | | 1/17/15 CAD | | | | (3,000) | | | | 326,922 | | | | (337,379) | |
| |
Franco-Nevada Corp. Call | | | USD | | | | 60.000 | | | | 10/18/14 USD | | | | (2,000) | | | | 323,914 | | | | (470,000) | |
| |
Franco-Nevada Corp. Call | | | USD | | | | 60.000 | | | | 1/17/15 USD | | | | (3,000) | | | | 383,373 | | | | (900,000) | |
| |
Freeport-McMoRan Copper & | | | | | | | | | | | | | | | | | | | | | | | | |
Gold, Inc. Put | | | USD | | | | 31.000 | | | | 1/17/15 USD | | | | (2,000) | | | | 299,914 | | | | (164,000) | |
| |
Freeport-McMoRan Copper & | | | | | | | | | | | | | | | | | | | | | | | | |
Gold, Inc. Put | | | USD | | | | 32.000 | | | | 11/22/14 USD | | | | (1,500) | | | | 215,936 | | | | (103,500) | |
| |
Goldcorp, Inc. Call | | | USD | | | | 29.000 | | | | 1/17/15 USD | | | | (2,000) | | | | 199,356 | | | | (326,000) | |
| |
Goldcorp, Inc. Put | | | USD | | | | 20.000 | | | | 1/17/15 USD | | | | (2,000) | | | | 207,056 | | | | (46,000) | |
| |
Kinross Gold Corp. Put | | | USD | | | | 5.000 | | | | 1/17/15 USD | | | | (3,000) | | | | 330,924 | | | | (336,000) | |
| |
Newmont Mining Corp. Call | | | USD | | | | 25.000 | | | | 1/17/15 USD | | | | (2,000) | | | | 385,913 | | | | (432,000) | |
| |
Randgold Resources Ltd. Put | | | USD | | | | 67.500 | | | | 1/17/15 USD | | | | (1,000) | | | | 144,457 | | | | (137,500) | |
| |
Randgold Resources Ltd. Call | | | USD | | | | 100.000 | | | | 1/17/15 USD | | | | (2,000) | | | | 239,276 | | | | (400,000) | |
| |
Randgold Resources Ltd. Call | | | USD | | | | 82.500 | | | | 12/20/14 USD | | | | (1,000) | | | | 601,950 | | | | (750,000) | |
| |
Randgold Resources Ltd. Call | | | USD | | | | 95.000 | | | | 12/20/14 USD | | | | (2,000) | | | | 254,895 | | | | (500,000) | |
| |
Randgold Resources Ltd. Call | | | USD | | | | 100.000 | | | | 12/20/14 USD | | | | (1,000) | | | | 146,957 | | | | (162,500) | |
| |
Rio Tinto plc Put | | | USD | | | | 52.500 | | | | 7/19/14 USD | | | | (2,000) | | | | 290,086 | | | | (120,000) | |
| |
Royal Gold, Inc. Call | | | USD | | | | 85.000 | | | | 1/17/15 USD | | | | (2,000) | | | | 263,915 | | | | (620,000) | |
| |
Royal Gold, Inc. Call | | | USD | | | | 90.000 | | | | 1/17/15 USD | | | | (3,000) | | | | 543,740 | | | | (681,000) | |
| |
Royal Gold, Inc. Call | | | USD | | | | 77.500 | | | | 10/18/14 USD | | | | (3,000) | | | | 1,060,861 | | | | (1,290,000) | |
| |
Silver Wheaton Corp. Call | | | USD | | | | 28.000 | | | | 12/20/14 USD | | | | (2,000) | | | | 252,196 | | | | (300,000) | |
| |
Silver Wheaton Corp. Call | | | USD | | | | 29.000 | | | | 12/20/14 USD | | | | (3,000) | | | | 308,874 | | | | (345,000) | |
| |
Silver Wheaton Corp. Call | | | USD | | | | 30.000 | | | | 1/17/15 USD | | | | (2,000) | | | | 201,916 | | | | (206,000) | |
| |
Silver Wheaton Corp. Call | | | USD | | | | 27.000 | | | | 1/17/15 USD | | | | (2,000) | | | | 217,916 | | | | (418,000) | |
| |
SPDR Gold Trust Exchange | | | | | | | | | | | | | | | | | | | | | | | | |
Traded Fund Put | | | USD | | | | 123.000 | | | | 8/16/14 USD | | | | (1,000) | | | | 104,958 | | | | (75,000) | |
| |
SPDR Gold Trust Exchange | | | | | | | | | | | | | | | | | | | | | | | | |
Traded Fund Call | | | USD | | | | 130.000 | | | | 8/16/14 USD | | | | (1,000) | | | | 105,958 | | | | (147,000) | |
| |
Tahoe Resources, Inc. Put | | | USD | | | | 20.000 | | | | 9/20/14 USD | | | | (3,000) | | | | 418,374 | | | | (60,000) | |
| |
Tahoe Resources, Inc. Call | | | USD | | | | 25.000 | | | | 12/20/14 USD | | | | (2,000) | | | | 353,913 | | | | (660,000) | |
| | | | | | | | | | | | | | | | | | | | |
Total Exchange-Traded Options Written | | | | | | | | | | | | | | | | | | $ | 12,326,492 | | | $ | (15,311,191) | |
| | | | | | | | | | | | | | | | | | | | |
Glossary:
Currency abbreviation indicate amounts reporting in currency
CAD Canadian Dollar
See accompanying Notes to Consolidated Financial Statements.
14 OPPENHEIMER GOLD & SPECIAL MINERALS FUND
CONSOLIDATED STATEMENT OF
ASSETS AND LIABILITIES June 30, 2014
| | | | |
| |
Assets | | | | |
Investments, at value—see accompanying consolidated statement of investments: | | | | |
Unaffiliated companies (cost $1,271,440,136) | | $ | 1,440,864,412 | |
Affiliated companies (cost $26,353,105) | | | 26,353,105 | |
| | | | |
| | | 1,467,217,517 | |
| |
Cash | | | 14,208,352 | |
| |
Cash—foreign currencies (cost $1,070,328) | | | 1,070,328 | |
| |
Receivables and other assets: | | | | |
Investments sold | | | 36,122,912 | |
Shares of beneficial interest sold | | | 1,451,237 | |
Dividends | | | 396,736 | |
Other | | | 172,165 | |
| | | | |
Total assets | | | 1,520,639,247 | |
|
| |
Liabilities | | | | |
Options written, at value (premiums received $12,326,492) | | | 15,311,191 | |
| |
Payables and other liabilities: | | | | |
Investments purchased | | | 31,904,086 | |
Shares of beneficial interest redeemed | | | 3,122,075 | |
Trustees’ compensation | | | 252,113 | |
Distribution and service plan fees | | | 237,817 | |
Shareholder communications | | | 31,839 | |
Other | | | 86,741 | |
| | | | |
Total liabilities | | | 50,945,862 | |
|
| |
Net Assets | | $ | 1,469,693,385 | |
| | | | |
| | | | |
| |
Composition of Net Assets | | | | |
Paid-in capital | | $ | 2,564,805,924 | |
| |
Accumulated net investment loss | | | (25,459,897) | |
| |
Accumulated net realized loss on investments and foreign currency transactions | | | (1,236,092,440) | |
| |
Net unrealized appreciation on investments and translation of assets and liabilities denominated in foreign currencies | | | 166,439,798 | |
| | | | |
Net Assets | | $ | 1,469,693,385 | |
| | | | |
15 OPPENHEIMER GOLD & SPECIAL MINERALS FUND
CONSOLIDATED STATEMENT OF
ASSETS AND LIABILITIES Continued
| | | | |
| |
Net Asset Value Per Share | | | | |
Class A Shares: | | | | |
| |
| Net asset value and redemption price per share (based on net assets of $864,648,469 and 43,480,060 shares of beneficial interest outstanding) | | $ | 19.89 | |
| |
| Maximum offering price per share (net asset value plus sales charge of 5.75% of offering price) | | $ | 21.10 | |
| |
| |
Class B Shares: | | | | |
| |
| Net asset value, redemption price (excludes applicable contingent deferred sales charge) and offering price per share (based on net assets of $27,501,640 and 1,480,414 shares of beneficial interest outstanding) | | $ | 18.58 | |
| |
| |
Class C Shares: | | | | |
| |
| Net asset value, redemption price (excludes applicable contingent deferred sales charge) and offering price per share (based on net assets of $214,591,192 and 11,637,614 shares of beneficial interest outstanding) | | $ | 18.44 | |
| |
| |
Class I Shares: | | | | |
| |
| Net asset value, redemption price and offering price per share (based on net assets of $53,114,168 and 2,660,641 shares of beneficial interest outstanding) | | $ | 19.96 | |
| |
| |
Class N Shares: | | | | |
| |
| Net asset value, redemption price (excludes applicable contingent deferred sales charge) and offering price per share (based on net assets of $156,438,740 and 8,187,053 shares of beneficial interest outstanding) | | $ | 19.11 | |
| |
| |
Class Y Shares: | | | | |
| |
| Net asset value, redemption price and offering price per share (based on net assets of $153,399,176 and 7,728,542 shares of beneficial interest outstanding) | | $ | 19.85 | |
See accompanying Notes to Consolidated Financial Statements.
16 OPPENHEIMER GOLD & SPECIAL MINERALS FUND
CONSOLIDATED STATEMENT OF
OPERATIONS For the Year Ended June 30, 2014
| | | | |
Investment Income | | | | |
Dividends: | | | | |
Unaffiliated companies (net of foreign withholding taxes of $1,996,305) | | $ | 16,567,807 | |
Affiliated companies | | | 20,211 | |
Interest | | | 97,527 | |
Other income | | | 28,521 | |
Total investment income | | | 16,714,066 | |
Expenses | | | | |
Management fees | | | 9,436,745 | |
Distribution and service plan fees: | | | | |
Class A | | | 2,044,023 | |
Class B | | | 312,468 | |
Class C | | | 2,029,748 | |
Class N | | | 672,647 | |
Transfer and shareholder servicing agent fees: | | | | |
Class A | | | 2,553,875 | |
Class B | | | 128,269 | |
Class C | | | 583,273 | |
Class I | | | 11,239 | |
Class N | | | 493,090 | |
Class Y | | | 316,667 | |
Shareholder communications: | | | | |
Class A | | | 375,770 | |
Class B | | | 40,711 | |
Class C | | | 118,468 | |
Class I | | | 87 | |
Class N | | | 20,708 | |
Class Y | | | 120,934 | |
Custodian fees and expenses | | | 49,747 | |
Trustees’ compensation | | | 40,133 | |
Other | | | 159,029 | |
Total expenses | | | 19,507,631 | |
Less waivers and reimbursements of expenses | | | (1,039,579 | ) |
Net expenses | | | 18,468,052 | |
Net Investment Loss | | | (1,753,986 | ) |
17 OPPENHEIMER GOLD & SPECIAL MINERALS FUND
CONSOLIDATED STATEMENT OF OPERATIONS Continued
| | | | |
Realized and Unrealized Gain (Loss) | | | | |
Net realized gain (loss) on: | | | | |
Investments from: | | | | |
Unaffiliated companies (includes premiums on options exercised) | | $ | (592,447,660 | ) |
Affiliated companies | | | (89,849,306 | ) |
Closing and expiration of option contracts written | | | 6,147,830 | |
Foreign currency transactions | | | 85,051 | |
Net realized loss | | | (676,064,085 | ) |
Net change in unrealized appreciation/depreciation on: | | | | |
Investments | | | 893,321,244 | |
Translation of assets and liabilities denominated in foreign currencies | | | 32,249,126 | |
Option contracts written | | | 2,341,182 | |
Net change in unrealized appreciation/depreciation | | | 927,911,552 | |
Net Increase in Net Assets Resulting from Operations | | $ | 250,093,481 | |
| | | | |
| | | | |
See accompanying Notes to Consolidated Financial Statements.
18 OPPENHEIMER GOLD & SPECIAL MINERALS FUND
CONSOLIDATED
STATEMENTS OF CHANGES IN NET ASSETS
| | | | | | | | | | |
| | | Year Ended
June 30, 2014 | | | | | Year Ended
June 28, 20131 | |
Operations | | | | | | | | | | |
| Net investment loss | | $ | (1,753,986) | | | | | $ | (4,641,258) | |
| Net realized loss | | | (676,064,085) | | | | | | (383,747,052) | |
Net change in unrealized appreciation/depreciation | | | 927,911,552 | | | | | | (757,467,771) | |
Net increase (decrease) in net assets resulting from operations | | | 250,093,481 | | | | | | (1,145,856,081) | |
Beneficial Interest Transactions | | | | | | | | | | |
Net increase (decrease) in net assets resulting from beneficial interest transactions: | | | | | | | | | | |
Class A | | | (77,472,656) | | | | | | (185,760,959) | |
Class B | | | (12,906,378) | | | | | | (29,949,426) | |
Class C | | | (20,138,133) | | | | | | (49,676,061) | |
Class I | | | 21,060,557 | | | | | | 29,701,468 | |
Class N | | | 16,008,142 | | | | | | 2,484,053 | |
Class Y | | | 3,610,718 | | | | | | (260,192,973) | |
| | | (69,837,750) | | | | | | (493,393,898) | |
Net Assets | | | | | | | | | | |
| Total increase (decrease) | | | 180,255,731 | | | | | | (1,639,249,979) | |
| Beginning of period | | | 1,289,437,654 | | | | | | 2,928,687,633 | |
| | | |
| End of period (including accumulated net investment loss of $25,459,897 and $71,679,205, respectively) | | $ | 1,469,693,385 | | | | | $ | 1,289,437,654 | |
| | | | | | | | | | |
| | | | | | | | | | |
| | | | | | | | | | |
1. June 28, 2013 represents the last business day of the Fund’s reporting period. See Note 1 of the accompanying Consolidated Notes.
See accompanying Notes to Consolidated Financial Statements.
19 OPPENHEIMER GOLD & SPECIAL MINERALS FUND
CONSOLIDATED FINANCIAL HIGHLIGHTS
| | | | | | | | | | | | | | | | | | | | |
| Class A | | Year Ended
June 30,
2014 | | | Year Ended
June 28,
2013 1 | | | Year Ended
June 29,
2012 1 | | | Year Ended
June 30,
2011 | | | Year Ended
June 30,
2010 | |
| |
| Per Share Operating Data | | | | | | | | | | | | | | | | | | | | |
| Net asset value, beginning of period | | $ | 16.45 | | | $ | 29.22 | | | $ | 44.89 | | | $ | 39.93 | | | $ | 26.21 | |
| |
| Income (loss) from investment operations: | | | | | | | | | | | | | | | | | | | | |
Net investment income (loss)2 | | | 0.003 | | | | (0.01) | | | | (0.20) | | | | (0.28) | | | | (0.26) | |
Net realized and unrealized gain (loss) | | | 3.44 | | | | (12.76) | | | | (13.06) | | | | 10.76 | | | | 14.65 | |
| | | | |
Total from investment operations | | | 3.44 | | | | (12.77) | | | | (13.26) | | | | 10.48 | | | | 14.39 | |
| |
Dividends and/or distributions to shareholders: | | | | | | | | | | | | | | | | | | | | |
Dividends from net investment income | | | 0.00 | | | | 0.00 | | | | (0.62) | | | | (4.52) | | | | (0.67) | |
Distributions from net realized gain | | | 0.00 | | | | 0.00 | | | | (1.78) | | | | (1.00) | | | | 0.00 | |
Tax return of capital distribution | | | 0.00 | | | | 0.00 | | | | (0.01) | | | | 0.00 | | | | 0.00 | |
| | | | |
Total dividends and/or distributions to shareholders | | | 0.00 | | | | 0.00 | | | | (2.41) | | | | (5.52) | | | | (0.67) | |
| |
| Net asset value, end of period | | $ | 19.89 | | | $ | 16.45 | | | $ | 29.22 | | | $ | 44.89 | | | $ | 39.93 | |
| | | | |
| | | | | | | | | | | | | | | | |
| |
| Total Return, at Net Asset Value4 | | | 20.91% | | | | (43.70)% | | | | (30.49)% | | | | 25.22% | | | | 55.18% | |
| |
| Ratios/Supplemental Data | | | | | | | | | | | | | | | | | | | | |
Net assets, end of period (in thousands) | | $ | 864,648 | | | $ | 790,790 | | | $ | 1,611,924 | | | $ | 3,140,551 | | | $ | 2,500,205 | |
| |
Average net assets (in thousands) | | $ | 836,448 | | | $ | 1,480,784 | | | $ | 2,376,520 | | | $ | 3,277,921 | | | $ | 1,983,223 | |
| |
Ratios to average net assets:5 | | | | | | | | | | | | | | | | | | | | |
Net investment income (loss) | | | 0.00%6 | | | | (0.04)% | | | | (0.51)% | | | | (0.61)% | | | | (0.74)% | |
Total expenses7 | | | 1.29% | | | | 1.30% | | | | 1.22% | | | | 1.07% | | | | 1.12% | |
| Expenses after payments, waivers and/or reimbursements and reduction to custodian expenses | | | 1.21% | | | | 1.23% | | | | 1.20% | | | | 1.07% | | | | 1.12% | |
| |
Portfolio turnover rate | | | 95% | | | | 41% | | | | 48% | | | | 37% | | | | 20% | |
20 OPPENHEIMER GOLD & SPECIAL MINERALS FUND
1. June 28, 2013 and June 29, 2012 represent the last business days of the Fund’s reporting periods. See Note 1 of the accompanying Consolidated Notes.
2. Per share amounts calculated based on the average shares outstanding during the period.
3. Less than $0.005 per share.
4. Assumes an initial investment on the business day before the first day of the fiscal period, with all dividends and distributions reinvested in additional shares on the reinvestment date, and redemption at the net asset value calculated on the last business day of the fiscal period. Sales charges are not reflected in the total returns. Total returns are not annualized for periods less than one full year. Returns do not reflect the deduction of taxes that a shareholder would pay on fund distributions or the redemption of fund shares.
5. Annualized for periods less than one full year.
6. Less than 0.005%.
7. Total expenses including indirect expenses from affiliated fund were as follows:
| | | | | | |
| | Year Ended June 30, 2014 | | | 1.29 | % |
| | Year Ended June 28, 2013 | | | 1.30 | % |
| | Year Ended June 29, 2012 | | | 1.22 | % |
| | Year Ended June 30, 2011 | | | 1.07 | % |
| | Year Ended June 30, 2010 | | | 1.12 | % |
See accompanying Notes to Consolidated Financial Statements.
21 OPPENHEIMER GOLD & SPECIAL MINERALS FUND
CONSOLIDATED FINANCIAL HIGHLIGHTS Continued
| | | | | | | | | | | | | | | | | | | | |
| Class B | | Year Ended
June 30,
2014 | | | Year Ended
June 28,
2013 1 | | | Year Ended
June 29, 2012
1 | | | Year Ended
June 30,
2011 | | | Year Ended
June 30,
2010 | |
| |
Per Share Operating Data | | | | | | | | | | | | | | | | | | | | |
| Net asset value, beginning of period | | $ | 15.49 | | | $ | 27.77 | | | $ | 42.76 | | | $ | 38.26 | | | $ | 25.17 | |
| |
| Income (loss) from investment operations: | | | | | | | | | | | | | | | | | | | | |
Net investment loss2 | | | (0.14) | | | | (0.26) | | | | (0.48) | | | | (0.64) | | | | (0.54) | |
Net realized and unrealized gain (loss) | | | 3.23 | | | | (12.02) | | | | (12.41) | | | | 10.30 | | | | 14.06 | |
| | | | |
Total from investment operations | | | 3.09 | | | | (12.28) | | | | (12.89) | | | | 9.66 | | | | 13.52 | |
| |
Dividends and/or distributions to shareholders: | | | | | | | | | | | | | | | | | | | | |
Dividends from net investment income | | | 0.00 | | | | 0.00 | | | | (0.31) | | | | (4.16) | | | | (0.43) | |
Distributions from net realized gain | | | 0.00 | | | | 0.00 | | | | (1.78) | | | | (1.00) | | | | 0.00 | |
Tax return of capital distribution | | | 0.00 | | | | 0.00 | | | | (0.01) | | | | 0.00 | | | | 0.00 | |
| | | | |
Total dividends and/or distributions to shareholders | | | 0.00 | | | | 0.00 | | | | (2.10) | | | | (5.16) | | | | (0.43) | |
| |
| Net asset value, end of period | | $ | 18.58 | | | $ | 15.49 | | | $ | 27.77 | | | $ | 42.76 | | | $ | 38.26 | |
| | | | |
|
| |
Total Return, at Net Asset Value3 | | | 19.87% | | | | (44.18)% | | | | (31.03)% | | | | 24.19% | | | | 53.86% | |
| |
Ratios/Supplemental Data | | | | | | | | | | | | | | | | | | | | |
Net assets, end of period (in thousands) | | $ | 27,502 | | | $ | 35,001 | | | $ | 95,198 | | | $ | 171,961 | | | $ | 149,228 | |
| |
Average net assets (in thousands) | | $ | 31,281 | | | $ | 78,911 | | | $ | 139,623 | | | $ | 178,499 | | | $ | 137,358 | |
| |
Ratios to average net assets:4 | | | | | | | | | | | | | | | | | | | | |
Net investment loss | | | (0.81)% | | | | (0.94)% | | | | (1.29)% | | | | (1.44)% | | | | (1.61)% | |
Total expenses5 | | | 2.23% | | | | 2.21% | | | | 2.01% | | | | 1.91% | | | | 1.98% | |
| Expenses after payments, waivers and/or reimbursements and reduction to custodian expenses | | | 2.05% | | | | 2.09% | | | | 1.99% | | | | 1.91% | | | | 1.98% | |
| |
Portfolio turnover rate | | | 95% | | | | 41% | | | | 48% | | | | 37% | | | | 20% | |
22 OPPENHEIMER GOLD & SPECIAL MINERALS FUND
1. June 28, 2013 and June 29, 2012 represent the last business days of the Fund’s reporting periods. See Note 1 of the accompanying Consolidated Notes.
2. Per share amounts calculated based on the average shares outstanding during the period.
3. Assumes an initial investment on the business day before the first day of the fiscal period, with all dividends and distributions reinvested in additional shares on the reinvestment date, and redemption at the net asset value calculated on the last business day of the fiscal period. Sales charges are not reflected in the total returns. Total returns are not annualized for periods less than one full year. Returns do not reflect the deduction of taxes that a shareholder would pay on fund distributions or the redemption of fund shares.
4. Annualized for periods less than one full year.
5. Total expenses including indirect expenses from affiliated fund were as follows:
| | | | | | |
| | Year Ended June 30, 2014 | | | 2.23 | % |
| | Year Ended June 28, 2013 | | | 2.21 | % |
| | Year Ended June 29, 2012 | | | 2.01 | % |
| | Year Ended June 30, 2011 | | | 1.91 | % |
| | Year Ended June 30, 2010 | | | 1.98 | % |
See accompanying Notes to Consolidated Financial Statements.
23 OPPENHEIMER GOLD & SPECIAL MINERALS FUND
CONSOLIDATED FINANCIAL HIGHLIGHTS Continued
| | | | | | | | | | | | | | | | | | | | |
| Class C | | Year Ended
June 30,
2014 | | | Year Ended
June 28, 2013
1 | | | Year Ended
June 29, 2012
1 | | | Year Ended
June 30,
2011 | | | Year Ended
June 30,
2010 | |
| |
Per Share Operating Data | | | | | | | | | | | | | | | | | | | | |
| Net asset value, beginning of period | | $ | 15.37 | | | $ | 27.52 | | | $ | 42.46 | | | $ | 38 .04 | | | $ | 25 .05 | |
| |
| Income (loss) from investment operations: | | | | | | | | | | | | | | | | | | | | |
| Net investment loss2 | | | (0.13) | | | | (0.21) | | | | (0.43) | | | | (0.60) | | | | (0.50) | |
| Net realized and unrealized gain (loss) | | | 3.20 | | | | (11.94) | | | | (12.32) | | | | 10.26 | | | | 13.98 | |
| | | | |
| Total from investment operations | | | 3.07 | | | | (12.15) | | | | (12.75) | | | | 9.66 | | | | 13.48 | |
| |
| Dividends and/or distributions to shareholders: | | | | | | | | | | | | | | | | | | | | |
| Dividends from net investment income | | | 0.00 | | | | 0.00 | | | | (0.40) | | | | (4.24) | | | | (0.49) | |
| Distributions from net realized gain | | | 0.00 | | | | 0.00 | | | | (1.78) | | | | (1.00) | | | | 0.00 | |
| Tax return of capital distribution | | | 0.00 | | | | 0.00 | | | | (0.01) | | | | 0.00 | | | | 0.00 | |
| | | | |
| Total dividends and/or distributions to shareholders | | | 0.00 | | | | 0.00 | | | | (2.19) | | | | (5.24) | | | | (0.49) | |
| |
| Net asset value, end of period | | $ | 18.44 | | | $ | 15.37 | | | $ | 27.52 | | | $ | 42.46 | | | $ | 38.04 | |
| | | | |
| |
Total Return, at Net Asset Value3 | | | 19.90% | | | | (44.11)% | | | | (30.96)% | | | | 24.31% | | | | 53.98% | |
| |
Ratios/Supplemental Data | | | | | | | | | | | | | | | | | | | | |
| Net assets, end of period (in thousands) | | $ | 214,591 | | | $ | 198,474 | | | $ | 416,485 | | | $ | 637,676 | | | $ | 476,835 | |
| |
| Average net assets (in thousands) | | $ | 203,399 | | | $ | 383,403 | | | $ | 559,825 | | | $ | 620,759 | | | $ | 396,328 | |
| |
| Ratios to average net assets:4 | | | | | | | | | | | | | | | | | | | | |
| Net investment loss | | | (0.78)% | | | | (0.78)% | | | | (1.16)% | | | | (1.35)% | | | | (1 .51)% | |
| Total expenses5 | | | 2.04% | | | | 1.99% | | | | 1.89% | | | | 1.81% | | | | 1 .88% | |
| Expenses after payments, waivers and/or reimbursements and reduction to custodian expenses | | | 2.01% | | | | 1.97% | | | | 1.87% | | | | 1.81% | | | | 1 .88% | |
| |
| Portfolio turnover rate | | | 95% | | | | 41% | | | | 48% | | | | 37% | | | | 20% | |
24 OPPENHEIMER GOLD & SPECIAL MINERALS FUND
1. June 28, 2013 and June 29, 2012 represent the last business days of the Fund’s reporting periods. See Note 1 of the accompanying Consolidated Notes.
2. Per share amounts calculated based on the average shares outstanding during the period.
3. Assumes an initial investment on the business day before the first day of the fiscal period, with all dividends and distributions reinvested in additional shares on the reinvestment date, and redemption at the net asset value calculated on the last business day of the fiscal period. Sales charges are not reflected in the total returns. Total returns are not annualized for periods less than one full year. Returns do not reflect the deduction of taxes that a shareholder would pay on fund distributions or the redemption of fund shares.
4. Annualized for periods less than one full year.
5. Total expenses including indirect expenses from affiliated fund were as follows:
| | | | | | | | |
| | Year Ended June 30, 2014 | | | 2.04% | | | |
| | Year Ended June 28, 2013 | | | 1.99% | | | |
| | Year Ended June 29, 2012 | | | 1.89% | | | |
| | Year Ended June 30, 2011 | | | 1.81% | | | |
| | Year Ended June 30, 2010 | | | 1.88% | | | |
See accompanying Notes to Consolidated Financial Statements.
25 OPPENHEIMER GOLD & SPECIAL MINERALS FUND
CONSOLIDATED FINANCIAL HIGHLIGHTS Continued
| | | | | | | | | | | | | | |
| | | Year Ended | | | Period Ended | | | | | | | |
| Class I | | June 30,
2014 | | | June 28,
20131,2 | | | | | | | |
| | | | | | | |
Per Share Operating Data | | | | | | | | | | | | | | |
| Net asset value, beginning of period | | $ | 16.43 | | | $ | 35.07 | | | | | | | |
| | | | | | | |
| Income (loss) from investment operations: | | | | | | | | | | | | | | |
| Net investment income3 | | | 0.08 | | | | 0.33 | | | | | | | |
| Net realized and unrealized gain (loss) | | | 3.45 | | | | (18.97) | | | | | | | |
| | | | | | | | | | |
| Total from investment operations | | | 3.53 | | | | (18.64) | | | | | | | |
| | | | | | | |
| Dividends and/or distributions to shareholders: | | | | | | | | | | | | | | |
| Dividends from net investment income | | | 0.00 | | | | 0.00 | | | | | | | |
| Distributions from net realized gain | | | 0.00 | | | | 0.00 | | | | | | | |
| Tax return of capital distribution | | | 0.00 | | | | 0.00 | | | | | | | |
| | | | | | | | | | |
| Total dividends and/or distributions to shareholders | | | 0.00 | | | | 0.00 | | | | | | | |
| | | | | | | |
| Net asset value, end of period | | $ | 19.96 | | | $ | 16.43 | | | | | | | |
| | | | | | | | | | |
| | | | | | | |
| Total Return, at Net Asset Value4 | | | 21.55% | | | | (53.14)% | | | | | | | |
| | | | | | | |
| Ratios/Supplemental Data | | | | | | | | | | | | | | |
| Net assets, end of period (in thousands) | | $ | 53,114 | | | $ | 24,687 | | | | | | | |
| | | | | | | |
| Average net assets (in thousands) | | $ | 37,622 | | | $ | 4,739 | | | | | | | |
| | | | | | | |
| Ratios to average net assets:5 | | | | | | | | | | | | | | |
| Net investment income | | | 0.46% | | | | 2.62% | | | | | | | |
| Total expenses6 | | | 0.73% | | | | 0.94% | | | | | | | |
| Expenses after payments, waivers and/or reimbursements and reduction to custodian expenses | | | 0.71% | | | | 0.92% | | | | | | | |
| | | | | | | |
| Portfolio turnover rate | | | 95% | | | | 41% | | | | | | | |
1. June 28, 2013 represents the last business day of the Funds reporting period. See Note 1 of the accompanying Consolidated Notes.
2. For the period from October 26, 2012 (inception of offering) to June 28, 2013.
3. Per share amounts calculated based on the average shares outstanding during the period.
4. Assumes an initial investment on the business day before the first day of the fiscal period, with all dividends and distributions reinvested in additional shares on the reinvestment date, and redemption at the net asset value calculated on the last business day of the fiscal period. Sales charges are not reflected in the total returns. Total returns are not annualized for periods less than one full year. Returns do not reflect the deduction of taxes that a shareholder would pay on fund distributions or the redemption of fund shares.
5. Annualized for periods less than one full year.
6. Total expenses including indirect expenses from affiliated fund were as follows:
| | | | | | | | | | |
| | | | Year Ended June 30, 2014 | | | 0.73 | % | | |
| | | | Period Ended June 28, 2013 | | | 0.94 | % | | |
See accompanying Notes to Consolidated Financial Statements.
26 OPPENHEIMER GOLD & SPECIAL MINERALS FUND
| | | | | | | | | | | | | | | | | | | | |
| Class N | | Year Ended
June 30,
2014 | | | Year Ended
June 28,
2013 1 | | | Year Ended
June 29,
2012 1 | | | Year Ended
June 30,
2011 | | | Year Ended
June 30,
2010 | |
| |
| Per Share Operating Data | | | | | | | | | | | | | | | | | | | | |
| Net asset value, beginning of period | | $ | 15.85 | | | $ | 28.23 | | | $ | 43.53 | | | $ | 38.88 | | | $ | 25.58 | |
| |
| Income (loss) from investment operations: | | | | | | | | | | | | | | | | | | | | |
| Net investment loss2 | | | (0.05) | | | | (0.08) | | | | (0.29) | | | | (0.44) | | | | (0.39) | |
| Net realized and unrealized gain | | | | | | | | | | | | | | | | | | | | |
| (loss) | | | 3.31 | | | | (12.30) | | | | (12.64) | | | | 10.49 | | | | 14.30 | |
| | | | |
| Total from investment operations | | | 3.26 | | | | (12.38) | | | | (12.93) | | | | 10.05 | | | | 13.91 | |
| |
| Dividends and/or distributions to shareholders: | | | | | | | | | | | | | | | | | | | | |
| Dividends from net investment income | | | 0.00 | | | | 0.00 | | | | (0.58) | | | | (4.40) | | | | (0.61) | |
| Distributions from net realized gain | | | 0.00 | | | | 0.00 | | | | (1.78) | | | | (1.00) | | | | 0.00 | |
| Tax return of capital distribution | | | 0.00 | | | | 0.00 | | | | (0.01) | | | | 0.00 | | | | 0.00 | |
| | | | |
| Total dividends and/or distributions to shareholders | | | 0.00 | | | | 0.00 | | | | (2.37) | | | | (5.40) | | | | (0.61) | |
| |
| Net asset value, end of period | | $ | 19.11 | | | $ | 15.85 | | | $ | 28.23 | | | $ | 43.53 | | | $ | 38.88 | |
| | | | |
|
| |
| Total Return, at Net Asset Value3 | | | 20.57% | | | | (43.86)% | | | | (30.67)% | | | | 24.79% | | | | 54.60% | |
|
| |
| Ratios/Supplemental Data | | | | | | | | | | | | | | | | | | | | |
| Net assets, end of period (in thousands) | | $ | 156,439 | | | $ | 115,079 | | | $ | 199,154 | | | $ | 263,079 | | | $ | 157,461 | |
| |
| Average net assets (in thousands) | | $ | 134,936 | | | $ | 191,117 | | | $ | 246,052 | | | $ | 236,220 | | | $ | 115,927 | |
| |
| Ratios to average net assets:4 | | | | | | | | | | | | | | | | | | | | |
| Net investment loss | | | (0.29)% | | | | (0.30)% | | | | (0.77)% | | | | (0.96)% | | | | (1.12)% | |
| Total expenses5 | | | 1.57% | | | | 1.75% | | | | 1.51% | | | | 1.43% | | | | 1.55% | |
| Expenses after payments, waivers and/or reimbursements and reduction to custodian expenses | | | 1.47% | | | | 1.52% | | | | 1.49% | | | | 1.43% | | | | 1.49% | |
| |
| Portfolio turnover rate | | | 95% | | | | 41% | | | | 48% | | | | 37% | | | | 20% | |
27 OPPENHEIMER GOLD & SPECIAL MINERALS FUND
CONSOLIDATED FINANCIAL HIGHLIGHTS Continued
1. June 28, 2013 and June 29, 2012 represent the last business days of the Fund’s reporting periods. See Note 1 of the accompanying Consolidated Notes.
2. Per share amounts calculated based on the average shares outstanding during the period.
3. Assumes an initial investment on the business day before the first day of the fiscal period, with all dividends and distributions reinvested in additional shares on the reinvestment date, and redemption at the net asset value calculated on the last business day of the fiscal period. Sales charges are not reflected in the total returns. Total returns are not annualized for periods less than one full year. Returns do not reflect the deduction of taxes that a shareholder would pay on fund distributions or the redemption of fund shares.
4. Annualized for periods less than one full year.
5. Total expenses including indirect expenses from affiliated fund were as follows:
| | | | | | | | |
| | Year Ended June 30, 2014 | | | 1.57 | % | | |
| | Year Ended June 28, 2013 | | | 1.75 | % | | |
| | Year Ended June 29, 2012 | | | 1.51 | % | | |
| | Year Ended June 30, 2011 | | | 1.43 | % | | |
| | Year Ended June 30, 2010 | | | 1.55 | % | | |
See accompanying Notes to Consolidated Financial Statements.
28 OPPENHEIMER GOLD & SPECIAL MINERALS FUND
| | | | | | | | | | | | | | | | |
| | | Year Ended | | | Year Ended | | | Year Ended | | | Period Ended | |
| Class Y | | June 30,
2014 | | | June 28, 2013 1 | | | June 29, 2012 1 | | | June 30, 20112 | |
| |
| Per Share Operating Data | | | | | | | | | | | | | | | | |
| Net asset value, beginning of period | | $ | 16.37 | | | $ | 29.06 | | | $ | 44.90 | | | $ | 45.55 | |
| |
| Income (loss) from investment operations: | | | | | | | | | | | | | | | | |
| Net investment income (loss)3 | | | 0.04 | | | | 0.01 | | | | (0.10) | | | | (0.05) | |
| Net realized and unrealized gain (loss) | | | 3.44 | | | | (12.70) | | | | (13.05) | | | | 5.09 | |
| | | | |
| Total from investment operations | | | 3.48 | | | | (12.69) | | | | (13.15) | | | | 5.04 | |
| |
| Dividends and/or distributions to shareholders: | | | | | | | | | | | | | | | | |
| Dividends from net investment income | | | 0.00 | | | | 0.00 | | | | (0.89) | | | | (4.69) | |
| Distributions from net realized gain | | | 0.00 | | | | 0.00 | | | | (1.78) | | | | (1.00) | |
| Tax return of capital distribution | | | 0.00 | | | | 0.00 | | | | (0.02) | | | | 0.00 | |
| | | | |
| Total dividends and/or distributions to shareholders | | | 0.00 | | | | 0.00 | | | | (2.69) | | | | (5.69) | |
| |
| Net asset value, end of period | | $ | 19.85 | | | $ | 16.37 | | | $ | 29.06 | | | $ | 44.90 | |
| | | | |
| |
| Total Return, at Net Asset Value4 | | | 21.18% | | | | (43.63)% | | | | (30.34)% | | | | 10.16% | |
| |
| Ratios/Supplemental Data | | | | | | | | | | | | | | | | |
| Net assets, end of period (in thousands) | | $ | 153,399 | | | $ | 125,407 | | | $ | 605,927 | | | $ | 222,043 | |
| |
| Average net assets (in thousands) | | $ | 141,136 | | | $ | 559,544 | | | $ | 568,371 | | | $ | 89,984 | |
| |
| Ratios to average net assets:5 | | | | | | | | | | | | | | | | |
| Net investment income (loss) | | | 0.24% | | | | 0.05% | | | | (0.27)% | | | | (0.13)% | |
| Total expenses6 | | | 1.01% | | | | 1.19% | | | | 1.06% | | | | 0.66% | |
| Expenses after payments, waivers and/or reimbursements and reduction to custodian expenses | | | 0.97% | | | | 1.08% | | | | 1.03% | | | | 0.66% | |
| |
| Portfolio turnover rate | | | 95% | | | | 41% | | | | 48% | | | | 37% | |
29 OPPENHEIMER GOLD & SPECIAL MINERALS FUND
CONSOLIDATED FINANCIAL HIGHLIGHTS Continued
1. June 28, 2013 and June 29, 2012 represent the last business days of the Fund’s reporting periods. See Note 1 of the accompanying Consolidated Notes.
2. For the period from September 7, 2010 (inception of offering) to June 30, 2011.
3. Per share amounts calculated based on the average shares outstanding during the period.
4. Assumes an initial investment on the business day before the first day of the fiscal period, with all dividends and distributions reinvested in additional shares on the reinvestment date, and redemption at the net asset value calculated on the last business day of the fiscal period. Sales charges are not reflected in the total returns. Total returns are not annualized for periods less than one full year. Returns do not reflect the deduction of taxes that a shareholder would pay on fund distributions or the redemption of fund shares.
5. Annualized for periods less than one full year.
6. Total expenses including indirect expenses from affiliated fund were as follows:
| | | | | | | | |
| | Year Ended June 30, 2014 | | | 1.01 | % | | |
| | Year Ended June 28, 2013 | | | 1.19 | % | | |
| | Year Ended June 29, 2012 | | | 1.06 | % | | |
| | Period Ended June 30, 2011 | | | 0.66 | % | | |
See accompanying Notes to Consolidated Financial Statements.
30 OPPENHEIMER GOLD & SPECIAL MINERALS FUND
NOTES TO CONSOLIDATED
FINANCIAL STATEMENTS June 30, 2014
1. Significant Accounting Policies
Oppenheimer Gold & Special Minerals Fund (the “Fund”) is registered under the Investment Company Act of 1940, as amended, as a non-diversified open-end management investment company. The Fund’s investment objective is to seek capital appreciation. The Fund’s investment adviser is OFI Global Asset Management, Inc. (“OFI Global” or the “Manager”), a wholly-owned subsidiary of OppenheimerFunds, Inc. (“OFI” or the “Sub-Adviser”). The Manager has entered into a sub-advisory agreement with OFI.
The Fund offers Class A, Class C, Class I, Class N and Class Y shares, and previously offered Class B shares for new purchase through June 29, 2012. Subsequent to that date, no new purchases of Class B shares are permitted, however reinvestment of dividend and/or capital gain distributions and exchanges of Class B shares into and from other Oppenheimer funds will be allowed. Class A shares are sold at their offering price, which is normally net asset value plus a front-end sales charge. Class C and Class N shares are sold, and Class B shares were sold, without a front-end sales charge but may be subject to a contingent deferred sales charge (“CDSC”). Class N shares are sold only through retirement plans. Retirement plans that offer Class N shares may impose charges on those accounts. As of July 1, 2014, Class N shares will be renamed Class R shares. Class N shares subject to a CDSC on July 1, 2014, will continue to be subject to a CDSC after the shares are renamed. Purchases of Class R shares occurring on or after July 1, 2014, will not be subject to a CDSC upon redemption. Class I and Class Y shares are sold to certain institutional investors or intermediaries without either a front-end sales charge or a CDSC, however, the intermediaries may impose charges on their accountholders who beneficially own Class I and Class Y shares. All classes of shares have identical rights and voting privileges with respect to the Fund in general and exclusive voting rights on matters that affect that class alone. Earnings, net assets and net asset value per share may differ due to each class having its own expenses, such as transfer and shareholder servicing agent fees and shareholder communications, directly attributable to that class. Class A, B, C and N shares have separate distribution and/or service plans under which they pay fees. Class I and Class Y shares do not pay such fees. Class B shares will automatically convert to Class A shares 72 months after the date of purchase.
The following is a summary of significant accounting policies consistently followed by the Fund.
Previous Annual Periods. The last day of certain of the Fund’s prior fiscal years was the last day the New York Stock Exchange was open for trading. The Fund’s financial statements have been presented through that date to maintain consistency with the Fund’s net asset value calculations used for shareholder transactions.
Basis for Consolidation. The Fund has established a Cayman Islands exempted company, Oppenheimer Gold & Special Minerals Fund (Cayman) Ltd., which is wholly-owned and controlled by the Fund (the “Subsidiary”). The Fund and Subsidiary are both managed by the Manager. The Fund may invest up to 25% of its total assets in the Subsidiary. The Subsidiary invests primarily in shares of exchange-traded funds that invest in gold bullion (“Gold ETFs”), commodity-linked derivatives related to gold or other special minerals (including commodity
31 OPPENHEIMER GOLD & SPECIAL MINERALS FUND
NOTES TO CONSOLIDATED
FINANCIAL STATEMENTS Continued
1. Significant Accounting Policies (Continued)
futures, financial futures, options and swap contracts), and certain fixed-income securities and other investments that may serve as margin or collateral for the Subsidiary’s derivatives positions. Investments in the Subsidiary are intended to provide the Fund with exposure to minerals commodities market returns within the limitations of the federal tax requirements that apply to the Fund. The Subsidiary is subject to the same investment restrictions and guidelines, and follows the same compliance policies and procedures, as the Fund.
The financial statements have been consolidated and include accounts of the Fund and the Subsidiary. Accordingly, all inter-company transactions and balances have been eliminated. At June 30, 2014, the Fund owned 4,056 shares with a market value of $85,622,867.
Investment in Oppenheimer Institutional Money Market Fund. The Fund is permitted to invest daily available cash balances in an affiliated money market fund. The Fund may invest the available cash in Class E shares of Oppenheimer Institutional Money Market Fund (“IMMF”) to seek current income while preserving liquidity. IMMF is a registered open-end management investment company, regulated as a money market fund under the Investment Company Act of 1940, as amended. The Manager is the investment adviser of IMMF, and the Sub-Adviser provides investment and related advisory services to IMMF. When applicable, the Fund’s investment in IMMF is included in the Consolidated Statement of Investments. Shares of IMMF are valued at their net asset value per share. As a shareholder, the Fund is subject to its proportional share of IMMF’s Class E expenses, including its management fee. The Manager will waive fees and/or reimburse Fund expenses in an amount equal to the indirect management fees incurred through the Fund’s investment in IMMF.
Concentration Risk. Concentration risk is the risk that the Fund’s investments in securities of companies in one industry may cause it to be more exposed to changes in that industry or market sector as compared to a more broadly diversified fund. The Fund invests primarily in the mining and metals industry.
Foreign Currency Translation. The Fund’s accounting records are maintained in U.S. dollars. The values of securities denominated in foreign currencies and amounts related to the purchase and sale of foreign securities and foreign investment income are translated into U.S. dollars as of the close of the New York Stock Exchange (the “Exchange”), normally 4:00 P.M. Eastern time, on each day the Exchange is open for trading. Foreign exchange rates may be valued primarily using a reliable bank, dealer or service authorized by the Board of Trustees.
Reported net realized gains and losses from foreign currency transactions arise from sales of portfolio securities, sales and maturities of short-term securities, sales of foreign currencies, exchange rate fluctuations between the trade and settlement dates on securities transactions, and the difference between the amounts of dividends, interest, and foreign withholding taxes recorded on the Fund’s books and the U.S. dollar equivalent of the amounts actually received or paid. Net unrealized appreciation and depreciation on the translation of assets and liabilities denominated in foreign currencies arise from changes in the values of assets and liabilities, including investments in securities at fiscal period end, resulting from changes in exchange rates.
32 OPPENHEIMER GOLD & SPECIAL MINERALS FUND
1. Significant Accounting Policies (Continued)
The effect of changes in foreign currency exchange rates on investments is separately identified from the fluctuations arising from changes in market values of securities held and reported with all other foreign currency gains and losses in the Fund’s Consolidated Statement of Operations.
Allocation of Income, Expenses, Gains and Losses. Income, expenses (other than those attributable to a specific class), gains and losses are allocated on a daily basis to each class of shares based upon the relative proportion of net assets represented by such class. Operating expenses directly attributable to a specific class are charged against the operations of that class.
Federal Taxes. The Fund intends to comply with provisions of the Internal Revenue Code applicable to regulated investment companies and to distribute substantially all of its investment company taxable income, including any net realized gain on investments not offset by capital loss carryforwards, if any, to shareholders. Therefore, no federal income or excise tax provision is required. The Fund files income tax returns in U.S. federal and applicable state jurisdictions. The statute of limitations on the Fund’s tax return filings generally remain open for the three preceding fiscal reporting period ends.
Subchapter M requires, among other things, that at least 90% of the Fund’s gross income be derived from securities or derived with respect to its business of investing in securities (typically referred to as “qualifying income”). Income from commodity-linked derivatives may not be treated as “qualifying income” for purposes of the 90% gross income requirement. The Internal Revenue Service (IRS) has previously issued a number of private letter rulings which conclude that income derived from commodity index-linked notes and investments in a wholly-owned subsidiary will be “qualifying income.” As a result, the Fund will gain exposure to commodities through commodity-linked notes and its wholly-owned subsidiary.
The IRS has suspended the granting of private letter rulings pending further review. As a result, there can be no assurance that the IRS will not change its position with respect to commodity-linked notes and wholly-owned subsidiaries. In addition, future legislation and guidance from Treasury and the IRS may adversely affect the fund’s ability to gain exposure to commodities through commodity-linked notes and its wholly-owned subsidiary.
The Fund is required to include in income for federal income tax purposes all of the subsidiary’s net income and gains whether or not such income is distributed by the subsidiary. Net income and gains from the subsidiary are generally treated as ordinary income by the Fund, regardless of the character of the subsidiary’s underlying income. Net losses from the subsidiary do not pass through to the Fund for federal income tax purposes.
The tax components of capital shown in the following table represent distribution requirements the Fund must satisfy under the income tax regulations, losses the Fund may be able to offset against income and gains realized in future years and unrealized appreciation or depreciation of securities and other investments for federal income tax purposes.
33 OPPENHEIMER GOLD & SPECIAL MINERALS FUND
NOTES TO CONSOLIDATED
FINANCIAL STATEMENTS Continued
1. Significant Accounting Policies (Continued)
| | | | | | | | | | | | |
Undistributed Net Investment Income | | Undistributed
Long-Term
Gain | | | Accumulated
Loss
Carryforward1,2,3 | | | Net Unrealized
Appreciation
Based on cost of Securities and
Other Investments
for Federal Income
Tax Purposes | |
$20,782,028 | | | $— | | | $ | 1,226,945,065 | | | | $112,337,554 | |
1. As of June 30, 2014, the Fund had $1,226,945,065 of net capital loss carryforwards available to offset future realized capital gains, if any, and thereby reduce future taxable gain distributions. Details of the capital loss carryforwards are included in the table below. Capital loss carryovers with no expiration, if any, must be utilized prior to those with expiration dates.
| | | | |
| Expiring | | | |
No expiration | | $ | 1,226,945,065 | |
2. During the fiscal year ended June 30, 2014, the Fund did not utilize any capital loss carryforward.
3. During the fiscal year ended June 30, 2013, the Fund did not utilize any capital loss carryforward.
Net investment income (loss) and net realized gain (loss) may differ for financial statement and tax purposes. The character of dividends and distributions made during the fiscal year from net investment income or net realized gains may differ from their ultimate characterization for federal income tax purposes. Also, due to timing of dividends and distributions, the fiscal year in which amounts are distributed may differ from the fiscal year in which the income or net realized gain was recorded by the Fund.
Accordingly, the following amounts have been reclassified for June 30, 2014. Net assets of the Fund were unaffected by the reclassifications.
| | | | | | | | |
Increase to Paid-in Capital | | Reduction
to Accumulated
Net Investment
Loss | | | Increase
to Accumulated Net
Realized Loss
on Investments | |
$152 | | | $47,973,294 | | | | $47,973,446 | |
No distributions were paid during the years ended June 30, 2014 and June 30, 2013.
The aggregate cost of securities and other investments and the composition of unrealized appreciation and depreciation of securities and other investments for federal income tax purposes as of June 30, 2014 are noted in the following table. The primary difference between book and tax appreciation or depreciation of securities and other investments, if applicable, is attributable to the tax deferral of losses or tax realization of financial statement unrealized gain or loss.
34 OPPENHEIMER GOLD & SPECIAL MINERALS FUND
1. Significant Accounting Policies (Continued)
| | | | |
Federal tax cost of securities | | $ | 1,351,895,485 | |
Federal tax cost of other investments | | | (12,326,492 | ) |
| | | | |
Total federal tax cost | | $ | 1,339,568,993 | |
| | | | |
Gross unrealized appreciation | | $ | 218,405,904 | |
Gross unrealized depreciation | | | (106,068,350 | ) |
| | | | |
Net unrealized appreciation | | $ | 112,337,554 | |
| | | | |
Trustees’ Compensation. The Fund has adopted an unfunded retirement plan (the “Plan”) for the Fund’s independent trustees. Benefits are based on years of service and fees paid to each trustee during their period of service. The Plan was frozen with respect to adding new participants effective December 31, 2006 (the “Freeze Date”) and existing Plan Participants as of the Freeze Date will continue to receive accrued benefits under the Plan. Active independent trustees as of the Freeze Date have each elected a distribution method with respect to their benefits under the Plan. During the year ended June 30, 2014, the Fund’s projected benefit obligations, payments to retired trustees and accumulated liability were as follows:
| | | | |
Projected Benefit Obligations Increased | | $ | 5,065 | |
Payments Made to Retired Trustees | | | 10,000 | |
Accumulated Liability as of June 30, 2014 | | | 93,303 | |
The Board of Trustees has adopted a compensation deferral plan for independent trustees that enables trustees to elect to defer receipt of all or a portion of the annual compensation they are entitled to receive from the Fund. For purposes of determining the amount owed to the Trustee under the plan, deferred amounts are treated as though equal dollar amounts had been invested in shares of the Fund or in other Oppenheimer funds selected by the Trustee. The Fund purchases shares of the funds selected for deferral by the Trustee in amounts equal to his or her deemed investment, resulting in a Fund asset equal to the deferred compensation liability. Such assets are included as a component of “Other” within the asset section of the Consolidated Statement of Assets and Liabilities. Deferral of trustees’ fees under the plan will not affect the net assets of the Fund, and will not materially affect the Fund’s assets, liabilities or net investment income per share. Amounts will be deferred until distributed in accordance with the compensation deferral plan.
Dividends and Distributions to Shareholders. Dividends and distributions to shareholders, which are determined in accordance with income tax regulations and may differ from U.S. generally accepted accounting principles, are recorded on the ex-dividend date. Income and capital gain distributions, if any, are declared and paid annually or at other times as deemed necessary by the Manager.
35 OPPENHEIMER GOLD & SPECIAL MINERALS FUND
NOTES TO CONSOLIDATED
FINANCIAL STATEMENTS Continued
1. Significant Accounting Policies (Continued)
Investment Income. Dividend income is recorded on the ex-dividend date or upon ex-dividend notification in the case of certain foreign dividends where the ex-dividend date may have passed. Non-cash dividends included in dividend income, if any, are recorded at the fair market value of the securities received. Interest income is recognized on an accrual basis. Discount and premium, which are included in interest income on the Consolidated Statement of Operations, are amortized or accreted daily.
Custodian Fees. “Custodian fees and expenses” in the Consolidated Statement of Operations may include interest expense incurred by the Fund on any cash overdrafts of its custodian account during the period. Such cash overdrafts may result from the effects of failed trades in portfolio securities and from cash outflows resulting from unanticipated shareholder redemption activity. The Fund pays interest to its custodian on such cash overdrafts, to the extent they are not offset by positive cash balances maintained by the Fund, at a rate equal to the Federal Funds Rate plus 0.50%. The “Reduction to custodian expenses” line item, if applicable, represents earnings on cash balances maintained by the Fund during the period. Such interest expense and other custodian fees may be paid with these earnings.
Security Transactions. Security transactions are recorded on the trade date. Realized gains and losses on securities sold are determined on the basis of identified cost.
Indemnifications. The Fund’s organizational documents provide current and former trustees and officers with a limited indemnification against liabilities arising in connection with the performance of their duties to the Fund. In the normal course of business, the Fund may also enter into contracts that provide general indemnifications. The Fund’s maximum exposure under these arrangements is unknown as this would be dependent on future claims that may be made against the Fund. The risk of material loss from such claims is considered remote.
Other. The preparation of financial statements in conformity with accounting principles generally accepted in the United States of America requires management to make estimates and assumptions that affect the reported amounts of assets and liabilities and disclosure of contingent assets and liabilities at the date of the financial statements and the reported amounts of increases and decreases in net assets from operations during the reporting period. Actual results could differ from those estimates.
2. Securities Valuation
The Fund calculates the net asset value of its shares as of the close of the New York Stock Exchange (the “Exchange”), normally 4:00 P.M. Eastern time, on each day the Exchange is open for trading.
The Fund’s Board has adopted procedures for the valuation of the Fund’s securities and has delegated the day-to-day responsibility for valuation determinations under those procedures to the Manager. The Manager has established a Valuation Committee which is responsible for
36 OPPENHEIMER GOLD & SPECIAL MINERALS FUND
2. Securities Valuation (Continued)
determining a “fair valuation” for any security for which market quotations are not “readily available.” The Valuation Committee’s fair valuation determinations are subject to review, approval and ratification by the Fund’s Board at its next regularly scheduled meeting covering the calendar quarter in which the fair valuation was determined.
Valuation Methods and Inputs
Securities are valued using unadjusted quoted market prices, when available, as supplied primarily by third party pricing services or dealers.
The following methodologies are used to determine the market value or the fair value of the types of securities described below:
Securities traded on a registered U.S. securities exchange (including exchange-traded derivatives other than futures and futures options) are valued based on the last sale price of the security reported on the principal exchange on which it is traded, prior to the time when the Fund’s assets are valued. In the absence of a sale, the security is valued at the last sale price on the prior trading day, if it is within the spread of the current day’s closing “bid” and “asked” prices, and if not, at the current day’s closing bid price. A security of a foreign issuer traded on a foreign exchange, but not listed on a registered U.S. securities exchange, is valued based on the last sale price on the principal exchange on which the security is traded, as identified by the third party pricing service used by the Manager, prior to the time when the Fund’s assets are valued. If the last sale price is unavailable, the security is valued at the most recent official closing price on the principal exchange on which it is traded. If the last sales price or official closing price for a foreign security is not available, the security is valued at the mean between the bid and asked price per the exchange or, if not available from the exchange, obtained from two dealers. If bid and asked prices are not available from either the exchange or two dealers, the security is valued by using one of the following methodologies (listed in order of priority): (1) using a bid from the exchange, (2) the mean between the bid and asked price as provided by a single dealer, or (3) a bid from a single dealer.
Shares of a registered investment company that are not traded on an exchange are valued at that investment company’s net asset value per share.
Corporate and government debt securities (of U.S. or foreign issuers) and municipal debt securities, event-linked bonds, loans, mortgage-backed securities, collateralized mortgage obligations, and asset-backed securities are valued at the mean between the “bid” and “asked” prices utilizing evaluated prices obtained from third party pricing services or broker-dealers who may use matrix pricing methods to determine the evaluated prices.
Short-term money market type debt securities with a remaining maturity of sixty days or less are valued at cost adjusted by the amortization of discount or premium to maturity (amortized cost), which approximates market value. Short-term debt securities with a remaining maturity in excess of sixty days are valued at the mean between the “bid” and “asked” prices utilizing evaluated prices obtained from third party pricing services or broker-dealers.
37 OPPENHEIMER GOLD & SPECIAL MINERALS FUND
NOTES TO CONSOLIDATED
FINANCIAL STATEMENTS Continued
2. Securities Valuation (Continued)
A description of the standard inputs that may generally be considered by the third party pricing vendors in determining their evaluated prices is provided below.
| | |
| Security Type | | Standard inputs generally considered by third-party pricing vendors |
Corporate debt, government debt, municipal,
mortgage-backed and asset-backed securities | | Reported trade data, broker-dealer price quotations, benchmark yields, issuer spreads on comparable securities, the credit quality, yield, maturity, and other appropriate factors. |
Loans | | Information obtained from market participants regarding reported trade data and broker-dealer price quotations. |
Event-linked bonds | | Information obtained from market participants regarding reported trade data and broker-dealer price quotations. |
If a market value or price cannot be determined for a security using the methodologies described above, or if, in the “good faith” opinion of the Manager, the market value or price obtained does not constitute a “readily available market quotation,” or a significant event has occurred that would materially affect the value of the security the security is fair valued either (i) by a standardized fair valuation methodology applicable to the security type or the significant event as previously approved by the Valuation Committee and the Fund’s Board or (ii) as determined in good faith by the Manager’s Valuation Committee. The Valuation Committee considers all relevant facts that are reasonably available, through either public information or information available to the Manager, when determining the fair value of a security. Fair value determinations by the Manager are subject to review, approval and ratification by the Fund’s Board at its next regularly scheduled meeting covering the calendar quarter in which the fair valuation was determined. Those fair valuation standardized methodologies include, but are not limited to, valuing securities at the last sale price or initially at cost and subsequently adjusting the value based on: changes in company specific fundamentals, changes in an appropriate securities index, or changes in the value of similar securities which may be further adjusted for any discounts related to security-specific resale restrictions. When possible, such methodologies use observable market inputs such as unadjusted quoted prices of similar securities, observable interest rates, currency rates and yield curves. The methodologies used for valuing securities are not necessarily an indication of the risks associated with investing in those securities nor can it be assured that the Fund can obtain the fair value assigned to a security if it were to sell the security.
To assess the continuing appropriateness of security valuations, the Manager, or its third party service provider who is subject to oversight by the Manager, regularly compares prior day prices, prices on comparable securities, and sale prices to the current day prices and challenges those prices exceeding certain tolerance levels with the third party pricing service or broker source. For those securities valued by fair valuations, whether through a standardized fair valuation methodology or a fair valuation determination, the Valuation Committee reviews and affirms the reasonableness of the valuations based on such methodologies and fair valuation determinations on a regular basis after considering all relevant information that is reasonably available.
38 OPPENHEIMER GOLD & SPECIAL MINERALS FUND
2. Securities Valuation (Continued)
Classifications
Each investment asset or liability of the Fund is assigned a level at measurement date based on the significance and source of the inputs to its valuation. Various data inputs are used in determining the value of each of the Fund’s investments as of the reporting period end. These data inputs are categorized in the following hierarchy under applicable financial accounting standards:
1) Level 1-unadjusted quoted prices in active markets for identical assets or liabilities (including securities actively traded on a securities exchange)
2) Level 2-inputs other than unadjusted quoted prices that are observable for the asset or liability (such as unadjusted quoted prices for similar assets and market corroborated inputs such as interest rates, prepayment speeds, credit risks, etc.)
3) Level 3-significant unobservable inputs (including the Manager’s own judgments about assumptions that market participants would use in pricing the asset or liability).
The inputs used for valuing securities are not necessarily an indication of the risks associated with investing in those securities.
The table below categorizes amounts that are included in the Fund’s Consolidated Statement of Assets and Liabilities as of June 30, 2014 based on valuation input level:
| | | | | | | | | | | | | | | | |
| | | Level 1—
Unadjusted
Quoted Prices | | | Level 2—
Other Significant
Observable Inputs | | | Level 3—
Significant
Unobservable
Inputs | | | Value | |
Assets Table | | | | | | | | | | | | | | | | |
Investments, at Value: | | | | | | | | | | | | | | | | |
Common Stocks Materials | | $ | 1,240,522,975 | | | $ | 128,769,249 | | | $ | 13,419 | | | $ | 1,369,305,643 | |
Rights, Warrants and Certificates | | | 384,569 | | | | — | | | | — | | | | 384,569 | |
Exchange-Traded Options | | | | | | | | | | | | | | | | |
Purchased | | | 112,000 | | | | — | | | | — | | | | 112,000 | |
Investment Companies | | | 97,415,305 | | | | — | | | | — | | | | 97,415,305 | |
| | | | |
Total Assets | | $ | 1,338,434,849 | | | $ | 128,769,249 | | | $ | 13,419 | | | $ | 1,467,217,517 | |
| | | | |
| | | | |
Liabilities Table | | | | | | | | | | | | | | | | |
Other Financial Instruments: | | | | | | | | | | | | | | | | |
Options written, at value | | $ | (15,311,191 | ) | | $ | — | | | $ | — | | | $ | (15,311,191 | ) |
| | | | |
Total Liabilities | | $ | (15,311,191 | ) | | $ | — | | | $ | — | | | $ | (15,311,191 | ) |
| | | | |
Forward currency exchange contracts and futures contracts, if any, are reported at their unrealized appreciation/ depreciation at measurement date, which represents the change in the contract’s value from trade date. All additional assets and liabilities included in the above table are reported at their market value at measurement date.
39 OPPENHEIMER GOLD & SPECIAL MINERALS FUND
NOTES TO CONSOLIDATED
FINANCIAL STATEMENTS Continued
3. Shares of Beneficial Interest
The Fund has authorized an unlimited number of no par value shares of beneficial interest of each class. Transactions in shares of beneficial interest were as follows:
| | | | | | | | | | | | | | | | |
| | | Year Ended June 30, 2014 | | | Year Ended June 28, 2013 | |
| | | Shares | | | Amount | | | Shares | | | Amount | |
| |
Class A | | | | | | | | | | | | | | | | |
Sold | | | 17,480,164 | | | $ | 318,445,672 | | | | 18,676,638 | | | $ | 501,599,660 | |
Redeemed | | | (22,077,645 | ) | | | (395,918,328 | ) | | | (25,756,303 | ) | | | (687,360,619) | |
| | | | |
Net decrease | | | (4,597,481 | ) | | $ | (77,472,656 | ) | | | (7,079,665 | ) | | $ | (185,760,959) | |
| | | | |
| | | | |
| |
Class B | | | | | | | | | | | | | | | | |
Sold | | | 117,721 | | | $ | 2,052,322 | | | | 186,631 | | | $ | 5,370,023 | |
Redeemed | | | (896,483 | ) | | | (14,958,700 | ) | | | (1,355,666 | ) | | | (35,319,449) | |
| | | | |
Net decrease | | | (778,762 | ) | | $ | (12,906,378 | ) | | | (1,169,035 | ) | | $ | (29,949,426) | |
| | | | |
| | | | |
| |
Class C | | | | | | | | | | | | | | | | |
Sold | | | 2,983,507 | | | $ | 50,380,732 | | | | 3,163,365 | | | $ | 83,827,115 | |
Redeemed | | | (4,256,888 | ) | | | (70,518,865 | ) | | | (5,384,494 | ) | | | (133,503,176) | |
| | | | |
Net decrease | | | (1,273,381 | ) | | $ | (20,138,133 | ) | | | (2,221,129 | ) | | $ | (49,676,061) | |
| | | | |
| | | | |
| |
Class I | | | | | | | | | | | | | | | | |
Sold | | | 1,736,281 | | | $ | 31,802,732 | | | | 1,548,325 | | | $ | 30,481,217 | |
Redeemed | | | (578,244 | ) | | | (10,742,175 | ) | | | (45,721 | ) | | | (779,749) | |
| | | | |
Net increase | | | 1,158,037 | | | $ | 21,060,557 | | | | 1,502,604 | | | $ | 29,701,468 | |
| | | | |
| | | | |
| |
Class N | | | | | | | | | | | | | | | | |
Sold | | | 4,216,448 | | | $ | 73,157,334 | | | | 3,598,096 | | | $ | 95,089,492 | |
Redeemed | | | (3,290,461 | ) | | | (57,149,192 | ) | | | (3,392,225 | ) | | | (92,605,439) | |
| | | | |
Net increase | | | 925,987 | | | $ | 16,008,142 | | | | 205,871 | | | $ | 2,484,053 | |
| | | | |
| | | | |
| |
Class Y | | | | | | | | | | | | | | | | |
Sold | | | 6,401,807 | | | $ | 114,926,502 | | | | 11,063,895 | | | $ | 296,128,455 | |
Redeemed | | | (6,329,612 | ) | | | (111,315,784 | ) | | | (24,258,856 | ) | | | (556,321,428) | |
| | | | |
Net increase (decrease) | | | 72,195 | | | $ | 3,610,718 | | | | (13,194,961 | ) | | $ | (260,192,973) | |
| | | | |
4. Purchases and Sales of Securities
The aggregate cost of purchases and proceeds from sales of securities, other than short-term obligations and investments in IMMF, for the year ended June 30, 2014 were as follows:
| | | | | | | | |
| | | Purchases | | | Sales | |
Investment securities | | $ | 1,297,228,706 | | | $ | 1,380,822,284 | |
40 OPPENHEIMER GOLD & SPECIAL MINERALS FUND
5. Fees and Other Transactions with Affiliates
Management Fees. Under the investment advisory agreement, the Fund pays the Manager a management fee based on the daily net assets of the Fund at an annual rate as shown in the following table:
| | | | |
| Fee Schedule | | | |
Up to $200 million | | | 0.75 | % |
Next $200 million | | | 0.72 | |
Next $200 million | | | 0.69 | |
Next $200 million | | | 0.66 | |
Next $2.2 billion | | | 0.60 | |
Next $1.0 billion | | | 0.59 | |
Next $2.0 billion | | | 0.58 | |
Next $4.0 billion | | | 0.57 | |
Over $10 billion | | | 0.56 | |
The Manager also provides investment management related services to the Subsidiary. The Subsidiary pays the Manager a monthly management fee at an annual rate according to the above schedule. The Subsidiary also pays certain other expenses including custody and directors’ fees.
Sub-Adviser Fees. The Manager has retained the Sub-Adviser to provide the day-to-day portfolio management of the Fund. Under the Sub-Advisory Agreement, the Manager pays the Sub-Adviser an annual fee in monthly installments, equal to a percentage of the investment management fee collected by the Manager from the Fund, which shall be calculated after any investment management fee waivers. The fee paid to the Sub-Adviser is paid by the Manager, not by the Fund.
Transfer Agent Fees. OFI Global (the “Transfer Agent”) serves as the transfer and shareholder servicing agent for the Fund. The Fund pays the Transfer Agent a fee based on annual net assets. Fees incurred and average net assets for each class with respect to these services are detailed in the Consolidated Statement of Operations and Financial Highlights, respectively.
Sub-Transfer Agent Fees. The Transfer Agent has retained Shareholder Services, Inc., a wholly-owned subsidiary of OFI (the “Sub-Transfer Agent”), to provide the day-to-day transfer agent and shareholder servicing of the Fund. Under the Sub-Transfer Agency Agreement, the Transfer Agent pays the Sub-Transfer Agent an annual fee in monthly installments, equal to a percentage of the transfer agent fee collected by the Transfer Agent from the Fund, which shall be calculated after any applicable fee waivers. The fee paid to the Sub-Transfer Agent is paid by the Transfer Agent, not by the Fund.
41 OPPENHEIMER GOLD & SPECIAL MINERALS FUND
NOTES TO CONSOLIDATED
FINANCIAL STATEMENTS Continued
5. Fees and Other Transactions with Affiliates (Continued)
Distribution and Service Plan (12b-1) Fees. Under its General Distributor’s Agreement with the Fund, OppenheimerFunds Distributor, Inc. (the “Distributor”) acts as the Fund’s principal underwriter in the continuous public offering of the Fund’s classes of shares.
Service Plan for Class A Shares. The Fund has adopted a Service Plan (the “Plan”) for Class A shares under Rule 12b-1 of the Investment Company Act of 1940. Under the Plan, the Fund reimburses the Distributor for a portion of its costs incurred for services provided to accounts that hold Class A shares. Reimbursement is made periodically at an annual rate of up to 0.25% of the daily net assets of Class A shares of the Fund. The Distributor currently uses all of those fees to pay dealers, brokers, banks and other financial institutions periodically for providing personal service and maintenance of accounts of their customers that hold Class A shares. Any unreimbursed expenses the Distributor incurs with respect to Class A shares in any fiscal year cannot be recovered in subsequent periods. Fees incurred by the Fund under the Plan are detailed in the Consolidated Statement of Operations.
Distribution and Service Plans for Class B, Class C and Class N Shares. The Fund has adopted Distribution and Service Plans (the “Plans”) for Class B, Class C and Class N shares under Rule 12b-1 of the Investment Company Act of 1940 to compensate the Distributor for its services in connection with the distribution of those shares and servicing accounts. Under the Plans, the Fund pays the Distributor an annual asset-based sales charge of 0.75% on Class B and Class C shares daily net assets and 0.25% on Class N shares daily net assets. The Distributor also receives a service fee of 0.25% per year under each plan. If either the Class B, Class C or Class N plan is terminated by the Fund or by the shareholders of a class, the Board of Trustees and its independent trustees must determine whether the Distributor shall be entitled to payment from the Fund of all or a portion of the service fee and/or asset-based sales charge in respect to shares sold prior to the effective date of such termination. Fees incurred by the Fund under the Plans are detailed in the Consolidated Statement of Operations. The Distributor determines its uncompensated expenses under the Plans at calendar quarter ends. The Distributor’s aggregate uncompensated expenses under the Plans at June 30, 2014 were as follows:
| | | | |
Class C | | $ | 7,507,089 | |
Class N | | | 4,373,950 | |
Sales Charges. Front-end sales charges and contingent deferred sales charges (“CDSC”) do not represent expenses of the Fund. They are deducted from the proceeds of sales of Fund shares prior to investment or from redemption proceeds prior to remittance, as applicable. The sales charges retained by the Distributor from the sale of shares and the CDSC retained by the Distributor on the redemption of shares is shown in the following table for the period indicated.
42 OPPENHEIMER GOLD & SPECIAL MINERALS FUND
5. Fees and Other Transactions with Affiliates (Continued)
| | | | | | | | | | | | | | | | | | | | |
| Year Ended | | Class A
Front-End
Sales Charges
Retained by
Distributor | | | Class A
Contingent
Deferred Sales
Charges
Retained by
Distributor | | | Class B
Contingent
Deferred Sales
Charges
Retained by
Distributor | | | Class C
Contingent
Deferred Sales
Charges
Retained by
Distributor | | | Class N
Contingent
Deferred Sales
Charges
Retained by
Distributor | |
June 30, 2014 | | | $253,447 | | | | $1,839 | | | | $104,511 | | | | $36,573 | | | | $1,519 | |
Waivers and Reimbursements of Expenses. The Manager has contractually agreed to waive the Fund’s management fee in an amount equal to the management fee of the Subsidiary. During the year ended June 30, 2014 , this waiver reduced the Fund’s management fee by $292,124.
The Manager will waive fees and/or reimburse Fund expenses in an amount equal to the indirect management fees incurred through the Fund’s investment in IMMF. During the year ended June 30, 2014, the Manager waived fees and/or reimbursed the Fund $23,802 for IMMF management fees.
The Transfer Agent has contractually agreed to limit transfer and shareholder servicing agent fees for Classes B, C, N and Y shares to 0.35% of average annual net assets per class and for Class A shares to 0.30% of average annual net assets of the class.
During the year ended June 30, 2014, the Transfer Agent waived transfer and shareholder servicing agent fees as follows:
| | | | |
Class A | | $ | 509,822 | |
Class B | | | 51,135 | |
Class C | | | 42,900 | |
Class N | | | 91,730 | |
Class Y | | | 28,066 | |
Some of these undertakings may be modified or terminated at any time; some may not be modified or terminated until after one year from the date of the current prospectus, as indicated therein.
6. Risk Exposures and the Use of Derivative Instruments
The Fund’s investment objective not only permits the Fund to purchase investment securities, it also allows the Fund to enter into various types of derivatives contracts, including, but not limited to, futures contracts, forward currency exchange contracts, credit default swaps, interest rate swaps, total return swaps, variance swaps and purchased and written options. In doing so, the Fund will employ strategies in differing combinations to permit it to increase, decrease, or change the level or types of exposure to market risk factors. These instruments may allow the Fund to pursue its objectives more quickly and efficiently than if it were to make direct purchases or sales of securities capable of effecting a similar response to market factors. Such contracts may be entered into through a bilateral over-the-counter (“OTC”) transaction, or through a securities or futures exchange and cleared through a clearinghouse.
43 OPPENHEIMER GOLD & SPECIAL MINERALS FUND
NOTES TO CONSOLIDATED
FINANCIAL STATEMENTS Continued
6. Risk Exposures and the Use of Derivative Instruments (Continued)
Market Risk Factors. In accordance with its investment objectives, the Fund may use derivatives to increase or decrease its exposure to one or more of the following market risk factors:
Commodity Risk. Commodity risk relates to the change in value of commodities or commodity indexes as they relate to increases or decreases in the commodities market. Commodities are physical assets that have tangible properties. Examples of these types of assets are crude oil, heating oil, metals, livestock, and agricultural products.
Credit Risk. Credit risk relates to the ability of the issuer to meet interest and principal payments, or both, as they come due. In general, lower-grade, higher-yield bonds are subject to credit risk to a greater extent than lower-yield, higher-quality bonds.
Equity Risk. Equity risk relates to the change in value of equity securities as they relate to increases or decreases in the general market.
Foreign Exchange Rate Risk. Foreign exchange rate risk relates to the change in the U.S. dollar value of a security held that is denominated in a foreign currency. The U.S. dollar value of a foreign currency denominated security will decrease as the dollar appreciates against the currency, while the U.S. dollar value will increase as the dollar depreciates against the currency.
Interest Rate Risk. Interest rate risk refers to the fluctuations in value of fixed-income securities resulting from the inverse relationship between price and yield. For example, an increase in general interest rates will tend to reduce the market value of already issued fixed-income investments, and a decline in general interest rates will tend to increase their value. In addition, debt securities with longer maturities, which tend to have higher yields, are subject to potentially greater fluctuations in value from changes in interest rates than obligations with shorter maturities.
Volatility Risk. Volatility risk refers to the magnitude of the movement, but not the direction of the movement, in a financial instrument’s price over a defined time period. Large increases or decreases in a financial instrument’s price over a relative time period typically indicate greater volatility risk, while small increases or decreases in its price typically indicate lower volatility risk.
Derivatives may have little or no initial cash investment relative to their market value exposure and therefore can produce significant gains or losses in excess of their cost due to unanticipated changes in the market risk factors and the overall market. This use of embedded leverage allows the Fund to increase its market value exposure relative to its net assets and can substantially increase the volatility of the Fund’s performance. In instances where the Fund is using derivatives to decrease, or hedge, exposures to market risk factors for securities held by the Fund, there are also risks that those derivatives may not perform as expected resulting in losses for the combined or hedged positions. Some derivatives have the potential for unlimited loss, regardless of the size of the Fund’s initial investment.
Additional associated risks from investing in derivatives also exist and potentially could have significant effects on the valuation of the derivative and the Fund. Typically, the associated risks are not the risks that the Fund is attempting to increase or decrease exposure to, per its investment objectives, but are the additional risks from investing in derivatives.
44 OPPENHEIMER GOLD & SPECIAL MINERALS FUND
6. Risk Exposures and the Use of Derivative Instruments (Continued)
Examples of these associated risks are liquidity risk, which is the risk that the Fund will not be able to sell the derivative in the open market in a timely manner, and counterparty credit risk, which is the risk that the counterparty will not fulfill its obligation to the Fund.
The Fund’s actual exposures to these market risk factors and associated risks during the period are discussed in further detail, by derivative type, below.
Option Activity
The Fund may buy and sell put and call options, or write put and call options. When an option is written, the Fund receives a premium and becomes obligated to sell or purchase the underlying security, currency or other underlying financial instrument at a fixed price, upon exercise of the option.
Options can be traded through an exchange or through a privately negotiated arrangement with a dealer in an OTC transaction. Options traded through an exchange are generally cleared through a clearinghouse (such as The Options Clearing Corporation). The difference between the premium received or paid, and market value of the option, is recorded as unrealized appreciation or depreciation. The net change in unrealized appreciation or depreciation is reported in the Consolidated Statement of Operations. When an option is exercised, the cost of the security purchased or the proceeds of the security sale are adjusted by the amount of premium received or paid. Upon the expiration or closing of the option transaction, a gain or loss is reported in the Consolidated Statement of Operations.
The Fund has purchased call options on individual equity securities and/or equity indexes to increase exposure to equity risk. A purchased call option becomes more valuable as the price of the underlying financial instrument appreciates relative to the strike price.
During the year ended June 30, 2014, the Fund had an ending monthly average market value of $122,154 on purchased call options.
Options written, if any, are reported in a schedule following the Consolidated Statement of Investments and as a liability in the Consolidated Statement of Assets and Liabilities. Securities held in collateral accounts to cover potential obligations with respect to outstanding written options are noted in the Consolidated Statement of Investments.
The risk in writing a call option is that the market price of the security increases and if the option is exercised, the Fund must either purchase the security at a higher price for delivery or, if the Fund owns the underlying security, give up the opportunity for profit. The risk in writing a put option is that the Fund may incur a loss if the market price of the security decreases and the option is exercised. The risk in buying an option is that the Fund pays a premium whether or not the option is exercised. The Fund also has the additional risk that there may be an illiquid market where the Fund is unable to close the contract.
The Fund has written put options on individual equity securities and/or equity indexes to increase exposure to equity risk. A written put option becomes more valuable as the price of the underlying financial instrument appreciates relative to the strike price.
The Fund has written call options on individual equity securities and/or equity indexes to decrease exposure to equity risk. A written call option becomes more valuable as the price of the underlying financial instrument depreciates relative to the strike price.
45 OPPENHEIMER GOLD & SPECIAL MINERALS FUND
NOTES TO CONSOLIDATED
FINANCIAL STATEMENTS Continued
6. Risk Exposures and the Use of Derivative Instruments (Continued)
The Fund has written put options on individual commodities and/or commodity indexes to increase exposure to commodity risk. A written put option becomes more valuable as the price of the underlying financial instrument appreciates relative to the strike price.
The Fund has written call options on individual commodities and/or commodity indexes to decrease exposure to commodity risk. A written call option becomes more valuable as the price of the underlying financial instrument depreciates relative to the strike price.
During the year ended June 30, 2014, the Fund had an ending monthly average market value of $2,232,821 and $3,256,389 on written call options and written put options, respectively.
Additional associated risks to the Fund include counterparty credit risk and liquidity risk.
Written option activity for the year ended June 30, 2014 was as follows:
| | | | | | | | | | | | | | | | |
| | | Call Options | | | Put Options | |
| | | | | | | | |
| | | Number of
Contracts | | | Amount of
Premiums | | | Number of
Contracts | | | Amount of
Premiums | |
Options outstanding as of June 28, 2013 | | | — | | | $ | — | | | | 9,000 | | | $ | 1,292,937 | |
Options written | | | 111,750 | | | | 16,495,079 | | | | 107,000 | | | | 13,888,866 | |
Options closed or expired | | | (20,029) | | | | (2,569,728) | | | | (29,493) | | | | (3,578,102) | |
Options exercised | | | (35,721) | | | | (4,751,454) | | | | (60,007) | | | | (8,451,106) | |
| | | | |
Options outstanding as of June 30, 2014 | | | 56,000 | | | $ | 9,173,897 | | | | 26,500 | | | $ | 3,152,595 | |
| | | | |
Counterparty Credit Risk. Derivative positions are subject to the risk that the counterparty will not fulfill its obligation to the Fund. The Fund intends to enter into derivative transactions with counterparties that the Manager believes to be creditworthy at the time of the transaction.
For financial reporting purposes, the Fund does not offset derivative assets and derivative liabilities that are subject to netting arrangements in the Consolidated Statement of Assets and Liabilities. Bankruptcy or insolvency laws of a particular jurisdiction may impose restrictions on or prohibitions against the right of offset in bankruptcy, insolvency or other events.
The Fund’s risk of loss from counterparty credit risk on exchange-traded derivatives cleared through a clearinghouse and for centrally cleared swaps is generally considered lower than as compared to OTC derivatives. However, counterparty credit risk exists with respect to initial and variation margin deposited/paid by the Fund that is held in futures commission merchant, broker and/or clearinghouse accounts for such exchange-traded derivatives and for centrally cleared swaps.
With respect to centrally cleared swaps, such transactions will be submitted for clearing, and if cleared, will be held in accounts at futures commission merchants or brokers that are members of clearinghouses. While brokers, futures commission merchants and clearinghouses are required to segregate customer margin from their own assets, in the event that a broker, futures commission merchant or clearinghouse becomes insolvent or goes into bankruptcy and at that time there is a shortfall in the aggregate amount of margin held by the broker, futures commission merchant or clearinghouse for all its customers, U.S. bankruptcy laws will
46 OPPENHEIMER GOLD & SPECIAL MINERALS FUND
6. Risk Exposures and the Use of Derivative Instruments (Continued)
typically allocate that shortfall on a pro-rata basis across all the broker’s, futures commission merchant’s or clearinghouse’s customers, potentially resulting in losses to the Fund.
There is the risk that a broker, futures commission merchant or clearinghouse will decline to clear a transaction on the Fund’s behalf, and the Fund may be required to pay a termination fee to the executing broker with whom the Fund initially enters into the transaction. Clearinghouses may also be permitted to terminate centrally cleared swaps at any time. The Fund is also subject to the risk that the broker or futures commission merchant will improperly use the Fund’s assets deposited/paid as initial or variation margin to satisfy payment obligations of another customer. In the event of a default by another customer of the broker or futures commission merchant, the Fund might not receive its variation margin payments from the clearinghouse, due to the manner in which variation margin payments are aggregated for all customers of the broker/futures commission merchant.
Collateral and margin requirements differ by type of derivative. Margin requirements are established by the broker, futures commission merchant or clearinghouse for exchange-traded and cleared derivatives, including centrally cleared swaps. Brokers, futures commission merchants and clearinghouses can ask for margin in excess of the regulatory minimum, or increase the margin amount, in certain circumstances.
For financial reporting purposes, cash collateral that has been pledged to cover obligations of the Fund, if any, is reported separately on the Consolidated Statement of Assets and Liabilities as cash pledged as collateral. Non-cash collateral pledged by the Fund, if any, is noted in the Consolidated Statement of Investments. Generally, the amount of collateral due from or to a party must exceed a minimum transfer amount threshold (e.g. $250,000) before a transfer has to be made. To the extent amounts due to the Fund from its counterparties are not fully collateralized, contractually or otherwise, the Fund bears the risk of loss from counterparty nonperformance.
The following table presents the valuations of derivative instruments by risk exposure as reported within the Consolidated Statement of Assets and Liabilities as of June 30, 2014:
| | | | | | | | | | | | |
| | Asset Derivatives | | | Liability Derivatives | |
| | | | | | |
Derivatives Not Accounted for as Hedging Instruments | | Consolidated Statement
of Assets and Liabilities
Location | | Value | | | Consolidated Statement
of Assets and Liabilities
Location | | Value | |
| | | | | | | | | | | | | |
Commodity contracts | | | | | | | | Options written, at value | | $ | 222,000 | |
Equity contracts | | Investments, at value | | $ | 112,000 * | | | Options written, at value | | | 15,089,191 | |
| | | | | | | | | | | | |
Total | | | | $ | 112,000 | | | | | $ | 15,311,191 | |
| | | | | | | | | | | | |
*Amounts relate to purchased option contracts.
The effect of derivative instruments on the Consolidated Statement of Operations is as follows:
47 OPPENHEIMER GOLD & SPECIAL MINERALS FUND
NOTES TO CONSOLIDATED
FINANCIAL STATEMENTS Continued
6. Risk Exposures and the Use of Derivative Instruments (Continued)
| | | | | | | | | | | | |
| Amount of Realized Gain or (Loss) Recognized on Derivatives | |
Derivatives Not Accounted for as Hedging Instruments | | Investment from
unaffiliated companies
(including premiums
on options exercised)* | | | Closing and expiration of option contracts written | | | Total | |
| | | | | | | | | | | | | |
Commodity contracts | | $ | 159,642 | | | $ | 404,032 | | | $ | 563,674 | |
Equity contracts | | | 5,765,166 | | | | 5,743,798 | | | | 11,508,964 | |
| | | | |
Total | | $ | 5,924,808 | | | $ | 6,147,830 | | | $ | 12,072,638 | |
| | | | |
*Includes purchased option contracts, purchased swaption contracts and written option contracts exercised, if any.
| | | | | | | | | | | | |
| Amount of Change in Unrealized Gain or (Loss) Recognized on Derivatives | |
Derivatives Not Accounted for as Hedging Instruments | | Investments* | | | Option contracts written | | | Total | |
Commodity contracts | | $ | — | | | $ | (11,084) | | | $ | (11,084) | |
Equity contracts | | | (262,494) | | | | 2,352,266 | | | | 2,089,772 | |
| | | | |
Total | | $ | (262,494) | | | $ | 2,341,182 | | | $ | 2,078,688 | |
| | | | |
*Includes purchased option contracts and purchased swaption contracts, if any.
7. Restricted Securities
As of June 30, 2014, investments in securities included issues that are restricted. A restricted security may have a contractual restriction on its resale and is valued under methods approved by the Board of Trustees as reflecting fair value. Securities that are restricted are marked with an applicable footnote on the Statement of Investments. Restricted securities are reported on a schedule following the Statement of Investments.
8. Pending Litigation
In 2009, seven class action lawsuits were filed in the U.S. District Court for the District of Colorado against OppenheimerFunds, Inc. (“OFI”), OppenheimerFunds Distributor, Inc., the Fund’s principal underwriter and distributor (the “Distributor”), and certain funds (but not including the Fund) advised by OFI Global Asset Management, Inc. and distributed by the Distributor (the “Defendant Funds”). The lawsuits also named as defendants certain officers and current and former trustees of the respective Defendant Funds. The lawsuits raised claims under federal securities law and alleged, among other things, that the disclosure documents of the respective Defendant Funds contained misrepresentations and omissions and that the respective Defendant Funds’ investment policies were not followed. The plaintiffs in these actions sought unspecified damages, equitable relief and awards of attorneys’ fees and litigation expenses. The Defendant Funds’ Boards of Trustees also engaged counsel to represent the Funds and the present and former Independent Trustees named in those suits. On March 5, 2014, the parties in six of these lawsuits executed stipulations and agreements of settlement resolving those actions. On July 31, 2014, the court entered an order and final judgment approving the settlements as fair, reasonable and adequate. The settlements do not resolve a seventh outstanding lawsuit relating to Oppenheimer Rochester California Municipal Fund.
Other class action and individual lawsuits have been filed since 2008 in various state and federal courts against OFI and certain of its affiliates by investors seeking to recover
48 OPPENHEIMER GOLD & SPECIAL MINERALS FUND
8. Pending Litigation (Continued)
investments they allegedly lost as a result of the “Ponzi” scheme run by Bernard L. Madoff and his firm, Bernard L. Madoff Investment Securities, LLC (“BLMIS”). Plaintiffs in these suits allege that they suffered losses as a result of their investments in several funds managed by an affiliate of OFI and assert a variety of claims, including breach of fiduciary duty, fraud, negligent misrepresentation, unjust enrichment, and violation of federal and state securities laws and regulations, among others. They seek unspecified damages, equitable relief and awards of attorneys’ fees and litigation expenses. Neither the Distributor, nor any of the Oppenheimer mutual funds, their independent trustees or directors are named as defendants in these lawsuits. None of the Oppenheimer mutual funds invested in any funds or accounts managed by Madoff or BLMIS. On February 28, 2011, a stipulation of partial settlement of three groups of consolidated putative class action lawsuits relating to these matters was filed in the U.S. District Court for the Southern District of New York. On August 19, 2011, the court entered an order and final judgment approving the settlement as fair, reasonable and adequate. In September 2011, certain parties filed notices of appeal from the court’s order approving the settlement. In June 2014, the appellate court affirmed the lower court’s order approving the settlement. Certain parties subsequently filed a petition for certiorari before the U.S. Supreme Court further challenging the settlement approval order. The settlement does not resolve other outstanding lawsuits against OFI and its affiliates relating to BLMIS.
OFI believes the lawsuits and appeals described above are without legal merit and, with the exception of actions it has settled, is defending against them vigorously. While it is premature to render any opinion as to the outcome in these lawsuits, or whether any costs that the Defendant Funds may bear in defending the suits might not be reimbursed by insurance, OFI believes that these suits should not impair the ability of OFI or the Distributor to perform their respective duties to the Fund, and that the outcome of all of the suits together should not have any material effect on the operations of any of the Oppenheimer mutual funds.
49 OPPENHEIMER GOLD & SPECIAL MINERALS FUND
REPORTOF INDEPENDENT REGISTERED PUBLIC
ACCOUNTING FIRM
The Board of Trustees and Shareholders of Oppenheimer Gold & Special Minerals Fund:
We have audited the accompanying consolidated statement of assets and liabilities of Oppenheimer Gold & Special Minerals Fund and subsidiary, including the consolidated statement of investments, as of June 30, 2014, and the related consolidated statement of operations for the year then ended, the consolidated statements of changes in net assets for each of the years in the two-year period then ended, and the consolidated financial highlights for each of the years or periods in the five-year period then ended. These consolidated financial statements and financial highlights are the responsibility of the Fund’s management. Our responsibility is to express an opinion on these consolidated financial statements and financial highlights based on our audits.
We conducted our audits in accordance with the standards of the Public Company Accounting Oversight Board (United States). Those standards require that we plan and perform the audit to obtain reasonable assurance about whether the financial statements and financial highlights are free of material misstatement. An audit includes examining, on a test basis, evidence supporting the amounts and disclosures in the financial statements. Our procedures included confirmation of securities owned as of June 30, 2014, by correspondence with the custodian, transfer agent and brokers, or by other appropriate auditing procedures where replies from brokers were not received. An audit also includes assessing the accounting principles used and significant estimates made by management, as well as evaluating the overall financial statement presentation. We believe that our audits provide a reasonable basis for our opinion.
In our opinion, the consolidated financial statements and financial highlights referred to above present fairly, in all material respects, the financial position of Oppenheimer Gold & Special Minerals Fund and subsidiary as of June 30, 2014, the results of their operations for the year then ended, the changes in their net assets for each of the years in the two-year period then ended, and the consolidated financial highlights for each of the years or periods in the five-year period then ended, in conformity with U.S. generally accepted accounting principles.
KPMGLLP
Denver, Colorado
August 11, 2014
50 OPPENHEIMER GOLD & SPECIAL MINERALS FUND
FEDERAL INCOME TAX INFORMATION Unaudited
In early 2014, if applicable, shareholders of record received information regarding all dividends and distributions paid to them by the Fund during calendar year 2013.
Dividends, if any, paid by the Fund during the fiscal year ended June 30, 2014 which are not designated as capital gain distributions should be multiplied by the maximum amount allowable but not less than 19.63% to arrive at the amount eligible for the corporate dividend-received deduction.
A portion, if any, of the dividends paid by the Fund during the fiscal year ended June 30, 2014 which are not designated as capital gain distributions are eligible for lower individual income tax rates to the extent that the Fund has received qualified dividend income as stipulated by recent tax legislation. The maximum amount allowable but not less than $17,439,644 of the Fund’s fiscal year taxable income may be eligible for the lower individual income tax rates. In early 2014, shareholders of record received information regarding the percentage of distributions that are eligible for lower individual income tax rates.
Recent tax legislation allows a regulated investment company to designate distributions not designated as capital gain distributions, as either interest related dividends or short-term capital gain dividends, both of which are exempt from the U.S. withholding tax applicable to non U.S. taxpayers. For the fiscal year ended June 30, 2014, the maximum amount allowable but not less than $62,345 of the ordinary distributions to be paid by the Fund qualifies as an interest related dividend.
The Fund has elected the application of Section 853 of the Internal Revenue Code to permit shareholders to take a federal income tax credit or deduction, at their option, on a per share basis. The maximum amount allowable but not less than $1,926,862 of foreign income taxes were paid by the Fund during the fiscal year ended June 30, 2014. A separate notice will be mailed to each shareholder, which will reflect the proportionate share of such foreign taxes which must be treated by shareholders as gross income for federal income tax purposes.
Gross income of the maximum amount allowable but not less than $10,078,808 was derived from sources within foreign countries or possessions of the United States.
The foregoing information is presented to assist shareholders in reporting distributions received from the Fund to the Internal Revenue Service. Because of the complexity of the federal regulations which may affect your individual tax return and the many variations in state and local tax regulations, we recommend that you consult your tax advisor for specific guidance.
51 OPPENHEIMER GOLD & SPECIAL MINERALS FUND
PORTFOLIO PROXY VOTING POLICIESAND PROCEDURES;
UPDATES TO STATEMENTS OF INVESTMENTS Unaudited
The Fund has adopted Portfolio Proxy Voting Policies and Procedures under which the Fund votes proxies relating to securities (“portfolio proxies”) held by the Fund. A description of the Fund’s Portfolio Proxy Voting Policies and Procedures is available (i) without charge, upon request, by calling the Fund toll-free at 1.800.CALL OPP (225.5677), (ii) on the Fund’s website at oppenheimerfunds.com, and (iii) on the SEC’s website at www.sec.gov. In addition, the Fund is required to file Form N-PX, with its complete proxy voting record for the 12 months ended June 30th, no later than August 31st of each year. The Fund’s voting record is available (i) without charge, upon request, by calling the Fund toll-free at 1.800.CALL OPP (225.5677), and (ii) in the Form N-PX filing on the SEC’s website at www.sec.gov.
The Fund files its complete schedule of portfolio holdings with the SEC for the first quarter and the third quarter of each fiscal year on Form N-Q. The Fund’s Form N-Q filings are available on the SEC’s website at www.sec.gov. Those forms may be reviewed and copied at the SEC’s Public Reference Room in Washington, D.C. Information on the operation of the Public Reference Room may be obtained by calling 1-800-SEC-0330.
Householding—Delivery of Shareholder Documents
This is to inform you about OppenheimerFunds’ “householding” policy. If more than one member of your household maintains an account in a particular fund, OppenheimerFunds will mail only one copy of the fund’s prospectus (or, if available, the fund’s summary prospectus), annual and semiannual report and privacy policy. The consolidation of these mailings, called householding, benefits your fund through reduced mailing expense, and benefits you by reducing the volume of mail you receive from OppenheimerFunds. Householding does not affect the delivery of your account statements.
Please note that we will continue to household these mailings for as long as you remain an OppenheimerFunds shareholder, unless you request otherwise. If you prefer to receive multiple copies of these materials, please call us at 1.800.CALL-OPP (225-5677). You may also notify us in writing or via email. We will begin sending you individual copies of the prospectus (or, if available, the summary prospectus), reports and privacy policy within 30 days of receiving your request to stop householding.
52 OPPENHEIMER GOLD & SPECIAL MINERALS FUND
| | | | |
TRUSTEES AND OFFICERS Unaudited |
| | |
Name, Position(s) Held with the Fund, Length of Service, Year of Birth | | | | Principal Occupation(s) During the Past 5 Years; Other Trusteeships/Directorships Held; Number of Portfolios in the Fund Complex Currently Overseen |
| | |
INDEPENDENT TRUSTEES | | | | The address of each Trustee in the chart below is 6803 S. Tucson Way, Centennial, Colorado 80112-3924. Each Trustee serves for an indefinite term, or until his or her resignation, retirement, death or removal. |
| | |
Brian F. Wruble, Chairman of the Board of Trustees (since 2007), Trustee (since 2005) Year of Birth: 1943 | | | | Director of Community Foundation of the Florida Keys (non-profit) (since July 2012); Chairman Emeritus and Non-Voting Trustee of The Jackson Laboratory (non-profit) (since August 2011); Director of Special Value Opportunities Fund, LLC (registered investment company) (affiliate of the Sub-Adviser’s parent company) (since September 2004); Member of Zurich Insurance Advisory Council (insurance) (since 2004); Treasurer (since 2007) and Trustee of the Institute for Advanced Study (non-profit educational institute) (since May 1992); Chairman (August 2007-August 2011) and Trustee (since August 1991) of the Board of Trustees of The Jackson Laboratory (non-profit); General Partner of Odyssey Partners, L.P. (hedge fund) (September 1995-December 2007); Special Limited Partner of Odyssey Investment Partners, LLC (private equity investment) (January 1999-September 2004). Oversees 52 portfolios in the OppenheimerFunds complex. Mr. Wruble has served on the Boards of certain Oppenheimer funds since April 2001, during which time he has become familiar with the Fund’s (and other Oppenheimer funds’) financial, accounting, regulatory and investment matters and has contributed to the Boards’ deliberations. |
| | |
David K. Downes, Trustee (since 2007) Year of Birth: 1940 | | | | Director of THL Credit Inc. (since June 2009); Trustee of Employee Trusts (since January 2006); Chief Executive Officer and Board Member of Community Capital Management (investment management company) (since January 2004); President of The Community Reinvestment Act Qualified Investment Fund (investment management company) (since 2004); Director of Internet Capital Group (information technology company) (since October 2003); formerly, Independent Chairman GSK Employee Benefit Trust (April 2006- June 2013); Director of Correctnet (January 2006-2007); Independent Chairman of the Board of Trustees of Quaker Investment Trust (registered investment company) (2004-2007); Chief Operating Officer and Chief Financial Officer of Lincoln National Investment Companies, Inc. (subsidiary of Lincoln National Corporation, a publicly traded company) and Delaware Investments U.S., Inc. (investment management subsidiary of Lincoln National Corporation) (1993-2003); President, Chief Executive Officer and Trustee of Delaware Investment Family of Funds (1993-2003); President and Board Member of Lincoln National Convertible Securities Funds, Inc. and the Lincoln National Income Funds, TDC (1993-2003); Chairman and Chief Executive Officer of Retirement Financial Services, Inc. (registered transfer agent and investment adviser and subsidiary of Delaware Investments U.S., Inc.) (1993-2003); President and Chief Executive Officer of Delaware Service Company, Inc. (1995-2003); Chief Administrative Officer, Chief Financial Officer, Vice Chairman and Director of Equitable Capital Management Corporation (investment subsidiary of Equitable Life Assurance Society) (1985-1992); Corporate Controller of Merrill Lynch Company (financial services holding company) (1977-1985); held the following positions at the Colonial Penn Group, Inc. (insurance company): Corporate Budget Director (1974-1977), Assistant Treasurer (1972-1974) and Director of Corporate Taxes (1969-1972); held the following positions at Price Waterhouse Company (financial services firm): Tax Manager (1967-1969), Tax Senior (1965-1967) and |
53 OPPENHEIMER GOLD & SPECIAL MINERALS FUND
TRUSTEES AND OFFICERS Unaudited / Continued
| | | | |
David K. Downes, Continued | | | | Staff Accountant (1963-1965); United States Marine Corps (1957-1959). Oversees 52 portfolios in the OppenheimerFunds complex. Mr. Downes has served on the Boards of certain Oppenheimer funds since December 2005, during which time he has become familiar with the Fund’s (and other Oppenheimer funds’) financial, accounting, regulatory and investment matters and has contributed to the Boards’ deliberations. |
| | |
Matthew P. Fink, Trustee (since 2005) Year of Birth: 1941 | | | | Trustee of the Committee for Economic Development (policy research foundation) (2005-2011); Director of ICI Education Foundation (education foundation) (October 1991-August 2006); President of the Investment Company Institute (trade association) (October 1991-June 2004); Director of ICI Mutual Insurance Company (insurance company) (October 1991-June 2004); Author of The Rise of Mutual Funds: An Insider’s View published by Oxford University Press (second edition 2010). Oversees 52 portfolios in the OppenheimerFunds complex. Mr. Fink has served on the Boards of certain Oppenheimer funds since January 2005, during which time he has become familiar with the Fund’s (and other Oppenheimer funds’) financial, accounting, regulatory and investment matters and has contributed to the Boards’ deliberations. |
| | |
Edmund P. Giambastiani, Jr., Trustee (since 2013) Year of Birth: 1948 | | | | Advisory Board Member of the Maxwell School of Citizenship and Public Affairs of Syracuse University (since April 2012); Director of Mercury Defense Systems Inc. (information technology) (August 2011-February 2013); Trustee of the U.S. Naval Academy Foundation (since November 2010); Advisory Board Member of the Massachusetts Institute of Technology Lincoln Laboratory (federally-funded research development center) (since May 2010); Director of The Boeing Company (aerospace and defense) (since October 2009); Trustee of MITRE Corporation (federally-funded research development center) (since September 2008); Independent Director of QinetiQ Group Plc (defense technology and security) (February 2008-August 2011); Director of Monster Worldwide, Inc. (on-line career services) (since January 2008, Lead Director since June 2011); Chairman of Alenia North America, Inc. (military and defense products) (January 2008-October 2009); Director of SRA International, Inc. (information technology and services) (January 2008-July 2011); President of Giambastiani Group LLC (national security and energy consulting) (since October 2007); United States Navy, career nuclear submarine officer (June 1970-October 2007), Vice Chairman of the Joint Chiefs of Staff (2005-October 2007), NATO Supreme Allied Commander Transformation (2003-2005), Commander, U.S. Joint Forces Command (2002-2005). Since his retirement from the U.S. Navy in October 2007, Admiral Giambastiani has also served on numerous U.S. Government advisory boards, investigations and task forces for the Secretaries of Defense, State and Interior and the Central Intelligence Agency. Oversees 52 portfolios in the OppenheimerFunds complex. Admiral Giambastiani has served on the Boards of certain Oppenheimer funds since February 2013, including as an Advisory Board Member for certain Oppenheimer funds, during which time he has become familiar with the Fund’s (and other Oppenheimer funds’) financial, accounting, regulatory and investment matters and has contributed to the Boards’ deliberations. For purposes of this report, Admiral Giambastiani is identified as a Trustee. |
| | |
Mary F. Miller, Trustee (since 2004) Year of Birth: 1942 | | | | Trustee of International House (not-for-profit) (since June 2007); Trustee of the American Symphony Orchestra (not-for-profit) (October 1998-November 2011); and Senior Vice President and General Auditor of American Express Company (financial services company) (July 1998-February 2003). Oversees 52 portfolios |
54 OPPENHEIMER GOLD & SPECIAL MINERALS FUND
| | | | |
Mary F. Miller, Continued | | | | in the OppenheimerFunds complex. Ms. Miller has served on the Boards of certain Oppenheimer funds since August 2004, during which time she has become familiar with the Fund’s (and other Oppenheimer funds’) financial, accounting, regulatory and investment matters and has contributed to the Boards’ deliberations. |
| | |
Joel W. Motley, Trustee (since 2002) Year of Birth: 1952 | | | | Member of the Vestry of Trinity Wall Street (since April 2012); Director of Southern Africa Legal Services Foundation (since March 2012); Board Member of Pulitzer Center for Crisis Reporting (non-profit journalism) (since December 2010); Managing Director of Public Capital Advisors, LLC (privately-held financial advisor) (since January 2006); Managing Director of Carmona Motley, Inc. (privately-held financial advisor) (since January 2002); Director of Columbia Equity Financial Corp. (privately-held financial advisor) (2002-2007); Managing Director of Carmona Motley Hoffman Inc. (privately-held financial advisor) (January 1998-December 2001); Member of the Finance and Budget Committee of the Council on Foreign Relations, Member of the Investment Committee and Board of Human Rights Watch and Member of the Investment Committee and Board of Historic Hudson Valley. Oversees 52 portfolios in the OppenheimerFunds complex. Mr. Motley has served on the Boards of certain Oppenheimer funds since October 2002, during which time he has become familiar with the Fund’s (and other Oppenheimer funds’) financial, accounting, regulatory and investment matters and has contributed to the Boards’ deliberations. |
| | |
Joanne Pace, Trustee (since 2012) Year of Birth: 1958 | | | | Board Director of Horizon Blue Cross Blue Shield of New Jersey (since November 2012); Advisory Board Director of The Alberleen Group LLC (since March 2012); Advisory Board Director of The Agile Trading Group LLC (since March 2012); Advisory Council Member of 100 Women in Hedge Funds (non-profit) (since December 2012); Advisory Council Member of Morgan Stanley Children’s Hospital (non-profit) (since May 2012); Board Director of The Komera Project (non-profit) (since April 2012); New York Advisory Board Director of Peace First (non-profit) (since March 2010); Senior Advisor of SECOR Asset Management, LP (2010-2011); Managing Director and Chief Operating Officer of Morgan Stanley Investment Management (2006-2010); Partner and Chief Operating Officer of FrontPoint Partners, LLC (hedge fund) (2005-2006); held the following positions at Credit Suisse: Managing Director (2003-2005); Global Head of Human Resources and member of Executive Board and Operating Committee (2004-2005), Global Head of Operations and Product Control (2003-2004); held the following positions at Morgan Stanley: Managing Director (1997-2003), Controller and Principal Accounting Officer (1999-2003); Chief Financial Officer (temporary assignment) for the Oversight Committee, Long Term Capital Management (1998-1999). Lead Independent Director and Chair of the Audit and Nominating Committee of The Global Chartist Fund, LLC of Oppenheimer Asset Management (2011-2012); Board Director of Managed Funds Association (2008-2010); Board Director of Morgan Stanley Foundation (2007-2010) and Investment Committee Chair (2008-2010). Oversees 52 portfolios in the OppenheimerFunds complex. Ms. Pace has served on the Boards of certain Oppenheimer funds since November 2012, including as an Advisory Board Member for certain Oppenheimer funds, during which time she has become familiar with the Fund’s (and other Oppenheimer funds’) financial, accounting, regulatory and investment matters and has contributed to the Board’s deliberations. For purposes of this report, Ms. Pace is identified as a Trustee. |
55 OPPENHEIMER GOLD & SPECIAL MINERALS FUND
TRUSTEES AND OFFICERS Unaudited / Continued
| | | | |
| | |
Joseph M. Wikler, Trustee (since 2005) Year of Birth: 1941 | | | | Director of C-TASC (bio-statistics services) (2007-2012); formerly, Director of the following medical device companies: Medintec (1992-2011) and Cathco (1996-2011); Member of the Investment Committee of the Associated Jewish Charities of Baltimore (since 1994); Director of Lakes Environmental Association (environmental protection organization) (1996-2008); Director of Fortis/Hartford mutual funds (1994-December 2001). Oversees 52 portfolios in the OppenheimerFunds complex. Mr. Wikler has served on the Boards of certain Oppenheimer funds since August 2005, during which time he has become familiar with the Fund’s (and other Oppenheimer funds’) financial, accounting, regulatory and investment matters and has contributed to the Boards’ deliberations. |
| | |
Peter I. Wold, Trustee (since 2005) Year of Birth: 1948 | | | | Director of Arch Coal, Inc. (since 2010); President of Wold Oil Properties, Inc. (oil and gas exploration and production company) (since 1994); Vice President of American Talc Company, Inc. (talc mining and milling) (since 1999); Managing Member of Hole-in-the-Wall Ranch (cattle ranching) (since 1979); Director and Chairman of Wyoming Enhanced Oil Recovery Institute Commission (enhanced oil recovery study) (2004-2012); Director and Chairman of the Denver Branch of the Federal Reserve Bank of Kansas City (1993-1999); and Director of PacifiCorp. (electric utility) (1995-1999). Oversees 52 portfolios in the OppenheimerFunds complex. Mr. Wold has served on the Boards of certain Oppenheimer funds since August 2005, during which time he has become familiar with the Fund’s (and other Oppenheimer funds’) financial, accounting, regulatory and investment matters and has contributed to the Boards’ deliberations. |
| | |
INTERESTED TRUSTEE AND OFFICER | | | | Mr. Glavin is an “Interested Trustee” because he is affiliated with the Manager and the Sub-Adviser by virtue of his positions as an officer and director of the Manager and a director of the Sub-Adviser, and as a shareholder of the Sub-Adviser’s parent company. Both as a Trustee and as an officer, he serves for an indefinite term, or until his resignation, retirement, death or removal. Mr. Glavin’s address is 225 Liberty Street, 11th Floor, New York, New York 10281-1008. |
| | |
William F. Glavin, Jr., Trustee (since 2013), President and Principal Executive Officer (since 2009) Year of Birth: 1958 | | | | Director, Chairman and Chief Executive Officer of the Manager (since January 2013); President of the Manager (January 2013-May 2013); Chairman of the Sub-Adviser (December 2009-December 2012); Chief Executive Officer (January 2009-December 2012) and Director of the Sub-Adviser (since January 2009); President of the Sub-Adviser (May 2009-December 2012); Management Director (since June 2009), President (since December 2009) and Chief Executive Officer (since January 2011) of Oppenheimer Acquisition Corp. (“OAC”) (the Sub-Adviser’s parent holding company); Director of Oppenheimer Real Asset Management, Inc. (since March 2010); Executive Vice President (March 2006-February 2009) and Chief Operating Officer (July 2007-February 2009) of Massachusetts Mutual Life Insurance Company (OAC’s parent company); Director (May 2004-March 2006) and Chief Operating Officer and Chief Compliance Officer (May 2004-January 2005), President (January 2005-March 2006) and Chief Executive Officer (June 2005-March 2006) of Babson Capital Management LLC; Director (March 2005-March 2006), President (May 2003-March 2006) and Chief Compliance Officer (July 2005-March 2006) of Babson Capital Securities, Inc. (a broker-dealer); President (May 2003-March 2006) of Babson Investment Company, Inc.; Director (May 2004-August 2006) of Babson Capital Europe Limited; Director (May 2004-October 2006) of Babson Capital |
56 OPPENHEIMER GOLD & SPECIAL MINERALS FUND
| | | | |
William F. Glavin, Jr., Continued | | | | Guernsey Limited; Director (May 2004-March 2006) of Babson Capital Management LLC; Non-Executive Director (March 2005-March 2007) of Baring Asset Management Limited; Director (February 2005-June 2006) Baring Pension Trustees Limited; Director and Treasurer (December 2003-November 2006) of Charter Oak Capital Management, Inc.; Director (May 2006-September 2006) of C.M. Benefit Insurance Company; Director (May 2008-June 2009) and Executive Vice President (June 2007-July 2009) of C.M. Life Insurance Company; President (March 2006-May 2007) of MassMutual Assignment Company; Director (January 2005-December 2006), Deputy Chairman (March 2005-December 2006) and President (February 2005-March 2005) of MassMutual Holdings (Bermuda) Limited; Director (May 2008-June 2009) and Executive Vice President (June 2007-July 2009) of MML Bay State Life Insurance Company; Chief Executive Officer and President (April 2007-January 2009) of MML Distributors, LLC; and Chairman (March 2006-December 2008) and Chief Executive Officer (May 2007-December 2008) of MML Investors Services, Inc. An officer of 91 portfolios in the OppenheimerFunds complex. |
| | |
OTHER OFFICERS OF THE FUND | | | | The addresses of the Officers in the chart below are as follows: for Messrs. Li, Gabinet and Mss. Nasta and Picciotto, 225 Liberty Street, New York, New York 10281-1008, for Mr. Wixted, 6803 S. Tucson Way, Centennial, Colorado 80112-3924. Each Officer serves for an indefinite term or until his or her resignation, retirement, death or removal. |
| | |
Shanquan Li, Vice President (since 1997) Year of Birth: 1954 | | | | Senior Vice President of the Sub-Adviser (since June 2011); Vice President of the Sub-Adviser (November 1998-May 2011); Assistant Vice President of the Sub-Adviser (January 1997-November 1998). An officer in the OppenheimerFunds complex. |
| | |
Arthur S. Gabinet, Secretary and Chief Legal Officer (since 2011) Year of Birth: 1958 | | | | Executive Vice President, Secretary and General Counsel of the Manager (since January 2013); General Counsel OFI SteelPath, Inc. (since January 2013); Executive Vice President (May 2010-December 2012) and General Counsel (since January 2011) of the Sub-Adviser; General Counsel of the Distributor (since January 2011); General Counsel of Centennial Asset Management Corporation (January 2011-December 2012); Executive Vice President (January 2011-December 2012) and General Counsel of HarbourView Asset Management Corporation (since January 2011); Assistant Secretary (since January 2011) and Director (since January 2011) of OppenheimerFunds International Ltd. And OppenheimerFunds plc; Director of Oppenheimer Real Asset Management, Inc. (January 2011-December 2012) and General Counsel (since January 2011); Executive Vice President (January 2011-December 2011) and General Counsel of Shareholder Financial Services, Inc. and Shareholder Services, Inc. (since January 2011); Executive Vice President (January 2011-December 2012) and General Counsel of OFI Private Investments Inc. (since January 2011); Vice President of OppenheimerFunds Legacy Program (January 2011-December 2011); Executive Vice President (January 2011-December 2012) and General Counsel of OFI Institutional Asset Management, Inc. (since January 2011); General Counsel, Asset Management of the Sub-Adviser (May 2010-December 2010); Principal, The Vanguard Group (November 2005-April 2010); District Administrator, U.S. Securities and Exchange Commission (January 2003-October 2005). An officer of 91 portfolios in the OppenheimerFunds complex. |
57 OPPENHEIMER GOLD & SPECIAL MINERALS FUND
TRUSTEES AND OFFICERS Unaudited / Continued
| | | | |
| | |
Christina M. Nasta, Vice President and Chief Business Officer (since 2011) Year of Birth: 1973 | | | | Senior Vice President of OppenheimerFunds Distributor, Inc. (since January 2013); Senior Vice President of the Sub-Adviser (July 2010-December 2012); Vice President of the Sub-Adviser (January 2003-July 2010); Vice President of OppenheimerFunds Distributor, Inc. (January 2003-July 2010). An officer of 91 portfolios in the OppenheimerFunds complex. |
| | |
Mary Ann Picciotto, Chief Compliance Officer and Chief Anti-Money Laundering Officer (since 2014) Year of Birth: 1973 | | | | Senior Vice President and Chief Compliance Officer of the Manager (since March 2014); Chief Compliance Officer of the Sub-Adviser, OFI SteelPath, Inc., OFI Global Trust Company, OFI Global Institutional, Inc., Oppenheimer Real Asset Management, Inc., OFI Private Investments, Inc., Harborview Asset Management Corporation, Trinity Investment Management Corporation, and Shareholder Services, Inc. (since March 2014); Managing Director of Morgan Stanley Investment Management Inc. and certain of its various affiliated entities; Chief Compliance Officer of various Morgan Stanley Funds (May 2010-January 2014); Chief Compliance Officer of Morgan Stanley Investment Management Inc. (April 2007-January 2014). An officer of 91 portfolios in the OppenheimerFunds complex. |
| | |
Brian W. Wixted, Treasurer and Principal Financial & Accounting Officer (since 1999) Year of Birth: 1959 | | | | Senior Vice President of the Manager (since January 2013); Treasurer of the Sub-Adviser, HarbourView Asset Management Corporation, Shareholder Financial Services, Inc., Shareholder Services, Inc., and Oppenheimer Real Asset Management, Inc. (March 1999-June 2008), OFI Private Investments, Inc. (March 2000-June 2008), OppenheimerFunds International Ltd. and OppenheimerFunds plc (since May 2000), OFI Institutional Asset Management, Inc. (November 2000-June 2008), and OppenheimerFunds Legacy Program (charitable trust program established by the Sub-Adviser) (June 2003-December 2011); Treasurer and Chief Financial Officer of OFI Trust Company (since May 2000); Assistant Treasurer of Oppenheimer Acquisition Corporation (March 1999-June 2008). An officer of 91 portfolios in the OppenheimerFunds complex. |
The Fund’s Statement of Additional Information contains additional information about the Fund’s Trustees and Officers and is available without charge upon request by calling 1.800.CALL OPP (225.5677).
58 OPPENHEIMER GOLD & SPECIAL MINERALS FUND
OPPENHEIMER GOLD & SPECIAL MINERALS FUND
| | |
Manager | | OFI Global Asset Management, Inc. |
| |
Sub-Adviser | | OppenheimerFunds, Inc. |
| |
Distributor | | OppenheimerFunds Distributor, Inc. |
| |
Transfer and Shareholder Servicing Agent | | OFI Global Asset Management, Inc. |
| |
Sub-Transfer Agent | | Shareholder Services, Inc. DBA OppenheimerFunds Services |
| |
Independent Registered Public Accounting Firm | | KPMGLLP |
| |
Legal Counsel | | Kramer Levin Naftalis & Frankel LLP |
© 2014 OppenheimerFunds, Inc. All rights reserved.
59 OPPENHEIMER GOLD & SPECIAL MINERALS FUND
PRIVACY POLICY NOTICE
As an Oppenheimer fund shareholder, you are entitled to know how we protect your personal information and how we limit its disclosure.
Information Sources
We obtain nonpublic personal information about our shareholders from the following sources:
| Ÿ | | Applications or other forms |
| Ÿ | | When you create a user ID and password for online account access |
| Ÿ | | When you enroll in eDocs Direct, our electronic document delivery service |
| Ÿ | | Your transactions with us, our affiliates or others |
| Ÿ | | A software program on our website, often referred to as a “cookie,” which indicates which parts of our site you’ve visited |
| Ÿ | | When you set up challenge questions to reset your password online |
If you visit oppenheimerfunds.com and do not log on to the secure account information areas, we do not obtain any personal information about you. When you do log on to a secure area, we do obtain your user ID and password to identify you. We also use this information to provide you with products and services you have requested, to inform you about products and services that you may be interested in and assist you in other ways.
We do not collect personal information through our website unless you willingly provide it to us, either directly by email or in those areas of the website that request information. In order to update your personal information (including your mailing address, email address and phone number) you must first log on and visit your user profile.
If you have set your browser to warn you before accepting cookies, you will receive the warning message with each cookie. You can refuse cookies by turning them off in your browser. However, doing so may limit your access to certain sections of our website.
We use cookies to help us improve and manage our website. For example, cookies help us recognize new versus repeat visitors to the site, track the pages visited, and enable some special features on the website. This data helps us provide a better service for our website visitors.
Protection of Information
We do not disclose any non-public personal information (such as names on a customer list) about current or former customers to anyone, except as permitted by law.
Disclosure of Information
We send your financial advisor (as designated by you) copies of confirmations, account statements and other documents reporting activity in your fund accounts. We may also use details about you and your investments to help us, our financial service affiliates, or firms that jointly market their financial products and services with ours, to better serve your investment needs or suggest financial services or educational material that may be of interest to you. If this requires us to provide you with an opportunity to “opt in” or “opt out” of such information sharing with a firm not affiliated with us, you will receive notification on how to do so, before any such sharing takes place.
Right of Refusal
We will not disclose your personal information to unaffiliated third parties (except as permitted by law), unless we first offer you a reasonable opportunity to refuse or “opt out” of such disclosure.
60 OPPENHEIMER GOLD & SPECIAL MINERALS FUND
Internet Security and Encryption
In general, the email services provided by our website are encrypted and provide a secure and private means of communication with us. To protect your own privacy, confidential and/or personal information should only be communicated via email when you are advised that you are using a secure website.
As a security measure, we do not include personal or account information in non-secure emails, and we advise you not to send such information to us in non-secure emails. Instead, you may take advantage of the secure features of our website to encrypt your email correspondence. To do this, you will need to use a browser that supports Secure Sockets Layer (SSL) protocol.
We do not guarantee or warrant that any part of our website, including files available for download, are free of viruses or other harmful code. It is your responsibility to take appropriate precautions, such as use of an anti-virus software package, to protect your computer hardware and software.
| Ÿ | | All transactions, including redemptions, exchanges and purchases, are secured by SSL and 128-bit encryption. SSL is used to establish a secure connection between your PC and OppenheimerFunds’ server. It transmits information in an encrypted and scrambled format. |
| Ÿ | | Encryption is achieved through an electronic scrambling technology that uses a “key” to code and then decode the data. Encryption acts like the cable converter box you may have on your television set. It scrambles data with a secret code so that no one can make sense of it while it is being transmitted. When the data reaches its destination, the same software unscrambles the data. |
| Ÿ | | You can exit the secure area by either closing your browser, or for added security, you can use the Log Out button before you close your browser. |
Other Security Measures
We maintain physical, electronic and procedural safeguards to protect your personal account information. Our employees and agents have access to that information only so that they may offer you products or provide services, for example, when responding to your account questions.
How You Can Help
You can also do your part to keep your account information private and to prevent unauthorized transactions. If you obtain a user ID and password for your account, do not allow it to be used by anyone else. Also, take special precautions when accessing your account on a computer used by others.
Who We Are
This joint notice describes the privacy policies of the Oppenheimer funds, OppenheimerFunds, Inc., and each of its investment adviser subsidiaries, OppenheimerFunds Distributor, Inc. and OFI Global Trust Co. It applies to all Oppenheimer fund accounts you presently have, or may open in the future, using your Social Security number—whether or not you remain a shareholder of our funds. This notice was last updated November 2013. In the event it is updated or changed, we will post an updated notice on our website at oppenheimerfunds.com. If you have any questions about these privacy policies, write to us at P.O. Box 5270, Denver, CO 80217-5270, email us by clicking on the Contact Us section of our website at oppenheimerfunds.com or call us at 1.800.CALL OPP (225.5677).
61 OPPENHEIMER GOLD & SPECIAL MINERALS FUND
THIS PAGE INTENTIONALLY LEFT BLANK.
62 OPPENHEIMER GOLD & SPECIAL MINERALS FUND
THIS PAGE INTENTIONALLY LEFT BLANK.
63 OPPENHEIMER GOLD & SPECIAL MINERALS FUND

The registrant has adopted a code of ethics that applies to the registrant’s principal executive officer, principal financial officer, principal accounting officer or controller or persons performing similar functions.
| Item 3. | Audit Committee Financial Expert. |
The Board of Trustees of the registrant has determined that David Downes, the Board’s Audit Committee Chairman, is an audit committee financial expert and that Mr. Downes is “independent” for purposes of this Item 3.
| Item 4. | Principal Accountant Fees and Services. |
The principal accountant for the audit of the registrant’s annual financial statements billed $44,600 in fiscal 2014 and $49,500 in fiscal 2013.
The principal accountant for the audit of the registrant’s annual financial statements billed no such fees in fiscal 2014 and no such fees in fiscal 2013.
The principal accountant for the audit of the registrant’s annual financial statements billed $832,821 in fiscal 2014 and $538,480 in fiscal 2013 to the registrant’s investment adviser or any entity controlling, controlled by, or under common control with the adviser that provides ongoing services to the registrant.
Such services include: Internal control reviews, GIPS attestation procedures, internal audit training, surprise exams, system conversion testing, and corporate restructuring
The principal accountant for the audit of the registrant’s annual financial statements billed $1,660 in fiscal 2014 and $1,675 in fiscal 2013.
The principal accountant for the audit of the registrant’s annual financial statements billed $251,007 in fiscal 2014 and $443,073 in fiscal 2013 to the registrant’s investment adviser or any entity controlling, controlled by, or under common control with the adviser that provides ongoing services to the registrant.
Such services include: tax compliance, tax planning and tax advice. Tax compliance generally involves preparation of original and amended tax returns, claims for a refund and tax payment-planning services. Tax planning and tax advice includes assistance with tax audits and appeals, tax advice related to mergers and acquisitions and requests for rulings or technical advice from taxing authorities.
The principal accountant for the audit of the registrant’s annual financial statements billed no such fees in fiscal 2014 and no such fees in fiscal 2013.
The principal accountant for the audit of the registrant’s annual financial statements billed no such fees in fiscal 2014 and no such fees in fiscal 2013 to the registrant’s investment adviser or any entity controlling, controlled by, or under common control with the adviser that provides ongoing services to the registrant.
Such fees would include the cost to the principal accountant of attending audit committee meetings and consultations regarding the registrant’s retirement plan with respect to its Trustees.
| (e) | (1) During its regularly scheduled periodic meetings, the registrant’s audit committee will pre-approve all audit, audit-related, tax and other services to be provided by the principal accountants of the registrant. |
The audit committee has delegated pre-approval authority to its Chairman for any subsequent new engagements that arise between regularly scheduled meeting dates provided that any fees such pre-approved are presented to the audit committee at its next regularly scheduled meeting.
Under applicable laws, pre-approval of non-audit services may be waived provided that: 1) the aggregate amount of all such services provided constitutes no more than five percent of the total amount of fees paid by the registrant to its principal accountant during the fiscal year in which services are provided 2) such services were not recognized by the registrant at the time of engagement as non-audit services and 3) such services are promptly brought to the attention of the audit committee of the registrant and approved prior to the completion of the audit.
(2) 0%
| (f) | Not applicable as less than 50%. |
| (g) | The principal accountant for the audit of the registrant’s annual financial statements billed $1,085,488 in fiscal 2014 and $983,228 in fiscal 2013 to the registrant and the registrant’s investment adviser or any entity controlling, controlled by, or under common control with the adviser that provides ongoing services to the registrant related to non-audit fees. Those billings did not include any prohibited non-audit services as defined by the Securities Exchange Act of 1934. |
| (h) | The registrant’s audit committee of the board of Trustees has considered whether the provision of non-audit services that were rendered to the registrant’s investment adviser, and any entity controlling, controlled by, or under common control with the investment adviser that provides ongoing services to the registrant that were not pre-approved pursuant to paragraph (c)(7)(ii) of Rule 2-01 of Regulation S-X is compatible with maintaining the principal accountant’s independence. No such services were rendered. |
| Item 5. | Audit Committee of Listed Registrants |
Not applicable.
| Item 6. | Schedule of Investments. |
a) Not applicable. The complete schedule of investments is included in Item 1 of this Form N-CSR.
b) Not applicable.
Item 7. Disclosure of Proxy Voting Policies and Procedures for Closed-End Management Investment Companies.
Not applicable.
| Item 8. | Portfolio Managers of Closed-End Management Investment Companies. |
Not applicable.
Item 9. Purchases of Equity Securities by Closed-End Management Investment Company and Affiliated Purchasers.
Not applicable.
| Item 10. | Submission of Matters to a Vote of Security Holders. |
The Fund’s Governance Committee Provisions with Respect to Nominations of Directors/Trustees to the Respective Boards
None
| Item 11. | Controls and Procedures. |
Based on their evaluation of the registrant’s disclosure controls and procedures (as defined in rule 30a-3(c) under the Investment Company Act of 1940 (17 CFR 270.30a-3(c)) as of 6/30/2014, the registrant’s principal executive officer and principal financial officer found the registrant’s disclosure controls and procedures to provide reasonable assurances that information required to be disclosed by the registrant in the reports that it files under the Securities Exchange Act of 1934 (a) is accumulated and communicated to registrant’s management, including its principal executive officer and principal financial officer, to allow timely decisions regarding required disclosure, and (b) is recorded, processed, summarized and reported, within the time periods specified in the rules and forms adopted by the U.S. Securities and Exchange Commission.
There have been no changes in the registrant’s internal controls over financial reporting that occurred during the registrant’s second fiscal quarter of the period covered by this report that have materially affected, or are reasonably likely to materially affect, the registrant’s internal control over financial reporting.
| (a) | (1) Exhibit attached hereto. |
(2) Exhibits attached hereto.
(3) Not applicable.
| (b) | Exhibit attached hereto. |
SIGNATURES
Pursuant to the requirements of the Securities Exchange Act of 1934 and the Investment Company Act of 1940, the registrant has duly caused this report to be signed on its behalf by the undersigned, thereunto duly authorized.
Oppenheimer Gold & Special Minerals Fund
| | |
| By: | | /s/ William F. Glavin, Jr. |
| | William F. Glavin, Jr. |
| | Principal Executive Officer |
| |
| Date: | | 8/8/2014 |
Pursuant to the requirements of the Securities Exchange Act of 1934 and the Investment Company Act of 1940, this report has been signed below by the following persons on behalf of the registrant and in the capacities and on the dates indicated.
| | |
| By: | | /s/ William F. Glavin, Jr. |
| | William F. Glavin, Jr. |
| | Principal Executive Officer |
| |
| Date: | | 8/8/2014 |
| | |
| By: | | /s/ Brian W. Wixted |
| | Brian W. Wixted |
| | Principal Financial Officer |
| |
| Date: | | 8/8/2014 |