UNITED STATES
SECURITIES AND EXCHANGE COMMISSION
Washington, D.C. 20549
FORM N-CSR
CERTIFIED SHAREHOLDER REPORT OF REGISTERED
MANAGEMENT INVESTMENT COMPANIES
| | | | | | | | | | | | | | | | | | | | |
| Investment Company Act file number | | 811-03706 | | | | |
| | | | | | |
| AMERICAN CENTURY CALIFORNIA TAX-FREE AND MUNICIPAL FUNDS | | | | | | |
| (Exact name of registrant as specified in charter) | | | | | | |
| | | | | | |
| 4500 MAIN STREET, KANSAS CITY, MISSOURI | | | | | | 64111 |
| (Address of principal executive offices) | | | | | | (Zip Code) |
| | | | | | |
CHARLES A. ETHERINGTON
4500 MAIN STREET, KANSAS CITY, MISSOURI 64111 | | | | | | |
| (Name and address of agent for service) | | | | | | |
| | | | | | |
| Registrant’s telephone number, including area code: | | | | | 816-531-5575 | |
| | | | | | |
| Date of fiscal year end: | 08-31 | | | | | |
| | | | | | |
| Date of reporting period: | 08-31-2020 | | | | | |
ITEM 1. REPORTS TO STOCKHOLDERS.
| | | | | |
| |
| Annual Report |
| |
| August 31, 2020 |
| |
| California High-Yield Municipal Fund |
| Investor Class (BCHYX) |
| I Class (BCHIX) |
| Y Class (ACYHX) |
| A Class (CAYAX) |
| C Class (CAYCX) |
Beginning on January 1, 2021, as permitted by regulations adopted by the Securities and Exchange Commission, paper copies of the fund’s shareholder reports like this one will no longer be sent by mail, unless you specifically request paper copies of the reports from the fund or from your financial intermediary, such as a broker-dealer or bank. Instead, the reports will be made available on a website, and you will be notified by mail each time a report is posted and provided with a website link to access the report.
If you already elected to receive shareholder reports electronically, you will not be affected by this change and you need not take any action. You may elect to receive shareholder reports and other communications from the fund or your financial intermediary electronically by calling or sending an email request to your appropriate contacts as listed on the back cover of this report.
You may elect to receive all future reports in paper free of charge. You can inform the fund or your financial intermediary that you wish to continue receiving paper copies of your shareholder reports by calling or sending an email request to your appropriate contacts as listed on the back cover of this report. Your election to receive reports in paper will apply to all funds held with the fund complex/your financial intermediary.
| | | | | |
| President’s Letter | |
| Performance | |
| Portfolio Commentary | |
| Fund Characteristics | |
| Shareholder Fee Example | |
| Schedule of Investments | |
| Statement of Assets and Liabilities | |
| Statement of Operations | |
| Statement of Changes in Net Assets | |
| Notes to Financial Statements | |
| Financial Highlights | |
| Report of Independent Registered Public Accounting Firm | |
| Management | |
| Approval of Management Agreement | |
| Liquidity Risk Management Program | |
| |
| Additional Information | |
| |
| |
Any opinions expressed in this report reflect those of the author as of the date of the report, and do not necessarily represent the opinions of American Century Investments® or any other person in the American Century Investments organization. Any such opinions are subject to change at any time based upon market or other conditions and American Century Investments disclaims any responsibility to update such opinions. These opinions may not be relied upon as investment advice and, because investment decisions made by American Century Investments funds are based on numerous factors, may not be relied upon as an indication of trading intent on behalf of any American Century Investments fund. Security examples are used for representational purposes only and are not intended as recommendations to purchase or sell securities. Performance information for comparative indices and securities is provided to American Century Investments by third party vendors. To the best of American Century Investments’ knowledge, such information is accurate at the time of printing.
 Jonathan Thomas
Dear Investor:
Thank you for reviewing this annual report for the period ended August 31, 2020. Annual reports help convey important information about fund returns, including market factors that affected performance. For additional investment insights, please visit americancentury.com.
Pandemic Disrupted Economic, Market Courses
Broad market sentiment was generally upbeat through the first half of the reporting period. Dovish central banks, modest inflation, improving economic and corporate earnings data, and progress on U.S.-China trade policy helped boost global growth outlooks. Against this backdrop, risk assets, including municipal bonds (munis), largely remained in favor.
However, beginning in late February, COVID-19 quickly quashed the optimistic tone. The outbreak rapidly spread worldwide, halting most U.S. and global economic activity and triggering a deep worldwide recession. In the U.S., stocks and credit-sensitive assets sold off sharply, while U.S. Treasury yields plunged to record lows amid soaring demand. Quick and aggressive action from the Federal Reserve and Congress helped stabilize financial markets and restore confidence in the muni and credit sectors. Additionally, declining coronavirus infection and death rates in many regions and the reopening of economies were positive influences. By the end of August, manufacturing, employment and other data suggested an economic recovery was underway.
In general, munis bounced back from the early spring sell-off to deliver modest gains for the 12-month period. However, the broad asset class did not keep pace with the rallying Treasury market.
A Slow Return to Normal
The return to pre-pandemic life will take time and patience, but we are confident we will get there. Several drug companies are in final stages of vaccine trials, and medical professionals continue to fine-tune virus treatment protocols. In the meantime, investors likely will face periods of outbreak-related disruptions, economic and political uncertainty, and heightened market volatility. These influences can be unsettling, but they tend to be temporary.
We appreciate your confidence in us during these extraordinary times. Our firm has a long history of helping clients weather unpredictable markets, and we’re confident we will continue to meet today’s challenges.
Sincerely,
Jonathan Thomas
President and Chief Executive Officer
American Century Investments
| | | | | | | | | | | | | | | | | | | | | |
| Total Returns as of August 31, 2020 | | | | | | | |
| | | | | Average Annual Returns | | | |
| | Ticker
Symbol | | 1
year | 5
years | 10 years | Since
Inception | Inception
Date |
| Investor Class | BCHYX | | 0.96% | 4.56% | 5.12% | — | 12/30/86 |
| S&P Municipal Bond California 50% Investment Grade/50% High Yield Index | — | | 2.80% | 5.48% | — | — | — |
| Bloomberg Barclays Municipal Bond Index | — | | 3.24% | 3.99% | 3.97% | — | — |
| I Class | BCHIX | | 1.17% | 4.77% | 5.33% | — | 3/1/10 |
| Y Class | ACYHX | | 1.21% | — | — | 5.01% | 4/10/17 |
| A Class | CAYAX | | | | | | 1/31/03 |
| No sales charge | | | 0.71% | 4.30% | 4.86% | — | |
| With sales charge | | | -3.79% | 3.34% | 4.37% | — | |
| C Class | CAYCX | | -0.04% | 3.53% | 4.08% | — | 1/31/03 |
Average annual returns since inception are presented when ten years of performance history is not available.
Returns for the Bloomberg Barclays Municipal Bond Index are shown to cover the 10 year period because the S&P Municipal Bond California 50% Investment Grade/50% High Yield Index total return data became available as of December 30, 2011.
Sales charges include initial sales charges and contingent deferred sales charges (CDSCs), as applicable. A Class shares have a 4.50% maximum initial sales charge and may be subject to a maximum CDSC of 1.00%. C Class shares redeemed within 12 months of purchase are subject to a maximum CDSC of 1.00%. The SEC requires that mutual funds provide performance information net of maximum sales charges in all cases where charges could be applied.
Data presented reflect past performance. Past performance is no guarantee of future results. Current performance may be higher or lower than the performance shown. Total returns for periods less than one year are not annualized. Investment return and principal value will fluctuate, and redemption value may be more or less than original cost. Data assumes reinvestment of dividends and capital gains, and none of the charts reflect the deduction of taxes that a shareholder would pay on fund distributions or the redemption of fund shares. To obtain performance data current to the most recent month end, please call 1-800-345-2021 or visit americancentury.com. For additional information about the fund, please consult the prospectus.
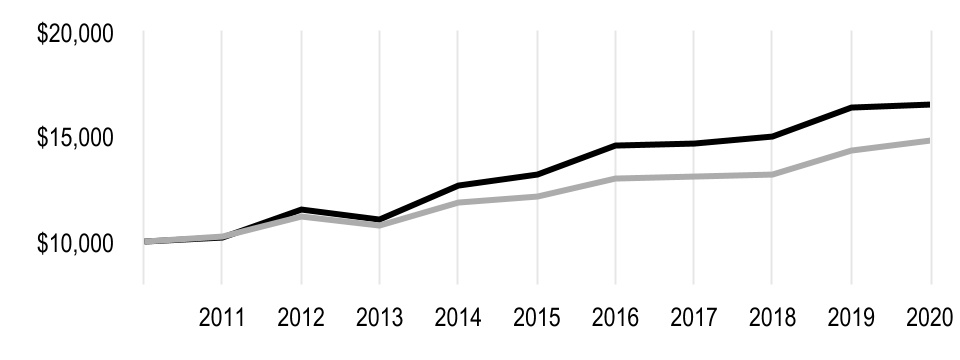
| | |
| Growth of $10,000 Over 10 Years |
| $10,000 investment made August 31, 2010 |
| Performance for other share classes will vary due to differences in fee structure. |
| | | | | |
| Value on August 31, 2020 | |
| Investor Class — $16,482 |
| |
| Bloomberg Barclays Municipal Bond Index — $14,768 |
| |
Since S&P Municipal Bond California 50% Investment Grade/50% High Yield Index total return data is only available from December 2011, it is not included in the line chart. .
| | | | | | | | | | | | | | |
| Total Annual Fund Operating Expenses | | | | |
| Investor Class | I Class | Y Class | A Class | C Class |
| 0.50% | 0.30% | 0.27% | 0.75% | 1.50% |
The total annual fund operating expenses shown is as stated in the fund’s prospectus current as of the date of this report. The prospectus may vary from the expense ratio shown elsewhere in this report because it is based on a different time period, includes acquired fund fees and expenses, and, if applicable, does not include fee waivers or expense reimbursements.
Data presented reflect past performance. Past performance is no guarantee of future results. Current performance may be higher or lower than the performance shown. Total returns for periods less than one year are not annualized. Investment return and principal value will fluctuate, and redemption value may be more or less than original cost. Data assumes reinvestment of dividends and capital gains, and none of the charts reflect the deduction of taxes that a shareholder would pay on fund distributions or the redemption of fund shares. To obtain performance data current to the most recent month end, please call 1-800-345-2021 or visit americancentury.com. For additional information about the fund, please consult the prospectus.
Portfolio Managers: Alan Kruss, Joseph Gotelli and Steven Permut
Performance Summary
California High-Yield Municipal returned 0.96%* for the 12 months ended August 31, 2020. By comparison, the S&P Municipal Bond California 50% Investment Grade/50% High Yield Index returned 2.80%. Fund returns reflect operating expenses, while index returns do not.
Like most asset classes during the 12-month period, the municipal bond (muni) market endured extreme volatility as the COVID-19 outbreak prompted a dramatic sell-off in March and April. However, the Federal Reserve (Fed) and the U.S. government quickly responded with monetary and fiscal stimulus. This helped stem losses, restore liquidity and lend stability to fixed-income markets in general, which benefited munis. Within the portfolio, sector allocation and security selection hindered performance, relative to the index, while duration positioning mitigated a portion of the decline.
Fed Moves Bolstered Muni Market
Early in the reporting period, waning trade tensions and an improving global growth outlook fostered risk-on investing, driving muni prices higher. However, as the coronavirus spread across the U.S. in early 2020, economic activity grinded to a halt, and risk assets sold off sharply. Robust demand for safe-haven assets led to considerable muni underperformance versus Treasuries.
Swift action by the Fed, including cutting short-term interest rates to near 0% and launching aggressive lending and asset-purchase plans, aided the market. The Fed’s efforts included the $500 billion Municipal Liquidity Facility (MLF), which restored market confidence that muni issuers would have access to liquidity as needed. Meanwhile, lawmakers passed the Coronavirus Aid, Relief and Economic Security (CARES) Act, which also helped soothe investors’ anxieties. A summer-long risk rally followed, especially as states lifted pandemic-related restrictions.
Demand for munis gradually recovered to nearly pre-COVID-19 levels by the end of the period. New-issue levels similarly whipsawed through 2020, although taxable issuance remained greater than tax-exempt issuance. Overall, muni returns largely trailed Treasuries. Within the broad muni sector, higher-quality securities outperformed lower-quality issues, and general obligation (GO) bonds outperformed revenue bonds. California munis modestly outperformed national munis.
Pandemic Pressured California Finances
State and local finances across the U.S. remained relatively healthy from the start of the reporting period through early 2020. However, costs related to the pandemic stretched California and other state budgets. The CARES Act earmarked funds to offset a large portion of those expenses. Additionally, adjustments by the California government to push select expenditures into 2021-2022 helped smooth the state’s expected drawdown in reserves. At of the end of August, the state’s cash position was strong, with $50.1 billion of available liquidity. This is a key indicator for rating agencies, given the state’s cash liquidity position typically weakens significantly in times of stress (such as from 2009 to 2011).
While California’s employment market has recovered slowly, especially within the hard-hit leisure and hospitality industry, the revenue impact continues to unfold. Yet, the state has several different levers to pull to adjust for any future downturns in revenue, including tax increases, spending to shift funds. The extent of the challenges hinges on the duration of the pandemic-related disruptions and economic downturn.
*All fund returns referenced in this commentary are for Investor Class shares. Performance for other share classes will vary due to differences in fee structure; when Investor Class performance exceeds that of the index, other share classes may not. See page 3 for returns for all share classes.
Security Selection, Sector Allocation Detracted from Results
Our security selection in the special tax, local GO and hospital sectors weighed on relative returns. While the index holds a blend of high- and low-quality issues in these sectors, we believe lower-quality securities possess a better risk/reward trade-off. Yet, when the market moves as dramatically as it did during the period, lower-quality securities tend to lag. Our security selection in the corporate muni sector helped offset some of these negative effects.
Our overweight allocation, relative to the index, to riskier sectors, including charter schools and student housing, diminished relative returns. An underweight stake in less-risky sectors, such as state GO bonds and water and sewer districts, also detracted. Conversely, avoiding the solid waste/resource recovery sector aided relative performance.
Duration Supplied a Lift
To help offset some of the credit risk in the portfolio, we consistently maintained a longer-than-index duration, which proved beneficial during the period. We also maintained overweight exposure in the 15- to 20-year portion of the yield curve, which supplied a lift.
Portfolio Positioning
Given the prevailing uncertainty related to the pandemic, we’re continually evaluating the broad secular and cyclical repercussions. We’re also monitoring how sectors such as student housing, nursing facilities and airports will manage marketplace changes.
As good as the CARES Act was in addressing the initial expenses of fighting COVID-19, we’re waiting to see what the next round of stimulus looks like. And if no new relief is forthcoming, state and local governments will likely need to implement measures to right-size under a lower-revenue regime. Meanwhile, the upcoming election also looms large due to the potential for higher tax rates, which generally provide a tailwind to the muni market.
Within California, the state’s cash reserves appear healthy enough to buffer the upcoming challenges. Nonetheless, between COVID-19 and the state’s wildfires, we’re weighing the long-term impacts such risks have on broader housing trends. Specifically, we’re considering how a distributed workforce away from coastal areas could affect fundamentals. Ultimately, we’re confident in the market’s resiliency, and we expect credit fundamentals to remain largely stable. Although downgrade levels will likely rise as the impact of the pandemic plays out, we believe defaults will mostly affect the riskiest parts of the market. We believe opportunities will continue to arise across the asset class at all quality levels, and our fundamental credit research will help identify those opportunities.
| | | | | |
| AUGUST 31, 2020 | |
| Portfolio at a Glance | |
| Weighted Average Life to Maturity | 19.7 years |
| Average Duration (Modified) | 5.7 years |
| | |
| Top Five Sectors | % of fund investments |
| Special Tax | 41% |
| Hospital | 15% |
| Tobacco Settlement | 7% |
| Charter School | 7% |
| Multi-Family Housing | 4% |
| | |
| Types of Investments in Portfolio | % of net assets |
| Municipal Securities | 100.4% |
| Other Assets and Liabilities | (0.4)% |
Fund shareholders may incur two types of costs: (1) transaction costs, including sales charges (loads) on purchase payments and redemption/exchange fees; and (2) ongoing costs, including management fees; distribution and service (12b-1) fees; and other fund expenses. This example is intended to help you understand your ongoing costs (in dollars) of investing in your fund and to compare these costs with the ongoing cost of investing in other mutual funds.
The example is based on an investment of $1,000 made at the beginning of the period and held for the entire period from March 1, 2020 to August 31, 2020.
Actual Expenses
The table provides information about actual account values and actual expenses for each class. You may use the information, together with the amount you invested, to estimate the expenses that you paid over the period. First, identify the share class you own. Then simply divide your account value by $1,000 (for example, an $8,600 account value divided by $1,000 = 8.6), then multiply the result by the number under the heading “Expenses Paid During Period” to estimate the expenses you paid on your account during this period.
If you hold Investor Class shares of any American Century Investments fund, or I Class shares of the American Century Diversified Bond Fund, in an American Century Investments account (i.e., not through a financial intermediary or employer-sponsored retirement plan account), American Century Investments may charge you a $25.00 annual account maintenance fee if the value of those shares is less than $10,000. We will redeem shares automatically in one of your accounts to pay the $25.00 fee. In determining your total eligible investment amount, we will include your investments in all personal accounts (including American Century Investments brokerage accounts) registered under your Social Security number. Personal accounts include individual accounts, joint accounts, UGMA/UTMA accounts, personal trusts, Coverdell Education Savings Accounts and IRAs (including traditional, Roth, Rollover, SEP-, SARSEP- and SIMPLE-IRAs), and certain other retirement accounts. If you have only business, business retirement, employer-sponsored or American Century Investments brokerage accounts, you are currently not subject to this fee. If you are subject to the account maintenance fee, your account value could be reduced by the fee amount.
Hypothetical Example for Comparison Purposes
The table also provides information about hypothetical account values and hypothetical expenses based on the actual expense ratio of each class of your fund and an assumed rate of return of 5% per year before expenses, which is not the actual return of a fund’s share class. The hypothetical account values and expenses may not be used to estimate the actual ending account balance or expenses you paid for the period. You may use this information to compare the ongoing costs of investing in your fund and other funds. To do so, compare this 5% hypothetical example with the 5% hypothetical examples that appear in the shareholder reports of the other funds.
Please note that the expenses shown in the table are meant to highlight your ongoing costs only and do not reflect any transactional costs, such as sales charges (loads) or redemption/exchange fees. Therefore, the table is useful in comparing ongoing costs only, and will not help you determine the relative total costs of owning different funds. In addition, if these transactional costs were included, your costs would have been higher.
| | | | | | | | | | | | | | |
| | Beginning
Account Value
3/1/20 | Ending
Account Value
8/31/20 | Expenses Paid During Period(1) 3/1/20 - 8/31/20 | Annualized Expense Ratio(1) |
| Actual | | | | |
| Investor Class | $1,000 | $971.50 | $2.48 | 0.50% |
| I Class | $1,000 | $973.30 | $1.49 | 0.30% |
| Y Class | $1,000 | $972.60 | $1.34 | 0.27% |
| A Class | $1,000 | $970.30 | $3.71 | 0.75% |
| C Class | $1,000 | $966.60 | $7.42 | 1.50% |
| Hypothetical | | | | |
| Investor Class | $1,000 | $1,022.62 | $2.54 | 0.50% |
| I Class | $1,000 | $1,023.63 | $1.53 | 0.30% |
| Y Class | $1,000 | $1,023.78 | $1.37 | 0.27% |
| A Class | $1,000 | $1,021.37 | $3.81 | 0.75% |
| C Class | $1,000 | $1,017.60 | $7.61 | 1.50% |
(1)Expenses are equal to the class's annualized expense ratio listed in the table above, multiplied by the average account value over the period, multiplied by 184, the number of days in the most recent fiscal half-year, divided by 366, to reflect the one-half year period. Annualized expense ratio reflects actual expenses, including any applicable fee waivers or expense reimbursements and excluding any acquired fund fees and expenses.
AUGUST 31, 2020
| | | | | | | | |
| Principal Amount | Value |
| MUNICIPAL SECURITIES — 100.4% | | |
| California — 99.3% | | |
| 91 Express Lanes Toll Road Rev., 5.00%, 8/15/30 | $ | 2,400,000 | | $ | 2,649,648 | |
| ABAG Finance Authority for Nonprofit Corps. Rev., (Jackson Laboratory), 5.00%, 7/1/37 | 2,000,000 | | 2,110,220 | |
| Alameda Community Facilities District Special Tax, 5.00%, 9/1/42 | 1,250,000 | | 1,381,750 | |
| Alameda Corridor Transportation Authority Rev., 5.00%, 10/1/26 | 2,000,000 | | 2,238,740 | |
| Alameda Corridor Transportation Authority Rev., 5.00%, 10/1/27 (AGM) | 2,000,000 | | 2,236,260 | |
| Alameda Corridor Transportation Authority Rev., 5.00%, 10/1/35 | 2,270,000 | | 2,645,072 | |
| Antelope Valley Healthcare District Rev., 5.00%, 3/1/46 | 5,000,000 | | 5,021,600 | |
| Beaumont Special Tax, 4.00%, 9/1/40 | 1,250,000 | | 1,363,800 | |
| Beaumont Special Tax, 4.00%, 9/1/45 | 1,510,000 | | 1,630,785 | |
| Beaumont Special Tax, 4.00%, 9/1/50 | 1,500,000 | | 1,613,805 | |
| Beaumont Special Tax, (Beaumont Community Facilities District No. 93-1), 5.00%, 9/1/43 | 1,605,000 | | 1,816,956 | |
| Beaumont Special Tax, (Beaumont Community Facilities District No. 93-1), 5.00%, 9/1/48 | 2,855,000 | | 3,217,671 | |
| Beaumont Special Tax, (Beaumont Community Facilities District No. 93-1), 5.00%, 9/1/48 | 2,535,000 | | 2,857,021 | |
| California Community College Financing Authority Rev., (NCCD-Orange Coast Properties LLC), 5.25%, 5/1/43 | 3,200,000 | | 3,309,888 | |
| California Community College Financing Authority Rev., (NCCD-Orange Coast Properties LLC), 5.25%, 5/1/48 | 4,500,000 | | 4,631,175 | |
California Community Housing Agency Rev., 5.00%, 4/1/49(1) | 8,035,000 | | 9,022,743 | |
California Community Housing Agency Rev., 5.00%, 8/1/49(1) | 11,000,000 | | 12,397,440 | |
California Community Housing Agency Rev., 5.00%, 2/1/50(1) | 5,000,000 | | 5,665,550 | |
| California County Tobacco Securitization Agency Rev., 4.00%, 6/1/49 | 750,000 | | 843,308 | |
| California County Tobacco Securitization Agency Rev., 5.00%, 6/1/49 | 650,000 | | 768,177 | |
California County Tobacco Securitization Agency Rev., (Alameda County Tobacco Securitization Corp.), 0.00%, 6/1/50(2) | 22,520,000 | | 3,663,328 | |
| California County Tobacco Securitization Agency Rev., (Gold Country Settlement Funding Corp.), 5.25%, 6/1/46 | 1,000,000 | | 1,000,020 | |
California County Tobacco Securitization Agency Rev., Capital Appreciation, 0.00%, 6/1/55(2) | 2,000,000 | | 358,040 | |
California Enterprise Development Authority Rev., (Academy For Academic Excellence), 5.00%, 7/1/40(1) | 500,000 | | 524,115 | |
California Enterprise Development Authority Rev., (Academy For Academic Excellence), 5.00%, 7/1/50(1) | 500,000 | | 519,000 | |
California Enterprise Development Authority Rev., (Academy For Academic Excellence), 5.00%, 7/1/55(1) | 350,000 | | 361,627 | |
| California Housing Finance Rev., 4.00%, 3/20/33 | 21,284,971 | | 23,519,254 | |
| California Housing Finance Rev., 4.25%, 1/15/35 | 3,278,159 | | 3,696,025 | |
| California Infrastructure & Economic Development Bank Rev., (Academy of Motion Picture Arts and Sciences Obligated Group), 5.00%, 11/1/29 | 5,000,000 | | 6,690,450 | |
| California Municipal Finance Authority Rev., (Azusa Pacific University), 5.00%, 4/1/41 | 1,860,000 | | 1,919,799 | |
| California Municipal Finance Authority Rev., (Bowles Hall Foundation), 5.00%, 6/1/50 | 1,750,000 | | 1,835,925 | |
California Municipal Finance Authority Rev., (California Baptist University), 5.00%, 11/1/46(1) | 2,000,000 | | 2,065,140 | |
| | | | | | | | |
| Principal Amount | Value |
| California Municipal Finance Authority Rev., (Caritas Affordable Housing, Inc.), 5.00%, 8/15/22 | $ | 360,000 | | $ | 386,759 | |
| California Municipal Finance Authority Rev., (CHF-Davis I LLC), 5.00%, 5/15/32 (BAM-TCRS) | 3,000,000 | | 3,632,220 | |
| California Municipal Finance Authority Rev., (CHF-Davis I LLC), 5.00%, 5/15/48 | 6,700,000 | | 7,632,774 | |
| California Municipal Finance Authority Rev., (CHF-Davis I LLC), 5.00%, 5/15/51 | 5,505,000 | | 6,259,350 | |
| California Municipal Finance Authority Rev., (CHF-Riverside I LLC), 5.00%, 5/15/52 | 5,140,000 | | 5,840,325 | |
| California Municipal Finance Authority Rev., (Claremont Graduate University), 5.00%, 10/1/49 | 2,145,000 | | 2,317,758 | |
| California Municipal Finance Authority Rev., (Claremont Graduate University), 5.00%, 10/1/54 | 1,875,000 | | 2,017,950 | |
| California Municipal Finance Authority Rev., (Clinicas del Camino Real Incorporated), 4.00%, 3/1/40 | 2,750,000 | | 3,017,492 | |
| California Municipal Finance Authority Rev., (Clinicas del Camino Real Incorporated), 4.00%, 3/1/50 | 6,785,000 | | 7,309,820 | |
| California Municipal Finance Authority Rev., (Community Hospitals of Central California Obligated Group), 5.00%, 2/1/27 | 1,000,000 | | 1,229,710 | |
| California Municipal Finance Authority Rev., (Community Hospitals of Central California Obligated Group), 5.00%, 2/1/46 | 3,615,000 | | 4,005,095 | |
| California Municipal Finance Authority Rev., (Congregational Home Obligated Group), 5.00%, 11/15/39 | 1,200,000 | | 1,308,744 | |
| California Municipal Finance Authority Rev., (Congregational Home Obligated Group), 5.00%, 11/15/49 | 4,750,000 | | 5,112,425 | |
California Municipal Finance Authority Rev., (Creative Center of Los Altos), 4.00%, 11/1/26(1) | 625,000 | | 636,481 | |
California Municipal Finance Authority Rev., (Creative Center of Los Altos), 4.00%, 11/1/36(1) | 1,400,000 | | 1,364,104 | |
California Municipal Finance Authority Rev., (Creative Center of Los Altos), 4.50%, 11/1/46(1) | 3,100,000 | | 3,071,573 | |
| California Municipal Finance Authority Rev., (Eisenhower Medical Center), 5.00%, 7/1/35 | 3,500,000 | | 4,073,090 | |
| California Municipal Finance Authority Rev., (Eisenhower Medical Center), 5.00%, 7/1/35 | 1,500,000 | | 1,745,610 | |
| California Municipal Finance Authority Rev., (Eisenhower Medical Center), 5.00%, 7/1/36 | 1,580,000 | | 1,832,547 | |
| California Municipal Finance Authority Rev., (Eisenhower Medical Center), 5.00%, 7/1/37 | 1,500,000 | | 1,735,035 | |
| California Municipal Finance Authority Rev., (Eisenhower Medical Center), 5.00%, 7/1/42 | 1,750,000 | | 1,987,352 | |
| California Municipal Finance Authority Rev., (Eisenhower Medical Center), 5.00%, 7/1/47 | 3,000,000 | | 3,368,400 | |
| California Municipal Finance Authority Rev., (Emerson College), 5.00%, 1/1/42 | 5,250,000 | | 5,981,482 | |
California Municipal Finance Authority Rev., (Healthright 360), 5.00%, 11/1/29(1) | 1,670,000 | | 1,885,547 | |
California Municipal Finance Authority Rev., (Healthright 360), 5.00%, 11/1/39(1) | 3,535,000 | | 3,822,643 | |
California Municipal Finance Authority Rev., (Healthright 360), 5.00%, 11/1/49(1) | 4,450,000 | | 4,717,400 | |
| California Municipal Finance Authority Rev., (Northbay Healthcare Group Obligated Group), 5.00%, 11/1/24 | 1,000,000 | | 1,124,480 | |
| California Municipal Finance Authority Rev., (Northbay Healthcare Group Obligated Group), 5.00%, 11/1/25 | 1,000,000 | | 1,145,680 | |
| California Municipal Finance Authority Rev., (Northbay Healthcare Group Obligated Group), 5.00%, 11/1/26 | 500,000 | | 580,315 | |
| California Municipal Finance Authority Rev., (Northbay Healthcare Group Obligated Group), 5.00%, 11/1/35 | 350,000 | | 379,243 | |
| | | | | | | | |
| Principal Amount | Value |
| California Municipal Finance Authority Rev., (Northbay Healthcare Group Obligated Group), 5.00%, 11/1/40 | $ | 500,000 | | $ | 536,410 | |
| California Municipal Finance Authority Rev., (Northbay Healthcare Group Obligated Group), 5.00%, 11/1/44 | 300,000 | | 319,635 | |
| California Municipal Finance Authority Rev., (Northbay Healthcare Group Obligated Group), 5.25%, 11/1/47 | 1,600,000 | | 1,763,152 | |
California Municipal Finance Authority Rev., (P3 Claremont Holdings LLC), 5.00%, 7/1/40(1) | 1,515,000 | | 1,659,743 | |
California Municipal Finance Authority Rev., (P3 Claremont Holdings LLC), 5.00%, 7/1/52(1) | 2,075,000 | | 2,239,195 | |
California Municipal Finance Authority Rev., (Palmdale Aerospace Academy, Inc.), 5.00%, 7/1/49(1) | 5,100,000 | | 5,362,650 | |
California Municipal Finance Authority Rev., (River Charter Schools), 5.50%, 6/1/38(1) | 800,000 | | 844,616 | |
California Municipal Finance Authority Rev., (River Charter Schools), 5.50%, 6/1/48(1) | 1,915,000 | | 2,002,994 | |
California Municipal Finance Authority Rev., (River Charter Schools), 5.50%, 6/1/53(1) | 1,805,000 | | 1,878,698 | |
California Municipal Finance Authority Rev., (Santa Rosa Academy LLC), 5.125%, 7/1/35(1) | 905,000 | | 953,743 | |
California Municipal Finance Authority Rev., (Santa Rosa Academy LLC), 5.375%, 7/1/45(1) | 1,400,000 | | 1,469,286 | |
| California Municipal Finance Authority Rev., (Touro College and University System Obligated Group), 5.25%, 1/1/34 | 950,000 | | 1,017,783 | |
| California Municipal Finance Authority Rev., (Touro College and University System Obligated Group), 5.25%, 1/1/40 | 1,750,000 | | 1,857,275 | |
| California Municipal Finance Authority Rev., (University of San Diego), 5.00%, 10/1/44 | 5,000,000 | | 6,229,500 | |
| California Municipal Finance Authority Rev., (University of San Diego), 5.00%, 10/1/49 | 5,000,000 | | 6,201,600 | |
| California Municipal Finance Authority Rev., (William Jessup University), 5.00%, 8/1/39 | 2,000,000 | | 2,080,700 | |
| California Municipal Finance Authority Rev., (William Jessup University), 5.00%, 8/1/48 | 2,700,000 | | 2,766,231 | |
California Pollution Control Financing Authority Rev., (San Diego County Water Authority), 5.00%, 11/21/45(1) | 2,500,000 | | 2,875,975 | |
| California Public Finance Authority Rev., (Henry Mayo Newhall Memorial Hospital), 5.00%, 10/15/47 | 3,500,000 | | 3,853,430 | |
California Public Finance Authority Rev., (Trinity Classical Academy), 5.00%, 7/1/36(1) | 400,000 | | 420,668 | |
California Public Finance Authority Rev., (Trinity Classical Academy), 5.00%, 7/1/44(1) | 375,000 | | 386,036 | |
California Public Finance Authority Rev., (Trinity Classical Academy), 5.00%, 7/1/54(1) | 1,000,000 | | 1,021,490 | |
| California School Finance Authority Rev., (Alliance for College Ready Public Schools Obligated Group), 5.00%, 7/1/31 | 4,000,000 | | 4,573,880 | |
California School Finance Authority Rev., (Alliance for College Ready Public Schools Obligated Group), 5.00%, 7/1/45(1) | 5,000,000 | | 5,539,700 | |
California School Finance Authority Rev., (Aspire Public Schools Obligated Group), 5.00%, 8/1/27(1) | 985,000 | | 1,151,081 | |
California School Finance Authority Rev., (Aspire Public Schools Obligated Group), 5.00%, 8/1/28(1) | 1,285,000 | | 1,492,887 | |
California School Finance Authority Rev., (Aspire Public Schools Obligated Group), 5.00%, 8/1/29(1) | 795,000 | | 920,181 | |
California School Finance Authority Rev., (Aspire Public Schools Obligated Group), 5.00%, 8/1/30(1) | 400,000 | | 460,376 | |
California School Finance Authority Rev., (Aspire Public Schools Obligated Group), 5.00%, 8/1/31(1) | 500,000 | | 573,185 | |
California School Finance Authority Rev., (Aspire Public Schools Obligated Group), 5.00%, 8/1/36(1) | 1,170,000 | | 1,320,661 | |
| | | | | | | | |
| Principal Amount | Value |
California School Finance Authority Rev., (Aspire Public Schools Obligated Group), 5.00%, 8/1/40(1) | $ | 1,000,000 | | $ | 1,120,310 | |
California School Finance Authority Rev., (Aspire Public Schools Obligated Group), 5.00%, 8/1/46(1) | 1,300,000 | | 1,444,456 | |
California School Finance Authority Rev., (Bright Star Schools Obligated Group), 5.00%, 6/1/37(1) | 1,800,000 | | 1,942,956 | |
California School Finance Authority Rev., (Bright Star Schools Obligated Group), 5.00%, 6/1/47(1) | 3,130,000 | | 3,322,808 | |
California School Finance Authority Rev., (Downtown College Prep Obligated Group), 4.00%, 6/1/26(1) | 2,525,000 | | 2,595,245 | |
California School Finance Authority Rev., (Downtown College Prep Obligated Group), 4.50%, 6/1/31(1) | 1,500,000 | | 1,571,835 | |
California School Finance Authority Rev., (Downtown College Prep Obligated Group), 4.75%, 6/1/36(1) | 1,500,000 | | 1,564,215 | |
California School Finance Authority Rev., (Downtown College Prep Obligated Group), 5.00%, 6/1/46(1) | 4,630,000 | | 4,833,905 | |
California School Finance Authority Rev., (Downtown College Prep Obligated Group), 5.00%, 6/1/51(1) | 2,000,000 | | 2,082,900 | |
California School Finance Authority Rev., (Ednovate Obligated Group), 5.00%, 6/1/30(1) | 1,325,000 | | 1,449,497 | |
California School Finance Authority Rev., (Ednovate Obligated Group), 5.00%, 6/1/37(1) | 430,000 | | 459,902 | |
California School Finance Authority Rev., (Ednovate Obligated Group), 5.00%, 6/1/48(1) | 2,100,000 | | 2,207,772 | |
California School Finance Authority Rev., (Ednovate Obligated Group), 5.00%, 6/1/56(1) | 2,000,000 | | 2,093,040 | |
California School Finance Authority Rev., (Fenton Charter Public Schools), 5.00%, 7/1/50(1) | 785,000 | | 832,916 | |
California School Finance Authority Rev., (Fenton Charter Public Schools), 5.00%, 7/1/58(1) | 770,000 | | 812,288 | |
California School Finance Authority Rev., (Green Dot Public Schools Obligated Group), 5.00%, 8/1/38(1) | 1,130,000 | | 1,324,993 | |
California School Finance Authority Rev., (Green Dot Public Schools Obligated Group), 5.00%, 8/1/45(1) | 3,500,000 | | 3,848,040 | |
California School Finance Authority Rev., (Green Dot Public Schools Obligated Group), 5.00%, 8/1/48(1) | 3,630,000 | | 4,176,823 | |
California School Finance Authority Rev., (Kepler Education, Inc.), 5.75%, 5/1/37(1) | 1,050,000 | | 1,137,339 | |
California School Finance Authority Rev., (Kepler Education, Inc.), 5.875%, 5/1/47(1) | 2,425,000 | | 2,602,001 | |
| California School Finance Authority Rev., (Kipp SoCal Public Schools Obligated Group), 4.125%, 7/1/24 | 300,000 | | 320,730 | |
| California School Finance Authority Rev., (Kipp SoCal Public Schools Obligated Group), 5.00%, 7/1/34 | 500,000 | | 553,425 | |
California School Finance Authority Rev., (Kipp SoCal Public Schools Obligated Group), 5.00%, 7/1/37(1) | 1,180,000 | | 1,378,618 | |
California School Finance Authority Rev., (Kipp SoCal Public Schools Obligated Group), 5.00%, 7/1/39(1) | 1,000,000 | | 1,204,810 | |
| California School Finance Authority Rev., (Kipp SoCal Public Schools Obligated Group), 5.125%, 7/1/44 | 700,000 | | 768,705 | |
California School Finance Authority Rev., (Kipp SoCal Public Schools Obligated Group), 5.00%, 7/1/45(1) | 1,650,000 | | 1,834,437 | |
California School Finance Authority Rev., (Kipp SoCal Public Schools Obligated Group), 5.00%, 7/1/49(1) | 2,000,000 | | 2,371,740 | |
California School Finance Authority Rev., (Kipp SoCal Public Schools Obligated Group), 5.00%, 7/1/54(1) | 1,150,000 | | 1,362,635 | |
California School Finance Authority Rev., (Larchmont Schools), 5.00%, 6/1/33(1) | 500,000 | | 533,240 | |
California School Finance Authority Rev., (Larchmont Schools), 5.00%, 6/1/43(1) | 550,000 | | 573,287 | |
| | | | | | | | |
| Principal Amount | Value |
California School Finance Authority Rev., (Larchmont Schools), 5.00%, 6/1/55(1) | $ | 1,000,000 | | $ | 1,033,450 | |
California School Finance Authority Rev., (Real Journey Academies Obligated Group), 5.00%, 6/1/49(1) | 5,250,000 | | 5,404,035 | |
California School Finance Authority Rev., (Rocketship Education Obligated Group), 5.00%, 6/1/21(1) | 320,000 | | 324,966 | |
California School Finance Authority Rev., (Rocketship Education Obligated Group), 5.00%, 6/1/26(1) | 500,000 | | 536,435 | |
California School Finance Authority Rev., (Rocketship Education Obligated Group), 5.00%, 6/1/31(1) | 870,000 | | 926,968 | |
California School Finance Authority Rev., (Rocketship Education Obligated Group), 5.00%, 6/1/36(1) | 1,000,000 | | 1,051,620 | |
California School Finance Authority Rev., (Rocketship Education Obligated Group), 5.00%, 6/1/37(1) | 360,000 | | 384,595 | |
California School Finance Authority Rev., (Rocketship Education Obligated Group), 5.00%, 6/1/46(1) | 2,100,000 | | 2,178,813 | |
California School Finance Authority Rev., (Rocketship Education Obligated Group), 5.00%, 6/1/53(1) | 2,265,000 | | 2,371,727 | |
California School Finance Authority Rev., (Summit Public Schools Obligated Group), 5.00%, 6/1/37(1) | 1,000,000 | | 1,139,850 | |
California School Finance Authority Rev., (Summit Public Schools Obligated Group), 5.00%, 6/1/47(1) | 1,870,000 | | 2,093,558 | |
California School Finance Authority Rev., (Summit Public Schools Obligated Group), 4.30%, 6/1/53(1) | 2,935,000 | | 2,954,254 | |
California School Finance Authority Rev., (TEACH, Inc. Obligated Group), 5.00%, 6/1/58(1) | 3,600,000 | | 3,745,476 | |
| California State Financial Authority Rev., (Master's University & Seminary), 5.00%, 8/1/34 | 1,400,000 | | 1,500,800 | |
| California State Financial Authority Rev., (Master's University & Seminary), 5.00%, 8/1/39 | 1,640,000 | | 1,730,413 | |
| California State Financial Authority Rev., (Master's University & Seminary), 5.00%, 8/1/48 | 1,000,000 | | 1,037,830 | |
| California State Public Works Board Rev., 5.00%, 11/1/38 | 2,350,000 | | 2,653,079 | |
| California State Public Works Board Rev., (State of California Department of Corrections & Rehabilitation), 5.00%, 9/1/39 | 7,000,000 | | 8,123,010 | |
California Statewide Communities Development Authority Rev., (899 Charleston LLC), 5.25%, 11/1/44(1) | 1,795,000 | | 1,852,368 | |
| California Statewide Communities Development Authority Rev., (Adventist Health System / West Obligated Group), 5.00%, 3/1/35 | 1,785,000 | | 2,123,043 | |
California Statewide Communities Development Authority Rev., (California Baptist University), 3.00%, 11/1/22(1) | 1,300,000 | | 1,301,170 | |
California Statewide Communities Development Authority Rev., (California Baptist University), 3.50%, 11/1/27(1) | 2,630,000 | | 2,596,625 | |
California Statewide Communities Development Authority Rev., (California Baptist University), 5.00%, 11/1/32(1) | 3,090,000 | | 3,314,488 | |
California Statewide Communities Development Authority Rev., (California Baptist University), 5.00%, 11/1/41(1) | 6,325,000 | | 6,607,032 | |
| California Statewide Communities Development Authority Rev., (Collis P and Howard Huntington Memorial Hospital Obligated Group), 5.00%, 7/1/34 | 1,500,000 | | 1,685,010 | |
| California Statewide Communities Development Authority Rev., (Collis P and Howard Huntington Memorial Hospital Obligated Group), 5.00%, 7/1/44 | 2,760,000 | | 3,055,679 | |
| California Statewide Communities Development Authority Rev., (Emanate Health Obligated Group), 4.00%, 4/1/45 | 2,000,000 | | 2,279,440 | |
| California Statewide Communities Development Authority Rev., (Episcopal Communities & Services for Seniors), 5.00%, 5/15/42 | 2,635,000 | | 2,759,451 | |
| California Statewide Communities Development Authority Rev., (Henry Mayo Newhall Memorial Hospital), 5.25%, 10/1/43 (AGM) | 1,000,000 | | 1,121,600 | |
| California Statewide Communities Development Authority Rev., (HumanGood California Obligated Group), 5.00%, 10/1/43 (GA: American Baptist Homes Foundation) | 1,200,000 | | 1,248,984 | |
| | | | | | | | |
| Principal Amount | Value |
| California Statewide Communities Development Authority Rev., (HumanGood California Obligated Group), 5.00%, 10/1/45 | $ | 2,400,000 | | $ | 2,619,720 | |
California Statewide Communities Development Authority Rev., (Independence Support LLC), 7.00%, 6/1/45(3)(4) | 552,144 | | 303,679 | |
| California Statewide Communities Development Authority Rev., (Kaiser Foundation Hospitals), VRN, 5.00%, 4/1/38 | 5,000,000 | | 6,689,200 | |
California Statewide Communities Development Authority Rev., (Lancer Educational Housing LLC), 5.00%, 6/1/46(1) | 3,500,000 | | 3,546,830 | |
California Statewide Communities Development Authority Rev., (Lancer Educational Housing LLC), 5.00%, 6/1/51(1) | 1,450,000 | | 1,473,041 | |
California Statewide Communities Development Authority Rev., (Loma Linda University Medical Center Obligated Group), 5.00%, 12/1/26(1) | 2,000,000 | | 2,273,400 | |
California Statewide Communities Development Authority Rev., (Loma Linda University Medical Center Obligated Group), 5.00%, 12/1/29(1) | 3,155,000 | | 3,560,386 | |
California Statewide Communities Development Authority Rev., (Loma Linda University Medical Center Obligated Group), 5.00%, 12/1/36(1) | 1,000,000 | | 1,101,770 | |
California Statewide Communities Development Authority Rev., (Loma Linda University Medical Center Obligated Group), 5.00%, 12/1/41(1) | 1,700,000 | | 1,856,145 | |
California Statewide Communities Development Authority Rev., (Loma Linda University Medical Center Obligated Group), 5.00%, 12/1/46(1) | 9,900,000 | | 10,740,807 | |
| California Statewide Communities Development Authority Rev., (Loma Linda University Medical Center Obligated Group), 5.50%, 12/1/54 | 4,605,000 | | 4,947,842 | |
California Statewide Communities Development Authority Rev., (Loma Linda University Medical Center Obligated Group), 5.50%, 12/1/58(1) | 14,750,000 | | 16,241,225 | |
| California Statewide Communities Development Authority Rev., (Methodist Hospital of Southern California Obligated Group), 5.00%, 1/1/48 | 10,000,000 | | 11,489,100 | |
California Statewide Communities Development Authority Rev., (NCCD-Hooper Street LLC), 5.25%, 7/1/39(1) | 2,550,000 | | 2,567,722 | |
California Statewide Communities Development Authority Rev., (NCCD-Hooper Street LLC), 5.25%, 7/1/49(1) | 3,375,000 | | 3,322,991 | |
| California Statewide Communities Development Authority Rev., (Redlands Community Hospital), 4.00%, 10/1/41 | 6,500,000 | | 6,967,220 | |
| California Statewide Communities Development Authority Special Assessment, 2.70%, 9/2/22 | 345,000 | | 352,424 | |
| California Statewide Communities Development Authority Special Assessment, 3.00%, 9/2/23 | 355,000 | | 369,353 | |
| California Statewide Communities Development Authority Special Assessment, 3.00%, 9/2/24 | 365,000 | | 383,057 | |
| California Statewide Communities Development Authority Special Assessment, 5.00%, 9/2/34 | 1,125,000 | | 1,324,721 | |
| California Statewide Communities Development Authority Special Assessment, 5.00%, 9/2/35 | 1,920,000 | | 2,146,464 | |
| California Statewide Communities Development Authority Special Assessment, 5.00%, 9/2/39 | 1,300,000 | | 1,485,302 | |
| California Statewide Communities Development Authority Special Assessment, 4.00%, 9/2/44 | 900,000 | | 941,535 | |
| California Statewide Communities Development Authority Special Assessment, 5.00%, 9/2/45 | 3,810,000 | | 4,181,780 | |
| California Statewide Communities Development Authority Special Assessment, 5.00%, 9/2/49 | 700,000 | | 789,635 | |
| California Statewide Communities Development Authority Special Tax, 5.00%, 9/1/36 | 1,000,000 | | 1,116,070 | |
| California Statewide Communities Development Authority Special Tax, 5.00%, 9/1/37 | 3,025,000 | | 3,324,777 | |
| | | | | | | | |
| Principal Amount | Value |
| California Statewide Communities Development Authority Special Tax, 5.00%, 9/1/39 | $ | 1,545,000 | | $ | 1,777,816 | |
| California Statewide Communities Development Authority Special Tax, 5.00%, 9/1/45 | 1,500,000 | | 1,651,440 | |
| California Statewide Communities Development Authority Special Tax, 5.00%, 9/1/47 | 1,650,000 | | 1,855,821 | |
| California Statewide Communities Development Authority Special Tax, 5.00%, 9/1/48 | 7,330,000 | | 8,337,508 | |
| California Statewide Communities Development Authority Special Tax, 5.00%, 9/1/48 | 1,750,000 | | 1,969,398 | |
| California Statewide Communities Development Authority Special Tax, (California Statewide Communities Development Authority Cmnty Facs Dist No. 2016-02), 5.00%, 9/1/39 | 1,000,000 | | 1,140,840 | |
| California Statewide Communities Development Authority Special Tax, (California Statewide Communities Development Authority Cmnty Facs Dist No. 2016-02), 5.00%, 9/1/49 | 2,095,000 | | 2,349,375 | |
| California Statewide Communities Development Authority Special Tax, (California Statewide Communities Development Authority Cmnty Facs Dist No. 2018-), 4.00%, 9/1/50 | 1,200,000 | | 1,240,992 | |
Calimesa Special Tax, (Calimesa Community Facilities District No. 2018-1), 4.00%, 9/1/37(5) | 415,000 | | 460,418 | |
Calimesa Special Tax, (Calimesa Community Facilities District No. 2018-1), 4.00%, 9/1/45(5) | 865,000 | | 935,359 | |
Calimesa Special Tax, (Calimesa Community Facilities District No. 2018-1), 4.00%, 9/1/50(5) | 820,000 | | 881,549 | |
| Cathedral City Redevelopment Agency Successor Agency Tax Allocation, 5.00%, 8/1/29 (AGM) | 1,250,000 | | 1,441,938 | |
| Cathedral City Redevelopment Agency Successor Agency Tax Allocation, 5.00%, 8/1/30 (AGM) | 1,315,000 | | 1,512,119 | |
| Cathedral City Redevelopment Agency Successor Agency Tax Allocation, 5.00%, 8/1/31 (AGM) | 1,380,000 | | 1,579,424 | |
| Central Basin Municipal Water District Rev., 5.00%, 8/1/44 | 5,000,000 | | 5,468,150 | |
| Chino Basin Regional Financing Authority Rev., (Inland Empire Utilities Agency), 4.00%, 11/1/25 | 3,000,000 | | 3,553,140 | |
| Chino Community Facilities District Special Tax, 5.00%, 9/1/43 | 3,160,000 | | 3,618,453 | |
| Chino Community Facilities District Special Tax, 4.00%, 9/1/45 | 1,325,000 | | 1,424,494 | |
| Chino Community Facilities District Special Tax, 5.00%, 9/1/48 | 2,500,000 | | 2,834,150 | |
| Chino Community Facilities District Special Tax, 4.00%, 9/1/50 | 2,500,000 | | 2,676,550 | |
| Chula Vista Community Facilities District Special Tax, (Chula Vista Community Facilities District No. 06-1), 5.00%, 9/1/43 | 595,000 | | 670,577 | |
| Chula Vista Community Facilities District Special Tax, (Chula Vista Community Facilities District No. 06-1), 5.00%, 9/1/48 | 1,000,000 | | 1,120,510 | |
| Corona-Norco Unified School District Special Tax, 5.00%, 9/1/43 | 2,430,000 | | 2,744,782 | |
| Corona-Norco Unified School District Special Tax, 4.00%, 9/1/45 | 2,000,000 | | 2,121,460 | |
| Corona-Norco Unified School District Special Tax, 5.00%, 9/1/48 | 1,500,000 | | 1,687,530 | |
| Del Mar Race Track Authority Rev., 5.00%, 10/1/29 | 1,010,000 | | 1,005,586 | |
| Del Mar Race Track Authority Rev., 5.00%, 10/1/35 | 2,000,000 | | 1,950,300 | |
| Dixon Special Tax, 5.00%, 9/1/45 | 4,780,000 | | 5,236,872 | |
| Dixon Special Tax, (Dixon Community Facilities District No. 2013-1 Parklane), 5.00%, 9/1/49 | 2,400,000 | | 2,686,416 | |
| Dublin Community Facilities District Improvement Area No. 1 Special Tax, 5.00%, 9/1/29 | 665,000 | | 796,723 | |
| Dublin Community Facilities District Improvement Area No. 1 Special Tax, 5.00%, 9/1/37 | 1,150,000 | | 1,331,275 | |
| Dublin Community Facilities District Improvement Area No. 1 Special Tax, 5.00%, 9/1/39 | 3,200,000 | | 3,660,288 | |
| Dublin Community Facilities District Improvement Area No. 1 Special Tax, 5.00%, 9/1/47 | 2,840,000 | | 3,232,658 | |
| Dublin Community Facilities District Improvement Area No. 1 Special Tax, 5.00%, 9/1/49 | 7,300,000 | | 8,192,571 | |
| | | | | | | | |
| Principal Amount | Value |
| East Garrison Public Finance Authority Special Tax, 5.00%, 9/1/46 | $ | 1,170,000 | | $ | 1,312,646 | |
| Eastern Municipal Water District Special Tax, 5.00%, 9/1/36 | 3,575,000 | | 4,006,002 | |
| El Dorado County Special Tax, 5.00%, 9/1/27 | 1,050,000 | | 1,294,503 | |
| El Dorado County Special Tax, 5.00%, 9/1/29 | 1,220,000 | | 1,485,338 | |
| El Dorado County Special Tax, 5.00%, 9/1/30 | 1,320,000 | | 1,598,744 | |
| El Dorado County Special Tax, 5.00%, 9/1/31 | 1,275,000 | | 1,536,120 | |
| El Dorado County Special Tax, 5.00%, 9/1/32 | 1,350,000 | | 1,612,211 | |
| El Dorado County Special Tax, 4.00%, 9/1/43 | 1,250,000 | | 1,333,475 | |
| El Dorado County Special Tax, 4.00%, 9/1/46 | 2,350,000 | | 2,482,211 | |
| El Dorado County Special Tax, 5.00%, 9/1/48 | 2,850,000 | | 3,150,561 | |
| El Dorado County Special Tax, (El County Dorado Community Facilities District No. 2018-1 Bass Lake Hills), 5.00%, 9/1/34 | 450,000 | | 515,880 | |
| El Dorado County Special Tax, (El County Dorado Community Facilities District No. 2018-1 Bass Lake Hills), 5.00%, 9/1/39 | 725,000 | | 820,490 | |
| El Dorado County Special Tax, (El County Dorado Community Facilities District No. 2018-1 Bass Lake Hills), 5.00%, 9/1/44 | 1,300,000 | | 1,456,000 | |
| El Dorado County Special Tax, (El County Dorado Community Facilities District No. 2018-1 Bass Lake Hills), 5.00%, 9/1/49 | 1,500,000 | | 1,670,280 | |
| Elk Grove Finance Authority Special Tax, 5.00%, 9/1/43 | 1,040,000 | | 1,170,998 | |
| Elk Grove Finance Authority Special Tax, 5.00%, 9/1/48 | 1,250,000 | | 1,397,188 | |
| Emeryville Redevelopment Agency Successor Agency Tax Allocation, 5.00%, 9/1/34 (AGM) | 1,000,000 | | 1,142,880 | |
| Fairfield Community Facilities District Special Tax, 5.00%, 9/1/49 | 1,600,000 | | 1,802,192 | |
| Fairfield Community Facilities District Special Tax, (Fairfield Community Facilities District No. 2016-1), 5.00%, 9/1/39 | 500,000 | | 575,485 | |
Fairfield Community Facilities District Special Tax, (Fairfield Community Facilities District No. 2019-1), 5.00%, 9/1/35(1) | 780,000 | | 906,781 | |
Fairfield Community Facilities District Special Tax, (Fairfield Community Facilities District No. 2019-1), 5.00%, 9/1/50(1) | 3,250,000 | | 3,646,500 | |
| Folsom Ranch Financing Authority Special Tax, 5.00%, 9/1/47 | 4,325,000 | | 4,896,549 | |
| Folsom Ranch Financing Authority Special Tax, (Folsom Community Facilities District No. 19), 5.00%, 9/1/34 | 1,690,000 | | 1,972,957 | |
| Folsom Ranch Financing Authority Special Tax, (Folsom Community Facilities District No. 19), 5.00%, 9/1/39 | 1,255,000 | | 1,440,803 | |
| Folsom Ranch Financing Authority Special Tax, (Folsom Community Facilities District No. 19), 5.00%, 9/1/44 | 2,285,000 | | 2,598,228 | |
| Folsom Ranch Financing Authority Special Tax, (Folsom Community Facilities District No. 20), 5.00%, 9/1/33 | 530,000 | | 609,945 | |
| Folsom Ranch Financing Authority Special Tax, (Folsom Community Facilities District No. 20), 5.00%, 9/1/38 | 845,000 | | 960,072 | |
| Folsom Ranch Financing Authority Special Tax, (Folsom Community Facilities District No. 20), 5.00%, 9/1/48 | 1,675,000 | | 1,879,367 | |
| Folsom Ranch Financing Authority Special Tax, (Folsom Community Facilities District No. 21), 5.00%, 9/1/35 | 1,285,000 | | 1,495,547 | |
| Folsom Ranch Financing Authority Special Tax, (Folsom Community Facilities District No. 21), 5.00%, 9/1/39 | 1,555,000 | | 1,784,285 | |
| Folsom Ranch Financing Authority Special Tax, (Folsom Community Facilities District No. 21), 5.00%, 9/1/44 | 2,540,000 | | 2,886,659 | |
| Fontana Special Tax, (Fontana Community Facilities District No. 31), 5.00%, 9/1/35 | 1,365,000 | | 1,545,480 | |
| Fontana Special Tax, (Fontana Community Facilities District No. 80 Bella Strada), 5.00%, 9/1/46 | 1,000,000 | | 1,135,590 | |
| Foothill-Eastern Transportation Corridor Agency Rev., 6.50%, 1/15/43 | 4,000,000 | | 4,542,840 | |
Foothill-Eastern Transportation Corridor Agency Rev., Capital Appreciation, 0.00%, 1/15/42(2) | 6,000,000 | | 2,963,100 | |
| Foothill-Eastern Transportation Corridor Agency Rev., Capital Appreciation, VRN, 0.00%, 1/15/42 | 2,200,000 | | 2,500,036 | |
| | | | | | | | |
| Principal Amount | Value |
| Foothill-Eastern Transportation Corridor Agency Rev., VRN, 5.50%, 1/15/53 | $ | 3,750,000 | | $ | 4,020,825 | |
| Fremont Community Facilities District No. 1 Special Tax, 5.00%, 9/1/40 | 3,000,000 | | 3,311,250 | |
| Fremont Community Facilities District No. 1 Special Tax, 5.00%, 9/1/45 | 2,000,000 | | 2,191,160 | |
| Fremont Community Facilities District No. 2 Special Tax, 5.00%, 9/1/44 | 1,000,000 | | 1,122,000 | |
| Fremont Community Facilities District No. 2 Special Tax, 5.00%, 9/1/49 | 1,550,000 | | 1,731,335 | |
| Golden State Tobacco Securitization Corp. Rev., 5.00%, 6/1/24 | 1,500,000 | | 1,739,340 | |
| Golden State Tobacco Securitization Corp. Rev., 5.00%, 6/1/25 | 1,000,000 | | 1,191,130 | |
| Golden State Tobacco Securitization Corp. Rev., 5.00%, 6/1/26 | 1,000,000 | | 1,220,970 | |
| Golden State Tobacco Securitization Corp. Rev., 5.00%, 6/1/29 | 1,500,000 | | 1,672,710 | |
| Golden State Tobacco Securitization Corp. Rev., 5.30%, 6/1/37 | 7,000,000 | | 7,255,990 | |
| Golden State Tobacco Securitization Corp. Rev., 5.00%, 6/1/47 | 10,000,000 | | 10,282,200 | |
| Golden State Tobacco Securitization Corp. Rev., 5.00%, 6/1/47 | 4,300,000 | | 4,421,346 | |
| Golden State Tobacco Securitization Corp. Rev., 5.25%, 6/1/47 | 16,500,000 | | 17,018,265 | |
Golden State Tobacco Securitization Corp. Rev., Capital Appreciation, 0.00%, 6/1/47(2) | 45,000,000 | | 9,500,850 | |
Hastings Campus Housing Finance Authority Rev., (University of California Hastings College of the Law), 5.00%, 7/1/61(5) | 5,335,000 | | 5,406,489 | |
Hastings Campus Housing Finance Authority Rev., Capital Appreciation, VRN, (University of California Hastings College of the Law), 0.00%, 7/1/61(1)(5) | 14,365,000 | | 5,417,616 | |
| Hemet Unified School District Financing Authority Special Tax, 5.00%, 9/1/34 | 350,000 | | 390,019 | |
| Hemet Unified School District Financing Authority Special Tax, 5.00%, 9/1/39 | 2,100,000 | | 2,315,691 | |
| Hesperia Special Tax, 5.00%, 9/1/29 | 1,060,000 | | 1,186,023 | |
| Hesperia Special Tax, 5.00%, 9/1/35 | 2,690,000 | | 2,954,319 | |
| Huntington Beach Community Facilities District Special Tax, 5.375%, 9/1/33 | 1,700,000 | | 1,853,544 | |
| Independent Cities Finance Authority Rev., 5.00%, 10/15/47 | 4,000,000 | | 4,182,280 | |
| Independent Cities Finance Authority Rev., (Augusta Communities LLC), 5.00%, 5/15/39 | 2,500,000 | | 2,607,050 | |
| Independent Cities Finance Authority Rev., (Castle Mobile Estates), 6.75%, 8/15/46 | 2,500,000 | | 2,599,175 | |
| Independent Cities Finance Authority Rev., (Palomar Estates East), 5.00%, 9/15/36 | 1,000,000 | | 1,084,550 | |
| Independent Cities Finance Authority Rev., (Palomar Estates West), 5.00%, 9/15/36 | 1,500,000 | | 1,626,825 | |
| Inland Valley Development Agency Tax Allocation, 5.25%, 9/1/37 | 1,110,000 | | 1,240,114 | |
| Irvine Special Assessment, 5.00%, 9/2/42 | 1,500,000 | | 1,673,790 | |
| Irvine Special Assessment, VRDN, 0.02%, 9/1/20 (LOC: State Street Bank & Trust Co.) | 843,000 | | 843,000 | |
| Irvine Special Tax, 5.00%, 9/1/39 | 1,000,000 | | 1,101,460 | |
| Irvine Special Tax, 5.00%, 9/1/44 | 500,000 | | 546,465 | |
| Irvine Special Tax, 5.00%, 9/1/49 | 4,500,000 | | 4,903,785 | |
| Irvine Special Tax, (Irvine Community Facilities District No. 2013-3), 5.00%, 9/1/43 | 2,500,000 | | 2,847,900 | |
| Irvine Special Tax, (Irvine Community Facilities District No. 2013-3), 5.00%, 9/1/48 | 4,250,000 | | 4,815,590 | |
| Irvine Unified School District Special Tax, 5.00%, 9/1/29 | 550,000 | | 677,116 | |
| Irvine Unified School District Special Tax, 5.00%, 9/1/29 | 700,000 | | 861,784 | |
| Irvine Unified School District Special Tax, 5.00%, 9/1/31 | 420,000 | | 511,228 | |
| Irvine Unified School District Special Tax, 5.00%, 9/1/34 | 500,000 | | 599,350 | |
| | | | | | | | |
| Principal Amount | Value |
| Irvine Unified School District Special Tax, 6.70%, 9/1/35 | $ | 515,000 | | $ | 515,000 | |
| Irvine Unified School District Special Tax, 4.00%, 9/1/50 (BAM) | 3,195,000 | | 3,717,862 | |
| Irvine Unified School District Special Tax, 5.00%, 3/1/57 | 3,500,000 | | 4,010,090 | |
| Jurupa Community Services District Special Tax, 5.00%, 9/1/37 | 250,000 | | 262,313 | |
| Jurupa Community Services District Special Tax, 5.00%, 9/1/40 | 1,605,000 | | 1,819,251 | |
| Jurupa Community Services District Special Tax, 5.00%, 9/1/42 | 1,000,000 | | 1,045,440 | |
| Jurupa Public Financing Authority Special Tax, 5.00%, 9/1/42 | 1,000,000 | | 1,117,590 | |
| Jurupa Unified School District Special Tax, 5.00%, 9/1/33 | 1,220,000 | | 1,404,647 | |
| Jurupa Unified School District Special Tax, 5.00%, 9/1/38 | 1,000,000 | | 1,136,690 | |
| Jurupa Unified School District Special Tax, 5.00%, 9/1/43 | 1,255,000 | | 1,414,410 | |
| Jurupa Unified School District Special Tax, 4.00%, 9/1/47 | 1,000,000 | | 1,058,180 | |
La Verne COP, (Brethren Hillcrest Homes), 5.00%, 5/15/22, Prerefunded at 101% of Par(6) | 1,100,000 | | 1,198,879 | |
| Lake Elsinore Special Tax, (Lake Elsinore Community Facilities District No. 2016-2), 5.00%, 9/1/43 | 2,470,000 | | 2,770,130 | |
| Lake Elsinore Special Tax, (Lake Elsinore Community Facilities District No. 2016-2), 5.00%, 9/1/48 | 3,640,000 | | 4,060,529 | |
| Lake Elsinore Facilities Financing Authority Special Tax, 4.00%, 9/1/44 | 535,000 | | 570,727 | |
| Lake Elsinore Public Financing Authority Special Tax, 5.00%, 9/1/40 | 1,925,000 | | 2,138,001 | |
| Lake Elsinore Unified School District Community Facilities District Special Tax, 4.00%, 9/1/42 | 600,000 | | 640,092 | |
| Lake Elsinore Unified School District Community Facilities District Special Tax, 4.00%, 9/1/47 | 900,000 | | 955,863 | |
| Lammersville Joint Unified School District Special Tax, (Lammersville Joint Unified School District Community Facilities Dist No. 2007-1), 6.00%, 9/1/43 | 1,250,000 | | 1,376,338 | |
| Lammersville Joint Unified School District Special Tax, (Lammersville Joint Unified School District Community Facilities Dist No. 2014-1), 5.00%, 9/1/43 | 775,000 | | 863,381 | |
| Lammersville Joint Unified School District Special Tax, (Lammersville Joint Unified School District Community Facilities Dist No. 2014-1), 5.00%, 9/1/47 | 3,750,000 | | 4,207,725 | |
| Lammersville Joint Unified School District Special Tax, (Lammersville Joint Unified School District Community Facilities Dist No. 2014-1), 5.00%, 9/1/48 | 2,500,000 | | 2,773,975 | |
| Lammersville Joint Unified School District Special Tax, (Lammersville Joint Unified School District Community Facilities District No. 200), 5.00%, 9/1/27 | 450,000 | | 548,537 | |
| Lammersville Joint Unified School District Special Tax, (Lammersville Joint Unified School District Community Facilities District No. 200), 5.00%, 9/1/28 | 505,000 | | 612,469 | |
| Lammersville Joint Unified School District Special Tax, (Lammersville Joint Unified School District Community Facilities District No. 200), 5.00%, 9/1/30 | 1,300,000 | | 1,549,223 | |
| Lammersville Joint Unified School District Special Tax, (Lammersville Joint Unified School District Community Facilities District No. 200), 5.00%, 9/1/32 | 1,510,000 | | 1,768,769 | |
| Long Beach Bond Finance Authority Rev., 5.50%, 11/15/37 (GA: Merrill Lynch & Co.) | 1,150,000 | | 1,675,194 | |
| Los Angeles Community Facilities District Special Tax, 6.40%, 9/1/22 | 330,000 | | 334,590 | |
| Los Angeles County Metropolitan Transportation Authority Rev., 4.00%, 6/1/37 | 1,000,000 | | 1,219,130 | |
| Los Angeles County Public Works Financing Authority Rev., 5.00%, 12/1/44 | 7,000,000 | | 8,889,720 | |
| Los Angeles Department of Airports Rev., 5.00%, 5/15/39 | 5,000,000 | | 6,358,050 | |
| Los Angeles Department of Airports Rev., 4.00%, 5/15/40 | 5,000,000 | | 5,895,950 | |
| Los Angeles Department of Water Rev., VRDN, 0.01%, 9/1/20 (SBBPA: Citibank N.A.) | 5,000,000 | | 5,000,000 | |
| | | | | | | | |
| Principal Amount | Value |
| Los Angeles Department of Water & Power System Rev., VRDN, 0.02%, 9/1/20 (SBBPA: Bank of America N.A.) | $ | 6,230,000 | | $ | 6,230,000 | |
| Los Angeles Department of Water & Power System Rev., VRDN, 0.02%, 9/1/20 (SBBPA: Barclays Bank) | 300,000 | | 300,000 | |
| Los Angeles Department of Water & Power System Rev., VRDN, 0.02%, 9/1/20 (SBBPA: TD Bank N.A.) | 2,100,000 | | 2,100,000 | |
| Los Angeles Department of Water & Power System Rev., VRDN, 0.02%, 9/1/20 (SBBPA: Bank of America N.A.) | 585,000 | | 585,000 | |
| M-S-R Energy Authority Rev., 7.00%, 11/1/34 (GA: Citigroup Global Markets) | 1,700,000 | | 2,645,387 | |
| M-S-R Energy Authority Rev., 6.50%, 11/1/39 (GA: Citigroup Global Markets) | 4,000,000 | | 6,372,520 | |
| Marina Redevelopment Agency Successor Agency Tax Allocation, 5.00%, 9/1/21 | 125,000 | | 129,885 | |
| Marina Redevelopment Agency Successor Agency Tax Allocation, 5.00%, 9/1/21 | 215,000 | | 223,359 | |
| Marina Redevelopment Agency Successor Agency Tax Allocation, 5.00%, 9/1/22 | 100,000 | | 107,473 | |
| Marina Redevelopment Agency Successor Agency Tax Allocation, 5.00%, 9/1/22 | 225,000 | | 241,628 | |
| Marina Redevelopment Agency Successor Agency Tax Allocation, 5.00%, 9/1/23 | 100,000 | | 111,205 | |
| Marina Redevelopment Agency Successor Agency Tax Allocation, 5.00%, 9/1/23 | 110,000 | | 121,605 | |
| Marina Redevelopment Agency Successor Agency Tax Allocation, 5.00%, 9/1/24 | 250,000 | | 284,195 | |
| Marina Redevelopment Agency Successor Agency Tax Allocation, 5.00%, 9/1/25 | 175,000 | | 204,540 | |
| Marina Redevelopment Agency Successor Agency Tax Allocation, 5.00%, 9/1/25 | 260,000 | | 302,117 | |
| Marina Redevelopment Agency Successor Agency Tax Allocation, 5.00%, 9/1/26 | 135,000 | | 160,164 | |
| Marina Redevelopment Agency Successor Agency Tax Allocation, 5.00%, 9/1/26 | 115,000 | | 135,701 | |
| Marina Redevelopment Agency Successor Agency Tax Allocation, 5.00%, 9/1/27 | 100,000 | | 117,331 | |
| Marina Redevelopment Agency Successor Agency Tax Allocation, 5.00%, 9/1/28 | 100,000 | | 117,627 | |
| Marina Redevelopment Agency Successor Agency Tax Allocation, 5.00%, 9/1/28 | 100,000 | | 116,681 | |
| Marina Redevelopment Agency Successor Agency Tax Allocation, 5.00%, 9/1/33 | 340,000 | | 391,286 | |
| Marina Redevelopment Agency Successor Agency Tax Allocation, 5.00%, 9/1/33 | 250,000 | | 285,275 | |
| Marina Redevelopment Agency Successor Agency Tax Allocation, 5.00%, 9/1/38 | 400,000 | | 452,852 | |
| Marina Redevelopment Agency Successor Agency Tax Allocation, 5.00%, 9/1/38 | 250,000 | | 281,773 | |
| Menifee Union School District Special Tax, 5.00%, 9/1/43 | 1,000,000 | | 1,123,010 | |
| Menifee Union School District Special Tax, 5.00%, 9/1/44 | 2,245,000 | | 2,522,190 | |
| Menifee Union School District Special Tax, 5.00%, 9/1/48 | 1,500,000 | | 1,677,780 | |
| Menifee Union School District Public Financing Authority Special Tax, 5.00%, 9/1/24 | 1,200,000 | | 1,379,760 | |
| Metropolitan Water District of Southern California Rev., VRDN, 0.02%, 9/1/20 (SBBPA: PNC Bank N.A.) | 2,100,000 | | 2,100,000 | |
| Metropolitan Water District of Southern California Rev., VRDN, 0.02%, 9/1/20 (SBBPA: PNC Bank N.A.) | 2,400,000 | | 2,400,000 | |
| Middle Fork Project Finance Authority Rev., 5.00%, 4/1/32 | 2,285,000 | | 2,762,177 | |
| Middle Fork Project Finance Authority Rev., 5.00%, 4/1/34 | 2,325,000 | | 2,770,819 | |
| Middle Fork Project Finance Authority Rev., 5.00%, 4/1/35 | 2,230,000 | | 2,641,212 | |
| | | | | | | | |
| Principal Amount | Value |
| Middle Fork Project Finance Authority Rev., 5.00%, 4/1/36 | $ | 1,800,000 | | $ | 2,122,398 | |
| Moorpark Rev., (Villa del Arroyo Moorpark LLC), 6.50%, 5/15/41 | 4,000,000 | | 4,133,880 | |
| Murrieta Community Facilities District Special Tax, 5.00%, 9/1/42 | 655,000 | | 745,587 | |
| Murrieta Community Facilities District Special Tax, 5.00%, 9/1/46 | 825,000 | | 933,512 | |
| Murrieta Financing Authority Special Tax, 5.00%, 9/1/31 | 1,735,000 | | 1,855,635 | |
| Murrieta Valley Unified School District Public Financing Authority Special Tax, 5.00%, 9/1/30 | 1,735,000 | | 2,023,999 | |
| Murrieta Valley Unified School District Public Financing Authority Special Tax, 5.00%, 9/1/31 | 1,915,000 | | 2,219,964 | |
| Murrieta Valley Unified School District Public Financing Authority Special Tax, 5.00%, 9/1/32 | 1,155,000 | | 1,332,154 | |
Northern Inyo County Local Hospital District GO, 0.00%, 11/1/34(2) | 1,325,000 | | 854,824 | |
Northern Inyo County Local Hospital District GO, 0.00%, 11/1/36(2) | 2,885,000 | | 1,704,833 | |
| Northern Inyo County Local Hospital District Rev., 3.875%, 12/1/27 | 3,745,000 | | 3,833,045 | |
| Ontario Community Facilities District No. 24 Special Tax, 5.00%, 9/1/26 | 390,000 | | 470,387 | |
| Ontario Community Facilities District No. 24 Special Tax, 5.00%, 9/1/41 | 2,065,000 | | 2,329,175 | |
| Ontario Community Facilities District No. 24 Special Tax, 5.00%, 9/1/46 | 1,500,000 | | 1,680,240 | |
| Ontario Community Facilities District No. 28 Special Tax, 5.00%, 9/1/42 | 1,000,000 | | 1,107,510 | |
| Ontario Community Facilities District No. 28 Special Tax, 5.00%, 9/1/47 | 500,000 | | 552,735 | |
| Ontario Community Facilities District No. 30 Special Tax, 4.00%, 9/1/42 | 1,395,000 | | 1,493,180 | |
| Ontario Community Facilities District No. 30 Special Tax, 4.00%, 9/1/48 | 2,000,000 | | 2,132,780 | |
| Ontario Community Facilities District No. 31 Special Tax, 5.00%, 9/1/42 | 1,050,000 | | 1,199,510 | |
| Ontario Community Facilities District No. 34 Special Tax, 4.00%, 9/1/48 | 1,000,000 | | 1,067,580 | |
| Ontario Community Facilities District No. 40 Special Tax, 4.00%, 9/1/50 | 780,000 | | 865,238 | |
| Ontario Community Facilities District No. 43 Special Tax, 4.00%, 9/1/50 | 1,000,000 | | 1,096,410 | |
| Orange County Community Facilities District Special Tax, 4.00%, 8/15/40 | 1,080,000 | | 1,181,909 | |
| Orange County Community Facilities District Special Tax, 5.25%, 8/15/45 | 3,905,000 | | 4,361,963 | |
| Orange County Community Facilities District Special Tax, 5.00%, 8/15/46 | 10,000,000 | | 11,222,900 | |
| Orange County Community Facilities District Special Tax, 5.00%, 8/15/47 | 2,550,000 | | 2,945,658 | |
| Orange County Community Facilities District Special Tax, 4.00%, 8/15/50 | 1,000,000 | | 1,077,460 | |
| Oroville Rev., (Oroville Hospital), 5.25%, 4/1/39 | 2,350,000 | | 2,580,981 | |
| Oroville Rev., (Oroville Hospital), 5.25%, 4/1/49 | 7,805,000 | | 8,447,273 | |
| Oroville Rev., (Oroville Hospital), 5.25%, 4/1/54 | 3,000,000 | | 3,212,340 | |
| Palomar Health COP, (Palomar Health Obligated Group), 4.00%, 11/1/38 | 1,445,000 | | 1,490,807 | |
| Palomar Health Rev., (Palomar Health Obligated Group), 5.00%, 11/1/27 | 2,005,000 | | 2,433,970 | |
| Palomar Health Rev., (Palomar Health Obligated Group), 5.00%, 11/1/30 | 3,000,000 | | 3,554,040 | |
| Palomar Health Rev., (Palomar Health Obligated Group), 5.00%, 11/1/31 | 2,125,000 | | 2,492,774 | |
| Palomar Health Rev., (Palomar Health Obligated Group), 5.00%, 11/1/36 | 8,465,000 | | 9,686,838 | |
| | | | | | | | |
| Principal Amount | Value |
| Palomar Health Rev., (Palomar Health Obligated Group), 5.00%, 11/1/39 | $ | 8,250,000 | | $ | 9,379,177 | |
| Palomar Health Rev., (Palomar Health Obligated Group), 5.00%, 11/1/42 | 10,000,000 | | 11,353,200 | |
| Perris Joint Powers Authority Special Tax, 5.00%, 9/1/26 | 1,090,000 | | 1,316,764 | |
| Perris Joint Powers Authority Special Tax, 5.00%, 9/1/27 | 1,000,000 | | 1,230,840 | |
| Perris Joint Powers Authority Special Tax, 5.00%, 9/1/30 | 1,325,000 | | 1,583,786 | |
| Perris Joint Powers Authority Special Tax, 5.00%, 9/1/34 | 1,555,000 | | 1,815,245 | |
| Perris Union High School District Special Tax, 5.00%, 9/1/41 | 4,750,000 | | 5,225,190 | |
| Pleasant Valley School District / Ventura County GO, 5.85%, 8/1/31 (NATL) | 4,835,000 | | 6,355,414 | |
| Poway Unified School District Public Financing Authority Special Tax, 5.00%, 9/1/34 | 995,000 | | 1,121,713 | |
| Poway Unified School District Public Financing Authority Special Tax, 5.00%, 9/1/35 | 990,000 | | 1,112,176 | |
| Poway Unified School District Public Financing Authority Special Tax, 5.00%, 9/1/36 | 1,245,000 | | 1,390,740 | |
| Rancho Cordova Special Tax, 4.00%, 9/1/31 | 1,350,000 | | 1,479,074 | |
| Rancho Cordova Special Tax, 4.00%, 9/1/37 | 3,000,000 | | 3,223,560 | |
| Rancho Cordova Special Tax, 5.00%, 9/1/40 | 1,195,000 | | 1,324,861 | |
| Rancho Cordova Special Tax, 4.00%, 9/1/45 | 1,025,000 | | 1,086,613 | |
| Rancho Cordova Special Tax, 5.00%, 9/1/45 | 1,250,000 | | 1,371,913 | |
| Rancho Cordova Special Tax, (Rancho Cordova Grantline 208 Community Facilities District No. 2018-1), 5.00%, 9/1/39 | 690,000 | | 770,475 | |
| Rancho Cordova Special Tax, (Rancho Cordova Grantline 208 Community Facilities District No. 2018-1), 5.00%, 9/1/44 | 410,000 | | 455,358 | |
| Rancho Cordova Special Tax, (Rancho Cordova Grantline 208 Community Facilities District No. 2018-1), 5.00%, 9/1/49 | 530,000 | | 586,169 | |
Redwood City Redevelopment Agency Successor Agency Tax Allocation, Capital Appreciation, 0.00%, 7/15/28 (Ambac)(2) | 3,405,000 | | 3,055,306 | |
| Regents of the University of California Medical Center Pooled Rev., VRDN, 0.01%, 9/1/20 | 1,500,000 | | 1,500,000 | |
| Rio Elementary School District Community Facilities District Special Tax, 5.00%, 9/1/35 | 2,550,000 | | 2,814,894 | |
| Rio Vista Community Facilities District Special Tax, 5.00%, 9/1/38 | 1,070,000 | | 1,216,793 | |
| Rio Vista Community Facilities District Special Tax, 5.00%, 9/1/48 | 1,190,000 | | 1,336,382 | |
| River Islands Public Financing Authority Special Tax, 5.50%, 9/1/45 | 3,500,000 | | 3,737,895 | |
| River Islands Public Financing Authority Special Tax, 5.50%, 9/1/45 | 5,000,000 | | 5,347,950 | |
| Riverside County Community Facilities Districts Special Tax, 5.00%, 9/1/30 | 1,035,000 | | 1,097,473 | |
| Riverside County Community Facilities Districts Special Tax, 5.00%, 9/1/35 | 2,520,000 | | 2,649,704 | |
| Riverside County Community Facilities Districts Special Tax, 5.00%, 9/1/40 | 2,250,000 | | 2,503,417 | |
| Riverside County Community Facilities Districts Special Tax, 5.00%, 9/1/42 | 3,000,000 | | 3,136,920 | |
| Riverside County Community Facilities Districts Special Tax, 5.00%, 9/1/42 | 1,110,000 | | 1,268,808 | |
| Riverside County Community Facilities Districts Special Tax, 5.00%, 9/1/44 | 2,735,000 | | 3,025,840 | |
| Riverside County Community Facilities Districts Special Tax, 5.00%, 9/1/45 | 540,000 | | 612,819 | |
| Riverside County Community Facilities Districts Special Tax, 5.00%, 9/1/48 | 2,500,000 | | 2,807,525 | |
| Riverside County Transportation Commission Rev., 5.75%, 6/1/44 | 500,000 | | 545,610 | |
Riverside County Transportation Commission Rev., Capital Appreciation, 0.00%, 6/1/41(2) | 2,000,000 | | 1,055,180 | |
Riverside County Transportation Commission Rev., Capital Appreciation, 0.00%, 6/1/42(2) | 3,320,000 | | 1,685,697 | |
| | | | | | | | |
| Principal Amount | Value |
Riverside County Transportation Commission Rev., Capital Appreciation, 0.00%, 6/1/43(2) | $ | 5,000,000 | | $ | 2,438,100 | |
| Riverside Unified School District Special Tax, 4.00%, 9/1/40 | 350,000 | | 382,267 | |
| Riverside Unified School District Special Tax, 4.00%, 9/1/45 | 415,000 | | 448,387 | |
| Riverside Unified School District Special Tax, 4.00%, 9/1/50 | 875,000 | | 941,456 | |
| Riverside Unified School District Special Tax, (Riverside Unified School District Community Facilities District No. 32), 4.00%, 9/1/43 | 1,600,000 | | 1,720,544 | |
| Riverside Unified School District Special Tax, (Riverside Unified School District Community Facilities District No. 32), 4.00%, 9/1/48 | 1,850,000 | | 1,980,665 | |
| Romoland School District Special Tax, 5.00%, 9/1/35 | 4,685,000 | | 5,256,101 | |
| Romoland School District Special Tax, 5.00%, 9/1/38 | 2,900,000 | | 3,234,428 | |
| Romoland School District Special Tax, 5.00%, 9/1/41 | 1,250,000 | | 1,433,325 | |
| Romoland School District Special Tax, 5.00%, 9/1/43 | 2,640,000 | | 2,816,035 | |
| Romoland School District Special Tax, (Romoland School District Community Facilities District No. 2004-1 Heritage Lake), 5.00%, 9/1/43 | 3,000,000 | | 3,378,060 | |
| Romoland School District Special Tax, (Romoland School District Community Facilities District No. 2004-1 Heritage Lake), 5.00%, 9/1/48 | 3,250,000 | | 3,633,565 | |
Roseville Special Tax, 5.00%, 9/1/32(1) | 1,265,000 | | 1,473,788 | |
| Roseville Special Tax, 5.00%, 9/1/40 | 1,670,000 | | 1,903,633 | |
| Roseville Special Tax, 5.00%, 9/1/44 | 2,950,000 | | 3,326,390 | |
Roseville Special Tax, 5.00%, 9/1/47(1) | 6,500,000 | | 7,297,745 | |
| Roseville Special Tax, 5.00%, 9/1/49 | 850,000 | | 952,434 | |
Roseville Special Tax, (Roseville Creekview Community Facilities District No. 1), 5.00%, 9/1/45(5) | 1,280,000 | | 1,439,194 | |
Roseville Special Tax, (Roseville Creekview Community Facilities District No. 1), 5.00%, 9/1/50(5) | 250,000 | | 280,250 | |
| Roseville Special Tax, (Roseville Fiddyment Ranch Community Facilities District No. 5), 5.00%, 9/1/49 | 1,000,000 | | 1,109,450 | |
| Roseville Special Tax, (Roseville SVSP Westpark-Federico Community Facilities District No. 1), 5.00%, 9/1/39 | 445,000 | | 499,766 | |
| Roseville Special Tax, (Roseville SVSP Westpark-Federico Community Facilities District No. 1), 5.00%, 9/1/44 | 500,000 | | 556,185 | |
| Roseville Special Tax, (Roseville SVSP Westpark-Federico Community Facilities District No. 1), 5.00%, 9/1/49 | 700,000 | | 776,615 | |
| Roseville Special Tax, (Villages at Sierra Vista Community Facilities District No. 1), 5.00%, 9/1/36 | 685,000 | | 778,345 | |
| Roseville Special Tax, (Villages at Sierra Vista Community Facilities District No. 1), 5.00%, 9/1/39 | 1,390,000 | | 1,567,614 | |
| Roseville Special Tax, (Villages at Sierra Vista Community Facilities District No. 1), 4.00%, 9/1/45 | 495,000 | | 522,581 | |
| Roseville Special Tax, (Villages at Sierra Vista Community Facilities District No. 1), 5.00%, 9/1/49 | 3,870,000 | | 4,304,794 | |
| Roseville Special Tax, (Villages at Sierra Vista Community Facilities District No. 1), 4.00%, 9/1/50 | 650,000 | | 682,806 | |
Roseville Special Tax, (Westbrook Community Facilities District
No. 1), 5.00%, 9/1/37 | 1,250,000 | | 1,401,075 | |
Roseville Special Tax, (Westbrook Community Facilities District
No. 1), 5.00%, 9/1/43 | 2,840,000 | | 3,195,028 | |
Roseville Special Tax, (Westbrook Community Facilities District
No. 1), 5.00%, 9/1/44 | 1,650,000 | | 1,792,214 | |
Roseville Special Tax, (Westbrook Community Facilities District
No. 1), 5.00%, 9/1/48 | 2,030,000 | | 2,273,641 | |
| Roseville Natural Gas Financing Authority Rev., 5.00%, 2/15/27 (GA: Merrill Lynch & Co.) | 5,000,000 | | 6,143,500 | |
Sacramento Special Tax, 5.00%, 9/1/32(1) | 300,000 | | 338,712 | |
| Sacramento Special Tax, 5.00%, 9/1/41 | 1,900,000 | | 2,141,946 | |
| Sacramento Special Tax, 5.00%, 9/1/44 | 500,000 | | 563,005 | |
| | | | | | | | |
| Principal Amount | Value |
| Sacramento Special Tax, 5.00%, 9/1/46 | $ | 2,250,000 | | $ | 2,520,360 | |
Sacramento Special Tax, 5.00%, 9/1/47(1) | 1,900,000 | | 2,098,873 | |
| Sacramento Special Tax, 5.00%, 9/1/49 | 1,000,000 | | 1,119,480 | |
| Sacramento Special Tax, (Sacramento Curtis Park Village Community Facilities Dist No. 2014-02), 5.00%, 9/1/39 | 1,120,000 | | 1,286,488 | |
| Sacramento County Special Tax, 5.00%, 9/1/29 | 1,000,000 | | 1,196,620 | |
| Sacramento County Special Tax, 5.00%, 9/1/30 | 1,170,000 | | 1,390,943 | |
| Sacramento County Special Tax, 5.00%, 9/1/31 | 1,355,000 | | 1,603,182 | |
| Sacramento County Special Tax, 5.00%, 9/1/32 | 665,000 | | 782,246 | |
| Sacramento County Special Tax, 5.00%, 9/1/35 | 2,335,000 | | 2,711,355 | |
| Sacramento County Special Tax, 5.00%, 9/1/40 | 2,325,000 | | 2,631,226 | |
| Sacramento County Special Tax, 5.00%, 9/1/40 | 3,000,000 | | 3,436,650 | |
| Sacramento County Special Tax, 5.00%, 9/1/45 | 4,645,000 | | 5,211,040 | |
| Sacramento County Special Tax, 5.00%, 9/1/46 | 3,385,000 | | 3,793,705 | |
| San Bernardino County Special Tax, (County of San Bernardino CA Community Facilities District No. 2002-1), 5.00%, 9/1/33 | 3,000,000 | | 3,306,180 | |
| San Bernardino County Special Tax, (County of San Bernardino CA Community Facilities District No. 2002-1), 4.00%, 9/1/42 | 700,000 | | 743,470 | |
| San Bernardino County Special Tax, (County of San Bernardino CA Community Facilities District No. 2002-1), 4.00%, 9/1/48 | 1,000,000 | | 1,051,720 | |
| San Bernardino County Special Tax, (County of San Bernardino CA Community Facilities District No. 2006-1), 5.00%, 9/1/43 | 1,300,000 | | 1,468,402 | |
| San Bernardino County Special Tax, (County of San Bernardino CA Community Facilities District No. 2006-1), 5.00%, 9/1/48 | 1,200,000 | | 1,346,412 | |
| San Buenaventura Rev., (Community Memorial Health System), 7.50%, 12/1/41 | 11,100,000 | | 11,685,969 | |
| San Clemente Special Tax, 5.00%, 9/1/46 | 7,560,000 | | 8,330,969 | |
| San Diego Special Tax, 5.00%, 9/1/37 | 970,000 | | 1,104,976 | |
| San Diego County Rev., (Sanford Burnham Prebys Medical Discovery Institute), 5.00%, 11/1/25 | 835,000 | | 1,027,033 | |
| San Diego County Rev., (Sanford Burnham Prebys Medical Discovery Institute), 5.00%, 11/1/26 | 525,000 | | 643,934 | |
| San Diego County Rev., (Sanford Burnham Prebys Medical Discovery Institute), 5.00%, 11/1/30 | 725,000 | | 884,275 | |
| San Diego County Special Tax, (San County Diego Community Facilities District No. 2008-01), 4.00%, 9/1/43 | 1,255,000 | | 1,336,926 | |
| San Diego County Special Tax, (San County Diego Community Facilities District No. 2008-01), 4.00%, 9/1/48 | 1,250,000 | | 1,324,313 | |
| San Diego County Regional Airport Authority Rev., 5.00%, 7/1/26 | 500,000 | | 558,075 | |
| San Diego County Regional Airport Authority Rev., 5.00%, 7/1/35 | 3,750,000 | | 4,761,600 | |
| San Diego County Regional Airport Authority Rev., 5.00%, 7/1/44 | 2,000,000 | | 2,467,860 | |
| San Diego County Regional Airport Authority Rev., 5.00%, 7/1/44 | 3,425,000 | | 3,811,443 | |
| San Diego County Regional Airport Authority Rev., 5.00%, 7/1/47 | 7,625,000 | | 9,031,507 | |
San Diego County Water Authority Rev., 5.00%, 5/1/29(5) | 1,225,000 | | 1,628,956 | |
San Diego County Water Authority Rev., 5.00%, 5/1/30(5) | 930,000 | | 1,260,020 | |
San Diego County Water Authority Rev., 5.00%, 5/1/31(5) | 1,050,000 | | 1,450,785 | |
| San Diego Unified Port District Rev., 5.00%, 9/1/26 | 750,000 | | 843,480 | |
San Francisco City & County Redevelopment Agency Successor Agency Special Tax, Capital Appreciation, 0.00%, 8/1/43(2) | 5,500,000 | | 1,537,030 | |
| San Francisco City & County Redevelopment Agency Successor Agency Tax Allocation, 5.00%, 8/1/33 | 780,000 | | 888,287 | |
| San Gorgonio Memorial Health Care District GO, 5.00%, 8/1/21 | 275,000 | | 285,186 | |
| San Jacinto Community Facilities District Special Tax, 5.00%, 9/1/28 | 1,080,000 | | 1,284,098 | |
| San Jacinto Community Facilities District Special Tax, 5.00%, 9/1/29 | 1,165,000 | | 1,377,682 | |
| San Jacinto Community Facilities District Special Tax, 5.00%, 9/1/32 | 450,000 | | 520,115 | |
| San Jacinto Community Facilities District Special Tax, 5.00%, 9/1/33 | 1,280,000 | | 1,473,178 | |
| | | | | | | | |
| Principal Amount | Value |
| San Jacinto Community Facilities District Special Tax, 5.00%, 9/1/34 | $ | 335,000 | | $ | 384,620 | |
| San Joaquin Hills Transportation Corridor Agency Rev., 5.25%, 1/15/44 | 6,000,000 | | 6,646,920 | |
San Joaquin Hills Transportation Corridor Agency Rev., Capital Appreciation, 0.00%, 1/15/25 (NATL)(2) | 3,090,000 | | 2,842,027 | |
San Joaquin Hills Transportation Corridor Agency Rev., Capital Appreciation, 0.00%, 1/15/29 (NATL)(2) | 165,000 | | 135,970 | |
San Joaquin Hills Transportation Corridor Agency Rev., Capital Appreciation, 0.00%, 1/15/31 (NATL)(2) | 16,000,000 | | 12,372,160 | |
San Joaquin Hills Transportation Corridor Agency Rev., Capital Appreciation, 0.00%, 1/15/32 (NATL)(2) | 290,000 | | 216,656 | |
San Joaquin Hills Transportation Corridor Agency Rev., Capital Appreciation, 0.00%, 1/15/36 (NATL)(2) | 1,335,000 | | 867,002 | |
| San Mateo Special Tax, 6.00%, 9/1/42 | 500,000 | | 531,980 | |
| San Mateo Special Tax, 5.50%, 9/1/44 | 2,250,000 | | 2,372,130 | |
| Santa Margarita Water District Special Tax, 5.625%, 9/1/43 | 1,200,000 | | 1,301,484 | |
| Santa Paula Special Tax, (Santa Paula Harvest Community Facilities District No. 1), 4.00%, 9/1/45 | 1,100,000 | | 1,134,815 | |
| Santa Paula Special Tax, (Santa Paula Harvest Community Facilities District No. 1), 4.00%, 9/1/50 | 1,500,000 | | 1,541,070 | |
| Saugus-Castaic School Facilities Financing Authority Special Tax, 6.00%, 9/1/43 | 1,450,000 | | 1,585,126 | |
| Saugus/Hart School Facilities Financing Authority Special Tax, 5.00%, 9/1/41 | 1,235,000 | | 1,382,768 | |
| Saugus/Hart School Facilities Financing Authority Special Tax, 5.00%, 9/1/46 | 1,245,000 | | 1,384,403 | |
Silicon Valley Tobacco Securitization Authority Rev., Capital Appreciation, 0.00%, 6/1/36(2) | 32,000,000 | | 13,363,200 | |
Silicon Valley Tobacco Securitization Authority Rev., Capital Appreciation, 0.00%, 6/1/41(2) | 11,465,000 | | 3,587,742 | |
| Southern California Public Power Authority Rev., 5.00%, 11/1/29 (GA: Goldman Sachs Group, Inc.) | 2,000,000 | | 2,569,180 | |
| Southern California Public Power Authority Rev., 5.00%, 11/1/33 (GA: Goldman Sachs Group, Inc.) | 3,755,000 | | 5,007,593 | |
Southern Mono Health Care District GO, Capital Appreciation, 0.00%, 8/1/26 (NATL)(2) | 1,800,000 | | 1,683,630 | |
| State of California GO, 5.00%, 11/1/47 | 8,375,000 | | 10,338,686 | |
| State of California GO, (Kindergarten), VRDN, 0.01%, 9/1/20 (LOC: State Street Bank & Trust Co.) | 375,000 | | 375,000 | |
Stockton Community Facilities District Special Tax, (Stockton Community Facilities District No. 2018-2), 4.00%, 9/1/45(5) | 1,115,000 | | 1,166,323 | |
Stockton Community Facilities District Special Tax, (Stockton Community Facilities District No. 2018-2), 4.00%, 9/1/50(5) | 1,500,000 | | 1,562,565 | |
| Stockton Public Financing Authority Rev., (Stockton Parking Authority), 4.00%, 3/1/40 | 1,500,000 | | 1,599,495 | |
| Stockton Public Financing Authority Rev., (Stockton Parking Authority), 5.00%, 3/1/47 | 1,625,000 | | 1,863,745 | |
| Stockton Public Financing Authority Rev., (Stockton Water Rev.), 5.00%, 10/1/33 (BAM) | 1,000,000 | | 1,255,430 | |
| Stockton Public Financing Authority Rev., (Stockton Water Rev.), 5.00%, 10/1/34 (BAM) | 3,250,000 | | 4,061,102 | |
| Stockton Public Financing Authority Rev., (Stockton Water Rev.), 5.00%, 10/1/35 (BAM) | 1,975,000 | | 2,458,065 | |
| Stockton Public Financing Authority Rev., (Stockton), 5.00%, 9/1/37 | 2,500,000 | | 2,789,100 | |
| Stockton Public Financing Authority Rev., (Stockton), 5.00%, 9/1/43 | 3,000,000 | | 3,311,040 | |
| Sulphur Springs Union School District Special Tax, (Sulphur Springs School District Community Facilities District No. 2006-1), 5.00%, 9/1/43 | 1,410,000 | | 1,564,381 | |
| Sulphur Springs Union School District Special Tax, (Sulphur Springs School District Community Facilities District No. 2006-1), 5.00%, 9/1/47 | 1,820,000 | | 2,011,227 | |
| | | | | | | | |
| Principal Amount | Value |
| Sunnyvale Special Tax, 7.75%, 8/1/32 | $ | 6,500,000 | | $ | 6,523,530 | |
| Tejon Ranch Public Facilities Finance Authority Special Tax, 5.00%, 9/1/45 | 6,000,000 | | 6,556,020 | |
| Temecula Valley Unified School District Community Facilities District Special Tax, (Temecula Valley Unified School District Community Facilities District No. 2014-1), 5.00%, 9/1/43 | 1,000,000 | | 1,123,510 | |
| Temescal Valley Water District Special Tax, (Temescal Valley Water District Community Facilities District No. 4 Terramor), 5.00%, 9/1/43 | 4,730,000 | | 5,311,837 | |
| Temescal Valley Water District Special Tax, (Temescal Valley Water District Community Facilities District No. 4 Terramor), 5.00%, 9/1/48 | 6,040,000 | | 6,752,841 | |
| Tobacco Securitization Authority of Northern California Rev., (Sacramento County Tobacco Securitization Corp.), 5.50%, 6/1/45 | 2,000,000 | | 2,011,680 | |
Tobacco Securitization Authority of Northern California Rev., (Sacramento County Tobacco Securitization Corp.), Capital Appreciation, 0.00%, 6/1/45(2) | 20,000,000 | | 3,769,800 | |
Tobacco Securitization Authority of Northern California Rev., (Sacramento County Tobacco Securitization Corp.), Capital Appreciation, 0.00%, 6/1/45(2) | 25,000,000 | | 5,929,500 | |
| Tobacco Securitization Authority of Southern California Rev., (San Diego County Tobacco Asset Securitization Corp.), 5.00%, 6/1/48 | 12,000,000 | | 14,169,360 | |
Tobacco Securitization Authority of Southern California Rev., (San Diego County Tobacco Asset Securitization Corp.), Capital Appreciation, 0.00%, 6/1/46(2) | 25,000,000 | | 4,147,500 | |
| Tracy Community Facilities District Special Tax, (Tracy Community Facilities District No. 2016-01), 5.00%, 9/1/34 | 1,570,000 | | 1,766,391 | |
| Tracy Community Facilities District Special Tax, (Tracy Community Facilities District No. 2016-01), 5.00%, 9/1/39 | 2,280,000 | | 2,530,207 | |
| Tracy Community Facilities District Special Tax, (Tracy Community Facilities District No. 2016-01), 5.00%, 9/1/43 | 2,500,000 | | 2,766,575 | |
| Tracy Community Facilities District Special Tax, (Tracy Community Facilities District No. 2016-01), 5.00%, 9/1/48 | 2,750,000 | | 3,031,105 | |
| Tracy Community Facilities District Special Tax, (Tracy Community Facilities District No. 2016-01), 5.00%, 9/1/49 | 3,555,000 | | 3,897,453 | |
| Tracy Community Facilities District Special Tax, (Tracy Community Facilities District No. 2016-02 ECFD), 5.00%, 9/1/49 | 1,750,000 | | 1,987,755 | |
| Transbay Joint Powers Authority Tax Allocation, (Transbay Joint Powers Authority Transbay Redevelopment Project Tax Increment Re), 5.00%, 10/1/45 | 2,000,000 | | 2,488,860 | |
| Transbay Joint Powers Authority Tax Allocation, (Transbay Joint Powers Authority Transbay Redevelopment Project Tax Increment Re), 5.00%, 10/1/49 | 2,200,000 | | 2,724,832 | |
| Tulare Local Health Care District GO, 4.00%, 8/1/39 (BAM) | 2,000,000 | | 2,322,160 | |
| Tustin Community Facilities District Special Tax, 5.00%, 9/1/37 | 3,330,000 | | 3,724,139 | |
| Tustin Community Facilities District Special Tax, 5.00%, 9/1/40 | 1,100,000 | | 1,224,443 | |
| Tustin Community Facilities District Special Tax, 5.00%, 9/1/45 | 2,200,000 | | 2,431,836 | |
| University of California Rev., 5.00%, 5/15/33 | 1,250,000 | | 1,698,613 | |
| University of California Rev., 5.00%, 5/15/34 | 6,000,000 | | 8,103,240 | |
| University of California Rev., VRDN, 0.01%, 9/1/20 | 2,000,000 | | 2,000,000 | |
| University of California Rev., VRDN, 0.01%, 9/1/20 | 900,000 | | 900,000 | |
| Upland COP, (San Antonio Regional Hospital Obligated Group), 4.00%, 1/1/42 | 3,000,000 | | 3,092,670 | |
| Upland COP, (San Antonio Regional Hospital Obligated Group), 5.00%, 1/1/47 | 2,500,000 | | 2,767,325 | |
| Val Verde Unified School District Special Tax, 5.00%, 9/1/37 | 1,750,000 | | 1,935,955 | |
| Washington Township Health Care District Rev., 5.00%, 7/1/24 | 500,000 | | 575,800 | |
| Washington Township Health Care District Rev., 5.00%, 7/1/25 | 500,000 | | 590,715 | |
| Washington Township Health Care District Rev., 5.00%, 7/1/26 | 400,000 | | 470,044 | |
| Washington Township Health Care District Rev., 5.00%, 7/1/26 | 550,000 | | 665,539 | |
| Washington Township Health Care District Rev., 3.25%, 7/1/27 | 1,000,000 | | 1,081,410 | |
| | | | | | | | |
| Principal Amount | Value |
| Washington Township Health Care District Rev., 5.00%, 7/1/27 | $ | 600,000 | | $ | 743,466 | |
| Washington Township Health Care District Rev., 3.50%, 7/1/28 | 750,000 | | 816,068 | |
| Washington Township Health Care District Rev., 5.00%, 7/1/28 | 1,300,000 | | 1,630,850 | |
| Washington Township Health Care District Rev., 3.75%, 7/1/29 | 1,000,000 | | 1,095,470 | |
| Washington Township Health Care District Rev., 5.00%, 7/1/29 | 1,400,000 | | 1,787,394 | |
| Western Placer Unified School District Special Tax, 2.00%, 6/1/25 | 800,000 | | 825,736 | |
| Western Placer Unified School District Special Tax, 2.00%, 6/1/25 | 3,900,000 | | 4,008,264 | |
| Whittier Rev., (Presbyterian Intercommunity Hospital Obligated Group), 5.00%, 6/1/44 | 3,500,000 | | 3,886,155 | |
| William S Hart Union High School District Special Tax, 5.00%, 9/1/42 | 1,350,000 | | 1,507,464 | |
| William S Hart Union High School District Special Tax, 5.00%, 9/1/47 | 2,350,000 | | 2,600,839 | |
| Woodland Special Tax, 4.00%, 9/1/41 | 2,725,000 | | 2,884,767 | |
| Woodland Special Tax, 4.00%, 9/1/45 | 2,735,000 | | 2,867,265 | |
| | 1,452,164,267 | |
| Guam — 1.1% | | |
| Guam Government Power Authority Rev., 5.00%, 10/1/34 | 850,000 | | 895,042 | |
| Guam Government Power Authority Rev., 5.00%, 10/1/36 | 1,940,000 | | 2,254,610 | |
| Guam Government Power Authority Rev., 5.00%, 10/1/37 | 1,575,000 | | 1,825,567 | |
| Guam Government Waterworks Authority Rev., 5.00%, 7/1/40 | 3,115,000 | | 3,616,577 | |
| Guam Government Waterworks Authority Rev., 5.00%, 1/1/46 | 3,000,000 | | 3,392,940 | |
| Guam Government Waterworks Authority Rev., 5.00%, 1/1/50 | 1,750,000 | | 2,130,205 | |
| Port Authority of Guam Government Rev., 5.00%, 7/1/48 | 1,500,000 | | 1,715,985 | |
| | 15,830,926 | |
TOTAL INVESTMENT SECURITIES — 100.4%
(Cost $1,393,877,653) | | 1,467,995,193 | |
| OTHER ASSETS AND LIABILITIES — (0.4)% | | (6,282,354) | |
| TOTAL NET ASSETS — 100.0% | | $ | 1,461,712,839 | |
| | | | | | | | |
| NOTES TO SCHEDULE OF INVESTMENTS | | |
| AGM | - | Assured Guaranty Municipal Corporation |
| BAM | - | Build America Mutual Assurance Company |
| BAM-TCRS | - | Build America Mutual Assurance Company - Transferrable Custodial Receipts |
| COP | - | Certificates of Participation |
| GA | - | Guaranty Agreement |
| GO | - | General Obligation |
| LOC | - | Letter of Credit |
| NATL | - | National Public Finance Guarantee Corporation |
| SBBPA | - | Standby Bond Purchase Agreement |
| VRDN | - | Variable Rate Demand Note. The instrument may be payable upon demand and adjusts periodically based upon the terms set forth in the security's offering documents. The rate shown is effective at the period end and the reference rate and spread, if any, is indicated. The date of the demand feature is disclosed. |
| VRN | - | Variable Rate Note. The rate adjusts periodically based upon the terms set forth in the security’s offering documents. The rate shown is effective at the period end and the reference rate and spread, if any, is indicated. The security's effective maturity date may be shorter than the final maturity date shown. |
(1)Security was purchased pursuant to Rule 144A under the Securities Act of 1933 and may be sold in transactions exempt from registration, normally to qualified institutional investors. The aggregate value of these securities at the period end was $236,990,298, which represented 16.2% of total net assets.
(2)Security is a zero-coupon bond. Zero-coupon securities are issued at a substantial discount from their value at maturity.
(3)Security is in default.
(4)Non-income producing.
(5)When-issued security. The issue price and yield are fixed on the date of the commitment, but payment and delivery are scheduled for a future date.
(6)Escrowed to maturity in U.S. government securities or state and local government securities.
See Notes to Financial Statements.
| | |
| Statement of Assets and Liabilities |
| | | | | |
| AUGUST 31, 2020 | |
| Assets | |
| Investment securities, at value (cost of $1,393,877,653) | $ | 1,467,995,193 | |
| Cash | 52,095 | |
| Receivable for investments sold | 3,908,450 | |
| Receivable for capital shares sold | 604,725 | |
| Interest receivable | 20,005,580 | |
| 1,492,566,043 | |
| |
| Liabilities | |
| Payable for investments purchased | 21,758,534 | |
| Payable for capital shares redeemed | 8,133,369 | |
| Accrued management fees | 524,253 | |
| Distribution and service fees payable | 33,223 | |
| Dividends payable | 403,825 | |
| 30,853,204 | |
| |
| Net Assets | $ | 1,461,712,839 | |
| |
| Net Assets Consist of: | |
| Capital paid in | $ | 1,398,625,029 | |
| Distributable earnings | 63,087,810 | |
| $ | 1,461,712,839 | |
| | | | | | | | | | | |
| | Net Assets | Shares Outstanding | Net Asset Value Per Share |
| Investor Class | $860,867,047 | 79,257,149 | $10.86 |
| I Class | $518,249,860 | 47,732,665 | $10.86 |
| Y Class | $56,417 | 5,196 | $10.86 |
| A Class | $58,148,116 | 5,353,438 | $10.86* |
| C Class | $24,391,399 | 2,245,404 | $10.86 |
*Maximum offering price $11.37 (net asset value divided by 0.955).
See Notes to Financial Statements.
| | | | | |
| YEAR ENDED AUGUST 31, 2020 | |
| Investment Income (Loss) | |
| Income: | |
| Interest | $ | 54,580,069 | |
| |
| Expenses: | |
| Management fees | 6,425,118 | |
| Distribution and service fees: | |
| A Class | 165,638 | |
| C Class | 258,462 | |
| Trustees' fees and expenses | 114,851 | |
| Other expenses | 7,988 | |
| 6,972,057 | |
| |
| Net investment income (loss) | 47,608,012 | |
| |
| Realized and Unrealized Gain (Loss) | |
| Net realized gain (loss) on investment transactions | (8,133,701) | |
| Change in net unrealized appreciation (depreciation) on investments | (37,861,597) | |
| |
| Net realized and unrealized gain (loss) | (45,995,298) | |
| |
| Net Increase (Decrease) in Net Assets Resulting from Operations | $ | 1,612,714 | |
See Notes to Financial Statements.
| | |
| Statement of Changes in Net Assets |
| | | | | | | | |
| YEARS ENDED AUGUST 31, 2020 AND AUGUST 31, 2019 | | |
| Increase (Decrease) in Net Assets | August 31, 2020 | August 31, 2019 |
| Operations | | |
| Net investment income (loss) | $ | 47,608,012 | | $ | 43,480,393 | |
| Net realized gain (loss) | (8,133,701) | | (2,792,603) | |
| Change in net unrealized appreciation (depreciation) | (37,861,597) | | 74,949,181 | |
| Net increase (decrease) in net assets resulting from operations | 1,612,714 | | 115,636,971 | |
| | |
| Distributions to Shareholders | | |
| From earnings: | | |
| Investor Class | (29,049,363) | | (30,134,597) | |
| I Class | (15,832,125) | | (10,895,838) | |
| Y Class | (1,734) | | (251) | |
| A Class | (1,907,678) | | (1,884,721) | |
| C Class | (552,282) | | (563,118) | |
| Decrease in net assets from distributions | (47,343,182) | | (43,478,525) | |
| | |
| Capital Share Transactions | | |
| Net increase (decrease) in net assets from capital share transactions (Note 5) | 28,062,935 | | 187,856,506 | |
| | |
| Net increase (decrease) in net assets | (17,667,533) | | 260,014,952 | |
| | |
| Net Assets | | |
| Beginning of period | 1,479,380,372 | | 1,219,365,420 | |
| End of period | $ | 1,461,712,839 | | $ | 1,479,380,372 | |
See Notes to Financial Statements.
| | |
| Notes to Financial Statements |
AUGUST 31, 2020
1. Organization
American Century California Tax-Free and Municipal Funds (the trust) is registered under the Investment Company Act of 1940, as amended (the 1940 Act), as an open-end management investment company and is organized as a Massachusetts business trust. California High-Yield Municipal Fund (the fund) is one fund in a series issued by the trust. The fund’s investment objective is to seek high current income that is exempt from federal and California income taxes.
The fund offers the Investor Class, I Class, Y Class, A Class and C Class. The A Class may incur an initial sales charge. The A Class and C Class may be subject to a contingent deferred sales charge.
2. Significant Accounting Policies
The following is a summary of significant accounting policies consistently followed by the fund in preparation of its financial statements. The fund is an investment company and follows accounting and reporting guidance in accordance with accounting principles generally accepted in the United States of America. This may require management to make certain estimates and assumptions at the date of the financial statements. Actual results could differ from these estimates. Management evaluated the impact of events or transactions occurring through the date the financial statements were issued that would merit recognition or disclosure.
Investment Valuations — The fund determines the fair value of its investments and computes its net asset value per share at the close of regular trading (usually 4 p.m. Eastern time) on the New York Stock Exchange (NYSE) on each day the NYSE is open. The Board of Trustees has adopted valuation policies and procedures to guide the investment advisor in the fund’s investment valuation process and to provide methodologies for the oversight of the fund’s pricing function.
Fixed income securities are valued at the evaluated mean as provided by independent pricing services or at the mean of the most recent bid and asked prices as provided by investment dealers. Municipal securities are valued using market models that consider trade data, quotations from dealers and active market makers, relevant yield curve and spread data, creditworthiness, trade data or market information on comparable securities, and other relevant security specific information.
If the fund determines that the market price for an investment is not readily available or the valuation methods mentioned above do not reflect an investment’s fair value, such investment is valued as determined in good faith by the Board of Trustees or its delegate, in accordance with policies and procedures adopted by the Board of Trustees. In its determination of fair value, the fund may review several factors including, but not limited to, market information regarding the specific investment or comparable investments and correlation with other investment types, futures indices or general market indicators. Circumstances that may cause the fund to use these procedures to value an investment include, but are not limited to: an investment has been declared in default or is distressed; trading in a security has been suspended during the trading day or a security is not actively trading on its principal exchange; prices received from a regular pricing source are deemed unreliable; or there is a foreign market holiday and no trading occurred.
The fund monitors for significant events occurring after the close of an investment’s primary exchange but before the fund’s net asset value per share is determined. Significant events may include, but are not limited to: corporate announcements and transactions; governmental action and political unrest that could impact a specific investment or an investment sector; or armed conflicts, natural disasters and similar events that could affect investments in a specific country or region.
Security Transactions — Security transactions are accounted for as of the trade date. Net realized gains and losses are determined on the identified cost basis, which is also used for federal income tax purposes.
Investment Income — Interest income is recorded on the accrual basis and includes paydown gain (loss) and accretion of discounts and amortization of premiums.
Segregated Assets — In accordance with the 1940 Act, the fund segregates assets on its books and records to cover certain types of investment securities and other financial instruments. American Century Investment Management, Inc. (ACIM) (the investment advisor) monitors, on a daily basis, the securities segregated to ensure the fund designates a sufficient amount of liquid assets, marked-to-market daily. The fund may also receive assets or be required to pledge assets at the custodian bank or with a broker for collateral requirements.
Income Tax Status — It is the fund’s policy to distribute substantially all net investment income and net realized gains to shareholders and to otherwise qualify as a regulated investment company under provisions of the Internal Revenue Code. Accordingly, no provision has been made for income taxes. The fund files U.S. federal, state, local and non-U.S. tax returns as applicable. The fund's tax returns are subject to examination by the relevant taxing authority until expiration of the applicable statute of limitations, which is generally three years from the date of filing but can be longer in certain jurisdictions. At this time, management believes there are no uncertain tax positions which, based on their technical merit, would not be sustained upon examination and for which it is reasonably possible that the total amounts of unrecognized tax benefits will significantly change in the next twelve months.
Multiple Class — All shares of the fund represent an equal pro rata interest in the net assets of the class to which such shares belong, and have identical voting, dividend, liquidation and other rights and the same terms and conditions, except for class specific expenses and exclusive rights to vote on matters affecting only individual classes. Income, non-class specific expenses, and realized and unrealized capital gains and losses of the fund are allocated to each class of shares based on their relative net assets.
Distributions to Shareholders — Distributions from net investment income, if any, are declared daily and paid monthly. Distributions from net realized gains, if any, are generally declared and paid annually.
Indemnifications — Under the trust’s organizational documents, its officers and trustees are indemnified against certain liabilities arising out of the performance of their duties to the fund. In addition, in the normal course of business, the fund enters into contracts that provide general indemnifications. The maximum exposure under these arrangements is unknown as this would involve future claims that may be made against a fund. The risk of material loss from such claims is considered by management to be remote.
3. Fees and Transactions with Related Parties
Certain officers and trustees of the trust are also officers and/or directors of American Century Companies, Inc. (ACC). The trust's investment advisor, ACIM, the trust's distributor, American Century Investment Services, Inc. (ACIS), and the trust's transfer agent, American Century Services, LLC, are wholly owned, directly or indirectly, by ACC.
Management Fees — The trust has entered into a management agreement with ACIM, under which ACIM provides the fund with investment advisory and management services in exchange for a single, unified management fee (the fee) per class. The agreement provides that ACIM will pay all expenses of managing and operating the fund, except brokerage expenses, taxes, interest, fees and expenses of the independent trustees (including legal counsel fees), extraordinary expenses, and expenses incurred in connection with the provision of shareholder services and distribution services under a plan adopted pursuant to Rule 12b-1 under the 1940 Act. The fee is computed and accrued daily based on each class's daily net assets and paid monthly in arrears. The difference in the fee among the classes is a result of their separate arrangements for non-Rule 12b-1 shareholder services. It is not the result of any difference in advisory or custodial fees or other expenses related to the management of the fund’s assets, which do not vary by class. The fee consists of (1) an Investment Category Fee based on the daily net assets of the fund and certain other accounts managed by the investment advisor that are in the same broad investment category as the fund and (2) a Complex Fee based on the assets of all the funds in the American Century Investments family of funds.
The Investment Category Fee range, the Complex Fee range and the effective annual management fee for each class for the period ended August 31, 2020 are as follows:
| | | | | | | | | | | |
| Investment Category Fee Range | Complex Fee Range | Effective Annual Management Fee |
| Investor Class | 0.1925% to
0.3100% | 0.2500% to 0.3100% | 0.49% |
| I Class | | 0.0500% to 0.1100% | 0.29% |
| Y Class | | 0.0200% to 0.0800% | 0.26% |
| A Class | | 0.2500% to 0.3100% | 0.49% |
| C Class | | 0.2500% to 0.3100% | 0.49% |
Distribution and Service Fees — The Board of Trustees has adopted a separate Master Distribution and Individual Shareholder Services Plan for each of the A Class and C Class (collectively the plans), pursuant to Rule 12b-1 of the 1940 Act. The plans provide that the A Class will pay ACIS an annual distribution and service fee of 0.25%. The plans provide that the C Class will pay ACIS an annual distribution and service fee of 1.00%, of which 0.25% is paid for individual shareholder services and 0.75% is paid for distribution services. The fees are computed and accrued daily based on each class’s daily net assets and paid monthly in arrears. The fees are used to pay financial intermediaries for distribution and individual shareholder services. Fees incurred under the plans during the period ended August 31, 2020 are detailed in the Statement of Operations.
Trustees’ Fees and Expenses — The Board of Trustees is responsible for overseeing the investment advisor’s management and operations of the fund. The trustees receive detailed information about the fund and its investment advisor regularly throughout the year, and meet at least quarterly with management of the investment advisor to review reports about fund operations. The fund’s officers do not receive compensation from the fund.
Interfund Transactions — The fund may enter into security transactions with other American Century Investments funds and other client accounts of the investment advisor, in accordance with the 1940 Act rules and procedures adopted by the Board of Trustees. The rules and procedures require, among other things, that these transactions be effected at the independent current market price of the security. During the period, the interfund purchases and sales were $51,193,000 and $39,871,000, respectively. The interfund transactions had no effect on the Statement of Operations in net realized gain (loss) on investment transactions.
4. Investment Transactions
Purchases and sales of investment securities, excluding short-term investments, for the period ended August 31, 2020 were $910,680,143 and $854,914,005, respectively.
5. Capital Share Transactions
Transactions in shares of the fund were as follows (unlimited number of shares authorized):
| | | | | | | | | | | | | | |
| Year ended
August 31, 2020 | | Year ended
August 31, 2019 | |
| Shares | Amount | Shares | Amount |
| Investor Class | | | | |
| Sold | 25,603,476 | | $ | 278,828,888 | | 23,940,254 | | $ | 253,460,969 | |
| Issued in reinvestment of distributions | 2,389,037 | | 25,920,745 | | 2,536,222 | | 26,869,020 | |
| Redeemed | (33,245,361) | | (352,178,767) | | (27,115,606) | | (285,562,928) | |
| (5,252,848) | | (47,429,134) | | (639,130) | | (5,232,939) | |
| I Class | | | | |
| Sold | 22,835,193 | | 247,834,215 | | 23,126,180 | | 245,972,453 | |
| Issued in reinvestment of distributions | 1,320,200 | | 14,313,214 | | 913,215 | | 9,725,591 | |
| Redeemed | (16,574,719) | | (176,358,923) | | (6,986,568) | | (73,344,053) | |
| 7,580,674 | | 85,788,506 | | 17,052,827 | | 182,353,991 | |
| Y Class | | | | |
| Sold | 3,636 | | 40,276 | | 906 | | 9,841 | |
| Issued in reinvestment of distributions | 160 | | 1,734 | | 23 | | 251 | |
| Redeemed | (31) | | (331) | | (5) | | (53) | |
| 3,765 | | 41,679 | | 924 | | 10,039 | |
| A Class | | | | |
| Sold | 1,114,369 | | 12,121,880 | | 1,566,444 | | 16,703,741 | |
| Issued in reinvestment of distributions | 117,445 | | 1,273,126 | | 115,047 | | 1,220,657 | |
| Redeemed | (2,184,527) | | (23,002,962) | | (761,701) | | (8,078,615) | |
| (952,713) | | (9,607,956) | | 919,790 | | 9,845,783 | |
| C Class | | | | |
| Sold | 434,316 | | 4,725,847 | | 595,323 | | 6,311,496 | |
| Issued in reinvestment of distributions | 45,528 | | 493,246 | | 46,191 | | 489,797 | |
| Redeemed | (553,602) | | (5,949,253) | | (561,765) | | (5,921,661) | |
| (73,758) | | (730,160) | | 79,749 | | 879,632 | |
| Net increase (decrease) | 1,305,120 | | $ | 28,062,935 | | 17,414,160 | | $ | 187,856,506 | |
6. Fair Value Measurements
The fund’s investments valuation process is based on several considerations and may use multiple inputs to determine the fair value of the investments held by the fund. In conformity with accounting principles generally accepted in the United States of America, the inputs used to determine a valuation are classified into three broad levels.
•Level 1 valuation inputs consist of unadjusted quoted prices in an active market for identical investments.
•Level 2 valuation inputs consist of direct or indirect observable market data (including quoted prices for comparable investments, evaluations of subsequent market events, interest rates, prepayment speeds, credit risk, etc.). These inputs also consist of quoted prices for identical investments initially expressed in local currencies that are adjusted through translation into U.S. dollars.
•Level 3 valuation inputs consist of unobservable data (including a fund’s own assumptions).
The level classification is based on the lowest level input that is significant to the fair valuation measurement. The valuation inputs are not necessarily an indication of the risks associated with investing in these securities or other financial instruments.
As of period end, the fund’s investment securities were classified as Level 2. The Schedule of Investments provides additional information on the fund’s portfolio holdings.
7. Risk Factors
The novel coronavirus (COVID-19) pandemic has significantly stressed the financial resources of many municipal issuers, which may impair a municipal issuer’s ability to meet its financial obligations when due and could adversely impact the value of its bonds, which could negatively impact the performance of the fund.
The fund focuses its investments in a single state and therefore may have more exposure to credit risk related to the state of California than a fund with a broader geographical diversification. The fund invests in lower-rated debt securities, which are subject to substantial risks including liquidity risk and credit risk.
8. Federal Tax Information
The tax character of distributions paid during the years ended August 31, 2020 and August 31, 2019 were as follows:
| | | | | | | | |
| 2020 | 2019 |
| Distributions Paid From | | |
| Exempt income | $ | 47,343,182 | $ | 43,478,525 |
| Long-term capital gains | — | — |
The book-basis character of distributions made during the year from net investment income or net realized gains may differ from their ultimate characterization for federal income tax purposes. These differences reflect the differing character of certain income items and net realized gains and losses for financial statement and tax purposes, and may result in reclassification among certain capital accounts on the financial statements.
As of period end, the federal tax cost of investments and the components of distributable earnings on a tax-basis were as follows:
| | | | | |
| Federal tax cost of investments | $ | 1,393,877,653 | |
| Gross tax appreciation of investments | $ | 79,603,352 | |
| Gross tax depreciation of investments | (5,485,812) | |
| Net tax appreciation (depreciation) of investments | $ | 74,117,540 | |
| Undistributed exempt income | $ | 1,007 | |
| Accumulated short-term losses | $ | (11,030,737) | |
The cost of investments for federal income tax purposes was the same as the cost for financial reporting purposes.
Accumulated capital losses represent net capital loss carryovers that may be used to offset future realized capital gains for federal income tax purposes. The capital loss carryovers may be carried forward for an unlimited period. Future capital loss carryover utilization in any given year may be subject to Internal Revenue Code limitations.
9. Recently Issued Accounting Standards
In March 2017, the Financial Accounting Standards Board (FASB) issued Accounting Standards Update No. 2017-08, “Receivables - Nonrefundable Fees and Other Costs (Subtopic 310-20), Premium Amortization on Purchased Callable Debt Securities” (ASU 2017-08). ASU 2017-08 amends the amortization period for certain purchased callable debt securities held at a premium, shortening such period to the earliest call date. The amendments are effective for fiscal years, and interim periods within those fiscal years, beginning after December 15, 2018. The adoption of ASU 2017-08 did not materially impact the financial statements.
| | | | | | | | | | | | | | | | | | | | | | | | | | | | | | | | | | | |
| For a Share Outstanding Throughout the Years Ended August 31 (except as noted) | | | | | | | | | | | |
| Per-Share Data | | | | | | | | Ratios and Supplemental Data | | | |
| | | Income From Investment Operations: | | | | | | Ratio to Average Net Assets of: | | | |
| | Net Asset
Value,
Beginning
of Period | Net Investment Income (Loss)(1) | Net
Realized and Unrealized
Gain (Loss) | Total
From Investment Operations | Distributions From Net Investment Income | Net Asset
Value, End
of Period | Total Return(2) | Operating Expenses | Net
Investment Income
(Loss) | Portfolio Turnover
Rate | Net Assets,
End of Period
(in thousands) |
| Investor Class | | | | | | | | | | | |
| | | | | | | | | | | |
| 2020 | $11.10 | 0.34 | (0.24) | 0.10 | (0.34) | $10.86 | 0.96% | 0.50% | 3.15% | 57% | $860,867 | |
| 2019 | $10.52 | 0.36 | 0.58 | 0.94 | (0.36) | $11.10 | 9.06% | 0.50% | 3.40% | 39% | $938,094 | |
| 2018 | $10.65 | 0.37 | (0.13) | 0.24 | (0.37) | $10.52 | 2.38% | 0.50% | 3.49% | 52% | $896,098 | |
| 2017 | $10.97 | 0.37 | (0.32) | 0.05 | (0.37) | $10.65 | 0.58% | 0.50% | 3.53% | 50% | $844,105 | |
| 2016 | $10.30 | 0.37 | 0.67 | 1.04 | (0.37) | $10.97 | 10.27% | 0.50% | 3.47% | 19% | $860,997 | |
| I Class | | | | | | | | | | | |
| 2020 | $11.10 | 0.36 | (0.24) | 0.12 | (0.36) | $10.86 | 1.17% | 0.30% | 3.35% | 57% | $518,250 | |
| 2019 | $10.52 | 0.38 | 0.58 | 0.96 | (0.38) | $11.10 | 9.38% | 0.30% | 3.60% | 39% | $445,520 | |
| 2018 | $10.64 | 0.39 | (0.12) | 0.27 | (0.39) | $10.52 | 2.58% | 0.30% | 3.69% | 52% | $243,002 | |
| 2017 | $10.97 | 0.39 | (0.33) | 0.06 | (0.39) | $10.64 | 0.69% | 0.30% | 3.73% | 50% | $143,717 | |
| 2016 | $10.30 | 0.39 | 0.67 | 1.06 | (0.39) | $10.97 | 10.49% | 0.30% | 3.67% | 19% | $137,888 | |
| Y Class | | | | | | | | | | | |
| 2020 | $11.10 | 0.37 | (0.24) | 0.13 | (0.37) | $10.86 | 1.21% | 0.27% | 3.38% | 57% | $56 | |
| 2019 | $10.52 | 0.38 | 0.58 | 0.96 | (0.38) | $11.10 | 9.31% | 0.27% | 3.63% | 39% | $16 | |
| 2018 | $10.65 | 0.39 | (0.13) | 0.26 | (0.39) | $10.52 | 2.59% | 0.27% | 3.72% | 52% | $5 | |
2017(3) | $10.39 | 0.15 | 0.26 | 0.41 | (0.15) | $10.65 | 4.01% | 0.27%(4) | 3.73%(4) | 50%(5) | $5 | |
| | | | | | | | | | | | | | | | | | | | | | | | | | | | | | | | | | | |
| For a Share Outstanding Throughout the Years Ended August 31 (except as noted) | | | | | | | | | | | |
| Per-Share Data | | | | | | | | Ratios and Supplemental Data | | | |
| | | Income From Investment Operations: | | | | | | Ratio to Average Net Assets of: | | | |
| | Net Asset
Value,
Beginning
of Period | Net Investment Income (Loss)(1) | Net
Realized and Unrealized
Gain (Loss) | Total
From Investment Operations | Distributions From Net Investment Income | Net Asset
Value, End
of Period | Total Return(2) | Operating Expenses | Net
Investment Income
(Loss) | Portfolio Turnover
Rate | Net Assets,
End of Period
(in thousands) |
| A Class | | | | | | | | | | | |
| 2020 | $11.10 | 0.31 | (0.24) | 0.07 | (0.31) | $10.86 | 0.71% | 0.75% | 2.90% | 57% | $58,148 | |
| 2019 | $10.52 | 0.33 | 0.58 | 0.91 | (0.33) | $11.10 | 8.79% | 0.75% | 3.15% | 39% | $70,003 | |
| 2018 | $10.65 | 0.34 | (0.13) | 0.21 | (0.34) | $10.52 | 2.12% | 0.75% | 3.24% | 52% | $56,688 | |
| 2017 | $10.97 | 0.34 | (0.32) | 0.02 | (0.34) | $10.65 | 0.33% | 0.75% | 3.28% | 50% | $55,457 | |
| 2016 | $10.30 | 0.34 | 0.67 | 1.01 | (0.34) | $10.97 | 10.00% | 0.75% | 3.22% | 19% | $135,279 | |
| C Class | | | | | | | | | | | |
| 2020 | $11.10 | 0.23 | (0.24) | (0.01) | (0.23) | $10.86 | (0.04)% | 1.50% | 2.15% | 57% | $24,391 | |
| 2019 | $10.53 | 0.26 | 0.57 | 0.83 | (0.26) | $11.10 | 7.98% | 1.50% | 2.40% | 39% | $25,747 | |
| 2018 | $10.65 | 0.26 | (0.12) | 0.14 | (0.26) | $10.53 | 1.36% | 1.50% | 2.49% | 52% | $23,572 | |
| 2017 | $10.97 | 0.27 | (0.32) | (0.05) | (0.27) | $10.65 | (0.42)% | 1.50% | 2.53% | 50% | $28,726 | |
| 2016 | $10.30 | 0.26 | 0.67 | 0.93 | (0.26) | $10.97 | 9.18% | 1.50% | 2.47% | 19% | $34,070 | |
| | |
| Notes to Financial Highlights |
(1)Computed using average shares outstanding throughout the period.
(2)Total returns are calculated based on the net asset value of the last business day and do not reflect applicable sales charges, if any. Total returns for periods less than one year are not annualized.
(3)April 10, 2017 (commencement of sale) through August 31, 2017.
(4)Annualized.
(5)Portfolio turnover is calculated at the fund level. Percentage indicated was calculated for the year ended August 31, 2017.
See Notes to Financial Statements.
| | |
| Report of Independent Registered Public Accounting Firm |
To the Board of Trustees of American Century California Tax-Free and Municipal Funds and Shareholders of California High-Yield Municipal Fund
Opinion on the Financial Statements
We have audited the accompanying statement of assets and liabilities, including the schedule of investments, of California High-Yield Municipal Fund (one of the funds constituting American Century California Tax-Free and Municipal Funds, referred to hereafter as the "Fund") as of August 31, 2020, the related statement of operations for the year ended August 31, 2020, the statement of changes in net assets for each of the two years in the period ended August 31, 2020, including the related notes, and the financial highlights for each of the periods indicated therein (collectively referred to as the “financial statements”). In our opinion, the financial statements present fairly, in all material respects, the financial position of the Fund as of August 31, 2020, the results of its operations for the year then ended, the changes in its net assets for each of the two years in the period ended August 31, 2020 and the financial highlights for each of the periods indicated therein in conformity with accounting principles generally accepted in the United States of America.
Basis for Opinion
These financial statements are the responsibility of the Fund’s management. Our responsibility is to express an opinion on the Fund’s financial statements based on our audits. We are a public accounting firm registered with the Public Company Accounting Oversight Board (United States) (PCAOB) and are required to be independent with respect to the Fund in accordance with the U.S. federal securities laws and the applicable rules and regulations of the Securities and Exchange Commission and the PCAOB.
We conducted our audits of these financial statements in accordance with the standards of the PCAOB. Those standards require that we plan and perform the audit to obtain reasonable assurance about whether the financial statements are free of material misstatement, whether due to error or fraud.
Our audits included performing procedures to assess the risks of material misstatement of the financial statements, whether due to error or fraud, and performing procedures that respond to those risks. Such procedures included examining, on a test basis, evidence regarding the amounts and disclosures in the financial statements. Our audits also included evaluating the accounting principles used and significant estimates made by management, as well as evaluating the overall presentation of the financial statements. Our procedures included confirmation of securities owned as of August 31, 2020 by correspondence with the custodian and brokers; when replies were not received from brokers, we performed other auditing procedures. We believe that our audits provide a reasonable basis for our opinion.
/s/ PricewaterhouseCoopers LLP
Kansas City, Missouri
October 16, 2020
We have served as the auditor of one or more investment companies in American Century Investments since 1997.
Board of Trustees
The individuals listed below serve as trustees of the funds. Each trustee will continue to serve in this capacity until death, retirement, resignation or removal from office. The board has adopted a mandatory retirement age for trustees who are not “interested persons,” as that term is defined in the Investment Company Act (independent trustees). Independent trustees shall retire on December 31 of the year in which they reach their 75th birthday; provided, however, that on or after January 1, 2022, independent trustees shall retire on December 31 of the year in which they reach their 76th birthday.
Mr. Thomas is an “interested person” because he currently serves as President and Chief Executive Officer of American Century Companies, Inc. (ACC), the parent company of American Century Investment Management, Inc. (ACIM or the advisor). The other trustees (more than three-fourths of the total number) are independent. They are not employees, directors or officers of, and have no financial interest in, ACC or any of its wholly owned, direct or indirect, subsidiaries, including ACIM, American Century Investment Services, Inc. (ACIS) and American Century Services, LLC (ACS), and they do not have any other affiliations, positions or relationships that would cause them to be considered “interested persons” under the Investment Company Act. The trustees serve in this capacity for eight (in the case of Jonathan S. Thomas, 16; and Ronald J. Gilson, 9) registered investment companies in the American Century Investments family of funds.
The following table presents additional information about the trustees. The mailing address for each trustee other than Mr. Thomas is 1665 Charleston Road, Mountain View, California 94043. The mailing address for Mr. Thomas is 4500 Main Street, Kansas City, Missouri 64111.
| | | | | | | | | | | | | | | | | |
Name
(Year of Birth) | Position(s) Held with Funds | Length of Time Served | Principal Occupation(s) During Past 5 Years | Number of American Century Portfolios Overseen by Trustee | Other Directorships Held During Past 5 Years |
| Independent Trustees | | | | | |
Tanya S. Beder
(1955) | Trustee | Since 2011 | Chairman and CEO, SBCC Group Inc. (independent advisory services) (2006 to present) | 40 | CYS
Investments,
Inc.; Kirby Corporation; Nabors
Industries Ltd. |
Jeremy I. Bulow
(1954) | Trustee | Since 2011 | Professor of Economics, Stanford University, Graduate School of Business (1979 to present) | 40 | None |
Anne Casscells
(1958) | Trustee | Since 2016 | Co-Chief Executive Officer and Chief Investment Officer, Aetos Alternatives Management (investment advisory firm) (2001 to present); Lecturer in Accounting, Stanford University, Graduate School of Business (2009 to 2017) | 40 | None |
Ronald J. Gilson
(1946) | Trustee and Chairman of the Board | Since 1995
(Chairman since 2005) | Charles J. Meyers Professor of Law and Business, Emeritus, Stanford Law School (1979 to 2016); Marc and Eva Stern Professor of Law and Business, Columbia University School of Law (1992 to present) | 59 | None |
| | | | | | | | | | | | | | | | | |
Name
(Year of Birth) | Position(s) Held with Funds | Length of Time Served | Principal Occupation(s) During Past 5 Years | Number of American Century Portfolios Overseen by Trustee | Other Directorships Held During Past 5 Years |
| Independent Trustees | | | | | |
Frederick L. A. Grauer
(1946) | Trustee | Since 2008 | Senior Advisor, Credit Sesame, Inc. (credit monitoring firm) (2018 to present); Senior Advisor, Course Hero (an educational technology company) (2015 to present) | 40 | None |
Jonathan D. Levin
(1972) | Trustee | Since 2016 | Philip H. Knight Professor and Dean, Graduate School of Business, Stanford University (2016 to present); Professor, Stanford University, (2000 to present) | 40 | None |
Peter F. Pervere
(1947) | Trustee | Since 2007 | Retired | 40 | None |
John B. Shoven
(1947) | Trustee | Since 2002 | Charles R. Schwab Professor of Economics, Stanford University (1973 to present, emeritus since 2019) | 40 | Cadence Design Systems; Exponent; Financial Engines |
| Interested Trustee | | | | | |
Jonathan S. Thomas
(1963) | Trustee | Since 2007 | President and Chief Executive Officer, ACC (2007 to present). Also serves as Chief Executive Officer, ACS; Executive Vice President, ACIM; Director, ACC, ACIM and other ACC subsidiaries | 122 | None |
The Statement of Additional Information has additional information about the fund's trustees and is available without charge, upon request, by calling 1-800-345-2021.
Officers
The following table presents certain information about the executive officers of the funds. Each officer serves as an officer for 16 (in the case of Robert J. Leach, 15) investment companies in the American Century family of funds. No officer is compensated for his or her service as an officer of the funds. The listed officers are interested persons of the funds and are appointed or re-appointed on an annual basis. The mailing address for each of the officers listed below is 4500 Main Street, Kansas City, Missouri 64111.
| | | | | | | | |
Name
(Year of Birth) | Offices with the Funds | Principal Occupation(s) During the Past Five Years |
Patrick Bannigan
(1965) | President since 2019 | Executive Vice President and Director, ACC (2012 to present); Chief Financial Officer, Chief Accounting Officer and Treasurer, ACC (2015 to present). Also serves as President, ACS; Vice President, ACIM; Chief Financial Officer, Chief Accounting Officer and/or Director, ACIM, ACS and other ACC subsidiaries |
R. Wes Campbell
(1974) | Chief Financial Officer and Treasurer since 2018 | Vice President, ACS, (2020 to present); Investment Operations and Investment Accounting, ACS (2000 to present)
|
Amy D. Shelton
(1964) | Chief Compliance Officer and Vice President since 2014 | Chief Compliance Officer, American Century funds, (2014 to present); Chief Compliance Officer, ACIM (2014 to present); Chief Compliance Officer, ACIS (2009 to present). Also serves as Vice President, ACIS |
Charles A. Etherington
(1957) | General Counsel since 2007 and Senior Vice President since 2006 | Attorney, ACC (1994 to present); Vice President, ACC (2005 to present); General Counsel, ACC (2007 to present). Also serves as General Counsel, ACIM, ACS, ACIS and other ACC subsidiaries; and Senior Vice President, ACIM and ACS |
C. Jean Wade
(1964) | Vice President since 2012 | Senior Vice President, ACS (2017 to present); Vice President, ACS (2000 to 2017) |
Robert J. Leach
(1966) | Vice President since 2006 | Vice President, ACS (2000 to present) |
David H. Reinmiller
(1963) | Vice President since 2000 | Attorney, ACC (1994 to present). Also serves as Vice President, ACIM and ACS |
Ward D. Stauffer
(1960) | Secretary since 2005 | Attorney, ACC (2003 to present) |
| | |
| Approval of Management Agreement |
At a meeting held on June 17, 2020, the Fund’s Board of Trustees (the "Board") unanimously approved the renewal of the management agreement pursuant to which American Century Investment Management, Inc. (the “Advisor”) acts as the investment advisor for the Fund. Under Section 15(c) of the Investment Company Act, contracts for investment advisory services are required to be reviewed, evaluated, and approved by a majority of a fund’s Trustees, including a majority of the independent Trustees, each year. The Board regards this annual evaluation and renewal as one of its most important responsibilities.
The independent Trustees have memorialized a statement regarding the relationship between their ongoing obligations to oversee and evaluate the performance of the Advisor and their annual consideration of renewal of the management agreement. In that statement, the independent Trustees noted that their assessment of the Advisor’s performance is an ongoing process that takes place over the entire year and is informed by all of the extensive information that the Board and its committees receive and consider over time. This information, together with the additional materials provided specifically in connection with the review, are central to the Board’s assessment of the Advisor’s performance and its determination whether to renew the Fund’s management agreement.
Prior to its consideration of the renewal of the management agreement, the Board requested and reviewed extensive data and analysis relating to the proposed renewal. This information and analysis was compiled by the Advisor and certain independent providers of evaluation data concerning the Fund and the services provided to the Fund by the Advisor.
In connection with its consideration of the renewal of the management agreement, the Board’s review and evaluation of the services provided by the Advisor included, but was not limited to, the following:
•the nature, extent, and quality of investment management, shareholder services, and other services provided to the Fund;
•the wide range of other programs and services the Advisor and its affiliates provide to the Fund and its shareholders on a routine and non-routine basis;
•the Fund’s investment performance, including data comparing the Fund’s performance to appropriate benchmarks and/or a peer group of other mutual funds with similar investment objectives and strategies;
•the cost of owning the Fund compared to the cost of owning similar funds;
•the compliance policies, procedures, and regulatory experience of the Advisor and its affiliates and certain other Fund service providers;
•financial data showing the cost of services provided by the Advisor and its affiliates to the Fund, the profitability of the Fund to the Advisor, and the overall profitability of the Advisor;
•the Advisor’s strategic plans;
•the Advisor’s response to the COVID-19 pandemic;
•any economies of scale associated with the Advisor’s management of the Fund;
•services provided and charges to the Advisor’s other investment management clients;
•fees and expenses associated with any investment by the Fund in other funds;
•payments and practices in connection with financial intermediaries holding shares of the Fund on behalf of their clients and the services provided by intermediaries in connection therewith; and
•any collateral benefits derived by the Advisor from the management of the Fund.
In keeping with its practice, the Board held two meetings and the independent Trustees met in private session to discuss the renewal and to review and discuss the information provided in response to their request. The Board held active discussions with the Advisor regarding the
renewal of the management agreement. The independent Trustees had the benefit of the advice of their independent counsel throughout the process.
Factors Considered
The Trustees considered all of the information provided by the Advisor, the independent data providers, and the independent Trustees’ independent counsel in connection with the approval. They determined that the information was sufficient for them to evaluate the management agreement for the Fund. In connection with their review, the Trustees did not identify any single factor as being all-important or controlling and each Trustee may have attributed different levels of importance to different factors. In deciding to renew the management agreement, the Board based its decision on a number of factors, including the following:
Nature, Extent and Quality of Services — Generally. Under the management agreement, the Advisor is responsible for providing or arranging for all services necessary for the operation of the Fund. The Board noted that the Advisor provides or arranges at its own expense a wide variety of services including:
•constructing and designing the Fund
•portfolio research and security selection
•initial capitalization/funding
•securities trading
•Fund administration
•custody of Fund assets
•daily valuation of the Fund’s portfolio
•shareholder servicing and transfer agency, including shareholder confirmations, recordkeeping, and communications
•legal services (except the independent Trustees’ counsel)
•regulatory and portfolio compliance
•financial reporting
•marketing and distribution (except amounts paid by the Fund under Rule 12b-1 plans)
The Board noted that many of these services have expanded over time in terms of both quantity and complexity in response to shareholder demands, competition in the industry, changing distribution channels, and the changing regulatory environment.
Investment Management Services. The nature of the investment management services provided to the Fund is quite complex and allows Fund shareholders access to professional money management, instant diversification of their investments within an asset class, the opportunity to easily diversify among asset classes by investing in or exchanging among various American Century Investments funds, and liquidity. In evaluating investment performance, the Board expects the Advisor to manage the Fund in accordance with its investment objectives and approved strategies. Further, the Trustees recognize that the Advisor has an obligation to seek the best execution of fund trades. In providing these services, the Advisor utilizes teams of investment professionals (portfolio managers, analysts, research assistants, and securities traders) who require extensive information technology, research, training, compliance, and other systems to conduct their business. The Board, directly and through its Portfolio Committee, regularly reviews investment performance information for the Fund, together with comparative information for appropriate benchmarks and/or peer groups of similarly-managed funds, over different time horizons. The Trustees also review investment performance information during the management agreement renewal process. If performance concerns are identified, the Fund receives special reviews until performance improves, during which the Board discusses with the Advisor the reasons for such results (e.g., market conditions, security selection) and any efforts being undertaken to improve performance. The Fund’s performance was above its benchmark for the one-, three-, and ten-year periods and slightly below its benchmark for the five-year period reviewed by the Board. The Board discussed the Fund’s performance with the Advisor and was satisfied with the efforts being undertaken by the Advisor. The Board found the investment
management services provided by the Advisor to the Fund to be satisfactory and consistent with the management agreement.
Shareholder and Other Services. Under the management agreement, the Advisor, either directly or through affiliates or third parties, provides the Fund with a comprehensive package of transfer agency, shareholder, and other services. The Board, directly and through its various committees, regularly reviews reports and evaluations of such services at its regular meetings. These reports include, but are not limited to, information regarding the operational efficiency and accuracy of the shareholder and transfer agency services provided, staffing levels, shareholder satisfaction, technology support (including cyber security), new products and services offered to Fund shareholders, securities trading activities, portfolio valuation services, auditing services, and legal and operational compliance activities. The Board found the services provided by the Advisor to the Fund under the management agreement to be competitive and of high quality.
COVID-19 Response. During 2020, much of the world experienced unprecedented change and challenges from the impacts of the rapidly evolving, worldwide spread of the COVID-19 virus. The Board evaluated the Advisor’s response to the COVID-19 pandemic and its impact on service to the Fund. The Board found that Fund shareholders have continued to receive the Advisor’s investment management and other services without disruption, and Advisor personnel have demonstrated great resiliency in providing those services. The Board, directly and through its committees, continues to monitor the impact of the pandemic and the response of each of the Fund’s service providers.
Costs of Services and Profitability. The Advisor provides detailed information concerning its cost of providing various services to the Fund, its profitability in managing the Fund, its overall profitability, and its financial condition. The Trustees have reviewed with the Advisor the methodology used to prepare this financial information. This information is considered in evaluating the Advisor’s financial condition, its ability to continue to provide services under the management agreement, and the reasonableness of the current management fee. The Board concluded that the Advisor’s profits were reasonable in light of the services provided to the Fund.
Ethics. The Board generally considers the Advisor’s commitment to providing quality services to shareholders and to conducting its business ethically. They noted that the Advisor’s practices generally meet or exceed industry best practices.
Economies of Scale. The Board also reviewed information provided by the Advisor regarding the possible existence of economies of scale in connection with the management of the Fund. The Board concluded that economies of scale are difficult to measure and predict with precision, especially on a fund-by-fund basis. The Board concluded that the Advisor is appropriately sharing economies of scale, to the extent they exist, through its competitive fee structure, offering competitive fees from fund inception, and through reinvestment in its business, infrastructure, investment capabilities and initiatives to provide shareholders enhanced and expanded services.
Comparison to Other Funds’ Fees. The management agreement provides that the Fund pays the Advisor a single, all-inclusive (or unified) management fee for providing all services necessary for the management and operation of the Fund, other than brokerage expenses, expenses attributable to short sales, taxes, interest, extraordinary expenses, fees and expenses of the Fund’s independent Trustees (including their independent legal counsel), and expenses incurred in connection with the provision of shareholder services and distribution services under a plan adopted pursuant to Rule 12b-1 under the Investment Company Act. Under this unified fee structure, the Advisor is responsible for providing all investment advisory, custody, audit, administrative, compliance, recordkeeping, marketing, and shareholder services, or arranging and supervising third parties to provide such services. By contrast, most other funds are charged a variety of fees, including an investment advisory fee, a transfer agency fee, an administrative fee, and other expenses. Other than their investment advisory fees and any applicable Rule 12b-1 distribution fees, all other components of the total fees charged by these other funds may be increased without shareholder approval. The Board believes the unified fee structure is a benefit to
Fund shareholders because it clearly discloses to shareholders the cost of owning Fund shares, and, since the unified fee cannot be increased without a vote of Fund shareholders, it shifts to the Advisor the risk of increased costs of operating the Fund and provides a direct incentive to minimize administrative inefficiencies. Part of the Board’s analysis of fee levels involves reviewing certain evaluative data compiled by an independent provider and comparing the Fund’s unified fee to the total expense ratio of peer funds. The unified fee charged to shareholders of the Fund was below the median of the total expense ratios of the Fund’s peer group. The Board concluded that the management fee paid by the Fund to the Advisor under the management agreement is reasonable in light of the services provided to the Fund.
Comparison to Fees and Services Provided to Other Clients of the Advisor. The Board also requested and received information from the Advisor concerning the nature of the services, fees, costs, and profitability of its advisory services to advisory clients other than the Fund. They observed that these varying types of client accounts require different services and involve different regulatory and entrepreneurial risks than the management of the Fund. The Board analyzed this information and concluded that the fees charged and services provided to the Fund were reasonable by comparison.
Payments to Intermediaries. The Trustees also requested and received a description of payments made to intermediaries by the Fund and the Advisor and services provided by intermediaries. These payments include various payments made by the Fund or the Advisor to different types of intermediaries and recordkeepers for distribution and service activities provided with respect to the Fund. The Trustees reviewed such information and received representations from the Advisor that all such payments by the Fund were made pursuant to the Fund’s Rule 12b-1 Plan and that all such payments by the Advisor were made from the Advisor’s resources and reasonable profits. The Board found such payments to be reasonable in scope and purpose.
Collateral or “Fall-Out” Benefits Derived by the Advisor. The Board considered the existence of collateral benefits the Advisor may receive as a result of its relationship with the Fund. The Board noted that the Advisor’s primary business is managing mutual funds and it generally does not use fund or shareholder information to generate profits in other lines of business, and therefore does not derive any significant collateral benefits from them. The Board noted that the Advisor may receive proprietary research from broker-dealers that execute fund portfolio transactions. The Board also determined that the Advisor is able to provide investment management services to certain clients other than the Fund, at least in part, due to its existing infrastructure built to serve the fund complex. The Board noted that the assets of those other accounts are, where applicable, included with the assets of the Fund to determine breakpoints in the management fee schedule.
Existing Relationship. The Board also considered whether there was any reason for not continuing the existing arrangement with the Advisor. In this regard, the Board was mindful of the potential disruptions of the Fund’s operations and various risks, uncertainties, and other effects that could occur as a result of a decision not to continue such relationship. In particular, the Board recognized that most shareholders have invested in the Fund on the strength of the Advisor’s industry standing and reputation and in the expectation that the Advisor will have a continuing role in providing advisory services to the Fund.
Conclusion of the Trustees. As a result of this process, the Board, including all of the independent Trustees and assisted by the advice of independent legal counsel, taking into account all of the factors discussed above and the information provided by the Advisor and others in connection with its review and throughout the year, concluded that the management agreement between the Fund and the Advisor is fair and reasonable in light of the services provided and should be renewed.
| | |
| Liquidity Risk Management Program |
The Fund has adopted a liquidity risk management program (the “program”). The Fund’s Board of Trustees (the "Board") has designated American Century Investment Management, Inc. (“ACIM”) as the administrator of the program. Personnel of ACIM or its affiliates conduct the day-to-day operation of the program pursuant to policies and procedures administered by those members of the ACIM’s Investment Oversight Committee who are members of the ACIM’s Investment Management and Global Analytics departments.
Under the program, ACIM manages the Fund’s liquidity risk, which is the risk that the Fund could not meet shareholder redemption requests without significant dilution of remaining shareholders’ interests in the Fund. This risk is managed by monitoring the degree of liquidity of the Fund’s investments, limiting the amount of the Fund’s illiquid investments, and utilizing various risk management tools and facilities available to the Fund for meeting shareholder redemptions, among other means. ACIM’s process of determining the degree of liquidity of the Fund’s investments is supported by one or more third-party liquidity assessment vendors.
The Board reviewed a report prepared by ACIM regarding the operation and effectiveness of the program for the period December 1, 2018 through December 31, 2019. No significant liquidity events impacting the Fund were noted in the report. In addition, ACIM provided its assessment that the program had been effective in managing the Fund’s liquidity risk.
Retirement Account Information
As required by law, distributions you receive from certain retirement accounts are subject to federal income tax withholding, unless you elect not to have withholding apply*. Tax will be withheld on the total amount withdrawn even though you may be receiving amounts that are not subject to withholding, such as nondeductible contributions. In such case, excess amounts of withholding could occur. You may adjust your withholding election so that a greater or lesser amount will be withheld.
If you don’t want us to withhold on this amount, you must notify us to not withhold the federal income tax. You may notify us in writing or in certain situations by telephone or through other electronic means. For systematic withdrawals, your withholding election will remain in effect until revoked or changed by filing a new election. You have the right to revoke your election at any time and change your withholding percentage for future distributions.
Remember, even if you elect not to have income tax withheld, you are liable for paying income tax on the taxable portion of your withdrawal. If you elect not to have income tax withheld or you don’t have enough income tax withheld, you may be responsible for payment of estimated tax. You may incur penalties under the estimated tax rules if your withholding and estimated tax payments are not sufficient. You can reduce or defer the income tax on a distribution by directly or indirectly rolling such distribution over to another IRA or eligible plan. You should consult your tax advisor for additional information.
State tax will be withheld if, at the time of your distribution, your address is within one of the mandatory withholding states and you have federal income tax withheld (or as otherwise required by state law). State taxes will be withheld from your distribution in accordance with the respective state rules.
*Some 403(b), 457 and qualified retirement plan distributions may be subject to 20% mandatory withholding, as they are subject to special tax and withholding rules. Your plan administrator or plan sponsor is required to provide you with a special tax notice explaining those rules at the time you request a distribution. If applicable, federal and/or state taxes may be withheld from your distribution amount.
Proxy Voting Policies
Descriptions of the principles and policies that the fund's investment advisor uses in exercising the voting rights associated with the securities purchased and/or held by the fund are available without charge, upon request, by calling 1-800-345-2021 or visiting American Century Investments’ website at americancentury.com/proxy. A description of the policies is also available on the Securities and Exchange Commission’s website at sec.gov. Information regarding how the investment advisor voted proxies relating to portfolio securities during the most recent 12-month period ended June 30 is available on americancentury.com/proxy. It is also available at sec.gov.
Quarterly Portfolio Disclosure
The fund files its complete schedule of portfolio holdings with the Securities and Exchange Commission (SEC) for the first and third quarters of each fiscal year as an exhibit to its reports on Form N-PORT. The fund’s Form N-PORT reports are available on the SEC’s website at sec.gov. The fund also makes its complete schedule of portfolio holdings for the most recent quarter of its fiscal year available on its website at americancentury.com and, upon request, by calling 1-800-345-2021.
Other Tax Information
The following information is provided pursuant to provisions of the Internal Revenue Code.
The fund designates $47,426,982 as exempt interest dividends for the fiscal year ended August 31, 2020.
| | | | | | | | |
| | |
| | |
| Contact Us | americancentury.com | |
| Automated Information Line | 1-800-345-8765 | |
| Investor Services Representative | 1-800-345-2021
or 816-531-5575 | |
| Investors Using Advisors | 1-800-378-9878 | |
| Business, Not-For-Profit, Employer-Sponsored Retirement Plans | 1-800-345-3533 | |
| Banks and Trust Companies, Broker-Dealers, Financial Professionals, Insurance Companies | 1-800-345-6488 | |
| Telecommunications Relay Service for the Deaf | 711 | |
| | |
| American Century California Tax-Free and Municipal Funds | | |
| | |
Investment Advisor: American Century Investment Management, Inc. Kansas City, Missouri | | |
| | |
| This report and the statements it contains are submitted for the general information of our shareholders. The report is not authorized for distribution to prospective investors unless preceded or accompanied by an effective prospectus. | | |
| | |
©2020 American Century Proprietary Holdings, Inc. All rights reserved.
CL-ANN-90325 2010 | | |

| | | | | |
| |
| Annual Report |
| |
| August 31, 2020 |
| |
| California Intermediate-Term Tax-Free Bond Fund |
| Investor Class (BCITX) |
| I Class (BCTIX) |
| Y Class (ACYTX) |
| A Class (BCIAX) |
| C Class (BCIYX) |
Beginning on January 1, 2021, as permitted by regulations adopted by the Securities and Exchange Commission, paper copies of the fund’s shareholder reports like this one will no longer be sent by mail, unless you specifically request paper copies of the reports from the fund or from your financial intermediary, such as a broker-dealer or bank. Instead, the reports will be made available on a website, and you will be notified by mail each time a report is posted and provided with a website link to access the report.
If you already elected to receive shareholder reports electronically, you will not be affected by this change and you need not take any action. You may elect to receive shareholder reports and other communications from the fund or your financial intermediary electronically by calling or sending an email request to your appropriate contacts as listed on the back cover of this report.
You may elect to receive all future reports in paper free of charge. You can inform the fund or your financial intermediary that you wish to continue receiving paper copies of your shareholder reports by calling or sending an email request to your appropriate contacts as listed on the back cover of this report. Your election to receive reports in paper will apply to all funds held with the fund complex/your financial intermediary.
| | | | | |
| President’s Letter | |
| Performance | |
| Portfolio Commentary | |
| Fund Characteristics | |
| Shareholder Fee Example | |
| Schedule of Investments | |
| Statement of Assets and Liabilities | |
| Statement of Operations | |
| Statement of Changes in Net Assets | |
| Notes to Financial Statements | |
| Financial Highlights | |
| Report of Independent Registered Public Accounting Firm | |
| Management | |
| Approval of Management Agreement | |
| Liquidity Risk Management Program | |
| |
| Additional Information | |
Any opinions expressed in this report reflect those of the author as of the date of the report, and do not necessarily represent the opinions of American Century Investments® or any other person in the American Century Investments organization. Any such opinions are subject to change at any time based upon market or other conditions and American Century Investments disclaims any responsibility to update such opinions. These opinions may not be relied upon as investment advice and, because investment decisions made by American Century Investments funds are based on numerous factors, may not be relied upon as an indication of trading intent on behalf of any American Century Investments fund. Security examples are used for representational purposes only and are not intended as recommendations to purchase or sell securities. Performance information for comparative indices and securities is provided to American Century Investments by third party vendors. To the best of American Century Investments’ knowledge, such information is accurate at the time of printing.
Jonathan Thomas
Dear Investor:
Thank you for reviewing this annual report for the period ended August 31, 2020. Annual reports help convey important information about fund returns, including market factors that affected performance. For additional investment insights, please visit americancentury.com.
Pandemic Disrupted Economic, Market Courses
Broad market sentiment was generally upbeat through the first half of the reporting period. Dovish central banks, modest inflation, improving economic and corporate earnings data, and progress on U.S.-China trade policy helped boost global growth outlooks. Against this backdrop, risk assets, including municipal bonds (munis), largely remained in favor.
However, beginning in late February, COVID-19 quickly quashed the optimistic tone. The outbreak rapidly spread worldwide, halting most U.S. and global economic activity and triggering a deep worldwide recession. In the U.S., stocks and credit-sensitive assets sold off sharply, while U.S. Treasury yields plunged to record lows amid soaring demand. Quick and aggressive action from the Federal Reserve and Congress helped stabilize financial markets and restore confidence in the muni and credit sectors. Additionally, declining coronavirus infection and death rates in many regions and the reopening of economies were positive influences. By the end of August, manufacturing, employment and other data suggested an economic recovery was underway.
In general, munis bounced back from the early spring sell-off to deliver modest gains for the 12-month period. However, the broad asset class did not keep pace with the rallying Treasury market.
A Slow Return to Normal
The return to pre-pandemic life will take time and patience, but we are confident we will get there. Several drug companies are in final stages of vaccine trials, and medical professionals continue to fine-tune virus treatment protocols. In the meantime, investors likely will face periods of outbreak-related disruptions, economic and political uncertainty, and heightened market volatility. These influences can be unsettling, but they tend to be temporary.
We appreciate your confidence in us during these extraordinary times. Our firm has a long history of helping clients weather unpredictable markets, and we’re confident we will continue to meet today’s challenges.
Sincerely,
Jonathan Thomas
President and Chief Executive Officer
American Century Investments
| | | | | | | | | | | | | | | | | | | | | |
| Total Returns as of August 31, 2020 | | | | | | | |
| | | | | Average Annual Returns | | | |
| | Ticker
Symbol | | 1 year | 5 years | 10 years | Since
Inception | Inception
Date |
| Investor Class | BCITX | | 1.93% | 3.04% | 3.20% | — | 11/9/83 |
| S&P Intermediate Term California AMT-Free Municipal Bond Index | — | | 3.30% | 3.26% | 3.48% | — | — |
| I Class | BCTIX | | 2.05% | 3.25% | 3.40% | — | 3/1/10 |
| Y Class | ACYTX | | 2.17% | — | — | 3.77% | 4/10/17 |
| A Class | BCIAX | | | | | | 3/1/10 |
| No sales charge | | | 1.68% | 2.81% | 2.94% | — | |
| With sales charge | | | -2.92% | 1.86% | 2.47% | — | |
| C Class | BCIYX | | 0.92% | 2.02% | 2.18% | — | 3/1/10 |
Average annual returns since inception are presented when ten years of performance history is not available.
Sales charges include initial sales charges and contingent deferred sales charges (CDSCs), as applicable. A Class shares have a 4.50% maximum initial sales charge and may be subject to a maximum CDSC of 1.00%. C Class shares redeemed within 12 months of purchase are subject to a maximum CDSC of 1.00%. The SEC requires that mutual funds provide performance information net of maximum sales charges in all cases where charges could be applied.
Data presented reflect past performance. Past performance is no guarantee of future results. Current performance may be higher or lower than the performance shown. Total returns for periods less than one year are not annualized. Investment return and principal value will fluctuate, and redemption value may be more or less than original cost. Data assumes reinvestment of dividends and capital gains, and none of the charts reflect the deduction of taxes that a shareholder would pay on fund distributions or the redemption of fund shares. To obtain performance data current to the most recent month end, please call 1-800-345-2021 or visit americancentury.com. For additional information about the fund, please consult the prospectus.
| | |
| Growth of $10,000 Over 10 Years |
| $10,000 investment made August 31, 2010 |
| Performance for other share classes will vary due to differences in fee structure. |
| | | | | |
| Value on August 31, 2020 | |
| Investor Class — $13,707 |
| |
| S&P Intermediate Term California AMT-Free Municipal Bond Index — $14,076 |
| |
| | | | | | | | | | | | | | |
| Total Annual Fund Operating Expenses | | | | |
| Investor Class | I Class | Y Class | A Class | C Class |
| 0.47% | 0.27% | 0.24% | 0.72% | 1.47% |
The total annual fund operating expenses shown is as stated in the fund’s prospectus current as of the date of this report. The prospectus may vary from the expense ratio shown elsewhere in this report because it is based on a different time period, includes acquired fund fees and expenses, and, if applicable, does not include fee waivers or expense reimbursements.
Data presented reflect past performance. Past performance is no guarantee of future results. Current performance may be higher or lower than the performance shown. Total returns for periods less than one year are not annualized. Investment return and principal value will fluctuate, and redemption value may be more or less than original cost. Data assumes reinvestment of dividends and capital gains, and none of the charts reflect the deduction of taxes that a shareholder would pay on fund distributions or the redemption of fund shares. To obtain performance data current to the most recent month end, please call 1-800-345-2021 or visit americancentury.com. For additional information about the fund, please consult the prospectus.
Portfolio Managers: Joseph Gotelli, Alan Kruss and Steven Permut
Performance Summary
California Intermediate-Term Tax-Free Bond returned 1.93%* for the 12 months ended August 31, 2020. By comparison, the S&P Intermediate Term California AMT-Free Municipal Bond Index returned 3.30%. Fund returns reflect operating expenses, while index returns do not.
Like most asset classes during the 12-month period, the municipal bond (muni) market endured extreme volatility as the COVID-19 outbreak prompted a dramatic sell-off in March and April. However, the Federal Reserve (Fed) and the U.S. government quickly responded with monetary and fiscal stimulus. This helped stem losses, restore liquidity and lend stability to fixed-income markets in general, which benefited munis. Within the portfolio, sector allocation and security selection hindered performance, relative to the index, while duration positioning mitigated a portion of the decline.
Fed Moves Bolstered Muni Market
Early in the reporting period, waning trade tensions and an improving global growth outlook fostered risk-on investing, driving muni prices higher. However, as the coronavirus spread across the U.S. in early 2020, economic activity grinded to a halt, and risk assets sold off sharply. Robust demand for safe-haven assets led to considerable muni underperformance versus Treasuries.
Swift action by the Fed, including cutting short-term interest rates to near 0% and launching aggressive lending and asset-purchase plans, aided the market. The Fed’s efforts included the $500 billion Municipal Liquidity Facility (MLF), which restored market confidence that muni issuers would have access to liquidity as needed. Meanwhile, lawmakers passed the Coronavirus Aid, Relief and Economic Security (CARES) Act, which also helped soothe investors’ anxieties. A summer-long risk rally followed, especially as states lifted pandemic-related restrictions.
Demand for munis gradually recovered to nearly pre-COVID-19 levels by the end of the period. New-issue levels similarly whipsawed through 2020, although taxable issuance remained greater than tax-exempt issuance. Overall, muni returns largely trailed U.S. Treasuries. Within the broad muni sector, higher-quality securities outperformed lower-quality issues, and general obligation (GO) bonds outperformed revenue bonds. California munis modestly outperformed national munis.
Pandemic Pressured California Finances
State and local finances across the U.S. remained relatively healthy from the start of the reporting period through early 2020. However, costs related to the pandemic stretched California and other state budgets. The CARES Act earmarked funds to offset a large portion of those expenses. Additionally, adjustments by the California government to push select expenditures into 2021-2022 helped smooth the state’s expected drawdown in reserves. At of the end of August, the state’s cash position was strong, with $50.1 billion of available liquidity. This is a key indicator for rating agencies, given the state’s cash liquidity position typically weakens significantly in times of stress (such as from 2009 to 2011).
While California’s employment market has recovered slowly, especially within the hard-hit leisure and hospitality industry, the revenue impact continues to unfold. Yet, the state has several different levers to pull to adjust for any future downturns in revenue, including tax increases, spending
*All fund returns referenced in this commentary are for Investor Class shares. Performance for other share classes will vary due to differences in fee structure; when Investor Class performance exceeds that of the index, other share classes may not. See page 3 for returns for all share classes.
reductions and the ability to shift funds. The extent of the challenges hinges on the duration of the pandemic-related disruptions and economic downturn.
Sector Allocation, Security Selection Detracted from Results
An overweight allocation, relative to the index, in the riskier student housing sector diminished relative returns, although our security selection offset a portion of losses. Investments in the out-of-index hospitals and multifamily housing sectors also weighed on performance, as did security selection in the special tax, local GO and private university sectors.
Duration Supplied a Lift
We consistently maintained a longer-than-index duration, which proved beneficial during the period. In addition, our overweight exposure in the 15- to 20-year portion of the yield curve supplied a lift. In addition, a stake in out-of-index tobacco securities and an underweight position in local GOs supplied a modest lift.
Portfolio Positioning
Given the prevailing uncertainty related to the pandemic, we’re continually evaluating the broad secular and cyclical repercussions. We’re also monitoring how sectors such as student housing, nursing homes, convention centers and airports will manage marketplace changes.
As good as the CARES Act was in addressing the initial expenses of fighting COVID-19, we’re waiting to see what the next round of stimulus looks like. And if no new relief is forthcoming, state and local governments will likely need to implement measures to right-size under a lower-revenue regime. Meanwhile, the upcoming election also looms large due to the potential for higher tax rates, which generally provide a tailwind to the muni market.
Within California, the state’s cash reserves appear healthy enough to buffer the upcoming challenges. Nonetheless, between COVID-19 and the state’s wildfires, we’re weighing the long-term impacts such risks have on broader housing trends. Specifically, we’re considering how a distributed workforce away from coastal areas could affect fundamentals. Ultimately, we’re confident in the market’s resiliency, and we expect credit fundamentals to remain largely stable. Although downgrade levels will likely rise as the impact of the pandemic plays out, we believe defaults will mostly affect the riskiest parts of the market. We believe opportunities will continue to arise across the asset class at all quality levels, and our fundamental credit research will help identify those opportunities.
| | | | | |
| AUGUST 31, 2020 | |
| Portfolio at a Glance | |
| Weighted Average Life to Maturity | 9.5 years |
| Average Duration (Modified) | 5.0 years |
| | |
| Top Five Sectors | % of fund investments |
| Special Tax | 17% |
| Hospital | 14% |
| Water & Sewer | 9% |
| General Obligation (GO) - Local | 9% |
| Lease Revenue | 7% |
| | |
| Types of Investments in Portfolio | % of net assets |
| Municipal Securities | 99.6% |
| Other Assets and Liabilities | 0.4% |
Fund shareholders may incur two types of costs: (1) transaction costs, including sales charges (loads) on purchase payments and redemption/exchange fees; and (2) ongoing costs, including management fees; distribution and service (12b-1) fees; and other fund expenses. This example is intended to help you understand your ongoing costs (in dollars) of investing in your fund and to compare these costs with the ongoing cost of investing in other mutual funds.
The example is based on an investment of $1,000 made at the beginning of the period and held for the entire period from March 1, 2020 to August 31, 2020.
Actual Expenses
The table provides information about actual account values and actual expenses for each class. You may use the information, together with the amount you invested, to estimate the expenses that you paid over the period. First, identify the share class you own. Then simply divide your account value by $1,000 (for example, an $8,600 account value divided by $1,000 = 8.6), then multiply the result by the number under the heading “Expenses Paid During Period” to estimate the expenses you paid on your account during this period.
If you hold Investor Class shares of any American Century Investments fund, or I Class shares of the American Century Diversified Bond Fund, in an American Century Investments account (i.e., not through a financial intermediary or employer-sponsored retirement plan account), American Century Investments may charge you a $25.00 annual account maintenance fee if the value of those shares is less than $10,000. We will redeem shares automatically in one of your accounts to pay the $25.00 fee. In determining your total eligible investment amount, we will include your investments in all personal accounts (including American Century Investments brokerage accounts) registered under your Social Security number. Personal accounts include individual accounts, joint accounts, UGMA/UTMA accounts, personal trusts, Coverdell Education Savings Accounts and IRAs (including traditional, Roth, Rollover, SEP-, SARSEP- and SIMPLE-IRAs), and certain other retirement accounts. If you have only business, business retirement, employer-sponsored or American Century Investments brokerage accounts, you are currently not subject to this fee. If you are subject to the account maintenance fee, your account value could be reduced by the fee amount.
Hypothetical Example for Comparison Purposes
The table also provides information about hypothetical account values and hypothetical expenses based on the actual expense ratio of each class of your fund and an assumed rate of return of 5% per year before expenses, which is not the actual return of a fund’s share class. The hypothetical account values and expenses may not be used to estimate the actual ending account balance or expenses you paid for the period. You may use this information to compare the ongoing costs of investing in your fund and other funds. To do so, compare this 5% hypothetical example with the 5% hypothetical examples that appear in the shareholder reports of the other funds.
Please note that the expenses shown in the table are meant to highlight your ongoing costs only and do not reflect any transactional costs, such as sales charges (loads) or redemption/exchange fees. Therefore, the table is useful in comparing ongoing costs only, and will not help you determine the relative total costs of owning different funds. In addition, if these transactional costs were included, your costs would have been higher.
| | | | | | | | | | | | | | |
| Beginning
Account Value
3/1/20 | Ending
Account Value
8/31/20 | Expenses Paid During Period(1) 3/1/20 - 8/31/20 | Annualized Expense Ratio(1) |
| Actual | | | | |
| Investor Class | $1,000 | $994.10 | $2.36 | 0.47% |
| I Class | $1,000 | $994.30 | $1.35 | 0.27% |
| Y Class | $1,000 | $995.30 | $1.20 | 0.24% |
| A Class | $1,000 | $992.90 | $3.61 | 0.72% |
| C Class | $1,000 | $989.10 | $7.35 | 1.47% |
| Hypothetical | | | | |
| Investor Class | $1,000 | $1,022.77 | $2.39 | 0.47% |
| I Class | $1,000 | $1,023.78 | $1.37 | 0.27% |
| Y Class | $1,000 | $1,023.93 | $1.22 | 0.24% |
| A Class | $1,000 | $1,021.52 | $3.66 | 0.72% |
| C Class | $1,000 | $1,017.75 | $7.46 | 1.47% |
(1)Expenses are equal to the class's annualized expense ratio listed in the table above, multiplied by the average account value over the period, multiplied by 184, the number of days in the most recent fiscal half-year, divided by 366, to reflect the one-half year period. Annualized expense ratio reflects actual expenses, including any applicable fee waivers or expense reimbursements and excluding any acquired fund fees and expenses.
AUGUST 31, 2020
| | | | | | | | |
| Principal Amount | Value |
| MUNICIPAL SECURITIES — 99.6% | | |
| California — 99.4% | | |
| 91 Express Lanes Toll Road Rev., 5.00%, 8/15/24 | $ | 1,000,000 | | $ | 1,118,790 | |
| 91 Express Lanes Toll Road Rev., 5.00%, 8/15/25 | 1,000,000 | | 1,116,420 | |
| ABAG Finance Authority for Nonprofit Corps. Rev., (Sharp Healthcare Obligated Group), 6.00%, 8/1/30 | 3,500,000 | | 3,672,025 | |
| ABAG Finance Authority for Nonprofit Corps. Rev., (Sharp Healthcare Obligated Group), 5.00%, 8/1/33 | 1,450,000 | | 1,604,816 | |
| ABAG Finance Authority for Nonprofit Corps. Special Tax, 5.00%, 9/2/28 (AGM) | 2,625,000 | | 3,287,760 | |
| ABAG Finance Authority for Nonprofit Corps. Special Tax, 5.00%, 9/2/31 (AGM) | 1,400,000 | | 1,727,012 | |
| ABAG Finance Authority for Nonprofit Corps. Special Tax, 5.00%, 9/2/32 (AGM) | 490,000 | | 600,936 | |
| Alameda Corridor Transportation Authority Rev., 5.00%, 10/1/22 | 1,000,000 | | 1,084,000 | |
| Alameda Corridor Transportation Authority Rev., 5.00%, 10/1/24 | 4,000,000 | | 4,485,320 | |
| Alameda Corridor Transportation Authority Rev., 5.00%, 10/1/34 | 3,500,000 | | 4,090,975 | |
| Alameda Corridor Transportation Authority Rev., 5.00%, 10/1/35 | 3,000,000 | | 3,495,690 | |
| Alameda Corridor Transportation Authority Rev., 5.00%, 10/1/36 | 1,000,000 | | 1,161,770 | |
| Alameda Corridor Transportation Authority Rev., 5.00%, 10/1/37 | 3,790,000 | | 4,392,837 | |
Alameda Corridor Transportation Authority Rev., Capital Appreciation, 0.00%, 10/1/32 (NATL)(1) | 1,000,000 | | 740,940 | |
Alameda Corridor Transportation Authority Rev., Capital Appreciation, 0.00%, 10/1/35 (NATL)(1) | 12,750,000 | | 8,481,172 | |
| Alum Rock Union Elementary School District GO, 6.00%, 8/1/39 | 2,500,000 | | 2,851,000 | |
Anaheim Public Financing Authority Rev., 5.375%, 4/1/21, Prerefunded at 100% of Par(2) | 1,000,000 | | 1,030,610 | |
Anaheim Public Financing Authority Rev., 5.00%, 10/1/22, Prerefunded at 100% of Par(2) | 1,200,000 | | 1,320,588 | |
Anaheim Public Financing Authority Rev., 5.00%, 10/1/22, Prerefunded at 100% of Par(2) | 2,275,000 | | 2,503,615 | |
| Anaheim Public Financing Authority Rev., (Anaheim), 5.00%, 5/1/25 | 1,000,000 | | 1,144,830 | |
| Anaheim Public Financing Authority Rev., (Anaheim), 5.00%, 5/1/28 | 1,100,000 | | 1,245,981 | |
| Anaheim Public Financing Authority Rev., (Anaheim), 5.00%, 5/1/29 | 1,250,000 | | 1,411,600 | |
| Anaheim Public Financing Authority Rev., (Anaheim), 5.00%, 9/1/30 (BAM) | 2,625,000 | | 3,343,489 | |
| Anaheim Public Financing Authority Rev., (Anaheim), 5.00%, 9/1/31 (BAM) | 1,745,000 | | 2,209,414 | |
| Anaheim Public Financing Authority Rev., (Anaheim), 5.00%, 9/1/32 (BAM) | 1,745,000 | | 2,193,482 | |
| Anaheim Public Financing Authority Rev., (Anaheim), 5.00%, 9/1/33 (BAM) | 1,665,000 | | 2,081,849 | |
| Anaheim Public Financing Authority Rev., (Anaheim), 5.00%, 5/1/34 | 1,360,000 | | 1,515,842 | |
| Anaheim Public Financing Authority Rev., (Anaheim), 5.00%, 9/1/34 (BAM) | 1,800,000 | | 2,147,256 | |
| Anaheim Public Financing Authority Rev., (Anaheim), 5.00%, 9/1/35 (BAM) | 2,105,000 | | 2,502,277 | |
| Anaheim Public Financing Authority Rev., (Anaheim), 5.00%, 9/1/36 (BAM) | 4,190,000 | | 4,957,776 | |
| Anaheim Public Financing Authority Rev., (Anaheim), 5.00%, 5/1/39 | 1,550,000 | | 1,713,773 | |
| Atwater Wastewater Rev., 5.00%, 5/1/23 (AGM) | 510,000 | | 571,037 | |
| Atwater Wastewater Rev., 5.00%, 5/1/25 (AGM) | 745,000 | | 894,894 | |
| Atwater Wastewater Rev., 5.00%, 5/1/27 (AGM) | 415,000 | | 525,357 | |
| | | | | | | | |
| Principal Amount | Value |
| Atwater Wastewater Rev., 5.00%, 5/1/29 (AGM) | $ | 700,000 | | $ | 891,464 | |
| Atwater Wastewater Rev., 5.00%, 5/1/32 (AGM) | 895,000 | | 1,107,043 | |
| Bakersfield Wastewater Rev., 5.00%, 9/15/31 | 1,355,000 | | 1,885,550 | |
| Bakersfield Wastewater Rev., 5.00%, 9/15/32 | 1,620,000 | | 2,229,039 | |
Bay Area Toll Authority Rev., 5.00%, 4/1/22, Prerefunded at 100% of Par(2) | 1,500,000 | | 1,613,805 | |
Bay Area Toll Authority Rev., 5.00%, 4/1/22, Prerefunded at 100% of Par(2) | 3,500,000 | | 3,765,545 | |
Bay Area Toll Authority Rev., 5.00%, 4/1/22, Prerefunded at 100% of Par(2) | 7,185,000 | | 7,730,126 | |
| Bay Area Toll Authority Rev., 4.00%, 4/1/29 | 3,000,000 | | 3,552,270 | |
| Bay Area Toll Authority Rev., VRN, 2.00%, 4/1/34 | 2,000,000 | | 2,002,900 | |
| Bay Area Toll Authority Rev., VRN, 1.34%, (MUNIPSA plus 1.25%), 4/1/36 | 4,000,000 | | 3,995,000 | |
| Bay Area Toll Authority Rev., VRN, 1.19%, (MUNIPSA plus 1.10%), 4/1/45 | 3,750,000 | | 3,773,775 | |
| Bay Area Toll Authority Rev., VRN, 2.625%, 4/1/45 | 15,000,000 | | 16,459,200 | |
| Brea Redevelopment Agency Tax Allocation, Capital Appreciation, VRN, 0.00%, 8/1/33 | 1,500,000 | | 1,594,935 | |
| Brea Redevelopment Agency Tax Allocation, Capital Appreciation, VRN, 0.00%, 8/1/34 | 1,785,000 | | 1,893,135 | |
| California Community College Financing Authority Rev., (NCCD-Orange Coast Properties LLC), 5.00%, 5/1/28 | 275,000 | | 294,671 | |
| California Community College Financing Authority Rev., (NCCD-Orange Coast Properties LLC), 5.00%, 5/1/29 | 800,000 | | 852,856 | |
| California Community College Financing Authority Rev., (NCCD-Orange Coast Properties LLC), 5.00%, 5/1/34 | 1,295,000 | | 1,349,286 | |
| California Community College Financing Authority Rev., (NCCD-Orange Coast Properties LLC), 5.00%, 5/1/36 | 1,595,000 | | 1,651,351 | |
| California Community College Financing Authority Rev., (NCCD-Orange Coast Properties LLC), 5.25%, 5/1/43 | 850,000 | | 879,189 | |
| California County Tobacco Securitization Agency Rev., 5.00%, 6/1/30 | 450,000 | | 604,971 | |
| California County Tobacco Securitization Agency Rev., 5.00%, 6/1/32 | 400,000 | | 526,720 | |
| California County Tobacco Securitization Agency Rev., 4.00%, 6/1/34 | 200,000 | | 240,756 | |
| California County Tobacco Securitization Agency Rev., 4.00%, 6/1/36 | 275,000 | | 327,553 | |
| California County Tobacco Securitization Agency Rev., 4.00%, 6/1/39 | 250,000 | | 294,843 | |
| California Educational Facilities Authority Rev., (Chapman University), 5.00%, 4/1/21 | 750,000 | | 768,023 | |
| California Educational Facilities Authority Rev., (Chapman University), 5.00%, 4/1/24 | 930,000 | | 1,062,218 | |
| California Educational Facilities Authority Rev., (Chapman University), 5.00%, 4/1/31 (GA: Brandman University) | 1,455,000 | | 1,484,042 | |
| California Educational Facilities Authority Rev., (Claremont McKenna College), 5.00%, 1/1/32 | 750,000 | | 908,955 | |
| California Educational Facilities Authority Rev., (Loma Linda University), 5.00%, 4/1/25 | 800,000 | | 926,176 | |
| California Educational Facilities Authority Rev., (Loma Linda University), 5.00%, 4/1/27 | 300,000 | | 361,908 | |
| California Educational Facilities Authority Rev., (Loma Linda University), 5.00%, 4/1/28 | 800,000 | | 959,192 | |
| California Educational Facilities Authority Rev., (Loyola Marymount University), 5.00%, 10/1/34 | 490,000 | | 602,313 | |
| California Educational Facilities Authority Rev., (Loyola Marymount University), 5.00%, 10/1/35 | 625,000 | | 765,206 | |
| | | | | | | | |
| Principal Amount | Value |
| California Educational Facilities Authority Rev., (Loyola Marymount University), 5.00%, 10/1/37 | $ | 745,000 | | $ | 905,942 | |
California Educational Facilities Authority Rev., (University of San Francisco), 5.00%, 10/1/21(2) | 365,000 | | 383,575 | |
California Educational Facilities Authority Rev., (University of San Francisco), 5.00%, 10/1/21(2) | 385,000 | | 404,593 | |
California Educational Facilities Authority Rev., (University of Southern California), 5.00%, 10/1/25(2) | 1,875,000 | | 2,323,275 | |
| California Educational Facilities Authority Rev., (University of the Pacific), 5.00%, 11/1/33 | 1,500,000 | | 1,732,575 | |
| California Health Facilities Financing Authority Rev., (Cedars-Sinai Medical Center Obligated Group), 5.00%, 11/15/22 | 3,000,000 | | 3,305,220 | |
| California Health Facilities Financing Authority Rev., (Cedars-Sinai Medical Center Obligated Group), 5.00%, 11/15/23 | 2,150,000 | | 2,465,125 | |
| California Health Facilities Financing Authority Rev., (Cedars-Sinai Medical Center Obligated Group), 5.00%, 11/15/24 | 1,450,000 | | 1,725,645 | |
| California Health Facilities Financing Authority Rev., (Cedars-Sinai Medical Center Obligated Group), 5.00%, 11/15/26 | 3,000,000 | | 3,679,920 | |
| California Health Facilities Financing Authority Rev., (Cedars-Sinai Medical Center Obligated Group), 5.00%, 11/15/27 | 6,000,000 | | 7,335,540 | |
| California Health Facilities Financing Authority Rev., (Cedars-Sinai Medical Center Obligated Group), 5.00%, 11/15/31 | 2,700,000 | | 3,256,038 | |
| California Health Facilities Financing Authority Rev., (Cedars-Sinai Medical Center Obligated Group), 5.00%, 11/15/32 | 400,000 | | 481,224 | |
| California Health Facilities Financing Authority Rev., (Children's Hospital of Orange County Obligated Group), 5.00%, 11/1/30 (GA: Children's Healthcare of California) | 700,000 | | 928,837 | |
| California Health Facilities Financing Authority Rev., (Children's Hospital of Orange County Obligated Group), 5.00%, 11/1/31 (GA: Children's Healthcare of California) | 1,000,000 | | 1,318,550 | |
| California Health Facilities Financing Authority Rev., (Children's Hospital of Orange County Obligated Group), 5.00%, 11/1/32 (GA: Children's Healthcare of California) | 1,200,000 | | 1,577,136 | |
| California Health Facilities Financing Authority Rev., (Children's Hospital of Orange County Obligated Group), 5.00%, 11/1/33 (GA: Children's Healthcare of California) | 1,300,000 | | 1,693,575 | |
| California Health Facilities Financing Authority Rev., (El Camino Hospital), 5.00%, 2/1/24 | 1,200,000 | | 1,373,904 | |
| California Health Facilities Financing Authority Rev., (El Camino Hospital), 5.00%, 2/1/25 | 500,000 | | 593,830 | |
| California Health Facilities Financing Authority Rev., (Lucile Salter Packard Children's Hospital at Stanford Obligated Group), 5.00%, 8/15/25 | 5,855,000 | | 6,336,515 | |
| California Health Facilities Financing Authority Rev., (Providence St. Joseph Health Obligated Group), 5.00%, 7/1/37 | 1,070,000 | | 1,175,866 | |
| California Health Facilities Financing Authority Rev., (Providence St. Joseph Health Obligated Group), VRN, 2.00%, 10/1/36 | 3,500,000 | | 3,733,240 | |
California Health Facilities Financing Authority Rev., (Stanford Health Care Obligated Group), 5.00%, 11/15/20, Prerefunded at 100% of Par(2) | 2,000,000 | | 2,019,740 | |
| California Health Facilities Financing Authority Rev., (Stanford Health Care Obligated Group), 5.00%, 11/15/22 | 1,000,000 | | 1,102,910 | |
| California Health Facilities Financing Authority Rev., (Stanford Health Care Obligated Group), 5.00%, 11/15/25 | 2,500,000 | | 3,081,325 | |
| California Health Facilities Financing Authority Rev., (Sutter Health Obligated Group), 5.00%, 8/15/22 | 1,650,000 | | 1,722,583 | |
| California Health Facilities Financing Authority Rev., (Sutter Health Obligated Group), 5.25%, 8/15/22 | 2,295,000 | | 2,357,493 | |
| California Health Facilities Financing Authority Rev., (Sutter Health Obligated Group), 5.00%, 11/15/22 | 2,250,000 | | 2,468,452 | |
| California Health Facilities Financing Authority Rev., (Sutter Health Obligated Group), 5.00%, 11/15/26 | 1,500,000 | | 1,878,180 | |
| | | | | | | | |
| Principal Amount | Value |
| California Health Facilities Financing Authority Rev., (Sutter Health Obligated Group), 5.00%, 11/15/29 | $ | 2,000,000 | | $ | 2,403,940 | |
| California Health Facilities Financing Authority Rev., (Sutter Health Obligated Group), 5.00%, 11/15/30 | 1,750,000 | | 2,094,960 | |
| California Health Facilities Financing Authority Rev., (Sutter Health Obligated Group), 5.00%, 11/15/31 | 1,500,000 | | 1,792,065 | |
| California Health Facilities Financing Authority Rev., (Sutter Health Obligated Group), 5.00%, 11/15/32 | 2,000,000 | | 2,489,120 | |
| California Health Facilities Financing Authority Rev., (Sutter Health Obligated Group), 5.00%, 11/15/38 | 5,890,000 | | 7,185,859 | |
| California Housing Finance Rev., 4.00%, 3/20/33 | 21,284,971 | | 23,519,254 | |
| California Housing Finance Rev., 4.25%, 1/15/35 | 5,524,138 | | 6,228,300 | |
| California Infrastructure & Economic Development Bank Rev., (Academy of Motion Picture Arts and Sciences Obligated Group), 5.00%, 11/1/27 | 1,010,000 | | 1,144,330 | |
| California Infrastructure & Economic Development Bank Rev., (Academy of Motion Picture Arts and Sciences Obligated Group), 5.00%, 11/1/28 | 1,205,000 | | 1,363,241 | |
| California Infrastructure & Economic Development Bank Rev., (Academy of Motion Picture Arts and Sciences Obligated Group), 5.00%, 11/1/29 | 1,000,000 | | 1,130,310 | |
| California Infrastructure & Economic Development Bank Rev., (Academy of Motion Picture Arts and Sciences Obligated Group), 5.00%, 11/1/29 | 5,000,000 | | 6,690,450 | |
| California Infrastructure & Economic Development Bank Rev., (Academy of Motion Picture Arts and Sciences Obligated Group), 5.00%, 11/1/30 | 1,370,000 | | 1,546,223 | |
| California Infrastructure & Economic Development Bank Rev., (California Academy of Sciences), VRN, 0.50%, (70% of the 1-month LIBOR plus 0.38%), 8/1/47 | 9,000,000 | | 8,967,420 | |
| California Infrastructure & Economic Development Bank Rev., (California Science Center Foundation), 5.00%, 5/1/28 | 800,000 | | 960,584 | |
| California Infrastructure & Economic Development Bank Rev., (California Science Center Foundation), 5.00%, 5/1/29 | 1,250,000 | | 1,493,650 | |
| California Infrastructure & Economic Development Bank Rev., (California Science Center Foundation), 5.00%, 5/1/30 | 1,000,000 | | 1,189,350 | |
| California Infrastructure & Economic Development Bank Rev., (California Science Center Foundation), 5.00%, 5/1/31 | 800,000 | | 978,032 | |
| California Infrastructure & Economic Development Bank Rev., (California State Teachers' Retirement System), 5.00%, 8/1/34 | 650,000 | | 854,003 | |
| California Infrastructure & Economic Development Bank Rev., (California State Teachers' Retirement System), 5.00%, 8/1/35 | 1,000,000 | | 1,308,290 | |
| California Infrastructure & Economic Development Bank Rev., (California State Teachers' Retirement System), 5.00%, 8/1/36 | 2,250,000 | | 2,931,120 | |
| California Infrastructure & Economic Development Bank Rev., (California State Teachers' Retirement System), 5.00%, 8/1/37 | 1,100,000 | | 1,428,163 | |
| California Infrastructure & Economic Development Bank Rev., (California State Teachers' Retirement System), 5.00%, 8/1/38 | 1,175,000 | | 1,520,838 | |
| California Infrastructure & Economic Development Bank Rev., (California State Teachers' Retirement System), 5.00%, 8/1/39 | 1,200,000 | | 1,548,732 | |
| California Infrastructure & Economic Development Bank Rev., (Museum Associates), VRN, 0.76%, (70% of the 1-month LIBOR plus 0.65%), 12/1/50 | 5,000,000 | | 4,997,650 | |
| California Infrastructure & Economic Development Bank Rev., (Segerstrom Center for the Arts), 5.00%, 1/1/25 | 3,500,000 | | 3,879,575 | |
| California Infrastructure & Economic Development Bank Rev., (Segerstrom Center for the Arts), 5.00%, 1/1/28 | 1,105,000 | | 1,253,645 | |
California Municipal Finance Authority Rev., (Azusa Pacific University), 8.00%, 4/1/21, Prerefunded at 100% of Par(2)(3) | 665,000 | | 694,918 | |
| California Municipal Finance Authority Rev., (Azusa Pacific University), 5.00%, 4/1/27 | 1,165,000 | | 1,257,268 | |
| | | | | | | | |
| Principal Amount | Value |
| California Municipal Finance Authority Rev., (Azusa Pacific University), 5.00%, 4/1/41 | $ | 500,000 | | $ | 516,075 | |
California Municipal Finance Authority Rev., (California Baptist University), 5.00%, 11/1/36(3) | 1,000,000 | | 1,050,200 | |
| California Municipal Finance Authority Rev., (California Lutheran University), 5.00%, 10/1/27 | 300,000 | | 358,053 | |
| California Municipal Finance Authority Rev., (California Lutheran University), 5.00%, 10/1/28 | 150,000 | | 181,284 | |
| California Municipal Finance Authority Rev., (California Lutheran University), 5.00%, 10/1/29 | 225,000 | | 270,947 | |
| California Municipal Finance Authority Rev., (California Lutheran University), 5.00%, 10/1/30 | 225,000 | | 269,339 | |
| California Municipal Finance Authority Rev., (California Lutheran University), 5.00%, 10/1/31 | 200,000 | | 238,098 | |
| California Municipal Finance Authority Rev., (California Lutheran University), 5.00%, 10/1/32 | 225,000 | | 266,148 | |
| California Municipal Finance Authority Rev., (California Lutheran University), 5.00%, 10/1/33 | 225,000 | | 264,926 | |
| California Municipal Finance Authority Rev., (California Lutheran University), 5.00%, 10/1/34 | 250,000 | | 293,600 | |
| California Municipal Finance Authority Rev., (California Lutheran University), 5.00%, 10/1/35 | 225,000 | | 262,843 | |
| California Municipal Finance Authority Rev., (California Lutheran University), 5.00%, 10/1/36 | 250,000 | | 291,143 | |
| California Municipal Finance Authority Rev., (California Lutheran University), 5.00%, 10/1/37 | 275,000 | | 318,230 | |
| California Municipal Finance Authority Rev., (California Lutheran University), 5.00%, 10/1/38 | 300,000 | | 346,206 | |
| California Municipal Finance Authority Rev., (Capital Facilities Development Corp.), 5.00%, 6/1/36 | 5,650,000 | | 6,929,047 | |
| California Municipal Finance Authority Rev., (Capital Facilities Development Corp.), 5.00%, 6/1/38 | 4,015,000 | | 4,895,088 | |
| California Municipal Finance Authority Rev., (Channing House), 5.00%, 5/15/35 (California Mortgage Insurance) | 1,000,000 | | 1,194,910 | |
| California Municipal Finance Authority Rev., (Chevron Corp.), VRDN, 0.02%, 9/1/20 (GA: Chevron Corp.) | 500,000 | | 500,000 | |
| California Municipal Finance Authority Rev., (CHF-Davis I LLC), 5.00%, 5/15/32 (BAM-TCRS) | 3,000,000 | | 3,632,220 | |
| California Municipal Finance Authority Rev., (CHF-Davis I LLC), 5.00%, 5/15/37 | 8,000,000 | | 9,292,880 | |
| California Municipal Finance Authority Rev., (CHF-Riverside I LLC), 5.00%, 5/15/36 | 750,000 | | 875,040 | |
| California Municipal Finance Authority Rev., (CHF-Riverside I LLC), 5.00%, 5/15/37 | 1,755,000 | | 2,038,503 | |
| California Municipal Finance Authority Rev., (CHF-Riverside I LLC), 5.00%, 5/15/39 | 1,535,000 | | 1,774,890 | |
| California Municipal Finance Authority Rev., (CHF-Riverside I LLC), 5.00%, 5/15/40 | 1,520,000 | | 1,753,274 | |
| California Municipal Finance Authority Rev., (Claremont Graduate University), 5.00%, 10/1/34 | 435,000 | | 491,193 | |
| California Municipal Finance Authority Rev., (Claremont Graduate University), 5.00%, 10/1/39 | 1,130,000 | | 1,244,639 | |
| California Municipal Finance Authority Rev., (Clinicas del Camino Real Incorporated), 4.00%, 3/1/30 | 785,000 | | 920,829 | |
| California Municipal Finance Authority Rev., (Clinicas del Camino Real Incorporated), 4.00%, 3/1/31 | 1,635,000 | | 1,888,245 | |
| California Municipal Finance Authority Rev., (Clinicas del Camino Real Incorporated), 4.00%, 3/1/32 | 1,700,000 | | 1,946,347 | |
| California Municipal Finance Authority Rev., (Clinicas del Camino Real Incorporated), 4.00%, 3/1/34 | 1,240,000 | | 1,399,687 | |
| | | | | | | | |
| Principal Amount | Value |
| California Municipal Finance Authority Rev., (Clinicas del Camino Real Incorporated), 4.00%, 3/1/35 | $ | 500,000 | | $ | 561,355 | |
| California Municipal Finance Authority Rev., (Community Hospitals of Central California Obligated Group), 5.00%, 2/1/22 | 1,000,000 | | 1,059,650 | |
| California Municipal Finance Authority Rev., (Community Hospitals of Central California Obligated Group), 5.00%, 2/1/23 | 520,000 | | 572,562 | |
| California Municipal Finance Authority Rev., (Community Hospitals of Central California Obligated Group), 5.00%, 2/1/25 | 1,925,000 | | 2,256,908 | |
| California Municipal Finance Authority Rev., (Community Hospitals of Central California Obligated Group), 5.00%, 2/1/26 | 1,000,000 | | 1,201,640 | |
| California Municipal Finance Authority Rev., (Community Hospitals of Central California Obligated Group), 5.00%, 2/1/27 | 545,000 | | 632,227 | |
| California Municipal Finance Authority Rev., (Community Hospitals of Central California Obligated Group), 5.00%, 2/1/28 | 735,000 | | 847,720 | |
| California Municipal Finance Authority Rev., (Community Hospitals of Central California Obligated Group), 5.00%, 2/1/28 | 1,075,000 | | 1,311,274 | |
| California Municipal Finance Authority Rev., (Community Hospitals of Central California Obligated Group), 5.00%, 2/1/29 | 1,000,000 | | 1,147,590 | |
| California Municipal Finance Authority Rev., (Community Hospitals of Central California Obligated Group), 5.00%, 2/1/29 | 4,130,000 | | 4,996,928 | |
| California Municipal Finance Authority Rev., (Community Hospitals of Central California Obligated Group), 5.00%, 2/1/30 | 2,680,000 | | 3,218,117 | |
| California Municipal Finance Authority Rev., (Community Hospitals of Central California Obligated Group), 5.00%, 2/1/32 | 1,100,000 | | 1,308,252 | |
| California Municipal Finance Authority Rev., (Community Hospitals of Central California Obligated Group), 5.00%, 2/1/33 | 3,940,000 | | 4,663,502 | |
| California Municipal Finance Authority Rev., (Community Hospitals of Central California Obligated Group), 5.00%, 2/1/40 | 1,420,000 | | 1,584,947 | |
| California Municipal Finance Authority Rev., (Congregational Home Obligated Group), 4.00%, 11/15/21 | 270,000 | | 274,666 | |
| California Municipal Finance Authority Rev., (Congregational Home Obligated Group), 4.00%, 11/15/22 | 280,000 | | 288,330 | |
| California Municipal Finance Authority Rev., (Congregational Home Obligated Group), 4.00%, 11/15/24 | 605,000 | | 635,292 | |
| California Municipal Finance Authority Rev., (Congregational Home Obligated Group), 4.00%, 11/15/27 | 300,000 | | 319,893 | |
| California Municipal Finance Authority Rev., (Congregational Home Obligated Group), 4.00%, 11/15/29 | 740,000 | | 791,719 | |
| California Municipal Finance Authority Rev., (Eisenhower Medical Center), 5.00%, 7/1/24 | 2,045,000 | | 2,338,417 | |
| California Municipal Finance Authority Rev., (Eisenhower Medical Center), 5.00%, 7/1/26 | 2,260,000 | | 2,706,621 | |
| California Municipal Finance Authority Rev., (Eisenhower Medical Center), 5.00%, 7/1/29 | 2,100,000 | | 2,526,531 | |
| California Municipal Finance Authority Rev., (Eisenhower Medical Center), 5.00%, 7/1/30 | 1,000,000 | | 1,198,330 | |
| California Municipal Finance Authority Rev., (Eisenhower Medical Center), 5.00%, 7/1/31 | 1,000,000 | | 1,192,610 | |
| California Municipal Finance Authority Rev., (Eisenhower Medical Center), 5.00%, 7/1/31 | 1,335,000 | | 1,592,134 | |
| California Municipal Finance Authority Rev., (Eisenhower Medical Center), 5.00%, 7/1/34 | 1,500,000 | | 1,757,445 | |
California Municipal Finance Authority Rev., (Emerson College), 5.75%, 1/1/22, Prerefunded at 100% of Par(2) | 2,250,000 | | 2,409,885 | |
California Municipal Finance Authority Rev., (Emerson College), 6.00%, 1/1/22, Prerefunded at 100% of Par(2) | 3,000,000 | | 3,221,430 | |
| California Municipal Finance Authority Rev., (Emerson College), 5.00%, 1/1/29 | 1,350,000 | | 1,625,629 | |
| California Municipal Finance Authority Rev., (Emerson College), 5.00%, 1/1/31 | 1,480,000 | | 1,754,466 | |
| | | | | | | | |
| Principal Amount | Value |
| California Municipal Finance Authority Rev., (Emerson College), 5.00%, 1/1/33 | $ | 1,040,000 | | $ | 1,215,781 | |
| California Municipal Finance Authority Rev., (Emerson College), 5.00%, 1/1/34 | 1,000,000 | | 1,163,240 | |
| California Municipal Finance Authority Rev., (Emerson College), 5.00%, 1/1/35 | 1,065,000 | | 1,234,708 | |
| California Municipal Finance Authority Rev., (Emerson College), 5.00%, 1/1/36 | 720,000 | | 833,278 | |
| California Municipal Finance Authority Rev., (Emerson College), 5.00%, 1/1/37 | 1,000,000 | | 1,154,270 | |
| California Municipal Finance Authority Rev., (HumanGood California Obligated Group), 4.00%, 10/1/36 | 1,750,000 | | 1,929,392 | |
| California Municipal Finance Authority Rev., (HumanGood California Obligated Group), 4.00%, 10/1/37 | 2,840,000 | | 3,126,016 | |
| California Municipal Finance Authority Rev., (HumanGood California Obligated Group), 4.00%, 10/1/38 | 2,750,000 | | 3,020,380 | |
| California Municipal Finance Authority Rev., (HumanGood California Obligated Group), 4.00%, 10/1/39 | 1,750,000 | | 1,916,845 | |
| California Municipal Finance Authority Rev., (Northbay Healthcare Group Obligated Group), 3.00%, 11/1/20 | 1,000,000 | | 1,002,580 | |
| California Municipal Finance Authority Rev., (Northbay Healthcare Group Obligated Group), 3.00%, 11/1/21 | 1,680,000 | | 1,705,973 | |
| California Municipal Finance Authority Rev., (Northbay Healthcare Group Obligated Group), 4.00%, 11/1/22 | 1,000,000 | | 1,048,480 | |
| California Municipal Finance Authority Rev., (Northbay Healthcare Group Obligated Group), 5.25%, 11/1/36 | 1,500,000 | | 1,696,590 | |
| California Municipal Finance Authority Rev., (Northern California Retired Officers Community), 2.00%, 7/1/24 (California Mortgage Insurance) | 4,000,000 | | 4,016,320 | |
| California Municipal Finance Authority Rev., (Orange County), 5.00%, 6/1/37 | 2,990,000 | | 3,574,934 | |
| California Municipal Finance Authority Rev., (Touro College and University System Obligated Group), 5.25%, 1/1/34 | 300,000 | | 321,405 | |
| California Municipal Finance Authority Rev., (Touro College and University System Obligated Group), 5.25%, 1/1/40 | 1,000,000 | | 1,061,300 | |
| California Municipal Finance Authority Rev., (University of La Verne), 5.00%, 6/1/25 | 700,000 | | 825,097 | |
| California Municipal Finance Authority Rev., (University of La Verne), 5.00%, 6/1/26 | 1,000,000 | | 1,207,840 | |
| California Municipal Finance Authority Rev., (University of La Verne), 5.00%, 6/1/28 | 1,000,000 | | 1,228,180 | |
| California Municipal Finance Authority Rev., (University of San Diego), 5.00%, 10/1/33 | 135,000 | | 173,975 | |
| California Municipal Finance Authority Rev., (University of San Diego), 5.00%, 10/1/34 | 175,000 | | 224,870 | |
| California Municipal Finance Authority Rev., (University of San Diego), 5.00%, 10/1/35 | 400,000 | | 511,724 | |
| California Municipal Finance Authority Rev., (University of San Diego), 5.00%, 10/1/36 | 1,000,000 | | 1,273,920 | |
| California Municipal Finance Authority Rev., (University of San Diego), 5.00%, 10/1/38 | 1,375,000 | | 1,740,475 | |
| California Municipal Finance Authority Rev., (University of San Diego), 5.00%, 10/1/39 | 840,000 | | 1,060,214 | |
| California Municipal Finance Authority Rev., (William Jessup University), 5.00%, 8/1/21 | 790,000 | | 803,185 | |
| California Municipal Finance Authority Rev., (William Jessup University), 5.00%, 8/1/23 | 765,000 | | 801,697 | |
| California Municipal Finance Authority Rev., (William Jessup University), 5.00%, 8/1/25 | 1,455,000 | | 1,558,814 | |
| California Municipal Finance Authority Rev., (William Jessup University), 5.00%, 8/1/26 | 1,530,000 | | 1,649,906 | |
| | | | | | | | |
| Principal Amount | Value |
| California Municipal Finance Authority Rev., (William Jessup University), 5.00%, 8/1/29 | $ | 1,000,000 | | $ | 1,086,040 | |
| California Municipal Finance Authority Rev., (William Jessup University), 5.00%, 8/1/39 | 2,000,000 | | 2,080,700 | |
California Pollution Control Financing Authority Rev., (San Diego County Water Authority), 5.00%, 7/1/39(3) | 4,000,000 | | 4,659,360 | |
| California Public Finance Authority Rev., (Henry Mayo Newhall Memorial Hospital), 5.00%, 10/15/33 | 500,000 | | 566,360 | |
| California Public Finance Authority Rev., (Henry Mayo Newhall Memorial Hospital), 5.00%, 10/15/37 | 1,000,000 | | 1,120,940 | |
| California School Finance Authority Rev., (Alliance for College Ready Public Schools Obligated Group), 5.00%, 7/1/46 | 7,000,000 | | 7,814,240 | |
California School Finance Authority Rev., (Aspire Public Schools Obligated Group), 5.00%, 8/1/46(3) | 1,200,000 | | 1,333,344 | |
California School Finance Authority Rev., (Fenton Charter Public Schools), 4.00%, 7/1/30(3) | 600,000 | | 629,970 | |
California School Finance Authority Rev., (Fenton Charter Public Schools), 5.00%, 7/1/40(3) | 960,000 | | 1,029,878 | |
California School Finance Authority Rev., (Green Dot Public Schools Obligated Group), 5.00%, 8/1/21(3) | 100,000 | | 102,988 | |
California School Finance Authority Rev., (Green Dot Public Schools Obligated Group), 5.00%, 8/1/22(3) | 165,000 | | 175,628 | |
California School Finance Authority Rev., (Green Dot Public Schools Obligated Group), 5.00%, 8/1/23(3) | 175,000 | | 192,918 | |
California School Finance Authority Rev., (Green Dot Public Schools Obligated Group), 5.00%, 8/1/24(3) | 160,000 | | 181,456 | |
California School Finance Authority Rev., (Green Dot Public Schools Obligated Group), 5.00%, 8/1/25(3) | 150,000 | | 174,498 | |
California School Finance Authority Rev., (Green Dot Public Schools Obligated Group), 5.00%, 8/1/26(3) | 150,000 | | 177,891 | |
California School Finance Authority Rev., (Green Dot Public Schools Obligated Group), 5.00%, 8/1/27(3) | 160,000 | | 193,099 | |
California School Finance Authority Rev., (Green Dot Public Schools Obligated Group), 5.00%, 8/1/28(3) | 190,000 | | 232,518 | |
California School Finance Authority Rev., (Rocketship Education Obligated Group), 5.00%, 6/1/26(3) | 500,000 | | 536,435 | |
California School Finance Authority Rev., (Rocketship Education Obligated Group), 4.50%, 6/1/27(3) | 380,000 | | 402,861 | |
California School Finance Authority Rev., (Rocketship Education Obligated Group), 5.00%, 6/1/34(3) | 670,000 | | 714,682 | |
California School Finance Authority Rev., (Rocketship Education Obligated Group), 5.125%, 6/1/47(3) | 635,000 | | 666,991 | |
California School Finance Authority Rev., (Summit Public Schools Obligated Group), 5.00%, 6/1/37(3) | 500,000 | | 569,925 | |
California School Finance Authority Rev., (TEACH, Inc. Obligated Group), 5.00%, 6/1/29(3) | 290,000 | | 316,396 | |
California School Finance Authority Rev., (TEACH, Inc. Obligated Group), 5.00%, 6/1/39(3) | 740,000 | | 782,676 | |
| California State Financial Authority Rev., (Master's University & Seminary), 5.00%, 8/1/24 | 705,000 | | 755,069 | |
| California State Financial Authority Rev., (Master's University & Seminary), 5.00%, 8/1/25 | 745,000 | | 806,567 | |
| California State Financial Authority Rev., (Master's University & Seminary), 5.00%, 8/1/26 | 780,000 | | 851,128 | |
| California State Financial Authority Rev., (Master's University & Seminary), 5.00%, 8/1/27 | 820,000 | | 898,622 | |
| California State Financial Authority Rev., (Master's University & Seminary), 5.00%, 8/1/28 | 865,000 | | 954,614 | |
| California State Financial Authority Rev., (Master's University & Seminary), 5.00%, 8/1/29 | 905,000 | | 1,003,763 | |
| California State Public Works Board Rev., 5.00%, 4/1/21 | 3,000,000 | | 3,084,030 | |
| | | | | | | | |
| Principal Amount | Value |
California State Public Works Board Rev., 5.00%, 9/1/22, Prerefunded at 100% of Par(2) | $ | 1,000,000 | | $ | 1,096,680 | |
| California State Public Works Board Rev., 5.00%, 4/1/23 | 2,000,000 | | 2,153,500 | |
| California State Public Works Board Rev., 5.25%, 12/1/26 | 3,000,000 | | 3,181,860 | |
California State Public Works Board Rev., (California State University), 5.00%, 9/1/23, Prerefunded at 100% of Par(2) | 1,865,000 | | 2,133,579 | |
| California State Public Works Board Rev., (State of California Department of Corrections & Rehabilitation), 5.00%, 9/1/25 | 5,000,000 | | 5,925,500 | |
| California State Public Works Board Rev., (State of California Department of Corrections & Rehabilitation), 5.00%, 11/1/29 | 5,000,000 | | 6,808,750 | |
| California State Public Works Board Rev., (State of California Department of Corrections & Rehabilitation), 5.00%, 11/1/30 | 2,500,000 | | 3,376,475 | |
| California State Public Works Board Rev., (State of California Department of General Services), 5.00%, 5/1/27 | 5,000,000 | | 6,036,750 | |
| California State University Rev., 5.00%, 11/1/20 | 1,250,000 | | 1,260,113 | |
| California State University Rev., 5.00%, 11/1/21 | 1,000,000 | | 1,057,350 | |
| California State University Rev., 5.00%, 11/1/24 | 3,700,000 | | 3,910,752 | |
| California State University Rev., 5.00%, 11/1/28 | 500,000 | | 672,255 | |
| California State University Rev., 5.00%, 11/1/28 | 2,000,000 | | 2,566,680 | |
| California State University Rev., 5.00%, 11/1/29 | 500,000 | | 687,210 | |
| California State University Rev., 5.00%, 11/1/29 | 1,000,000 | | 1,277,090 | |
| California State University Rev., 5.00%, 11/1/30 | 600,000 | | 819,780 | |
| California State University Rev., 5.00%, 11/1/30 | 3,000,000 | | 3,811,860 | |
| California State University Rev., 5.00%, 11/1/31 | 390,000 | | 529,484 | |
| California State University Rev., 5.00%, 11/1/31 | 2,900,000 | | 3,667,108 | |
| California State University Rev., 5.00%, 11/1/32 | 1,750,000 | | 2,067,940 | |
| California State University Rev., 4.00%, 11/1/34 | 10,000,000 | | 11,464,700 | |
| California State University Rev., 5.00%, 11/1/36 | 5,105,000 | | 6,267,511 | |
| California State University Rev., 4.00%, 11/1/38 | 2,865,000 | | 3,244,956 | |
| California State University Rev., VRN, 4.00%, 11/1/51 | 4,000,000 | | 4,361,840 | |
| California Statewide Communities Development Authority COP, (Salinas), 5.00%, 12/1/31 (AGM) | 1,155,000 | | 1,485,134 | |
| California Statewide Communities Development Authority COP, (Salinas), 5.00%, 12/1/34 (AGM) | 1,340,000 | | 1,703,328 | |
| California Statewide Communities Development Authority COP, (Salinas), 5.00%, 12/1/38 (AGM) | 1,000,000 | | 1,256,550 | |
| California Statewide Communities Development Authority Rev., (Adventist Health System / West Obligated Group), 5.00%, 3/1/23 | 1,190,000 | | 1,323,744 | |
| California Statewide Communities Development Authority Rev., (Adventist Health System / West Obligated Group), 5.00%, 3/1/24 | 800,000 | | 923,168 | |
| California Statewide Communities Development Authority Rev., (Adventist Health System / West Obligated Group), 5.00%, 3/1/25 | 750,000 | | 894,233 | |
| California Statewide Communities Development Authority Rev., (Adventist Health System / West Obligated Group), 5.00%, 3/1/26 | 1,000,000 | | 1,227,940 | |
| California Statewide Communities Development Authority Rev., (Adventist Health System / West Obligated Group), 5.00%, 3/1/27 | 1,590,000 | | 1,947,718 | |
| California Statewide Communities Development Authority Rev., (Adventist Health System / West Obligated Group), 5.00%, 3/1/31 | 740,000 | | 927,464 | |
| California Statewide Communities Development Authority Rev., (Adventist Health System / West Obligated Group), 5.00%, 3/1/32 | 900,000 | | 1,121,625 | |
| California Statewide Communities Development Authority Rev., (Adventist Health System / West Obligated Group), 5.00%, 3/1/33 | 1,250,000 | | 1,549,437 | |
| California Statewide Communities Development Authority Rev., (Adventist Health System / West Obligated Group), 5.00%, 3/1/34 | 1,000,000 | | 1,235,300 | |
| California Statewide Communities Development Authority Rev., (Adventist Health System / West Obligated Group), 5.00%, 3/1/35 | 1,475,000 | | 1,816,521 | |
| California Statewide Communities Development Authority Rev., (Adventist Health System / West Obligated Group), 5.00%, 3/1/35 | 715,000 | | 850,407 | |
| | | | | | | | |
| Principal Amount | Value |
| California Statewide Communities Development Authority Rev., (Adventist Health System / West Obligated Group), VRN, 5.00%, 3/1/37 | $ | 5,145,000 | | $ | 6,255,034 | |
| California Statewide Communities Development Authority Rev., (Chevron USA, Inc.), VRDN, 0.02%, 9/1/20 (GA: Chevron Corp.) | 500,000 | | 500,000 | |
| California Statewide Communities Development Authority Rev., (CHF-Irvine LLC), 5.00%, 5/15/22 | 2,000,000 | | 2,108,880 | |
| California Statewide Communities Development Authority Rev., (CHF-Irvine LLC), 5.00%, 5/15/23 | 1,000,000 | | 1,083,750 | |
| California Statewide Communities Development Authority Rev., (CHF-Irvine LLC), 5.00%, 5/15/24 | 1,000,000 | | 1,110,310 | |
| California Statewide Communities Development Authority Rev., (CHF-Irvine LLC), 5.00%, 5/15/25 | 1,925,000 | | 2,184,779 | |
| California Statewide Communities Development Authority Rev., (CHF-Irvine LLC), 5.00%, 5/15/28 | 2,050,000 | | 2,344,175 | |
| California Statewide Communities Development Authority Rev., (CHF-Irvine LLC), 5.00%, 5/15/29 | 1,000,000 | | 1,162,070 | |
| California Statewide Communities Development Authority Rev., (CHF-Irvine LLC), 5.00%, 5/15/29 | 1,250,000 | | 1,424,350 | |
| California Statewide Communities Development Authority Rev., (CHF-Irvine LLC), 5.00%, 5/15/30 | 1,940,000 | | 2,201,725 | |
| California Statewide Communities Development Authority Rev., (CHF-Irvine LLC), 5.00%, 5/15/34 | 2,220,000 | | 2,517,946 | |
| California Statewide Communities Development Authority Rev., (Collis P and Howard Huntington Memorial Hospital Obligated Group), 5.00%, 7/1/21 | 1,000,000 | | 1,035,200 | |
| California Statewide Communities Development Authority Rev., (Collis P and Howard Huntington Memorial Hospital Obligated Group), 5.00%, 7/1/22 | 475,000 | | 511,627 | |
| California Statewide Communities Development Authority Rev., (Collis P and Howard Huntington Memorial Hospital Obligated Group), 5.00%, 7/1/22 | 300,000 | | 323,133 | |
| California Statewide Communities Development Authority Rev., (Collis P and Howard Huntington Memorial Hospital Obligated Group), 5.00%, 7/1/23 | 600,000 | | 668,976 | |
| California Statewide Communities Development Authority Rev., (Collis P and Howard Huntington Memorial Hospital Obligated Group), 5.00%, 7/1/23 | 300,000 | | 334,488 | |
| California Statewide Communities Development Authority Rev., (Collis P and Howard Huntington Memorial Hospital Obligated Group), 5.00%, 7/1/24 | 750,000 | | 865,230 | |
| California Statewide Communities Development Authority Rev., (Collis P and Howard Huntington Memorial Hospital Obligated Group), 5.00%, 7/1/25 | 800,000 | | 922,248 | |
| California Statewide Communities Development Authority Rev., (Collis P and Howard Huntington Memorial Hospital Obligated Group), 5.00%, 7/1/25 | 300,000 | | 356,763 | |
| California Statewide Communities Development Authority Rev., (Collis P and Howard Huntington Memorial Hospital Obligated Group), 5.00%, 7/1/26 | 325,000 | | 396,338 | |
| California Statewide Communities Development Authority Rev., (Collis P and Howard Huntington Memorial Hospital Obligated Group), 5.00%, 7/1/27 | 1,880,000 | | 2,154,518 | |
California Statewide Communities Development Authority Rev., (Cottage Health System Obligated Group), 5.25%, 11/1/20, Prerefunded at 100% of Par(2) | 1,000,000 | | 1,008,390 | |
| California Statewide Communities Development Authority Rev., (Emanate Health Obligated Group), 4.00%, 4/1/36 | 675,000 | | 790,864 | |
| California Statewide Communities Development Authority Rev., (Emanate Health Obligated Group), 4.00%, 4/1/37 | 700,000 | | 816,879 | |
| California Statewide Communities Development Authority Rev., (Emanate Health Obligated Group), 4.00%, 4/1/38 | 1,350,000 | | 1,570,023 | |
| | | | | | | | |
| Principal Amount | Value |
| California Statewide Communities Development Authority Rev., (Emanate Health Obligated Group), 4.00%, 4/1/40 | $ | 650,000 | | $ | 750,679 | |
| California Statewide Communities Development Authority Rev., (Front Porch Communities & Services), 5.00%, 4/1/24 | 210,000 | | 239,060 | |
| California Statewide Communities Development Authority Rev., (Front Porch Communities & Services), 5.00%, 4/1/25 | 275,000 | | 321,970 | |
| California Statewide Communities Development Authority Rev., (Front Porch Communities & Services), 5.00%, 4/1/30 | 145,000 | | 172,692 | |
| California Statewide Communities Development Authority Rev., (Front Porch Communities & Services), 5.00%, 4/1/31 | 125,000 | | 147,744 | |
| California Statewide Communities Development Authority Rev., (Front Porch Communities & Services), 4.00%, 4/1/32 | 185,000 | | 203,848 | |
| California Statewide Communities Development Authority Rev., (Hebrew Home for Aged Disabled), 3.50%, 11/1/21 (California Mortgage Insurance) | 795,000 | | 822,261 | |
| California Statewide Communities Development Authority Rev., (HumanGood California Obligated Group), 5.00%, 10/1/22 | 1,065,000 | | 1,137,420 | |
| California Statewide Communities Development Authority Rev., (Kaiser Foundation Hospitals), 5.00%, 4/1/42 | 8,400,000 | | 8,847,132 | |
| California Statewide Communities Development Authority Rev., (Kaiser Foundation Hospitals), VRN, 5.00%, 4/1/38 | 10,000,000 | | 13,378,400 | |
| California Statewide Communities Development Authority Rev., (Kaiser Foundation Hospitals), VRN, 5.00%, 4/1/45 | 5,975,000 | | 7,993,594 | |
California Statewide Communities Development Authority Rev., (Lancer Educational Housing LLC), 4.00%, 6/1/21(3) | 1,840,000 | | 1,847,047 | |
California Statewide Communities Development Authority Rev., (Lancer Educational Housing LLC), 4.00%, 6/1/26(3) | 3,000,000 | | 3,025,320 | |
California Statewide Communities Development Authority Rev., (Lancer Educational Housing LLC), 5.00%, 6/1/34(3) | 375,000 | | 393,668 | |
California Statewide Communities Development Authority Rev., (Lancer Educational Housing LLC), 5.00%, 6/1/39(3) | 475,000 | | 490,941 | |
California Statewide Communities Development Authority Rev., (Loma Linda University Medical Center Obligated Group), 5.00%, 12/1/26(3) | 5,000,000 | | 5,683,500 | |
California Statewide Communities Development Authority Rev., (Loma Linda University Medical Center Obligated Group), 5.00%, 12/1/33(3) | 1,000,000 | | 1,100,870 | |
California Statewide Communities Development Authority Rev., (Loma Linda University Medical Center Obligated Group), 5.00%, 12/1/36(3) | 6,500,000 | | 7,161,505 | |
| California Statewide Communities Development Authority Rev., (Loma Linda University Medical Center Obligated Group), 5.25%, 12/1/44 | 1,085,000 | | 1,167,026 | |
| California Statewide Communities Development Authority Rev., (Marin General Hospital Obligated Group), 5.00%, 8/1/30 | 500,000 | | 622,425 | |
| California Statewide Communities Development Authority Rev., (Marin General Hospital Obligated Group), 5.00%, 8/1/32 | 675,000 | | 828,293 | |
| California Statewide Communities Development Authority Rev., (Marin General Hospital Obligated Group), 5.00%, 8/1/33 | 450,000 | | 549,644 | |
| California Statewide Communities Development Authority Rev., (Marin General Hospital Obligated Group), 5.00%, 8/1/34 | 625,000 | | 761,500 | |
| California Statewide Communities Development Authority Rev., (Marin General Hospital Obligated Group), 5.00%, 8/1/35 | 725,000 | | 880,165 | |
| California Statewide Communities Development Authority Rev., (Marin General Hospital Obligated Group), 5.00%, 8/1/36 | 700,000 | | 846,748 | |
| California Statewide Communities Development Authority Rev., (Marin General Hospital Obligated Group), 5.00%, 8/1/37 | 500,000 | | 603,090 | |
| California Statewide Communities Development Authority Rev., (Marin General Hospital Obligated Group), 5.00%, 8/1/38 | 500,000 | | 601,515 | |
| California Statewide Communities Development Authority Rev., (Methodist Hospital of Southern California Obligated Group), 5.00%, 1/1/33 | 2,000,000 | | 2,403,380 | |
| | | | | | | | |
| Principal Amount | Value |
| California Statewide Communities Development Authority Rev., (Methodist Hospital of Southern California Obligated Group), 5.00%, 1/1/35 | $ | 5,175,000 | | $ | 6,163,218 | |
| California Statewide Communities Development Authority Rev., (Methodist Hospital of Southern California Obligated Group), 5.00%, 1/1/36 | 4,560,000 | | 5,411,078 | |
| California Statewide Communities Development Authority Rev., (Methodist Hospital of Southern California Obligated Group), 5.00%, 1/1/38 | 3,825,000 | | 4,511,817 | |
| California Statewide Communities Development Authority Rev., (Redlands Community Hospital), 5.00%, 10/1/28 | 1,000,000 | | 1,211,620 | |
| California Statewide Communities Development Authority Rev., (Redlands Community Hospital), 5.00%, 10/1/29 | 600,000 | | 723,744 | |
| California Statewide Communities Development Authority Rev., (Redlands Community Hospital), 5.00%, 10/1/31 | 870,000 | | 1,035,561 | |
| California Statewide Communities Development Authority Rev., (Southern California Edison Co.), VRN, 2.625%, 11/1/33 | 4,750,000 | | 4,999,375 | |
| California Statewide Communities Development Authority Rev., (Viamonte Senior Living 1, Inc.), 3.00%, 7/1/26 (California Mortgage Insurance) | 2,750,000 | | 2,771,532 | |
| California Statewide Communities Development Authority Rev., (Viamonte Senior Living 1, Inc.), 3.00%, 7/1/27 (California Mortgage Insurance) | 1,500,000 | | 1,511,280 | |
| California Statewide Communities Development Authority Special Tax, 4.25%, 9/1/21 | 905,000 | | 931,091 | |
| California Statewide Communities Development Authority Special Tax, 5.00%, 9/1/27 | 785,000 | | 882,089 | |
| California Statewide Communities Development Authority Special Tax, 5.00%, 9/1/37 | 2,225,000 | | 2,552,676 | |
| California Statewide Communities Development Authority Special Tax, (California Statewide Communities Development Authority Cmnty Facs Dist No. 2018-), 4.00%, 9/1/40 | 580,000 | | 609,638 | |
| Carson Public Financing Authority Rev., (Carson Reassessment District No. 2001-1), 5.00%, 9/2/24 | 1,400,000 | | 1,612,800 | |
| Carson Public Financing Authority Rev., (Carson Reassessment District No. 2001-1), 5.00%, 9/2/31 | 1,000,000 | | 1,278,370 | |
| Carson Redevelopment Agency Successor Agency Tax Allocation, 5.00%, 10/1/20 (AGM) | 785,000 | | 787,952 | |
| Cathedral City Redevelopment Agency Successor Agency Tax Allocation, 5.00%, 8/1/28 (AGM) | 1,190,000 | | 1,376,901 | |
Chaffey Joint Union High School District GO, 5.00%, 8/1/23, Prerefunded at 100% of Par(2) | 3,125,000 | | 3,563,531 | |
Chaffey Joint Union High School District GO, 5.00%, 8/1/23, Prerefunded at 100% of Par(2) | 1,220,000 | | 1,391,203 | |
| Chino Basin Regional Financing Authority Rev., (Inland Empire Utilities Agency), 4.00%, 11/1/25 | 3,000,000 | | 3,553,140 | |
| Chino Community Facilities District Special Tax, (Chino Community Facilities District No. 2003-3), 4.00%, 9/1/40 | 700,000 | | 764,309 | |
| Chino Hills Financing Authority Special Tax, 3.00%, 9/1/20 | 640,000 | | 640,000 | |
| Chino Hills Financing Authority Special Tax, 4.00%, 9/1/21 | 500,000 | | 518,765 | |
| Chino Hills Financing Authority Special Tax, 4.00%, 9/1/22 | 500,000 | | 533,905 | |
| Chino Hills Financing Authority Special Tax, 4.00%, 9/1/23 | 500,000 | | 549,105 | |
| City & County of San Francisco GO, 5.00%, 6/15/25 | 1,880,000 | | 2,131,864 | |
Clovis Unified School District GO, Capital Appreciation, 0.00%, 8/1/24 (NATL)(1) | 5,935,000 | | 5,790,245 | |
| Commerce Community Development Commission Successor Agency Tax Allocation, 5.00%, 8/1/21 | 500,000 | | 521,380 | |
| Commerce Community Development Commission Successor Agency Tax Allocation, 5.00%, 8/1/22 | 350,000 | | 377,584 | |
| Commerce Community Development Commission Successor Agency Tax Allocation, 5.00%, 8/1/23 (AGM) | 600,000 | | 679,290 | |
| | | | | | | | |
| Principal Amount | Value |
| Compton Unified School District COP, 4.00%, 6/1/34 (BAM) | $ | 575,000 | | $ | 664,131 | |
| Compton Unified School District COP, 4.00%, 6/1/36 (BAM) | 730,000 | | 836,602 | |
| Compton Unified School District COP, 4.00%, 6/1/38 (BAM) | 1,025,000 | | 1,167,045 | |
| Contra Costa Transportation Authority Rev., 5.00%, 3/1/29 | 1,000,000 | | 1,258,470 | |
| Contra Costa Transportation Authority Rev., 5.00%, 3/1/30 | 1,250,000 | | 1,565,437 | |
| Contra Costa Transportation Authority Rev., 5.00%, 3/1/31 | 1,000,000 | | 1,246,370 | |
| Davis Redevelopment Successor Agency Tax Allocation, 5.00%, 9/1/32 | 1,000,000 | | 1,277,930 | |
| Del Mar Race Track Authority Rev., 4.00%, 10/1/20 | 1,330,000 | | 1,328,963 | |
| Del Mar Race Track Authority Rev., 5.00%, 10/1/35 | 660,000 | | 643,599 | |
| Del Mar Union School District Special Tax, (Del Mar Union School District Community Facilities District No. 99-1), 4.00%, 9/1/30 | 225,000 | | 262,582 | |
| Del Mar Union School District Special Tax, (Del Mar Union School District Community Facilities District No. 99-1), 4.00%, 9/1/31 | 250,000 | | 287,983 | |
| Del Mar Union School District Special Tax, (Del Mar Union School District Community Facilities District No. 99-1), 4.00%, 9/1/32 | 275,000 | | 313,723 | |
| Del Mar Union School District Special Tax, (Del Mar Union School District Community Facilities District No. 99-1), 4.00%, 9/1/33 | 265,000 | | 300,682 | |
| Del Mar Union School District Special Tax, (Del Mar Union School District Community Facilities District No. 99-1), 4.00%, 9/1/34 | 300,000 | | 338,670 | |
| Del Mar Union School District Special Tax, (Del Mar Union School District Community Facilities District No. 99-1), 4.00%, 9/1/35 | 500,000 | | 559,795 | |
| Del Mar Union School District Special Tax, (Del Mar Union School District Community Facilities District No. 99-1), 4.00%, 9/1/37 | 1,350,000 | | 1,491,871 | |
| Del Mar Union School District Special Tax, (Del Mar Union School District Community Facilities District No. 99-1), 4.00%, 9/1/39 | 1,290,000 | | 1,418,058 | |
| Desert Sands Unified School District GO, 5.00%, 8/1/39 | 1,750,000 | | 2,186,782 | |
| East Bay Municipal Utility District Water System Rev., 5.00%, 6/1/32 | 1,000,000 | | 1,351,380 | |
| East Bay Municipal Utility District Water System Rev., 5.00%, 6/1/34 | 1,000,000 | | 1,339,210 | |
| East Side Union High School District GO, 5.00%, 8/1/21 (BAM) | 1,600,000 | | 1,669,632 | |
| East Side Union High School District GO, 5.00%, 8/1/25 (BAM) | 1,000,000 | | 1,235,350 | |
| East Side Union High School District GO, 5.00%, 8/1/25 | 1,405,000 | | 1,525,802 | |
| East Side Union High School District GO, 5.00%, 8/1/26 (BAM) | 1,080,000 | | 1,376,341 | |
| East Side Union High School District GO, 5.00%, 8/1/27 (BAM) | 1,150,000 | | 1,510,030 | |
| Elk Grove Finance Authority Special Tax, 5.00%, 9/1/30 | 1,200,000 | | 1,403,580 | |
| Folsom Ranch Financing Authority Special Tax, (Folsom Community Facilities District No. 19), 5.00%, 9/1/39 | 875,000 | | 1,004,544 | |
| Fontana Special Tax, (Fontana Community Facilities District No. 22), 5.00%, 9/1/20 | 545,000 | | 545,000 | |
| Fontana Special Tax, (Fontana Community Facilities District No. 22), 5.00%, 9/1/22 | 520,000 | | 559,608 | |
| Fontana Special Tax, (Fontana Community Facilities District No. 22), 5.00%, 9/1/24 | 575,000 | | 660,646 | |
| Fontana Special Tax, (Fontana Community Facilities District No. 31), 4.00%, 9/1/28 | 750,000 | | 844,260 | |
| Fontana Special Tax, (Fontana Community Facilities District No. 31), 4.00%, 9/1/29 | 555,000 | | 621,556 | |
| Fontana Special Tax, (Fontana Community Facilities District No. 31), 4.00%, 9/1/30 | 1,110,000 | | 1,233,044 | |
| Fontana Special Tax, (Fontana Community Facilities District No. 31), 4.00%, 9/1/31 | 925,000 | | 1,021,959 | |
| Fontana Special Tax, (Fontana Community Facilities District No. 31), 4.00%, 9/1/32 | 1,000,000 | | 1,099,470 | |
| Fontana Redevelopment Agency Successor Agency Tax Allocation, 5.00%, 10/1/29 | 2,100,000 | | 2,589,636 | |
| Fontana Redevelopment Agency Successor Agency Tax Allocation, 5.00%, 10/1/32 | 1,495,000 | | 1,798,739 | |
| | | | | | | | |
| Principal Amount | Value |
| Foothill-Eastern Transportation Corridor Agency Rev., 6.25%, 1/15/33 | $ | 3,750,000 | | $ | 4,263,037 | |
| Foothill-Eastern Transportation Corridor Agency Rev., 6.50%, 1/15/43 | 500,000 | | 567,855 | |
| Foothill-Eastern Transportation Corridor Agency Rev., 5.75%, 1/15/46 | 1,000,000 | | 1,113,380 | |
Foothill-Eastern Transportation Corridor Agency Rev., Capital Appreciation, 0.00%, 1/15/33(1) | 750,000 | | 524,130 | |
Foothill-Eastern Transportation Corridor Agency Rev., Capital Appreciation, 0.00%, 1/15/42(1) | 6,070,000 | | 2,997,669 | |
| Foothill-Eastern Transportation Corridor Agency Rev., Capital Appreciation, VRN, 0.00%, 1/15/42 | 2,300,000 | | 2,613,674 | |
| Foothill-Eastern Transportation Corridor Agency Rev., VRN, 5.50%, 1/15/53 | 10,000,000 | | 10,722,200 | |
| Fremont Union High School District GO, 5.00%, 8/1/32 | 3,260,000 | | 4,173,191 | |
| Fremont Union High School District GO, 5.00%, 8/1/33 | 750,000 | | 955,875 | |
| Fremont Union High School District GO, 5.00%, 8/1/34 | 660,000 | | 839,190 | |
| Fremont Union High School District GO, 4.00%, 8/1/35 | 1,250,000 | | 1,476,800 | |
| Fresno Joint Powers Financing Authority Rev., 5.00%, 4/1/24 (AGM) | 1,350,000 | | 1,554,822 | |
| Fresno Joint Powers Financing Authority Rev., 5.00%, 4/1/26 (AGM) | 1,650,000 | | 2,020,441 | |
| Fresno Joint Powers Financing Authority Rev., 5.00%, 4/1/28 (AGM) | 1,400,000 | | 1,745,506 | |
| Fresno Joint Powers Financing Authority Rev., 5.00%, 4/1/29 (AGM) | 1,000,000 | | 1,238,820 | |
| Fresno Joint Powers Financing Authority Rev., 5.00%, 4/1/30 (AGM) | 1,350,000 | | 1,664,158 | |
Fullerton Redevelopment Agency Successor Agency Tax Allocation, 4.00%, 9/1/27 (BAM)(4) | 1,885,000 | | 2,308,899 | |
| Garden Grove Agency Community Development Successor Agency Tax Allocation, 5.00%, 10/1/22 (BAM) | 500,000 | | 547,555 | |
| Garden Grove Agency Community Development Successor Agency Tax Allocation, 5.00%, 10/1/23 (BAM) | 500,000 | | 569,745 | |
| Golden Empire Schools Financing Authority Rev., (Kern High School District), 5.00%, 5/1/21 | 3,000,000 | | 3,094,050 | |
| Golden State Tobacco Securitization Corp. Rev., 5.00%, 6/1/21 | 1,000,000 | | 1,035,820 | |
| Golden State Tobacco Securitization Corp. Rev., 5.00%, 6/1/22 | 2,070,000 | | 2,231,067 | |
| Golden State Tobacco Securitization Corp. Rev., 5.00%, 6/1/23 | 3,000,000 | | 3,357,360 | |
| Golden State Tobacco Securitization Corp. Rev., 5.00%, 6/1/24 | 7,435,000 | | 8,621,329 | |
| Golden State Tobacco Securitization Corp. Rev., 5.00%, 6/1/26 | 6,000,000 | | 7,325,820 | |
| Golden State Tobacco Securitization Corp. Rev., 5.00%, 6/1/27 | 7,960,000 | | 9,932,249 | |
| Golden State Tobacco Securitization Corp. Rev., 5.00%, 6/1/28 | 2,000,000 | | 2,473,580 | |
| Golden State Tobacco Securitization Corp. Rev., 5.00%, 6/1/29 | 6,650,000 | | 7,415,681 | |
| Golden State Tobacco Securitization Corp. Rev., 5.00%, 6/1/30 | 1,000,000 | | 1,112,630 | |
| Golden State Tobacco Securitization Corp. Rev., 3.50%, 6/1/36 | 12,520,000 | | 12,706,673 | |
Golden State Tobacco Securitization Corp. Rev., Capital Appreciation, 0.00%, 6/1/25 (AGM)(1) | 3,000,000 | | 2,885,250 | |
| Grossmont-Cuyamaca Community College District GO, 5.25%, 8/1/27 | 750,000 | | 854,535 | |
Hastings Campus Housing Finance Authority Rev., 5.00%, 7/1/45(4) | 7,680,000 | | 7,962,778 | |
Hayward Area Recreation & Park District COP, 5.125%, 1/1/24, Prerefunded at 100% of Par(2) | 2,750,000 | | 3,194,372 | |
| Hayward Unified School District GO, 4.00%, 8/1/36 (BAM) | 1,000,000 | | 1,181,870 | |
| Hayward Unified School District GO, 4.00%, 8/1/37 (BAM) | 1,000,000 | | 1,178,190 | |
| Hayward Unified School District GO, 4.00%, 8/1/38 (BAM) | 1,000,000 | | 1,174,840 | |
| Hayward Unified School District GO, 4.00%, 8/1/39 (BAM) | 2,360,000 | | 2,765,259 | |
| Hayward Unified School District GO, 4.00%, 8/1/40 (BAM) | 3,000,000 | | 3,506,430 | |
| Hesperia Community Redevelopment Agency Successor Agency Tax Allocation, 5.00%, 9/1/33 (AGM) | 4,195,000 | | 5,376,815 | |
| Huntington Beach Union High School District GO, 5.00%, 8/1/26 | 3,030,000 | | 3,446,534 | |
| | | | | | | | |
| Principal Amount | Value |
| Imperial Beach Redevelopment Agency Successor Agency Tax Allocation, 4.00%, 6/1/37 | $ | 1,055,000 | | $ | 1,242,336 | |
| Imperial Beach Redevelopment Agency Successor Agency Tax Allocation, 4.00%, 6/1/38 | 1,070,000 | | 1,255,677 | |
| Imperial Beach Redevelopment Agency Successor Agency Tax Allocation, 4.00%, 6/1/39 | 1,000,000 | | 1,169,770 | |
| Imperial Irrigation District Electric System Rev., 5.00%, 11/1/30 | 440,000 | | 583,620 | |
| Imperial Irrigation District Electric System Rev., 5.00%, 11/1/31 | 400,000 | | 529,308 | |
| Imperial Irrigation District Electric System Rev., 5.00%, 11/1/32 | 525,000 | | 690,034 | |
| Imperial Irrigation District Electric System Rev., 5.00%, 11/1/33 | 1,000,000 | | 1,303,340 | |
| Imperial Irrigation District Electric System Rev., 5.00%, 11/1/34 | 1,100,000 | | 1,429,483 | |
| Imperial Irrigation District Electric System Rev., 5.00%, 11/1/35 | 1,520,000 | | 1,966,910 | |
| Imperial Irrigation District Electric System Rev., 5.00%, 11/1/36 | 1,015,000 | | 1,238,594 | |
| Inglewood Redevelopment Agency Successor Agency Tax Allocation, 5.00%, 5/1/22 (BAM) | 350,000 | | 376,247 | |
| Inglewood Redevelopment Agency Successor Agency Tax Allocation, 5.00%, 5/1/23 (BAM) | 1,000,000 | | 1,121,100 | |
| Inglewood Redevelopment Agency Successor Agency Tax Allocation, 5.00%, 5/1/25 (BAM) | 1,500,000 | | 1,809,495 | |
| Inglewood Redevelopment Agency Successor Agency Tax Allocation, 5.00%, 5/1/38 (BAM) | 500,000 | | 599,860 | |
| Inglewood Unified School District GO, 4.00%, 8/1/21 (BAM) | 400,000 | | 413,720 | |
| Inglewood Unified School District GO, 5.00%, 8/1/29 (BAM) | 235,000 | | 296,182 | |
| Inglewood Unified School District GO, 5.00%, 8/1/31 (BAM) | 500,000 | | 623,895 | |
| Inglewood Unified School District GO, 5.00%, 8/1/32 (BAM) | 500,000 | | 619,645 | |
| Inglewood Unified School District GO, 5.00%, 8/1/34 (BAM) | 300,000 | | 366,552 | |
| Inglewood Unified School District GO, 5.00%, 8/1/35 (BAM) | 855,000 | | 1,040,843 | |
| Inglewood Unified School District GO, 5.00%, 8/1/37 (BAM) | 500,000 | | 605,500 | |
| Inland Valley Development Agency Tax Allocation, 5.25%, 9/1/37 | 1,665,000 | | 1,860,171 | |
| Inland Valley Development Agency Tax Allocation, 5.00%, 9/1/44 | 1,765,000 | | 1,941,094 | |
| Irvine Special Assessment, 5.00%, 9/2/26 | 1,500,000 | | 1,871,880 | |
| Irvine Special Tax, 5.00%, 9/1/39 | 1,000,000 | | 1,101,460 | |
| Irvine Unified School District Special Tax, 5.00%, 9/1/21 | 1,500,000 | | 1,561,680 | |
| Irvine Unified School District Special Tax, 5.00%, 9/1/23 | 1,135,000 | | 1,272,528 | |
| Irvine Unified School District Special Tax, 5.00%, 9/1/25 | 1,330,000 | | 1,586,331 | |
| Irvine Unified School District Special Tax, 5.00%, 9/1/26 | 640,000 | | 781,389 | |
| Irvine Unified School District Special Tax, 5.00%, 9/1/29 | 360,000 | | 466,830 | |
| Irvine Unified School District Special Tax, 5.00%, 9/1/31 | 1,840,000 | | 2,391,172 | |
| Irvine Unified School District Special Tax, 5.00%, 9/1/31 | 350,000 | | 447,496 | |
| Irvine Unified School District Special Tax, 4.00%, 9/1/33 | 2,110,000 | | 2,473,511 | |
| Irvine Unified School District Special Tax, 5.00%, 9/1/33 | 400,000 | | 503,904 | |
| Irvine Unified School District Special Tax, 4.00%, 9/1/35 | 1,000,000 | | 1,160,070 | |
| Irvine Unified School District Special Tax, 4.00%, 9/1/36 | 1,320,000 | | 1,522,726 | |
| Irvine Unified School District Special Tax, 4.00%, 9/1/36 (AGM) | 1,500,000 | | 1,691,910 | |
| Irvine Unified School District Special Tax, 4.00%, 9/1/37 | 1,355,000 | | 1,556,041 | |
| Irvine Unified School District Special Tax, 4.00%, 9/1/37 | 570,000 | | 646,967 | |
| Irvine Unified School District Special Tax, 4.00%, 9/1/40 | 690,000 | | 774,525 | |
| Jurupa Public Financing Authority Special Tax, 5.00%, 9/1/23 (BAM) | 800,000 | | 905,584 | |
| Jurupa Public Financing Authority Special Tax, 5.00%, 9/1/23 | 625,000 | | 708,488 | |
| Jurupa Public Financing Authority Special Tax, 5.00%, 9/1/24 (BAM) | 785,000 | | 920,727 | |
| Jurupa Public Financing Authority Special Tax, 5.00%, 9/1/24 | 680,000 | | 799,048 | |
| Jurupa Public Financing Authority Special Tax, 5.00%, 9/1/25 (BAM) | 370,000 | | 448,140 | |
| Jurupa Public Financing Authority Special Tax, 5.00%, 9/1/25 | 1,000,000 | | 1,171,670 | |
| Jurupa Unified School District GO, 5.00%, 8/1/37 | 1,075,000 | | 1,335,236 | |
| | | | | | | | |
| Principal Amount | Value |
| La Quinta Redevelopment Agency Successor Agency Tax Allocation, 5.00%, 9/1/20 | $ | 1,045,000 | | $ | 1,045,000 | |
| La Quinta Redevelopment Agency Successor Agency Tax Allocation, 5.00%, 9/1/31 | 4,265,000 | | 4,921,895 | |
La Verne COP, (Brethren Hillcrest Homes Obligated Group), 5.00%, 5/15/21(2) | 315,000 | | 325,499 | |
La Verne COP, (Brethren Hillcrest Homes Obligated Group), 5.00%, 5/15/22(2) | 225,000 | | 242,987 | |
La Verne COP, (Brethren Hillcrest Homes Obligated Group), 5.00%, 5/15/22, Prerefunded at 100% of Par(2) | 635,000 | | 692,080 | |
| Lancaster Redevelopment Agency Successor Agency Tax Allocation, 5.00%, 8/1/24 (AGM) | 435,000 | | 511,112 | |
| Lancaster Redevelopment Agency Successor Agency Tax Allocation, 5.00%, 8/1/25 (AGM) | 600,000 | | 729,060 | |
| Long Beach Bond Finance Authority Rev., 5.00%, 11/15/35 (GA: Merrill Lynch & Co.) | 1,920,000 | | 2,617,728 | |
| Long Beach Bond Finance Authority Rev., 5.50%, 11/15/37 (GA: Merrill Lynch & Co.) | 1,625,000 | | 2,367,121 | |
| Long Beach Harbor Rev., 4.00%, 7/15/21 | 1,000,000 | | 1,031,300 | |
| Long Beach Marina System Rev., 5.00%, 5/15/23 | 650,000 | | 704,178 | |
| Long Beach Marina System Rev., 5.00%, 5/15/24 | 1,380,000 | | 1,532,987 | |
| Long Beach Marina System Rev., 5.00%, 5/15/25 | 1,500,000 | | 1,703,145 | |
| Long Beach Marina System Rev., 5.00%, 5/15/27 | 800,000 | | 901,992 | |
| Long Beach Marina System Rev., 5.00%, 5/15/28 | 600,000 | | 673,092 | |
| Long Beach Marina System Rev., 5.00%, 5/15/40 | 2,250,000 | | 2,445,660 | |
| Long Beach Marina System Rev., 5.00%, 5/15/45 | 1,620,000 | | 1,747,462 | |
| Long Beach Unified School District GO, 5.00%, 8/1/28 | 5,000,000 | | 6,330,800 | |
| Los Alamitos Unified School District COP, Capital Appreciation, VRN, 0.00%, 8/1/42 | 3,200,000 | | 3,540,704 | |
| Los Angeles Community College District GO, 5.00%, 6/1/26 | 2,115,000 | | 2,683,533 | |
| Los Angeles Community College District GO, 4.00%, 8/1/37 | 3,000,000 | | 3,445,920 | |
| Los Angeles Community College District GO, 4.00%, 8/1/38 | 10,000,000 | | 11,430,600 | |
| Los Angeles County COP, 5.00%, 3/1/21 | 1,195,000 | | 1,222,342 | |
| Los Angeles County COP, 5.00%, 3/1/22 | 1,000,000 | | 1,068,600 | |
| Los Angeles County Metropolitan Transportation Authority Rev., 5.00%, 7/1/32 | 8,000,000 | | 10,513,040 | |
| Los Angeles County Metropolitan Transportation Authority Rev., 5.00%, 6/1/33 | 3,500,000 | | 4,718,140 | |
| Los Angeles County Sanitation Districts Financing Authority Rev., 5.00%, 10/1/23 | 2,855,000 | | 3,278,853 | |
| Los Angeles County Sanitation Districts Financing Authority Rev., 5.00%, 10/1/26 | 2,700,000 | | 3,338,739 | |
| Los Angeles Department of Airports Rev., 5.00%, 5/15/26 | 1,500,000 | | 1,798,635 | |
| Los Angeles Department of Airports Rev., 5.00%, 5/15/27 | 1,280,000 | | 1,526,976 | |
| Los Angeles Department of Airports Rev., 5.00%, 5/15/33 | 1,350,000 | | 1,656,814 | |
| Los Angeles Department of Airports Rev., 5.00%, 5/15/34 | 1,250,000 | | 1,529,937 | |
| Los Angeles Department of Airports Rev., 5.00%, 5/15/35 | 1,500,000 | | 1,830,360 | |
| Los Angeles Department of Airports Rev., 5.00%, 5/15/36 | 4,000,000 | | 5,144,720 | |
| Los Angeles Department of Airports Rev., 5.00%, 5/15/38 | 2,500,000 | | 3,147,000 | |
| Los Angeles Department of Airports Rev., 5.00%, 5/15/39 | 6,170,000 | | 7,744,707 | |
| Los Angeles Department of Airports Rev., 5.00%, 5/15/39 | 5,000,000 | | 6,358,050 | |
| Los Angeles Department of Water Rev., 5.00%, 7/1/23 | 1,215,000 | | 1,381,807 | |
| Los Angeles Department of Water Rev., 5.00%, 7/1/23 | 1,180,000 | | 1,342,002 | |
| Los Angeles Department of Water Rev., 5.00%, 7/1/23 | 1,445,000 | | 1,643,384 | |
| Los Angeles Department of Water Rev., 5.00%, 7/1/24 | 1,500,000 | | 1,633,800 | |
| Los Angeles Department of Water Rev., 5.00%, 7/1/25 | 3,940,000 | | 4,844,466 | |
| | | | | | | | |
| Principal Amount | Value |
| Los Angeles Department of Water Rev., 5.00%, 7/1/26 | $ | 4,040,000 | | $ | 5,141,344 | |
| Los Angeles Department of Water Rev., 5.00%, 7/1/27 | 2,125,000 | | 2,785,237 | |
| Los Angeles Department of Water Rev., 5.00%, 7/1/28 | 2,840,000 | | 3,744,966 | |
| Los Angeles Department of Water Rev., 5.00%, 7/1/29 | 6,030,000 | | 7,913,048 | |
| Los Angeles Department of Water Rev., 5.00%, 7/1/37 | 1,000,000 | | 1,339,240 | |
| Los Angeles Department of Water Rev., VRDN, 0.01%, 9/1/20 (SBBPA: Citibank N.A.) | 600,000 | | 600,000 | |
| Los Angeles Department of Water Rev., VRDN, 0.02%, 9/1/20 (SBBPA: TD Bank N.A.) | 700,000 | | 700,000 | |
| Los Angeles Department of Water & Power System Rev., 5.00%, 7/1/25 | 1,525,000 | | 1,867,988 | |
| Los Angeles Department of Water & Power System Rev., 5.00%, 7/1/26 | 1,000,000 | | 1,269,460 | |
| Los Angeles Department of Water & Power System Rev., 5.00%, 7/1/26 | 1,000,000 | | 1,087,270 | |
| Los Angeles Department of Water & Power System Rev., 5.00%, 7/1/26 | 1,300,000 | | 1,503,073 | |
| Los Angeles Department of Water & Power System Rev., 5.00%, 7/1/27 | 6,470,000 | | 7,328,698 | |
| Los Angeles Department of Water & Power System Rev., 5.00%, 7/1/38 | 3,000,000 | | 3,632,340 | |
| Los Angeles Department of Water & Power System Rev., VRDN, 0.02%, 9/1/20 (SBBPA: Bank of America N.A.) | 200,000 | | 200,000 | |
| Los Angeles Unified School District COP, 5.00%, 10/1/29 | 1,700,000 | | 1,832,158 | |
| Los Angeles Unified School District GO, 5.00%, 7/1/21 | 1,120,000 | | 1,165,170 | |
| Los Angeles Unified School District GO, 5.00%, 7/1/21 | 3,000,000 | | 3,120,990 | |
| Los Angeles Unified School District GO, 5.00%, 7/1/24 | 5,000,000 | | 5,900,800 | |
| Los Angeles Unified School District GO, 5.00%, 7/1/24 | 5,140,000 | | 5,344,623 | |
| Los Angeles Unified School District GO, 5.00%, 7/1/26 | 3,555,000 | | 4,174,636 | |
| Los Angeles Unified School District GO, 5.00%, 7/1/26 | 2,500,000 | | 3,148,525 | |
| Los Angeles Unified School District GO, 5.25%, 7/1/26 | 4,000,000 | | 4,022,560 | |
| Los Angeles Unified School District GO, 5.00%, 7/1/27 | 1,050,000 | | 1,229,508 | |
| Los Angeles Wastewater System Rev., 5.00%, 6/1/35 | 1,500,000 | | 1,934,250 | |
| M-S-R Energy Authority Rev., 7.00%, 11/1/34 (GA: Citigroup Global Markets) | 1,000,000 | | 1,556,110 | |
| M-S-R Energy Authority Rev., 7.00%, 11/1/34 (GA: Citigroup Global Markets) | 5,880,000 | | 9,149,927 | |
| M-S-R Energy Authority Rev., 6.50%, 11/1/39 (GA: Citigroup Global Markets) | 1,425,000 | | 2,270,210 | |
| M-S-R Energy Authority Rev., 6.50%, 11/1/39 (GA: Citigroup Global Markets) | 1,180,000 | | 1,879,893 | |
Manhattan Beach Unified School District GO, Capital Appreciation, 0.00%, 9/1/29(1) | 5,905,000 | | 5,280,015 | |
| Manteca Redevelopment Agency Successor Agency Tax Allocation, (Manteca Amended and Merged Redevelopment Project Area), 4.00%, 10/1/31 (BAM) | 400,000 | | 493,220 | |
| Manteca Redevelopment Agency Successor Agency Tax Allocation, (Manteca Amended and Merged Redevelopment Project Area), 4.00%, 10/1/33 (BAM) | 550,000 | | 664,895 | |
| Manteca Redevelopment Agency Successor Agency Tax Allocation, (Manteca Amended and Merged Redevelopment Project Area), 4.00%, 10/1/35 (BAM) | 600,000 | | 716,160 | |
| Menlo Park Community Development Agency Successor Agency Tax Allocation, 5.00%, 10/1/20 | 325,000 | | 326,242 | |
| Metropolitan Water District of Southern California Rev., VRDN, 0.02%, 9/1/20 (SBBPA: Bank of America N.A.) | 1,405,000 | | 1,405,000 | |
| Metropolitan Water District of Southern California Rev., VRDN, 0.02%, 9/1/20 (SBBPA: PNC Bank N.A.) | 2,900,000 | | 2,900,000 | |
| Middle Fork Project Finance Authority Rev., 5.00%, 4/1/30 | 2,505,000 | | 3,076,591 | |
| | | | | | | | |
| Principal Amount | Value |
| Middle Fork Project Finance Authority Rev., 5.00%, 4/1/31 | $ | 3,895,000 | | $ | 4,741,539 | |
| Middle Fork Project Finance Authority Rev., 5.00%, 4/1/32 | 1,810,000 | | 2,187,982 | |
| Milpitas Redevelopment Agency Successor Agency Tax Allocation, 5.00%, 9/1/25 | 2,325,000 | | 2,822,387 | |
| Milpitas Redevelopment Agency Successor Agency Tax Allocation, 5.00%, 9/1/26 | 6,285,000 | | 7,546,777 | |
| Modesto Irrigation District Rev., 5.00%, 10/1/30 | 2,000,000 | | 2,630,840 | |
| Modesto Irrigation District Rev., 5.00%, 10/1/31 | 1,200,000 | | 1,574,964 | |
| Modesto Irrigation District Rev., 5.00%, 10/1/35 | 2,215,000 | | 2,848,955 | |
| Modesto Irrigation District Rev., 5.00%, 10/1/36 | 1,250,000 | | 1,596,662 | |
Municipal Improvement Corp. of Los Angeles Rev., 5.00%, 3/1/22, Prerefunded at 100% of Par(2) | 3,000,000 | | 3,215,640 | |
| Municipal Improvement Corp. of Los Angeles Rev., 5.00%, 11/1/22 | 1,000,000 | | 1,102,730 | |
| Municipal Improvement Corp. of Los Angeles Rev., 5.00%, 11/1/25 | 750,000 | | 928,538 | |
| Municipal Improvement Corp. of Los Angeles Rev., (Los Angeles), 5.00%, 11/1/31 | 750,000 | | 868,395 | |
| Municipal Improvement Corp. of Los Angeles Rev., (Los Angeles), 5.00%, 11/1/32 | 750,000 | | 866,918 | |
| Municipal Improvement Corp. of Los Angeles Rev., (Los Angeles), 5.00%, 11/1/33 | 750,000 | | 865,733 | |
| Municipal Improvement Corp. of Los Angeles Rev., (Los Angeles), 5.00%, 11/1/34 | 1,000,000 | | 1,152,740 | |
| Municipal Improvement Corp. of Los Angeles Rev., (Los Angeles), 5.00%, 11/1/35 | 1,750,000 | | 2,013,865 | |
| Municipal Improvement Corp. of Los Angeles Rev., (Los Angeles), 5.00%, 11/1/36 | 1,500,000 | | 1,723,245 | |
| Municipal Improvement Corp. of Los Angeles Rev., (Los Angeles), 5.00%, 11/1/37 | 2,085,000 | | 2,392,058 | |
| Murrieta Financing Authority Special Tax, 5.00%, 9/1/21 | 1,200,000 | | 1,248,372 | |
| Napa Valley Community College District GO, Capital Appreciation, VRN, 0.00%, 8/1/22 | 5,745,000 | | 6,040,695 | |
| Napa Valley Community College District GO, Capital Appreciation, VRN, 0.00%, 8/1/33 | 2,850,000 | | 3,163,386 | |
| Napa Valley Community College District GO, Capital Appreciation, VRN, 0.00%, 8/1/34 | 1,500,000 | | 1,660,050 | |
| Natomas Unified School District GO, 5.00%, 9/1/26 (BAM) | 1,785,000 | | 2,019,442 | |
| New Haven Unified School District GO, 4.00%, 8/1/38 | 250,000 | | 294,725 | |
Newport Beach Rev., (Hoag Memorial Hospital / Newport Healthcare Obligated Group), 6.00%, 12/1/21, Prerefunded at 100% of Par(2) | 2,000,000 | | 2,142,840 | |
| Norman Y Mineta San Jose International Airport SJC Rev., 5.00%, 3/1/27 | 1,295,000 | | 1,479,835 | |
| Norman Y Mineta San Jose International Airport SJC Rev., 5.00%, 3/1/28 | 1,500,000 | | 1,710,750 | |
| Norman Y Mineta San Jose International Airport SJC Rev., 5.00%, 3/1/30 | 1,750,000 | | 1,984,220 | |
| Norman Y Mineta San Jose International Airport SJC Rev., 5.00%, 3/1/31 | 1,000,000 | | 1,130,160 | |
| Northern California Energy Authority Rev., VRN, 4.00%, 7/1/49 (GA: Goldman Sachs Group, Inc.) | 13,300,000 | | 14,847,056 | |
| Northern California Power Agency Rev., 5.00%, 7/1/26 | 1,750,000 | | 1,891,295 | |
| Northern California Power Agency Rev., 5.00%, 7/1/27 | 2,000,000 | | 2,161,100 | |
| Northern California Transmission Agency Rev., 5.00%, 5/1/28 | 1,000,000 | | 1,220,930 | |
| Northern California Transmission Agency Rev., 5.00%, 5/1/29 | 1,000,000 | | 1,215,420 | |
| Northern California Transmission Agency Rev., 5.00%, 5/1/30 | 1,855,000 | | 2,239,152 | |
| Novato Redevelopment Agency Successor Agency Tax Allocation, 4.00%, 9/1/36 | 1,825,000 | | 2,118,661 | |
| Novato Redevelopment Agency Successor Agency Tax Allocation, 4.00%, 9/1/37 | 1,900,000 | | 2,198,281 | |
| | | | | | | | |
| Principal Amount | Value |
| Novato Redevelopment Agency Successor Agency Tax Allocation, 4.00%, 9/1/38 | $ | 1,420,000 | | $ | 1,637,757 | |
| Novato Redevelopment Agency Successor Agency Tax Allocation, 4.00%, 9/1/39 | 1,475,000 | | 1,696,220 | |
| Novato Redevelopment Agency Successor Agency Tax Allocation, 4.00%, 9/1/40 | 1,465,000 | | 1,680,091 | |
| Oakland Alameda County Coliseum Authority Rev., 5.00%, 2/1/25 | 4,065,000 | | 4,298,778 | |
| Oakland Sewer Rev., 5.00%, 6/15/26 | 1,200,000 | | 1,416,744 | |
| Oakland Unified School District / Alameda County GO, 5.00%, 8/1/22 | 410,000 | | 435,777 | |
Oakland Unified School District / Alameda County GO, 5.50%, 8/1/22, Prerefunded at 100% of Par(2) | 3,150,000 | | 3,462,354 | |
| Oakland Unified School District / Alameda County GO, 5.00%, 8/1/23 | 1,400,000 | | 1,578,038 | |
| Oakland Unified School District / Alameda County GO, 5.00%, 8/1/25 | 650,000 | | 784,199 | |
| Oakland Unified School District / Alameda County GO, 5.00%, 8/1/25 | 3,700,000 | | 4,463,902 | |
| Ontario Community Facilities District No. 24 Special Tax, 4.00%, 9/1/20 | 295,000 | | 295,000 | |
| Ontario Community Facilities District No. 24 Special Tax, 4.00%, 9/1/21 | 285,000 | | 293,579 | |
| Ontario Community Facilities District No. 24 Special Tax, 4.00%, 9/1/22 | 300,000 | | 317,187 | |
| Ontario Community Facilities District No. 24 Special Tax, 4.00%, 9/1/23 | 60,000 | | 64,979 | |
| Ontario Community Facilities District No. 30 Special Tax, 4.00%, 9/1/24 | 315,000 | | 346,932 | |
| Ontario Community Facilities District No. 30 Special Tax, 4.00%, 9/1/25 | 325,000 | | 363,929 | |
| Ontario Community Facilities District No. 30 Special Tax, 4.00%, 9/1/26 | 340,000 | | 379,851 | |
| Ontario Community Facilities District No. 30 Special Tax, 4.00%, 9/1/29 | 230,000 | | 253,232 | |
| Orange County Special Assessment, 3.00%, 9/2/25 | 285,000 | | 322,800 | |
| Orange County Special Assessment, 5.00%, 9/2/26 | 600,000 | | 761,646 | |
| Orange County Special Assessment, 5.00%, 9/2/28 | 600,000 | | 805,620 | |
| Orange County Special Assessment, 5.00%, 9/2/30 | 875,000 | | 1,144,553 | |
| Orange County Airport Rev., 5.00%, 7/1/24 | 1,470,000 | | 1,716,431 | |
| Orange County Airport Rev., 5.00%, 7/1/25 | 1,000,000 | | 1,206,010 | |
| Orange County Airport Rev., 5.00%, 7/1/26 | 1,000,000 | | 1,237,340 | |
| Orange County Community Facilities District Special Tax, 5.00%, 8/15/28 | 1,960,000 | | 2,076,483 | |
| Orange County Community Facilities District Special Tax, 5.00%, 8/15/29 | 2,000,000 | | 2,359,260 | |
| Orange County Community Facilities District Special Tax, 5.00%, 8/15/30 | 2,220,000 | | 2,605,370 | |
| Orange County Community Facilities District Special Tax, 5.00%, 8/15/32 | 2,575,000 | | 2,983,395 | |
| Orange County Community Facilities District Special Tax, 5.00%, 8/15/35 | 975,000 | | 1,096,368 | |
| Oroville Rev., (Oroville Hospital), 5.25%, 4/1/34 | 1,685,000 | | 1,881,572 | |
| Oroville Rev., (Oroville Hospital), 5.25%, 4/1/39 | 3,500,000 | | 3,844,015 | |
| Oxnard Financing Authority Rev., 5.00%, 6/1/25 (AGM) | 2,000,000 | | 2,342,380 | |
| Oxnard Financing Authority Rev., 5.00%, 6/1/26 (AGM) | 3,690,000 | | 4,300,916 | |
| Oxnard Financing Authority Rev., 5.00%, 6/1/28 (AGM) | 1,515,000 | | 1,753,749 | |
| Oxnard Financing Authority Rev., 5.00%, 6/1/32 (AGM) | 2,500,000 | | 2,850,250 | |
| Oxnard Financing Authority Rev., 5.00%, 6/1/33 (AGM) | 1,000,000 | | 1,137,050 | |
| | | | | | | | |
| Principal Amount | Value |
| Oxnard Gas Tax Rev., 4.00%, 9/1/32 (AGM) | $ | 1,045,000 | | $ | 1,243,634 | |
Oxnard School District GO, VRN, 5.00%, 8/1/25, Prerefunded at 100% of Par (AGM)(2) | 3,750,000 | | 4,609,087 | |
| Palm Desert Redevelopment Agency Successor Agency Tax Allocation, 5.00%, 10/1/30 (BAM) | 350,000 | | 431,613 | |
| Palmdale Community Redevelopment Agency Successor Agency Tax Allocation, 5.00%, 9/1/28 (NATL) | 2,150,000 | | 2,623,516 | |
| Palmdale Community Redevelopment Agency Successor Agency Tax Allocation, 5.00%, 9/1/29 (NATL) | 2,075,000 | | 2,520,938 | |
| Palmdale Community Redevelopment Agency Successor Agency Tax Allocation, 5.00%, 9/1/30 (NATL) | 1,215,000 | | 1,469,227 | |
| Palomar Health COP, (Palomar Health Obligated Group), 5.00%, 11/1/20 | 535,000 | | 538,568 | |
Palomar Health COP, (Palomar Health Obligated Group), 5.25%, 11/1/20, Prerefunded at 100% of Par(2) | 325,000 | | 327,727 | |
Palomar Health COP, (Palomar Health Obligated Group), 6.00%, 11/1/20, Prerefunded at 100% of Par(2) | 1,870,000 | | 1,887,915 | |
| Palomar Health COP, (Palomar Health Obligated Group), 5.00%, 11/1/22 | 770,000 | | 837,367 | |
| Palomar Health COP, (Palomar Health Obligated Group), 5.00%, 11/1/25 | 650,000 | | 774,573 | |
| Palomar Health COP, (Palomar Health Obligated Group), 5.00%, 11/1/26 | 475,000 | | 579,130 | |
| Palomar Health COP, (Palomar Health Obligated Group), 5.00%, 11/1/27 | 720,000 | | 898,394 | |
| Palomar Health COP, (Palomar Health Obligated Group), 5.00%, 11/1/32 | 4,000,000 | | 4,769,640 | |
| Palomar Health GO, 5.00%, 8/1/23 | 1,900,000 | | 2,128,133 | |
| Palomar Health GO, 5.00%, 8/1/28 | 1,340,000 | | 1,622,499 | |
| Palomar Health GO, Capital Appreciation, VRN, 7.00%, 8/1/38 (AGC) | 3,330,000 | | 4,802,626 | |
| Palomar Health Rev., (Palomar Health Obligated Group), 5.00%, 11/1/21 | 3,625,000 | | 3,796,571 | |
| Palomar Health Rev., (Palomar Health Obligated Group), 5.00%, 11/1/22 | 1,000,000 | | 1,087,490 | |
| Palomar Health Rev., (Palomar Health Obligated Group), 5.00%, 11/1/24 | 2,375,000 | | 2,763,835 | |
| Palomar Health Rev., (Palomar Health Obligated Group), 5.00%, 11/1/27 | 4,100,000 | | 4,977,195 | |
| Palomar Health Rev., (Palomar Health Obligated Group), 5.00%, 11/1/29 | 4,585,000 | | 5,481,001 | |
| Palomar Health Rev., (Palomar Health Obligated Group), 5.00%, 11/1/39 | 4,080,000 | | 4,638,430 | |
Palos Verdes Peninsula Unified School District GO, 0.00%, 8/1/33(1) | 2,600,000 | | 2,074,410 | |
| Peninsula Corridor Joint Powers Board Rev., 5.00%, 10/1/31 | 1,045,000 | | 1,311,726 | |
| Peninsula Corridor Joint Powers Board Rev., 5.00%, 10/1/32 | 785,000 | | 978,369 | |
| Peninsula Corridor Joint Powers Board Rev., 5.00%, 10/1/36 | 300,000 | | 366,651 | |
| Peninsula Corridor Joint Powers Board Rev., 5.00%, 10/1/37 | 435,000 | | 529,900 | |
| Peninsula Corridor Joint Powers Board Rev., 5.00%, 10/1/38 | 550,000 | | 666,941 | |
| Peninsula Corridor Joint Powers Board Rev., 5.00%, 10/1/39 | 1,210,000 | | 1,463,084 | |
| Peralta Community College District GO, 5.00%, 8/1/22 | 2,145,000 | | 2,336,806 | |
| Peralta Community College District GO, 5.00%, 8/1/25 | 620,000 | | 754,707 | |
| Peralta Community College District GO, 5.00%, 8/1/26 | 550,000 | | 688,820 | |
| Peralta Community College District GO, 5.00%, 8/1/27 | 500,000 | | 643,540 | |
| Pittsburg Successor Agency Redevelopment Agency Tax Allocation, 5.00%, 9/1/29 (AGM) | 3,000,000 | | 3,658,290 | |
| Pomona Unified School District GO, 6.55%, 8/1/29 (NATL) | 1,000,000 | | 1,307,840 | |
| Pomona Unified School District GO, 6.15%, 8/1/30 (NATL) | 855,000 | | 922,442 | |
| | | | | | | | |
| Principal Amount | Value |
| Port Commission of the City & County of San Francisco Rev., 5.00%, 3/1/31 | $ | 775,000 | | $ | 1,044,770 | |
| Port Commission of the City & County of San Francisco Rev., 5.00%, 3/1/33 | 860,000 | | 1,139,190 | |
| Port Commission of the City & County of San Francisco Rev., 5.00%, 3/1/35 | 400,000 | | 525,240 | |
| Port Commission of the City & County of San Francisco Rev., 5.00%, 3/1/36 | 325,000 | | 424,486 | |
| Port Commission of the City & County of San Francisco Rev., 4.00%, 3/1/37 | 325,000 | | 389,171 | |
| Port Commission of the City & County of San Francisco Rev., 4.00%, 3/1/38 | 405,000 | | 482,525 | |
| Port Commission of the City & County of San Francisco Rev., 4.00%, 3/1/40 | 1,310,000 | | 1,544,896 | |
Porterville Public Financing Authority Rev., 5.625%, 10/1/21, Prerefunded at 100% of Par(2) | 4,000,000 | | 4,237,240 | |
Poway Unified School District GO, Capital Appreciation, 0.00%, 8/1/41(1) | 4,890,000 | | 3,004,123 | |
| Poway Unified School District Public Financing Authority Special Tax, 5.00%, 9/1/31 | 1,645,000 | | 2,046,133 | |
Rancho Santa Fe Community Services District Special Tax, 5.125%, 9/1/21, Prerefunded at 100% of Par(2) | 790,000 | | 828,497 | |
Rancho Santa Fe Community Services District Special Tax, 5.25%, 9/1/21, Prerefunded at 100% of Par(2) | 1,300,000 | | 1,364,961 | |
Rancho Santa Fe Community Services District Special Tax, 5.375%, 9/1/21, Prerefunded at 100% of Par(2) | 1,410,000 | | 1,482,220 | |
| Redding Electric System Rev., 5.00%, 6/1/28 | 1,000,000 | | 1,291,360 | |
| Redding Electric System Rev., 5.00%, 6/1/29 | 1,250,000 | | 1,604,887 | |
| Redding Electric System Rev., 5.00%, 6/1/30 | 1,250,000 | | 1,595,712 | |
| Regents of the University of California Medical Center Pooled Rev., 5.00%, 5/15/33 | 3,015,000 | | 3,653,607 | |
| Regents of the University of California Medical Center Pooled Rev., 5.00%, 5/15/34 | 2,000,000 | | 2,419,160 | |
| Regents of the University of California Medical Center Pooled Rev., VRDN, 0.01%, 9/1/20 | 7,900,000 | | 7,900,000 | |
| Rio Elementary School District Community Facilities District Special Tax, 5.00%, 9/1/24 | 700,000 | | 807,233 | |
River Islands Public Financing Authority Rev., 4.00%, 9/1/40(4) | 2,500,000 | | 2,902,850 | |
Riverside County Redevelopment Successor Agency Tax Allocation, 6.50%, 10/1/20, Prerefunded at 100% of Par(2) | 1,560,000 | | 1,567,987 | |
Riverside County Transportation Commission Rev., Capital Appreciation, 0.00%, 6/1/28(1) | 1,000,000 | | 842,210 | |
Riverside County Transportation Commission Rev., Capital Appreciation, 0.00%, 6/1/30(1) | 1,000,000 | | 789,970 | |
Riverside County Transportation Commission Rev., Capital Appreciation, 0.00%, 6/1/31(1) | 1,555,000 | | 1,187,445 | |
| Riverside Sewer Rev., 5.00%, 8/1/25 | 1,630,000 | | 1,995,707 | |
| Riverside Sewer Rev., 5.00%, 8/1/26 | 3,400,000 | | 4,125,832 | |
| Riverside Sewer Rev., 5.00%, 8/1/35 | 3,750,000 | | 4,789,500 | |
| Riverside Sewer Rev., 5.00%, 8/1/37 | 3,265,000 | | 4,141,391 | |
| Riverside Water Rev., 5.00%, 10/1/36 | 7,185,000 | | 9,447,556 | |
| Riverside Water Rev., 5.00%, 10/1/37 | 7,295,000 | | 9,561,775 | |
| Romoland School District Special Tax, 4.00%, 9/1/21 | 1,035,000 | | 1,066,050 | |
| Romoland School District Special Tax, 5.00%, 9/1/22 | 1,140,000 | | 1,228,954 | |
| Romoland School District Special Tax, (Romoland School District Community Facilities District No. 2004-1, 5.00%, 9/1/36 | 1,000,000 | | 1,142,550 | |
| Romoland School District Special Tax, (Romoland School District Community Facilities District No. 2004-1, 5.00%, 9/1/37 | 1,100,000 | | 1,253,208 | |
| | | | | | | | |
| Principal Amount | Value |
| Romoland School District Special Tax, (Romoland School District Community Facilities District No. 2004-1, 5.00%, 9/1/38 | $ | 1,000,000 | | $ | 1,136,180 | |
| Roseville Special Tax, (Fiddyment Ranch Community Facilities District No. 1), 5.00%, 9/1/25 | 750,000 | | 886,913 | |
| Roseville Special Tax, (Fiddyment Ranch Community Facilities District No. 1), 5.00%, 9/1/26 | 1,075,000 | | 1,295,214 | |
| Roseville Special Tax, (Fiddyment Ranch Community Facilities District No. 1), 5.00%, 9/1/28 | 1,025,000 | | 1,251,433 | |
| Roseville Special Tax, (Fiddyment Ranch Community Facilities District No. 1), 5.00%, 9/1/30 | 1,390,000 | | 1,668,514 | |
| Roseville Special Tax, (Fiddyment Ranch Community Facilities District No. 1), 5.00%, 9/1/31 | 1,000,000 | | 1,187,450 | |
| Roseville Special Tax, (Fiddyment Ranch Community Facilities District No. 1), 5.00%, 9/1/32 | 1,250,000 | | 1,472,150 | |
| Roseville Special Tax, (Fiddyment Ranch Community Facilities District No. 1), 5.00%, 9/1/34 | 1,050,000 | | 1,226,463 | |
Roseville Special Tax, (Roseville Creekview Community Facilities District No. 1), 5.00%, 9/1/40(4) | 1,260,000 | | 1,426,597 | |
| Roseville Water Utility COP, 5.00%, 12/1/26 | 1,690,000 | | 2,097,645 | |
| Roseville Water Utility COP, 5.00%, 12/1/27 | 2,250,000 | | 2,787,435 | |
| Sacramento City Financing Authority Rev., 5.40%, 11/1/20 (Ambac) | 475,000 | | 478,938 | |
| Sacramento County Airport System Rev., 5.00%, 7/1/23 | 1,000,000 | | 1,001,620 | |
| Sacramento County Airport System Rev., 5.00%, 7/1/24 | 1,000,000 | | 1,001,620 | |
| Sacramento County Airport System Rev., 5.00%, 7/1/33 | 1,450,000 | | 1,801,741 | |
| Sacramento County Airport System Rev., 5.00%, 7/1/34 | 1,000,000 | | 1,239,110 | |
| Sacramento County Airport System Rev., 5.00%, 7/1/35 | 1,000,000 | | 1,234,590 | |
| Sacramento County Sanitation Districts Financing Authority Rev., 5.25%, 12/1/21 (NATL) | 1,000,000 | | 1,064,170 | |
| Sacramento County Sanitation Districts Financing Authority Rev., (Sacramento Regional County Sanitation District), 5.00%, 12/1/27 | 2,960,000 | | 3,917,501 | |
| Sacramento County Sanitation Districts Financing Authority Rev., (Sacramento Regional County Sanitation District), 5.00%, 12/1/28 | 2,000,000 | | 2,702,180 | |
| Sacramento County Sanitation Districts Financing Authority Rev., VRN, 0.77%, (67% of the 3-month LIBOR plus 0.53%), 12/1/35 (NATL) | 8,500,000 | | 7,347,145 | |
| Sacramento County Water Financing Authority Rev., (Sacramento County Water Agency), 5.00%, 6/1/27 | 2,000,000 | | 2,605,740 | |
| Sacramento County Water Financing Authority Rev., (Sacramento County Water Agency), 5.00%, 6/1/28 | 700,000 | | 936,628 | |
| Sacramento Municipal Utility District Rev., 5.25%, 7/1/24 (Ambac) | 3,000,000 | | 3,365,250 | |
| Sacramento Municipal Utility District Rev., 5.00%, 8/15/24 | 1,500,000 | | 1,640,205 | |
| Sacramento Municipal Utility District Rev., 5.00%, 8/15/24 | 1,000,000 | | 1,189,630 | |
| Sacramento Municipal Utility District Rev., 5.00%, 8/15/25 | 5,000,000 | | 5,463,250 | |
| Sacramento Municipal Utility District Rev., 5.00%, 8/15/28 | 1,200,000 | | 1,613,820 | |
| Sacramento Redevelopment Agency Successor Agency Tax Allocation, 5.00%, 12/1/34 (BAM) | 1,355,000 | | 1,583,480 | |
| Sacramento Transient Occupancy Tax Rev., 5.00%, 6/1/36 | 1,000,000 | | 1,135,840 | |
| Sacramento Transient Occupancy Tax Rev., 5.00%, 6/1/37 | 2,250,000 | | 2,546,145 | |
| Sacramento Transient Occupancy Tax Rev., 5.00%, 6/1/38 | 1,000,000 | | 1,128,550 | |
| San Bernardino Community College District GO, Capital Appreciation, VRN, 0.00%, 8/1/34 | 17,240,000 | | 21,145,550 | |
| San Bernardino Redevelopment Agency Successor Agency Tax Allocation, 5.00%, 12/1/20 (AGM) | 2,915,000 | | 2,950,301 | |
| San Bernardino Redevelopment Agency Successor Agency Tax Allocation, 5.00%, 12/1/22 (AGM) | 2,310,000 | | 2,546,914 | |
| San Bernardino Redevelopment Agency Successor Agency Tax Allocation, 5.00%, 12/1/24 (AGM) | 2,310,000 | | 2,747,999 | |
| San Bernardino Redevelopment Agency Successor Agency Tax Allocation, 5.00%, 12/1/25 (AGM) | 1,275,000 | | 1,566,133 | |
| | | | | | | | |
| Principal Amount | Value |
| San Buenaventura Rev., (Community Memorial Health System), 8.00%, 12/1/26 | $ | 2,000,000 | | $ | 2,145,800 | |
| San Buenaventura Rev., (Community Memorial Health System), 7.50%, 12/1/41 | 4,300,000 | | 4,526,997 | |
| San Diego Association of Governments Rev., 5.00%, 11/15/26 | 9,250,000 | | 11,173,167 | |
| San Diego Association of Governments Rev., 1.80%, 11/15/27 | 2,000,000 | | 2,052,360 | |
San Diego Community College District GO, 5.00%, 8/1/23, Prerefunded at 100% of Par(2) | 3,000,000 | | 3,420,990 | |
| San Diego County Rev., (Sanford Burnham Prebys Medical Discovery Institute), 5.00%, 11/1/22 | 1,525,000 | | 1,680,962 | |
| San Diego County Rev., (Sanford Burnham Prebys Medical Discovery Institute), 5.00%, 11/1/30 | 675,000 | | 823,291 | |
| San Diego County Regional Airport Authority Rev., 5.00%, 7/1/31 | 1,000,000 | | 1,232,850 | |
| San Diego County Regional Airport Authority Rev., 5.00%, 7/1/32 | 850,000�� | | 1,042,109 | |
| San Diego County Regional Airport Authority Rev., 5.00%, 7/1/33 | 1,000,000 | | 1,220,560 | |
| San Diego County Regional Airport Authority Rev., 5.00%, 7/1/34 | 700,000 | | 852,264 | |
| San Diego County Regional Airport Authority Rev., 5.00%, 7/1/35 | 1,000,000 | | 1,213,580 | |
| San Diego County Regional Airport Authority Rev., 4.00%, 7/1/37 | 1,200,000 | | 1,393,308 | |
| San Diego County Regional Airport Authority Rev., 4.00%, 7/1/38 | 1,350,000 | | 1,562,557 | |
| San Diego County Regional Airport Authority Rev., 5.00%, 7/1/39 | 1,000,000 | | 1,252,670 | |
| San Diego County Regional Airport Authority Rev., 5.00%, 7/1/44 | 3,000,000 | | 3,338,490 | |
| San Diego County Regional Transportation Commission Rev., 5.00%, 4/1/21 | 5,940,000 | | 6,106,736 | |
| San Diego County Water Authority Rev., 5.00%, 5/1/25 | 5,250,000 | | 6,431,092 | |
| San Diego County Water Authority Rev., 5.00%, 5/1/26 | 2,390,000 | | 2,912,741 | |
| San Diego County Water Authority Rev., 5.00%, 5/1/27 | 3,485,000 | | 4,234,589 | |
San Diego County Water Authority Rev., 5.00%, 5/1/29(4) | 1,225,000 | | 1,628,956 | |
San Diego County Water Authority Rev., 5.00%, 5/1/31(4) | 1,050,000 | | 1,450,785 | |
| San Diego Public Facilities Financing Authority Rev., (San Diego Sewer Utility), 5.00%, 5/15/28 | 10,000,000 | | 12,542,300 | |
San Diego Public Facilities Financing Authority Rev., (San Diego Water Utility), 5.00%, 8/1/21(2) | 2,000,000 | | 2,087,040 | |
San Diego Public Facilities Financing Authority Rev., (San Diego Water Utility), 5.00%, 8/1/22, Prerefunded at 100% of Par(2) | 2,000,000 | | 2,183,280 | |
| San Diego Public Facilities Financing Authority Rev., (San Diego Water Utility), 5.00%, 8/1/38 | 5,000,000 | | 6,345,850 | |
| San Diego Redevelopment Agency Successor Agency Tax Allocation, 5.00%, 9/1/22 | 1,000,000 | | 1,091,210 | |
| San Diego Redevelopment Agency Successor Agency Tax Allocation, 5.00%, 9/1/23 | 1,000,000 | | 1,135,820 | |
| San Diego Unified Port District Rev., 5.00%, 9/1/23 | 250,000 | | 283,635 | |
| San Diego Unified Port District Rev., 5.00%, 9/1/24 | 500,000 | | 566,300 | |
| San Diego Unified Port District Rev., 5.00%, 9/1/26 | 750,000 | | 843,480 | |
| San Diego Unified School District GO, 5.00%, 7/1/33 | 1,320,000 | | 1,675,687 | |
| San Francisco Bay Area Rapid Transit District Rev., 5.00%, 7/1/28 | 1,500,000 | | 1,810,605 | |
San Francisco City & County Airport Comm-San Francisco International Airport Rev., 5.00%, 5/3/21, Prerefunded at 100% of Par(2) | 980,000 | | 1,011,791 | |
San Francisco City & County Airport Comm-San Francisco International Airport Rev., 5.00%, 5/3/21, Prerefunded at 100% of Par(2) | 1,210,000 | | 1,249,252 | |
| San Francisco City & County Airport Comm-San Francisco International Airport Rev., 5.00%, 5/1/22 | 1,000,000 | | 1,076,200 | |
San Francisco City & County Airport Comm-San Francisco International Airport Rev., 4.00%, 5/1/23, Prerefunded at 100% of Par(2) | 1,625,000 | | 1,783,941 | |
| San Francisco City & County Airport Comm-San Francisco International Airport Rev., 5.00%, 5/1/26 | 1,250,000 | | 1,340,087 | |
| | | | | | | | |
| Principal Amount | Value |
| San Francisco City & County Airport Comm-San Francisco International Airport Rev., 5.00%, 5/1/29 | $ | 5,060,000 | | $ | 5,201,427 | |
| San Francisco City & County Airport Comm-San Francisco International Airport Rev., 5.00%, 5/1/36 | 6,000,000 | | 7,547,460 | |
| San Francisco City & County Public Utilities Commission Wastewater Rev., 5.00%, 10/1/21 | 5,000,000 | | 5,262,300 | |
| San Francisco City & County Redevelopment Agency Successor Agency Tax Allocation, (Mission Bay South Redevelopment Project), 5.00%, 8/1/21 | 460,000 | | 480,410 | |
| San Francisco City & County Redevelopment Agency Successor Agency Tax Allocation, (Mission Bay South Redevelopment Project), 5.00%, 8/1/26 | 425,000 | | 495,729 | |
| San Francisco City & County Redevelopment Agency Successor Agency Tax Allocation, (Mission Bay South Redevelopment Project), 5.00%, 8/1/27 | 550,000 | | 639,436 | |
| San Francisco City & County Redevelopment Agency Successor Agency Tax Allocation, (Mission Bay South Redevelopment Project), 5.00%, 8/1/28 | 370,000 | | 428,578 | |
| San Francisco City & County Redevelopment Agency Successor Agency Tax Allocation, (Mission Bay South Redevelopment Project), 5.00%, 8/1/31 | 400,000 | | 459,128 | |
San Francisco City & County Redevelopment Financing Authority Tax Allocation, 6.625%, 2/1/21, Prerefunded at 100% of Par(2) | 500,000 | | 513,110 | |
| San Francisco Public Utilities Commission Water Rev., 5.00%, 11/1/28 | 1,055,000 | | 1,279,736 | |
| San Gorgonio Memorial Health Care District GO, 5.00%, 8/1/25 | 850,000 | | 987,071 | |
| San Joaquin Hills Transportation Corridor Agency Rev., 5.00%, 1/15/34 | 12,000,000 | | 13,517,160 | |
| San Joaquin Hills Transportation Corridor Agency Rev., 5.00%, 1/15/44 | 1,000,000 | | 1,108,030 | |
| San Joaquin Hills Transportation Corridor Agency Rev., 5.25%, 1/15/44 | 1,000,000 | | 1,107,820 | |
| San Mateo Special Tax, 5.875%, 9/1/32 | 1,375,000 | | 1,473,725 | |
| San Mateo Special Tax, 5.50%, 9/1/44 | 750,000 | | 790,710 | |
| San Mateo Foster City Public Financing Authority Rev., (San Mateo Sewer Rev.), 5.00%, 8/1/34 | 1,050,000 | | 1,387,848 | |
| San Mateo Foster City Public Financing Authority Rev., (San Mateo Sewer Rev.), 4.00%, 8/1/35 | 1,100,000 | | 1,347,951 | |
| San Mateo Foster City Public Financing Authority Rev., (San Mateo Sewer Rev.), 5.00%, 8/1/36 | 1,885,000 | | 2,466,673 | |
| Santa Ana Gas Tax Rev., 5.00%, 1/1/34 | 720,000 | | 932,681 | |
| Santa Ana Gas Tax Rev., 5.00%, 1/1/35 | 1,260,000 | | 1,627,151 | |
| Santa Ana Gas Tax Rev., 5.00%, 1/1/37 | 1,260,000 | | 1,613,367 | |
| Santa Barbara Financing Authority Rev., (Santa Barbara), 5.00%, 4/1/29 | 1,515,000 | | 1,978,332 | |
| Santa Barbara Financing Authority Rev., (Santa Barbara), 5.00%, 4/1/31 | 845,000 | | 1,086,053 | |
| Santa Barbara Financing Authority Rev., (Santa Barbara), 5.00%, 4/1/33 | 840,000 | | 1,065,590 | |
| Santa Barbara Financing Authority Rev., (Santa Barbara), 5.00%, 4/1/35 | 2,035,000 | | 2,563,001 | |
| Santa Barbara Financing Authority Rev., (Santa Barbara), 5.00%, 4/1/38 | 1,000,000 | | 1,245,990 | |
Santa Clara Electric Rev., 5.00%, 7/1/21, Prerefunded at 100% of Par(2) | 1,500,000 | | 1,558,815 | |
| Santa Cruz County Redevelopment Agency Tax Allocation, 5.00%, 9/1/35 (AGM) | 1,500,000 | | 1,761,570 | |
| Santa Monica Redevelopment Agency Tax Allocation, 5.875%, 7/1/42 | 1,000,000 | | 1,034,570 | |
| Santa Paula Special Tax, (Santa Paula Harvest Community Facilities District No. 1), 5.00%, 9/1/40 | 1,000,000 | | 1,138,360 | |
| | | | | | | | |
| Principal Amount | Value |
| Santa Paula Utility Authority Rev., (Santa Paula), 5.00%, 2/1/29 (AGM) | $ | 1,920,000 | | $ | 2,531,155 | |
| Santa Paula Utility Authority Rev., (Santa Paula), 5.00%, 2/1/30 (AGM) | 2,225,000 | | 2,911,323 | |
| Santa Paula Utility Authority Rev., (Santa Paula), 5.00%, 2/1/31 (AGM) | 2,090,000 | | 2,704,690 | |
| Santa Paula Utility Authority Rev., (Santa Paula), 5.00%, 2/1/32 (AGM) | 1,900,000 | | 2,443,666 | |
| Santa Paula Utility Authority Rev., (Santa Paula), 4.00%, 2/1/33 (AGM) | 2,000,000 | | 2,364,180 | |
| Santa Paula Utility Authority Rev., (Santa Paula), 4.00%, 2/1/34 (AGM) | 600,000 | | 705,324 | |
| Sonoma Community Development Agency Successor Agency Tax Allocation, 5.00%, 6/1/23 (NATL) | 1,000,000 | | 1,078,250 | |
| Sonoma Community Development Agency Successor Agency Tax Allocation, 5.00%, 6/1/25 (NATL) | 1,390,000 | | 1,642,354 | |
| Sonoma Community Development Agency Successor Agency Tax Allocation, 5.00%, 6/1/29 (NATL) | 1,100,000 | | 1,336,445 | |
| Sonoma Community Development Agency Successor Agency Tax Allocation, 5.00%, 6/1/33 (NATL) | 1,325,000 | | 1,578,234 | |
| South Bayside Waste Management Authority Rev., 5.00%, 9/1/33 (AGM) | 450,000 | | 587,286 | |
| South Bayside Waste Management Authority Rev., 5.00%, 9/1/36 (AGM) | 2,110,000 | | 2,718,355 | |
| South Bayside Waste Management Authority Rev., 5.00%, 9/1/40 (AGM) | 2,515,000 | | 3,189,573 | |
| South Orange County Public Financing Authority Special Tax, 5.00%, 8/15/21 | 1,500,000 | | 1,560,555 | |
| South Orange County Public Financing Authority Special Tax, 5.00%, 8/15/23 | 1,200,000 | | 1,347,060 | |
| South Orange County Public Financing Authority Special Tax, 5.00%, 8/15/25 | 1,125,000 | | 1,341,934 | |
| South Orange County Public Financing Authority Special Tax, 5.00%, 8/15/26 | 1,000,000 | | 1,219,050 | |
| South Orange County Public Financing Authority Special Tax, 5.00%, 8/15/27 | 1,155,000 | | 1,441,047 | |
| South Orange County Public Financing Authority Special Tax, 5.00%, 8/15/28 | 1,340,000 | | 1,705,271 | |
| Southern California Public Power Authority Rev., 5.00%, 7/1/21 | 2,780,000 | | 2,892,117 | |
| Southern California Public Power Authority Rev., 5.00%, 11/1/28 (GA: Goldman Sachs Group, Inc.) | 835,000 | | 1,060,333 | |
| Southern California Water Replenishment District Rev., 5.00%, 8/1/21 | 1,000,000 | | 1,044,650 | |
| Southern California Water Replenishment District Rev., 5.00%, 8/1/35 | 2,190,000 | | 2,789,534 | |
| Southern California Water Replenishment District Rev., 5.00%, 8/1/37 | 2,170,000 | | 2,739,495 | |
| State of California GO, 5.00%, 3/1/23 | 10,000,000 | | 11,203,600 | |
| State of California GO, 5.00%, 12/1/26 | 1,045,000 | | 1,201,332 | |
| State of California GO, 5.00%, 2/1/27 | 10,000,000 | | 11,112,800 | |
| State of California GO, 4.00%, 11/1/27 | 2,000,000 | | 2,476,380 | |
| State of California GO, 5.00%, 2/1/28 | 6,795,000 | | 7,538,985 | |
| State of California GO, 5.00%, 11/1/29 | 2,625,000 | | 2,991,844 | |
| State of California GO, 5.00%, 4/1/30 | 2,500,000 | | 3,344,875 | |
| State of California GO, 5.00%, 4/1/31 | 1,350,000 | | 1,792,719 | |
| State of California GO, 5.00%, 11/1/31 | 7,435,000 | | 9,568,399 | |
| State of California GO, 5.00%, 4/1/32 | 3,000,000 | | 3,952,230 | |
| State of California GO, 5.25%, 8/1/32 (AGM) | 5,000,000 | | 7,170,100 | |
| State of California GO, 5.00%, 4/1/37 | 5,000,000 | | 5,749,000 | |
| | | | | | | | |
| Principal Amount | Value |
| State of California GO, 5.00%, 4/1/38 | $ | 3,500,000 | | $ | 4,488,680 | |
| State of California GO, (Kindergarten), VRDN, 0.01%, 9/1/20 (LOC: State Street Bank & Trust Co.) | 600,000 | | 600,000 | |
| State of California GO, VRN, 4.00%, 12/1/30 | 4,000,000 | | 4,107,000 | |
| State of California Department of Water Resources Rev., 5.00%, 12/1/25 | 2,000,000 | | 2,494,220 | |
| State of California Department of Water Resources Power Supply Rev., 5.00%, 5/1/21 | 10,000,000 | | 10,325,100 | |
| State of California Department of Water Resources Power Supply Rev., 5.00%, 5/1/22 | 4,180,000 | | 4,519,709 | |
| Stockton Public Financing Authority Rev., 5.00%, 9/1/22 (BAM) | 1,410,000 | | 1,531,810 | |
| Stockton Public Financing Authority Rev., 5.00%, 9/1/23 (BAM) | 1,435,000 | | 1,618,895 | |
Stockton Public Financing Authority Rev., 6.25%, 10/1/23, Prerefunded at 100% of Par(2) | 1,500,000 | | 1,777,545 | |
Stockton Public Financing Authority Rev., 6.25%, 10/1/23, Prerefunded at 100% of Par(2) | 750,000 | | 888,773 | |
| Stockton Public Financing Authority Rev., 5.00%, 9/1/24 (BAM) | 1,090,000 | | 1,274,221 | |
| Stockton Public Financing Authority Rev., 5.00%, 9/1/25 (BAM) | 2,255,000 | | 2,628,496 | |
| Stockton Public Financing Authority Rev., 5.00%, 9/1/26 (BAM) | 1,495,000 | | 1,734,215 | |
| Stockton Public Financing Authority Rev., 5.00%, 9/1/27 (BAM) | 1,000,000 | | 1,156,310 | |
| Stockton Public Financing Authority Rev., (Stockton Water Rev.), 5.00%, 10/1/30 (BAM) | 1,000,000 | | 1,284,510 | |
| Stockton Public Financing Authority Rev., (Stockton Water Rev.), 5.00%, 10/1/31 (BAM) | 1,000,000 | | 1,274,740 | |
| Stockton Public Financing Authority Special Tax, 4.00%, 9/2/20 (BAM) | 575,000 | | 575,000 | |
| Stockton Public Financing Authority Special Tax, 4.00%, 9/2/21 (BAM) | 450,000 | | 466,659 | |
| Stockton Public Financing Authority Special Tax, 4.00%, 9/2/22 (BAM) | 940,000 | | 1,001,890 | |
| Stockton Public Financing Authority Special Tax, 4.00%, 9/2/23 (BAM) | 655,000 | | 718,771 | |
| Stockton Redevelopment Agency Successor Agency Tax Allocation, 5.00%, 9/1/29 (AGM) | 1,500,000 | | 1,814,655 | |
| Stockton Redevelopment Agency Successor Agency Tax Allocation, 5.00%, 9/1/30 (AGM) | 1,800,000 | | 2,167,434 | |
| Stockton Redevelopment Agency Successor Agency Tax Allocation, 5.00%, 9/1/31 (AGM) | 1,825,000 | | 2,182,517 | |
| Temecula Redevelopment Agency Successor Agency Tax Allocation, 5.00%, 12/15/28 (AGM) | 500,000 | | 642,675 | |
| Temecula Redevelopment Agency Successor Agency Tax Allocation, 5.00%, 12/15/29 (AGM) | 1,155,000 | | 1,472,059 | |
| Temecula Redevelopment Agency Successor Agency Tax Allocation, 5.00%, 12/15/31 (AGM) | 765,000 | | 961,567 | |
| Temecula Redevelopment Agency Successor Agency Tax Allocation, 5.00%, 12/15/32 (AGM) | 750,000 | | 937,448 | |
| Temecula Valley Unified School District Financing Authority Special Tax, 5.00%, 9/1/20 (BAM) | 400,000 | | 400,000 | |
| Temecula Valley Unified School District Financing Authority Special Tax, 5.00%, 9/1/21 (BAM) | 515,000 | | 539,880 | |
| Temecula Valley Unified School District Financing Authority Special Tax, 5.00%, 9/1/22 (BAM) | 275,000 | | 298,469 | |
| Tobacco Securitization Authority of Southern California Rev., 5.00%, 6/1/30 | 1,000,000 | | 1,330,610 | |
| Tracy Community Facilities District Special Tax, (Tracy Community Facilities District No. 2016-01), 5.00%, 9/1/28 | 425,000 | | 498,126 | |
| Tracy Community Facilities District Special Tax, (Tracy Community Facilities District No. 2016-01), 5.00%, 9/1/33 | 1,610,000 | | 1,832,244 | |
| Tracy Community Facilities District Special Tax, (Tracy Community Facilities District No. 2016-01), 5.00%, 9/1/36 | 1,595,000 | | 1,898,385 | |
| | | | | | | | |
| Principal Amount | Value |
| Tracy Community Facilities District Special Tax, (Tracy Community Facilities District No. 2016-01), 5.00%, 9/1/38 | $ | 3,270,000 | | $ | 3,662,629 | |
| Transbay Joint Powers Authority Tax Allocation, (Transbay Joint Powers Authority Transbay Redevelopment Project Tax Increment Re), 5.00%, 10/1/24 | 435,000 | | 495,391 | |
| Transbay Joint Powers Authority Tax Allocation, (Transbay Joint Powers Authority Transbay Redevelopment Project Tax Increment Re), 5.00%, 10/1/26 | 1,185,000 | | 1,409,119 | |
| Transbay Joint Powers Authority Tax Allocation, (Transbay Joint Powers Authority Transbay Redevelopment Project Tax Increment Re), 5.00%, 10/1/28 | 1,310,000 | | 1,610,462 | |
| Transbay Joint Powers Authority Tax Allocation, (Transbay Joint Powers Authority Transbay Redevelopment Project Tax Increment Re), 5.00%, 10/1/30 | 800,000 | | 1,052,992 | |
| Transbay Joint Powers Authority Tax Allocation, (Transbay Joint Powers Authority Transbay Redevelopment Project Tax Increment Re), 5.00%, 10/1/30 | 1,440,000 | | 1,796,126 | |
| Transbay Joint Powers Authority Tax Allocation, (Transbay Joint Powers Authority Transbay Redevelopment Project Tax Increment Re), 5.00%, 10/1/31 | 750,000 | | 929,550 | |
| Transbay Joint Powers Authority Tax Allocation, (Transbay Joint Powers Authority Transbay Redevelopment Project Tax Increment Re), 5.00%, 10/1/33 | 815,000 | | 995,751 | |
| Transbay Joint Powers Authority Tax Allocation, (Transbay Joint Powers Authority Transbay Redevelopment Project Tax Increment Re), 5.00%, 10/1/33 | 1,000,000 | | 1,291,090 | |
| Transbay Joint Powers Authority Tax Allocation, (Transbay Joint Powers Authority Transbay Redevelopment Project Tax Increment Re), 5.00%, 10/1/34 | 300,000 | | 364,869 | |
| Transbay Joint Powers Authority Tax Allocation, (Transbay Joint Powers Authority Transbay Redevelopment Project Tax Increment Re), 5.00%, 10/1/35 | 300,000 | | 363,207 | |
| Transbay Joint Powers Authority Tax Allocation, (Transbay Joint Powers Authority Transbay Redevelopment Project Tax Increment Re), 5.00%, 10/1/37 | 700,000 | | 889,854 | |
| Transbay Joint Powers Authority Tax Allocation, (Transbay Joint Powers Authority Transbay Redevelopment Project Tax Increment Re), 5.00%, 10/1/38 | 320,000 | | 381,994 | |
| Transbay Joint Powers Authority Tax Allocation, (Transbay Joint Powers Authority Transbay Redevelopment Project Tax Increment Re), 5.00%, 10/1/39 | 1,000,000 | | 1,263,340 | |
| Truckee Redevelopment Successor Agency Tax Allocation, 4.00%, 9/1/32 (AGM) | 330,000 | | 405,587 | |
| Tulare Local Health Care District GO, 4.00%, 8/1/26 (BAM) | 515,000 | | 606,310 | |
| Tulare Local Health Care District GO, 4.00%, 8/1/27 (BAM) | 585,000 | | 699,631 | |
| Tulare Local Health Care District GO, 4.00%, 8/1/28 (BAM) | 435,000 | | 526,463 | |
| Tulare Local Health Care District GO, 4.00%, 8/1/29 (BAM) | 740,000 | | 904,835 | |
| Tulare Local Health Care District GO, 4.00%, 8/1/31 (BAM) | 1,245,000 | | 1,516,846 | |
| Tulare Local Health Care District GO, 4.00%, 8/1/32 (BAM) | 690,000 | | 830,484 | |
| Tulare Local Health Care District GO, 4.00%, 8/1/34 (BAM) | 1,550,000 | | 1,840,454 | |
| Tulare Local Health Care District GO, 4.00%, 8/1/35 (BAM) | 650,000 | | 768,157 | |
| Tustin Community Facilities District Special Tax, (Tustin Community Facilities District No. 2006-1), 5.00%, 9/1/28 | 1,000,000 | | 1,199,650 | |
| Tustin Community Facilities District Special Tax, (Tustin Community Facilities District No. 2006-1), 5.00%, 9/1/30 | 1,000,000 | | 1,190,440 | |
University of California Rev., 5.00%, 5/15/22, Prerefunded at 100% of Par(2) | 2,840,000 | | 3,072,113 | |
University of California Rev., 5.00%, 5/15/23, Prerefunded at 100% of Par(2) | 1,395,000 | | 1,572,974 | |
| University of California Rev., 4.00%, 5/15/26 | 2,415,000 | | 2,922,005 | |
| University of California Rev., 5.00%, 5/15/26 | 3,310,000 | | 3,580,030 | |
| | | | | | | | |
| Principal Amount | Value |
| University of California Rev., 5.00%, 5/15/32 | $ | 3,750,000 | | $ | 5,136,487 | |
| University of California Rev., 5.00%, 5/15/33 | 1,000,000 | | 1,358,890 | |
| University of California Rev., VRDN, 0.01%, 9/1/20 | 5,500,000 | | 5,500,000 | |
| University of California Rev., VRDN, 0.01%, 9/1/20 | 300,000 | | 300,000 | |
| University of California Rev., VRDN, 0.01%, 9/1/20 | 600,000 | | 600,000 | |
| University of California Rev., VRN, 5.00%, 5/15/48 | 5,000,000 | | 5,631,450 | |
| University of California Hastings College of the Law Rev., 5.00%, 4/1/31 (AGM) | 1,045,000 | | 1,287,210 | |
| Upland COP, (San Antonio Regional Hospital Obligated Group), 5.00%, 1/1/29 | 1,510,000 | | 1,842,472 | |
| Upland COP, (San Antonio Regional Hospital Obligated Group), 5.00%, 1/1/32 | 1,475,000 | | 1,751,267 | |
| Upland COP, (San Antonio Regional Hospital Obligated Group), 4.00%, 1/1/36 | 1,000,000 | | 1,057,500 | |
| Walnut Energy Center Authority Rev., 5.00%, 1/1/35 | 2,000,000 | | 2,648,620 | |
| Walnut Energy Center Authority Rev., 5.00%, 1/1/36 | 2,000,000 | | 2,634,640 | |
| West Contra Costa Unified School District GO, 5.00%, 8/1/30 | 2,000,000 | | 2,307,280 | |
| West Contra Costa Unified School District GO, 5.00%, 8/1/33 | 3,000,000 | | 3,442,440 | |
| West Contra Costa Unified School District GO, 5.00%, 8/1/35 | 1,500,000 | | 1,717,155 | |
| West Hollywood Public Financing Authority Rev., (West Hollywood), 4.00%, 4/1/36 | 2,000,000 | | 2,418,800 | |
| West Valley-Mission Community College District GO, 4.00%, 8/1/34 | 625,000 | | 770,406 | |
| West Valley-Mission Community College District GO, 4.00%, 8/1/35 | 600,000 | | 734,682 | |
| West Valley-Mission Community College District GO, 4.00%, 8/1/36 | 1,230,000 | | 1,499,505 | |
| Western Placer Unified School District Special Tax, 2.00%, 6/1/25 | 1,200,000 | | 1,238,604 | |
| Western Placer Unified School District Special Tax, 2.00%, 6/1/25 | 2,850,000 | | 2,929,116 | |
| Western Riverside Water & Wastewater Financing Authority Rev., 5.00%, 9/1/24 | 1,685,000 | | 1,950,994 | |
| Western Riverside Water & Wastewater Financing Authority Rev., 5.00%, 9/1/25 | 1,170,000 | | 1,394,862 | |
Yosemite Community College District GO, Capital Appreciation, 0.00%, 8/1/31(1) | 2,210,000 | | 1,811,868 | |
| | 1,998,003,930 | |
| Guam — 0.2% | | |
| Guam Government Waterworks Authority Rev., 5.00%, 7/1/21 | 300,000 | | 309,768 | |
| Guam Government Waterworks Authority Rev., 5.00%, 7/1/22 | 325,000 | | 347,965 | |
| Guam Government Waterworks Authority Rev., 5.00%, 7/1/23 | 500,000 | | 553,475 | |
| Guam Government Waterworks Authority Rev., 5.00%, 7/1/24 | 350,000 | | 399,651 | |
| Guam Government Waterworks Authority Rev., 5.00%, 7/1/25 | 350,000 | | 410,620 | |
| Guam Government Waterworks Authority Rev., 5.00%, 7/1/26 | 500,000 | | 599,430 | |
| Guam Government Waterworks Authority Rev., 5.00%, 7/1/27 | 900,000 | | 1,100,061 | |
| | 3,720,970 | |
TOTAL INVESTMENT SECURITIES — 99.6%
(Cost $1,872,900,168) | | 2,001,724,900 | |
| OTHER ASSETS AND LIABILITIES — 0.4% | | 8,574,800 | |
| TOTAL NET ASSETS — 100.0% | | $ | 2,010,299,700 | |
| | | | | | | | |
| NOTES TO SCHEDULE OF INVESTMENTS | | |
| AGC | - | Assured Guaranty Corporation |
| AGM | - | Assured Guaranty Municipal Corporation |
| BAM | - | Build America Mutual Assurance Company |
| BAM-TCRS | - | Build America Mutual Assurance Company - Transferrable Custodial Receipts |
| COP | - | Certificates of Participation |
| GA | - | Guaranty Agreement |
| GO | - | General Obligation |
| LIBOR | - | London Interbank Offered Rate |
| LOC | - | Letter of Credit |
| MUNIPSA | - | SIFMA Municipal Swap Index |
| NATL | - | National Public Finance Guarantee Corporation |
| SBBPA | - | Standby Bond Purchase Agreement |
| VRDN | - | Variable Rate Demand Note. The instrument may be payable upon demand and adjusts periodically based upon the terms set forth in the security's offering documents. The rate shown is effective at the period end and the reference rate and spread, if any, is indicated. The date of the demand feature is disclosed. |
| VRN | - | Variable Rate Note. The rate adjusts periodically based upon the terms set forth in the security’s offering documents. The rate shown is effective at the period end and the reference rate and spread, if any, is indicated. The security's effective maturity date may be shorter than the final maturity date shown. |
(1)Security is a zero-coupon bond. Zero-coupon securities are issued at a substantial discount from their value at maturity.
(2)Escrowed to maturity in U.S. government securities or state and local government securities.
(3)Security was purchased pursuant to Rule 144A under the Securities Act of 1933 and may be sold in transactions exempt from registration, normally to qualified institutional investors. The aggregate value of these securities at the period end was $34,521,483, which represented 1.7% of total net assets.
(4)When-issued security. The issue price and yield are fixed on the date of the commitment, but payment and delivery are scheduled for a future date.
See Notes to Financial Statements.
| | |
| Statement of Assets and Liabilities |
| | | | | |
| AUGUST 31, 2020 | |
| Assets | |
| Investment securities, at value (cost of $1,872,900,168) | $ | 2,001,724,900 | |
| Cash | 257,733 | |
| Receivable for investments sold | 8,118,500 | |
| Receivable for capital shares sold | 867,807 | |
| Interest receivable | 21,429,989 | |
| 2,032,398,929 | |
| |
| Liabilities | |
| Payable for investments purchased | 18,803,660 | |
| Payable for capital shares redeemed | 2,014,918 | |
| Accrued management fees | 595,281 | |
| Distribution and service fees payable | 14,584 | |
| Dividends payable | 670,786 | |
| 22,099,229 | |
| |
| Net Assets | $ | 2,010,299,700 | |
| |
| Net Assets Consist of: | |
| Capital paid in | $ | 1,885,165,027 | |
| Distributable earnings | 125,134,673 | |
| $ | 2,010,299,700 | |
| | | | | | | | | | | |
| | Net Assets | Shares Outstanding | Net Asset Value Per Share |
| Investor Class | $887,524,803 | 72,914,342 | $12.17 |
| I Class | $838,638,817 | 68,883,199 | $12.17 |
| Y Class | $252,097,957 | 20,706,076 | $12.18 |
| A Class | $20,507,109 | 1,684,023 | $12.18* |
| C Class | $11,531,014 | 946,618 | $12.18 |
*Maximum offering price $12.75 (net asset value divided by 0.955).
See Notes to Financial Statements.
| | | | | |
| YEAR ENDED AUGUST 31, 2020 | |
| Investment Income (Loss) | |
| Income: | |
| Interest | $ | 54,232,557 | |
| |
| Expenses: | |
| Management fees | 7,454,729 | |
| Distribution and service fees: | |
| A Class | 50,236 | |
| C Class | 135,805 | |
| Trustees' fees and expenses | 152,456 | |
| Other expenses | 247 | |
| 7,793,473 | |
| |
| Net investment income (loss) | 46,439,084 | |
| |
| Realized and Unrealized Gain (Loss) | |
| Net realized gain (loss) on investment transactions | (2,381,069) | |
| Change in net unrealized appreciation (depreciation) on investments | (9,056,268) | |
| |
| Net realized and unrealized gain (loss) | (11,437,337) | |
| |
| Net Increase (Decrease) in Net Assets Resulting from Operations | $ | 35,001,747 | |
See Notes to Financial Statements.
| | |
| Statement of Changes in Net Assets |
| | | | | | | | |
| YEARS ENDED AUGUST 31, 2020 AND AUGUST 31, 2019 | | |
| Increase (Decrease) in Net Assets | August 31, 2020 | August 31, 2019 |
| Operations | | |
| Net investment income (loss) | $ | 46,439,084 | | $ | 46,588,676 | |
| Net realized gain (loss) | (2,381,069) | | 1,921,403 | |
| Change in net unrealized appreciation (depreciation) | (9,056,268) | | 81,656,268 | |
| Net increase (decrease) in net assets resulting from operations | 35,001,747 | | 130,166,347 | |
| | |
| Distributions to Shareholders | | |
| From earnings: | | |
| Investor Class | (26,421,416) | | (29,171,085) | |
| I Class | (20,159,657) | | (17,228,314) | |
| Y Class | (1,975,018) | | (246,575) | |
| A Class | (432,114) | | (511,424) | |
| C Class | (192,153) | | (239,644) | |
| Decrease in net assets from distributions | (49,180,358) | | (47,397,042) | |
| | |
| Capital Share Transactions | | |
| Net increase (decrease) in net assets from capital share transactions (Note 5) | 84,053,317 | | 142,187,251 | |
| | |
| Net increase (decrease) in net assets | 69,874,706 | | 224,956,556 | |
| | |
| Net Assets | | |
| Beginning of period | 1,940,424,994 | | 1,715,468,438 | |
| End of period | $ | 2,010,299,700 | | $ | 1,940,424,994 | |
| | |
| | |
See Notes to Financial Statements.
| | |
| Notes to Financial Statements |
AUGUST 31, 2020
1. Organization
American Century California Tax-Free and Municipal Funds (the trust) is registered under the Investment Company Act of 1940, as amended (the 1940 Act), as an open-end management investment company and is organized as a Massachusetts business trust. California Intermediate-Term Tax-Free Bond Fund (the fund) is one fund in a series issued by the trust. The fund’s investment objective is to seek safety of principal and high current income that is exempt from federal and California income taxes.
The fund offers the Investor Class, I Class, Y Class, A Class and C Class. The A Class may incur an initial sales charge. The A Class and C Class may be subject to a contingent deferred sales charge.
2. Significant Accounting Policies
The following is a summary of significant accounting policies consistently followed by the fund in preparation of its financial statements. The fund is an investment company and follows accounting and reporting guidance in accordance with accounting principles generally accepted in the United States of America. This may require management to make certain estimates and assumptions at the date of the financial statements. Actual results could differ from these estimates. Management evaluated the impact of events or transactions occurring through the date the financial statements were issued that would merit recognition or disclosure.
Investment Valuations — The fund determines the fair value of its investments and computes its net asset value per share at the close of regular trading (usually 4 p.m. Eastern time) on the New York Stock Exchange (NYSE) on each day the NYSE is open. The Board of Trustees has adopted valuation policies and procedures to guide the investment advisor in the fund’s investment valuation process and to provide methodologies for the oversight of the fund’s pricing function.
Fixed income securities are valued at the evaluated mean as provided by independent pricing services or at the mean of the most recent bid and asked prices as provided by investment dealers. Municipal securities are valued using market models that consider trade data, quotations from dealers and active market makers, relevant yield curve and spread data, creditworthiness, trade data or market information on comparable securities, and other relevant security specific information.
If the fund determines that the market price for an investment is not readily available or the valuation methods mentioned above do not reflect an investment’s fair value, such investment is valued as determined in good faith by the Board of Trustees or its delegate, in accordance with policies and procedures adopted by the Board of Trustees. In its determination of fair value, the fund may review several factors including, but not limited to, market information regarding the specific investment or comparable investments and correlation with other investment types, futures indices or general market indicators. Circumstances that may cause the fund to use these procedures to value an investment include, but are not limited to: an investment has been declared in default or is distressed; trading in a security has been suspended during the trading day or a security is not actively trading on its principal exchange; prices received from a regular pricing source are deemed unreliable; or there is a foreign market holiday and no trading occurred.
The fund monitors for significant events occurring after the close of an investment’s primary exchange but before the fund’s net asset value per share is determined. Significant events may include, but are not limited to: corporate announcements and transactions; governmental action and political unrest that could impact a specific investment or an investment sector; or armed conflicts, natural disasters and similar events that could affect investments in a specific country or region.
Security Transactions — Security transactions are accounted for as of the trade date. Net realized gains and losses are determined on the identified cost basis, which is also used for federal income tax purposes.
Investment Income — Interest income is recorded on the accrual basis and includes paydown gain (loss) and accretion of discounts and amortization of premiums.
Segregated Assets — In accordance with the 1940 Act, the fund segregates assets on its books and records to cover certain types of investment securities and other financial instruments. American Century Investment Management, Inc. (ACIM) (the investment advisor) monitors, on a daily basis, the securities segregated to ensure the fund designates a sufficient amount of liquid assets, marked-to-market daily. The fund may also receive assets or be required to pledge assets at the custodian bank or with a broker for collateral requirements.
Income Tax Status — It is the fund’s policy to distribute substantially all net investment income and net realized gains to shareholders and to otherwise qualify as a regulated investment company under provisions of the Internal Revenue Code. Accordingly, no provision has been made for income taxes. The fund files U.S. federal, state, local and non-U.S. tax returns as applicable. The fund's tax returns are subject to examination by the relevant taxing authority until expiration of the applicable statute of limitations, which is generally three years from the date of filing but can be longer in certain jurisdictions. At this time, management believes there are no uncertain tax positions which, based on their technical merit, would not be sustained upon examination and for which it is reasonably possible that the total amounts of unrecognized tax benefits will significantly change in the next twelve months.
Multiple Class — All shares of the fund represent an equal pro rata interest in the net assets of the class to which such shares belong, and have identical voting, dividend, liquidation and other rights and the same terms and conditions, except for class specific expenses and exclusive rights to vote on matters affecting only individual classes. Income, non-class specific expenses, and realized and unrealized capital gains and losses of the fund are allocated to each class of shares based on their relative net assets.
Distributions to Shareholders — Distributions from net investment income, if any, are declared daily and paid monthly. Distributions from net realized gains, if any, are generally declared and paid annually.
Indemnifications — Under the trust’s organizational documents, its officers and trustees are indemnified against certain liabilities arising out of the performance of their duties to the fund. In addition, in the normal course of business, the fund enters into contracts that provide general indemnifications. The maximum exposure under these arrangements is unknown as this would involve future claims that may be made against a fund. The risk of material loss from such claims is considered by management to be remote.
3. Fees and Transactions with Related Parties
Certain officers and trustees of the trust are also officers and/or directors of American Century Companies, Inc. (ACC). The trust's investment advisor, ACIM, the trust's distributor, American Century Investment Services, Inc. (ACIS), and the trust's transfer agent, American Century Services, LLC, are wholly owned, directly or indirectly, by ACC.
Management Fees — The trust has entered into a management agreement with ACIM, under which ACIM provides the fund with investment advisory and management services in exchange for a single, unified management fee (the fee) per class. The agreement provides that ACIM will pay all expenses of managing and operating the fund, except brokerage expenses, taxes, interest, fees and expenses of the independent trustees (including legal counsel fees), extraordinary expenses, and expenses incurred in connection with the provision of shareholder services and distribution services under a plan adopted pursuant to Rule 12b-1 under the 1940 Act. The fee is computed and accrued daily based on each class's daily net assets and paid monthly in arrears. The difference in the fee among the classes is a result of their separate arrangements for non-Rule 12b-1 shareholder services. It is not the result of any difference in advisory or custodial fees or other expenses related to the management of the fund’s assets, which do not vary by class. The fee consists of (1) an Investment Category Fee based on the daily net assets of the fund and certain other accounts managed by the investment advisor that are in the same broad investment category as the fund and (2) a Complex Fee based on the assets of all the funds in the American Century Investments family of funds.
The Investment Category Fee range, the Complex Fee range and the effective annual management fee for each class for the period ended August 31, 2020 are as follows:
| | | | | | | | | | | |
| Investment Category Fee Range | Complex Fee Range | Effective Annual Management Fee |
| Investor Class | 0.1625%
to 0.2800% | 0.2500% to 0.3100% | 0.46% |
| I Class | | 0.0500% to 0.1100% | 0.26% |
| Y Class | | 0.0200% to 0.0800% | 0.23% |
| A Class | | 0.2500% to 0.3100% | 0.46% |
| C Class | | 0.2500% to 0.3100% | 0.46% |
Distribution and Service Fees — The Board of Trustees has adopted a separate Master Distribution and Individual Shareholder Services Plan for each of the A Class and C Class (collectively the plans), pursuant to Rule 12b-1 of the 1940 Act. The plans provide that the A Class will pay ACIS an annual distribution and service fee of 0.25%. The plans provide that the C Class will pay ACIS an annual distribution and service fee of 1.00%, of which 0.25% is paid for individual shareholder services and 0.75% is paid for distribution services. The fees are computed and accrued daily based on each class’s daily net assets and paid monthly in arrears. The fees are used to pay financial intermediaries for distribution and individual shareholder services. Fees incurred under the plans during the period ended August 31, 2020 are detailed in the Statement of Operations.
Trustees’ Fees and Expenses — The Board of Trustees is responsible for overseeing the investment advisor’s management and operations of the fund. The trustees receive detailed information about the fund and its investment advisor regularly throughout the year, and meet at least quarterly with management of the investment advisor to review reports about fund operations. The fund’s officers do not receive compensation from the fund.
Interfund Transactions — The fund may enter into security transactions with other American Century Investments funds and other client accounts of the investment advisor, in accordance with the 1940 Act rules and procedures adopted by the Board of Trustees. The rules and procedures require, among other things, that these transactions be effected at the independent current market price of the security. During the period, the interfund purchases and sales were $45,500,000 and $47,495,000, respectively. The interfund transactions had no effect on the Statement of Operations in net realized gain (loss) on investment transactions.
4. Investment Transactions
Purchases and sales of investment securities, excluding short-term investments, for the period ended August 31, 2020 were $892,242,267 and $791,449,744, respectively.
5. Capital Share Transactions
Transactions in shares of the fund were as follows (unlimited number of shares authorized):
| | | | | | | | | | | | | | |
| Year ended
August 31, 2020 | | Year ended
August 31, 2019 | |
| Shares | Amount | Shares | Amount |
| Investor Class | | | | |
| Sold | 18,190,546 | | $ | 219,851,997 | | 24,621,877 | | $ | 290,107,076 | |
| Issued in reinvestment of distributions | 1,592,022 | | 19,237,974 | | 1,806,888 | | 21,344,203 | |
| Redeemed | (41,615,838) | | (495,626,417) | | (29,478,055) | | (346,207,121) | |
| (21,833,270) | | (256,536,446) | | (3,049,290) | | (34,755,842) | |
| I Class | | | | |
| Sold | 24,061,902 | | 289,763,690 | | 32,410,824 | | 380,925,733 | |
| Issued in reinvestment of distributions | 1,650,730 | | 19,951,982 | | 1,429,728 | | 16,934,188 | |
| Redeemed | (16,842,041) | | (200,511,428) | | (18,892,785) | | (221,485,726) | |
| 8,870,591 | | 109,204,244 | | 14,947,767 | | 176,374,195 | |
| Y Class | | | | |
| Sold | 20,917,830 | | 248,732,941 | | 468,794 | | 5,525,634 | |
| Issued in reinvestment of distributions | 28,593 | | 345,500 | | 20,808 | | 246,575 | |
| Redeemed | (1,158,240) | | (13,943,525) | | (160,758) | | (1,888,292) | |
| 19,788,183 | | 235,134,916 | | 328,844 | | 3,883,917 | |
| A Class | | | | |
| Sold | 413,103 | | 4,954,622 | | 538,059 | | 6,357,771 | |
| Issued in reinvestment of distributions | 34,738 | | 419,980 | | 42,195 | | 499,252 | |
| Redeemed | (530,296) | | (6,304,465) | | (646,166) | | (7,687,880) | |
| (82,455) | | (929,863) | | (65,912) | | (830,857) | |
| C Class | | | | |
| Sold | 129,702 | | 1,574,469 | | 159,709 | | 1,883,932 | |
| Issued in reinvestment of distributions | 14,138 | | 170,986 | | 17,581 | | 207,725 | |
| Redeemed | (378,224) | | (4,564,989) | | (388,837) | | (4,575,819) | |
| (234,384) | | (2,819,534) | | (211,547) | | (2,484,162) | |
| Net increase (decrease) | 6,508,665 | | $ | 84,053,317 | | 11,949,862 | | $ | 142,187,251 | |
6. Fair Value Measurements
The fund’s investments valuation process is based on several considerations and may use multiple inputs to determine the fair value of the investments held by the fund. In conformity with accounting principles generally accepted in the United States of America, the inputs used to determine a valuation are classified into three broad levels.
•Level 1 valuation inputs consist of unadjusted quoted prices in an active market for identical investments.
•Level 2 valuation inputs consist of direct or indirect observable market data (including quoted prices for comparable investments, evaluations of subsequent market events, interest rates, prepayment speeds, credit risk, etc.). These inputs also consist of quoted prices for identical investments initially expressed in local currencies that are adjusted through translation into U.S. dollars.
•Level 3 valuation inputs consist of unobservable data (including a fund’s own assumptions).
The level classification is based on the lowest level input that is significant to the fair valuation measurement. The valuation inputs are not necessarily an indication of the risks associated with investing in these securities or other financial instruments.
As of period end, the fund’s investment securities were classified as Level 2. The Schedule of Investments provides additional information on the fund’s portfolio holdings.
7. Risk Factors
The novel coronavirus (COVID-19) pandemic has significantly stressed the financial resources of many municipal issuers, which may impair a municipal issuer's ability to meet its financial obligations when due and could adversely impact the value of its bonds, which could negatively impact the performance of the fund.
The fund focuses its investments in a single state and therefore may have more exposure to credit risk related to the state of California than a fund with a broader geographical diversification.
The fund may invest in instruments that have variable or floating coupon rates based on the London Interbank Offered Rate (LIBOR). LIBOR is a benchmark interest rate intended to be representative of the rate at which certain major international banks lend to one another over short-terms. LIBOR will be phased out by the end of 2021. Uncertainty remains regarding a replacement rate or rates for LIBOR. The transition process may lead to increased volatility or illiquidity in markets for instruments that rely on LIBOR. This could result in a change to the value of such instruments.
8. Federal Tax Information
The tax character of distributions paid during the years ended August 31, 2020 and August 31, 2019 were as follows:
| | | | | | | | |
| 2020 | 2019 |
| Distributions Paid From | | |
| Exempt income | $ | 46,175,830 | $ | 46,467,231 |
| Taxable ordinary income | $ | 14,408 | — |
| Long-term capital gains | $ | 2,990,120 | $ | 929,811 |
The book-basis character of distributions made during the year from net investment income or net realized gains may differ from their ultimate characterization for federal income tax purposes. These differences reflect the differing character of certain income items and net realized gains and losses for financial statement and tax purposes, and may result in reclassification among certain capital accounts on the financial statements.
As of period end, the federal tax cost of investments and the components of distributable earnings on a tax-basis were as follows:
| | | | | |
| Federal tax cost of investments | $ | 1,872,912,080 | |
| Gross tax appreciation of investments | $ | 131,104,442 | |
| Gross tax depreciation of investments | (2,291,622) | |
| Net tax appreciation (depreciation) of investments | $ | 128,812,820 | |
| Other book-to-tax adjustments | $ | (1,137) | |
| Undistributed exempt income | — | |
| Post-October capital loss deferral | $ | (3,677,010) | |
The difference between book-basis and tax-basis unrealized appreciation (depreciation) is attributable primarily to the tax deferral of losses on wash sales.
Loss deferrals represent certain qualified losses that the fund has elected to treat as having been incurred in the following fiscal year for federal income tax purposes.
9. Recently Issued Accounting Standards
In March 2017, the Financial Accounting Standards Board (FASB) issued Accounting Standards Update No. 2017-08, “Receivables - Nonrefundable Fees and Other Costs (Subtopic 310-20), Premium Amortization on Purchased Callable Debt Securities” (ASU 2017-08). ASU 2017-08 amends the amortization period for certain purchased callable debt securities held at a premium, shortening such period to the earliest call date. The amendments are effective for fiscal years, and interim periods within those fiscal years, beginning after December 15, 2018. The adoption of ASU 2017-08 did not materially impact the financial statements.
| | | | | | | | | | | | | | | | | | | | | | | | | | | | | | | | | | | | | | | | | |
| For a Share Outstanding Throughout the Years Ended August 31 (except as noted) | | | | | | | | | | | | | |
| Per-Share Data | | | | | | | | | | Ratios and Supplemental Data | | | |
| | | Income From Investment Operations: | | | Distributions From: | | | | | Ratio to Average Net Assets of: | | | |
| | Net Asset
Value,
Beginning
of Period | Net Investment Income (Loss)(1) | Net
Realized and Unrealized
Gain (Loss) | Total From Investment Operations | Net
Investment Income | Net
Realized Gains | Total Distributions | Net Asset
Value,
End of Period | Total Return(2) | Operating Expenses | Net
Investment Income
(Loss) | Portfolio Turnover
Rate | Net Assets,
End of Period
(in thousands) |
| Investor Class | | | | | | | | | | | | | |
| 2020 | $12.23 | 0.27 | (0.04) | 0.23 | (0.27) | (0.02) | (0.29) | $12.17 | 1.93% | 0.47% | 2.26% | 40% | $887,525 | |
| 2019 | $11.69 | 0.30 | 0.55 | 0.85 | (0.30) | (0.01) | (0.31) | $12.23 | 7.29% | 0.47% | 2.56% | 54% | $1,158,927 | |
| 2018 | $12.00 | 0.30 | (0.31) | (0.01) | (0.30) | — | (0.30) | $11.69 | 0.03% | 0.47% | 2.56% | 52% | $1,143,719 | |
| 2017 | $12.24 | 0.29 | (0.24) | 0.05 | (0.29) | — | (0.29) | $12.00 | 0.46% | 0.47% | 2.43% | 52% | $1,196,600 | |
| 2016 | $11.85 | 0.28 | 0.39 | 0.67 | (0.28) | — | (0.28) | $12.24 | 5.74% | 0.47% | 2.34% | 23% | $1,301,751 | |
| I Class | | | | | | | | | | | | | |
| 2020 | $12.23 | 0.30 | (0.04) | 0.26 | (0.30) | (0.02) | (0.32) | $12.17 | 2.05% | 0.27% | 2.46% | 40% | $838,639 | |
| 2019 | $11.70 | 0.32 | 0.55 | 0.87 | (0.33) | (0.01) | (0.34) | $12.23 | 7.59% | 0.27% | 2.76% | 54% | $734,197 | |
| 2018 | $12.00 | 0.32 | (0.29) | 0.03 | (0.33) | — | (0.33) | $11.70 | 0.23% | 0.27% | 2.76% | 52% | $527,123 | |
| 2017 | $12.24 | 0.31 | (0.24) | 0.07 | (0.31) | — | (0.31) | $12.00 | 0.66% | 0.27% | 2.63% | 52% | $378,363 | |
| 2016 | $11.85 | 0.31 | 0.39 | 0.70 | (0.31) | — | (0.31) | $12.24 | 5.95% | 0.27% | 2.54% | 23% | $298,010 | |
| Y Class | | | | | | | | | | | | | |
| 2020 | $12.23 | 0.30 | (0.03) | 0.27 | (0.30) | (0.02) | (0.32) | $12.18 | 2.17% | 0.24% | 2.49% | 40% | $252,098 | |
| 2019 | $11.70 | 0.33 | 0.54 | 0.87 | (0.33) | (0.01) | (0.34) | $12.23 | 7.53% | 0.24% | 2.79% | 54% | $11,228 | |
| 2018 | $12.00 | 0.33 | (0.30) | 0.03 | (0.33) | — | (0.33) | $11.70 | 0.26% | 0.24% | 2.79% | 52% | $6,889 | |
2017(3) | $11.78 | 0.12 | 0.23 | 0.35 | (0.13) | — | (0.13) | $12.00 | 2.94% | 0.24%(4) | 2.62%(4) | 52%(5) | $6,233 | |
| | | | | | | | | | | | | | | | | | | | | | | | | | | | | | | | | | | | | | | | | |
| For a Share Outstanding Throughout the Years Ended August 31 (except as noted) | | | | | | | | | | | | | |
| Per-Share Data | | | | | | | | | | Ratios and Supplemental Data | | | |
| | | Income From Investment Operations: | | | Distributions From: | | | | | Ratio to Average Net Assets of: | | | |
| | Net Asset
Value,
Beginning
of Period | Net Investment Income (Loss)(1) | Net
Realized and Unrealized
Gain (Loss) | Total From Investment Operations | Net
Investment Income | Net
Realized Gains | Total Distributions | Net Asset
Value,
End of Period | Total Return(2) | Operating Expenses | Net
Investment Income
(Loss) | Portfolio Turnover
Rate | Net Assets,
End of Period
(in thousands) |
| A Class | | | | | | | | | | | | | |
| 2020 | $12.24 | 0.24 | (0.04) | 0.20 | (0.24) | (0.02) | (0.26) | $12.18 | 1.68% | 0.72% | 2.01% | 40% | $20,507 | |
| 2019 | $11.70 | 0.27 | 0.55 | 0.82 | (0.27) | (0.01) | (0.28) | $12.24 | 7.11% | 0.72% | 2.31% | 54% | $21,617 | |
| 2018 | $12.00 | 0.27 | (0.30) | (0.03) | (0.27) | — | (0.27) | $11.70 | (0.22)% | 0.72% | 2.31% | 52% | $21,438 | |
| 2017 | $12.24 | 0.26 | (0.24) | 0.02 | (0.26) | — | (0.26) | $12.00 | 0.21% | 0.72% | 2.18% | 52% | $22,836 | |
| 2016 | $11.85 | 0.25 | 0.39 | 0.64 | (0.25) | — | (0.25) | $12.24 | 5.47% | 0.72% | 2.09% | 23% | $47,126 | |
| C Class | | | | | | | | | | | | | |
| 2020 | $12.24 | 0.15 | (0.04) | 0.11 | (0.15) | (0.02) | (0.17) | $12.18 | 0.92% | 1.47% | 1.26% | 40% | $11,531 | |
| 2019 | $11.70 | 0.18 | 0.55 | 0.73 | (0.18) | (0.01) | (0.19) | $12.24 | 6.22% | 1.47% | 1.56% | 54% | $14,457 | |
| 2018 | $12.01 | 0.18 | (0.31) | (0.13) | (0.18) | — | (0.18) | $11.70 | (0.96)% | 1.47% | 1.56% | 52% | $16,299 | |
| 2017 | $12.24 | 0.17 | (0.23) | (0.06) | (0.17) | — | (0.17) | $12.01 | (0.46)% | 1.47% | 1.43% | 52% | $16,929 | |
| 2016 | $11.86 | 0.16 | 0.38 | 0.54 | (0.16) | — | (0.16) | $12.24 | 4.60% | 1.47% | 1.34% | 23% | $21,058 | |
| | |
| Notes to Financial Highlights |
(1)Computed using average shares outstanding throughout the period.
(2)Total returns are calculated based on the net asset value of the last business day and do not reflect applicable sales charges, if any. Total returns for periods less than one year are not annualized.
(3)April 10, 2017 (commencement of sale) through August 31, 2017.
(4)Annualized.
(5)Portfolio turnover is calculated at the fund level. Percentage indicated was calculated for the year ended August 31, 2017.
See Notes to Financial Statements.
| | |
| Report of Independent Registered Public Accounting Firm |
To the Board of Trustees of American Century California Tax-Free and Municipal Funds and Shareholders of California Intermediate-Term Tax-Free Bond Fund
Opinion on the Financial Statements
We have audited the accompanying statement of assets and liabilities, including the schedule of investments, of California Intermediate-Term Tax-Free Bond Fund (one of the funds constituting American Century California Tax-Free and Municipal Funds, referred to hereafter as the "Fund") as of August 31, 2020, the related statement of operations for the year ended August 31, 2020, the statement of changes in net assets for each of the two years in the period ended August 31, 2020, including the related notes, and the financial highlights for each of the periods indicated therein (collectively referred to as the “financial statements”). In our opinion, the financial statements present fairly, in all material respects, the financial position of the Fund as of August 31, 2020, the results of its operations for the year then ended, the changes in its net assets for each of the two years in the period ended August 31, 2020 and the financial highlights for each of the periods indicated therein in conformity with accounting principles generally accepted in the United States of America.
Basis for Opinion
These financial statements are the responsibility of the Fund’s management. Our responsibility is to express an opinion on the Fund’s financial statements based on our audits. We are a public accounting firm registered with the Public Company Accounting Oversight Board (United States) (PCAOB) and are required to be independent with respect to the Fund in accordance with the U.S. federal securities laws and the applicable rules and regulations of the Securities and Exchange Commission and the PCAOB.
We conducted our audits of these financial statements in accordance with the standards of the PCAOB. Those standards require that we plan and perform the audit to obtain reasonable assurance about whether the financial statements are free of material misstatement, whether due to error or fraud.
Our audits included performing procedures to assess the risks of material misstatement of the financial statements, whether due to error or fraud, and performing procedures that respond to those risks. Such procedures included examining, on a test basis, evidence regarding the amounts and disclosures in the financial statements. Our audits also included evaluating the accounting principles used and significant estimates made by management, as well as evaluating the overall presentation of the financial statements. Our procedures included confirmation of securities owned as of August 31, 2020 by correspondence with the custodian and brokers; when replies were not received from brokers, we performed other auditing procedures. We believe that our audits provide a reasonable basis for our opinion.
/s/ PricewaterhouseCoopers LLP
Kansas City, Missouri
October 16, 2020
We have served as the auditor of one or more investment companies in American Century Investments since 1997.
Board of Trustees
The individuals listed below serve as trustees of the funds. Each trustee will continue to serve in this capacity until death, retirement, resignation or removal from office. The board has adopted a mandatory retirement age for trustees who are not “interested persons,” as that term is defined in the Investment Company Act (independent trustees). Independent trustees shall retire on December 31 of the year in which they reach their 75th birthday; provided, however, that on or after January 1, 2022, independent trustees shall retire on December 31 of the year in which they reach their 76th birthday.
Mr. Thomas is an “interested person” because he currently serves as President and Chief Executive Officer of American Century Companies, Inc. (ACC), the parent company of American Century Investment Management, Inc. (ACIM or the advisor). The other trustees (more than three-fourths of the total number) are independent. They are not employees, directors or officers of, and have no financial interest in, ACC or any of its wholly owned, direct or indirect, subsidiaries, including ACIM, American Century Investment Services, Inc. (ACIS) and American Century Services, LLC (ACS), and they do not have any other affiliations, positions or relationships that would cause them to be considered “interested persons” under the Investment Company Act. The trustees serve in this capacity for eight (in the case of Jonathan S. Thomas, 16; and Ronald J. Gilson, 9) registered investment companies in the American Century Investments family of funds.
The following table presents additional information about the trustees. The mailing address for each trustee other than Mr. Thomas is 1665 Charleston Road, Mountain View, California 94043. The mailing address for Mr. Thomas is 4500 Main Street, Kansas City, Missouri 64111.
| | | | | | | | | | | | | | | | | |
Name
(Year of Birth) | Position(s) Held with Funds | Length of Time Served | Principal Occupation(s) During Past 5 Years | Number of American Century Portfolios Overseen by Trustee | Other Directorships Held During Past 5 Years |
| Independent Trustees | | | | | |
Tanya S. Beder
(1955) | Trustee | Since 2011 | Chairman and CEO, SBCC Group Inc. (independent advisory services) (2006 to present) | 40 | CYS
Investments,
Inc.; Kirby Corporation; Nabors
Industries Ltd. |
Jeremy I. Bulow
(1954) | Trustee | Since 2011 | Professor of Economics, Stanford University, Graduate School of Business (1979 to present) | 40 | None |
Anne Casscells
(1958) | Trustee | Since 2016 | Co-Chief Executive Officer and Chief Investment Officer, Aetos Alternatives Management (investment advisory firm) (2001 to present); Lecturer in Accounting, Stanford University, Graduate School of Business (2009 to 2017) | 40 | None |
Ronald J. Gilson
(1946) | Trustee and Chairman of the Board | Since 1995
(Chairman since 2005) | Charles J. Meyers Professor of Law and Business, Emeritus, Stanford Law School (1979 to 2016); Marc and Eva Stern Professor of Law and Business, Columbia University School of Law (1992 to present) | 59 | None |
| | | | | | | | | | | | | | | | | |
Name
(Year of Birth) | Position(s) Held with Funds | Length of Time Served | Principal Occupation(s) During Past 5 Years | Number of American Century Portfolios Overseen by Trustee | Other Directorships Held During Past 5 Years |
| Independent Trustees | | | | | |
Frederick L. A. Grauer
(1946) | Trustee | Since 2008 | Senior Advisor, Credit Sesame, Inc. (credit monitoring firm) (2018 to present); Senior Advisor, Course Hero (an educational technology company) (2015 to present) | 40 | None |
Jonathan D. Levin
(1972) | Trustee | Since 2016 | Philip H. Knight Professor and Dean, Graduate School of Business, Stanford University (2016 to present); Professor, Stanford University, (2000 to present) | 40 | None |
Peter F. Pervere
(1947) | Trustee | Since 2007 | Retired | 40 | None |
John B. Shoven
(1947) | Trustee | Since 2002 | Charles R. Schwab Professor of Economics, Stanford University (1973 to present, emeritus since 2019) | 40 | Cadence Design Systems; Exponent; Financial Engines |
| Interested Trustee | | | | | |
Jonathan S. Thomas
(1963) | Trustee | Since 2007 | President and Chief Executive Officer, ACC (2007 to present). Also serves as Chief Executive Officer, ACS; Executive Vice President, ACIM; Director, ACC, ACIM and other ACC subsidiaries | 122 | None |
The Statement of Additional Information has additional information about the fund's trustees and is available without charge, upon request, by calling 1-800-345-2021.
Officers
The following table presents certain information about the executive officers of the funds. Each officer serves as an officer for 16 (in the case of Robert J. Leach, 15) investment companies in the American Century family of funds. No officer is compensated for his or her service as an officer of the funds. The listed officers are interested persons of the funds and are appointed or re-appointed on an annual basis. The mailing address for each of the officers listed below is 4500 Main Street, Kansas City, Missouri 64111.
| | | | | | | | |
Name
(Year of Birth) | Offices with the Funds | Principal Occupation(s) During the Past Five Years |
Patrick Bannigan
(1965) | President since 2019 | Executive Vice President and Director, ACC (2012 to present); Chief Financial Officer, Chief Accounting Officer and Treasurer, ACC (2015 to present). Also serves as President, ACS; Vice President, ACIM; Chief Financial Officer, Chief Accounting Officer and/or Director, ACIM, ACS and other ACC subsidiaries |
R. Wes Campbell
(1974) | Chief Financial Officer and Treasurer since 2018 | Vice President, ACS, (2020 to present); Investment Operations and Investment Accounting, ACS (2000 to present)
|
Amy D. Shelton
(1964) | Chief Compliance Officer and Vice President since 2014 | Chief Compliance Officer, American Century funds, (2014 to present); Chief Compliance Officer, ACIM (2014 to present); Chief Compliance Officer, ACIS (2009 to present). Also serves as Vice President, ACIS |
Charles A. Etherington
(1957) | General Counsel since 2007 and Senior Vice President since 2006 | Attorney, ACC (1994 to present); Vice President, ACC (2005 to present); General Counsel, ACC (2007 to present). Also serves as General Counsel, ACIM, ACS, ACIS and other ACC subsidiaries; and Senior Vice President, ACIM and ACS |
C. Jean Wade
(1964) | Vice President since 2012 | Senior Vice President, ACS (2017 to present); Vice President, ACS (2000 to 2017) |
Robert J. Leach
(1966) | Vice President since 2006 | Vice President, ACS (2000 to present) |
David H. Reinmiller
(1963) | Vice President since 2000 | Attorney, ACC (1994 to present). Also serves as Vice President, ACIM and ACS |
Ward D. Stauffer
(1960) | Secretary since 2005 | Attorney, ACC (2003 to present) |
| | |
| Approval of Management Agreement |
At a meeting held on June 17, 2020, the Fund’s Board of Trustees (the "Board") unanimously approved the renewal of the management agreement pursuant to which American Century Investment Management, Inc. (the “Advisor”) acts as the investment advisor for the Fund. Under Section 15(c) of the Investment Company Act, contracts for investment advisory services are required to be reviewed, evaluated, and approved by a majority of a fund’s Trustees, including a majority of the independent Trustees, each year. The Board regards this annual evaluation and renewal as one of its most important responsibilities.
The independent Trustees have memorialized a statement regarding the relationship between their ongoing obligations to oversee and evaluate the performance of the Advisor and their annual consideration of renewal of the management agreement. In that statement, the independent Trustees noted that their assessment of the Advisor’s performance is an ongoing process that takes place over the entire year and is informed by all of the extensive information that the Board and its committees receive and consider over time. This information, together with the additional materials provided specifically in connection with the review, are central to the Board’s assessment of the Advisor’s performance and its determination whether to renew the Fund’s management agreement.
Prior to its consideration of the renewal of the management agreement, the Board requested and reviewed extensive data and analysis relating to the proposed renewal. This information and analysis was compiled by the Advisor and certain independent providers of evaluation data concerning the Fund and the services provided to the Fund by the Advisor.
In connection with its consideration of the renewal of the management agreement, the Board’s review and evaluation of the services provided by the Advisor included, but was not limited to, the following:
•the nature, extent, and quality of investment management, shareholder services, and other services provided to the Fund;
•the wide range of other programs and services the Advisor and its affiliates provide to the Fund and its shareholders on a routine and non-routine basis;
•the Fund’s investment performance, including data comparing the Fund’s performance to appropriate benchmarks and/or a peer group of other mutual funds with similar investment objectives and strategies;
•the cost of owning the Fund compared to the cost of owning similar funds;
•the compliance policies, procedures, and regulatory experience of the Advisor and its affiliates and certain other Fund service providers;
•financial data showing the cost of services provided by the Advisor and its affiliates to the Fund, the profitability of the Fund to the Advisor, and the overall profitability of the Advisor;
•the Advisor’s strategic plans;
•the Advisor’s response to the COVID-19 pandemic;
•any economies of scale associated with the Advisor’s management of the Fund;
•services provided and charges to the Advisor’s other investment management clients;
•fees and expenses associated with any investment by the Fund in other funds;
•payments and practices in connection with financial intermediaries holding shares of the Fund on behalf of their clients and the services provided by intermediaries in connection therewith; and
•any collateral benefits derived by the Advisor from the management of the Fund.
In keeping with its practice, the Board held two meetings and the independent Trustees met in private session to discuss the renewal and to review and discuss the information provided in response to their request. The Board held active discussions with the Advisor regarding the
renewal of the management agreement. The independent Trustees had the benefit of the advice of their independent counsel throughout the process.
Factors Considered
The Trustees considered all of the information provided by the Advisor, the independent data providers, and the independent Trustees’ independent counsel in connection with the approval. They determined that the information was sufficient for them to evaluate the management agreement for the Fund. In connection with their review, the Trustees did not identify any single factor as being all-important or controlling and each Trustee may have attributed different levels of importance to different factors. In deciding to renew the management agreement, the Board based its decision on a number of factors, including the following:
Nature, Extent and Quality of Services — Generally. Under the management agreement, the Advisor is responsible for providing or arranging for all services necessary for the operation of the Fund. The Board noted that the Advisor provides or arranges at its own expense a wide variety of services including:
•constructing and designing the Fund
•portfolio research and security selection
•initial capitalization/funding
•securities trading
•Fund administration
•custody of Fund assets
•daily valuation of the Fund’s portfolio
•shareholder servicing and transfer agency, including shareholder confirmations, recordkeeping, and communications
•legal services (except the independent Trustees’ counsel)
•regulatory and portfolio compliance
•financial reporting
•marketing and distribution (except amounts paid by the Fund under Rule 12b-1 plans)
The Board noted that many of these services have expanded over time in terms of both quantity and complexity in response to shareholder demands, competition in the industry, changing distribution channels, and the changing regulatory environment.
Investment Management Services. The nature of the investment management services provided to the Fund is quite complex and allows Fund shareholders access to professional money management, instant diversification of their investments within an asset class, the opportunity to easily diversify among asset classes by investing in or exchanging among various American Century Investments funds, and liquidity. In evaluating investment performance, the Board expects the Advisor to manage the Fund in accordance with its investment objectives and approved strategies. Further, the Trustees recognize that the Advisor has an obligation to seek the best execution of fund trades. In providing these services, the Advisor utilizes teams of investment professionals (portfolio managers, analysts, research assistants, and securities traders) who require extensive information technology, research, training, compliance, and other systems to conduct their business. The Board, directly and through its Portfolio Committee, regularly reviews investment performance information for the Fund, together with comparative information for appropriate benchmarks and/or peer groups of similarly-managed funds, over different time horizons. The Trustees also review investment performance information during the management agreement renewal process. If performance concerns are identified, the Fund receives special reviews until performance improves, during which the Board discusses with the Advisor the reasons for such results (e.g., market conditions, security selection) and any efforts being undertaken to improve performance. The Fund’s performance was above its benchmark for the one-, three-, five-, and ten-year periods reviewed by the Board. The Board found the investment management services provided by the Advisor to the Fund to be satisfactory and consistent with the management agreement.
Shareholder and Other Services. Under the management agreement, the Advisor, either directly or through affiliates or third parties, provides the Fund with a comprehensive package of transfer agency, shareholder, and other services. The Board, directly and through its various committees, regularly reviews reports and evaluations of such services at its regular meetings. These reports include, but are not limited to, information regarding the operational efficiency and accuracy of the shareholder and transfer agency services provided, staffing levels, shareholder satisfaction, technology support (including cyber security), new products and services offered to Fund shareholders, securities trading activities, portfolio valuation services, auditing services, and legal and operational compliance activities. The Board found the services provided by the Advisor to the Fund under the management agreement to be competitive and of high quality.
COVID-19 Response. During 2020, much of the world experienced unprecedented change and challenges from the impacts of the rapidly evolving, worldwide spread of the COVID-19 virus. The Board evaluated the Advisor’s response to the COVID-19 pandemic and its impact on service to the Fund. The Board found that Fund shareholders have continued to receive the Advisor’s investment management and other services without disruption, and Advisor personnel have demonstrated great resiliency in providing those services. The Board, directly and through its committees, continues to monitor the impact of the pandemic and the response of each of the Fund’s service providers.
Costs of Services and Profitability. The Advisor provides detailed information concerning its cost of providing various services to the Fund, its profitability in managing the Fund, its overall profitability, and its financial condition. The Trustees have reviewed with the Advisor the methodology used to prepare this financial information. This information is considered in evaluating the Advisor’s financial condition, its ability to continue to provide services under the management agreement, and the reasonableness of the current management fee. The Board concluded that the Advisor’s profits were reasonable in light of the services provided to the Fund.
Ethics. The Board generally considers the Advisor’s commitment to providing quality services to shareholders and to conducting its business ethically. They noted that the Advisor’s practices generally meet or exceed industry best practices.
Economies of Scale. The Board also reviewed information provided by the Advisor regarding the possible existence of economies of scale in connection with the management of the Fund. The Board concluded that economies of scale are difficult to measure and predict with precision, especially on a fund-by-fund basis. The Board concluded that the Advisor is appropriately sharing economies of scale, to the extent they exist, through its competitive fee structure, offering competitive fees from fund inception, and through reinvestment in its business, infrastructure, investment capabilities and initiatives to provide shareholders enhanced and expanded services.
Comparison to Other Funds’ Fees. The management agreement provides that the Fund pays the Advisor a single, all-inclusive (or unified) management fee for providing all services necessary for the management and operation of the Fund, other than brokerage expenses, expenses attributable to short sales, taxes, interest, extraordinary expenses, fees and expenses of the Fund’s independent Trustees (including their independent legal counsel), and expenses incurred in connection with the provision of shareholder services and distribution services under a plan adopted pursuant to Rule 12b-1 under the Investment Company Act. Under this unified fee structure, the Advisor is responsible for providing all investment advisory, custody, audit, administrative, compliance, recordkeeping, marketing, and shareholder services, or arranging and supervising third parties to provide such services. By contrast, most other funds are charged a variety of fees, including an investment advisory fee, a transfer agency fee, an administrative fee, and other expenses. Other than their investment advisory fees and any applicable Rule 12b-1 distribution fees, all other components of the total fees charged by these other funds may be increased without shareholder approval. The Board believes the unified fee structure is a benefit to Fund shareholders because it clearly discloses to shareholders the cost of owning Fund shares, and, since the unified fee cannot be increased without a vote of Fund shareholders, it shifts to the
Advisor the risk of increased costs of operating the Fund and provides a direct incentive to minimize administrative inefficiencies. Part of the Board’s analysis of fee levels involves reviewing certain evaluative data compiled by an independent provider and comparing the Fund’s unified fee to the total expense ratio of peer funds. The unified fee charged to shareholders of the Fund was below the median of the total expense ratios of the Fund’s peer group. The Board concluded that the management fee paid by the Fund to the Advisor under the management agreement is reasonable in light of the services provided to the Fund.
Comparison to Fees and Services Provided to Other Clients of the Advisor. The Board also requested and received information from the Advisor concerning the nature of the services, fees, costs, and profitability of its advisory services to advisory clients other than the Fund. They observed that these varying types of client accounts require different services and involve different regulatory and entrepreneurial risks than the management of the Fund. The Board analyzed this information and concluded that the fees charged and services provided to the Fund were reasonable by comparison.
Payments to Intermediaries. The Trustees also requested and received a description of payments made to intermediaries by the Fund and the Advisor and services provided by intermediaries. These payments include various payments made by the Fund or the Advisor to different types of intermediaries and recordkeepers for distribution and service activities provided with respect to the Fund. The Trustees reviewed such information and received representations from the Advisor that all such payments by the Fund were made pursuant to the Fund’s Rule 12b-1 Plan and that all such payments by the Advisor were made from the Advisor’s resources and reasonable profits. The Board found such payments to be reasonable in scope and purpose.
Collateral or “Fall-Out” Benefits Derived by the Advisor. The Board considered the existence of collateral benefits the Advisor may receive as a result of its relationship with the Fund. The Board noted that the Advisor’s primary business is managing mutual funds and it generally does not use fund or shareholder information to generate profits in other lines of business, and therefore does not derive any significant collateral benefits from them. The Board noted that the Advisor may receive proprietary research from broker-dealers that execute fund portfolio transactions. The Board also determined that the Advisor is able to provide investment management services to certain clients other than the Fund, at least in part, due to its existing infrastructure built to serve the fund complex. The Board noted that the assets of those other accounts are, where applicable, included with the assets of the Fund to determine breakpoints in the management fee schedule.
Existing Relationship. The Board also considered whether there was any reason for not continuing the existing arrangement with the Advisor. In this regard, the Board was mindful of the potential disruptions of the Fund’s operations and various risks, uncertainties, and other effects that could occur as a result of a decision not to continue such relationship. In particular, the Board recognized that most shareholders have invested in the Fund on the strength of the Advisor’s industry standing and reputation and in the expectation that the Advisor will have a continuing role in providing advisory services to the Fund.
Conclusion of the Trustees. As a result of this process, the Board, including all of the independent Trustees and assisted by the advice of independent legal counsel, taking into account all of the factors discussed above and the information provided by the Advisor and others in connection with its review and throughout the year, concluded that the management agreement between the Fund and the Advisor is fair and reasonable in light of the services provided and should be renewed.
| | |
| Liquidity Risk Management Program |
The Fund has adopted a liquidity risk management program (the “program”). The Fund’s Board of Trustees (the "Board") has designated American Century Investment Management, Inc. (“ACIM”) as the administrator of the program. Personnel of ACIM or its affiliates conduct the day-to-day operation of the program pursuant to policies and procedures administered by those members of the ACIM’s Investment Oversight Committee who are members of the ACIM’s Investment Management and Global Analytics departments.
Under the program, ACIM manages the Fund’s liquidity risk, which is the risk that the Fund could not meet shareholder redemption requests without significant dilution of remaining shareholders’ interests in the Fund. This risk is managed by monitoring the degree of liquidity of the Fund’s investments, limiting the amount of the Fund’s illiquid investments, and utilizing various risk management tools and facilities available to the Fund for meeting shareholder redemptions, among other means. ACIM’s process of determining the degree of liquidity of the Fund’s investments is supported by one or more third-party liquidity assessment vendors.
The Board reviewed a report prepared by ACIM regarding the operation and effectiveness of the program for the period December 1, 2018 through December 31, 2019. No significant liquidity events impacting the Fund were noted in the report. In addition, ACIM provided its assessment that the program had been effective in managing the Fund’s liquidity risk.
Retirement Account Information
As required by law, distributions you receive from certain retirement accounts are subject to federal income tax withholding, unless you elect not to have withholding apply*. Tax will be withheld on the total amount withdrawn even though you may be receiving amounts that are not subject to withholding, such as nondeductible contributions. In such case, excess amounts of withholding could occur. You may adjust your withholding election so that a greater or lesser amount will be withheld.
If you don’t want us to withhold on this amount, you must notify us to not withhold the federal income tax. You may notify us in writing or in certain situations by telephone or through other electronic means. For systematic withdrawals, your withholding election will remain in effect until revoked or changed by filing a new election. You have the right to revoke your election at any time and change your withholding percentage for future distributions.
Remember, even if you elect not to have income tax withheld, you are liable for paying income tax on the taxable portion of your withdrawal. If you elect not to have income tax withheld or you don’t have enough income tax withheld, you may be responsible for payment of estimated tax. You may incur penalties under the estimated tax rules if your withholding and estimated tax payments are not sufficient. You can reduce or defer the income tax on a distribution by directly or indirectly rolling such distribution over to another IRA or eligible plan. You should consult your tax advisor for additional information.
State tax will be withheld if, at the time of your distribution, your address is within one of the mandatory withholding states and you have federal income tax withheld (or as otherwise required by state law). State taxes will be withheld from your distribution in accordance with the respective state rules.
*Some 403(b), 457 and qualified retirement plan distributions may be subject to 20% mandatory withholding, as they are subject to special tax and withholding rules. Your plan administrator or plan sponsor is required to provide you with a special tax notice explaining those rules at the time you request a distribution. If applicable, federal and/or state taxes may be withheld from your distribution amount.
Proxy Voting Policies
Descriptions of the principles and policies that the fund's investment advisor uses in exercising the voting rights associated with the securities purchased and/or held by the fund are available without charge, upon request, by calling 1-800-345-2021 or visiting American Century Investments’ website at americancentury.com/proxy. A description of the policies is also available on the Securities and Exchange Commission’s website at sec.gov. Information regarding how the investment advisor voted proxies relating to portfolio securities during the most recent 12-month period ended June 30 is available on americancentury.com/proxy. It is also available at sec.gov.
Quarterly Portfolio Disclosure
The fund files its complete schedule of portfolio holdings with the Securities and Exchange Commission (SEC) for the first and third quarters of each fiscal year as an exhibit to its reports on Form N-PORT. The fund’s Form N-PORT reports are available on the SEC’s website at sec.gov. The fund also makes its complete schedule of portfolio holdings for the most recent quarter of its fiscal year available on its website at americancentury.com and, upon request, by calling 1-800-345-2021.
Other Tax Information
The following information is provided pursuant to provisions of the Internal Revenue Code.
The fund hereby designates $2,990,120, or up to the maximum amount allowable, as long-term capital gain distributions (20% rate gain distributions) for the fiscal year ended August 31, 2020.
The fund hereby designates $14,408 as qualified short-term capital gain distributions for purposes of Internal Revenue Code Section 871 for the fiscal year ended August 31, 2020.
The fund designates $46,231,313 as exempt interest dividends for the fiscal year ended August 31, 2020.
| | | | | | | | |
| | |
| | |
| Contact Us | americancentury.com | |
| Automated Information Line | 1-800-345-8765 | |
| Investor Services Representative | 1-800-345-2021
or 816-531-5575 | |
| Investors Using Advisors | 1-800-378-9878 | |
| Business, Not-For-Profit, Employer-Sponsored Retirement Plans | 1-800-345-3533 | |
| Banks and Trust Companies, Broker-Dealers, Financial Professionals, Insurance Companies | 1-800-345-6488 | |
| Telecommunications Relay Service for the Deaf | 711 | |
| | |
| American Century California Tax-Free and Municipal Funds | | |
| | |
Investment Advisor: American Century Investment Management, Inc. Kansas City, Missouri | | |
| | |
This report and the statements it contains are submitted for the general information of our shareholders. The report is not authorized for distribution to prospective investors unless preceded or accompanied by an effective prospectus. | | |
| | |
©2020 American Century Proprietary Holdings, Inc. All rights reserved.
CL-ANN-90327 2010 | | |
| | | | | |
| |
| Annual Report |
| |
| August 31, 2020 |
| |
| California Tax-Free Money Market Fund |
| Investor Class (BCTXX) |
Beginning on January 1, 2021, as permitted by regulations adopted by the Securities and Exchange Commission, paper copies of the fund’s shareholder reports like this one will no longer be sent by mail, unless you specifically request paper copies of the reports from the fund or from your financial intermediary, such as a broker-dealer or bank. Instead, the reports will be made available on a website, and you will be notified by mail each time a report is posted and provided with a website link to access the report.
If you already elected to receive shareholder reports electronically, you will not be affected by this change and you need not take any action. You may elect to receive shareholder reports and other communications from the fund or your financial intermediary electronically by calling or sending an email request to your appropriate contacts as listed on the back cover of this report.
You may elect to receive all future reports in paper free of charge. You can inform the fund or your financial intermediary that you wish to continue receiving paper copies of your shareholder reports by calling or sending an email request to your appropriate contacts as listed on the back cover of this report. Your election to receive reports in paper will apply to all funds held with the fund complex/your financial intermediary.
| | | | | |
| President’s Letter | |
| Performance | |
| Fund Characteristics | |
| Shareholder Fee Example | |
| Schedule of Investments | |
| Statement of Assets and Liabilities | |
| Statement of Operations | |
| Statement of Changes in Net Assets | |
| Notes to Financial Statements | |
| Financial Highlights | |
| Report of Independent Registered Public Accounting Firm | |
| Management | |
| Approval of Management Agreement | |
| Liquidity Risk Management Program | |
| |
| Additional Information | |
Any opinions expressed in this report reflect those of the author as of the date of the report, and do not necessarily represent the opinions of American Century Investments® or any other person in the American Century Investments organization. Any such opinions are subject to change at any time based upon market or other conditions and American Century Investments disclaims any responsibility to update such opinions. These opinions may not be relied upon as investment advice and, because investment decisions made by American Century Investments funds are based on numerous factors, may not be relied upon as an indication of trading intent on behalf of any American Century Investments fund. Security examples are used for representational purposes only and are not intended as recommendations to purchase or sell securities. Performance information for comparative indices and securities is provided to American Century Investments by third party vendors. To the best of American Century Investments’ knowledge, such information is accurate at the time of printing.
Jonathan Thomas
Dear Investor:
Thank you for reviewing this annual report for the period ended August 31, 2020. Annual reports help convey important information about fund returns, including market factors that affected performance. For additional investment insights, please visit americancentury.com.
Pandemic Disrupted Economic, Market Courses
Broad market sentiment was generally upbeat through the first half of the reporting period. Dovish central banks, modest inflation, improving economic and corporate earnings data, and progress on U.S.-China trade policy helped boost global growth outlooks. Against this backdrop, risk assets, including municipal bonds (munis), largely remained in favor.
However, beginning in late February, COVID-19 quickly quashed the optimistic tone. The outbreak rapidly spread worldwide, halting most U.S. and global economic activity and triggering a deep worldwide recession. In the U.S., stocks and credit-sensitive assets sold off sharply, while U.S. Treasury yields plunged to record lows amid soaring demand. Quick and aggressive action from the Federal Reserve and Congress helped stabilize financial markets and restore confidence in the muni and credit sectors. Additionally, declining coronavirus infection and death rates in many regions and the reopening of economies were positive influences. By the end of August, manufacturing, employment and other data suggested an economic recovery was underway.
In general, munis bounced back from the early spring sell-off to deliver modest gains for the 12-month period. However, the broad asset class did not keep pace with the rallying Treasury market.
A Slow Return to Normal
The return to pre-pandemic life will take time and patience, but we are confident we will get there. Several drug companies are in final stages of vaccine trials, and medical professionals continue to fine-tune virus treatment protocols. In the meantime, investors likely will face periods of outbreak-related disruptions, economic and political uncertainty, and heightened market volatility. These influences can be unsettling, but they tend to be temporary.
We appreciate your confidence in us during these extraordinary times. Our firm has a long history of helping clients weather unpredictable markets, and we’re confident we will continue to meet today’s challenges.
Sincerely,
Jonathan Thomas
President and Chief Executive Officer
American Century Investments
| | | | | | | | | | | | | | | | | | | |
| Total Returns as of August 31, 2020 | | | | | | | |
| | | | | Average Annual Returns | | | |
| | Ticker
Symbol | | 1 year | 5 years | 10 years | | Inception
Date |
| Investor Class | BCTXX | | 0.53% | 0.54% | 0.28% | | 11/9/83 |
Fund returns would have been lower if a portion of the fees had not been waived.
| | |
| Total Annual Fund Operating Expenses |
Investor Class 0.50% |
The total annual fund operating expenses shown is as stated in the fund’s prospectus current as of the date of this report. The prospectus may vary from the expense ratio shown elsewhere in this report because it is based on a different time period, includes acquired fund fees and expenses, and, if applicable, does not include fee waivers or expense reimbursements.
Data presented reflect past performance. Past performance is no guarantee of future results. Current performance may be higher or lower than the performance shown. Total returns for periods less than one year are not annualized. To obtain performance data current to the most recent month end, please call 1-800-345-2021 or visit americancentury.com. For additional information about the fund, please consult the prospectus.
You could lose money by investing in the fund. Although the fund seeks to preserve the value of your investment at $1.00 per share, it cannot guarantee it will do so. The fund may impose a fee upon sale of your shares or may temporarily suspend your ability to sell shares if the fund’s liquidity falls below required minimums because of market conditions or other factors. An investment in the fund is not insured or guaranteed by the Federal Deposit Insurance Corporation or any other government agency. The fund’s sponsor has no legal obligation to provide financial support to the fund, and you should not expect that the sponsor will provide financial support to the fund at any time.
The 7-day current yield more closely reflects the current earnings of the fund than the total return.
| | | | | |
| AUGUST 31, 2020 | |
| 7-Day Current Yield | |
After waiver(1) | 0.01% |
| Before waiver | (0.34)% |
| 7-Day Effective Yield | |
After waiver(1) | 0.01% |
| (1) Yields would have been lower if a portion of the fees had not been waived. | |
| |
| Portfolio at a Glance | |
| Weighted Average Maturity | 35 days |
| Weighted Average Life | 35 days |
| | |
| Portfolio Composition by Maturity | % of fund investments |
| 1-30 days | 74% |
| 31-90 days | 17% |
| 91-180 days | — |
| More than 180 days | 9% |
Fund shareholders may incur two types of costs: (1) transaction costs, including sales charges (loads) on purchase payments and redemption/exchange fees; and (2) ongoing costs, including management fees; distribution and service (12b-1) fees; and other fund expenses. This example is intended to help you understand your ongoing costs (in dollars) of investing in your fund and to compare these costs with the ongoing cost of investing in other mutual funds.
The example is based on an investment of $1,000 made at the beginning of the period and held for the entire period from March 1, 2020 to August 31, 2020.
Actual Expenses
The table provides information about actual account values and actual expenses for each class. You may use the information, together with the amount you invested, to estimate the expenses that you paid over the period. First, identify the share class you own. Then simply divide your account value by $1,000 (for example, an $8,600 account value divided by $1,000 = 8.6), then multiply the result by the number under the heading “Expenses Paid During Period” to estimate the expenses you paid on your account during this period.
If you hold Investor Class shares of any American Century Investments fund, or I Class shares of the American Century Diversified Bond Fund, in an American Century Investments account (i.e., not through a financial intermediary or employer-sponsored retirement plan account), American Century Investments may charge you a $25.00 annual account maintenance fee if the value of those shares is less than $10,000. We will redeem shares automatically in one of your accounts to pay the $25.00 fee. In determining your total eligible investment amount, we will include your investments in all personal accounts (including American Century Investments brokerage accounts) registered under your Social Security number. Personal accounts include individual accounts, joint accounts, UGMA/UTMA accounts, personal trusts, Coverdell Education Savings Accounts and IRAs (including traditional, Roth, Rollover, SEP-, SARSEP- and SIMPLE-IRAs), and certain other retirement accounts. If you have only business, business retirement, employer-sponsored or American Century Investments brokerage accounts, you are currently not subject to this fee. If you are subject to the account maintenance fee, your account value could be reduced by the fee amount.
Hypothetical Example for Comparison Purposes
The table also provides information about hypothetical account values and hypothetical expenses based on the actual expense ratio of each class of your fund and an assumed rate of return of 5% per year before expenses, which is not the actual return of a fund’s share class. The hypothetical account values and expenses may not be used to estimate the actual ending account balance or expenses you paid for the period. You may use this information to compare the ongoing costs of investing in your fund and other funds. To do so, compare this 5% hypothetical example with the 5% hypothetical examples that appear in the shareholder reports of the other funds.
Please note that the expenses shown in the table are meant to highlight your ongoing costs only and do not reflect any transactional costs, such as sales charges (loads) or redemption/exchange fees. Therefore, the table is useful in comparing ongoing costs only, and will not help you determine the relative total costs of owning different funds. In addition, if these transactional costs were included, your costs would have been higher.
| | | | | | | | | | | | | | |
| | Beginning
Account Value
3/1/20 | Ending
Account Value
8/31/20 | Expenses Paid During Period(1) 3/1/20 - 8/31/20 | Annualized Expense Ratio(1) |
| Actual | | | | |
| Investor Class | $1,000 | $1,002.10 | $1.66 | 0.33% |
| Hypothetical | | | | |
| Investor Class | $1,000 | $1,023.48 | $1.68 | 0.33% |
(1)Expenses are equal to the class's annualized expense ratio listed in the table above, multiplied by the average account value over the period, multiplied by 184, the number of days in the most recent fiscal half-year, divided by 366, to reflect the one-half year period. Annualized expense ratio reflects actual expenses, including any applicable fee waivers or expense reimbursements and excluding any acquired fund fees and expenses.
AUGUST 31, 2020
| | | | | | | | |
| Principal Amount | Value |
| MUNICIPAL SECURITIES — 99.2% | | |
| California — 98.3% | | |
| ABAG Finance Authority for Nonprofit Corporations Rev., (Pathways Home Health and Hospice), VRDN, 0.09%, 9/7/20 (LOC: U.S. Bank N.A.) | $ | 2,420,000 | | $ | 2,420,000 | |
| ABAG Finance Authority for Nonprofit Corporations Rev., (Sharp Healthcare Obligated Group), VRDN, 0.07%, 9/7/20 (LOC: Citibank N.A.) | 3,565,000 | | 3,565,000 | |
| California Educational Facilities Authority Rev., 0.21%, 3/3/21 | 1,000,000 | | 1,000,000 | |
| California Enterprise Development Authority Rev., (Community Hospice, Inc.), VRDN, 0.11%, 9/7/20 (LOC: Bank of Stockton and FHLB) | 2,595,000 | | 2,595,000 | |
| California Enterprise Development Authority Rev., (Humane Society Silicon Valley), VRDN, 0.11%, 9/7/20 (LOC: First Republic Bank and FHLB) | 5,180,000 | | 5,180,000 | |
| California Infrastructure & Economic Development Bank Rev., (Columbia College), VRDN, 0.11%, 9/7/20 (LOC: Wells Fargo Bank N.A.) | 4,220,000 | | 4,220,000 | |
| California Infrastructure & Economic Development Bank Rev., (Columbia College), VRDN, 0.11%, 9/7/20 (LOC: Wells Fargo Bank N.A.) | 2,035,000 | | 2,035,000 | |
| California Infrastructure & Economic Development Bank Rev., (EB Property Management LLC), VRDN, 0.10%, 9/7/20 (LOC: California United Bank and Wells Fargo Bank N.A.) | 1,180,000 | | 1,180,000 | |
| California Infrastructure & Economic Development Bank Rev., (Kennfoods USA LLC), VRDN, 0.10%, 9/7/20 (LOC: Bank of the West) | 760,000 | | 760,000 | |
| California Infrastructure & Economic Development Bank Rev., VRDN, 0.13%, 9/7/20 (LOC: Union Bank N.A.) | 2,030,000 | | 2,030,000 | |
| California Statewide Communities Development Authority Rev., 0.52%, 10/8/20 | 3,500,000 | | 3,500,000 | |
| California Statewide Communities Development Authority Rev., (Marvin & Bebe L Zigman), VRDN, 0.08%, 9/7/20 (LOC: Wells Fargo Bank N.A.) | 600,000 | | 600,000 | |
| California Statewide Communities Development Authority Rev., (Uptown Newport Building Owner LP), VRDN, 0.13%, 9/7/20 (LOC: East West Bank, Zions Bank and FHLB) | 6,300,000 | | 6,300,000 | |
| Irvine Ranch Water District Special Assessment, VRN, 0.03%, (MUNIPSA less 0.06%), 10/1/37 | 6,000,000 | | 6,000,000 | |
| Los Angeles County Rev., 4.00%, 6/30/21 | 1,000,000 | | 1,030,676 | |
| Los Angeles County California GO, 0.18%, 11/3/20 (LOC: Barclays Bank plc) | 4,000,000 | | 4,000,000 | |
| Los Angeles County Capital Asset Leasing Corp. Rev., 0.16%, 10/8/20 (LOC: State Street Bank & Trust Co.) | 1,000,000 | | 1,000,000 | |
| Los Angeles Department of Water & Power System Rev., VRDN, 0.02%, 9/1/20 (SBBPA: Bank of America N.A.) | 300,000 | | 300,000 | |
| Los Angeles Department of Water & Power System Rev., VRDN, 0.02%, 9/1/20 (SBBPA: Bank of America N.A.) | 600,000 | | 600,000 | |
| Metropolitan Water District of Southern California Rev., VRDN, 0.02%, 9/1/20 (SBBPA: PNC Bank N.A.) | 300,000 | | 300,000 | |
| Metropolitan Water District of Southern California Rev., VRN, 0.34%, (MUNIPSA plus 0.25%), 7/1/47 | 4,000,000 | | 4,000,000 | |
| Modesto Public Financing Authority Rev., (Modesto), VRDN, 0.08%, 9/7/20 (LOC: Bank of the West) | 1,915,000 | | 1,915,000 | |
| Municipal Improvement Corp. of Los Angeles Rev., 0.16%, 11/17/20 (LOC: U.S. Bank N.A.) | 1,000,000 | | 1,000,000 | |
| Reedley COP, (Mennonite Brethren Homes, Inc.), VRDN, 0.15%, 9/7/20 (LOC: Bank of the Sierra and FHLB) | 4,190,000 | | 4,190,000 | |
| | | | | | | | |
| Principal Amount | Value |
| Regents of the University of California Medical Center Pooled Rev., VRDN, 0.01%, 9/1/20 | $ | 600,000 | | $ | 600,000 | |
| Regents of the University of California Medical Center Pooled Rev., VRDN, 0.01%, 9/1/20 | 300,000 | | 300,000 | |
| Riverside County Rev., 1.38%, 10/22/20 | 1,000,000 | | 1,000,379 | |
| Riverside Electric Rev., VRDN, 0.08%, 9/7/20 (LOC: Barclays Bank plc) | 145,000 | | 145,000 | |
| San Diego County COP, (San Diego Museum of Art), VRDN, 0.07%, 9/7/20 (LOC: Wells Fargo Bank N.A.)(GA: Irish Government) | 1,500,000 | | 1,500,000 | |
| San Diego County Water Authority, 0.17%, 9/24/20 | 4,000,000 | | 4,000,000 | |
| San Francisco City & County Rev., (Related / Mariposa Development Co. LP), VRDN, 0.09%, 9/7/20 (LOC: Bank of America N.A.) | 2,700,000 | | 2,700,000 | |
| San Francisco City & County Airport Comm-San Francisco International Airport Rev., VRDN, 0.08%, 9/7/20 (LOC: Sumitomo Mitsui Banking) | 1,850,000 | | 1,850,000 | |
| San Francisco City & County Public Utilities Commission Power Rev., 0.20%, 9/3/20 (LOC: Bank of America N.A.) | 2,502,000 | | 2,502,000 | |
| San Francisco City & County Public Utilities Commission Wastewater Rev., 0.17%, 10/28/20 (LOC: Bank of America N.A.) | 3,180,000 | | 3,180,000 | |
| Santa Clara County Financing Authority Rev., (El Camino Hospital), VRDN, 0.08%, 9/7/20 (LOC: Wells Fargo Bank N.A.) | 500,000 | | 500,000 | |
| Santa Clara County Financing Authority Rev., VRDN, 0.08%, 9/7/20 (LOC: Bank of America N.A.) | 1,000,000 | | 1,000,000 | |
| State of California GO, 0.21%, 9/8/20 | 4,840,000 | | 4,840,000 | |
| State of California GO, 0.18%, 10/15/20 (LOC: Royal Bank of Canada) | 1,200,000 | | 1,200,000 | |
| State of California Department of Water Resources Rev., 0.16%, 10/1/20 | 5,345,000 | | 5,345,000 | |
Tender Option Bond Trust Receipts/Certificates GO, VRDN, 0.17%, 9/7/20 (LIQ FAC: JPMorgan Chase Bank N.A.)(1) | 3,000,000 | | 3,000,000 | |
Tender Option Bond Trust Receipts/Certificates Rev., VRDN, 0.09%, 9/7/20 (LIQ FAC: Barclays Bank plc)(1) | 2,220,000 | | 2,220,000 | |
Tender Option Bond Trust Receipts/Certificates Rev., VRDN, 0.09%, 9/7/20 (LIQ FAC: Barclays Bank plc)(1) | 2,900,000 | | 2,900,000 | |
Tender Option Bond Trust Receipts/Certificates Rev., VRDN, 0.13%, 9/7/20 (LIQ FAC: JPMorgan Chase Bank N.A.)(1) | 2,900,000 | | 2,900,000 | |
Tender Option Bond Trust Receipts/Certificates Rev., VRDN, 0.14%, 9/7/20 (LIQ FAC: JPMorgan Chase Bank N.A.)(1) | 3,750,000 | | 3,750,000 | |
Tender Option Bond Trust Receipts/Certificates Rev., VRDN, 0.15%, 9/7/20 (LIQ FAC: JPMorgan Chase Bank N.A.)(1) | 6,750,000 | | 6,750,000 | |
| Town of Hillsborough COP, VRDN, 0.06%, 9/7/20 (SBBPA: Bank of the West) | 2,700,000 | | 2,700,000 | |
| University of California Rev., VRDN, 0.01%, 9/1/20 | 300,000 | | 300,000 | |
| Victorville Joint Powers Finance Authority Rev., VRDN, 0.09%, 9/7/20 (LOC: BNP Paribas) | 11,335,000 | | 11,335,000 | |
| West Basin Municipal Water District Rev., 0.20%, 10/28/20 (LOC: Bank of the West) | 1,000,000 | | 1,000,000 | |
| Yolo County Rev., (Beckett Hall, Inc.), VRDN, 0.16%, 9/7/20 (LOC: Bank of the West) | 4,730,000 | | 4,730,000 | |
| | 131,968,055 | |
| Nevada — 0.9% | | |
| Truckee Meadows Water Authority Rev., 0.17%, 11/4/20 (LOC: Wells Fargo Bank N.A.) | 1,172,000 | | 1,172,000 | |
| TOTAL INVESTMENT SECURITIES — 99.2% | | 133,140,055 | |
| OTHER ASSETS AND LIABILITIES — 0.8% | | 1,112,083 | |
| TOTAL NET ASSETS — 100.0% | | $ | 134,252,138 | |
| | | | | | | | |
| NOTES TO SCHEDULE OF INVESTMENTS | | |
| COP | - | Certificates of Participation |
| FHLB | - | Federal Home Loan Bank |
| GA | - | Guaranty Agreement |
| GO | - | General Obligation |
| LIQ FAC | - | Liquidity Facilities |
| LOC | - | Letter of Credit |
| MUNIPSA | - | SIFMA Municipal Swap Index |
| SBBPA | - | Standby Bond Purchase Agreement |
| VRDN | - | Variable Rate Demand Note. The instrument may be payable upon demand and adjusts periodically based upon the terms set forth in the security's offering documents. The rate shown is effective at the period end and the reference rate and spread, if any, is indicated. The date of the demand feature is disclosed. |
| VRN | - | Variable Rate Note. The rate adjusts periodically based upon the terms set forth in the security’s offering documents. The rate shown is effective at the period end and the reference rate and spread, if any, is indicated. The security's effective maturity date may be shorter than the final maturity date shown. |
(1)Security was purchased pursuant to Rule 144A under the Securities Act of 1933 and may be sold in transactions exempt from registration, normally to qualified institutional investors. The aggregate value of these securities at the period end was $21,520,000, which represented 16.0% of total net assets.
See Notes to Financial Statements.
| | |
| Statement of Assets and Liabilities |
| | | | | |
| AUGUST 31, 2020 | |
| Assets | |
| Investment securities, at value (amortized cost and cost for federal income tax purposes) | $ | 133,140,055 | |
| Cash | 127,646 | |
| Receivable for investments sold | 835,000 | |
| Receivable for capital shares sold | 124,828 | |
| Interest receivable | 46,156 | |
| 134,273,685 | |
| |
| Liabilities | |
| Payable for capital shares redeemed | 5,584 | |
| Accrued management fees | 15,963 | |
| 21,547 | |
| |
| Net Assets | $ | 134,252,138 | |
| |
| Investor Class Capital Shares | |
| Shares outstanding (unlimited number of shares authorized) | 134,252,132 | |
| |
| Net Asset Value Per Share | $ | 1.00 | |
| |
| Net Assets Consist of: | |
| Capital paid in | $ | 134,252,138 | |
See Notes to Financial Statements.
| | | | | |
| YEAR ENDED AUGUST 31, 2020 | |
| Investment Income (Loss) | |
| Income: | |
| Interest | $ | 1,483,157 | |
| |
| Expenses: | |
| Management fees | 747,513 | |
| Trustees' fees and expenses | 11,857 | |
| Other expenses | 1,114 | |
| 760,484 | |
| Fees waived | (123,250) | |
| 637,234 | |
| |
| Net investment income (loss) | 845,923 | |
| |
| Net Increase (Decrease) in Net Assets Resulting from Operations | $ | 845,923 | |
See Notes to Financial Statements.
| | |
| Statement of Changes in Net Assets |
| | | | | | | | |
| YEARS ENDED AUGUST 31, 2020 AND AUGUST 31, 2019 | | |
| Increase (Decrease) in Net Assets | August 31, 2020 | August 31, 2019 |
| Operations | | |
| Net investment income (loss) | $ | 845,923 | | $ | 1,727,730 | |
| | |
| Distributions to Shareholders | | |
| From earnings | (845,923) | | (1,753,715) | |
| | |
| Capital Share Transactions | | |
| Proceeds from shares sold | 63,402,452 | | 55,813,854 | |
| Proceeds from reinvestment of distributions | 829,998 | | 1,724,963 | |
| Payments for shares redeemed | (92,002,702) | | (59,933,840) | |
| Net increase (decrease) in net assets from capital share transactions | (27,770,252) | | (2,395,023) | |
| | |
| Net increase (decrease) in net assets | (27,770,252) | | (2,421,008) | |
| | |
| Net Assets | | |
| Beginning of period | 162,022,390 | | 164,443,398 | |
| End of period | $ | 134,252,138 | | $ | 162,022,390 | |
| | |
| Transactions in Shares of the Fund | | |
| Sold | 63,402,452 | | 55,813,854 | |
| Issued in reinvestment of distributions | 829,998 | | 1,724,963 | |
| Redeemed | (92,002,702) | | (59,933,840) | |
| Net increase (decrease) in shares of the fund | (27,770,252) | | (2,395,023) | |
See Notes to Financial Statements.
| | |
| Notes to Financial Statements |
AUGUST 31, 2020
1. Organization
American Century California Tax-Free and Municipal Funds (the trust) is registered under the Investment Company Act of 1940, as amended (the 1940 Act), as an open-end management investment company and is organized as a Massachusetts business trust. California Tax-Free Money Market Fund (the fund) is one fund in a series issued by the trust. The fund’s investment objective is to seek safety of principal and high current income that is exempt from federal and California income taxes.
2. Significant Accounting Policies
The following is a summary of significant accounting policies consistently followed by the fund in preparation of its financial statements. The fund is an investment company and follows accounting and reporting guidance in accordance with accounting principles generally accepted in the United States of America. This may require management to make certain estimates and assumptions at the date of the financial statements. Actual results could differ from these estimates. Management evaluated the impact of events or transactions occurring through the date the financial statements were issued that would merit recognition or disclosure.
Investment Valuations — The fund determines the fair value of its investments and computes its net asset value per share at the close of regular trading (usually 4 p.m. Eastern time) on the New York Stock Exchange (NYSE) on each day the NYSE is open. Investments are generally valued at amortized cost, which approximates fair value. If the fund determines that the amortized cost does not reflect an investment’s fair value, such investment is valued as determined in good faith by the Board of Trustees or its delegate, in accordance with policies and procedures adopted by the Board of Trustees.
Security Transactions — Security transactions are accounted for as of the trade date. Net realized gains and losses are determined on the identified cost basis, which is also used for federal income tax purposes.
Investment Income — Interest income is recorded on the accrual basis and includes accretion of discounts and amortization of premiums.
Income Tax Status — It is the fund’s policy to distribute substantially all net investment income and net realized gains to shareholders and to otherwise qualify as a regulated investment company under provisions of the Internal Revenue Code. Accordingly, no provision has been made for income taxes. The fund files U.S. federal, state, local and non-U.S. tax returns as applicable. The fund's tax returns are subject to examination by the relevant taxing authority until expiration of the applicable statute of limitations, which is generally three years from the date of filing but can be longer in certain jurisdictions. At this time, management believes there are no uncertain tax positions which, based on their technical merit, would not be sustained upon examination and for which it is reasonably possible that the total amounts of unrecognized tax benefits will significantly change in the next twelve months.
Distributions to Shareholders — Distributions from net investment income, if any, are declared daily and paid monthly. The fund may make capital gains distributions to comply with the distribution requirements of the Internal Revenue Code.
Indemnifications — Under the trust’s organizational documents, its officers and trustees are indemnified against certain liabilities arising out of the performance of their duties to the fund. In addition, in the normal course of business, the fund enters into contracts that provide general indemnifications. The maximum exposure under these arrangements is unknown as this would involve future claims that may be made against a fund. The risk of material loss from such claims is considered by management to be remote.
3. Fees and Transactions with Related Parties
Certain officers and trustees of the trust are also officers and/or directors of American Century Companies, Inc. (ACC). The trust's investment advisor, American Century Investment Management, Inc. (ACIM), the trust's distributor, American Century Investment Services, Inc., and the trust's transfer agent, American Century Services, LLC, are wholly owned, directly or indirectly, by ACC.
Management Fees — The trust has entered into a management agreement with ACIM, under which ACIM provides the fund with investment advisory and management services in exchange for a single, unified management fee (the fee). The agreement provides that ACIM will pay all expenses of managing and operating the fund, except brokerage expenses, taxes, interest, fees and expenses of the independent trustees (including legal counsel fees) and extraordinary expenses. The fee is computed and accrued daily based on the daily net assets of the fund and paid monthly in arrears. The fee consists of (1) an Investment Category Fee based on the daily net assets of the fund and certain other accounts managed by the investment advisor that are in the same broad investment category as the fund and (2) a Complex Fee based on the assets of all the funds in the American Century Investments family of funds. In order to maintain a positive yield, ACIM may voluntarily waive a portion of the management fee on a daily basis. The fee waiver may be revised or terminated at any time without notice. The rates for the Investment Category Fee range from 0.1570% to 0.2700% and the rates for the Complex Fee range from 0.2500% to 0.3100%. The effective annual management fee for the period ended August 31, 2020 was 0.49% before waiver and 0.41% after waiver.
Trustees’ Fees and Expenses — The Board of Trustees is responsible for overseeing the investment advisor’s management and operations of the fund. The trustees receive detailed information about the fund and its investment advisor regularly throughout the year, and meet at least quarterly with management of the investment advisor to review reports about fund operations. The fund’s officers do not receive compensation from the fund.
Interfund Transactions — The fund may enter into security transactions with other American Century Investments funds and other client accounts of the investment advisor, in accordance with the 1940 Act rules and procedures adopted by the Board of Trustees. The rules and procedures require, among other things, that these transactions be effected at the independent current market price of the security. During the period, the interfund purchases and sales were $13,386,000 and $22,713,000, respectively. The interfund transactions had no effect on the Statement of Operations in net realized gain (loss) on investment transactions.
4. Fair Value Measurements
The fund’s investments valuation process is based on several considerations and may use multiple inputs to determine the fair value of the investments held by the fund. In conformity with accounting principles generally accepted in the United States of America, the inputs used to determine a valuation are classified into three broad levels.
•Level 1 valuation inputs consist of unadjusted quoted prices in an active market for identical investments.
•Level 2 valuation inputs consist of direct or indirect observable market data (including quoted prices for comparable investments, evaluations of subsequent market events, interest rates, prepayment speeds, credit risk, etc.). These inputs also consist of quoted prices for identical investments initially expressed in local currencies that are adjusted through translation into U.S. dollars.
•Level 3 valuation inputs consist of unobservable data (including a fund’s own assumptions).
The level classification is based on the lowest level input that is significant to the fair valuation measurement. The valuation inputs are not necessarily an indication of the risks associated with investing in these securities or other financial instruments.
As of period end, the fund’s investment securities were classified as Level 2. The Schedule of Investments provides additional information on the fund’s portfolio holdings.
5. Risk Factors
The novel coronavirus (COVID-19) pandemic has significantly stressed the financial resources of many municipal issuers, which may impair a municipal issuer's ability to meet its financial obligations when due and could adversely impact the value of its bonds, which could negatively impact the performance of the fund.
The fund focuses its investments in a single state and therefore may have more exposure to credit risk related to the state of California than a fund with a broader geographical diversification.
6. Federal Tax Information
The tax character of distributions paid during the years ended August 31, 2020 and August 31, 2019 were as follows:
| | | | | | | | |
| 2020 | 2019 |
| Distributions Paid From | | |
| Exempt income | $ | 845,923 | | $ | 1,727,730 | |
| Taxable ordinary income | — | $ | 11,885 | |
| Long-term capital gains | — | $ | 14,100 | |
The book-basis character of distributions made during the year from net investment income or net realized gains may differ from their ultimate characterization for federal income tax purposes. These differences reflect the differing character of certain income items and net realized gains and losses for financial statement and tax purposes, and may result in reclassification among certain capital accounts on the financial statements.
7. Recently Issued Accounting Standards
In March 2017, the Financial Accounting Standards Board (FASB) issued Accounting Standards Update No. 2017-08, “Receivables - Nonrefundable Fees and Other Costs (Subtopic 310-20), Premium Amortization on Purchased Callable Debt Securities” (ASU 2017-08). ASU 2017-08 amends the amortization period for certain purchased callable debt securities held at a premium, shortening such period to the earliest call date. The amendments are effective for fiscal years, and interim periods within those fiscal years, beginning after December 15, 2018. The adoption of ASU 2017-08 did not materially impact the financial statements.
| | | | | | | | | | | | | | | | | | | | | | | | | | | | | | | | | | | | | | | | | | | | |
| For a Share Outstanding Throughout the Years Ended August 31 (except as noted) | | | | | | | | | | | | | | |
| Per-Share Data | | | | | | | | | | Ratios and Supplemental Data | | | | |
| | | Income From Investment Operations: | | | Distributions From: | | | | | Ratio to Average Net Assets of: | | | | |
| | Net Asset
Value,
Beginning
of Period | Net
Investment
Income
(Loss) | Net
Realized and Unrealized
Gain (Loss) | Total From Investment Operations | Net
Investment
Income | Net
Realized
Gains | Total
Distributions | Net Asset
Value,
End of Period | Total Return(1) | Operating
Expenses | Operating Expenses (before expense waiver) | Net
Investment
Income
(Loss) | Net Investment Income (Loss) (before expense waiver) | Net Assets,
End of Period
(in thousands) |
| Investor Class | | | | | | | | | | | | | | |
| 2020 | $1.00 | 0.01 | — | 0.01 | (0.01) | — | (0.01) | $1.00 | 0.53% | 0.42% | 0.50% | 0.55% | 0.47% | $134,252 | |
| 2019 | $1.00 | 0.01 | — | 0.01 | (0.01) | —(2) | (0.01) | $1.00 | 1.08% | 0.50% | 0.50% | 1.06% | 1.06% | $162,022 | |
| 2018 | $1.00 | 0.01 | —(2) | 0.01 | (0.01) | —(2) | (0.01) | $1.00 | 0.75% | 0.50% | 0.50% | 0.75% | 0.75% | $164,443 | |
| 2017 | $1.00 | —(2) | —(2) | —(2) | —(2) | —(2) | —(2) | $1.00 | 0.35% | 0.50% | 0.50% | 0.33% | 0.33% | $168,782 | |
| 2016 | $1.00 | —(2) | —(2) | —(2) | —(2) | —(2) | —(2) | $1.00 | 0.02% | 0.29% | 0.50% | 0.02% | (0.19)% | $169,640 | |
| | |
| Notes to Financial Highlights |
(1)Total returns are calculated based on the net asset value of the last business day. Total returns for periods less than one year are not annualized.
(2)Per-share amount was less than $0.005.
See Notes to Financial Statements.
| | |
| Report of Independent Registered Public Accounting Firm |
To the Board of Trustees of American Century California Tax-Free and Municipal Funds and Shareholders of California Tax-Free Money Market Fund
Opinion on the Financial Statements
We have audited the accompanying statement of assets and liabilities, including the schedule of investments, of California Tax-Free Money Market Fund (one of the funds constituting American Century California Tax-Free and Municipal Funds, referred to hereafter as the "Fund") as of August 31, 2020, the related statement of operations for the year ended August 31, 2020, the statement of changes in net assets for each of the two years in the period ended August 31, 2020, including the related notes, and the financial highlights for each of the five years in the period ended August 31, 2020 (collectively referred to as the “financial statements”). In our opinion, the financial statements present fairly, in all material respects, the financial position of the Fund as of August 31, 2020, the results of its operations for the year then ended, the changes in its net assets for each of the two years in the period ended August 31, 2020 and the financial highlights for each of the five years in the period ended August 31, 2020 in conformity with accounting principles generally accepted in the United States of America.
Basis for Opinion
These financial statements are the responsibility of the Fund’s management. Our responsibility is to express an opinion on the Fund’s financial statements based on our audits. We are a public accounting firm registered with the Public Company Accounting Oversight Board (United States) (PCAOB) and are required to be independent with respect to the Fund in accordance with the U.S. federal securities laws and the applicable rules and regulations of the Securities and Exchange Commission and the PCAOB.
We conducted our audits of these financial statements in accordance with the standards of the PCAOB. Those standards require that we plan and perform the audit to obtain reasonable assurance about whether the financial statements are free of material misstatement, whether due to error or fraud.
Our audits included performing procedures to assess the risks of material misstatement of the financial statements, whether due to error or fraud, and performing procedures that respond to those risks. Such procedures included examining, on a test basis, evidence regarding the amounts and disclosures in the financial statements. Our audits also included evaluating the accounting principles used and significant estimates made by management, as well as evaluating the overall presentation of the financial statements. Our procedures included confirmation of securities owned as of August 31, 2020 by correspondence with the custodian. We believe that our audits provide a reasonable basis for our opinion.
/s/ PricewaterhouseCoopers LLP
Kansas City, Missouri
October 16, 2020
We have served as the auditor of one or more investment companies in American Century Investments since 1997.
Board of Trustees
The individuals listed below serve as trustees of the funds. Each trustee will continue to serve in this capacity until death, retirement, resignation or removal from office. The board has adopted a mandatory retirement age for trustees who are not “interested persons,” as that term is defined in the Investment Company Act (independent trustees). Independent trustees shall retire on December 31 of the year in which they reach their 75th birthday; provided, however, that on or after January 1, 2022, independent trustees shall retire on December 31 of the year in which they reach their 76th birthday.
Mr. Thomas is an “interested person” because he currently serves as President and Chief Executive Officer of American Century Companies, Inc. (ACC), the parent company of American Century Investment Management, Inc. (ACIM or the advisor). The other trustees (more than three-fourths of the total number) are independent. They are not employees, directors or officers of, and have no financial interest in, ACC or any of its wholly owned, direct or indirect, subsidiaries, including ACIM, American Century Investment Services, Inc. (ACIS) and American Century Services, LLC (ACS), and they do not have any other affiliations, positions or relationships that would cause them to be considered “interested persons” under the Investment Company Act. The trustees serve in this capacity for eight (in the case of Jonathan S. Thomas, 16; and Ronald J. Gilson, 9) registered investment companies in the American Century Investments family of funds.
The following table presents additional information about the trustees. The mailing address for each trustee other than Mr. Thomas is 1665 Charleston Road, Mountain View, California 94043. The mailing address for Mr. Thomas is 4500 Main Street, Kansas City, Missouri 64111.
| | | | | | | | | | | | | | | | | |
Name
(Year of Birth) | Position(s) Held with Funds | Length of Time Served | Principal Occupation(s) During Past 5 Years | Number of American Century Portfolios Overseen by Trustee | Other Directorships Held During Past 5 Years |
| Independent Trustees | | | | | |
Tanya S. Beder
(1955) | Trustee | Since 2011 | Chairman and CEO, SBCC Group Inc. (independent advisory services) (2006 to present) | 40 | CYS
Investments,
Inc.; Kirby Corporation; Nabors
Industries Ltd. |
Jeremy I. Bulow
(1954) | Trustee | Since 2011 | Professor of Economics, Stanford University, Graduate School of Business (1979 to present) | 40 | None |
Anne Casscells
(1958) | Trustee | Since 2016 | Co-Chief Executive Officer and Chief Investment Officer, Aetos Alternatives Management (investment advisory firm) (2001 to present); Lecturer in Accounting, Stanford University, Graduate School of Business (2009 to 2017) | 40 | None |
Ronald J. Gilson
(1946) | Trustee and Chairman of the Board | Since 1995
(Chairman since 2005) | Charles J. Meyers Professor of Law and Business, Emeritus, Stanford Law School (1979 to 2016); Marc and Eva Stern Professor of Law and Business, Columbia University School of Law (1992 to present) | 59 | None |
| | | | | | | | | | | | | | | | | |
Name
(Year of Birth) | Position(s) Held with Funds | Length of Time Served | Principal Occupation(s) During Past 5 Years | Number of American Century Portfolios Overseen by Trustee | Other Directorships Held During Past 5 Years |
| Independent Trustees | | | | | |
Frederick L. A. Grauer
(1946) | Trustee | Since 2008 | Senior Advisor, Credit Sesame, Inc. (credit monitoring firm) (2018 to present); Senior Advisor, Course Hero (an educational technology company) (2015 to present) | 40 | None |
Jonathan D. Levin
(1972) | Trustee | Since 2016 | Philip H. Knight Professor and Dean, Graduate School of Business, Stanford University (2016 to present); Professor, Stanford University, (2000 to present) | 40 | None |
Peter F. Pervere
(1947) | Trustee | Since 2007 | Retired | 40 | None |
John B. Shoven
(1947) | Trustee | Since 2002 | Charles R. Schwab Professor of Economics, Stanford University (1973 to present, emeritus since 2019) | 40 | Cadence Design Systems; Exponent; Financial Engines |
| Interested Trustee | | | | | |
Jonathan S. Thomas
(1963) | Trustee | Since 2007 | President and Chief Executive Officer, ACC (2007 to present). Also serves as Chief Executive Officer, ACS; Executive Vice President, ACIM; Director, ACC, ACIM and other ACC subsidiaries | 122 | None |
The Statement of Additional Information has additional information about the fund's trustees and is available without charge, upon request, by calling 1-800-345-2021.
Officers
The following table presents certain information about the executive officers of the funds. Each officer serves as an officer for 16 (in the case of Robert J. Leach, 15) investment companies in the American Century family of funds. No officer is compensated for his or her service as an officer of the funds. The listed officers are interested persons of the funds and are appointed or re-appointed on an annual basis. The mailing address for each of the officers listed below is 4500 Main Street, Kansas City, Missouri 64111.
| | | | | | | | |
Name
(Year of Birth) | Offices with the Funds | Principal Occupation(s) During the Past Five Years |
Patrick Bannigan
(1965) | President since 2019 | Executive Vice President and Director, ACC (2012 to present); Chief Financial Officer, Chief Accounting Officer and Treasurer, ACC (2015 to present). Also serves as President, ACS; Vice President, ACIM; Chief Financial Officer, Chief Accounting Officer and/or Director, ACIM, ACS and other ACC subsidiaries |
R. Wes Campbell
(1974) | Chief Financial Officer and Treasurer since 2018 | Vice President, ACS, (2020 to present); Investment Operations and Investment Accounting, ACS (2000 to present)
|
Amy D. Shelton
(1964) | Chief Compliance Officer and Vice President since 2014 | Chief Compliance Officer, American Century funds, (2014 to present); Chief Compliance Officer, ACIM (2014 to present); Chief Compliance Officer, ACIS (2009 to present). Also serves as Vice President, ACIS |
Charles A. Etherington
(1957) | General Counsel since 2007 and Senior Vice President since 2006 | Attorney, ACC (1994 to present); Vice President, ACC (2005 to present); General Counsel, ACC (2007 to present). Also serves as General Counsel, ACIM, ACS, ACIS and other ACC subsidiaries; and Senior Vice President, ACIM and ACS |
C. Jean Wade
(1964) | Vice President since 2012 | Senior Vice President, ACS (2017 to present); Vice President, ACS (2000 to 2017) |
Robert J. Leach
(1966) | Vice President since 2006 | Vice President, ACS (2000 to present) |
David H. Reinmiller
(1963) | Vice President since 2000 | Attorney, ACC (1994 to present). Also serves as Vice President, ACIM and ACS |
Ward D. Stauffer
(1960) | Secretary since 2005 | Attorney, ACC (2003 to present) |
| | |
| Approval of Management Agreement |
At a meeting held on June 17, 2020, the Fund’s Board of Trustees (the "Board") unanimously approved the renewal of the management agreement pursuant to which American Century Investment Management, Inc. (the “Advisor”) acts as the investment advisor for the Fund. Under Section 15(c) of the Investment Company Act, contracts for investment advisory services are required to be reviewed, evaluated, and approved by a majority of a fund’s Trustees, including a majority of the independent Trustees, each year. The Board regards this annual evaluation and renewal as one of its most important responsibilities.
The independent Trustees have memorialized a statement regarding the relationship between their ongoing obligations to oversee and evaluate the performance of the Advisor and their annual consideration of renewal of the management agreement. In that statement, the independent Trustees noted that their assessment of the Advisor’s performance is an ongoing process that takes place over the entire year and is informed by all of the extensive information that the Board and its committees receive and consider over time. This information, together with the additional materials provided specifically in connection with the review, are central to the Board’s assessment of the Advisor’s performance and its determination whether to renew the Fund’s management agreement.
Prior to its consideration of the renewal of the management agreement, the Board requested and reviewed extensive data and analysis relating to the proposed renewal. This information and analysis was compiled by the Advisor and certain independent providers of evaluation data concerning the Fund and the services provided to the Fund by the Advisor.
In connection with its consideration of the renewal of the management agreement, the Board’s review and evaluation of the services provided by the Advisor included, but was not limited to, the following:
•the nature, extent, and quality of investment management, shareholder services, and other services provided to the Fund;
•the wide range of other programs and services the Advisor and its affiliates provide to the Fund and its shareholders on a routine and non-routine basis;
•the Fund’s investment performance, including data comparing the Fund’s performance to appropriate benchmarks and/or a peer group of other mutual funds with similar investment objectives and strategies;
•the cost of owning the Fund compared to the cost of owning similar funds;
•the compliance policies, procedures, and regulatory experience of the Advisor and its affiliates and certain other Fund service providers;
•financial data showing the cost of services provided by the Advisor and its affiliates to the Fund, the profitability of the Fund to the Advisor, and the overall profitability of the Advisor;
•the Advisor’s strategic plans;
•the Advisor’s response to the COVID-19 pandemic;
•any economies of scale associated with the Advisor’s management of the Fund;
•services provided and charges to the Advisor’s other investment management clients;
•fees and expenses associated with any investment by the Fund in other funds;
•payments and practices in connection with financial intermediaries holding shares of the Fund on behalf of their clients and the services provided by intermediaries in connection therewith; and
•any collateral benefits derived by the Advisor from the management of the Fund.
In keeping with its practice, the Board held two meetings and the independent Trustees met in private session to discuss the renewal and to review and discuss the information provided in response to their request. The Board held active discussions with the Advisor regarding the
renewal of the management agreement. The independent Trustees had the benefit of the advice of their independent counsel throughout the process.
Factors Considered
The Trustees considered all of the information provided by the Advisor, the independent data providers, and the independent Trustees’ independent counsel in connection with the approval. They determined that the information was sufficient for them to evaluate the management agreement for the Fund. In connection with their review, the Trustees did not identify any single factor as being all-important or controlling and each Trustee may have attributed different levels of importance to different factors. In deciding to renew the management agreement, the Board based its decision on a number of factors, including the following:
Nature, Extent and Quality of Services — Generally. Under the management agreement, the Advisor is responsible for providing or arranging for all services necessary for the operation of the Fund. The Board noted that the Advisor provides or arranges at its own expense a wide variety of services including:
•constructing and designing the Fund
•portfolio research and security selection
•initial capitalization/funding
•securities trading
•Fund administration
•custody of Fund assets
•daily valuation of the Fund’s portfolio
•shareholder servicing and transfer agency, including shareholder confirmations, recordkeeping, and communications
•legal services (except the independent Trustees’ counsel)
•regulatory and portfolio compliance
•financial reporting
•marketing and distribution (except amounts paid by the Fund under Rule 12b-1 plans)
The Board noted that many of these services have expanded over time in terms of both quantity and complexity in response to shareholder demands, competition in the industry, changing distribution channels, and the changing regulatory environment.
Investment Management Services. The nature of the investment management services provided to the Fund is quite complex and allows Fund shareholders access to professional money management, instant diversification of their investments within an asset class, the opportunity to easily diversify among asset classes by investing in or exchanging among various American Century Investments funds, and liquidity. In evaluating investment performance, the Board expects the Advisor to manage the Fund in accordance with its investment objectives and approved strategies. Further, the Trustees recognize that the Advisor has an obligation to seek the best execution of fund trades. In providing these services, the Advisor utilizes teams of investment professionals (portfolio managers, analysts, research assistants, and securities traders) who require extensive information technology, research, training, compliance, and other systems to conduct their business. The Board, directly and through its Portfolio Committee, regularly reviews investment performance information for the Fund, together with comparative information for appropriate benchmarks and/or peer groups of similarly-managed funds, over different time horizons. The Trustees also review investment performance information during the management agreement renewal process. If performance concerns are identified, the Fund receives special reviews until performance improves, during which the Board discusses with the Advisor the reasons for such results (e.g., market conditions, security selection) and any efforts being undertaken to improve performance. The Fund’s performance was above the median of its peer group for the one-, three-, five-, and ten-year periods reviewed by the Board. The Board found the investment management services provided by the Advisor to the Fund to be satisfactory and consistent with the management agreement.
Shareholder and Other Services. Under the management agreement, the Advisor, either directly or through affiliates or third parties, provides the Fund with a comprehensive package of transfer agency, shareholder, and other services. The Board, directly and through its various committees, regularly reviews reports and evaluations of such services at its regular meetings. These reports include, but are not limited to, information regarding the operational efficiency and accuracy of the shareholder and transfer agency services provided, staffing levels, shareholder satisfaction, technology support (including cyber security), new products and services offered to Fund shareholders, securities trading activities, portfolio valuation services, auditing services, and legal and operational compliance activities. The Board found the services provided by the Advisor to the Fund under the management agreement to be competitive and of high quality.
COVID-19 Response. During 2020, much of the world experienced unprecedented change and challenges from the impacts of the rapidly evolving, worldwide spread of the COVID-19 virus. The Board evaluated the Advisor’s response to the COVID-19 pandemic and its impact on service to the Fund. The Board found that Fund shareholders have continued to receive the Advisor’s investment management and other services without disruption, and Advisor personnel have demonstrated great resiliency in providing those services. The Board, directly and through its committees, continues to monitor the impact of the pandemic and the response of each of the Fund’s service providers.
Costs of Services and Profitability. The Advisor provides detailed information concerning its cost of providing various services to the Fund, its profitability in managing the Fund, its overall profitability, and its financial condition. The Trustees have reviewed with the Advisor the methodology used to prepare this financial information. This information is considered in evaluating the Advisor’s financial condition, its ability to continue to provide services under the management agreement, and the reasonableness of the current management fee. The Board concluded that the Advisor’s profits were reasonable in light of the services provided to the Fund.
Ethics. The Board generally considers the Advisor’s commitment to providing quality services to shareholders and to conducting its business ethically. They noted that the Advisor’s practices generally meet or exceed industry best practices.
Economies of Scale. The Board also reviewed information provided by the Advisor regarding the possible existence of economies of scale in connection with the management of the Fund. The Board concluded that economies of scale are difficult to measure and predict with precision, especially on a fund-by-fund basis. The Board concluded that the Advisor is appropriately sharing economies of scale, to the extent they exist, through its competitive fee structure, offering competitive fees from fund inception, and through reinvestment in its business, infrastructure, investment capabilities and initiatives to provide shareholders enhanced and expanded services.
Comparison to Other Funds’ Fees. The management agreement provides that the Fund pays the Advisor a single, all-inclusive (or unified) management fee for providing all services necessary for the management and operation of the Fund, other than brokerage expenses, expenses attributable to short sales, taxes, interest, extraordinary expenses, fees and expenses of the Fund’s independent Trustees (including their independent legal counsel), and expenses incurred in connection with the provision of shareholder services and distribution services under a plan adopted pursuant to Rule 12b-1 under the Investment Company Act. Under this unified fee structure, the Advisor is responsible for providing all investment advisory, custody, audit, administrative, compliance, recordkeeping, marketing, and shareholder services, or arranging and supervising third parties to provide such services. By contrast, most other funds are charged a variety of fees, including an investment advisory fee, a transfer agency fee, an administrative fee, and other expenses. Other than their investment advisory fees and any applicable Rule 12b-1 distribution fees, all other components of the total fees charged by these other funds may be increased without shareholder approval. The Board believes the unified fee structure is a benefit to Fund shareholders because it clearly discloses to shareholders the cost of owning Fund shares, and, since the unified fee cannot be increased without a vote of Fund shareholders, it shifts to the
Advisor the risk of increased costs of operating the Fund and provides a direct incentive to minimize administrative inefficiencies. Part of the Board’s analysis of fee levels involves reviewing certain evaluative data compiled by an independent provider and comparing the Fund’s unified fee to the total expense ratio of peer funds. The unified fee charged to shareholders of the Fund was below the median of the total expense ratios of the Fund’s peer universe.The Board concluded that the management fee paid by the Fund to the Advisor under the management agreement is reasonable in light of the services provided to the Fund.
Comparison to Fees and Services Provided to Other Clients of the Advisor. The Board also requested and received information from the Advisor concerning the nature of the services, fees, costs, and profitability of its advisory services to advisory clients other than the Fund. They observed that these varying types of client accounts require different services and involve different regulatory and entrepreneurial risks than the management of the Fund. The Board analyzed this information and concluded that the fees charged and services provided to the Fund were reasonable by comparison.
Payments to Intermediaries. The Trustees also requested and received a description of payments made to intermediaries by the Fund and the Advisor and services provided by intermediaries. These payments include various payments made by the Fund or the Advisor to different types of intermediaries and recordkeepers for distribution and service activities provided with respect to the Fund. The Trustees reviewed such information and received representations from the Advisor that all such payments by the Fund were made pursuant to the Fund’s Rule 12b-1 Plan and that all such payments by the Advisor were made from the Advisor’s resources and reasonable profits. The Board found such payments to be reasonable in scope and purpose.
Collateral or “Fall-Out” Benefits Derived by the Advisor. The Board considered the existence of collateral benefits the Advisor may receive as a result of its relationship with the Fund. The Board noted that the Advisor’s primary business is managing mutual funds and it generally does not use fund or shareholder information to generate profits in other lines of business, and therefore does not derive any significant collateral benefits from them. The Board noted that the Advisor may receive proprietary research from broker-dealers that execute fund portfolio transactions. The Board also determined that the Advisor is able to provide investment management services to certain clients other than the Fund, at least in part, due to its existing infrastructure built to serve the fund complex. The Board noted that the assets of those other accounts are, where applicable, included with the assets of the Fund to determine breakpoints in the management fee schedule.
Existing Relationship. The Board also considered whether there was any reason for not continuing the existing arrangement with the Advisor. In this regard, the Board was mindful of the potential disruptions of the Fund’s operations and various risks, uncertainties, and other effects that could occur as a result of a decision not to continue such relationship. In particular, the Board recognized that most shareholders have invested in the Fund on the strength of the Advisor’s industry standing and reputation and in the expectation that the Advisor will have a continuing role in providing advisory services to the Fund.
Conclusion of the Trustees. As a result of this process, the Board, including all of the independent Trustees and assisted by the advice of independent legal counsel, taking into account all of the factors discussed above and the information provided by the Advisor and others in connection with its review and throughout the year, concluded that the management agreement between the Fund and the Advisor is fair and reasonable in light of the services provided and should be renewed.
| | |
| Liquidity Risk Management Program |
The Fund has adopted a liquidity risk management program (the “program”). The Fund’s Board of Trustees (the "Board") has designated American Century Investment Management, Inc. (“ACIM”) as the administrator of the program. Personnel of ACIM or its affiliates conduct the day-to-day operation of the program pursuant to policies and procedures administered by those members of the ACIM’s Investment Oversight Committee who are members of the ACIM’s Investment Management and Global Analytics departments.
Under the program, ACIM manages the Fund’s liquidity risk, which is the risk that the Fund could not meet shareholder redemption requests without significant dilution of remaining shareholders’ interests in the Fund. This risk is managed by monitoring the degree of liquidity of the Fund’s investments, limiting the amount of the Fund’s illiquid investments, and utilizing various risk management tools and facilities available to the Fund for meeting shareholder redemptions, among other means. ACIM’s process of determining the degree of liquidity of the Fund’s investments is supported by one or more third-party liquidity assessment vendors.
The Board reviewed a report prepared by ACIM regarding the operation and effectiveness of the program for the period December 1, 2018 through December 31, 2019. No significant liquidity events impacting the Fund were noted in the report. In addition, ACIM provided its assessment that the program had been effective in managing the Fund’s liquidity risk.
Retirement Account Information
As required by law, distributions you receive from certain retirement accounts are subject to federal income tax withholding, unless you elect not to have withholding apply*. Tax will be withheld on the total amount withdrawn even though you may be receiving amounts that are not subject to withholding, such as nondeductible contributions. In such case, excess amounts of withholding could occur. You may adjust your withholding election so that a greater or lesser amount will be withheld.
If you don’t want us to withhold on this amount, you must notify us to not withhold the federal income tax. You may notify us in writing or in certain situations by telephone or through other electronic means. For systematic withdrawals, your withholding election will remain in effect until revoked or changed by filing a new election. You have the right to revoke your election at any time and change your withholding percentage for future distributions.
Remember, even if you elect not to have income tax withheld, you are liable for paying income tax on the taxable portion of your withdrawal. If you elect not to have income tax withheld or you don’t have enough income tax withheld, you may be responsible for payment of estimated tax. You may incur penalties under the estimated tax rules if your withholding and estimated tax payments are not sufficient. You can reduce or defer the income tax on a distribution by directly or indirectly rolling such distribution over to another IRA or eligible plan. You should consult your tax advisor for additional information.
State tax will be withheld if, at the time of your distribution, your address is within one of the mandatory withholding states and you have federal income tax withheld (or as otherwise required by state law). State taxes will be withheld from your distribution in accordance with the respective state rules.
*Some 403(b), 457 and qualified retirement plan distributions may be subject to 20% mandatory withholding, as they are subject to special tax and withholding rules. Your plan administrator or plan sponsor is required to provide you with a special tax notice explaining those rules at the time you request a distribution. If applicable, federal and/or state taxes may be withheld from your distribution amount.
Proxy Voting Policies
Descriptions of the principles and policies that the fund's investment advisor uses in exercising the voting rights associated with the securities purchased and/or held by the fund are available without charge, upon request, by calling 1-800-345-2021 or visiting American Century Investments’ website at americancentury.com/proxy. A description of the policies is also available on the Securities and Exchange Commission’s website at sec.gov. Information regarding how the investment advisor voted proxies relating to portfolio securities during the most recent 12-month period ended June 30 is available on americancentury.com/proxy. It is also available at sec.gov.
Portfolio Holdings Disclosure
The fund files its complete schedule of portfolio holdings with the Securities and Exchange Commission (SEC) each month on Form N-MFP. The fund’s Form N-MFP reports are available on it’s website at americancentury.com and on the SEC’s website at sec.gov. The fund also makes its complete schedule of portfolio holdings for the most recent quarter of its fiscal year available on its website at americancentury.com and, upon request, by calling 1-800-345-2021.
Other Tax Information
The following information is provided pursuant to provisions of the Internal Revenue Code.
The fund designates $845,923 as exempt interest dividends for the fiscal year ended August 31, 2020.
| | | | | | | | |
| | |
| | |
| Contact Us | americancentury.com | |
| Automated Information Line | 1-800-345-8765 | |
| Investor Services Representative | 1-800-345-2021
or 816-531-5575 | |
| Investors Using Advisors | 1-800-378-9878 | |
| Business, Not-For-Profit, Employer-Sponsored Retirement Plans | 1-800-345-3533 | |
| Banks and Trust Companies, Broker-Dealers, Financial Professionals, Insurance Companies | 1-800-345-6488 | |
| Telecommunications Relay Service for the Deaf | 711 | |
| | |
| American Century California Tax-Free and Municipal Funds | | |
| | |
Investment Advisor: American Century Investment Management, Inc. Kansas City, Missouri | | |
| | |
This report and the statements it contains are submitted for the general information of our shareholders. The report is not authorized for distribution to prospective investors unless preceded or accompanied by an effective prospectus. | | |
| | |
©2020 American Century Proprietary Holdings, Inc. All rights reserved.
CL-ANN-90328 2010 | | |
ITEM 2. CODE OF ETHICS.
(a) The registrant has adopted a Code of Ethics for Senior Financial Officers that applies to the registrant’s principal executive officer, principal financial officer, principal accounting officer, and persons performing similar functions.
(b) No response required.
(c) None.
(d) None.
(e) Not applicable.
(f) The registrant’s Code of Ethics for Senior Financial Officers was filed as Exhibit 12 (a)(1) to American Century Asset Allocation Portfolios, Inc.’s Annual Certified Shareholder Report on Form N-CSR, File No. 811-21591, on September 29, 2005, and is incorporated herein by reference.
ITEM 3. AUDIT COMMITTEE FINANCIAL EXPERT.
(a)(1) The registrant's board has determined that the registrant has at least one audit committee financial expert serving on its audit committee.
(a)(2) Tanya S. Beder, Anne Casscells, Peter F. Pervere and Ronald J. Gilson are the registrant's designated audit committee financial experts. They are "independent" as defined in Item 3 of Form N-CSR.
(a)(3) Not applicable.
(b) No response required.
(c) No response required.
(d) No response required.
ITEM 4. PRINCIPAL ACCOUNTANT FEES AND SERVICES.
(a) Audit Fees.
The aggregate fees billed for each of the last two fiscal years for professional services rendered by the principal accountant for the audit of the registrant’s annual financial statements or services that are normally provided by the accountant in connection with statutory and regulatory filings or engagements for those fiscal years were as follows:
FY 2019: $86,209
FY 2020: $94,558
(b) Audit-Related Fees.
The aggregate fees billed in each of the last two fiscal years for assurance and related services by the principal accountant that are reasonably related to the performance of the audit of the registrant’s financial statements and are not reported under paragraph (a) of this Item were as follows:
For services rendered to the registrant:
FY 2019: $0
FY 2020: $0
Fees required to be approved pursuant to paragraph (c)(7)(ii) of Rule 2-01 of Regulation S-X (relating to certain engagements for non-audit services with the registrant’s investment adviser and its affiliates):
FY 2019: $0
FY 2020: $0
(c) Tax Fees.
The aggregate fees billed in each of the last two fiscal years for professional services rendered by the principal accountant for tax compliance, tax advice, and tax planning were as follows:
For services rendered to the registrant:
FY 2019: $0
FY 2020: $0
Fees required to be approved pursuant to paragraph (c)(7)(ii) of Rule 2-01 of Regulation S-X (relating to certain engagements for non-audit services with the registrant’s investment adviser and its affiliates):
FY 2019: $0
FY 2020: $0
(d) All Other Fees.
The aggregate fees billed in each of the last two fiscal years for products and services provided by the principal accountant, other than the services reported in paragraphs (a) through (c) of this Item were as follows:
For services rendered to the registrant:
FY 2019: $0
FY 2020: $0
Fees required to be approved pursuant to paragraph (c)(7)(ii) of Rule 2-01 of Regulation S-X (relating to certain engagements for non-audit services with the registrant’s investment adviser and its affiliates):
FY 2019: $0
FY 2020: $0
(e)(1) In accordance with paragraph (c)(7)(i)(A) of Rule 2-01 of Regulation S-X, before the accountant is engaged by the registrant to render audit or non-audit services, the engagement is approved by the registrant’s audit committee. Pursuant to paragraph (c)(7)(ii) of Rule 2-01 of Regulation S-X, the registrant’s audit committee also pre-approves its accountant’s engagements for non-audit services with the registrant’s investment adviser, its parent company, and any entity controlled by, or under common control with the investment adviser that provides ongoing services to the registrant, if the engagement relates directly to the operations and financial reporting of the registrant.
(e)(2) All services described in each of paragraphs (b) through (d) of this Item were pre-approved before the engagement by the registrant’s audit committee pursuant to paragraph (c)(7)(i)(A) of Rule 2-01 of Regulation S-X.
Consequently, none of such services were required to be approved by the audit committee pursuant to paragraph (c)(7)(i)(C).
(f) The percentage of hours expended on the principal accountant’s engagement to audit the registrant’s financial statements for the most recent fiscal year that were attributed to work performed by persons other than the principal accountant’s full-time, permanent employees was less than 50%.
(g) The aggregate non-audit fees billed by the registrant’s accountant for services rendered to the registrant, and rendered to the registrant’s investment adviser (not including any sub-adviser whose role is primarily portfolio management and is subcontracted with or overseen by another investment adviser), and any entity controlling, controlled by, or under common control with the adviser that provides ongoing services to the registrant for each of the last two fiscal years of the registrant were as follows:
FY 2019: $177,597
FY 2020: $147,500
(h) The registrant’s investment adviser and accountant have notified the registrant’s audit committee of all non-audit services that were rendered by the registrant’s accountant to the registrant’s investment adviser, its parent company, and any entity controlled by, or under common control with the investment adviser that provides services to the registrant, which services were not required to be pre-approved pursuant to paragraph (c)(7)(ii) of Rule 2-01 of Regulation S-X. The notification provided to the registrant’s audit committee included sufficient details regarding such services to allow the registrant’s audit committee to consider the continuing independence of its principal accountant.
ITEM 5. AUDIT COMMITTEE OF LISTED REGISTRANTS.
Not applicable.
ITEM 6. INVESTMENTS.
(a) The schedule of investments is included as part of the report to stockholders filed under Item 1 of this Form.
(b) Not applicable.
ITEM 7. DISCLOSURE OF PROXY VOTING POLICIES AND PROCEDURES FOR CLOSED-END MANAGEMENT INVESTMENT COMPANIES.
Not applicable.
ITEM 8. PORTFOLIO MANAGERS OF CLOSED-END MANAGEMENT INVESTMENT COMPANIES.
Not applicable.
ITEM 9. PURCHASES OF EQUITY SECURITIES BY CLOSED-END MANAGEMENT INVESTMENT COMPANY AND AFFILIATED PURCHASERS.
Not applicable.
ITEM 10. SUBMISSION OF MATTERS TO A VOTE OF SECURITY HOLDERS.
During the reporting period, there were no material changes to the procedures by which shareholders may recommend nominees to the registrant’s board.
ITEM 11. CONTROLS AND PROCEDURES.
(a) The registrant's principal executive officer and principal financial officer have concluded that the registrant's disclosure controls and procedures (as defined in Rule 30a-3(c) under the Investment Company Act of 1940) are effective based on their evaluation of these controls and procedures as of a date within 90 days of the filing date of this report.
(b) There were no changes in the registrant's internal control over financial reporting (as defined in Rule 30a-3(d) under the Investment Company Act of 1940) that occurred during the period covered by this report that have materially affected, or are reasonably likely to materially affect, the registrant's internal control over financial reporting.
ITEM 12. DISCLOSURE OF SECURITIES LENDING ACTIVITIES FOR CLOSED-END MANAGEMENT INVESTMENT COMPANIES.
Not applicable.
ITEM 13. EXHIBITS.
(a)(1) Registrant’s Code of Ethics for Senior Financial Officers, which is the subject of the disclosure required by Item 2 of Form N-CSR, was filed as Exhibit 12(a)(1) to American Century Asset Allocation Portfolios, Inc.’s Certified Shareholder Report on Form N-CSR, File No. 811-21591, on September 29, 2005.
(a)(3) Not applicable.
(a)(4) Not applicable.
SIGNATURES
Pursuant to the requirements of the Securities Exchange Act of 1934 and the Investment Company Act of 1940, the registrant has duly caused this report to be signed on its behalf by the undersigned, thereunto duly authorized.
| | | | | | | | | | | | | | |
| Registrant: | American Century California Tax-Free and Municipal Funds | | | |
| | | | |
| By: | /s/ Patrick Bannigan | | | |
| Name: | Patrick Bannigan | | |
| Title: | President | | |
| | | | |
| Date: | October 28, 2020 | | | |
Pursuant to the requirements of the Securities Exchange Act of 1934 and the Investment Company Act of 1940, this report has been signed below by the following persons on behalf of the registrant and in the capacities and on the dates indicated.
| | | | | | | | | | | |
| By: | /s/ Patrick Bannigan | | |
| Name: Patrick Bannigan | | |
| Title: President | | |
| (principal executive officer) | | |
| | | |
| Date: | October 28, 2020 | | |
| | | | | | | | | | | |
| By: | /s/ R. Wes Campbell | | |
| Name: R. Wes Campbell | | |
| Title: Treasurer and | | |
| Chief Financial Officer | | |
| (principal financial officer) | | |
| | | |
| Date: | October 28, 2020 | | |