UNITED STATES
SECURITIES AND EXCHANGE COMMISSION
Washington, D.C.20549
FORM N-CSR
CERTIFIED SHAREHOLDER REPORT OF REGISTERED
MANAGEMENT INVESTMENT COMPANIES
| | | | | | | | | | | | | | | | | | | | |
| Investment Company Act file number | 811-03706 |
| |
| AMERICAN CENTURY CALIFORNIA TAX-FREE AND MUNICIPAL FUNDS |
| (Exact name of registrant as specified in charter) |
| |
| 4500 MAIN STREET, KANSAS CITY, MISSOURI | 64111 |
| (Address of principal executive offices) | (Zip Code) |
| |
JOHN PAK
4500 MAIN STREET, KANSAS CITY, MISSOURI 64111 |
| (Name and address of agent for service) |
| |
| Registrant’s telephone number, including area code: | 816-531-5575 |
| |
| Date of fiscal year end: | 08-31 |
| |
| Date of reporting period: | 08-31-2024 |
ITEM 1. REPORTS TO STOCKHOLDERS.
(a)
ANNUAL SHAREHOLDER REPORT
California High-Yield Municipal Fund 
| | | | | |
| Investor Class (BCHYX) | August 31, 2024 |
This annual shareholder report contains important information about California High-Yield Municipal Fund for the period of September 1, 2023 to August 31, 2024. You can find additional information about the fund at americancentury.com/docs. You can also request this information by contacting us at 1-800-345-2021.
| | | | | | | | |
What were the fund costs for the last year? (based on a hypothetical $10,000 investment) |
|
| Costs of a $10,000 investment | Costs paid as a percentage of a $10,000 investment |
| Investor Class | $52 | 0.50% |
|
| | | | | |
| What were the key factors that affected the fund’s performance? |
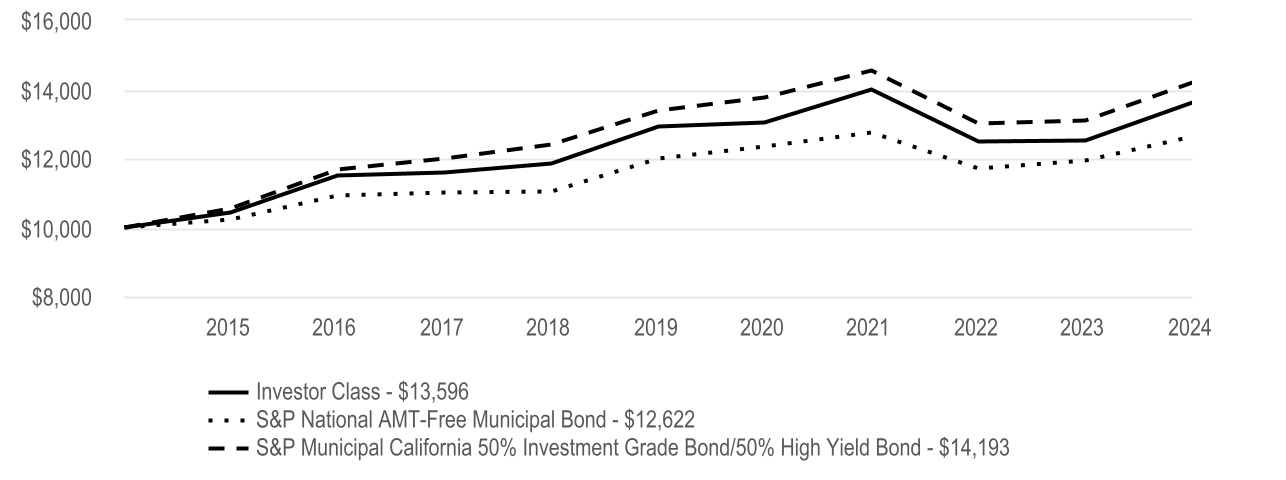
California High-Yield Municipal Fund Investor Class returned 8.75% for the reporting period ended August 31, 2024. |
| The fund seeks high current income that is exempt from federal and California income taxes. The commentary below refers to the fund’s performance compared to the S&P Municipal Bond California 50% Investment-Grade/50% High-Yield Index. |
| • | Against a backdrop of falling Treasury yields, moderating inflation and generally healthy demand for municipal bonds (munis), California munis delivered solid gains. In this environment, our sector allocations aided performance, particularly overweights versus the index in the charter school and special tax sectors and an underweight to state general obligation bonds. These weightings more than offset negative effects from an overweight in the multifamily housing sector. |
| • | We maintained a longer-than-index duration, which also boosted the fund’s performance as yields declined. In addition, our positioning along the yield curve aided results. |
| • | Security selection detracted from performance, largely due to choices in the special tax, charter school and student housing sectors. Positive selection results in the multifamily housing, toll facilities and corporate muni sectors helped offset some negative effects. |
| • | High-yield munis outperformed their investment-grade peers during the period. Compared with the index, which invests evenly in investment-grade and high-yield munis, the fund ended the period with an overweight to high-yield securities. This positioning aided fund performance. |
| | |
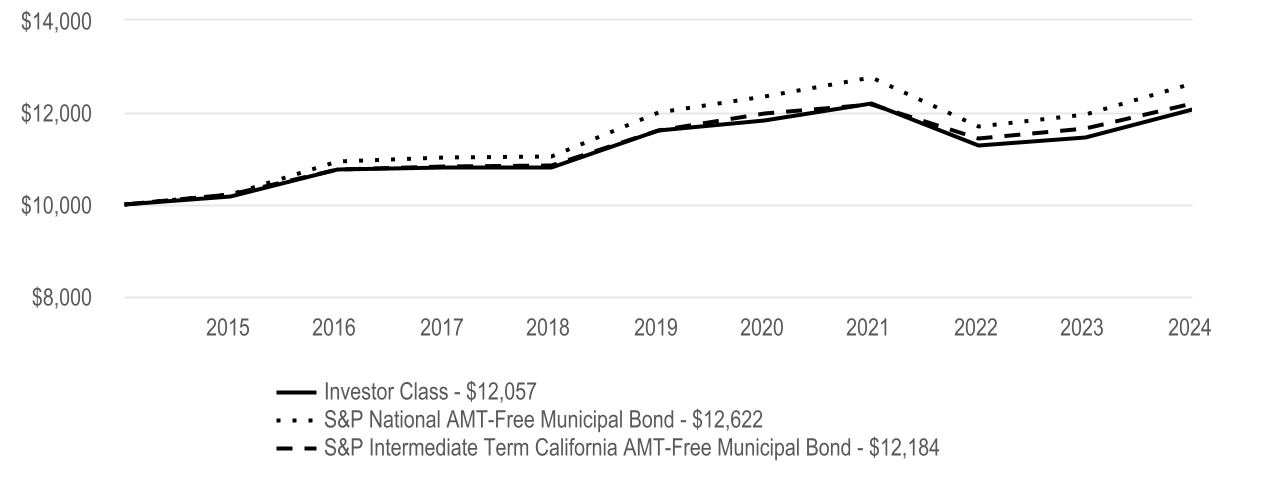
Cumulative Performance (based on an initial $10,000 investment) |
| August 31, 2014 through August 31, 2024 |
|
| | | | | | | | | | | | | | |
Average Annual Total Returns | |
| 1 Year | 5 Year | 10 Year | | | |
| Investor Class | 8.75% | 1.03% | 3.12% | | | |
| | | | | | |
| Regulatory Index | | | | | | |
| S&P National AMT-Free Municipal Bond | 5.74% | 1.04% | 2.36% | | | |
| | | | | | |
| Performance Index | | | | | | |
| S&P Municipal California 50% Investment Grade Bond/50% High Yield Bond | 8.38% | 1.18% | 3.56% | | | |
| | | | | | |
| | | | | | |
| | | | | | |
| | | | | | |
| | | | | | | | | | | | | | | | | |
| The regulatory index is provided as a broad measure of market performance. The performance index is provided because the advisor believes it is more reflective of the fund’s investment strategy. |
|
|
|
|
|
|
|
|
|
|
| | |
|
The opinions expressed are those of American Century Investments and are no guarantee of the future performance of any American Century Investments fund. This information is for educational purposes only and is not intended as investment advice. Data reflects past performance, assumes reinvestment of dividends and capital gains and is no guarantee of future results. Current performance may be higher or lower than data shown. Investment return and principal value will fluctuate and redemption value may be more or less than original cost, and none of the charts reflect the deduction of taxes that a shareholder would pay on fund distributions or the redemption of fund shares. Total returns for periods less than one year are not annualized. Visit americancentury.com for more recent performance information.
|
| | | | | |
Fund Statistics | |
| Net Assets | $1,554,487,774 |
| Management Fees (dollars paid during the reporting period) | $5,486,583 |
| Portfolio Turnover Rate | 56 | % |
| Total Number of Portfolio Holdings | 623 |
| |
| |
| | | | | | | | | | | | | | | | | | | | | | | | | | | | | | | | | | | | |
| Types of Investments in Portfolio (as a % of net assets) | | | | | | | | | | | | | | | | Portfolio at a Glance |
| Municipal Securities | 99.6% | | | | | | | | | | | | | | | | | | | | | | | Weighted Average Life to Maturity | 19 years |
| Affiliated Funds | 0.1% | | | | | | | | | | | | | | | | | | | | | | | Modified Duration | 7 years |
| Other Assets and Liabilities | 0.3% | | | | | | | | | | | | | | | | | | | | | | | | |
| | | | | | | | | | | | | | | | | | | | | | | | | | |
| | | | | | | | | | | | | | | | | | | | | | | | | | |
| | | | | | | | | | | | | | | | | | | | | | | | | | |
| | | | | | | | | | | | | | | | | | | | | | | | | | |
| | | | | | | | | | | | | | | | | | | | | | | | | | |
| | | | | | | | | | | | | | | | | | | | | | | | | | |
| | | | | | | | | | | | | | | | | | | | | | | | | | |
| | | | | | | | | | | | | | | | | | | | | | | | | | |
| | | | | | | | | | | | | | | | | | | | | | | | | | |
| | | | | | | | | | | | | | | | | | | | | | | | | | |
| | | | | | | | | | | | | | | | | | | | | | | | | | |
| | | | | | | | | | | | | | | | | | | | | | | | | | |
| | | | | | | | | | | | | | | | | | | | | | | | | | |
| | |
| For additional information about the fund, including its Prospectus, Statement of Additional Information, financial statements, holdings and proxy voting information, scan the QR code or visit americancentury.com/docs. |

| | |
| American Century Investment Services, Inc., Distributor |
| ©2024 American Century Proprietary Holdings, Inc. All rights reserved. |
A-25075201
ANNUAL SHAREHOLDER REPORT
California High-Yield Municipal Fund
| | | | | |
| I Class (BCHIX) | August 31, 2024 |
This annual shareholder report contains important information about California High-Yield Municipal Fund for the period of September 1, 2023 to August 31, 2024. You can find additional information about the fund at americancentury.com/docs. You can also request this information by contacting us at 1-800-345-2021.
| | | | | | | | |
What were the fund costs for the last year? (based on a hypothetical $10,000 investment) |
|
| Costs of a $10,000 investment | Costs paid as a percentage of a $10,000 investment |
| I Class | $31 | 0.30% |
|
| | | | | |
| What were the key factors that affected the fund’s performance? |
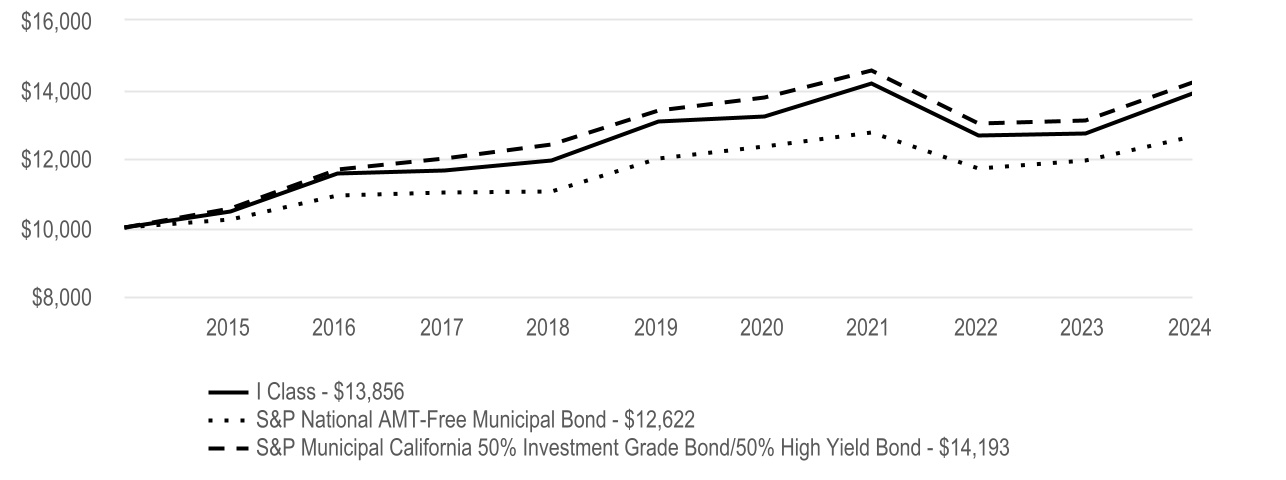
California High-Yield Municipal Fund I Class returned 8.97% for the reporting period ended August 31, 2024. |
| The fund seeks high current income that is exempt from federal and California income taxes. The commentary below refers to the fund’s performance compared to the S&P Municipal Bond California 50% Investment-Grade/50% High-Yield Index. |
| • | Against a backdrop of falling Treasury yields, moderating inflation and generally healthy demand for municipal bonds (munis), California munis delivered solid gains. In this environment, our sector allocations aided performance, particularly overweights versus the index in the charter school and special tax sectors and an underweight to state general obligation bonds. These weightings more than offset negative effects from an overweight in the multifamily housing sector. |
| • | We maintained a longer-than-index duration, which also boosted the fund’s performance as yields declined. In addition, our positioning along the yield curve aided results. |
| • | Security selection detracted from performance, largely due to choices in the special tax, charter school and student housing sectors. Positive selection results in the multifamily housing, toll facilities and corporate muni sectors helped offset some negative effects. |
| • | High-yield munis outperformed their investment-grade peers during the period. Compared with the index, which invests evenly in investment-grade and high-yield munis, the fund ended the period with an overweight to high-yield securities. This positioning aided fund performance. |
| | |
Cumulative Performance (based on an initial $10,000 investment) |
| August 31, 2014 through August 31, 2024 |
|
| | | | | | | | | | | | | | |
Average Annual Total Returns | |
| 1 Year | 5 Year | 10 Year | | | |
| I Class | 8.97% | 1.21% | 3.32% | | | |
| | | | | | |
| Regulatory Index | | | | | | |
| S&P National AMT-Free Municipal Bond | 5.74% | 1.04% | 2.36% | | | |
| | | | | | |
| Performance Index | | | | | | |
| S&P Municipal California 50% Investment Grade Bond/50% High Yield Bond | 8.38% | 1.18% | 3.56% | | | |
| | | | | | |
| | | | | | |
| | | | | | |
| | | | | | |
| | | | | | | | | | | | | | | | | |
| The regulatory index is provided as a broad measure of market performance. The performance index is provided because the advisor believes it is more reflective of the fund’s investment strategy. |
|
|
|
|
|
|
|
|
|
|
| | |
|
The opinions expressed are those of American Century Investments and are no guarantee of the future performance of any American Century Investments fund. This information is for educational purposes only and is not intended as investment advice. Data reflects past performance, assumes reinvestment of dividends and capital gains and is no guarantee of future results. Current performance may be higher or lower than data shown. Investment return and principal value will fluctuate and redemption value may be more or less than original cost, and none of the charts reflect the deduction of taxes that a shareholder would pay on fund distributions or the redemption of fund shares. Total returns for periods less than one year are not annualized. Visit americancentury.com for more recent performance information.
|
| | | | | |
Fund Statistics | |
| Net Assets | $1,554,487,774 |
| Management Fees (dollars paid during the reporting period) | $5,486,583 |
| Portfolio Turnover Rate | 56 | % |
| Total Number of Portfolio Holdings | 623 |
| |
| |
| | | | | | | | | | | | | | | | | | | | | | | | | | | | | | | | | | | | |
| Types of Investments in Portfolio (as a % of net assets) | | | | | | | | | | | | | | | | Portfolio at a Glance |
| Municipal Securities | 99.6% | | | | | | | | | | | | | | | | | | | | | | | Weighted Average Life to Maturity | 19 years |
| Affiliated Funds | 0.1% | | | | | | | | | | | | | | | | | | | | | | | Modified Duration | 7 years |
| Other Assets and Liabilities | 0.3% | | | | | | | | | | | | | | | | | | | | | | | | |
| | | | | | | | | | | | | | | | | | | | | | | | | | |
| | | | | | | | | | | | | | | | | | | | | | | | | | |
| | | | | | | | | | | | | | | | | | | | | | | | | | |
| | | | | | | | | | | | | | | | | | | | | | | | | | |
| | | | | | | | | | | | | | | | | | | | | | | | | | |
| | | | | | | | | | | | | | | | | | | | | | | | | | |
| | | | | | | | | | | | | | | | | | | | | | | | | | |
| | | | | | | | | | | | | | | | | | | | | | | | | | |
| | | | | | | | | | | | | | | | | | | | | | | | | | |
| | | | | | | | | | | | | | | | | | | | | | | | | | |
| | | | | | | | | | | | | | | | | | | | | | | | | | |
| | | | | | | | | | | | | | | | | | | | | | | | | | |
| | | | | | | | | | | | | | | | | | | | | | | | | | |
| | |
| For additional information about the fund, including its Prospectus, Statement of Additional Information, financial statements, holdings and proxy voting information, scan the QR code or visit americancentury.com/docs. |
| | |
| American Century Investment Services, Inc., Distributor |
| ©2024 American Century Proprietary Holdings, Inc. All rights reserved. |
A-25075789
ANNUAL SHAREHOLDER REPORT
California High-Yield Municipal Fund
| | | | | |
| Y Class (ACYHX) | August 31, 2024 |
This annual shareholder report contains important information about California High-Yield Municipal Fund for the period of September 1, 2023 to August 31, 2024. You can find additional information about the fund at americancentury.com/docs. You can also request this information by contacting us at 1-800-345-2021.
| | | | | | | | |
What were the fund costs for the last year? (based on a hypothetical $10,000 investment) |
|
| Costs of a $10,000 investment | Costs paid as a percentage of a $10,000 investment |
| Y Class | $28 | 0.27% |
|
| | | | | |
| What were the key factors that affected the fund’s performance? |
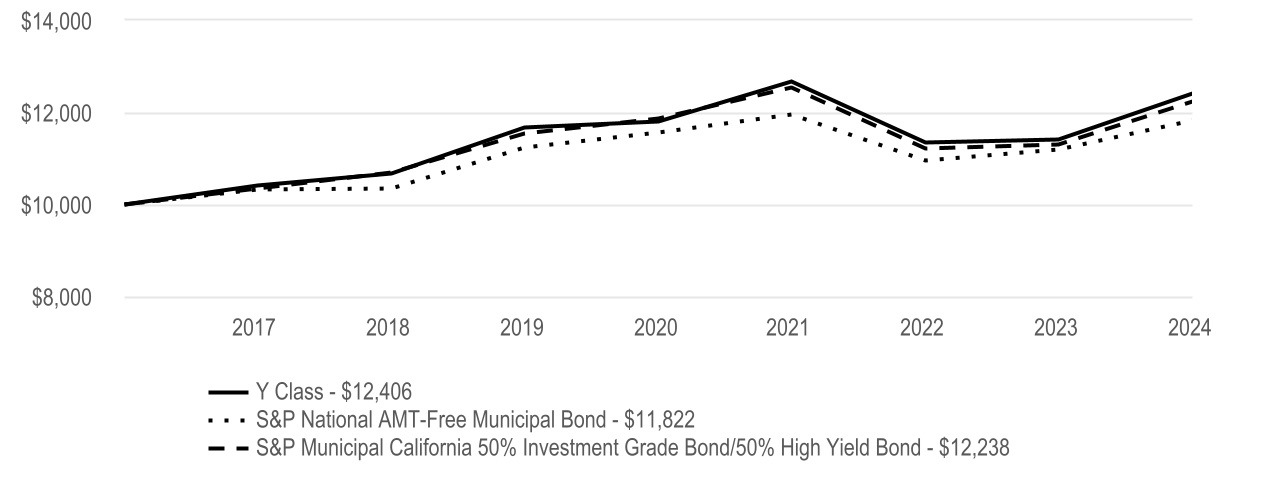
California High-Yield Municipal Fund Y Class returned 8.89% for the reporting period ended August 31, 2024. |
| The fund seeks high current income that is exempt from federal and California income taxes. The commentary below refers to the fund’s performance compared to the S&P Municipal Bond California 50% Investment-Grade/50% High-Yield Index. |
| • | Against a backdrop of falling Treasury yields, moderating inflation and generally healthy demand for municipal bonds (munis), California munis delivered solid gains. In this environment, our sector allocations aided performance, particularly overweights versus the index in the charter school and special tax sectors and an underweight to state general obligation bonds. These weightings more than offset negative effects from an overweight in the multifamily housing sector. |
| • | We maintained a longer-than-index duration, which also boosted the fund’s performance as yields declined. In addition, our positioning along the yield curve aided results. |
| • | Security selection detracted from performance, largely due to choices in the special tax, charter school and student housing sectors. Positive selection results in the multifamily housing, toll facilities and corporate muni sectors helped offset some negative effects. |
| • | High-yield munis outperformed their investment-grade peers during the period. Compared with the index, which invests evenly in investment-grade and high-yield munis, the fund ended the period with an overweight to high-yield securities. This positioning aided fund performance. |
| | |
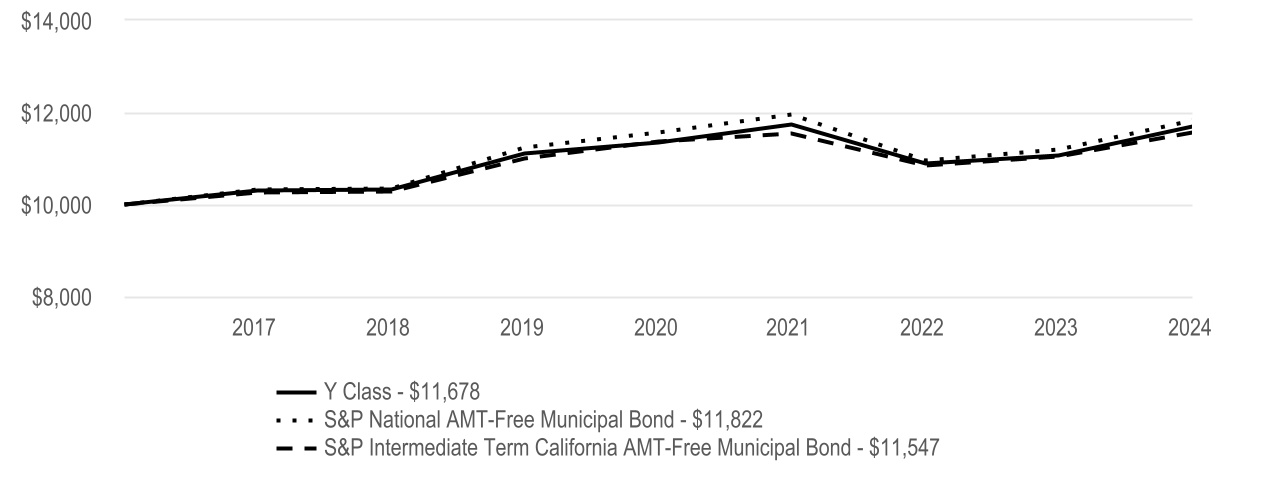
Cumulative Performance (based on an initial $10,000 investment) |
| April 10, 2017 through August 31, 2024 |
|
| | | | | | | | | | | | | | | | |
Average Annual Total Returns | |
| 1 Year | 5 Year | | Since Inception | Inception Date | |
| Y Class | 8.89% | 1.24% | | 2.96% | 4/10/17 | |
| | | | | | |
| Regulatory Index | | | | | | |
| S&P National AMT-Free Municipal Bond | 5.74% | 1.04% | | 2.29% | — | |
| | | | | | |
| Performance Index | | | | | | |
| S&P Municipal California 50% Investment Grade Bond/50% High Yield Bond | 8.38% | 1.18% | | 2.77% | — | |
| | | | | | |
| | | | | | |
| | | | | | |
| | | | | | |
| | | | | | | | | | | | | | | | | |
| The regulatory index is provided as a broad measure of market performance. The performance index is provided because the advisor believes it is more reflective of the fund’s investment strategy. |
|
|
|
|
|
|
|
|
|
|
| | |
|
The opinions expressed are those of American Century Investments and are no guarantee of the future performance of any American Century Investments fund. This information is for educational purposes only and is not intended as investment advice. Data reflects past performance, assumes reinvestment of dividends and capital gains and is no guarantee of future results. Current performance may be higher or lower than data shown. Investment return and principal value will fluctuate and redemption value may be more or less than original cost, and none of the charts reflect the deduction of taxes that a shareholder would pay on fund distributions or the redemption of fund shares. Total returns for periods less than one year are not annualized. Visit americancentury.com for more recent performance information.
|
| | | | | |
Fund Statistics | |
| Net Assets | $1,554,487,774 |
| Management Fees (dollars paid during the reporting period) | $5,486,583 |
| Portfolio Turnover Rate | 56 | % |
| Total Number of Portfolio Holdings | 623 |
| |
| |
| | | | | | | | | | | | | | | | | | | | | | | | | | | | | | | | | | | | |
| Types of Investments in Portfolio (as a % of net assets) | | | | | | | | | | | | | | | | Portfolio at a Glance |
| Municipal Securities | 99.6% | | | | | | | | | | | | | | | | | | | | | | | Weighted Average Life to Maturity | 19 years |
| Affiliated Funds | 0.1% | | | | | | | | | | | | | | | | | | | | | | | Modified Duration | 7 years |
| Other Assets and Liabilities | 0.3% | | | | | | | | | | | | | | | | | | | | | | | | |
| | | | | | | | | | | | | | | | | | | | | | | | | | |
| | | | | | | | | | | | | | | | | | | | | | | | | | |
| | | | | | | | | | | | | | | | | | | | | | | | | | |
| | | | | | | | | | | | | | | | | | | | | | | | | | |
| | | | | | | | | | | | | | | | | | | | | | | | | | |
| | | | | | | | | | | | | | | | | | | | | | | | | | |
| | | | | | | | | | | | | | | | | | | | | | | | | | |
| | | | | | | | | | | | | | | | | | | | | | | | | | |
| | | | | | | | | | | | | | | | | | | | | | | | | | |
| | | | | | | | | | | | | | | | | | | | | | | | | | |
| | | | | | | | | | | | | | | | | | | | | | | | | | |
| | | | | | | | | | | | | | | | | | | | | | | | | | |
| | | | | | | | | | | | | | | | | | | | | | | | | | |
| | |
| For additional information about the fund, including its Prospectus, Statement of Additional Information, financial statements, holdings and proxy voting information, scan the QR code or visit americancentury.com/docs. |
| | |
| American Century Investment Services, Inc., Distributor |
| ©2024 American Century Proprietary Holdings, Inc. All rights reserved. |
A-25075771
ANNUAL SHAREHOLDER REPORT
California High-Yield Municipal Fund
| | | | | |
| A Class (CAYAX) | August 31, 2024 |
This annual shareholder report contains important information about California High-Yield Municipal Fund for the period of September 1, 2023 to August 31, 2024. You can find additional information about the fund at americancentury.com/docs. You can also request this information by contacting us at 1-800-345-2021.
| | | | | | | | |
What were the fund costs for the last year? (based on a hypothetical $10,000 investment) |
|
| Costs of a $10,000 investment | Costs paid as a percentage of a $10,000 investment |
| A Class | $78 | 0.75% |
|
| | | | | |
| What were the key factors that affected the fund’s performance? |
California High-Yield Municipal Fund A Class returned 8.48% for the reporting period ended August 31, 2024. |
| The fund seeks high current income that is exempt from federal and California income taxes. The commentary below refers to the fund’s performance compared to the S&P Municipal Bond California 50% Investment-Grade/50% High-Yield Index. |
| • | Against a backdrop of falling Treasury yields, moderating inflation and generally healthy demand for municipal bonds (munis), California munis delivered solid gains. In this environment, our sector allocations aided performance, particularly overweights versus the index in the charter school and special tax sectors and an underweight to state general obligation bonds. These weightings more than offset negative effects from an overweight in the multifamily housing sector. |
| • | We maintained a longer-than-index duration, which also boosted the fund’s performance as yields declined. In addition, our positioning along the yield curve aided results. |
| • | Security selection detracted from performance, largely due to choices in the special tax, charter school and student housing sectors. Positive selection results in the multifamily housing, toll facilities and corporate muni sectors helped offset some negative effects. |
| • | High-yield munis outperformed their investment-grade peers during the period. Compared with the index, which invests evenly in investment-grade and high-yield munis, the fund ended the period with an overweight to high-yield securities. This positioning aided fund performance. |
| | |
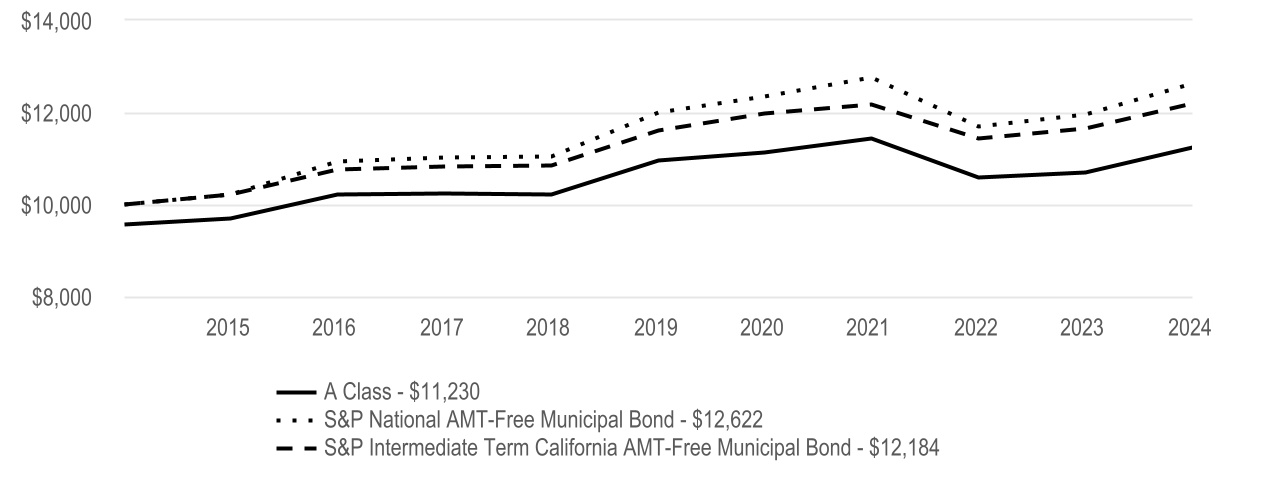
Cumulative Performance (based on an initial $10,000 investment) |
| August 31, 2014 through August 31, 2024 |
| The initial investment is adjusted to reflect the maximum initial sales charge. |
| | | | | | | | | | | | | | |
Average Annual Total Returns | |
| 1 Year | 5 Year | 10 Year | | | |
| A Class | 8.48% | 0.78% | 2.86% | | | |
| A Class - with sales charge | 3.59% | -0.15% | 2.39% | | | |
| Regulatory Index | | | | | | |
| S&P National AMT-Free Municipal Bond | 5.74% | 1.04% | 2.36% | | | |
| | | | | | |
| Performance Index | | | | | | |
| S&P Municipal California 50% Investment Grade Bond/50% High Yield Bond | 8.38% | 1.18% | 3.56% | | | |
| | | | | | |
| | | | | | |
| | | | | | |
| | | | | | |
| | | | | | | | | | | | | | | | | |
| The regulatory index is provided as a broad measure of market performance. The performance index is provided because the advisor believes it is more reflective of the fund’s investment strategy. |
| A Class shares have a 4.50% maximum initial sales charge and may be subject to a maximum contingent deferred sales charge of 1.00%. |
|
|
|
|
|
|
|
|
|
| | |
|
The opinions expressed are those of American Century Investments and are no guarantee of the future performance of any American Century Investments fund. This information is for educational purposes only and is not intended as investment advice. Data reflects past performance, assumes reinvestment of dividends and capital gains and is no guarantee of future results. Current performance may be higher or lower than data shown. Investment return and principal value will fluctuate and redemption value may be more or less than original cost, and none of the charts reflect the deduction of taxes that a shareholder would pay on fund distributions or the redemption of fund shares. Total returns for periods less than one year are not annualized. Visit americancentury.com for more recent performance information.
|
| | | | | |
Fund Statistics | |
| Net Assets | $1,554,487,774 |
| Management Fees (dollars paid during the reporting period) | $5,486,583 |
| Portfolio Turnover Rate | 56 | % |
| Total Number of Portfolio Holdings | 623 |
| |
| |
| | | | | | | | | | | | | | | | | | | | | | | | | | | | | | | | | | | | |
| Types of Investments in Portfolio (as a % of net assets) | | | | | | | | | | | | | | | | Portfolio at a Glance |
| Municipal Securities | 99.6% | | | | | | | | | | | | | | | | | | | | | | | Weighted Average Life to Maturity | 19 years |
| Affiliated Funds | 0.1% | | | | | | | | | | | | | | | | | | | | | | | Modified Duration | 7 years |
| Other Assets and Liabilities | 0.3% | | | | | | | | | | | | | | | | | | | | | | | | |
| | | | | | | | | | | | | | | | | | | | | | | | | | |
| | | | | | | | | | | | | | | | | | | | | | | | | | |
| | | | | | | | | | | | | | | | | | | | | | | | | | |
| | | | | | | | | | | | | | | | | | | | | | | | | | |
| | | | | | | | | | | | | | | | | | | | | | | | | | |
| | | | | | | | | | | | | | | | | | | | | | | | | | |
| | | | | | | | | | | | | | | | | | | | | | | | | | |
| | | | | | | | | | | | | | | | | | | | | | | | | | |
| | | | | | | | | | | | | | | | | | | | | | | | | | |
| | | | | | | | | | | | | | | | | | | | | | | | | | |
| | | | | | | | | | | | | | | | | | | | | | | | | | |
| | | | | | | | | | | | | | | | | | | | | | | | | | |
| | | | | | | | | | | | | | | | | | | | | | | | | | |
| | |
| For additional information about the fund, including its Prospectus, Statement of Additional Information, financial statements, holdings and proxy voting information, scan the QR code or visit americancentury.com/docs. |
| | |
| American Century Investment Services, Inc., Distributor |
| ©2024 American Century Proprietary Holdings, Inc. All rights reserved. |
A-25075888
ANNUAL SHAREHOLDER REPORT
California High-Yield Municipal Fund
| | | | | |
| C Class (CAYCX) | August 31, 2024 |
This annual shareholder report contains important information about California High-Yield Municipal Fund for the period of September 1, 2023 to August 31, 2024. You can find additional information about the fund at americancentury.com/docs. You can also request this information by contacting us at 1-800-345-2021.
| | | | | | | | |
What were the fund costs for the last year? (based on a hypothetical $10,000 investment) |
|
| Costs of a $10,000 investment | Costs paid as a percentage of a $10,000 investment |
| C Class | $156 | 1.50% |
|
| | | | | |
| What were the key factors that affected the fund’s performance? |
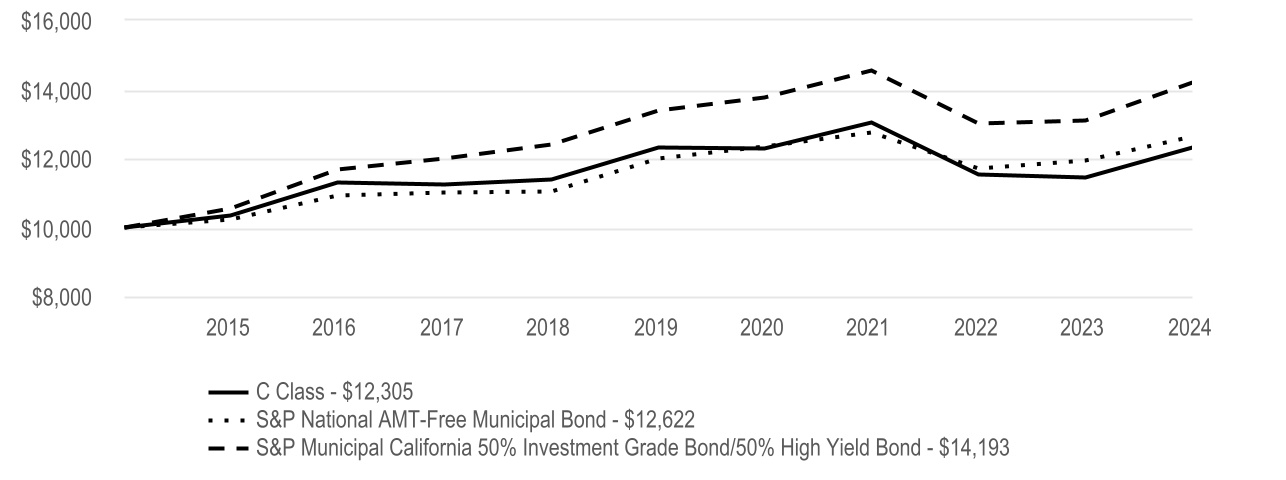
California High-Yield Municipal Fund C Class returned 7.67% for the reporting period ended August 31, 2024. |
| The fund seeks high current income that is exempt from federal and California income taxes. The commentary below refers to the fund’s performance compared to the S&P Municipal Bond California 50% Investment-Grade/50% High-Yield Index. |
| • | Against a backdrop of falling Treasury yields, moderating inflation and generally healthy demand for municipal bonds (munis), California munis delivered solid gains. In this environment, our sector allocations aided performance, particularly overweights versus the index in the charter school and special tax sectors and an underweight to state general obligation bonds. These weightings more than offset negative effects from an overweight in the multifamily housing sector. |
| • | We maintained a longer-than-index duration, which also boosted the fund’s performance as yields declined. In addition, our positioning along the yield curve aided results. |
| • | Security selection detracted from performance, largely due to choices in the special tax, charter school and student housing sectors. Positive selection results in the multifamily housing, toll facilities and corporate muni sectors helped offset some negative effects. |
| • | High-yield munis outperformed their investment-grade peers during the period. Compared with the index, which invests evenly in investment-grade and high-yield munis, the fund ended the period with an overweight to high-yield securities. This positioning aided fund performance. |
| | |
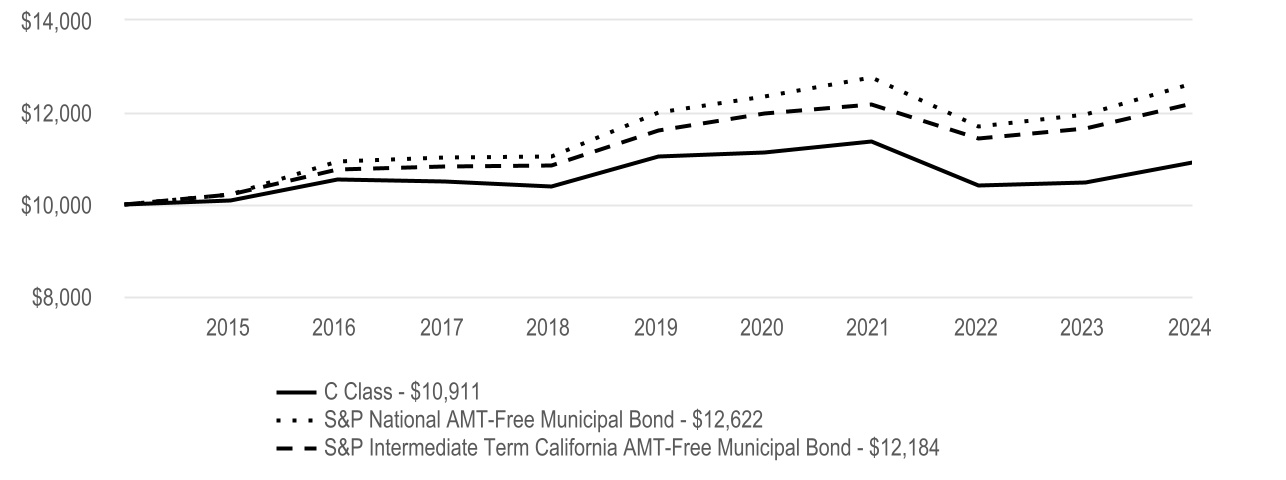
Cumulative Performance (based on an initial $10,000 investment) |
| August 31, 2014 through August 31, 2024 |
|
| | | | | | | | | | | | | | |
Average Annual Total Returns | |
| 1 Year | 5 Year | 10 Year | | | |
| C Class | 7.67% | 0.02% | 2.10% | | | |
| | | | | | |
| Regulatory Index | | | | | | |
| S&P National AMT-Free Municipal Bond | 5.74% | 1.04% | 2.36% | | | |
| | | | | | |
| Performance Index | | | | | | |
| S&P Municipal California 50% Investment Grade Bond/50% High Yield Bond | 8.38% | 1.18% | 3.56% | | | |
| | | | | | |
| | | | | | |
| | | | | | |
| | | | | | |
| | | | | | | | | | | | | | | | | |
| The regulatory index is provided as a broad measure of market performance. The performance index is provided because the advisor believes it is more reflective of the fund’s investment strategy. |
|
|
|
|
| C Class shares will automatically convert to A Class shares after being held for approximately eight years. C Class average annual returns do not reflect this conversion. |
|
|
|
|
|
| | |
|
The opinions expressed are those of American Century Investments and are no guarantee of the future performance of any American Century Investments fund. This information is for educational purposes only and is not intended as investment advice. Data reflects past performance, assumes reinvestment of dividends and capital gains and is no guarantee of future results. Current performance may be higher or lower than data shown. Investment return and principal value will fluctuate and redemption value may be more or less than original cost, and none of the charts reflect the deduction of taxes that a shareholder would pay on fund distributions or the redemption of fund shares. Total returns for periods less than one year are not annualized. Visit americancentury.com for more recent performance information.
|
| | | | | |
Fund Statistics | |
| Net Assets | $1,554,487,774 |
| Management Fees (dollars paid during the reporting period) | $5,486,583 |
| Portfolio Turnover Rate | 56 | % |
| Total Number of Portfolio Holdings | 623 |
| |
| |
| | | | | | | | | | | | | | | | | | | | | | | | | | | | | | | | | | | | |
| Types of Investments in Portfolio (as a % of net assets) | | | | | | | | | | | | | | | | Portfolio at a Glance |
| Municipal Securities | 99.6% | | | | | | | | | | | | | | | | | | | | | | | Weighted Average Life to Maturity | 19 years |
| Affiliated Funds | 0.1% | | | | | | | | | | | | | | | | | | | | | | | Modified Duration | 7 years |
| Other Assets and Liabilities | 0.3% | | | | | | | | | | | | | | | | | | | | | | | | |
| | | | | | | | | | | | | | | | | | | | | | | | | | |
| | | | | | | | | | | | | | | | | | | | | | | | | | |
| | | | | | | | | | | | | | | | | | | | | | | | | | |
| | | | | | | | | | | | | | | | | | | | | | | | | | |
| | | | | | | | | | | | | | | | | | | | | | | | | | |
| | | | | | | | | | | | | | | | | | | | | | | | | | |
| | | | | | | | | | | | | | | | | | | | | | | | | | |
| | | | | | | | | | | | | | | | | | | | | | | | | | |
| | | | | | | | | | | | | | | | | | | | | | | | | | |
| | | | | | | | | | | | | | | | | | | | | | | | | | |
| | | | | | | | | | | | | | | | | | | | | | | | | | |
| | | | | | | | | | | | | | | | | | | | | | | | | | |
| | | | | | | | | | | | | | | | | | | | | | | | | | |
| | |
| For additional information about the fund, including its Prospectus, Statement of Additional Information, financial statements, holdings and proxy voting information, scan the QR code or visit americancentury.com/docs. |
| | |
| American Century Investment Services, Inc., Distributor |
| ©2024 American Century Proprietary Holdings, Inc. All rights reserved. |
A-25075805
ANNUAL SHAREHOLDER REPORT
California Intermediate-Term Tax-Free Bond Fund
| | | | | |
| Investor Class (BCITX) | August 31, 2024 |
This annual shareholder report contains important information about California Intermediate-Term Tax-Free Bond Fund for the period of September 1, 2023 to August 31, 2024. You can find additional information about the fund at americancentury.com/docs. You can also request this information by contacting us at 1-800-345-2021.
| | | | | | | | |
What were the fund costs for the last year? (based on a hypothetical $10,000 investment) |
|
| Costs of a $10,000 investment | Costs paid as a percentage of a $10,000 investment |
| Investor Class | $48 | 0.47% |
|
| | | | | |
| What were the key factors that affected the fund’s performance? |
California Intermediate-Term Tax-Free Bond Fund Investor Class returned 5.38% for the reporting period ended August 31, 2024. |
| The fund seeks safety of principal and high current income that is exempt from federal and California income taxes. The commentary below refers to the fund’s performance compared to the S&P Intermediate Term California AMT-Free Municipal Bond Index. |
| • | Against a backdrop of falling Treasury yields, moderating inflation and generally healthy demand for municipal bonds (munis), California munis delivered solid gains for the 12-month period. |
| • | Our sector allocations were top contributors to performance. Out-of-index weightings to the corporate muni and hospital sectors and an underweight versus the index to the state general obligation (GO) sector aided results. These allocations more than offset slightly negative effects from an underweight to local GO bonds and an overweight to the special tax sector. |
| • | We maintained a longer-than-index duration, which also boosted the fund’s performance as yields declined. In addition, our positioning along the yield curve aided results. |
| • | Our security selection efforts contributed to performance, most significantly in the special tax sector. Our selections in the water and sewer sector also lifted results. These choices more than offset negative selection results among local and state GO bonds. |
| | |
Cumulative Performance (based on an initial $10,000 investment) |
| August 31, 2014 through August 31, 2024 |
|
| | | | | | | | | | | | | | |
Average Annual Total Returns | |
| 1 Year | 5 Year | 10 Year | | | |
| Investor Class | 5.38% | 0.79% | 1.89% | | | |
| | | | | | |
| Regulatory Index | | | | | | |
| S&P National AMT-Free Municipal Bond | 5.74% | 1.04% | 2.36% | | | |
| | | | | | |
| Performance Index | | | | | | |
| S&P Intermediate Term California AMT-Free Municipal Bond | 4.62% | 1.00% | 2.00% | | | |
| | | | | | |
| | | | | | |
| | | | | | |
| | | | | | |
| | | | | | | | | | | | | | | | | |
| The regulatory index is provided as a broad measure of market performance. The performance index is provided because the advisor believes it is more reflective of the fund’s investment strategy. |
|
|
|
|
|
|
|
|
|
|
| | |
|
The opinions expressed are those of American Century Investments and are no guarantee of the future performance of any American Century Investments fund. This information is for educational purposes only and is not intended as investment advice. Data reflects past performance, assumes reinvestment of dividends and capital gains and is no guarantee of future results. Current performance may be higher or lower than data shown. Investment return and principal value will fluctuate and redemption value may be more or less than original cost, and none of the charts reflect the deduction of taxes that a shareholder would pay on fund distributions or the redemption of fund shares. Total returns for periods less than one year are not annualized. Visit americancentury.com for more recent performance information.
|
| | | | | |
Fund Statistics | |
| Net Assets | $2,033,234,197 |
| Management Fees (dollars paid during the reporting period) | $6,363,263 |
| Portfolio Turnover Rate | 64 | % |
| Total Number of Portfolio Holdings | 935 |
| |
| |
| | | | | | | | | | | | | | | | | | | | | | | | | | | | | | | | | | | | |
| Types of Investments in Portfolio (as a % of net assets) | | | | | | | | | | | | | | | | Portfolio at a Glance |
| Municipal Securities | 99.7% | | | | | | | | | | | | | | | | | | | | | | | Weighted Average Life to Maturity | 10 years |
| Affiliated Funds | 0.2% | | | | | | | | | | | | | | | | | | | | | | | Modified Duration | 4 years |
| Other Assets and Liabilities | 0.1% | | | | | | | | | | | | | | | | | | | | | | | | |
| | | | | | | | | | | | | | | | | | | | | | | | | | |
| | | | | | | | | | | | | | | | | | | | | | | | | | |
| | | | | | | | | | | | | | | | | | | | | | | | | | |
| | | | | | | | | | | | | | | | | | | | | | | | | | |
| | | | | | | | | | | | | | | | | | | | | | | | | | |
| | | | | | | | | | | | | | | | | | | | | | | | | | |
| | | | | | | | | | | | | | | | | | | | | | | | | | |
| | | | | | | | | | | | | | | | | | | | | | | | | | |
| | | | | | | | | | | | | | | | | | | | | | | | | | |
| | | | | | | | | | | | | | | | | | | | | | | | | | |
| | | | | | | | | | | | | | | | | | | | | | | | | | |
| | | | | | | | | | | | | | | | | | | | | | | | | | |
| | | | | | | | | | | | | | | | | | | | | | | | | | |
| | |
| For additional information about the fund, including its Prospectus, Statement of Additional Information, financial statements, holdings and proxy voting information, scan the QR code or visit americancentury.com/docs. |
| | |
| American Century Investment Services, Inc., Distributor |
| ©2024 American Century Proprietary Holdings, Inc. All rights reserved. |
A-25075508
ANNUAL SHAREHOLDER REPORT
California Intermediate-Term Tax-Free Bond Fund
| | | | | |
| I Class (BCTIX) | August 31, 2024 |
This annual shareholder report contains important information about California Intermediate-Term Tax-Free Bond Fund for the period of September 1, 2023 to August 31, 2024. You can find additional information about the fund at americancentury.com/docs. You can also request this information by contacting us at 1-800-345-2021.
| | | | | | | | |
What were the fund costs for the last year? (based on a hypothetical $10,000 investment) |
|
| Costs of a $10,000 investment | Costs paid as a percentage of a $10,000 investment |
| I Class | $28 | 0.27% |
|
| | | | | |
| What were the key factors that affected the fund’s performance? |
California Intermediate-Term Tax-Free Bond Fund I Class returned 5.59% for the reporting period ended August 31, 2024. |
| The fund seeks safety of principal and high current income that is exempt from federal and California income taxes. The commentary below refers to the fund’s performance compared to the S&P Intermediate Term California AMT-Free Municipal Bond Index. |
| • | Against a backdrop of falling Treasury yields, moderating inflation and generally healthy demand for municipal bonds (munis), California munis delivered solid gains for the 12-month period. |
| • | Our sector allocations were top contributors to performance. Out-of-index weightings to the corporate muni and hospital sectors and an underweight versus the index to the state general obligation (GO) sector aided results. These allocations more than offset slightly negative effects from an underweight to local GO bonds and an overweight to the special tax sector. |
| • | We maintained a longer-than-index duration, which also boosted the fund’s performance as yields declined. In addition, our positioning along the yield curve aided results. |
| • | Our security selection efforts contributed to performance, most significantly in the special tax sector. Our selections in the water and sewer sector also lifted results. These choices more than offset negative selection results among local and state GO bonds. |
| | |
Cumulative Performance (based on an initial $10,000 investment) |
| August 31, 2014 through August 31, 2024 |
|
| | | | | | | | | | | | | | |
Average Annual Total Returns | |
| 1 Year | 5 Year | 10 Year | | | |
| I Class | 5.59% | 0.98% | 2.09% | | | |
| | | | | | |
| Regulatory Index | | | | | | |
| S&P National AMT-Free Municipal Bond | 5.74% | 1.04% | 2.36% | | | |
| | | | | | |
| Performance Index | | | | | | |
| S&P Intermediate Term California AMT-Free Municipal Bond | 4.62% | 1.00% | 2.00% | | | |
| | | | | | |
| | | | | | |
| | | | | | |
| | | | | | |
| | | | | | | | | | | | | | | | | |
| The regulatory index is provided as a broad measure of market performance. The performance index is provided because the advisor believes it is more reflective of the fund’s investment strategy. |
|
|
|
|
|
|
|
|
|
|
| | |
|
The opinions expressed are those of American Century Investments and are no guarantee of the future performance of any American Century Investments fund. This information is for educational purposes only and is not intended as investment advice. Data reflects past performance, assumes reinvestment of dividends and capital gains and is no guarantee of future results. Current performance may be higher or lower than data shown. Investment return and principal value will fluctuate and redemption value may be more or less than original cost, and none of the charts reflect the deduction of taxes that a shareholder would pay on fund distributions or the redemption of fund shares. Total returns for periods less than one year are not annualized. Visit americancentury.com for more recent performance information.
|
| | | | | |
Fund Statistics | |
| Net Assets | $2,033,234,197 |
| Management Fees (dollars paid during the reporting period) | $6,363,263 |
| Portfolio Turnover Rate | 64 | % |
| Total Number of Portfolio Holdings | 935 |
| |
| |
| | | | | | | | | | | | | | | | | | | | | | | | | | | | | | | | | | | | |
| Types of Investments in Portfolio (as a % of net assets) | | | | | | | | | | | | | | | | Portfolio at a Glance |
| Municipal Securities | 99.7% | | | | | | | | | | | | | | | | | | | | | | | Weighted Average Life to Maturity | 10 years |
| Affiliated Funds | 0.2% | | | | | | | | | | | | | | | | | | | | | | | Modified Duration | 4 years |
| Other Assets and Liabilities | 0.1% | | | | | | | | | | | | | | | | | | | | | | | | |
| | | | | | | | | | | | | | | | | | | | | | | | | | |
| | | | | | | | | | | | | | | | | | | | | | | | | | |
| | | | | | | | | | | | | | | | | | | | | | | | | | |
| | | | | | | | | | | | | | | | | | | | | | | | | | |
| | | | | | | | | | | | | | | | | | | | | | | | | | |
| | | | | | | | | | | | | | | | | | | | | | | | | | |
| | | | | | | | | | | | | | | | | | | | | | | | | | |
| | | | | | | | | | | | | | | | | | | | | | | | | | |
| | | | | | | | | | | | | | | | | | | | | | | | | | |
| | | | | | | | | | | | | | | | | | | | | | | | | | |
| | | | | | | | | | | | | | | | | | | | | | | | | | |
| | | | | | | | | | | | | | | | | | | | | | | | | | |
| | | | | | | | | | | | | | | | | | | | | | | | | | |
| | |
| For additional information about the fund, including its Prospectus, Statement of Additional Information, financial statements, holdings and proxy voting information, scan the QR code or visit americancentury.com/docs. |
| | |
| American Century Investment Services, Inc., Distributor |
| ©2024 American Century Proprietary Holdings, Inc. All rights reserved. |
A-25075839
ANNUAL SHAREHOLDER REPORT
California Intermediate-Term Tax-Free Bond Fund
| | | | | |
| Y Class (ACYTX) | August 31, 2024 |
This annual shareholder report contains important information about California Intermediate-Term Tax-Free Bond Fund for the period of September 1, 2023 to August 31, 2024. You can find additional information about the fund at americancentury.com/docs. You can also request this information by contacting us at 1-800-345-2021.
| | | | | | | | |
What were the fund costs for the last year? (based on a hypothetical $10,000 investment) |
|
| Costs of a $10,000 investment | Costs paid as a percentage of a $10,000 investment |
| Y Class | $25 | 0.24% |
|
| | | | | |
| What were the key factors that affected the fund’s performance? |
California Intermediate-Term Tax-Free Bond Fund Y Class returned 5.63% for the reporting period ended August 31, 2024. |
| The fund seeks safety of principal and high current income that is exempt from federal and California income taxes. The commentary below refers to the fund’s performance compared to the S&P Intermediate Term California AMT-Free Municipal Bond Index. |
| • | Against a backdrop of falling Treasury yields, moderating inflation and generally healthy demand for municipal bonds (munis), California munis delivered solid gains for the 12-month period. |
| • | Our sector allocations were top contributors to performance. Out-of-index weightings to the corporate muni and hospital sectors and an underweight versus the index to the state general obligation (GO) sector aided results. These allocations more than offset slightly negative effects from an underweight to local GO bonds and an overweight to the special tax sector. |
| • | We maintained a longer-than-index duration, which also boosted the fund’s performance as yields declined. In addition, our positioning along the yield curve aided results. |
| • | Our security selection efforts contributed to performance, most significantly in the special tax sector. Our selections in the water and sewer sector also lifted results. These choices more than offset negative selection results among local and state GO bonds. |
| | |
Cumulative Performance (based on an initial $10,000 investment) |
| April 10, 2017 through August 31, 2024 |
|
| | | | | | | | | | | | | | | | |
Average Annual Total Returns | |
| 1 Year | 5 Year | | Since Inception | Inception Date | |
| Y Class | 5.63% | 1.02% | | 2.12% | 4/10/17 | |
| | | | | | |
| Regulatory Index | | | | | | |
| S&P National AMT-Free Municipal Bond | 5.74% | 1.04% | | 2.29% | — | |
| | | | | | |
| Performance Index | | | | | | |
| S&P Intermediate Term California AMT-Free Municipal Bond | 4.62% | 1.00% | | 1.96% | — | |
| | | | | | |
| | | | | | |
| | | | | | |
| | | | | | |
| | | | | | | | | | | | | | | | | |
| The regulatory index is provided as a broad measure of market performance. The performance index is provided because the advisor believes it is more reflective of the fund’s investment strategy. |
|
|
|
|
|
|
|
|
|
|
| | |
|
The opinions expressed are those of American Century Investments and are no guarantee of the future performance of any American Century Investments fund. This information is for educational purposes only and is not intended as investment advice. Data reflects past performance, assumes reinvestment of dividends and capital gains and is no guarantee of future results. Current performance may be higher or lower than data shown. Investment return and principal value will fluctuate and redemption value may be more or less than original cost, and none of the charts reflect the deduction of taxes that a shareholder would pay on fund distributions or the redemption of fund shares. Total returns for periods less than one year are not annualized. Visit americancentury.com for more recent performance information.
|
| | | | | |
Fund Statistics | |
| Net Assets | $2,033,234,197 |
| Management Fees (dollars paid during the reporting period) | $6,363,263 |
| Portfolio Turnover Rate | 64 | % |
| Total Number of Portfolio Holdings | 935 |
| |
| |
| | | | | | | | | | | | | | | | | | | | | | | | | | | | | | | | | | | | |
| Types of Investments in Portfolio (as a % of net assets) | | | | | | | | | | | | | | | | Portfolio at a Glance |
| Municipal Securities | 99.7% | | | | | | | | | | | | | | | | | | | | | | | Weighted Average Life to Maturity | 10 years |
| Affiliated Funds | 0.2% | | | | | | | | | | | | | | | | | | | | | | | Modified Duration | 4 years |
| Other Assets and Liabilities | 0.1% | | | | | | | | | | | | | | | | | | | | | | | | |
| | | | | | | | | | | | | | | | | | | | | | | | | | |
| | | | | | | | | | | | | | | | | | | | | | | | | | |
| | | | | | | | | | | | | | | | | | | | | | | | | | |
| | | | | | | | | | | | | | | | | | | | | | | | | | |
| | | | | | | | | | | | | | | | | | | | | | | | | | |
| | | | | | | | | | | | | | | | | | | | | | | | | | |
| | | | | | | | | | | | | | | | | | | | | | | | | | |
| | | | | | | | | | | | | | | | | | | | | | | | | | |
| | | | | | | | | | | | | | | | | | | | | | | | | | |
| | | | | | | | | | | | | | | | | | | | | | | | | | |
| | | | | | | | | | | | | | | | | | | | | | | | | | |
| | | | | | | | | | | | | | | | | | | | | | | | | | |
| | | | | | | | | | | | | | | | | | | | | | | | | | |
| | |
| For additional information about the fund, including its Prospectus, Statement of Additional Information, financial statements, holdings and proxy voting information, scan the QR code or visit americancentury.com/docs. |
| | |
| American Century Investment Services, Inc., Distributor |
| ©2024 American Century Proprietary Holdings, Inc. All rights reserved. |
A-25075763
ANNUAL SHAREHOLDER REPORT
California Intermediate-Term Tax-Free Bond Fund
| | | | | |
| A Class (BCIAX) | August 31, 2024 |
This annual shareholder report contains important information about California Intermediate-Term Tax-Free Bond Fund for the period of September 1, 2023 to August 31, 2024. You can find additional information about the fund at americancentury.com/docs. You can also request this information by contacting us at 1-800-345-2021.
| | | | | | | | |
What were the fund costs for the last year? (based on a hypothetical $10,000 investment) |
|
| Costs of a $10,000 investment | Costs paid as a percentage of a $10,000 investment |
| A Class | $74 | 0.72% |
|
| | | | | |
| What were the key factors that affected the fund’s performance? |
California Intermediate-Term Tax-Free Bond Fund A Class returned 5.12% for the reporting period ended August 31, 2024. |
| The fund seeks safety of principal and high current income that is exempt from federal and California income taxes. The commentary below refers to the fund’s performance compared to the S&P Intermediate Term California AMT-Free Municipal Bond Index. |
| • | Against a backdrop of falling Treasury yields, moderating inflation and generally healthy demand for municipal bonds (munis), California munis delivered solid gains for the 12-month period. |
| • | Our sector allocations were top contributors to performance. Out-of-index weightings to the corporate muni and hospital sectors and an underweight versus the index to the state general obligation (GO) sector aided results. These allocations more than offset slightly negative effects from an underweight to local GO bonds and an overweight to the special tax sector. |
| • | We maintained a longer-than-index duration, which also boosted the fund’s performance as yields declined. In addition, our positioning along the yield curve aided results. |
| • | Our security selection efforts contributed to performance, most significantly in the special tax sector. Our selections in the water and sewer sector also lifted results. These choices more than offset negative selection results among local and state GO bonds. |
| | |
Cumulative Performance (based on an initial $10,000 investment) |
| August 31, 2014 through August 31, 2024 |
| The initial investment is adjusted to reflect the maximum initial sales charge. |
| | | | | | | | | | | | | | |
Average Annual Total Returns | |
| 1 Year | 5 Year | 10 Year | | | |
| A Class | 5.12% | 0.52% | 1.63% | | | |
| A Class - with sales charge | 0.39% | -0.40% | 1.17% | | | |
| Regulatory Index | | | | | | |
| S&P National AMT-Free Municipal Bond | 5.74% | 1.04% | 2.36% | | | |
| | | | | | |
| Performance Index | | | | | | |
| S&P Intermediate Term California AMT-Free Municipal Bond | 4.62% | 1.00% | 2.00% | | | |
| | | | | | |
| | | | | | |
| | | | | | |
| | | | | | |
| | | | | | | | | | | | | | | | | |
| The regulatory index is provided as a broad measure of market performance. The performance index is provided because the advisor believes it is more reflective of the fund’s investment strategy. |
| A Class shares have a 4.50% maximum initial sales charge and may be subject to a maximum contingent deferred sales charge of 1.00%. |
|
|
|
|
|
|
|
|
|
| | |
|
The opinions expressed are those of American Century Investments and are no guarantee of the future performance of any American Century Investments fund. This information is for educational purposes only and is not intended as investment advice. Data reflects past performance, assumes reinvestment of dividends and capital gains and is no guarantee of future results. Current performance may be higher or lower than data shown. Investment return and principal value will fluctuate and redemption value may be more or less than original cost, and none of the charts reflect the deduction of taxes that a shareholder would pay on fund distributions or the redemption of fund shares. Total returns for periods less than one year are not annualized. Visit americancentury.com for more recent performance information.
|
| | | | | |
Fund Statistics | |
| Net Assets | $2,033,234,197 |
| Management Fees (dollars paid during the reporting period) | $6,363,263 |
| Portfolio Turnover Rate | 64 | % |
| Total Number of Portfolio Holdings | 935 |
| |
| |
| | | | | | | | | | | | | | | | | | | | | | | | | | | | | | | | | | | | |
| Types of Investments in Portfolio (as a % of net assets) | | | | | | | | | | | | | | | | Portfolio at a Glance |
| Municipal Securities | 99.7% | | | | | | | | | | | | | | | | | | | | | | | Weighted Average Life to Maturity | 10 years |
| Affiliated Funds | 0.2% | | | | | | | | | | | | | | | | | | | | | | | Modified Duration | 4 years |
| Other Assets and Liabilities | 0.1% | | | | | | | | | | | | | | | | | | | | | | | | |
| | | | | | | | | | | | | | | | | | | | | | | | | | |
| | | | | | | | | | | | | | | | | | | | | | | | | | |
| | | | | | | | | | | | | | | | | | | | | | | | | | |
| | | | | | | | | | | | | | | | | | | | | | | | | | |
| | | | | | | | | | | | | | | | | | | | | | | | | | |
| | | | | | | | | | | | | | | | | | | | | | | | | | |
| | | | | | | | | | | | | | | | | | | | | | | | | | |
| | | | | | | | | | | | | | | | | | | | | | | | | | |
| | | | | | | | | | | | | | | | | | | | | | | | | | |
| | | | | | | | | | | | | | | | | | | | | | | | | | |
| | | | | | | | | | | | | | | | | | | | | | | | | | |
| | | | | | | | | | | | | | | | | | | | | | | | | | |
| | | | | | | | | | | | | | | | | | | | | | | | | | |
| | |
| For additional information about the fund, including its Prospectus, Statement of Additional Information, financial statements, holdings and proxy voting information, scan the QR code or visit americancentury.com/docs. |
| | |
| American Century Investment Services, Inc., Distributor |
| ©2024 American Century Proprietary Holdings, Inc. All rights reserved. |
A-25075821
ANNUAL SHAREHOLDER REPORT
California Intermediate-Term Tax-Free Bond Fund
| | | | | |
| C Class (BCIYX) | August 31, 2024 |
This annual shareholder report contains important information about California Intermediate-Term Tax-Free Bond Fund for the period of September 1, 2023 to August 31, 2024. You can find additional information about the fund at americancentury.com/docs. You can also request this information by contacting us at 1-800-345-2021.
| | | | | | | | |
What were the fund costs for the last year? (based on a hypothetical $10,000 investment) |
|
| Costs of a $10,000 investment | Costs paid as a percentage of a $10,000 investment |
| C Class | $150 | 1.47% |
|
| | | | | |
| What were the key factors that affected the fund’s performance? |
California Intermediate-Term Tax-Free Bond Fund C Class returned 4.33% for the reporting period ended August 31, 2024. |
| The fund seeks safety of principal and high current income that is exempt from federal and California income taxes. The commentary below refers to the fund’s performance compared to the S&P Intermediate Term California AMT-Free Municipal Bond Index. |
| • | Against a backdrop of falling Treasury yields, moderating inflation and generally healthy demand for municipal bonds (munis), California munis delivered solid gains for the 12-month period. |
| • | Our sector allocations were top contributors to performance. Out-of-index weightings to the corporate muni and hospital sectors and an underweight versus the index to the state general obligation (GO) sector aided results. These allocations more than offset slightly negative effects from an underweight to local GO bonds and an overweight to the special tax sector. |
| • | We maintained a longer-than-index duration, which also boosted the fund’s performance as yields declined. In addition, our positioning along the yield curve aided results. |
| • | Our security selection efforts contributed to performance, most significantly in the special tax sector. Our selections in the water and sewer sector also lifted results. These choices more than offset negative selection results among local and state GO bonds. |
| | |
Cumulative Performance (based on an initial $10,000 investment) |
| August 31, 2014 through August 31, 2024 |
|
| | | | | | | | | | | | | | |
Average Annual Total Returns | |
| 1 Year | 5 Year | 10 Year | | | |
| C Class | 4.33% | -0.21% | 0.88% | | | |
| | | | | | |
| Regulatory Index | | | | | | |
| S&P National AMT-Free Municipal Bond | 5.74% | 1.04% | 2.36% | | | |
| | | | | | |
| Performance Index | | | | | | |
| S&P Intermediate Term California AMT-Free Municipal Bond | 4.62% | 1.00% | 2.00% | | | |
| | | | | | |
| | | | | | |
| | | | | | |
| | | | | | |
| | | | | | | | | | | | | | | | | |
| The regulatory index is provided as a broad measure of market performance. The performance index is provided because the advisor believes it is more reflective of the fund’s investment strategy. |
|
|
|
|
| C Class shares will automatically convert to A Class shares after being held for approximately eight years. C Class average annual returns do not reflect this conversion. |
|
|
|
|
|
| | |
|
The opinions expressed are those of American Century Investments and are no guarantee of the future performance of any American Century Investments fund. This information is for educational purposes only and is not intended as investment advice. Data reflects past performance, assumes reinvestment of dividends and capital gains and is no guarantee of future results. Current performance may be higher or lower than data shown. Investment return and principal value will fluctuate and redemption value may be more or less than original cost, and none of the charts reflect the deduction of taxes that a shareholder would pay on fund distributions or the redemption of fund shares. Total returns for periods less than one year are not annualized. Visit americancentury.com for more recent performance information.
|
| | | | | |
Fund Statistics | |
| Net Assets | $2,033,234,197 |
| Management Fees (dollars paid during the reporting period) | $6,363,263 |
| Portfolio Turnover Rate | 64 | % |
| Total Number of Portfolio Holdings | 935 |
| |
| |
| | | | | | | | | | | | | | | | | | | | | | | | | | | | | | | | | | | | |
| Types of Investments in Portfolio (as a % of net assets) | | | | | | | | | | | | | | | | Portfolio at a Glance |
| Municipal Securities | 99.7% | | | | | | | | | | | | | | | | | | | | | | | Weighted Average Life to Maturity | 10 years |
| Affiliated Funds | 0.2% | | | | | | | | | | | | | | | | | | | | | | | Modified Duration | 4 years |
| Other Assets and Liabilities | 0.1% | | | | | | | | | | | | | | | | | | | | | | | | |
| | | | | | | | | | | | | | | | | | | | | | | | | | |
| | | | | | | | | | | | | | | | | | | | | | | | | | |
| | | | | | | | | | | | | | | | | | | | | | | | | | |
| | | | | | | | | | | | | | | | | | | | | | | | | | |
| | | | | | | | | | | | | | | | | | | | | | | | | | |
| | | | | | | | | | | | | | | | | | | | | | | | | | |
| | | | | | | | | | | | | | | | | | | | | | | | | | |
| | | | | | | | | | | | | | | | | | | | | | | | | | |
| | | | | | | | | | | | | | | | | | | | | | | | | | |
| | | | | | | | | | | | | | | | | | | | | | | | | | |
| | | | | | | | | | | | | | | | | | | | | | | | | | |
| | | | | | | | | | | | | | | | | | | | | | | | | | |
| | | | | | | | | | | | | | | | | | | | | | | | | | |
| | |
| For additional information about the fund, including its Prospectus, Statement of Additional Information, financial statements, holdings and proxy voting information, scan the QR code or visit americancentury.com/docs. |
| | |
| American Century Investment Services, Inc., Distributor |
| ©2024 American Century Proprietary Holdings, Inc. All rights reserved. |
A-25075813
ANNUAL SHAREHOLDER REPORT
California Tax-Free Money Market Fund
| | | | | |
| Investor Class (BCTXX) | August 31, 2024 |
This annual shareholder report contains important information about California Tax-Free Money Market Fund for the period of September 1, 2023 to August 31, 2024. You can find additional information about the fund at americancentury.com/docs. You can also request this information by contacting us at 1-800-345-2021.
| | | | | | | | |
What were the fund costs for the last year? (based on a hypothetical $10,000 investment) |
|
| Costs of a $10,000 investment | Costs paid as a percentage of a $10,000 investment |
| Investor Class | $51 | 0.50% |
|
| | | | | |
Fund Statistics | |
| Net Assets | $112,991,183 |
| Management Fees (dollars paid during the reporting period) | $565,917 |
| |
| Total Number of Portfolio Holdings | 54 |
| 7-Day Current Yield - Investor Class | 2.52 | % |
| 7-Day Effective Yield - Investor Class | 2.55 | % |
| | | | | | | | | | | | | | | | | | | | | | | | | | | | | | | | | | | | |
| Types of Investments in Portfolio (as a % of net assets) | | | | | | | | | | | | | | Portfolio at a Glance | | |
| Municipal Securities | 98.9% | | | | | | | | | | | | | | | | | | | | Weighted Average Maturity | 26 days | | | |
| Other Assets and Liabilities | 1.1% | | | | | | | | | | | | | | | | | | | | Weighted Average Life | 26 days | | | |
| | | | | | | | | | | | | | | | | | | | | | | | | | |
| | | | | | | | | | | | | | | | | | | | | | | | | | |
| | | | | | | | | | | | | | | | | | | | | | | | | | |
| | | | | | | | | | | | | | | | | | | | | | | | | | |
| | | | | | | | | | | | | | | | | | | | | | | | | | |
| | | | | | | | | | | | | | | | | | | | | | | | | | |
| | | | | | | | | | | | | | | | | | | | | | | | | | |
| | | | | | | | | | | | | | | | | | | | | | | | | | |
| | | | | | | | | | | | | | | | | | | | | | | | | | |
| | | | | | | | | | | | | | | | | | | | | | | | | | |
| | | | | | | | | | | | | | | | | | | | | | | | | | |
| | | | | | | | | | | | | | | | | | | | | | | | | | |
| | | | | | | | | | | | | | | | | | | | | | | | | | |
| | | | | | | | | | | | | | | | | | | | | | | | | | |
| | |
| For additional information about the fund, including its Prospectus, Statement of Additional Information, financial statements, holdings and proxy voting information, scan the QR code or visit americancentury.com/docs. |
| | |
| American Century Investment Services, Inc., Distributor |
| ©2024 American Century Proprietary Holdings, Inc. All rights reserved. |
A-25075300
(b) Not applicable.
ITEM 2. CODE OF ETHICS.
(a) The registrant has adopted a Code of Ethics for Senior Financial Officers that applies to the registrant’s principal executive officer, principal financial officer, principal accounting officer, and persons performing similar functions.
(b) No response required.
(c) None.
(d) None.
(e) Not applicable.
(f) The registrant’s Code of Ethics for Senior Financial Officers was filed as Exhibit 12 (a)(1) to American Century Asset Allocation Portfolios, Inc.’s Annual Certified Shareholder Report on Form N-CSR, File No. 811-21591, on September 29, 2005, and is incorporated herein by reference.
ITEM 3. AUDIT COMMITTEE FINANCIAL EXPERT.
(a)(1) The registrant's board has determined that the registrant has at least one audit committee financial expert serving on its audit committee.
(a)(2) Tanya S. Beder, Jennifer Cabalquinto, Anne Casscells and John Loder are the registrant's designated audit committee financial experts. They are "independent" as defined in Item 3 of Form N-CSR.
(a)(3) Not applicable.
(b) No response required.
(c) No response required.
(d) No response required.
ITEM 4. PRINCIPAL ACCOUNTANT FEES AND SERVICES.
(a) Audit Fees.
The aggregate fees billed for each of the last two fiscal years for professional services rendered by the principal
accountant for the audit of the registrant’s annual financial statements or services that are normally provided by the accountant in connection with statutory and regulatory filings or engagements for those fiscal years were as follows:
| | | | | |
| FY 2023: | $57,950 |
| FY 2024: | $57,950 |
(b) Audit-Related Fees.
The aggregate fees billed in each of the last two fiscal years for assurance and related services by the principal accountant that are reasonably related to the performance of the audit of the registrant’s financial statements and are not reported under paragraph (a) of this Item were as follows:
For services rendered to the registrant:
Fees required to be approved pursuant to paragraph (c)(7)(ii) of Rule 2-01 of Regulation S-X (relating to certain engagements for non-audit services with the registrant’s investment adviser and its affiliates):
(c) Tax Fees.
The aggregate fees billed in each of the last two fiscal years for professional services rendered by the principal accountant for tax compliance, tax advice, and tax planning were as follows:
For services rendered to the registrant:
Fees required to be approved pursuant to paragraph (c)(7)(ii) of Rule 2-01 of Regulation S-X (relating to certain engagements for non-audit services with the registrant’s investment adviser and its affiliates):
(d) All Other Fees.
The aggregate fees billed in each of the last two fiscal years for products and services provided by the principal accountant, other than the services reported in paragraphs (a) through (c) of this Item were as follows:
For services rendered to the registrant:
Fees required to be approved pursuant to paragraph (c)(7)(ii) of Rule 2-01 of Regulation S-X (relating to certain engagements for non-audit services with the registrant’s investment adviser and its affiliates):
(e)(1) In accordance with paragraph (c)(7)(i)(A) of Rule 2-01 of Regulation S-X, before the accountant is engaged by the registrant to render audit or non-audit services, the engagement is approved by the registrant’s audit committee. Pursuant to paragraph (c)(7)(ii) of Rule 2-01 of Regulation S-X, the registrant’s audit committee also pre-approves its accountant’s engagements for non-audit services with the registrant’s investment adviser, its parent company, and any entity controlled by, or under common control with the investment adviser that provides ongoing services to the registrant, if the engagement relates directly to the operations and financial reporting of the registrant.
(e)(2) All services described in each of paragraphs (b) through (d) of this Item were pre-approved before the engagement by the registrant’s audit committee pursuant to paragraph (c)(7)(i)(A) of Rule 2-01 of Regulation S-X. Consequently, none of such services were required to be approved by the audit committee pursuant to paragraph (c)(7)(i)(C).
(f) The percentage of hours expended on the principal accountant’s engagement to audit the registrant’s financial statements for the most recent fiscal year that were attributed to work performed by persons other than the principal accountant’s full-time, permanent employees was less than 50%.
(g) The aggregate non-audit fees billed by the registrant’s accountant for services rendered to the registrant, and rendered to the registrant’s investment adviser (not including any sub-adviser whose role is primarily portfolio management and is subcontracted with or overseen by another investment adviser), and any entity controlling, controlled by, or under common control with the adviser that provides ongoing services to the registrant for each of the last two fiscal years of the registrant were as follows:
| | | | | |
| FY 2023: | $193,325 |
| FY 2024: | $198,325 |
(h) The registrant’s investment adviser and accountant have notified the registrant’s audit committee of all non-audit services that were rendered by the registrant’s accountant to the registrant’s investment adviser, its parent company, and any entity controlled by, or under common control with the investment adviser that provides services to the registrant, which services were not required to be pre-approved pursuant to paragraph (c)(7)(ii) of Rule 2-01 of Regulation S-X. The notification provided to the registrant’s audit committee included sufficient details regarding such services to allow the registrant’s audit committee to consider the continuing independence of its principal accountant.
| | | | | |
| (i) | Not applicable. |
| |
| (j) | Not applicable. |
ITEM 5. AUDIT COMMITTEE OF LISTED REGISTRANTS.
Not applicable.
ITEM 6. INVESTMENTS.
(a) The schedule of investments is included as part of the report to stockholders filed under Item 7 of this Form.
(b) Not applicable.
ITEM 7. FINANCIAL STATEMENTS AND FINANCIAL HIGHLIGHTS FOR OPEN-END MANAGEMENT INVESTMENT COMPANIES.
(a)
| | | | | |
| |
| Annual Financial Statements and Other Information |
| |
| August 31, 2024 |
| |
| California High-Yield Municipal Fund |
| Investor Class (BCHYX) |
| I Class (BCHIX) |
| Y Class (ACYHX) |
| A Class (CAYAX) |
| C Class (CAYCX) |
| | | | | |
| Schedule of Investments | |
| Statement of Assets and Liabilities | |
| Statement of Operations | |
| Statement of Changes in Net Assets | |
| Notes to Financial Statements | |
| Financial Highlights | |
| Report of Independent Registered Public Accounting Firm | |
| Approval of Management Agreement | |
| |
| Other Tax Information | |
AUGUST 31, 2024
| | | | | | | | |
| Principal
Amount/Shares | Value |
| MUNICIPAL SECURITIES — 99.6% | | |
| California — 98.6% | | |
| Alameda Community Facilities District Special Tax, (City of Alameda CA Community Facilities District No. 13-1), 5.00%, 9/1/42 | $ | 1,250,000 | | $ | 1,272,246 | |
| Alameda Community Facilities District Special Tax, (City of Alameda CA Community Facilities District No. 22-1), 5.00%, 9/1/48 | 750,000 | | 771,140 | |
| Alameda Community Facilities District Special Tax, (City of Alameda CA Community Facilities District No. 22-1), 5.00%, 9/1/53 | 1,175,000 | | 1,214,588 | |
| Alameda Corridor Transportation Authority Rev., Capital Appreciation, VRN, 0.00%, 10/1/52 (AGM) | 12,000,000 | | 6,860,471 | |
| Alameda Corridor Transportation Authority Rev., 5.00%, 10/1/36 | 2,700,000 | | 2,764,574 | |
Alameda Corridor Transportation Authority Rev., Capital Appreciation, 0.00%, 10/1/53 (AGM)(1) | 6,000,000 | | 1,481,621 | |
| Anaheim City School District GO, 5.00%, 8/1/51 (AGM) | 4,000,000 | | 4,390,626 | |
| Anaheim Housing & Public Improvements Authority Rev., (City of Anaheim CA Water System Rev.), VRDN, 3.45%, 9/3/24 (LOC: Bank of America N.A.) | 7,400,000 | | 7,400,000 | |
| Antelope Valley Healthcare District Rev., (Antelope Valley Healthcare District Obligated Group), 5.00%, 3/1/46 | 5,000,000 | | 4,896,616 | |
| Bay Area Toll Authority Rev., 5.00%, 4/1/26 | 1,000,000 | | 1,040,223 | |
| Bay Area Toll Authority Rev., 4.00%, 4/1/38 | 2,080,000 | | 2,107,043 | |
| Bay Area Toll Authority Rev., 4.125%, 4/1/54 | 3,750,000 | | 3,759,541 | |
| Bay Area Toll Authority Rev., VRDN, 3.60%, 9/3/24 (LOC: Barclays Bank PLC) | 1,800,000 | | 1,800,000 | |
| Bay Area Toll Authority Rev., VRDN, 3.85%, 9/3/24 (LOC: Barclays Bank PLC) | 2,600,000 | | 2,600,000 | |
| Bay Area Toll Authority Rev., VRDN, 3.85%, 9/3/24 (LOC: Bank of America N.A.) | 4,500,000 | | 4,500,000 | |
| Beaumont Special Tax, (City of Beaumont CA Community Facilities District No 93-1 Area No. 8C), 5.00%, 9/1/43 | 1,605,000 | | 1,660,299 | |
| Beaumont Special Tax, (City of Beaumont CA Community Facilities District No. 93-1 Improvement Area 8F), 4.00%, 9/1/40 | 1,250,000 | | 1,207,730 | |
| Beaumont Special Tax, (City of Beaumont CA Community Facilities District No. 93-1 Improvement Area 8F), 4.00%, 9/1/45 | 1,510,000 | | 1,408,027 | |
| Beaumont Special Tax, (City of Beaumont CA Community Facilities District No. 93-1 Improvement Area 8F), 4.00%, 9/1/50 | 1,500,000 | | 1,359,392 | |
| California Community Choice Financing Authority Rev., VRN, 3.37%, (MUNIPSA plus 0.45%), 2/1/52 (GA: Morgan Stanley) | 10,000,000 | | 9,366,988 | |
| California Community Choice Financing Authority Rev., VRN, 5.00%, 12/1/53 (GA: Goldman Sachs Group, Inc.) | 3,000,000 | | 3,176,292 | |
| California Community Choice Financing Authority Rev., VRN, 5.00%, 2/1/54 (GA: Morgan Stanley) | 2,600,000 | | 2,794,065 | |
| California Community Choice Financing Authority Rev., VRN, 5.00%, 5/1/54 (GA: Morgan Stanley) | 7,475,000 | | 8,098,662 | |
| California Community Choice Financing Authority Rev., VRN, 5.50%, 10/1/54 (GA: National Bank of Canada) | 2,335,000 | | 2,597,343 | |
| California Community Choice Financing Authority Rev., VRN, 5.25%, 11/1/54 (GA: Goldman Sachs Group, Inc.) | 10,000,000 | | 10,786,644 | |
| California Community College Financing Authority Rev., (NCCD-Orange Coast Properties LLC), 5.25%, 5/1/43 | 3,200,000 | | 3,296,310 | |
| California Community College Financing Authority Rev., (NCCD-Orange Coast Properties LLC), 5.25%, 5/1/48 | 4,500,000 | | 4,617,053 | |
California Community Housing Agency Rev., (California Community Housing Agency Fountains at Emerald Park), 4.00%, 8/1/46(2) | 3,060,000 | | 2,662,664 | |
California Community Housing Agency Rev., (California Community Housing Agency Verdant at Green Valley Apartments), 5.00%, 8/1/49(2) | 6,000,000 | | 5,772,017 | |
California County Tobacco Securitization Agency Rev., (Alameda County Tobacco Securitization Corp.), 0.00%, 6/1/50(1) | 22,520,000 | | 4,677,354 | |
| California County Tobacco Securitization Agency Rev., (Los Angeles County Securitization Corp.), 4.00%, 6/1/49 | 750,000 | | 700,708 | |
| California County Tobacco Securitization Agency Rev., (Los Angeles County Securitization Corp.), 5.00%, 6/1/49 | 4,310,000 | | 4,413,343 | |
California County Tobacco Securitization Agency Rev., (Los Angeles County Securitization Corp.), Capital Appreciation, 0.00%, 6/1/55(1) | 5,020,000 | | 990,409 | |
California Enterprise Development Authority Rev., (Academy For Academic Excellence CA), 5.00%, 7/1/40(2) | 500,000 | | 506,670 | |
California Enterprise Development Authority Rev., (Academy For Academic Excellence CA), 5.00%, 7/1/50(2) | 500,000 | | 502,844 | |
California Enterprise Development Authority Rev., (Academy For Academic Excellence CA), 5.00%, 7/1/55(2) | 350,000 | | 351,348 | |
| California Enterprise Development Authority Rev., (Provident Group-Pomona Properties LLC), 5.00%, 1/15/45 | 1,000,000 | | 1,054,199 | |
| California Health Facilities Financing Authority Rev., (Cedars-Sinai Medical Center Obligated Group), 4.00%, 8/15/48 | 5,000,000 | | 5,001,617 | |
| California Health Facilities Financing Authority Rev., (CommonSpirit Health Obligated Group), 4.00%, 4/1/49 | 9,710,000 | | 9,313,786 | |
| | | | | | | | |
| Principal
Amount/Shares | Value |
| California Health Facilities Financing Authority Rev., (CommonSpirit Health Obligated Group), 5.00%, 12/1/54 | $ | 4,750,000 | | $ | 5,124,728 | |
| California Health Facilities Financing Authority Rev., (Scripps Health Obligated Group), 5.00%, 11/15/44 | 5,000,000 | | 5,611,995 | |
| California Housing Finance Rev., 4.25%, 1/15/35 | 3,065,858 | | 3,207,047 | |
| California Housing Finance Rev., 3.50%, 11/20/35 | 17,715,400 | | 17,240,397 | |
| California Housing Finance Agency Rev., (AH Housing Preservation LP), 4.10%, 9/1/40 (FNMA) | 10,000,000 | | 10,250,215 | |
| California Housing Finance Agency Rev., (SV Housing Preservation LP), 4.10%, 7/1/40 (FHLMC) | 3,330,000 | | 3,382,452 | |
| California Infrastructure & Economic Development Bank Rev., 4.00%, 10/1/42 | 15,165,000 | | 15,802,602 | |
| California Infrastructure & Economic Development Bank Rev., (California Science Center Foundation), 4.00%, 5/1/51 | 4,000,000 | | 3,870,202 | |
| California Infrastructure & Economic Development Bank Rev., (Equitable School Revolving Fund LLC Obligated Group), 4.00%, 11/1/46 | 1,500,000 | | 1,484,634 | |
| California Infrastructure & Economic Development Bank Rev., (Equitable School Revolving Fund LLC Obligated Group), 4.00%, 11/1/51 | 1,600,000 | | 1,547,571 | |
| California Municipal Finance Authority COP, (Palomar Health Obligated Group), 5.25%, 11/1/52 (AGM) | 2,335,000 | | 2,498,807 | |
| California Municipal Finance Authority Rev., 4.00%, 12/1/43 | 1,000,000 | | 971,234 | |
| California Municipal Finance Authority Rev., (Bowles Hall Foundation), 5.00%, 6/1/50 | 1,750,000 | | 1,757,191 | |
California Municipal Finance Authority Rev., (California Baptist University), 5.00%, 11/1/46(2) | 8,325,000 | | 8,339,635 | |
California Municipal Finance Authority Rev., (Caritas Corp. CMFA Mobile Home Park Financing 2024 Portfolio), 5.00%, 8/15/49(3) | 1,235,000 | | 1,338,212 | |
California Municipal Finance Authority Rev., (Catalyst Impact Fund 1 LLC), 6.00%, 1/1/39(2) | 4,000,000 | | 4,233,808 | |
| California Municipal Finance Authority Rev., (CHF-Davis I LLC), 5.00%, 5/15/32 (BAM-TCRS) | 3,000,000 | | 3,212,807 | |
| California Municipal Finance Authority Rev., (CHF-Davis I LLC), 5.00%, 5/15/51 | 12,205,000 | | 12,513,683 | |
| California Municipal Finance Authority Rev., (CHF-Davis II LLC), 4.00%, 5/15/41 (BAM) | 1,000,000 | | 1,008,058 | |
California Municipal Finance Authority Rev., (Claremont Graduate University), 5.00%, 10/1/49(2) | 2,145,000 | | 2,120,732 | |
California Municipal Finance Authority Rev., (Claremont Graduate University), 5.00%, 10/1/54(2) | 1,875,000 | | 1,834,949 | |
| California Municipal Finance Authority Rev., (Clinicas del Camino Real, Inc.), 4.00%, 3/1/40 | 2,750,000 | | 2,435,587 | |
| California Municipal Finance Authority Rev., (Clinicas del Camino Real, Inc.), 4.00%, 3/1/50 | 5,785,000 | | 4,829,705 | |
California Municipal Finance Authority Rev., (Community Health Centers of The Central Coast, Inc.), 5.00%, 12/1/54(2) | 2,590,000 | | 2,525,504 | |
| California Municipal Finance Authority Rev., (Community Hospitals of Central California Obligated Group), 4.00%, 2/1/51 | 2,000,000 | | 1,819,455 | |
| California Municipal Finance Authority Rev., (Congregational Homes, Inc. Obligated Group), 5.00%, 11/15/49 | 4,750,000 | | 4,742,891 | |
California Municipal Finance Authority Rev., (Creative Center of Los Altos), 4.00%, 11/1/26(2) | 295,000 | | 292,339 | |
California Municipal Finance Authority Rev., (Creative Center of Los Altos), 4.00%, 11/1/36(2) | 1,400,000 | | 1,312,405 | |
California Municipal Finance Authority Rev., (Creative Center of Los Altos), 4.50%, 11/1/46(2) | 3,100,000 | | 2,808,698 | |
| California Municipal Finance Authority Rev., (Eisenhower Medical Center), 5.00%, 7/1/37 | 1,500,000 | | 1,539,670 | |
| California Municipal Finance Authority Rev., (Eisenhower Medical Center), 5.00%, 7/1/47 | 3,000,000 | | 3,022,746 | |
| California Municipal Finance Authority Rev., (Emerson College), 5.00%, 1/1/42 | 5,250,000 | | 5,363,836 | |
California Municipal Finance Authority Rev., (Healthright 360), 5.00%, 11/1/29(2) | 1,670,000 | | 1,708,808 | |
California Municipal Finance Authority Rev., (Healthright 360), 5.00%, 11/1/39(2) | 3,535,000 | | 3,492,114 | |
California Municipal Finance Authority Rev., (Healthright 360), 5.00%, 11/1/49(2) | 4,450,000 | | 4,107,050 | |
| California Municipal Finance Authority Rev., (HumanGood California Obligated Group), 4.00%, 10/1/49 | 6,250,000 | | 5,824,971 | |
| California Municipal Finance Authority Rev., (Ignatian Corp.), 5.00%, 9/1/49 | 2,250,000 | | 2,476,181 | |
| California Municipal Finance Authority Rev., (Ignatian Corp.), 5.00%, 9/1/54 | 3,000,000 | | 3,270,181 | |
California Municipal Finance Authority Rev., (P3 Claremont Holdings LLC), 5.00%, 7/1/40(2) | 1,515,000 | | 1,505,074 | |
California Municipal Finance Authority Rev., (P3 Claremont Holdings LLC), 5.00%, 7/1/52(2) | 2,075,000 | | 1,984,789 | |
California Municipal Finance Authority Rev., (Palmdale Aerospace Academy, Inc.), 5.00%, 7/1/49(2) | 5,100,000 | | 5,111,966 | |
California Municipal Finance Authority Rev., (River Charter Schools), 5.50%, 6/1/48(2) | 2,265,000 | | 2,269,635 | |
| California Municipal Finance Authority Rev., (Samuel Merritt University), 5.25%, 6/1/53 | 4,000,000 | | 4,367,444 | |
California Municipal Finance Authority Rev., (Santa Rosa Academy LLC), 5.125%, 7/1/35(2) | 905,000 | | 912,863 | |
California Municipal Finance Authority Rev., (Santa Rosa Academy LLC), 5.375%, 7/1/45(2) | 1,400,000 | | 1,407,826 | |
| California Municipal Finance Authority Rev., (St. Mary and All Angels Christian Church CA), 4.65%, 5/1/30 | 1,045,000 | | 1,067,892 | |
California Municipal Finance Authority Rev., (St. Mary and All Angels Christian Church CA), 5.00%, 5/1/34(2) | 300,000 | | 313,477 | |
California Municipal Finance Authority Rev., (St. Mary and All Angels Christian Church CA), 5.50%, 5/1/44(2) | 350,000 | | 363,399 | |
California Municipal Finance Authority Rev., (St. Mary and All Angels Christian Church CA), 5.75%, 5/1/54(2) | 435,000 | | 453,008 | |
California Municipal Finance Authority Rev., (St. Mary and All Angels Christian Church CA), 5.875%, 5/1/59(2) | 390,000 | | 407,754 | |
| | | | | | | | |
| Principal
Amount/Shares | Value |
California Municipal Finance Authority Rev., (William Jessup University), 5.00%, 8/1/48(2) | $ | 8,450,000 | | $ | 7,259,546 | |
| California Municipal Finance Authority Special Tax, (California Municipal Finance Authority BOLD Program Series 2020B), 4.00%, 9/1/43 | 1,000,000 | | 939,415 | |
| California Municipal Finance Authority Special Tax, (California Municipal Finance Authority BOLD Program Series 2020B), 4.00%, 9/1/50 | 1,500,000 | | 1,359,392 | |
| California Municipal Finance Authority Special Tax, (California Municipal Finance Authority BOLD Program Series 2023B), 5.75%, 9/1/53 | 1,850,000 | | 2,013,476 | |
| California Municipal Finance Authority Special Tax, (California Municipal Finance Authority BOLD Program Series 2024A), 5.125%, 9/1/54 | 1,000,000 | | 1,035,849 | |
| California Municipal Finance Authority Special Tax, (California Municipal Finance Authority Cmnty Facs District No. 2020-4 Area No. 2), 4.00%, 9/1/46 | 2,290,000 | | 2,113,880 | |
| California Municipal Finance Authority Special Tax, (California Municipal Finance Authority Cmnty Facs District No. 2020-4 Area No. 2), 4.00%, 9/1/51 | 3,145,000 | | 2,830,140 | |
| California Municipal Finance Authority Special Tax, (California Municipal Finance Authority Cmnty Facs District No. 2021-6 Area No. 2), 6.00%, 9/1/52 | 1,700,000 | | 1,823,268 | |
| California Municipal Finance Authority Special Tax, (California Municipal Finance Authority Cmnty Facs District No. 2023-11 Area A), 5.00%, 9/1/54 | 800,000 | | 831,058 | |
| California Municipal Finance Authority Special Tax, (California Municipal Finance Authority Cmnty Facs District No. 2023-11 Area A), 5.125%, 9/1/59 | 1,250,000 | | 1,310,987 | |
| California Municipal Finance Authority Special Tax, (California Municipal Finance Authority Community Facilities District No. 2021-13), 5.00%, 9/1/47 | 2,000,000 | | 2,080,413 | |
| California Municipal Finance Authority Special Tax, (City Of Chula Vista Community Facilities District No. 2021-11), 5.00%, 9/1/57 | 5,000,000 | | 5,172,047 | |
California Pollution Control Financing Authority Rev., (Poseidon Resources Channelside LP), 5.00%, 11/21/45(2) | 2,500,000 | | 2,586,252 | |
California Public Finance Authority Rev., (Crossroads Christian Schools Obligated Group), 5.00%, 1/1/56(2) | 4,000,000 | | 3,571,585 | |
California Public Finance Authority Rev., (Kendal at Sonoma Obligated Group), 3.125%, 5/15/29(2) | 2,580,000 | | 2,525,171 | |
California Public Finance Authority Rev., (Kendal at Sonoma Obligated Group), 5.00%, 11/15/36(2) | 1,160,000 | | 1,171,087 | |
California Public Finance Authority Rev., (Kendal at Sonoma Obligated Group), 5.00%, 11/15/46(2) | 1,545,000 | | 1,471,253 | |
California Public Finance Authority Rev., (Kendal at Sonoma Obligated Group), 5.00%, 11/15/51(2) | 1,150,000 | | 1,066,206 | |
California Public Finance Authority Rev., (Kendal at Sonoma Obligated Group), 5.00%, 11/15/56(2) | 1,260,000 | | 1,151,188 | |
| California Public Finance Authority Rev., (PIH Health, Inc. Obligated Group), 5.00%, 6/1/36 | 1,500,000 | | 1,721,410 | |
| California Public Finance Authority Rev., (PIH Health, Inc. Obligated Group), 5.00%, 6/1/37 | 1,500,000 | | 1,714,466 | |
| California Public Finance Authority Rev., (PIH Health, Inc. Obligated Group), 5.00%, 6/1/38 | 2,000,000 | | 2,266,995 | |
| California Public Finance Authority Rev., (PIH Health, Inc. Obligated Group), 5.00%, 6/1/39 | 1,625,000 | | 1,825,137 | |
California School Finance Authority Rev., 5.00%, 6/1/37(2) | 475,000 | | 480,179 | |
California School Finance Authority Rev., 5.00%, 6/1/47(2) | 875,000 | | 869,055 | |
California School Finance Authority Rev., (Alliance for College Ready Public Schools Obligated Group), 5.00%, 7/1/31(2) | 4,000,000 | | 4,078,765 | |
California School Finance Authority Rev., (Alliance for College Ready Public Schools Obligated Group), 5.00%, 7/1/45(2) | 5,000,000 | | 5,021,777 | |
California School Finance Authority Rev., (Aspire Public Schools Obligated Group), 5.00%, 8/1/25, Prerefunded at 100% of Par(2)(4) | 110,000 | | 112,345 | |
California School Finance Authority Rev., (Aspire Public Schools Obligated Group), 5.00%, 8/1/45(2) | 1,100,000 | | 1,104,709 | |
California School Finance Authority Rev., (Aspire Public Schools Obligated Group), 4.00%, 8/1/51(2) | 1,300,000 | | 1,168,548 | |
California School Finance Authority Rev., (Aspire Public Schools Obligated Group), 5.00%, 8/1/61(2) | 4,000,000 | | 4,026,198 | |
California School Finance Authority Rev., (Bright Star Schools Obligated Group), 2.00%, 6/1/27(2) | 535,000 | | 508,371 | |
California School Finance Authority Rev., (Bright Star Schools Obligated Group), 5.00%, 6/1/37(2) | 1,800,000 | | 1,811,320 | |
California School Finance Authority Rev., (Bright Star Schools Obligated Group), 4.00%, 6/1/39(2) | 1,085,000 | | 1,038,225 | |
California School Finance Authority Rev., (Bright Star Schools Obligated Group), 5.00%, 6/1/47(2) | 3,130,000 | | 3,075,497 | |
California School Finance Authority Rev., (Bright Star Schools Obligated Group), 4.00%, 6/1/51(2) | 1,730,000 | | 1,527,405 | |
California School Finance Authority Rev., (Bright Star Schools Obligated Group), 4.00%, 6/1/61(2) | 2,220,000 | | 1,887,618 | |
California School Finance Authority Rev., (Downtown College Prep Obligated Group), 4.00%, 6/1/26(2) | 970,000 | | 951,395 | |
California School Finance Authority Rev., (Downtown College Prep Obligated Group), 4.50%, 6/1/31(2) | 1,500,000 | | 1,438,328 | |
California School Finance Authority Rev., (Downtown College Prep Obligated Group), 4.75%, 6/1/36(2) | 1,500,000 | | 1,420,894 | |
California School Finance Authority Rev., (Ednovate Obligated Group), 5.00%, 6/1/30(2) | 1,000,000 | | 1,018,392 | |
California School Finance Authority Rev., (Ednovate Obligated Group), 5.00%, 6/1/37(2) | 430,000 | | 431,497 | |
California School Finance Authority Rev., (Ednovate Obligated Group), 5.00%, 6/1/48(2) | 2,100,000 | | 2,015,288 | |
California School Finance Authority Rev., (Ednovate Obligated Group), 5.00%, 6/1/56(2) | 2,000,000 | | 1,887,658 | |
| | | | | | | | |
| Principal
Amount/Shares | Value |
California School Finance Authority Rev., (Granada Hills Charter High School Obligated Group), 5.00%, 7/1/54(2) | $ | 600,000 | | $ | 625,559 | |
California School Finance Authority Rev., (Granada Hills Charter High School Obligated Group), 5.00%, 7/1/64(2) | 1,440,000 | | 1,490,130 | |
California School Finance Authority Rev., (Green Dot Public Schools Obligated Group), 5.00%, 8/1/38(2) | 1,130,000 | | 1,167,811 | |
California School Finance Authority Rev., (Green Dot Public Schools Obligated Group), 5.375%, 8/1/42(2) | 500,000 | | 537,372 | |
California School Finance Authority Rev., (Green Dot Public Schools Obligated Group), 5.00%, 8/1/45(2) | 3,500,000 | | 3,515,293 | |
California School Finance Authority Rev., (Green Dot Public Schools Obligated Group), 5.00%, 8/1/48(2) | 3,630,000 | | 3,692,329 | |
California School Finance Authority Rev., (Green Dot Public Schools Obligated Group), 5.75%, 8/1/52(2) | 1,650,000 | | 1,779,798 | |
California School Finance Authority Rev., (Kepler Education, Inc.), 5.75%, 5/1/37 (ST INTERCEPT)(2) | 1,050,000 | | 1,067,223 | |
California School Finance Authority Rev., (Kepler Education, Inc.), 5.875%, 5/1/47 (ST INTERCEPT)(2) | 2,425,000 | | 2,450,003 | |
California School Finance Authority Rev., (Kipp SoCal Public Schools Obligated Group), 5.00%, 7/1/34(2) | 500,000 | | 500,419 | |
California School Finance Authority Rev., (Kipp SoCal Public Schools Obligated Group), 5.00%, 7/1/37(2) | 1,180,000 | | 1,212,161 | |
California School Finance Authority Rev., (Kipp SoCal Public Schools Obligated Group), 5.125%, 7/1/44(2) | 700,000 | | 700,310 | |
California School Finance Authority Rev., (Kipp SoCal Public Schools Obligated Group), 5.00%, 7/1/45(2) | 1,650,000 | | 1,656,786 | |
California School Finance Authority Rev., (Kipp SoCal Public Schools Obligated Group), 5.00%, 7/1/49(2) | 2,000,000 | | 2,047,831 | |
California School Finance Authority Rev., (Larchmont Schools), 5.00%, 6/1/33(2) | 500,000 | | 508,678 | |
California School Finance Authority Rev., (Larchmont Schools), 5.00%, 6/1/43(2) | 550,000 | | 552,897 | |
California School Finance Authority Rev., (Larchmont Schools), 5.00%, 6/1/55(2) | 1,000,000 | | 980,829 | |
California School Finance Authority Rev., (Lighthouse Community Public Schools Obligated Group), 6.375%, 6/1/52(2) | 1,225,000 | | 1,280,525 | |
California School Finance Authority Rev., (Lighthouse Community Public Schools Obligated Group), 6.50%, 6/1/62(2) | 2,125,000 | | 2,223,271 | |
California School Finance Authority Rev., (Orange County Educational Arts Academy), 5.625%, 6/1/43(2) | 560,000 | | 575,695 | |
California School Finance Authority Rev., (Orange County Educational Arts Academy), 5.875%, 6/1/53(2) | 700,000 | | 719,819 | |
California School Finance Authority Rev., (Partnerships to Uplift Communities Series 2023 Obligated Group), 5.50%, 8/1/43(2) | 550,000 | | 586,244 | |
California School Finance Authority Rev., (Partnerships to Uplift Communities Series 2023 Obligated Group), 5.50%, 8/1/47(2) | 505,000 | | 533,362 | |
California School Finance Authority Rev., (Real Journey Academies Obligated Group), 5.00%, 6/1/49(2) | 5,250,000 | | 5,068,923 | |
California School Finance Authority Rev., (Real Journey Academies Obligated Group), 5.00%, 6/1/50(2) | 2,740,000 | | 2,636,186 | |
California School Finance Authority Rev., (Real Journey Academies Obligated Group), 5.00%, 6/1/59(2) | 3,915,000 | | 3,699,460 | |
California School Finance Authority Rev., (Rocketship Education Obligated Group), 5.00%, 6/1/26(2) | 235,000 | | 236,280 | |
California School Finance Authority Rev., (Rocketship Education Obligated Group), 5.00%, 6/1/31(2) | 870,000 | | 875,501 | |
California School Finance Authority Rev., (Rocketship Education Obligated Group), 5.00%, 6/1/36(2) | 1,000,000 | | 1,003,406 | |
California School Finance Authority Rev., (Rocketship Education Obligated Group), 5.00%, 6/1/37(2) | 360,000 | | 363,161 | |
California School Finance Authority Rev., (Rocketship Education Obligated Group), 5.00%, 6/1/46(2) | 2,100,000 | | 2,080,603 | |
California School Finance Authority Rev., (Rocketship Education Obligated Group), 5.00%, 6/1/53(2) | 2,265,000 | | 2,217,472 | |
California School Finance Authority Rev., (Summit Public Schools Obligated Group), 5.00%, 6/1/27, Prerefunded at 100% of Par(2)(4) | 525,000 | | 553,337 | |
California School Finance Authority Rev., (Summit Public Schools Obligated Group), 5.00%, 6/1/27, Prerefunded at 100% of Par(2)(4) | 995,000 | | 1,048,706 | |
California School Finance Authority Rev., (TEACH, Inc. Series 2019 Obligated Group), 5.00%, 6/1/58(2) | 3,600,000 | | 3,524,999 | |
California School Finance Authority Rev., (Value Schools), 5.00%, 7/1/40 (ST INTERCEPT)(2) | 545,000 | | 567,843 | |
California School Finance Authority Rev., (Value Schools), 5.25%, 7/1/48 (ST INTERCEPT)(2) | 700,000 | | 727,395 | |
| California State Financial Authority Rev., (Master's University & Seminary), 5.00%, 8/1/34 | 1,400,000 | | 1,464,221 | |
| California State Financial Authority Rev., (Master's University & Seminary), 5.00%, 8/1/39 | 1,640,000 | | 1,687,692 | |
| California State Financial Authority Rev., (Master's University & Seminary), 5.00%, 8/1/48 | 1,000,000 | | 1,011,012 | |
| California State University Rev., 5.25%, 11/1/53 | 1,000,000 | | 1,130,774 | |
| California State University Rev., 5.50%, 11/1/55 | 5,000,000 | | 5,810,049 | |
California Statewide Communities Development Authority Rev., (899 Charleston LLC), 5.25%, 11/1/44(2) | 5,500,000 | | 5,499,179 | |
| California Statewide Communities Development Authority Rev., (Adventist Health System/West Obligated Group), 5.00%, 3/1/35 | 1,785,000 | | 1,818,149 | |
California Statewide Communities Development Authority Rev., (California Baptist University), 3.50%, 11/1/27(2) | 2,130,000 | | 2,094,864 | |
California Statewide Communities Development Authority Rev., (California Baptist University), 5.00%, 11/1/32(2) | 3,090,000 | | 3,186,250 | |
| California Statewide Communities Development Authority Rev., (Emanate Health Obligated Group), 4.00%, 4/1/45 | 6,000,000 | | 5,900,182 | |
| California Statewide Communities Development Authority Rev., (Enloe Medical Center Obligated Group), 5.25%, 8/15/52 (AGM) | 500,000 | | 541,347 | |
| | | | | | | | |
| Principal
Amount/Shares | Value |
| California Statewide Communities Development Authority Rev., (Front Porch Communities & Services Obligated Group), 4.00%, 4/1/39 | $ | 1,405,000 | | $ | 1,391,891 | |
| California Statewide Communities Development Authority Rev., (Front Porch Communities & Services Obligated Group), 4.00%, 4/1/40 | 2,615,000 | | 2,580,763 | |
| California Statewide Communities Development Authority Rev., (HumanGood California Obligated Group), 5.00%, 10/1/45 | 2,400,000 | | 2,418,168 | |
California Statewide Communities Development Authority Rev., (Lancer Educational Housing LLC), 5.00%, 6/1/46(2) | 3,500,000 | | 3,517,137 | |
California Statewide Communities Development Authority Rev., (Lancer Educational Housing LLC), 5.00%, 6/1/51(2) | 1,450,000 | | 1,458,401 | |
California Statewide Communities Development Authority Rev., (Loma Linda University Medical Center Obligated Group), 5.00%, 12/1/26(2) | 2,000,000 | | 2,053,209 | |
California Statewide Communities Development Authority Rev., (Loma Linda University Medical Center Obligated Group), 5.00%, 12/1/29(2) | 3,155,000 | | 3,235,908 | |
California Statewide Communities Development Authority Rev., (Loma Linda University Medical Center Obligated Group), 5.00%, 12/1/36(2) | 1,000,000 | | 1,019,215 | |
California Statewide Communities Development Authority Rev., (Loma Linda University Medical Center Obligated Group), 5.00%, 12/1/41(2) | 1,700,000 | | 1,723,350 | |
California Statewide Communities Development Authority Rev., (Loma Linda University Medical Center Obligated Group), 5.00%, 12/1/46(2) | 9,900,000 | | 10,004,611 | |
| California Statewide Communities Development Authority Rev., (Loma Linda University Medical Center Obligated Group), 5.50%, 12/1/54 | 4,605,000 | | 4,611,777 | |
California Statewide Communities Development Authority Rev., (Loma Linda University Medical Center Obligated Group), 5.25%, 12/1/56(2) | 14,750,000 | | 14,919,444 | |
| California Statewide Communities Development Authority Rev., (Redlands Community Hospital Obligated Group), 4.00%, 10/1/41 | 6,500,000 | | 6,331,528 | |
| California Statewide Communities Development Authority Rev., (USC Obligated Group), 5.00%, 1/1/43 | 7,500,000 | | 7,858,102 | |
| California Statewide Communities Development Authority Special Assessment, (City of San Diego CA Assessment District No. 18-01), 5.00%, 9/2/39 | 1,300,000 | | 1,366,449 | |
| California Statewide Communities Development Authority Special Assessment, (City of San Diego CA Assessment District No. 18-01), 4.00%, 9/2/44 | 900,000 | | 854,026 | |
| California Statewide Communities Development Authority Special Assessment, (County of Contra Costa CA Assessment District No. 14-01), 5.00%, 9/2/35 | 1,920,000 | | 1,946,343 | |
| California Statewide Communities Development Authority Special Assessment, (County of Contra Costa CA Assessment District No. 14-01), 5.00%, 9/2/45 | 3,810,000 | | 3,837,959 | |
| California Statewide Communities Development Authority Special Tax, (California Statewide Cmntys Dev Authority Cmnty Facs Dist No. 2015-01 Area No. 2), 5.00%, 9/1/47 | 1,650,000 | | 1,685,473 | |
| California Statewide Communities Development Authority Special Tax, (California Statewide Cmntys Dev Authority Cmnty Facs Dist No. 2015-01 Area No. 3), 5.50%, 9/1/42 | 1,000,000 | | 1,079,473 | |
| California Statewide Communities Development Authority Special Tax, (California Statewide Cmntys Dev Authority Cmnty Facs Dist No. 2015-01 Area No. 3), 5.625%, 9/1/52 | 3,000,000 | | 3,232,216 | |
| California Statewide Communities Development Authority Special Tax, (California Statewide Communities Dev Auth Cmnty Facs Dist 2022-7 Impt Area 2), 5.00%, 9/1/49 | 1,500,000 | | 1,555,831 | |
| California Statewide Communities Development Authority Special Tax, (California Statewide Communities Dev Auth Cmnty Facs Dist 2022-7 Impt Area 2), 5.00%, 9/1/54 | 1,500,000 | | 1,549,696 | |
| California Statewide Communities Development Authority Special Tax, (California Statewide Communities Dev Auth Cmnty Facs Dist No. 2020-2 Impt Area 3), 5.00%, 9/1/49 | 375,000 | | 390,921 | |
| California Statewide Communities Development Authority Special Tax, (California Statewide Communities Dev Auth Cmnty Facs Dist No. 2020-2 Impt Area 3), 5.00%, 9/1/54 | 550,000 | | 569,619 | |
| California Statewide Communities Development Authority Special Tax, (California Statewide Communities Dev Authority Cmnty Facs Dist No. 2022-10), 5.50%, 9/1/53 | 1,700,000 | | 1,831,956 | |
| California Statewide Communities Development Authority Special Tax, (California Statewide Communities Development Authority Cmnty Facs Dist No. 2007), 5.00%, 9/1/37 | 1,565,000 | | 1,584,744 | |
| California Statewide Communities Development Authority Special Tax, (California Statewide Communities Development Authority Cmnty Facs Dist No. 2016), 5.00%, 9/1/39 | 1,000,000 | | 1,046,463 | |
| California Statewide Communities Development Authority Special Tax, (California Statewide Communities Development Authority Cmnty Facs Dist No. 2016), 5.00%, 9/1/49 | 2,095,000 | | 2,156,228 | |
| California Statewide Communities Development Authority Special Tax, (California Statewide Communities Development Authority Cmnty Facs Dist No. 2016), 5.50%, 9/1/52 | 4,245,000 | | 4,422,077 | |
| California Statewide Communities Development Authority Special Tax, (California Statewide Communities Development Authority Cmnty Facs Dist No. 2017), 5.00%, 9/1/48 | 7,330,000 | | 7,539,491 | |
| California Statewide Communities Development Authority Special Tax, (California Statewide Communities Development Authority Cmnty Facs Dist No. 2018), 5.00%, 9/1/39 | 1,455,000 | | 1,515,564 | |
| | | | | | | | |
| Principal
Amount/Shares | Value |
| California Statewide Communities Development Authority Special Tax, (California Statewide Communities Development Authority Cmnty Facs Dist No. 2018), 5.00%, 9/1/48 | $ | 1,750,000 | | $ | 1,798,720 | |
| California Statewide Communities Development Authority Special Tax, (California Statewide Communities Development Authority Cmnty Facs Dist No. 2018), 4.00%, 9/1/50 | 1,200,000 | | 1,146,990 | |
| Calimesa Special Tax, (City of Calimesa CA Community Facilities District No. 2018-1 Area No. 1), 4.00%, 9/1/45 | 865,000 | | 832,767 | |
| Calimesa Special Tax, (City of Calimesa CA Community Facilities District No. 2018-1 Area No. 1), 4.00%, 9/1/50 | 820,000 | | 765,481 | |
| Chabot-Las Positas Community College District GO, 5.25%, 8/1/48 | 4,350,000 | | 4,937,224 | |
| Chino Community Facilities District Special Tax, (City of Chino CA Community Facilities District No. 2003-3 Improvement Area No. 10), 5.00%, 9/1/49 | 680,000 | | 707,529 | |
| Chino Community Facilities District Special Tax, (City of Chino CA Community Facilities District No. 2003-3 Improvement Area No. 10), 5.00%, 9/1/54 | 740,000 | | 766,319 | |
| Chino Community Facilities District Special Tax, (City of Chino CA Community Facilities District No. 2003-3 Improvement Area No. 7), 5.00%, 9/1/43 | 3,160,000 | | 3,270,053 | |
| Chino Community Facilities District Special Tax, (City of Chino CA Community Facilities District No. 2003-3 Improvement Area No. 7), 4.00%, 9/1/45 | 1,325,000 | | 1,273,847 | |
| Chino Community Facilities District Special Tax, (City of Chino CA Community Facilities District No. 2003-3 Improvement Area No. 7), 5.00%, 9/1/48 | 2,500,000 | | 2,570,525 | |
| Chino Community Facilities District Special Tax, (City of Chino CA Community Facilities District No. 2003-3 Improvement Area No. 7), 4.00%, 9/1/50 | 2,500,000 | | 2,341,116 | |
| Chino Community Facilities District Special Tax, (City of Chino CA Community Facilities District No. 2003-3 Improvement Area No. 9), 5.375%, 9/1/47 | 1,615,000 | | 1,720,384 | |
| Chino Community Facilities District Special Tax, (City of Chino CA Community Facilities District No. 2003-3 Improvement Area No. 9), 5.375%, 9/1/52 | 2,000,000 | | 2,118,627 | |
| Chino Community Facilities District Special Tax, (City of Chino CA Community Facilities District No. 2019-1), 4.00%, 9/1/51 | 1,000,000 | | 945,754 | |
| Chula Vista Community Facilities District Special Tax, (City of Chula Vista CA Community Facilities District No. 06-1 Area No. 1), 5.00%, 9/1/43 | 535,000 | | 553,832 | |
| Chula Vista Community Facilities District Special Tax, (City of Chula Vista CA Community Facilities District No. 06-1 Area No. 1), 5.00%, 9/1/48 | 895,000 | | 919,586 | |
| Citrus Community College District GO, 5.00%, 8/1/49 | 4,000,000 | | 4,490,625 | |
| City & County of San Francisco Community Facilities District No. 2016-1 Special Tax, (City & County of San Francisco Community Facilities District No. 2016-1 Area 1), 4.00%, 9/1/35 | 300,000 | | 303,406 | |
| City & County of San Francisco Community Facilities District No. 2016-1 Special Tax, (City & County of San Francisco Community Facilities District No. 2016-1 Area 1), 4.00%, 9/1/41 | 1,000,000 | | 972,135 | |
| City & County of San Francisco Community Facilities District No. 2016-1 Special Tax, (City & County of San Francisco Community Facilities District No. 2016-1 Area 1), 4.00%, 9/1/42 | 600,000 | | 578,929 | |
| City & County of San Francisco Community Facilities District No. 2016-1 Special Tax, (City & County of San Francisco Community Facilities District No. 2016-1 Area 1), 4.00%, 9/1/50 | 1,450,000 | | 1,324,322 | |
| City & County of San Francisco Community Facilities District No. 2016-1 Special Tax, (City & County of San Francisco Community Facilities District No. 2016-1 Area 1), 4.00%, 9/1/51 | 2,500,000 | | 2,311,960 | |
City & County of San Francisco Special Tax District No. Special Tax, (City & County of San Francisco CA Special Tax Dist No. 2020-1 Office Special Tax), 5.75%, 9/1/53(2) | 1,800,000 | | 1,959,057 | |
City & County of San Francisco Special Tax District No. Special Tax, (City & County of San Francisco CA Spl Tax Dist No. 2020-1 Shoreline Tax Zone 1), 5.75%, 9/1/53(2) | 1,500,000 | | 1,625,918 | |
City & County of San Francisco, Infrastructure & Revitalization Financing Dist No. 1 Facs Tax Allocation, 5.00%, 9/1/52(2) | 1,500,000 | | 1,510,420 | |
City & County of San Francisco, Special Tax District No. 2020-1 Special Tax, (City & County of San Francisco CA Special Tax Dist No. 2020-1 Development Spl Ta), 4.00%, 9/1/46(2) | 2,475,000 | | 2,286,939 | |
| Clovis Unified School District GO, 4.00%, 8/1/48 | 4,000,000 | | 3,990,710 | |
| College of the Sequoias Visalia Area Improvement District No. 2 GO, 5.00%, 8/1/54 | 2,000,000 | | 2,208,246 | |
Corona Community Facilities District Special Tax, (City of Corona CA Community Facilities District No 2018-1 Improvement Area No. 2), 5.00%, 9/1/49(3) | 1,600,000 | | 1,701,456 | |
Corona Community Facilities District Special Tax, (City of Corona CA Community Facilities District No 2018-1 Improvement Area No. 2), 5.00%, 9/1/54(3) | 1,600,000 | | 1,690,992 | |
| Corona-Norco Unified School District Special Tax, (Corona-Norco Unified School District Community Facilities District No. 05-1), 4.00%, 9/1/45 | 2,000,000 | | 1,847,007 | |
| Corona-Norco Unified School District Special Tax, (Corona-Norco Unified School District Community Facilities District No. 16-1), 5.00%, 9/1/43 | 2,430,000 | | 2,503,782 | |
| Corona-Norco Unified School District Special Tax, (Corona-Norco Unified School District Community Facilities District No. 16-1), 5.00%, 9/1/48 | 1,500,000 | | 1,535,670 | |
| County of Sacramento Rev., (Einstein Preservation LP), Series 2024-01FN, 4.125%, 4/1/40 (FNMA) | 1,250,000 | | 1,262,146 | |
CSCDA Community Improvement Authority Rev., (CSCDA Community Improvement Authority 1818 Platinum Triangle-Anaheim), 3.25%, 4/1/57(2) | 9,635,000 | | 7,343,004 | |
| | | | | | | | |
| Principal
Amount/Shares | Value |
CSCDA Community Improvement Authority Rev., (CSCDA Community Improvement Authority 1818 Platinum Triangle-Anaheim), 4.00%, 4/1/57(2) | $ | 5,500,000 | | $ | 4,201,704 | |
CSCDA Community Improvement Authority Rev., (CSCDA Community Improvement Authority Altana Apartments), 4.00%, 10/1/56(2) | 13,000,000 | | 10,629,789 | |
CSCDA Community Improvement Authority Rev., (CSCDA Community Improvement Authority Dublin), 4.00%, 2/1/57(2) | 4,000,000 | | 3,116,874 | |
CSCDA Community Improvement Authority Rev., (CSCDA Community Improvement Authority Escondido Portfolio), 4.00%, 12/1/59(2) | 12,000,000 | | 7,637,149 | |
CSCDA Community Improvement Authority Rev., (CSCDA Community Improvement Authority Oceanaire Apartments), 4.00%, 9/1/56(2) | 6,235,000 | | 4,992,494 | |
CSCDA Community Improvement Authority Rev., (CSCDA Community Improvement Authority Orange Portfolio), 4.00%, 3/1/57(2) | 3,235,000 | | 2,504,044 | |
CSCDA Community Improvement Authority Rev., (CSCDA Community Improvement Authority Parrallel-Anaheim), 4.00%, 8/1/56(2) | 4,850,000 | | 4,365,431 | |
CSCDA Community Improvement Authority Rev., (CSCDA Community Improvement Authority Pasadena Portfolio), 2.65%, 12/1/46(2) | 1,480,000 | | 1,174,311 | |
CSCDA Community Improvement Authority Rev., (CSCDA Community Improvement Authority Renaissance at City Center), 5.00%, 7/1/51(2) | 8,250,000 | | 8,153,317 | |
CSCDA Community Improvement Authority Rev., (CSCDA Community Improvement Authority Waterscape Apartments), 4.00%, 9/1/46(2) | 1,925,000 | | 1,646,952 | |
CSCDA Community Improvement Authority Rev., (CSCDA Community Improvement Authority Westgate Apartments), 3.125%, 6/1/57(2) | 5,385,000 | | 3,355,059 | |
CSCDA Community Improvement Authority Rev., (CSCDA Community Improvement Authority Westgate Apartments), 4.00%, 6/1/57(2) | 2,500,000 | | 871,219 | |
| Dixon Special Tax, (City of Dixon CA Community Facilities District No. 2013-1 Parklane), 5.00%, 9/1/45 | 4,780,000 | | 4,814,974 | |
| Dixon Special Tax, (City of Dixon CA Community Facilities District No. 2019-1 Improvement Area No. 1), 4.00%, 9/1/45 | 1,000,000 | | 942,853 | |
| Dixon Special Tax, (City of Dixon CA Community Facilities District No. 2019-1 Improvement Area No. 2), 5.00%, 9/1/46 | 300,000 | | 315,413 | |
| Dixon Special Tax, (City of Dixon CA Community Facilities District No. 2019-1 Improvement Area No. 2), 5.00%, 9/1/48 | 1,400,000 | | 1,439,461 | |
| Dixon Special Tax, (City of Dixon CA Community Facilities District No. 2019-1 Improvement Area No. 2), 5.00%, 9/1/53 | 1,600,000 | | 1,653,907 | |
| Dixon Special Tax, (City of Dixon CA Community Facilities District No. 2019-1 Improvement Area No. 2), 5.00%, 9/1/54 | 1,000,000 | | 1,038,823 | |
| Dublin Special Tax, (City of Dublin CA Community Facilities District No. 2015-1 Improvement Area No. 4), 5.50%, 9/1/47 | 2,630,000 | | 2,822,180 | |
| Dublin Special Tax, (City of Dublin CA Community Facilities District No. 2015-1 Improvement Area No. 4), 5.50%, 9/1/51 | 3,040,000 | | 3,252,081 | |
| Dublin Special Tax, (City of Dublin CA Community Facilities District No. 2015-1 Improvement Area No. 5), 5.375%, 9/1/51 | 1,250,000 | | 1,311,361 | |
| Dublin Community Facilities District Improvement Area No. 1 Special Tax, (City of Dublin CA Community Facilities District No. 2015-1 Improvement Area No. 1), 5.00%, 9/1/37 | 1,150,000 | | 1,193,131 | |
| Dublin Community Facilities District Improvement Area No. 1 Special Tax, (City of Dublin CA Community Facilities District No. 2015-1 Improvement Area No. 1), 5.00%, 9/1/47 | 2,840,000 | | 2,898,653 | |
| Dublin Community Facilities District Improvement Area No. 1 Special Tax, (City of Dublin CA Community Facilities District No. 2015-1 Improvement Area No. 2), 5.00%, 9/1/44 | 2,200,000 | | 2,294,023 | |
| East Bay Municipal Utility District Wastewater System Rev., 5.00%, 6/1/42 | 600,000 | | 680,269 | |
| East Bay Municipal Utility District Wastewater System Rev., 5.00%, 6/1/45 | 1,200,000 | | 1,341,867 | |
| East Bay Municipal Utility District Wastewater System Rev., (East Bay Municipal Utility District Wastewater System Revenue), 5.00%, 6/1/54 | 1,850,000 | | 2,055,470 | |
| East Bay Municipal Utility District Water System Rev., (East Bay Municipal Utility District Water System Revenue), 5.00%, 6/1/54 | 2,855,000 | | 3,172,091 | |
| East Garrison Public Finance Authority Special Tax, (East Garrison Public Finance Authority East Garrison Cmnty Facs Dist No. 2006-1), 5.00%, 9/1/46 | 1,155,000 | | 1,170,727 | |
| El Dorado County Special Tax, (County of El Dorado CA Community Facilities District No. 2014-1), 4.00%, 9/1/46 | 2,350,000 | | 2,205,664 | |
| El Dorado County Special Tax, (County of El Dorado CA Community Facilities District No. 2018-1 Bass Lake Hills), 5.00%, 9/1/34 | 450,000 | | 469,195 | |
| El Dorado County Special Tax, (County of El Dorado CA Community Facilities District No. 2018-1 Bass Lake Hills), 5.00%, 9/1/49 | 2,920,000 | | 2,983,241 | |
| El Rancho Unified School District GO, 5.75%, 8/1/48 (BAM) | 625,000 | | 739,567 | |
| Emeryville Redevelopment Agency Successor Agency Tax Allocation, 5.00%, 9/1/34 (AGM) | 1,000,000 | | 1,001,131 | |
| Escondido Special Tax, (City of Escondido CA Community Facilities District No. 2020-2), 5.00%, 9/1/52 | 2,700,000 | | 2,794,583 | |
| | | | | | | | |
| Principal
Amount/Shares | Value |
| Fairfield Community Facilities District Special Tax, (City of Fairfield CA Community Facilities District No. 2016-1 Improvement Area C), 4.00%, 9/1/41 | $ | 1,145,000 | | $ | 1,117,164 | |
| Fairfield Community Facilities District Special Tax, (City of Fairfield CA Community Facilities District No. 2016-1 Improvement Area C), 4.00%, 9/1/45 | 2,000,000 | | 1,890,946 | |
| Fairfield Community Facilities District Special Tax, (City of Fairfield CA Community Facilities District No. 2019-1 Area No. 1), 5.00%, 9/1/50 | 3,250,000 | | 3,346,003 | |
| Folsom Ranch Financing Authority Special Tax, (City of Folsom CA Community Facilities District No. 19), 5.00%, 9/1/39 | 1,255,000 | | 1,316,465 | |
| Folsom Ranch Financing Authority Special Tax, (City of Folsom CA Community Facilities District No. 19), 5.00%, 9/1/44 | 2,285,000 | | 2,371,144 | |
| Folsom Ranch Financing Authority Special Tax, (City of Folsom CA Community Facilities District No. 19), 5.00%, 9/1/47 | 4,325,000 | | 4,416,761 | |
| Folsom Ranch Financing Authority Special Tax, (City of Folsom CA Community Facilities District No. 20), 5.00%, 9/1/33 | 530,000 | | 553,661 | |
| Folsom Ranch Financing Authority Special Tax, (City of Folsom CA Community Facilities District No. 20), 5.00%, 9/1/38 | 845,000 | | 879,974 | |
| Folsom Ranch Financing Authority Special Tax, (City of Folsom CA Community Facilities District No. 20), 5.00%, 9/1/42 | 1,680,000 | | 1,773,750 | |
| Folsom Ranch Financing Authority Special Tax, (City of Folsom CA Community Facilities District No. 20), 5.125%, 9/1/47 | 1,250,000 | | 1,310,694 | |
| Folsom Ranch Financing Authority Special Tax, (City of Folsom CA Community Facilities District No. 20), 5.125%, 9/1/52 | 1,300,000 | | 1,356,361 | |
| Folsom Ranch Financing Authority Special Tax, (City of Folsom CA Community Facilities District No. 21), 4.00%, 9/1/46 | 800,000 | | 738,165 | |
| Folsom Ranch Financing Authority Special Tax, (City of Folsom CA Community Facilities District No. 23 Area No 1), 4.00%, 9/1/40 | 1,245,000 | | 1,201,500 | |
| Folsom Ranch Financing Authority Special Tax, (City of Folsom CA Community Facilities District No. 23 Area No 1), 4.00%, 9/1/50 | 2,285,000 | | 2,042,181 | |
| Fontana Special Tax, (City of Fontana CA Community Facilities District No. 31), 5.00%, 9/1/35 | 1,365,000 | | 1,422,385 | |
| Fontana Special Tax, (City of Fontana CA Community Facilities District No. 85), 4.00%, 9/1/45 | 750,000 | | 721,045 | |
| Fontana Special Tax, (City of Fontana CA Community Facilities District No. 85), 4.00%, 9/1/50 | 900,000 | | 842,802 | |
| Foothill-Eastern Transportation Corridor Agency Rev., 4.00%, 1/15/46 (BAM-TCRS) | 7,250,000 | | 7,269,832 | |
Foothill-Eastern Transportation Corridor Agency Rev., Capital Appreciation, 0.00%, 1/15/42(1) | 6,000,000 | | 2,865,056 | |
| Foothill-Eastern Transportation Corridor Agency Rev., Capital Appreciation, 6.85%, 1/15/42 | 2,200,000 | | 2,622,518 | |
| Fort Bragg Unified School District GO, 5.50%, 8/1/52 | 1,450,000 | | 1,584,792 | |
| Fremont Community Facilities District No. 1 Special Tax, 5.00%, 9/1/40 | 3,000,000 | | 3,027,369 | |
| Fremont Community Facilities District No. 1 Special Tax, 5.00%, 9/1/45 | 2,000,000 | | 2,014,440 | |
| Fresno Unified School District GO, 4.00%, 8/1/52 | 2,500,000 | | 2,465,865 | |
| Fresno Unified School District GO, 4.00%, 8/1/55 | 4,500,000 | | 4,442,364 | |
| Glendale Electric Rev., (City of Glendale Electric Revenue), 5.00%, 2/1/49 | 5,000,000 | | 5,513,191 | |
| Golden State Tobacco Securitization Corp. Rev., 5.00%, 6/1/51 | 4,000,000 | | 4,154,730 | |
Golden State Tobacco Securitization Corp. Rev., Capital Appreciation, 0.00%, 6/1/66(1) | 44,750,000 | | 5,225,780 | |
Hastings Campus Housing Finance Authority Rev., 5.00%, 7/1/45(2) | 1,000,000 | | 962,363 | |
Hastings Campus Housing Finance Authority Rev., 5.00%, 7/1/61(2) | 7,135,000 | | 6,579,020 | |
Hastings Campus Housing Finance Authority Rev., Capital Appreciation, VRN, 0.00%, 7/1/61(2) | 14,365,000 | | 6,691,563 | |
| Hemet Unified School District Financing Authority Special Tax, 5.00%, 9/1/39 | 2,100,000 | | 2,110,628 | |
| Hesperia Special Tax, (City of Hesperia CA Community Facilities District No. 2005-1), 5.00%, 9/1/29 | 1,060,000 | | 1,069,642 | |
Independent Cities Finance Authority Rev., (City of Compton CA Sales Tax Rev.), 4.00%, 6/1/51 (AGM)(2) | 3,400,000 | | 3,349,932 | |
| Independent Cities Finance Authority Rev., (Millennium Housing LLC CA), 5.00%, 9/15/50 | 2,000,000 | | 2,093,260 | |
| Independent Cities Finance Authority Rev., (Palomar Estates East), 5.00%, 9/15/36 | 1,000,000 | | 1,011,425 | |
| Independent Cities Finance Authority Rev., (Palomar Estates West), 5.00%, 9/15/36 | 1,500,000 | | 1,517,138 | |
| Indio Electric Financing Authority Rev., (Imperial Irrigation District Electric System Rev.), 5.25%, 1/1/53 | 3,000,000 | | 3,344,031 | |
| Inland Valley Development Agency Tax Allocation, 5.25%, 9/1/37 | 1,110,000 | | 1,114,204 | |
| Irvine Special Assessment, (City of Irvine CA Reassessment District No. 15-2), 5.00%, 9/2/42 | 1,500,000 | | 1,514,785 | |
Irvine Special Tax, (City of Irvine CA Community Facilities District No 2013-3 Area No. 1), Capital Appreciation, 0.00%, 9/1/52 (BAM)(1) | 1,400,000 | | 375,732 | |
Irvine Special Tax, (City of Irvine CA Community Facilities District No 2013-3 Area No. 1), Capital Appreciation, 0.00%, 9/1/53 (BAM)(1) | 1,000,000 | | 255,305 | |
| | | | | | | | |
| Principal
Amount/Shares | Value |
| Irvine Special Tax, (City of Irvine CA Community Facilities District No. 2013-3 Improvement Area No. 1), 5.25%, 9/1/53 (BAM) | $ | 2,000,000 | | $ | 2,229,896 | |
| Irvine Special Tax, (City of Irvine CA Community Facilities District No. 2013-3 Improvement Area No. 8), 5.00%, 9/1/48 | 2,500,000 | | 2,572,376 | |
| Irvine Facilities Financing Authority Rev., (City of Irvine CA), 4.25%, 5/1/53 | 5,000,000 | | 5,009,267 | |
| Jurupa Unified School District Special Tax, (Jurupa Unified School District Community Facilities District No. 11 Area B), 4.00%, 9/1/47 | 1,000,000 | | 914,340 | |
| Jurupa Unified School District Special Tax, (Jurupa Unified School District Community Facilities District No. 6 Zone 2), 5.00%, 9/1/38 | 1,000,000 | | 1,039,683 | |
| Jurupa Unified School District Special Tax, (Jurupa Unified School District Community Facilities District No. 6 Zone 2), 5.00%, 9/1/43 | 1,255,000 | | 1,292,175 | |
| Lake Elsinore Special Tax, (City of Lake Elsinore CA Community Facilities District No. 2016-2), 5.00%, 9/1/43 | 2,470,000 | | 2,549,584 | |
| Lake Elsinore Special Tax, (City of Lake Elsinore CA Community Facilities District No. 2016-2), 5.00%, 9/1/48 | 3,640,000 | | 3,726,559 | |
| Lake Elsinore Public Financing Authority Special Tax, 5.00%, 9/1/40 | 1,925,000 | | 1,942,936 | |
| Lake Elsinore Unified School District Community Facilities District Special Tax, (Lake Elsinore Unified School District Community Facilities District No. 2013-1), 4.00%, 9/1/42 | 600,000 | | 594,535 | |
| Lake Elsinore Unified School District Community Facilities District Special Tax, (Lake Elsinore Unified School District Community Facilities District No. 2013-1), 4.00%, 9/1/47 | 900,000 | | 870,010 | |
| Lammersville Joint Unified School District Special Tax, (Lammersville Joint Unified School District Cmnty Facs Dist No. 2014-1 Area No. 1), 5.00%, 9/1/43 | 775,000 | | 800,547 | |
| Lammersville Joint Unified School District Special Tax, (Lammersville Joint Unified School District Community Facilities District No. 200), 5.00%, 9/1/30 | 1,300,000 | | 1,363,145 | |
| Lammersville Joint Unified School District Special Tax, (Lammersville Joint Unified School District Community Facilities District No. 200), 5.00%, 9/1/32 | 1,510,000 | | 1,575,804 | |
| Lee Lake Water District Financing Corp. Special Tax, (Temescal Valley Water District Community Facilities District No. 4 Area No. 1), 5.00%, 9/1/43 | 4,730,000 | | 4,884,161 | |
| Lee Lake Water District Financing Corp. Special Tax, (Temescal Valley Water District Community Facilities District No. 4 Area No. 1), 5.00%, 9/1/48 | 6,040,000 | | 6,194,762 | |
| Lee Lake Water District Financing Corp. Special Tax, (Temescal Valley Water District Community Facilities District No. 4 Area No. 2), 4.00%, 9/1/46 | 1,040,000 | | 988,752 | |
| Lee Lake Water District Financing Corp. Special Tax, (Temescal Valley Water District Community Facilities District No. 4 Area No. 2), 4.00%, 9/1/51 | 930,000 | | 862,798 | |
| Long Beach Bond Finance Authority Rev., 5.50%, 11/15/37 (GA: Merrill Lynch & Co.) | 1,150,000 | | 1,348,554 | |
| Los Angeles Community Facilities District Special Tax, (City of Los Angeles CA Community Facilities District No. 11), 4.00%, 9/1/46 | 1,500,000 | | 1,399,874 | |
| Los Angeles County Community Facilities District No. 2021-01 Special Tax, (County of Los Angeles CA Community Facilities District No. 2021-01 Area No.1), 5.00%, 9/1/52 | 1,000,000 | | 1,045,974 | |
Los Angeles County Community Facilities District No. 2021-01 Special Tax, (County of Los Angeles CA Community Facilities District No. 2021-01 Area No.2), 5.00%, 9/1/49(3) | 1,400,000 | | 1,474,979 | |
Los Angeles County Community Facilities District No. 2021-01 Special Tax, (County of Los Angeles CA Community Facilities District No. 2021-01 Area No.2), 5.00%, 9/1/54(3) | 1,500,000 | | 1,575,331 | |
| Los Angeles County Public Works Financing Authority Rev., (County of Los Angeles CA), 5.00%, 12/1/49 | 7,000,000 | | 7,399,728 | |
Los Angeles County Public Works Financing Authority Rev., (County of Los Angeles CA), 5.50%, 12/1/53(3) | 2,350,000 | | 2,724,255 | |
| Los Angeles Department of Airports Rev., 5.00%, 5/15/39 | 5,000,000 | | 5,476,596 | |
| Los Angeles Department of Airports Rev., 5.00%, 5/15/48 | 3,000,000 | | 3,297,082 | |
| Los Angeles Department of Water & Power Rev., (Los Angeles Department of Water & Power Power System Rev.), 5.00%, 7/1/51 | 5,165,000 | | 5,572,749 | |
| Los Angeles Department of Water & Power Rev., (Los Angeles Department of Water & Power Power System Rev.), 5.00%, 7/1/53 | 5,000,000 | | 5,503,818 | |
| Los Angeles Department of Water & Power Rev., (Los Angeles Department of Water & Power Power System Rev.), 5.25%, 7/1/54 | 5,250,000 | | 5,955,352 | |
| Los Angeles Department of Water & Power Rev., (Los Angeles Department of Water & Power Power System Rev.), VRDN, 3.57%, 9/3/24 (SBBPA: Bank of America N.A.) | 1,500,000 | | 1,500,000 | |
| Los Angeles Department of Water & Power Rev., (Los Angeles Department of Water & Power Power System Rev.), VRDN, 3.65%, 9/3/24 (SBBPA: Royal Bank of Canada) | 500,000 | | 500,000 | |
| Los Angeles Department of Water & Power Rev., (Los Angeles Department of Water & Power Power System Rev.), VRDN, 3.65%, 9/3/24 (SBBPA: Bank of America N.A.) | 640,000 | | 640,000 | |
| Los Angeles Department of Water & Power Rev., (Los Angeles Department of Water & Power Power System Rev.), VRDN, 3.60%, 9/6/24 (SBBPA: JPMorgan Chase Bank N.A.) | 4,400,000 | | 4,400,000 | |
| Los Angeles Department of Water & Power Water System Rev., 5.00%, 7/1/42 | 2,000,000 | | 2,295,634 | |
| Los Angeles Department of Water & Power Water System Rev., 5.00%, 7/1/43 | 1,000,000 | | 1,142,835 | |
| Los Angeles Department of Water & Power Water System Rev., 5.00%, 7/1/44 | 1,000,000 | | 1,138,388 | |
| | | | | | | | |
| Principal
Amount/Shares | Value |
| Los Angeles Department of Water & Power Water System Rev., 5.00%, 7/1/52 | $ | 3,000,000 | | $ | 3,281,167 | |
| Los Angeles Department of Water & Power Water System Rev., VRDN, 3.65%, 9/3/24 (SBBPA: Barclays Bank PLC) | 400,000 | | 400,000 | |
| Los Angeles Department of Water & Power Water System Rev., VRDN, 3.68%, 9/3/24 (SBBPA: Barclays Bank PLC) | 1,000,000 | | 1,000,000 | |
| Los Angeles Housing Authority Rev., 3.75%, 4/1/34 (FNMA) | 2,000,000 | | 2,037,063 | |
| Los Angeles Unified School District GO, 5.00%, 7/1/33 | 1,700,000 | | 2,028,388 | |
| Los Angeles Unified School District GO, 5.00%, 7/1/34 | 1,750,000 | | 2,115,661 | |
| Marina Redevelopment Agency Successor Agency Tax Allocation, 5.00%, 9/1/24 | 250,000 | | 250,000 | |
| Marina Redevelopment Agency Successor Agency Tax Allocation, 5.00%, 9/1/25 | 260,000 | | 265,414 | |
| Marina Redevelopment Agency Successor Agency Tax Allocation, 5.00%, 9/1/26 | 115,000 | | 119,872 | |
| Marina Redevelopment Agency Successor Agency Tax Allocation, 5.00%, 9/1/26 | 135,000 | | 140,719 | |
| Marina Redevelopment Agency Successor Agency Tax Allocation, 5.00%, 9/1/27 | 100,000 | | 104,991 | |
| Marina Redevelopment Agency Successor Agency Tax Allocation, 5.00%, 9/1/28 | 100,000 | | 104,708 | |
| Marina Redevelopment Agency Successor Agency Tax Allocation, 5.00%, 9/1/28 | 100,000 | | 104,789 | |
| Marina Redevelopment Agency Successor Agency Tax Allocation, 5.00%, 9/1/33 | 250,000 | | 260,858 | |
| Marina Redevelopment Agency Successor Agency Tax Allocation, 5.00%, 9/1/33 | 340,000 | | 354,699 | |
| Marina Redevelopment Agency Successor Agency Tax Allocation, 5.00%, 9/1/38 | 250,000 | | 260,046 | |
| Marina Redevelopment Agency Successor Agency Tax Allocation, 5.00%, 9/1/38 | 400,000 | | 416,074 | |
Menifee Union School District GO, Capital Appreciation, 0.00%, 8/1/44(1) | 1,750,000 | | 712,254 | |
Menifee Union School District GO, Capital Appreciation, 0.00%, 8/1/45(1) | 1,200,000 | | 461,055 | |
| Menifee Union School District Special Tax, (Menifee Union School District Community Facilities District No. 2011-1 Area No. 4), 5.00%, 9/1/44 | 2,245,000 | | 2,330,662 | |
| Menifee Union School District Special Tax, (Menifee Union School District Community Facilities District No. 2011-1 Area No. 7), 5.25%, 9/1/52 | 2,000,000 | | 2,107,480 | |
| Middle Fork Project Finance Authority Rev., 5.00%, 4/1/34 | 1,175,000 | | 1,247,676 | |
| Middle Fork Project Finance Authority Rev., 5.00%, 4/1/35 | 1,030,000 | | 1,091,298 | |
| Middle Fork Project Finance Authority Rev., 5.00%, 4/1/36 | 2,350,000 | | 2,481,554 | |
| Midpeninsula Regional Open Space District Field Employees Corp. GO, 4.00%, 3/1/54 | 1,140,000 | | 1,117,078 | |
| Monterey Peninsula Community College District GO, 4.00%, 8/1/51 | 3,350,000 | | 3,315,880 | |
| Moreno Valley Unified School District Community Facilities District Special Tax, (Moreno Valley Unified School District Community Facilities District No. 2018-1), 4.00%, 9/1/52 | 3,985,000 | | 3,511,384 | |
| M-S-R Energy Authority Rev., 7.00%, 11/1/34 (GA: Citigroup Global Markets) | 1,700,000 | | 2,146,069 | |
| M-S-R Energy Authority Rev., 6.50%, 11/1/39 (GA: Citigroup Global Markets) | 4,000,000 | | 5,189,542 | |
| Murrieta Community Facilities District Special Tax, (City of Murrieta CA Community Facilities District No. 2005-5 Improvement Area A), 5.00%, 9/1/42 | 655,000 | | 674,021 | |
| Murrieta Community Facilities District Special Tax, (City of Murrieta CA Community Facilities District No. 2005-5 Improvement Area A), 5.00%, 9/1/46 | 825,000 | | 845,014 | |
| North Lake Tahoe Public Financing Authority Rev., (County of Placer CA), 5.50%, 12/1/47 | 4,425,000 | | 4,935,124 | |
| Northern California Energy Authority Rev., VRN, 5.00%, 12/1/54 (GA: Pacific Life Insurance Co.) | 5,000,000 | | 5,368,789 | |
| Northern California Sanitation Agencies Financing Authority Rev., (Sacramento Area Sewer District), 5.00%, 12/1/38 | 500,000 | | 596,384 | |
Northern Inyo County Local Hospital District GO, 0.00%, 11/1/34 (AGC)(1) | 1,325,000 | | 907,701 | |
Northern Inyo County Local Hospital District GO, 0.00%, 11/1/36 (AGC)(1) | 2,885,000 | | 1,790,979 | |
| Norwalk-La Mirada Unified School District GO, 5.00%, 8/1/51 | 1,750,000 | | 1,933,446 | |
| Ojai Unified School District GO, 5.50%, 8/1/53 (AGM) | 1,750,000 | | 1,988,340 | |
| Ontario Special Tax, (City of Ontario CA Community Facilities District No. 35), 5.00%, 9/1/49 | 500,000 | | 525,588 | |
| Ontario Special Tax, (City of Ontario CA Community Facilities District No. 35), 5.00%, 9/1/54 | 1,000,000 | | 1,044,553 | |
| Ontario Special Tax, (City of Ontario CA Community Facilities District No. 56), 5.50%, 9/1/48 | 1,250,000 | | 1,353,068 | |
| Ontario Special Tax, (City of Ontario CA Community Facilities District No. 56), 5.75%, 9/1/54 | 2,210,000 | | 2,402,910 | |
| Ontario Special Tax, (City of Ontario CA Community Facilities District No. 57), 4.25%, 9/1/37 | 415,000 | | 418,192 | |
| Ontario Special Tax, (City of Ontario CA Community Facilities District No. 57), 4.625%, 9/1/42 | 650,000 | | 660,999 | |
| Ontario Special Tax, (City of Ontario CA Community Facilities District No. 57), 4.75%, 9/1/47 | 840,000 | | 848,459 | |
| Ontario Special Tax, (City of Ontario CA Community Facilities District No. 57), 4.75%, 9/1/52 | 825,000 | | 826,962 | |
| Ontario Community Facilities District No. 24 Special Tax, 5.00%, 9/1/26 | 390,000 | | 406,523 | |
| Ontario Community Facilities District No. 28 Special Tax, 5.00%, 9/1/42 | 1,000,000 | | 1,026,198 | |
| Ontario Community Facilities District No. 28 Special Tax, 5.00%, 9/1/47 | 500,000 | | 510,326 | |
| | | | | | | | |
| Principal
Amount/Shares | Value |
| Ontario Community Facilities District No. 30 Special Tax, 4.00%, 9/1/42 | $ | 1,395,000 | | $ | 1,322,487 | |
| Ontario Community Facilities District No. 30 Special Tax, 4.00%, 9/1/48 | 2,000,000 | | 1,819,948 | |
| Ontario Community Facilities District No. 31 Special Tax, 5.00%, 9/1/42 | 1,050,000 | | 1,075,128 | |
| Ontario Community Facilities District No. 34 Special Tax, 4.00%, 9/1/48 | 1,000,000 | | 914,041 | |
| Ontario Community Facilities District No. 43 Special Tax, 4.00%, 9/1/50 | 1,000,000 | | 937,918 | |
| Ontario Public Financing Authority Rev., (City of Ontario CA Water Rev.), 5.00%, 8/1/49 | 5,000,000 | | 5,564,590 | |
| Orange County Community Facilities District Special Tax, (County of Orange CA Community Facilities District No. 2015-1), 5.25%, 8/15/45 | 3,905,000 | | 3,941,231 | |
| Orange County Community Facilities District Special Tax, (County of Orange CA Community Facilities District No. 2016-1), 5.00%, 8/15/41 | 6,545,000 | | 6,655,207 | |
| Orange County Community Facilities District Special Tax, (County of Orange CA Community Facilities District No. 2016-1), 5.00%, 8/15/46 | 3,000,000 | | 3,040,474 | |
| Orange County Community Facilities District Special Tax, (County of Orange CA Community Facilities District No. 2017-1 Area No.1), 5.00%, 8/15/42 | 2,500,000 | | 2,578,297 | |
| Orange County Community Facilities District Special Tax, (County of Orange CA Community Facilities District No. 2021-1), 5.00%, 8/15/47 | 3,300,000 | | 3,443,243 | |
| Orange County Community Facilities District Special Tax, (County of Orange CA Community Facilities District No. 2021-1), 5.00%, 8/15/52 | 1,000,000 | | 1,038,915 | |
| Orange County Community Facilities District Special Tax, (County of Orange CA Community Facilities District No. 2023-1), 5.50%, 8/15/53 | 2,200,000 | | 2,371,392 | |
| Orange County Community Facilities District Special Tax, (County of Orange CA Community Facilities District No. 2023-1), 5.75%, 8/15/53 | 1,085,000 | | 1,180,148 | |
| Oroville Rev., (Oroville Hospital), 5.25%, 4/1/39 | 2,350,000 | | 1,762,500 | |
| Oroville Rev., (Oroville Hospital), 5.25%, 4/1/49 | 3,000,000 | | 2,253,649 | |
| Oxnard School District GO, 4.25%, 8/1/53 (BAM) | 3,000,000 | | 3,030,166 | |
| Palm Desert Special Tax, (City of Palm Desert CA Community Facilities District No. 2021-1), 3.00%, 9/1/31 | 345,000 | | 322,797 | |
| Palm Desert Special Tax, (City of Palm Desert CA Community Facilities District No. 2021-1), 4.00%, 9/1/41 | 900,000 | | 845,759 | |
| Palm Desert Special Tax, (City of Palm Desert CA Community Facilities District No. 2021-1), 5.00%, 9/1/49 | 600,000 | | 625,474 | |
| Palm Desert Special Tax, (City of Palm Desert CA Community Facilities District No. 2021-1), 4.00%, 9/1/51 | 1,300,000 | | 1,142,975 | |
| Palm Desert Special Tax, (City of Palm Desert CA Community Facilities District No. 2021-1), 5.00%, 9/1/53 | 525,000 | | 544,491 | |
| Palmdale Water District Public Financing Authority Rev., (Palmdale Water District), 5.00%, 10/1/53 (AGM) | 1,700,000 | | 1,887,687 | |
| Palomar Health COP, (Palomar Health Obligated Group), 4.00%, 11/1/38 | 1,445,000 | | 1,307,231 | |
| Palomar Health Rev., (Palomar Health Obligated Group), 5.00%, 11/1/36 | 3,465,000 | | 3,429,379 | |
| Palomar Health Rev., (Palomar Health Obligated Group), 5.00%, 11/1/39 | 8,250,000 | | 8,014,359 | |
| Palomar Health Rev., (Palomar Health Obligated Group), 5.00%, 11/1/42 | 15,000,000 | | 14,290,158 | |
| Peninsula Corridor Joint Powers Board Rev., 5.00%, 6/1/51 | 10,000,000 | | 10,826,021 | |
| Perris Joint Powers Authority Special Tax, 5.00%, 9/1/34 | 1,555,000 | | 1,615,590 | |
| Perris Union High School District Special Tax, (Perris Union High School District Community Facilities District No. 92-1), 5.00%, 9/1/41 | 4,750,000 | | 4,770,886 | |
| Pleasant Valley School District/Ventura County GO, 5.85%, 8/1/31 (NPFG) | 4,775,000 | | 5,189,676 | |
| Rancho Cordova Special Tax, (City of Rancho Cordova CA Arista Del Sol Cmnty Facs Dist No. 2022-1 Impt Area 1), 5.375%, 9/1/53 | 1,300,000 | | 1,376,238 | |
| Rancho Cordova Special Tax, (City of Rancho Cordova CA Ranch Community Facs District No. 2021-1 Area No. 1), 5.25%, 9/1/52 | 2,000,000 | | 2,078,826 | |
| Rancho Cordova Special Tax, (City of Rancho Cordova CA Sunridge North Douglas Cmnty Facs District No. 2005-1), 5.00%, 9/1/40 | 1,195,000 | | 1,206,715 | |
| Rancho Cordova Special Tax, (City of Rancho Cordova CA Sunridge North Douglas Cmnty Facs District No. 2005-1), 4.00%, 9/1/45 | 1,025,000 | | 958,427 | |
| Rancho Cordova Special Tax, (City of Rancho Cordova CA Sunridge North Douglas Cmnty Facs District No. 2005-1), 5.00%, 9/1/45 | 1,250,000 | | 1,260,237 | |
Redwood City Redevelopment Agency Successor Agency Tax Allocation, Capital Appreciation, 0.00%, 7/15/28 (AMBAC)(1) | 3,405,000 | | 3,025,846 | |
| Regents of the University of California Medical Center Pooled Rev., VRDN, 3.60%, 9/3/24 | 2,000,000 | | 2,000,000 | |
| Regents of the University of California Medical Center Pooled Rev., VRDN, 3.85%, 9/3/24 | 3,900,000 | | 3,900,000 | |
| Regents of the University of California Medical Center Pooled Rev., VRDN, 3.85%, 9/3/24 | 5,710,000 | | 5,710,000 | |
| Rialto Special Tax, (City of Rialto CA Community Facilities District No. 2020-1), 5.50%, 9/1/53 | 1,500,000 | | 1,610,679 | |
| Rincon Valley Union School District GO, 4.00%, 8/1/49 | 915,000 | | 895,001 | |
| Riverside County Community Facilities Districts Special Tax, (County of Riverside CA Community Facilities District No. 04-2), 5.00%, 9/1/30 | 1,035,000 | | 1,035,000 | |
| | | | | | | | |
| Principal
Amount/Shares | Value |
| Riverside County Community Facilities Districts Special Tax, (County of Riverside CA Community Facilities District No. 04-2), 5.00%, 9/1/35 | $ | 2,520,000 | | $ | 2,520,000 | |
| Riverside County Community Facilities Districts Special Tax, (County of Riverside CA Community Facilities District No. 05-8), 5.00%, 9/1/48 | 2,500,000 | | 2,559,450 | |
| Riverside County Community Facilities Districts Special Tax, (County of Riverside CA Community Facilities District No. 07-2), 5.00%, 9/1/40 | 2,250,000 | | 2,269,871 | |
| Riverside County Community Facilities Districts Special Tax, (County of Riverside CA Community Facilities District No. 07-2), 5.00%, 9/1/42 | 1,110,000 | | 1,137,507 | |
| Riverside County Community Facilities Districts Special Tax, (County of Riverside CA Community Facilities District No. 07-2), 5.00%, 9/1/44 | 2,735,000 | | 2,754,330 | |
| Riverside County Community Facilities Districts Special Tax, (County of Riverside CA Community Facilities District No. 07-2), 5.00%, 9/1/45 | 540,000 | | 551,418 | |
| Riverside County Transportation Commission Rev., 4.00%, 6/1/46 | 1,475,000 | | 1,457,958 | |
Riverside County Transportation Commission Rev., Capital Appreciation, 0.00%, 6/1/41(1) | 2,000,000 | | 1,000,186 | |
Riverside County Transportation Commission Rev., Capital Appreciation, 0.00%, 6/1/42(1) | 3,320,000 | | 1,573,654 | |
Riverside County Transportation Commission Rev., Capital Appreciation, 0.00%, 6/1/43(1) | 5,000,000 | | 2,249,488 | |
| Riverside Unified School District Special Tax, 4.00%, 9/1/50 | 875,000 | | 800,404 | |
| Riverside Unified School District Special Tax, (Riverside Unified School District Community Facilities Dist No. 19 Impt Area 1), 5.00%, 9/1/54 | 1,270,000 | | 1,315,302 | |
| Riverside Unified School District Special Tax, (Riverside Unified School District Community Facilities Dist No. 19 Impt Area 2), 5.00%, 9/1/54 | 770,000 | | 797,466 | |
| Riverside Unified School District Special Tax, (Riverside Unified School District Community Facilities District No. 32), 4.00%, 9/1/43 | 1,600,000 | | 1,526,732 | |
| Riverside Unified School District Special Tax, (Riverside Unified School District Community Facilities District No. 32), 4.00%, 9/1/48 | 1,850,000 | | 1,703,615 | |
| Riverside Water Rev., 5.00%, 10/1/47 | 1,000,000 | | 1,106,863 | |
| Riverside Water Rev., 5.00%, 10/1/52 | 1,000,000 | | 1,094,066 | |
| Romoland School District Special Tax, (Romoland School District Community Facilities District No. 2004-1 Area No. 4), 5.00%, 9/1/43 | 3,000,000 | | 3,105,599 | |
| Romoland School District Special Tax, (Romoland School District Community Facilities District No. 2004-1), 5.00%, 9/1/38 | 2,900,000 | | 2,934,737 | |
| Romoland School District Special Tax, (Romoland School District Community Facilities District No. 2020-1), 5.00%, 9/1/49 | 1,000,000 | | 1,056,157 | |
| Romoland School District Special Tax, (Romoland School District-Community Facilities District No. 2017-1 Impt Area 2), 5.00%, 9/1/46 | 370,000 | | 390,555 | |
| Romoland School District Special Tax, (Romoland School District-Community Facilities District No. 2017-1 Impt Area 2), 5.00%, 9/1/54 | 1,525,000 | | 1,587,408 | |
Roseville Special Tax, (City of Roseville CA Amoruso Ranch Community Facilities District 1 Impt Area 1), 5.00%, 9/1/49(3) | 1,125,000 | | 1,170,522 | |
Roseville Special Tax, (City of Roseville CA Amoruso Ranch Community Facilities District 1 Impt Area 1), 5.00%, 9/1/54(3) | 1,600,000 | | 1,662,084 | |
| Roseville Special Tax, (City of Roseville CA Creekview Community Facilities District No. 1 Area No. 1), 5.00%, 9/1/50 | 1,995,000 | | 2,053,931 | |
| Roseville Special Tax, (City of Roseville CA Creekview Community Facilities District No. 1), 5.00%, 9/1/43 | 475,000 | | 499,692 | |
| Roseville Special Tax, (City of Roseville CA Creekview Community Facilities District No. 1), 5.25%, 9/1/53 | 1,500,000 | | 1,575,491 | |
Roseville Special Tax, (City of Roseville CA Fiddyment Ranch Community Facilities District No. 5), 5.00%, 9/1/32(2) | 1,265,000 | | 1,310,645 | |
Roseville Special Tax, (City of Roseville CA Fiddyment Ranch Community Facilities District No. 5), 5.00%, 9/1/47(2) | 6,500,000 | | 6,605,008 | |
| Roseville Special Tax, (City of Roseville CA Ranch at Sierra Vista Community Facilities District No. 1), 4.00%, 9/1/45 | 450,000 | | 416,724 | |
| Roseville Special Tax, (City of Roseville CA Ranch at Sierra Vista Community Facilities District No. 1), 4.00%, 9/1/50 | 1,000,000 | | 895,114 | |
| Roseville Special Tax, (City of Roseville CA Ranch at Sierra Vista Community Facilities District No. 1), 5.00%, 9/1/53 | 1,000,000 | | 1,037,126 | |
| Roseville Special Tax, (City of Roseville CA SVSP Westpark-Federico Community Facilities District No. 1), 4.00%, 9/1/46 | 640,000 | | 593,893 | |
| Roseville Special Tax, (City of Roseville CA SVSP Westpark-Federico Community Facilities District No. 1), 5.00%, 9/1/49 | 1,275,000 | | 1,305,937 | |
| Roseville Special Tax, (City of Roseville CA SVSP Westpark-Federico Community Facilities District No. 1), 4.00%, 9/1/51 | 1,290,000 | | 1,164,900 | |
| Roseville Special Tax, (City of Roseville CA Villages at Sierra Vista Community Facilities District 1), 5.00%, 9/1/39 | 1,390,000 | | 1,439,292 | |
| Roseville Special Tax, (City of Roseville CA Villages at Sierra Vista Community Facilities District 1), 5.00%, 9/1/44 | 3,230,000 | | 3,335,590 | |
| | | | | | | | |
| Principal
Amount/Shares | Value |
| Roseville Special Tax, (City of Roseville CA Villages at Sierra Vista Community Facilities District 1), 4.00%, 9/1/45 | $ | 495,000 | | $ | 447,812 | |
| Roseville Special Tax, (City of Roseville CA Villages at Sierra Vista Community Facilities District 1), 4.00%, 9/1/50 | 650,000 | | 575,584 | |
| Roseville Special Tax, (City of Roseville CA Westbrook Community Facilities District No. 1), 5.00%, 9/1/43 | 2,840,000 | | 2,911,523 | |
| Roseville Special Tax, (City of Roseville CA Westbrook Community Facilities District No. 1), 5.00%, 9/1/44 | 1,650,000 | | 1,650,705 | |
| Roseville Special Tax, (City of Roseville CA Westbrook Community Facilities District No. 1), 5.00%, 9/1/44 | 2,950,000 | | 3,070,662 | |
| Roseville Natural Gas Financing Authority Rev., 5.00%, 2/15/27 (GA: Merrill Lynch & Co.) | 5,000,000 | | 5,178,568 | |
| Sacramento Special Tax, (City of Sacramento CA Greenbriar Community Facs District No. 2018-03 Area No. 1), 4.00%, 9/1/46 | 1,200,000 | | 1,132,742 | |
| Sacramento Special Tax, (City of Sacramento CA Greenbriar Community Facs District No. 2018-03 Area No. 1), 4.00%, 9/1/50 | 1,500,000 | | 1,380,699 | |
| Sacramento Special Tax, (City of Sacramento CA Natomas Central Community Facilities District No. 2006-2), 5.00%, 9/1/41 | 1,900,000 | | 1,936,015 | |
Sacramento Special Tax, (City of Sacramento CA Natomas Meadows Cmnty Facs District No. 2007-1 Area No. 1), 5.00%, 9/1/32(2) | 300,000 | | 309,309 | |
Sacramento Special Tax, (City of Sacramento CA Natomas Meadows Cmnty Facs District No. 2007-1 Area No. 1), 5.00%, 9/1/47(2) | 1,900,000 | | 1,938,169 | |
| Sacramento County Special Tax, (County of Sacramento CA Community Facilities District No. 2004-1), 5.00%, 9/1/30 | 1,170,000 | | 1,206,925 | |
| Sacramento County Special Tax, (County of Sacramento CA Community Facilities District No. 2004-1), 5.00%, 9/1/31 | 1,355,000 | | 1,395,333 | |
| Sacramento County Special Tax, (County of Sacramento CA Community Facilities District No. 2004-1), 5.00%, 9/1/35 | 2,335,000 | | 2,399,845 | |
| Sacramento County Special Tax, (County of Sacramento CA Community Facilities District No. 2004-1), 5.00%, 9/1/40 | 3,000,000 | | 3,070,729 | |
| Sacramento County Special Tax, (County of Sacramento CA Community Facilities District No. 2005-2), 5.00%, 9/1/40 | 2,325,000 | | 2,367,156 | |
| Sacramento County Special Tax, (County of Sacramento CA Community Facilities District No. 2005-2), 5.00%, 9/1/45 | 4,645,000 | | 4,709,113 | |
| Sacramento County Special Tax, (County of Sacramento CA Community Facilities District No. 2014-2), 5.00%, 9/1/46 | 4,200,000 | | 4,254,784 | |
| Sacramento Municipal Utility District Rev., 5.00%, 8/15/53 | 4,000,000 | | 4,443,386 | |
| Sacramento Municipal Utility District Rev., 5.00%, 11/15/54 | 2,000,000 | | 2,233,850 | |
| Salinas Union High School District GO, 4.00%, 8/1/47 | 5,000,000 | | 4,936,450 | |
| San Bernardino Community College District GO, 5.00%, 8/1/49 | 5,000,000 | | 5,446,962 | |
| San Bernardino County Special Tax, (County of San Bernardino CA Community Facilities District No 2006-1 Area No 5), 4.00%, 9/1/42 | 700,000 | | 663,614 | |
| San Bernardino County Special Tax, (County of San Bernardino CA Community Facilities District No 2006-1 Area No 5), 4.00%, 9/1/48 | 1,000,000 | | 907,276 | |
| San Bernardino County Special Tax, (County of San Bernardino CA Community Facilities District No 2006-1 Area No 5), 5.00%, 9/1/48 | 1,200,000 | | 1,232,964 | |
| San Clemente Special Tax, (City of San Clemente CA-Community Facilities District No. 2006-1), 5.00%, 9/1/46 | 7,530,000 | | 7,598,267 | |
| San Diego County COP, 5.00%, 10/1/53 | 4,000,000 | | 4,399,806 | |
| San Diego County Special Tax, (County of San Diego CA Community Facilities District No. 2008-01 Area No. 1), 4.00%, 9/1/43 | 1,255,000 | | 1,191,301 | |
| San Diego County Special Tax, (County of San Diego CA Community Facilities District No. 2008-01 Area No. 1), 4.00%, 9/1/48 | 1,250,000 | | 1,142,551 | |
| San Diego County Regional Airport Authority Rev., 5.00%, 7/1/36 | 3,750,000 | | 4,112,167 | |
| San Diego County Regional Airport Authority Rev., 5.00%, 7/1/39 | 2,000,000 | | 2,173,266 | |
| San Diego County Regional Airport Authority Rev., 5.00%, 7/1/49 | 8,500,000 | | 9,002,252 | |
| San Diego County Regional Airport Authority Rev., (San Diego County Regional Airport Authority Special Facilities Rev.), 5.00%, 7/1/44 | 3,425,000 | | 3,427,196 | |
San Diego Unified School District GO, 5.00%, 7/1/34(3) | 1,000,000 | | 1,184,450 | |
| San Diego Unified School District GO, 4.00%, 7/1/53 | 1,750,000 | | 1,742,892 | |
| San Francisco Bay Area Rapid Transit District GO, 5.25%, 8/1/47 | 4,750,000 | | 5,429,917 | |
| San Francisco City & County Airport Comm-San Francisco International Airport Rev., 5.00%, 5/1/43 | 6,750,000 | | 7,588,077 | |
| San Francisco City & County Airport Comm-San Francisco International Airport Rev., 5.00%, 5/1/49 | 1,000,000 | | 1,111,381 | |
| San Francisco City & County Public Utilities Commission Wastewater Rev., 5.00%, 10/1/54 | 5,000,000 | | 5,536,719 | |
| San Francisco City & County Redevelopment Agency Successor Agency Tax Allocation, (Mission Bay South Redevelopment Area Tax Increment Financing District), 5.00%, 8/1/33 | 780,000 | | 780,585 | |
| San Francisco City & County Redevelopment Successor Agency Tax Allocation, 5.25%, 8/1/53 (AGM) | 1,000,000 | | 1,121,392 | |
| | | | | | | | |
| Principal
Amount/Shares | Value |
| San Francisco Public Utilities Commission Water Rev., 5.25%, 11/1/52 | $ | 7,000,000 | | $ | 7,880,277 | |
| San Joaquin Hills Transportation Corridor Agency Rev., 5.25%, 1/15/44 | 6,000,000 | | 6,029,429 | |
San Joaquin Hills Transportation Corridor Agency Rev., Capital Appreciation, 0.00%, 1/15/25 (NPFG)(1) | 3,090,000 | | 3,052,190 | |
San Joaquin Hills Transportation Corridor Agency Rev., Capital Appreciation, 0.00%, 1/15/29 (NPFG)(1) | 165,000 | | 143,959 | |
San Joaquin Hills Transportation Corridor Agency Rev., Capital Appreciation, 0.00%, 1/15/31 (NPFG)(1) | 16,000,000 | | 12,895,474 | |
San Joaquin Hills Transportation Corridor Agency Rev., Capital Appreciation, 0.00%, 1/15/32 (NPFG)(1) | 290,000 | | 223,864 | |
San Joaquin Hills Transportation Corridor Agency Rev., Capital Appreciation, 0.00%, 1/15/36 (NPFG)(1) | 1,335,000 | | 874,479 | |
| San Luis Obispo Community Facilities District No. 2019-1 Special Tax, 4.00%, 9/1/46 | 550,000 | | 514,018 | |
| San Luis Obispo Community Facilities District No. 2019-1 Special Tax, 4.00%, 9/1/51 | 700,000 | | 634,118 | |
| San Mateo Foster City School District GO, 4.00%, 8/1/51 | 4,000,000 | | 3,972,743 | |
San Rafael City Elementary School District GO, 4.00%, 8/1/54(3) | 2,445,000 | | 2,435,493 | |
| Santa Clara Valley Water District Safe Clean Water Rev., 5.00%, 8/1/47 | 1,500,000 | | 1,659,273 | |
| Saugus/Hart School Facilities Financing Authority Special Tax, (Saugus/Hart School Facilities Financing Authority Community Facs Dist No. 2006-1), 5.00%, 9/1/46 | 2,495,000 | | 2,518,204 | |
| Sierra Joint Community College District GO, 4.00%, 8/1/53 | 4,000,000 | | 3,977,581 | |
Silicon Valley Tobacco Securitization Authority Rev., Capital Appreciation, 0.00%, 6/1/36(1) | 32,000,000 | | 16,849,626 | |
Silicon Valley Tobacco Securitization Authority Rev., Capital Appreciation, 0.00%, 6/1/41(1) | 11,465,000 | | 4,488,318 | |
| Simi Valley Unified School District GO, 5.25%, 8/1/51 | 5,000,000 | | 5,487,306 | |
| South San Francisco Special Tax, (City of South San Francisco CA Community Facilities District No. 2021-01), 4.00%, 9/1/44 | 1,000,000 | | 945,096 | |
| South San Francisco Special Tax, (City of South San Francisco CA Community Facilities District No. 2021-01), 5.00%, 9/1/52 | 2,200,000 | | 2,277,068 | |
| South Tahoe Joint Powers Financing Authority Rev., (City of South Lake Tahoe CA), 5.25%, 10/1/53 | 3,000,000 | | 3,340,114 | |
| Southern California Public Power Authority Rev., 5.00%, 11/1/29 (GA: Goldman Sachs Group, Inc.) | 2,000,000 | | 2,107,290 | |
| Southern California Public Power Authority Rev., 5.00%, 11/1/33 (GA: Goldman Sachs Group, Inc.) | 3,755,000 | | 3,994,688 | |
| Southern California Public Power Authority Rev., (City of Anaheim CA Electric System Rev.), VRN, 5.00%, 4/1/55 (GA: American General Life) | 2,000,000 | | 2,154,134 | |
| Southern California Public Power Authority Rev., (Los Angeles Department of Water & Power Power System Rev.), 5.00%, 7/1/48 | 3,750,000 | | 4,181,371 | |
| Southern California Public Power Authority Rev., (Los Angeles Department of Water & Power), 5.00%, 7/1/53 | 2,000,000 | | 2,227,557 | |
Southern Mono Health Care District GO, Capital Appreciation, 0.00%, 8/1/26 (NPFG)(1) | 1,800,000 | | 1,695,294 | |
| State Center Community College District GO, 5.00%, 8/1/47 | 9,000,000 | | 9,916,350 | |
| State of California GO, 5.25%, 10/1/45 | 1,070,000 | | 1,216,133 | |
| State of California GO, 5.00%, 9/1/53 | 1,000,000 | | 1,105,506 | |
| State of California GO, 5.25%, 9/1/53 | 5,000,000 | | 5,619,438 | |
State of California GO, 5.50%, 8/1/54(3) | 750,000 | | 868,291 | |
| Stockton Community Facilities District Special Tax, (City of Stockton CA Community Facilities District No. 2018-2 Area No. 1), 4.00%, 9/1/45 | 1,115,000 | | 1,019,562 | |
| Stockton Community Facilities District Special Tax, (City of Stockton CA Community Facilities District No. 2018-2 Area No. 1), 4.00%, 9/1/50 | 1,500,000 | | 1,335,693 | |
| Stockton Public Financing Authority Rev., Special Tax, (City of Stockton CA Arch Road East Community Facilities District No. 99-02), 5.00%, 9/1/37 | 2,500,000 | | 2,603,355 | |
| Stockton Public Financing Authority Rev., Special Tax, (City of Stockton CA Arch Road East Community Facilities District No. 99-02), 5.00%, 9/1/43 | 3,000,000 | | 3,089,976 | |
| Sulphur Springs Union School District Special Tax, (Sulphur Springs School District Community Facilities District No. 2006-1), 5.00%, 9/1/47 | 3,640,000 | | 3,713,124 | |
| Sunnyvale Special Tax, (City of Sunnyvale CA Community Facilities District No. 1), 7.75%, 8/1/32 | 5,215,000 | | 5,231,366 | |
| Tejon Ranch Public Facilities Finance Authority Special Tax, (Tejon Ranch Public Facilities Finance Authority Community Facs Dist No. 2008-1), 5.00%, 9/1/45 | 6,000,000 | | 6,050,302 | |
| Tejon Ranch Public Facilities Finance Authority Special Tax, (Tejon Ranch Public Facilities Finance Authority Community Facs Dist No. 2008-1), 4.00%, 9/1/50 | 4,750,000 | | 4,392,739 | |
Temecula Public Financing Authority Special Tax, (Temecula Public Financing Authority-Community Facilities District No. 16-01), Capital Appreciation, 0.00%, 9/1/53(1) | 8,730,000 | | 1,604,484 | |
| Temecula Public Financing Authority Special Tax, (Temecula Public Financing Authority-Community Facilities District No. 20-01), 5.00%, 9/1/49 | 950,000 | | 990,333 | |
| Temecula Public Financing Authority Special Tax, (Temecula Public Financing Authority-Community Facilities District No. 20-01), 5.00%, 9/1/54 | 875,000 | | 906,212 | |
| Temecula Valley Unified School District Community Facilities District Special Tax, (Temecula Valley Unified School District Community Facilities District No. 2014-1), 5.00%, 9/1/43 | 1,000,000 | | 1,029,992 | |
| | | | | | | | |
| Principal
Amount/Shares | Value |
Tobacco Securitization Authority of Northern California Rev., (Sacramento County Tobacco Securitization Corp.), Capital Appreciation, 0.00%, 6/1/60(1) | $ | 5,000,000 | | $ | 840,904 | |
| Tobacco Securitization Authority of Southern California Rev., (San Diego County Tobacco Asset Securitization Corp.), 5.00%, 6/1/48 | 2,570,000 | | 2,606,477 | |
Tobacco Securitization Authority of Southern California Rev., (San Diego County Tobacco Asset Securitization Corp.), Capital Appreciation, 0.00%, 6/1/46(1) | 25,000,000 | | 4,297,455 | |
| Tracy Community Facilities District Special Tax, (City of Tracy CA Community Facilities District No. 2016-01 Improvement Area No. 1), 5.00%, 9/1/43 | 2,750,000 | | 2,819,257 | |
| Tracy Community Facilities District Special Tax, (City of Tracy CA Community Facilities District No. 2016-01 Improvement Area No. 1), 5.00%, 9/1/44 | 3,385,000 | | 3,464,093 | |
| Tracy Community Facilities District Special Tax, (City of Tracy CA Community Facilities District No. 2016-01 Improvement Area No. 1), 5.00%, 9/1/48 | 2,500,000 | | 2,545,686 | |
| Tracy Community Facilities District Special Tax, (City of Tracy CA Community Facilities District No. 2016-01 Improvement Area No. 2), 5.75%, 9/1/48 | 1,900,000 | | 2,053,044 | |
| Tracy Community Facilities District Special Tax, (City of Tracy CA Community Facilities District No. 2016-01 Improvement Area No. 2), 5.875%, 9/1/53 | 2,900,000 | | 3,143,026 | |
| Transbay Joint Powers Authority Tax Allocation, (Transbay Joint Powers Authority Transbay Redevelopment Project Tax Increment), 5.00%, 10/1/45 | 6,390,000 | | 6,599,748 | |
| University of California Rev., 5.00%, 5/15/26 | 7,000,000 | | 7,315,666 | |
| University of California Rev., 5.00%, 5/15/42 | 2,500,000 | | 2,732,399 | |
| University of California Rev., VRDN, 3.45%, 9/3/24 | 950,000 | | 950,000 | |
| University of California Rev., VRDN, 3.65%, 9/3/24 | 500,000 | | 500,000 | |
| Upland COP, (San Antonio Regional Hospital Obligated Group), 4.00%, 1/1/42 | 3,000,000 | | 2,769,202 | |
| Upland COP, (San Antonio Regional Hospital Obligated Group), 5.00%, 1/1/47 | 2,500,000 | | 2,550,624 | |
| Victor Valley Community College District GO, (Victor Valley Community College District), 5.00%, 8/1/51 | 3,670,000 | | 4,028,316 | |
| Vista Unified School District GO, 5.25%, 8/1/48 (BAM) | 4,410,000 | | 4,944,966 | |
| Washington Township Health Care District GO, 5.50%, 8/1/53 | 1,115,000 | | 1,265,044 | |
| Washington Township Health Care District Rev., 5.00%, 7/1/26 | 400,000 | | 404,439 | |
| Washington Township Health Care District Rev., 3.25%, 7/1/27 | 1,000,000 | | 978,183 | |
| Washington Township Health Care District Rev., 3.50%, 7/1/28 | 750,000 | | 742,090 | |
| Washington Township Health Care District Rev., 3.75%, 7/1/29 | 1,000,000 | | 996,019 | |
| Washington Township Health Care District Rev., 5.75%, 7/1/48 | 850,000 | | 934,768 | |
| Washington Township Health Care District Rev., 5.75%, 7/1/53 | 1,000,000 | | 1,086,099 | |
| William S Hart Union High School District Special Tax, (William S Hart Union High School District Cmnty Facs Dist No. 2021-1 Impt Area A), 5.00%, 9/1/49 | 750,000 | | 784,669 | |
| William S Hart Union High School District Special Tax, (William S Hart Union High School District Cmnty Facs Dist No. 2021-1 Impt Area A), 5.00%, 9/1/54 | 885,000 | | 919,358 | |
| William S Hart Union High School District Special Tax, (William S Hart Union High School District Community Facilities Dist No. 2015-1), 5.00%, 9/1/42 | 1,350,000 | | 1,375,062 | |
| William S Hart Union High School District Special Tax, (William S Hart Union High School District Community Facilities Dist No. 2015-1), 5.00%, 9/1/47 | 2,350,000 | | 2,385,245 | |
| Woodland Special Tax, (City of Woodland CA Community Facilities District No. 2004-1), 4.00%, 9/1/41 | 2,535,000 | | 2,455,393 | |
| Woodland Special Tax, (City of Woodland CA Community Facilities District No. 2004-1), 4.00%, 9/1/45 | 2,540,000 | | 2,408,181 | |
| Yorba Linda Water District Public Financing Corp. Rev., 4.00%, 10/1/52 | 3,750,000 | | 3,703,808 | |
| | | 1,532,619,558 | |
| Guam — 0.4% | | |
| Guam Government Waterworks Authority Rev., 5.00%, 7/1/36 | 1,755,000 | | 1,820,221 | |
| Guam Government Waterworks Authority Rev., 5.00%, 7/1/37 | 1,500,000 | | 1,553,886 | |
| Guam Government Waterworks Authority Rev., 5.00%, 1/1/50 | 1,750,000 | | 1,809,410 | |
| Port Authority of Guam Government Rev., 5.00%, 7/1/48 | 1,500,000 | | 1,524,164 | |
| | | 6,707,681 | |
| Puerto Rico — 0.6% | | |
| Puerto Rico GO, 5.375%, 7/1/25 | 1,950,410 | | 1,964,153 | |
| Puerto Rico GO, 5.625%, 7/1/29 | 201,036 | | 216,269 | |
| Puerto Rico GO, 5.75%, 7/1/31 | 195,264 | | 216,353 | |
| Puerto Rico GO, 4.00%, 7/1/33 | 185,162 | | 183,794 | |
| Puerto Rico GO, 4.00%, 7/1/35 | 166,436 | | 164,268 | |
| Puerto Rico GO, 4.00%, 7/1/37 | 142,845 | | 139,750 | |
| | | | | | | | |
| Principal
Amount/Shares | Value |
| Puerto Rico GO, 4.00%, 7/1/41 | $ | 194,215 | | $ | 184,594 | |
| Puerto Rico GO, 4.00%, 7/1/46 | 201,981 | | 187,546 | |
Puerto Rico GO, Capital Appreciation, 0.00%, 7/1/33(1) | 238,285 | | 160,599 | |
| Puerto Rico GO, VRN, 0.00%, 11/1/43 | 820,743 | | 520,146 | |
| Puerto Rico GO, VRN, 0.00%, 11/1/51 | 2,178,660 | | 1,146,520 | |
Puerto Rico Sales Tax Financing Corp. Sales Tax Rev., Capital Appreciation, 0.00%, 7/1/51(1) | 15,000,000 | | 3,681,184 | |
| | | 8,765,176 | |
TOTAL MUNICIPAL SECURITIES (Cost $1,559,504,262) | | 1,548,092,415 | |
AFFILIATED FUNDS(5) — 0.1% | | |
American Century California Municipal Bond ETF
(Cost $2,255,337) | 44,700 | | 2,257,636 | |
TOTAL INVESTMENT SECURITIES — 99.7% (Cost $1,561,759,599) | | 1,550,350,051 | |
| OTHER ASSETS AND LIABILITIES — 0.3% | | 4,137,723 | |
| TOTAL NET ASSETS — 100.0% | | $ | 1,554,487,774 | |
| | | | | | | | | | | | | | |
| FUTURES CONTRACTS PURCHASED |
| Reference Entity | Contracts | Expiration
Date | Notional Amount | Unrealized
Appreciation
(Depreciation)^ |
| U.S. Treasury 2-Year Notes | 183 | December 2024 | $ | 37,981,078 | | $ | (48,966) | |
^Amount represents value and unrealized appreciation (depreciation).
| | | | | | | | | | | | | | |
| FUTURES CONTRACTS SOLD |
| Reference Entity | Contracts | Expiration
Date | Notional Amount | Unrealized
Appreciation
(Depreciation)^ |
| U.S. Treasury 10-Year Ultra Notes | 81 | December 2024 | $ | 9,512,438 | | $ | 58,694 | |
^Amount represents value and unrealized appreciation (depreciation).
| | | | | | | | |
| NOTES TO SCHEDULE OF INVESTMENTS |
| AGC | – | Assured Guaranty Corp. |
| AGM | – | Assured Guaranty Municipal Corp. |
| AMBAC | – | American Municipal Bond Assurance Corp. |
| BAM | – | Build America Mutual Assurance Corp. |
| BAM-TCRS | – | Build America Mutual Assurance Corp. - Transferrable Custodial Receipts |
| COP | – | Certificates of Participation |
| FHLMC | – | Federal Home Loan Mortgage Corp. |
| FNMA | – | Federal National Mortgage Association |
| GA | – | Guaranty Agreement |
| GO | – | General Obligation |
| LOC | – | Letter of Credit |
| MUNIPSA | – | SIFMA Municipal Swap Index |
| NPFG | – | National Public Finance Guarantee Corp. |
| SBBPA | – | Standby Bond Purchase Agreement |
| ST INTERCEPT | – | State Intercept |
| VRDN | – | Variable Rate Demand Note. The instrument may be payable upon demand and adjusts periodically based upon the terms set forth in the security's offering documents. The rate shown is effective at the period end and the reference rate and spread, if any, is indicated. The date of the demand feature is disclosed. |
| VRN | – | Variable Rate Note. The rate adjusts periodically based upon the terms set forth in the security’s offering documents. The rate shown is effective at the period end and the reference rate and spread, if any, is indicated. The security's effective maturity date may be shorter than the final maturity date shown. |
(1)Security is a zero-coupon bond. Zero-coupon securities may be issued at a substantial discount from their value at maturity.
(2)Security was purchased pursuant to Rule 144A or Section 4(2) under the Securities Act of 1933 and may be sold in transactions exempt from registration, normally to qualified institutional investors. The aggregate value of these securities at the period end was $312,816,003, which represented 20.1% of total net assets.
(3)When-issued security. The issue price and yield are fixed on the date of the commitment, but payment and delivery are scheduled for a future date.
(4)Escrowed to maturity in U.S. government securities or state and local government securities.
(5)Investments are funds within the American Century Investments family of funds and are considered affiliated funds.
See Notes to Financial Statements.
| | |
| Statement of Assets and Liabilities |
| | | | | |
| AUGUST 31, 2024 | |
| Assets | |
| Investment securities - unaffiliated, at value (cost of $1,559,504,262) | $ | 1,548,092,415 | |
| Investment securities - affiliated, at value (cost of $2,255,337) | 2,257,636 | |
| Total investment securities, at value (cost of $1,561,759,599) | 1,550,350,051 | |
| Cash | 41,993 | |
| Deposits with broker for futures contracts | 236,525 | |
| Receivable for investments sold | 2,700,304 | |
| Receivable for capital shares sold | 1,567,068 | |
| Receivable for variation margin on futures contracts | 3,985 | |
| Interest receivable | 20,644,900 | |
| 1,575,544,826 | |
| |
| Liabilities | |
| Payable for investments purchased | 17,736,158 | |
| Payable for capital shares redeemed | 2,378,135 | |
| Accrued management fees | 504,229 | |
| Distribution and service fees payable | 23,951 | |
| Dividends payable | 414,579 | |
| 21,057,052 | |
| |
| Net Assets | $ | 1,554,487,774 | |
| |
| Net Assets Consist of: | |
| Capital paid in | $ | 1,660,222,191 | |
| Distributable earnings (loss) | (105,734,417) | |
| $ | 1,554,487,774 | |
| | | | | | | | | | | |
| Net Assets | Shares Outstanding | Net Asset Value Per Share* |
| Investor Class | $733,179,224 | 74,106,655 | $9.89 |
| I Class | $723,661,347 | 73,185,545 | $9.89 |
| Y Class | $34,607,708 | 3,499,147 | $9.89 |
| A Class | $46,882,536 | 4,738,669 | $9.89 |
| C Class | $16,156,959 | 1,632,850 | $9.89 |
*Maximum offering price per share was equal to the net asset value per share for all share classes, except A Class, for which the maximum offering price per share was $10.36 (net asset value divided by 0.955). A contingent deferred sales charge may be imposed on redemptions of A Class and C Class.
See Notes to Financial Statements.
| | | | | |
| YEAR ENDED AUGUST 31, 2024 |
| Investment Income (Loss) |
| Income: | |
| Interest | $ | 60,033,350 | |
| |
| Expenses: | |
| Management fees | 5,486,931 | |
| Distribution and service fees: | |
| A Class | 120,622 | |
| C Class | 154,419 | |
| Trustees' fees and expenses | 99,629 | |
| Other expenses | 36,402 | |
| 5,898,003 | |
Fees waived(1) | (348) | |
| 5,897,655 | |
| |
| Net investment income (loss) | 54,135,695 | |
| |
| Realized and Unrealized Gain (Loss) |
| Net realized gain (loss) on: | |
| Investment transactions | (14,527,163) | |
| Futures contract transactions | (382,328) | |
| (14,909,491) | |
| |
| Change in net unrealized appreciation (depreciation) on: | |
| Investments (including $2,299 from affiliated funds) | 74,656,057 | |
| Futures contracts | (757,015) | |
| 73,899,042 | |
| |
| Net realized and unrealized gain (loss) | 58,989,551 | |
| |
| Net Increase (Decrease) in Net Assets Resulting from Operations | $ | 113,125,246 | |
(1)Amount consists of $165, $162, $6, $11 and $4 for Investor Class, I Class, Y Class, A Class and C Class, respectively.
See Notes to Financial Statements.
| | |
| Statement of Changes in Net Assets |
| | | | | | | | |
| YEARS ENDED AUGUST 31, 2024 AND AUGUST 31, 2023 |
| Increase (Decrease) in Net Assets | August 31, 2024 | August 31, 2023 |
| Operations | | |
| Net investment income (loss) | $ | 54,135,695 | | $ | 52,336,779 | |
| Net realized gain (loss) | (14,909,491) | | (36,434,861) | |
| Change in net unrealized appreciation (depreciation) | 73,899,042 | | (15,446,907) | |
| Net increase (decrease) in net assets resulting from operations | 113,125,246 | | 455,011 | |
| | |
| Distributions to Shareholders | | |
| From earnings: | | |
| Investor Class | (26,354,255) | | (25,651,612) | |
| I Class | (25,711,599) | | (24,218,258) | |
| Y Class | (215,677) | | (178,118) | |
| A Class | (1,741,538) | | (1,859,487) | |
| C Class | (440,812) | | (429,783) | |
| Decrease in net assets from distributions | (54,463,881) | | (52,337,258) | |
| | |
| Capital Share Transactions | | |
| Net increase (decrease) in net assets from capital share transactions (Note 5) | 124,143,157 | | (66,642,119) | |
| | |
| Net increase (decrease) in net assets | 182,804,522 | | (118,524,366) | |
| | |
| Net Assets | | |
| Beginning of period | 1,371,683,252 | | 1,490,207,618 | |
| End of period | $ | 1,554,487,774 | | $ | 1,371,683,252 | |
See Notes to Financial Statements.
| | |
| Notes to Financial Statements |
AUGUST 31, 2024
1. Organization
American Century California Tax-Free and Municipal Funds (the trust) is registered under the Investment Company Act of 1940, as amended (the 1940 Act), as an open-end management investment company and is organized as a Massachusetts business trust. California High-Yield Municipal Fund (the fund) is one fund in a series issued by the trust. The fund’s investment objective is to seek high current income that is exempt from federal and California income taxes.
The fund offers the Investor Class, I Class, Y Class, A Class and C Class. The A Class may incur an initial sales charge. The A Class and C Class may be subject to a contingent deferred sales charge.
2. Significant Accounting Policies
The following is a summary of significant accounting policies consistently followed by the fund in preparation of its financial statements. The fund is an investment company and follows accounting and reporting guidance in accordance with accounting principles generally accepted in the United States of America. This may require management to make certain estimates and assumptions at the date of the financial statements. Actual results could differ from these estimates. Management evaluated the impact of events or transactions occurring through the date the financial statements were issued that would merit recognition or disclosure.
Investment Valuations — The fund determines the fair value of its investments and computes its net asset value (NAV) per share at the close of regular trading (usually 4 p.m. Eastern time) on the New York Stock Exchange (NYSE) on each day the NYSE is open. The value of investments of the fund is determined by American Century Investment Management, Inc. (ACIM) (the investment advisor), as the valuation designee, pursuant to its valuation policies and procedures. The Board of Trustees oversees the valuation designee and reviews its valuation policies and procedures at least annually.
Fixed income securities are valued at the evaluated mean as provided by independent pricing services or at the mean of the most recent bid and asked prices as provided by investment dealers. Municipal securities are valued using market models that consider trade data, quotations from dealers and active market makers, relevant yield curve and spread data, creditworthiness, trade data or market information on comparable securities, and other relevant security specific information.
Equity securities that are listed or traded on a domestic securities exchange are valued at the last reported sales price or at the official closing price as provided by the exchange. Equity securities traded on foreign securities exchanges are generally valued at the closing price of such securities on the exchange where primarily traded or at the close of the NYSE, if that is earlier. If no last sales price is reported, or if local convention or regulation so provides, the mean of the latest bid and asked prices may be used. Securities traded over-the-counter are valued at the mean of the latest bid and asked prices, the last sales price, or the official closing price.
Exchange-traded futures contracts are valued at the settlement price as provided by the appropriate exchange.
If the valuation designee determines that the market price for a portfolio security is not readily available or is believed by the valuation designee to be unreliable, such security is valued at fair value as determined in good faith by the valuation designee, in accordance with its policies and procedures. Circumstances that may cause the fund to determine that market quotations are not available or reliable include, but are not limited to: when there is a significant event subsequent to the market quotation; trading in a security has been halted during the trading day; or trading in a security is insufficient or did not take place due to a closure or holiday.
The valuation designee monitors for significant events occurring after the close of an investment’s primary exchange but before the fund’s NAV per share is determined. Significant events may include, but are not limited to: corporate announcements and transactions; regulatory news, governmental action and political unrest that could impact a specific investment or an investment sector; or armed conflicts, natural disasters and similar events that could affect investments in a specific country or region. The valuation designee also monitors for significant fluctuations between domestic and foreign markets, as evidenced by the U.S. market or such other indicators that it deems appropriate. The valuation designee may apply a model-derived factor to the closing price of equity securities traded on foreign securities exchanges. The factor is based on observable market data as provided by an independent pricing service.
Security Transactions — Security transactions are accounted for as of the trade date. Net realized gains and losses are determined on the identified cost basis, which is also used for federal income tax purposes.
Investment Income — Interest income is recorded on the accrual basis and includes paydown gain (loss) and accretion of discounts and amortization of premiums.
Income Tax Status — It is the fund's policy to distribute substantially all net investment income and net realized gains to shareholders and to otherwise qualify as a regulated investment company under provisions of the Internal Revenue Code. Accordingly, no provision has been made for income taxes. The fund files U.S. federal, state, local and non-U.S. tax returns as applicable. The fund's tax returns are subject to examination by the relevant taxing authority until expiration of the applicable statute of limitations, which is generally three years from the date of filing but can be longer in certain jurisdictions. At this time, management believes there are no uncertain tax positions which, based on their technical merit, would not be sustained upon examination and for which it is reasonably possible that the total amounts of unrecognized tax benefits will significantly change in the next twelve months.
Multiple Class — All shares of the fund represent an equal pro rata interest in the net assets of the class to which such shares belong, and have identical voting, dividend, liquidation and other rights and the same terms and conditions, except for class specific expenses and exclusive rights to vote on matters affecting only individual classes. Income, non-class specific expenses, and realized and unrealized capital gains and losses of the fund are allocated to each class of shares based on their relative net assets.
Distributions to Shareholders — Distributions from net investment income, if any, are declared daily and paid monthly. Distributions from net realized gains, if any, are generally declared and paid annually.
Indemnifications — Under the trust’s organizational documents, its officers and trustees are indemnified against certain liabilities arising out of the performance of their duties to the fund. In addition, in the normal course of business, the fund enters into contracts that provide general indemnifications. The maximum exposure under these arrangements is unknown as this would involve future claims that may be made against a fund. The risk of material loss from such claims is considered by management to be remote.
3. Fees and Transactions with Related Parties
Certain officers and trustees of the trust are also officers and/or directors of American Century Companies, Inc. (ACC). The trust's investment advisor, ACIM, the trust's distributor, American Century Investment Services, Inc. (ACIS), and the trust's transfer agent, American Century Services, LLC, are wholly owned, directly or indirectly, by ACC. ACIM serves as the investment advisor for the affiliated funds.
Management Fees — The trust has entered into a management agreement with ACIM, under which ACIM provides the fund with investment advisory and management services in exchange for a single, unified management fee (the fee) per class. The agreement provides that ACIM will pay all expenses of managing and operating the fund, except brokerage expenses, taxes, interest, fees and expenses of the independent trustees (including legal counsel fees), extraordinary expenses, and expenses incurred in connection with the provision of shareholder services and distribution services under a plan adopted pursuant to Rule 12b-1 under the 1940 Act. The fee is computed and accrued daily based on each class’s daily net assets and paid monthly in arrears. The difference in the fee among the classes is a result of their separate arrangements for non-Rule 12b-1 shareholder services. It is not the result of any difference in advisory or custodial fees or other expenses related to the management of the fund's assets, which do not vary by class. The fee consists of (1) an Investment Category Fee based on the daily net assets of the fund and certain other accounts managed by the investment advisor that are in the same broad investment category as the fund and (2) a Complex Fee based on the assets of all funds in the American Century Investments family of funds that have the same investment advisor and distributor as the fund. For purposes of determining the Investment Category Fee and Complex Fee, the assets of funds managed by the investment advisor that invest exclusively in the shares of other funds (funds of funds) are not included. The investment advisor will waive the portion of the fund's management fee equal to the expenses attributable to the management fees of the American Century Investments funds in which the fund invests. The amount of this waiver will fluctuate depending on the fund's daily allocation to other American Century Investments funds. This waiver is expected to remain in effect permanently and it cannot be terminated without the approval of the Board of Trustees. The impact of this waiver to the ratio of operating expenses to average net assets was less than 0.005% for each class for the period ending August 31, 2024.
The Investment Category Fee range, the Complex Fee range and the effective annual management fee for each class for the period ended August 31, 2024 are as follows:
| | | | | | | | | | | |
| Investment Category Fee Range | Complex Fee Range | Effective Annual Management Fee |
| Investor Class | 0.1925% to 0.3100% | 0.2500% to 0.3100% | 0.49% |
| I Class | 0.0500% to 0.1100% | 0.29% |
| Y Class | 0.0200% to 0.0800% | 0.26% |
| A Class | 0.2500% to 0.3100% | 0.49% |
| C Class | 0.2500% to 0.3100% | 0.49% |
Distribution and Service Fees — The Board of Trustees has adopted a separate Master Distribution and Individual Shareholder Services Plan for each of the A Class and C Class (collectively the plans), pursuant to Rule 12b-1 of the 1940 Act. The plans provide that the A Class will pay ACIS an annual distribution and service fee of 0.25%. The plans provide that the C Class will pay ACIS an annual distribution and service fee of 1.00%, of which 0.25% is paid for individual shareholder services and 0.75% is paid for distribution services. The fees are computed and accrued daily based on each class’s daily net assets and paid monthly in arrears. The fees are used to pay financial intermediaries for distribution and individual shareholder services. Fees incurred under the plans during the period ended August 31, 2024 are detailed in the Statement of Operations.
Trustees' Fees and Expenses — The Board of Trustees is responsible for overseeing the investment advisor’s management and operations of the fund. The trustees receive detailed information about the fund and its investment advisor regularly throughout the year, and meet at least quarterly with management of the investment advisor to review reports about fund operations. The fund's officers do not receive compensation from the fund.
Other Expenses — A fund’s other expenses may include interest charges, clearing exchange fees, proxy solicitation expenses, fees associated with the recovery of foreign tax reclaims and other miscellaneous expenses.
Interfund Transactions — The fund may enter into security transactions with other American Century Investments funds and other client accounts of the investment advisor, in accordance with the 1940 Act rules and procedures adopted by the Board of Trustees. The rules and procedures require, among other things, that these transactions be effected at the independent current market price of the security. During the period, the interfund purchases and sales were $15,140,000 and $26,275,000, respectively. The interfund transactions had no effect on the Statement of Operations in net realized gain (loss) on investment transactions.
4. Investment Transactions
Purchases and sales of investment securities, excluding short-term investments, for the period ended August 31, 2024 were $920,491,689 and $778,458,669, respectively.
5. Capital Share Transactions
Transactions in shares of the fund were as follows (unlimited number of shares authorized):
| | | | | | | | | | | | | | |
| Year ended
August 31, 2024 | Year ended
August 31, 2023 |
| Shares | Amount | Shares | Amount |
| Investor Class | | | | |
| Sold | 15,880,819 | | $ | 153,351,863 | | 11,935,326 | | $ | 114,651,603 | |
| Issued in reinvestment of distributions | 2,491,392 | | 23,960,521 | | 2,433,880 | | 23,231,332 | |
| Redeemed | (14,990,481) | | (143,232,356) | | (19,685,029) | | (188,022,619) | |
| 3,381,730 | | 34,080,028 | | (5,315,823) | | (50,139,684) | |
| I Class | | | | |
| Sold | 34,127,262 | | 327,687,693 | | 51,479,048 | | 493,265,517 | |
| Issued in reinvestment of distributions | 2,475,761 | | 23,799,705 | | 2,295,518 | | 21,904,126 | |
| Redeemed | (30,311,607) | | (285,324,537) | | (54,980,934) | | (524,898,071) | |
| 6,291,416 | | 66,162,861 | | (1,206,368) | | (9,728,428) | |
| Y Class | | | | |
| Sold | 3,241,971 | | 31,947,919 | | 157,390 | | 1,516,965 | |
| Issued in reinvestment of distributions | 22,082 | | 213,962 | | 17,889 | | 170,808 | |
| Redeemed | (199,333) | | (1,890,768) | | (148,983) | | (1,411,842) | |
| 3,064,720 | | 30,271,113 | | 26,296 | | 275,931 | |
| A Class | | | | |
| Sold | 1,163,695 | | 11,241,024 | | 1,451,160 | | 14,094,800 | |
| Issued in reinvestment of distributions | 139,893 | | 1,343,371 | | 143,946 | | 1,373,905 | |
| Redeemed | (1,957,373) | | (18,997,273) | | (2,283,903) | | (21,933,498) | |
| (653,785) | | (6,412,878) | | (688,797) | | (6,464,793) | |
| C Class | | | | |
| Sold | 304,584 | | 2,963,756 | | 333,356 | | 3,218,000 | |
| Issued in reinvestment of distributions | 44,171 | | 424,592 | | 43,341 | | 414,010 | |
| Redeemed | (345,430) | | (3,346,315) | | (439,756) | | (4,217,155) | |
| 3,325 | | 42,033 | | (63,059) | | (585,145) | |
| Net increase (decrease) | 12,087,406 | | $ | 124,143,157 | | (7,247,751) | | $ | (66,642,119) | |
6. Affiliated Fund Transactions
A summary of transactions for each affiliated fund for the period ended August 31, 2024 follows (amounts in thousands):
| | | | | | | | | | | | | | | | | | | | | | | | | | |
Affiliated Fund(1) | Beginning
Value | Purchase
Cost | Sales
Cost | Change in Net Unrealized Appreciation (Depreciation) | Ending
Value | Ending
Shares | Net
Realized
Gain
(Loss) | Distributions Received(2) |
| American Century California Municipal Bond ETF | — | | $ | 2,256 | | — | | $ | 2 | | $ | 2,258 | | 45 | | — | | — | |
(1)Investments are funds within the American Century Investments family of funds and are considered affiliated funds. Additional information and attributes of each affiliated fund are available at americancentury.com.
(2)Distributions received includes distributions from net investment income and from capital gains, if any.
7. Investments in Affiliated Funds
The fund does not invest in an affiliated fund for the purpose of exercising management or control; however, investments by the fund within its investment strategy may represent a significant portion of an affiliated fund's net assets.
8. Fair Value Measurements
The fund's investments valuation process is based on several considerations and may use multiple inputs to determine the fair value of the investments held by the fund. In conformity with accounting principles generally accepted in the United States of America, the inputs used to determine a valuation are classified into three broad levels.
•Level 1 valuation inputs consist of unadjusted quoted prices in an active market for identical investments.
•Level 2 valuation inputs consist of direct or indirect observable market data (including quoted prices for comparable investments, evaluations of subsequent market events, interest rates, prepayment speeds, credit risk, etc.). These inputs also consist of quoted prices for identical investments initially expressed in local currencies that are adjusted through translation into U.S. dollars.
•Level 3 valuation inputs consist of unobservable data (including a fund’s own assumptions).
The level classification is based on the lowest level input that is significant to the fair valuation measurement. The valuation inputs are not necessarily an indication of the risks associated with investing in these securities or other financial instruments.
The following is a summary of the level classifications as of period end. The Schedule of Investments provides additional information on the fund's portfolio holdings.
| | | | | | | | | | | |
| Level 1 | Level 2 | Level 3 |
| Assets | | | |
| Investment Securities | | | |
| Municipal Securities | — | | $ | 1,548,092,415 | | — | |
| Affiliated Funds | $ | 2,257,636 | | — | | — | |
| $ | 2,257,636 | | $ | 1,548,092,415 | | — | |
| Other Financial Instruments | | | |
| Futures Contracts | $ | 58,694 | | — | | — | |
| | | |
| Liabilities | | | |
| Other Financial Instruments | | | |
| Futures Contracts | $ | 48,966 | | — | | — | |
9. Derivative Instruments
Interest Rate Risk — The fund is subject to interest rate risk in the normal course of pursuing its investment objectives. The value of bonds generally declines as interest rates rise. A fund may enter into futures contracts based on a bond index or a specific underlying security. A fund may purchase futures contracts to gain exposure to increases in market value or sell futures contracts to protect against a decline in market value. Upon entering into a futures contract, a fund will segregate cash, cash equivalents or other appropriate liquid securities on its records in amounts sufficient to meet requirements. A fund may incur charges or earn income on cash deposit balances, which are reflected in interest expenses or interest income, respectively. Subsequent payments (variation margin) are made or received daily, in cash, by a fund. The variation margin is equal to the daily change in the contract value and is recorded as unrealized gains and losses. A fund recognizes a realized gain or loss when the futures contract is closed or expires. Net realized and unrealized gains or losses occurring during the holding period of futures contracts are a component of net realized gain (loss) on futures contract transactions and change in net unrealized appreciation (depreciation) on futures contracts, respectively. One of the risks of entering into futures contracts is the possibility that the change in value of the contract may not correlate with the changes in value of the underlying securities. The fund's average notional exposure to interest rate risk derivative instruments held during the period was $24,092,209 futures contracts purchased and $9,494,922 futures contracts sold.
The value of interest rate risk derivative instruments as of August 31, 2024, is disclosed on the Statement of Assets and Liabilities as an asset of $3,985 in receivable for variation margin on futures contracts.* For the year ended August 31, 2024, the effect of interest rate risk derivative instruments on the Statement of Operations was $(382,328) in net realized gain (loss) on futures contract transactions and $(757,015) in change in net unrealized appreciation (depreciation) on futures contracts.
*Included in the unrealized appreciation (depreciation) on futures contracts as reported in the Schedule of Investments.
10. Risk Factors
The value of the fund’s shares will go up and down, sometimes rapidly or unpredictably, based on the performance of the securities owned by the fund and other factors generally affecting the securities market. Market risks, including political, regulatory, economic and social developments, can affect the value of the fund’s investments. Natural disasters, public health emergencies, war, terrorism and other unforeseeable events may lead to increased market volatility and may have adverse long-term effects on world economies and markets generally.
The fund focuses its investments in a single state and therefore may have more exposure to credit risk related to the state of California than a fund with a broader geographical diversification. The fund invests in lower-rated debt securities, which are subject to substantial risks including liquidity risk and credit risk.
11. Federal Tax Information
The tax character of distributions paid during the years ended August 31, 2024 and August 31, 2023 were as follows:
| | | | | | | | |
| 2024 | 2023 |
| Distributions Paid From | | |
| Exempt income | $ | 54,463,881 | | $ | 52,337,258 | |
| Long-term capital gains | — | | — | |
The book-basis character of distributions made during the year from net investment income or net realized gains may differ from their ultimate characterization for federal income tax purposes. These differences reflect the differing character of certain income items and net realized gains and losses for financial statement and tax purposes, and may result in reclassification among certain capital accounts on the financial statements.
As of period end, the federal tax cost of investments and the components of distributable earnings on a tax-basis were as follows:
| | | | | |
| Federal tax cost of investments | $ | 1,561,988,206 | |
| Gross tax appreciation of investments | $ | 32,225,465 | |
| Gross tax depreciation of investments | (43,863,620) | |
| Net tax appreciation (depreciation) of investments | (11,638,155) | |
| Net tax appreciation (depreciation) on derivatives | — | |
| Net tax appreciation (depreciation) | $ | (11,638,155) | |
| Other book-to-tax adjustments | $ | (278,628) | |
| Undistributed exempt income | — | |
| Accumulated short-term capital losses | $ | (52,066,461) | |
| Accumulated long-term capital losses | $ | (41,751,173) | |
The difference between book-basis and tax-basis unrealized appreciation (depreciation) is attributable primarily to the tax deferral of losses on wash sales.
Accumulated capital losses represent net capital loss carryovers that may be used to offset future realized capital gains for federal income tax purposes. The capital loss carryovers may be carried forward for an unlimited period. Future capital loss carryover utilization in any given year may be subject to Internal Revenue Code limitations.
| | | | | | | | | | | | | | | | | | | | | | | | | | | | | | | | | | | | | | | | | |
| For a Share Outstanding Throughout the Years Ended August 31 (except as noted) |
| Per-Share Data | Ratios and Supplemental Data |
| | Income From Investment Operations*: | | | Ratio to Average Net Assets of†: | | |
| Net Asset
Value,
Beginning
of Period | Net Investment Income (Loss)(1) | Net
Realized and Unrealized
Gain (Loss) | Total
From Investment Operations | Distributions From Net Investment Income | Net Asset
Value, End
of Period | Total Return(2) | Operating Expenses | Operating
Expenses
(before expense waiver) | Net
Investment Income
(Loss) | Net
Investment
Income
(Loss)
(before expense waiver) | Portfolio Turnover
Rate | Net Assets,
End of Period
(in thousands) |
| Investor Class | | | | | | | | | | | | |
| 2024 | $9.46 | 0.37 | 0.43 | 0.80 | (0.37) | $9.89 | 8.75% | 0.50% | 0.50% | 3.84% | 3.84% | 56% | $733,179 | |
| 2023 | $9.79 | 0.35 | (0.33) | 0.02 | (0.35) | $9.46 | 0.25% | 0.50% | 0.50% | 3.67% | 3.67% | 73% | $668,857 | |
| 2022 | $11.30 | 0.31 | (1.51) | (1.20) | (0.31) | $9.79 | (10.74)% | 0.49% | 0.49% | 2.96% | 2.96% | 73% | $744,087 | |
| 2021 | $10.86 | 0.32 | 0.44 | 0.76 | (0.32) | $11.30 | 7.12% | 0.49% | 0.49% | 2.91% | 2.91% | 25% | $941,838 | |
| 2020 | $11.10 | 0.34 | (0.24) | 0.10 | (0.34) | $10.86 | 0.96% | 0.50% | 0.50% | 3.15% | 3.15% | 57% | $860,867 | |
| I Class | | | | | | | | | | | | | |
| 2024 | $9.45 | 0.39 | 0.44 | 0.83 | (0.39) | $9.89 | 8.97% | 0.30% | 0.30% | 4.04% | 4.04% | 56% | $723,661 | |
| 2023 | $9.78 | 0.37 | (0.33) | 0.04 | (0.37) | $9.45 | 0.44% | 0.30% | 0.30% | 3.87% | 3.87% | 73% | $632,307 | |
| 2022 | $11.29 | 0.33 | (1.51) | (1.18) | (0.33) | $9.78 | (10.57)% | 0.29% | 0.29% | 3.16% | 3.16% | 73% | $666,056 | |
| 2021 | $10.86 | 0.34 | 0.44 | 0.78 | (0.35) | $11.29 | 7.24% | 0.29% | 0.29% | 3.11% | 3.11% | 25% | $724,407 | |
| 2020 | $11.10 | 0.36 | (0.24) | 0.12 | (0.36) | $10.86 | 1.17% | 0.30% | 0.30% | 3.35% | 3.35% | 57% | $518,250 | |
| Y Class | | | | | | | | | | | |
| 2024 | $9.46 | 0.39 | 0.43 | 0.82 | (0.39) | $9.89 | 8.89% | 0.27% | 0.27% | 4.07% | 4.07% | 56% | $34,608 | |
| 2023 | $9.78 | 0.37 | (0.32) | 0.05 | (0.37) | $9.46 | 0.58% | 0.27% | 0.27% | 3.90% | 3.90% | 73% | $4,108 | |
| 2022 | $11.29 | 0.34 | (1.51) | (1.17) | (0.34) | $9.78 | (10.54)% | 0.26% | 0.26% | 3.19% | 3.19% | 73% | $3,993 | |
| 2021 | $10.86 | 0.35 | 0.43 | 0.78 | (0.35) | $11.29 | 7.28% | 0.26% | 0.26% | 3.14% | 3.14% | 25% | $6 | |
| 2020 | $11.10 | 0.37 | (0.24) | 0.13 | (0.37) | $10.86 | 1.21% | 0.27% | 0.27% | 3.38% | 3.38% | 57% | $56 | |
| A Class | | | | | | | | | | | | | |
| 2024 | $9.46 | 0.35 | 0.43 | 0.78 | (0.35) | $9.89 | 8.48% | 0.75% | 0.75% | 3.59% | 3.59% | 56% | $46,883 | |
| 2023 | $9.79 | 0.33 | (0.33) | — | (0.33) | $9.46 | 0.00% | 0.75% | 0.75% | 3.42% | 3.42% | 73% | $50,999 | |
| 2022 | $11.30 | 0.29 | (1.51) | (1.22) | (0.29) | $9.79 | (10.96)% | 0.74% | 0.74% | 2.71% | 2.71% | 73% | $59,508 | |
| 2021 | $10.86 | 0.30 | 0.44 | 0.74 | (0.30) | $11.30 | 6.86% | 0.74% | 0.74% | 2.66% | 2.66% | 25% | $65,969 | |
| 2020 | $11.10 | 0.31 | (0.24) | 0.07 | (0.31) | $10.86 | 0.71% | 0.75% | 0.75% | 2.90% | 2.90% | 57% | $58,148 | |
| C Class | | | | | | | | | | | | | |
| 2024 | $9.46 | 0.27 | 0.43 | 0.70 | (0.27) | $9.89 | 7.67% | 1.50% | 1.50% | 2.84% | 2.84% | 56% | $16,157 | |
| 2023 | $9.79 | 0.26 | (0.33) | (0.07) | (0.26) | $9.46 | (0.75)% | 1.50% | 1.50% | 2.67% | 2.67% | 73% | $15,412 | |
| 2022 | $11.30 | 0.21 | (1.51) | (1.30) | (0.21) | $9.79 | (11.63)% | 1.49% | 1.49% | 1.96% | 1.96% | 73% | $16,564 | |
| 2021 | $10.86 | 0.21 | 0.44 | 0.65 | (0.21) | $11.30 | 6.06% | 1.49% | 1.49% | 1.91% | 1.91% | 25% | $22,196 | |
| 2020 | $11.10 | 0.23 | (0.24) | (0.01) | (0.23) | $10.86 | (0.04)% | 1.50% | 1.50% | 2.15% | 2.15% | 57% | $24,391 | |
| | |
| Notes to Financial Highlights |
(1)Computed using average shares outstanding throughout the period.
(2)Total returns are calculated based on the net asset value of the last business day and do not reflect applicable sales charges, if any. Total returns for periods less than one year are not annualized.
* The amount shown for a share outstanding throughout the period may not correlate with the Statement(s) of Operations or precisely reflect the class expense differentials due to the timing of transactions in shares of a fund in relation to income earned and/or fluctuations in the fair value of a fund's investments.
† Ratios for periods less than one year are annualized. Zero balances may reflect amounts less than 0.005%.
See Notes to Financial Statements.
| | |
| Report of Independent Registered Public Accounting Firm |
To the shareholders of the California High-Yield Municipal Fund and the Board of Trustees of American Century California Tax-Free and Municipal Funds:
Opinion on the Financial Statements and Financial Highlights
We have audited the accompanying statement of assets and liabilities, including the schedule of investments, of California High-Yield Municipal Fund (the “Fund”), one of the funds constituting the American Century California Tax-Free and Municipal Funds, as of August 31, 2024, the related statement of operations for the year then ended, the statements of changes in net assets for each of the two years in the period then ended, the financial highlights for each of the three years in the period then ended, and the related notes. In our opinion, the financial statements and financial highlights present fairly, in all material respects, the financial position of the Fund, as of August 31, 2024, and the results of its operations for the year then ended, the changes in its net assets for each of the two years in the period then ended, and the financial highlights for each of the three years in the period then ended, in conformity with accounting principles generally accepted in the United States of America. The financial highlights for each of the two years in the period ended August 31, 2021, were audited by other auditors, whose report, dated October 18, 2021, expressed an unqualified opinion on such financial highlights.
Basis for Opinion
These financial statements and financial highlights are the responsibility of the Fund's management. Our responsibility is to express an opinion on the Fund’s financial statements and financial highlights based on our audits. We are a public accounting firm registered with the Public Company Accounting Oversight Board (United States) (PCAOB) and are required to be independent with respect to the Fund in accordance with the U.S. federal securities laws and the applicable rules and regulations of the Securities and Exchange Commission and the PCAOB.
We conducted our audits in accordance with the standards of the PCAOB. Those standards require that we plan and perform the audit to obtain reasonable assurance about whether the financial statements and financial highlights are free of material misstatement, whether due to error or fraud. The Fund is not required to have, nor were we engaged to perform, an audit of its internal control over financial reporting. As part of our audits, we are required to obtain an understanding of internal control over financial reporting but not for the purpose of expressing an opinion on the effectiveness of the Fund’s internal control over financial reporting. Accordingly, we express no such opinion.
Our audits included performing procedures to assess the risks of material misstatement of the financial statements and financial highlights, whether due to error or fraud, and performing procedures that respond to those risks. Such procedures included examining, on a test basis, evidence regarding the amounts and disclosures in the financial statements and financial highlights. Our audits also included evaluating the accounting principles used and significant estimates made by management, as well as evaluating the overall presentation of the financial statements and financial highlights. Our procedures included confirmation of securities owned as of August 31, 2024, by correspondence with the custodian and brokers; when replies were not received from brokers, we performed other auditing procedures. We believe that our audits provide a reasonable basis for our opinion.
/s/ Deloitte & Touche LLP
Kansas City, Missouri
October 16, 2024
We have served as the auditor of one or more American Century investment companies since 1997.
| | |
| Approval of Management Agreement |
At a meeting held on June 13, 2024, the Fund’s Board of Trustees (the “Board”) unanimously approved the renewal of the management agreement pursuant to which American Century Investment Management, Inc. (the “Advisor”) acts as the investment advisor for the Fund. Under the Investment Company Act of 1940 (the “Investment Company Act”), contracts for investment advisory services are required to be reviewed, evaluated, and approved by a majority of a fund’s Trustees, including a majority of the independent Trustees. The Board regards this annual evaluation and renewal as one of its most important responsibilities.
The independent Trustees have memorialized a statement regarding the relationship between their ongoing obligations to oversee and evaluate the performance of the Advisor and their annual consideration of renewal of the management agreement. In that statement, the independent Trustees noted that their assessment of the Advisor’s performance is an ongoing process that takes place over the entire year and is informed by all of the extensive information that the Board and its committees receive and consider over time. This information, together with the additional materials provided specifically in connection with the review, are central to the Board’s assessment of the Advisor’s performance and its determination whether to renew the Fund’s management agreement.
Prior to its consideration of the renewal of the management agreement, the Board requested and reviewed data and analysis relating to the proposed renewal. This information and analysis was compiled by the Advisor and certain independent data providers concerning the Fund.
In connection with its consideration of the renewal of the management agreement, the Board’s review and evaluation of the services provided by the Advisor and its affiliates included, but was not limited to
•the nature, extent, and quality of investment management, shareholder services, distribution services, and other services provided to the Fund;
•the wide range of programs and services the Advisor and other service providers provide to the Fund and its shareholders on a routine and non-routine basis;
•the Fund’s investment performance compared to appropriate benchmarks and/or peer groups of other mutual funds with similar investment objectives and strategies;
•the cost of owning the Fund compared to the cost of owning similarly-managed funds;
•the Advisor’s compliance policies, procedures, and regulatory experience and those of certain other service providers;
•the Advisor’s strategic plans, generally, and with respect to the Advisor’s response to investment management industry challenges;
•the Advisor’s business continuity plans, vendor management practices, and information security practices;
•the cost of services provided to the Fund, the profitability of the Fund to the Advisor, and the Advisor’s financial results of operation;
•possible economies of scale associated with the Advisor’s management of the Fund;
•any collateral benefits derived by the Advisor from the management of the Fund;
•fees and expenses associated with any investment by the Fund in other funds;
•payments to intermediaries by the Fund and the Advisor and services provided by intermediaries in connection therewith; and
•services provided and charges to the Advisor’s other investment management clients.
In keeping with its practice, the Board held two meetings and the independent Trustees met in private sessions to discuss the renewal and to review and discuss the information provided in response to their request. The Board held active discussions with the Advisor regarding the renewal of the management agreement. The independent Trustees had the benefit of the advice of their independent counsel throughout the process.
Factors Considered
The Trustees considered all of the information provided by the Advisor, the independent data providers, and the independent Trustees’ independent counsel in connection with the approval. They determined that the information was sufficient for them to evaluate the management agreement for the Fund. In connection with their review, the Trustees did not identify any single factor as being all-important or controlling and each Trustee may have attributed different levels of importance to different factors. In deciding to renew the management agreement, the Board based its decision on a number of factors, including the following:
Nature, Extent and Quality of Services — Generally. Under the management agreement, the Advisor is responsible for providing or arranging for all services necessary for the operation of the Fund. The Board noted that the Advisor provides or arranges at its own expense a wide variety of services including, but not limited to:
•constructing and designing the Fund
•portfolio research and security selection
•initial capitalization/funding
•securities trading
•Fund administration
•custody of Fund assets
•daily valuation of the Fund’s portfolio
•liquidity monitoring and management
•risk management, including information security
•shareholder servicing and transfer agency, including shareholder confirmations, recordkeeping, and communications
•legal services (except the independent Trustees’ counsel)
•regulatory and portfolio compliance
•financial reporting
•marketing and distribution (except amounts paid by the Fund under Rule 12b-1 plans)
The Board noted that many of these services have expanded over time in terms of both quantity and complexity in response to shareholder demands, competition in the industry, changing distribution channels, and the changing regulatory environment.
Investment Management Services. The nature of the investment management services provided to the Fund is quite complex and allows Fund shareholders access to professional money management, instant diversification of their investments, the opportunity to easily diversify among asset classes by investing in or exchanging among various American Century Investments funds, and liquidity. In evaluating investment performance, the Board expects the Advisor to manage the Fund in accordance with its investment objectives and principal investment strategies. Further, the Trustees recognize that the Advisor has an obligation to seek the best execution of fund trades. In providing these services, the Advisor utilizes teams of investment professionals who require extensive information technology, research, training, compliance, and other systems to conduct their business. The Board, directly and through its Portfolio Committee, regularly reviews investment performance information for the Fund, together with comparative information for appropriate benchmarks and/or peer groups of similarly-managed funds, over different time horizons. The Trustees also review investment performance information during the management agreement renewal process. If performance concerns are identified, the Fund receives special reviews until performance improves, during which the Board discusses with the Advisor the reasons for such results and any actions being taken to improve performance. The Fund’s performance was above its benchmark for the one-, three-, and five-year periods and below its benchmark for the ten-year period reviewed by the Board. The Board found the investment management services provided by the Advisor to the Fund to be satisfactory and consistent with the management agreement.
Shareholder and Other Services. Under the management agreement, the Advisor, either directly or through affiliates or third parties, provides the Fund with a comprehensive package of transfer agency, shareholder, and other services. The Board, directly and through its various committees, regularly reviews reports and evaluations of such services at its regular meetings. These reports include, but are not limited to, information regarding the operational efficiency and accuracy of the shareholder and transfer agency services provided, staffing levels, shareholder satisfaction, technology support (including information security), new products and services offered to Fund shareholders, securities trading activities, portfolio valuation services, risk management, auditing services, and legal and operational compliance activities. The Board found the services provided by the Advisor to the Fund under the management agreement to be competitive and of high quality.
Costs of Services and Profitability. The Advisor provides detailed information concerning its cost of providing various services to the Fund, its profitability in managing the Fund, and its financial results of operation. The Trustees have reviewed with the Advisor the methodology used to prepare this financial information. This information is considered in evaluating the Advisor’s financial condition, its ability to continue to provide services under the management agreement, and the reasonableness of the terms of the current management agreement. The Board concluded that the Advisor’s profits were reasonable in light of the services provided to the Fund.
Ethics. The Board generally considers the Advisor’s commitment to providing quality services to shareholders and to conducting its business ethically. They noted that the Advisor’s practices generally meet or exceed industry best practices.
Economies of Scale. The Board also reviewed information provided by the Advisor regarding the possible existence of economies of scale in connection with the management of the Fund. The Board concluded that economies of scale are difficult to measure and predict with precision, especially on a fund-by-fund basis. The Board concluded that the Advisor is appropriately sharing economies of scale, to the extent they exist, through its fee structure and through reinvestment in its business, infrastructure, investment capabilities and initiatives to provide shareholders enhanced and expanded services.
Comparison to Other Funds’ Fees. The management agreement provides that the Fund pays the Advisor a single, all-inclusive (or unified) management fee for providing all services necessary for the management and operation of the Fund, other than brokerage and other transaction fees and expenses relating to acquisition and disposition of portfolio securities, acquired fund fees and expenses, taxes, interest, extraordinary expenses, fund litigation expenses, fees and expenses of the Fund’s independent Trustees (including their independent legal counsel), and expenses incurred in connection with the provision of shareholder services and distribution services under a plan adopted pursuant to Investment Company Act Rule 12b-1. Under this unified fee structure, the Advisor is responsible for providing investment advisory, custody, audit, administrative, compliance, recordkeeping, marketing, and shareholder services, or arranging and supervising third parties to provide such services. By contrast, most other funds are charged a variety of fees, including an investment advisory fee, a transfer agency fee, an administrative fee, and other expenses. Other than their investment advisory fees and any applicable Rule 12b-1 distribution fees, all other
components of the total fees charged by these other funds may be increased without shareholder approval. The Board believes the unified fee structure is a benefit to Fund shareholders because it clearly discloses to shareholders the cost of owning Fund shares, and, since the unified fee cannot be increased without a vote of Fund shareholders, it shifts to the Advisor the risk of increased costs of operating the Fund and provides a direct incentive to minimize administrative inefficiencies. Part of the Board’s analysis of fee levels involves reviewing certain evaluative data compiled by an independent provider comparing the Fund’s unified fee to the total expense ratio of peer funds. The unified fee charged to shareholders of the Fund was below the median of the total expense ratios of the Fund’s peer expense group. The Board concluded that the management fee paid by the Fund to the Advisor under the management agreement is reasonable in light of the services provided to the Fund.
Comparison to Fees and Services Provided to Other Clients of the Advisor. The Board also requested and received information from the Advisor concerning the nature of the services, fees, costs, and profitability of its advisory services to advisory clients other than the Fund. They observed that these varying types of client accounts require different services and involve different regulatory and entrepreneurial risks than the management of the Fund. The Board analyzed this information and concluded that the fees charged and services provided to the Fund were reasonable by comparison.
Payments to Intermediaries. The Trustees also requested and received a description of payments made to intermediaries by the Fund and the Advisor and services provided by intermediaries. These payments include various payments made by the Fund or the Advisor to different types of intermediaries and recordkeepers for distribution and service activities provided with respect to the Fund. The Trustees reviewed such information and received representations from the Advisor that all such payments by the Fund were made pursuant to the Fund’s Rule 12b-1 Plan and that all such payments by the Advisor were made from the Advisor’s resources and reasonable profits.
Collateral or “Fall-Out” Benefits Derived by the Advisor. The Board considered the possible existence of collateral benefits the Advisor may receive as a result of its relationship with the Fund. The Board noted that the Advisor’s primary business is managing funds and it generally does not use fund or shareholder information to generate profits in other lines of business, and therefore does not derive any significant collateral benefits from them. The Board noted that the Advisor may receive proprietary research from broker-dealers that execute fund portfolio transactions. The Board also determined that the Advisor is able to provide investment management services to certain clients other than the Fund, at least in part, due to its existing infrastructure built to serve the fund complex. The Board also noted that the assets of those other accounts are, where applicable, included with the assets of the Fund to determine breakpoints in the management fee schedule.
Existing Relationship. The Board also considered whether there was any reason for not continuing the existing arrangement with the Advisor. In this regard, the Board was mindful of the potential disruptions of the Fund’s operations and various risks, uncertainties, and other effects that could occur as a result of a decision not to continue such relationship. In particular, the Board recognized that most shareholders have invested in the Fund on the strength of the Advisor’s industry standing and reputation and in the expectation that the Advisor will have a continuing role in providing advisory services to the Fund.
Conclusion of the Trustees. As a result of this process, the Board, including all of the independent Trustees, taking into account all of the factors discussed above and the information provided by the Advisor and others in connection with its review and received over time, concluded that the terms of the management agreement are fair and reasonable and that the management fee charged to the Fund is reasonable in light of the services provided and that the management agreement between the Fund and the Advisor should be renewed for an additional one-year period.
Other Tax Information
The following information is provided pursuant to provisions of the Internal Revenue Code.
The fund designates $54,463,881 as exempt interest dividends for the fiscal year ended August 31, 2024.
| | | | | | | | |
| Contact Us | americancentury.com | |
| Automated Information Line | 1-800-345-8765 | |
| Investor Services Representative | 1-800-345-2021
or 816-531-5575 | |
| Banks and Trust Companies, Broker-Dealers, Financial Professionals, Insurance Companies | 1-800-345-6488 | |
| | |
| This report and the statements it contains are submitted for the general information of our shareholders. The report is not authorized for distribution to prospective investors unless preceded or accompanied by an effective prospectus. | |
| | |
©2024 American Century Proprietary Holdings, Inc. All rights reserved.
CL-ANN-90325 2410 | |
| | | | | |
| |
| Annual Financial Statements and Other Information |
| |
| August 31, 2024 |
| |
| California Intermediate-Term Tax-Free Bond Fund |
| Investor Class (BCITX) |
| I Class (BCTIX) |
| Y Class (ACYTX) |
| A Class (BCIAX) |
| C Class (BCIYX) |
| | | | | |
| Schedule of Investments | |
| Statement of Assets and Liabilities | |
| Statement of Operations | |
| Statement of Changes in Net Assets | |
| Notes to Financial Statements | |
| Financial Highlights | |
| Report of Independent Registered Public Accounting Firm | |
| Approval of Management Agreement | |
| |
| Other Tax Information | |
AUGUST 31, 2024
| | | | | | | | |
| Principal
Amount/Shares | Value |
| MUNICIPAL SECURITIES — 99.7% | | |
| California — 99.3% | | |
| 91 Express Lanes Toll Road Rev., 5.00%, 8/15/25 | $ | 900,000 | | $ | 921,810 | |
| ABAG Finance Authority for Nonprofit Corps. Special Tax, (Abag Finance Authority for Nonprofit Corps Assessment District No. 1999-1) Special Tax, 5.00%, 9/2/28 (AGM) | 2,620,000 | | 2,814,480 | |
| ABAG Finance Authority for Nonprofit Corps. Special Tax, (Abag Finance Authority for Nonprofit Corps Assessment District No. 1999-1) Special Tax, 5.00%, 9/2/31 (AGM) | 1,395,000 | | 1,488,166 | |
| ABAG Finance Authority for Nonprofit Corps. Special Tax, (Abag Finance Authority for Nonprofit Corps Assessment District No. 1999-1) Special Tax, 5.00%, 9/2/32 (AGM) | 490,000 | | 522,010 | |
| Alameda Community Facilities District Special Tax, (City of Alameda CA Community Facilities District No. 22-1), 5.00%, 9/1/43 | 1,250,000 | | 1,314,978 | |
| Alameda Corridor Transportation Authority Rev., 5.00%, 10/1/34 | 3,500,000 | | 3,588,713 | |
| Alameda Corridor Transportation Authority Rev., 5.00%, 10/1/35 | 3,000,000 | | 3,072,192 | |
| Alameda Corridor Transportation Authority Rev., 5.00%, 10/1/36 | 4,550,000 | | 4,658,820 | |
Alameda Corridor Transportation Authority Rev., Capital Appreciation, 0.00%, 10/1/35 (NPFG)(1) | 9,000,000 | | 6,132,570 | |
| Alameda County Joint Powers Authority Rev., (County of Alameda CA), 5.00%, 12/1/31 | 2,000,000 | | 2,338,217 | |
| Alameda County Joint Powers Authority Rev., (County of Alameda CA), 5.00%, 12/1/32 | 2,350,000 | | 2,788,313 | |
| Anaheim Housing & Public Improvements Authority Rev., (City of Anaheim CA Water System Rev.), VRDN, 3.45%, 9/3/24 (LOC: Bank of America N.A.) | 11,700,000 | | 11,700,000 | |
| Anaheim Public Financing Authority Rev., (City of Anaheim CA), 5.00%, 9/1/35 (BAM) | 8,105,000 | | 8,490,891 | |
| Atwater Wastewater Rev., 5.00%, 5/1/25 (AGM) | 745,000 | | 754,714 | |
| Atwater Wastewater Rev., 5.00%, 5/1/27 (AGM) | 415,000 | | 439,122 | |
| Atwater Wastewater Rev., 5.00%, 5/1/29 (AGM) | 700,000 | | 741,424 | |
| Atwater Wastewater Rev., 5.00%, 5/1/32 (AGM) | 895,000 | | 945,141 | |
| Baldwin Park Unified School District GO, 4.00%, 8/1/31 (AGM) | 6,420,000 | | 6,542,277 | |
| Bay Area Toll Authority Rev., 5.00%, 4/1/26 | 3,000,000 | | 3,120,669 | |
| Bay Area Toll Authority Rev., 4.00%, 4/1/33 | 3,000,000 | | 3,054,239 | |
| Bay Area Toll Authority Rev., 5.00%, 4/1/42 | 5,430,000 | | 6,062,515 | |
| Bay Area Toll Authority Rev., VRDN, 3.60%, 9/3/24 (LOC: Barclays Bank PLC) | 5,500,000 | | 5,500,000 | |
| Bay Area Toll Authority Rev., VRDN, 3.85%, 9/3/24 (LOC: Barclays Bank PLC) | 2,540,000 | | 2,540,000 | |
| Bay Area Toll Authority Rev., VRDN, 3.85%, 9/3/24 (LOC: Bank of America N.A.) | 18,000,000 | | 18,000,000 | |
| Bay Area Toll Authority Rev., VRN, 4.17%, (MUNIPSA plus 1.25%), 4/1/36 | 4,000,000 | | 4,033,604 | |
| Bay Area Toll Authority Rev., VRN, 2.625%, 4/1/45 | 10,000,000 | | 9,923,330 | |
| Bay Area Toll Authority Rev., VRN, 3.33%, (MUNIPSA plus 0.41%), 4/1/56 | 6,000,000 | | 5,904,009 | |
| Bay Area Toll Authority Rev., VRN, 3.37%, (MUNIPSA plus 0.45%), 4/1/56 | 3,000,000 | | 2,989,309 | |
| Brea Redevelopment Agency Tax Allocation, Capital Appreciation, 5.00%, 8/1/33 | 1,500,000 | | 1,586,229 | |
| Brea Redevelopment Agency Tax Allocation, Capital Appreciation, 5.00%, 8/1/34 | 1,785,000 | | 1,885,738 | |
| Burlingame School District GO, 5.00%, 8/1/48 | 2,545,000 | | 2,838,098 | |
| California Community Choice Financing Authority Rev., VRN, 3.37%, (MUNIPSA plus 0.45%), 2/1/52 (GA: Morgan Stanley) | 20,000,000 | | 18,733,976 | |
| California Community Choice Financing Authority Rev., VRN, 4.00%, 2/1/52 (GA: Morgan Stanley) | 11,045,000 | | 11,235,760 | |
| California Community Choice Financing Authority Rev., VRN, 5.00%, 12/1/53 (GA: Goldman Sachs Group, Inc.) | 7,500,000 | | 7,940,730 | |
| California Community Choice Financing Authority Rev., VRN, 5.00%, 2/1/54 (GA: Morgan Stanley) | 6,900,000 | | 7,415,018 | |
| California Community Choice Financing Authority Rev., VRN, 5.00%, 5/1/54 (GA: Morgan Stanley) | 6,545,000 | | 7,091,070 | |
| California Community Choice Financing Authority Rev., VRN, 5.50%, 10/1/54 (GA: National Bank of Canada) | 4,665,000 | | 5,189,124 | |
| California Community Choice Financing Authority Rev., VRN, 5.25%, 11/1/54 (GA: Goldman Sachs Group, Inc.) | 14,410,000 | | 15,543,554 | |
| California Community College Financing Authority Rev., (NCCD-Orange Coast Properties LLC), 5.00%, 5/1/28 | 275,000 | | 291,278 | |
| California Community College Financing Authority Rev., (NCCD-Orange Coast Properties LLC), 5.00%, 5/1/29 | 800,000 | | 846,222 | |
| California Community College Financing Authority Rev., (NCCD-Orange Coast Properties LLC), 5.00%, 5/1/34 | 1,295,000 | | 1,356,154 | |
| California Community College Financing Authority Rev., (NCCD-Orange Coast Properties LLC), 5.00%, 5/1/36 | 1,595,000 | | 1,659,763 | |
| California Community College Financing Authority Rev., (NCCD-Orange Coast Properties LLC), 5.25%, 5/1/43 | 955,000 | | 983,743 | |
| California County Tobacco Securitization Agency Rev., (Gold Country Settlement Funding Corp.), 5.00%, 6/1/33 | 900,000 | | 977,955 | |
| | | | | | | | |
| Principal
Amount/Shares | Value |
| California County Tobacco Securitization Agency Rev., (Los Angeles County Securitization Corp.), 5.00%, 6/1/30 | $ | 450,000 | | $ | 490,165 | |
| California County Tobacco Securitization Agency Rev., (Los Angeles County Securitization Corp.), 5.00%, 6/1/32 | 400,000 | | 433,294 | |
| California County Tobacco Securitization Agency Rev., (Los Angeles County Securitization Corp.), 4.00%, 6/1/34 | 200,000 | | 205,299 | |
| California County Tobacco Securitization Agency Rev., (Los Angeles County Securitization Corp.), 4.00%, 6/1/36 | 275,000 | | 280,755 | |
| California County Tobacco Securitization Agency Rev., (Los Angeles County Securitization Corp.), 4.00%, 6/1/39 | 250,000 | | 251,907 | |
California Educational Facilities Authority Rev., (Claremont McKenna College), 5.00%, 1/1/26, Prerefunded at 100% of Par(2) | 750,000 | | 776,099 | |
| California Educational Facilities Authority Rev., (Leland Stanford Junior University), 5.00%, 6/1/43 | 3,000,000 | | 3,724,369 | |
| California Educational Facilities Authority Rev., (Leland Stanford Junior University), 5.00%, 5/1/45 | 4,450,000 | | 5,530,277 | |
| California Educational Facilities Authority Rev., (Loma Linda University), 5.00%, 4/1/25 | 800,000 | | 807,777 | |
| California Educational Facilities Authority Rev., (Loma Linda University), 5.00%, 4/1/27 | 300,000 | | 315,592 | |
| California Educational Facilities Authority Rev., (Loma Linda University), 5.00%, 4/1/28 | 800,000 | | 841,054 | |
| California Educational Facilities Authority Rev., (Loyola Marymount University), 5.00%, 10/1/34 | 490,000 | | 524,626 | |
| California Educational Facilities Authority Rev., (Loyola Marymount University), 5.00%, 10/1/35 | 625,000 | | 667,839 | |
| California Educational Facilities Authority Rev., (Loyola Marymount University), 5.00%, 10/1/37 | 1,485,000 | | 1,579,828 | |
California Educational Facilities Authority Rev., (University of Southern California), 5.00%, 10/1/25(2) | 1,875,000 | | 1,927,014 | |
| California Educational Facilities Authority Rev., (University of the Pacific), 5.00%, 11/1/33 | 1,500,000 | | 1,524,381 | |
| California Enterprise Development Authority Rev., (Provident Group-Pomona Properties LLC), 5.00%, 1/15/39 | 650,000 | | 705,872 | |
| California Enterprise Development Authority Rev., (Provident Group-SDSU Properties LLC), 5.00%, 8/1/45 | 1,745,000 | | 1,792,460 | |
| California Health Facilities Financing Authority Rev., 4.00%, 4/1/45 (BAM-TCRS) | 1,000,000 | | 1,004,419 | |
| California Health Facilities Financing Authority Rev., (Adventist Health System/West Obligated Group), 5.25%, 12/1/43 | 4,805,000 | | 5,331,777 | |
| California Health Facilities Financing Authority Rev., (Cedars-Sinai Medical Center Obligated Group), 5.00%, 11/15/24 | 1,450,000 | | 1,456,289 | |
| California Health Facilities Financing Authority Rev., (Cedars-Sinai Medical Center Obligated Group), 5.00%, 11/15/26 | 3,000,000 | | 3,083,441 | |
| California Health Facilities Financing Authority Rev., (Cedars-Sinai Medical Center Obligated Group), 5.00%, 11/15/27 | 6,000,000 | | 6,161,132 | |
| California Health Facilities Financing Authority Rev., (Cedars-Sinai Medical Center Obligated Group), 5.00%, 11/15/31 | 2,700,000 | | 2,765,288 | |
| California Health Facilities Financing Authority Rev., (Cedars-Sinai Medical Center Obligated Group), 5.00%, 11/15/32 | 400,000 | | 409,349 | |
| California Health Facilities Financing Authority Rev., (Cedars-Sinai Medical Center Obligated Group), 4.00%, 8/15/35 | 2,440,000 | | 2,466,817 | |
| California Health Facilities Financing Authority Rev., (Cedars-Sinai Medical Center Obligated Group), 4.00%, 8/15/48 | 10,000,000 | | 10,003,235 | |
| California Health Facilities Financing Authority Rev., (Children's Hospital of Orange County Obligated Group), 5.00%, 11/1/30 (GA: Children's Healthcare of California) | 700,000 | | 781,797 | |
| California Health Facilities Financing Authority Rev., (Children's Hospital of Orange County Obligated Group), 5.00%, 11/1/31 (GA: Children's Healthcare of California) | 1,000,000 | | 1,114,436 | |
| California Health Facilities Financing Authority Rev., (Children's Hospital of Orange County Obligated Group), 5.00%, 11/1/32 (GA: Children's Healthcare of California) | 1,200,000 | | 1,335,603 | |
| California Health Facilities Financing Authority Rev., (CommonSpirit Health Obligated Group), 5.00%, 12/1/37 | 1,600,000 | | 1,847,025 | |
| California Health Facilities Financing Authority Rev., (CommonSpirit Health Obligated Group), 4.00%, 4/1/38 | 3,000,000 | | 3,037,741 | |
| California Health Facilities Financing Authority Rev., (CommonSpirit Health Obligated Group), 5.00%, 12/1/38 | 1,165,000 | | 1,335,123 | |
| California Health Facilities Financing Authority Rev., (CommonSpirit Health Obligated Group), 5.00%, 12/1/39 | 1,000,000 | | 1,140,151 | |
| California Health Facilities Financing Authority Rev., (CommonSpirit Health Obligated Group), 4.00%, 4/1/40 | 1,785,000 | | 1,793,153 | |
| California Health Facilities Financing Authority Rev., (CommonSpirit Health Obligated Group), 5.00%, 12/1/40 | 1,100,000 | | 1,243,780 | |
| California Health Facilities Financing Authority Rev., (CommonSpirit Health Obligated Group), 5.00%, 12/1/41 | 1,250,000 | | 1,406,167 | |
| California Health Facilities Financing Authority Rev., (El Camino Hospital), 5.00%, 2/1/25 | 500,000 | | 504,235 | |
| California Health Facilities Financing Authority Rev., (Episcopal Communities & Services for Seniors Obligated Group), 3.85%, 11/15/27 | 1,250,000 | | 1,257,549 | |
| California Health Facilities Financing Authority Rev., (Kaiser Foundation Hospitals), VRN, 5.00%, 6/1/41 | 2,000,000 | | 2,229,028 | |
| California Health Facilities Financing Authority Rev., (Lucile Salter Packard Children's Hospital at Stanford Obligated Group), 5.00%, 8/15/30 | 1,730,000 | | 1,796,420 | |
| California Health Facilities Financing Authority Rev., (Lucile Salter Packard Children's Hospital at Stanford Obligated Group), 5.00%, 8/15/31 | 1,300,000 | | 1,348,576 | |
| California Health Facilities Financing Authority Rev., (Providence St. Joseph Health Obligated Group), VRN, 2.00%, 10/1/36 | 3,500,000 | | 3,430,938 | |
| | | | | | | | |
| Principal
Amount/Shares | Value |
| California Health Facilities Financing Authority Rev., (Scripps Health Obligated Group), VRN, 5.00%, 11/15/61 | $ | 9,000,000 | | $ | 10,116,139 | |
| California Health Facilities Financing Authority Rev., (Stanford Health Care Obligated Group), 5.00%, 11/15/25 | 2,500,000 | | 2,571,588 | |
| California Health Facilities Financing Authority Rev., (Stanford Health Care Obligated Group), 5.00%, 8/15/33 | 4,000,000 | | 4,787,944 | |
California Health Facilities Financing Authority Rev., (Sutter Health Obligated Group), 5.00%, 11/15/25, Prerefunded at 100% of Par(2) | 1,500,000 | | 1,545,611 | |
California Health Facilities Financing Authority Rev., (Sutter Health Obligated Group), 5.00%, 11/15/25, Prerefunded at 100% of Par(2) | 1,750,000 | | 1,803,213 | |
California Health Facilities Financing Authority Rev., (Sutter Health Obligated Group), 5.00%, 11/15/25, Prerefunded at 100% of Par(2) | 2,000,000 | | 2,060,815 | |
| California Health Facilities Financing Authority Rev., (Sutter Health Obligated Group), 5.00%, 11/15/26 | 1,500,000 | | 1,573,339 | |
| California Health Facilities Financing Authority Rev., (Sutter Health Obligated Group), 5.00%, 11/15/32 | 2,000,000 | | 2,116,296 | |
| California Health Facilities Financing Authority Rev., (Sutter Health Obligated Group), 5.00%, 11/15/36 | 6,135,000 | | 6,432,721 | |
| California Housing Finance Rev., 4.25%, 1/15/35 | 5,166,112 | | 5,404,021 | |
| California Housing Finance Rev., 3.50%, 11/20/35 | 12,169,427 | | 11,843,128 | |
| California Housing Finance Agency Rev., (AH Housing Preservation LP), 4.10%, 9/1/40 (FNMA) | 5,000,000 | | 5,125,107 | |
| California Housing Finance Agency Rev., (SV Housing Preservation LP), 4.10%, 7/1/40 (FHLMC) | 6,670,000 | | 6,775,062 | |
| California Infrastructure & Economic Development Bank Rev., 4.00%, 10/1/42 | 10,000,000 | | 10,420,443 | |
| California Infrastructure & Economic Development Bank Rev., (California Academy of Sciences), 3.25%, 8/1/29 | 1,000,000 | | 1,004,556 | |
| California Infrastructure & Economic Development Bank Rev., (California State Teachers' Retirement System), 5.00%, 8/1/33 | 1,800,000 | | 1,979,276 | |
| California Infrastructure & Economic Development Bank Rev., (Equitable School Revolving Fund LLC Obligated Group), 4.00%, 11/1/34 | 500,000 | | 519,431 | |
| California Infrastructure & Economic Development Bank Rev., (Equitable School Revolving Fund LLC Obligated Group), 4.00%, 11/1/35 | 350,000 | | 361,660 | |
| California Infrastructure & Economic Development Bank Rev., (Equitable School Revolving Fund LLC Obligated Group), 4.00%, 11/1/36 | 365,000 | | 375,436 | |
| California Infrastructure & Economic Development Bank Rev., (Equitable School Revolving Fund LLC Obligated Group), 4.00%, 11/1/37 | 575,000 | | 589,803 | |
| California Infrastructure & Economic Development Bank Rev., (Equitable School Revolving Fund LLC Obligated Group), 4.00%, 11/1/38 | 585,000 | | 597,273 | |
| California Infrastructure & Economic Development Bank Rev., (Equitable School Revolving Fund LLC Obligated Group), 4.00%, 11/1/39 | 630,000 | | 640,764 | |
| California Infrastructure & Economic Development Bank Rev., (Equitable School Revolving Fund LLC Obligated Group), 4.00%, 11/1/40 | 650,000 | | 657,876 | |
| California Infrastructure & Economic Development Bank Rev., (Equitable School Revolving Fund LLC Obligated Group), 4.00%, 11/1/41 | 425,000 | | 429,694 | |
| California Infrastructure & Economic Development Bank Rev., (Museum Associates), VRN, 3.62%, (MUNIPSA plus 0.70%), 12/1/50 | 2,500,000 | | 2,499,675 | |
| California Infrastructure & Economic Development Bank Rev., (Segerstrom Center for the Arts), 5.00%, 1/1/25 | 3,500,000 | | 3,522,046 | |
| California Infrastructure & Economic Development Bank Rev., (Segerstrom Center for the Arts), 5.00%, 1/1/28 | 1,105,000 | | 1,190,140 | |
| California Municipal Finance Authority COP, (Palomar Health Obligated Group), 5.25%, 11/1/52 (AGM) | 1,670,000 | | 1,787,156 | |
| California Municipal Finance Authority Rev., 5.00%, 12/1/40 | 600,000 | | 675,162 | |
| California Municipal Finance Authority Rev., 4.00%, 12/1/43 | 2,100,000 | | 2,039,591 | |
| California Municipal Finance Authority Rev., (Aldersly), 3.75%, 11/15/28 | 2,995,000 | | 2,996,644 | |
| California Municipal Finance Authority Rev., (Aldersly), 4.00%, 11/15/28 | 595,000 | | 596,221 | |
| California Municipal Finance Authority Rev., (Azusa Pacific University), 5.00%, 4/1/27 | 1,165,000 | | 1,165,938 | |
California Municipal Finance Authority Rev., (California Baptist University), 5.00%, 11/1/36(3) | 1,000,000 | | 1,017,756 | |
| California Municipal Finance Authority Rev., (California Lutheran University CA), 5.00%, 10/1/27 | 300,000 | | 316,524 | |
| California Municipal Finance Authority Rev., (California Lutheran University CA), 5.00%, 10/1/28 | 150,000 | | 160,552 | |
| California Municipal Finance Authority Rev., (California Lutheran University CA), 5.00%, 10/1/29 | 225,000 | | 240,389 | |
| California Municipal Finance Authority Rev., (California Lutheran University CA), 5.00%, 10/1/30 | 225,000 | | 239,487 | |
| California Municipal Finance Authority Rev., (California Lutheran University CA), 5.00%, 10/1/31 | 200,000 | | 212,080 | |
| California Municipal Finance Authority Rev., (California Lutheran University CA), 5.00%, 10/1/32 | 225,000 | | 237,907 | |
| California Municipal Finance Authority Rev., (California Lutheran University CA), 5.00%, 10/1/33 | 225,000 | | 237,354 | |
| California Municipal Finance Authority Rev., (California Lutheran University CA), 5.00%, 10/1/34 | 250,000 | | 262,968 | |
| California Municipal Finance Authority Rev., (California Lutheran University CA), 5.00%, 10/1/35 | 225,000 | | 236,116 | |
| California Municipal Finance Authority Rev., (California Lutheran University CA), 5.00%, 10/1/36 | 250,000 | | 261,606 | |
| California Municipal Finance Authority Rev., (California Lutheran University CA), 5.00%, 10/1/37 | 275,000 | | 287,431 | |
| | | | | | | | |
| Principal
Amount/Shares | Value |
| California Municipal Finance Authority Rev., (California Lutheran University CA), 5.00%, 10/1/38 | $ | 300,000 | | $ | 312,695 | |
| California Municipal Finance Authority Rev., (Capital Facilities Development Corp.), 5.00%, 6/1/36 | 5,650,000 | | 6,058,592 | |
| California Municipal Finance Authority Rev., (Capital Facilities Development Corp.), 5.00%, 6/1/38 | 4,015,000 | | 4,294,650 | |
California Municipal Finance Authority Rev., (Caritas Corp. CMFA Mobile Home Park Financing 2024 Portfolio), 5.00%, 8/15/31(4) | 270,000 | | 304,740 | |
California Municipal Finance Authority Rev., (Caritas Corp. CMFA Mobile Home Park Financing 2024 Portfolio), 5.00%, 8/15/33(4) | 600,000 | | 687,454 | |
California Municipal Finance Authority Rev., (Caritas Corp. CMFA Mobile Home Park Financing 2024 Portfolio), 5.00%, 8/15/35(4) | 660,000 | | 757,668 | |
California Municipal Finance Authority Rev., (Caritas Corp. CMFA Mobile Home Park Financing 2024 Portfolio), 5.00%, 8/15/37(4) | 720,000 | | 819,988 | |
California Municipal Finance Authority Rev., (Caritas Corp. CMFA Mobile Home Park Financing 2024 Portfolio), 5.00%, 8/15/39(4) | 950,000 | | 1,070,713 | |
California Municipal Finance Authority Rev., (Caritas Corp. CMFA Mobile Home Park Financing 2024 Portfolio), 5.00%, 8/15/40(4) | 525,000 | | 587,539 | |
California Municipal Finance Authority Rev., (Caritas Corp. CMFA Mobile Home Park Financing 2024 Portfolio), 4.00%, 8/15/44(4) | 1,810,000 | | 1,805,945 | |
| California Municipal Finance Authority Rev., (CHF-Davis I LLC), 5.00%, 5/15/26 | 4,210,000 | | 4,344,211 | |
| California Municipal Finance Authority Rev., (CHF-Davis I LLC), 5.00%, 5/15/32 (BAM-TCRS) | 3,000,000 | | 3,212,806 | |
| California Municipal Finance Authority Rev., (CHF-Davis I LLC), 5.00%, 5/15/35 | 7,500,000 | | 7,938,067 | |
| California Municipal Finance Authority Rev., (CHF-Davis II LLC), 4.00%, 5/15/36 (BAM) | 1,200,000 | | 1,235,236 | |
| California Municipal Finance Authority Rev., (CHF-Davis II LLC), 4.00%, 5/15/38 (BAM) | 750,000 | | 766,825 | |
California Municipal Finance Authority Rev., (Claremont Graduate University), 5.00%, 10/1/34(3) | 435,000 | | 449,709 | |
California Municipal Finance Authority Rev., (Claremont Graduate University), 5.00%, 10/1/39(3) | 1,130,000 | | 1,140,562 | |
| California Municipal Finance Authority Rev., (Clinicas del Camino Real, Inc.), 4.00%, 3/1/30 | 785,000 | | 762,090 | |
| California Municipal Finance Authority Rev., (Clinicas del Camino Real, Inc.), 4.00%, 3/1/31 | 1,635,000 | | 1,572,906 | |
| California Municipal Finance Authority Rev., (Clinicas del Camino Real, Inc.), 4.00%, 3/1/32 | 1,700,000 | | 1,620,284 | |
| California Municipal Finance Authority Rev., (Clinicas del Camino Real, Inc.), 4.00%, 3/1/34 | 1,240,000 | | 1,159,954 | |
| California Municipal Finance Authority Rev., (Clinicas del Camino Real, Inc.), 4.00%, 3/1/35 | 500,000 | | 462,997 | |
California Municipal Finance Authority Rev., (Community Health Centers of The Central Coast, Inc.), 3.00%, 12/1/24(3) | 110,000 | | 109,358 | |
California Municipal Finance Authority Rev., (Community Health Centers of The Central Coast, Inc.), 4.00%, 12/1/25(3) | 200,000 | | 199,639 | |
California Municipal Finance Authority Rev., (Community Health Centers of The Central Coast, Inc.), 5.00%, 12/1/28(3) | 100,000 | | 103,396 | |
California Municipal Finance Authority Rev., (Community Health Centers of The Central Coast, Inc.), 5.00%, 12/1/46(3) | 1,590,000 | | 1,566,726 | |
California Municipal Finance Authority Rev., (Community Hospitals of Central California Obligated Group), 5.00%, 2/1/25, Prerefunded at 100% of Par(2) | 545,000 | | 550,065 | |
California Municipal Finance Authority Rev., (Community Hospitals of Central California Obligated Group), 5.00%, 2/1/25, Prerefunded at 100% of Par(2) | 735,000 | | 741,831 | |
California Municipal Finance Authority Rev., (Community Hospitals of Central California Obligated Group), 5.00%, 2/1/25, Prerefunded at 100% of Par(2) | 1,000,000 | | 1,009,293 | |
California Municipal Finance Authority Rev., (Community Hospitals of Central California Obligated Group), 5.00%, 2/1/25, Prerefunded at 100% of Par(2) | 1,420,000 | | 1,433,197 | |
California Municipal Finance Authority Rev., (Community Hospitals of Central California Obligated Group), 5.00%, 2/1/25(2) | 1,925,000 | | 1,942,890 | |
| California Municipal Finance Authority Rev., (Community Hospitals of Central California Obligated Group), 5.00%, 2/1/26 | 1,000,000 | | 1,020,503 | |
| California Municipal Finance Authority Rev., (Community Hospitals of Central California Obligated Group), 5.00%, 2/1/27 | 1,750,000 | | 1,816,399 | |
| California Municipal Finance Authority Rev., (Community Hospitals of Central California Obligated Group), 5.00%, 2/1/28 | 3,325,000 | | 3,453,505 | |
| California Municipal Finance Authority Rev., (Community Hospitals of Central California Obligated Group), 5.00%, 2/1/31 | 2,700,000 | | 2,792,105 | |
| California Municipal Finance Authority Rev., (Community Hospitals of Central California Obligated Group), 5.00%, 2/1/35 | 5,000,000 | | 5,150,697 | |
| California Municipal Finance Authority Rev., (Congregational Homes, Inc. Obligated Group), 4.00%, 11/15/24 | 605,000 | | 604,251 | |
| California Municipal Finance Authority Rev., (Congregational Homes, Inc. Obligated Group), 4.00%, 11/15/27 | 300,000 | | 298,650 | |
| California Municipal Finance Authority Rev., (Congregational Homes, Inc. Obligated Group), 4.00%, 11/15/29 | 740,000 | | 737,902 | |
| | | | | | | | |
| Principal
Amount/Shares | Value |
| California Municipal Finance Authority Rev., (County of Orange CA), 5.00%, 6/1/37 | $ | 2,990,000 | | $ | 3,129,280 | |
| California Municipal Finance Authority Rev., (Eisenhower Medical Center), 5.00%, 7/1/26 | 2,260,000 | | 2,321,391 | |
| California Municipal Finance Authority Rev., (Eisenhower Medical Center), 5.00%, 7/1/29 | 2,100,000 | | 2,186,296 | |
| California Municipal Finance Authority Rev., (Eisenhower Medical Center), 5.00%, 7/1/30 | 1,000,000 | | 1,039,418 | |
| California Municipal Finance Authority Rev., (Eisenhower Medical Center), 5.00%, 7/1/31 | 1,000,000 | | 1,037,656 | |
| California Municipal Finance Authority Rev., (Eisenhower Medical Center), 5.00%, 7/1/31 | 1,335,000 | | 1,385,270 | |
| California Municipal Finance Authority Rev., (Eisenhower Medical Center), 5.00%, 7/1/34 | 1,500,000 | | 1,549,825 | |
| California Municipal Finance Authority Rev., (Emerson College), 5.00%, 1/1/29 | 1,350,000 | | 1,413,524 | |
| California Municipal Finance Authority Rev., (Emerson College), 5.00%, 1/1/31 | 1,480,000 | | 1,544,151 | |
| California Municipal Finance Authority Rev., (Emerson College), 5.00%, 1/1/33 | 1,040,000 | | 1,080,712 | |
| California Municipal Finance Authority Rev., (Emerson College), 5.00%, 1/1/34 | 1,000,000 | | 1,037,428 | |
| California Municipal Finance Authority Rev., (Emerson College), 5.00%, 1/1/35 | 2,565,000 | | 2,655,175 | |
| California Municipal Finance Authority Rev., (Emerson College), 5.00%, 1/1/36 | 720,000 | | 743,921 | |
| California Municipal Finance Authority Rev., (Emerson College), 5.00%, 1/1/37 | 1,000,000 | | 1,030,808 | |
| California Municipal Finance Authority Rev., (HumanGood California Obligated Group), 4.00%, 10/1/37 | 2,840,000 | | 2,810,759 | |
| California Municipal Finance Authority Rev., (HumanGood California Obligated Group), 4.00%, 10/1/38 | 2,750,000 | | 2,712,786 | |
| California Municipal Finance Authority Rev., (HumanGood California Obligated Group), 4.00%, 10/1/39 | 1,750,000 | | 1,719,723 | |
| California Municipal Finance Authority Rev., (Ignatian Corp.), 5.00%, 9/1/39 | 1,000,000 | | 1,153,363 | |
| California Municipal Finance Authority Rev., (Ignatian Corp.), 5.00%, 9/1/40 | 750,000 | | 857,492 | |
| California Municipal Finance Authority Rev., (Ignatian Corp.), 5.00%, 9/1/41 | 750,000 | | 850,854 | |
| California Municipal Finance Authority Rev., (Ignatian Corp.), 5.00%, 9/1/42 | 1,250,000 | | 1,407,895 | |
| California Municipal Finance Authority Rev., (Ignatian Corp.), 5.00%, 9/1/43 | 1,000,000 | | 1,121,381 | |
| California Municipal Finance Authority Rev., (Ignatian Corp.), 5.00%, 9/1/44 | 675,000 | | 753,959 | |
| California Municipal Finance Authority Rev., (University of La Verne), 5.00%, 6/1/25 | 700,000 | | 711,209 | |
| California Municipal Finance Authority Rev., (University of La Verne), 5.00%, 6/1/26 | 1,000,000 | | 1,040,182 | |
| California Municipal Finance Authority Rev., (University of La Verne), 5.00%, 6/1/28 | 1,000,000 | | 1,056,932 | |
California Municipal Finance Authority Rev., (William Jessup University), 5.00%, 8/1/25(3) | 1,455,000 | | 1,447,149 | |
California Municipal Finance Authority Rev., (William Jessup University), 5.00%, 8/1/26(3) | 1,530,000 | | 1,516,497 | |
California Municipal Finance Authority Rev., (William Jessup University), 5.00%, 8/1/29(3) | 1,000,000 | | 980,367 | |
California Municipal Finance Authority Rev., (William Jessup University), 5.00%, 8/1/39(3) | 2,750,000 | | 2,491,408 | |
| California Municipal Finance Authority Special Tax, (California Municipal Finance Authority BOLD Program Series 2020B), 4.00%, 9/1/35 | 1,320,000 | | 1,300,769 | |
| California Municipal Finance Authority Special Tax, (California Municipal Finance Authority Cmnty Facs District No. 2020-4 Area No. 2), 4.00%, 9/1/36 | 585,000 | | 587,931 | |
| California Municipal Finance Authority Special Tax, (California Municipal Finance Authority Cmnty Facs District No. 2020-4 Area No. 2), 4.00%, 9/1/41 | 1,610,000 | | 1,553,770 | |
| California Municipal Finance Authority Special Tax, (California Municipal Finance Authority Cmnty Facs District No. 2021-6 Area No. 2), 5.75%, 9/1/42 | 1,500,000 | | 1,635,920 | |
California Pollution Control Financing Authority Rev., (Poseidon Resources Channelside LP), 5.00%, 7/1/39(3) | 2,000,000 | | 2,096,470 | |
California Pollution Control Financing Authority Rev., (Poseidon Resources Channelside LP), 5.00%, 11/21/45(3) | 3,435,000 | | 3,553,510 | |
| California Public Finance Authority Rev., (Henry Mayo Newhall Hospital Obligated Group), 5.00%, 10/15/33 | 500,000 | | 511,021 | |
| California Public Finance Authority Rev., (Henry Mayo Newhall Hospital Obligated Group), 5.00%, 10/15/37 | 1,000,000 | | 1,017,308 | |
| California Public Finance Authority Rev., (Hoag Memorial Hospital Presbyterian Obligated Group), 5.00%, 7/15/35 | 700,000 | | 805,902 | |
| California Public Finance Authority Rev., (Hoag Memorial Hospital Presbyterian Obligated Group), VRDN, 3.80%, 9/3/24 (LIQ FAC: JPMorgan Chase Bank N.A.)(SBBPA: JPMorgan Chase Bank N.A.) | 400,000 | | 400,000 | |
California Public Finance Authority Rev., (Kendal at Sonoma Obligated Group), 2.375%, 11/15/28(3) | 1,625,000 | | 1,593,353 | |
| California Public Finance Authority Rev., (PIH Health, Inc. Obligated Group), 5.00%, 6/1/25 | 925,000 | | 939,194 | |
| California Public Finance Authority Rev., (PIH Health, Inc. Obligated Group), 5.00%, 6/1/27 | 1,070,000 | | 1,131,525 | |
| California Public Finance Authority Rev., (PIH Health, Inc. Obligated Group), 5.00%, 6/1/28 | 700,000 | | 752,348 | |
| California Public Finance Authority Rev., (PIH Health, Inc. Obligated Group), 5.00%, 6/1/29 | 625,000 | | 682,471 | |
| California Public Finance Authority Rev., (PIH Health, Inc. Obligated Group), 5.00%, 6/1/30 | 750,000 | | 827,936 | |
| California Public Finance Authority Rev., (Sharp Healthcare Obligated Group), 5.00%, 8/1/28 | 4,000,000 | | 4,386,354 | |
| California Public Finance Authority Rev., (Sharp Healthcare Obligated Group), 5.00%, 8/1/30 | 3,250,000 | | 3,700,061 | |
| California Public Finance Authority Rev., (Sharp Healthcare Obligated Group), 5.00%, 8/1/33 | 2,000,000 | | 2,357,701 | |
California School Finance Authority Rev., 5.00%, 6/1/37(3) | 240,000 | | 242,617 | |
| | | | | | | | |
| Principal
Amount/Shares | Value |
California School Finance Authority Rev., (Aspire Public Schools Obligated Group), 5.00%, 8/1/25, Prerefunded at 100% of Par(2)(3) | $ | 100,000 | | $ | 102,132 | |
California School Finance Authority Rev., (Aspire Public Schools Obligated Group), 4.00%, 8/1/36(3) | 325,000 | | 324,052 | |
California School Finance Authority Rev., (Aspire Public Schools Obligated Group), 5.00%, 8/1/40(3) | 1,000,000 | | 1,026,203 | |
California School Finance Authority Rev., (Aspire Public Schools Obligated Group), 4.00%, 8/1/41(3) | 525,000 | | 501,836 | |
California School Finance Authority Rev., (Granada Hills Charter High School Obligated Group), 5.00%, 7/1/34(3) | 340,000 | | 374,645 | |
California School Finance Authority Rev., (Granada Hills Charter High School Obligated Group), 5.00%, 7/1/34(3) | 505,000 | | 518,103 | |
California School Finance Authority Rev., (Granada Hills Charter High School Obligated Group), 5.00%, 7/1/35(3) | 355,000 | | 389,155 | |
California School Finance Authority Rev., (Granada Hills Charter High School Obligated Group), 5.00%, 7/1/36(3) | 375,000 | | 410,216 | |
California School Finance Authority Rev., (Granada Hills Charter High School Obligated Group), 5.00%, 7/1/37(3) | 395,000 | | 430,202 | |
California School Finance Authority Rev., (Granada Hills Charter High School Obligated Group), 4.00%, 7/1/38(3) | 465,000 | | 465,164 | |
California School Finance Authority Rev., (Granada Hills Charter High School Obligated Group), 5.00%, 7/1/38(3) | 415,000 | | 450,168 | |
California School Finance Authority Rev., (Granada Hills Charter High School Obligated Group), 5.00%, 7/1/39(3) | 435,000 | | 468,678 | |
California School Finance Authority Rev., (Granada Hills Charter High School Obligated Group), 5.00%, 7/1/41(3) | 480,000 | | 510,719 | |
California School Finance Authority Rev., (Granada Hills Charter High School Obligated Group), 5.00%, 7/1/43(3) | 175,000 | | 184,534 | |
California School Finance Authority Rev., (Granada Hills Charter High School Obligated Group), 5.00%, 7/1/44(3) | 185,000 | | 194,298 | |
California School Finance Authority Rev., (Granada Hills Charter High School Obligated Group), 4.00%, 7/1/48(3) | 680,000 | | 635,770 | |
California School Finance Authority Rev., (Green Dot Public Schools Obligated Group), 5.00%, 8/1/25(3) | 150,000 | | 151,439 | |
California School Finance Authority Rev., (Green Dot Public Schools Obligated Group), 5.00%, 8/1/26(3) | 150,000 | | 153,907 | |
California School Finance Authority Rev., (Green Dot Public Schools Obligated Group), 5.00%, 8/1/27(3) | 160,000 | | 166,892 | |
California School Finance Authority Rev., (Green Dot Public Schools Obligated Group), 5.00%, 8/1/28(3) | 190,000 | | 200,701 | |
California School Finance Authority Rev., (Green Dot Public Schools Obligated Group), 5.00%, 8/1/32(3) | 705,000 | | 742,656 | |
California School Finance Authority Rev., (Green Dot Public Schools Obligated Group), 5.375%, 8/1/42(3) | 1,000,000 | | 1,074,744 | |
California School Finance Authority Rev., (Partnerships to Uplift Communities Series 2023 Obligated Group), 5.00%, 8/1/33(3) | 695,000 | | 733,997 | |
California School Finance Authority Rev., (Partnerships to Uplift Communities Series 2023 Obligated Group), 5.25%, 8/1/38(3) | 420,000 | | 444,479 | |
California School Finance Authority Rev., (Real Journey Academies Obligated Group), 5.00%, 6/1/30(3) | 440,000 | | 445,055 | |
California School Finance Authority Rev., (Rocketship Education Obligated Group), 5.00%, 6/1/26(3) | 235,000 | | 236,280 | |
California School Finance Authority Rev., (Rocketship Education Obligated Group), 4.50%, 6/1/27(3) | 380,000 | | 382,321 | |
California School Finance Authority Rev., (Rocketship Education Obligated Group), 5.00%, 6/1/34(3) | 670,000 | | 678,432 | |
California School Finance Authority Rev., (Rocketship Education Obligated Group), 5.125%, 6/1/47(3) | 635,000 | | 635,315 | |
California School Finance Authority Rev., (Summit Public Schools Obligated Group), 5.00%, 6/1/27, Prerefunded at 100% of Par(2)(3) | 260,000 | | 274,034 | |
California School Finance Authority Rev., (TEACH, Inc. Series 2019 Obligated Group), 5.00%, 6/1/29(3) | 255,000 | | 259,068 | |
California School Finance Authority Rev., (TEACH, Inc. Series 2019 Obligated Group), 5.00%, 6/1/39(3) | 740,000 | | 743,500 | |
California School Finance Authority Rev., (Value Schools), 5.00%, 7/1/33 (ST INTERCEPT)(3) | 925,000 | | 977,781 | |
| California State Financial Authority Rev., (Master's University & Seminary), 5.00%, 8/1/25 | 745,000 | | 750,617 | |
| California State Financial Authority Rev., (Master's University & Seminary), 5.00%, 8/1/26 | 780,000 | | 799,447 | |
| California State Financial Authority Rev., (Master's University & Seminary), 5.00%, 8/1/27 | 820,000 | | 850,482 | |
| California State Financial Authority Rev., (Master's University & Seminary), 5.00%, 8/1/28 | 865,000 | | 906,936 | |
| California State Financial Authority Rev., (Master's University & Seminary), 5.00%, 8/1/29 | 905,000 | | 958,176 | |
| California State Financial Authority Rev., (Master's University & Seminary), 5.00%, 8/1/39 | 1,750,000 | | 1,800,891 | |
| California State Public Works Board Rev., (State of California), 5.00%, 12/1/24 | 5,000,000 | | 5,025,462 | |
| California State Public Works Board Rev., (State of California), 5.00%, 9/1/25 | 5,000,000 | | 5,011,990 | |
| California State Public Works Board Rev., (State of California), 5.00%, 5/1/27 | 5,000,000 | | 5,067,832 | |
| California State Public Works Board Rev., (State of California), 5.00%, 9/1/29 | 5,000,000 | | 5,578,261 | |
| California State Public Works Board Rev., (State of California), 5.00%, 8/1/35 | 2,615,000 | | 2,947,507 | |
California State University Rev., 5.00%, 11/1/24, Prerefunded at 100% of Par(2) | 35,000 | | 35,114 | |
| California State University Rev., 5.00%, 11/1/28 | 2,000,000 | | 2,137,326 | |
| California State University Rev., 5.00%, 11/1/29 | 1,000,000 | | 1,063,285 | |
| California State University Rev., 5.00%, 11/1/30 | 3,000,000 | | 3,174,544 | |
| California State University Rev., 5.00%, 11/1/31 | 2,900,000 | | 3,061,291 | |
| California State University Rev., 4.00%, 11/1/34 | 10,000,000 | | 10,140,403 | |
| California State University Rev., 4.00%, 11/1/37 | 2,375,000 | | 2,387,604 | |
| | | | | | | | |
| Principal
Amount/Shares | Value |
| California State University Rev., 5.00%, 11/1/39 | $ | 5,000,000 | | $ | 5,881,898 | |
| California State University Rev., VRN, 3.125%, 11/1/51 | 4,300,000 | | 4,320,482 | |
| California Statewide Communities Development Authority COP, (City of Salinas CA Measure X Sales Tax Rev.), 5.00%, 12/1/31 (AGM) | 1,155,000 | | 1,263,789 | |
| California Statewide Communities Development Authority COP, (City of Salinas CA Measure X Sales Tax Rev.), 5.00%, 12/1/34 (AGM) | 1,340,000 | | 1,462,307 | |
| California Statewide Communities Development Authority COP, (City of Salinas CA Measure X Sales Tax Rev.), 5.00%, 12/1/38 (AGM) | 1,000,000 | | 1,068,203 | |
| California Statewide Communities Development Authority Rev., (Adventist Health System/West Obligated Group), 5.00%, 3/1/25 | 750,000 | | 755,992 | |
| California Statewide Communities Development Authority Rev., (Adventist Health System/West Obligated Group), 5.00%, 3/1/26 | 1,000,000 | | 1,026,490 | |
| California Statewide Communities Development Authority Rev., (Adventist Health System/West Obligated Group), 5.00%, 3/1/27 | 1,590,000 | | 1,632,256 | |
| California Statewide Communities Development Authority Rev., (Cedars-Sinai Medical Center Obligated Group), 5.00%, 7/1/25 | 300,000 | | 304,959 | |
| California Statewide Communities Development Authority Rev., (Cedars-Sinai Medical Center Obligated Group), 5.00%, 7/1/26 | 325,000 | | 339,590 | |
| California Statewide Communities Development Authority Rev., (CHF-Irvine LLC), 5.00%, 5/15/25 | 1,925,000 | | 1,948,547 | |
| California Statewide Communities Development Authority Rev., (CHF-Irvine LLC), 5.00%, 5/15/28 | 2,050,000 | | 2,114,345 | |
| California Statewide Communities Development Authority Rev., (CHF-Irvine LLC), 5.00%, 5/15/29 | 1,000,000 | | 1,045,637 | |
| California Statewide Communities Development Authority Rev., (CHF-Irvine LLC), 5.00%, 5/15/29 | 1,250,000 | | 1,287,515 | |
| California Statewide Communities Development Authority Rev., (CHF-Irvine LLC), 5.00%, 5/15/30 | 1,940,000 | | 1,995,218 | |
| California Statewide Communities Development Authority Rev., (CHF-Irvine LLC), 5.00%, 5/15/34 | 2,220,000 | | 2,297,760 | |
| California Statewide Communities Development Authority Rev., (Emanate Health Obligated Group), 4.00%, 4/1/36 | 675,000 | | 684,520 | |
| California Statewide Communities Development Authority Rev., (Emanate Health Obligated Group), 4.00%, 4/1/37 | 700,000 | | 707,547 | |
| California Statewide Communities Development Authority Rev., (Emanate Health Obligated Group), 4.00%, 4/1/38 | 1,350,000 | | 1,359,540 | |
| California Statewide Communities Development Authority Rev., (Emanate Health Obligated Group), 4.00%, 4/1/40 | 650,000 | | 648,671 | |
California Statewide Communities Development Authority Rev., (Enloe Medical Center Obligated Group), 5.00%, 2/15/26, Prerefunded at 100% of Par(2) | 640,000 | | 663,139 | |
| California Statewide Communities Development Authority Rev., (Enloe Medical Center Obligated Group), 5.25%, 8/15/37 | 1,605,000 | | 1,660,343 | |
| California Statewide Communities Development Authority Rev., (Enloe Medical Center Obligated Group), 5.125%, 8/15/47 (AGM) | 350,000 | | 379,358 | |
| California Statewide Communities Development Authority Rev., (Front Porch Communities & Services Obligated Group), 5.00%, 4/1/25 | 275,000 | | 277,437 | |
| California Statewide Communities Development Authority Rev., (Front Porch Communities & Services Obligated Group), 5.00%, 4/1/30 | 145,000 | | 150,591 | |
| California Statewide Communities Development Authority Rev., (Front Porch Communities & Services Obligated Group), 5.00%, 4/1/31 | 125,000 | | 129,548 | |
| California Statewide Communities Development Authority Rev., (Front Porch Communities & Services Obligated Group), 4.00%, 4/1/32 | 185,000 | | 187,006 | |
California Statewide Communities Development Authority Rev., (Lancer Educational Housing LLC), 4.00%, 6/1/26(3) | 1,270,000 | | 1,268,454 | |
California Statewide Communities Development Authority Rev., (Lancer Educational Housing LLC), 5.00%, 6/1/34(3) | 375,000 | | 391,861 | |
California Statewide Communities Development Authority Rev., (Lancer Educational Housing LLC), 5.00%, 6/1/39(3) | 475,000 | | 486,439 | |
California Statewide Communities Development Authority Rev., (Loma Linda University Medical Center Obligated Group), 5.00%, 12/1/26(3) | 5,000,000 | | 5,133,022 | |
California Statewide Communities Development Authority Rev., (Loma Linda University Medical Center Obligated Group), 5.00%, 12/1/33(3) | 1,000,000 | | 1,047,598 | |
California Statewide Communities Development Authority Rev., (Loma Linda University Medical Center Obligated Group), 5.00%, 12/1/36(3) | 6,500,000 | | 6,624,898 | |
| California Statewide Communities Development Authority Rev., (Loma Linda University Medical Center Obligated Group), 5.25%, 12/1/44 | 1,085,000 | | 1,084,852 | |
| California Statewide Communities Development Authority Rev., (Redlands Community Hospital Obligated Group), 5.00%, 10/1/28 | 1,000,000 | | 1,029,117 | |
| California Statewide Communities Development Authority Rev., (Redlands Community Hospital Obligated Group), 5.00%, 10/1/29 | 600,000 | | 617,003 | |
| California Statewide Communities Development Authority Rev., (Redlands Community Hospital Obligated Group), 5.00%, 10/1/31 | 870,000 | | 890,749 | |
| | | | | | | | |
| Principal
Amount/Shares | Value |
| California Statewide Communities Development Authority Rev., (USC Obligated Group), 5.00%, 1/1/35 | $ | 5,175,000 | | $ | 5,511,702 | |
| California Statewide Communities Development Authority Rev., (USC Obligated Group), 5.00%, 1/1/36 | 4,560,000 | | 4,847,571 | |
| California Statewide Communities Development Authority Rev., (USC Obligated Group), 5.00%, 1/1/38 | 3,825,000 | | 4,051,573 | |
| California Statewide Communities Development Authority Special Tax, (California Statewide Cmntys Dev Authority Cmnty Facs Dist No. 2015-01 Area No. 2), 5.00%, 9/1/27 | 365,000 | | 375,320 | |
| California Statewide Communities Development Authority Special Tax, (California Statewide Cmntys Dev Authority Cmnty Facs Dist No. 2015-01 Area No. 2), 5.00%, 9/1/37 | 2,225,000 | | 2,310,370 | |
| California Statewide Communities Development Authority Special Tax, (California Statewide Communities Dev Authority Cmnty Facs Dist No. 2022-10), 5.25%, 9/1/43 | 650,000 | | 701,347 | |
| California Statewide Communities Development Authority Rev., (Kaiser Foundation Hospitals), VRN, Series 2009-C3, 5.00%, 4/1/45 | 5,725,000 | | 6,380,592 | |
| Carson Public Financing Authority Rev., (City of Carson CA Reassessment District No. 2001-1), 5.00%, 9/2/24 | 1,400,000 | | 1,400,000 | |
| Carson Public Financing Authority Rev., (City of Carson CA Reassessment District No. 2001-1), 5.00%, 9/2/30 | 1,000,000 | | 1,092,163 | |
| Cathedral City Redevelopment Agency Successor Agency Tax Allocation, 4.00%, 8/1/28 (BAM) | 200,000 | | 207,344 | |
| Cathedral City Redevelopment Agency Successor Agency Tax Allocation, 5.00%, 8/1/28 (AGM) | 1,190,000 | | 1,192,807 | |
| Cathedral City Redevelopment Agency Successor Agency Tax Allocation, 4.00%, 8/1/31 (BAM) | 760,000 | | 787,218 | |
| Cathedral City Redevelopment Successor Agency Tax Allocation, (Cathedral City Redevelopment Agency Successor Agency Merged Redevelopment Area), 5.00%, 8/1/25 | 550,000 | | 560,427 | |
| Chabot-Las Positas Community College District GO, 5.25%, 8/1/48 | 2,900,000 | | 3,291,483 | |
| Chino Community Facilities District Special Tax, (City of Chino CA Community Facilities District No. 2003-3 Improvement Area No. 10), 4.00%, 9/1/29 | 350,000 | | 355,145 | |
| Chino Community Facilities District Special Tax, (City of Chino CA Community Facilities District No. 2003-3 Improvement Area No. 10), 5.00%, 9/1/34 | 655,000 | | 709,530 | |
| Chino Community Facilities District Special Tax, (City of Chino CA Community Facilities District No. 2003-3 Improvement Area No. 10), 5.00%, 9/1/39 | 835,000 | | 895,030 | |
| Chino Community Facilities District Special Tax, (City of Chino CA Community Facilities District No. 2003-3 Improvement Area No. 10), 5.00%, 9/1/44 | 795,000 | | 828,906 | |
| Chino Community Facilities District Special Tax, (City of Chino CA Community Facilities District No. 2003-3 Improvement Area No. 8), 4.00%, 9/1/36 | 1,525,000 | | 1,522,493 | |
| Chino Community Facilities District Special Tax, (City of Chino CA Community Facilities District No. 2019-1), 4.00%, 9/1/35 | 500,000 | | 510,250 | |
| Chula Vista Elementary School District GO, 5.00%, 8/1/40 | 1,000,000 | | 1,150,752 | |
| City & County of San Francisco GO, 5.00%, 6/15/25 | 1,565,000 | | 1,596,675 | |
| City & County of San Francisco GO, 5.00%, 6/15/26 | 2,000,000 | | 2,096,859 | |
| City & County of San Francisco GO, 5.00%, 6/15/27 | 1,875,000 | | 2,015,640 | |
City & County of San Francisco, Infrastructure & Revitalization Financing Dist No. 1 Facs Tax Allocation, 5.00%, 9/1/27(3) | 230,000 | | 243,969 | |
City & County of San Francisco, Infrastructure & Revitalization Financing Dist No. 1 Facs Tax Allocation, 5.00%, 9/1/32(3) | 400,000 | | 439,901 | |
City & County of San Francisco, Infrastructure & Revitalization Financing Dist No. 1 Facs Tax Allocation, 5.00%, 9/1/37(3) | 385,000 | | 415,329 | |
City & County of San Francisco, Special Tax District No. 2020-1 Special Tax, (City & County of San Francisco CA Special Tax Dist No. 2020-1 Development Spl Ta), 4.00%, 9/1/26(3) | 70,000 | | 70,443 | |
City & County of San Francisco, Special Tax District No. 2020-1 Special Tax, (City & County of San Francisco CA Special Tax Dist No. 2020-1 Development Spl Ta), 4.00%, 9/1/31(3) | 150,000 | | 152,777 | |
| Clovis Unified School District GO, 4.00%, 8/1/48 | 6,000,000 | | 5,986,064 | |
| Compton Unified School District COP, 4.00%, 6/1/34 (BAM) | 575,000 | | 585,212 | |
| Compton Unified School District COP, 4.00%, 6/1/38 (BAM) | 1,025,000 | | 1,035,444 | |
Corona Community Facilities District Special Tax, (City of Corona CA Community Facilities District No. 2018-1 Improvement Area No. 2), 5.00%, 9/1/39(4) | 500,000 | | 549,600 | |
Corona Community Facilities District Special Tax, (City of Corona CA Community Facilities District No. 2018-1 Improvement Area No. 2), 5.00%, 9/1/44(4) | 725,000 | | 782,137 | |
| County of Sacramento Rev., (Einstein Preservation LP), Series 2024-01FN, 4.125%, 4/1/40 (FNMA) | 1,250,000 | | 1,262,146 | |
CSCDA Community Improvement Authority Rev., (CSCDA Community Improvement Authority 1818 Platinum Triangle-Anaheim), 4.00%, 4/1/57(3) | 1,650,000 | | 1,260,511 | |
CSCDA Community Improvement Authority Rev., (CSCDA Community Improvement Authority Dublin), 2.45%, 2/1/47(3) | 1,900,000 | | 1,599,805 | |
CSCDA Community Improvement Authority Rev., (CSCDA Community Improvement Authority Oceanaire Apartments), 3.20%, 9/1/46(3) | 5,000,000 | | 3,978,639 | |
CSCDA Community Improvement Authority Rev., (CSCDA Community Improvement Authority Pasadena Portfolio), 2.65%, 12/1/46(3) | 7,935,000 | | 6,296,055 | |
| | | | | | | | |
| Principal
Amount/Shares | Value |
CSCDA Community Improvement Authority Rev., (CSCDA Community Improvement Authority Westgate Apartments), 4.00%, 6/1/57(3) | $ | 705,000 | | $ | 245,684 | |
| Del Mar Union School District Special Tax, (Del Mar Union School District Community Facilities District No. 99-1), 4.00%, 9/1/30 | 225,000 | | 228,941 | |
| Del Mar Union School District Special Tax, (Del Mar Union School District Community Facilities District No. 99-1), 4.00%, 9/1/31 | 250,000 | | 253,546 | |
| Del Mar Union School District Special Tax, (Del Mar Union School District Community Facilities District No. 99-1), 4.00%, 9/1/32 | 275,000 | | 278,411 | |
| Del Mar Union School District Special Tax, (Del Mar Union School District Community Facilities District No. 99-1), 4.00%, 9/1/33 | 265,000 | | 268,013 | |
| Del Mar Union School District Special Tax, (Del Mar Union School District Community Facilities District No. 99-1), 4.00%, 9/1/34 | 300,000 | | 303,315 | |
| Del Mar Union School District Special Tax, (Del Mar Union School District Community Facilities District No. 99-1), 4.00%, 9/1/35 | 500,000 | | 503,683 | |
| Del Mar Union School District Special Tax, (Del Mar Union School District Community Facilities District No. 99-1), 4.00%, 9/1/37 | 1,345,000 | | 1,347,052 | |
| Del Mar Union School District Special Tax, (Del Mar Union School District Community Facilities District No. 99-1), 4.00%, 9/1/39 | 1,285,000 | | 1,258,673 | |
| Desert Sands Unified School District GO, 5.00%, 8/1/39 | 1,750,000 | | 1,839,448 | |
| Dixon Special Tax, (City of Dixon CA Community Facilities District No. 2019-1 Improvement Area No. 1), 4.00%, 9/1/36 | 200,000 | | 200,027 | |
| Dixon Special Tax, (City of Dixon CA Community Facilities District No. 2019-1 Improvement Area No. 2), 5.00%, 9/1/38 | 1,290,000 | | 1,384,439 | |
| Dixon Special Tax, (City of Dixon CA Community Facilities District No. 2019-1 Improvement Area No. 2), 5.00%, 9/1/43 | 2,280,000 | | 2,376,522 | |
| Dublin Special Tax, (City of Dublin CA Community Facilities District No. 2015-1 Improvement Area No. 4), 5.00%, 9/1/37 | 955,000 | | 1,020,064 | |
| Dublin Special Tax, (City of Dublin CA Community Facilities District No. 2015-1 Improvement Area No. 4), 5.25%, 9/1/42 | 2,000,000 | | 2,145,126 | |
| Dublin Special Tax, (City of Dublin CA Community Facilities District No. 2015-1 Improvement Area No. 5), 5.00%, 9/1/38 | 785,000 | | 834,324 | |
| Dublin Special Tax, (City of Dublin CA Community Facilities District No. 2015-1 Improvement Area No. 5), 5.125%, 9/1/43 | 1,265,000 | | 1,341,391 | |
| East Bay Municipal Utility District Wastewater System Rev., 5.00%, 6/1/34 | 350,000 | | 411,154 | |
| East Bay Municipal Utility District Wastewater System Rev., 5.00%, 6/1/36 | 600,000 | | 699,150 | |
| East Bay Municipal Utility District Wastewater System Rev., 5.00%, 6/1/37 | 450,000 | | 522,686 | |
| East Bay Municipal Utility District Water System Rev., (East Bay Municipal Utility District Water System Revenue), 5.00%, 6/1/44 | 2,250,000 | | 2,557,371 | |
| East Bay Municipal Utility District Water System Rev., (East Bay Municipal Utility District Water System Revenue), 5.00%, 6/1/44 | 3,000,000 | | 3,409,828 | |
| Eastern Municipal Water District Rev., 4.00%, 7/1/26 | 2,250,000 | | 2,315,128 | |
| Eastern Municipal Water District Rev., 4.00%, 7/1/27 | 1,750,000 | | 1,830,263 | |
| Eastern Municipal Water District Financing Authority Rev., (Eastern Municipal Water District), 4.00%, 7/1/37 | 1,700,000 | | 1,769,620 | |
| Eastern Municipal Water District Financing Authority Rev., (Eastern Municipal Water District), 4.00%, 7/1/38 | 1,500,000 | | 1,555,700 | |
El Monte Union High School District GO, Capital Appreciation, 0.00%, 6/1/47(1) | 3,500,000 | | 1,255,079 | |
| El Rancho Unified School District GO, 5.75%, 8/1/48 (BAM) | 625,000 | | 739,567 | |
| Elk Grove Finance Authority Special Tax, (City of Elk Grove CA Community Facilities District No. 2005-1 Laguna Ridge), 5.00%, 9/1/30 | 1,715,000 | | 1,764,356 | |
| Fairfield Community Facilities District Special Tax, (City of Fairfield CA Community Facilities District No. 2016-1 Improvement Area C), 4.00%, 9/1/36 | 545,000 | | 548,394 | |
| Folsom Ranch Financing Authority Special Tax, (City of Folsom CA Community Facilities District No. 19), 5.00%, 9/1/39 | 875,000 | | 917,854 | |
| Folsom Ranch Financing Authority Special Tax, (City of Folsom CA Community Facilities District No. 23 Area No 1), 4.00%, 9/1/35 | 1,690,000 | | 1,692,096 | |
| Fontana Special Tax, (City of Fontana CA Community Facilities District No. 22), 5.00%, 9/1/24 | 575,000 | | 575,000 | |
| Fontana Special Tax, (City of Fontana CA Community Facilities District No. 31), 4.00%, 9/1/30 | 1,110,000 | | 1,116,374 | |
| Fontana Special Tax, (City of Fontana CA Community Facilities District No. 31), 4.00%, 9/1/32 | 1,000,000 | | 1,001,628 | |
| Fontana Special Tax, (City of Fontana CA Community Facilities District No. 31), 4.00%, 9/1/36 | 2,230,000 | | 2,241,172 | |
| Fontana Special Tax, (City of Fontana CA Community Facilities District No. 85), 4.00%, 9/1/32 | 245,000 | | 251,099 | |
| Fontana Special Tax, (City of Fontana CA Community Facilities District No. 85), 4.00%, 9/1/36 | 550,000 | | 557,692 | |
| Fontana Redevelopment Agency Successor Agency Tax Allocation, 5.00%, 10/1/29 | 2,100,000 | | 2,246,959 | |
| | | | | | | | |
| Principal
Amount/Shares | Value |
| Fontana Redevelopment Agency Successor Agency Tax Allocation, 5.00%, 10/1/32 | $ | 1,495,000 | | $ | 1,586,812 | |
| Foothill-Eastern Transportation Corridor Agency Rev., 5.00%, 1/15/30 | 300,000 | | 326,607 | |
| Foothill-Eastern Transportation Corridor Agency Rev., 4.00%, 1/15/32 | 350,000 | | 363,042 | |
| Foothill-Eastern Transportation Corridor Agency Rev., 4.00%, 1/15/33 | 250,000 | | 258,692 | |
| Foothill-Eastern Transportation Corridor Agency Rev., 4.00%, 1/15/33 | 3,603,000 | | 3,728,272 | |
| Foothill-Eastern Transportation Corridor Agency Rev., 4.00%, 1/15/43 | 1,725,000 | | 1,703,503 | |
| Foothill-Eastern Transportation Corridor Agency Rev., 4.00%, 1/15/46 (BAM-TCRS) | 6,361,000 | | 6,378,400 | |
Foothill-Eastern Transportation Corridor Agency Rev., Capital Appreciation, 0.00%, 1/15/33(1) | 750,000 | | 553,348 | |
Foothill-Eastern Transportation Corridor Agency Rev., Capital Appreciation, 0.00%, 1/15/42(1) | 6,070,000 | | 2,898,482 | |
| Foothill-Eastern Transportation Corridor Agency Rev., Capital Appreciation, 6.85%, 1/15/42 | 2,300,000 | | 2,741,723 | |
| Fremont Union High School District GO, 5.00%, 8/1/34 | 660,000 | | 699,900 | |
| Fremont Union High School District GO, 5.00%, 8/1/34 | 1,750,000 | | 2,124,708 | |
| Fremont Union High School District GO, 4.00%, 8/1/35 | 1,250,000 | | 1,283,553 | |
| Fremont Union High School District GO, 5.00%, 8/1/35 | 2,000,000 | | 2,418,487 | |
| Fresno Joint Powers Financing Authority Rev., (City of Fresno CA), 5.00%, 4/1/26 (AGM) | 1,650,000 | | 1,716,890 | |
| Fresno Joint Powers Financing Authority Rev., (City of Fresno CA), 5.00%, 4/1/28 (AGM) | 1,400,000 | | 1,480,003 | |
| Fresno Joint Powers Financing Authority Rev., (City of Fresno CA), 5.00%, 4/1/29 (AGM) | 1,000,000 | | 1,055,680 | |
| Fresno Joint Powers Financing Authority Rev., (City of Fresno CA), 5.00%, 4/1/30 (AGM) | 1,350,000 | | 1,421,989 | |
| Fresno Unified School District GO, 4.00%, 8/1/49 | 2,125,000 | | 2,120,710 | |
| Glendale Electric Rev., 5.00%, 2/1/45 | 6,400,000 | | 7,136,390 | |
Golden State Tobacco Securitization Corp. Rev., 5.00%, 6/1/25, Prerefunded at 100% of Par(2) | 1,000,000 | | 1,018,993 | |
Golden State Tobacco Securitization Corp. Rev., 5.00%, 6/1/26(2) | 6,000,000 | | 6,251,543 | |
Golden State Tobacco Securitization Corp. Rev., 5.00%, 6/1/27, Prerefunded at 100% of Par(2) | 2,000,000 | | 2,132,473 | |
Golden State Tobacco Securitization Corp. Rev., Capital Appreciation, 0.00%, 6/1/25 (AGM)(1)(2) | 3,000,000 | | 2,938,421 | |
| Goleta Water District Rev., 5.00%, 9/1/31 (BAM) | 400,000 | | 457,284 | |
| Goleta Water District Rev., 5.00%, 9/1/33 (BAM) | 200,000 | | 234,455 | |
| Goleta Water District Rev., 5.00%, 9/1/34 (BAM) | 425,000 | | 498,324 | |
Hanford Joint Union High School District GO, Capital Appreciation, 0.00%, 8/1/41(1) | 2,235,000 | | 1,062,527 | |
Hastings Campus Housing Finance Authority Rev., 5.00%, 7/1/45(3) | 10,925,000 | | 10,513,818 | |
| Hayward Unified School District GO, 4.00%, 8/1/36 (BAM) | 1,000,000 | | 1,024,787 | |
| Hayward Unified School District GO, 4.00%, 8/1/37 (BAM) | 1,000,000 | | 1,021,796 | |
| Hayward Unified School District GO, 4.00%, 8/1/39 (BAM) | 2,360,000 | | 2,388,337 | |
| Hayward Unified School District GO, 4.00%, 8/1/43 (BAM) | 4,520,000 | | 4,537,218 | |
| Hercules Redevelopment Agency Successor Agency Tax Allocation, 5.00%, 8/1/42 (AGM) | 7,235,000 | | 7,861,194 | |
| Hesperia Community Redevelopment Agency Successor Agency Tax Allocation, 5.00%, 9/1/33 (AGM) | 4,195,000 | | 4,518,734 | |
| Imperial Irrigation District Electric System Rev., 5.00%, 11/1/30 | 440,000 | | 489,383 | |
| Imperial Irrigation District Electric System Rev., 5.00%, 11/1/31 | 400,000 | | 444,200 | |
| Imperial Irrigation District Electric System Rev., 5.00%, 11/1/32 | 525,000 | | 582,084 | |
| Imperial Irrigation District Electric System Rev., 5.00%, 11/1/36 | 1,015,000 | | 1,046,717 | |
| Imperial Irrigation District Electric System Rev., 5.00%, 11/1/38 | 4,075,000 | | 4,436,701 | |
Independent Cities Finance Authority Rev., (City of Compton CA Sales Tax Rev.), 4.00%, 6/1/36 (AGM)(3) | 700,000 | | 721,691 | |
Independent Cities Finance Authority Rev., (City of Compton CA Sales Tax Rev.), 4.00%, 6/1/41 (AGM)(3) | 900,000 | | 911,780 | |
| Inglewood Redevelopment Agency Successor Agency Tax Allocation, 5.00%, 5/1/25 (BAM) | 1,500,000 | | 1,520,844 | |
| Inglewood Redevelopment Agency Successor Agency Tax Allocation, 5.00%, 5/1/38 (BAM) | 500,000 | | 522,899 | |
| Inglewood Unified School District GO, 5.00%, 8/1/29 (BAM) | 235,000 | | 246,808 | |
| Inglewood Unified School District GO, 5.00%, 8/1/31 (BAM) | 500,000 | | 521,676 | |
| Inglewood Unified School District GO, 5.00%, 8/1/32 (BAM) | 500,000 | | 520,320 | |
| Inglewood Unified School District GO, 5.00%, 8/1/34 (BAM) | 300,000 | | 310,883 | |
| Inglewood Unified School District GO, 5.00%, 8/1/35 (BAM) | 855,000 | | 884,378 | |
| Inglewood Unified School District GO, 5.00%, 8/1/37 (BAM) | 500,000 | | 515,391 | |
| Inland Valley Development Agency Tax Allocation, 5.25%, 9/1/37 | 1,665,000 | | 1,671,305 | |
| Inland Valley Development Agency Tax Allocation, 5.00%, 9/1/44 | 1,765,000 | | 1,771,353 | |
| Irvine Special Assessment, (City of Irvine CA Reassessment District No. 15-1), 5.00%, 9/2/26 | 1,500,000 | | 1,563,938 | |
| Irvine Special Tax, (City of Irvine CA Community Facilities District No. 2013-3 Area No. 1), 5.00%, 9/1/39 | 1,000,000 | | 1,000,000 | |
| | | | | | | | |
| Principal
Amount/Shares | Value |
| Irvine Special Tax, (City of Irvine CA Community Facilities District No. 2013-3 Area No. 1), 5.00%, 9/1/49 | $ | 1,480,000 | | $ | 1,480,000 | |
| Irvine Facilities Financing Authority Rev., (City of Irvine CA), 5.25%, 5/1/43 | 2,500,000 | | 2,566,811 | |
| Irvine Unified School District Special Tax, 4.00%, 9/1/34 | 2,285,000 | | 2,322,131 | |
| Irvine Unified School District Special Tax, 4.00%, 9/1/35 | 995,000 | | 1,008,963 | |
| Irvine Unified School District Special Tax, 4.00%, 9/1/36 (AGM) | 1,500,000 | | 1,514,684 | |
| Irvine Unified School District Special Tax, 4.00%, 9/1/38 | 2,720,000 | | 2,721,251 | |
| Irvine Unified School District Special Tax, (Community Facilities District No. 1), 5.00%, 9/1/29 | 1,910,000 | | 2,082,168 | |
| Irvine Unified School District Special Tax, (Irvine Unified School District Community Facilities District No. 09-1), 5.00%, 9/1/26 | 635,000 | | 658,771 | |
| Irvine Unified School District Special Tax, (Irvine Unified School District Community Facilities District No. 09-1), 5.00%, 9/1/29 | 360,000 | | 393,672 | |
| Irvine Unified School District Special Tax, (Irvine Unified School District Community Facilities District No. 09-1), 5.00%, 9/1/31 | 345,000 | | 375,674 | |
| Irvine Unified School District Special Tax, (Irvine Unified School District Community Facilities District No. 09-1), 5.00%, 9/1/33 | 395,000 | | 428,561 | |
| Irvine Unified School District Special Tax, (Irvine Unified School District Community Facilities District No. 09-1), 4.00%, 9/1/37 | 570,000 | | 577,317 | |
| Jurupa Public Financing Authority Special Tax, 5.00%, 9/1/24 | 680,000 | | 680,000 | |
| Jurupa Public Financing Authority Special Tax, 5.00%, 9/1/25 | 1,000,000 | | 1,000,000 | |
| Kern Community College District GO, 5.00%, 8/1/39 | 2,000,000 | | 2,328,485 | |
| Kern Community College District GO, 5.00%, 8/1/40 | 1,000,000 | | 1,154,126 | |
| La Mesa-Spring Valley School District GO, 4.00%, 8/1/42 | 350,000 | | 354,503 | |
| La Mesa-Spring Valley School District GO, 4.00%, 8/1/43 | 335,000 | | 337,778 | |
| La Mesa-Spring Valley School District GO, 5.00%, 8/1/47 | 1,250,000 | | 1,360,648 | |
La Quinta Redevelopment Agency Successor Agency Tax Allocation, 5.00%, 9/1/24, Prerefunded at 100% of Par(2) | 4,265,000 | | 4,265,000 | |
| Lancaster Redevelopment Agency Successor Agency Tax Allocation, 5.00%, 8/1/25 (AGM) | 600,000 | | 612,084 | |
| Lee Lake Water District Financing Corp. Special Tax, (Temescal Valley Water District Community Facilities District No. 4 Area No. 2), 4.00%, 9/1/36 | 930,000 | | 934,659 | |
| Long Beach Bond Finance Authority Rev., 5.00%, 11/15/35 (GA: Merrill Lynch & Co.) | 1,920,000 | | 2,140,839 | |
| Long Beach Bond Finance Authority Rev., 5.50%, 11/15/37 (GA: Merrill Lynch & Co.) | 1,625,000 | | 1,905,565 | |
| Long Beach CA Harbor Rev., 5.00%, 5/15/39 | 1,310,000 | | 1,325,707 | |
| Long Beach Marina System Rev., 5.00%, 5/15/25 | 1,500,000 | | 1,512,733 | |
| Long Beach Marina System Rev., 5.00%, 5/15/27 | 800,000 | | 806,756 | |
| Long Beach Marina System Rev., 5.00%, 5/15/28 | 600,000 | | 604,986 | |
| Long Beach Marina System Rev., 5.00%, 5/15/40 | 2,250,000 | | 2,257,603 | |
| Long Beach Marina System Rev., 5.00%, 5/15/45 | 1,620,000 | | 1,622,857 | |
| Long Beach Unified School District GO, 5.00%, 8/1/28 | 5,000,000 | | 5,250,491 | |
| Long Beach Unified School District GO, 5.00%, 8/1/32 | 3,985,000 | | 4,154,523 | |
| Los Alamitos Unified School District COP, Capital Appreciation, VRN, 6.05%, 8/1/42 | 3,200,000 | | 3,586,324 | |
| Los Angeles Community College District GO, 5.00%, 6/1/26 | 2,115,000 | | 2,213,286 | |
| Los Angeles Community College District GO, 5.00%, 8/1/32 | 5,000,000 | | 5,938,888 | |
| Los Angeles Community College District GO, 4.00%, 8/1/39 | 10,000,000 | | 10,049,360 | |
| Los Angeles Community Facilities District Special Tax, (City of Los Angeles CA Community Facilities District No. 11), 4.00%, 9/1/38 | 1,000,000 | | 991,399 | |
| Los Angeles County Community Facilities District No. 2021-01 Special Tax, (County of Los Angeles CA Community Facilities District No. 2021-01 Area No.1), 5.00%, 9/1/42 | 1,800,000 | | 1,920,615 | |
| Los Angeles County Metropolitan Transportation Authority Sales Tax Rev., 5.00%, 6/1/25 | 10,000,000 | | 10,180,227 | |
| Los Angeles County Metropolitan Transportation Authority Sales Tax Rev., 5.00%, 7/1/32 | 5,000,000 | | 5,434,859 | |
Los Angeles County Public Works Financing Authority Rev., (County of Los Angeles CA), 5.25%, 12/1/44(4) | 2,000,000 | | 2,323,906 | |
| Los Angeles County Sanitation Districts Financing Authority Rev., (Los Angeles County Sanitation District No. 14), 5.00%, 10/1/26 | 2,700,000 | | 2,770,601 | |
Los Angeles Department of Airports Rev., 5.00%, 5/15/29, Prerefunded at 100% of Par(2) | 1,565,000 | | 1,741,123 | |
| Los Angeles Department of Airports Rev., 5.00%, 5/15/33 | 1,350,000 | | 1,430,688 | |
| Los Angeles Department of Airports Rev., 5.00%, 5/15/34 | 1,250,000 | | 1,323,513 | |
| Los Angeles Department of Airports Rev., 5.00%, 5/15/35 | 1,500,000 | | 1,586,326 | |
| Los Angeles Department of Airports Rev., 5.00%, 5/15/36 | 5,000,000 | | 5,543,030 | |
| Los Angeles Department of Airports Rev., 5.00%, 5/15/38 | 935,000 | | 1,020,257 | |
| | | | | | | | |
| Principal
Amount/Shares | Value |
| Los Angeles Department of Airports Rev., 4.00%, 5/15/39 | $ | 2,545,000 | | $ | 2,628,042 | |
| Los Angeles Department of Airports Rev., 5.00%, 5/15/39 | 8,265,000 | | 9,052,814 | |
| Los Angeles Department of Airports Rev., 5.00%, 5/15/40 | 1,520,000 | | 1,715,011 | |
| Los Angeles Department of Airports Rev., 5.00%, 5/15/41 | 2,600,000 | | 2,921,551 | |
| Los Angeles Department of Water & Power Rev., (Los Angeles Department of Water & Power Power System Rev.), 5.00%, 7/1/25 | 1,525,000 | | 1,553,925 | |
| Los Angeles Department of Water & Power Rev., (Los Angeles Department of Water & Power Power System Rev.), 5.00%, 7/1/26 | 1,000,000 | | 1,046,383 | |
| Los Angeles Department of Water & Power Rev., (Los Angeles Department of Water & Power Power System Rev.), 5.00%, 7/1/27 | 5,600,000 | | 5,606,023 | |
| Los Angeles Department of Water & Power Rev., (Los Angeles Department of Water & Power Power System Rev.), 5.00%, 7/1/28 | 10,000,000 | | 10,999,943 | |
| Los Angeles Department of Water & Power Rev., (Los Angeles Department of Water & Power Power System Rev.), 5.00%, 7/1/40 | 5,000,000 | | 5,751,713 | |
| Los Angeles Department of Water & Power Rev., (Los Angeles Department of Water & Power Power System Rev.), 5.00%, 7/1/43 | 8,150,000 | | 9,041,082 | |
| Los Angeles Department of Water & Power Rev., (Los Angeles Department of Water & Power Power System Rev.), VRDN, 3.57%, 9/3/24 (SBBPA: Bank of America N.A.) | 1,000,000 | | 1,000,000 | |
| Los Angeles Department of Water & Power Rev., (Los Angeles Department of Water & Power Power System Rev.), VRDN, 3.65%, 9/3/24 (SBBPA: Bank of America N.A.) | 1,620,000 | | 1,620,000 | |
| Los Angeles Department of Water & Power Rev., (Los Angeles Department of Water & Power Power System Rev.), VRDN, 3.60%, 9/6/24 (SBBPA: JPMorgan Chase Bank N.A.) | 4,600,000 | | 4,600,000 | |
| Los Angeles Department of Water & Power System Rev., 5.00%, 7/1/41 | 3,470,000 | | 3,911,727 | |
| Los Angeles Department of Water & Power System Rev., 5.00%, 7/1/42 | 3,960,000 | | 4,440,664 | |
| Los Angeles Department of Water & Power Water System Rev., 5.00%, 7/1/26 | 4,040,000 | | 4,236,178 | |
| Los Angeles Department of Water & Power Water System Rev., 5.00%, 7/1/27 | 2,125,000 | | 2,286,342 | |
| Los Angeles Department of Water & Power Water System Rev., 5.00%, 7/1/29 | 6,030,000 | | 6,546,462 | |
| Los Angeles Department of Water & Power Water System Rev., 5.00%, 7/1/40 | 3,775,000 | | 4,404,800 | |
| Los Angeles Department of Water & Power Water System Rev., 5.00%, 7/1/41 | 3,000,000 | | 3,465,407 | |
| Los Angeles Department of Water & Power Water System Rev., 5.00%, 7/1/41 | 7,480,000 | | 7,762,068 | |
| Los Angeles Department of Water & Power Water System Rev., 5.00%, 7/1/42 | 1,790,000 | | 2,007,270 | |
| Los Angeles Department of Water & Power Water System Rev., VRDN, 3.65%, 9/3/24 (SBBPA: Barclays Bank PLC) | 3,445,000 | | 3,445,000 | |
| Los Angeles Department of Water & Power Water System Rev., VRDN, 3.68%, 9/3/24 (SBBPA: Barclays Bank PLC) | 800,000 | | 800,000 | |
| Los Angeles Housing Authority Rev., 3.75%, 4/1/34 (FNMA) | 2,000,000 | | 2,037,063 | |
| Los Angeles Unified School District COP, 5.00%, 10/1/25 | 730,000 | | 747,969 | |
| Los Angeles Unified School District GO, 5.00%, 7/1/26 | 2,500,000 | | 2,623,235 | |
| Los Angeles Unified School District GO, 5.00%, 7/1/27 | 2,345,000 | | 2,519,704 | |
| Los Angeles Unified School District GO, 5.00%, 7/1/28 | 1,750,000 | | 1,924,990 | |
| Los Angeles Unified School District GO, 5.00%, 7/1/33 | 2,300,000 | | 2,744,290 | |
| Los Angeles Unified School District GO, 5.25%, 7/1/40 | 4,000,000 | | 4,715,099 | |
| Los Angeles Unified School District GO, 5.25%, 7/1/47 | 4,000,000 | | 4,530,110 | |
| Los Angeles Wastewater System Rev., 5.00%, 6/1/31 | 3,700,000 | | 3,756,971 | |
| Los Angeles Wastewater System Rev., 5.00%, 6/1/35 | 1,500,000 | | 1,611,296 | |
| Los Gatos-Saratoga Joint High School District GO, 4.00%, 8/1/44 | 10,000,000 | | 10,003,404 | |
Los Rios Community College District GO, 5.00%, 8/1/26(4) | 3,250,000 | | 3,414,737 | |
Manhattan Beach Unified School District GO, Capital Appreciation, 0.00%, 9/1/29(1) | 5,905,000 | | 5,155,152 | |
| Marina Redevelopment Agency Successor Agency Tax Allocation, 5.00%, 9/1/43 | 1,000,000 | | 1,051,983 | |
| Marina Redevelopment Agency Successor Agency Tax Allocation, 5.00%, 9/1/43 | 2,100,000 | | 2,209,163 | |
| Menifee Union School District GO, 4.00%, 8/1/46 | 5,000,000 | | 5,038,281 | |
| Menifee Union School District Special Tax, (Menifee Union School District Community Facilities District No. 2011-1 Area No. 5), 4.00%, 9/1/36 | 500,000 | | 508,068 | |
| Metropolitan Water District of Southern California Rev., 4.00%, 10/1/24 | 4,070,000 | | 4,073,655 | |
| Metropolitan Water District of Southern California Rev., 4.00%, 10/1/25 | 2,000,000 | | 2,034,331 | |
| Metropolitan Water District of Southern California Rev., 5.00%, 7/1/35 | 1,600,000 | | 1,878,222 | |
| Metropolitan Water District of Southern California Rev., 5.00%, 7/1/36 | 1,700,000 | | 1,984,083 | |
| Metropolitan Water District of Southern California Rev., 5.00%, 10/1/36 | 1,175,000 | | 1,341,369 | |
| | | | | | | | |
| Principal
Amount/Shares | Value |
| Metropolitan Water District of Southern California Rev., 5.00%, 7/1/37 | $ | 1,000,000 | | $ | 1,162,080 | |
| Middle Fork Project Finance Authority Rev., 5.00%, 4/1/27 | 3,000,000 | | 3,115,762 | |
| Middle Fork Project Finance Authority Rev., 5.00%, 4/1/31 | 3,895,000 | | 4,168,193 | |
| Milpitas Redevelopment Agency Successor Agency Tax Allocation, 5.00%, 9/1/25 | 2,325,000 | | 2,381,021 | |
| Milpitas Redevelopment Agency Successor Agency Tax Allocation, 5.00%, 9/1/26 | 6,285,000 | | 6,431,440 | |
| Monterey Peninsula Community College District GO, 4.00%, 8/1/42 | 445,000 | | 461,019 | |
| Monterey Peninsula Community College District GO, 4.00%, 8/1/43 | 875,000 | | 899,944 | |
| Monterey Peninsula Community College District GO, 4.00%, 8/1/44 | 650,000 | | 663,606 | |
| Monterey Peninsula Community College District GO, 4.00%, 8/1/45 | 775,000 | | 785,023 | |
| Moreno Valley Unified School District Community Facilities District Special Tax, (Moreno Valley Unified School District Community Facilities District No. 2018-1), 4.00%, 9/1/36 | 750,000 | | 744,536 | |
| Moreno Valley Unified School District Community Facilities District Special Tax, (Moreno Valley Unified School District Community Facilities District No. 2018-1), 4.00%, 9/1/41 | 1,625,000 | | 1,554,993 | |
| Moreno Valley Unified School District Community Facilities District Special Tax, (Moreno Valley Unified School District Community Facilities District No. 2018-1), 4.00%, 9/1/46 | 2,230,000 | | 2,025,360 | |
| Mountain View Los Altos Union High School District GO, 4.00%, 8/1/33 | 4,135,000 | | 4,535,960 | |
Mountain View School District School Facilities Improvement District No. 2 GO, Capital Appreciation, 0.00%, 7/1/29(1) | 7,495,000 | | 6,317,548 | |
| Mountain View-Whisman School District GO, 4.25%, 9/1/45 | 5,750,000 | | 5,946,555 | |
| M-S-R Energy Authority Rev., 7.00%, 11/1/34 (GA: Citigroup Global Markets) | 1,000,000 | | 1,262,394 | |
| M-S-R Energy Authority Rev., 7.00%, 11/1/34 (GA: Citigroup Global Markets) | 5,880,000 | | 7,422,874 | |
| M-S-R Energy Authority Rev., 6.50%, 11/1/39 (GA: Citigroup Global Markets) | 1,180,000 | | 1,530,915 | |
| M-S-R Energy Authority Rev., 6.50%, 11/1/39 (GA: Citigroup Global Markets) | 1,425,000 | | 1,848,774 | |
| Municipal Improvement Corp. of Los Angeles Rev., (City of Los Angeles CA), 5.00%, 11/1/25 | 750,000 | | 771,816 | |
| Napa Valley Community College District GO, Capital Appreciation, 4.00%, 8/1/33 | 2,850,000 | | 2,890,488 | |
| Napa Valley Community College District GO, Capital Appreciation, 4.00%, 8/1/34 | 1,500,000 | | 1,520,531 | |
| New Haven Unified School District GO, 4.00%, 8/1/38 | 250,000 | | 253,588 | |
| Norman Y Mineta San Jose International Airport SJC Rev., 5.00%, 3/1/27 | 1,295,000 | | 1,298,704 | |
| Norman Y Mineta San Jose International Airport SJC Rev., 5.00%, 3/1/28 | 1,500,000 | | 1,504,291 | |
| Norman Y Mineta San Jose International Airport SJC Rev., 5.00%, 3/1/30 | 1,750,000 | | 1,755,006 | |
| Norman Y Mineta San Jose International Airport SJC Rev., 5.00%, 3/1/31 | 1,000,000 | | 1,002,861 | |
| North Lake Tahoe Public Financing Authority Rev., (County of Placer CA), 5.25%, 12/1/42 | 3,250,000 | | 3,610,469 | |
| Northern California Energy Authority Rev., VRN, 5.00%, 12/1/54 (GA: Pacific Life Insurance Co.) | 10,000,000 | | 10,737,579 | |
| Northern California Power Agency Rev., 5.00%, 7/1/25 | 2,000,000 | | 2,040,827 | |
| Northern California Power Agency Rev., 5.00%, 7/1/26 | 2,250,000 | | 2,355,953 | |
| Northern California Sanitation Agencies Financing Authority Rev., (Sacramento Area Sewer District), 5.00%, 12/1/38 | 500,000 | | 596,384 | |
| Northern California Sanitation Agencies Financing Authority Rev., (Sacramento Area Sewer District), 5.00%, 12/1/39 | 1,000,000 | | 1,187,332 | |
| Northern California Transmission Agency Rev., 5.00%, 5/1/28 | 1,000,000 | | 1,038,494 | |
| Northern California Transmission Agency Rev., 5.00%, 5/1/29 | 1,000,000 | | 1,038,188 | |
| Northern California Transmission Agency Rev., 5.00%, 5/1/30 | 1,855,000 | | 1,922,369 | |
| Novato Redevelopment Agency Successor Agency Tax Allocation, 4.00%, 9/1/36 | 1,825,000 | | 1,858,304 | |
| Novato Redevelopment Agency Successor Agency Tax Allocation, 4.00%, 9/1/37 | 1,900,000 | | 1,933,058 | |
| Novato Redevelopment Agency Successor Agency Tax Allocation, 4.00%, 9/1/38 | 1,420,000 | | 1,444,363 | |
| Oakland Sewer Rev., 5.00%, 6/15/26 | 1,200,000 | | 1,201,662 | |
| Oakland Unified School District/Alameda County GO, 5.00%, 8/1/25 | 650,000 | | 664,392 | |
| Oakland Unified School District/Alameda County GO, 5.00%, 8/1/28 | 1,185,000 | | 1,231,542 | |
| Oakland Unified School District/Alameda County GO, 5.25%, 8/1/40 (AGM) | 1,500,000 | | 1,733,201 | |
| Oakland Unified School District/Alameda County GO, 5.25%, 8/1/41 (AGM) | 2,250,000 | | 2,587,152 | |
| Ontario Special Tax, (City of Ontario CA Community Facilities District No. 35), 5.00%, 9/1/39 | 500,000 | | 543,207 | |
| Ontario Special Tax, (City of Ontario CA Community Facilities District No. 35), 5.00%, 9/1/44 | 500,000 | | 530,016 | |
| Ontario Community Facilities District No. 30 Special Tax, 4.00%, 9/1/24 | 315,000 | | 315,000 | |
| Ontario Community Facilities District No. 30 Special Tax, 4.00%, 9/1/25 | 325,000 | | 327,014 | |
| Ontario Community Facilities District No. 30 Special Tax, 4.00%, 9/1/26 | 340,000 | | 344,945 | |
| Ontario Community Facilities District No. 30 Special Tax, 4.00%, 9/1/29 | 230,000 | | 235,010 | |
| | | | | | | | |
| Principal
Amount/Shares | Value |
| Ontario Community Facilities District No. 56 Special Tax, (City of Ontario CA Community Facilities District No. 56), 5.00%, 9/1/38 | $ | 1,200,000 | | $ | 1,297,078 | |
| Ontario Community Facilities District No. 56 Special Tax, (City of Ontario CA Community Facilities District No. 56), 5.25%, 9/1/43 | 1,000,000 | | 1,075,890 | |
| Ontario Montclair School District GO, 4.00%, 8/1/48 | 3,000,000 | | 2,993,660 | |
| Ontario Montclair School District GO, 4.00%, 8/1/48 | 9,255,000 | | 9,179,174 | |
| Ontario Public Financing Authority Rev., (City of Ontario CA Water Rev.), 5.00%, 8/1/49 | 1,500,000 | | 1,669,377 | |
| Orange County Special Assessment, (County of Orange CA Reassessment District No. 17-1R), 3.00%, 9/2/25 | 285,000 | | 285,666 | |
| Orange County Special Assessment, (County of Orange CA Reassessment District No. 17-1R), 5.00%, 9/2/26 | 600,000 | | 628,079 | |
| Orange County Special Assessment, (County of Orange CA Reassessment District No. 17-1R), 5.00%, 9/2/28 | 600,000 | | 656,068 | |
| Orange County Special Assessment, (County of Orange CA Reassessment District No. 17-1R), 5.00%, 9/2/30 | 875,000 | | 954,788 | |
Orange County Airport Rev., 5.00%, 7/1/25(2) | 1,000,000 | | 1,019,419 | |
Orange County Airport Rev., 5.00%, 7/1/26(2) | 1,000,000 | | 1,044,892 | |
| Orange County Community Facilities District Special Tax, (County of Orange CA Community Facilities District No. 2016-1), 5.00%, 8/15/29 | 2,000,000 | | 2,071,307 | |
| Orange County Community Facilities District Special Tax, (County of Orange CA Community Facilities District No. 2016-1), 5.00%, 8/15/30 | 2,220,000 | | 2,296,182 | |
| Orange County Community Facilities District Special Tax, (County of Orange CA Community Facilities District No. 2016-1), 5.00%, 8/15/32 | 2,575,000 | | 2,654,345 | |
| Orange County Community Facilities District Special Tax, (County of Orange CA Community Facilities District No. 2021-1), 5.00%, 8/15/37 | 1,300,000 | | 1,405,569 | |
| Orange County Community Facilities District Special Tax, (County of Orange CA Community Facilities District No. 2021-1), 5.00%, 8/15/47 | 1,700,000 | | 1,773,792 | |
| Orange County Community Facilities District Special Tax, (County of Orange CA Community Facilities District No. 2023-1), 5.50%, 8/15/48 | 1,200,000 | | 1,299,394 | |
| Orange County Sanitation District Rev., 5.00%, 2/1/36 | 6,130,000 | | 6,290,265 | |
Orange County Transportation Authority Rev., 4.00%, 10/15/24(2) | 10,000,000 | | 10,012,679 | |
| Oroville Rev., (Oroville Hospital), 5.25%, 4/1/34 | 1,685,000 | | 1,263,750 | |
| Oroville Rev., (Oroville Hospital), 5.25%, 4/1/39 | 3,500,000 | | 2,625,000 | |
| Oxnard Financing Authority Rev., (City of Oxnard CA Wastewater Rev.), 5.00%, 6/1/25 (AGM) | 2,000,000 | | 2,002,905 | |
| Oxnard Financing Authority Rev., (City of Oxnard CA Wastewater Rev.), 5.00%, 6/1/26 (AGM) | 3,690,000 | | 3,695,104 | |
| Oxnard Financing Authority Rev., (City of Oxnard CA Wastewater Rev.), 5.00%, 6/1/28 (AGM) | 1,515,000 | | 1,516,991 | |
| Oxnard Financing Authority Rev., (City of Oxnard CA Wastewater Rev.), 5.00%, 6/1/32 (AGM) | 2,500,000 | | 2,502,808 | |
| Oxnard Financing Authority Rev., (City of Oxnard CA Wastewater Rev.), 5.00%, 6/1/33 (AGM) | 1,000,000 | | 1,001,116 | |
| Oxnard School District GO, 5.00%, 8/1/41 (BAM) | 1,000,000 | | 1,129,342 | |
| Oxnard School District GO, 5.00%, 8/1/44 (BAM) | 1,190,000 | | 1,328,859 | |
Oxnard School District GO, VRN, 5.00%, 8/1/25, Prerefunded at 100% of Par (AGM)(2) | 3,750,000 | | 3,835,082 | |
| Palm Desert Redevelopment Agency Successor Agency Tax Allocation, 5.00%, 10/1/30 (BAM) | 350,000 | | 368,920 | |
| Palmdale Community Redevelopment Agency Successor Agency Tax Allocation, 5.00%, 9/1/28 (NPFG) | 2,150,000 | | 2,258,333 | |
| Palmdale Community Redevelopment Agency Successor Agency Tax Allocation, 5.00%, 9/1/29 (NPFG) | 2,075,000 | | 2,180,235 | |
| Palmdale Community Redevelopment Agency Successor Agency Tax Allocation, 5.00%, 9/1/30 (NPFG) | 1,215,000 | | 1,272,438 | |
| Palomar Health COP, (Palomar Health Obligated Group), 5.00%, 11/1/25 | 650,000 | | 657,925 | |
| Palomar Health COP, (Palomar Health Obligated Group), 5.00%, 11/1/26 | 475,000 | | 484,265 | |
| Palomar Health COP, (Palomar Health Obligated Group), 5.00%, 11/1/27 | 720,000 | | 732,182 | |
| Palomar Health COP, (Palomar Health Obligated Group), 5.00%, 11/1/32 | 4,000,000 | | 4,015,856 | |
| Palomar Health COP, (Palomar Health Obligated Group), Capital Appreciation, 7.00%, 8/1/38 (AGC) | 3,330,000 | | 3,810,377 | |
| Palomar Health GO, (Palomar Health Obligated Group), 5.00%, 8/1/28 | 1,340,000 | | 1,373,013 | |
| Palomar Health Rev., (Palomar Health Obligated Group), 5.00%, 11/1/24 | 2,375,000 | | 2,377,964 | |
| Palomar Health Rev., (Palomar Health Obligated Group), 5.00%, 11/1/29 | 4,585,000 | | 4,595,569 | |
| Palomar Health Rev., (Palomar Health Obligated Group), 5.00%, 11/1/36 | 4,080,000 | | 4,038,057 | |
Palos Verdes Peninsula Unified School District GO, Capital Appreciation, 0.00%, 8/1/33(1) | 2,600,000 | | 1,984,078 | |
| Pasadena Area Community College District GO, 5.00%, 8/1/48 | 3,320,000 | | 3,673,037 | |
| Pasadena Unified School District GO, 5.00%, 8/1/29 | 2,700,000 | | 3,032,589 | |
| Peninsula Corridor Joint Powers Board Rev., 5.00%, 10/1/31 | 1,045,000 | | 1,155,018 | |
| Peninsula Corridor Joint Powers Board Rev., 5.00%, 10/1/32 | 785,000 | | 866,592 | |
| Peninsula Corridor Joint Powers Board Rev., 5.00%, 10/1/36 | 300,000 | | 330,574 | |
| Peninsula Corridor Joint Powers Board Rev., 5.00%, 10/1/37 | 435,000 | | 477,336 | |
| | | | | | | | |
| Principal
Amount/Shares | Value |
| Peninsula Corridor Joint Powers Board Rev., 5.00%, 10/1/38 | $ | 550,000 | | $ | 598,558 | |
| Peninsula Corridor Joint Powers Board Rev., 5.00%, 10/1/39 | 1,210,000 | | 1,308,227 | |
| Peninsula Corridor Joint Powers Board Rev., 5.00%, 6/1/41 | 3,625,000 | | 4,028,872 | |
| Pittsburg Successor Agency Redevelopment Agency Tax Allocation, 5.00%, 9/1/27 (AGM) | 3,340,000 | | 3,475,038 | |
| Pittsburg Successor Agency Redevelopment Agency Tax Allocation, 5.00%, 9/1/29 (AGM) | 3,000,000 | | 3,121,756 | |
| Pleasanton Unified School District GO, 4.00%, 8/1/42 | 3,280,000 | | 3,354,271 | |
| Pomona Unified School District GO, 6.55%, 8/1/29 (NPFG) | 740,000 | | 815,121 | |
| Pomona Unified School District GO, 5.00%, 8/1/42 | 150,000 | | 171,514 | |
| Pomona Unified School District GO, 5.00%, 8/1/43 | 200,000 | | 227,144 | |
| Pomona Unified School District GO, 5.00%, 8/1/44 | 400,000 | | 451,435 | |
| Pomona Unified School District GO, 5.00%, 8/1/45 | 750,000 | | 843,473 | |
| Pomona Unified School District GO, 5.00%, 8/1/46 | 250,000 | | 280,273 | |
Poway Unified School District GO, (Poway Unified School District Facilities Improvement District No. 2007-1), Capital Appreciation, 0.00%, 8/1/38(1) | 2,000,000 | | 1,218,336 | |
Poway Unified School District GO, (Poway Unified School District Facilities Improvement District No. 2007-1), Capital Appreciation, 0.00%, 8/1/41(1) | 4,890,000 | | 2,539,808 | |
| Poway Unified School District Public Financing Authority Special Tax, 5.00%, 9/1/31 | 1,630,000 | | 1,704,050 | |
| Rancho Santa Fe Community Services District Special Tax, (Rancho Santa Fe Community Services District Community Facilities District No. 1), 5.00%, 9/1/27 | 1,500,000 | | 1,558,277 | |
| Ravenswood City School District GO, 5.25%, 8/1/45 (AGM) | 3,375,000 | | 3,697,660 | |
| Redwood City School District GO, 5.00%, 8/1/38 | 200,000 | | 234,053 | |
| Redwood City School District GO, 5.00%, 8/1/39 | 250,000 | | 290,847 | |
| Redwood City School District GO, 5.00%, 8/1/40 | 350,000 | | 403,649 | |
| Regents of the University of California Medical Center Pooled Rev., 5.00%, 5/15/33 | 3,015,000 | | 3,115,101 | |
| Regents of the University of California Medical Center Pooled Rev., 5.00%, 5/15/33 | 2,900,000 | | 3,405,793 | |
| Regents of the University of California Medical Center Pooled Rev., 5.00%, 5/15/34 | 2,000,000 | | 2,065,774 | |
| Regents of the University of California Medical Center Pooled Rev., 5.00%, 5/15/34 | 6,000,000 | | 7,007,219 | |
| Regents of the University of California Medical Center Pooled Rev., VRDN, 3.60%, 9/3/24 | 4,100,000 | | 4,100,000 | |
| Regents of the University of California Medical Center Pooled Rev., VRDN, 3.85%, 9/3/24 | 865,000 | | 865,000 | |
| Regents of the University of California Medical Center Pooled Rev., VRDN, 3.85%, 9/3/24 | 5,565,000 | | 5,565,000 | |
Rialto Unified School District GO, Capital Appreciation, 0.00%, 8/1/46 (BAM)(1) | 1,000,000 | | 361,351 | |
Rialto Unified School District GO, Capital Appreciation, 0.00%, 8/1/47 (BAM)(1) | 1,175,000 | | 401,953 | |
| Rio Elementary School District Community Facilities District Special Tax, (Rio Elementary School District Community Facilities District No. 1), 5.00%, 9/1/24 | 700,000 | | 700,000 | |
| Riverside County Public Financing Authority Tax Allocation, (Riverside County Public Financing Authority Redevelopment Project Area No. 1), 5.00%, 10/1/27 (AGM) | 250,000 | | 267,719 | |
| Riverside County Public Financing Authority Tax Allocation, (Riverside County Public Financing Authority Redevelopment Project Area No. 1), 5.00%, 10/1/28 (AGM) | 500,000 | | 546,385 | |
| Riverside County Public Financing Authority Tax Allocation, (Riverside County Public Financing Authority Redevelopment Project Area No. 1), 5.00%, 10/1/34 (AGM) | 1,000,000 | | 1,187,207 | |
| Riverside County Public Financing Authority Tax Allocation, (Riverside County Public Financing Authority Redevelopment Project Area No. 1), 5.00%, 10/1/35 (AGM) | 1,325,000 | | 1,562,180 | |
| Riverside County Public Financing Authority Tax Allocation, (Riverside County Public Financing Authority Redevelopment Project Area No. 1), 5.00%, 10/1/36 (AGM) | 1,000,000 | | 1,170,771 | |
| Riverside County Public Financing Authority Tax Allocation, (Riverside County Public Financing Authority Redevelopment Project Area No. 1), 5.00%, 10/1/37 (AGM) | 750,000 | | 873,707 | |
| Riverside County Transportation Commission Rev., 4.00%, 6/1/40 | 2,500,000 | | 2,525,758 | |
| Riverside County Transportation Commission Rev., 4.00%, 6/1/46 | 1,820,000 | | 1,798,972 | |
Riverside County Transportation Commission Rev., Capital Appreciation, 0.00%, 6/1/28(1)(2) | 465,000 | | 419,056 | |
Riverside County Transportation Commission Rev., Capital Appreciation, 0.00%, 6/1/28(1) | 535,000 | | 471,937 | |
Riverside County Transportation Commission Rev., Capital Appreciation, 0.00%, 6/1/30(1) | 1,000,000 | | 821,357 | |
Riverside County Transportation Commission Rev., Capital Appreciation, 0.00%, 6/1/31(1) | 1,555,000 | | 1,229,679 | |
| Riverside Sewer Rev., 5.00%, 8/1/25 | 1,630,000 | | 1,668,768 | |
| Riverside Sewer Rev., 5.00%, 8/1/26 | 3,400,000 | | 3,474,155 | |
| Riverside Sewer Rev., 5.00%, 8/1/28 | 1,935,000 | | 1,974,492 | |
| Riverside Sewer Rev., 5.00%, 8/1/29 | 1,330,000 | | 1,356,634 | |
| Riverside Sewer Rev., 5.00%, 8/1/35 | 3,750,000 | | 4,063,345 | |
| | | | | | | | |
| Principal
Amount/Shares | Value |
| Riverside Sewer Rev., 5.00%, 8/1/37 | $ | 3,265,000 | | $ | 3,519,086 | |
| Romoland School District Special Tax, (Romoland School District Community Facilities District No. 2004-1 Area No. 4), 5.00%, 9/1/36 | 1,000,000 | | 1,042,434 | |
| Romoland School District Special Tax, (Romoland School District Community Facilities District No. 2004-1 Area No. 4), 5.00%, 9/1/37 | 1,100,000 | | 1,146,250 | |
| Romoland School District Special Tax, (Romoland School District Community Facilities District No. 2004-1 Area No. 4), 5.00%, 9/1/38 | 1,000,000 | | 1,041,289 | |
| Romoland School District Special Tax, (Romoland School District Community Facilities District No. 2020-1), 5.00%, 9/1/44 | 565,000 | | 602,711 | |
| Romoland School District Special Tax, (Romoland School District-Community Facilities District No. 2017-1 Impt Area 2), 5.00%, 9/1/38 | 250,000 | | 271,632 | |
| Romoland School District Special Tax, (Romoland School District-Community Facilities District No. 2017-1 Impt Area 2), 5.00%, 9/1/43 | 425,000 | | 452,974 | |
Roseville Special Tax, (City of Roseville CA Amoruso Ranch Community Facilities District 1 Impt Area 1), 5.00%, 9/1/34(4) | 250,000 | | 271,594 | |
Roseville Special Tax, (City of Roseville CA Amoruso Ranch Community Facilities District 1 Impt Area 1), 5.00%, 9/1/39(4) | 1,000,000 | | 1,071,011 | |
Roseville Special Tax, (City of Roseville CA Amoruso Ranch Community Facilities District 1 Impt Area 1), 5.00%, 9/1/44(4) | 550,000 | | 577,972 | |
| Roseville Special Tax, (City of Roseville CA Creekview Community Facilities District No. 1 Area No. 1), 5.00%, 9/1/40 | 1,260,000 | | 1,323,522 | |
| Roseville Special Tax, (City of Roseville CA Fiddyment Ranch Community Facilities District No. 1), 5.00%, 9/1/26 | 1,075,000 | | 1,120,543 | |
| Roseville Special Tax, (City of Roseville CA Fiddyment Ranch Community Facilities District No. 1), 5.00%, 9/1/28 | 1,025,000 | | 1,076,764 | |
| Roseville Special Tax, (City of Roseville CA Fiddyment Ranch Community Facilities District No. 1), 5.00%, 9/1/30 | 1,390,000 | | 1,442,631 | |
| Roseville Special Tax, (City of Roseville CA Fiddyment Ranch Community Facilities District No. 1), 5.00%, 9/1/32 | 1,245,000 | | 1,286,356 | |
| Roseville Special Tax, (City of Roseville CA Fiddyment Ranch Community Facilities District No. 1), 5.00%, 9/1/34 | 1,045,000 | | 1,077,629 | |
| Roseville Special Tax, (City of Roseville CA SVSP Westpark-Federico Community Facilities District No. 1), 4.00%, 9/1/37 | 350,000 | | 351,358 | |
| Roseville Water Utility COP, 5.00%, 12/1/26 | 1,690,000 | | 1,746,489 | |
| Roseville Water Utility COP, 5.00%, 12/1/27 | 2,250,000 | | 2,327,447 | |
| Sacramento Special Tax, (City of Sacramento CA Greenbriar Community Facs District No. 2018-03 Area No. 1), 3.00%, 9/1/25 | 450,000 | | 447,227 | |
| Sacramento Special Tax, (City of Sacramento CA Greenbriar Community Facs District No. 2018-03 Area No. 1), 4.00%, 9/1/27 | 570,000 | | 581,143 | |
| Sacramento Special Tax, (City of Sacramento CA Greenbriar Community Facs District No. 2018-03 Area No. 1), 4.00%, 9/1/29 | 710,000 | | 730,700 | |
| Sacramento Special Tax, (City of Sacramento CA Greenbriar Community Facs District No. 2018-03 Area No. 1), 4.00%, 9/1/30 | 265,000 | | 272,636 | |
| Sacramento Special Tax, (City of Sacramento CA Greenbriar Community Facs District No. 2018-03 Area No. 1), 4.00%, 9/1/31 | 220,000 | | 225,585 | |
| Sacramento Special Tax, (City of Sacramento CA Greenbriar Community Facs District No. 2018-03 Area No. 1), 4.00%, 9/1/32 | 315,000 | | 322,157 | |
| Sacramento Special Tax, (City of Sacramento CA Greenbriar Community Facs District No. 2018-03 Area No. 1), 4.00%, 9/1/34 | 560,000 | | 570,005 | |
| Sacramento Special Tax, (City of Sacramento CA Greenbriar Community Facs District No. 2018-03 Area No. 1), 4.00%, 9/1/36 | 660,000 | | 665,697 | |
| Sacramento Special Tax, (City of Sacramento CA Greenbriar Community Facs District No. 2018-03 Area No. 1), 4.00%, 9/1/41 | 1,000,000 | | 981,650 | |
| Sacramento County Airport System Rev., 5.00%, 7/1/33 | 1,450,000 | | 1,558,817 | |
| Sacramento County Airport System Rev., 5.00%, 7/1/34 | 1,000,000 | | 1,073,683 | |
| Sacramento County Airport System Rev., 5.00%, 7/1/35 | 1,000,000 | | 1,071,853 | |
| Sacramento County Water Financing Authority Rev., (Sacramento County Water Agency), 4.00%, 11/1/25 | 22,140,000 | | 22,466,837 | |
| Sacramento Municipal Utility District Rev., 5.00%, 8/15/25 | 2,000,000 | | 2,048,848 | |
| Sacramento Municipal Utility District Rev., 5.00%, 8/15/26 | 6,500,000 | | 6,827,173 | |
| Sacramento Municipal Utility District Rev., 5.00%, 8/15/27 | 6,500,000 | | 7,009,256 | |
| Sacramento Municipal Utility District Rev., 5.00%, 8/15/28 | 4,000,000 | | 4,415,487 | |
| Sacramento Municipal Utility District Rev., 5.00%, 8/15/36 | 7,465,000 | | 8,396,887 | |
| Sacramento Municipal Utility District Rev., 5.00%, 11/15/40 | 890,000 | | 1,036,003 | |
| Sacramento Municipal Utility District Rev., 5.00%, 11/15/41 | 4,350,000 | | 5,029,125 | |
| Sacramento Municipal Utility District Rev., 5.00%, 11/15/42 | 1,000,000 | | 1,150,671 | |
| | | | | | | | |
| Principal
Amount/Shares | Value |
| Sacramento Redevelopment Agency Successor Agency Tax Allocation, 5.00%, 12/1/34 (BAM) | $ | 1,355,000 | | $ | 1,389,003 | |
| Sacramento Transient Occupancy Tax Rev., 5.00%, 6/1/36 | 3,220,000 | | 3,428,431 | |
| Sacramento Transient Occupancy Tax Rev., 5.00%, 6/1/38 | 1,000,000 | | 1,057,924 | |
| Sacramento Transportation Authority Sales Tax Rev., 5.00%, 10/1/24 | 750,000 | | 751,231 | |
| Sacramento Transportation Authority Sales Tax Rev., 5.00%, 10/1/25 | 1,050,000 | | 1,079,468 | |
| Sacramento Transportation Authority Sales Tax Rev., 5.00%, 10/1/26 | 825,000 | | 870,817 | |
| San Bernardino Redevelopment Agency Successor Agency Tax Allocation, 5.00%, 12/1/24 (AGM) | 2,310,000 | | 2,320,224 | |
| San Bernardino Redevelopment Agency Successor Agency Tax Allocation, 5.00%, 12/1/25 (AGM) | 1,275,000 | | 1,307,029 | |
| San Diego Community College District GO, (San Diego Community College District), 4.00%, 8/1/42 | 2,000,000 | | 2,091,071 | |
| San Diego Community College District GO, (San Diego Community College District), 4.00%, 8/1/43 | 1,800,000 | | 1,868,449 | |
| San Diego County COP, 5.00%, 10/1/48 | 4,735,000 | | 5,253,997 | |
| San Diego County Rev., (Sanford Burnham Prebys Medical Discovery Institute), 5.00%, 11/1/30 | 675,000 | | 694,466 | |
| San Diego County Regional Airport Authority Rev., 5.00%, 7/1/31 | 1,000,000 | | 1,059,208 | |
| San Diego County Regional Airport Authority Rev., 5.00%, 7/1/32 | 850,000 | | 899,105 | |
| San Diego County Regional Airport Authority Rev., 5.00%, 7/1/33 | 1,000,000 | | 1,056,782 | |
| San Diego County Regional Airport Authority Rev., 5.00%, 7/1/34 | 700,000 | | 739,039 | |
| San Diego County Regional Airport Authority Rev., 5.00%, 7/1/35 | 1,000,000 | | 1,054,410 | |
| San Diego County Regional Airport Authority Rev., 5.00%, 7/1/39 | 1,000,000 | | 1,086,633 | |
| San Diego County Regional Airport Authority Rev., (San Diego County Regional Airport Authority Special Facilities Rev.), 5.00%, 7/1/44 | 3,000,000 | | 3,001,924 | |
| San Diego County Regional Transportation Commission Rev., 5.00%, 4/1/38 | 1,300,000 | | 1,521,052 | |
| San Diego County Water Authority Rev., 5.00%, 5/1/25 | 5,250,000 | | 5,336,143 | |
| San Diego County Water Authority Rev., 5.00%, 5/1/26 | 2,390,000 | | 2,430,424 | |
| San Diego County Water Authority Rev., 5.00%, 5/1/27 | 3,485,000 | | 3,537,668 | |
| San Diego County Water Authority Rev., 5.00%, 5/1/28 | 3,000,000 | | 3,273,216 | |
| San Diego County Water Authority Rev., 4.00%, 5/1/34 | 1,900,000 | | 2,050,861 | |
| San Diego Public Facilities Financing Authority Rev., (City of San Diego CA Sewer Utility Rev.), 5.00%, 5/15/28 | 10,000,000 | | 10,437,693 | |
| San Diego Public Facilities Financing Authority Rev., (City of San Diego CA Sewer Utility Rev.), 5.00%, 8/1/38 | 5,000,000 | | 5,369,496 | |
| San Diego Public Facilities Financing Authority Rev., (City of San Diego CA Sewer Utility Rev.), 5.00%, 5/15/39 | 1,800,000 | | 2,051,377 | |
| San Diego Unified Port District Rev., 5.00%, 9/1/24 | 500,000 | | 500,000 | |
San Diego Unified School District GO, 5.00%, 7/1/31(4) | 500,000 | | 567,347 | |
| San Diego Unified School District GO, 5.00%, 7/1/33 | 1,320,000 | | 1,401,292 | |
San Diego Unified School District GO, 5.00%, 7/1/34(4) | 1,000,000 | | 1,180,866 | |
San Diego Unified School District GO, 5.00%, 7/1/36(4) | 500,000 | | 584,876 | |
San Diego Unified School District GO, Capital Appreciation, 0.00%, 7/1/39(1) | 1,410,000 | | 788,787 | |
| San Francisco Bay Area Rapid Transit District GO, 5.00%, 8/1/40 | 5,000,000 | | 5,689,129 | |
| San Francisco Bay Area Rapid Transit District GO, 4.00%, 8/1/42 | 7,425,000 | | 7,437,696 | |
| San Francisco Bay Area Rapid Transit District Rev., 5.00%, 7/1/28 | 1,500,000 | | 1,528,730 | |
| San Francisco City & County Airport Comm-San Francisco International Airport Rev., 5.00%, 5/1/39 | 6,000,000 | | 6,505,807 | |
| San Francisco City & County Airport Comm-San Francisco International Airport Rev., 5.00%, 5/1/40 | 1,000,000 | | 1,154,427 | |
| San Francisco City & County Airport Comm-San Francisco International Airport Rev., 5.00%, 5/1/43 | 6,750,000 | | 7,588,077 | |
| San Francisco City & County Public Utilities Commission Wastewater Rev., 5.25%, 10/1/42 | 1,000,000 | | 1,147,806 | |
| San Francisco City & County Public Utilities Commission Wastewater Rev., VRN, 4.00%, 10/1/48 | 2,485,000 | | 2,615,482 | |
| San Francisco City & County Redevelopment Agency Successor Agency Tax Allocation, (Mission Bay South Redevelopment Area Tax Increment Financing District), 5.00%, 8/1/26 | 425,000 | | 425,483 | |
| San Francisco City & County Redevelopment Agency Successor Agency Tax Allocation, (Mission Bay South Redevelopment Area Tax Increment Financing District), 5.00%, 8/1/27 | 550,000 | | 550,626 | |
| San Francisco City & County Redevelopment Agency Successor Agency Tax Allocation, (Mission Bay South Redevelopment Area Tax Increment Financing District), 5.00%, 8/1/28 | 370,000 | | 370,420 | |
| San Francisco City & County Redevelopment Agency Successor Agency Tax Allocation, (Mission Bay South Redevelopment Area Tax Increment Financing District), 5.00%, 8/1/31 | 400,000 | | 400,354 | |
| San Francisco Public Utilities Commission Water Rev., 5.00%, 11/1/28 | 1,055,000 | | 1,071,752 | |
| San Francisco Public Utilities Commission Water Rev., 5.25%, 11/1/48 | 7,000,000 | | 7,932,156 | |
| San Gorgonio Memorial Health Care District GO, 5.00%, 8/1/25 | 850,000 | | 848,736 | |
| San Joaquin Hills Transportation Corridor Agency Rev., 4.00%, 1/15/34 | 1,500,000 | | 1,580,971 | |
| San Joaquin Hills Transportation Corridor Agency Rev., 4.00%, 1/15/34 | 7,809,000 | | 8,230,535 | |
| | | | | | | | |
| Principal
Amount/Shares | Value |
| San Joaquin Hills Transportation Corridor Agency Rev., 4.00%, 1/15/35 | $ | 1,730,000 | | $ | 1,818,469 | |
| San Joaquin Hills Transportation Corridor Agency Rev., 4.00%, 1/15/36 | 1,400,000 | | 1,465,750 | |
| San Joaquin Hills Transportation Corridor Agency Rev., 4.00%, 1/15/44 | 986,000 | | 994,347 | |
| San Joaquin Hills Transportation Corridor Agency Rev., 5.25%, 1/15/44 | 3,270,000 | | 3,286,039 | |
| San Jose Evergreen Community College District GO, 4.00%, 9/1/45 | 5,000,000 | | 5,075,059 | |
| San Luis Obispo Community Facilities District No. 2019-1 Special Tax, 4.00%, 9/1/36 | 150,000 | | 151,667 | |
| San Luis Obispo County Financing Authority Rev., (County of San Luis Obispo CA), 5.50%, 11/15/47 | 4,000,000 | | 4,509,296 | |
| San Mateo County Transit District Rev., (San Mateo County Transit District Sales Tax Rev.), 3.375%, 6/1/34 | 5,835,000 | | 5,767,362 | |
| San Mateo Foster City Public Financing Authority Rev., (City of San Mateo CA Sewer Rev.), 5.00%, 8/1/34 | 1,050,000 | | 1,164,367 | |
| San Mateo Foster City Public Financing Authority Rev., (City of San Mateo CA Sewer Rev.), 4.00%, 8/1/35 | 1,100,000 | | 1,146,848 | |
| San Mateo Foster City Public Financing Authority Rev., (City of San Mateo CA Sewer Rev.), 5.00%, 8/1/36 | 1,885,000 | | 2,078,557 | |
San Mateo Foster City Public Financing Authority Rev., (Estero Municipal Improvement District), 5.00%, 8/1/25(2) | 3,940,000 | | 4,029,393 | |
| San Mateo Foster City School District GO, 5.00%, 8/1/40 | 1,000,000 | | 1,143,067 | |
| San Mateo Foster City School District GO, 5.00%, 8/1/41 | 1,150,000 | | 1,305,074 | |
| San Mateo Foster City School District GO, 4.00%, 8/1/42 | 1,000,000 | | 1,043,138 | |
| Santa Ana Gas Tax Rev., 5.00%, 1/1/34 | 720,000 | | 787,065 | |
| Santa Ana Gas Tax Rev., 5.00%, 1/1/35 | 1,260,000 | | 1,374,757 | |
| Santa Ana Gas Tax Rev., 5.00%, 1/1/37 | 1,260,000 | | 1,360,612 | |
| Santa Barbara Financing Authority Rev., (City of Santa Barbara CA), 5.00%, 4/1/29 | 1,515,000 | | 1,689,694 | |
| Santa Barbara Financing Authority Rev., (City of Santa Barbara CA), 5.00%, 4/1/31 | 845,000 | | 938,135 | |
| Santa Barbara Financing Authority Rev., (City of Santa Barbara CA), 5.00%, 4/1/33 | 840,000 | | 928,580 | |
| Santa Barbara Financing Authority Rev., (City of Santa Barbara CA), 5.00%, 4/1/35 | 2,035,000 | | 2,238,452 | |
| Santa Barbara Financing Authority Rev., (City of Santa Barbara CA), 5.00%, 4/1/38 | 1,000,000 | | 1,089,402 | |
| Santa Clara Valley Water District Safe Clean Water COP, 5.00%, 12/1/26 | 2,000,000 | | 2,110,195 | |
| Santa Clarita Community College District GO, 5.25%, 8/1/45 | 3,000,000 | | 3,376,077 | |
| Santa Clarita Community College District GO, 5.25%, 8/1/48 | 3,500,000 | | 3,916,873 | |
| Santa Cruz County Redevelopment Agency Tax Allocation, 5.00%, 9/1/35 (AGM) | 1,500,000 | | 1,529,375 | |
| Santa Monica Redevelopment Agency Tax Allocation, (Santa Monica Redevelopment Agency Successor Agy Earthquake Recovery Redev Proj), 5.875%, 7/1/42 | 1,000,000 | | 1,001,861 | |
| Santa Paula Special Tax, (City of Santa Paula CA Harvest Community Facilities District No. 1 Area A), 5.00%, 9/1/40 | 1,000,000 | | 1,050,414 | |
| Santa Paula Utility Authority Rev., (City of Santa Paula CA), 5.00%, 2/1/29 (AGM) | 1,920,000 | | 2,122,743 | |
| Santa Paula Utility Authority Rev., (City of Santa Paula CA), 5.00%, 2/1/30 (AGM) | 2,225,000 | | 2,454,403 | |
| Santa Paula Utility Authority Rev., (City of Santa Paula CA), 5.00%, 2/1/31 (AGM) | 2,090,000 | | 2,296,981 | |
| Santa Paula Utility Authority Rev., (City of Santa Paula CA), 5.00%, 2/1/32 (AGM) | 1,900,000 | | 2,080,797 | |
| Santa Paula Utility Authority Rev., (City of Santa Paula CA), 4.00%, 2/1/33 (AGM) | 2,000,000 | | 2,065,982 | |
| Santa Paula Utility Authority Rev., (City of Santa Paula CA), 4.00%, 2/1/34 (AGM) | 600,000 | | 620,077 | |
| Sierra Joint Community College District GO, 4.00%, 8/1/48 | 4,000,000 | | 4,011,196 | |
| Sonoma Community Development Agency Successor Agency Tax Allocation, 5.00%, 6/1/25 (NPFG) | 715,000 | | 726,503 | |
| Sonoma Community Development Agency Successor Agency Tax Allocation, 5.00%, 6/1/29 (NPFG) | 1,100,000 | | 1,148,630 | |
| Sonoma Community Development Agency Successor Agency Tax Allocation, 5.00%, 6/1/33 (NPFG) | 1,325,000 | | 1,376,188 | |
South Bayside Waste Management Authority Rev., 5.00%, 9/1/33 (AGM)(2) | 15,000 | | 16,638 | |
| South Bayside Waste Management Authority Rev., 5.00%, 9/1/33 (AGM) | 435,000 | | 475,534 | |
South Bayside Waste Management Authority Rev., 5.00%, 9/1/36 (AGM)(2) | 70,000 | | 77,645 | |
| South Bayside Waste Management Authority Rev., 5.00%, 9/1/36 (AGM) | 2,040,000 | | 2,217,334 | |
| South Bayside Waste Management Authority Rev., 5.00%, 9/1/39 (AGM) | 2,450,000 | | 2,617,571 | |
South Bayside Waste Management Authority Rev., 5.00%, 9/1/40 (AGM)(2) | 80,000 | | 88,737 | |
| South Orange County Public Financing Authority Rev., (County of Orange CA), 5.00%, 6/1/37 | 1,935,000 | | 2,213,335 | |
| South Orange County Public Financing Authority Rev., (County of Orange CA), 5.00%, 6/1/38 | 1,400,000 | | 1,592,158 | |
| South Orange County Public Financing Authority Special Tax, 5.00%, 8/15/25 | 1,125,000 | | 1,143,218 | |
| South Orange County Public Financing Authority Special Tax, 5.00%, 8/15/26 | 1,000,000 | | 1,033,681 | |
| South Orange County Public Financing Authority Special Tax, 5.00%, 8/15/27 | 1,155,000 | | 1,224,762 | |
| South Orange County Public Financing Authority Special Tax, 5.00%, 8/15/28 | 1,340,000 | | 1,430,481 | |
| Southern California Public Power Authority Rev., 5.00%, 11/1/28 (GA: Goldman Sachs Group, Inc.) | 835,000 | | 875,550 | |
| | | | | | | | |
| Principal
Amount/Shares | Value |
| Southern California Public Power Authority Rev., (City of Anaheim CA Electric System Rev.), VRN, 5.00%, 4/1/55 (GA: American General Life) | $ | 6,000,000 | | $ | 6,462,403 | |
| Southern California Public Power Authority Rev., (Los Angeles Department of Water & Power Power System Rev.), 5.00%, 7/1/48 | 6,250,000 | | 6,968,952 | |
| Southern California Water Replenishment District Rev., 5.00%, 8/1/35 | 2,190,000 | | 2,381,477 | |
| Southern California Water Replenishment District Rev., 5.00%, 8/1/37 | 2,170,000 | | 2,340,540 | |
| State Center Community College District GO, 5.00%, 8/1/47 | 6,000,000 | | 6,610,900 | |
| State of California GO, 5.00%, 9/1/25 | 10,000,000 | | 10,240,951 | |
| State of California GO, 5.00%, 9/1/28 | 10,000,000 | | 10,949,788 | |
| State of California GO, 5.00%, 11/1/28 | 5,000,000 | | 5,493,429 | |
| State of California GO, 5.00%, 9/1/31 | 3,685,000 | | 4,222,823 | |
State of California GO, 5.00%, 8/1/33(4) | 7,000,000 | | 8,196,915 | |
| State of California GO, 4.00%, 3/1/37 | 10,100,000 | | 10,485,235 | |
| State of California GO, 4.00%, 9/1/37 | 1,250,000 | | 1,333,857 | |
| State of California GO, 4.00%, 3/1/38 | 5,000,000 | | 5,166,016 | |
| State of California GO, 5.00%, 4/1/38 | 3,500,000 | | 3,783,262 | |
| State of California GO, 5.00%, 9/1/38 | 5,000,000 | | 5,752,885 | |
| State of California GO, 4.00%, 10/1/39 | 9,500,000 | | 9,824,547 | |
| State of California GO, 4.00%, 10/1/41 | 6,595,000 | | 6,751,410 | |
| State of California GO, 4.00%, 4/1/42 | 7,500,000 | | 7,661,325 | |
| State of California GO, 4.00%, 9/1/42 | 1,000,000 | | 1,022,553 | |
| State of California GO, 5.00%, 9/1/42 | 2,025,000 | | 2,130,774 | |
| State of California GO, 5.00%, 9/1/42 | 4,000,000 | | 4,473,845 | |
| State of California GO, 5.25%, 10/1/45 | 1,430,000 | | 1,625,299 | |
| State of California Department of Water Resources Rev., 5.00%, 12/1/25 | 2,000,000 | | 2,067,155 | |
| Stockton Public Financing Authority Rev., 5.00%, 9/1/24 (BAM) | 1,090,000 | | 1,090,000 | |
| Stockton Public Financing Authority Rev., 5.00%, 9/1/25 (BAM) | 2,255,000 | | 2,255,116 | |
| Stockton Public Financing Authority Rev., 5.00%, 9/1/26 (BAM) | 1,495,000 | | 1,495,077 | |
| Stockton Public Financing Authority Rev., 5.00%, 9/1/27 (BAM) | 1,000,000 | | 1,000,052 | |
| Stockton Public Financing Authority Rev., (City of Stockton CA Water Rev.), 5.00%, 10/1/30 (BAM) | 1,000,000 | | 1,089,418 | |
| Stockton Public Financing Authority Rev., (City of Stockton CA Water Rev.), 5.00%, 10/1/31 (BAM) | 1,000,000 | | 1,084,583 | |
| Stockton Redevelopment Agency Successor Agency Tax Allocation, 5.00%, 9/1/29 (AGM) | 1,500,000 | | 1,567,113 | |
| Stockton Redevelopment Agency Successor Agency Tax Allocation, 5.00%, 9/1/30 (AGM) | 1,800,000 | | 1,876,876 | |
| Stockton Redevelopment Agency Successor Agency Tax Allocation, 5.00%, 9/1/31 (AGM) | 1,825,000 | | 1,899,235 | |
| Stockton Unified School District GO, 5.00%, 8/1/35 (AGM) | 1,110,000 | | 1,298,312 | |
| Stockton Unified School District GO, 5.00%, 8/1/35 (AGM) | 2,375,000 | | 2,777,919 | |
| Stockton Unified School District GO, 5.00%, 8/1/36 (AGM) | 850,000 | | 989,938 | |
| Stockton Unified School District GO, 5.00%, 8/1/36 (AGM) | 1,325,000 | | 1,543,139 | |
| Stockton Unified School District GO, 5.00%, 8/1/39 (AGM) | 1,000,000 | | 1,150,678 | |
| Stockton Unified School District GO, 5.00%, 8/1/40 (AGM) | 500,000 | | 572,020 | |
| Temecula Redevelopment Agency Successor Agency Tax Allocation, 5.00%, 12/15/28 (AGM) | 500,000 | | 533,816 | |
| Temecula Redevelopment Agency Successor Agency Tax Allocation, 5.00%, 12/15/29 (AGM) | 1,155,000 | | 1,232,075 | |
| Temecula Redevelopment Agency Successor Agency Tax Allocation, 5.00%, 12/15/31 (AGM) | 765,000 | | 813,931 | |
| Temecula Redevelopment Agency Successor Agency Tax Allocation, 5.00%, 12/15/32 (AGM) | 750,000 | | 797,796 | |
| Temescal Valley Water District Public Financing Authority Special Tax, 5.00%, 9/1/27 (AGM) | 1,060,000 | | 1,134,451 | |
| Temescal Valley Water District Public Financing Authority Special Tax, 5.00%, 9/1/28 (AGM) | 1,130,000 | | 1,232,381 | |
| Tobacco Securitization Authority of Southern California Rev., (San Diego County Tobacco Asset Securitization Corp.), 5.00%, 6/1/30 | 1,000,000 | | 1,083,052 | |
| Tracy Community Facilities District Special Tax, (City of Tracy CA Community Facilities District No. 2016-01 Improvement Area No. 1), 5.00%, 9/1/28 | 425,000 | | 445,354 | |
| Tracy Community Facilities District Special Tax, (City of Tracy CA Community Facilities District No. 2016-01 Improvement Area No. 1), 5.00%, 9/1/33 | 3,220,000 | | 3,353,372 | |
| Tracy Community Facilities District Special Tax, (City of Tracy CA Community Facilities District No. 2016-01 Improvement Area No. 1), 5.00%, 9/1/38 | 3,270,000 | | 3,385,792 | |
| Tracy Community Facilities District Special Tax, (City of Tracy CA Community Facilities District No. 2016-01 Improvement Area No. 2), 5.25%, 9/1/38 | 700,000 | | 759,114 | |
| | | | | | | | |
| Principal
Amount/Shares | Value |
| Tracy Community Facilities District Special Tax, (City of Tracy CA Community Facilities District No. 2016-01 Improvement Area No. 2), 5.625%, 9/1/43 | $ | 1,400,000 | | $ | 1,515,419 | |
| Transbay Joint Powers Authority Tax Allocation, (Transbay Joint Powers Authority Transbay Redevelopment Project Tax Increment), 5.00%, 10/1/24 | 435,000 | | 435,414 | |
| Transbay Joint Powers Authority Tax Allocation, (Transbay Joint Powers Authority Transbay Redevelopment Project Tax Increment), 5.00%, 10/1/26 | 1,185,000 | | 1,222,734 | |
| Transbay Joint Powers Authority Tax Allocation, (Transbay Joint Powers Authority Transbay Redevelopment Project Tax Increment), 5.00%, 10/1/28 | 1,310,000 | | 1,384,154 | |
| Transbay Joint Powers Authority Tax Allocation, (Transbay Joint Powers Authority Transbay Redevelopment Project Tax Increment), 5.00%, 10/1/30 | 800,000 | | 860,778 | |
| Transbay Joint Powers Authority Tax Allocation, (Transbay Joint Powers Authority Transbay Redevelopment Project Tax Increment), 5.00%, 10/1/30 | 1,440,000 | | 1,538,109 | |
| Transbay Joint Powers Authority Tax Allocation, (Transbay Joint Powers Authority Transbay Redevelopment Project Tax Increment), 5.00%, 10/1/31 | 750,000 | | 797,915 | |
| Transbay Joint Powers Authority Tax Allocation, (Transbay Joint Powers Authority Transbay Redevelopment Project Tax Increment), 5.00%, 10/1/32 | 1,000,000 | | 1,066,599 | |
| Transbay Joint Powers Authority Tax Allocation, (Transbay Joint Powers Authority Transbay Redevelopment Project Tax Increment), 5.00%, 10/1/33 | 815,000 | | 862,823 | |
| Transbay Joint Powers Authority Tax Allocation, (Transbay Joint Powers Authority Transbay Redevelopment Project Tax Increment), 5.00%, 10/1/34 | 300,000 | | 316,551 | |
| Transbay Joint Powers Authority Tax Allocation, (Transbay Joint Powers Authority Transbay Redevelopment Project Tax Increment), 5.00%, 10/1/35 | 300,000 | | 315,725 | |
| Transbay Joint Powers Authority Tax Allocation, (Transbay Joint Powers Authority Transbay Redevelopment Project Tax Increment), 5.00%, 10/1/37 | 700,000 | | 737,087 | |
| Transbay Joint Powers Authority Tax Allocation, (Transbay Joint Powers Authority Transbay Redevelopment Project Tax Increment), 5.00%, 10/1/38 | 320,000 | | 331,837 | |
| Transbay Joint Powers Authority Tax Allocation, (Transbay Joint Powers Authority Transbay Redevelopment Project Tax Increment), 5.00%, 10/1/39 | 1,000,000 | | 1,044,166 | |
| Truckee Redevelopment Successor Agency Tax Allocation, 4.00%, 9/1/32 (AGM) | 330,000 | | 342,915 | |
| Tulare Local Health Care District GO, 4.00%, 8/1/27 (BAM) | 585,000 | | 604,957 | |
| Tulare Local Health Care District GO, 4.00%, 8/1/28 (BAM) | 435,000 | | 454,408 | |
| Tulare Local Health Care District GO, 4.00%, 8/1/29 (BAM) | 740,000 | | 779,406 | |
| Tustin Community Facilities District Special Tax, (City of Tustin CA Community Facilities District No. 06-1), 5.00%, 9/1/28 | 1,000,000 | | 1,019,970 | |
| Tustin Community Facilities District Special Tax, (City of Tustin CA Community Facilities District No. 06-1), 5.00%, 9/1/30 | 1,000,000 | | 1,019,119 | |
| University of California Rev., 4.00%, 5/15/26 | 2,415,000 | | 2,480,204 | |
| University of California Rev., 5.00%, 5/15/26 | 13,000,000 | | 13,586,236 | |
| University of California Rev., 5.00%, 5/15/29 | 14,500,000 | | 16,275,571 | |
| University of California Rev., 5.00%, 5/15/35 | 10,000,000 | | 11,678,265 | |
| University of California Rev., 5.00%, 5/15/42 | 2,500,000 | | 2,732,399 | |
| University of California Rev., 5.00%, 5/15/43 | 7,500,000 | | 8,477,094 | |
| University of California Rev., VRDN, 3.80%, 9/3/24 | 500,000 | | 500,000 | |
| University of California Hastings College of the Law Rev., 5.00%, 4/1/31 (AGM) | 1,045,000 | | 1,105,727 | |
| Upland COP, (San Antonio Regional Hospital Obligated Group), 5.00%, 1/1/29 | 1,510,000 | | 1,588,818 | |
| Upland COP, (San Antonio Regional Hospital Obligated Group), 5.00%, 1/1/32 | 1,475,000 | | 1,544,676 | |
| Upland COP, (San Antonio Regional Hospital Obligated Group), 4.00%, 1/1/36 | 1,000,000 | | 984,419 | |
| Walnut Energy Center Authority Rev., 5.00%, 1/1/26 | 2,425,000 | | 2,505,189 | |
| Walnut Energy Center Authority Rev., 5.00%, 1/1/27 | 1,645,000 | | 1,741,204 | |
| Washington Township Health Care District GO, 5.25%, 8/1/37 | 150,000 | | 175,297 | |
| Washington Township Health Care District GO, 5.25%, 8/1/38 | 200,000 | | 232,336 | |
| Washington Township Health Care District GO, 5.25%, 8/1/39 | 300,000 | | 346,357 | |
| Washington Township Health Care District GO, 5.25%, 8/1/40 | 500,000 | | 573,978 | |
| Washington Township Health Care District Rev., 5.00%, 7/1/27 | 755,000 | | 785,738 | |
| Washington Township Health Care District Rev., 5.00%, 7/1/41 | 300,000 | | 305,303 | |
| Washington Township Health Care District Rev., 5.00%, 7/1/42 | 250,000 | | 253,154 | |
| Washington Township Health Care District Rev., 5.00%, 7/1/43 | 225,000 | | 226,952 | |
| West Valley-Mission Community College District GO, 5.00%, 8/1/38 | 1,000,000 | | 1,156,982 | |
| Western Placer Waste Management Authority Rev., 4.00%, 6/1/42 | 4,770,000 | | 4,867,154 | |
| | | | | | | | |
| Principal
Amount/Shares | Value |
| Western Riverside Water & Wastewater Financing Authority Rev., 5.00%, 9/1/24 | $ | 1,685,000 | | $ | 1,685,000 | |
| Western Riverside Water & Wastewater Financing Authority Rev., 5.00%, 9/1/25 | 1,170,000 | | 1,195,290 | |
| Whittier Union High School District GO, 4.00%, 8/1/43 | 2,000,000 | | 2,045,846 | |
| Whittier Union High School District GO, 4.00%, 8/1/46 | 4,000,000 | | 4,022,010 | |
| William S Hart Union High School District Special Tax, (William S Hart Union High School District Cmnty Facs Dist No. 2021-1 Impt Area A), 5.00%, 9/1/44 | 385,000 | | 407,469 | |
| Yorba Linda Water District Public Financing Corp. Rev., 5.00%, 10/1/47 | 3,600,000 | | 3,974,032 | |
Yosemite Community College District GO, Capital Appreciation, 0.00%, 8/1/31(1) | 2,210,000 | | 1,796,485 | |
| Yosemite Community College District GO, Capital Appreciation, VRN, 0.00%, 8/1/42 | 1,410,000 | | 1,218,799 | |
| | 2,019,777,183 | |
| Guam — 0.2% | | |
| Guam Government Waterworks Authority Rev., 5.00%, 7/1/25 | 350,000 | | 354,835 | |
| Guam Government Waterworks Authority Rev., 5.00%, 7/1/26 | 500,000 | | 516,095 | |
| Guam Government Waterworks Authority Rev., 5.00%, 7/1/27 | 900,000 | | 944,569 | |
| Guam Power Authority Rev., 5.00%, 10/1/26 | 450,000 | | 469,205 | |
| Guam Power Authority Rev., 5.00%, 10/1/27 | 300,000 | | 318,336 | |
| Guam Power Authority Rev., 5.00%, 10/1/28 | 300,000 | | 323,368 | |
| Guam Power Authority Rev., 5.00%, 10/1/29 | 400,000 | | 437,075 | |
| Guam Power Authority Rev., 5.00%, 10/1/30 | 150,000 | | 165,248 | |
| | 3,528,731 | |
| Puerto Rico — 0.2% | | |
| Puerto Rico GO, VRN, 0.00%, 11/1/51 | 1,743,296 | | 917,409 | |
Puerto Rico Sales Tax Financing Corp. Sales Tax Rev., Capital Appreciation, 0.00%, 7/1/51(1) | 10,000,000 | | 2,454,123 | |
| | 3,371,532 | |
TOTAL MUNICIPAL SECURITIES (Cost $2,009,399,800) | | 2,026,677,446 | |
AFFILIATED FUNDS(5) — 0.2% | | |
American Century California Municipal Bond ETF (Cost $5,050,144) | 100,100 | | 5,055,691 | |
TOTAL INVESTMENT SECURITIES — 99.9% (Cost $2,014,449,944) | | 2,031,733,137 | |
| OTHER ASSETS AND LIABILITIES — 0.1% | | 1,501,060 | |
| TOTAL NET ASSETS — 100.0% | | $ | 2,033,234,197 | |
| | | | | | | | | | | | | | |
| FUTURES CONTRACTS PURCHASED |
| Reference Entity | Contracts | Expiration
Date | Notional Amount | Unrealized
Appreciation
(Depreciation)^ |
| U.S. Treasury 2-Year Notes | 249 | December 2024 | $ | 51,679,172 | | $ | (66,626) | |
^Amount represents value and unrealized appreciation (depreciation).
| | | | | | | | | | | | | | |
| FUTURES CONTRACTS SOLD |
| Reference Entity | Contracts | Expiration
Date | Notional Amount | Unrealized
Appreciation
(Depreciation)^ |
| U.S. Treasury 10-Year Ultra Notes | 110 | December 2024 | $ | 12,918,125 | | $ | 79,708 | |
^Amount represents value and unrealized appreciation (depreciation).
| | | | | | | | |
| NOTES TO SCHEDULE OF INVESTMENTS |
| AGC | – | Assured Guaranty Corp. |
| AGM | – | Assured Guaranty Municipal Corp. |
| BAM | – | Build America Mutual Assurance Corp. |
| BAM-TCRS | – | Build America Mutual Assurance Corp. - Transferrable Custodial Receipts |
| COP | – | Certificates of Participation |
| FHLMC | – | Federal Home Loan Mortgage Corp. |
| FNMA | – | Federal National Mortgage Association |
| GA | – | Guaranty Agreement |
| GO | – | General Obligation |
| LIQ FAC | – | Liquidity Facilities |
| LOC | – | Letter of Credit |
| MUNIPSA | – | SIFMA Municipal Swap Index |
| NPFG | – | National Public Finance Guarantee Corp. |
| SBBPA | – | Standby Bond Purchase Agreement |
| ST INTERCEPT | – | State Intercept |
| VRDN | – | Variable Rate Demand Note. The instrument may be payable upon demand and adjusts periodically based upon the terms set forth in the security's offering documents. The rate shown is effective at the period end and the reference rate and spread, if any, is indicated. The date of the demand feature is disclosed. |
| VRN | – | Variable Rate Note. The rate adjusts periodically based upon the terms set forth in the security’s offering documents. The rate shown is effective at the period end and the reference rate and spread, if any, is indicated. The security's effective maturity date may be shorter than the final maturity date shown. |
(1)Security is a zero-coupon bond. Zero-coupon securities may be issued at a substantial discount from their value at maturity.
(2)Escrowed to maturity in U.S. government securities or state and local government securities.
(3)Security was purchased pursuant to Rule 144A or Section 4(2) under the Securities Act of 1933 and may be sold in transactions exempt from registration, normally to qualified institutional investors. The aggregate value of these securities at the period end was $75,597,667, which represented 3.7% of total net assets.
(4)When-issued security. The issue price and yield are fixed on the date of the commitment, but payment and delivery are scheduled for a future date.
(5)Investments are funds within the American Century Investments family of funds and are considered affiliated funds.
See Notes to Financial Statements.
| | |
| Statement of Assets and Liabilities |
| | | | | |
| AUGUST 31, 2024 |
| Assets |
| Investment securities - unaffiliated, at value (cost of $2,009,399,800) | $ | 2,026,677,446 | |
| Investment securities - affiliated, at value (cost of $5,050,144) | 5,055,691 | |
| Total investment securities, at value (cost of $2,014,449,944) | 2,031,733,137 | |
| Cash | 42,745 | |
| Deposits with broker for futures contracts | 321,275 | |
| Receivable for investments sold | 7,705,850 | |
| Receivable for capital shares sold | 952,151 | |
| Receivable for variation margin on futures contracts | 5,329 | |
| Interest receivable | 22,048,172 | |
| 2,062,808,659 | |
| |
| Liabilities | |
| Payable for investments purchased | 25,392,315 | |
| Payable for capital shares redeemed | 2,716,519 | |
| Accrued management fees | 540,129 | |
| Distribution and service fees payable | 5,483 | |
| Dividends payable | 920,016 | |
| 29,574,462 | |
| |
| Net Assets | $ | 2,033,234,197 | |
| |
| Net Assets Consist of: | |
| Capital paid in | $ | 2,076,550,737 | |
| Distributable earnings (loss) | (43,316,540) | |
| $ | 2,033,234,197 | |
| | | | | | | | | | | |
| Net Assets | Shares Outstanding | Net Asset Value Per Share* |
| Investor Class | $605,504,618 | 53,749,614 | $11.27 |
| I Class | $1,103,077,616 | 97,898,670 | $11.27 |
| Y Class | $307,065,352 | 27,249,874 | $11.27 |
| A Class | $14,810,763 | 1,313,965 | $11.27 |
| C Class | $2,775,848 | 246,195 | $11.27 |
*Maximum offering price per share was equal to the net asset value per share for all share classes, except A Class, for which the maximum offering price per share was $11.80 (net asset value divided by 0.955). A contingent deferred sales charge may be imposed on redemptions of A Class and C Class.
See Notes to Financial Statements.
| | | | | |
| YEAR ENDED AUGUST 31, 2024 |
| Investment Income (Loss) |
| Income: | |
| Interest | $ | 63,468,510 | |
| |
| Expenses: | |
| Management fees | 6,363,923 | |
| Distribution and service fees: | |
| A Class | 37,652 | |
| C Class | 33,545 | |
| Trustees' fees and expenses | 144,526 | |
| Other expenses | 10,874 | |
| 6,590,520 | |
Fees waived(1) | (660) | |
| 6,589,860 | |
| |
| Net investment income (loss) | 56,878,650 | |
| |
| Realized and Unrealized Gain (Loss) | |
| Net realized gain (loss) on: | |
| Investment transactions | (7,787,366) | |
| Futures contract transactions | 23,964 | |
| (7,763,402) | |
| |
| Change in net unrealized appreciation (depreciation) on: | |
| Investments (including $5,547 from affiliated funds) | 54,825,705 | |
| Futures contracts | (565,195) | |
| 54,260,510 | |
| |
| Net realized and unrealized gain (loss) | 46,497,108 | |
| |
| Net Increase (Decrease) in Net Assets Resulting from Operations | $ | 103,375,758 | |
(1)Amount consists of $197, $359, $98, $5 and $1 for Investor Class, I Class, Y Class, A Class and C Class, respectively.
See Notes to Financial Statements.
| | |
| Statement of Changes in Net Assets |
| | | | | | | | |
| YEARS ENDED AUGUST 31, 2024 AND AUGUST 31, 2023 |
| Increase (Decrease) in Net Assets | August 31, 2024 | August 31, 2023 |
| Operations |
| Net investment income (loss) | $ | 56,878,650 | | $ | 56,711,690 | |
| Net realized gain (loss) | (7,763,402) | | (32,493,195) | |
| Change in net unrealized appreciation (depreciation) | 54,260,510 | | 4,820,723 | |
| Net increase (decrease) in net assets resulting from operations | 103,375,758 | | 29,039,218 | |
| | |
| Distributions to Shareholders | | |
| From earnings: | | |
| Investor Class | (18,643,077) | | (18,903,744) | |
| I Class | (32,064,326) | | (28,398,013) | |
| Y Class | (9,738,030) | | (8,847,294) | |
| A Class | (402,509) | | (414,709) | |
| C Class | (64,299) | | (69,398) | |
| Decrease in net assets from distributions | (60,912,241) | | (56,633,158) | |
| | |
| Capital Share Transactions | | |
| Net increase (decrease) in net assets from capital share transactions (Note 5) | (38,520,680) | | (2,449,361) | |
| | |
| Net increase (decrease) in net assets | 3,942,837 | | (30,043,301) | |
| | |
| Net Assets | | |
| Beginning of period | 2,029,291,360 | | 2,059,334,661 | |
| End of period | $ | 2,033,234,197 | | $ | 2,029,291,360 | |
See Notes to Financial Statements.
| | |
| Notes to Financial Statements |
AUGUST 31, 2024
1. Organization
American Century California Tax-Free and Municipal Funds (the trust) is registered under the Investment Company Act of 1940, as amended (the 1940 Act), as an open-end management investment company and is organized as a Massachusetts business trust. California Intermediate-Term Tax-Free Bond Fund (the fund) is one fund in a series issued by the trust. The fund’s investment objective is to seek safety of principal and high current income that is exempt from federal and California income taxes.
The fund offers the Investor Class, I Class, Y Class, A Class and C Class. The A Class may incur an initial sales charge. The A Class and C Class may be subject to a contingent deferred sales charge.
2. Significant Accounting Policies
The following is a summary of significant accounting policies consistently followed by the fund in preparation of its financial statements. The fund is an investment company and follows accounting and reporting guidance in accordance with accounting principles generally accepted in the United States of America. This may require management to make certain estimates and assumptions at the date of the financial statements. Actual results could differ from these estimates. Management evaluated the impact of events or transactions occurring through the date the financial statements were issued that would merit recognition or disclosure.
Investment Valuations — The fund determines the fair value of its investments and computes its net asset value (NAV) per share at the close of regular trading (usually 4 p.m. Eastern time) on the New York Stock Exchange (NYSE) on each day the NYSE is open. The value of investments of the fund is determined by American Century Investment Management, Inc. (ACIM) (the investment advisor), as the valuation designee, pursuant to its valuation policies and procedures. The Board of Trustees oversees the valuation designee and reviews its valuation policies and procedures at least annually.
Fixed income securities are valued at the evaluated mean as provided by independent pricing services or at the mean of the most recent bid and asked prices as provided by investment dealers. Municipal securities are valued using market models that consider trade data, quotations from dealers and active market makers, relevant yield curve and spread data, creditworthiness, trade data or market information on comparable securities, and other relevant security specific information.
Equity securities that are listed or traded on a domestic securities exchange are valued at the last reported sales price or at the official closing price as provided by the exchange. Equity securities traded on foreign securities exchanges are generally valued at the closing price of such securities on the exchange where primarily traded or at the close of the NYSE, if that is earlier. If no last sales price is reported, or if local convention or regulation so provides, the mean of the latest bid and asked prices may be used. Securities traded over-the-counter are valued at the mean of the latest bid and asked prices, the last sales price, or the official closing price.
Exchange-traded futures contracts are valued at the settlement price as provided by the appropriate exchange.
If the valuation designee determines that the market price for a portfolio security is not readily available or is believed by the valuation designee to be unreliable, such security is valued at fair value as determined in good faith by the valuation designee, in accordance with its policies and procedures. Circumstances that may cause the fund to determine that market quotations are not available or reliable include, but are not limited to: when there is a significant event subsequent to the market quotation; trading in a security has been halted during the trading day; or trading in a security is insufficient or did not take place due to a closure or holiday.
The valuation designee monitors for significant events occurring after the close of an investment’s primary exchange but before the fund’s NAV per share is determined. Significant events may include, but are not limited to: corporate announcements and transactions; regulatory news, governmental action and political unrest that could impact a specific investment or an investment sector; or armed conflicts, natural disasters and similar events that could affect investments in a specific country or region. The valuation designee also monitors for significant fluctuations between domestic and foreign markets, as evidenced by the U.S. market or such other indicators that it deems appropriate. The valuation designee may apply a model-derived factor to the closing price of equity securities traded on foreign securities exchanges. The factor is based on observable market data as provided by an independent pricing service.
Security Transactions — Security transactions are accounted for as of the trade date. Net realized gains and losses are determined on the identified cost basis, which is also used for federal income tax purposes.
Investment Income — Interest income is recorded on the accrual basis and includes paydown gain (loss) and accretion of discounts and amortization of premiums.
Income Tax Status — It is the fund's policy to distribute substantially all net investment income and net realized gains to shareholders and to otherwise qualify as a regulated investment company under provisions of the Internal Revenue Code. Accordingly, no provision has been made for income taxes. The fund files U.S. federal, state, local and non-U.S. tax returns as applicable. The fund's tax returns are subject to examination by the relevant taxing authority until expiration of the applicable statute of limitations, which is generally three years from the date of filing but can be longer in certain jurisdictions. At this time, management believes there are no uncertain tax positions which, based on their technical merit, would not be sustained upon examination and for which it is reasonably possible that the total amounts of unrecognized tax benefits will significantly change in the next twelve months.
Multiple Class — All shares of the fund represent an equal pro rata interest in the net assets of the class to which such shares belong, and have identical voting, dividend, liquidation and other rights and the same terms and conditions, except for class specific expenses and exclusive rights to vote on matters affecting only individual classes. Income, non-class specific expenses, and realized and unrealized capital gains and losses of the fund are allocated to each class of shares based on their relative net assets.
Distributions to Shareholders — Distributions from net investment income, if any, are declared daily and paid monthly. Distributions from net realized gains, if any, are generally declared and paid annually.
Indemnifications — Under the trust’s organizational documents, its officers and trustees are indemnified against certain liabilities arising out of the performance of their duties to the fund. In addition, in the normal course of business, the fund enters into contracts that provide general indemnifications. The maximum exposure under these arrangements is unknown as this would involve future claims that may be made against a fund. The risk of material loss from such claims is considered by management to be remote.
3. Fees and Transactions with Related Parties
Certain officers and trustees of the trust are also officers and/or directors of American Century Companies, Inc. (ACC). The trust's investment advisor, ACIM, the trust's distributor, American Century Investment Services, Inc. (ACIS), and the trust's transfer agent, American Century Services, LLC, are wholly owned, directly or indirectly, by ACC. ACIM serves as the investment advisor for the affiliated funds.
Management Fees — The trust has entered into a management agreement with ACIM, under which ACIM provides the fund with investment advisory and management services in exchange for a single, unified management fee (the fee) per class. The agreement provides that ACIM will pay all expenses of managing and operating the fund, except brokerage expenses, taxes, interest, fees and expenses of the independent trustees (including legal counsel fees), extraordinary expenses, and expenses incurred in connection with the provision of shareholder services and distribution services under a plan adopted pursuant to Rule 12b-1 under the 1940 Act. The fee is computed and accrued daily based on each class’s daily net assets and paid monthly in arrears. The difference in the fee among the classes is a result of their separate arrangements for non-Rule 12b-1 shareholder services. It is not the result of any difference in advisory or custodial fees or other expenses related to the management of the fund's assets, which do not vary by class. The fee consists of (1) an Investment Category Fee based on the daily net assets of the fund and certain other accounts managed by the investment advisor that are in the same broad investment category as the fund and (2) a Complex Fee based on the assets of all funds in the American Century Investments family of funds that have the same investment advisor and distributor as the fund. For purposes of determining the Investment Category Fee and Complex Fee, the assets of funds managed by the investment advisor that invest exclusively in the shares of other funds (funds of funds) are not included. The investment advisor will waive the portion of the fund's management fee equal to the expenses attributable to the management fees of the American Century Investments funds in which the fund invests. The amount of this waiver will fluctuate depending on the fund's daily allocation to other American Century Investments funds. This waiver is expected to remain in effect permanently and it cannot be terminated without the approval of the Board of Trustees. The impact of this waiver to the ratio of operating expenses to average net assets was less than 0.005% for each class for the period ended August 31, 2024.
The Investment Category Fee range, the Complex Fee range and the effective annual management fee for each class for the period ended August 31, 2024 are as follows:
| | | | | | | | | | | |
| Investment Category Fee Range | Complex Fee Range | Effective Annual Management Fee |
| Investor Class | 0.1625% to 0.2800% | 0.2500% to 0.3100% | 0.46% |
| I Class | 0.0500% to 0.1100% | 0.26% |
| Y Class | 0.0200% to 0.0800% | 0.23% |
| A Class | 0.2500% to 0.3100% | 0.46% |
| C Class | 0.2500% to 0.3100% | 0.46% |
Distribution and Service Fees — The Board of Trustees has adopted a separate Master Distribution and Individual Shareholder Services Plan for each of the A Class and C Class (collectively the plans), pursuant to Rule 12b-1 of the 1940 Act. The plans provide that the A Class will pay ACIS an annual distribution and service fee of 0.25%. The plans provide that the C Class will pay ACIS an annual distribution and service fee of 1.00%, of which 0.25% is paid for individual shareholder services and 0.75% is paid for distribution services. The fees are computed and accrued daily based on each class’s daily net assets and paid monthly in arrears. The fees are used to pay financial intermediaries for distribution and individual shareholder services. Fees incurred under the plans during the period ended August 31, 2024 are detailed in the Statement of Operations.
Trustees' Fees and Expenses — The Board of Trustees is responsible for overseeing the investment advisor’s management and operations of the fund. The trustees receive detailed information about the fund and its investment advisor regularly throughout the year, and meet at least quarterly with management of the investment advisor to review reports about fund operations. The fund's officers do not receive compensation from the fund.
Other Expenses — A fund’s other expenses may include interest charges, clearing exchange fees, proxy solicitation expenses, fees associated with the recovery of foreign tax reclaims and other miscellaneous expenses.
Interfund Transactions — The fund may enter into security transactions with other American Century Investments funds and other client accounts of the investment advisor, in accordance with the 1940 Act rules and procedures adopted by the Board of Trustees. The rules and procedures require, among other things, that these transactions be effected at the independent current market price of the security. During the period, the interfund purchases and sales were
$26,525,000 and $17,440,000, respectively. The interfund transactions had no effect on the Statement of Operations in net realized gain (loss) on investment transactions.
4. Investment Transactions
Purchases and sales of investment securities, excluding short-term investments, for the period ended August 31, 2024 were $1,275,828,852 and $1,268,074,019, respectively.
5. Capital Share Transactions
Transactions in shares of the fund were as follows (unlimited number of shares authorized):
| | | | | | | | | | | | | | |
| Year ended
August 31, 2024 | Year ended
August 31, 2023 |
| Shares | Amount | Shares | Amount |
| Investor Class | | | | |
| Sold | 5,439,356 | | $ | 59,930,951 | | 10,517,840 | | $ | 116,427,234 | |
| Issued in reinvestment of distributions | 1,483,818 | | 16,476,990 | | 1,511,125 | | 16,735,862 | |
| Redeemed | (14,299,256) | | (158,493,411) | | (18,868,507) | | (208,948,662) | |
| (7,376,082) | | (82,085,470) | | (6,839,542) | | (75,785,566) | |
| I Class | | | | |
| Sold | 46,560,482 | | 514,380,608 | | 59,442,552 | | 655,531,156 | |
| Issued in reinvestment of distributions | 2,707,863 | | 30,090,366 | | 2,504,949 | | 27,742,808 | |
| Redeemed | (42,668,074) | | (466,565,971) | | (62,907,875) | | (690,960,213) | |
| 6,600,271 | | 77,905,003 | | (960,374) | | (7,686,249) | |
| Y Class | | | | |
| Sold | 10,728,133 | | 118,492,613 | | 19,258,477 | | 212,428,762 | |
| Issued in reinvestment of distributions | 300,660 | | 3,341,656 | | 212,891 | | 2,360,905 | |
| Redeemed | (13,903,443) | | (153,985,561) | | (11,981,302) | | (132,245,232) | |
| (2,874,650) | | (32,151,292) | | 7,490,066 | | 82,544,435 | |
| A Class | | | | |
| Sold | 218,925 | | 2,404,817 | | 393,609 | | 4,347,983 | |
| Issued in reinvestment of distributions | 33,916 | | 376,871 | | 35,243 | | 390,708 | |
| Redeemed | (307,143) | | (3,406,416) | | (540,226) | | (5,961,271) | |
| (54,302) | | (624,728) | | (111,374) | | (1,222,580) | |
| C Class | | | | |
| Sold | 13,763 | | 154,414 | | 57,702 | | 640,743 | |
| Issued in reinvestment of distributions | 5,785 | | 64,223 | | 6,243 | | 69,221 | |
| Redeemed | (160,897) | | (1,782,830) | | (91,618) | | (1,009,365) | |
| (141,349) | | (1,564,193) | | (27,673) | | (299,401) | |
| Net increase (decrease) | (3,846,112) | | $ | (38,520,680) | | (448,897) | | $ | (2,449,361) | |
6. Affiliated Fund Transactions
A summary of transactions for each affiliated fund for the period ended August 31, 2024 follows (amounts in thousands):
| | | | | | | | | | | | | | | | | | | | | | | | | | |
Affiliated Fund(1) | Beginning
Value | Purchase
Cost | Sales
Cost | Change in Net Unrealized Appreciation (Depreciation) | Ending
Value | Ending
Shares | Net
Realized
Gain
(Loss) | Distributions Received(2) |
| American Century California Municipal Bond ETF | — | | $ | 5,050 | | — | | $ | 6 | | $ | 5,056 | | 100 | | — | | — | |
(1)Investments are funds within the American Century Investments family of funds and are considered affiliated funds. Additional information and attributes of each affiliated fund are available at americancentury.com.
(2)Distributions received includes distributions from net investment income and from capital gains, if any.
7. Investments in Affiliated Funds
The fund does not invest in an affiliated fund for the purpose of exercising management or control; however, investments by the fund within its investment strategy may represent a significant portion of an affiliated fund's net assets.
8. Fair Value Measurements
The fund's investments valuation process is based on several considerations and may use multiple inputs to determine the fair value of the investments held by the fund. In conformity with accounting principles generally accepted in the United States of America, the inputs used to determine a valuation are classified into three broad levels.
•Level 1 valuation inputs consist of unadjusted quoted prices in an active market for identical investments.
•Level 2 valuation inputs consist of direct or indirect observable market data (including quoted prices for comparable investments, evaluations of subsequent market events, interest rates, prepayment speeds, credit risk, etc.). These inputs also consist of quoted prices for identical investments initially expressed in local currencies that are adjusted through translation into U.S. dollars.
•Level 3 valuation inputs consist of unobservable data (including a fund’s own assumptions).
The level classification is based on the lowest level input that is significant to the fair valuation measurement. The valuation inputs are not necessarily an indication of the risks associated with investing in these securities or other financial instruments.
The following is a summary of the level classifications as of period end. The Schedule of Investments provides additional information on the fund's portfolio holdings.
| | | | | | | | | | | |
| Level 1 | Level 2 | Level 3 |
| Assets | | | |
| Investment Securities | | | |
| Municipal Securities | — | | $ | 2,026,677,446 | | — | |
| Affiliated Funds | $ | 5,055,691 | | — | | — | |
| $ | 5,055,691 | | $ | 2,026,677,446 | | — | |
| Other Financial Instruments | | | |
| Futures Contracts | $ | 79,708 | | — | | — | |
| | | |
| Liabilities | | | |
| Other Financial Instruments | | | |
| Futures Contracts | $ | 66,626 | | — | | — | |
9. Derivative Instruments
Interest Rate Risk — The fund is subject to interest rate risk in the normal course of pursuing its investment objectives. The value of bonds generally declines as interest rates rise. A fund may enter into futures contracts based on a bond index or a specific underlying security. A fund may purchase futures contracts to gain exposure to increases in market value or sell futures contracts to protect against a decline in market value. Upon entering into a futures contract, a fund will segregate cash, cash equivalents or other appropriate liquid securities on its records in amounts sufficient to meet requirements. A fund may incur charges or earn income on cash deposit balances, which are reflected in interest expenses or interest income, respectively. Subsequent payments (variation margin) are made or received daily, in cash, by a fund. The variation margin is equal to the daily change in the contract value and is recorded as unrealized gains and losses. A fund recognizes a realized gain or loss when the futures contract is closed or expires. Net realized and unrealized gains or losses occurring during the holding period of futures contracts are a component of net realized gain (loss) on futures contract transactions and change in net unrealized appreciation (depreciation) on futures contracts, respectively. One of the risks of entering into futures contracts is the possibility that the change in value of the contract may not correlate with the changes in value of the underlying securities. The fund's average notional exposure to interest rate risk derivative instruments held during the period was $33,829,169 futures contracts purchased and $12,873,648 futures contracts sold.
The value of interest rate risk derivative instruments as of August 31, 2024, is disclosed on the Statement of Assets and Liabilities as an asset of $5,329 in receivable for variation margin on futures contracts.* For the year ended August 31, 2024, the effect of interest rate risk derivative instruments on the Statement of Operations was $23,964 in net realized gain (loss) on futures contract transactions and $(565,195) in change in net unrealized appreciation (depreciation) on futures contracts.
*Included in the unrealized appreciation (depreciation) on futures contracts as reported in the Schedule of Investments.
10. Risk Factors
The value of the fund’s shares will go up and down, sometimes rapidly or unpredictably, based on the performance of the securities owned by the fund and other factors generally affecting the securities market. Market risks, including political, regulatory, economic and social developments, can affect the value of the fund’s investments. Natural disasters, public health emergencies, war, terrorism and other unforeseeable events may lead to increased market volatility and may have adverse long-term effects on world economies and markets generally.
The fund focuses its investments in a single state and therefore may have more exposure to credit risk related to the state of California than a fund with a broader geographical diversification.
11. Federal Tax Information
The tax character of distributions paid during the years ended August 31, 2024 and August 31, 2023 were as follows:
| | | | | | | | |
| 2024 | 2023 |
| Distributions Paid From | | |
| Exempt income | $ | 60,912,241 | | $ | 56,633,158 | |
| Taxable ordinary income | — | | — | |
| Long-term capital gains | — | | — | |
The book-basis character of distributions made during the year from net investment income or net realized gains may differ from their ultimate characterization for federal income tax purposes. These differences reflect the differing character of certain income items and net realized gains and losses for financial statement and tax purposes, and may result in reclassification among certain capital accounts on the financial statements.
As of period end, the federal tax cost of investments and the components of distributable earnings on a tax-basis were as follows:
| | | | | |
| Federal tax cost of investments | $ | 2,014,452,558 | |
| Gross tax appreciation of investments | $ | 35,906,676 | |
| Gross tax depreciation of investments | (18,626,097) | |
| Net tax appreciation (depreciation) of investments | 17,280,579 | |
| Net tax appreciation (depreciation) on derivatives | — | |
| Net tax appreciation (depreciation) | $ | 17,280,579 | |
| Other book-to-tax adjustments | $ | (345,957) | |
| Undistributed exempt income | — | |
| Accumulated short-term capital losses | $ | (28,705,844) | |
| Accumulated long-term capital losses | $ | (31,545,318) | |
The difference between book-basis and tax-basis unrealized appreciation (depreciation) is attributable primarily to the realization for tax purposes of unrealized gains (losses) on futures contracts.
Accumulated capital losses represent net capital loss carryovers that may be used to offset future realized capital gains for federal income tax purposes. The capital loss carryovers may be carried forward for an unlimited period. Future capital loss carryover utilization in any given year may be subject to Internal Revenue Code limitations.
| | | | | | | | | | | | | | | | | | | | | | | | | | | | | | | | | | | | | | | | | | | | | | | |
| For a Share Outstanding Throughout the Years Ended August 31 (except as noted) |
| Per-Share Data | Ratios and Supplemental Data |
| | Income From Investment Operations*: | Distributions From: | | | Ratio to Average Net Assets of†: | | |
| Net Asset
Value,
Beginning
of Period | Net Investment Income (Loss)(1) | Net
Realized and Unrealized
Gain (Loss) | Total From Investment Operations | Net
Investment Income | Net
Realized Gains | Total Distributions | Net Asset
Value,
End of Period | Total Return(2) | Operating Expenses | Operating
Expenses
(before
expense
waiver) | Net
Investment Income
(Loss) | Net
Investment
Income
(Loss)
(before
expense
waiver) | Portfolio Turnover
Rate | Net Assets,
End of Period
(in thousands) |
| Investor Class |
| 2024 | $11.01 | 0.30 | 0.28 | 0.58 | (0.32) | — | (0.32) | $11.27 | 5.38% | 0.47% | 0.47% | 2.72% | 2.72% | 64% | $605,505 | |
| 2023 | $11.14 | 0.29 | (0.13) | 0.16 | (0.29) | — | (0.29) | $11.01 | 1.46% | 0.47% | 0.47% | 2.62% | 2.62% | 79% | $672,918 | |
| 2022 | $12.28 | 0.23 | (1.13) | (0.90) | (0.23) | (0.01) | (0.24) | $11.14 | (7.38)% | 0.46% | 0.46% | 2.00% | 2.00% | 69% | $757,454 | |
| 2021 | $12.17 | 0.26 | 0.11 | 0.37 | (0.26) | — | (0.26) | $12.28 | 3.04% | 0.46% | 0.46% | 2.10% | 2.10% | 30% | $917,539 | |
| 2020 | $12.23 | 0.27 | (0.04) | 0.23 | (0.27) | (0.02) | (0.29) | $12.17 | 1.93% | 0.47% | 0.47% | 2.26% | 2.26% | 40% | $887,525 | |
| I Class |
| 2024 | $11.01 | 0.33 | 0.28 | 0.61 | (0.35) | — | (0.35) | $11.27 | 5.59% | 0.27% | 0.27% | 2.92% | 2.92% | 64% | $1,103,078 | |
| 2023 | $11.15 | 0.31 | (0.14) | 0.17 | (0.31) | — | (0.31) | $11.01 | 1.57% | 0.27% | 0.27% | 2.82% | 2.82% | 79% | $1,005,299 | |
| 2022 | $12.29 | 0.26 | (1.13) | (0.87) | (0.26) | (0.01) | (0.27) | $11.15 | (7.19)% | 0.26% | 0.26% | 2.20% | 2.20% | 69% | $1,028,424 | |
| 2021 | $12.17 | 0.28 | 0.12 | 0.40 | (0.28) | — | (0.28) | $12.29 | 3.33% | 0.26% | 0.26% | 2.30% | 2.30% | 30% | $932,636 | |
| 2020 | $12.23 | 0.30 | (0.04) | 0.26 | (0.30) | (0.02) | (0.32) | $12.17 | 2.05% | 0.27% | 0.27% | 2.46% | 2.46% | 40% | $838,639 | |
| Y Class |
| 2024 | $11.01 | 0.33 | 0.28 | 0.61 | (0.35) | — | (0.35) | $11.27 | 5.63% | 0.24% | 0.24% | 2.95% | 2.95% | 64% | $307,065 | |
| 2023 | $11.15 | 0.32 | (0.14) | 0.18 | (0.32) | — | (0.32) | $11.01 | 1.60% | 0.24% | 0.24% | 2.85% | 2.85% | 79% | $331,733 | |
| 2022 | $12.29 | 0.26 | (1.13) | (0.87) | (0.26) | (0.01) | (0.27) | $11.15 | (7.16)% | 0.23% | 0.23% | 2.23% | 2.23% | 69% | $252,327 | |
| 2021 | $12.18 | 0.29 | 0.11 | 0.40 | (0.29) | — | (0.29) | $12.29 | 3.37% | 0.23% | 0.23% | 2.33% | 2.33% | 30% | $263,120 | |
| 2020 | $12.23 | 0.30 | (0.03) | 0.27 | (0.30) | (0.02) | (0.32) | $12.18 | 2.17% | 0.24% | 0.24% | 2.49% | 2.49% | 40% | $252,098 | |
| A Class |
| 2024 | $11.01 | 0.28 | 0.28 | 0.56 | (0.30) | — | (0.30) | $11.27 | 5.12% | 0.72% | 0.72% | 2.47% | 2.47% | 64% | $14,811 | |
| 2023 | $11.15 | 0.26 | (0.14) | 0.12 | (0.26) | — | (0.26) | $11.01 | 1.12% | 0.72% | 0.72% | 2.37% | 2.37% | 79% | $15,071 | |
| 2022 | $12.29 | 0.20 | (1.13) | (0.93) | (0.20) | (0.01) | (0.21) | $11.15 | (7.60)% | 0.71% | 0.71% | 1.75% | 1.75% | 69% | $16,499 | |
| 2021 | $12.18 | 0.23 | 0.11 | 0.34 | (0.23) | — | (0.23) | $12.29 | 2.79% | 0.71% | 0.71% | 1.85% | 1.85% | 30% | $23,015 | |
| 2020 | $12.24 | 0.24 | (0.04) | 0.20 | (0.24) | (0.02) | (0.26) | $12.18 | 1.68% | 0.72% | 0.72% | 2.01% | 2.01% | 40% | $20,507 | |
| C Class |
| 2024 | $11.02 | 0.19 | 0.27 | 0.46 | (0.21) | — | (0.21) | $11.27 | 4.33% | 1.47% | 1.47% | 1.72% | 1.72% | 64% | $2,776 | |
| 2023 | $11.15 | 0.18 | (0.13) | 0.05 | (0.18) | — | (0.18) | $11.02 | 0.45% | 1.47% | 1.47% | 1.62% | 1.62% | 79% | $4,270 | |
| 2022 | $12.29 | 0.12 | (1.13) | (1.01) | (0.12) | (0.01) | (0.13) | $11.15 | (8.30)% | 1.46% | 1.46% | 1.00% | 1.00% | 69% | $4,631 | |
| 2021 | $12.18 | 0.14 | 0.10 | 0.24 | (0.13) | — | (0.13) | $12.29 | 2.02% | 1.46% | 1.46% | 1.10% | 1.10% | 30% | $7,603 | |
| 2020 | $12.24 | 0.15 | (0.04) | 0.11 | (0.15) | (0.02) | (0.17) | $12.18 | 0.92% | 1.47% | 1.47% | 1.26% | 1.26% | 40% | $11,531 | |
| | |
| Notes to Financial Highlights |
(1)Computed using average shares outstanding throughout the period.
(2)Total returns are calculated based on the net asset value of the last business day and do not reflect applicable sales charges, if any. Total returns for periods less than one year are not annualized.
*The amount shown for a share outstanding throughout the period may not correlate with the Statement(s) of Operations or precisely reflect the class expense differentials due to the timing of transactions in shares of a fund in relation to income earned and/or fluctuations in the fair value of a fund's investments.
†Ratios for periods less than one year are annualized. Zero balances may reflect amounts less than 0.005%.
See Notes to Financial Statements.
| | |
| Report of Independent Registered Public Accounting Firm |
To the shareholders of the California Intermediate-Term Tax-Free Bond Fund and the Board of Trustees of American Century California Tax-Free and Municipal Funds:
Opinion on the Financial Statements and Financial Highlights
We have audited the accompanying statement of assets and liabilities, including the schedule of investments, of California Intermediate-Term Tax-Free Bond Fund (the “Fund”), one of the funds constituting the American Century California Tax-Free and Municipal Funds, as of August 31, 2024, the related statement of operations for the year then ended, the statements of changes in net assets for each of the two years in the period then ended, the financial highlights for each of the three years in the period then ended, and the related notes. In our opinion, the financial statements and financial highlights present fairly, in all material respects, the financial position of the Fund, as of August 31, 2024, and the results of its operations for the year then ended, the changes in its net assets for each of the two years in the period then ended, and the financial highlights for each of the three years in the period then ended, in conformity with accounting principles generally accepted in the United States of America. The financial highlights for each of the two years in the period ended August 31, 2021, were audited by other auditors, whose report, dated October 18, 2021, expressed an unqualified opinion on such financial highlights.
Basis for Opinion
These financial statements and financial highlights are the responsibility of the Fund's management. Our responsibility is to express an opinion on the Fund’s financial statements and financial highlights based on our audits. We are a public accounting firm registered with the Public Company Accounting Oversight Board (United States) (PCAOB) and are required to be independent with respect to the Fund in accordance with the U.S. federal securities laws and the applicable rules and regulations of the Securities and Exchange Commission and the PCAOB.
We conducted our audits in accordance with the standards of the PCAOB. Those standards require that we plan and perform the audit to obtain reasonable assurance about whether the financial statements and financial highlights are free of material misstatement, whether due to error or fraud. The Fund is not required to have, nor were we engaged to perform, an audit of its internal control over financial reporting. As part of our audits, we are required to obtain an understanding of internal control over financial reporting but not for the purpose of expressing an opinion on the effectiveness of the Fund’s internal control over financial reporting. Accordingly, we express no such opinion.
Our audits included performing procedures to assess the risks of material misstatement of the financial statements and financial highlights, whether due to error or fraud, and performing procedures that respond to those risks. Such procedures included examining, on a test basis, evidence regarding the amounts and disclosures in the financial statements and financial highlights. Our audits also included evaluating the accounting principles used and significant estimates made by management, as well as evaluating the overall presentation of the financial statements and financial highlights. Our procedures included confirmation of securities owned as of August 31, 2024, by correspondence with the custodian and brokers; when replies were not received from brokers, we performed other auditing procedures. We believe that our audits provide a reasonable basis for our opinion.
/s/ Deloitte & Touche LLP
Kansas City, Missouri
October 16, 2024
We have served as the auditor of one or more American Century investment companies since 1997.
| | |
| Approval of Management Agreement |
At a meeting held on June 13, 2024, the Fund’s Board of Trustees (the “Board”) unanimously approved the renewal of the management agreement pursuant to which American Century Investment Management, Inc. (the “Advisor”) acts as the investment advisor for the Fund. Under the Investment Company Act of 1940 (the “Investment Company Act”), contracts for investment advisory services are required to be reviewed, evaluated, and approved by a majority of a fund’s Trustees, including a majority of the independent Trustees. The Board regards this annual evaluation and renewal as one of its most important responsibilities.
The independent Trustees have memorialized a statement regarding the relationship between their ongoing obligations to oversee and evaluate the performance of the Advisor and their annual consideration of renewal of the management agreement. In that statement, the independent Trustees noted that their assessment of the Advisor’s performance is an ongoing process that takes place over the entire year and is informed by all of the extensive information that the Board and its committees receive and consider over time. This information, together with the additional materials provided specifically in connection with the review, are central to the Board’s assessment of the Advisor’s performance and its determination whether to renew the Fund’s management agreement.
Prior to its consideration of the renewal of the management agreement, the Board requested and reviewed data and analysis relating to the proposed renewal. This information and analysis was compiled by the Advisor and certain independent data providers concerning the Fund.
In connection with its consideration of the renewal of the management agreement, the Board’s review and evaluation of the services provided by the Advisor and its affiliates included, but was not limited to
•the nature, extent, and quality of investment management, shareholder services, distribution services, and other services provided to the Fund;
•the wide range of programs and services the Advisor and other service providers provide to the Fund and its shareholders on a routine and non-routine basis;
•the Fund’s investment performance compared to appropriate benchmarks and/or peer groups of other mutual funds with similar investment objectives and strategies;
•the cost of owning the Fund compared to the cost of owning similarly-managed funds;
•the Advisor’s compliance policies, procedures, and regulatory experience and those of certain other service providers;
•the Advisor’s strategic plans, generally, and with respect to the Advisor’s response to investment management industry challenges;
•the Advisor’s business continuity plans, vendor management practices, and information security practices;
•the cost of services provided to the Fund, the profitability of the Fund to the Advisor, and the Advisor’s financial results of operation;
•possible economies of scale associated with the Advisor’s management of the Fund;
•any collateral benefits derived by the Advisor from the management of the Fund;
•fees and expenses associated with any investment by the Fund in other funds;
•payments to intermediaries by the Fund and the Advisor and services provided by intermediaries in connection therewith; and
•services provided and charges to the Advisor’s other investment management clients.
In keeping with its practice, the Board held two meetings and the independent Trustees met in private sessions to discuss the renewal and to review and discuss the information provided in response to their request. The Board held active discussions with the Advisor regarding the renewal of the management agreement. The independent Trustees had the benefit of the advice of their independent counsel throughout the process.
Factors Considered
The Trustees considered all of the information provided by the Advisor, the independent data providers, and the independent Trustees’ independent counsel in connection with the approval. They determined that the information was sufficient for them to evaluate the management agreement for the Fund. In connection with their review, the Trustees did not identify any single factor as being all-important or controlling and each Trustee may have attributed different levels of importance to different factors. In deciding to renew the management agreement, the Board based its decision on a number of factors, including the following:
Nature, Extent and Quality of Services — Generally. Under the management agreement, the Advisor is responsible for providing or arranging for all services necessary for the operation of the Fund. The Board noted that the Advisor provides or arranges at its own expense a wide variety of services including, but not limited to:
•constructing and designing the Fund
•portfolio research and security selection
•initial capitalization/funding
•securities trading
•Fund administration
•custody of Fund assets
•daily valuation of the Fund’s portfolio
•liquidity monitoring and management
•risk management, including information security
•shareholder servicing and transfer agency, including shareholder confirmations, recordkeeping, and communications
•legal services (except the independent Trustees’ counsel)
•regulatory and portfolio compliance
•financial reporting
•marketing and distribution (except amounts paid by the Fund under Rule 12b-1 plans)
The Board noted that many of these services have expanded over time in terms of both quantity and complexity in response to shareholder demands, competition in the industry, changing distribution channels, and the changing regulatory environment.
Investment Management Services. The nature of the investment management services provided to the Fund is quite complex and allows Fund shareholders access to professional money management, instant diversification of their investments, the opportunity to easily diversify among asset classes by investing in or exchanging among various American Century Investments funds, and liquidity. In evaluating investment performance, the Board expects the Advisor to manage the Fund in accordance with its investment objectives and principal investment strategies. Further, the Trustees recognize that the Advisor has an obligation to seek the best execution of fund trades. In providing these services, the Advisor utilizes teams of investment professionals who require extensive information technology, research, training, compliance, and other systems to conduct their business. The Board, directly and through its Portfolio Committee, regularly reviews investment performance information for the Fund, together with comparative information for appropriate benchmarks and/or peer groups of similarly-managed funds, over different time horizons. The Trustees also review investment performance information during the management agreement renewal process. If performance concerns are identified, the Fund receives special reviews until performance improves, during which the Board discusses with the Advisor the reasons for such results and any actions being taken to improve performance. The Fund’s performance was above its benchmark for the one-, three-, five-, and ten-year periods reviewed by the Board. The Board found the investment management services provided by the Advisor to the Fund to be satisfactory and consistent with the management agreement.
Shareholder and Other Services. Under the management agreement, the Advisor, either directly or through affiliates or third parties, provides the Fund with a comprehensive package of transfer agency, shareholder, and other services. The Board, directly and through its various committees, regularly reviews reports and evaluations of such services at its regular meetings. These reports include, but are not limited to, information regarding the operational efficiency and accuracy of the shareholder and transfer agency services provided, staffing levels, shareholder satisfaction, technology support (including information security), new products and services offered to Fund shareholders, securities trading activities, portfolio valuation services, risk management, auditing services, and legal and operational compliance activities. The Board found the services provided by the Advisor to the Fund under the management agreement to be competitive and of high quality.
Costs of Services and Profitability. The Advisor provides detailed information concerning its cost of providing various services to the Fund, its profitability in managing the Fund, and its financial results of operation. The Trustees have reviewed with the Advisor the methodology used to prepare this financial information. This information is considered in evaluating the Advisor’s financial condition, its ability to continue to provide services under the management agreement, and the reasonableness of the terms of the current management agreement. The Board concluded that the Advisor’s profits were reasonable in light of the services provided to the Fund.
Ethics. The Board generally considers the Advisor’s commitment to providing quality services to shareholders and to conducting its business ethically. They noted that the Advisor’s practices generally meet or exceed industry best practices.
Economies of Scale. The Board also reviewed information provided by the Advisor regarding the possible existence of economies of scale in connection with the management of the Fund. The Board concluded that economies of scale are difficult to measure and predict with precision, especially on a fund-by-fund basis. The Board concluded that the Advisor is appropriately sharing economies of scale, to the extent they exist, through its fee structure and through reinvestment in its business, infrastructure, investment capabilities and initiatives to provide shareholders enhanced and expanded services.
Comparison to Other Funds’ Fees. The management agreement provides that the Fund pays the Advisor a single, all-inclusive (or unified) management fee for providing all services necessary for the management and operation of the Fund, other than brokerage and other transaction fees and expenses relating to acquisition and disposition of portfolio securities, acquired fund fees and expenses, taxes, interest, extraordinary expenses, fund litigation expenses, fees and expenses of the Fund’s independent Trustees (including their independent legal counsel), and expenses incurred in connection with the provision of shareholder services and distribution services under a plan adopted pursuant to Investment Company Act Rule 12b-1. Under this unified fee structure, the Advisor is responsible for providing investment advisory, custody, audit, administrative, compliance, recordkeeping, marketing, and shareholder services, or arranging and supervising third parties to provide such services. By contrast, most other funds are charged a variety of fees, including an investment advisory fee, a transfer agency fee, an administrative fee, and other expenses. Other than their investment advisory fees and any applicable Rule 12b-1 distribution fees, all other
components of the total fees charged by these other funds may be increased without shareholder approval. The Board believes the unified fee structure is a benefit to Fund shareholders because it clearly discloses to shareholders the cost of owning Fund shares, and, since the unified fee cannot be increased without a vote of Fund shareholders, it shifts to the Advisor the risk of increased costs of operating the Fund and provides a direct incentive to minimize administrative inefficiencies. Part of the Board’s analysis of fee levels involves reviewing certain evaluative data compiled by an independent provider comparing the Fund’s unified fee to the total expense ratio of peer funds. The unified fee charged to shareholders of the Fund was below the median of the total expense ratios of the Fund’s peer expense group. The Board concluded that the management fee paid by the Fund to the Advisor under the management agreement is reasonable in light of the services provided to the Fund.
Comparison to Fees and Services Provided to Other Clients of the Advisor. The Board also requested and received information from the Advisor concerning the nature of the services, fees, costs, and profitability of its advisory services to advisory clients other than the Fund. They observed that these varying types of client accounts require different services and involve different regulatory and entrepreneurial risks than the management of the Fund. The Board analyzed this information and concluded that the fees charged and services provided to the Fund were reasonable by comparison.
Payments to Intermediaries. The Trustees also requested and received a description of payments made to intermediaries by the Fund and the Advisor and services provided by intermediaries. These payments include various payments made by the Fund or the Advisor to different types of intermediaries and recordkeepers for distribution and service activities provided with respect to the Fund. The Trustees reviewed such information and received representations from the Advisor that all such payments by the Fund were made pursuant to the Fund’s Rule 12b-1 Plan and that all such payments by the Advisor were made from the Advisor’s resources and reasonable profits.
Collateral or “Fall-Out” Benefits Derived by the Advisor. The Board considered the possible existence of collateral benefits the Advisor may receive as a result of its relationship with the Fund. The Board noted that the Advisor’s primary business is managing funds and it generally does not use fund or shareholder information to generate profits in other lines of business, and therefore does not derive any significant collateral benefits from them. The Board noted that the Advisor may receive proprietary research from broker-dealers that execute fund portfolio transactions. The Board also determined that the Advisor is able to provide investment management services to certain clients other than the Fund, at least in part, due to its existing infrastructure built to serve the fund complex. The Board also noted that the assets of those other accounts are, where applicable, included with the assets of the Fund to determine breakpoints in the management fee schedule.
Existing Relationship. The Board also considered whether there was any reason for not continuing the existing arrangement with the Advisor. In this regard, the Board was mindful of the potential disruptions of the Fund’s operations and various risks, uncertainties, and other effects that could occur as a result of a decision not to continue such relationship. In particular, the Board recognized that most shareholders have invested in the Fund on the strength of the Advisor’s industry standing and reputation and in the expectation that the Advisor will have a continuing role in providing advisory services to the Fund.
Conclusion of the Trustees. As a result of this process, the Board, including all of the independent Trustees, taking into account all of the factors discussed above and the information provided by the Advisor and others in connection with its review and received over time, concluded that the terms of the management agreement are fair and reasonable and that the management fee charged to the Fund is reasonable in light of the services provided and that the management agreement between the Fund and the Advisor should be renewed for an additional one-year period.
Other Tax Information
The following information is provided pursuant to provisions of the Internal Revenue Code.
The fund designates $60,912,241 as exempt interest dividends for the fiscal year ended August 31, 2024.
| | | | | | | | |
| Contact Us | americancentury.com | |
| Automated Information Line | 1-800-345-8765 | |
| Investor Services Representative | 1-800-345-2021
or 816-531-5575 | |
| Banks and Trust Companies, Broker-Dealers, Financial Professionals, Insurance Companies | 1-800-345-6488 | |
| | |
This report and the statements it contains are submitted for the general information of our shareholders. The report is not authorized for distribution to prospective investors unless preceded or accompanied by an effective prospectus. | |
| | |
©2024 American Century Proprietary Holdings, Inc. All rights reserved.
CL-ANN-90327 2410 | |
| | | | | |
| |
| Annual Financial Statements and Other Information |
| |
| August 31, 2024 |
| |
| California Tax-Free Money Market Fund |
| Investor Class (BCTXX) |
| | | | | |
| Schedule of Investments | |
| Statement of Assets and Liabilities | |
| Statement of Operations | |
| Statement of Changes in Net Assets | |
| Notes to Financial Statements | |
| Financial Highlights | |
| Report of Independent Registered Public Accounting Firm | |
| Approval of Management Agreement | |
| |
| Other Tax Information | |
AUGUST 31, 2024
| | | | | | | | |
| | Principal Amount | Value |
| MUNICIPAL SECURITIES — 98.9% | | |
| California — 98.9% | | |
| Abag Finance Authority for Nonprofit Corps. Rev., (Lakeside Village Apartments), VRDN, 2.55%, 9/6/24 (LOC: FHLMC)(LIQ FAC: FHLMC) | $ | 450,000 | | $ | 450,000 | |
| Abag Finance Authority for Nonprofit Corps. Rev., (Public Policy Institute of California), VRDN, 2.60%, 9/6/24 (LOC: Wells Fargo Bank N.A.) | 1,300,000 | | 1,300,000 | |
| Alameda Public Financing Authority Rev., (Alameda Point Improvement Project), VRDN, 2.80%, 9/6/24 (LOC: Wells Fargo Bank N.A.) | 1,300,000 | | 1,300,000 | |
| Bay Area Toll Authority Rev., VRDN, 3.85%, 9/3/24 (LOC: Barclays Bank PLC) | 170,000 | | 170,000 | |
| Bay Area Toll Authority Rev., VRDN, 2.18%, 9/6/24 (LOC: Sumitomo Mitsui Banking Corp) | 2,150,000 | | 2,150,000 | |
| California Educational Facilities Authority Rev., (California Institute of Technology), VRDN, 2.01%, 9/6/24 | 250,000 | | 250,000 | |
| California Educational Facilities Authority Rev., (California Institute of Technology), VRDN, 2.05%, 9/6/24 | 500,000 | | 500,000 | |
| California Enterprise Development Authority Rev., (Community Hospice, Inc.), VRDN, 2.96%, 9/6/24 (LOC: Bank of Stockton and FHLB) | 1,795,000 | | 1,795,000 | |
| California Health Facilities Financing Authority, 3.65%, 9/5/24 | 4,450,000 | | 4,450,000 | |
| California Health Facilities Financing Authority Rev., (CommonSpirit Health Obligated Group), VRDN, 2.55%, 9/6/24 (LOC: Bank of Montreal) | 1,000,000 | | 1,000,000 | |
| California Housing Finance Agency Rev., (Montecito Village Affordable LP), VRDN, 2.90%, 9/6/24 (LIQ FAC: FHLMC) | 1,515,000 | | 1,515,000 | |
| California Infrastructure & Economic Development Bank Rev., (Goodwill Industries of Orange County), VRDN, 3.00%, 9/6/24 (LOC: Wells Fargo Bank N.A.) | 180,000 | | 180,000 | |
| California Infrastructure & Economic Development Bank Rev., (Kennfoods USA LLC), VRDN, 2.88%, 9/6/24 (LOC: Bank of the West and BMO Harris Bank N.A.) | 520,000 | | 520,000 | |
| California Infrastructure & Economic Development Bank Rev., (Los Angeles Society for the Prevention of Cruelty to Animals), VRDN, 2.81%, 9/6/24 (LOC: Bank of New York Mellon) | 500,000 | | 500,000 | |
| California Infrastructure & Economic Development Bank Rev., VRDN, 3.01%, 9/6/24 (LOC: Union Bank N.A.) | 1,300,000 | | 1,300,000 | |
| California Municipal Finance Authority Rev., (Pacific Meadows Senior Housing LP), VRDN, 3.00%, 9/6/24 (LOC: FHLMC)(LIQ FAC: FHLMC) | 1,850,000 | | 1,850,000 | |
| California Public Finance Authority Rev., (Hoag Memorial Hospital Presbyterian Obligated Group), VRDN, 3.80%, 9/3/24 (LIQ FAC: JPMorgan Chase Bank N.A.)(SBBPA: JPMorgan Chase Bank N.A.) | 1,900,000 | | 1,900,000 | |
| California Public Finance Authority Rev., (Sharp Healthcare Obligated Group), VRDN, 2.20%, 9/6/24 (LOC: Royal Bank of Canada) | 1,000,000 | | 1,000,000 | |
| California Statewide Communities Development Authority Rev., (Marvin & Bebe L Zigman), VRDN, 2.74%, 9/6/24 (LOC: Wells Fargo Bank N.A.) | 1,000,000 | | 1,000,000 | |
| California Statewide Communities Development Authority Rev., (Rady Children's Hospital Obligated Group), VRDN, 2.50%, 9/6/24 (LOC: Northern Trust Company) | 500,000 | | 500,000 | |
| California Statewide Communities Development Authority Rev., (Southside Brookshore Associates LP), VRDN, 2.96%, 9/6/24 (LOC: East West Bank and FHLB) | 7,290,000 | | 7,290,000 | |
| Calleguas-Las Virgenes Public Financing Authority Rev., VRDN, 2.60%, 9/6/24 (LOC: Wells Fargo Bank N.A.) | 500,000 | | 500,000 | |
| Los Angeles Rev., 5.00%, 6/26/25 | 4,000,000 | | 4,049,915 | |
| Los Angeles County Capital Asset Leasing Corp., 3.50%, 11/5/24 (LIQ FAC: Bank of Montreal) | 3,700,000 | | 3,700,000 | |
| Los Angeles Department of Airports, 2.95%, 12/5/24 (LIQ FAC: Bank of America N.A.) | 1,202,000 | | 1,202,000 | |
| Metropolitan Water District of Southern California Rev., VRDN, 2.40%, 9/6/24 (SBBPA: Bank of America N.A.) | 1,390,000 | | 1,390,000 | |
Mizuho Floater/Residual Trust Rev., VRDN, 3.24%, 10/4/24 (LOC: Mizuho Capital Markets LLC)(1) | 3,970,000 | | 3,970,000 | |
| Modesto Rev., (VO Associates A California LP), VRDN, 2.20%, 9/6/24 (LOC: FHLMC)(LIQ FAC: FHLMC) | 3,675,000 | | 3,675,000 | |
| Modesto Rev., (Westdale Commons A California LP), VRDN, 1.95%, 9/6/24 (LOC: FNMA) | 1,200,000 | | 1,200,000 | |
| Municipal Improvement Corp. of Los Angeles, 3.00%, 9/5/24 (LIQ FAC: U.S. Bank N.A.) | 3,800,000 | | 3,800,000 | |
| Municipal Improvement Corp. of Los Angeles, 3.38%, 9/5/24 (LIQ FAC: U.S. Bank N.A.) | 2,000,000 | | 2,000,000 | |
| Orange County Water District COP, VRDN, 2.05%, 9/6/24 (LOC: Bank of America N.A.) | 1,000,000 | | 1,000,000 | |
RBC Municipal Products, Inc. Trust Rev., VRDN, 2.92%, 9/6/24 (LOC: Royal Bank of Canada)(LIQ FAC: Royal Bank of Canada)(1) | 3,000,000 | | 3,000,000 | |
| Reedley COP, (Mennonite Brethren Homes, Inc.), VRDN, 2.92%, 9/6/24 (LOC: Bank of the Sierra and FHLB) | 1,510,000 | | 1,510,000 | |
| Regents of the University of California Medical Center Pooled Rev., VRDN, 3.60%, 9/3/24 | 250,000 | | 250,000 | |
| Regents of the University of California Medical Center Pooled Rev., VRDN, 3.85%, 9/3/24 | 4,640,000 | | 4,640,000 | |
| Riverside County GO, 3.875%, 10/18/24 | 5,500,000 | | 5,501,187 | |
| Riverside County Housing Authority Rev., (Pacific Inland Communities LLC), VRDN, 2.60%, 9/6/24 (LOC: FNMA)(LIQ FAC: FNMA) | 2,000,000 | | 2,000,000 | |
| | | | | | | | |
| | Principal Amount | Value |
| San Diego County COP, VRDN, 2.02%, 9/6/24 (LOC: Northern Trust Co.) | $ | 1,950,000 | | $ | 1,950,000 | |
| San Francisco City & County Airport Comm-San Francisco International Airport Rev., VRDN, 2.00%, 9/6/24 (LOC: Barclays Bank PLC) | 800,000 | | 800,000 | |
| San Mateo Joint Powers Financing Authority Rev., (City of San Mateo CA), VRDN, 2.20%, 9/6/24 (LOC: Wells Fargo Bank N.A.) | 840,000 | | 840,000 | |
| Santa Clara County Financing Authority Rev., (El Camino Hospital), VRDN, 2.03%, 9/6/24 (LOC: Wells Fargo Bank N.A.) | 3,350,000 | | 3,350,000 | |
| State of California, 3.44%, 10/2/24 (LIQ FAC: Wells Fargo Bank N.A.) | 1,300,000 | | 1,300,000 | |
| State of California Department of Water Resources, 3.10%, 10/10/24 | 3,500,000 | | 3,500,000 | |
Tender Option Bond Trust Receipts/Certificates Rev., VRDN, 4.10%, 9/3/24 (LOC: Barclays Bank PLC)(LIQ FAC: Barclays Bank PLC)(1) | 1,720,000 | | 1,720,000 | |
Tender Option Bond Trust Receipts/Certificates Rev., VRDN, 2.97%, 9/6/24 (LOC: Deutsche Bank AG)(LIQ FAC: Deutsche Bank AG)(1) | 2,830,000 | | 2,830,000 | |
Tender Option Bond Trust Receipts/Certificates Rev., VRDN, 3.05%, 9/6/24 (LOC: Bank of America N.A.)(LIQ FAC: Bank of America N.A.)(1) | 2,400,000 | | 2,400,000 | |
Tender Option Bond Trust Receipts/Certificates Rev., VRDN, 3.24%, 9/6/24 (LIQ FAC: Mizuho Capital Markets LLC)(GA: Mizuho Capital Markets LLC)(1) | 3,385,000 | | 3,385,000 | |
Tender Option Bond Trust Receipts/Certificates Rev., VRDN, 3.05%, 10/4/24 (LOC: Bank of America N.A.)(LIQ FAC: Bank of America N.A.)(1) | 4,000,000 | | 4,000,000 | |
Tender Option Bond Trust Receipts/Certificates Tax Allocation, VRDN, 3.00%, 9/6/24 (LOC: Barclays Bank PLC)(LIQ FAC: Barclays Bank PLC)(1) | 5,290,000 | | 5,290,000 | |
| University of California, 3.50%, 10/10/24 | 1,050,000 | | 1,050,000 | |
| University of California Rev., VRDN, 3.45%, 9/3/24 | 1,755,000 | | 1,755,000 | |
| University of California Rev., VRDN, 3.85%, 9/3/24 | 1,200,000 | | 1,200,000 | |
| Yolo County Rev., (Beckett Hall, Inc.), VRDN, 2.59%, 9/6/24 (LOC: BMO Harris Bank N.A.) | 2,050,000 | | 2,050,000 | |
| TOTAL INVESTMENT SECURITIES — 98.9% | | 111,728,102 | |
| OTHER ASSETS AND LIABILITIES — 1.1% | | 1,263,081 | |
| TOTAL NET ASSETS — 100.0% | | $ | 112,991,183 | |
| | | | | | | | |
| NOTES TO SCHEDULE OF INVESTMENTS |
| COP | – | Certificates of Participation |
| FHLB | – | Federal Home Loan Bank |
| FHLMC | – | Federal Home Loan Mortgage Corp. |
| FNMA | – | Federal National Mortgage Association |
| GA | – | Guaranty Agreement |
| GO | – | General Obligation |
| LIQ FAC | – | Liquidity Facilities |
| LOC | – | Letter of Credit |
| SBBPA | – | Standby Bond Purchase Agreement |
| VRDN | – | Variable Rate Demand Note. The instrument may be payable upon demand and adjusts periodically based upon the terms set forth in the security's offering documents. The rate shown is effective at the period end and the reference rate and spread, if any, is indicated. The date of the demand feature is disclosed. |
(1)Security was purchased pursuant to Rule 144A or Section 4(2) under the Securities Act of 1933 and may be sold in transactions exempt from registration, normally to qualified institutional investors. The aggregate value of these securities at the period end was $26,595,000, which represented 23.5% of total net assets.
See Notes to Financial Statements.
| | |
| Statement of Assets and Liabilities |
| | | | | |
| AUGUST 31, 2024 |
| Assets |
| Investment securities, at value (amortized cost and cost for federal income tax purposes) | $ | 111,728,102 | |
| Cash | 279,644 | |
| Receivable for investments sold | 255,000 | |
| Receivable for capital shares sold | 84,704 | |
| Interest receivable | 707,795 | |
| 113,055,245 | |
| |
| Liabilities | |
| Payable for capital shares redeemed | 18,105 | |
| Accrued management fees | 45,957 | |
| 64,062 | |
| |
| Net Assets | $ | 112,991,183 | |
| |
| Investor Class Capital Shares | |
| Shares outstanding (unlimited number of shares authorized) | 112,986,221 | |
| |
| Net Asset Value Per Share | $ | 1.00 | |
| |
| Net Assets Consist of: | |
| Capital paid in | $ | 112,986,227 | |
| Distributable earnings (loss) | 4,956 | |
| $ | 112,991,183 | |
See Notes to Financial Statements.
| | | | | |
| YEAR ENDED AUGUST 31, 2024 |
| Investment Income (Loss) | |
| Income: | |
| Interest | $ | 3,774,758 | |
| |
| Expenses: | |
| Management fees | 565,917 | |
| Trustees' fees and expenses | 8,452 | |
| 574,369 | |
| |
| |
| |
| Net investment income (loss) | 3,200,389 | |
| |
| Net Increase (Decrease) in Net Assets Resulting from Operations | $ | 3,200,389 | |
See Notes to Financial Statements.
| | |
| Statement of Changes in Net Assets |
| | | | | | | | |
| YEARS ENDED AUGUST 31, 2024 AND AUGUST 31, 2023 |
| Increase (Decrease) in Net Assets | August 31, 2024 | August 31, 2023 |
| Operations | | |
| Net investment income (loss) | $ | 3,200,389 | | $ | 2,684,769 | |
| Net realized gain (loss) | — | | 5,554 | |
| Net increase (decrease) in net assets resulting from operations | 3,200,389 | | 2,690,323 | |
| | |
| Distributions to Shareholders | | |
| From earnings | (3,200,389) | | (2,684,769) | |
| | |
| Capital Share Transactions | | |
| Proceeds from shares sold | 47,424,842 | | 57,670,089 | |
| Proceeds from reinvestment of distributions | 3,148,628 | | 2,623,976 | |
| Payments for shares redeemed | (57,461,539) | | (59,907,094) | |
| Net increase (decrease) in net assets from capital share transactions | (6,888,069) | | 386,971 | |
| | |
| Net increase (decrease) in net assets | (6,888,069) | | 392,525 | |
| | |
| Net Assets | | |
| Beginning of period | 119,879,252 | | 119,486,727 | |
| End of period | $ | 112,991,183 | | $ | 119,879,252 | |
| | |
| Transactions in Shares of the Fund | | |
| Sold | 47,424,842 | | 57,670,089 | |
| Issued in reinvestment of distributions | 3,148,628 | | 2,623,976 | |
| Redeemed | (57,461,539) | | (59,907,094) | |
| Net increase (decrease) in shares of the fund | (6,888,069) | | 386,971 | |
See Notes to Financial Statements.
| | |
| Notes to Financial Statements |
AUGUST 31, 2024
1. Organization
American Century California Tax-Free and Municipal Funds (the trust) is registered under the Investment Company Act of 1940, as amended (the 1940 Act), as an open-end management investment company and is organized as a Massachusetts business trust. California Tax-Free Money Market Fund (the fund) is one fund in a series issued by the trust. The fund’s investment objective is to seek safety of principal and high current income that is exempt from federal and California income taxes.
2. Significant Accounting Policies
The following is a summary of significant accounting policies consistently followed by the fund in preparation of its financial statements. The fund is an investment company and follows accounting and reporting guidance in accordance with accounting principles generally accepted in the United States of America. This may require management to make certain estimates and assumptions at the date of the financial statements. Actual results could differ from these estimates. Management evaluated the impact of events or transactions occurring through the date the financial statements were issued that would merit recognition or disclosure.
Investment Valuations — The fund determines the fair value of its investments and computes its net asset value (NAV) per share at the close of regular trading (usually 4 p.m. Eastern time) on the New York Stock Exchange (NYSE) on each day the NYSE is open. The value of investments of the fund is determined by American Century Investment Management, Inc. (ACIM) (the investment advisor), as the valuation designee, pursuant to its valuation policies and procedures. The Board of Trustees oversees the valuation designee and reviews its valuation policies and procedures at least annually. Investments are generally valued at amortized cost, which approximates fair value. If the valuation designee determines that the valuation methods do not reflect an investment’s fair value, such investment is valued as determined in good faith by the valuation designee.
Security Transactions — Security transactions are accounted for as of the trade date. Net realized gains and losses are determined on the identified cost basis, which is also used for federal income tax purposes.
Investment Income — Interest income is recorded on the accrual basis and includes accretion of discounts and amortization of premiums.
Income Tax Status — It is the fund's policy to distribute substantially all net investment income and net realized gains to shareholders and to otherwise qualify as a regulated investment company under provisions of the Internal Revenue Code. Accordingly, no provision has been made for income taxes. The fund files U.S. federal, state, local and non-U.S. tax returns as applicable. The fund's tax returns are subject to examination by the relevant taxing authority until expiration of the applicable statute of limitations, which is generally three years from the date of filing but can be longer in certain jurisdictions. At this time, management believes there are no uncertain tax positions which, based on their technical merit, would not be sustained upon examination and for which it is reasonably possible that the total amounts of unrecognized tax benefits will significantly change in the next twelve months.
Distributions to Shareholders — Distributions from net investment income, if any, are declared daily and paid monthly. The fund may make capital gains distributions to comply with the distribution requirements of the Internal Revenue Code.
Indemnifications — Under the trust’s organizational documents, its officers and trustees are indemnified against certain liabilities arising out of the performance of their duties to the fund. In addition, in the normal course of business, the fund enters into contracts that provide general indemnifications. The maximum exposure under these arrangements is unknown as this would involve future claims that may be made against a fund. The risk of material loss from such claims is considered by management to be remote.
3. Fees and Transactions with Related Parties
Certain officers and trustees of the trust are also officers and/or directors of American Century Companies, Inc. (ACC). The trust's investment advisor, ACIM, the trust's distributor, American Century Investment Services, Inc., and the trust's transfer agent, American Century Services, LLC, are wholly owned, directly or indirectly, by ACC.
Management Fees — The trust has entered into a management agreement with ACIM, under which ACIM provides the fund with investment advisory and management services in exchange for a single, unified management fee (the fee). The agreement provides that ACIM will pay all expenses of managing and operating the fund, except brokerage expenses, taxes, interest, fees and expenses of the independent trustees (including legal counsel fees), and extraordinary expenses. The fee is computed and accrued daily based on the daily net assets of the fund and paid monthly in arrears. The fee consists of (1) an Investment Category Fee based on the daily net assets of the fund and certain other accounts managed by the investment advisor that are in the same broad investment category as the fund and (2) a Complex Fee based on the assets of all funds in the American Century Investments family of funds that have the same investment advisor and distributor as the fund. For purposes of determining the Investment Category Fee and Complex Fee, the assets of funds managed by the investment advisor that invest exclusively in the shares of other funds (funds of funds) are not included. The rates for the Investment Category Fee range from 0.1570% to 0.2700% and the rates for the Complex Fee range from 0.2500% to 0.3100%. The effective annual management fee for the period ended August 31, 2024 was 0.49%.
Trustees' Fees and Expenses — The Board of Trustees is responsible for overseeing the investment advisor’s management and operations of the fund. The trustees receive detailed information about the fund and its investment advisor regularly throughout the year, and meet at least quarterly with management of the investment advisor to review reports about fund operations. The fund's officers do not receive compensation from the fund.
Interfund Transactions — The fund may enter into security transactions with other American Century Investments funds and other client accounts of the investment advisor, in accordance with the 1940 Act rules and procedures adopted by the Board of Trustees. The rules and procedures require, among other things, that these transactions be effected at the independent current market price of the security. During the period, the interfund purchases and sales were $2,700,000 and $1,650,000, respectively. The interfund transactions had no effect on the Statement of Operations in net realized gain (loss) on investment transactions.
4. Fair Value Measurements
The fund's investments valuation process is based on several considerations and may use multiple inputs to determine the fair value of the investments held by the fund. In conformity with accounting principles generally accepted in the United States of America, the inputs used to determine a valuation are classified into three broad levels.
•Level 1 valuation inputs consist of unadjusted quoted prices in an active market for identical investments.
•Level 2 valuation inputs consist of direct or indirect observable market data (including quoted prices for comparable investments, evaluations of subsequent market events, interest rates, prepayment speeds, credit risk, etc.). These inputs also consist of quoted prices for identical investments initially expressed in local currencies that are adjusted through translation into U.S. dollars.
•Level 3 valuation inputs consist of unobservable data (including a fund’s own assumptions).
The level classification is based on the lowest level input that is significant to the fair valuation measurement. The valuation inputs are not necessarily an indication of the risks associated with investing in these securities or other financial instruments.
As of period end, the fund’s investment securities were classified as Level 2. The Schedule of Investments provides additional information on the fund’s portfolio holdings.
5. Risk Factors
The fund focuses its investments in a single state and therefore may have more exposure to credit risk related to the state of California than a fund with a broader geographical diversification.
6. Federal Tax Information
The tax character of distributions paid during the years ended August 31, 2024 and August 31, 2023 were as follows:
| | | | | | | | |
| 2024 | 2023 |
| Distributions Paid From | | |
| Exempt income | $ | 3,195,433 | | $ | 2,684,769 | |
| Long-term capital gains | $ | 4,956 | | — | |
The book-basis character of distributions made during the year from net investment income or net realized gains may differ from their ultimate characterization for federal income tax purposes. These differences reflect the differing character of certain income items and net realized gains and losses for financial statement and tax purposes, and may result in reclassification among certain capital accounts on the financial statements.
As of August 31, 2024, the fund had undistributed exempt income for federal income tax purposes of $4,956.
| | | | | | | | | | | | | | | | | | | | | | | | | | | | | | | | | | | | | | |
| For a Share Outstanding Throughout the Years Ended August 31 (except as noted) |
| Per-Share Data | Ratios and Supplemental Data |
| | Income From Investment Operations*: | | | | Ratio to Average Net Assets of†: | |
| Net Asset Value, Beginning of Period | Net
Investment
Income
(Loss) | Net Realized and Unrealized Gain (Loss) | Total From Investment Operations | Distributions
From Net
Investment
Income | Net Asset Value, End of Period | Total Return(1) | Operating
Expenses | Operating
Expenses
(before
expense
waiver) | Net
Investment
Income
(Loss) | Net Investment
Income
(Loss) (before
expense
waiver) | Net Assets, End of Period (in thousands) |
| Investor Class |
| 2024 | $1.00 | 0.03 | —(2) | 0.03 | (0.03) | $1.00 | 2.81% | 0.50% | 0.50% | 2.77% | 2.77% | $112,991 | |
| 2023 | $1.00 | 0.02 | —(2) | 0.02 | (0.02) | $1.00 | 2.21% | 0.50% | 0.50% | 2.18% | 2.18% | $119,879 | |
| 2022 | $1.00 | —(2) | — | —(2) | —(2) | $1.00 | 0.19% | 0.28% | 0.50% | 0.18% | (0.04)% | $119,487 | |
| 2021 | $1.00 | —(2) | —(2) | —(2) | —(2) | $1.00 | 0.01% | 0.11% | 0.50% | 0.01% | (0.38)% | $127,418 | |
| 2020 | $1.00 | 0.01 | — | 0.01 | (0.01) | $1.00 | 0.53% | 0.42% | 0.50% | 0.55% | 0.47% | $134,252 | |
| | |
| Notes to Financial Highlights |
(1)Total returns are calculated based on the net asset value of the last business day. Total returns for periods less than one year are not annualized.
(2)Per-share amount was less than $0.005.
*The amount shown for a share outstanding throughout the period may not correlate with the Statement(s) of Operations due to the timing of transactions in shares of a fund in relation to income earned and/or fluctuations in the fair value of a fund's investments.
†Ratios for periods less than one year are annualized. Zero balances may reflect amounts less than 0.005%.
See Notes to Financial Statements.
| | |
| Report of Independent Registered Public Accounting Firm |
To the shareholders of the California Tax-Free Money Market Fund and the Board of Trustees of American Century California Tax-Free and Municipal Funds:
Opinion on the Financial Statements and Financial Highlights
We have audited the accompanying statement of assets and liabilities, including the schedule of investments, of California Tax-Free Money Market Fund (the “Fund”), one of the funds constituting the American Century California Tax-Free and Municipal Funds, as of August 31, 2024, the related statement of operations for the year then ended, the statements of changes in net assets for each of the two years in the period then ended, the financial highlights for each of the three years in the period then ended, and the related notes. In our opinion, the financial statements and financial highlights present fairly, in all material respects, the financial position of the Fund, as of August 31, 2024, and the results of its operations for the year then ended, the changes in its net assets for each of the two years in the period then ended, and the financial highlights for each of the three years in the period then ended, in conformity with accounting principles generally accepted in the United States of America. The financial highlights for each of the two years in the period ended August 31, 2021, were audited by other auditors, whose report, dated October 18, 2021, expressed an unqualified opinion on such financial highlights.
Basis for Opinion
These financial statements and financial highlights are the responsibility of the Fund's management. Our responsibility is to express an opinion on the Fund’s financial statements and financial highlights based on our audits. We are a public accounting firm registered with the Public Company Accounting Oversight Board (United States) (PCAOB) and are required to be independent with respect to the Fund in accordance with the U.S. federal securities laws and the applicable rules and regulations of the Securities and Exchange Commission and the PCAOB.
We conducted our audits in accordance with the standards of the PCAOB. Those standards require that we plan and perform the audit to obtain reasonable assurance about whether the financial statements and financial highlights are free of material misstatement, whether due to error or fraud. The Fund is not required to have, nor were we engaged to perform, an audit of its internal control over financial reporting. As part of our audits, we are required to obtain an understanding of internal control over financial reporting but not for the purpose of expressing an opinion on the effectiveness of the Fund’s internal control over financial reporting. Accordingly, we express no such opinion.
Our audits included performing procedures to assess the risks of material misstatement of the financial statements and financial highlights, whether due to error or fraud, and performing procedures that respond to those risks. Such procedures included examining, on a test basis, evidence regarding the amounts and disclosures in the financial statements and financial highlights. Our audits also included evaluating the accounting principles used and significant estimates made by management, as well as evaluating the overall presentation of the financial statements and financial highlights. Our procedures included confirmation of securities owned as of August 31, 2024, by correspondence with the custodian and brokers; when replies were not received from brokers, we performed other auditing procedures. We believe that our audits provide a reasonable basis for our opinion.
/s/ Deloitte & Touche LLP
Kansas City, Missouri
October 16, 2024
We have served as the auditor of one or more American Century investment companies since 1997.
| | |
| Approval of Management Agreement |
At a meeting held on June 13, 2024, the Fund’s Board of Trustees (the “Board”) unanimously approved the renewal of the management agreement pursuant to which American Century Investment Management, Inc. (the “Advisor”) acts as the investment advisor for the Fund. Under the Investment Company Act of 1940 (the “Investment Company Act”), contracts for investment advisory services are required to be reviewed, evaluated, and approved by a majority of a fund’s Trustees, including a majority of the independent Trustees. The Board regards this annual evaluation and renewal as one of its most important responsibilities.
The independent Trustees have memorialized a statement regarding the relationship between their ongoing obligations to oversee and evaluate the performance of the Advisor and their annual consideration of renewal of the management agreement. In that statement, the independent Trustees noted that their assessment of the Advisor’s performance is an ongoing process that takes place over the entire year and is informed by all of the extensive information that the Board and its committees receive and consider over time. This information, together with the additional materials provided specifically in connection with the review, are central to the Board’s assessment of the Advisor’s performance and its determination whether to renew the Fund’s management agreement.
Prior to its consideration of the renewal of the management agreement, the Board requested and reviewed data and analysis relating to the proposed renewal. This information and analysis was compiled by the Advisor and certain independent data providers concerning the Fund.
In connection with its consideration of the renewal of the management agreement, the Board’s review and evaluation of the services provided by the Advisor and its affiliates included, but was not limited to
•the nature, extent, and quality of investment management, shareholder services, distribution services, and other services provided to the Fund;
•the wide range of programs and services the Advisor and other service providers provide to the Fund and its shareholders on a routine and non-routine basis;
•the Fund’s investment performance compared to appropriate benchmarks and/or peer groups of other mutual funds with similar investment objectives and strategies;
•the cost of owning the Fund compared to the cost of owning similarly-managed funds;
•the Advisor’s compliance policies, procedures, and regulatory experience and those of certain other service providers;
•the Advisor’s strategic plans, generally, and with respect to the Advisor’s response to investment management industry challenges;
•the Advisor’s business continuity plans, vendor management practices, and information security practices;
•the cost of services provided to the Fund, the profitability of the Fund to the Advisor, and the Advisor’s financial results of operation;
•possible economies of scale associated with the Advisor’s management of the Fund;
•any collateral benefits derived by the Advisor from the management of the Fund;
•fees and expenses associated with any investment by the Fund in other funds;
•payments to intermediaries by the Fund and the Advisor and services provided by intermediaries in connection therewith; and
•services provided and charges to the Advisor’s other investment management clients.
In keeping with its practice, the Board held two meetings and the independent Trustees met in private sessions to discuss the renewal and to review and discuss the information provided in response to their request. The Board held active discussions with the Advisor regarding the renewal of the management agreement. The independent Trustees had the benefit of the advice of their independent counsel throughout the process.
Factors Considered
The Trustees considered all of the information provided by the Advisor, the independent data providers, and the independent Trustees’ independent counsel in connection with the approval. They determined that the information was sufficient for them to evaluate the management agreement for the Fund. In connection with their review, the Trustees did not identify any single factor as being all-important or controlling and each Trustee may have attributed different levels of importance to different factors. In deciding to renew the management agreement, the Board based its decision on a number of factors, including the following:
Nature, Extent and Quality of Services — Generally. Under the management agreement, the Advisor is responsible for providing or arranging for all services necessary for the operation of the Fund. The Board noted that the Advisor provides or arranges at its own expense a wide variety of services including, but not limited to:
•constructing and designing the Fund
•portfolio research and security selection
•initial capitalization/funding
•securities trading
•Fund administration
•custody of Fund assets
•daily valuation of the Fund’s portfolio
•liquidity monitoring and management
•risk management, including information security
•shareholder servicing and transfer agency, including shareholder confirmations, recordkeeping, and communications
•legal services (except the independent Trustees’ counsel)
•regulatory and portfolio compliance
•financial reporting
•marketing and distribution (except amounts paid by the Fund under Rule 12b-1 plans)
The Board noted that many of these services have expanded over time in terms of both quantity and complexity in response to shareholder demands, competition in the industry, changing distribution channels, and the changing regulatory environment.
Investment Management Services. The nature of the investment management services provided to the Fund is quite complex and allows Fund shareholders access to professional money management, instant diversification of their investments, the opportunity to easily diversify among asset classes by investing in or exchanging among various American Century Investments funds, and liquidity. In evaluating investment performance, the Board expects the Advisor to manage the Fund in accordance with its investment objectives and principal investment strategies. Further, the Trustees recognize that the Advisor has an obligation to seek the best execution of fund trades. In providing these services, the Advisor utilizes teams of investment professionals who require extensive information technology, research, training, compliance, and other systems to conduct their business. The Board, directly and through its Portfolio Committee, regularly reviews investment performance information for the Fund, together with comparative information for appropriate benchmarks and/or peer groups of similarly-managed funds, over different time horizons. The Trustees also review investment performance information during the management agreement renewal process. If performance concerns are identified, the Fund receives special reviews until performance improves, during which the Board discusses with the Advisor the reasons for such results and any actions being taken to improve performance. The Fund’s performance was above its peer group median for the one-, three-, five-, and ten-year periods reviewed by the Board. The Board found the investment management services provided by the Advisor to the Fund to be satisfactory and consistent with the management agreement.
Shareholder and Other Services. Under the management agreement, the Advisor, either directly or through affiliates or third parties, provides the Fund with a comprehensive package of transfer agency, shareholder, and other services. The Board, directly and through its various committees, regularly reviews reports and evaluations of such services at its regular meetings. These reports include, but are not limited to, information regarding the operational efficiency and accuracy of the shareholder and transfer agency services provided, staffing levels, shareholder satisfaction, technology support (including information security), new products and services offered to Fund shareholders, securities trading activities, portfolio valuation services, risk management, auditing services, and legal and operational compliance activities. The Board found the services provided by the Advisor to the Fund under the management agreement to be competitive and of high quality.
Costs of Services and Profitability. The Advisor provides detailed information concerning its cost of providing various services to the Fund, its profitability in managing the Fund, and its financial results of operation. The Trustees have reviewed with the Advisor the methodology used to prepare this financial information. This information is considered in evaluating the Advisor’s financial condition, its ability to continue to provide services under the management agreement, and the reasonableness of the terms of the current management agreement. The Board concluded that the Advisor’s profits were reasonable in light of the services provided to the Fund.
Ethics. The Board generally considers the Advisor’s commitment to providing quality services to shareholders and to conducting its business ethically. They noted that the Advisor’s practices generally meet or exceed industry best practices.
Economies of Scale. The Board also reviewed information provided by the Advisor regarding the possible existence of economies of scale in connection with the management of the Fund. The Board concluded that economies of scale are difficult to measure and predict with precision, especially on a fund-by-fund basis. The Board concluded that the Advisor is appropriately sharing economies of scale, to the extent they exist, through its fee structure and through reinvestment in its business, infrastructure, investment capabilities and initiatives to provide shareholders enhanced and expanded services.
Comparison to Other Funds’ Fees. The management agreement provides that the Fund pays the Advisor a single, all-inclusive (or unified) management fee for providing all services necessary for the management and operation of the Fund, other than brokerage and other transaction fees and expenses relating to acquisition and disposition of portfolio securities, acquired fund fees and expenses, taxes, interest, extraordinary expenses, fund litigation expenses, fees and expenses of the Fund’s independent Trustees (including their independent legal counsel), and expenses incurred in connection with the provision of shareholder services and distribution services under a plan adopted pursuant to Investment Company Act Rule 12b-1. Under this unified fee structure, the Advisor is responsible for providing investment advisory, custody, audit, administrative, compliance, recordkeeping, marketing, and shareholder services, or arranging and supervising third parties to provide such services. By contrast, most other funds are charged a variety of fees, including an investment advisory fee, a transfer agency fee, an administrative fee, and other expenses. Other than their investment advisory fees and any applicable Rule 12b-1 distribution fees, all other
components of the total fees charged by these other funds may be increased without shareholder approval. The Board believes the unified fee structure is a benefit to Fund shareholders because it clearly discloses to shareholders the cost of owning Fund shares, and, since the unified fee cannot be increased without a vote of Fund shareholders, it shifts to the Advisor the risk of increased costs of operating the Fund and provides a direct incentive to minimize administrative inefficiencies. Part of the Board’s analysis of fee levels involves reviewing certain evaluative data compiled by an independent provider comparing the Fund’s unified fee to the total expense ratio of peer funds. The unified fee charged to the Fund was above the median of the net prospectus expense ratios of the Fund’s peer expense universe. The Board concluded that the management fee paid by the Fund to the Advisor under the management agreement is reasonable in light of the services provided to the Fund.
Comparison to Fees and Services Provided to Other Clients of the Advisor. The Board also requested and received information from the Advisor concerning the nature of the services, fees, costs, and profitability of its advisory services to advisory clients other than the Fund. They observed that these varying types of client accounts require different services and involve different regulatory and entrepreneurial risks than the management of the Fund. The Board analyzed this information and concluded that the fees charged and services provided to the Fund were reasonable by comparison.
Payments to Intermediaries. The Trustees also requested and received a description of payments made to intermediaries by the Fund and the Advisor and services provided by intermediaries. These payments include various payments made by the Fund or the Advisor to different types of intermediaries and recordkeepers for distribution and service activities provided with respect to the Fund. The Trustees reviewed such information and received representations from the Advisor that all such payments by the Fund were made pursuant to the Fund’s Rule 12b-1 Plan and that all such payments by the Advisor were made from the Advisor’s resources and reasonable profits.
Collateral or “Fall-Out” Benefits Derived by the Advisor. The Board considered the possible existence of collateral benefits the Advisor may receive as a result of its relationship with the Fund. The Board noted that the Advisor’s primary business is managing funds and it generally does not use fund or shareholder information to generate profits in other lines of business, and therefore does not derive any significant collateral benefits from them. The Board noted that the Advisor may receive proprietary research from broker-dealers that execute fund portfolio transactions. The Board also determined that the Advisor is able to provide investment management services to certain clients other than the Fund, at least in part, due to its existing infrastructure built to serve the fund complex. The Board also noted that the assets of those other accounts are, where applicable, included with the assets of the Fund to determine breakpoints in the management fee schedule.
Existing Relationship. The Board also considered whether there was any reason for not continuing the existing arrangement with the Advisor. In this regard, the Board was mindful of the potential disruptions of the Fund’s operations and various risks, uncertainties, and other effects that could occur as a result of a decision not to continue such relationship. In particular, the Board recognized that most shareholders have invested in the Fund on the strength of the Advisor’s industry standing and reputation and in the expectation that the Advisor will have a continuing role in providing advisory services to the Fund.
Conclusion of the Trustees. As a result of this process, the Board, including all of the independent Trustees, taking into account all of the factors discussed above and the information provided by the Advisor and others in connection with its review and received over time, concluded that the terms of the management agreement are fair and reasonable and that the management fee charged to the Fund is reasonable in light of the services provided and that the management agreement between the Fund and the Advisor should be renewed for an additional one-year period.
Other Tax Information
The following information is provided pursuant to provisions of the Internal Revenue Code.
The fund designates $3,195,433 as exempt interest dividends for the fiscal year ended August 31, 2024.
The fund hereby designates $4,956 or up to the maximum amount allowable, as long-term capital gain distributions (20% rate gain distributions) for the fiscal year ended August 31, 2024.
| | | | | | | | |
| Contact Us | americancentury.com | |
| Automated Information Line | 1-800-345-8765 | |
| Investor Services Representative | 1-800-345-2021
or 816-531-5575 | |
| Banks and Trust Companies, Broker-Dealers, Financial Professionals, Insurance Companies | 1-800-345-6488 | |
| | |
This report and the statements it contains are submitted for the general information of our shareholders. The report is not authorized for distribution to prospective investors unless preceded or accompanied by an effective prospectus. | |
| | |
©2024 American Century Proprietary Holdings, Inc. All rights reserved.
CL-ANN-90328 2410 | |
(b) The information required by Item 13 of Form N-1A is included as part of the financial statements filed under Item 7(a) of this Form.
ITEM 8. CHANGES IN AND DISAGREEMENTS WITH ACCOUNTANTS FOR OPEN-END MANAGEMENT INVESTMENT COMPANIES.
None.
ITEM 9. PROXY DISCLOSURES FOR OPEN-END MANAGEMENT INVESTMENT COMPANIES.
None.
ITEM 10. REMUNERATION PAID TO DIRECTORS, OFFICERS, AND OTHERS OF OPEN-END MANAGEMENT INVESTMENT COMPANIES.
The remuneration paid to directors, officers and others is included as part of the report to stockholders filed under Item 7 of this Form.
ITEM 11. STATEMENT REGARDING BASIS FOR APPROVAL OF INVESTMENT ADVISORY CONTRACT.
| | |
|
| A statement regarding the basis for the board of directors’ approval of the investment advisory contract is included as part of the reports to stockholders filed under Item 7 of this Form. |
|
ITEM 12. DISCLOSURE OF PROXY VOTING POLICIES AND PROCEDURES FOR CLOSED-END MANAGEMENT INVESTMENT COMPANIES.
Not applicable.
ITEM 13. PORTFOLIO MANAGERS OF CLOSED-END MANAGEMENT INVESTMENT COMPANIES.
Not applicable.
ITEM 14. PURCHASES OF EQUITY SECURITIES BY CLOSED-END MANAGEMENT INVESTMENT COMPANY AND AFFILIATED PURCHASERS.
Not applicable.
ITEM 15. SUBMISSION OF MATTERS TO A VOTE OF SECURITY HOLDERS.
During the reporting period, there were no material changes to the procedures by which shareholders may recommend nominees to the registrant’s board.
ITEM 16. CONTROLS AND PROCEDURES.
(a) The registrant's principal executive officer and principal financial officer have concluded that the registrant's disclosure controls and procedures (as defined in Rule 30a-3(c) under the Investment Company Act of 1940) are effective based on their evaluation of these controls and procedures as of a date within 90 days of the filing date of this report.
(b) There were no changes in the registrant's internal control over financial reporting (as defined in Rule 30a-3(d) under the Investment Company Act of 1940) that occurred during the period covered by this report that have materially affected, or are reasonably likely to materially affect, the registrant's internal control over financial reporting.
ITEM 17. DISCLOSURE OF SECURITIES LENDING ACTIVITIES FOR CLOSED-END MANAGEMENT INVESTMENT COMPANIES.
Not applicable.
ITEM 18. RECOVERY OF ERRONEOUSLY AWARDED COMPENSATION.
(a) Not applicable.
(b) Not applicable.
ITEM 19. EXHIBITS.
(a)(1) Registrant’s Code of Ethics for Senior Financial Officers, which is the subject of the disclosure required by Item 2 of Form N-CSR, was filed as Exhibit 12(a)(1) to American Century Asset Allocation Portfolios, Inc.’s Certified Shareholder Report on Form N-CSR, File No. 811-21591, on September 29, 2005.
(a)(2) Not applicable.
(a)(4) Not applicable.
(a)(5) Not applicable.
SIGNATURES
Pursuant to the requirements of the Securities Exchange Act of 1934 and the Investment Company Act of 1940, the registrant has duly caused this report to be signed on its behalf by the undersigned, thereunto duly authorized.
| | | | | | | | | | | | | | |
| Registrant: | American Century California Tax-Free and Municipal Funds |
| | | |
| | | |
| By: | /s/ Patrick Bannigan | |
| Name: | Patrick Bannigan | |
| Title: | President | |
| | | |
| Date: | October 28, 2024 | |
| | |
Pursuant to the requirements of the Securities Exchange Act of 1934 and the Investment Company Act of 1940, this report has been signed below by the following persons on behalf of the registrant and in the capacities and on the dates indicated.
| | | | | | | | |
| By: | /s/ Patrick Bannigan |
| Name: | Patrick Bannigan |
| Title: | President |
| | (principal executive officer) |
| | |
| Date: | October 28, 2024 |
| | | | | | | | |
| By: | /s/ R. Wes Campbell |
| Name: | R. Wes Campbell |
| Title: | Treasurer and |
| | Chief Financial Officer |
| | (principal financial officer) |
| | |
| Date: | October 28, 2024 |