| UNITED STATES | ||
| SECURITIES AND EXCHANGE COMMISSION | ||
| Washington, D.C. 20549 | ||
| FORM N-CSR | ||
| CERTIFIED SHAREHOLDER REPORT OF REGISTERED | ||
| MANAGEMENT INVESTMENT COMPANIES | ||
| Investment Company Act file number | 811-03706 | |
| AMERICAN CENTURY CALIFORNIA TAX-FREE AND MUNICIPAL FUNDS | ||
| (Exact name of registrant as specified in charter) | ||
| 4500 MAIN STREET, KANSAS CITY, MISSOURI | 64111 | |
| (Address of principal executive offices) | (Zip Code) | |
| CHARLES A. ETHERINGTON | ||
| 4500 MAIN STREET, KANSAS CITY, MISSOURI 64111 | ||
| (Name and address of agent for service) | ||
| Registrant’s telephone number, including area code: | 816-531-5575 | |
| Date of fiscal year end: | 08-31 | |
| Date of reporting period: | 08-31-09 | |
| ITEM 1. REPORTS TO STOCKHOLDERS. |
|
| Annual Report |
| August 31, 2009 |
![]()
| American Century Investments |
California Long-Term Tax-Free Fund
California High-Yield Municipal Fund
| President’s Letter |
Dear Investor:
Thank you for investing with us during the 12 months ended August 31, 2009. We appreciate your trust in American Century Investments® during this remarkable period.
During the first half of the fiscal year, historic levels of stress, instability, and intervention governed global financial results as the subprime-initiated credit and financial crises and resulting global recession froze the capital markets, triggering a flight to safety.
The second half had a much different tone. Optimism and risk appetites returned as U.S. economic growth projections for coming quarters turned positive. As we passed the second anniversary of the subprime mortgage meltdown and the first anniversary of Lehman Brothers’ landmark collapse, the worst of the economic and financial market obstacles appeared to be behind us.
We believe, however, that careful security selection and risk management remain important. We’re not out of the economic woods yet, not with rising mortgage and corporate default rates, mounting job losses, relatively tight credit conditions, and more debt reduction than spending by consumers and businesses.
Effective risk management requires a commitment to disciplined investment approaches that balance risk and reward, with the goal of setting and maintaining risk levels that are appropriate for portfolio objectives. At American Century Investments, we’ve stayed true to the principles that have guided us for over 50 years, including our commitment to delivering superior investment performance and helping investors reach their financial goals. Managing risk is part of that commitment—we offer portfolios that can help diversify and stabilize investment returns.
The U.S. economy and financial markets have come a long way in the past 12 months, but the coming year will likely present additional challenges. Given that outlook, I’m pleased to share with you my strong belief that we have the proper investment teams and processes in place to provide competitive and compelling long-term results for you. Thank you for your continued confidence in us.
Sincerely,

Jonathan S. Thomas
President and Chief Executive Officer
American Century Investments
| Table of Contents |
| Market Perspective | 2 |
| U.S. Fixed-Income Total Returns | 2 |
| California Long-Term Tax-Free | |
| Performance | 3 |
| Portfolio Commentary | 5 |
| Portfolio at a Glance, Yields, Portfolio Composition | |
| by Credit Rating, and Top Five Sectors | 7 |
| California High-Yield Municipal | |
| Performance | 8 |
| Portfolio Commentary | 10 |
| Portfolio at a Glance, Yields, Portfolio Composition | |
| by Credit Rating, and Top Five Sectors | 12 |
| Shareholder Fee Examples | 13 |
| Financial Statements | |
| Schedule of Investments | 15 |
| Statement of Assets and Liabilities | 31 |
| Statement of Operations | 33 |
| Statement of Changes in Net Assets | 34 |
| Notes to Financial Statements | 35 |
| Financial Highlights | 43 |
| Report of Independent Registered Public Accounting Firm | 51 |
| Other Information | |
| Management | 52 |
| Approval of Management Agreements | 55 |
| Additional Information | 60 |
| Index Definitions | 61 |
The opinions expressed in the Market Perspective and each of the Portfolio Commentaries reflect those of the portfolio management team as of the date of the report, and do not necessarily represent the opinions of American Century Investments or any other person in the American Century Investments organization. Any such opinions are subject to change at any time based upon market or other conditions and American Century Investments disclaims any responsibility to update such opinions. These opinions may not be relied upon as investment advice and, because investment decisions made by American Century Investments funds are based on numerous factors, may not be relied upon as an indication of trading intent on behalf of any American Century Investments fund. Security examples are used for representational purposes only and are not intended as recommendations to purchase or sell securities. Performance information for com parative indices and securities is provided to American Century Investments by third party vendors. To the best of American Century Investments’ knowledge, such information is accurate at the time of printing.
| Market Perspective |

By David MacEwen, Chief Investment Officer, Fixed Income
Municipals Tumbled then Rallied
In the first half of the 12-month period ended August 31, 2009, widespread credit and liquidity problems, along with unprecedented failures and takeovers of several major financial institutions, plagued the financial markets. Despite massive U.S. government intervention in the financial system and a record-low federal funds target rate of nearly 0%, credit remained scarce and economic activity dropped sharply.
Investors shunned all but the highest-quality securities. Demand for U.S. Treasuries skyrocketed, pushing Treasury prices higher and yields to record lows in December. Meanwhile, selling of municipal bonds by hedge funds, combined with the collapse of several national bond insurers and mounting budget crises in many states, contributed to historic volatility and under-performance for municipals.
This unrest pushed municipal bond yields to record levels relative to Treasuries, which helped spark a municipal rally in 2009. High-quality municipals finished the 12-month period with solid gains, while high-yield securities were unable to fully recover from the sell-off among riskier assets. Although high-yield municipals performed well during the rally, they did not generate sufficient gains to offset their earlier losses.
California Municipals Lagged on State’s Fiscal Woes
California municipal bonds generally lagged their national counterparts during the reporting period. Sinking tax revenues and the state’s budget nightmare stifled investor demand. Furthermore, the state’s credit rating was downgraded to various degrees by all three major ratings agencies. Late in the period, the government closed its $26.3 billion fiscal 2010 budget shortfall with massive spending cuts, borrowing, and the issuance of IOUs.
Despite this challenging climate, we believe California will not default on its general obligation (GO) debt. California’s Constitution mandates payment, and the state has only moderate debt levels compared with its general fund revenues.
Overall, our outlook remains positive. The California municipal market is diverse and still offers attractive opportunities among high-quality local-government GO, essential-service revenue, health care, higher education and airport bonds. More so than the state, local governments built up reserves during the “good years” to provide a cushion during these lean times.
| U.S. Fixed-Income Total Returns | |||||
| For the 12 months ended August 31, 2009 | |||||
| Barclays Capital Municipal Market Indices | Barclays Capital Taxable Market Indices | ||||
| Municipal Bond | 5.67% | U.S. Aggregate Index | 7.94% | ||
| California Tax-Exempt Bond | 4.16% | U.S. Treasury Index | 6.09% | ||
| 3-Year Municipal Bond | 5.57% | ||||
| 5-Year General Obligation (GO) Bond | 6.94% | ||||
| Long-Term Municipal Bond | 3.34% | ||||
| Non-Investment-Grade Municipal Bond | -9.19% | ||||
2
| Performance |
| California Long-Term Tax-Free | |||||
| Total Returns as of August 31, 2009 | |||||
| Average Annual Returns | |||||
| Since | Inception | ||||
| 1 year | 5 years | 10 years | Inception | Date | |
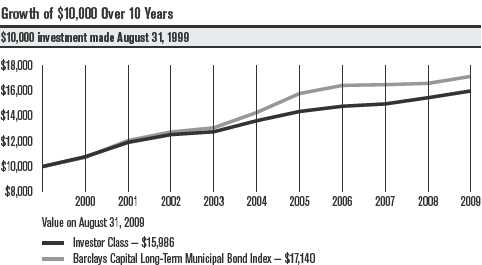
| Investor Class | 3.47% | 3.24% | 4.80% | 6.65% | 11/9/83 |
| Barclays Capital Long-Term | |||||
| Municipal Bond Index(1) | 3.34% | 3.72% | 5.54% | 8.09%(2) | — |
| Lipper California Municipal | |||||
| Debt Funds Average Returns(3) | 0.78% | 2.43% | 4.03% | 6.70%(4) | — |
| Investor Class’s Lipper Ranking(3) | |||||
| as of 8/31/09 | 17 of 123 | 20 of 100 | 10 of 78 | 2 of 2 | — |
| as of 9/30/09 | 46 of 123 | 29 of 100 | 13 of 78 | 2 of 2 | — |
| A Class | 9/28/07 | ||||
| No sales charge* | 3.22% | — | — | 2.49% | |
| With sales charge* | -1.42% | — | — | 0.08% | |
| B Class | 9/28/07 | ||||
| No sales charge* | 2.44% | — | — | 1.72% | |
| With sales charge* | -1.56% | — | — | -0.35% | |
| C Class | 2.45% | — | — | 1.72% | 9/28/07 |
*Sales charges include initial sales charges and contingent deferred sales charges (CDSCs), as applicable. A Class shares have a 4.50% maximum initial sales charge for fixed-income funds and may be subject to a maximum CDSC of 1.00%. B Class shares redeemed within six years of purchase are subject to a CDSC that declines from 5.00% during the first year after purchase to 0.00% the sixth year after purchase. C Class shares redeemed within 12 months of purchase are subject to a maximum CDSC of 1.00%. The SEC requires that mutual funds provide performance information net of maximum sales charges in all cases where charges could be applied.
| (1) | Formerly Lehman Brothers Long-Term Municipal Bond Index. |
| (2) | Since 10/31/83, the date nearest the Investor Class’s inception for which data are available. |
| (3) | Data provided by Lipper Inc. — A Reuters Company. © 2009 Reuters. All rights reserved. Any copying, republication or redistribution of Lipper |
| content, including by caching, framing or similar means, is expressly prohibited without the prior written consent of Lipper. Lipper shall not be | |
| liable for any errors or delays in the content, or for any actions taken in reliance thereon. | |
| Lipper Fund Performance — Performance data is total return, and is preliminary and subject to revision. | |
| Lipper Rankings — Rankings are based only on the universe shown and are based on average annual total returns. This listing might not | |
| represent the complete universe of funds tracked by Lipper. | |
| The data contained herein has been obtained from company reports, financial reporting services, periodicals and other resources believed to be | |
| reliable. Although carefully verified, data on compilations is not guaranteed by Lipper and may be incomplete. No offer or solicitations to buy or | |
| sell any of the securities herein is being made by Lipper. | |
| (4) | Since 11/10/83, the date nearest the Investor Class’s inception for which data are available. |
Data presented reflect past performance. Past performance is no guarantee of future results. Current performance may be higher or lower than the performance shown. Investment return and principal value will fluctuate, and redemption value may be more or less than original cost. To obtain performance data current to the most recent month end, please call 1-800-345-2021 or visit americancentury.com. As interest rates rise, bond values will decline. Investment income may be subject to certain state and local taxes and, depending on your tax status, the federal alternative minimum tax (AMT). Capital gains are not exempt from state and federal income tax.
Unless otherwise indicated, performance reflects Investor Class shares; performance for other share classes will vary due to differences in fee structure. For information about other share classes available, please consult the prospectus. Data assumes reinvestment of dividends and capital gains, and none of the charts reflect the deduction of taxes that a shareholder would pay on fund distributions or the redemption of fund shares. Returns for the index are provided for comparison. The fund’s total returns include operating expenses (such as transaction costs and management fees) that reduce returns, while the total returns of the index do not.
3
California Long-Term Tax-Free
| One-Year Returns Over 10 Years | ||||||||||
| Periods ended August 31 | ||||||||||
| 2000 | 2001 | 2002 | 2003 | 2004 | 2005 | 2006 | 2007 | 2008 | 2009 | |
| Investor Class | 7.79% | 10.55% | 5.14% | 1.81% | 6.83% | 5.38% | 2.89% | 1.24% | 3.29% | 3.47% |
| Barclays Capital | ||||||||||
| Long-Term Municipal | ||||||||||
| Bond Index | 7.34% | 12.35% | 5.62% | 2.62% | 9.24% | 10.52% | 4.08% | 0.36% | 0.62% | 3.34% |
| Total Annual Fund Operating Expenses | ||||
| Investor Class | A Class | B Class | C Class | |
| 0.49% | 0.74% | 1.49% | 1.49% | |
The total annual fund operating expenses shown is as stated in the fund’s prospectus current as of the date of this report. The prospectus may vary from the expense ratio shown elsewhere in this report because it is based on a different time period, includes acquired fund fees and expenses, and, if applicable, does not include fee waivers or expense reimbursements.
Data presented reflect past performance. Past performance is no guarantee of future results. Current performance may be higher or lower than the performance shown. Investment return and principal value will fluctuate, and redemption value may be more or less than original cost. To obtain performance data current to the most recent month end, please call 1-800-345-2021 or visit americancentury.com. As interest rates rise, bond values will decline. Investment income may be subject to certain state and local taxes and, depending on your tax status, the federal alternative minimum tax (AMT). Capital gains are not exempt from state and federal income tax.
Unless otherwise indicated, performance reflects Investor Class shares; performance for other share classes will vary due to differences in fee structure. For information about other share classes available, please consult the prospectus. Data assumes reinvestment of dividends and capital gains, and none of the charts reflect the deduction of taxes that a shareholder would pay on fund distributions or the redemption of fund shares. Returns for the index are provided for comparison. The fund’s total returns include operating expenses (such as transaction costs and management fees) that reduce returns, while the total returns of the index do not.
4
| Portfolio Commentary |
California Long-Term Tax-Free
Portfolio Managers: David MacEwen, Joseph Gotelli, and Steven Permut
Performance Summary
California Long-Term Tax-Free rose 3.47%* for the 12 months ended August 31, 2009. By comparison, the Barclays Capital Long-Term Municipal Bond Index gained 3.34%. For the same period, the California Municipal Debt Funds tracked by Lipper had an average return of 0.78%. The portfolio’s average annual returns also exceeded those of its Lipper group average for the five- and 10-year periods ended in August. See page 3 for additional performance comparisons.
The fiscal year covered a remarkable period that included the worst of the economic downturn, a steep decline and subsequent rebound in financial markets, and California’s ongoing budget crisis (see the Market Perspective on page 2). In that environment, the fund enjoyed a positive absolute return and outperformed its Lipper peer group average. The portfolio also finished ahead of the Barclays Index despite the fact that California debt trailed the national average.
We believe the portfolio’s outperformance of its peer group amid the market volatility and for the five- and 10-year periods ended in August highlight the advantages of our consistent, measured approach—we use careful credit analysis to build positions with what we believe to be attractive risk/ reward characteristics. A number of trades helped performance in the fiscal year, led by the portfolio’s exposure to general obligation (GO) bonds.
GO Allocation Contributed
A key contribution to the portfolio’s return relative to the Lipper group average came from our exposure to California GOs. We believe we were underweight these securities relative to our peers early in the fiscal year, when they underperformed for technical (supply and demand) reasons in the wake of the credit crisis. We began to add GOs in 2009 when their yield and total return potential reached what we considered very attractive levels compared with the actual risks inherent in these bonds. As a result, we believe we held an overweight position later in the fiscal year when GOs outperformed.
Credit Exposure Helped
Over the course of the fiscal year we added a number of select, lower-rated bonds that we felt offered compelling risk/reward trade-offs. This positioning aided performance—it helped to favor higher-quality securities early in the fiscal year, while it was beneficial to hold slightly more lower-rated bonds in recent months. This trade, and the addition of A-rated GO bonds, helps explain the modest increase in bonds rated A and BBB in the portfolio since our last report to shareholders.
*All fund returns referenced in this commentary are for Investor Class shares.
5
California Long-Term Tax-Free
Other Contributors
The portfolio also enjoyed a positive contribution to return from a trade using long-term municipal bonds and 30-year Treasury futures designed to capitalize on the changing yield relationship between municipals and Treasuries. We implemented the trade when long-term municipal yields exceeded those on like-maturity Treasuries, a condition caused by the extreme market conditions of late 2008. The trade was based on the expectation that the yield difference between the two would move toward their normal historical relationship—with municipals yielding less than Treasuries—which they did.
Holding more long-term municipal bonds also meant the portfolio had a slightly long duration (greater price sensitivity to interest rate changes). That helped performance as investors began to move out the maturity spectrum in search of additional yield later in the reporting period.
Outlook
“We remain very positive on the municipal market,” said Steven Permut, leader of the municipal bond team at American Century Investments. “Municipal bond prices are being supported by record demand and a relative lack of supply—two factors we don’t see changing in the near term. Having said that, economic fundamentals remain poor, and we think tax-based bonds and those issued by local governments are likely to face challenges. In addition, California’s complicated budget situation brings additional “headline risk” and the possibility of further credit rating downgrades. These factors could result in significant price volatility for the state’s bonds. We think these conditions put a premium on careful credit analysis and individual security selection—what we believe are two strengths of our management approach.”
6
| California Long-Term Tax-Free | ||
| Portfolio at a Glance | ||
| As of 8/31/09 | As of 8/31/08 | |
| Weighted Average Maturity | 17.4 years | 16.8 years |
| Average Duration (Modified) | 7.7 years | 8.0 years |
| Yields as of August 31, 2009 | ||
| 30-Day SEC Yield | ||
| Investor Class | 4.23% | |
| A Class | 3.80% | |
| B Class | 3.25% | |
| C Class | 3.25% | |
| Investor Class 30-Day Tax-Equivalent Yields(1) | ||
| 31.98% Tax Bracket | 6.22% | |
| 34.70% Tax Bracket | 6.48% | |
| 39.23% Tax Bracket | 6.96% | |
| 41.05% Tax Bracket | 7.18% | |
| (1) The tax brackets indicated are for combined state and federal income tax. Actual tax-equivalent yields may be lower, if alternative minimum tax | ||
| is applicable. | ||
| Portfolio Composition by Credit Rating | ||
| % of | % of | |
| fund investments | fund investments | |
| as of 8/31/09 | as of 2/28/09 | |
| AAA | 28% | 22% |
| AA | 27% | 37% |
| A | 36% | 35% |
| BBB | 9% | 6% |
| Ratings provided by independent research companies. These ratings are listed in Standard & Poor’s format even if they were provided by other | ||
| sources. The letter ratings indicate the credit worthiness of the underlying bonds in the portfolio and generally range from AAA (highest) to D (lowest). | ||
| Top Five Sectors as of August 31, 2009 | ||
| % of | ||
| fund investments | ||
| General Obligation (GO) | 21% | |
| Certificate of Participation (COPs)/Leases | 14% | |
| Hospital Revenue | 12% | |
| Water/Sewer/Gas Revenue | 11% | |
| Prerefunded | 10% | |
7
| Performance |
| California High-Yield Municipal | |||||
| Total Returns as of August 31, 2009 | |||||
| Average Annual Returns | |||||
| Since | Inception | ||||
| 1 year | 5 years | 10 years | Inception | Date | |
| Investor Class | -1.16% | 2.80% | 4.77% | 5.66% | 12/30/86 |
| Barclays Capital Long-Term | |||||
| Municipal Bond Index(1) | 3.34% | 3.72% | 5.54% | 6.85%(2) | — |
| Lipper California Municipal | |||||
| Debt Funds Average Returns(3) | 0.78% | 2.43% | 4.03% | 5.58%(2) | — |
| Investor Class’s Lipper Ranking(3) | |||||
| as of 8/31/09 | 102 of 123 | 39 of 100 | 13 of 78 | 12 of 24 | — |
| as of 9/30/09 | 103 of 123 | 22 of 100 | 2 of 78 | 10 of 24 | — |
| A Class | 1/31/03 | ||||
| No sales charge* | -1.41% | 2.54% | — | 3.38% | |
| With sales charge* | -5.87% | 1.60% | — | 2.66% | |
| B Class | 1/31/03 | ||||
| No sales charge* | -2.14% | 1.77% | — | 2.61% | |
| With sales charge* | -6.14% | 1.59% | — | 2.61% | |
| C Class | -2.14% | 1.77% | — | 2.65% | 1/31/03 |
| *Sales charges include initial sales charges and contingent deferred sales charges (CDSCs), as applicable. A Class shares have a 4.50% |
| maximum initial sales charge for fixed-income funds and may be subject to a maximum CDSC of 1.00%. B Class shares redeemed |
| within six years of purchase are subject to a CDSC that declines from 5.00% during the first year after purchase to 0.00% the sixth |
| year after purchase. C Class shares redeemed within 12 months of purchase are subject to a maximum CDSC of 1.00%. The SEC |
| requires that mutual funds provide performance information net of maximum sales charges in all cases where charges could be applied. |
| (1) | Formerly Lehman Brothers Long-Term Municipal Bond Index. |
| (2) | Since 12/31/86, the date nearest the Investor Class’s inception for which data are available. |
| (3) | Data provided by Lipper Inc. — A Reuters Company. © 2009 Reuters. All rights reserved. Any copying, republication or redistribution of Lipper |
| content, including by caching, framing or similar means, is expressly prohibited without the prior written consent of Lipper. Lipper shall not be | |
| liable for any errors or delays in the content, or for any actions taken in reliance thereon. | |
| Lipper Fund Performance — Performance data is total return, and is preliminary and subject to revision. | |
| Lipper Rankings — Rankings are based only on the universe shown and are based on average annual total returns. This listing might not | |
| represent the complete universe of funds tracked by Lipper. | |
| The data contained herein has been obtained from company reports, financial reporting services, periodicals and other resources believed to be | |
| reliable. Although carefully verified, data on compilations is not guaranteed by Lipper and may be incomplete. No offer or solicitations to buy or | |
| sell any of the securities herein is being made by Lipper. |
Data presented reflect past performance. Past performance is no guarantee of future results. Current performance may be higher or lower than the performance shown. Investment return and principal value will fluctuate, and redemption value may be more or less than original cost. To obtain performance data current to the most recent month end, please call 1-800-345-2021 or visit americancentury.com. As interest rates rise, bond values will decline. In addition, the lower-rated securities in which the fund invests are subject to greater credit risk, default risk and liquidity risk. Investment income may be subject to certain state and local taxes and, depending on your tax status, the federal alternative minimum tax (AMT). Capital gains are not exempt from state and federal income tax.
Unless otherwise indicated, performance reflects Investor Class shares; performance for other share classes will vary due to differences in fee structure. For information about other share classes available, please consult the prospectus. Data assumes reinvestment of dividends and capital gains, and none of the charts reflect the deduction of taxes that a shareholder would pay on fund distributions or the redemption of fund shares. Returns for the index are provided for comparison. The fund’s total returns include operating expenses (such as transaction costs and management fees) that reduce returns, while the total returns of the index do not.
8
California High-Yield Municipal
| One-Year Returns Over 10 Years | ||||||||||
| Periods ended August 31 | ||||||||||
| 2000 | 2001 | 2002 | 2003 | 2004 | 2005 | 2006 | 2007 | 2008 | 2009 | |
| Investor Class | 6.70% | 9.50% | 6.07% | 3.35% | 8.48% | 9.65% | 3.80% | 1.22% | 0.81% | -1.16% |
| Barclays Capital | ||||||||||
| Long-Term Municipal | ||||||||||
| Bond Index | 7.34% | 12.35% | 5.62% | 2.62% | 9.24% | 10.52% | 4.08% | 0.36% | 0.62% | 3.34% |
| Total Annual Fund Operating Expenses | ||||
| Investor Class | A Class | B Class | C Class | |
| 0.52% | 0.77% | 1.52% | 1.52% | |
The total annual fund operating expenses shown is as stated in the fund’s prospectus current as of the date of this report. The prospectus may vary from the expense ratio shown elsewhere in this report because it is based on a different time period, includes acquired fund fees and expenses, and, if applicable, does not include fee waivers or expense reimbursements.
Data presented reflect past performance. Past performance is no guarantee of future results. Current performance may be higher or lower than the performance shown. Investment return and principal value will fluctuate, and redemption value may be more or less than original cost. To obtain performance data current to the most recent month end, please call 1-800-345-2021 or visit americancentury.com. As interest rates rise, bond values will decline. In addition, the lower-rated securities in which the fund invests are subject to greater credit risk, default risk and liquidity risk. Investment income may be subject to certain state and local taxes and, depending on your tax status, the federal alternative minimum tax (AMT). Capital gains are not exempt from state and federal income tax.
Unless otherwise indicated, performance reflects Investor Class shares; performance for other share classes will vary due to differences in fee structure. For information about other share classes available, please consult the prospectus. Data assumes reinvestment of dividends and capital gains, and none of the charts reflect the deduction of taxes that a shareholder would pay on fund distributions or the redemption of fund shares. Returns for the index are provided for comparison. The fund’s total returns include operating expenses (such as transaction costs and management fees) that reduce returns, while the total returns of the index do not.
9
| Portfolio Commentary |
California High-Yield Municipal
Portfolio Manager: Steven Permut
Performance Summary
California High-Yield Municipal declined 1.16%* for the 12 months ended August 31, 2009. By comparison, the Barclays Capital Long-Term Municipal Bond Index rose 3.34%. At the same time, the California Municipal Debt Funds tracked by Lipper had an average gain of 0.78%. However, the portfolio’s average annual returns continued to exceed those of its Lipper group average for the five- and 10-year periods ended in August. See page 8 for additional performance comparisons.
The fiscal year covered a remarkable period that included the worst of the economic downturn, a steep decline and subsequent rebound in financial markets, and California’s ongoing budget crisis (see the Market Perspective on page 2). In that challenging environment for lower-rated, credit-sensitive bonds, the fund produced negative absolute results and trailed the Barclays Index and its Lipper peer group average.
The portfolio’s credit and sector allocations explain its relative underperfor mance. Nevertheless, a number of decisions made positive contributions to return in the fiscal year, including additions to our stake in general obligation (GO) bonds, and a trade intended to capitalize on the changing yield relationship between municipal and Treasury bonds.
Credit, Sector Exposure Were Key
Below-investment-grade municipals (such as those in which the portfolio invests) trailed investment-grade bonds by a wide margin for the 12 months, as the Barclays Capital Non-Investment-Grade (High-Yield) Municipal Bond Index fell 9.19%. This explains the portfolio’s underperfor-mance of the high-quality Barclays Long-Term Municipal Bond Index and Lipper group average, which primarily reflects the return of investment-grade portfolios. High-yield municipals performed particularly poorly in late 2008—the height of the financial crisis—but have come roaring back in 2009, though still posting negative absolute results for the full 12 months.
Our sector allocation within the non-investment-grade slice further detracted from performance. We had little or no exposure to the tobacco, airline, and other corporate-backed municipal bonds that have snapped back dramatically so far in 2009. Instead, we held a significant allocation to land-secured bonds, which tend to be less liquid (less frequently bought and sold) than other bonds, so their prices typically adjust more slowly to market movements. As a result, these securities lagged in the market recovery.
*All fund returns referenced in this commentary are for Investor Class shares.
10
California High-Yield Municipal
Positive Contributors
At the other end of the spectrum, the portfolio enjoyed a positive contribution to return from a trade using long-term municipal bonds and 30-year Treasury futures designed to capitalize on the changing yield relationship between municipals and Treasuries. We implemented the trade when long-term municipal yields exceeded those on like-maturity Treasuries, a condition caused by the extreme market conditions of late 2008. The trade was based on the expectation that the yield difference between the two would move toward their normal historical relationship—with municipals yielding less than Treasuries—which they did.
It also helped to increase the portfolio’s overall credit quality, as we continued to trim what we saw as our weakest names in favor of California GOs and investment-grade health care credits. We began to add GOs in the first quarter of 2009, when their yield and total return potential reached what we considered very attractive levels compared with the actual risks inherent in these bonds. These trades contributed to performance, because GOs and some of the BBB-rated health care securities we purchased did well in recent months.
Outlook
“We remain very positive on the municipal market,” said Steven Permut, leader of the municipal bond team at American Century Investments. “Municipal bond prices are being supported by record demand and a relative lack of supply—two factors we don’t see changing in the near term. Having said that, economic fundamentals remain poor, and we think tax-based bonds and those issued by local governments are likely to face challenges. In addition, California’s complicated budget situation brings additional “headline risk” and the possibility of further credit rating downgrades. These factors could result in significant price volatility for the state’s bonds. We think these conditions put a premium on careful credit analysis and individual security selection—what we believe are two strengths of our management approach.”
11
| California High-Yield Municipal | ||
| Portfolio at a Glance | ||
| As of 8/31/09 | As of 8/31/08 | |
| Weighted Average Maturity | 19.4 years | 17.2 years |
| Average Duration (Modified) | 7.8 years | 7.0 years |
| Yields as of August 31, 2009 | ||
| 30-Day SEC Yield | ||
| Investor Class | 5.21% | |
| A Class | 4.74% | |
| B Class | 4.23% | |
| C Class | 4.23% | |
| Investor Class 30-Day Tax-Equivalent Yields(1) | ||
| 31.98% Tax Bracket | 7.66% | |
| 34.70% Tax Bracket | 7.98% | |
| 39.23% Tax Bracket | 8.57% | |
| 41.05% Tax Bracket | 8.84% | |
| (1) The tax brackets indicated are for combined state and federal income tax. Actual tax-equivalent yields may be lower, if alternative minimum tax | ||
| is applicable. | ||
| Portfolio Composition by Credit Rating | ||
| % of | % of | |
| fund investments | fund investments | |
| as of 8/31/09 | as of 2/28/09 | |
| AAA | 19% | 25% |
| AA | 16% | 24% |
| A | 23% | 11% |
| BBB | 9% | 7% |
| Unrated | 33% | 33% |
| Ratings provided by independent research companies. These ratings are listed in Standard & Poor’s format even if they were provided by other | ||
| sources. The letter ratings indicate the credit worthiness of the underlying bonds in the portfolio and generally range from AAA (highest) to D (lowest). | ||
| Top Five Sectors as of August 31, 2009 | ||
| % of | ||
| fund investments | ||
| Land Secured | 25% | |
| General Obligation (GO) | 12% | |
| Electric Revenue | 9% | |
| Hospital Revenue | 9% | |
| Prerefunded | 8% | |
12
| Shareholder Fee Examples (Unaudited) |
Fund shareholders may incur two types of costs: (1) transaction costs, including sales charges (loads) on purchase payments and redemption/ exchange fees; and (2) ongoing costs, including management fees; distribution and service (12b-1) fees; and other fund expenses. This example is intended to help you understand your ongoing costs (in dollars) of investing in your fund and to compare these costs with the ongoing cost of investing in other mutual funds.
The example is based on an investment of $1,000 made at the beginning of the period and held for the entire period from March 1, 2009 to August 31, 2009.
Actual Expenses
The table provides information about actual account values and actual expenses for each class. You may use the information, together with the amount you invested, to estimate the expenses that you paid over the period. First, identify the share class you own. Then simply divide your account value by $1,000 (for example, an $8,600 account value divided by $1,000 = 8.6), then multiply the result by the number under the heading “Expenses Paid During Period” to estimate the expenses you paid on your account during this period.
If you hold Investor Class shares of any American Century Investments fund, or Institutional Class shares of the American Century Diversified Bond Fund, in an American Century Investments account (i.e., not a financial intermediary or retirement plan account), American Century Investments may charge you a $12.50 semiannual account maintenance fee if the value of those shares is less than $10,000. We will redeem shares automatically in one of your accounts to pay the $12.50 fee. In determining your total eligible investment amount, we will include your investments in all personal accounts (including American Century Investments Brokerage accounts) registered under your Social Security number. Personal accounts include individual accounts, joint accounts, UGMA/UTMA accounts, personal trusts, Coverdell Education Savings Accounts and IRAs (including traditional, Roth, Rollover, SEP-, SARSEP- and SIMPLE-IRAs), and certain other retirement accounts. If you have only business, business retirement, employer-sponsored or American Century Investments Brokerage accounts, you are currently not subject to this fee. We will not charge the fee as long as you choose to manage your accounts exclusively online. If you are subject to the Account Maintenance Fee, your account value could be reduced by the fee amount.
Hypothetical Example for Comparison Purposes
The table also provides information about hypothetical account values and hypothetical expenses based on the actual expense ratio of each class of your fund and an assumed rate of return of 5% per year before expenses, which is not the actual return of a fund’s share class. The hypothetical account values and expenses may not be used to estimate the actual ending account balance or expenses you paid for the period. You may use this information to compare the ongoing costs of investing in your fund and other funds. To do so, compare this 5% hypothetical example with the 5% hypothetical examples that appear in the shareholder reports of the other funds.
13
Please note that the expenses shown in the table are meant to highlight your ongoing costs only and do not reflect any transactional costs, such as sales charges (loads) or redemption/exchange fees. Therefore, the table is useful in comparing ongoing costs only, and will not help you determine the relative total costs of owning different funds. In addition, if these transactional costs were included, your costs would have been higher.
| Beginning | Ending | Expenses Paid | ||
| Account Value | Account Value | During Period* | Annualized | |
| 3/1/09 | 8/31/09 | 3/1/09 – 8/31/09 | Expense Ratio* | |
| California Long-Term Tax-Free | ||||
| Actual | ||||
| Investor Class | $1,000 | $1,057.30 | $2.54 | 0.49% |
| A Class | $1,000 | $1,056.10 | $3.84 | 0.74% |
| B Class | $1,000 | $1,052.10 | $7.71 | 1.49% |
| C Class | $1,000 | $1,052.10 | $7.71 | 1.49% |
| Hypothetical | ||||
| Investor Class | $1,000 | $1,022.74 | $2.50 | 0.49% |
| A Class | $1,000 | $1,021.48 | $3.77 | 0.74% |
| B Class | $1,000 | $1,017.69 | $7.58 | 1.49% |
| C Class | $1,000 | $1,017.69 | $7.58 | 1.49% |
| California High-Yield Municipal | ||||
| Actual | ||||
| Investor Class | $1,000 | $1,071.70 | $2.72 | 0.52% |
| A Class | $1,000 | $1,070.40 | $4.02 | 0.77% |
| B Class | $1,000 | $1,066.40 | $7.92 | 1.52% |
| C Class | $1,000 | $1,066.40 | $7.92 | 1.52% |
| Hypothetical | ||||
| Investor Class | $1,000 | $1,022.58 | $2.65 | 0.52% |
| A Class | $1,000 | $1,021.32 | $3.92 | 0.77% |
| B Class | $1,000 | $1,017.54 | $7.73 | 1.52% |
| C Class | $1,000 | $1,017.54 | $7.73 | 1.52% |
| *Expenses are equal to the class’s annualized expense ratio listed in the table above, multiplied by the average account value over the period, | ||||
| multiplied by 184, the number of days in the most recent fiscal half-year, divided by 365, to reflect the one-half year period. | ||||
14
| Schedule of Investments |
California Long-Term Tax-Free
| AUGUST 31, 2009 | ||||||
| Principal | Principal | |||||
| Amount | Value | Amount | Value | |||
| Municipal Securities — 97.7% | California County | |||||
| Tobacco Securitization | ||||||
| CALIFORNIA — 95.6% | Agency Rev., (Gold Country | |||||
| ABAG Finance Auth. for | Settlement Funding Corp.), | |||||
| Nonprofit Corps. Rev., | 5.25%, 6/1/46(1) | $ 5,000,000 | $ 3,525,600 | |||
| (899 Charleston LLC), | California Department of | |||||
| VRDN, 0.20%, 9/1/09 | Water Resources Power | |||||
| (LOC: LaSalle Bank N.A.) | $ 600,000 | $ 600,000 | Supply Rev., Series 2002 A, | |||
| ABAG Finance Auth. for | 5.50%, 5/1/14 (Ambac)(1) | 3,480,000 | 3,817,142 | |||
| Nonprofit Corps. Rev., | California Department of | |||||
| (Oshman Family Jewish | Water Resources Power | |||||
| Community), VRDN, 0.12%, | Supply Rev., Series 2005 G4, | |||||
| 9/1/09 (LOC: LaSalle | 5.00%, 5/1/16(1) | 2,050,000 | 2,266,890 | |||
| Bank N.A.) | 1,500,000 | 1,500,000 | California Educational | |||
| ABAG Finance Auth. for | Facilities Auth. Rev., | |||||
| Nonprofit Corps. Rev., | (University of Pacific), | |||||
| (Sharp Healthcare), | 5.25%, 5/1/34(1) | 2,000,000 | 1,896,620 | |||
| 6.25%, 8/1/39(1) | 2,200,000 | 2,233,946 | ||||
| California Educational | ||||||
| Anaheim Public Financing | Facilities Auth. Rev., | |||||
| Auth. Rev., (Electric | (University of Santa Clara), | |||||
| System Distribution), | 5.625%, 4/1/37 | 5,000,000 | 5,265,600 | |||
| 5.25%, 10/1/39(1) | 4,000,000 | 4,099,720 | ||||
| California Educational | ||||||
| Antioch Public Financing | Facilities Auth. Rev., | |||||
| Auth. Lease Rev., | (University of Southern | |||||
| Series 2002 A, | California), 5.50%, | |||||
| (Municipal Facilities), | 10/1/09, Prerefunded | |||||
| 5.50%, 1/1/32 (NATL)(1) | 5,235,000 | 5,263,269 | at 101% of Par(1)(2) | 7,570,000 | 7,677,418 | |
| Antioch Public Financing | California Educational | |||||
| Auth. Lease Rev., | Facilities Auth. Rev., | |||||
| Series 2002 B, | (Western University | |||||
| (Municipal Facilities), | Health Sciences), 6.00%, | |||||
| 5.625%, 1/1/27 (NATL)(1) | 6,005,000 | 6,118,374 | 10/1/12, Prerefunded | |||
| Avenal Public Financing | at 100% of Par(1)(2) | 1,920,000 | 2,195,290 | |||
| Auth. Rev., 5.00%, 9/1/25(1) | 1,395,000 | 1,196,589 | California Educational | |||
| Banning COP, (Wastewater | Facilities Auth. Rev., | |||||
| System Refunding & | Series 2004 C, | |||||
| Improvement), 8.00%, | (Lutheran University), | |||||
| 1/1/19 (Ambac)(1)(2) | 495,000 | 579,917 | 5.00%, 10/1/29(1) | 1,220,000 | 1,064,474 | |
| Bay Area Toll Auth. Toll | California Educational | |||||
| Bridge Rev., Series 2008 F1, | Facilities Auth. Rev., | |||||
| (San Francisco Bay Area), | Series 2007 A, (Claremont | |||||
| 5.00%, 4/1/39(1) | 2,135,000 | 2,163,161 | Graduate University), | |||
| Bay Area Toll Auth. Toll | 5.00%, 3/1/42(1) | 4,000,000 | 3,653,720 | |||
| Bridge Rev., Series 2009 F1, | California Educational | |||||
| (San Francisco Bay Area), | Facilities Auth. Rev., | |||||
| 5.25%, 4/1/27(1) | 3,750,000 | 4,024,200 | Series 2009 A, (University | |||
| Berryessa Union School | of Southern California), | |||||
| District GO, Series 2001 B, | 5.00%, 10/1/39(1) | 3,953,000 | 4,057,359 | |||
| (Election of 1999), 5.375%, | California GO, | |||||
| 8/1/11, Prerefunded at | 5.00%, 4/1/26(1) | 3,000,000 | 3,014,430 | |||
| 101% of Par (FSA)(1)(2) | 1,205,000 | 1,322,849 | California GO, | |||
| Big Bear Lake Water Rev., | 5.75%, 4/1/28(1) | 2,000,000 | 2,113,020 | |||
| 6.00%, 4/1/22 (NATL)(1) | 3,500,000 | 4,060,105 | California GO, | |||
| 5.00%, 6/1/32(1) | 6,600,000 | 6,415,992 | ||||
15
California Long-Term Tax-Free
| Principal | Principal | |||||
| Amount | Value | Amount | Value | |||
| California GO, | California Public Works | |||||
| 5.00%, 11/1/32(1) | $ 9,500,000 | $ 9,232,670 | Board Lease Rev., Series | |||
| California GO, | 1993 A, (Department of | |||||
| 6.50%, 4/1/33(1) | 5,000,000 | 5,545,200 | Corrections), 5.00%, | |||
| 12/1/19 (Ambac)(1) | $ 4,000,000 | $ 3,998,120 | ||||
| California GO, | ||||||
| 5.00%, 6/1/34(1) | 6,400,000 | 6,194,752 | ||||
| California Public Works | ||||||
| California GO, | Board Lease Rev., | |||||
| 5.00%, 4/1/38(1) | 7,000,000 | 6,662,670 | Series 2005 A, | |||
| (Department of General | ||||||
| California GO, | Services – Butterfield), | |||||
| 6.00%, 4/1/38(1) | 5,000,000 | 5,290,900 | 5.25%, 6/1/30(1) | 3,250,000 | 3,065,530 | |
| California Health Facilities | California Public Works | |||||
| Financing Auth. Rev., | Board Lease Rev., Series | |||||
| Series 1993 C, (St. Francis | 2006 E, (University of | |||||
| Memorial Hospital), | California Research), | |||||
| 5.875%, 11/1/23(1)(2) | 7,165,000 | 8,767,524 | 5.00%, 10/1/31(1) | 2,835,000 | 2,819,861 | |
| California Health Facilities | California State University | |||||
| Financing Auth. Rev., | Systemwide Rev., | |||||
| Series 2008 C, (Providence | Series 2007 A, 5.00%, | |||||
| Health & Services), | 11/1/24 (FSA)(1) | 5,000,000 | 5,260,600 | |||
| 6.50%, 10/1/33(1) | 1,000,000 | 1,095,390 | ||||
| California State University | ||||||
| California Health Facilities | Systemwide Rev., Series | |||||
| Financing Auth. Rev., Series | 2009 A, 5.25%, 11/1/34(1) | 2,200,000 | 2,226,444 | |||
| 2008 J, (Catholic Healthcare | ||||||
| West), 5.625%, 7/1/32(1) | 5,000,000 | 4,871,050 | California Statewide | |||
| Communities Development | ||||||
| California Health Facilities | Auth. Rev., Series 1998 A, | |||||
| Financing Auth. Rev., Series | (Sherman Oaks Project), | |||||
| 2009 A, (Catholic Healthcare | 5.00%, 8/1/22 | |||||
| West), 6.00%, 7/1/39(1) | 3,400,000 | 3,412,172 | (Ambac/California | |||
| California Health Facilities | Mortgage Insurance)(1) | 8,515,000 | 8,377,909 | |||
| Financing Auth. Rev., | California Statewide | |||||
| Series 2009 A, (Children’s | Communities Development | |||||
| Hospital of Orange County), | Auth. Rev., Series 2001 C, | |||||
| 6.50%, 11/1/38(1) | 5,000,000 | 5,107,550 | (Kaiser Permanente), VRDN, | |||
| California Health Facilities | 5.25%, 8/1/16(1) | 5,000,000 | 4,841,700 | |||
| Financing Auth. Rev., | California Statewide | |||||
| Series 2009 A, (Saint | Communities Development | |||||
| Joseph Health System), | Auth. Rev., Series 2005 A, | |||||
| 5.50%, 7/1/29(1) | 3,750,000 | 3,800,850 | (Thomas Jefferson School | |||
| California Health Facilities | of Law), 4.875%, 10/1/15, | |||||
| Financing Auth. Rev., | Prerefunded at 100% | |||||
| Series 2009 A, (Saint | of Par(1)(2) | 1,000,000 | 1,111,050 | |||
| Joseph Health System), | California Statewide | |||||
| 5.75%, 7/1/39(1) | 3,000,000 | 3,033,420 | Communities Development | |||
| California Health Facilities | Auth. Rev., Series 2006 B, | |||||
| Financing Auth. Rev., Series | (Kaiser Permanente), | |||||
| 2009 B, (Providence Health | 5.25%, 3/1/45(1) | 5,000,000 | 4,637,500 | |||
| Services), 5.50%, 10/1/39(1) | 1,000,000 | 1,000,710 | California Statewide | |||
| California Infrastructure | Communities Development | |||||
| & Economic Development | Auth. Rev., Series 2008 C, | |||||
| Bank Rev., (Performing | (Catholic Healthcare West), | |||||
| Arts Center of Los Angeles | 5.625%, 7/1/35(1) | 3,000,000 | 2,891,040 | |||
| County), 5.00%, 12/1/37(1) | 1,000,000 | 900,910 | Campbell Union High School | |||
| District GO, 5.00%, 8/1/30(1) | 2,400,000 | 2,466,048 |
16
California Long-Term Tax-Free
| Principal | Principal | |||||
| Amount | Value | Amount | Value | |||
| Capistrano Unified School | Hillsborough School District | |||||
| District Special Tax Rev., | GO, Series 2006 B, (Election | |||||
| (Community Facilities | of 2002), 4.88%, 9/1/31(1)(3) | $ 5,335,000 | $ 1,563,315 | |||
| District No. 88-1), 6.50%, | Huntington Beach Union | |||||
| 9/1/14 (FSA)(1) | $ 5,695,000 | $ 5,815,051 | High School District GO, | |||
| Carlsbad Unified School | (Election of 2004), | |||||
| District GO, Series 2007 A, | 4.98%, 8/1/30 | |||||
| (Election of 2006), 5.25%, | (FSA-CR) (NATL)(1)(3) | 6,880,000 | 1,824,301 | |||
| 8/1/32 (NATL)(1) | 1,125,000 | 1,173,015 | Huntington Beach Union | |||
| Castaic Lake Water Agency | High School District GO, | |||||
| COP, Series 1994 A, (Water | (Election of 2004), 5.00%, | |||||
| System Improvement), | 8/1/31 (NATL)(1)(3) | 5,000,000 | 1,207,350 | |||
| 7.00%, 8/1/12 (NATL)(1) | 1,520,000 | 1,734,290 | Irvine Ranch Water District | |||
| Coalinga Public Financing | Rev., VRDN, 0.12%, 9/1/09 | |||||
| Auth. Local Obligation Rev., | (LOC: Bank of America N.A.) | 1,100,000 | 1,100,000 | |||
| Series 1998 A, (Senior Lien), | Kern High School | |||||
| 6.375%, 9/15/21 (Ambac)(1) | 1,320,000 | 1,425,151 | District GO, 7.15%, | |||
| Concord Joint Powers | 8/1/14 (NATL)(1)(2) | 1,815,000 | 2,276,627 | |||
| Financing Auth. Lease | Kern High School District | |||||
| Rev., (Concord Avenue | GO, Series 1992 C, | |||||
| Parking Structure), | (Election of 1990), 6.25%, | |||||
| 5.125%, 3/1/23(1) | 2,615,000 | 2,685,867 | 8/1/13 (NATL)(1)(2) | 1,340,000 | 1,592,188 | |
| Concord Joint Powers | Kern High School District | |||||
| Financing Auth. Lease | GO, Series 1993 D, 7.00%, | |||||
| Rev., (Police Facilities), | 8/1/17 (NATL)(1)(2) | 3,630,000 | 4,731,560 | |||
| 5.25%, 8/1/13(1) | 1,810,000 | 1,954,384 | ||||
| Lancaster Financing Auth. | ||||||
| Contra Costa Water District | Tax Allocation Rev., (Projects | |||||
| Rev., Series 1992 E, 6.25%, | No. 5 & 6), 5.60%, 2/1/34(1) | 1,250,000 | 1,110,363 | |||
| 10/1/12 (Ambac)(1) | 1,205,000 | 1,286,036 | ||||
| Lancaster Financing Auth. | ||||||
| Escondido COP, 5.00%, | Tax Allocation Rev., (School | |||||
| 9/1/30 (Ambac)(1) | 4,725,000 | 4,634,705 | District), 5.00%, 2/1/37(1) | 5,190,000 | 3,841,690 | |
| Fresno Sewer Rev., | Lodi Unified School District | |||||
| Series 1993 A1, 6.25%, | COP, Series 2005 A, | |||||
| 9/1/14 (Ambac)(1) | 2,225,000 | 2,481,409 | (Aspire), 5.00%, 8/1/32 | |||
| Golden State Tobacco | (FGIC)(NATL)(1) | 2,140,000 | 2,017,399 | |||
| Securitization Corp. | Los Angeles Community | |||||
| Settlement Rev., | College District GO, Series | |||||
| Series 2003 A1, 6.25%, | 2008 E1, (Election of 2001), | |||||
| 6/1/33, Prerefunded at | 5.00%, 8/1/26(1) | 2,800,000 | 2,929,024 | |||
| 100% of Par(1)(2) | 1,355,000 | 1,513,738 | ||||
| Los Angeles Department of | ||||||
| Golden State Tobacco | Airports Rev., Series 2008 C, | |||||
| Securitization Corp. | (Los Angeles International | |||||
| Settlement Rev., Series | Airport), 5.25%, 5/15/21(1) | 4,370,000 | 4,647,014 | |||
| 2007 A1, 5.125%, 6/1/47(1) | 4,375,000 | 3,071,031 | ||||
| Los Angeles Department | ||||||
| Golden State Tobacco | of Water & Power Rev., | |||||
| Securitization Corp. | Series 2008 A1, (Power | |||||
| Settlement Rev., Series | System), 5.25%, 7/1/38(1) | 4,000,000 | 4,125,160 | |||
| 2007 A1, 5.75%, 6/1/47(1) | 14,470,000 | 11,286,745 | ||||
| Los Angeles Unified School | ||||||
| Hillsborough School District | District GO, Series 2006 G, | |||||
| GO, Series 2006 B, (Election | (Election of 2004), 5.00%, | |||||
| of 2002), 4.86%, 9/1/29(1)(3) | 4,705,000 | 1,569,306 | 7/1/25 (Ambac)(1) | 5,000,000 | 5,211,050 | |
| Hillsborough School District | Manhattan Beach Unified | |||||
| GO, Series 2006 B, (Election | School District GO, Series | |||||
| of 2002), 4.87%, 9/1/30(1)(3) | 5,010,000 | 1,563,771 | 2009 A, (Election of 2008), | |||
| 6.37%, 9/1/29(1)(3) | 5,905,000 | 1,711,151 |
17
California Long-Term Tax-Free
| Principal | Principal | |||||
| Amount | Value | Amount | Value | |||
| Metropolitan Water District | Pico Rivera Water Auth. | |||||
| of Southern California Rev., | Rev., Series 1999 A, | |||||
| 5.75%, 8/10/18(1) | $ 8,000,000 | $ 8,862,720 | (Water System), 5.50%, | |||
| Metropolitan Water | 5/1/29 (NATL)(1) | $ 2,500,000 | $ 2,778,975 | |||
| District of Southern | Pomona Unified School | |||||
| California Rev., Series | District GO, Series 2000 A, | |||||
| 2006 B, 4.375%, 7/1/37(1) | 3,000,000 | 2,844,840 | 6.55%, 8/1/29 (NATL)(1) | 1,000,000 | 1,109,270 | |
| Metropolitan Water | Pomona Unified School | |||||
| District of Southern | District GO, Series 2001 A, | |||||
| California Rev., Series | 6.15%, 8/1/30 (NATL)(1) | 1,000,000 | 1,052,350 | |||
| 2009 B, 5.00%, 7/1/30(1) | 4,000,000 | 4,209,240 | Poway Unified School | |||
| Metropolitan Water | District Public | |||||
| District of Southern | Financing Auth. Rev. , | |||||
| California Rev., Series | 7.875%, 9/15/39 | 1,070,000 | 1,108,959 | |||
| 2009 C, 5.00%, 7/1/35(1) | 1,150,000 | 1,184,155 | Riverside Redevelopment | |||
| Modesto Irrigation District | Agency Tax Allocation Rev., | |||||
| COP, Series 2009 A, | Series 2004 A, (Housing | |||||
| 5.75%, 10/1/34(1) | 2,500,000 | 2,589,250 | Set-Aside), 5.00%, | |||
| M-S-R Public Power Agency | 8/1/28 (FGIC)(NATL)(1) | 1,330,000 | 1,179,338 | |||
| Rev., Series 1989 D, | Sacramento County Airport | |||||
| (San Juan), 6.75%, | System Rev., Series | |||||
| 7/1/20 (NATL)(1)(2) | 8,145,000 | 10,080,985 | 2009 D, (Subordinate | |||
| New Haven Unified School | PFC/Grant Revenue | |||||
| District GO, 12.00%, | Bonds), 5.625%, 7/1/29(1) | 1,000,000 | 1,004,400 | |||
| 8/1/18 (FSA)(1) | 1,000,000 | 1,646,800 | Saddleback Valley Unified | |||
| Oakland Redevelopment | School District Public | |||||
| Agency Tax Allocation Rev., | Financing Auth. Special | |||||
| (Central District), 5.50%, | Tax Rev., Series 1997 A, | |||||
| 2/1/14 (Ambac)(1) | 5,055,000 | 5,104,994 | 6.00%, 9/1/16 (FSA)(1) | 1,000,000 | 1,126,000 | |
| Orange County Improvement | San Bernardino Community | |||||
| Bond Act of 1915 Special | College District GO, Series | |||||
| Assessment Rev., | 2008 A, (Election of 2002), | |||||
| (Newport Coast Phase IV | 6.25%, 8/1/33(1) | 1,800,000 | 2,016,126 | |||
| Assessment District | San Bernardino Community | |||||
| No. 01-1), 5.00%, 9/2/26 | 850,000 | 743,334 | College District GO, Series | |||
| Orange County Improvement | 2009 B, 0.00%, 8/1/19(1)(4) | 7,400,000 | 4,161,760 | |||
| Bond Act of 1915 Special | San Diego County COP | |||||
| Assessment Rev., | Linked Security, ARC, YCC, | |||||
| (Newport Coast Phase IV | 5.625%, 9/1/12 (Ambac)(1) | 5,300,000 | 5,415,328 | |||
| Assessment District | San Diego Public Facilities | |||||
| No. 01-1), 5.05%, 9/2/33 | 1,250,000 | 1,037,138 | Financing Auth. Rev., Series | |||
| Oxnard School District | 2009 A, 5.25%, 5/15/34(1) | 2,000,000 | 2,037,920 | |||
| GO, Series 2001 A, 5.75%, | San Francisco City and | |||||
| 8/1/22 (NATL)(1) | 3,100,000 | 3,289,100 | County COP, Series | |||
| Palomar Pomerado Health | 2009 A, (Multiple Capital | |||||
| GO, Series 2009 A, | Improvement Projects), | |||||
| (Election of 2004), 0.00%, | 5.00%, 4/1/29(1) | 1,170,000 | 1,179,699 | |||
| 8/1/19 (AGC)(1)(4) | 1,670,000 | 1,008,463 | San Mateo County Joint | |||
| Pasadena COP, (Old | Powers Financing Auth. | |||||
| Pasadena Parking Facility), | Lease Rev., Series 1993 A, | |||||
| 6.25%, 1/1/18(1) | 2,075,000 | 2,420,571 | (Capital Projects Program), | |||
| Perris Public Financing Auth. | 6.50%, 7/1/15 (NATL)(1) | 3,000,000 | 3,470,130 | |||
| Tax Allocation Rev., | ||||||
| 5.35%, 10/1/36 | 1,150,000 | 850,770 |
18
California Long-Term Tax-Free
| Principal | Principal | |||||
| Amount | Value | Amount | Value | |||
| San Mateo County Joint | Ukiah Electric Rev., 6.25%, | |||||
| Powers Financing Auth. | 6/1/18 (NATL)(1) | $ 2,315,000 | $ 2,559,834 | |||
| Lease Rev., Series 1993 A, | Ventura County Community | |||||
| (Capital Projects Program), | College District GO, Series | |||||
| 6.00%, 7/1/19 (NATL)(1) | $ 4,000,000 | $ 4,492,560 | 2008 C, (Election of 2002), | |||
| Santa Margarita-Dana Point | 5.50%, 8/1/33(1) | 5,000,000 | 5,192,450 | |||
| Auth. Rev., Series 1994 B, | Vernon Electric System | |||||
| (Improvement Districts 3, | Rev., Series 2009 A, | |||||
| 3A, 4, 4A), 7.25%, | 5.125%, 8/1/21(1) | 5,000,000 | 5,001,300 | |||
| 8/1/14 (NATL)(1) | 2,000,000 | 2,306,900 | ||||
| Vista COP, (Community | ||||||
| Shasta Lake Public Finance | Projects), 5.00%, | |||||
| Auth. Rev., 5.00%, 4/1/25(1) | 2,470,000 | 2,165,202 | 5/1/37 (NATL)(1) | 7,000,000 | 6,403,040 | |
| South Coast Air Quality | Walnut Valley Unified School | |||||
| Management District | District GO, Series 1992 B, | |||||
| Building Corp. Rev., | 6.00%, 8/1/10 (Ambac)(1)(2) | 1,445,000 | 1,519,446 | |||
| (Installment Sale | ||||||
| Headquarters), 6.00%, | Watsonville Insured Hospital | |||||
| 8/1/11 (Ambac)(1) | 2,500,000 | 2,587,950 | Rev., Series 1996 A, | |||
| (Community Hospital), | ||||||
| South Gate COP, | 6.20%, 7/1/12 (California | |||||
| Series 2002 A, 5.50%, | Mortgage Insurance)(1)(2) | 1,925,000 | 2,097,499 | |||
| 9/1/21 (Ambac)(1) | 2,705,000 | 2,710,031 | ||||
| Woodland COP, (Wastewater | ||||||
| South Orange County Public | System Reference), 5.75%, | |||||
| Financing Auth. Special | 3/1/12 (Ambac)(1) | 2,460,000 | 2,559,605 | |||
| Tax Rev., Series 1994 A, | ||||||
| (Senior Lien), 7.00%, | 403,405,506 | |||||
| 9/1/11 (NATL)(1) | 2,000,000 | 2,135,800 | GUAM — 0.2% | |||
| Southern California Public | Guam Government GO, | |||||
| Power Auth. Rev., | Series 2009 A, | |||||
| (Multiple Projects), | 6.75%, 11/15/29(1) | 900,000 | 909,324 | |||
| 6.75%, 7/1/12 (FSA-CR)(1) | 7,315,000 | 8,317,155 | PUERTO RICO — 1.9% | |||
| Southern California Public | Puerto Rico Electric Power | |||||
| Power Auth. Rev., | Auth. Rev., Series 2002 II, | |||||
| (Multiple Projects), | 5.375%, 7/1/12, Prerefunded | |||||
| 6.75%, 7/1/13 (FSA-CR)(1) | 3,730,000 | 4,363,951 | at 101% of Par (XLCA)(1)(2) | 4,000,000 | 4,524,680 | |
| Stanton Redevelopment | Puerto Rico Infrastructure | |||||
| Agency Tax Allocation Rev., | Financing Auth. Special Tax | |||||
| (Community Development), | Rev., Series 2005 C, 5.50%, | |||||
| 5.45%, 12/1/17 (Ambac)(1) | 1,105,000 | 1,105,818 | 7/1/23 (Ambac)(1) | 2,000,000 | 1,976,960 | |
| Taft Public Financing Auth. | University of Puerto Rico | |||||
| Lease Rev., Series 1997 A, | Rev., Series 2006 Q, | |||||
| (Community Correctional | 5.00%, 6/1/12(1) | 1,200,000 | 1,235,292 | |||
| Facility Acquisition), | 7,736,932 | |||||
| 6.05%, 1/1/17(1) | 2,000,000 | 2,002,340 | ||||
| TOTAL INVESTMENT | ||||||
| Tuolumne Wind Project | SECURITIES — 97.7% | |||||
| Auth. Rev., Series 2009 A, | (Cost $405,221,273) | 412,051,762 | ||||
| 5.625%, 1/1/29(1) | 1,200,000 | 1,232,772 | ||||
| OTHER ASSETS | ||||||
| Turlock Health Facility COP, | AND LIABILITIES — 2.3% | 9,819,593 | ||||
| (Emanuel Medical Center, | ||||||
| Inc.), 5.50%, 10/15/18(1) | 1,215,000 | 1,132,659 | TOTAL NET ASSETS — 100.0% | $421,871,355 | ||
| Turlock Health Facility COP, | ||||||
| (Emanuel Medical Center, | ||||||
| Inc.), 5.50%, 10/15/19(1) | 1,285,000 | 1,186,633 | ||||
19
California Long-Term Tax-Free
| Futures Contracts | ||||
| Underlying Face | ||||
| Contracts Sold | Expiration Date | Amount at Value | Unrealized Gain (Loss) | |
| 84 U.S. Long Bond | December 2009 | $10,059,000 | $(185,908) | |
| Notes to Schedule of Investments | ||||
| ABAG = Association of Bay Area Governments | ||||
| AGC = Assured Guaranty Corporation | ||||
| Ambac = Ambac Assurance Corporation | ||||
| ARC = Auction Rate Certificate | ||||
| COP = Certificates of Participation | ||||
| FGIC = Financial Guaranty Insurance Company | ||||
| FSA = Financial Security Assurance, Inc. | ||||
| FSA-CR = Financial Security Assurance, Inc. — Custodial Receipts | ||||
| GO = General Obligation | ||||
| LOC = Letter of Credit | ||||
| M-S-R = Modesto, Stockton, Redding | ||||
| NATL = National Public Finance Guarantee Corporation | ||||
| VRDN = Variable Rate Demand Note. Interest reset date is indicated. Rate shown is effective at the period end. | ||||
| XLCA = XL Capital Ltd. | ||||
| YCC = Yield Curve Certificate | ||||
| (1) | Security, or a portion thereof, has been segregated for futures contracts. At the period end, the aggregate value of securities pledged | |||
| was $10,059,000. | ||||
| (2) | Escrowed to maturity in U.S. government securities or state and local government securities. | |||
| (3) | Security is a zero-coupon municipal bond. The rate indicated is the yield to maturity at purchase. Zero-coupon securities are issued at a | |||
| substantial discount from their value at maturity. | ||||
| (4) | Convertible capital appreciation bond. These securities are issued with a zero-coupon and become interest bearing at a predetermined rate and | |||
| date and are issued at a substantial discount from their value at maturity. Interest reset or final maturity date is indicated, as applicable. Rate | ||||
| shown is effective at the period end. | ||||
| See Notes to Financial Statements. | ||||
20
California High-Yield Municipal
| AUGUST 31, 2009 | ||||||
| Principal | Principal | |||||
| Amount | Value | Amount | Value | |||
| Municipal Securities — 98.5% | California Department of | |||||
| Water Resources Power | ||||||
| CALIFORNIA — 94.8% | Supply Rev., Series 2008 H, | |||||
| ABAG Finance Auth. for | 5.00%, 5/1/22(1) | $ 4,500,000 | $ 4,769,100 | |||
| Nonprofit Corps. Rev., | California Department of | |||||
| (Sharp Healthcare), | Water Resources Water | |||||
| 6.25%, 8/1/39(1) | $ 1,800,000 | $ 1,827,774 | System Rev., Series | |||
| ABC Unified School District | 2008 AE, (Central Valley), | |||||
| GO, Series 2000 B, 6.14%, | 5.00%, 12/1/23(1) | 2,500,000 | 2,733,475 | |||
| 8/1/21 (NATL/FGIC)(1)(2) | 1,000,000 | 516,900 | California Economic | |||
| Anaheim Public Financing | Recovery GO, Series | |||||
| Auth. Lease Rev., | 2004 A, 5.25%, 7/1/14 | |||||
| Series 1997 A, (Public | (NATL/FGIC)(1) | 6,000,000 | 6,688,680 | |||
| Improvements), 6.00%, | California Educational | |||||
| 9/1/24 (FSA)(1) | 1,200,000 | 1,352,316 | Facilities Auth. Rev., | |||
| Beaumont Financing Auth. | (Western University | |||||
| Local Agency Special Tax | Health Sciences), 6.00%, | |||||
| Rev., Series 2004 D, | 10/1/12, Prerefunded at | |||||
| 5.80%, 9/1/35 | 2,875,000 | 2,334,730 | 100% of Par(1)(3) | 1,505,000 | 1,716,859 | |
| Beaumont Financing Auth. | California Educational | |||||
| Local Agency Special Tax | Facilities Auth. Rev., | |||||
| Rev., Series 2005 B, | Series 2009 A, (Pomona | |||||
| 5.40%, 9/1/35 | 1,390,000 | 1,055,246 | College), 5.00%, 1/1/24(1) | 1,400,000 | 1,560,006 | |
| Beaumont Financing Auth. | California GO, | |||||
| Local Agency Special Tax | 6.00%, 4/1/38(1) | 5,000,000 | 5,290,900 | |||
| Rev., Series 2005 C, | California Health Facilities | |||||
| 5.50%, 9/1/29 | 855,000 | 692,507 | Financing Auth. Rev., | |||
| Beaumont Financing Auth. | Series 1989 A, (Kaiser | |||||
| Local Agency Special Tax | Permanente), 7.15%, | |||||
| Rev., Series 2005 C, | 10/1/12 (Ambac-TCRS)(1)(2) | 4,000,000 | 3,696,000 | |||
| 5.50%, 9/1/35 | 4,000,000 | 2,831,240 | California Health Facilities | |||
| Beaumont Financing Auth. | Financing Auth. Rev., | |||||
| Local Agency Special | Series 2008 A, (Scripps | |||||
| Tax Rev., Series 2006 A, | Health), 5.50%, 10/1/20(1) | 1,500,000 | 1,574,250 | |||
| (Improvement Area | California Health Facilities | |||||
| No. 19C), 5.35%, 9/1/36 | 2,700,000 | 1,854,225 | Financing Auth. Rev., | |||
| Beaumont Financing Auth. | Series 2008 A, (Sutter | |||||
| Local Agency Special | Health), 5.50%, 8/15/16(1) | 5,000,000 | 5,421,350 | |||
| Tax Rev., Series 2008 A, | California Health Facilities | |||||
| (Improvement Area | Financing Auth. Rev., | |||||
| No. 19C), 6.875%, 9/1/36 | 1,050,000 | 901,215 | Series 2008 A3, | |||
| Berryessa Unified School | (Stanford Hospital), | |||||
| District GO, Series 2000 A, | VRDN, 3.45%, 6/15/11(1) | 3,700,000 | 3,812,961 | |||
| 6.18%, 8/1/21 (FSA)(1)(2) | 1,190,000 | 633,211 | California Health Facilities | |||
| Berryessa Unified School | Financing Auth. Rev., | |||||
| District GO, Series 2000 A, | Series 2008 C, (Providence | |||||
| 6.05%, 8/1/22 (FSA)(1)(2) | 1,220,000 | 608,231 | Health & Services), | |||
| Berryessa Unified School | 6.50%, 10/1/33(1) | 1,000,000 | 1,095,390 | |||
| District GO, Series 2000 A, | California Health Facilities | |||||
| 6.06%, 8/1/23 (FSA)(1)(2) | 1,000,000 | 461,340 | Financing Auth. Rev., Series | |||
| California Department of | 2008 G, (Catholic Healthcare | |||||
| Water Resources Power | West), 5.50%, 7/1/25(1) | 2,000,000 | 2,002,600 | |||
| Supply Rev., Series 2005 G4, | ||||||
| 5.00%, 5/1/16(1) | 2,450,000 | 2,709,210 | ||||
21
California High-Yield Municipal
| Principal | Principal | |||||
| Amount | Value | Amount | Value | |||
| California Health Facilities | California State Department | |||||
| Financing Auth. Rev., Series | of Water Resources Rev., | |||||
| 2009 A, (Catholic Healthcare | Series 2009 AF, (Water | |||||
| West), 6.00%, 7/1/39(1) | $ 4,300,000 | $ 4,315,394 | System), 5.00%, 12/1/32(1) | $ 1,000,000 | $ 1,045,120 | |
| California Health Facilities | California State University | |||||
| Financing Auth. Rev., | Fresno Association, Inc. | |||||
| Series 2009 A, (Children’s | Rev., (Auxiliary Organization | |||||
| Hospital of Orange County), | Event Center), 7.00%, | |||||
| 6.50%, 11/1/38(1) | 3,000,000 | 3,064,530 | 7/1/12, Prerefunded at | |||
| California Infrastructure | 101% of Par(1)(3) | 2,455,000 | 2,867,759 | |||
| & Economic Development | California State University | |||||
| Bank Rev., Series 2008 A, | Rev., Series 2005 C, | |||||
| (California Independent | (Systemwide Financing | |||||
| System Operator Corp.), | Program), 5.00%, | |||||
| 5.00%, 2/1/13(1) | 2,500,000 | 2,655,900 | 11/1/30 (NATL)(1) | 10,000,000 | 10,015,100 | |
| California Mobilehome | California State University | |||||
| Park Financing Auth. Rev., | Rev., Series 2009 A, | |||||
| Series 2000 B, (Union City | (Systemwide Financing | |||||
| Tropics), 7.30%, 8/15/10, | Program), 5.25%, 11/1/38(1) | 3,000,000 | 3,020,130 | |||
| Prerefunded at 102% | California Statewide | |||||
| of Par(3) | 4,410,000 | 4,768,974 | Communities Development | |||
| California Mobilehome Park | Auth. COP, (Sonoma | |||||
| Financing Auth. Rev., | County Indian Health), | |||||
| Series 2001 B, (Rancho | 6.40%, 9/1/29(1) | 2,290,000 | 2,162,058 | |||
| Vallecitos – San Marcos), | California Statewide | |||||
| 6.75%, 11/15/36 | 1,905,000 | 1,603,877 | Communities Development | |||
| California Mobilehome Park | Auth. Rev., (Drew School), | |||||
| Financing Auth. Rev., Series | 5.30%, 10/1/37 | 1,070,000 | 735,015 | |||
| 2003 B, (Palomar Estates | California Statewide | |||||
| E&W), 7.00%, 9/15/36(1) | 6,345,000 | 5,611,899 | Communities Development | |||
| California Mobilehome Park | Auth. Rev., (Lancer | |||||
| Financing Auth. Rev., Series | Educational Student | |||||
| 2006 B, (Union City Tropics), | Housing), 5.625%, 6/1/33 | 2,500,000 | 1,706,025 | |||
| 5.50%, 12/15/41 | 2,000,000 | 1,446,380 | California Statewide | |||
| California Municipal | Communities Development | |||||
| Finance Auth. Rev., (Biola | Auth. Rev., (Southern | |||||
| University), 5.875%, 10/1/34 | 1,000,000 | 965,010 | California Presbyterian | |||
| California Pollution Control | Homes), 7.25%, 11/15/41(1) | 2,500,000 | 2,553,800 | |||
| Financing Auth. Rev., Series | California Statewide | |||||
| 1996 C, (Pacific Gas and | Communities Development | |||||
| Electric), VRDN, 0.15%, | Auth. Rev., (Thomas | |||||
| 9/1/09 (LOC: JPMorgan | Jefferson School of Law), | |||||
| Chase Bank)(1) | 800,000 | 800,000 | 7.75%, 10/1/11, Prerefunded | |||
| California Public Works | at 101% of Par(1)(3) | 1,910,000 | 2,162,578 | |||
| Board Lease Rev., Series | California Statewide | |||||
| 1993 D, (Department of | Communities Development | |||||
| Corrections), 5.25%, | Auth. Rev., Series 2001 C, | |||||
| 6/1/15 (FSA)(1) | 2,000,000 | 2,230,360 | (Kaiser Permanente), VRN, | |||
| California State and Local | 5.25%, 8/1/16(1) | 4,000,000 | 3,873,360 | |||
| Government Financial Auth. | California Statewide | |||||
| Rev., Series 1997 B, (Marin | Communities Development | |||||
| Valley Mobile Country), | Auth. Rev., Series 2007 A, | |||||
| 7.50%, 10/1/24 | 1,265,000 | 1,189,530 | (California Baptist | |||
| University), 5.50%, 11/1/38 | 9,000,000 | 6,022,620 |
22
California High-Yield Municipal
| Principal | Principal | |||||
| Amount | Value | Amount | Value | |||
| California Statewide | Clovis Public Financing | |||||
| Communities Development | Auth. Lease Rev., | |||||
| Auth. Rev., Series | (Corporate Yard), 5.375%, | |||||
| 2007 A, (Front Porch | 3/1/20 (Ambac)(1) | $ 1,780,000 | $ 1,869,552 | |||
| Communities and Services), | Corcoran COP, | |||||
| 5.125%, 4/1/37(1)(4) | $ 3,400,000 | $ 2,484,448 | 8.75%, 6/1/16(4) | 425,000 | 484,598 | |
| California Statewide | Corona Department | |||||
| Communities Development | of Water & Power COP, | |||||
| Auth. Rev., Series 2007 A, | 5.00%, 9/1/35 (NATL)(1) | 2,000,000 | 1,899,620 | |||
| (Valleycare Health System), | ||||||
| 5.125%, 7/15/31 | 2,000,000 | 1,319,060 | Duarte Unified School | |||
| District GO, Series 1999 B, | ||||||
| California Statewide | 6.08%, 11/1/23 (FSA)(1)(2) | 1,150,000 | 522,640 | |||
| Communities Development | ||||||
| Auth. Rev., Series 2008 B, | Duarte Unified School | |||||
| (Rady Children’s Hospital), | District GO, Series 2006 E, | |||||
| VRDN, 0.11%, 9/1/09 | (Election of 1998), 5.07%, | |||||
| 11/1/28 (FSA)(1)(2) | 2,355,000 | 730,427 | ||||
| (LOC: Bank of the West)(1) | 1,100,000 | 1,100,000 | ||||
| California Statewide | Eastern Municipal Water | |||||
| Communities Development | District Water & Sewer | |||||
| Auth. Rev., Series 2008 D, | COP, Series 2008 H, | |||||
| 5.00%, 7/1/33(1) | 4,500,000 | 4,534,875 | ||||
| (Los Angeles County | ||||||
| Museum of Art), VRDN, | El Dorado County | |||||
| 0.10%, 9/1/09 (LOC: Wells | Community Facilities District | |||||
| Fargo Bank N.A.)(1) | 2,500,000 | 2,500,000 | No. 1992-1 Special Tax Rev., | |||
| California Statewide | 5.60%, 9/1/09 | 970,000 | 970,000 | |||
| Communities Development | El Dorado County | |||||
| Auth. Rev., Series 2009 A, | Community Facilities | |||||
| (Kaiser Permanente), | District No. 2001-1 Special | |||||
| 5.00%, 4/1/19 | 5,000,000 | 5,218,400 | Tax Rev., (Promontory | |||
| Capistrano Unified School | Specific), 6.30%, 9/1/31 | 2,500,000 | 1,925,225 | |||
| District Special Tax Rev., | El Dorado County | |||||
| (Community Facilities | Community Facilities | |||||
| District No. 90-2), | District No. 2005-1 Special | |||||
| 6.00%, 9/1/33 | 6,250,000 | 5,453,500 | Tax Rev., 5.25%, 9/1/35 | 3,400,000 | 2,163,692 | |
| Carmel Unified School | Folsom Community Facilities | |||||
| District GO, 5.50%, | District No. 7 Special Tax | |||||
| 8/1/25 (NATL)(1) | 1,000,000 | 1,022,610 | Rev., 5.75%, 9/1/14 | 2,450,000 | 2,381,253 | |
| Carson Redevelopment | Folsom Community Facilities | |||||
| Agency Tax Allocation Rev., | District No. 10 Special Tax | |||||
| Series 2009 A, (Project Area | Rev., 7.00%, 9/1/24 | 2,610,000 | 2,492,550 | |||
| No.1 ), 7.00%, 10/1/36(1) | 2,000,000 | 2,072,980 | Folsom Community Facilities | |||
| Chino Valley Unified School | District No. 14 Special | |||||
| District COP, Series 2001 A, | Tax Rev., 6.30%, 9/1/11, | |||||
| 5.375%, 9/1/20 (FSA)(1) | 1,700,000 | 1,734,952 | Prerefunded at 102% | |||
| of Par(3) | 6,500,000 | 7,276,620 | ||||
| Chula Vista Community | ||||||
| Facilities District No. 06-1 | Foothill-De Anza Community | |||||
| Area A Special Tax Rev., | College District GO, 6.16%, | |||||
| (Eastlake Woods), | 8/1/21 (NATL)(1)(2) | 3,000,000 | 1,705,650 | |||
| 6.20%, 9/1/33 | 3,600,000 | 3,400,920 | Fullerton Community | |||
| Chula Vista Industrial | Facilities District No. 1 | |||||
| Development Rev., | Special Tax Rev., (Amerige | |||||
| Series 2004 D, (San Diego | Heights), 6.20%, 9/1/32 | 3,000,000 | 2,585,850 | |||
| Gas), 5.875%, 1/1/34(1) | 1,000,000 | 1,028,670 |
23
California High-Yield Municipal
| Principal | Principal | |||||
| Amount | Value | Amount | Value | |||
| Fullerton Unified School | Huntington Beach Union | |||||
| District Special Tax Rev., | High School District GO, | |||||
| (Community Facilities | (Election of 2004), 5.00%, | |||||
| District No. 2001-1), | 8/1/31 (NATL)(1)(2) | $ 5,000,000 | $ 1,207,350 | |||
| 6.375%, 9/1/31 | $ 5,000,000 | $ 4,800,500 | Imperial Irrigation District | |||
| Glendale Unified School | COP, (Water System), | |||||
| District GO, Series 1999 C, | 5.50%, 7/1/29 (Ambac)(1) | 5,000,000 | 5,051,150 | |||
| 6.00%, 9/1/22 (FSA)(1) | 2,630,000 | 2,699,038 | Imperial Irrigation District | |||
| Golden State Tobacco | Rev., 5.00%, 11/1/33(1) | 2,185,000 | 2,145,757 | |||
| Securitization Corp. | Independent Cities Lease | |||||
| Settlement Rev., Series | Finance Auth. Rev., Series | |||||
| 2007 A1, 5.125%, 6/1/47(1) | 8,500,000 | 5,966,575 | 2004 A, (Morgan Hill – | |||
| Golden State Tobacco | Hacienda Valley Mobile | |||||
| Securitization Corp. | Estates), 5.90%, 11/15/34 | 2,235,000 | 1,807,869 | |||
| Settlement Rev., Series | Independent Cities Lease | |||||
| 2007 A1, 5.75%, 6/1/47(1) | 7,500,000 | 5,850,075 | Finance Auth. Rev., Series | |||
| Hawaiian Gardens COP, | 2006 B, (San Juan Mobile | |||||
| Series 2000 A, 8.00%, | Estates), 5.55%, 5/15/31 | 500,000 | 376,575 | |||
| 6/1/10, Prerefunded at | Independent Cities Lease | |||||
| 102% of Par(3) | 2,965,000 | 3,173,469 | Finance Auth. Rev., Series | |||
| Hawaiian Gardens | 2006 B, (San Juan Mobile | |||||
| Redevelopment Agency | Estates), 5.85%, 5/15/41 | 1,150,000 | 853,611 | |||
| Tax Allocation Rev., | Independent Cities Lease | |||||
| Series 2006 B, | Finance Auth. Rev., Series | |||||
| (Redevelopment Project | 2007 A, (Santa Rosa | |||||
| No. 1), 5.40%, 12/1/25 | 1,155,000 | 926,160 | Leisure Mobilehome Park), | |||
| Hemet Unified School | 5.70%, 11/15/47 | 3,430,000 | 2,634,446 | |||
| District Special Tax Rev., | Irvine California Unified | |||||
| (Community Facilities | School District Special Tax | |||||
| District No. 2005-2), | Rev., (Community Facilities | |||||
| 5.25%, 9/1/30 | 2,670,000 | 1,923,628 | District No. 06-1), VRDN, | |||
| Hemet Unified School | 0.12%, 9/1/09 (LOC: Bank | |||||
| District Special Tax Rev., | of America N.A.) | 1,550,000 | 1,550,000 | |||
| (Community Facilities | Irvine Improvement | |||||
| District No. 2005-2), | Bond Act of 1915 Special | |||||
| 5.25%, 9/1/35 | 1,510,000 | 1,035,800 | Assessment Rev., (Limited | |||
| Hesperia Public Financing | Obligation Assessment | |||||
| Auth. Tax Allocation | District No. 93-14), VRDN, | |||||
| Rev., Series 2007 A, | 0.16%, 9/1/09 (LOC: Bank | |||||
| (Redevelopment and | of America N.A.)(1) | 1,362,000 | 1,362,000 | |||
| Housing), 5.50%, | Irvine Improvement | |||||
| 9/1/32 (XLCA)(1) | 3,500,000 | 2,996,245 | Bond Act of 1915 Special | |||
| Hesperia Public Financing | Assessment Rev., Series | |||||
| Auth. Tax Allocation | 2006 B, (Reassessment | |||||
| Rev., Series 2007 A, | District No. 03-19), VRDN, | |||||
| (Redevelopment and | 0.10%, 9/1/09 (LOC: Bank | |||||
| Housing), 5.50%, | of New York and California | |||||
| 9/1/37 (XLCA)(1) | 2,025,000 | 1,671,314 | State Teacher’s Retirement) | 1,264,000 | 1,264,000 | |
| Highland Community | Jurupa Special Tax Rev., | |||||
| Facilities District No. 2001-1 | Series 2008 A, (Community | |||||
| Special Tax Rev., | Facilities District No. 25), | |||||
| 6.45%, 9/1/28 | 2,000,000 | 1,742,740 | 8.875%, 9/1/38 | 2,000,000 | 2,044,640 | |
| Hillsborough School District | ||||||
| GO, Series 2006 B, (Election | ||||||
| of 2002), 4.84%, 9/1/28(1)(2) | 3,345,000 | 1,198,881 |
24
California High-Yield Municipal
| Principal | Principal | |||||
| Amount | Value | Amount | Value | |||
| Kern Community College | Los Angeles Community | |||||
| Safety, Repair and | Facilities District No. 3 | |||||
| Improvement District GO, | Special Tax Rev., (Cascades | |||||
| (Election of 2002), 4.56%, | Business Park & Golf | |||||
| 11/1/30 (FSA)(1)(2) | $ 8,550,000 | $ 2,184,354 | Course), 6.40%, 9/1/22 | $ 1,310,000 | $ 1,201,296 | |
| Laguna Salada Union | Los Angeles Department of | |||||
| School District GO, Series | Airports Rev., Series 2008 C, | |||||
| 2000 C, 6.12%, 8/1/29 | (Los Angeles International | |||||
| (NATL/FGIC)(1)(2) | 1,000,000 | 282,420 | Airport), 5.25%, 5/15/25(1) | 2,000,000 | 2,066,160 | |
| Lake Elsinore Community | Los Angeles Unified School | |||||
| Facilities District No. 2004-3 | District GO, Series 2009 D, | |||||
| Special Tax Rev., Series | 5.00%, 1/1/34(1) | 2,500,000 | 2,523,050 | |||
| 2005 A, (Rosetta Canyon | Manteca Unified School | |||||
| Improvement Area No. 1), | District GO, (Election | |||||
| 5.25%, 9/1/35 | 1,225,000 | 827,757 | of 2004), 4.92%, | |||
| Lake Elsinore Community | 8/1/30 (NATL)(1)(2) | 5,455,000 | 1,416,882 | |||
| Facilities District No. 2004-3 | Metropolitan Water | |||||
| Special Tax Rev., Series | District of Southern | |||||
| 2006 A, (Rosetta Canyon | California Rev., Series | |||||
| improvement Area No. 2), | 2009 A, 5.00%, 1/1/39(1) | 5,000,000 | 5,115,750 | |||
| 5.25%, 9/1/37 | 5,000,000 | 3,268,450 | Metropolitan Water | |||
| Lake Elsinore Community | District of Southern | |||||
| Facilities District No. 2005-1 | California Rev., Series | |||||
| Special Tax Rev., Series | 2009 C, 5.00%, 7/1/35(1) | 1,150,000 | 1,184,155 | |||
| 2006 A, (Serenity), | ||||||
| 5.35%, 9/1/36 | 1,100,000 | 762,498 | Milpitas Improvement | |||
| Bond Act of 1915 | ||||||
| Lake Elsinore Community | Special Assessment Rev., | |||||
| Facilities District No. 2005-2 | Series 1996 A, (Local | |||||
| Special Tax Rev., Series | Improvement District | |||||
| 2005 A, (Alverhill Ranch | No. 18), 6.75%, 9/2/16 | 1,480,000 | 1,480,385 | |||
| Improvement Area A), | ||||||
| 5.45%, 9/1/36 | 5,000,000 | 3,403,550 | Modesto Irrigation District | |||
| COP, Series 2009 A, | ||||||
| Lake Elsinore Community | (Capital Improvements), | |||||
| Facilities District No. 2006-2 | 6.00%, 10/1/39(1) | 3,000,000 | 3,185,010 | |||
| Special Tax Rev., Series | ||||||
| 2006 A, (Viscaya), | Montebello Community | |||||
| 5.40%, 9/1/36 | 2,020,000 | 1,411,798 | Redevelopment Agency | |||
| Tax Allocation Rev., | ||||||
| Lake Elsinore Unified School | Series 2009 A, (Montebello | |||||
| District Special Tax Rev., | Hills Redevelopment), | |||||
| (Community Facilities | 8.10%, 3/1/27(1) | 2,000,000 | 2,176,860 | |||
| District No. 2005-1, | ||||||
| Improvement Area A), | Moreno Valley Unified | |||||
| 5.40%, 9/1/35 | 2,245,000 | 1,524,916 | School District Special Tax | |||
| Rev., (Community Facilities | ||||||
| Lincoln Community Facilities | District No. 2002-1), | |||||
| District No. 2003-1 Special | 6.20%, 9/1/32 | 4,000,000 | 3,389,960 | |||
| Tax Rev., (Lincoln Crossing), | ||||||
| 6.00%, 9/1/13, Prerefunded | Murrieta Community | |||||
| at 102% of Par(3) | 1,775,000 | 2,111,664 | Facilities District | |||
| No. 2000-2 Special | ||||||
| Los Angeles Community | Tax Rev., Series 2004 A, | |||||
| College District GO No. | (The Oaks Improvement | |||||
| 2003, Series 2008 F1, | Area), 6.00%, 9/1/34 | 1,920,000 | 1,513,536 | |||
| (Election of 2003), | ||||||
| 5.00%, 8/1/27(1) | 2,000,000 | 2,078,660 | Murrieta Improvement Bond | |||
| Act of 1915 Special Tax | ||||||
| Rev., (Community Facilities | ||||||
| District No. 2000-1), | ||||||
| 6.375%, 9/1/30 | 4,100,000 | 3,469,584 |
25
California High-Yield Municipal
| Principal | Principal | |||||
| Amount | Value | Amount | Value | |||
Oakland Unified School | Perris Union High School | |||||
| District Alameda County GO, | District GO, Series | |||||
| Series 2009 A, (Election of | 2000 A, 6.40%, 9/1/24 | |||||
| 2006), 6.125%, 8/1/29(1) | $ 2,500,000 | $ 2,568,050 | (NATL/FGIC)(1)(2) | $ 1,000,000 | $ 398,020 | |
| Oceanside Community | Perris Union High School | |||||
| Development Commission | District GO, Series | |||||
| Tax Allocation | 2000 A, 6.40%, 3/1/25 | |||||
| Rev., (Downtown | (NATL/FGIC)(1)(2) | 1,000,000 | 382,340 | |||
| Redevelopment), | Pittsburg Redevelopment | |||||
| 5.70%, 9/1/25(1) | 3,500,000 | 3,468,850 | Agency Tax Allocation Rev., | |||
| Oceanside Community | (Los Medanos Community | |||||
| Facilities District No. 2001-1 | Development), 6.20%, | |||||
| Special Tax Rev., Series | 8/1/25 (Ambac)(1)(2) | 2,900,000 | 1,080,511 | |||
| 2002 A, (Morrow | Placer Union High School | |||||
| Hills Development), | District GO, Series 2000 A, | |||||
| 6.20%, 9/1/32 | 2,650,000 | 2,220,859 | (Election of 1999), 6.20%, | |||
| Oxnard School District | 8/1/16 (NATL/FGIC)(1)(2) | 2,640,000 | 1,972,872 | |||
| GO, Series 2001 A, 5.75%, | Placer Union High School | |||||
| 8/1/30 (NATL)(1) | 3,000,000 | 3,023,640 | District GO, Series 2000 A, | |||
| Pacifica COP, (Public Safety | (Election of 1999), 6.28%, | |||||
| Building), 5.80%, 11/1/09, | 8/1/18 (NATL/FGIC)(1)(2) | 1,600,000 | 1,029,744 | |||
| Prerefunded at 102% of | Placer Union High School | |||||
| Par (NATL)(1)(3) | 1,150,000 | 1,182,580 | District GO, Series 2000 A, | |||
| Palmdale Water District | (Election of 1999), 6.35%, | |||||
| COP, 5.00%, 10/1/34 | 8/1/21 (NATL/FGIC)(1)(2) | 2,925,000 | 1,484,174 | |||
| (NATL/FGIC)(1) | 9,950,000 | 9,432,301 | Placer Union High School | |||
| Palomar Pomerado Health | District GO, Series 2000 A, | |||||
| Care District COP, (Indian | (Election of 1999), 6.37%, | |||||
| Health Council, Inc.), | 8/1/22 (NATL/FGIC)(1)(2) | 2,100,000 | 995,652 | |||
| 6.25%, 10/1/29(1) | 2,410,000 | 2,235,998 | Placer Union High School | |||
| Palomar Pomerado Health | District GO, Series 2000 A, | |||||
| GO, Series 2009 A, | (Election of 1999), 6.39%, | |||||
| (Election of 2004), 0.00%, | 8/1/23 (NATL/FGIC)(1)(2) | 3,525,000 | 1,542,681 | |||
| 8/1/19 (AGC)(1)(5) | 1,670,000 | 1,008,463 | Placer Union High School | |||
| Perris Community Facilities | District GO, Series 2000 A, | |||||
| District No. 2004-3 Special | (Election of 1999), 2.11%, | |||||
| Tax Rev., Series 2005 A, | 8/1/24 (NATL/FGIC)(1)(2) | 1,000,000 | 407,130 | |||
| (Improvement Area No. 2), | Pleasant Valley School | |||||
| 5.30%, 9/1/35 | 1,365,000 | 939,707 | District-Ventura County | |||
| Perris Public Financing Auth. | GO, Series 2002 A, 5.85%, | |||||
| Special Tax Rev., Series | 8/1/31 (NATL)(1) | 4,835,000 | 4,888,523 | |||
| 2003 A, 6.25%, 9/1/33 | 2,955,000 | 2,157,859 | Poway Unified School | |||
| Perris Public Financing Auth. | District Public | |||||
| Special Tax Rev., Series | Financing Auth. Rev. , | |||||
| 2004 A, 6.125%, 9/1/34 | 2,995,000 | 2,363,714 | 7.875%, 9/15/39 | 4,000,000 | 4,145,640 | |
| Perris Public Financing | Rancho Cordova Community | |||||
| Auth. Special Tax Rev., | Facilities District No. 2003-1 | |||||
| Series 2008 A, (Community | Special Tax Rev., (Sunridge | |||||
| Facilities District No. | Anatolia), 5.375%, 9/1/37 | 3,000,000 | 2,215,500 | |||
| 2005-4), 6.60%, 9/1/38 | 2,210,000 | 1,817,614 | Rancho Cordova Community | |||
| Perris Public Financing Auth. | Facilities District No. 2003-1 | |||||
| Tax Allocation Rev., | Special Tax Rev., (Sunridge | |||||
| 5.35%, 10/1/36 | 975,000 | 721,305 | Anatolia), 5.50%, 9/1/37 | 2,000,000 | 1,507,520 |
26
California High-Yield Municipal
| Principal | Principal | |||||
| Amount | Value | Amount | Value | |||
| Rancho Cordova Community | Sacramento Airport System | |||||
| Facilities District No. 2004-1 | Rev., Series 2009 D, | |||||
| Special Tax Rev., (Sunridge | (PFC/Grant Revenue | |||||
| Park Area), 6.125%, 9/1/37 | $10,000,000 | $ 7,540,800 | Bonds), 6.00%, 7/1/35(1) | $ 4,000,000 | $ 4,048,800 | |
| Redding California Electric | Sacramento County | |||||
| System Rev., COP, | Community Facilities | |||||
| Series 2008 A, 5.00%, | District No. 1 Special | |||||
| 6/1/30 (FSA)(1) | 2,500,000 | 2,535,200 | Tax Rev., (Elliot Ranch), | |||
| Rialto Community Facilities | 6.30%, 9/1/21 | 1,500,000 | 1,500,690 | |||
| District No. 2006-1 Special | Sacramento Municipal | |||||
| Tax Rev., Series 2006-1, | Utilities District Electric | |||||
| (Elm Park), 5.35%, 9/1/36 | 1,460,000 | 1,002,655 | Rev., Series 1997 K, 5.25%, | |||
| Richmond Joint Powers | 7/1/24 (Ambac)(1) | 4,000,000 | 4,148,240 | |||
| Financing Auth. Lease Rev., | Sacramento Special Tax | |||||
| (Refunding & Civic Center), | Rev., (North Natomas | |||||
| VRDN, 4.125%, 11/25/09 | Community Facilities District | |||||
| (Ambac) (SBBPA: Dexia | No. 1), 6.30%, 9/1/26 | 4,000,000 | 3,548,320 | |||
| Credit Local)(1) | 1,930,000 | 1,930,695 | San Buenaventura City COP, | |||
| Riverside County COP, | (Wastewater Revenue), | |||||
| 5.75%, 11/1/31 (NATL)(1) | 2,365,000 | 2,458,181 | 5.00%, 3/1/29 (NATL)(1) | 1,975,000 | 1,991,610 | |
| Riverside County | San Diego Redevelopment | |||||
| Improvement Bond | Agency Tax Allocation Rev., | |||||
| Act of 1915 Special | Series 2009 A, (North Park | |||||
| Assessment Rev., | Redevelopment Project), | |||||
| (District No. 168-Rivercrest), | 7.00%, 11/1/39(1) | 3,000,000 | 3,079,650 | |||
| 6.70%, 9/2/26 | 1,875,000 | 1,672,069 | San Francisco City and | |||
| Riverside Unified School | County Airports Commission | |||||
| District Special Tax Rev., | Rev., Series 2008 34D, | |||||
| (Community Facilities | (San Francisco International | |||||
| District No. 13, Improvement | Airport), 5.25%, 5/1/26(1) | 3,000,000 | 3,043,590 | |||
| Area 1), 5.375%, 9/1/34 | 2,000,000 | 1,479,560 | San Francisco City and | |||
| Riverside Unified School | County Redevelopment | |||||
| District Special Tax Rev., | Agency Lease Rev., | |||||
| Series 2000 A, (Community | (George R. Moscone), | |||||
| Facilities District No. 7), | 7.05%, 7/1/13(1)(2) | 1,250,000 | 1,096,800 | |||
| 7.00%, 9/1/10, Prerefunded | San Francisco City and | |||||
| at 102% of Par(3) | 4,765,000 | 5,163,545 | County Redevelopment | |||
| Riverside Unified School | Financing Auth. Tax | |||||
| District Special Tax Rev., | Allocation Rev., Series | |||||
| Series 2005 A, (Community | 2009 D, (Mission Bay | |||||
| Facilities District No. 15, | South Redevelopment), | |||||
| Improvement Area 2), | 6.625%, 8/1/39(6) | 2,000,000 | 2,004,880 | |||
| 5.25%, 9/1/30 | 1,000,000 | 766,080 | San Marcos Public | |||
| Rohnert Park Finance Auth. | Facilities Auth. Special | |||||
| Rev., Series 2001 A, | Tax Rev., Series 2004 A, | |||||
| (Las Casitas de Sonoma), | 5.45%, 9/1/24 | 2,790,000 | 2,413,517 | |||
| 6.40%, 4/15/36 | 4,315,000 | 3,736,790 | Santa Barbara County | |||
| Romoland School | Water Rev. COP, 5.50%, | |||||
| District Special Tax Rev., | 9/1/22 (Ambac)(1) | 3,005,000 | 3,081,838 | |||
| (Community Facilities | Santa Cruz County | |||||
| District No. 1, Improvement | Redevelopment Agency | |||||
| Area 1), 5.40%, 9/1/36 | 5,000,000 | 3,494,550 | Tax Allocation Rev., Series | |||
| Roseville Community | 2009 A, (Live Oak/Soquel | |||||
| Facilities District No. 1 | Community Improvement), | |||||
| Special Tax Rev., (The | 7.00%, 9/1/36(1) | 3,000,000 | 3,135,960 | |||
| Fountains), 6.125%, 9/1/38 | 2,600,000 | 2,081,274 |
27
California High-Yield Municipal
| Principal | Principal | |||||
| Amount | Value | Amount | Value | |||
| Shasta Lake Public Finance | Turlock Health Facility COP, | |||||
| Auth. Rev., (Electrical | Series 2007 B, (Emanuel | |||||
| Enterprise), 6.25%, | Medical Center, Inc.), | |||||
| 4/1/13, Prerefunded | 5.50%, 10/15/37(1) | $ 2,000,000 | $ 1,499,380 | |||
| at 102% of Par(1)(3) | $ 7,755,000 | $ 9,232,095 | Tustin Community Facilities | |||
| Soledad Improvement | District No. 06-1 Special Tax | |||||
| Bond Act of 1915 Special | Rev., Series 2007 A, (Tustin | |||||
| Assessment Rev., (Diamond | Legacy/Columbus Villages), | |||||
| Ridge Assessment | 6.00%, 9/1/36 | 5,000,000 | 4,209,900 | |||
| District No. 2002-01), | Tustin Community Facilities | |||||
| 6.75%, 9/2/33 | 2,160,000 | 1,866,694 | District No. 07-1 Special Tax | |||
| Southern California | Rev., (Tustin Legacy/Retail | |||||
| Public Power Auth. Rev., | Center), 6.00%, 9/1/37 | 1,300,000 | 1,177,319 | |||
| (Multi-Projects), 6.75%, | University of California | |||||
| 7/1/10 (FSA-CR)(1) | 500,000 | 525,130 | Rev., Series 2009 O, | |||
| Southern California Public | 5.25%, 5/15/39(1) | 1,300,000 | 1,353,053 | |||
| Power Auth. Rev., (Southern | Val Verde Unified School | |||||
| Transmission), 6.35%, | District Special Tax Rev., | |||||
| 7/1/14 (NATL-IBC)(1)(2) | 2,400,000 | 2,033,304 | (Community Facilities | |||
| Southern California Public | District No. 1, Improvement | |||||
| Power Auth. Rev., (Southern | Area A), 5.40%, 9/1/30 | 2,500,000 | 1,968,325 | |||
| Transmission), 6.35%, | Val Verde Unified School | |||||
| 7/1/15 (NATL-IBC)(1)(2) | 1,250,000 | 1,006,150 | District Special Tax Rev., | |||
| Southern California | (Community Facilities | |||||
| Public Power Auth. Rev., | District No. 1, Improvement | |||||
| Series 2008 A, | Area A), 5.45%, 9/1/36 | 2,600,000 | 1,967,654 | |||
| (Southern Transmission), | Ventura County Community | |||||
| 5.00%, 7/1/22(1) | 5,750,000 | 6,066,710 | College District GO, Series | |||
| Stockton Community | 2008 C, (Election of 2002), | |||||
| Facilities District Special Tax | 5.50%, 8/1/33(1) | 1,600,000 | 1,661,584 | |||
| Rev., (Spanos Park West | Vernon Electric System | |||||
| No. 2001-1), 6.375%, | Rev., Series 2009 A, | |||||
| 9/1/12, Prerefunded at | 5.125%, 8/1/21(1) | 8,000,000 | 8,002,080 | |||
| 102% of Par(1)(3) | 4,195,000 | 4,889,356 | ||||
| West Sacramento | ||||||
| Sunnyvale Community | Community Facilities District | |||||
| Facilities District No. 1 | No. 20 Special Tax Rev., | |||||
| Special Tax Rev., | 5.30%, 9/1/35 | 1,740,000 | 1,217,530 | |||
| 7.75%, 8/1/32 | 6,500,000 | 5,995,600 | Westlands Water District | |||
| Tahoe-Truckee Unified | COP, Series 2005 A, 5.00%, | |||||
| School District GO, Series | 9/1/25 (NATL)(1) | 2,080,000 | 2,092,917 | |||
| 1999 A, (Improvement | ||||||
| District No. 2), 6.19%, | Yosemite Community | |||||
| 8/1/22 (NATL/FGIC)(1)(2) | 2,690,000 | 1,299,620 | College District GO, 4.97%, | |||
| 8/1/20 (FSA)(1)(2) | 6,020,000 | 3,661,484 | ||||
| Tahoe-Truckee Unified | ||||||
| School District GO, Series | Yosemite Community | |||||
| 1999 A, (Improvement | College District GO, | |||||
| District No. 2), 6.19%, | (Election of 2004), 4.33%, | |||||
| 8/1/16 (FSA)(1)(2) | 3,545,000 | 2,772,367 | ||||
| 8/1/23 (NATL/FGIC)(1)(2) | 2,220,000 | 990,098 | ||||
| Tracy Community Facilities | Yuba City Redevelopment | |||||
| District No. 2006-1 Special | Agency Tax Allocation Rev., | |||||
| Tax Rev., (NEI Phase II), | 5.70%, 9/1/24 | 2,270,000 | 1,762,541 | |||
| 5.75%, 9/1/36 | 3,105,000 | 2,230,384 | Yuba City Redevelopment | |||
| Tuolumne Wind Project | Agency Tax Allocation Rev., | |||||
| Auth. Rev., Series 2009 A, | 6.00%, 9/1/31 | 2,000,000 | 1,495,700 | |||
| 5.875%, 1/1/29(1) | 2,000,000 | 2,091,140 |
28
California High-Yield Municipal
| Principal | Principal | |||||
| Amount | Value | Amount | Value | |||
| Yuba City Unified School | Puerto Rico GO, Series | |||||
| District GO, 6.05%, | 2008 A, 6.00%, 7/1/38(1) | $ 1,400,000 | $ 1,394,148 | |||
| 9/1/24 (NATL/FGIC)(1)(2) | $ 2,895,000 | $ 1,196,706 | Puerto Rico Sales Tax | |||
| Yuba City Unified School | Financing Corp. Rev., | |||||
| District GO, 6.05%, | Series 2007 A, VRN, 1.25%, | |||||
| 3/1/25 (NATL/FGIC)(1)(2) | 1,500,000 | 596,385 | 11/2/09, resets quarterly at | |||
| 479,701,492 | 67% of the 3-month LIBOR | |||||
| plus 0.93% with no caps(1) | 10,000,000 | 6,225,000 | ||||
| GUAM — 0.7% | ||||||
| Guam Government GO, | 13,386,012 | |||||
| Series 2009 A, | U.S. VIRGIN ISLANDS — 0.4% | |||||
| 7.00%, 11/15/39(1) | 3,300,000 | 3,327,027 | Virgin Islands Public Finance | |||
| PUERTO RICO — 2.6% | Auth. Rev., Series 2009 A, | |||||
| (Diageo Matching Fund | ||||||
| Puerto Rico Electric Power | Bonds), 6.75%, 10/1/37 | 2,000,000 | 2,041,740 | |||
| Auth. Rev., Series 2007 UU, | ||||||
| VRN, 1.10%, 10/1/09, resets | TOTAL INVESTMENT | |||||
| quarterly at 67% of the | SECURITIES — 98.5% | |||||
| 3-month LIBOR plus 0.70% | (Cost $537,884,835) | 498,456,271 | ||||
| with no caps(1) | 7,800,000 | 4,709,250 | OTHER ASSETS | |||
| Puerto Rico GO, Series | AND LIABILITIES — 1.5% | 7,668,298 | ||||
| 2006 A, (Public | TOTAL NET ASSETS — 100.0% | $506,124,569 | ||||
| Improvement), | ||||||
| 5.25%, 7/1/30(1) | 1,145,000 | 1,057,614 | ||||
| Futures Contracts | |||
| Underlying Face | |||
| Contracts Sold | Expiration Date | Amount at Value | Unrealized Gain (Loss) |
| 110 U.S. Long Bond | December 2009 | $13,172,500 | $(243,451) |
29
| California High-Yield Municipal | |
| Notes to Schedule of Investments | |
| ABAG = Association of Bay Area Governments | |
| AGC = Assured Guaranty Corporation | |
| Ambac = Ambac Assurance Corporation | |
| Ambac-TCRS = Ambac Assurance Corporation — Transferrable Custodial Receipts | |
| COP = Certificates of Participation | |
| FGIC = Financial Guaranty Insurance Company | |
| FSA = Financial Security Assurance, Inc. | |
| FSA-CR = Financial Security Assurance, Inc. — Custodial Receipts | |
| GO = General Obligation | |
| LIBOR = London Interbank Offered Rate | |
| LOC = Letter of Credit | |
| NATL = National Public Finance Guarantee Corporation | |
| NATL-IBC = National Public Finance Guarantee Corporation — Insured Bond Certificates | |
| resets = The frequency with which a security’s coupon changes, based on current market conditions or an underlying index. The more frequently a | |
| security resets, the less risk the investor is taking that the coupon will vary significantly from current market rates. | |
| SBBPA = Standby Bond Purchase Agreement | |
| VRDN = Variable Rate Demand Note. Interest reset date is indicated. Rate shown is effective at the period end. | |
| VRN = Variable Rate Note. Interest reset date is indicated. Rate shown is effective at the period end. | |
| XLCA = XL Capital Ltd. | |
| (1) | Security, or a portion thereof, has been segregated for when-issued securities and/or futures contracts. At the period end, the aggregate value |
| securities pledged was $15,178,000. | |
| (2) | Security is a zero-coupon municipal bond. The rate indicated is the yield to maturity at purchase. Zero-coupon securities are issued at a |
| substantial discount from their value at maturity. | |
| (3) | Escrowed to maturity in U.S. government securities or state and local government securities. |
| (4) | Security was purchased under Rule 144A of the Securities Act of 1933 or is a private placement and, unless registered under the Act or |
| exempted from registration, may only be sold to qualified institutional investors. The aggregate value of these securities at the period end was | |
| $2,969,046, which represented 0.6% of total net assets. | |
| (5) | Convertible capital appreciation bond. These securities are issued with a zero-coupon and become interest bearing at a predetermined rate and |
| date and are issued at a substantial discount from their value at maturity. Interest reset or final maturity date is indicated, as applicable. Rate | |
| shown is effective at the period end. | |
| (6) | When-issued security. |
| See Notes to Financial Statements. | |
| Statement of Assets and Liabilities |
| AUGUST 31, 2009 | ||
| California | California | |
| Long-Term Tax-Free | High-Yield Municipal | |
| Assets | ||
| Investment securities, at value (cost of $405,221,273 and | ||
| $537,884,835, respectively) | $412,051,762 | $498,456,271 |
| Cash | 15,367 | 682,657 |
| Receivable for investments sold | 5,371,238 | 1,052,175 |
| Receivable for capital shares sold | 142,327 | 558,048 |
| Dividends and interest receivable | 5,653,524 | 9,799,232 |
| 423,234,218 | 510,548,383 | |
| Liabilities | ||
| Payable for investments purchased | 340,946 | 2,876,298 |
| Payable for capital shares redeemed | 263,489 | 642,272 |
| Payable for variation margin on futures contracts | 55,125 | 72,188 |
| Accrued management fees | 167,789 | 202,963 |
| Distribution fees payable | 3,886 | 19,829 |
| Service fees (and distribution fees — A Class) payable | 3,197 | 27,743 |
| Dividends payable | 528,431 | 582,521 |
| 1,362,863 | 4,423,814 | |
| Net Assets | $421,871,355 | $506,124,569 |
See Notes to Financial Statements.
31
| AUGUST 31, 2009 | ||
| California | California | |
| Long-Term Tax-Free | High-Yield Municipal | |
| Net Assets Consist of: | ||
| Capital paid in | $425,472,207 | $572,435,442 |
| Undistributed net investment income | 135,560 | 2,283 |
| Accumulated net realized loss on investment transactions | (10,380,993) | (26,641,141) |
| Net unrealized appreciation (depreciation) on investments | 6,644,581 | (39,672,015) |
| $421,871,355 | $506,124,569 | |
| Investor Class | ||
| Net assets | $405,262,526 | $373,312,983 |
| Shares outstanding | 37,980,560 | 42,060,135 |
| Net asset value per share | $10.67 | $8.88 |
| A Class | ||
| Net assets | $10,221,061 | $101,110,734 |
| Shares outstanding | 957,886 | 11,391,872 |
| Net asset value per share | $10.67 | $8.88 |
| Maximum offering price (net asset value divided by 0.955) | $11.17 | $9.30 |
| B Class | ||
| Net assets | $25,831 | $953,909 |
| Shares outstanding | 2,421 | 107,472 |
| Net asset value per share | $10.67 | $8.88 |
| C Class | ||
| Net assets | $6,361,937 | $30,746,943 |
| Shares outstanding | 596,190 | 3,463,715 |
| Net asset value per share | $10.67 | $8.88 |
| See Notes to Financial Statements. | ||
32
| Statement of Operations |
| YEAR ENDED AUGUST 31, 2009 | ||
| California | California | |
| Long-Term Tax-Free | High-Yield Municipal | |
| Investment Income (Loss) | ||
| Income: | ||
| Interest | $ 21,797,803 | $ 30,603,668 |
| Expenses: | ||
| Management fees | 1,953,563 | 2,584,524 |
| Distribution fees: | ||
| B Class | 183 | 7,212 |
| C Class | 25,445 | 238,515 |
| Service fees: | ||
| B Class | 61 | 2,403 |
| C Class | 8,481 | 79,506 |
| Distribution and service fees — A Class | 17,782 | 260,105 |
| Trustees’ fees and expenses | 21,813 | 27,395 |
| Other expenses | 829 | 2,773 |
| 2,028,157 | 3,202,433 | |
| Fees waived | — | (10,025) |
| 2,028,157 | 3,192,408 | |
| Net investment income (loss) | 19,769,646 | 27,411,260 |
| Realized and Unrealized Gain (Loss) | ||
| Net realized gain (loss) on: | ||
| Investment transactions | (10,247,518) | (17,308,936) |
| Futures contract transactions | 2,092,356 | 1,288,054 |
| (8,155,162) | (16,020,882) | |
| Change in net unrealized appreciation (depreciation) on: | ||
| Investments | 666,523 | (30,669,177) |
| Futures contracts | (177,502) | (210,797) |
| 489,021 | (30,879,974) | |
| Net realized and unrealized gain (loss) | (7,666,141) | (46,900,856) |
| Net Increase (Decrease) in Net Assets Resulting from Operations | $12,103,505 | $(19,489,596) |
| See Notes to Financial Statements. | ||
33
| Statement of Changes in Net Assets |
| YEARS ENDED AUGUST 31, 2009 AND AUGUST 31, 2008 | ||||
| California Long-Term Tax-Free | California High-Yield Municipal | |||
| Increase (Decrease) in Net Assets | 2009 | 2008 | 2009 | 2008 |
| Operations | ||||
| Net investment income (loss) | $ 19,769,646 | $ 20,327,948 | $ 27,411,260 | $ 30,092,483 |
| Net realized gain (loss) | (8,155,162) | (2,153,530) | (16,020,882) | (9,163,366) |
| Change in net unrealized | ||||
| appreciation (depreciation) | 489,021 | (4,045,033) | (30,879,974) | (16,577,471) |
| Net increase (decrease) in net assets | ||||
| resulting from operations | 12,103,505 | 14,129,385 | (19,489,596) | 4,351,646 |
| Distributions to Shareholders | ||||
| From net investment income: | ||||
| Investor Class | (19,296,657) | (20,203,854) | (20,387,662) | (22,069,515) |
| A Class | (330,336) | (106,999) | (5,527,472) | (6,447,288) |
| B Class | (951) | (837) | (43,799) | (53,221) |
| C Class | (132,178) | (13,642) | (1,452,024) | (1,522,459) |
| Decrease in net assets from distributions | (19,760,122) | (20,325,332) | (27,410,957) | (30,092,483) |
| Capital Share Transactions | ||||
| Net increase (decrease) in net assets | ||||
| from capital share transactions | (8,879,658) | 2,545,279 | (76,687,910) | (2,915,320) |
| Net increase (decrease) in net assets | (16,536,275) | (3,650,668) | (123,588,463) | (28,656,157) |
| Net Assets | ||||
| Beginning of period | 438,407,630 | 442,058,298 | 629,713,032 | 658,369,189 |
| End of period | $421,871,355 | $438,407,630 | $ 506,124,569 | $629,713,032 |
| Undistributed net investment income | $135,560 | $126,023 | $2,283 | — |
See Notes to Financial Statements.
34
| Notes to Financial Statements |
AUGUST 31, 2009
1. Organization and Summary of Significant Accounting Policies
Organization — American Century California Tax-Free and Municipal Funds (the trust) is registered under the Investment Company Act of 1940 (the 1940 Act) as an open-end management investment company. California Long-Term Tax-Free Fund (Long-Term) and California High-Yield Municipal Fund (High-Yield Municipal) are two funds in a series issued by the trust. Long-Term is diversified under the 1940 Act. High-Yield Municipal is nondiversified under the 1940 Act. Long-Term’s investment objective is to seek safety of principal and high current income that is exempt from federal and California income taxes. Long-Term invests primarily in long-term investment-grade municipal obligations. High-Yield Municipal’s investment objective is to seek high current income that is exempt from federal and California income taxes. High-Yield Municipal pursues this objective by investing a portion of its assets in lower-rated and unrated municipal securities. The following is a summary of the funds’ significant accounting policies.
Multiple Class — The funds are authorized to issue the Investor Class, the A Class, the B Class and the C Class. The A Class may incur an initial sales charge. The A Class, B Class and C Class may be subject to a contingent deferred sales charge. The share classes differ principally in their respective sales charges and distribution and shareholder servicing expenses and arrangements. All shares of each fund represent an equal pro rata interest in the net assets of the class to which such shares belong, and have identical voting, dividend, liquidation and other rights and the same terms and conditions, except for class specific expenses and exclusive rights to vote on matters affecting only individual classes. Income, non-class specific expenses, and realized and unrealized capital gains and losses of the funds are allocated to each class of shares based on their relative net assets.
Security Valuations — Debt securities maturing in greater than 60 days at the time of purchase are valued at current market value as provided by a commercial pricing service or at the mean of the most recent bid and asked prices. Debt securities maturing within 60 days at the time of purchase may be valued at cost, plus or minus any amortized discount or premium. If an event occurs after the value of a security was established but before the net asset value per share was determined that was likely to materially change the net asset value, that security would be valued as determined in accordance with procedures adopted by the Board of Trustees. If the funds determine that the market price of a portfolio security is not readily available, or that the valuation methods mentioned above do not reflect the security’s fair value, such secur ity is valued as determined by the Board of Trustees or its designee, in accordance with procedures adopted by the Board of Trustees, if such determination would materially impact a fund’s net asset value. Certain other circumstances may cause the funds to use alternative procedures to value a security such as: a security has been declared in default; trading in a security has been halted during the trading day; or there is a foreign market holiday and no trading will commence.
Security Transactions — For financial reporting purposes, security transactions are accounted for as of the trade date. Net realized gains and losses are determined on the identified cost basis, which is also used for federal income tax purposes.
Investment Income — Interest income is recorded on the accrual basis and includes accretion of discounts and amortization of premiums.
35
When-Issued — The funds may engage in securities transactions on a when-issued basis. Under these arrangements, the securities’ prices and yields are fixed on the date of the commitment, but payment and delivery are scheduled for a future date. During this period, securities are subject to market fluctuations. The funds will segregate cash, cash equivalents or other appropriate liquid securities on their records in amounts sufficient to meet the purchase price.
Income Tax Status — It is each fund’s policy to distribute substantially all net investment income and net realized gains to shareholders and to otherwise qualify as a regulated investment company under provisions of the Internal Revenue Code. The funds are no longer subject to examination by tax authorities for years prior to 2006. At this time, management believes there are no uncertain tax positions which, based on their technical merit, would not be sustained upon examination and for which it is reasonably possible that the total amounts of unrecognized tax benefits will significantly change in the next twelve months. Accordingly, no provision has been made for federal or state income taxes. Interest and penalties associated with any federal or state income tax obligations, if any, are recorded as interest expense.
Distributions to Shareholders — Distributions from net investment income are declared daily and paid monthly. Distributions from net realized gains, if any, are generally declared and paid annually.
Indemnifications — Under the trust’s organizational documents, its officers and trustees are indemnified against certain liabilities arising out of the performance of their duties to the funds. In addition, in the normal course of business, the funds enter into contracts that provide general indemnifications. The maximum exposure under these arrangements is unknown as this would involve future claims that may be made against a fund. The risk of material loss from such claims is considered by management to be remote.
Use of Estimates — The financial statements are prepared in conformity with accounting principles generally accepted in the United States of America, which may require management to make certain estimates and assumptions at the date of the financial statements. Actual results could differ from these estimates.
Subsequent Events — Management has evaluated events or transactions that may have occurred since August 31, 2009, that would merit recognition or disclosure in the financial statements. This evaluation was completed through October 29, 2009, the date the financial statements were issued
36
2. Fees and Transactions with Related Parties
Management Fees — The trust has entered into a Management Agreement with American Century Investment Management, Inc., (ACIM) (the investment advisor) under which ACIM provides the funds with investment advisory and management services in exchange for a single, unified management fee (the fee) per class. The Agreement provides that all expenses of the funds, except brokerage commissions, taxes, interest, fees and expenses of those trustees who are not considered “interested persons” as defined in the 1940 Act (including counsel fees) and extraordinary expenses, will be paid by ACIM. The fee is computed and accrued daily based on the daily net assets of each specific class of shares of each fund and paid monthly in arrears. The fee consists of (1) an Investment Category Fee based on the daily net assets of the funds and certain ot her accounts managed by the investment advisor that are in the same broad investment category as each fund and (2) a Complex Fee based on the assets of all the funds in the American Century Investments family of funds. The rates for the Investment Category Fee range from 0.1625% to 0.2800% for Long-Term and from 0.1925% to 0.3100% for High-Yield Municipal. The rates for the Complex Fee range from 0.2500% to 0.3100%. Effective August 1, 2009, the investment advisor voluntarily agreed to waive 0.024% of its management fee for High-Yield Municipal. The total amount of the waiver for each class of High-Yield Municipal for the year ended August 31, 2009, was $7,361, $2,029, $19, and $616 for the Investor Class, A Class, B Class, and C Class, respectively. The waiver had no impact on the ratio of operating expenses to average net assets and the ratio of net investment income (loss) to average net assets. The fee waiver may be revised or terminated at any time without notice. The effective annual management fee for each class of Long-Term and High-Yield Municipal for the year ended August 31, 2009 was 0.48% and 0.51%, respectively.
Distribution and Service Fees — The Board of Trustees has adopted a separate Master Distribution and Individual Shareholder Services Plan for each of the A Class, B Class and C Class (collectively, the plans), pursuant to Rule 12b-1 of the 1940 Act. The plans provide that the A Class will pay American Century Investment Services, Inc. (ACIS) an annual distribution and service fee of 0.25%. The plans provide that the B Class and the C Class will each pay ACIS an annual distribution fee of 0.75% and service fee of 0.25%. The fees are computed and accrued daily based on each class’s daily net assets and paid monthly in arrears. The fees are used to pay financial intermediaries for distribution and individual shareholder services. Fees incurred under the plans during the year ended August 31, 2009, are detailed in the Statement of Operati ons.
Related Parties — Certain officers and trustees of the trust are also officers and/or directors of American Century Companies, Inc. (ACC), the parent of the trust’s investment advisor, ACIM, the distributor of the trust, ACIS, and the trust’s transfer agent, American Century Services, LLC.
The funds have a Mutual Funds Services Agreement with J.P. Morgan Investor Services Co. (JPMIS). JPMorgan Chase Bank (JPMCB) is a custodian of the funds. JPMIS and JPMCB are wholly owned subsidiaries of JPMorgan Chase & Co. (JPM). JPM is an equity investor in ACC.
3. Investment Transactions
Investment transactions, excluding short-term investments, for the year ended August 31, 2009 were as follows:
| Long-Term | High-Yield Municipal | |
| Purchases | $143,855,198 | $121,848,889 |
| Sales | $156,222,075 | $161,076,102 |
37
4. Capital Share Transactions
Transactions in shares of the funds were as follows (unlimited number of shares authorized):
| Year ended August 31, 2009 | Year ended August 31, 2008(1) | |||
| Shares | Amount | Shares | Amount | |
| Long-Term | ||||
| Investor Class | ||||
| Sold | 2,458,207 | $ 25,282,715 | 2,284,090 | $ 25,125,048 |
| Issued in reinvestment of distributions | 1,265,165 | 12,986,315 | 1,257,874 | 13,731,585 |
| Redeemed | (5,540,731) | (56,281,428) | (3,991,365) | (43,762,286) |
| (1,817,359) | (18,012,398) | (449,401) | (4,905,653) | |
| A Class | ||||
| Sold | 846,542 | 8,782,757 | 590,594 | 6,431,130 |
| Issued in reinvestment of distributions | 12,798 | 131,710 | 3,974 | 42,989 |
| Redeemed | (470,769) | (4,779,031) | (25,253) | (270,232) |
| 388,571 | 4,135,436 | 569,315 | 6,203,887 | |
| B Class | ||||
| Sold | — | — | 2,253 | 25,003 |
| Issued in reinvestment of distributions | 92 | 951 | 76 | 837 |
| 92 | 951 | 2,329 | 25,840 | |
| C Class | ||||
| Sold | 510,946 | 5,269,768 | 113,252 | 1,239,078 |
| Issued in reinvestment of distributions | 5,017 | 51,988 | 670 | 7,245 |
| Redeemed | (31,374) | (325,403) | (2,321) | (25,118) |
| 484,589 | 4,996,353 | 111,601 | 1,221,205 | |
| Net increase (decrease) | (944,107) | $ (8,879,658) | 233,844 | $ 2,545,279 |
| High-Yield Municipal | ||||
| Investor Class | ||||
| Sold | 7,437,211 | $ 64,350,962 | 11,413,438 | $ 110,295,711 |
| Issued in reinvestment of distributions | 1,793,476 | 15,332,797 | 1,720,436 | 16,589,054 |
| Redeemed | (15,129,688) | (128,314,223) | (12,386,981) | (120,187,199) |
| (5,899,001) | (48,630,464) | 746,893 | 6,697,566 | |
| A Class | ||||
| Sold | 3,254,297 | 27,936,391 | 5,713,242 | 55,497,720 |
| Issued in reinvestment of distributions | 433,732 | 3,707,761 | 439,735 | 4,241,145 |
| Redeemed | (6,342,488) | (53,985,441) | (6,984,393) | (67,914,673) |
| (2,654,459) | (22,341,289) | (831,416) | (8,175,808) | |
| B Class | ||||
| Sold | 10,859 | 93,014 | 3,270 | 32,002 |
| Issued in reinvestment of distributions | 2,220 | 18,975 | 2,513 | 24,262 |
| Redeemed | (32,872) | (281,397) | (25,383) | (244,626) |
| (19,793) | (169,408) | (19,600) | (188,362) | |
| C Class | ||||
| Sold | 525,813 | 4,535,532 | 1,191,026 | 11,499,082 |
| Issued in reinvestment of distributions | 79,549 | 679,723 | 71,098 | 685,480 |
| Redeemed | (1,274,820) | (10,762,004) | (1,383,313) | (13,433,278) |
| (669,458) | (5,546,749) | (121,189) | (1,248,716) | |
| Net increase (decrease) | (9,242,711) | $ (76,687,910) | (225,312) | $ (2,915,320) |
| (1) September 28, 2007 (commencement of sale) through August 31, 2008 for Long-Term’s A Class, B Class, and C Class. | ||||
38
5. Fair Value Measurements
The funds’ securities valuation process is based on several considerations and may use multiple inputs to determine the fair value of the positions held by the funds. In conformity with accounting principles generally accepted in the United States of America, the inputs used to determine a valuation are classified into three broad levels as follows:
| • Level 1 valuation inputs consist of actual quoted prices in an active market for |
| identical securities; |
| • Level 2 valuation inputs consist of significant direct or indirect observable market data |
| (including quoted prices for similar securities, evaluations of subsequent market events, |
| interest rates, prepayment speeds, credit risk, etc.); or |
| • Level 3 valuation inputs consist of significant unobservable inputs (including a fund’s |
| own assumptions). |
The level classification is based on the lowest level input that is significant to the fair valuation measurement. The valuation inputs are not an indication of the risks associated with investing in these securities or other financial instruments.
As of August 31, 2009, the valuation inputs used to determine the fair value of the funds’ municipal securities and unrealized gain (loss) on futures contracts were classified as level 2 and level 1, respectively.
6. Derivative Instruments
Interest Rate Risk — The funds are subject to interest rate risk in the normal course of pursuing their investment objectives. The value of bonds generally declines as interest rates rise. A fund may enter into futures contracts based on a bond index or a specific underlying security. A fund may purchase futures contracts to gain exposure to increases in market value or sell futures contracts to protect against a decline in market value. Upon entering into a futures contract, a fund will segregate cash, cash equivalents or other appropriate liquid securities on its records in amounts sufficient to meet requirements. Subsequent payments (variation margin) are made or received daily, in cash, by a fund. The variation margin is equal to the daily change in the contract value and is recorded as unrealized gains and losses. A fund recognizes a realized gain or loss when the futures contract is closed or expires. Net realized and unrealized gains or losses occurring during the holding period of futures contracts are a component of net realized gain (loss) on futures contract transactions and change in net unrealized appreciation (depreciation) on futures contracts, respectively. One of the risks of entering into futures contracts is the possibility that the change in value of the contract may not correlate with the changes in value of the underlying securities. During the year ended August 31, 2009, the funds purchased and sold futures contracts.
For Long-Term, the value of interest rate risk derivatives as of August 31, 2009, is disclosed on the Statement of Assets and Liabilities as a liability of $55,125 in payable for variation margin on futures contracts. For Long-Term, for the year ended August 31, 2009, the effect of interest rate risk derivatives on the Statement of Operations was $2,092,356 in net realized gain (loss) on futures contract transactions and $(177,502) in change in net unrealized appreciation (depreciation) on futures contracts.
For High-Yield Municipal, the value of interest rate risk derivatives as of August 31, 2009, is disclosed on the Statement of Assets and Liabilities as a liability of $72,188 in payable for variation margin on futures contracts. For High-Yield Municipal, for the year ended August 31, 2009, the effect of interest rate risk derivatives on the Statement of Operations was $1,288,054 in net realized gain (loss) on futures contract transactions and $(210,797) in change in net unrealized appreciation (depreciation) on futures contracts.
The value of derivative instruments at period end and the effect of derivatives on the Statement of Operations is indicative of the funds’ typical volume.
39
7. Bank Line of Credit
The funds, along with certain other funds in the American Century Investments family of funds, had a $500,000,000 unsecured bank line of credit agreement with Bank of America, N.A. The line expired December 10, 2008, and was not renewed. The agreement allowed the funds to borrow money for temporary or emergency purposes to fund shareholder redemptions. Borrowings under the agreement were subject to interest at the Federal Funds rate plus 0.40%. The funds did not borrow from the line during the year ended August 31, 2009.
8. Interfund Lending
The funds, along with certain other funds in the American Century Investments family of funds, may participate in an interfund lending program, pursuant to an Exemptive Order issued by the Securities and Exchange Commission (SEC). This program provides an alternative credit facility allowing the funds to borrow from or lend to other funds in the American Century Investments family of funds that permit such transactions. Interfund lending transactions are subject to each fund’s investment policies and borrowing and lending limits. The interfund loan rate earned/paid on interfund lending transactions is determined daily based on the average of certain current market rates. Interfund lending transactions normally extend only overnight, but can have a maximum duration of seven days. The program is subject to annual approval by the Board of Trustees. During the year ended August 31, 2009, the funds did not utilize the program.
9. Risk Factors
The funds concentrate their investments in a single state and therefore may have more exposure to credit risk related to the state of California than a fund with a broader geographical diversification. Income may be subject to state and local taxes and, if applicable, the alternative minimum tax. High- Yield Municipal invests primarily in lower-rated debt securities, which are subject to substantial risks including price volatility, liquidity risk, and default risk.
10. Federal Tax Information
The tax character of distributions paid during the years ended August 31, 2009 and August 31, 2008 were as follows:
| Long-Term | High-Yield Municipal | |||
| 2009 | 2008 | 2009 | 2008 | |
| Distributions Paid From | ||||
| Exempt income | $19,760,122 | $20,325,332 | $27,410,957 | $30,092,483 |
| Taxable ordinary income | — | — | — | — |
The book-basis character of distributions made during the year from net investment income or net realized gains may differ from their ultimate characterization for federal income tax purposes. These differences reflect the differing character of certain income items and net realized gains and losses for financial statement and tax purposes, and may result in reclassification among certain capital accounts on the financial statements.
40
As of August 31, 2009, the components of distributable earnings on a tax-basis and the
federal tax cost of investments were as follows:
| Long-Term | High-Yield Municipal | |
| Federal tax cost of investments | $406,392,775 | $538,505,707 |
| Gross tax appreciation of investments | $ 18,568,155 | $ 13,900,145 |
| Gross tax depreciation of investments | (12,909,168) | (53,949,581) |
| Net tax appreciation (depreciation) of investments | $ 5,658,987 | $(40,049,436) |
| Undistributed exempt income | $135,560 | $2,283 |
| Accumulated long-term gains | $293,784 | — |
| Accumulated capital losses | — | $(13,700,854) |
| Capital loss deferrals | $(9,689,183) | $(12,562,866) |
The difference between book-basis and tax-basis cost and unrealized appreciation (depreciation) is attributable primarily to the tax deferral of losses on wash sales and to the realization for tax purposes of unrealized gains (losses) for certain futures contracts.
The accumulated capital losses listed above represent net capital loss carryovers that may be used to offset future realized capital gains for federal income tax purposes. Future capital loss carryover utilization in any given year may be subject to Internal Revenue Code limitations. The capital loss carryovers expire as follows:
| 2015 | 2016 | 2017 | |
| High-Yield Municipal | $(1,856,960) | $(59,453) | $(11,784,441) |
The capital loss deferrals listed above represent net capital losses incurred in the ten-month period ended August 31, 2009. The funds have elected to treat such losses as having been incurred in the following fiscal year for federal income tax purposes.
11. Recently Issued Accounting Standards
The Financial Accounting Standards Board (FASB) issued Statement of Financial Accounting Standards No. 157, “Fair Value Measurements” (FAS 157), in September 2006, which is effective for fiscal years beginning after November 15, 2007. FAS 157 defines fair value, establishes a framework for measuring fair value and expands the required financial statement disclosures about fair value measurements. The adoption of FAS 157 did not materially impact the determination of fair value.
In March 2008, the FASB issued Statement of Financial Accounting Standards No. 161, “Disclosures about Derivative Instruments and Hedging Activities — an amendment of FASB Statement No. 133” (FAS 161). FAS 161 is effective for interim periods beginning after November 15, 2008 and has been adopted by the funds. FAS 161 amends and expands disclosures about derivative instruments and hedging activities. FAS 161 requires qualitative disclosures about the objectives and strategies of derivative instruments, quantitative disclosures about the fair value amounts of and gains and losses on derivative instruments, and disclosures of credit-risk-related contingent features in hedging activities.
41
12. Other Tax Information (Unaudited)
The following information is provided pursuant to provisions of the Internal Revenue Code.
The funds hereby designate the following exempt interest distributions, or up to the maximum amount allowable, for the fiscal year ended August 31, 2009.
| Long-Term | High-Yield Municipal | |
| Exempt interest distributions | $19,758,949 | $27,391,616 |
42
| Financial Highlights |
| California Long-Term Tax-Free | |||||
| Investor Class | |||||
| For a Share Outstanding Throughout the Years Ended August 31 | |||||
| 2009 | 2008 | 2007 | 2006 | 2005 | |
| Per-Share Data | |||||
| Net Asset Value, Beginning of Period | $10.83 | $10.98 | $11.36 | $11.78 | $11.69 |
| Income From Investment Operations | |||||
| Net Investment Income (Loss) | 0.50 | 0.51 | 0.51 | 0.51 | 0.52 |
| Net Realized and Unrealized Gain (Loss) | (0.16) | (0.15) | (0.36) | (0.19) | 0.09 |
| Total From Investment Operations | 0.34 | 0.36 | 0.15 | 0.32 | 0.61 |
| Distributions | |||||
| From Net Investment Income | (0.50) | (0.51) | (0.51) | (0.51) | (0.52) |
| From Net Realized Gains | — | — | (0.02) | (0.23) | — |
| Total Distributions | (0.50) | (0.51) | (0.53) | (0.74) | (0.52) |
| Net Asset Value, End of Period | $10.67 | $10.83 | $10.98 | $11.36 | $11.78 |
| Total Return(1) | 3.47% | 3.29% | 1.24% | 2.89% | 5.38% |
| Ratios/Supplemental Data | |||||
| Ratio of Operating Expenses | |||||
| to Average Net Assets | 0.49% | 0.49% | 0.49% | 0.49% | 0.49% |
| Ratio of Net Investment Income (Loss) | |||||
| to Average Net Assets | 4.90% | 4.60% | 4.48% | 4.46% | 4.40% |
| Portfolio Turnover Rate | 36% | 29% | 18% | 33% | 36% |
| Net Assets, End of Period (in thousands) | $405,263 | $431,008 | $442,058 | $446,000 | $475,954 |
| (1) | Total return assumes reinvestment of net investment income and capital gains distributions, if any. The total return of the classes may not |
| precisely reflect the class expense differences because of the impact of calculating the net asset values to two decimal places. If net asset | |
| values were calculated to three decimal places, the total return differences would more closely reflect the class expense differences. The | |
| calculation of net asset values to two decimal places is made in accordance with SEC guidelines and does not result in any gain or loss of value | |
| between one class and another. |
See Notes to Financial Statements.
43
California Long-Term Tax-Free
| A Class | ||
| For a Share Outstanding Throughout the Years Ended August 31 (except as noted) | ||
| 2009 | 2008(1) | |
| Per-Share Data | ||
| Net Asset Value, Beginning of Period | $10.83 | $11.10 |
| Income From Investment Operations | ||
| Net Investment Income (Loss) | 0.48 | 0.44 |
| Net Realized and Unrealized Gain (Loss) | (0.16) | (0.27) |
| Total From Investment Operations | 0.32 | 0.17 |
| Distributions | ||
| From Net Investment Income | (0.48) | (0.44) |
| Net Asset Value, End of Period | $10.67 | $10.83 |
| Total Return(2) | 3.22% | 1.57% |
| Ratios/Supplemental Data | ||
| Ratio of Operating Expenses to Average Net Assets | 0.74% | 0.74%(3) |
| Ratio of Net Investment Income (Loss) to Average Net Assets | 4.65% | 4.41%(3) |
| Portfolio Turnover Rate | 36% | 29%(4) |
| Net Assets, End of Period (in thousands) | $10,221 | $6,166 |
| (1) | September 28, 2007 (commencement of sale) through August 31, 2008. |
| (2) | Total return assumes reinvestment of net investment income and capital gains distributions, if any, and does not reflect applicable sales charges. |
| Total returns for periods less than one year are not annualized. The total return of the classes may not precisely reflect the class expense | |
| differences because of the impact of calculating the net asset values to two decimal places. If net asset values were calculated to three decimal | |
| places, the total return differences would more closely reflect the class expense differences. The calculation of net asset values to two decimal | |
| places is made in accordance with SEC guidelines and does not result in any gain or loss of value between one class and another. | |
| (3) | Annualized. |
| (4) | Portfolio turnover is calculated at the fund level. Percentage indicated was calculated for the year ended August 31, 2008. |
See Notes to Financial Statements.
44
California Long-Term Tax-Free
| B Class | ||
| For a Share Outstanding Throughout the Years Ended August 31 (except as noted) | ||
| 2009 | 2008(1) | |
| Per-Share Data | ||
| Net Asset Value, Beginning of Period | $10.83 | $11.10 |
| Income From Investment Operations | ||
| Net Investment Income (Loss) | 0.40 | 0.36 |
| Net Realized and Unrealized Gain (Loss) | (0.16) | (0.27) |
| Total From Investment Operations | 0.24 | 0.09 |
| Distributions | ||
| From Net Investment Income | (0.40) | (0.36) |
| Net Asset Value, End of Period | $10.67 | $10.83 |
| Total Return(2) | 2.44% | 0.87% |
| Ratios/Supplemental Data | ||
| Ratio of Operating Expenses to Average Net Assets | 1.49% | 1.49%(3) |
| Ratio of Net Investment Income (Loss) to Average Net Assets | 3.90% | 3.64%(3) |
| Portfolio Turnover Rate | 36% | 29%(4) |
| Net Assets, End of Period (in thousands) | $26 | $25 |
| (1) | September 28, 2007 (commencement of sale) through August 31, 2008. |
| (2) | Total return assumes reinvestment of net investment income and capital gains distributions, if any, and does not reflect applicable sales charges. |
| Total returns for periods less than one year are not annualized. The total return of the classes may not precisely reflect the class expense | |
| differences because of the impact of calculating the net asset values to two decimal places. If net asset values were calculated to three decimal | |
| places, the total return differences would more closely reflect the class expense differences. The calculation of net asset values to two decimal | |
| places is made in accordance with SEC guidelines and does not result in any gain or loss of value between one class and another. | |
| (3) | Annualized. |
| (4) | Portfolio turnover is calculated at the fund level. Percentage indicated was calculated for the year ended August 31, 2008. |
See Notes to Financial Statements.
45
California Long-Term Tax-Free
| C Class | ||
| For a Share Outstanding Throughout the Years Ended August 31 (except as noted) | ||
| 2009 | 2008(1) | |
| Per-Share Data | ||
| Net Asset Value, Beginning of Period | $10.83 | $11.10 |
| Income From Investment Operations | ||
| Net Investment Income (Loss) | 0.40 | 0.36 |
| Net Realized and Unrealized Gain (Loss) | (0.16) | (0.27) |
| Total From Investment Operations | 0.24 | 0.09 |
| Distributions | ||
| From Net Investment Income | (0.40) | (0.36) |
| Net Asset Value, End of Period | $10.67 | $10.83 |
| Total Return(2) | 2.45% | 0.87% |
| Ratios/Supplemental Data | ||
| Ratio of Operating Expenses to Average Net Assets | 1.49% | 1.49%(3) |
| Ratio of Net Investment Income (Loss) to Average Net Assets | 3.90% | 3.72%(3) |
| Portfolio Turnover Rate | 36% | 29%(4) |
| Net Assets, End of Period (in thousands) | $6,362 | $1,209 |
| (1) | September 28, 2007 (commencement of sale) through August 31, 2008. |
| (2) | Total return assumes reinvestment of net investment income and capital gains distributions, if any, and does not reflect applicable sales charges. |
| Total returns for periods less than one year are not annualized. The total return of the classes may not precisely reflect the class expense | |
| differences because of the impact of calculating the net asset values to two decimal places. If net asset values were calculated to three decimal | |
| places, the total return differences would more closely reflect the class expense differences. The calculation of net asset values to two decimal | |
| places is made in accordance with SEC guidelines and does not result in any gain or loss of value between one class and another. | |
| (3) | Annualized. |
| (4) | Portfolio turnover is calculated at the fund level. Percentage indicated was calculated for the year ended August 31, 2008. |
See Notes to Financial Statements.
46
California High-Yield Municipal
| Investor Class | |||||
| For a Share Outstanding Throughout the Years Ended August 31 | |||||
| 2009 | 2008 | 2007 | 2006 | 2005 | |
| Per-Share Data | |||||
| Net Asset Value, Beginning of Period | $9.50 | $9.90 | $10.25 | $10.36 | $9.93 |
| Income From Investment Operations | |||||
| Net Investment Income (Loss) | 0.48 | 0.48 | 0.48 | 0.49 | 0.51 |
| Net Realized and Unrealized Gain (Loss) | (0.62) | (0.40) | (0.35) | (0.11) | 0.43 |
| Total From Investment Operations | (0.14) | 0.08 | 0.13 | 0.38 | 0.94 |
| Distributions | |||||
| From Net Investment Income | (0.48) | (0.48) | (0.48) | (0.49) | (0.51) |
| Net Asset Value, End of Period | $8.88 | $9.50 | $9.90 | $10.25 | $10.36 |
| Total Return(1) | (1.16)% | 0.81% | 1.22% | 3.80% | 9.65% |
| Ratios/Supplemental Data | |||||
| Ratio of Operating Expenses | |||||
| to Average Net Assets | 0.52% | 0.52% | 0.52% | 0.52% | 0.52% |
| Ratio of Net Investment Income (Loss) | |||||
| to Average Net Assets | 5.56% | 4.91% | 4.70% | 4.80% | 4.99% |
| Portfolio Turnover Rate | 26% | 31% | 17% | 25% | 13% |
| Net Assets, End of Period (in thousands) | $373,313 | $455,741 | $467,477 | $406,063 | $377,534 |
| (1) | Total return assumes reinvestment of net investment income and capital gains distributions, if any. The total return of the classes may not |
| precisely reflect the class expense differences because of the impact of calculating the net asset values to two decimal places. If net asset | |
| values were calculated to three decimal places, the total return differences would more closely reflect the class expense differences. The | |
| calculation of net asset values to two decimal places is made in accordance with SEC guidelines and does not result in any gain or loss of value | |
| between one class and another. |
See Notes to Financial Statements.
47
California High-Yield Municipal
| A Class | |||||
| For a Share Outstanding Throughout the Years Ended August 31 | |||||
| 2009 | 2008 | 2007 | 2006 | 2005 | |
| Per-Share Data | |||||
| Net Asset Value, Beginning of Period | $9.50 | $9.90 | $10.25 | $10.36 | $9.93 |
| Income From Investment Operations | |||||
| Net Investment Income (Loss) | 0.46 | 0.45 | 0.46 | 0.46 | 0.48 |
| Net Realized and Unrealized Gain (Loss) | (0.62) | (0.40) | (0.35) | (0.11) | 0.43 |
| Total From Investment Operations | (0.16) | 0.05 | 0.11 | 0.35 | 0.91 |
| Distributions | |||||
| From Net Investment Income | (0.46) | (0.45) | (0.46) | (0.46) | (0.48) |
| Net Asset Value, End of Period | $8.88 | $9.50 | $9.90 | $10.25 | $10.36 |
| Total Return(1) | (1.41)% | 0.55% | 0.97% | 3.54% | 9.38% |
| Ratios/Supplemental Data | |||||
| Ratio of Operating Expenses | |||||
| to Average Net Assets | 0.77% | 0.77% | 0.77% | 0.77% | 0.77% |
| Ratio of Net Investment Income (Loss) | |||||
| to Average Net Assets | 5.31% | 4.66% | 4.45% | 4.55% | 4.74% |
| Portfolio Turnover Rate | 26% | 31% | 17% | 25% | 13% |
| Net Assets, End of Period (in thousands) | $101,111 | $133,480 | $147,314 | $90,421 | $39,608 |
| (1) | Total return assumes reinvestment of net investment income and capital gains distributions, if any, and does not reflect applicable sales charges. |
| The total return of the classes may not precisely reflect the class expense differences because of the impact of calculating the net asset values | |
| to two decimal places. If net asset values were calculated to three decimal places, the total return differences would more closely reflect the | |
| class expense differences. The calculation of net asset values to two decimal places is made in accordance with SEC guidelines and does not | |
| result in any gain or loss of value between one class and another. |
See Notes to Financial Statements.
48
California High-Yield Municipal
| B Class | |||||
| For a Share Outstanding Throughout the Years Ended August 31 | |||||
| 2009 | 2008 | 2007 | 2006 | 2005 | |
| Per-Share Data | |||||
| Net Asset Value, Beginning of Period | $9.50 | $9.90 | $10.25 | $10.36 | $9.93 |
| Income From Investment Operations | |||||
| Net Investment Income (Loss) | 0.39 | 0.38 | 0.38 | 0.39 | 0.40 |
| Net Realized and Unrealized Gain (Loss) | (0.62) | (0.40) | (0.35) | (0.11) | 0.43 |
| Total From Investment Operations | (0.23) | (0.02) | 0.03 | 0.28 | 0.83 |
| Distributions | |||||
| From Net Investment Income | (0.39) | (0.38) | (0.38) | (0.39) | (0.40) |
| Net Asset Value, End of Period | $8.88 | $9.50 | $9.90 | $10.25 | $10.36 |
| Total Return(1) | (2.14)% | (0.20)% | 0.22% | 2.77% | 8.57% |
| Ratios/Supplemental Data | |||||
| Ratio of Operating Expenses | |||||
| to Average Net Assets | 1.52% | 1.52% | 1.52% | 1.52% | 1.52% |
| Ratio of Net Investment Income (Loss) | |||||
| to Average Net Assets | 4.56% | 3.91% | 3.70% | 3.80% | 3.99% |
| Portfolio Turnover Rate | 26% | 31% | 17% | 25% | 13% |
| Net Assets, End of Period (in thousands) | $954 | $1,209 | $1,454 | $1,263 | $1,158 |
| (1) | Total return assumes reinvestment of net investment income and capital gains distributions, if any, and does not reflect applicable sales charges. |
| The total return of the classes may not precisely reflect the class expense differences because of the impact of calculating the net asset values | |
| to two decimal places. If net asset values were calculated to three decimal places, the total return differences would more closely reflect the | |
| class expense differences. The calculation of net asset values to two decimal places is made in accordance with SEC guidelines and does not | |
| result in any gain or loss of value between one class and another. |
See Notes to Financial Statements.
49
California High-Yield Municipal
| C Class | |||||
| For a Share Outstanding Throughout the Years Ended August 31 | |||||
| 2009 | 2008 | 2007 | 2006 | 2005 | |
| Per-Share Data | |||||
| Net Asset Value, Beginning of Period | $9.50 | $9.90 | $10.25 | $10.36 | $9.93 |
| Income From Investment Operations | |||||
| Net Investment Income (Loss) | 0.39 | 0.38 | 0.38 | 0.39 | 0.40 |
| Net Realized and Unrealized Gain (Loss) | (0.62) | (0.40) | (0.35) | (0.11) | 0.43 |
| Total From Investment Operations | (0.23) | (0.02) | 0.03 | 0.28 | 0.83 |
| Distributions | |||||
| From Net Investment Income | (0.39) | (0.38) | (0.38) | (0.39) | (0.40) |
| Net Asset Value, End of Period | $8.88 | $9.50 | $9.90 | $10.25 | $10.36 |
| Total Return(1) | (2.14)% | (0.20)% | 0.22% | 2.76% | 8.56% |
| Ratios/Supplemental Data | |||||
| Ratio of Operating Expenses | |||||
| to Average Net Assets | 1.52% | 1.52% | 1.52% | 1.52% | 1.52% |
| Ratio of Net Investment Income (Loss) | |||||
| to Average Net Assets | 4.56% | 3.91% | 3.70% | 3.80% | 3.99% |
| Portfolio Turnover Rate | 26% | 31% | 17% | 25% | 13% |
| Net Assets, End of Period (in thousands) | $30,747 | $39,283 | $42,125 | $31,276 | $17,499 |
| (1) | Total return assumes reinvestment of net investment income and capital gains distributions, if any, and does not reflect applicable sales charges. |
| The total return of the classes may not precisely reflect the class expense differences because of the impact of calculating the net asset values | |
| to two decimal places. If net asset values were calculated to three decimal places, the total return differences would more closely reflect the | |
| class expense differences. The calculation of net asset values to two decimal places is made in accordance with SEC guidelines and does not | |
| result in any gain or loss of value between one class and another. |
See Notes to Financial Statements.
50
| Report of Independent Registered Public Accounting Firm |
To the Trustees of the American Century California Tax-Free and Municipal Funds and Shareholders of the California Long-Term Tax-Free Fund and the California High-Yield Municipal Fund:
In our opinion, the accompanying statements of assets and liabilities, including the schedules of investments, and the related statements of operations and of changes in net assets and the financial highlights present fairly, in all material respects, the financial position of the California Long-Term Tax-Free Fund and the California High-Yield Municipal Fund (two of the four funds in the American Century California Tax-Free and Municipal Funds, hereafter referred to as the “Funds”) at August 31, 2009, the results of each of their operations for the year then ended, the changes in each of their net assets for each of the two years in the period then ended and the financial highlights for each of the periods presented, in conformity with accounting principles generally accepted in the United States of America. These financial statements and financial highlights (hereafter referred to as “financial statements” ) are the responsibility of the Funds’ management; our responsibility is to express an opinion on these financial statements based on our audits. We conducted our audits of these financial statements in accordance with the standards of the Public Company Accounting Oversight Board (United States). Those standards require that we plan and perform the audit to obtain reasonable assurance about whether the financial statements are free of material misstatement. An audit includes examining, on a test basis, evidence supporting the amounts and disclosures in the financial statements, assessing the accounting principles used and significant estimates made by management, and evaluating the overall financial statement presentation. We believe that our audits, which included confirmation of securities at August 31, 2009 by correspondence with the custodian and brokers, provide a reasonable basis for our opinion.
PricewaterhouseCoopers LLP
Kansas City, Missouri
October 29, 2009
51
| Management |
The individuals listed below serve as trustees or officers of the funds. Each trustee serves until his or her successor is duly elected and qualified or until he or she retires. Effective March 2004, mandatory retirement age for independent trustees is 73. However, the mandatory retirement age may be extended for a period not to exceed two years with the approval of the remaining independent trustees. Those listed as interested trustees are “interested” primarily by virtue of their engagement as directors and/ or officers of, or ownership interest in, American Century Companies, Inc. (ACC) or its wholly owned, direct or indirect, subsidiaries, including the fund’s investment advisor, American Century Investment Management, Inc. (ACIM or the advisor); the fund’s principal underwriter, American Century Investment Services, Inc. (ACIS); and the fund’s transfer agent, American Century Services, LLC (ACS).
The other trustees (more than three-fourths of the total number) are independent; that is, they have never been employees, directors or officers of, and have no financial interest in, ACC or any of its wholly owned, direct or indirect, subsidiaries, including ACIM, ACIS and ACS. The trustees serve in this capacity for eight registered investment companies in the American Century Investments family of funds.
All persons named as officers of the funds also serve in similar capacities for the other 14 registered investment companies in the American Century Investments family of funds advised by ACIM or American Century Global Investment Management, Inc. (ACGIM), a wholly owned subsidiary of ACIM, unless otherwise noted. Only officers with policy-making functions are listed. No officer is compensated for his or her service as an officer of the funds. The listed officers are interested persons of the funds and are appointed or re-appointed on an annual basis.
Interested Trustee
Jonathan S. Thomas, 4500 Main Street, Kansas City, MO 64111
Year of Birth: 1963
Position(s) Held with Funds: Trustee (since 2007) and President (since 2007)
Principal Occupation(s) During Past 5 Years: President and Chief Executive Officer, ACC
(March 2007 to present); Chief Administrative Officer, ACC (February 2006 to
February 2007); Executive Vice President, ACC (November 2005 to February 2007).
Also serves as: President, Chief Executive Officer and Director, ACS; Executive
Vice President, ACIM and ACGIM; Director, ACIM, ACGIM, ACIS and other ACC
subsidiaries. Managing Director, Morgan Stanley (March 2000 to November 2005)
Number of Portfolios in Fund Complex Overseen by Trustee: 103
Other Directorships Held by Trustee: None
52
Independent Trustees
John Freidenrich, 1665 Charleston Road, Mountain View, CA 94043
Year of Birth: 1937
Position(s) Held with Funds: Trustee (since 2005)
Principal Occupation(s) During Past 5 Years: Member and Manager, Regis Management
Company, LLC (money management firm) (April 2004 to present); Partner and
Founder, Bay Partners (venture capital firm) (1976 to 2006)
Number of Portfolios in Fund Complex Overseen by Trustee: 40
Other Directorships Held by Trustee: None
Ronald J. Gilson, 1665 Charleston Road, Mountain View, CA 94043
Year of Birth: 1946
Position(s) Held with Funds: Trustee (since 1995) and Chairman of the Board (since 2005)
Principal Occupation(s) During Past 5 Years: Charles J. Meyers Professor of Law and Business,
Stanford Law School (1979 to present); Marc and Eva Stern Professor of Law and
Business, Columbia University School of Law (1992 to present)
Number of Portfolios in Fund Complex Overseen by Trustee: 40
Other Directorships Held by Trustee: None
Frederick L.A. Grauer, 1665 Charleston Road, Mountain View, CA 94043
Year of Birth: 1946
Position(s) Held with Funds: Trustee (since 2008)
Principal Occupation(s) During Past 5 Years: Senior Advisor, Barclays Global Investors
(asset manager) (2003 to present)
Number of Portfolios in Fund Complex Overseen by Trustee: 40
Other Directorships Held by Trustee: None
Peter F. Pervere, 1665 Charleston Road, Mountain View, CA 94043
Year of Birth: 1947
Position(s) Held with Funds: Trustee (since 2007)
Principal Occupation(s) During Past 5 Years: Retired, formerly Vice President and Chief
Financial Officer, Commerce One, Inc. (software and services provider)
Number of Portfolios in Fund Complex Overseen by Trustee: 40
Other Directorships Held by Trustee: None
Myron S. Scholes, 1665 Charleston Road, Mountain View, CA 94043
Year of Birth: 1941
Position(s) Held with Funds: Trustee (since 1980)
Principal Occupation(s) During Past 5 Years: Chairman, Platinum Grove Asset Management,
L.P. (asset manager) (1999 to present); Frank E. Buck Professor of Finance-Emeritus,
Stanford Graduate School of Business (1996 to present)
Number of Portfolios in Fund Complex Overseen by Trustee: 40
Other Directorships Held by Trustee: Dimensional Fund Advisors
John B. Shoven, 1665 Charleston Road, Mountain View, CA 94043
Year of Birth: 1947
Position(s) Held with Funds: Trustee (since 2002)
Principal Occupation(s) During Past 5 Years: Professor of Economics, Stanford University
(1973 to present)
Number of Portfolios in Fund Complex Overseen by Trustee: 40
Other Directorships Held by Trustee: Cadence Design Systems; E×ponent
53
Jeanne D. Wohlers, 1665 Charleston Road, Mountain View, CA 94043
Year of Birth: 1945
Position(s) Held with Funds: Trustee (since 1984)
Principal Occupation(s) During Past 5 Years: Retired
Number of Portfolios in Fund Complex Overseen by Trustee: 40
Other Directorships Held by Trustee: None
Officers
Barry Fink, 4500 Main Street, Kansas City, MO 64111
Year of Birth: 1955
Position(s) Held with Funds: Executive Vice President (since 2007)
Principal Occupation(s) During Past 5 Years: Chief Operating Officer and Executive Vice
President, ACC (September 2007 to present); President, ACS (October 2007 to
present); Managing Director, Morgan Stanley (2000 to 2007); Global General
Counsel, Morgan Stanley (2000 to 2006). Also serves as: Director, ACC, ACS, ACIS
and other ACC subsidiaries
Maryanne Roepke, 4500 Main Street, Kansas City, MO 64111
Year of Birth: 1956
Position(s) Held with Funds: Chief Compliance Officer (since 2006) and Senior Vice
President (since 2000)
Principal Occupation(s) During Past 5 Years: Chief Compliance Officer, ACIM, ACGIM and ACS
(August 2006 to present); Assistant Treasurer, ACC (January 1995 to August 2006); and
Treasurer and Chief Financial Officer, various American Century Investments funds
(July 2000 to August 2006). Also serves as: Senior Vice President, ACS
Charles A. Etherington, 4500 Main Street, Kansas City, MO 64111
Year of Birth: 1957
Position(s) Held with Funds: General Counsel (since 2007) and Senior Vice President
(since 2006)
Principal Occupation(s) During Past 5 Years: Attorney, ACC (February 1994 to present); Vice
President, ACC (November 2005 to present); General Counsel, ACC (March 2007
to present). Also serves as: General Counsel, ACIM, ACGIM, ACS, ACIS and other
ACC subsidiaries; and Senior Vice President, ACIM, ACGIM and ACS
Robert Leach, 4500 Main Street, Kansas City, MO 64111
Year of Birth: 1966
Position(s) Held with Funds: Vice President, Treasurer and Chief Financial Officer
(all since 2006)
Principal Occupation(s) During Past 5 Years: Vice President, ACS (February 2000 to present);
and Controller, various American Century Investments funds (1997 to September 2006)
David H. Reinmiller, 4500 Main Street, Kansas City, MO 64111
Year of Birth: 1963
Position(s) Held with Funds: Vice President (since September 2001)
Principal Occupation(s) During Past 5 Years: Attorney, ACC (January 1994 to present);
Associate General Counsel, ACC (January 2001 to present); Chief Compliance
Officer, American Century Investments funds, ACIM and ACGIM (January 2001 to
February 2005). Also serves as: Associate General Counsel, ACIM, ACGIM, ACS,
ACIS and other ACC subsidiaries; and Vice President, ACIM, ACGIM and ACS
Ward Stauffer, 4500 Main Street, Kansas City, MO 64111
Year of Birth: 1960
Position(s) Held with Funds: Secretary (since March 2005)
Principal Occupation(s) During Past 5 Years: Attorney, ACC (June 2003 to present)
The SAI has additional information about the funds’ trustees and is available without charge, upon request, by calling 1-800-345-2021.
54
| Approval of Management Agreements |
Under Section 15(c) of the Investment Company Act, contracts for investment advisory services to a mutual fund are required to be reviewed, evaluated and approved each year by the fund’s board of directors/ trustees, including a majority of a fund’s independent directors/trustees (the “Directors”). At American Century Investments, this process is referred to as the “15(c) Process.” The board oversees on a continuous basis and evaluates at its quarterly meetings, directly and through the committees of the board, the nature and quality of significant services provided by the advisor, the investment performance of the funds, shareholder services, audit and compliance functions and a variety of other matters relating to fund operations. Each year, it also holds a special meeting in connection with determining whether to renew the contracts for advisory services, to review fund performance, shareholder services, adviser profitability, audit and compliance matters, and other fund operational matters.
Under a Securities and Exchange Commission rule, each fund is required to disclose in its annual or semiannual report, as appropriate, the material factors and conclusions that formed the basis for the board’s approval or renewal of any advisory agreements within the fund’s most recently completed fiscal half-year period.
Annual Contract Review Process
As part of the annual 15(c) Process, the Directors requested and reviewed extensive data and information compiled by the advisor and certain independent providers of evaluative data (the “15(c) Providers”) concerning California High-Yield Municipal Fund and California Long-Term Tax-Free Fund (the “funds”) and the services provided to the funds under the management agreement. The information considered and the discussions held at the meetings included, but were not limited to:
• the nature, extent and quality of investment management, shareholder services and other services that the advisor provides to the funds;
• the wide range of programs and services the advisor provides to the funds and their shareholders on a routine and non-routine basis;
• the compliance policies, procedures, and regulatory experience of the advisor;
• data comparing the cost of owning each fund to the cost of owning a similar fund;
• data comparing each fund’s performance to appropriate benchmarks and/or a peer group of other mutual funds with similar investment objectives and strategies;
• financial data showing the profitability of each fund to the advisor and the overall profitability of the advisor;
• data comparing services provided and charges to other non-fund invest-ment management clients of the advisor; and
55
• collateral or “fall-out” benefits derived by the advisor from the manage-ment of the funds, and potential sharing of economies of scale in connection with the management of the funds.
In keeping with its practice, the Directors at a special meeting and at a regu larly scheduled quarterly meeting reviewed and discussed the information provided by the advisor throughout the year and to negotiate with the advisor the renewal of the management agreement, including the setting of the applicable management fee. The Directors had the benefit of the advice of their independent counsel throughout the period.
Factors Considered
The Directors considered all of the information provided by the advisor, independent data providers, and the board’s independent counsel, and evaluated such information for each fund the board oversees. The Directors did not identify any single factor as being all-important or controlling, and each Director may have attributed different levels of importance to different factors. In deciding to renew each fund’s management agreement under the terms ultimately determined by the board to be appropriate, the Directors based their decision on a number of factors, including the following.
Nature, Extent and Quality of Services — Generally. Under the management agreement, the advisor is responsible for providing or arranging for all services necessary for the operation of the funds. The board noted that under the management agreement, the advisor provides or arranges at its own expense a wide variety of services including:
| • fund construction and design |
| • initial capitalization/funding |
| • portfolio research and security selection |
| • securities trading |
| • fund administration |
| • custody of fund assets |
| • daily valuation of fund portfolios |
| • shareholder servicing and transfer agency, including shareholder confir- |
| mations, recordkeeping and communications |
| • legal services |
| • regulatory and portfolio compliance |
| • financial reporting |
| • marketing and distribution |
56
The Directors noted that many of these services have expanded over time both in terms of quantity and complexity in response to shareholder demands, competition in the industry, changing distribution channels and the changing regulatory environment. In performing their evaluation, the Directors considered information received in connection with the annual review, as well as information provided on an ongoing basis throughout the year and at their regularly scheduled board and committee meetings.
Investment Management Services. The nature of the investment management services provided is quite complex and allows fund shareholders access to professional money management, instant diversification of their investments within an asset class, the opportunity to easily diversify among asset classes, and liquidity. In evaluating investment performance, the board expects the advisor to manage each fund in accordance with its investment objectives and approved strategies. In providing these services, the advisor utilizes teams of investment professionals (portfolio managers, analysts, research assistants, and securities traders) who require extensive information technology, research, training, compliance and other systems to conduct their business. At each quarterly meeting and at the special meeting to consider renewal of the management agr eement, the Directors, directly and through its Portfolio Committee, review investment performance information for each fund, together with comparative information for appropriate benchmarks and/or peer groups of similarly-managed funds, over different time horizons. If performance concerns are identified, the underperforming fund receives special reviews until performance improves, during which Directors discuss with the advisor the reasons for such underperformance (e.g., market conditions, security and sector selection) and any efforts being undertaken to improve performance. California Long-Term Tax-Free’s performance was above the median for its peer group for the one- and three-year periods. California High-Yield Municipal’s quarter end performance fell below the median for its peer group for both the one- and three-year periods during the past year. The board discussed the fund’s performance with the advisor and was satisfied with the efforts being undertaken by the advisor. The board w ill continue to monitor these efforts and the performance of the fund.
Shareholder and Other Services. The advisor provides the funds with a comprehensive package of transfer agency, shareholder, and other services. The Directors, directly and through the various Committees of the Board, review reports and evaluations of such services at their regular quarterly meetings and at their special meeting to consider renewal of the management agreement, including the annual meeting concerning contract review, and other reports to the board. These reports include, but are not limited to, information regarding the operational efficiency and accuracy of the shareholder and transfer agency services provided, staffing levels, shareholder satisfaction (as measured by external as well as internal sources), technology support, new products and services offered to fund shareholders, securities trading activities, portfolio v aluation services, auditing services, and legal and operational compliance activities. Certain aspects of shareholder and transfer agency service level efficiency and the quality of securities trading activities are measured by independent third party providers and are presented in comparison to other fund groups not managed by the advisor.
57
Costs of Services Provided and Profitability. The advisor provides detailed information concerning its cost of providing various services to the funds, its profitability in managing each fund, its overall profitability, and its financial condition. The Directors have reviewed with the advisor the methodology used to prepare this financial information. The Directors have also reviewed with the advisor its methodology for compensating the investment professionals that provide services to the funds. This financial information regarding the advisor is considered in order to evaluate the advisor’s financial condition, its ability to continue to provide services under the management agreement, and the reasonableness of the current management fee.
Ethics. The Directors generally consider the advisor’s commitment to providing quality services to shareholders and to conducting its business ethically. They noted that the advisor’s practices generally meet or exceed industry best practices.
Economies of Scale. The Directors review information provided by the advisor regarding the existence of economies of scale in connection with the investment management of the funds. The Directors concluded that economies of scale are difficult to measure and predict with precision, especially on a fund-by-fund basis. The analysis of economies of scale is further complicated by the additional services and content provided by the advisor and its reinvestment in its ability to provide and expand those services. Accordingly, the Directors seek to evaluate economies of scale by reviewing information, such as year-over-year profitability of the advisor generally, the profitability of its management of each fund specifically, and the expenses incurred by the advisor in providing various functions to the funds. The Directors believe the advisor is appropriately sharing economies of scale through its competitive fee structure, fee breakpoints as the fund complex and the fund increase in size, and through reinvestment in its business to provide shareholders additional services and enhancements to existing services. In particular, separate breakpoint schedules based on the size of the entire fund complex and on the size of each fund reflect the complexity of assessing economies of scale.
Comparison to Other Funds’ Fees. Each fund pays the advisor a single, all-inclusive (or unified) management fee for providing all services necessary for the management and operation of the fund, other than brokerage expenses, taxes, interest, extraordinary expenses, and the fees and expenses of the fund’s independent directors (including their independent legal counsel). Under the unified fee structure, the advisor is responsible for providing all investment advisory, custody, audit, administrative, compliance, recordkeeping, marketing and shareholder services, or arranging and supervising third parties to provide such services. By contrast, most other funds are charged a variety of fees, including an investment advisory fee, a transfer agency fee, an administrative fee, distribution charges and other expenses. Other than their i nvestment advisory fees and Rule 12b-1 distribution fees, the components of the total fees charged by these other funds may be increased without shareholder approval. The board believes the unified fee structure is a benefit to fund shareholders because it clearly discloses to shareholders the cost of owning fund shares, and, since the unified fee cannot be increased without a vote of fund shareholders, it shifts to the advisor the risk of increased costs of operating the fund and provides a direct incentive to minimize administrative inefficiencies. Part of the
58
Directors’ analysis of fee levels involves reviewing certain evaluative data compiled by an independent provider and comparing the fund’s unified fee to the total expense ratio of other funds in the fund’s peer group. The Directors also reviewed updated fee level data provided by the advisor, but recognized that comparative data was particularly difficult to evaluate given the significant market developments during the past year impacting fund assets. The unified fee charged to shareholders of California Long-Term Tax Free was in the lowest quartile of the total expense ratios of its peer group. The unified fee charged to shareholders of California High-Yield Municipal was below the median of the total expense ratios of its peer group.
Comparison to Fees and Services Provided to Other Clients of the Advisor. The Directors also requested and received information from the advisor concerning the nature and extent of the services, fees, and profitability of its advisory services to advisory clients other than the funds. They observed that these varying types of client accounts require different services and involve different regulatory and entrepreneurial risks than the management of the funds. The Directors analyzed this information and concluded that the fees charged and services provided to the funds were reasonable by comparison.
Collateral or “Fall-Out” Benefits Derived by the Advisor. The Directors considered the existence of collateral benefits the advisor may receive as a result of its relationship with the funds. They concluded that the advisor’s primary business is managing mutual funds and it generally does not use fund or shareholder information to generate profits in other lines of business, and therefore does not derive any significant collateral benefits from them. The Directors noted that the advisor receives proprietary research from broker-dealers that execute fund portfolio transactions but concluded that this research is likely to benefit fund shareholders. The Directors also determined that the advisor is able to provide investment management services to certain clients other than the funds, at least in part, due to its existing infr astructure built to serve the fund complex. The Directors concluded, however, that the assets of those other clients are not material to the analysis and, in any event, are included with the assets of each fund to determine breakpoints in the fund’s fee schedule, provided they are managed using the same investment team and strategy.
Conclusions of the Directors
As a result of this process, the Directors, in the absence of particular circumstances and assisted by the advice of their independent legal counsel, taking into account all of the factors discussed above and the information provided by the advisor and others, concluded that the investment management agreement between each fund and the advisor, including the management fee, is fair and reasonable in light of the services provided and should be renewed for a one-year term. In addition, the Directors negotiated a one-year waiver by the advisor of a portion of the management fee for California High-Yield Municipal. These changes were proposed by the Directors based on their review of the percentile rank of the fund’s fees within the fund’s peer universe and the fact that the Directors seek, as a general rule, to have total expense ratios of existing fixed income and money market funds in the lowest quartile of the fee s of comparable funds. The fee waiver, effective August 1, 2009, will result in a lowering of the management fee of the fund from 52% to 50%.
59
| Additional Information |
Proxy Voting Guidelines
American Century Investment Management, Inc., the funds’ investment advisor, is responsible for exercising the voting rights associated with the securities purchased and/or held by the funds. A description of the policies and procedures the advisor uses in fulfilling this responsibility is available without charge, upon request, by calling 1-800-345-2021. It is also available on American Century Investments’ website at americancentury.com and on the Securities and Exchange Commission’s website at sec.gov. Information regarding how the investment advisor voted proxies relating to portfolio securities during the most recent 12-month period ended June 30 is available on the “About Us” page at americancentury.com. It is also available at sec.gov.
Quarterly Portfolio Disclosure
The funds file their complete schedule of portfolio holdings with the Securities and Exchange Commission (SEC) for the first and third quarters of each fiscal year on Form N-Q. The funds’ Forms N-Q are available on the SEC’s website at sec.gov, and may be reviewed and copied at the SEC’s Public Reference Room in Washington, DC. Information on the operation of the Public Reference Room may be obtained by calling 1-800-SEC-0330. The funds also make their complete schedule of portfolio holdings for the most recent quarter of their fiscal year available on their website at americancentury.com and, upon request, by calling 1-800-345-2021.
60
| Index Definitions |
The following indices are used to illustrate investment market, sector, or style performance or to serve as fund performance comparisons. They are not investment products available for purchase.
The Barclays Capital 3-Year Municipal Bond Index is composed of those securities included in the Barclays Capital Municipal Bond Index that are investment-grade and have maturities between two and four years.
The Barclays Capital 5-Year General Obligation (GO) Bond Index is composed of investment-grade U.S. municipal securities, with maturities of four to six years, that are general obligations of a state or local government.
The Barclays Capital California Tax-Exempt Bond Index is composed of those securities included in the Barclays Capital Municipal Bond Index that are investment-grade and are issued in California.
The Barclays Capital Long-Term Municipal Bond Index is composed of those securities included in the Barclays Capital Municipal Bond Index that have maturities greater than 22 years.
The Barclays Capital Municipal Bond Index is a market value-weighted index designed for the long-term tax-exempt bond market.
The Barclays Capital Non-Investment-Grade Municipal Bond Index is composed of non-investment grade U.S. municipal securities with a remaining maturity of one year or more.
The Barclays Capital U.S. Aggregate Index represents securities that are taxable, registered with the Securities and Exchange Commission, and U.S. dollar-denominated. The index covers the U.S. investment-grade fixed-rate bond market, with index components for government and corporate securities, mortgage pass-through securities, and asset-backed securities.
The Barclays Capital U.S. Treasury Index is composed of those securities included in the Barclays Capital U.S. Aggregate Index that are public obligations of the U.S. Treasury with a remaining maturity of one year or more.
61
| Notes |
62
| Notes |
63
| Notes |
64

| Contact Us | |
| americancentury.com | |
| Automated Information Line | 1-800-345-8765 |
| Investor Services Representative | 1-800-345-2021 or |
| 816-531-5575 | |
| Investors Using Advisors | 1-800-378-9878 |
| Business, Not-For-Profit, Employer-Sponsored | |
| Retirement Plans | 1-800-345-3533 |
| Banks and Trust Companies, Broker-Dealers, | |
| Financial Professionals, Insurance Companies | 1-800-345-6488 |
| Telecommunications Device for the Deaf | 1-800-634-4113 |
| American Century California Tax-Free and Municipal Funds | |
| Investment Advisor: | |
| American Century Investment Management, Inc. | |
| Kansas City, Missouri | |
This report and the statements it contains are submitted for the general
information of our shareholders. The report is not authorized for distribution to
prospective investors unless preceded or accompanied by an effective prospectus.
American Century Investment Services, Inc., Distributor
©2009 American Century Proprietary Holdings, Inc. All rights reserved.
0910
CL-ANN-66475N
| Annual Report |
| August 31, 2009 |
![]()
| American Century Investments |
California Tax-Free Money Market Fund
California Tax-Free Bond Fund
| President’s Letter |
Dear Investor:
Thank you for investing with us during the 12 months ended August 31, 2009. We appreciate your trust in American Century Investments® during this remarkable period.
During the first half of the fiscal year, historic levels of stress, instability, and intervention governed global financial results as the subprime-initiated credit and financial crises and resulting global recession froze the capital markets, triggering a flight to safety.
The second half had a much different tone. Optimism and risk appetites returned as U.S. economic growth projections for coming quarters turned positive. As we passed the second anniversary of the subprime mortgage meltdown and the first anniversary of Lehman Brothers’ landmark collapse, the worst of the economic and financial market obstacles appeared to be behind us.
We believe, however, that careful security selection and risk management remain important. We’re not out of the economic woods yet, not with rising mortgage and corporate default rates, mounting job losses, relatively tight credit conditions, and more debt reduction than spending by consumers and businesses.
Effective risk management requires a commitment to disciplined investment approaches that balance risk and reward, with the goal of setting and maintaining risk levels that are appropriate for portfolio objectives. At American Century Investments, we’ve stayed true to the principles that have guided us for over 50 years, including our commitment to delivering superior investment performance and helping investors reach their financial goals. Managing risk is part of that commitment—we offer portfolios that can help diversify and stabilize investment returns.
The U.S. economy and financial markets have come a long way in the past 12 months, but the coming year will likely present additional challenges. Given that outlook, I’m pleased to share with you my strong belief that we have the proper investment teams and processes in place to provide competitive and compelling long-term results for you. Thank you for your continued confidence in us.
Sincerely,

Jonathan S. Thomas
President and Chief Executive Officer
American Century Investments
| Table of Contents |
| Market Perspective | 2 |
| U.S. Fixed-Income Total Returns | 2 |
| California Tax-Free Money Market Fund | |
| Performance | 3 |
| Yields | 4 |
| Portfolio Composition by Credit Rating | 4 |
| Portfolio Composition by Maturity | 4 |
| California Tax-Free Bond Fund | |
| Performance | 5 |
| Portfolio Commentary | 7 |
| Portfolio at a Glance | 9 |
| Yields | 9 |
| Top Five Sectors | 9 |
| Portfolio Composition by Credit Rating | 9 |
| Shareholder Fee Examples | 10 |
| Financial Statements | |
| Schedule of Investments | 12 |
| Statement of Assets and Liabilities | 28 |
| Statement of Operations | 29 |
| Statement of Changes in Net Assets | 30 |
| Notes to Financial Statements | 31 |
| Financial Highlights | 38 |
| Report of Independent Registered Public Accounting Firm | 40 |
| Other Information | |
| Management | 41 |
| Approval of Management Agreements | 44 |
| Additional Information | 49 |
| Index Definitions | 50 |
The opinions expressed in the Market Perspective and the Portfolio Commentary reflect those of the portfolio management team as of the date of the report, and do not necessarily represent the opinions of American Century Investments or any other person in the American Century Investments organization. Any such opinions are subject to change at any time based upon market or other conditions and American Century Investments disclaims any responsibility to update such opinions. These opinions may not be relied upon as investment advice and, because investment decisions made by American Century Investments funds are based on numerous factors, may not be relied upon as an indication of trading intent on behalf of any American Century Investments fund. Security examples are used for representational purposes only and are not intended as recommendations to purchase or sell securities. Performance information for comparative i ndices and securities is provided to American Century Investments by third party vendors. To the best of American Century Investments’ knowledge, such information is accurate at the time of printing.
| Market Perspective |

By David MacEwen, Chief Investment Officer, Fixed Income
Municipals Tumbled then Rallied
In the first half of the 12-month period ended August 31, 2009, widespread credit and liquidity problems, along with unprecedented failures and takeovers of several major financial institutions, plagued the financial markets. Despite massive U.S. government intervention in the financial system and a record-low federal funds target rate of nearly 0%, credit remained scarce and economic activity dropped sharply.
Investors shunned all but the highest-quality securities. Demand for U.S. Treasuries skyrocketed, pushing Treasury prices higher and yields to record lows in December. Meanwhile, selling of municipal bonds by hedge funds, combined with the collapse of several national bond insurers and mounting budget crises in many states, contributed to historic volatility and under-performance for municipals.
This unrest pushed municipal bond yields to record levels relative to Treasuries, which helped spark a municipal rally in 2009. High-quality municipals finished the 12-month period with solid gains, while high-yield securities were unable to fully recover from the sell-off among riskier assets. Although high-yield municipals performed well during the rally, they did not generate sufficient gains to offset their earlier losses.
California Municipals Lagged on State’s Fiscal Woes
California municipal bonds generally lagged their national counterparts during the reporting period. Sinking tax revenues and the state’s budget nightmare stifled investor demand. Furthermore, the state’s credit rating was downgraded to various degrees by all three major ratings agencies. Late in the period, the government closed its $26.3 billion fiscal 2010 budget shortfall with massive spending cuts, borrowing, and the issuance of IOUs.
Despite this challenging climate, we believe California will not default on its general obligation (GO) debt. California’s Constitution mandates payment, and the state has only moderate debt levels compared with its general fund revenues.
Overall, our outlook remains positive. The California municipal market is diverse and still offers attractive opportunities among high-quality local-government GO, essential-service revenue, health care, higher education and airport bonds. More so than the state, local governments built up reserves during the “good years” to provide a cushion during these lean times.
| U.S. Fixed-Income Total Returns | |||||
| For the 12 months ended August 31, 2009 | |||||
| Barclays Capital Municipal Market Indices | Barclays Capital Taxable Market Indices | ||||
| Municipal Bond | 5.67% | U.S. Aggregate Index | 7.94% | ||
| California Tax-Exempt Bond | 4.16% | U.S. Treasury Index | 6.09% | ||
| 3-Year Municipal Bond | 5.57% | ||||
| 5-Year General Obligation (GO) Bond | 6.94% | ||||
| Long-Term Municipal Bond | 3.34% | ||||
| Non-Investment-Grade Municipal Bond | -9.19% | ||||
2
| Performance |
| California Tax-Free Money Market | |||||
| Total Returns as of August 31, 2009 | |||||
| Average Annual Returns | |||||
| Since | Inception | ||||
| 1 year | 5 years | 10 years | Inception | Date | |
| California Tax-Free Money Market | 0.77%(1) | 2.11%(1) | 1.90% | 3.02% | 11/9/83 |
| Lipper California Tax-Exempt | |||||
| Money Market Funds | |||||
| Average Returns(2) | 0.66% | 1.96% | 1.77% | 3.12%(3) | — |
| Fund’s Lipper Ranking as of 8/31/09(2) | 21 of 72 | 16 of 59 | 9 of 40 | 2 of 2(3) | — |
| Fund’s Lipper Ranking as of 9/30/09(2) | 25 of 73 | 16 of 59 | 9 of 41 | 2 of 2(3) | — |
| (1) | Fund returns would have been lower if American Century Investments had not voluntarily waived a portion of its management fees. |
| (2) | Data provided by Lipper Inc. — A Reuters Company. © 2009 Reuters. All rights reserved. Any copying, republication or redistribution of Lipper |
| content, including by caching, framing or similar means, is expressly prohibited without the prior written consent of Lipper. Lipper shall not be | |
| liable for any errors or delays in the content, or for any actions taken in reliance thereon. | |
| Lipper Fund Performance — Performance data is total return, and is preliminary and subject to revision. | |
| Lipper Rankings — Rankings are based only on the universe shown and are based on average annual total returns. This listing might not | |
| represent the complete universe of funds tracked by Lipper. | |
| The data contained herein has been obtained from company reports, financial reporting services, periodicals and other resources believed to be | |
| reliable. Although carefully verified, data on compilations is not guaranteed by Lipper and may be incomplete. No offer or solicitations to buy or | |
| sell any of the securities herein is being made by Lipper. | |
| (3) | Since 11/30/83, the date nearest the fund’s inception for which data are available. |
| Total Annual Fund Operating Expenses | ||
| California Tax-Free Money Market | 0.50% | |
The total annual fund operating expenses shown is as stated in the fund’s prospectus current as of the date of this report. The prospectus may vary from the expense ratio shown elsewhere in this report because it is based on a different time period, includes acquired fund fees and expenses, and, if applicable, does not include fee waivers or expense reimbursements.
Data presented reflect past performance. Past performance is no guarantee of future results. Current performance may be higher or lower than the performance shown. To obtain performance data current to the most recent month end, please call 1-800-345-2021 or visit americancentury.com. Investment income may be subject to certain state and local taxes and, depending on your tax status, the federal alternative minimum tax (AMT). Capital gains are not exempt from state and federal income tax.
An investment in the fund is not insured or guaranteed by the Federal Deposit Insurance Corporation or any other government agency. Although the fund seeks to preserve the value of your investment at $1.00 per share, it is possible to lose money by investing in the fund.
The 7-day current yield more closely reflects the current earnings of the fund than the total return.
3
| California Tax-Free Money Market | |
| Yields as of August 31, 2009 | |
| 7-Day Current Yield | |
| After waiver(1) | 0.01% |
| Before waiver | -0.08% |
| 7-Day Effective Yield(1) | |
| 0.01% | |
| 7-Day Tax-Equivalent Current Yields(1)(2) | |
| 31.98% Tax Bracket | 0.01% |
| 34.70% Tax Bracket | 0.02% |
| 39.23% Tax Bracket | 0.02% |
| 41.05% Tax Bracket | 0.02% |
| (1) | Yields would have been lower if a portion of fees had not been waived. |
| (2) | The tax brackets indicated are for combined state and federal income tax. Actual tax-equivalent yields may be lower, if alternative minimum tax |
| is applicable. |
| Portfolio Composition by Credit Rating | ||
| % of fund investments | % of fund investments | |
| as of 8/31/09 | as of 2/28/09 | |
| A-1+ | 77% | 100% |
| A-1 | 23% | — |
Ratings provided by independent research companies. These ratings are listed in Standard & Poor’s format even if they were provided by other
sources. The letter ratings indicate the credit worthiness of the underlying bonds in the portfolio and generally range from AAA (highest) to D (lowest).
| Portfolio Composition by Maturity | ||
| % of fund investments | % of fund investments | |
| as of 8/31/09 | as of 2/28/09 | |
| 1-30 days | 86% | 80% |
| 31-90 days | — | — |
| 91-180 days | 1% | 15% |
| More than 180 days | 13% | 5% |
Data presented reflect past performance. Past performance is no guarantee of future results. Current performance may be higher or lower than the performance shown. To obtain performance data current to the most recent month end, please call 1-800-345-2021 or visit americancentury.com. Investment income may be subject to certain state and local taxes and, depending on your tax status, the federal alternative minimum tax (AMT). Capital gains are not exempt from state and federal income tax.
An investment in the fund is not insured or guaranteed by the Federal Deposit Insurance Corporation or any other government agency. Although the fund seeks to preserve the value of your investment at $1.00 per share, it is possible to lose money by investing in the fund.
The 7-day current yield more closely reflects the current earnings of the fund than the total return.
4
| Performance |
California Tax-Free Bond
| Total Returns as of August 31, 2009 | |||||
| Average Annual Returns | |||||
| Since | Inception | ||||
| 1 year | 5 years | 10 years | Inception | Date | |
| California Tax-Free Bond | 4.32% | 3.33% | 4.43% | 5.72% | 11/9/83 |
| Barclays Capital 5-Year | |||||
| GO Bond Index(1) | 6.94% | 4.32% | 5.05% | 6.41%(2) | — |
| Lipper California Intermediate | |||||
| Municipal Debt Funds | |||||
| Average Returns(3) | 3.00% | 2.74% | 4.24% | 5.73%(4) | — |
| Fund’s Lipper Ranking as of 8/31/09(3) | 12 of 41 | 7 of 38 | 5 of 19 | 1 of 1(4) | — |
| Fund’s Lipper Ranking as of 9/30/09(3) | 14 of 41 | 5 of 38 | 5 of 19 | 1 of 1(4) | — |
| (1) | Formerly Lehman Brothers 5-Year GO Index. |
| (2) | Since 10/31/83, the date nearest the fund’s inception for which data are available. |
| (3) | Data provided by Lipper Inc. — A Reuters Company. © 2009 Reuters. All rights reserved. Any copying, republication or redistribution of Lipper |
| content, including by caching, framing or similar means, is expressly prohibited without the prior written consent of Lipper. Lipper shall not be | |
| liable for any errors or delays in the content, or for any actions taken in reliance thereon. | |
| Lipper Fund Performance — Performance data is total return, and is preliminary and subject to revision. | |
| Lipper Rankings — Rankings are based only on the universe shown and are based on average annual total returns. This listing might not | |
| represent the complete universe of funds tracked by Lipper. | |
| The data contained herein has been obtained from company reports, financial reporting services, periodicals and other resources believed to be | |
| reliable. Although carefully verified, data on compilations is not guaranteed by Lipper and may be incomplete. No offer or solicitations to buy or | |
| sell any of the securities herein is being made by Lipper. | |
| (4) | Since 11/10/83, the date nearest the fund’s inception for which data are available. |
Data presented reflect past performance. Past performance is no guarantee of future results. Current performance may be higher or lower than the performance shown. Investment return and principal value will fluctuate, and redemption value may be more or less than original cost. To obtain performance data current to the most recent month end, please call 1-800-345-2021 or visit americancentury.com. As interest rates rise, bond values will decline. Investment income may be subject to certain state and local taxes and, depending on your tax status, the federal alternative minimum tax (AMT). Capital gains are not exempt from state and federal income tax.
Data assumes reinvestment of dividends and capital gains, and none of the charts reflect the deduction of taxes that a shareholder would pay on fund distributions or the redemption of fund shares. Returns for the index are provided for comparison. The fund’s total returns include operating expenses (such as transaction costs and management fees) that reduce returns, while the total returns of the index do not.
5
California Tax-Free Bond
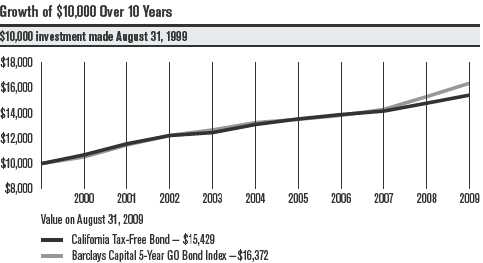
| One-Year Returns Over 10 Years | ||||||||||
| Periods ended August 31 | ||||||||||
| 2000 | 2001 | 2002 | 2003 | 2004 | 2005 | 2006 | 2007 | 2008 | 2009 | |
| California | ||||||||||
| Tax-Free Bond | 6.95% | 8.22% | 5.63% | 1.91% | 5.13% | 3.36% | 2.58% | 1.98% | 4.42% | 4.32% |
| Barclays Capital | ||||||||||
| 5-Year GO | ||||||||||
| Bond Index | 5.33% | 8.99% | 6.56% | 3.57% | 4.58% | 1.96% | 2.32% | 3.44% | 7.07% | 6.94% |
| Total Annual Fund Operating Expenses | |
| California Tax-Free Bond | 0.49% |
The total annual fund operating expenses shown is as stated in the fund’s prospectus current as of the date of this report. The prospectus may vary from the expense ratio shown elsewhere in this report because it is based on a different time period, includes acquired fund fees and expenses, and, if applicable, does not include fee waivers or expense reimbursements.
Data presented reflect past performance. Past performance is no guarantee of future results. Current performance may be higher or lower than the performance shown. Investment return and principal value will fluctuate, and redemption value may be more or less than original cost. To obtain performance data current to the most recent month end, please call 1-800-345-2021 or visit americancentury.com. As interest rates rise, bond values will decline. Investment income may be subject to certain state and local taxes and, depending on your tax status, the federal alternative minimum tax (AMT). Capital gains are not exempt from state and federal income tax.
Data assumes reinvestment of dividends and capital gains, and none of the charts reflect the deduction of taxes that a shareholder would pay on fund distributions or the redemption of fund shares. Returns for the index are provided for comparison. The fund’s total returns include operating expenses (such as transaction costs and management fees) that reduce returns, while the total returns of the index do not.
6
| Portfolio Commentary |
California Tax-Free Bond
Portfolio Managers: Alan Kruss, Joseph Gotelli, and Steven Permut
Performance Summary
California Tax-Free Bond returned 4.32% for the 12 months ended August 31, 2009. By comparison, the Barclays Capital 5-Year General Obligation (GO) Bond Index returned 6.94%. For the same period, the California Intermediate Municipal Debt Funds tracked by Lipper had an average return of 3.00%. See page 5 for additional performance comparisons.
The fiscal year covered a remarkable period that included the worst of the economic downturn, a steep decline and subsequent rebound in financial markets, and California’s ongoing budget crisis (see the Market Perspective on page 2). In that environment, the fund enjoyed a positive absolute return and outperformed its Lipper peer group average. Relative to the Barclays Index, the fund and Lipper group average lagged because California debt trailed the national average and because intermediate-term GO bonds made up one of the best-performing segments of the municipal market for the 12 months.
We believe the portfolio’s outperformance of its peer group amid the market volatility and for the five- and 10-year periods ended in August highlight the advantages of our consistent, measured approach—we use careful credit analysis to build positions with what we believe to have attractive risk/reward characteristics.
GO Allocation Contributed
A key contribution to the portfolio’s return relative to the Lipper group average came from our exposure to California GOs. We believe we were underweight these securities relative to our peers early in the fiscal year, when they were under pressure due to the budget stalemate in Sacramento. We began to add GOs in early 2009, when their yield and total return potential reached what we considered very attractive levels compared with the actual risks inherent in these bonds. As a result, we believe we held an overweight position later in the fiscal year when GOs outperformed.
Among other sector trades, we continued to hold a number of less economically sensitive revenue bonds, in areas ranging from health care and higher education to water/sewer and electric utilities.
Credit Exposure Helped
Adding GO bonds meant the portfolio’s exposure to A-rated debt increased. This was indicative of a broader trend in the portfolio, as we bought a number of select, lower-rated bonds in recent months that we felt offered compelling risk/reward trade-offs. This positioning aided performance—it helped to favor higher-quality securities in 2008, while it was beneficial to hold more lower-rated bonds in 2009.
7
California Tax-Free Bond
Other Contributors
The portfolio also enjoyed a positive contribution to return from a trade using long-term municipal bonds and 30-year Treasury futures designed to capitalize on the changing yield relationship between municipals and Treasuries. We implemented the trade when long-term municipal yields exceeded those on like-maturity Treasuries, a condition caused by the extreme market conditions of late 2008. The trade was based on the expectation that the yield difference between the two would move toward their normal historical relationship—with municipals yielding less than Treasuries—which they did.
Holding more long-term municipal bonds also meant the portfolio had a slightly long duration (greater price sensitivity to interest rate changes). That helped performance as investors began to move out the maturity spectrum in search of additional yield later in the reporting period.
Outlook
“We remain very positive on the municipal market,” said Steven Permut, leader of the municipal bond team at American Century Investments. “Municipal bond prices are being supported by record demand and a relative lack of supply—two factors we don’t see changing in the near term. Having said that, economic fundamentals remain poor, and we think tax-based bonds and those issued by local governments are likely to face challenges. In addition, California’s complicated budget situation brings additional “headline risk” and the possibility of further credit rating downgrades. These factors could result in significant price volatility for the state’s bonds. We think these conditions put a premium on careful credit analysis and individual security selection—what we believe are two strengths of our management approach.”
8
| California Tax-Free Bond | ||
| Portfolio at a Glance | ||
| As of | As of | |
| 8/31/09 | 8/31/08 | |
| Weighted Average Maturity | 10.3 years | 9.1 years |
| Average Duration (Modified) | 5.2 years | 5.1 years |
| Yields as of August 31, 2009 | ||
| 30-Day SEC Yield | ||
| 3.25% | ||
| 30-Day Tax-Equivalent Yields* | ||
| 31.98% Tax Bracket | 4.78% | |
| 34.70% Tax Bracket | 4.98% | |
| 39.23% Tax Bracket | 5.35% | |
| 41.05% Tax Bracket | 5.51% | |
*The tax brackets indicated are for combined state and federal income tax. Actual tax-equivalent yields may be lower, if alternative minimum tax
is applicable.
| Top Five Sectors as of August 31, 2009 | ||
| % of fund investments | ||
| General Obligation (GO) | 23% | |
| Prerefunded | 15% | |
| Electric Revenue | 14% | |
| Hospital Revenue | 10% | |
| Certificates of Participation (COPs)/Leases | 8% | |
| Portfolio Composition by Credit Rating | ||
| % of fund investments | % of fund investments | |
| as of 8/31/09 | as of 2/28/09 | |
| AAA | 35% | 33% |
| AA | 24% | 34% |
| A | 29% | 19% |
| BBB | 12% | 10% |
| Not Rated | — | 4% |
Ratings provided by independent research companies. These ratings are listed in Standard & Poor’s format even if they were provided by other sources.
The letter ratings indicate the credit worthiness of the underlying bonds in the portfolio and generally range from AAA (highest) to D (lowest).
9
| Shareholder Fee Examples (Unaudited) |
Fund shareholders may incur two types of costs: (1) transaction costs, including sales charges (loads) on purchase payments and redemption/ exchange fees; and (2) ongoing costs, including management fees; distribution and service (12b-1) fees; and other fund expenses. This example is intended to help you understand your ongoing costs (in dollars) of investing in your fund and to compare these costs with the ongoing cost of investing in other mutual funds.
The example is based on an investment of $1,000 made at the beginning of the period and held for the entire period from March 1, 2009 to August 31, 2009.
Actual Expenses
The table provides information about actual account values and actual expenses for each class. You may use the information, together with the amount you invested, to estimate the expenses that you paid over the period. First, identify the share class you own. Then simply divide your account value by $1,000 (for example, an $8,600 account value divided by $1,000 = 8.6), then multiply the result by the number under the heading “Expenses Paid During Period” to estimate the expenses you paid on your account during this period.
If you hold Investor Class shares of any American Century Investments fund, or Institutional Class shares of the American Century Diversified Bond Fund, in an American Century Investments account (i.e., not a financial intermediary or retirement plan account), American Century Investments may charge you a $12.50 semiannual account maintenance fee if the value of those shares is less than $10,000. We will redeem shares automatically in one of your accounts to pay the $12.50 fee. In determining your total eligible investment amount, we will include your investments in all personal accounts (including American Century Investments Brokerage accounts) registered under your Social Security number. Personal accounts include individual accounts, joint accounts, UGMA/UTMA accounts, personal trusts, Coverdell Education Savings Accounts and IRAs (including traditional, Roth, Rollover, SEP-, SARSEP- and SIMPLE-IRAs), and certain other retirement accounts. If you have only business, business retirement, employer-sponsored or American Century Investments Brokerage accounts, you are currently not subject to this fee. We will not charge the fee as long as you choose to manage your accounts exclusively online. If you are subject to the Account Maintenance Fee, your account value could be reduced by the fee amount.
Hypothetical Example for Comparison Purposes
The table also provides information about hypothetical account values and hypothetical expenses based on the actual expense ratio of each class of your fund and an assumed rate of return of 5% per year before expenses, which is not the actual return of a fund’s share class. The hypothetical account values and expenses may not be used to estimate the actual ending account balance or expenses you paid for the period. You may use this information to compare the ongoing costs of investing in your fund and other funds. To do so, compare this 5% hypothetical example with the 5% hypothetical examples that appear in the shareholder reports of the other funds.
10
Please note that the expenses shown in the table are meant to highlight your ongoing costs only and do not reflect any transactional costs, such as sales charges (loads) or redemption/exchange fees. Therefore, the table is useful in comparing ongoing costs only, and will not help you determine the relative total costs of owning different funds. In addition, if these transactional costs were included, your costs would have been higher.
| Beginning | Ending | Expenses Paid | ||
| Account Value | Account Value | During Period(1) | Annualized | |
| 3/1/09 | 8/31/09 | 3/1/09 - 8/31/09 | Expense Ratio(1) | |
| California Tax-Free Money Market | ||||
| Actual (after waiver)(2) | $1,000 | $1,000.90 | $2.47 | 0.49% |
| Actual (before waiver) | $1,000 | $1,000.90(3) | $2.77 | 0.55% |
| Hypothetical | $1,000 | $1,022.74 | $2.50 | 0.49% |
| (after waiver)(2) | ||||
| Hypothetical | $1,000 | $1,022.43 | $2.80 | 0.55% |
| (before waiver) | ||||
| California Tax-Free Bond | ||||
| Actual | $1,000 | $1,039.50 | $2.52 | 0.49% |
| Hypothetical | $1,000 | $1,022.74 | $2.50 | 0.49% |
| (1) | Expenses are equal to the fund’s annualized expense ratio listed in the table above, multiplied by the average account value over the period, |
| multiplied by 184, the number of days in the most recent fiscal half-year, divided by 365, to reflect the one-half year period. | |
| (2) | During the six months ended August 31, 2009, the investment advisor waived a portion of the fund’s management fee. |
| (3) | Ending account value assumes the return earned after waiver. The return would have been lower had fees not been waived and would have |
| resulted in a lower ending account value. |
11
| Schedule of Investments |
California Tax-Free Money Market
| AUGUST 31, 2009 | ||||||
| Principal | Principal | |||||
| Amount | Value | Amount | Value | |||
| Municipal Securities — 98.6% | Apple Valley COP, (Public | |||||
| Facilities Financing), VRDN, | ||||||
| CALIFORNIA — 98.6% | 0.35%, 9/3/09 (LOC: Union | |||||
| ABAG Finance Auth. for | Bank of California N.A. | |||||
| Nonprofit Corps. Multifamily | and California State | |||||
| Housing Rev., Series 2002 | Teacher’s Retirement) | $ 3,445,000 | $ 3,445,000 | |||
| A, (The Arbors Apartments), | Austin Trust Various States | |||||
| VRDN, 0.30%, 9/2/09 | GO, Series 2008-1154, | |||||
| (FNMA) (LIQ FAC: FNMA) | $ 2,000,000 | $ 2,000,000 | VRDN, 0.49%, 9/3/09 (FSA) | |||
| ABAG Finance Auth. for | (LIQ FAC: Bank of | |||||
| Nonprofit Corps. Rev., (899 | America N.A.)(1) | 5,315,000 | 5,315,000 | |||
| Charleston LLC), VRDN, | Austin Trust Various States | |||||
| 0.20%, 9/1/09 (LOC: | GO, Series 2008-3016X, | |||||
| LaSalle Bank N.A.) | 3,000,000 | 3,000,000 | VRDN, 0.49%, 9/3/09 (FSA) | |||
| ABAG Finance Auth. for | (LIQ FAC: Bank of | |||||
| Nonprofit Corps. Rev., | America N.A.)(1) | 7,180,000 | 7,180,000 | |||
| (Katherine Delmar Burke | Austin Trust Various States | |||||
| School), VRDN, 0.55%, | GO, Series 2008-3019X, | |||||
| 9/3/09 (LOC: Allied Irish | VRDN, 0.49%, 9/3/09 (FSA) | |||||
| Bank plc) | 1,050,000 | 1,050,000 | (LIQ FAC: Bank of | |||
| ABAG Finance Auth. for | America N.A.)(1) | 6,500,000 | 6,500,000 | |||
| Nonprofit Corps. Rev., Series | Austin Trust Various States | |||||
| 2005 A, (San Francisco | GO, Series 2008-3020X, | |||||
| University), VRDN, 0.55%, | VRDN, 0.49%, 9/3/09 | |||||
| 9/3/09 (LOC: Allied Irish | (FSA) (LIQ FAC: Bank of | |||||
| Bank plc) | 1,150,000 | 1,150,000 | America N.A.)(1) | 5,750,000 | 5,750,000 | |
| ABAG Finance Auth. for | Austin Trust Various States | |||||
| Nonprofit Corps. Rev., Series | GO, Series 2008-3044X, | |||||
| 2006 A, (La Jolla Country | VRDN, 0.49%, 9/3/09 (FSA) | |||||
| Day School), VRDN, 0.55%, | (LIQ FAC: Bank of | |||||
| 9/3/09 (LOC: Allied Irish | America N.A.)(1) | 6,665,000 | 6,665,000 | |||
| Bank plc) | 1,090,000 | 1,090,000 | Austin Trust Various States | |||
| Alameda Public Financing | GO, Series 2008-3318, | |||||
| Auth. Multifamily Housing | VRDN, 0.54%, 9/3/09 | |||||
| Rev., Series 2005 A, (Eagle | (AGC) (LIQ FAC: Bank of | |||||
| Village/Parrot Village | America N.A.)(1) | 1,500,000 | 1,500,000 | |||
| Apartments), VRDN, | Barstow Multifamily | |||||
| 0.26%, 9/3/09 (FNMA) | Housing Rev., (Desert Vista | |||||
| (LIQ FAC: FNMA) | 4,065,000 | 4,065,000 | Apartments), VRDN, 0.25%, | |||
| Alameda-Contra Costa | 9/2/09 (LOC: Redlands | |||||
| Schools Financing Auth. | Federal Bank and FHLB) | 2,400,000 | 2,400,000 | |||
| COP, Series 2003 L, (Capital | Butte County Housing Auth. | |||||
| Improvement Financing), | Multi-Family Rev., (Pine Tree | |||||
| VRDN, 0.25%, 9/3/09 (LOC: | Apartments), VRDN, 0.48%, | |||||
| Scotia Bank) | 1,845,000 | 1,845,000 | 9/2/09 (LOC: Wells Fargo | |||
| Anaheim Union High School | Bank N.A.) | 452,000 | 452,000 | |||
| District COP, (School Facility | California Enterprise | |||||
| Bridge Funding), VRDN, | Development Auth. Rev., | |||||
| 0.50%, 9/3/09 (FSA) | (Community Hospice, Inc.), | |||||
| (SBBPA: Wachovia | VRDN, 0.35%, 9/3/09 (LOC: | |||||
| Bank N.A.) | 3,060,000 | 3,060,000 | Bank of Stockton and Bank | |||
| of New York) | 4,835,000 | 4,835,000 | ||||
12
California Tax-Free Money Market
| Principal | Principal | |||||
| Amount | Value | Amount | Value | |||
| California Enterprise | California Municipal Finance | |||||
| Development Auth. Rev., | Auth. Rev., (Saint Andrew’s | |||||
| (Humane Society Silicon | Parish), VRDN, 0.55%, | |||||
| Valley), VRDN, 0.40%, | 9/3/09 (LOC: Allied Irish | |||||
| 9/3/09 (LOC: First Republic | Bank plc) | $ 1,300,000 | $ 1,300,000 | |||
| Bank and U.S. Bank N.A.) | $ 8,000,000 | $ 8,000,000 | California Municipal Finance | |||
| California GO, Series 2003 | Auth. Rev., (San Francisco | |||||
| B45, (MERLOTs), VRDN, | Planning), VRDN, 0.20%, | |||||
| 0.47%, 9/2/09 (SBBPA: | 9/3/09 (LOC: Pacific Capital | |||||
| Wachovia Bank N.A.)(1) | 3,000,000 | 3,000,000 | Bank N.A. and FHLB) | 3,435,000 | 3,435,000 | |
| California GO, Series 2003 | California Municipal Finance | |||||
| C2, VRDN, 0.23%, 9/3/09 | Auth. Rev., Series 2008 | |||||
| (LOC: Landesbank Hessen- | A, (Central Coast YMCA), | |||||
| Thuringen Girozentrale, | VRDN, 0.30%, 9/3/09 (LOC: | |||||
| Bank of America N.A. and | Pacific Capital Bank N.A. | |||||
| Bank of Nova Scotia) | 4,000,000 | 4,000,000 | and FHLB) | 2,750,000 | 2,750,000 | |
| California GO, Series 2006- | California School Cash | |||||
| 1255, (PUTTERs), VRDN, | Reserve Program Auth. | |||||
| 0.42%, 9/3/09 (BHAC- | Rev., Series 2009-10 A, | |||||
| CR/Ambac) (LIQ FAC: | 2.50%, 7/1/10 | 10,000,000 | 10,156,718 | |||
| JPMorgan Chase | California State Department | |||||
| Bank N.A.)(1) | 2,750,000 | 2,750,000 | of Water Resources Power | |||
| California GO, Series 2007- | Supply Rev., Series 2002 A, | |||||
| 1932, (PUTTERs), VRDN, | 5.50%, 5/1/10 | 2,095,000 | 2,157,724 | |||
| 0.84%, 9/3/09 (FSA) (LIQ | California State Department | |||||
| FAC: JPMorgan Chase | of Water Resources Power | |||||
| Bank N.A.)(1) | 4,995,000 | 4,995,000 | Supply Rev., Series 2005 G3, | |||
| California Health Facilities | VRDN, 0.55%, 9/3/09 (FSA) | |||||
| Financing Auth. Rev., | (SBBPA: JPMorgan Chase | |||||
| (Memorial Health Services), | Bank N.A.) | 8,700,000 | 8,700,000 | |||
| VRDN, 0.33%, 9/2/09 | 2,725,000 | 2,725,000 | California Statewide | |||
| California Infrastructure | Communities Development | |||||
| & Economic Development | Auth. Multifamily Housing | |||||
| Bank Rev., (Bay Area Toll | Rev., Series 2008-2680, | |||||
| Bridges), VRDN, 0.40%, | (PUTTERs), VRDN, 0.49%, | |||||
| 9/3/09 (LOC: Bank of | 9/3/09 (LOC: JPMorgan | |||||
| the West) | 2,830,000 | 2,830,000 | Chase Bank N.A.)(1) | 7,500,000 | 7,500,000 | |
| California Infrastructure | California Statewide | |||||
| & Economic Development | Communities Development | |||||
| Bank Rev., (Country | Auth. Rev., (Archer School | |||||
| Schools), VRDN, 0.35%, | for Girls, Inc.), VRDN, | |||||
| 9/3/09 (LOC: First Republic | 0.55%, 9/3/09 (LOC: Allied | |||||
| Bank and Bank of New York) | 3,000,000 | 3,000,000 | Irish Bank plc) | 1,000,000 | 1,000,000 | |
| California Infrastructure | California Statewide | |||||
| & Economic Development | Communities Development | |||||
| Bank Rev., Series 2008 B, | Auth. Rev., (St. Mary & | |||||
| (Colburn School), VRDN, | All Angels School), VRDN, | |||||
| 0.45%, 9/3/09 (LOC: Allied | 0.45%, 9/3/09 (LOC: Allied | |||||
| Irish Bank plc) | 6,000,000 | 6,000,000 | Irish Bank plc) | 2,000,000 | 2,000,000 |
13
California Tax-Free Money Market
| Principal | Principal | |||||
| Amount | Value | Amount | Value | |||
| California Statewide | El Monte COP, Series | |||||
| Communities Development | 2003 A, (Community | |||||
| Auth. Rev., Series 2000 A, | Improvement), VRDN, | |||||
| (Jewish Federation), VRDN, | 0.35%, 9/3/09 (LOC: Union | |||||
| 0.52%, 9/3/09 (LOC: Allied | Bank of California N.A. | |||||
| Irish Bank plc) | $ 3,230,000 | $ 3,230,000 | and California State | |||
| California Statewide | Teacher’s Retirement) | $ 4,935,000 | $ 4,935,000 | |||
| Communities Development | Fremont COP, (Capital | |||||
| Auth. Rev., Series 2008 B, | Improvement Funding), | |||||
| (Rady Children’s Hospital), | VRDN, 0.25%, 9/3/09 (LOC: | |||||
| VRDN, 0.11%, 9/1/09 (LOC: | Scotia Bank) | 2,740,000 | 2,740,000 | |||
| Bank of the West) | 2,600,000 | 2,600,000 | Hanford Sewer System | |||
| Carlsbad Unified School | Rev., Series 1996 A, VRDN, | |||||
| District COP, (School Facility | 0.55%, 9/3/09 (LOC: Union | |||||
| Bridge Funding), VRDN, | Bank of California N.A.) | 1,200,000 | 1,200,000 | |||
| 0.50%, 9/3/09 (FSA) | Irvine Improvement | |||||
| (SBBPA: Wachovia | Bond Act of 1915 Special | |||||
| Bank N.A.) | 1,600,000 | 1,600,000 | Assessment Rev., Series | |||
| Carlsbad Unified School | 2006 A, (Reassessment | |||||
| District COP, (School Facility | District No. 05-21), VRDN, | |||||
| Bridge Funding), VRDN, | 0.10%, 9/1/09 (LOC: Bank | |||||
| 0.50%, 9/3/09 (FSA) | of New York and California | |||||
| (SBBPA: Wachovia | State Teacher’s Retirement) | 600,000 | 600,000 | |||
| Bank N.A.) | 2,580,000 | 2,580,000 | JP Morgan Chase Trust | |||
| Carlsbad Unified School | COP, Series 2009-3361, | |||||
| District COP, (School | (PUTTERs/DRIVERs), | |||||
| Facility Bridge Funding), | VRDN, 0.54%, 9/3/09 | |||||
| VRDN, 0.55%, 9/3/09 | (NATL) (LIQ FAC: JPMorgan | |||||
| (FSA) (SBBPA: First Union | Chase Bank N.A.)(1) | 2,570,000 | 2,570,000 | |||
| National Bank) | 8,200,000 | 8,200,000 | JP Morgan Chase Trust | |||
| Chico Multifamily Mortgage | COP, Series 2009-3416, | |||||
| Rev., (Webb Homes), VRDN, | (PUTTERs/DRIVERs), | |||||
| 0.75%, 9/1/09 (LOC: Wells | VRDN, 0.54%, 9/3/09 | |||||
| Fargo Bank N.A.) | 295,000 | 295,000 | (NATL) (LIQ FAC: JPMorgan | |||
| Diamond Bar Public | Chase Bank N.A.)(1) | 2,200,000 | 2,200,000 | |||
| Financing Auth. Lease Rev., | Long Beach Health Facilities | |||||
| Series 2002 A, (Community/ | Rev., (Memorial Health | |||||
| Senior Center), VRDN, | Services), VRDN, | |||||
| 0.28%, 9/2/09 (LOC: Union | 0.33%, 9/2/09 | 18,200,000 | 18,200,000 | |||
| Bank of California N.A.) | 7,400,000 | 7,400,000 | Los Angeles COP, Series | |||
| East Bay Municipal Utility | 2005 A, (Loyola High | |||||
| District Rev., Series 2009 | School), VRDN, 0.55%, | |||||
| A1, VRN, 0.39%, 9/3/09 | 5,000,000 | 5,000,000 | 9/3/09 (LOC: Allied Irish | |||
| East Bay Municipal Utility | Bank plc) | 1,375,000 | 1,375,000 | |||
| District Rev., Series 2009 | Los Angeles COP, Series | |||||
| A2, VRN, 0.39%, 9/3/09 | 29,540,000 | 29,540,000 | 2006 A, (Notre Dame High | |||
| Eastern Municipal Water | School), VRDN, 0.55%, | |||||
| District Water & Sewer | 9/3/09 (LOC: Allied Irish | |||||
| COP, Series 2008 E, VRDN, | Bank plc) | 1,710,000 | 1,710,000 | |||
| 0.23%, 9/2/09 (LIQ FAC: | Los Angeles County Tax & | |||||
| Lloyds TSB Bank plc)(1) | 4,900,000 | 4,900,000 | Rev. Anticipation Notes GO, | |||
| 2.50%, 4/28/10 | 9,800,000 | 9,931,032 |
14
California Tax-Free Money Market
| Principal | Principal | |||||
| Amount | Value | Amount | Value | |||
| Los Angeles County Tax & | Paramount Unified School | |||||
| Rev. Anticipation Notes | District COP, (School Facility | |||||
| GO, Series 2009 A, | Bridge Funding Program), | |||||
| 2.50%, 6/30/10 | $ 15,500,000 | $ 15,718,502 | VRDN, 0.50%, 9/3/09 (FSA) | |||
| Los Angeles Unified School | (SBBPA: Wachovia | |||||
| District GO, Series 2008- | Bank N.A.) | $ 3,200,000 | $ 3,200,000 | |||
| 2748, (PUTTERs), VRDN, | RBC Municipal Products | |||||
| 0.54%, 9/3/09 (FSA) (LIQ | Inc. Trust Tax Allocation | |||||
| FAC: JPMorgan Chase | Rev., Series 2008 E5, VRDN, | |||||
| Bank N.A.)(1) | 4,995,000 | 4,995,000 | 0.34%, 9/3/09 (LOC: Royal | |||
| Los Angeles Unified | Bank of Canada) (LIQ FAC: | |||||
| School District Tax & Rev. | Royal Bank of Canada)(1) | 28,180,000 | 28,180,000 | |||
| Anticipation Notes GO, | Reedley COP, VRDN, | |||||
| 2.00%, 8/12/10 | 10,000,000 | 10,129,565 | 0.37%, 9/3/09 (LOC: | |||
| Metropolitan Water District | U.S. Bank N.A.) | 10,650,000 | 10,650,000 | |||
| Southern California Rev., | Riverside County Industrial | |||||
| Series 2009 A1, VRN, | Development Authority | |||||
| 0.44%, 9/3/09 | 15,000,000 | 15,000,000 | Empowerment Zone Facility | |||
| Metropolitan Water District | Rev., (Guy Evans Inc.), | |||||
| Southern California Rev., | VRDN, 0.30%, 9/3/09 | |||||
| Series 2009 A2, VRN, | (LOC: California Bank & | |||||
| 0.44%, 9/3/09 | 16,000,000 | 16,000,000 | Trust and FHLB) | 5,765,000 | 5,765,000 | |
| Modesto Water Rev. COP, | San Bernardino County | |||||
| Series 2008 A, VRDN, | Multifamily Housing Auth. | |||||
| 0.41%, 9/3/09 (AGC) | Rev., Series 1993 A, (Rialto | |||||
| (SBBPA: Bank of | Heritage), VRDN, 0.29%, | |||||
| America N.A.) | 2,500,000 | 2,500,000 | 9/9/09 (LOC: California | |||
| Moreno Valley COP, (1997 | Federal Bank and FHLB) | 4,330,000 | 4,330,000 | |||
| City Hall Refinancing), | San Diego County COP, | |||||
| VRDN, 0.35%, 9/3/09 (LOC: | VRDN, 0.45%, 9/3/09 (LOC: | |||||
| Union Bank of California | Allied Irish Bank plc) | 3,300,000 | 3,300,000 | |||
| N.A. and California State | San Diego Unified School | |||||
| Teacher’s Retirement) | 5,470,000 | 5,470,000 | District Tax & Rev. | |||
| Novato Multifamily Housing | Anticipation Notes GO, | |||||
| Rev., (Nova-Ro III Senior | 2.00%, 7/8/10 | 6,500,000 | 6,581,264 | |||
| Housing), VRDN, 0.23%, | San Francisco City & County | |||||
| 9/3/09 (LOC: Bank of | Redevelopment Agency | |||||
| the West) | 800,000 | 800,000 | Community Facilities District | |||
| Orange County Housing | No. 4 Rev., (Mission Bay | |||||
| Multifamily Apartments | North Public Improvements), | |||||
| Development Auth. Rev., | VRDN, 0.25%, 9/3/09 (LOC: | |||||
| Series 1985 CC, (Lantern | Bank of America N.A.) | 1,400,000 | 1,400,000 | |||
| Pines), VRDN, 0.29%, | Santa Rosa Wastewater | |||||
| 9/1/09 (FNMA) (LIQ | Rev., Series 2004 A, | |||||
| FAC: FNMA) | 1,450,000 | 1,450,000 | VRDN, 1.10%, 9/3/09 | |||
| Orange County Sanitation | (LOC: Landesbank | |||||
| District COP, Series 2008 C, | Baden-Wurttemberg) | 19,400,000 | 19,400,000 | |||
| 2.50%, 12/10/09 | 5,000,000 | 5,020,617 |
15
California Tax-Free Money Market
| Principal | Notes to Schedule of Investments | |||
| Amount | Value | ABAG = Association of Bay Area Governments | ||
| Southern California Public | AGC = Assured Guaranty Corporation | |||
| Power Auth. Rev., (Southern | ||||
| Transmission), VRDN, | Ambac = Ambac Assurance Corporation | |||
| 0.90%, 9/2/09 (Ambac) | BHAC-CR = Berkshire Hathaway Assurance Corporation — | |||
| (LOC: Lloyds TSB Bank plc) | $ 3,300,000 | $ 3,300,000 | Custodial Receipts | |
| Sweetwater Union High | COP = Certificates of Participation | |||
| School District GO, Series | DRIVERs = Derivative Inverse Tax-Exempt Receipts | |||
| 2008-2684, (PUTTERs), | FHLB = Federal Home Loan Bank | |||
| VRDN, 0.84%, 9/3/09 (FSA) | ||||
| (LIQ FAC: JPMorgan Chase | FNMA = Federal National Mortgage Association | |||
| Bank N.A.)(1) | 3,500,000 | 3,500,000 | FSA = Financial Security Assurance, Inc. | |
| Three Valleys Municipal | GO = General Obligation | |||
| Water District COP, | LIQ FAC = Liquidity Facilities | |||
| (Miramar Water Treatment, | ||||
| Water Transmission and | LOC = Letter of Credit | |||
| Hydroelectric Generating | MERLOTs = Municipal Exempt Receipts Liquidity Optional Tenders | |||
| Facilities), VRDN, 0.20%, | NATL = National Public Finance Guarantee Corporation | |||
| 9/2/09 (LOC: Wells Fargo | ||||
| Bank N.A.) | 5,000,000 | 5,000,000 | PUTTERs = Puttable Tax-Exempt Receipts | |
| Vallejo Water Rev., Series | SBBPA = Standby Bond Purchase Agreement | |||
| 2005 A, VRDN, 0.33%, | VRDN = Variable Rate Demand Note. Interest reset date is indicated. | |||
| 9/2/09 (LOC: JPMorgan | Rate shown is effective at the period end. | |||
| Chase Bank N.A.) | 4,500,000 | 4,500,000 | VRN = Variable Rate Note. Interest reset date is indicated. Rate shown | |
| West Hills Community | is effective at the period end. | |||
| College District COP, VRDN, | (1) Security was purchased under Rule 144A or Section 4(2) of | |||
| 0.28%, 9/2/09 (LOC: Union | the Securities Act of 1933 or is a private placement and, unless | |||
| Bank of California N.A.) | 9,000,000 | 9,000,000 | registered under the Act or exempted from registration, may only | |
| TOTAL INVESTMENT | be sold to qualified institutional investors. The aggregate value | |||
| SECURITIES — 98.6% | 433,597,422 | of these securities at the period end was $97,500,000, which | ||
| OTHER ASSETS | represented 22.2% of total net assets. None of the restricted | |||
| AND LIABILITIES — 1.4% | 6,039,758 | securities are considered to be illiquid. | ||
| TOTAL NET ASSETS — 100.0% | $439,637,180 | |||
| See Notes to Financial Statements. | ||||
16
California Tax-Free Bond
| AUGUST 31, 2009 | ||||||
| Principal | Principal | |||||
| Amount | Value | Amount | Value | |||
| Municipal Securities — 98.7% | California Economic | |||||
| Recovery GO, Series 2004 A, | ||||||
| CALIFORNIA — 93.2% | 5.25%, 7/1/14(1) | $ 5,000,000 | $ 5,578,700 | |||
| Banning Utility Auth. | California Economic | |||||
| Rev., (Refunding and | Recovery GO, Series | |||||
| Improvement Projects), | 2004 A, 5.25%, 7/1/14 | |||||
| 5.25%, 11/1/35 | (NATL/FGIC)(1) | 5,000,000 | 5,573,900 | |||
| (NATL/FGIC)(1) | $ 750,000 | $ 730,178 | ||||
| California Educational | ||||||
| Bay Area Toll Auth. Toll | Facilities Auth. Rev., | |||||
| Bridge Rev., Series 2008 F1, | (Golden Gate University), | |||||
| (San Francisco Bay Area), | 5.50%, 10/1/18(1) | 4,000,000 | 3,714,320 | |||
| 5.00%, 4/1/34(1) | 5,000,000 | 5,087,050 | ||||
| California Educational | ||||||
| Bay Area Toll Auth. Toll | Facilities Auth. Rev., | |||||
| Bridge Rev., Series 2009 F1, | (Santa Clara University), | |||||
| (San Francisco Bay Area), | 5.00%, 4/1/18 | 500,000 | 558,045 | |||
| 5.25%, 4/1/27(1) | 6,250,000 | 6,707,000 | ||||
| California Educational | ||||||
| California Department of | Facilities Auth. Rev., | |||||
| Water Resources Power | (Santa Clara University), | |||||
| Supply Rev., Series | 5.00%, 4/1/19 | 700,000 | 772,877 | |||
| 2002 A, 5.375%, 5/1/12, | California Educational | |||||
| Prerefunded at 101% | Facilities Auth. Rev., | |||||
| of Par (XLCA)(1)(2) | 7,000,000 | 7,855,120 | ||||
| (Santa Clara University), | ||||||
| California Department of | 5.25%, 4/1/23 | 2,000,000 | 2,156,380 | |||
| Water Resources Power | California Educational | |||||
| Supply Rev., Series 2002 A, | Facilities Auth. Rev., | |||||
| 5.50%, 5/1/12(1) | 3,750,000 | 4,107,525 | ||||
| (Scripps College), 5.25%, | ||||||
| California Department of | 8/1/11, Prerefunded at | |||||
| Water Resources Power | 100% of Par(1)(2) | 985,000 | 1,068,695 | |||
| Supply Rev., Series 2005 F5, | California Educational | |||||
| 5.00%, 5/1/22(1) | 1,800,000 | 1,907,640 | ||||
| Facilities Auth. Rev., Series | ||||||
| California Department of | 2000 B, (Pooled College & | |||||
| Water Resources Power | University), 6.625%, 6/1/10, | |||||
| Supply Rev., Series 2005 G4, | Prerefunded at 101% | |||||
| 5.00%, 5/1/16(1) | 2,450,000 | 2,709,210 | of Par(1)(2) | 275,000 | 289,911 | |
| California Department of | California Educational | |||||
| Water Resources Power | Facilities Auth. Rev., Series | |||||
| Supply Rev., Series 2008 H, | 2000 B, (Pooled College & | |||||
| 5.00%, 5/1/21(1) | 5,000,000 | 5,350,400 | University), 6.625%, 6/1/10, | |||
| California Department of | Prerefunded at 101% | |||||
| Water Resources Rev., | of Par(1)(2) | 1,330,000 | 1,402,113 | |||
| (Central Valley), 5.50%, | California Educational | |||||
| 12/1/11, Prerefunded at | Facilities Auth. Rev., | |||||
| 100% of Par(1)(2) | 15,000 | 16,564 | Series 2004 C, | |||
| California Department of | (Lutheran University), | |||||
| Water Resources Rev., | 5.00%, 10/1/24(1) | 2,500,000 | 2,300,625 | |||
| (Central Valley), | California Educational | |||||
| 5.50%, 12/1/17(1) | 1,235,000 | 1,336,591 | Facilities Auth. Rev., | |||
| California Department of | Series 2008 T4, | |||||
| Water Resources Rev., | (Stanford University), | |||||
| Series 2009 AF, (Central | 5.00%, 3/15/14(1) | 5,000,000 | 5,691,050 | |||
| Valley), 5.00%, 12/1/22(1) | 2,000,000 | 2,219,360 | ||||
17
California Tax-Free Bond
| Principal | Principal | |||||
| Amount | Value | Amount | Value | |||
| California Educational | California Health Facilities | |||||
| Facilities Auth. Rev., Series | Financing Auth. Rev., 5.70%, | |||||
| 2009 A, (Pomona College), | 12/1/24 (Ambac/California | |||||
| 5.00%, 1/1/24(1) | $ 2,100,000 | $ 2,340,009 | Mortgage Insurance)(1) | $ 1,985,000 | $ 2,026,268 | |
| California Educational | California Health Facilities | |||||
| Facilities Auth. Rev., Series | Financing Auth. Rev., | |||||
| 2009 A, (University of | (Children’s Hospital), | |||||
| Southern California), | 6.25%, 11/1/29(1) | 5,000,000 | 5,108,850 | |||
| 5.00%, 10/1/39(1) | 2,952,000 | 3,029,933 | California Health Facilities | |||
| California GO, 5.25%, | Financing Auth. Rev., | |||||
| 10/1/10, Prerefunded | Series 1998 A, (Kaiser | |||||
| at 100% of Par | Permanente), 5.25%, | |||||
| (FGIC-TCRS)(1)(2) | 7,650,000 | 8,007,485 | 6/1/11 (FSA)(1)(2) | 2,000,000 | 2,027,460 | |
| California GO, 5.50%, | California Health Facilities | |||||
| 3/1/11 (XLCA-ICR)(1) | 1,000,000 | 1,056,570 | Financing Auth. Rev., Series | |||
| California GO, 5.50%, | 2008 A, (Scripps Health), | |||||
| 4/1/12 (NATL)(1) | 5,000,000 | 5,439,700 | 5.00%, 10/1/17(1) | 1,400,000 | 1,447,908 | |
| California GO, 5.00%, | California Health Facilities | |||||
| 2/1/14, Prerefunded at | Financing Auth. Rev., Series | |||||
| 100% of Par(1)(2) | 4,000,000 | 4,551,280 | 2008 A, (Sutter Health), | |||
| 5.50%, 8/15/17(1) | 1,000,000 | 1,082,910 | ||||
| California GO, 5.125%, | ||||||
| 2/1/14, Prerefunded at | California Health Facilities | |||||
| 100% of Par(1)(2) | 5,000,000 | 5,715,550 | Financing Auth. Rev., Series | |||
| 2008 A, (Sutter Health), | ||||||
| California GO, 5.00%, | 5.25%, 8/15/22(1) | 3,335,000 | 3,418,708 | |||
| 11/1/16 (Ambac)(1) | 1,575,000 | 1,742,564 | ||||
| California Health Facilities | ||||||
| California GO, | Financing Auth. Rev., Series | |||||
| 5.00%, 8/1/18(1) | 2,260,000 | 2,434,698 | ||||
| 2008 A, (Sutter Health), | ||||||
| California GO, | 5.00%, 8/15/38(1) | 2,520,000 | 2,251,645 | |||
| 5.25%, 2/1/20(1) | 5,000,000 | 5,189,800 | ||||
| California Health Facilities | ||||||
| California GO, | Financing Auth. Rev., | |||||
| 5.00%, 3/1/20(1) | 1,690,000 | 1,802,605 | Series 2008 A3, (Stanford | |||
| California GO, | Hospital), VRDN, | |||||
| 5.00%, 8/1/20(1) | 5,000,000 | 5,284,150 | 3.45%, 6/15/11(1) | 1,000,000 | 1,030,530 | |
| California GO, | California Health Facilities | |||||
| 5.00%, 3/1/22(1) | 5,000,000 | 5,162,300 | Financing Auth. Rev., | |||
| California GO, | Series 2008 C, (Providence | |||||
| 5.50%, 4/1/24(1) | 4,000,000 | 4,236,560 | Health & Services), | |||
| 5.00%, 10/1/14(1) | 500,000 | 552,770 | ||||
| California GO, | ||||||
| 5.00%, 8/1/24(1) | 1,260,000 | 1,280,866 | California Health Facilities | |||
| Financing Auth. Rev., | ||||||
| California GO, | Series 2008 C, (Providence | |||||
| 5.75%, 4/1/28(1) | 5,000,000 | 5,282,550 | Health & Services), | |||
| California GO, | 6.25%, 10/1/24(1) | 3,250,000 | 3,634,085 | |||
| 5.75%, 4/1/31(1) | 7,710,000 | 8,079,849 | California Health Facilities | |||
| California GO, | Financing Auth. Rev., | |||||
| 6.50%, 4/1/33(1) | 5,000,000 | 5,545,200 | Series 2008 C, (Providence | |||
| California GO, | Health & Services), | |||||
| 5.00%, 4/1/38(1) | 4,450,000 | 4,235,554 | 6.50%, 10/1/38(1) | 2,125,000 | 2,314,826 | |
| California GO, | California Health Facilities | |||||
| 6.00%, 4/1/38(1) | 3,000,000 | 3,174,540 | Financing Auth. Rev., Series | |||
| 2008 H, (Catholic Healthcare | ||||||
| West), 5.125%, 7/1/22(1) | 1,000,000 | 1,000,530 |
18
California Tax-Free Bond
| Principal | Principal | |||||
| Amount | Value | Amount | Value | |||
| California Health Facilities | California Municipal Finance | |||||
| Financing Auth. Rev., Series | Auth. Rev., (Loma Linda | |||||
| 2009 A, (Catholic Healthcare | University), 5.00%, 4/1/23(1) | $ 1,145,000 | $ 1,161,545 | |||
| West), 5.00%, 7/1/18(1) | $ 4,980,000 | $ 5,068,644 | California Municipal Finance | |||
| California Health Facilities | Auth. Rev., (Loma Linda | |||||
| Financing Auth. Rev., Series | University), 5.00%, 4/1/28(1) | 2,000,000 | 1,952,620 | |||
| 2009 A, (Catholic Healthcare | California Public Works | |||||
| West), 5.40%, 7/1/21(1) | 2,500,000 | 2,566,975 | Board Lease Rev., | |||
| California Health Facilities | Series 2005 A, | |||||
| Financing Auth. Rev., | (Department General | |||||
| Series 2009 A, (Saint | Services - Butterfield), | |||||
| Joseph Health System), | 5.00%, 6/1/15(1) | 1,450,000 | 1,528,924 | |||
| 5.50%, 7/1/29(1) | 3,750,000 | 3,800,850 | California Public Works | |||
| California Health Facilities | Board Lease Rev., Series | |||||
| Financing Auth. Rev., | 2006 A, (Various California | |||||
| Series 2009 A, (Saint | State University Projects), | |||||
| Joseph Health System), | 5.00%, 10/1/11(1) | 2,165,000 | 2,269,851 | |||
| 5.75%, 7/1/39(1) | 3,000,000 | 3,033,420 | California Public Works | |||
| California Infrastructure | Board Lease Rev., Series | |||||
| & Economic Development | 2009 A, (Department | |||||
| Bank Rev., Series 2000 A, | General Services - Buildings | |||||
| (Scripps Research Institute), | 8 & 9), 6.25%, 4/1/34(1) | 2,435,000 | 2,529,429 | |||
| 5.625%, 7/1/20(1) | 1,000,000 | 1,007,500 | California Public Works | |||
| California Infrastructure | Board Lease Rev., Series | |||||
| & Economic Development | 2009 B, (Department | |||||
| Bank Rev., Series 2003 | of Education - Riverside | |||||
| A, (Bay Area Toll Bridges | Campus), 6.00%, 4/1/27(1) | 2,130,000 | 2,195,583 | |||
| Seismic Retrofit 1st Lien), | California State University | |||||
| 5.125%, 7/1/26, Prerefunded | Fresno Association, Inc. Rev., | |||||
| at 100% of Par (Ambac)(1)(2) | 5,000,000 | 5,903,850 | (Auxiliary Organization Event | |||
| California Infrastructure | Center), 5.00%, 7/1/12(1)(2) | 1,000,000 | 1,106,860 | |||
| & Economic Development | California State University | |||||
| Bank Rev., Series 2006 A, | Fresno Association, Inc. | |||||
| (California Science Center | Rev., (Auxiliary Organization | |||||
| Phase II), 4.25%, 5/1/13 | Event Center), 5.25%, | |||||
| (NATL/FGIC)(1) | 1,075,000 | 1,112,625 | 7/1/12, Prerefunded at | |||
| California Infrastructure | 101% of Par(1)(2) | 3,100,000 | 3,482,819 | |||
| & Economic Development | California State University | |||||
| Bank Rev., Series 2008 A, | Fresno Association, Inc. | |||||
| (California Independent | Rev., (Auxiliary Organization | |||||
| System Operator Corp.), | Event Center), 6.00%, | |||||
| 5.00%, 2/1/13(1) | 2,500,000 | 2,655,900 | 7/1/12, Prerefunded at | |||
| California Mobilehome | 101% of Par(1)(2) | 1,500,000 | 1,718,310 | |||
| Park Financing Auth. Rev., | California State University | |||||
| Series 2000 A, (Union City | System Rev., Series 2002 A, | |||||
| Tropics), 5.375%, 8/15/10, | 5.375%, 11/1/18 (Ambac)(1) | 1,250,000 | 1,352,163 | |||
| Prerefunded at 102% of Par | ||||||
| (ACA)(1)(2) | 1,075,000 | 1,146,842 | California Statewide | |||
| Communities Development | ||||||
| California Mobilehome Park | Auth. Rev., Series 2002 B, | |||||
| Financing Auth. Rev., Series | 5.20%, 10/1/18 (FSA)(1) | 1,695,000 | 1,809,921 | |||
| 2006 A, (Union City Tropics), | ||||||
| 3.80%, 12/15/11(1) | 1,350,000 | 1,352,619 | California Statewide | |||
| Communities Development | ||||||
| Auth. Rev., Series 2002 C, | ||||||
| (Kaiser Permanente), VRN, | ||||||
| 3.85%, 6/1/12(1) | 1,100,000 | 1,119,536 |
19
California Tax-Free Bond
| Principal | Principal | |||||
| Amount | Value | Amount | Value | |||
| California Statewide | Capistrano Unified School | |||||
| Communities Development | District Special Tax Rev., | |||||
| Auth. Rev., Series 2007 | (Community Facilities | |||||
| A, (California Baptist | District No. 87-1), 5.00%, | |||||
| University), 5.30%, 11/1/18 | $ 2,250,000 | $ 1,872,562 | 9/1/18 (Ambac)(1) | $ 3,115,000 | $ 3,076,623 | |
| California Statewide | Carson Redevelopment | |||||
| Communities Development | Agency Tax Allocation Rev., | |||||
| Auth. Rev., Series 2007 | (Redevelopment Project | |||||
| A, (California Baptist | Area No. 1), 5.50%, | |||||
| University), 5.40%, 11/1/27 | 2,500,000 | 1,798,875 | 10/1/11 (NATL)(1) | 1,130,000 | 1,175,573 | |
| California Statewide | Chabot Las Positas | |||||
| Communities Development | Community College | |||||
| Auth. Rev., Series 2007 A, | District COP, 5.50%, | |||||
| (Front Porch Communities | 12/1/10 (FSA)(1)(2) | 1,090,000 | 1,127,529 | |||
| and Services), 5.125%, | Chaffey Community College | |||||
| 4/1/37(1)(3) | 1,600,000 | 1,169,152 | District GO, Series 2002 A, | |||
| California Statewide | 4.25%, 7/1/11 (FSA)(1) | 1,070,000 | 1,132,199 | |||
| Communities Development | Chino Ontario Upland Water | |||||
| Auth. Rev., Series 2007 | Facilities Auth. COP, Series | |||||
| A, (Henry Mayo Newhall | 1997 A, (Agua de Lejos), | |||||
| Memorial Hospital), | 5.20%, 10/1/15 | |||||
| 5.00%, 10/1/20 (California | (NATL/FGIC)(1) | 3,000,000 | 3,032,160 | |||
| Mortgage Insurance)(1) | 1,000,000 | 1,015,910 | ||||
| Coast Community College | ||||||
| California Statewide | District GO, Series 2006 B, | |||||
| Communities Development | (Election of 2002), 5.00%, | |||||
| Auth. Rev., Series 2007 A, | 8/1/17 (FSA)(1) | 2,065,000 | 2,301,794 | |||
| (Valleycare Health System), | ||||||
| 4.80%, 7/15/17 | 4,600,000 | 3,843,346 | Eastern Municipal Water | |||
| District Water & Sewer | ||||||
| California Statewide | COP, Series 2001 A, 5.25%, | |||||
| Communities Development | 7/1/13 (NATL/FGIC)(1) | 2,300,000 | 2,445,199 | |||
| Auth. Rev., Series 2007 A, | ||||||
| (Valleycare Health System), | Eastern Municipal Water | |||||
| 5.00%, 7/15/22 | 1,000,000 | 746,740 | District Water & Sewer | |||
| COP, Series 2008 H, | ||||||
| California Statewide | 5.00%, 7/1/24(1) | 1,000,000 | 1,046,450 | |||
| Communities Development | ||||||
| Auth. Rev., Series 2007 B, | El Segundo Unified School | |||||
| (Adventist Health | District GO, 5.375%, 9/1/12, | |||||
| System/West), 5.00%, | Prerefunded at 100% | |||||
| of Par (FGIC)(1)(2) | 1,020,000 | 1,147,724 | ||||
| 3/1/37 (AGC)(1) | 2,500,000 | 2,388,575 | ||||
| California Statewide | El Segundo Unified School | |||||
| Communities Development | District GO, 5.375%, 9/1/12, | |||||
| Auth. Rev., Series 2008 D, | Prerefunded at 100% | |||||
| of Par (FGIC)(1)(2) | 1,095,000 | 1,232,116 | ||||
| (Catholic Healthcare West), | ||||||
| 5.50%, 7/1/31(1) | 1,000,000 | 964,230 | Folsom Cordova Unified | |||
| California Statewide | School District No. 2 | |||||
| Communities Development | Facilities Improvement GO, | |||||
| Auth. Rev., Series 2009 | Series 2002 A, 5.375%, | |||||
| 10/1/15 (NATL)(1) | 1,000,000 | 1,087,960 | ||||
| A, (Kaiser Permanente), | ||||||
| 5.00%, 4/1/13(1) | 2,500,000 | 2,722,750 | Folsom Cordova Unified | |||
| Calleguas-Las Virgines | School District No. 2 | |||||
| Public Financing Auth. Rev., | Facilities Improvement GO, | |||||
| Series 2007 A, (Municipal | Series 2002 A, 5.375%, | |||||
| 10/1/16 (NATL)(1) | 1,225,000 | 1,332,751 | ||||
| Water District), 5.00%, | ||||||
| 7/1/20 (NATL/FGIC)(1) | 1,000,000 | 1,079,690 | Folsom Public Financing | |||
| Campbell Union High School | Auth. Lease Rev., (City | |||||
| District GO, 5.00%, 8/1/30(1) | 1,600,000 | 1,644,032 | Hall & Community Center), | |||
| 5.25%, 10/1/14 (FSA)(1) | 1,225,000 | 1,331,918 |
20
California Tax-Free Bond
| Principal | Principal | |||||
| Amount | Value | Amount | Value | |||
| Folsom Public Financing | Irvine Improvement | |||||
| Auth. Lease Rev., (City | Bond Act of 1915 Special | |||||
| Hall & Community Center), | Assessment Rev., (Limited | |||||
| 5.25%, 10/1/15 (FSA)(1) | $ 1,290,000 | $ 1,402,591 | Obligation Assessment | |||
| Foothill/Eastern | District No. 93-14), VRDN, | |||||
| Transportation Corridor | 0.16%, 9/1/09 (LOC: Bank | |||||
| Agency Toll Road Rev., | of America N.A.)(1) | $ 4,250,000 | $ 4,250,000 | |||
| Series 1995 A, (Senior Lien), | Irvine Unified School District | |||||
| 5.26%, 1/1/26(1)(2)(4) | 10,000,000 | 4,865,300 | Financing Auth. Special Tax | |||
| Franklin-Mckinley School | Rev., Series 2006 A, (Group | |||||
| District GO, Series 2005 A, | II), 4.50%, 9/1/13 | 785,000 | 772,738 | |||
| (Election of 2004), 5.00%, | Irvine Unified School District | |||||
| 8/1/15, Prerefunded at | Financing Auth. Special Tax | |||||
| 100% of Par (FGIC)(1)(2) | 1,150,000 | 1,336,219 | Rev., Series 2006 A, (Group | |||
| Fremont Union High School | II), 4.75%, 9/1/16 | 600,000 | 576,840 | |||
| District GO, Series 2000 B, | Irvine Unified School District | |||||
| 5.25%, 9/1/10, Prerefunded | Financing Auth. Special Tax | |||||
| at 100% of Par(1)(2) | 2,550,000 | 2,666,560 | Rev., Series 2006 A, (Group | |||
| Golden State Tobacco | II), 5.00%, 9/1/20 | 745,000 | 691,591 | |||
| Securitization Corp. | Lancaster Financing Auth. | |||||
| Settlement Rev., Series | Tax Allocation Rev., (Projects | |||||
| 2003 A1, 6.75%, 6/1/13, | No. 5 & 6), 3.80%, 2/1/10(1) | 110,000 | 110,009 | |||
| Prerefunded at 100% | Lancaster Financing Auth. | |||||
| of Par(1)(2) | 4,440,000 | 5,231,963 | Tax Allocation Rev., (Projects | |||
| Golden State Tobacco | No. 5 & 6), 4.00%, 2/1/11(1) | 120,000 | 120,012 | |||
| Securitization Corp. | Lancaster Financing Auth. | |||||
| Settlement Rev., Series 2007 | Tax Allocation Rev., (Projects | |||||
| A1, 5.75%, 6/1/47(1) | 10,000,000 | 7,800,100 | No. 5 & 6), 4.30%, 2/1/13(1) | 125,000 | 124,314 | |
| Hercules Redevelopment | Long Beach Bond Finance | |||||
| Agency Tax Allocation Rev., | Auth. Lease Rev., (Plaza | |||||
| Series 2007 A, 5.00%, | Parking Facility), 5.25%, | |||||
| 8/1/12 (Ambac)(1) | 1,300,000 | 1,342,614 | 11/1/16(1) | 2,030,000 | 2,110,855 | |
| Hercules Redevelopment | Long Beach Bond Finance | |||||
| Agency Tax Allocation Rev., | Auth. Tax Allocation Rev., | |||||
| Series 2007 A, 5.00%, | Series 2002 A, (North Long | |||||
| 8/1/13 (Ambac)(1) | 1,360,000 | 1,397,835 | Beach Redevelopment), | |||
| Hillsborough School District | 5.00%, 8/1/10 (Ambac)(1) | 750,000 | 761,332 | |||
| GO, (Bond Anticipation | Long Beach Bond Finance | |||||
| Notes), 3.60%, 9/1/13(4) | 2,700,000 | 2,374,272 | Auth. Tax Allocation Rev., | |||
| Huntington Beach Union | Series 2002 A, (North Long | |||||
| High School District GO, | Beach Redevelopment), | |||||
| (Election of 2004), | 5.00%, 8/1/11 (Ambac)(1) | 680,000 | 697,993 | |||
| 4.98%, 8/1/30 (FSA-CR) | Los Altos School District GO, | |||||
| (NATL)(1)(4) | 10,320,000 | 2,736,451 | 5.00%, 8/1/19 (Ambac)(1) | 2,500,000 | 2,717,325 | |
| Imperial Irrigation District | Los Angeles Community | |||||
| COP, (Water Systems), | Redevelopment Agency | |||||
| 5.50%, 7/1/16 (Ambac)(1) | 1,675,000 | 1,713,927 | Parking System Rev., | |||
| Inglewood Redevelopment | (Cinerama Dome Public | |||||
| Agency Tax Allocation | Package), 5.30%, 7/1/13 | |||||
| Rev., Series 2007 A1, | (ACA) (LOC: Wells Fargo | |||||
| (Subordinate Lien), 5.00%, | Bank N.A.)(1) | 1,030,000 | 926,578 | |||
| 5/1/23 (Ambac)(1) | 945,000 | 850,283 |
21
California Tax-Free Bond
| Principal | Principal | |||||
| Amount | Value | Amount | Value | |||
| Los Angeles Convention | Los Gatos-Saratoga Joint | |||||
| and Exhibition Center Auth. | Union High School District | |||||
| Lease Rev., Series 1993 A, | GO, Series 2002 C, (Election | |||||
| 6.00%, 8/15/10 | of 1998), 5.375%, 6/1/12, | |||||
| (NATL-IBC)(1) | $ 1,155,000 | $ 1,199,260 | Prerefunded at 101% | |||
| Los Angeles County | of Par (FSA)(1)(2) | $ 1,390,000 | $ 1,564,598 | |||
| Metropolitan Transportation | Lynwood Public Financing | |||||
| Auth. Sales Tax Rev., Series | Auth. Lease Rev., Series | |||||
| 2001 B, (Proposal A), | 2003 A, (Public Capital | |||||
| 5.25%, 7/1/13 (FSA)(1) | 3,000,000 | 3,235,530 | Improvement), 4.125%, | |||
| Los Angeles County | 9/1/12 (Ambac)(1) | 575,000 | 609,028 | |||
| Metropolitan Transportation | Manhattan Beach Unified | |||||
| Auth. Sales Tax Rev., Series | School District GO, Series | |||||
| 2001 B, (Proposal A), | 2009 A, (Election of 2008), | |||||
| 5.25%, 7/1/16 (FSA)(1) | 6,680,000 | 7,147,533 | 6.29%, 9/1/28(1)(4) | 5,620,000 | 1,746,415 | |
| Los Angeles County | Mojave Unified School | |||||
| Metropolitan Transportation | District No. 1 Facilities | |||||
| Auth. Sales Tax Rev., Series | Improvement GO, 5.25%, | |||||
| 2008 B, (Proposal A), | 8/1/20 (NATL/FGIC)(1) | 1,520,000 | 1,617,371 | |||
| 5.00%, 7/1/31(1) | 1,000,000 | 1,022,870 | Mountain View COP, (Capital | |||
| Los Angeles Department of | Projects), 5.25%, 8/1/18(1) | 1,485,000 | 1,585,802 | |||
| Airports Rev., Series 2008 C, | M-S-R Public Power Agency | |||||
| (Los Angeles International | Rev., Series 2007 K, | |||||
| Airport), 5.00%, 5/15/18(1) | 750,000 | 813,240 | (San Juan), 5.00%, | |||
| Los Angeles Department of | 7/1/12 (NATL)(1) | 4,065,000 | 4,392,192 | |||
| Water & Power Rev., Series | M-S-R Public Power Agency | |||||
| 2001 AA1, (Power System), | Rev., Series 2007 K, | |||||
| 5.25%, 7/1/10 (NATL)(1) | 3,130,000 | 3,247,813 | (San Juan), 5.00%, | |||
| Los Angeles Department of | 7/1/13 (NATL)(1) | 2,305,000 | 2,507,702 | |||
| Water & Power Rev., Series | M-S-R Public Power Agency | |||||
| 2008 A1, (Power System), | Rev., Series 2007 K, | |||||
| 5.25%, 7/1/38(1) | 5,000,000 | 5,156,450 | (San Juan), 5.00%, | |||
| Los Angeles Department of | 7/1/14 (NATL)(1) | 1,000,000 | 1,092,150 | |||
| Water & Power Rev., Series | Murrieta Valley Unified | |||||
| 2008 A2, (Power System), | School District Public | |||||
| 5.25%, 7/1/32(1) | 3,735,000 | 3,879,134 | Financing Auth. Special Tax | |||
| Los Angeles Unified School | Rev., Series 2006 A, 4.00%, | |||||
| District GO, 5.50%, | 9/1/11 (AGC)(1) | 1,255,000 | 1,306,656 | |||
| 7/1/12 (NATL)(1) | 3,500,000 | 3,846,885 | Murrieta Valley Unified | |||
| Los Angeles Unified School | School District Public | |||||
| District GO, Series 2002 E, | Financing Auth. Special Tax | |||||
| (Election of 1997), 5.00%, | Rev., Series 2006 A, 4.00%, | |||||
| 7/1/11 (NATL)(1) | 5,000,000 | 5,334,950 | 9/1/12 (AGC)(1) | 1,745,000 | 1,831,552 | |
| Los Angeles Unified School | Murrieta Valley Unified | |||||
| District GO, Series 2003 F, | School District Public | |||||
| (Election of 1997), 5.00%, | Financing Auth. Special Tax | |||||
| 7/1/16 (FSA)(1) | 2,500,000 | 2,712,250 | Rev., Series 2006 A, 4.00%, | |||
| Los Angeles Unified School | 9/1/13 (AGC)(1) | 1,690,000 | 1,762,991 | |||
| District GO, Series 2009 F, | Murrieta Valley Unified | |||||
| 5.00%, 7/1/21(1) | 5,405,000 | 5,806,429 | School District Public | |||
| Los Angeles Wastewater | Financing Auth. Special Tax | |||||
| System Rev., Series 2009 A, | Rev., Series 2006 A, 4.00%, | |||||
| 5.75%, 6/1/34(1) | 2,975,000 | 3,214,428 | 9/1/14 (AGC)(1) | 1,085,000 | 1,127,206 | |
| Oceanside COP, Series 2003 | ||||||
| A, 5.00%, 4/1/11 (Ambac)(1) | 1,225,000 | 1,260,954 |
22
California Tax-Free Bond
| Principal | Principal | |||||
| Amount | Value | Amount | Value | |||
| Oceanside COP, Series 2003 | Palomar Pomerado Health | |||||
| A, 5.00%, 4/1/12 (Ambac)(1) | $ 1,310,000 | $ 1,360,160 | GO, Series 2009 A, (Election | |||
| Orange County Community | of 2004), 0.00%, | |||||
| Facilities District Special | 8/1/19 (AGC)(1)(5) | $ 1,660,000 | $ 1,002,424 | |||
| Tax Rev., Series 2005 A, | Paramount Unified School | |||||
| (No. 04-1-Ladera Ranch), | District GO, (Election of | |||||
| 3.50%, 8/15/10 | 650,000 | 646,243 | 2006), 5.25%, | |||
| Orange County Community | 8/1/25 (FSA)(1) | 1,570,000 | 1,671,296 | |||
| Facilities District Special | Paramount Unified School | |||||
| Tax Rev., Series 2005 A, | District GO, (Election | |||||
| (No. 04-1-Ladera Ranch), | of 2006), 5.25%, | |||||
| 3.80%, 8/15/11 | 760,000 | 747,582 | 8/1/26 (FSA)(1) | 1,760,000 | 1,862,643 | |
| Orange County Community | Perris Public Financing | |||||
| Facilities District Special Tax | Auth. Tax Allocation Rev., | |||||
| Rev., Series 2005 A, (No. | 5.35%, 10/1/36 | 1,150,000 | 850,770 | |||
| 04-1-Ladera Ranch), | Poway Unified School | |||||
| 3.90%, 8/15/12 | 825,000 | 804,862 | District Public Financing | |||
| Orange County Community | Auth. Special Tax Rev., | |||||
| Facilities District Special Tax | 5.00%, 9/15/19 (Ambac)(1) | 1,170,000 | 1,164,864 | |||
| Rev., Series 2005 A, (No. | Poway Unified School | |||||
| 04-1-Ladera Ranch), | District Public Financing | |||||
| 4.10%, 8/15/13 | 700,000 | 676,382 | Auth. Special Tax Rev., | |||
| Orange County Community | 5.00%, 9/15/20 (Ambac)(1) | 1,215,000 | 1,197,966 | |||
| Facilities District Special Tax | Rancho Mirage Joint Powers | |||||
| Rev., Series 2005 A, (No. | Financing Auth. Rev., | |||||
| 04-1-Ladera Ranch), | Series 2007 A, (Eisenhower | |||||
| 4.25%, 8/15/14 | 1,135,000 | 1,085,775 | Medical Center), | |||
| Orange County Improvement | 5.00%, 7/1/15(1) | 1,505,000 | 1,581,740 | |||
| Bond Act of 1915 Special | Rancho Mirage Joint Powers | |||||
| Assessment Rev., (Newport | Financing Auth. Rev., | |||||
| Coast Phase IV Assessment | Series 2007 A, (Eisenhower | |||||
| District No. 01-1), | Medical Center), | |||||
| 4.30%, 9/2/14 | 270,000 | 256,527 | 5.00%, 7/1/21(1) | 1,000,000 | 1,006,370 | |
| Orange County Improvement | Richmond Joint Powers | |||||
| Bond Act of 1915 Special | Financing Auth. Lease Rev., | |||||
| Assessment Rev., (Newport | (Refunding & Civic Center), | |||||
| Coast Phase IV Assessment | VRDN, 4.125%, 11/25/09 | |||||
| District No. 01-1), | (Ambac) (SBBPA: Dexia | |||||
| 4.45%, 9/2/15 | 320,000 | 302,438 | Credit Local)(1) | 1,365,000 | 1,365,491 | |
| Orange County Improvement | Riverside County COP, | |||||
| Bond Act of 1915 Special | Series 2007 A, (Public | |||||
| Assessment Rev., (Newport | Safety Communication), | |||||
| Coast Phase IV Assessment | 5.00%, 11/1/14 (Ambac)(1) | 1,000,000 | 1,117,350 | |||
| District No. 01-1), | ||||||
| 4.55%, 9/2/16 | 245,000 | 228,595 | Riverside County COP, | |||
| Series 2007 A, (Public | ||||||
| Orange County Public | Safety Communication), | |||||
| Financing Auth. Lease Rev., | 5.00%, 11/1/15 (Ambac)(1) | 2,000,000 | 2,241,520 | |||
| (Juvenile Justice Center | ||||||
| Facility), 5.375%, | Sacramento City Financing | |||||
| 6/1/17 (Ambac)(1) | 3,030,000 | 3,167,592 | Auth. Lease Rev., Series | |||
| 1993 A, 5.40%, | ||||||
| Orange County Sanitation | 11/1/20 (Ambac)(1) | 3,000,000 | 3,021,780 | |||
| District COP, Series 2007 B, | ||||||
| 5.00%, 2/1/26 (FSA)(1) | 2,750,000 | 2,885,272 |
23
California Tax-Free Bond
| Principal | Principal | |||||
| Amount | Value | Amount | Value | |||
| Sacramento City Financing | San Diego Public Facilities | |||||
| Auth. Rev., 5.00%, 12/1/16 | Financing Auth. Rev., Series | |||||
| (NATL/FGIC)(1) | $ 2,500,000 | $ 2,648,100 | 2009 B, 5.00%, 5/15/22(1) | $ 1,000,000 | $ 1,071,570 | |
| Sacramento City Financing | San Diego Public Facilities | |||||
| Auth. Rev., Series 2002 A, | Financing Auth. Tax | |||||
| (City Hall), 5.25%, 12/1/12, | Allocation Rev., Series 2007 | |||||
| Prerefunded at 100% | B, (Southcrest and Central | |||||
| of Par (FSA)(1)(2) | 4,045,000 | 4,574,571 | Imperial Redevelopment), | |||
| Sacramento City Financing | 5.125%, 10/1/22 (Radian)(1) | 1,280,000 | 1,242,547 | |||
| Auth. Rev., Series 2002 A, | San Diego Redevelopment | |||||
| (City Hall), 5.25%, | Agency Tax Allocation Rev., | |||||
| 12/1/15 (FSA)(1) | 1,245,000 | 1,367,620 | (Horton Plaza), | |||
| Sacramento Municipal Utility | 5.70%, 11/1/17(1) | 2,030,000 | 2,057,710 | |||
| District Electric Rev., | San Diego Redevelopment | |||||
| Series 1997 K, 5.70%, | Agency Tax Allocation Rev., | |||||
| 7/1/17 (Ambac)(1) | 3,105,000 | 3,536,005 | (Horton Plaza), | |||
| Sacramento Municipal Utility | 5.80%, 11/1/21(1) | 2,635,000 | 2,626,805 | |||
| District Electric Rev., | San Diego Redevelopment | |||||
| Series 2001 O, 5.25%, | Agency Tax Allocation | |||||
| 8/15/11 (NATL)(1) | 5,005,000 | 5,333,979 | Rev., (North Park), 5.90%, | |||
| Sacramento Municipal Utility | 9/1/25(1) | 710,000 | 710,071 | |||
| District Electric Rev., | San Francisco City and | |||||
| Series 2003 S, 5.00%, | County Airports Commission | |||||
| 11/15/11 (NATL)(1) | 3,000,000 | 3,203,160 | Rev., Series 2008-34D, | |||
| San Bernardino Community | (San Francisco International | |||||
| College District GO, Series | Airport), 5.00%, | |||||
| 2008 A, (Election of 2002), | 5/1/17 (AGC)(1) | 3,375,000 | 3,751,043 | |||
| 5.25%, 8/1/18(1) | 350,000 | 399,900 | San Francisco City and | |||
| San Bernardino Community | County Airports Commission | |||||
| College District GO, Series | Rev., Series 2008-34D, | |||||
| 2008 A, (Election of 2002), | (San Francisco International | |||||
| 5.50%, 8/1/19(1) | 300,000 | 342,645 | Airport), 5.00%, | |||
| 5/1/18 (AGC)(1) | 2,000,000 | 2,218,400 | ||||
| San Bernardino Community | ||||||
| College District GO, Series | San Francisco City and | |||||
| 2008 A, (Election of 2002), | County COP, Series | |||||
| 6.25%, 8/1/33(1) | 1,500,000 | 1,680,105 | 2009 A, (Multiple Capital | |||
| Improvement Projects), | ||||||
| San Bernardino Community | 5.00%, 4/1/29(1) | 1,170,000 | 1,179,699 | |||
| College District GO, Series | ||||||
| 2009 B, (Election of 2008), | San Mateo County | |||||
| 0.00%, 8/1/19(1)(5) | 9,840,000 | 5,534,016 | Transportation District Sales | |||
| Tax Rev., Series 1993 A, | ||||||
| San Bernardino County | 5.25%, 6/1/18 (NATL)(1) | 2,680,000 | 3,051,073 | |||
| Redevelopment Agency | ||||||
| Tax Allocation Rev., Series | San Ramon Valley Unified | |||||
| 2005 A, (San Sevaine | School District GO, | |||||
| Redevelopment), 5.00%, | (Election of 2002), 5.00%, | |||||
| 9/1/15 (Radian)(1) | 1,005,000 | 1,026,929 | 8/1/21 (NATL)(1) | 1,000,000 | 1,063,040 | |
| San Buenaventura City | Santa Ana Community | |||||
| COP, Series 2002 B, 5.50%, | Redevelopment Agency | |||||
| 1/1/15 (Ambac)(1) | 1,695,000 | 1,846,533 | Tax Allocation Rev., Series | |||
| 2003 B, (South Main Street | ||||||
| San Buenaventura City | Redevelopment), 5.00%, | |||||
| COP, Series 2002 B, 5.50%, | 9/1/13 (NATL/FGIC)(1) | 1,885,000 | 1,974,406 | |||
| 1/1/16 (Ambac)(1) | 1,790,000 | 1,950,026 | ||||
| Santa Barbara County COP, | ||||||
| San Diego Public Facilities | 5.375%, 10/1/17 (Ambac)(1) | 3,350,000 | 3,406,247 | |||
| Financing Auth. Rev., Series | ||||||
| 2009 A, 5.00%, 8/1/21(1) | 1,000,000 | 1,073,490 |
24
California Tax-Free Bond
| Principal | Principal | |||||
| Amount | Value | Amount | Value | |||
| Santa Fe Springs | South Tahoe Joint Powers | |||||
| Community Development | Financing Auth. Rev., Series | |||||
| Commission Tax Allocation | 2005 A, (Redevelopment | |||||
| Rev., Series 2002 A, 5.375%, | Project Area No. 1), 5.00%, | |||||
| 9/1/10, Prerefunded at | 10/1/19 (Ambac)(1) | $ 1,445,000 | $ 1,412,834 | |||
| 101% of Par (NATL)(1)(2) | $ 690,000 | $ 731,124 | Southern California Public | |||
| Santa Fe Springs | Power Auth. Rev., 6.75%, | |||||
| Community Development | 7/1/10 (GIC: PNC Bank)(1) | 2,000,000 | 2,098,960 | |||
| Commission Tax Allocation | Southern California | |||||
| Rev., Series 2002 A, 5.375%, | Public Power Auth. Rev., | |||||
| 9/1/16 (NATL)(1) | 430,000 | 433,195 | Series 2002 A, (Southern | |||
| Santa Monica-Malibu | Transmission), 5.25%, | |||||
| Unified School District GO, | 7/1/17 (FSA)(1) | 5,000,000 | 5,428,750 | |||
| 5.25%, 8/1/13(1) | 1,250,000 | 1,402,438 | Southern California | |||
| Scotts Valley COP, 4.00%, | Public Power Auth. Rev., | |||||
| 10/1/15 (FSA)(1) | 1,145,000 | 1,167,328 | Series 2002 A, (Southern | |||
| Scotts Valley COP, 4.25%, | Transmission), 5.25%, | |||||
| 10/1/18 (FSA)(1) | 1,370,000 | 1,373,274 | 7/1/18 (FSA)(1) | 3,325,000 | 3,563,103 | |
| Scotts Valley Redevelopment | Southern California Public | |||||
| Agency Tax Allocation Rev., | Power Auth. Rev., Series 2008 | |||||
| 5.00%, 8/1/29 (Ambac)(1) | 2,780,000 | 2,444,593 | A, (Southern Transmission), | |||
| 5.00%, 7/1/22(1) | 2,875,000 | 3,033,355 | ||||
| Shasta Lake Public Finance | ||||||
| Auth. Rev., 4.00%, 4/1/12(1) | 1,000,000 | 989,100 | Southern California Public | |||
| Power Auth. Rev., Series 2008 | ||||||
| Shasta Lake Public Finance | B, (Southern Transmission), | |||||
| Auth. Rev., 4.50%, 4/1/15(1) | 1,530,000 | 1,460,767 | ||||
| 6.00%, 7/1/27(1) | 2,000,000 | 2,172,480 | ||||
| Shasta Lake Public Finance | Southwestern Community | |||||
| Auth. Rev., 5.00%, 4/1/19(1) | 2,400,000 | 2,270,352 | ||||
| College District GO, 5.625%, | ||||||
| Shasta Lake Public Finance | 8/1/11, Prerefunded at | |||||
| Auth. Rev., 5.00%, 4/1/22(1) | 2,130,000 | 1,941,857 | 101% of Par (Ambac)(1)(2) | 1,975,000 | 2,177,536 | |
| Solano County COP, 5.00%, | Stockton Community | |||||
| 11/1/13 (NATL)(1) | 1,135,000 | 1,257,637 | Facilities District Special Tax | |||
| South Orange County Public | Rev., (No. 1 Weston Ranch), | |||||
| Financing Auth. Special | 5.50%, 9/1/09, Prerefunded | |||||
| Tax Rev., Series 2003 A, | at 102% of Par(1)(2) | 325,000 | 331,500 | |||
| (Senior Lien), 5.00%, | Stockton Public Financing | |||||
| 9/1/12 (NATL)(1) | 2,000,000 | 2,078,540 | Auth. Rev., Series 2006 A, | |||
| South Tahoe Joint Powers | (Redevelopment), 5.00%, | |||||
| Financing Auth. Rev., Series | 9/1/25 (Radian)(1) | 1,890,000 | 1,575,882 | |||
| 2005 A, (Redevelopment | Tuolumne Wind Project | |||||
| Project Area No. 1), 5.00%, | Auth. Rev., Series 2009 A, | |||||
| 10/1/13 (Ambac)(1) | 1,080,000 | 1,118,966 | 5.625%, 1/1/29(1) | 1,000,000 | 1,027,310 | |
| South Tahoe Joint Powers | Turlock Health Facility COP, | |||||
| Financing Auth. Rev., Series | (Emanuel Medical Center, | |||||
| 2005 A, (Redevelopment | Inc.), 4.25%, 10/15/09(1) | 785,000 | 784,443 | |||
| Project Area No. 1), 5.00%, | Turlock Health Facility COP, | |||||
| 10/1/15 (Ambac)(1) | 1,195,000 | 1,234,017 | ||||
| (Emanuel Medical Center, | ||||||
| South Tahoe Joint Powers | Inc.), 4.50%, 10/15/10(1) | 820,000 | 817,343 | |||
| Financing Auth. Rev., Series | Turlock Health Facility COP, | |||||
| 2005 A, (Redevelopment | (Emanuel Medical Center, | |||||
| Project Area No. 1), 5.00%, | Inc.), 5.00%, 10/15/12(1) | 895,000 | 889,218 | |||
| 10/1/17 (Ambac)(1) | 1,310,000 | 1,315,738 | ||||
| Turlock Health Facility COP, | ||||||
| (Emanuel Medical Center, | ||||||
| Inc.), 5.00%, 10/15/14(1) | 985,000 | 942,251 |
25
California Tax-Free Bond
| Principal | Principal | |||||
| Amount | Value | Amount | Value | |||
| Turlock Health Facility COP, | West Sacramento Financing | |||||
| (Emanuel Medical Center, | Auth. Special Tax Rev., | |||||
| Inc.), 5.50%, 10/15/15(1) | $ 1,035,000 | $ 1,001,797 | Series 2006 A, 5.00%, | |||
| Turlock Health Facility COP, | 9/1/18 (XLCA)(1) | $ 1,500,000 | $ 1,417,485 | |||
| (Emanuel Medical Center, | West Sacramento Financing | |||||
| Inc.), 5.50%, 10/15/16(1) | 1,090,000 | 1,041,386 | Auth. Special Tax Rev., | |||
| Turlock Health Facility COP, | Series 2006 A, 5.00%, | |||||
| (Emanuel Medical Center, | 9/1/19 (XLCA)(1) | 1,500,000 | 1,388,100 | |||
| Inc.), 5.50%, 10/15/17(1) | 1,150,000 | 1,083,403 | West Sacramento Financing | |||
| Turlock Irrigation District | Auth. Special Tax Rev., | |||||
| Rev., Series 2003 A, 5.00%, | Series 2006 A, 5.00%, | |||||
| 1/1/13 (NATL)(1) | 2,175,000 | 2,358,679 | 9/1/20 (XLCA)(1) | 1,350,000 | 1,231,254 | |
| University of California | 556,092,439 | |||||
| Regents Medical Center | GUAM — 1.0% | |||||
| Pooled Rev., Series 2008 D, | Guam Government Limited | |||||
| 5.00%, 5/15/27(1) | 1,000,000 | 1,032,850 | Obligation Rev., Series 2001 | |||
| University of California Rev., | A, 5.00%, 12/1/09 (FSA)(1) | 5,000,000 | 5,038,550 | |||
| Series 2009 Q, | Territory of Guam GO, Series | |||||
| 5.25%, 5/15/23(1) | 2,000,000 | 2,187,220 | 2009 A, 6.00%, 11/15/19(1) | 1,000,000 | 991,480 | |
| Val Verde Unified School | 6,030,030 | |||||
| District COP, 5.00%, | ||||||
| 1/1/14 (FGIC)(1)(2) | 1,000,000 | 1,140,650 | NORTHERN MARIANA ISLANDS — 0.2% | |||
| Val Verde Unified School | Northern Mariana Islands | |||||
| District COP, 5.25%, 1/1/15, | GO, Series 2000 A, 5.75%, | |||||
| 6/1/10 (ACA)(1) | 1,430,000 | 1,431,873 | ||||
| Prerefunded at 100% | ||||||
| of Par (FGIC)(1)(2) | 1,000,000 | 1,171,620 | PUERTO RICO — 3.6% | |||
| Val Verde Unified School | Puerto Rico Electric Power | |||||
| District COP, 5.25%, 1/1/15, | Auth. Rev., Series 2002 II, | |||||
| Prerefunded at 100% | 5.375%, 7/1/12, Prerefunded | |||||
| of Par (FGIC)(1)(2) | 1,145,000 | 1,341,505 | at 101% of Par (NATL)(1)(2) | 3,700,000 | 4,185,329 | |
| Val Verde Unified School | Puerto Rico Electric Power | |||||
| District COP, 5.25%, 1/1/15, | Auth. Rev., Series 2002 KK, | |||||
| Prerefunded at 100% | 5.25%, 7/1/13 (FSA)(1) | 2,655,000 | 2,825,106 | |||
| of Par (FGIC)(1)(2) | 1,415,000 | 1,657,842 | Puerto Rico Electric Power | |||
| Val Verde Unified School | Auth. Rev., Series 2002 KK, | |||||
| District COP, 5.25%, 1/1/15, | 5.50%, 7/1/14 (FSA)(1) | 3,140,000 | 3,372,077 | |||
| Prerefunded at 100% | Puerto Rico GO, Series 2001 | |||||
| of Par (FGIC)(1)(2) | 2,505,000 | 2,934,908 | A, (Public Improvement), | |||
| Val Verde Unified School | 5.50%, 7/1/17 (XLCA)(1) | 5,000,000 | 5,155,100 | |||
| District COP, 5.25%, 1/1/15, | Puerto Rico GO, Series 2004 | |||||
| Prerefunded at 100% | A, VRDN, 5.00%, 7/1/12(1) | 1,750,000 | 1,782,253 | |||
| of Par (FGIC)(1)(2) | 2,640,000 | 3,093,077 | Puerto Rico Government | |||
| Val Verde Unified School | Development Bank Rev., | |||||
| District COP, 5.25%, 1/1/15, | Series 2006 B, (Senior | |||||
| Prerefunded at 100% | Notes), 5.00%, 12/1/15(1) | 2,500,000 | 2,518,225 | |||
| of Par (FGIC)(1)(2) | 2,980,000 | 3,491,428 | Puerto Rico Infrastructure | |||
| Ventura County Community | Financing Auth. Special | |||||
| College District GO, Series | Tax Rev., Series 2006 B, | |||||
| 2008 C, (Election of 2002), | 4.50%, 7/1/11(1) | 1,400,000 | 1,428,392 | |||
| 5.50%, 8/1/33(1) | 3,000,000 | 3,115,470 | 21,266,482 | |||
| Vernon Electric System | ||||||
| Rev., Series 2009 A, | ||||||
| 5.125%, 8/1/21(1) | 5,000,000 | 5,001,300 | ||||
26
California Tax-Free Bond
| Principal | Principal | ||||||
| Amount | Value | Amount | Value | ||||
| U.S. VIRGIN ISLANDS — 0.7% | Virgin Islands Public Finance | ||||||
| Virgin Islands Public Finance | Auth. Rev., Series 2004 A, | ||||||
| Auth. Rev., (Virgin Islands | (Virgin Islands Matching | ||||||
| Gross Receipts Taxes Loan | Fund Loan Note and Senior | ||||||
| Note), 5.00%, 10/1/18 | Lien), 5.25%, 10/1/16(1) | $ 500,000 | $ 505,570 | ||||
| (NATL/FGIC)(1) | $ 1,000,000 | $ 988,610 | Virgin Islands Public Finance | ||||
| Virgin Islands Public Finance | Auth. Rev., Series 2004 A, | ||||||
| Auth. Rev., Series 1998 A, | (Virgin Islands Matching | ||||||
| (Senior Lien), | Fund Loan Note and Senior | ||||||
| 5.50%, 10/1/13(1) | 1,050,000 | 1,061,298 | Lien), 5.25%, 10/1/20(1) | 1,000,000 | 994,150 | ||
| Virgin Islands Public Finance | 4,228,662 | ||||||
| Auth. Rev., Series 2004 A, | TOTAL INVESTMENT | ||||||
| (Virgin Islands Matching | SECURITIES — 98.7% | ||||||
| Fund Loan Note and Senior | (Cost $572,833,260) | 589,049,486 | |||||
| Lien), 5.00%, 10/1/14(1) | 500,000 | 506,355 | OTHER ASSETS | ||||
| Virgin Islands Public Finance | AND LIABILITIES — 1.3% | 7,689,552 | |||||
| Auth. Rev., Series 2004 A, | TOTAL NET ASSETS — 100.0% | $596,739,038 | |||||
| (Virgin Islands Matching | |||||||
| Fund Loan Note and Senior | |||||||
| Lien), 5.25%, 10/1/15(1) | 170,000 | 172,679 | |||||
| Futures Contracts | |||
| Underlying Face | |||
| Contracts Sold | Expiration Date | Amount at Value | Unrealized Gain (Loss) |
| 100 U.S. Long Bond | December 2009 | $11,975,000 | $(221,319) |
| Notes to Schedule of Investments | |||
| ACA = American Capital Access | (1) | Security, or a portion thereof, has been segregated for futures | |
| AGC = Assured Guaranty Corporation | contracts. At the period end, the aggregate value of securities | ||
| Ambac = Ambac Assurance Corporation | pledged was $11,975,000. | ||
| COP = Certificates of Participation | (2) | Escrowed to maturity in U.S. government securities or state and | |
| local government securities. | |||
| FGIC = Financial Guaranty Insurance Company | (3) | Security was purchased under Rule 144A of the Securities Act of | |
| FGIC-TCRS = Financial Guaranty Insurance Company - Transferable | 1933 or is a private placement and, unless registered under the | ||
| Custodial Receipts | Act or exempted from registration, may only be sold to qualified | ||
| FSA = Financial Security Assurance, Inc. | institutional investors. The aggregate value of these securities at | ||
| FSA-CR = Financial Security Assurance, Inc. - Custodial Receipts | the period end was $1,169,152, which represented 0.2% of total | ||
| net assets. | |||
| GIC = Guaranteed Investment Contact | |||
| (4) | Security is a zero-coupon municipal bond. The rate indicated is the | ||
| GO = General Obligation | yield to maturity at purchase. Zero-coupon securities are issued at | ||
| LOC = Letter of Credit | a substantial discount from their value at maturity. | ||
| M-S-R = Modesto, Stockton, Redding | (5) | Convertible capital appreciation bond. These securities are | |
| NATL = National Public Finance Guarantee Corporation | issued with a zero-coupon and become interest bearing at a | ||
| predetermined rate and date and are issued at a substantial | |||
| NATL-IBC = National Public Finance Guarantee Corporation - Insured | discount from their value at maturity. Interest reset or final maturity | ||
| Bond Certificates | date is indicated, as applicable. Rate shown is effective at the | ||
| Radian = Radian Asset Assurance, Inc. | period end. | ||
| SBBPA = Standby Bond Purchase Agreement | |||
| VRDN = Variable Rate Demand Note. Interest reset date is indicated. | |||
| Rate shown is effective at the period end. | See Notes to Financial Statements. | ||
| VRN = Variable Rate Note. Interest reset date is indicated. Rate shown | |||
| is effective at the period end. | |||
| XLCA = XL Capital Ltd. | |||
| XLCA-ICR = XL Capital Ltd. - Insured Custodial Receipts | |||
27
| Statement of Assets and Liabilities |
| AUGUST 31, 2009 | ||
| California Tax-Free | California | |
| Money Market | Tax-Free Bond | |
| Assets | ||
| Investment securities, at value (cost of $433,597,422 | ||
| and $572,833,260, respectively) | $433,597,422 | $589,049,486 |
| Cash | 769,337 | 506,162 |
| Receivable for investments sold | 5,300,095 | 474,475 |
| Receivable for capital shares sold | 1,169,339 | 1,008,849 |
| Interest receivable | 482,852 | 7,445,477 |
| Prepaid temporary guarantee program fees | 10,854 | — |
| 441,329,899 | 598,484,449 | |
| Liabilities | ||
| Payable for investments purchased | 100,000 | 340,946 |
| Payable for capital shares redeemed | 1,437,804 | 707,367 |
| Payable for variation margin on futures contracts | — | 65,625 |
| Accrued management fees | 154,749 | 238,869 |
| Dividends payable | 166 | 392,604 |
| 1,692,719 | 1,745,411 | |
| Net Assets | $439,637,180 | $596,739,038 |
| Capital Shares | ||
| Outstanding (unlimited number of shares authorized) | 439,568,733 | 54,371,560 |
| Net Asset Value Per Share | $1.00 | $10.98 |
| Net Assets Consist of: | ||
| Capital paid in | $439,568,729 | $590,838,481 |
| Accumulated undistributed net investment income (loss) | (166) | 133,069 |
| Accumulated undistributed net realized gain (loss) | ||
| on investment transactions | 68,617 | (10,227,419) |
| Net unrealized appreciation on investments | — | 15,994,907 |
| $439,637,180 | $596,739,038 | |
| See Notes to Financial Statements. | ||
28
| Statement of Operations |
| YEAR ENDED AUGUST 31, 2009 | ||
| California Tax-Free | California | |
| Money Market | Tax-Free Bond | |
| Investment Income (Loss) | ||
| Income: | ||
| Interest | $6,694,382 | $26,224,810 |
| Expenses: | ||
| Management fees | 2,498,837 | 2,777,896 |
| Temporary guarantee program fees | 215,880 | — |
| Portfolio insurance | 45,760 | — |
| Trustees’ fees and expenses | 27,682 | 31,034 |
| Other expenses | 3,292 | 1,602 |
| 2,791,451 | 2,810,532 | |
| Fees waived | (320,851) | — |
| 2,470,600 | 2,810,532 | |
| Net investment income (loss) | 4,223,782 | 23,414,278 |
| Realized and Unrealized Gain (Loss) | ||
| Net realized gain (loss) on: | ||
| Investment transactions | 73,055 | (6,129,996) |
| Futures contract transactions | — | 1,042,659 |
| 73,055 | (5,087,337) | |
| Change in net unrealized appreciation (depreciation) on: | ||
| Investment | — | 4,944,107 |
| Futures contracts | — | (217,094) |
| — | 4,727,013 | |
| Net realized and unrealized gain (loss) | 73,055 | (360,324) |
| Net Increase (Decrease) in Net Assets Resulting from Operations | $4,296,837 | $23,053,954 |
| See Notes to Financial Statements. | ||
29
| Statement of Changes in Net Assets |
| YEARS ENDED AUGUST 31, 2009 AND AUGUST 31, 2008 | ||||
| California Tax-Free Money Market | California Tax-Free Bond | |||
| Increase (Decrease) in Net Assets | 2009 | 2008 | 2009 | 2008 |
| Operations | ||||
| Net investment income (loss) | $ 4,223,782 | $ 13,286,421 | $ 23,414,278 | $ 23,478,801 |
| Net realized gain (loss) | 73,055 | 44,508 | (5,087,337) | (2,670,165) |
| Change in net unrealized | ||||
| appreciation (depreciation) | — | — | 4,727,013 | 4,477,924 |
| Net increase (decrease) in net assets | ||||
| resulting from operations | 4,296,837 | 13,330,929 | 23,053,954 | 25,286,560 |
| Distributions to Shareholders | ||||
| From net investment income | (4,223,782) | (13,286,421) | (23,282,784) | (23,478,801) |
| From net realized gains | — | (173,341) | — | — |
| Decrease in net assets from distributions | (4,223,782) | (13,459,762) | (23,282,784) | (23,478,801) |
| Capital Share Transactions | ||||
| Proceeds from shares sold | 206,688,782 | 310,311,383 | 132,296,225 | 120,299,092 |
| Issued in connection with acquisition | ||||
| (Note 10) | — | — | — | 124,217,258 |
| Proceeds from reinvestment of distributions | 3,928,321 | 12,578,608 | 18,658,483 | 18,991,692 |
| Payments for shares redeemed | (351,102,162) | (295,058,722) | (164,962,371) | (116,586,293) |
| Net increase (decrease) in net assets | ||||
| from capital share transactions | (140,485,059) | 27,831,269 | (14,007,663) | 146,921,749 |
| Net increase (decrease) in net assets | (140,412,004) | 27,702,436 | (14,236,493) | 148,729,508 |
| Net Assets | ||||
| Beginning of period | 580,049,184 | 552,346,748 | 610,975,531 | 462,246,023 |
| End of period | $439,637,180 | $580,049,184 | $596,739,038 | $610,975,531 |
| Accumulated undistributed | ||||
| net investment income (loss) | $(166) | — | $133,069 | $1,575 |
| Transactions in Shares of the Fund | ||||
| Sold | 206,688,782 | 310,311,383 | 12,355,744 | 10,931,066 |
| Issued in connection with acquisition | ||||
| (Note 10) | — | — | — | 11,372,787 |
| Issued in reinvestment of distributions | 3,928,321 | 12,578,608 | 1,742,660 | 1,731,627 |
| Redeemed | (351,102,162) | (295,058,722) | (15,494,704) | (10,606,944) |
| Net increase (decrease) in shares | ||||
| of the funds | (140,485,059) | 27,831,269 | (1,396,300) | 13,428,536 |
| See Notes to Financial Statements. | ||||
30
| Notes to Financial Statements |
AUGUST 31, 2009
1. Organization and Summary of Significant Accounting Policies
Organization — American Century California Tax-Free and Municipal Funds (the trust) is registered under the Investment Company Act of 1940 (the 1940 Act) as an open-end management investment company. California Tax-Free Money Market Fund (Tax-Free Money Market) and California Tax-Free Bond Fund (Tax-Free Bond) (collectively, the funds) are two funds in a series issued by the trust. Tax-Free Money Market is diversified under Rule 2a-7 of the 1940 Act. Tax-Free Bond is diversified under the 1940 Act. The funds’ investment objectives are to seek safety of principal and high current income that is exempt from federal and California income taxes. Tax-Free Money Market invests primarily in municipal obligations with very short-term maturities. Tax-Free Bond invests primarily in municipal obligations of all maturity ranges. The following is a summary of the funds’ significant accounting policies.
Security Valuations — Securities of Tax-Free Money Market are valued at amortized cost, which approximates current market value. Securities of Tax-Free Bond are valued at current market value as provided by a commercial pricing service or at the mean of the most recent bid and asked prices. Debt securities maturing within 60 days at the time of purchase may be valued at cost, plus or minus any amortized discount or premium. If an event occurs after the value of a security was established but before net asset value per share was determined that was likely to materially change the net asset value, that security would be valued as determined in accordance with procedures adopted by the Board of Trustees. If the funds determine that the market price of a portfolio security is not readily available, or that the valuation methods mentioned above do not reflect the security’s fair value, such security is valued as determined by the Board of Trustees or its designee, in accordance with procedures adopted by the Board of Trustees, if such determination would materially impact a fund’s net asset value. Certain other circumstances may cause the funds to use alternative procedures to value a security such as: a security has been declared in default; trading in a security has been halted during the trading day; or there is a foreign market holiday and no trading will commence.
Security Transactions — For financial reporting purposes, security transactions are accounted for as of the trade date. Net realized gains and losses are determined on the identified cost basis, which is also used for federal income tax purposes.
Investment Income — Interest income is recorded on the accrual basis and includes accretion of discounts and amortization of premiums.
When-Issued — The funds may engage in securities transactions on a when-issued basis. Under these arrangements, the securities’ prices and yields are fixed on the date of the commitment, but payment and delivery are scheduled for a future date. During this period, securities are subject to market fluctuations. The funds will segregate cash, cash equivalents or other appropriate liquid securities on its records in amounts sufficient to meet the purchase price.
Income Tax Status — It is each fund’s policy to distribute substantially all net investment income and net realized gains to shareholders and to otherwise qualify as a regulated investment company under provisions of the Internal Revenue Code. The funds are no longer subject to examination by tax authorities for years prior to 2006. At this time, management believes there are no uncertain tax positions which, based on their technical merit, would not be sustained upon examination and for which it is reasonably possible that the total amounts of unrecognized tax benefits will significantly change in the next twelve months. Accordingly, no provision has been made for federal or state income taxes. Interest and penalties associated with any federal or state income tax obligations, if any, are recorded as interest expense.
31
Distributions to Shareholders — Distributions from net investment income are declared daily and paid monthly. Distributions from net realized gains, if any, are generally declared and paid annually.
Indemnifications — Under the trust’s organizational documents, its officers and trustees are indemnified against certain liabilities arising out of the performance of their duties to the funds. In addition, in the normal course of business, the funds enter into contracts that provide general indemnifications. The maximum exposure under these arrangements is unknown as this would involve future claims that may be made against a fund. The risk of material loss from such claims is considered by management to be remote.
Use of Estimates — The financial statements are prepared in conformity with accounting principles generally accepted in the United States of America, which may require management to make certain estimates and assumptions at the date of the financial statements. Actual results could differ from these estimates.
Subsequent Events — Management has evaluated events or transactions that may have occurred since August 31, 2009, that would merit recognition or disclosure in the financial statements. This evaluation was completed through October 29, 2009, the date the financial statements were issued.
2. Fees and Transactions with Related Parties
Management Fees — The trust has entered into a Management Agreement with American Century Investment Management, Inc. (ACIM) (the investment advisor), under which ACIM provides the funds with investment advisory and management services in exchange for a single, unified management fee (the fee). The Agreement provides that all expenses of the funds, except brokerage commissions, taxes, portfolio insurance, temporary guarantee program fees, interest, fees and expenses of those trustees who are not considered “interested persons” as defined in the 1940 Act (including counsel fees) and extraordinary expenses, will be paid by ACIM. The fee is computed and accrued daily based on the daily net assets of each specific class of shares of each fund and paid monthly in arrears. The fee consists of (1) an Investment Category Fee based o n the daily net assets of the funds and certain other accounts managed by the investment advisor that are in the same broad investment category as each fund and (2) a Complex Fee based on the assets of all the funds in the American Century Investments family of funds. The rates for the Investment Category Fee range from 0.1570% to 0.2700% for Tax-Free Money Market and from 0.1625% to 0.2800% for Tax-Free Bond. The rates for the Complex Fee range from 0.2500% to 0.3100%. From August 1, 2008 to July 31, 2009, ACIM voluntarily agreed to waive 0.06% of its management fee for Tax-Free Money Market. In order to maintain a positive yield, ACIM may voluntarily waive a portion of its management fee on a daily basis. The effective annual management fee for Tax-Free Money Market for the year ended August 31, 2009 was 0.49% before waiver and 0.43% after waiver. The effective annual management fee was 0.48% for Tax-Free Bond for the year ended August 31, 2009.
Money Market Insurance — Tax-Free Money Market, along with other money market funds managed by ACIM, entered into an insurance agreement with Ambac Assurance Corporation (Ambac). Ambac provided limited coverage for certain loss events including issuer defaults as to payment of principal or interest and insolvency of a credit enhancement provider. Tax-Free Money Market paid annual premiums to Ambac, which were amortized daily over one year. For the year ended August 31, 2009, the ratio of money market insurance expense to average net assets was 0.01%. The agreement expired on January 31, 2009, and was not renewed.
32
Temporary Guarantee Program — On October 3, 2008, the Board of Trustees approved Tax-Free Money Market to participate in the U.S. Treasury Department’s Temporary Guarantee Program for Money Market Funds (the program). The program provides coverage to guarantee the account values of shareholders in the event the fund’s net asset value falls below $0.995 and the Trustees liquidate the fund. The program covers the lesser of a shareholder’s account value on September 19, 2008, or on the date of liquidation. Participation in the program requires Tax-Free Money Market to pay a fee based on the net assets of Tax-Free Money Market as of the close of business on September 19, 2008, which is amortized daily over the period. Tax-Free Money Market participated in the program from September 19, 2008 through December 19, 2008 and paid a fee of 0.01% of its net assets as of September 19, 2008. Tax-Free Money Market continued its participation in the program from December 20, 2008 through April 30, 2009 and paid a fee of 0.015% of its net assets as of September 19, 2008. Tax-Free Money Market continued its participation in a program extension from May 1, 2009 through September 18, 2009 and paid a fee of 0.015% of its net assets as of September 19, 2008. The program expired on September 18, 2009. For the year ended August 31, 2009, the annualized ratio of the program fee to average net assets was 0.04%.
Related Parties — Certain officers and trustees of the trust are also officers and/or directors of American Century Companies, Inc. (ACC), the parent of the trust’s investment advisor, ACIM, the distributor of the trust, American Century Investment Services, Inc., and the trust’s transfer agent, American Century Services, LLC.
The funds have a Mutual Funds Services Agreement with J.P. Morgan Investor Services Co. (JPMIS). JPMorgan Chase Bank (JPMCB) is a custodian of the funds. JPMIS and JPMCB are wholly owned subsidiaries of JPMorgan Chase & Co. (JPM). JPM is an equity investor in ACC.
3. Investment Transactions
All investment transactions for Tax-Free Money Market were considered short-term during the year ended August 31, 2009.
Purchases and sales of investment securities for Tax-Free Bond, excluding short-term investments, for the year ended August 31, 2009, were $202,290,396 and $214,330,764 respectively.
4. Fair Value Measurements
The funds’ securities valuation process is based on several considerations and may use multiple inputs to determine the fair value of the positions held by the funds. In conformity with accounting principles generally accepted in the United States of America, the inputs used to determine a valuation are classified into three broad levels as follows:
• Level 1 valuation inputs consist of actual quoted prices in an active market for identical securities;
• Level 2 valuation inputs consist of significant direct or indirect observable market data (including quoted prices for similar securities, evaluations of subsequent market events, interest rates, prepayment speeds, credit risk, etc.); or
• Level 3 valuation inputs consist of significant unobservable inputs (including a fund’s own assumptions).
The level classification is based on the lowest level input that is significant to the fair valuation measurement. The valuation inputs are not an indication of the risks associated with investing in these securities or other financial instruments.
33
As of August 31, 2009, the valuation inputs used to determine the fair value of Tax-Fee Money Market’s municipal securities were classified as Level 2.
As of August 31, 2009, the valuation inputs used to determine the fair value of Tax-Fee Bond’s municipal securities and unrealized gain (loss) on futures contracts were classified as Level 2 and Level 1, respectively.
5. Derivative Instruments
Interest Rate Risk — Tax-Free Bond is subject to interest rate risk in the normal course of pursuing its investment objectives. The value of bonds generally declines as interest rates rise. A fund may enter into futures contracts based on a bond index or a specific underlying security. A fund may purchase futures contracts to gain exposure to increases in market value or sell futures contracts to protect against a decline in market value. Upon entering into a futures contract, a fund will segregate cash, cash equivalents or other appropriate liquid securities on its records in amounts sufficient to meet requirements. Subsequent payments (variation margin) are made or received daily, in cash, by a fund. The variation margin is equal to the daily change in the contract value and is recorded as unrealized gains and losses. A fund recogni zes a realized gain or loss when the futures contract is closed or expires. Net realized and unrealized gains or losses occurring during the holding period of futures contracts are a component of net realized gain (loss) on futures contract transactions and change in net unrealized appreciation (depreciation) on futures contracts, respectively. One of the risks of entering into futures contracts is the possibility that the change in value of the contract may not correlate with the changes in value of the underlying securities. During the year ended August 31, 2009, Tax-Free Bond purchased and sold futures contracts.
For Tax-Free Bond, the value of interest rate risk derivatives as of August 31, 2009, is disclosed on the Statement of Assets and Liabilities as a liability of $65,625 in payable for variation margin on futures contracts. For Tax-Free Bond, for the year ended August 31, 2009, the effect of interest rate risk derivatives on the Statement of Operations was $1,042,659 in net realized gain (loss) on futures contract transactions and $(217,094) in change in net unrealized appreciation (depreciation) on futures contracts.
The value of derivative instruments at period end and the effect of derivatives on the Statement of Operations is indicative of Tax-Free Bond’s typical volume.
6. Bank Line of Credit
Tax-Free Bond, along with certain other funds in the American Century Investments family of funds, had a $500,000,000 unsecured bank line of credit agreement with Bank of America, N.A. The line expired December 10, 2008, and was not renewed. The agreement allowed the funds to borrow money for temporary or emergency purposes to fund shareholder redemptions. Borrowings under the agreement were subject to interest at the Federal Funds rate plus 0.40%. Tax-Free Bond did not borrow from the line during the year ended August 31, 2009.
34
7. Interfund Lending
The funds, along with certain other funds in the American Century Investments family of funds, may participate in an interfund lending program, pursuant to an Exemptive Order issued by the Securities and Exchange Commission (SEC). This program provides an alternative credit facility allowing the funds to borrow from or lend to other funds in the American Century Investments family of funds that permit such transactions. Interfund lending transactions are subject to each fund’s investment policies and borrowing and lending limits. The interfund loan rate earned/paid on interfund lending transactions is determined daily based on the average of certain current market rates. Interfund lending transactions normally extend only overnight, but can have a maximum duration of seven days. The program is subject to annual approval by the Board of Trustees. During the year ended August 31, 2009, the funds did not utilize the program.
8. Risk Factors
The funds concentrate their investments in a single state and therefore may have more exposure to credit risk related to the state of California than a fund with a broader geographical diversification. Income may be subject to state and local taxes and, if applicable, the alternative minimum tax.
9. Federal Tax Information
The tax character of distributions paid during the years ended August 31, 2009 and August 31, 2008 were as follows:
| Tax-Free Money Market | Tax-Free Bond | |||
| 2009 | 2008 | 2009 | 2008 | |
| Distributions Paid From | ||||
| Exempt income | $4,219,344 | $13,291,025 | $23,282,784 | $23,477,398 |
| Taxable ordinary income | $1,217 | $12,012 | — | $1,403 |
| Long-term capital gains | $3,221 | $156,725 | — | — |
The book-basis character of distributions made during the year from net investment income or net realized gains may differ from their ultimate characterization for federal income tax purposes. These differences reflect the differing character of certain income items and net realized gains and losses for financial statement and tax purposes, and may result in reclassification among certain capital accounts on the financial statements.
35
As of August 31, 2009, the components of distributable earnings on a tax-basis and the federal tax cost of investments were as follows:
| Tax-Free | ||
| Money Market | Tax-Free Bond | |
| Federal tax cost of investments | $433,597,422 | $573,671,385 |
| Gross tax appreciation of investments | — | $22,878,842 |
| Gross tax depreciation of investments | — | (7,500,741) |
| Net tax appreciation (depreciation) of investments | — | $15,378,101 |
| Undistributed ordinary income | $68,451 | — |
| Undistributed exempt income | — | $133,069 |
| Accumulated capital losses | — | $(5,305,027) |
| Capital loss deferrals | — | $(4,305,586) |
The difference between book-basis and tax-basis cost and unrealized appreciation (depreciation) is attributable primarily to the tax deferral of losses on straddle positions and the realization for tax purposes of unrealized gain (loss) for certain futures contracts.
The accumulated capital losses listed above represent net capital loss carryovers that may be used to offset future realized capital gains for federal income tax purposes. Future capital loss carryover utilization in any given year may be subject to Internal Revenue Code limitations. The capital loss carryovers expire as follows:
| 2011 | 2012 | 2013 | 2014 | 2015 | 2016 | 2017 | |
| Tax-Free Bond | $905,757 | — | $405,593 | $322,273 | $551,134 | $275,673 | $2,844,597 |
The capital loss deferrals listed above represent net capital losses incurred in the ten-month period ended August 31, 2009. Tax-Free Bond has elected to treat such losses as having been incurred in the following fiscal year for federal income tax purposes.
10. Reorganization Plan
On December 8, 2006, the Board of Trustees approved a plan of reorganization (the reorganization) pursuant to which Tax-Free Bond acquired all of the assets of California Limited-Term Tax-Free Fund (Limited-Term), one fund in a series issued by the trust, in exchange for shares of equal value of Tax-Free Bond and the assumption by Tax-Free Bond of certain of Limited-Term’s ordinary course liabilities. The financial statements and performance history of Tax-Free Bond was carried over in the post-reorganization. The reorganization was effective after the close of business on August 31, 2007. New shares in connection with the reorganization were issued by Tax-Free Bond on September 4, 2007.
The acquisition was accomplished by a tax-free exchange of 11,372,787 shares of Tax-Free Bond for 12,057,363 outstanding shares of Limited-Term. The net assets of Limited-Term and Tax-Free Bond immediately before the acquisition were $124,217,258 and $462,246,023, respectively. Limited-Term’s unrealized appreciation of $404,931 was combined with that of Tax-Free Bond. Immediately after the acquisition, the combined net assets were $586,463,281. Tax-Free Bond acquired accumulated capital losses and capital loss deferrals of $(1,633,013) and $(212,243), respectively, from Limited-Term.
36
11. Recently Issued Accounting Standards
The Financial Accounting Standards Board (FASB) issued Statement of Financial Accounting Standards No. 157, “Fair Value Measurements” (FAS 157), in September 2006, which is effective for fiscal years beginning after November 15, 2007. FAS 157 defines fair value, establishes a framework for measuring fair value and expands the required financial statement disclosures about fair value measurements. The adoption of FAS 157 did not materially impact the determination of fair value.
In March 2008, the FASB issued Statement of Financial Accounting Standards No. 161, “Disclosures about Derivative Instruments and Hedging Activities — an amendment of FASB Statement No. 133” (FAS 161). FAS 161 is effective for interim periods beginning after November 15, 2008 and has been adopted by the funds. FAS 161 amends and expands disclosures about derivative instruments and hedging activities. FAS 161 requires qualitative disclosures about the objectives and strategies of derivative instruments, quantitative disclosures about the fair value amounts of and gains and losses on derivative instruments, and disclosures of credit-risk-related contingent features in hedging activities.
12. Other Tax Information (Unaudited)
The following information is provided pursuant to provisions of the Internal Revenue Code.
Tax-Free Money Market and Tax-Free Bond hereby designate $4,233,723 and $23,192,474, respectively, or up to the maximum amount allowable, of exempt interest distributions for the fiscal year ended August 31, 2009.
Tax-Free Money Market hereby designates $3,221, or up to the maximum amount allowable, of long-term capital gain distributions for the fiscal year ended August 31, 2009.
Tax-Free Money Market hereby designates $1,217 of distributions as qualified short-term capital gains for purposes of Internal Revenue Code Section 871.
37
| Financial Highlights |
| California Tax-Free Money Market | |||||
| For a Share Outstanding Throughout the Years Ended August 31 | |||||
| 2009 | 2008 | 2007 | 2006 | 2005 | |
| Per-Share Data | |||||
| Net Asset Value, Beginning of Period | $1.00 | $1.00 | $1.00 | $1.00 | $1.00 |
| Income From Investment Operations | |||||
| Net Investment Income (Loss) | 0.01 | 0.02 | 0.03 | 0.03 | 0.02 |
| Distributions | |||||
| From Net Investment Income | (0.01) | (0.02) | (0.03) | (0.03) | (0.02) |
| From Net Realized Gains | — | —(1) | — | — | — |
| Total Distributions | (0.01) | (0.02) | (0.03) | (0.03) | (0.02) |
| Net Asset Value, End of Period | $1.00 | $1.00 | $1.00 | $1.00 | $1.00 |
| Total Return(2) | 0.77% | 2.38% | 3.16% | 2.70% | 1.54% |
| Ratios/Supplemental Data | |||||
| Ratio of Operating Expenses | |||||
| to Average Net Assets | 0.49%(3) | 0.47%(3) | 0.49%(3) | 0.52%(3) | 0.52% |
| Ratio of Operating Expenses to Average | |||||
| Net Assets (Before Expense Waiver) | 0.55% | 0.51% | 0.51% | 0.52% | 0.52% |
| Ratio of Net Investment Income (Loss) | |||||
| to Average Net Assets | 0.83%(3) | 2.32%(3) | 3.12%(3) | 2.64%(3) | 1.53% |
| Net Investment Income (Loss) to Average | |||||
| Net Assets (Before Expense Waiver) | 0.77% | 2.28% | 3.10% | 2.64% | 1.53% |
| Net Assets, End of Period (in thousands) | $439,637 | $580,049 | $552,347 | $530,013 | $617,356 |
| (1) | Per-share amount was less than $0.005. |
| (2) | Total return assumes reinvestment of net investment income and capital gains distributions, if any. |
| (3) | Effective August 1, 2006, the investment advisor voluntarily agreed to waive a portion of its management fee. |
See Notes to Financial Statements.
38
California Tax-Free Bond
| For a Share Outstanding Throughout the Years Ended August 31 | |||||
| 2009 | 2008 | 2007 | 2006 | 2005 | |
| Per-Share Data | |||||
| Net Asset Value, Beginning of Period | $10.96 | $10.92 | $11.15 | $11.33 | $11.41 |
| Income From Investment Operations | |||||
| Net Investment Income (Loss) | 0.44 | 0.44 | 0.45 | 0.46 | 0.46 |
| Net Realized and Unrealized Gain (Loss) | 0.01 | 0.04 | (0.23) | (0.18) | (0.08) |
| Total From Investment Operations | 0.45 | 0.48 | 0.22 | 0.28 | 0.38 |
| Distributions | |||||
| From Net Investment Income | (0.43) | (0.44) | (0.45) | (0.46) | (0.46) |
| From Net Realized Gains | — | — | — | —(1) | — |
| Total Distributions | (0.43) | (0.44) | (0.45) | (0.46) | (0.46) |
| Net Asset Value, End of Period | $10.98 | $10.96 | $10.92 | $11.15 | $11.33 |
| Total Return(2) | 4.32% | 4.42% | 1.98% | 2.58% | 3.36% |
| Ratios/Supplemental Data | |||||
| Ratio of Operating Expenses | |||||
| to Average Net Assets | 0.49% | 0.49% | 0.49% | 0.49% | 0.49% |
| Ratio of Net Investment Income (Loss) | |||||
| to Average Net Assets | 4.07% | 3.96% | 4.06% | 4.13% | 4.02% |
| Portfolio Turnover Rate | 36% | 41% | 41% | 34% | 34% |
| Net Assets, End of Period (in thousands) | $596,739 | $610,976 | $462,246 | $432,052 | $435,887 |
| (1) | Per-share amount was less than $0.005. |
| (2) | Total return assumes reinvestment of net investment income and capital gains distributions, if any. |
See Notes to Financial Statements.
39
| Report of Independent Registered Public Accounting Firm |
To the Trustees of the American Century California Tax-Free and Municipal Funds and Shareholders of the California Tax-Free Money Market Fund and the California Tax-Free Bond Fund:
In our opinion, the accompanying statements of assets and liabilities, including the schedules of investments, and the related statements of operations and of changes in net assets and the financial highlights present fairly, in all material respects, the financial position of the California Tax-Free Money Market Fund and the California Tax-Free Bond Fund (two of the four funds in the American Century California Tax-Free and Municipal Funds, hereafter referred to as the “Funds”) at August 31, 2009, the results of each of their operations for the year then ended, the changes in each of their net assets for each of the two years in the period then ended and the financial highlights for each of the five years in the period then ended, in conformity with accounting principles generally accepted in the United States of America. These financial statements and financial highlights (hereafter referred to as “financial st atements”) are the responsibility of the Funds’ management; our responsibility is to express an opinion on these financial statements based on our audits. We conducted our audits of these financial statements in accordance with the standards of the Public Company Accounting Oversight Board (United States). Those standards require that we plan and perform the audit to obtain reasonable assurance about whether the financial statements are free of material misstatement. An audit includes examining, on a test basis, evidence supporting the amounts and disclosures in the financial statements, assessing the accounting principles used and significant estimates made by management, and evaluating the overall financial statement presentation. We believe that our audits, which included confirmation of securities at August 31, 2009 by correspondence with the custodian and brokers, provide a reasonable basis for our opinion.
PricewaterhouseCoopers LLP
Kansas City, Missouri
October 29, 2009
40
| Management |
The individuals listed below serve as trustees or officers of the funds. Each trustee serves until his or her successor is duly elected and qualified or until he or she retires. Effective March 2004, mandatory retirement age for independent trustees is 73. However, the mandatory retirement age may be extended for a period not to exceed two years with the approval of the remaining independent trustees. Those listed as interested trustees are “interested” primarily by virtue of their engagement as directors and/ or officers of, or ownership interest in, American Century Companies, Inc. (ACC) or its wholly owned, direct or indirect, subsidiaries, including the fund’s investment advisor, American Century Investment Management, Inc. (ACIM or the advisor); the fund’s principal underwriter, American Century Investment Services, Inc. (ACIS); and the fund’s transfer agent, American Century Services, LLC (ACS).
The other trustees (more than three-fourths of the total number) are independent; that is, they have never been employees, directors or officers of, and have no financial interest in, ACC or any of its wholly owned, direct or indirect, subsidiaries, including ACIM, ACIS and ACS. The trustees serve in this capacity for eight registered investment companies in the American Century Investments family of funds.
All persons named as officers of the funds also serve in similar capacities for the other 14 registered investment companies in the American Century Investments family of funds advised by ACIM or American Century Global Investment Management, Inc. (ACGIM), a wholly owned subsidiary of ACIM, unless otherwise noted. Only officers with policy-making functions are listed. No officer is compensated for his or her service as an officer of the funds. The listed officers are interested persons of the funds and are appointed or re-appointed on an annual basis.
Interested Trustee
Jonathan S. Thomas, 4500 Main Street, Kansas City, MO 64111
Year of Birth: 1963
Position(s) Held with Funds: Trustee (since 2007) and President (since 2007)
Principal Occupation(s) During Past 5 Years: President and Chief Executive Officer, ACC
(March 2007 to present); Chief Administrative Officer, ACC (February 2006 to
February 2007); Executive Vice President, ACC (November 2005 to February 2007)
Also serves as: President, Chief Executive Officer and Director, ACS; Executive
Vice President, ACIM and ACGIM; Director, ACIM, ACGIM, ACIS and other ACC
subsidiaries. Managing Director, Morgan Stanley (March 2000 to November 2005)
Number of Portfolios in Fund Complex Overseen by Trustee: 103
Other Directorships Held by Trustee: None
Independent Trustees
John Freidenrich, 1665 Charleston Road, Mountain View, CA 94043
Year of Birth: 1937
Position(s) Held with Funds: Trustee (since 2005)
Principal Occupation(s) During Past 5 Years: Member and Manager, Regis Management
Company, LLC (money management firm) (April 2004 to present); Partner and
Founder, Bay Partners (venture capital firm) (1976 to 2006)
Number of Portfolios in Fund Complex Overseen by Trustee: 40
Other Directorships Held by Trustee: None
41
Ronald J. Gilson, 1665 Charleston Road, Mountain View, CA 94043
Year of Birth: 1946
Position(s) Held with Funds: Trustee (since 1995) and Chairman of the Board (since 2005)
Principal Occupation(s) During Past 5 Years: Charles J. Meyers Professor of Law and Business,
Stanford Law School (1979 to present); Marc and Eva Stern Professor of Law and
Business, Columbia University School of Law (1992 to present)
Number of Portfolios in Fund Complex Overseen by Trustee: 40
Other Directorships Held by Trustee: None
Frederick L.A. Grauer, 1665 Charleston Road, Mountain View, CA 94043
Year of Birth: 1946
Position(s) Held with Funds: Trustee (since 2008)
Principal Occupation(s) During Past 5 Years: Senior Advisor, Barclays Global Investors (asset
manager) (2003 to present)
Number of Portfolios in Fund Complex Overseen by Trustee: 40
Other Directorships Held by Trustee: None
Peter F. Pervere, 1665 Charleston Road, Mountain View, CA 94043
Year of Birth: 1947
Position(s) Held with Funds: Trustee (since 2007)
Principal Occupation(s) During Past 5 Years: Retired, formerly Vice President and Chief
Financial Officer, Commerce One, Inc. (software and services provider)
Number of Portfolios in Fund Complex Overseen by Trustee: 40
Other Directorships Held by Trustee: None
Myron S. Scholes, 1665 Charleston Road, Mountain View, CA 94043
Year of Birth: 1941
Position(s) Held with Funds: Trustee (since 1980)
Principal Occupation(s) During Past 5 Years: Chairman, Platinum Grove Asset Management,
L.P. (asset manager) (1999 to present); Frank E. Buck Professor of Finance-Emeritus,
Stanford Graduate School of Business (1996 to present)
Number of Portfolios in Fund Complex Overseen by Trustee: 40
Other Directorships Held by Trustee: Dimensional Fund Advisors
John B. Shoven, 1665 Charleston Road, Mountain View, CA 94043
Year of Birth: 1947
Position(s) Held with Funds: Trustee (since 2002)
Principal Occupation(s) During Past 5 Years: Professor of Economics, Stanford University
(1973 to present)
Number of Portfolios in Fund Complex Overseen by Trustee: 40
Other Directorships Held by Trustee: Cadence Design Systems; E×ponent
Jeanne D. Wohlers, 1665 Charleston Road, Mountain View, CA 94043
Year of Birth: 1945
Position(s) Held with Funds: Trustee (since 1984)
Principal Occupation(s) During Past 5 Years: Retired
Number of Portfolios in Fund Complex Overseen by Trustee: 40
Other Directorships Held by Trustee: None
42
Officers
Barry Fink, 4500 Main Street, Kansas City, MO 64111
Year of Birth: 1955
Position(s) Held with Funds: Executive Vice President (since 2007)
Principal Occupation(s) During Past 5 Years: Chief Operating Officer and Executive Vice
President, ACC (September 2007 to present); President, ACS (October 2007 to
present); Managing Director, Morgan Stanley (2000 to 2007); Global General
Counsel, Morgan Stanley (2000 to 2006). Also serves as: Director, ACC, ACS, ACIS
and other ACC subsidiaries
Maryanne Roepke, 4500 Main Street, Kansas City, MO 64111
Year of Birth: 1956
Position(s) Held with Funds: Chief Compliance Officer (since 2006) and Senior Vice
President (since 2000)
Principal Occupation(s) During Past 5 Years: Chief Compliance Officer, ACIM, ACGIM
and ACS (August 2006 to present); Assistant Treasurer, ACC (January 1995 to
August 2006); and Treasurer and Chief Financial Officer, various American
Century Investments funds (July 2000 to August 2006). Also serves as: Senior
Vice President, ACS
Charles A. Etherington, 4500 Main Street, Kansas City, MO 64111
Year of Birth: 1957
Position(s) Held with Funds: General Counsel (since 2007) and Senior Vice President
(since 2006)
Principal Occupation(s) During Past 5 Years: Attorney, ACC (February 1994 to present); Vice
President, ACC (November 2005 to present); General Counsel, ACC (March 2007
to present). Also serves as: General Counsel, ACIM, ACGIM, ACS, ACIS and other
ACC subsidiaries; and Senior Vice President, ACIM, ACGIM and ACS
Robert Leach, 4500 Main Street, Kansas City, MO 64111
Year of Birth: 1966
Position(s) Held with Funds: Vice President, Treasurer and Chief Financial Officer (all
since 2006)
Principal Occupation(s) During Past 5 Years: Vice President, ACS (February 2000 to present);
and Controller, various American Century Investments funds (1997 to September 2006)
David H. Reinmiller, 4500 Main Street, Kansas City, MO 64111
Year of Birth: 1963
Position(s) Held with Funds: Vice President (since September 2001)
Principal Occupation(s) During Past 5 Years: Attorney, ACC (January 1994 to present);
Associate General Counsel, ACC (January 2001 to present); Chief Compliance
Officer, American Century Investments funds, ACIM and ACGIM (January 2001 to
February 2005). Also serves as: Associate General Counsel, ACIM, ACGIM, ACS,
ACIS and other ACC subsidiaries; and Vice President, ACIM, ACGIM and ACS
Ward Stauffer, 4500 Main Street, Kansas City, MO 64111
Year of Birth: 1960
Position(s) Held with Funds: Secretary (since March 2005)
Principal Occupation(s) During Past 5 Years: Attorney, ACC (June 2003 to present)
The SAI has additional information about the funds’ trustees and is available without charge, upon request, by calling 1-800-345-2021.
43
| Approval of Management Agreements |
Under Section 15(c) of the Investment Company Act, contracts for investment advisory services to a mutual fund are required to be reviewed, evaluated and approved each year by the fund’s board of directors/ trustees, including a majority of a fund’s independent directors/trustees (the “Directors”). At American Century Investments, this process is referred to as the “15(c) Process.” The board oversees on a continuous basis and evaluates at its quarterly meetings, directly and through the committees of the board, the nature and quality of significant services provided by the advisor, the investment performance of the funds, shareholder services, audit and compliance functions and a variety of other matters relating to fund operations. Each year, it also holds a special meeting in connection with determining whether to renew the contracts for advisory services, to review fund performance, shareholder services, adviser profitability, audit and compliance matters, and other fund operational matters.
Under a Securities and Exchange Commission rule, each fund is required to disclose in its annual or semiannual report, as appropriate, the material factors and conclusions that formed the basis for the board’s approval or renewal of any advisory agreements within the fund’s most recently completed fiscal half-year period.
Annual Contract Review Process
As part of the annual 15(c) Process, the Directors requested and reviewed extensive data and information compiled by the advisor and certain independent providers of evaluative data (the “15(c) Providers”) concerning California Tax-Free Money Market and California Tax-Free Bond (the “funds”) and the services provided to the funds under the management agreement. The information considered and the discussions held at the meetings included, but were not limited to:
• the nature, extent and quality of investment management, shareholder services and other services that the advisor provides to the funds;
• the wide range of programs and services the advisor provides to the funds and their shareholders on a routine and non-routine basis;
• the compliance policies, procedures, and regulatory experience of the advisor;
• data comparing the cost of owning each fund to the cost of owning a similar fund;
• data comparing each fund’s performance to appropriate benchmarks and/or a peer group of other mutual funds with similar investment objectives and strategies;
• financial data showing the profitability of each fund to the advisor and the overall profitability of the advisor;
44
• data comparing services provided and charges to other non-fund invest-ment management clients of the advisor; and
• collateral or “fall-out” benefits derived by the advisor from the manage-ment of the funds, and potential sharing of economies of scale in connection with the management of the funds.
In keeping with its practice, the Directors at a special meeting and at a regularly scheduled quarterly meeting reviewed and discussed the information provided by the advisor throughout the year and to negotiate with the advisor the renewal of the management agreement, including the setting of the applicable management fee. The Directors had the benefit of the advice of their independent counsel throughout the period.
Factors Considered
The Directors considered all of the information provided by the advisor, independent data providers, and the board’s independent counsel, and evaluated such information for each fund the board oversees. The Directors did not identify any single factor as being all-important or controlling, and each Director may have attributed different levels of importance to different factors. In deciding to renew each fund’s management agreement under the terms ultimately determined by the board to be appropriate, the Directors based their decision on a number of factors, including the following.
Nature, Extent and Quality of Services - Generally. Under the management agreement, the advisor is responsible for providing or arranging for all services necessary for the operation of the funds. The board noted that under the management agreement, the advisor provides or arranges at its own expense a wide variety of services including:
• fund construction and design
• initial capitalization/funding
• portfolio research and security selection
• securities trading
• fund administration
• custody of fund assets
• daily valuation of fund portfolios
• shareholder servicing and transfer agency, including shareholder
confirmations, recordkeeping and communications
• legal services
• regulatory and portfolio compliance
45
• financial reporting
• marketing and distribution
The Directors noted that many of these services have expanded over time both in terms of quantity and complexity in response to shareholder demands, competition in the industry, changing distribution channels and the changing regulatory environment. In performing their evaluation, the Directors considered information received in connection with the annual review, as well as information provided on an ongoing basis throughout the year and at their regularly scheduled board and committee meetings.
Investment Management Services. The nature of the investment management services provided is quite complex and allows fund shareholders access to professional money management, instant diversification of their investments within an asset class, the opportunity to easily diversify among asset classes, and liquidity. In evaluating investment performance, the board expects the advisor to manage each fund in accordance with its investment objectives and approved strategies. In providing these services, the advisor utilizes teams of investment professionals (portfolio managers, analysts, research assistants, and securities traders) who require extensive information technology, research, training, compliance and other systems to conduct their business. At each quarterly meeting and at the special meeting to consider renewal of the management agreemen t, the Directors, directly and through its Portfolio Committee, review investment performance information for each fund, together with comparative information for appropriate benchmarks and/or peer groups of similarly-managed funds, over different time horizons. If performance concerns are identified, the underperforming fund receives special reviews until performance improves, during which Directors discuss with the advisor the reasons for such underperformance (e.g., market conditions, security and sector selection) and any efforts being undertaken to improve performance. Each fund’s performance for both the one- and three-year periods was at or above the median for its respective peer group.
Shareholder and Other Services. The advisor provides the funds with a comprehensive package of transfer agency, shareholder, and other services. The Directors, directly and through the various Committees of the Board, review reports and evaluations of such services at their regular quarterly meetings and at their special meeting to consider renewal of the management agreement, including the annual meeting concerning contract review, and other reports to the board. These reports include, but are not limited to, information regarding the operational efficiency and accuracy of the shareholder and transfer agency services provided, staffing levels, shareholder satisfaction (as measured by external as well as internal sources), technology support, new products and services offered to fund shareholders, securities trading activities, portfolio valuat ion services, auditing services, and legal and operational compliance activities. Certain aspects of shareholder and transfer agency service level efficiency and the quality of securities trading activities are measured by independent third party providers and are presented in comparison to other fund groups not managed by the advisor.
46
Costs of Services Provided and Profitability. The advisor provides detailed information concerning its cost of providing various services to the funds, its profitability in managing each fund, its overall profitability, and its financial condition. The Directors have reviewed with the advisor the methodology used to prepare this financial information. The Directors have also reviewed with the advisor its methodology for compensating the investment professionals that provide services to the funds. This financial information regarding the advisor is considered in order to evaluate the advisor’s financial condition, its ability to continue to provide services under the management agreement, and the reasonableness of the current management fee.
Ethics. The Directors generally consider the advisor’s commitment to providing quality services to shareholders and to conducting its business ethically. They noted that the advisor’s practices generally meet or exceed industry best practices.
Economies of Scale. The Directors review information provided by the advisor regarding the existence of economies of scale in connection with the investment management of the funds. The Directors concluded that economies of scale are difficult to measure and predict with precision, especially on a fund-by-fund basis. The analysis of economies of scale is further complicated by the additional services and content provided by the advisor and its reinvestment in its ability to provide and expand those services. Accordingly, the Directors seek to evaluate economies of scale by reviewing information, such as year-over-year profitability of the advisor generally, the profitability of its management of each fund specifically, and the expenses incurred by the advisor in providing various functions to the funds. The Directors believe the advisor is appropriately sharing economies of scale through its competitive fee structure, fee breakpoints as the fund complex and the fund increase in size, and through reinvestment in its business to provide shareholders additional services and enhancements to existing services. In particular, separate breakpoint schedules based on the size of the entire fund complex and on the size of each fund reflect the complexity of assessing economies of scale.
Comparison to Other Funds’ Fees. Each fund pays the advisor a single, all-inclusive (or unified) management fee for providing all services necessary for the management and operation of the fund, other than brokerage expenses, taxes, interest, extraordinary expenses, and the fees and expenses of the fund’s independent directors (including their independent legal counsel). Under the unified fee structure, the advisor is responsible for providing all investment advisory, custody, audit, administrative, compliance, record-keeping, marketing and shareholder services, or arranging and supervising third parties to provide such services. By contrast, most other funds are charged a variety of fees, including an investment advisory fee, a transfer agency fee, an administrative fee, distribution charges and other expenses. Other than their investment advisory fees and Rule 12b-1 distribution fees, the components of the total fees charged by these other funds may be increased without shareholder approval. The board believes the unified fee structure is a benefit to fund shareholders because it clearly discloses to shareholders the cost of owning fund shares, and, since the unified fee
47
cannot be increased without a vote of fund shareholders, it shifts to the advisor the risk of increased costs of operating the fund and provides a direct incentive to minimize administrative inefficiencies. Part of the Directors’ analysis of fee levels involves reviewing certain evaluative data compiled by an independent provider and comparing the fund’s unified fee to the total expense ratio of other funds in the fund’s peer group. The Directors also reviewed updated fee level data provided by the advisor, but recognized that comparative data was particularly difficult to evaluate given the significant market developments during the past year impacting fund assets. The unified fees charged to shareholders of California Tax-Free Bond and California Tax-Free Money Market were in the lowest quartile of the total expense ratios of their respective peer groups.
Comparison to Fees and Services Provided to Other Clients of the Advisor. The Directors also requested and received information from the advisor concerning the nature and extent of the services, fees, and profitability of its advisory services to advisory clients other than the funds. They observed that these varying types of client accounts require different services and involve different regulatory and entrepreneurial risks than the management of the funds. The Directors analyzed this information and concluded that the fees charged and services provided to the funds were reasonable by comparison.
Collateral or “Fall-Out” Benefits Derived by the Advisor. The Directors considered the existence of collateral benefits the advisor may receive as a result of its relationship with the funds. They concluded that the advisor’s primary business is managing mutual funds and it generally does not use fund or shareholder information to generate profits in other lines of business, and therefore does not derive any significant collateral benefits from them. The Directors noted that the advisor receives proprietary research from broker dealers that execute fund portfolio transactions but concluded that this research is likely to benefit fund shareholders. The Directors also determined that the advisor is able to provide investment management services to certain clients other than the funds, at least in part, due to its existing infr astructure built to serve the fund complex. The Directors concluded, however, that the assets of those other clients are not material to the analysis and, in any event, are included with the assets of each fund to determine breakpoints in the fund’s fee schedule, provided they are managed using the same investment team and strategy.
Conclusions of the Directors
As a result of this process, the Directors, in the absence of particular circumstances and assisted by the advice of their independent legal counsel, taking into account all of the factors discussed above and the information provided by the advisor and others, concluded that the investment management agreement between each fund and the advisor, including the management fee, is fair and reasonable in light of the services provided and should be renewed for a one-year term.
48
| Additional Information |
Proxy Voting Guidelines
American Century Investment Management, Inc., the funds’ investment advisor, is responsible for exercising the voting rights associated with the securities purchased and/or held by the funds. A description of the policies and procedures the advisor uses in fulfilling this responsibility is available without charge, upon request, by calling 1-800-345-2021. It is also available on American Century Investments’ website at americancentury.com and on the Securities and Exchange Commission’s website at sec.gov. Information regarding how the investment advisor voted proxies relating to portfolio securities during the most recent 12-month period ended June 30 is available on the “About Us” page at americancentury.com. It is also available at sec.gov.
Quarterly Portfolio Disclosure
The funds file their complete schedule of portfolio holdings with the Securities and Exchange Commission (SEC) for the first and third quarters of each fiscal year on Form N-Q. The funds’ Forms N-Q are available on the SEC’s website at sec.gov, and may be reviewed and copied at the SEC’s Public Reference Room in Washington, DC. Information on the operation of the Public Reference Room may be obtained by calling 1-800-SEC-0330. The funds also make their complete schedule of portfolio holdings for the most recent quarter of their fiscal year available on their website at americancentury.com and, upon request, by calling 1-800-345-2021.
49
| Index Definitions |
The following indices are used to illustrate investment market, sector, or
style performance or to serve as fund performance comparisons. They are
not investment products available for purchase.
The Barclays Capital 3-Year Municipal Bond Index is composed of those securities
included in the Barclays Capital Municipal Bond Index that have maturities
of two to four years.
The Barclays Capital 5-Year General Obligation (GO) Bond Index is composed of investment-
grade U.S. municipal securities, with maturities of four to six years, that are
general obligations of a state or local government.
The Barclays Capital California Tax-Exempt Bond Index is composed of those securities
included in the Barclays Capital Municipal Bond Index that are investment-
grade and are issued in California.
The Barclays Capital Long-Term Municipal Bond Index is composed of those securities
included in the Barclays Capital Municipal Bond Index that have maturities
greater than 22 years.
The Barclays Capital Municipal Bond Index is a market value-weighted index
designed for the long-term tax-exempt bond market.
The Barclays Capital Non-Investment-Grade Municipal Bond Index is composed of non-
investment grade U.S. municipal securities with a remaining maturity of
one year or more.
The Barclays Capital U.S. Aggregate Index represents securities that are taxable,
registered with the Securities and Exchange Commission, and U.S. dollar-
denominated. The index covers the U.S. investment-grade fixed-rate bond
market, with index components for government and corporate securities,
mortgage pass-through securities, and asset-backed securities.
The Barclays Capital U.S. Treasury Index is composed of those securities included in
the Barclays Capital U.S. Aggregate Index that are public obligations of the
U.S. Treasury with a remaining maturity of one year or more.
50
| Notes |
51
| Notes |
52

| Contact Us | |
| americancentury.com | |
| Automated Information Line | 1-800-345-8765 |
| Investor Services Representative | 1-800-345-2021 or |
| 816-531-5575 | |
| Business, Not-For-Profit, Employer-Sponsored | |
| Retirement Plans | 1-800-345-3533 |
| Banks and Trust Companies, Broker-Dealers, | |
| Financial Professionals, Insurance Companies | 1-800-345-6488 |
| Telecommunications Device for the Deaf | 1-800-634-4113 |
American Century California Tax-Free and Municipal Funds
Investment Advisor:
American Century Investment Management, Inc.
Kansas City, Missouri
This report and the statements it contains are submitted for the general
information of our shareholders. The report is not authorized for distribution to
prospective investors unless preceded or accompanied by an effective prospectus.
American Century Investment Services, Inc., Distributor
©2009 American Century Proprietary Holdings, Inc. All rights reserved.
0910
CL-ANN-66476N
| ITEM 2. CODE OF ETHICS. | ||
| (a) | The registrant has adopted a Code of Ethics for Senior Financial Officers that applies to the | |
| registrant’s principal executive officer, principal financial officer, principal accounting officer, | ||
| and persons performing similar functions. | ||
| (b) | No response required. | |
| (c) | None. | |
| (d) | None. | |
| (e) | Not applicable. | |
| (f) | The registrant’s Code of Ethics for Senior Financial Officers was filed as Exhibit 12 (a)(1) to | |
| American Century Asset Allocation Portfolios, Inc.’s Annual Certified Shareholder Report on | ||
| Form N-CSR, File No. 811-21591, on September 29, 2005, and is incorporated herein by | ||
| reference. | ||
| ITEM 3. AUDIT COMMITTEE FINANCIAL EXPERT. | ||
| (a)(1) | The registrant's board has determined that the registrant has at least one audit committee | |
| financial expert serving on its audit committee. | ||
| (a)(2) | Peter F. Pervere, Jeanne D. Wohlers and Ronald J. Gilson are the registrant's designated audit | |
| committee financial experts. They are "independent" as defined in Item 3 of Form N-CSR. | ||
| (a)(3) | Not applicable. | |
| (b) | No response required. | |
| (c) | No response required. | |
| (d) | No response required. | |
| ITEM 4. PRINCIPAL ACCOUNTANT FEES AND SERVICES. | ||
| (a) | Audit Fees. | |
| The aggregate fees billed for each of the last two fiscal years for professional services rendered by the | ||
| principal accountant for the audit of the registrant’s annual financial statements or services that are | ||
| normally provided by the accountant in connection with statutory and regulatory filings or engagements | ||
| for those fiscal years were as follows: | ||
| FY 2008: | $ 85,356 | |
| FY 2009: | $107,593 | |
| (b) | Audit-Related Fees. | |
| The aggregate fees billed in each of the last two fiscal years for assurance and related services by the | ||
| principal accountant that are reasonably related to the performance of the audit of the registrant’s | ||
| financial statements and are not reported under paragraph (a) of this Item were as follows: | ||
| For services rendered to the registrant: | ||
| FY 2008: | $0 | |
| FY 2009: | $0 | |
| Fees required to be approved pursuant to paragraph (c)(7)(ii) of Rule 2-01 of Regulation S-X | ||
| (relating to certain engagements for non-audit services with the registrant’s investment adviser | ||
| and its affiliates): | ||
| FY 2008: | $0 | |
| FY 2009: | $0 | |
| (c) | Tax Fees. | |
| The aggregate fees billed in each of the last two fiscal years for professional services rendered by the | ||
| principal accountant for tax compliance, tax advice, and tax planning were as follows: | ||
| For services rendered to the registrant: | ||
| FY 2008: | $0 | |
| FY 2009: | $27,288 | |
| These services included assistance with communications and filings to the Internal Revenue | ||
| Service for a change in accounting method. | ||
| Fees required to be approved pursuant to paragraph (c)(7)(ii) of Rule 2-01 of Regulation S-X | ||
| (relating to certain engagements for non-audit services with the registrant’s investment adviser | ||
| and its affiliates): | ||
| FY 2008: | $0 | |
| FY 2009: | $27,288 | |
| These services included assistance with communications and filings to the Internal Revenue | ||
| Service for a change in accounting method. | ||
| (d) | All Other Fees. | |
| The aggregate fees billed in each of the last two fiscal years for products and services provided by the | ||
| principal accountant, other than the services reported in paragraphs (a) through (c) of this Item were as | ||
| follows: | ||
| For services rendered to the registrant: | ||
| FY 2008: | $0 | |
| FY 2009: | $0 | |
| Fees required to be approved pursuant to paragraph (c)(7)(ii) of Rule 2-01 of Regulation S-X | ||
| (relating to certain engagements for non-audit services with the registrant’s investment adviser | ||
| and its affiliates): | ||
| FY 2008: | $0 | |
| FY 2009: | $0 | |
| (e)(1) | In accordance with paragraph (c)(7)(i)(A) of Rule 2-01 of Regulation S-X, before the | |
| accountant is engaged by the registrant to render audit or non-audit services, the engagement is | ||
| approved by the registrant’s audit committee. Pursuant to paragraph (c)(7)(ii) of Rule 2-01 of | ||
| Regulation S-X, the registrant’s audit committee also pre-approves its accountant’s | ||
| engagements for non-audit services with the registrant’s investment adviser, its parent company, | ||
| and any entity controlled by, or under common control with the investment adviser that | ||
| provides ongoing services to the registrant, if the engagement relates directly to the operations | ||
| and financial reporting of the registrant. | ||
| (e)(2) | All services described in each of paragraphs (b) through (d) of this Item were pre-approved | |
| before the engagement by the registrant’s audit committee pursuant to paragraph (c)(7)(i)(A) of | ||
| Rule 2-01 of Regulation S-X. Consequently, none of such services were required to be | ||
| approved by the audit committee pursuant to paragraph (c)(7)(i)(C). | ||
| (f) | The percentage of hours expended on the principal accountant’s engagement to audit the | |
| registrant’s financial statements for the most recent fiscal year that were attributed to work | ||
| performed by persons other than the principal accountant’s full-time, permanent employees was | ||
| less than 50%. | ||
| (g) | The aggregate non-audit fees billed by the registrant’s accountant for services rendered to the | |
| registrant, and rendered to the registrant’s investment adviser (not including any sub-adviser | ||
| whose role is primarily portfolio management and is subcontracted with or overseen by another | ||
| investment adviser), and any entity controlling, controlled by, or under common control with | ||
| the adviser that provides ongoing services to the registrant for each of the last two fiscal years | ||
| of the registrant were as follows: | ||
| FY 2008: | $ 90,000 | |
| FY 2009: | $177,638 | |
| (h) | The registrant’s investment adviser and accountant have notified the registrant’s audit | |
| committee of all non-audit services that were rendered by the registrant’s accountant to the | ||
| registrant’s investment adviser, its parent company, and any entity controlled by, or under | ||
| common control with the investment adviser that provides services to the registrant, which | ||
| services were not required to be pre-approved pursuant to paragraph (c)(7)(ii) of Rule 2-01 of | ||
| Regulation S-X. The notification provided to the registrant’s audit committee included | ||
| sufficient details regarding such services to allow the registrant’s audit committee to consider | ||
| the continuing independence of its principal accountant. | ||
| ITEM 5. AUDIT COMMITTEE OF LISTED REGISTRANTS. | |
| Not applicable. | |
| ITEM 6. INVESTMENTS. | |
| (a) | The schedule of investments is included as part of the report to stockholders filed under Item 1 |
| of this Form. | |
| (b) | Not applicable. |
| ITEM 7. DISCLOSURE OF PROXY VOTING POLICIES AND PROCEDURES FOR | |
| CLOSED-END MANAGEMENT INVESTMENT COMPANIES. | |
| Not applicable. | |
| ITEM 8. PORTFOLIO MANAGERS OF CLOSED-END MANAGEMENT | |
| INVESTMENT COMPANIES. | |
| Not applicable. | |
| ITEM 9. PURCHASES OF EQUITY SECURITIES BY CLOSED-END MANAGEMENT | |
| INVESTMENT COMPANY AND AFFILIATED PURCHASERS. | |
| Not applicable. | |
| ITEM 10. SUBMISSION OF MATTERS TO A VOTE OF SECURITY HOLDERS. | |
| During the reporting period, there were no material changes to the procedures by which shareholders may | |
| recommend nominees to the registrant’s board. | |
| ITEM 11. CONTROLS AND PROCEDURES. | |
| (a) | The registrant's principal executive officer and principal financial officer have concluded that |
| the registrant's disclosure controls and procedures (as defined in Rule 30a-3(c) under the | |
| Investment Company Act of 1940) are effective based on their evaluation of these controls and | |
| procedures as of a date within 90 days of the filing date of this report. | |
| (b) | There were no changes in the registrant's internal control over financial reporting (as defined in |
| Rule 30a-3(d) under the Investment Company Act of 1940) that occurred during the registrant's | |
| second fiscal quarter of the period covered by this report that have materially affected, or are | |
| reasonably likely to materially affect, the registrant's internal control over financial reporting. | |
| ITEM 12. EXHIBITS. | |
| (a)(1) | Registrant’s Code of Ethics for Senior Financial Officers, which is the subject of the disclosure |
| required by Item 2 of Form N-CSR, was filed as Exhibit 12(a)(1) to American Century Asset | |
| Allocation Portfolios, Inc.’s Certified Shareholder Report on Form N-CSR, File No. 811-21591, | |
| on September 29, 2005. | |
| (a)(2) | Separate certifications by the registrant’s principal executive officer and principal financial |
| officer, pursuant to Section 302 of the Sarbanes-Oxley Act of 2002 and Rule 30a-2(a) under the | |
| Investment Company Act of 1940, are filed and attached hereto as EX-99.CERT. | |
| (a)(3) | Not applicable. |
| (b) | A certification by the registrant’s chief executive officer and chief financial officer, pursuant to |
| Section 906 of the Sarbanes-Oxley Act of 2002, is furnished and attached hereto as EX- | |
| 99.906CERT. | |
SIGNATURES
Pursuant to the requirements of the Securities Exchange Act of 1934 and the Investment Company Act of 1940, the registrant has duly caused this report to be signed on its behalf by the undersigned, thereunto duly authorized.
| Registrant: | American Century California Tax-Free and Municipal Funds | |
| By: | /s/ Jonathan S. Thomas | |
| Name: | Jonathan S. Thomas | |
| Title: | President | |
| Date: | October 30, 2009 | |
Pursuant to the requirements of the Securities Exchange Act of 1934 and the Investment Company Act of 1940, this report has been signed below by the following persons on behalf of the registrant and in the capacities and on the dates indicated.
| By: | /s/ Jonathan S. Thomas | |
| Name: | Jonathan S. Thomas | |
| Title: | President | |
| (principal executive officer) | ||
| Date: | October 30, 2009 | |
| By: | /s/ Robert J. Leach | |
| Name: | Robert J. Leach | |
| Title: | Vice President, Treasurer, and | |
| Chief Financial Officer | ||
| (principal financial officer) | ||
| Date: | October 30, 2009 | |