UNITED STATES
SECURITIES AND EXCHANGE COMMISSION
Washington, D.C. 20549
FORM N-CSR
CERTIFIED SHAREHOLDER REPORT OF REGISTERED MANAGEMENT
INVESTMENT COMPANIES
Investment Company Act file number | 811- 3721 | |||||
|
| |||||
| DREYFUS INTERMEDIATE MUNICIPAL BOND FUND, INC. |
| ||||
| (Exact name of Registrant as specified in charter) |
| ||||
|
|
| ||||
|
c/o The Dreyfus Corporation 200 Park Avenue New York, New York 10166 |
| ||||
| (Address of principal executive offices) (Zip code) |
| ||||
|
|
| ||||
| John Pak, Esq. 200 Park Avenue New York, New York 10166 |
| ||||
| (Name and address of agent for service) |
| ||||
| ||||||
Registrant's telephone number, including area code: | (212) 922-6000 | |||||
|
| |||||
Date of fiscal year end:
| 5/31 |
| ||||
Date of reporting period: | 5/31/15 |
| ||||
Dreyfus
Intermediate Municipal
Bond Fund, Inc.
ANNUAL REPORT May 31, 2015
Save time. Save paper. View your next shareholder report online as soon as it’s available. Log into www.dreyfus.com and sign up for Dreyfus eCommunications. It’s simple and only takes a few minutes.
The views expressed in this report reflect those of the portfolio manager only through the end of the period covered and do not necessarily represent the views of Dreyfus or any other person in the Dreyfus organization. Any such views are subject to change at any time based upon market or other conditions and Dreyfus disclaims any responsibility to update such views.These views may not be relied on as investment advice and, because investment decisions for a Dreyfus fund are based on numerous factors, may not be relied on as an indication of trading intent on behalf of any Dreyfus fund.
Not FDIC-Insured • Not Bank-Guaranteed • May Lose Value
Contents | |
THE FUND | |
| 2 | A Letter from the President |
| 3 | Discussion of Fund Performance |
| 6 | Fund Performance |
| 7 | Understanding Your Fund’s Expenses |
| 7 | Comparing Your Fund’s Expenses With Those of Other Funds |
| 8 | Statement of Investments |
| 28 | Statement of Assets and Liabilities |
| 29 | Statement of Operations |
| 30 | Statement of Changes in Net Assets |
| 31 | Financial Highlights |
| 32 | Notes to Financial Statements |
| 40 | Report of Independent Registered Public Accounting Firm |
| 41 | Important Tax Information |
| 42 | Board Members Information |
| 45 | Officers of the Fund |
FOR MORE INFORMATION | |
Back Cover |
Dreyfus Intermediate Municipal
Bond Fund, Inc.
The Fund
A LETTER FROM THE PRESIDENT
Dear Shareholder:
We are pleased to present this annual report for Dreyfus Intermediate Municipal Bond Fund, Inc., covering the 12-month period from June 1, 2014, through May 31, 2015. For information about how the fund performed during the reporting period, as well as general market perspectives, we provide a Discussion of Fund Performance on the pages that follow.
Municipal bonds produced moderately positive total returns over the reporting period, on average. Developments in overseas markets during 2014 — including plummeting oil prices and ongoing economic concerns in Europe, Japan, and China — sparked a flight to quality among global investors, who turned away from foreign sovereign bonds in favor of U.S. assets. In addition, aggressively accommodative monetary policies in Europe and Japan made yields of U.S. fixed-income securities relatively attractive. Consequently, intensifying demand put downward pressure on U.S. bond yields, including municipal bonds, over much of the reporting period. This trend reversed in early 2015, giving back some of the market’s previous gains when the supply of newly issued municipal bonds increased substantially in the low interest rate environment.
We remain optimistic regarding the long-term outlook for the U.S. economy generally and municipal bonds in particular. We believe labor markets have continued to strengthen, oil prices have climbed from previous lows, and foreign currency exchange rates have become less volatile. Meanwhile, credit conditions appear to have continued to improve for most states and municipalities, and demand remains strong from investors seeking tax-advantaged investment income.As always, we urge you to discuss these observations with your financial advisor, who can help you assess their implications for your investment portfolio.
Thank you for your continued confidence and support.

J. Charles Cardona
President
The Dreyfus Corporation
June 15, 2015
2
DISCUSSION OF FUND PERFORMANCE
For the period of June 1, 2014, through May 31, 2015, as provided by Thomas Casey and Christine Todd, Portfolio Managers
Fund and Market Performance Overview
For the 12-month period ended May 31, 2015, Dreyfus Intermediate Municipal Bond Fund achieved a total return of 2.00%.1 In comparison, the Barclays 7-Year Municipal Bond Index (the “Index”), the fund’s benchmark, achieved a total return of 2.12% for the same period.2
Positive returns from municipal bonds stemming from falling long-term interest rates over the reporting period’s first half were followed by relatively flat returns over the second half.The fund modestly lagged its benchmark, mainly due to its focus on longer maturities when yields climbed during the spring of 2015.
The Fund’s Investment Approach
The fund seeks the maximum amount of current income exempt from federal income tax as is consistent with the preservation of capital. To pursue its goal, the fund normally invests substantially all of its assets in municipal bonds that provide income exempt from federal personal income tax.
The fund invests at least 80% of its assets in municipal bonds rated A or higher, or the unrated equivalent as determined by The Dreyfus Corporation (“Dreyfus”).The fund may invest up to 20% of its assets in municipal bonds rated below A, including bonds rated below investment grade (“high yield” or “junk” bonds) or the unrated equivalent as determined by Dreyfus. The dollar-weighted average maturity of the fund’s portfolio ranges between three and 10 years.
We focus on identifying undervalued sectors and securities, and we minimize the use of interest rate forecasting. We select municipal bonds by using fundamental credit analysis to estimate the relative value and attractiveness of various sectors and securities and to exploit pricing inefficiencies in the municipal bond market. We actively trade among various sectors, such as pre-refunded, general obligation, and revenue, based on their apparent relative values.
The Fund 3
DISCUSSION OF FUND PERFORMANCE (continued)
Falling Long-Term Rates Supported Bond Prices
Long-term interest rates generally fell over the first half of the reporting period, supporting municipal bond prices and sending yields lower despite expectations that an expanding domestic economy would drive prices lower. Global investors seeking more competitive yields than were available in Europe and Japan flocked to higher yielding investments in the United States, and the resulting supply-and-demand imbalance put downward pressure on yields and upward pressure on prices of U.S. fixed-income securities.
This trend began to reverse over the reporting period’s second half, when longer term interest rates drifted higher amid stronger-than-expected employment data and expectations of short-term rate hikes later this year. An economic soft patch during the winter of 2015 caused yields to moderate temporarily, but longer term interest rates resumed their climb when economic growth re-accelerated in the spring, resulting in generally flat market returns over the first five months of 2015. Likewise, after benefiting from favorable supply-and-demand dynamics during 2014, issuance volumes climbed over the opening months of 2015 as issuers rushed to refinance existing debt before expected increases in short-term interest rates.
Underlying credit conditions have improved for most municipal bond issuers as tax revenues have climbed beyond pre-recession levels for many state and local governments. However, isolated credit problems have persisted for Puerto Rico and—in the wake of a recent court ruling against pension reform legislation—Illinois and other states with high levels of unfunded pension liabilities.
Interest Rate Strategies Dampened Relative Results
Over much of the reporting period, the fund’s focus on maturities at the longer end of the intermediate-term range fully captured the benefits of falling long-term interest rates and narrowing yield differences along the market’s maturity spectrum. However, this strategy proved counterproductive when interest rates rose during the spring of 2015, mildly constraining relative performance for the reporting period overall.
Our security selection strategy proved more beneficial, as we maintained overweighted exposure to BBB-rated revenue-backed bonds and an underweighted position in lower yielding general obligation bonds and AAA-rated securities.The fund achieved
4
especially strong results from revenue bonds backed by hospitals, industrial development projects, and the states’ settlement of litigation with U.S. tobacco companies. The fund held no Illinois securities affected by the adverse court ruling, avoiding credit-related weakness. In contrast, laggards for the reporting period included higher quality bonds from special tax districts, providers of essential municipal services, and electric utilities.
A More Cautious Interest Rate Posture
The U.S. economic recovery has gained traction, issuance volumes have increased recently, and investors expect higher short-term interest rates later this year.Therefore, in anticipation of bouts of heightened market volatility, we have adopted a somewhat more cautious interest rate posture by adjusting the fund’s average duration to a position that is only modestly longer than the benchmark.We are more optimistic regarding the market’s longer term prospects in light of robust investor demand and improving credit fundamentals, and we have retained the fund’s emphasis on revenue bonds with strong income characteristics.
June 15, 2015
| Bond funds are subject generally to interest rate, credit, liquidity, and market risks, to varying degrees, all of which are |
| more fully described in the fund’s prospectus. Generally, all other factors being equal, bond prices are inversely related |
| to interest-rate changes, and rate increases can cause price declines. |
| High yield bonds involve increased credit and liquidity risks compared with investment grade bonds and are considered |
| speculative in terms of the issuer’s ability to pay interest and repay principal on a timely basis. |
| The use of derivatives involves risks different from, or possibly greater than, the risks associated with investing directly |
| in the underlying assets. Derivatives can be highly volatile, illiquid and difficult to value, and there is the risk that |
| changes in the value of a derivative held by the fund will not correlate with the underlying instruments or the fund’s |
| other instruments. |
| 1 Total return includes reinvestment of dividends and any capital gains paid. Past performance is no guarantee of future |
| results. Share price, yield, and investment return fluctuate such that upon redemption, fund shares may be worth more |
| or less than their original cost. Income may be subject to state and local taxes, and some income may be subject to the |
| federal alternative minimum tax (AMT) for certain investors. Capital gains, if any, are fully taxable. |
| 2 SOURCE: LIPPER INC. — Reflects reinvestment of dividends and, where applicable, capital gain distributions. |
| The Barclays 7-Year Municipal Bond Index is an unmanaged total return performance benchmark for the |
| investment-grade, geographically unrestricted 7-year tax-exempt bond market, consisting of municipal bonds with |
| maturities of 6-8 years. Index returns do not reflect fees and expenses associated with operating a mutual fund. |
The Fund 5
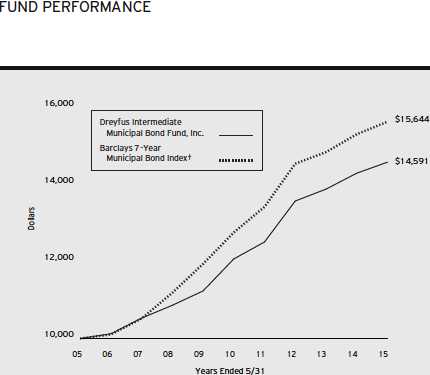
Comparison of change in value of $10,000 investment in Dreyfus Intermediate Municipal Bond Fund, Inc. and the Barclays 7-Year Municipal Bond Index
| Average Annual Total Returns as of 5/31/15 | ||||||
| 1 | Year | 5 Years | 10 Years | |||
| Fund | 2.00 | % | 3.86 | % | 3.85 | % |
| Barclays 7-Year Municipal Bond Index | 2.12 | % | 4.16 | % | 4.58 | % |
† Source: Lipper Inc.
Past performance is not predictive of future performance.The fund’s performance shown in the graph and table does not reflect the deduction of taxes that a shareholder would pay on fund distributions or the redemption of fund shares. The above graph compares a $10,000 investment made in Dreyfus Intermediate Municipal Bond Fund, Inc. on 5/31/05 to a $10,000 investment made in the Barclays 7-Year Municipal Bond Index (the “Index”) on that date. All dividends and capital gain distributions are reinvested.
The fund invests primarily in municipal securities and maintains a portfolio with a weighted average maturity ranging between 3 and 10 years.The fund’s performance shown in the line graph above takes into account fees and expenses.The Index, unlike the fund, is an unmanaged total return performance benchmark for the investment-grade, geographically unrestricted 7-year tax-exempt bond market, consisting of municipal bonds with maturities of 6-8 years.These factors can contribute to the Index potentially outperforming or underperforming the fund. Unlike a mutual fund, the Index is not subject to charges, fees and other expenses. Investors cannot invest directly in any index. Further information relating to fund performance, including expense reimbursements, if applicable, is contained in the Financial Highlights section of the prospectus and elsewhere in this report.
6
UNDERSTANDING YOUR FUND’S EXPENSES (Unaudited)
As a mutual fund investor, you pay ongoing expenses, such as management fees and other expenses. Using the information below, you can estimate how these expenses affect your investment and compare them with the expenses of other funds.You also may pay one-time transaction expenses, including sales charges (loads) and redemption fees, which are not shown in this section and would have resulted in higher total expenses. For more information, see your fund’s prospectus or talk to your financial adviser.
Review your fund’s expenses
The table below shows the expenses you would have paid on a $1,000 investment in Dreyfus Intermediate Municipal Bond Fund, Inc. from December 1, 2014 to May 31, 2015. It also shows how much a $1,000 investment would be worth at the close of the period, assuming actual returns and expenses.
Expenses and Value of a $1,000 Investment
assuming actual returns for the six months ended May 31, 2015
| Expenses paid per $1,000† | $ | 3.65 |
| Ending value (after expenses) | $ | 1,003.70 |
COMPARING YOUR FUND’S EXPENSES WITH THOSE OF OTHER FUNDS (Unaudited)
Using the SEC’s method to compare expenses
The Securities and Exchange Commission (SEC) has established guidelines to help investors assess fund expenses. Per these guidelines, the table below shows your fund’s expenses based on a $1,000 investment, assuming a hypothetical 5% annualized return. You can use this information to compare the ongoing expenses (but not transaction expenses or total cost) of investing in the fund with those of other funds. All mutual fund shareholder reports will provide this information to help you make this comparison. Please note that you cannot use this information to estimate your actual ending account balance and expenses paid during the period.
Expenses and Value of a $1,000 Investment
assuming a hypothetical 5% annualized return for the six months ended May 31, 2015
| Expenses paid per $1,000† | $ | 3.68 |
| Ending value (after expenses) | $ | 1,021.29 |
† Expenses are equal to the fund’s annualized expense ratio of .73%; multiplied by the average account value over the
period, multiplied by 182/365 (to reflect the one-half year period).
The Fund 7
| STATEMENT OF INVESTMENTS | ||||
| May 31, 2015 | ||||
| Long-Term Municipal | Coupon | Maturity | Principal | |
| Investments—99.0% | Rate (%) | Date | Amount ($) | Value ($) |
| Alabama—3.4% | ||||
| Alabama Port Authority, | ||||
| Docks Facilities Revenue | ||||
| (Insured; National Public | ||||
| Finance Guarantee Corp.) | 5.00 | 10/1/22 | 5,000,000 | 5,270,950 |
| Alabama Public School and College | ||||
| Authority, Capital Improvement | ||||
| Revenue | 5.00 | 1/1/26 | 1,500,000 | 1,797,765 |
| Birmingham Water Works Board, | ||||
| Water Revenue (Insured; | ||||
| Assured Guaranty Corp.) | 5.00 | 1/1/17 | 5,000,000 | 5,339,900 |
| Jefferson County, | ||||
| Limited Obligation | ||||
| School Warrants | 5.25 | 1/1/17 | 5,050,000 | 5,100,551 |
| Jefferson County, | ||||
| Limited Obligation | ||||
| School Warrants | 5.25 | 1/1/19 | 2,150,000 | 2,171,522 |
| University of Alabama Board of | ||||
| Trustees, General Revenue (The | ||||
| University of Alabama) | 5.00 | 7/1/24 | 6,025,000 | 7,117,935 |
| Alaska—.6% | ||||
| Alaska Industrial Development and | ||||
| Export Authority, Revolving | ||||
| Fund Revenue | 5.25 | 4/1/24 | 3,780,000 | 4,373,611 |
| Arizona—2.0% | ||||
| Phoenix Civic Improvement | ||||
| Corporation, Junior Lien | ||||
| Wastewater System Revenue | 5.00 | 7/1/28 | 5,000,000 | 5,859,700 |
| Pima County, | ||||
| Sewer System Revenue | ||||
| Obligations (Insured; Assured | ||||
| Guaranty Municipal Corp.) | 5.00 | 7/1/23 | 3,250,000 | 3,739,028 |
| Pima County Industrial Development | ||||
| Authority, Education Revenue | ||||
| (American Charter Schools | ||||
| Foundation Project) | 5.13 | 7/1/15 | 720,000 | 720,526 |
| Salt River Project Agricultural | ||||
| Improvement and Power | ||||
| District, Salt River Project | ||||
| Electric System Revenue | 5.00 | 12/1/27 | 4,500,000 | 5,295,600 |
8
| Long-Term Municipal | Coupon | Maturity | Principal | ||
| Investments (continued) | Rate (%) | Date | Amount ($) | Value ($) | |
| Arkansas—.6% | |||||
| University of Arkansas Board of | |||||
| Trustees, Various Facility | |||||
| Revenue (Fayetteville Campus) | 5.00 | 11/1/35 | 2,685,000 | 3,049,650 | |
| University of Arkansas Board of | |||||
| Trustees, Various Facility | |||||
| Revenue (Fayetteville Campus) | 5.00 | 11/1/36 | 1,585,000 | 1,796,154 | |
| California—15.4% | |||||
| Arcadia Unified School District, | |||||
| GO (Insured; Assured Guaranty | |||||
| Municipal Corp.) | 0.00 | 8/1/20 | 1,635,000 | a | 1,367,236 |
| Bay Area Toll Authority, | |||||
| San Francisco Bay Area Subordinate | |||||
| Lien Toll Bridge Revenue | 5.00 | 4/1/27 | 1,750,000 | 2,027,917 | |
| Bay Area Toll Authority, | |||||
| San Francisco Bay Area Toll | |||||
| Bridge Revenue | 5.00 | 4/1/22 | 3,500,000 | 4,192,720 | |
| Bay Area Toll Authority, | |||||
| San Francisco Bay Area Toll | |||||
| Bridge Revenue | |||||
| (Prerefunded) | 5.25 | 4/1/19 | 6,000,000 | b | 6,928,500 |
| California, | |||||
| GO (Various Purpose) | 5.25 | 10/1/20 | 18,060,000 | 21,084,689 | |
| California, | |||||
| GO (Various Purpose) | 5.25 | 3/1/22 | 1,250,000 | 1,470,637 | |
| California, | |||||
| GO (Various Purpose) | 5.00 | 9/1/23 | 2,500,000 | 2,992,275 | |
| California, | |||||
| GO (Various Purpose) | 5.63 | 4/1/25 | 3,500,000 | 4,054,995 | |
| California Health Facilities | |||||
| Financing Authority, Revenue | |||||
| (Providence Health and | |||||
| Services) (Prerefunded) | 6.25 | 10/1/18 | 3,500,000 | b | 4,099,305 |
| California Health Facilities | |||||
| Financing Authority, Revenue | |||||
| (Sutter Health) | 5.25 | 8/15/22 | 3,000,000 | 3,387,420 | |
| California Housing Finance Agency, | |||||
| Home Mortgage Revenue | |||||
| (Insured; FGIC) | 4.40 | 2/1/18 | 3,300,000 | 3,372,336 |
The Fund 9
STATEMENT OF INVESTMENTS (continued)
| Long-Term Municipal | Coupon | Maturity | Principal | ||
| Investments (continued) | Rate (%) | Date | Amount ($) | Value ($) | |
| California (continued) | |||||
| California Housing Finance Agency, | |||||
| Home Mortgage Revenue | |||||
| (Insured; FGIC) | 4.40 | 8/1/18 | 3,310,000 | 3,376,068 | |
| California State Public Works | |||||
| Board, LR (Judicial Council of | |||||
| California) (Various Judicial | |||||
| Council Projects) | 5.00 | 3/1/26 | 1,500,000 | 1,738,050 | |
| California State Public Works | |||||
| Board, LR (Various | |||||
| Capital Projects) | 5.00 | 12/1/26 | 4,355,000 | 5,153,054 | |
| California State University | |||||
| Trustees, Systemwide Revenue | 5.00 | 11/1/22 | 5,000,000 | 5,981,300 | |
| Clovis Unified School District, | |||||
| GO (Insured; National Public | |||||
| Finance Guarantee Corp.) | 0.00 | 8/1/22 | 10,415,000 | a | 8,706,315 |
| Coast Community College District, | |||||
| GO (Insured; National Public | |||||
| Finance Guarantee Corp.) | 0.00 | 8/1/20 | 1,855,000 | a | 1,663,731 |
| Los Angeles Harbor Department, | |||||
| Revenue | 5.00 | 8/1/19 | 1,425,000 | 1,617,689 | |
| Orange County Transportation | |||||
| Authority, Senior Lien Toll | |||||
| Road Revenue (91 Express Lanes) | 5.00 | 8/15/28 | 2,500,000 | 2,880,825 | |
| Sacramento City Unified School | |||||
| District, GO (Insured; Assured | |||||
| Guaranty Municipal Corp.) | 0.00 | 7/1/23 | 5,065,000 | a | 4,056,204 |
| San Diego County Water Authority, | |||||
| Water Revenue | 5.00 | 5/1/28 | 5,000,000 | 5,803,550 | |
| San Diego Public Facilities | |||||
| Financing Authority, | |||||
| Subordinated Water Revenue | |||||
| (Payable Solely from | |||||
| Subordinated Installment | |||||
| Payments Secured by Net | |||||
| System Revenues of | |||||
| the Water Utility Fund) | 5.00 | 8/1/28 | 2,000,000 | 2,319,260 | |
| San Diego Public Facilities | |||||
| Financing Authority, Water | |||||
| Revenue | 5.00 | 8/1/24 | 7,560,000 | 8,871,206 |
10
| Long-Term Municipal | Coupon | Maturity | Principal | ||
| Investments (continued) | Rate (%) | Date | Amount ($) | Value ($) | |
| California (continued) | |||||
| Southern California Public Power | |||||
| Authority, Revenue (Canyon | |||||
| Power Project) | 5.00 | 7/1/23 | 5,000,000 | 5,754,000 | |
| Southern California Public Power | |||||
| Authority, Revenue (Windy | |||||
| Point/Windy Flats Project) | 5.00 | 7/1/23 | 1,850,000 | 2,175,526 | |
| Tobacco Securitization Authority | |||||
| of Southern California, | |||||
| Tobacco Settlement | |||||
| Asset-Backed Bonds (San Diego | |||||
| County Tobacco Asset | |||||
| Securitization Corporation) | 4.75 | 6/1/25 | 1,210,000 | 1,210,012 | |
| Tuolumne Wind Project Authority, | |||||
| Revenue (Tuolumne | |||||
| Company Project) | 5.00 | 1/1/22 | 2,000,000 | 2,251,140 | |
| University of California Regents, | |||||
| General Revenue | 5.25 | 5/15/23 | 125,000 | 137,353 | |
| University of California Regents, | |||||
| General Revenue (Prerefunded) | 5.25 | 5/15/17 | 2,375,000 | b | 2,608,201 |
| Colorado—3.5% | |||||
| City and County of Denver, | |||||
| Airport System Subordinate | |||||
| Revenue | 5.50 | 11/15/26 | 15,640,000 | 18,486,480 | |
| Colorado Health Facilities | |||||
| Authority, Revenue (Catholic | |||||
| Health Initiatives) | 6.00 | 10/1/23 | 5,355,000 | 6,102,611 | |
| E-470 Public Highway Authority, | |||||
| Senior Revenue (Insured; National | |||||
| Public Finance Guarantee Corp.) | 0.00 | 9/1/18 | 3,000,000 | a | 2,798,670 |
| Connecticut—2.1% | |||||
| Connecticut, | |||||
| Special Tax Obligation Revenue | |||||
| (Transportation Infrastructure | |||||
| Purposes) | 5.00 | 1/1/30 | 7,130,000 | 8,091,195 | |
| Connecticut, | |||||
| Special Tax Obligation Revenue | |||||
| (Transportation Infrastructure | |||||
| Purposes) | 5.00 | 9/1/32 | 5,500,000 | 6,320,655 |
The Fund 11
STATEMENT OF INVESTMENTS (continued)
| Long-Term Municipal | Coupon | Maturity | Principal | ||
| Investments (continued) | Rate (%) | Date | Amount ($) | Value ($) | |
| Connecticut (continued) | |||||
| Connecticut Health and Educational | |||||
| Facilities Authority, Revenue | |||||
| (Wesleyan University Issue) | 5.00 | 7/1/26 | 1,000,000 | 1,147,330 | |
| Connecticut Health and Educational | |||||
| Facilities Authority, Revenue | |||||
| (Wesleyan University Issue) | 5.00 | 7/1/27 | 1,000,000 | 1,147,330 | |
| District of Columbia—2.5% | |||||
| District of Columbia, | |||||
| HR (Children’s Hospital | |||||
| Obligated Group Issue) | |||||
| (Insured; Assured Guaranty | |||||
| Municipal Corp.) | 5.25 | 7/15/18 | 1,650,000 | 1,763,603 | |
| District of Columbia, | |||||
| Income Tax Secured Revenue | 5.00 | 12/1/25 | 2,500,000 | 2,881,000 | |
| District of Columbia Water and | |||||
| Sewer Authority, Public | |||||
| Utility Subordinate Lien | |||||
| Revenue | 5.00 | 10/1/27 | 5,980,000 | 6,965,624 | |
| Metropolitan Washington Airports | |||||
| Authority, Airport System | |||||
| Revenue | 5.00 | 10/1/25 | 3,000,000 | 3,502,890 | |
| Washington Metropolitan Area | |||||
| Transit Authority, Gross | |||||
| Revenue Transit Bonds | 5.25 | 7/1/23 | 3,725,000 | 4,254,583 | |
| Florida—8.3% | |||||
| Bay County, | |||||
| Sales Tax Revenue (Insured; | |||||
| AMBAC) (Prerefunded) | 5.00 | 9/1/16 | 2,375,000 | b | 2,510,351 |
| Broward County, | |||||
| Airport System Revenue | 5.00 | 10/1/22 | 3,605,000 | 4,190,019 | |
| Broward County, | |||||
| Port Facilities Revenue | 5.00 | 9/1/21 | 4,340,000 | 5,007,058 | |
| Citizens Property Insurance | |||||
| Corporation, Coastal Account | |||||
| Senior Secured Revenue | 5.00 | 6/1/25 | 16,000,000 | 18,610,560 | |
| Citizens Property Insurance | |||||
| Corporation, Personal Lines | |||||
| Account/Commercial Lines | |||||
| Account Senior Secured Revenue | 5.00 | 6/1/21 | 5,000,000 | 5,721,100 |
12
| Long-Term Municipal | Coupon | Maturity | Principal | ||
| Investments (continued) | Rate (%) | Date | Amount ($) | Value ($) | |
| Florida (continued) | |||||
| Collier County School Board, | |||||
| COP (Master Lease Program | |||||
| Agreement) (Insured; Assured | |||||
| Guaranty Municipal Corp.) | 5.25 | 2/15/20 | 3,500,000 | 4,043,690 | |
| Collier County School Board, | |||||
| COP (Master Lease Program | |||||
| Agreement) (Insured; Assured | |||||
| Guaranty Municipal Corp.) | 5.25 | 2/15/22 | 2,000,000 | 2,379,300 | |
| Hillsborough County, | |||||
| GO (Unincorporated Area Parks | |||||
| and Recreation Program) | |||||
| (Insured; National Public | |||||
| Finance Guarantee Corp.) | 5.00 | 7/1/22 | 1,155,000 | 1,374,542 | |
| Jacksonville Economic Development | |||||
| Commission, Health Care | |||||
| Facilities Revenue | |||||
| (Florida Proton Therapy | |||||
| Institute Project) | 6.00 | 9/1/17 | 1,375,000 | c | 1,501,720 |
| Lee County, | |||||
| Transportation Facilities | |||||
| Revenue (Insured; Assured | |||||
| Guaranty Municipal Corp.) | 5.00 | 10/1/24 | 2,500,000 | 2,999,725 | |
| Miami-Dade County, | |||||
| Seaport Revenue | 5.75 | 10/1/28 | 1,500,000 | 1,758,465 | |
| Miami-Dade County, | |||||
| Subordinate Special Obligation | |||||
| Revenue | 5.00 | 10/1/26 | 1,000,000 | 1,143,040 | |
| Miami-Dade County, | |||||
| Transit System Sales Surtax | |||||
| Revenue (Insured; XLCA) | |||||
| (Prerefunded) | 5.00 | 7/1/16 | 2,330,000 | b | 2,446,733 |
| Miami-Dade County, | |||||
| Water and Sewer System Revenue | |||||
| (Prerefunded) | 5.38 | 10/1/18 | 5,000,000 | b | 5,682,850 |
| Orlando Utilities Commission, | |||||
| Utility System Revenue | 5.00 | 10/1/23 | 2,500,000 | 2,816,700 | |
| Orlando-Orange County Expressway | |||||
| Authority, Revenue (Insured; | |||||
| Assured Guaranty Municipal Corp.) | 5.00 | 7/1/17 | 2,105,000 | 2,290,072 |
The Fund 13
STATEMENT OF INVESTMENTS (continued)
| Long-Term Municipal | Coupon | Maturity | Principal | ||
| Investments (continued) | Rate (%) | Date | Amount ($) | Value ($) | |
| Florida (continued) | |||||
| Palm Bay, | |||||
| Educational Facilities | |||||
| Revenue (Patriot Charter | |||||
| School Project) | 6.75 | 7/1/22 | 3,000,000 | d | 900,060 |
| Georgia—2.2% | |||||
| Atlanta, | |||||
| Water and Wastewater Revenue | 5.00 | 11/1/31 | 4,000,000 | 4,626,280 | |
| Atlanta, | |||||
| Water and Wastewater Revenue | |||||
| (Prerefunded) | 6.00 | 11/1/19 | 3,000,000 | b | 3,595,110 |
| Atlanta Development Authority, | |||||
| Senior Lien Revenue | |||||
| (New Downtown Atlanta | |||||
| Stadium Project) | 5.00 | 7/1/27 | 1,000,000 | 1,162,110 | |
| DeKalb County, | |||||
| Water and Sewerage Revenue | 5.25 | 10/1/25 | 4,000,000 | 4,959,520 | |
| Municipal Electric Authority of | |||||
| Georgia, Revenue | |||||
| (Project One | |||||
| Subordinated Bonds) | 5.75 | 1/1/19 | 2,660,000 | 3,032,134 | |
| Hawaii—.9% | |||||
| Hawaii, | |||||
| Airports System Revenue | 5.00 | 7/1/18 | 6,000,000 | 6,641,040 | |
| Idaho—.2% | |||||
| Idaho Health Facilities Authority, | |||||
| Revenue (Trinity Health Credit | |||||
| Group) (Prerefunded) | 6.13 | 12/1/18 | 1,450,000 | b | 1,696,776 |
| Illinois—8.7% | |||||
| Chicago, | |||||
| Customer Facility Charge | |||||
| Senior Lien Revenue (Chicago | |||||
| O’Hare International Airport) | 5.50 | 1/1/26 | 3,300,000 | 3,781,371 | |
| Chicago, | |||||
| General Airport Senior Lien | |||||
| Revenue (Chicago O’Hare | |||||
| International Airport) | 5.00 | 1/1/18 | 4,250,000 | 4,605,937 | |
| Chicago, | |||||
| General Airport Senior Lien | |||||
| Revenue (Chicago O’Hare | |||||
| International Airport) | 5.00 | 1/1/23 | 3,530,000 | 4,013,610 |
14
| Long-Term Municipal | Coupon | Maturity | Principal | |
| Investments (continued) | Rate (%) | Date | Amount ($) | Value ($) |
| Illinois (continued) | ||||
| Chicago, | ||||
| Second Lien Wastewater | ||||
| Transmission Revenue | ||||
| Project Bonds | 5.00 | 1/1/26 | 2,500,000 | 2,700,875 |
| Chicago Park District, | ||||
| Limited Tax GO | 5.00 | 1/1/28 | 1,000,000 | 1,049,060 |
| Chicago Park District, | ||||
| Limited Tax GO | 5.00 | 1/1/30 | 2,060,000 | 2,138,568 |
| Cook County Community High School | ||||
| District Number 219, GO | ||||
| (Insured; Assured Guaranty | ||||
| Municipal Corp.) | 5.00 | 12/1/24 | 2,020,000 | 2,202,608 |
| Illinois, | ||||
| Sales Tax Revenue | 5.00 | 6/15/18 | 1,700,000 | 1,881,407 |
| Illinois Finance Authority, | ||||
| Revenue (Advocate Health | ||||
| Care Network) | 5.00 | 6/1/28 | 9,005,000 | 10,230,220 |
| Illinois Finance Authority, | ||||
| Revenue (Rush University | ||||
| Medical Center Obligated Group) | 5.00 | 11/15/33 | 2,140,000 | 2,367,182 |
| Illinois Toll Highway Authority, | ||||
| Toll Highway Senior Revenue | 5.00 | 1/1/25 | 5,000,000 | 5,603,150 |
| Metropolitan Pier and Exposition | ||||
| Authority, Dedicated State Tax | ||||
| Revenue (McCormick Place | ||||
| Expansion Project) (Insured; | ||||
| National Public Finance | ||||
| Guarantee Corp.) | 5.55 | 6/15/21 | 2,500,000 | 2,667,125 |
| Railsplitter Tobacco Settlement | ||||
| Authority, Tobacco Settlement | ||||
| Revenue | 5.00 | 6/1/18 | 2,290,000 | 2,519,710 |
| Railsplitter Tobacco Settlement | ||||
| Authority, Tobacco Settlement | ||||
| Revenue | 5.25 | 6/1/21 | 3,300,000 | 3,835,821 |
| Railsplitter Tobacco Settlement | ||||
| Authority, Tobacco Settlement | ||||
| Revenue | 5.50 | 6/1/23 | 2,750,000 | 3,198,828 |
| Railsplitter Tobacco Settlement | ||||
| Authority, Tobacco Settlement | ||||
| Revenue | 6.00 | 6/1/28 | 2,385,000 | 2,818,521 |
The Fund 15
STATEMENT OF INVESTMENTS (continued)
| Long-Term Municipal | Coupon | Maturity | Principal | |
| Investments (continued) | Rate (%) | Date | Amount ($) | Value ($) |
| Illinois (continued) | ||||
| University of Illinois Board of | ||||
| Trustees, Auxiliary Facilities | ||||
| System Revenue (University | ||||
| of Illinois) | 5.00 | 4/1/26 | 7,595,000 | 8,643,186 |
| University of Illinois Board of | ||||
| Trustees, Auxiliary Facilities | ||||
| System Revenue (University | ||||
| of Illinois) | 5.00 | 4/1/32 | 3,655,000 | 4,077,372 |
| Indiana—2.5% | ||||
| Indiana Finance Authority, | ||||
| Educational Facilities Revenue | ||||
| (Butler University Project) | 5.00 | 2/1/30 | 1,400,000 | 1,544,074 |
| Indiana Finance Authority, | ||||
| First Lien Wastewater Utility | ||||
| Revenue (CWA Authority Project) | 5.25 | 10/1/23 | 2,500,000 | 2,954,050 |
| Indianapolis, | ||||
| Gas Utility Distribution | ||||
| System Second Lien Revenue | ||||
| (Insured; Assured Guaranty | ||||
| Municipal Corp.) | 5.00 | 8/15/23 | 3,500,000 | 4,013,415 |
| Indianapolis, | ||||
| Thermal Energy System First | ||||
| Lien Revenue (Insured; Assured | ||||
| Guaranty Municipal Corp.) | 5.00 | 10/1/18 | 7,700,000 | 8,572,872 |
| Richmond Hospital Authority, | ||||
| Revenue (Reid Hospital Project) | 5.00 | 1/1/28 | 2,440,000 | 2,743,292 |
| Iowa—.3% | ||||
| Iowa Finance Authority, | ||||
| State Revolving Fund Revenue | 5.00 | 8/1/24 | 2,000,000 | 2,351,060 |
| Kentucky—1.2% | ||||
| Kentucky Public Transportation | ||||
| Infrastructure Authority, | ||||
| Subordinate Toll Revenue, BAN | ||||
| (Downtown Crossing Project) | 5.00 | 7/1/17 | 6,250,000 | 6,764,125 |
| Pikeville, | ||||
| Hospital Improvement | ||||
| Revenue (Pikeville Medical | ||||
| Center, Inc. Project) | 6.25 | 3/1/23 | 2,195,000 | 2,624,540 |
16
| Long-Term Municipal | Coupon | Maturity | Principal | |
| Investments (continued) | Rate (%) | Date | Amount ($) | Value ($) |
| Louisiana—2.6% | ||||
| Louisiana State University Board | ||||
| of Supervisors and | ||||
| Agricultural and Mechanical | ||||
| College, Auxiliary Revenue | 5.00 | 7/1/25 | 2,000,000 | 2,263,560 |
| Tobacco Settlement Financing | ||||
| Corporation of Louisiana, | ||||
| Tobacco Settlement | ||||
| Asset-Backed Bonds | 5.00 | 5/15/27 | 17,500,000 | 18,342,275 |
| Maryland—.6% | ||||
| Maryland Economic Development | ||||
| Corporation, EDR | ||||
| (Transportation | ||||
| Facilities Project) | 5.38 | 6/1/25 | 1,500,000 | 1,637,820 |
| Maryland Health and Higher | ||||
| Educational Facilities | ||||
| Authority, Revenue | ||||
| (Peninsula Regional | ||||
| Medical Center Issue) | 5.00 | 7/1/31 | 1,740,000 | 1,933,766 |
| Maryland Health and Higher | ||||
| Educational Facilities | ||||
| Authority, Revenue (The Johns | ||||
| Hopkins Health System | ||||
| Obligated Group Issue) | 5.00 | 7/1/24 | 1,155,000 | 1,358,719 |
| Massachusetts—4.1% | ||||
| Massachusetts, | ||||
| Federal Highway GAN | ||||
| (Accelerated Bridge Program) | 5.00 | 6/15/23 | 3,250,000 | 3,890,250 |
| Massachusetts College Building | ||||
| Authority, Revenue | 5.00 | 5/1/27 | 1,800,000 | 2,124,936 |
| Massachusetts Development Finance | ||||
| Agency, Revenue (Bentley | ||||
| University Issue) | 5.00 | 7/1/23 | 2,550,000 | 2,878,185 |
| Massachusetts Development Finance | ||||
| Agency, Revenue (Partners | ||||
| HealthCare System Issue) | 5.00 | 7/1/25 | 1,000,000 | 1,147,370 |
| Massachusetts Development Finance | ||||
| Agency, Revenue (Tufts Medical | ||||
| Center Issue) | 5.50 | 1/1/22 | 2,990,000 | 3,415,716 |
The Fund 17
STATEMENT OF INVESTMENTS (continued)
| Long-Term Municipal | Coupon | Maturity | Principal | |
| Investments (continued) | Rate (%) | Date | Amount ($) | Value ($) |
| Massachusetts (continued) | ||||
| Massachusetts Educational | ||||
| Financing Authority, Education | ||||
| Loan Revenue (Issue K) | 5.00 | 7/1/22 | 6,645,000 | 7,440,606 |
| Massachusetts School Building | ||||
| Authority, Senior Dedicated | ||||
| Sales Tax Revenue | 5.00 | 10/15/23 | 2,500,000 | 2,983,450 |
| Massachusetts School Building | ||||
| Authority, Senior Dedicated | ||||
| Sales Tax Revenue | 5.00 | 8/15/24 | 5,000,000 | 5,965,550 |
| Massachusetts School Building | ||||
| Authority, Senior Dedicated | ||||
| Sales Tax Revenue | 5.00 | 8/15/28 | 2,000,000 | 2,360,180 |
| Michigan—3.6% | ||||
| Detroit, | ||||
| Sewage Disposal System Senior | ||||
| Lien Revenue (Insured; Assured | ||||
| Guaranty Municipal Corp.) | 5.25 | 7/1/19 | 1,635,000 | 1,847,403 |
| Detroit School District, | ||||
| School Building and Site | ||||
| Improvement Bonds (GO— | ||||
| Unlimited Tax) (Insured; FGIC) | 6.00 | 5/1/19 | 2,965,000 | 3,428,429 |
| Michigan, | ||||
| GO (Environmental Program) | 5.00 | 11/1/19 | 2,000,000 | 2,307,320 |
| Michigan Finance Authority, | ||||
| HR (Beaumont Health Credit | ||||
| Group) | 5.00 | 8/1/25 | 3,180,000 | 3,690,485 |
| Michigan Finance Authority, | ||||
| HR (Oakwood Obligated Group) | 5.00 | 8/15/30 | 3,870,000 | 4,241,907 |
| Michigan Finance Authority, | ||||
| Local Government Loan Program | ||||
| Revenue (Detroit Water and | ||||
| Sewerage Department, Sewage | ||||
| Disposal System Revenue Senior | ||||
| Lien Local Project Bonds) | ||||
| (Insured; Assured Guaranty | ||||
| Municipal Corp.) | 5.00 | 7/1/30 | 1,000,000 | 1,110,950 |
18
| Long-Term Municipal | Coupon | Maturity | Principal | |
| Investments (continued) | Rate (%) | Date | Amount ($) | Value ($) |
| Michigan (continued) | ||||
| Michigan Finance Authority, | ||||
| Local Government Loan Program | ||||
| Revenue (Detroit Water and | ||||
| Sewerage Department, Water | ||||
| Supply System Revenue Senior | ||||
| Lien Local Project Bonds) | ||||
| (Insured; Assured Guaranty | ||||
| Municipal Corp.) | 5.00 | 7/1/23 | 5,000,000 | 5,756,100 |
| Wayne County Airport Authority, | ||||
| Airport Revenue (Detroit | ||||
| Metropolitan Wayne | ||||
| County Airport) | 5.00 | 12/1/18 | 2,500,000 | 2,774,775 |
| Wayne County Airport Authority, | ||||
| Junior Lien Airport Revenue | ||||
| (Detroit Metropolitan Wayne | ||||
| County Airport) (Insured; | ||||
| National Public Finance | ||||
| Guarantee Corp.) | 5.00 | 12/1/22 | 2,500,000 | 2,686,200 |
| Minnesota—.8% | ||||
| Minneapolis-Saint Paul | ||||
| Metropolitan Airports | ||||
| Commission, Subordinate | ||||
| Airport Revenue (Insured; | ||||
| National Public Finance | ||||
| Guarantee Corp.) | 5.00 | 1/1/25 | 5,000,000 | 5,325,950 |
| Western Minnesota Municipal Power | ||||
| Agency, Power Supply | ||||
| Revenue | 5.00 | 1/1/24 | 1,000,000 | 1,206,730 |
| Missouri—2.4% | ||||
| Kansas City, | ||||
| General Improvement Airport | ||||
| Revenue | 5.00 | 9/1/19 | 4,000,000 | 4,546,520 |
| Missouri Development Finance | ||||
| Board, Infrastructure | ||||
| Facilities Revenue (Branson | ||||
| Landing Project) | 5.00 | 6/1/28 | 1,495,000 | 1,665,938 |
The Fund 19
STATEMENT OF INVESTMENTS (continued)
| Long-Term Municipal | Coupon | Maturity | Principal | ||
| Investments (continued) | Rate (%) | Date | Amount ($) | Value ($) | |
| Missouri (continued) | |||||
| Missouri Development Finance | |||||
| Board, Infrastructure | |||||
| Facilities Revenue (Branson | |||||
| Landing Project) | 5.00 | 6/1/30 | 2,425,000 | 2,678,825 | |
| Missouri Health and Educational | |||||
| Facilities Authority, Health | |||||
| Facilities Revenue (CoxHealth) | 5.00 | 11/15/35 | 3,705,000 | 4,077,390 | |
| Missouri Joint Municipal Electric | |||||
| Utility Commission, | |||||
| Power Project Revenue | |||||
| (Iatan 2 Project) | 5.00 | 1/1/32 | 1,550,000 | 1,733,334 | |
| Missouri Joint Municipal Electric | |||||
| Utility Commission, | |||||
| Power Project Revenue | |||||
| (Prairie State Project) | 5.00 | 12/1/30 | 3,270,000 | 3,722,503 | |
| Nebraska—.3% | |||||
| Nebraska Public Power District, | |||||
| General Revenue | 5.00 | 1/1/33 | 2,000,000 | 2,295,200 | |
| Nevada—2.2% | |||||
| Clark County, | |||||
| Airport System Revenue | 5.00 | 7/1/22 | 3,300,000 | 3,783,450 | |
| Clark County School District, | |||||
| Limited Tax GO | 5.00 | 6/15/25 | 4,950,000 | 5,396,836 | |
| Director of the State of Nevada | |||||
| Department of Business and | |||||
| Industry, SWDR (Republic | |||||
| Services, Inc. Project) | 5.63 | 6/1/18 | 5,000,000 | 5,490,800 | |
| Las Vegas Valley Water District, | |||||
| Limited Tax GO (Additionally | |||||
| Secured by Southern Nevada | |||||
| Water Authority Pledged | |||||
| Revenues) | 5.00 | 6/1/25 | 2,100,000 | 2,446,731 | |
| New Hampshire—.6% | |||||
| New Hampshire Business Finance | |||||
| Authority, PCR (The United | |||||
| Illuminating Company Project) | |||||
| (Insured; AMBAC) | 0.37 | 10/1/33 | 5,000,000 | e | 4,675,000 |
| New Jersey—1.0% | |||||
| Rutgers, The State University, | |||||
| GO | 5.00 | 5/1/29 | 6,840,000 | 7,870,925 |
20
| Long-Term Municipal | Coupon | Maturity | Principal | ||
| Investments (continued) | Rate (%) | Date | Amount ($) | Value ($) | |
| New Mexico—2.1% | |||||
| New Mexico Hospital Equipment Loan | |||||
| Council, Hospital System | |||||
| Revenue (Presbyterian | |||||
| Healthcare Services) | |||||
| (Prerefunded) | 6.00 | 8/1/18 | 7,500,000 | b | 8,639,025 |
| New Mexico Municipal Energy | |||||
| Acquisition Authority, Gas | |||||
| Supply Revenue | 0.87 | 8/1/19 | 5,000,000 | e | 5,003,650 |
| New Mexico Municipal Energy | |||||
| Acquisition Authority, Gas | |||||
| Supply Revenue (SBPA; Royal | |||||
| Bank of Canada) | 0.77 | 2/1/19 | 2,500,000 | e | 2,494,500 |
| New York—6.7% | |||||
| Long Island Power Authority, | |||||
| Electric System General | |||||
| Revenue (Insured; National | |||||
| Public Finance Guarantee Corp.) | 1.52 | 9/1/15 | 3,000,000 | e | 2,999,610 |
| New York City, | |||||
| GO | 5.00 | 8/1/20 | 2,655,000 | 3,096,765 | |
| New York City, | |||||
| GO | 5.00 | 3/1/25 | 3,300,000 | 3,949,440 | |
| New York City, | |||||
| GO | 5.00 | 8/1/28 | 5,000,000 | 5,681,350 | |
| New York City, | |||||
| GO (Prerefunded) | 5.00 | 8/1/16 | 50,000 | b | 52,700 |
| New York City Health and Hospitals | |||||
| Corporation, Health System | |||||
| Revenue | 5.00 | 2/15/22 | 4,385,000 | 5,019,992 | |
| New York City Industrial | |||||
| Development Agency, Senior | |||||
| Airport Facilities Revenue | |||||
| (Transportation Infrastructure | |||||
| Properties, LLC Obligated Group) | 5.00 | 7/1/20 | 3,035,000 | 3,383,873 | |
| New York City Transitional Finance | |||||
| Authority, Future Tax Secured | |||||
| Subordinate Revenue | 5.00 | 5/1/28 | 4,400,000 | 5,116,804 | |
| New York Liberty Development | |||||
| Corporation, Revenue | |||||
| (Goldman Sachs | |||||
| Headquarters Issue) | 5.25 | 10/1/35 | 2,000,000 | 2,361,040 |
The Fund 21
STATEMENT OF INVESTMENTS (continued)
| Long-Term Municipal | Coupon | Maturity | Principal | ||
| Investments (continued) | Rate (%) | Date | Amount ($) | Value ($) | |
| New York (continued) | |||||
| New York State Dormitory | |||||
| Authority, Revenue (New York | �� | ||||
| University Hospitals Center) | |||||
| (Prerefunded) | 5.25 | 7/1/17 | 400,000 | b | 428,364 |
| New York State Dormitory | |||||
| Authority, State Personal | |||||
| Income Tax Revenue | |||||
| (General Purpose) | 5.25 | 2/15/21 | 2,490,000 | 2,849,830 | |
| New York State Dormitory | |||||
| Authority, State Personal | |||||
| Income Tax Revenue | |||||
| (General Purpose) | 5.00 | 2/15/25 | 3,925,000 | 4,725,347 | |
| New York State Dormitory | |||||
| Authority, State Personal | |||||
| Income Tax Revenue | |||||
| (General Purpose) | 5.00 | 3/15/32 | 5,000,000 | 5,728,200 | |
| New York State Dormitory | |||||
| Authority, State Personal | |||||
| Income Tax Revenue (General | |||||
| Purpose) (Prerefunded) | 5.25 | 2/15/19 | 10,000 | b | 11,477 |
| Suffolk Tobacco Asset | |||||
| Securitization Corporation, | |||||
| Tobacco Settlement | |||||
| Asset-Backed Bonds | 5.38 | 6/1/28 | 810,000 | 799,940 | |
| Triborough Bridge and Tunnel | |||||
| Authority, General Revenue | |||||
| (MTA Bridges and Tunnels) | 5.00 | 1/1/19 | 1,500,000 | 1,693,695 | |
| Triborough Bridge and Tunnel | |||||
| Authority, General Revenue | |||||
| (MTA Bridges and Tunnels) | 0.47 | 12/3/19 | 5,000,000 | e | 4,929,800 |
| North Carolina—.9% | |||||
| North Carolina, | |||||
| Capital Improvement Limited | |||||
| Obligation Bonds | 5.00 | 5/1/30 | 4,000,000 | 4,601,880 | |
| North Carolina Eastern Municipal | |||||
| Power Agency, Power System | |||||
| Revenue (Escrowed to Maturity) | 5.00 | 1/1/21 | 1,200,000 | 1,396,344 | |
| North Carolina Medical Care | |||||
| Commission, Retirement | |||||
| Facilities First Mortgage | |||||
| Revenue (The United Methodist | |||||
| Retirement Homes Project) | 5.13 | 10/1/19 | 1,250,000 | 1,259,463 |
22
| Long-Term Municipal | Coupon | Maturity | Principal | |
| Investments (continued) | Rate (%) | Date | Amount ($) | Value ($) |
| Ohio—.5% | ||||
| Montgomery County, | ||||
| Revenue (Miami Valley Hospital) | 5.75 | 11/15/22 | 2,970,000 | 3,528,449 |
| Oregon—.1% | ||||
| Port of Portland, | ||||
| Revenue (Portland | ||||
| International Airport) | 5.00 | 7/1/35 | 1,000,000 | 1,142,080 |
| Pennsylvania—3.5% | ||||
| Allegheny County Airport | ||||
| Authority, Airport Revenue | ||||
| (Pittsburgh International | ||||
| Airport) (Insured; FGIC) | 5.00 | 1/1/19 | 3,395,000 | 3,783,422 |
| Chester County Industrial | ||||
| Development Authority, Revenue | ||||
| (Avon Grove Charter | ||||
| School Project) | 5.65 | 12/15/17 | 265,000 | 276,138 |
| Delaware Valley Regional Finance | ||||
| Authority, Local Government | ||||
| Revenue | 5.75 | 7/1/17 | 6,830,000 | 7,461,707 |
| Montgomery County | ||||
| Higher Education | ||||
| and Health Authority, HR | ||||
| (Abington Memorial Hospital | ||||
| Obligated Group) | 5.00 | 6/1/21 | 6,585,000 | 7,546,278 |
| Pennsylvania Intergovernmental | ||||
| Cooperation Authority, Special | ||||
| Tax Revenue (City of | ||||
| Philadelphia Funding Program) | 5.00 | 6/15/17 | 4,000,000 | 4,342,440 |
| Pennsylvania Turnpike Commission, | ||||
| Turnpike Revenue | 5.00 | 12/1/27 | 1,800,000 | 2,073,618 |
| Philadelphia Authority for | ||||
| Industrial Development, | ||||
| Revenue (Independence Charter | ||||
| School Project) | 5.38 | 9/15/17 | 1,080,000 | 1,127,002 |
| Philadelphia School District, | ||||
| GO | 5.00 | 9/1/17 | 1,160,000 | 1,255,758 |
| South Carolina—1.1% | ||||
| Piedmont Municipal Power Agency, | ||||
| Electric Revenue | 5.00 | 1/1/20 | 5,000,000 | 5,718,200 |
| South Carolina Public Service | ||||
| Authority, Revenue Obligations | ||||
| (Santee Cooper) | 5.00 | 12/1/25 | 2,320,000 | 2,753,306 |
The Fund 23
STATEMENT OF INVESTMENTS (continued)
| Long-Term Municipal | Coupon | Maturity | Principal | ||
| Investments (continued) | Rate (%) | Date | Amount ($) | Value ($) | |
| Texas—6.3% | |||||
| Austin, | |||||
| Electric Utility System Revenue | 5.00 | 11/15/23 | 1,550,000 | 1,799,007 | |
| Cypress-Fairbanks Independent | |||||
| School District, Unlimited Tax | |||||
| School Building Bonds | |||||
| (Permanent School Fund | |||||
| Guarantee Program) | 5.00 | 2/15/27 | 5,000,000 | 5,948,650 | |
| Harris County Metropolitan Transit | |||||
| Authority, Sales and Use Tax | |||||
| Revenue | 5.00 | 11/1/27 | 2,500,000 | 2,908,900 | |
| Harris County-Houston Sports | |||||
| Authority, Senior Lien Revenue | 5.00 | 11/15/28 | 2,500,000 | 2,840,500 | |
| Harris County-Houston Sports | |||||
| Authority, Senior Lien Revenue | 5.00 | 11/15/29 | 2,325,000 | 2,631,807 | |
| Houston, | |||||
| Airport System Subordinate | |||||
| Lien Revenue (Insured; XLCA) | 0.37 | 7/1/32 | 1,900,000 | e | 1,793,125 |
| Houston, | |||||
| Combined Utility System First | |||||
| Lien Revenue | 5.00 | 11/15/20 | 2,725,000 | 3,198,905 | |
| Houston, | |||||
| Combined Utility System First | |||||
| Lien Revenue | 5.00 | 11/15/29 | 2,500,000 | 2,870,725 | |
| North Texas Tollway Authority, | |||||
| First Tier System Revenue | 6.00 | 1/1/23 | 385,000 | 428,097 | |
| North Texas Tollway Authority, | |||||
| First Tier System Revenue | |||||
| (Prerefunded) | 6.00 | 1/1/18 | 2,615,000 | b | 2,938,632 |
| North Texas Tollway Authority, | |||||
| Second Tier System Revenue | 5.00 | 1/1/31 | 5,000,000 | 5,571,800 | |
| San Antonio, | |||||
| Municipal Drainage Utility | |||||
| System Revenue | 5.00 | 2/1/28 | 5,000,000 | 5,790,000 | |
| San Antonio, | |||||
| Water System Revenue | 5.00 | 5/15/29 | 1,355,000 | 1,546,380 | |
| Texas, | |||||
| GO (College Student Loan Bonds) | 5.50 | 8/1/19 | 3,500,000 | 4,068,925 | |
| Texas Transportation Commission, | |||||
| Central Texas Turnpike System | |||||
| Second Tier Revenue | 5.00 | 8/15/31 | 2,500,000 | 2,751,600 |
24
| Long-Term Municipal | Coupon | Maturity | Principal | |
| Investments (continued) | Rate (%) | Date | Amount ($) | Value ($) |
| Texas (continued) | ||||
| Texas Water Development Board, | ||||
| State Revolving Fund | ||||
| Subordinate Lien Revenue | 5.00 | 7/15/23 | 2,000,000 | 2,298,820 |
| Virginia—.4% | ||||
| Virginia College Building | ||||
| Authority, Educational | ||||
| Facilities Revenue (21st | ||||
| Century College and | ||||
| Equipment Programs) | 5.00 | 2/1/22 | 3,000,000 | 3,533,400 |
| Washington—3.8% | ||||
| Port of Seattle, | ||||
| Intermediate Lien Revenue | 5.00 | 2/1/18 | 2,500,000 | 2,752,825 |
| Port of Seattle, | ||||
| Intermediate Lien Revenue | 5.00 | 8/1/28 | 2,485,000 | 2,843,486 |
| Port of Seattle, | ||||
| Limited Tax GO | 5.75 | 12/1/25 | 830,000 | 992,713 |
| Port of Tacoma, | ||||
| Limited Tax GO | ||||
| (Insured; Assured | ||||
| Guaranty Municipal Corp.) | 5.00 | 12/1/20 | 3,025,000 | 3,343,018 |
| Seattle, | ||||
| Drainage and Wastewater | ||||
| Improvement Revenue | 5.00 | 9/1/27 | 5,025,000 | 5,859,100 |
| Washington, | ||||
| GO (Various Purpose) | 5.00 | 2/1/22 | 2,500,000 | 2,876,025 |
| Washington, | ||||
| Motor Vehicle Fuel Tax GO | 5.00 | 7/1/23 | 5,030,000 | 6,074,681 |
| Washington, | ||||
| Motor Vehicle Fuel Tax GO | 5.00 | 2/1/24 | 4,315,000 | 5,155,691 |
| West Virginia—.6% | ||||
| West Virginia University Board of | ||||
| Governors, University | ||||
| Improvement Revenue | ||||
| (West Virginia | ||||
| University Projects) | 5.00 | 10/1/22 | 1,475,000 | 1,736,208 |
| West Virginia Water Development | ||||
| Authority, Infrastructure | ||||
| Excess Lottery Revenue | ||||
| (Chesapeake Bay/Greenbrier | ||||
| River Projects) | 5.00 | 7/1/34 | 2,610,000 | 2,966,865 |
The Fund 25
STATEMENT OF INVESTMENTS (continued)
| Long-Term Municipal | Coupon | Maturity | Principal | ||
| Investments (continued) | Rate (%) | Date | Amount ($) | Value ($) | |
| Wisconsin—.4% | |||||
| Wisconsin Health and Educational | |||||
| Facilities Authority, Health | |||||
| Facilities Revenue | |||||
| (UnityPoint Health) | 5.00 | 12/1/28 | 1,890,000 | 2,159,854 | |
| Wisconsin Health and Educational | |||||
| Facilities Authority, Revenue | |||||
| (ProHealth Care, Inc. | |||||
| Obligated Group) | 5.00 | 8/15/33 | 1,250,000 | 1,365,088 | |
| Total Investments (cost $739,136,174) | 99.0 | % | 778,145,709 | ||
| Cash and Receivables (Net) | 1.0 | % | 8,234,954 | ||
| Net Assets | 100.0 | % | 786,380,663 | ||
a Security issued with a zero coupon. Income is recognized through the accretion of discount.
b These securities are prerefunded; the date shown represents the prerefunded date. Bonds which are prerefunded are
collateralized by U.S. Government securities which are held in escrow and are used to pay principal and interest on
the municipal issue and to retire the bonds in full at the earliest refunding date.
c Security exempt from registration pursuant to Rule 144A under the Securities Act of 1933.This security may be
resold in transactions exempt from registration, normally to qualified institutional buyers. At May 31, 2015, this
security was valued at $1,501,720 or .2% of net assets.
d Non-income producing—security in default.
e Variable rate security—interest rate subject to periodic change.
| Portfolio Summary (Unaudited)† | |||
| Value (%) | Value (%) | ||
| Transportation Services | 20.5 | Lease | 2.3 |
| Education | 14.1 | Housing | 1.3 |
| Utility-Water and Sewer | 11.3 | Pollution Control | 1.3 |
| Health Care | 9.6 | County | 1.1 |
| Utility-Electric | 8.3 | Industrial | 1.1 |
| Special Tax | 7.2 | Resource Recovery | 1.0 |
| City | 4.2 | Asset-Backed | .3 |
| Prerefunded | 3.4 | Other | 9.2 |
| State/Territory | 2.8 | 99.0 | |
| † Based on net assets. | |||
26
| Summary of Abbreviations | |||
| ABAG | Association of Bay Area | ACA | American Capital Access |
| Governments | |||
| AGC | ACE Guaranty Corporation | AGIC | Asset Guaranty Insurance Company |
| AMBAC | American Municipal Bond | ARRN | Adjustable Rate |
| Assurance Corporation | Receipt Notes | ||
| BAN | Bond Anticipation Notes | BPA | Bond Purchase Agreement |
| CIFG | CDC Ixis Financial Guaranty | COP | Certificate of Participation |
| CP | Commercial Paper | DRIVERS | Derivative Inverse |
| Tax-Exempt Receipts | |||
| EDR | Economic Development | EIR | Environmental Improvement |
| Revenue | Revenue | ||
| FGIC | Financial Guaranty | FHA | Federal Housing |
| Insurance Company | Administration | ||
| FHLB | Federal Home | FHLMC | Federal Home Loan Mortgage |
| Loan Bank | Corporation | ||
| FNMA | Federal National | GAN | Grant Anticipation Notes |
| Mortgage Association | |||
| GIC | Guaranteed Investment | GNMA | Government National Mortgage |
| Contract | Association | ||
| GO | General Obligation | HR | Hospital Revenue |
| IDB | Industrial Development Board | IDC | Industrial Development Corporation |
| IDR | Industrial Development | LIFERS | Long Inverse Floating |
| Revenue | Exempt Receipts | ||
| LOC | Letter of Credit | LOR | Limited Obligation Revenue |
| LR | Lease Revenue | MERLOTS | Municipal Exempt Receipts |
| Liquidity Option Tender | |||
| MFHR | Multi-Family Housing Revenue | MFMR | Multi-Family Mortgage Revenue |
| PCR | Pollution Control Revenue | PILOT | Payment in Lieu of Taxes |
| P-FLOATS | Puttable Floating Option | PUTTERS | Puttable Tax-Exempt Receipts |
| Tax-Exempt Receipts | |||
| RAC | Revenue Anticipation Certificates | RAN | Revenue Anticipation Notes |
| RAW | Revenue Anticipation Warrants | RIB | Residual Interest Bonds |
| ROCS | Reset Options Certificates | RRR | Resources Recovery Revenue |
| SAAN | State Aid Anticipation Notes | SBPA | Standby Bond Purchase Agreement |
| SFHR | Single Family Housing Revenue | SFMR | Single Family Mortgage Revenue |
| SONYMA | State of New York | SPEARS | Short Puttable Exempt |
| Mortgage Agency | Adjustable Receipts | ||
| SWDR | Solid Waste Disposal Revenue | TAN | Tax Anticipation Notes |
| TAW | Tax Anticipation Warrants | TRAN | Tax and Revenue Anticipation Notes |
| XLCA | XL Capital Assurance | ||
| See notes to financial statements. | |||
The Fund 27
STATEMENT OF ASSETS AND LIABILITIES
May 31, 2015
| Cost | Value | |
| Assets ($): | ||
| Investments in securities—See Statement of Investments | 739,136,174 | 778,145,709 |
| Cash | 18,330,522 | |
| Interest receivable | 9,488,708 | |
| Receivable for shares of Common Stock subscribed | 42,809 | |
| Prepaid expenses | 17,236 | |
| 806,024,984 | ||
| Liabilities ($): | ||
| Due to The Dreyfus Corporation and affiliates—Note 3(b) | 491,270 | |
| Payable for investment securities purchased | 18,342,560 | |
| Payable for shares of Common Stock redeemed | 710,161 | |
| Accrued expenses | 100,330 | |
| 19,644,321 | ||
| Net Assets ($) | 786,380,663 | |
| Composition of Net Assets ($): | ||
| Paid-in capital | 743,108,571 | |
| Accumulated undistributed investment income—net | 111,187 | |
| Accumulated net realized gain (loss) on investments | 4,151,370 | |
| Accumulated net unrealized appreciation | ||
| (depreciation) on investments | 39,009,535 | |
| Net Assets ($) | 786,380,663 | |
| Shares Outstanding | ||
| (300 million shares of $.001 par value Common Stock authorized) | 56,704,658 | |
| Net Asset Value, offering and redemption price per share ($) | 13.87 | |
| See notes to financial statements. | ||
28
STATEMENT OF OPERATIONS
Year Ended May 31, 2015
| Investment Income ($): | ||
| Interest Income | 27,056,242 | |
| Expenses: | ||
| Management fee—Note 3(a) | 4,767,848 | |
| Shareholder servicing costs—Note 3(b) | 680,801 | |
| Professional fees | 83,494 | |
| Directors’ fees and expenses—Note 3(c) | 60,675 | |
| Custodian fees—Note 3(b) | 59,046 | |
| Registration fees | 37,263 | |
| Prospectus and shareholders’ reports | 27,288 | |
| Loan commitment fees—Note 2 | 7,839 | |
| Miscellaneous | 63,746 | |
| Total Expenses | 5,788,000 | |
| Less—reduction in fees due to earnings credits—Note 3(b) | (428 | ) |
| Net Expenses | 5,787,572 | |
| Investment Income—Net | 21,268,670 | |
| Realized and Unrealized Gain (Loss) on Investments—Note 4 ($): | ||
| Net realized gain (loss) on investments | 3,035,318 | |
| Net unrealized appreciation (depreciation) on investments | (8,461,908 | ) |
| Net Realized and Unrealized Gain (Loss) on Investments | (5,426,590 | ) |
| Net Increase in Net Assets Resulting from Operations | 15,842,080 | |
| See notes to financial statements. |
The Fund 29
STATEMENT OF CHANGES IN NET ASSETS
| Year Ended May 31, | ||||
| 2015 | 2014 | |||
| Operations ($): | ||||
| Investment income—net | 21,268,670 | 23,974,227 | ||
| Net realized gain (loss) on investments | 3,035,318 | 4,239,311 | ||
| Net unrealized appreciation | ||||
| (depreciation) on investments | (8,461,908 | ) | (8,872,526 | ) |
| Net Increase (Decrease) in Net Assets | ||||
| Resulting from Operations | 15,842,080 | 19,341,012 | ||
| Dividends to Shareholders from ($): | ||||
| Investment income—net | (20,951,270 | ) | (23,631,959 | ) |
| Net realized gain on investments | — | (9,202,475 | ) | |
| Total Dividends | (20,951,270 | ) | (32,834,434 | ) |
| Capital Stock Transactions ($): | ||||
| Net proceeds from shares sold | 56,864,837 | 35,518,818 | ||
| Dividends reinvested | 16,586,488 | 26,371,198 | ||
| Cost of shares redeemed | (85,281,746 | ) | (198,836,543 | ) |
| Increase (Decrease) in Net Assets | ||||
| from Capital Stock Transactions | (11,830,421 | ) | (136,946,527 | ) |
| Total Increase (Decrease) in Net Assets | (16,939,611 | ) | (150,439,949 | ) |
| Net Assets ($): | ||||
| Beginning of Period | 803,320,274 | 953,760,223 | ||
| End of Period | 786,380,663 | 803,320,274 | ||
| Undistributed investment income—net | 111,187 | 62,050 | ||
| Capital Share Transactions (Shares): | ||||
| Shares sold | 4,057,966 | 2,595,906 | ||
| Shares issued for dividends reinvested | 1,185,014 | 1,937,805 | ||
| Shares redeemed | (6,097,063 | ) | (14,561,136 | ) |
| Net Increase (Decrease) in Shares Outstanding | (854,083 | ) | (10,027,425 | ) |
| See notes to financial statements. | ||||
30
FINANCIAL HIGHLIGHTS
The following table describes the performance for the fiscal periods indicated. Total return shows how much your investment in the fund would have increased (or decreased) during each period, assuming you had reinvested all dividends and distributions.These figures have been derived from the fund’s financial statements.
| Year Ended May 31, | ||||||||||
| 2015 | 2014 | 2013 | 2012 | 2011 | ||||||
| Per Share Data ($): | ||||||||||
| Net asset value, beginning of period | 13.96 | 14.11 | 14.23 | 13.53 | 13.52 | |||||
| Investment Operations: | ||||||||||
| Investment income—neta | .37 | .40 | .38 | .44 | .48 | |||||
| Net realized and unrealized | ||||||||||
| gain (loss) on investments | (.09 | ) | (.00 | )b | (.05 | ) | .70 | .00 | b | |
| Total from Investment Operations | .28 | .40 | .33 | 1.14 | .48 | |||||
| Distributions: | ||||||||||
| Dividends from investment income—net | (.37 | ) | (.39 | ) | (.38 | ) | (.44 | ) | (.47 | ) |
| Dividends from net realized | ||||||||||
| gain on investments | — | (.16 | ) | (.07 | ) | — | — | |||
| Total Distributions | (.37 | ) | (.55 | ) | (.45 | ) | (.44 | ) | (.47 | ) |
| Net asset value, end of period | 13.87 | 13.96 | 14.11 | 14.23 | 13.53 | |||||
| Total Return (%) | 2.00 | 2.99 | 2.28 | 8.53 | 3.65 | |||||
| Ratios/Supplemental Data (%): | ||||||||||
| Ratio of total expenses | ||||||||||
| to average net assets | .73 | .73 | .73 | .76 | .75 | |||||
| Ratio of net expenses | ||||||||||
| to average net assets | .73 | .73 | .73 | .76 | .75 | |||||
| Ratio of net investment income | ||||||||||
| to average net assets | 2.68 | 2.90 | 2.65 | 3.17 | 3.53 | |||||
| Portfolio Turnover Rate | 19.54 | 22.74 | 20.26 | 15.11 | 21.46 | |||||
| Net Assets, end of period ($ x 1,000) | 786,381 | 803,320 | 953,760 | 945,529 | 858,152 | |||||
a Based on average shares outstanding.
b Amount represents less than $.01 per share.
See notes to financial statements.
The Fund 31
NOTES TO FINANCIAL STATEMENTS
NOTE 1—Significant Accounting Policies:
Dreyfus Intermediate Municipal Bond Fund, Inc. (the “fund”) is registered under the Investment Company Act of 1940, as amended (the “Act”), as a diversified open-end management investment company. The fund’s investment objective is to seek the maximum amount of current income exempt from federal income tax as is consistent with the preservation of capital. The Dreyfus Corporation (the “Manager” or “Dreyfus”), a wholly-owned subsidiary of The Bank of New York Mellon Corporation (“BNY Mellon”), serves as the fund’s investment adviser. MBSC Securities Corporation (the “Distributor”), a wholly-owned subsidiary of Dreyfus, is the distributor of the fund’s shares, which are sold to the public without a sales charge.
The Financial Accounting Standards Board (“FASB”) Accounting Standards Codification (“ASC”) is the exclusive reference of authoritative U.S. generally accepted accounting principles (“GAAP”) recognized by the FASB to be applied by nongovernmental entities. Rules and interpretive releases of the Securities and Exchange Commission (“SEC”) under authority of federal laws are also sources of authoritative GAAP for SEC registrants. The fund’s financial statements are prepared in accordance with GAAP, which may require the use of management estimates and assumptions. Actual results could differ from those estimates.
The fund enters into contracts that contain a variety of indemnifications. The fund’s maximum exposure under these arrangements is unknown.The fund does not anticipate recognizing any loss related to these arrangements.
(a) Portfolio valuation: The fair value of a financial instrument is the amount that would be received to sell an asset or paid to transfer a liability in an orderly transaction between market participants at the measurement date (i.e., the exit price). GAAP establishes a fair value hierarchy that prioritizes the inputs of valuation techniques used to measure fair value. This hierarchy gives the highest priority to unadjusted quoted prices in active markets for identical assets or liabilities (Level 1 measurements) and the lowest priority to unobservable inputs (Level 3 measurements).
32
Additionally, GAAP provides guidance on determining whether the volume and activity in a market has decreased significantly and whether such a decrease in activity results in transactions that are not orderly. GAAP requires enhanced disclosures around valuation inputs and techniques used during annual and interim periods.
Various inputs are used in determining the value of the fund’s investments relating to fair value measurements. These inputs are summarized in the three broad levels listed below:
Level 1—unadjusted quoted prices in active markets for identical investments.
Level 2—other significant observable inputs (including quoted prices for similar investments, interest rates, prepayment speeds, credit risk, etc.).
Level 3—significant unobservable inputs (including the fund’s own assumptions in determining the fair value of investments).
The inputs or methodology used for valuing securities are not necessarily an indication of the risk associated with investing in those securities.
Changes in valuation techniques may result in transfers in or out of an assigned level within the disclosure hierarchy. Valuation techniques used to value the fund’s investments are as follows:
Investments in securities are valued each business day by an independent pricing service (the “Service”) approved by the fund’s Board of Directors (the “Board”). Investments for which quoted bid prices are readily available and are representative of the bid side of the market in the judgment of the Service are valued at the mean between the quoted bid prices (as obtained by the Service from dealers in such securities) and asked prices (as calculated by the Service based upon its evaluation of the market for such securities). Other investments (which constitute a majority of the portfolio securities) are carried at fair value as determined by the Service, based on methods which include consideration of the following: yields or prices of municipal securities of comparable quality, coupon, maturity and type; indica-
The Fund 33
NOTES TO FINANCIAL STATEMENTS (continued)
tions as to values from dealers; and general market conditions. All of the preceding securities are generally categorized within Level 2 of the fair value hierarchy.
The Service’s procedures are reviewed by Dreyfus under the general supervision of the Board.
When market quotations or official closing prices are not readily available, or are determined not to reflect accurately fair value, such as when the value of a security has been significantly affected by events after the close of the exchange or market on which the security is principally traded, but before the fund calculates its net asset value, the fund may value these investments at fair value as determined in accordance with the procedures approved by the Board. Certain factors may be considered when fair valuing investments such as: fundamental analytical data, the nature and duration of restrictions on disposition, an evaluation of the forces that influence the market in which the securities are purchased and sold, and public trading in similar securities of the issuer or comparable issuers.These securities are either categorized within Level 2 or 3 of the fair value hierarchy depending on the relevant inputs used.
For restricted securities where observable inputs are limited, assumptions about market activity and risk are used and are generally categorized within Level 3 of the fair value hierarchy.
The following is a summary of the inputs used as of May 31, 2015 in valuing the fund’s investments:
| Level 2—Other | Level 3— | |||
| Level 1— | Significant | Significant | ||
| Unadjusted | Observable | Unobservable | ||
| Quoted Prices | Inputs | Inputs | Total | |
| Assets ($) | ||||
| Investments in Securities: | ||||
| Municipal Bonds† | — | 777,245,649 | 900,060 | 778,145,709 |
| † See Statement of Investments for additional detailed categorizations. | ||||
At May 31, 2015, there were no transfers between Level 1 and Level 2 of the fair value hierarchy.
34
The following is a reconciliation of Level 3 assets for which significant unobservable inputs were used to determine fair value
| Municipal Bonds ($) | ||
| Balance as of 5/31/2014 | 900,180 | |
| Realized gain (loss) | — | |
| Change in unrealized appreciation (depreciation) | (120 | ) |
| Purchases | — | |
| Sales | — | |
| Transfers into Level 3 | — | |
| Transfers out of Level 3 | — | |
| Balance as of 5/31/2015 | 900,060 | |
| The amount of total gains (losses) for the period | ||
| included in earnings attributable to the change | ||
| in unrealized gains (losses) relating to | ||
| investments still held at 5/31/2015 | (120 | ) |
(b) Securities transactions and investment income: Securities transactions are recorded on a trade date basis. Realized gains and losses from securities transactions are recorded on the identified cost basis. Interest income, adjusted for accretion of discount and amortization of premium on investments, is earned from settlement date and recognized on the accrual basis. Securities purchased or sold on a when issued or delayed delivery basis may be settled a month or more after the trade date.
(c) Dividends to shareholders: It is the policy of the fund to declare dividends daily from investment income-net. Such dividends are paid monthly. Dividends from net realized capital gains, if any, are normally declared and paid annually, but the fund may make distributions on a more frequent basis to comply with the distribution requirements of the Internal Revenue Code of 1986, as amended (the “Code”).To the extent that net realized capital gains can be offset by capital loss carryovers, it is the policy of the fund not to distribute such gains. Income and capital gain distributions are determined in accordance with income tax regulations, which may differ from GAAP.
(d) Federal income taxes: It is the policy of the fund to continue to qualify as a regulated investment company, which can distribute tax exempt dividends, by complying with the applicable provisions of the
The Fund 35
NOTES TO FINANCIAL STATEMENTS (continued)
Code, and to make distributions of income and net realized capital gain sufficient to relieve it from substantially all federal income and excise taxes.
As of and during the period ended May 31, 2015, the fund did not have any liabilities for any uncertain tax positions.The fund recognizes interest and penalties, if any, related to uncertain tax positions as income tax expense in the Statement of Operations. During the period ended May 31, 2015, the fund did not incur any interest or penalties.
Each tax year in the four-year period ended May 31, 2015 remains subject to examination by the Internal Revenue Service and state taxing authorities.
At May 31, 2015, the components of accumulated earnings on a tax basis were as follows: undistributed tax-exempt income $762,964, undistributed ordinary income $149,562, undistributed capital gains $2,665,619 and unrealized appreciation $40,345,723.
The tax character of distributions paid to shareholders during the fiscal periods ended May 31, 2015 and May 31, 2014 were as follows: tax-exempt income $20,951,270 and $23,547,971, ordinary income $0 and $447,267, and long-term capital gains $0 and $8,839,196, respectively.
During the period ended May 31, 2015, as a result of permanent book to tax differences, primarily due to the tax treatment for amortization adjustments, the fund decreased accumulated undistributed investment income-net by $268,263, increased accumulated net realized gain (loss) on investments by $258,247 and increased paid-in capital by $10,016. Net assets and net asset value per share were not affected by this reclassification.
NOTE 2—Bank Lines of Credit:
The fund participates with other Dreyfus-managed funds in a $430 million unsecured credit facility led by Citibank, N.A. and a $300 million unsecured credit facility provided by The Bank of New York
36
Mellon (each, a “Facility”), each to be utilized primarily for temporary or emergency purposes, including the financing of redemptions. Prior to October 8, 2014, the unsecured credit facility with Citibank , N.A. was $265 million. In connection therewith, the fund has agreed to pay its pro rata portion of commitment fees for each Facility. Interest is charged to the fund based on rates determined pursuant to the terms of the respective Facility at the time of borrowing. During the period ended May 31, 2015, the fund did not borrow under the Facilities.
NOTE 3—Management Fee and Other Transactions with Affiliates:
(a) Pursuant to a management agreement with Dreyfus, the management fee is computed at the annual rate of .60% of the value of the fund’s average daily net assets and is payable monthly.
(b) Under the Shareholder Services Plan, the fund reimburses the Distributor at an amount not to exceed an annual rate of .25% of the value of the fund’s average daily net assets for the provision of certain services. The services provided may include personal services relating to shareholder accounts, such as answering shareholder inquires regarding the fund and providing reports and other information, and services related to the maintenance of shareholder accounts. During the period ended May 31, 2015, the fund was charged $374,686 pursuant to the Shareholder Services Plan.
The fund has arrangements with the transfer agent and the custodian whereby the fund may receive earnings credits when positive cash balances are maintained, which are used to offset transfer agency and custody fees. For financial reporting purposes, the fund includes net earnings credits as an expense offset in the Statement of Operations.
The fund compensates Dreyfus Transfer, Inc., a wholly-owned subsidiary of Dreyfus, under a transfer agency agreement for providing transfer agency and cash management services for the fund. The
The Fund 37
NOTES TO FINANCIAL STATEMENTS (continued)
majority of transfer agency fees are comprised of amounts paid on a per account basis, while cash management fees are related to fund subscriptions and redemptions. During the period ended May 31, 2015, the fund was charged $202,676 for transfer agency services and $9,703 for cash management services. These fees are included in Shareholder servicing costs in the Statement of Operations. Cash management fees were partially offset by earnings credits of $428.
The fund compensates The Bank of New York Mellon under a custody agreement for providing custodial services for the fund. These fees are determined based on net assets, geographic region and transaction activity. During the period ended May 31, 2015, the fund was charged $59,046 pursuant to the custody agreement.
The fund compensates The Bank of New York Mellon for performing certain cash management services related to fund subscriptions and redemptions, including shareholder redemption draft processing, under a cash management agreement. During the period ended May 31, 2015, the fund was charged $7,393 pursuant to the agreement, which is included in Shareholder servicing costs in the Statement of Operations.
During the period ended May 31, 2015, the fund was charged $10,891 for services performed by the Chief Compliance Officer and his staff.
The components of “Due to The Dreyfus Corporation and affiliates” in the Statement of Assets and Liabilities consist of: management fees $400,410, Shareholder Services Plan fees $30,698, custodian fees $20,158, Chief Compliance Officer fees $2,113 and transfer agency fees $37,891.
(c) Each Board member also serves as a Board member of other funds within the Dreyfus complex. Annual retainer fees and attendance fees are allocated to each fund based on net assets.
38
NOTE 4—Securities Transactions:
The aggregate amount of purchases and sales of investment securities, excluding short-term securities, during the period ended May 31, 2015, amounted to $153,073,025 and $156,220,115, respectively.
At May 31, 2015, the cost of investments for federal income tax purposes was $737,799,986; accordingly, accumulated net unrealized appreciation on investments was $40,345,723, consisting of $44,547,550 gross unrealized appreciation and $4,201,827 gross unrealized depreciation.
The Fund 39
REPORT OF INDEPENDENT REGISTERED
PUBLIC ACCOUNTING FIRM
Shareholders and Board of Directors
Dreyfus Intermediate Municipal Bond Fund, Inc.
We have audited the accompanying statement of assets and liabilities of Dreyfus Intermediate Municipal Bond Fund, Inc., including the statement of investments, as of May 31, 2015, and the related statement of operations for the year then ended, the statement of changes in net assets for each of the two years in the period then ended, and the financial highlights for each of the five years in the period then ended. These financial statements and financial highlights are the responsibility of the Fund’s management. Our responsibility is to express an opinion on these financial statements and financial highlights based on our audits.
We conducted our audits in accordance with the standards of the Public Company Accounting Oversight Board (United States).Those standards require that we plan and perform the audit to obtain reasonable assurance about whether the financial statements and financial highlights are free of material misstatement. We were not engaged to perform an audit of the Fund’s internal control over financial reporting. Our audits included consideration of internal control over financial reporting as a basis for designing audit procedures that are appropriate in the circumstances, but not for the purpose of expressing an opinion on the effectiveness of the Fund’s internal control over financial reporting. Accordingly, we express no such opinion. An audit also includes examining, on a test basis, evidence supporting the amounts and disclosures in the financial statements and financial highlights, assessing the accounting principles used and significant estimates made by management, and evaluating the overall financial statement presentation. Our procedures included confirmation of securities owned as of May 31, 2015 by correspondence with the custodian and others.We believe that our audits provide a reasonable basis for our opinion.
In our opinion, the financial statements and financial highlights referred to above present fairly, in all material respects, the financial position of Dreyfus Intermediate Municipal Bond Fund, Inc. at May 31, 2015, the results of its operations for the year then ended, the changes in its net assets for each of the two years in the period then ended, and the financial highlights for each of the five years in the period then ended, in conformity with U.S. generally accepted accounting principles.

New York, New York
July 28, 2015
40
IMPORTANT TAX INFORMATION (Unaudited)
In accordance with federal tax law, the fund hereby reports all the dividends paid from investment income-net during the fiscal year ended May 31, 2015 as “exempt-interest dividends” (not generally subject to regular federal income tax).Where required by federal tax law rules, shareholders will receive notification of their portion of the fund’s taxable ordinary dividends (if any), capital gains distributions (if any) and tax-exempt dividends paid for the 2015 calendar year on Form 1099-DIV, which will be mailed in early 2016.
The Fund 41
BOARD MEMBERS INFORMATION (Unaudited)
INDEPENDENT BOARD MEMBERS
Joseph S. DiMartino (71)
Chairman of the Board (1995)
Principal Occupation During Past 5 Years:
• Corporate Director and Trustee (1995-present)
Other Public Company Board Memberships During Past 5 Years:
CBIZ (formerly, Century Business Services, Inc.), a provider of outsourcing functions for small and medium size companies, Director (1997-present)
The Newark Group, a provider of a national market of paper recovery facilities, paperboard mills and paperboard converting plants, Director (2000-2010)
No. of Portfolios for which Board Member Serves: 147
———————
Joni Evans (73)
Board Member (2006)
Principal Occupation During Past 5 Years:
Chief Executive Officer, www.wowOwow.com an online community dedicated to women’s conversations and publications (2007-present)
Principal, Joni Evans Ltd. (publishing) (2006-present)
No. of Portfolios for which Board Member Serves: 26
———————
Ehud Houminer (74)
Board Member (1994)
Principal Occupation During Past 5 Years:
• Executive-in-Residence at the Columbia Business School, Columbia University (1992-present)
Other Public Company Board Membership During Past 5 Years:
• Avnet, Inc., an electronics distributor, Director (1993-2012)
No. of Portfolios for which Board Member Serves: 63
———————
Hans C. Mautner (77)
Board Member (1980)
Principal Occupation During Past 5 Years:
President—International Division and an Advisory Director of Simon Property Group, a real estate investment company (1998-2010)
Chairman and Chief Executive Officer of Simon Global Limited, a real estate company (1999-2010)
No. of Portfolios for which Board Member Serves: 26
42
Robin A. Melvin (51)
Board Member (1995)
Principal Occupation During Past 5 Years:
Co-chairman, Illinois Mentoring Partnership, non-profit organization dedicated to increasing the quantity and quality of mentoring services in Illinois; (2014-present; served as a board member since 2013)
Director, Boisi Family Foundation, a private family foundation that supports youth-serving organi- zations that promote the self sufficiency of youth from disadvantaged circumstances (1995-2012)
No. of Portfolios for which Board Member Serves: 115
———————
Burton N. Wallack (64)
Board Member (2006)
Principal Occupation During Past 5 Years:
President and Co-owner of Wallack Management Company, a real estate management company (1987-present)
No. of Portfolios for which Board Member Serves: 26
———————
John E. Zuccotti (77)
Board Member (1980)
Principal Occupation During Past 5 Years:
Chairman of Brookfield Properties, Inc. (1996-present)
Senior Counsel of Weil, Gotshal & Manges, LLP (1997-present)
Other Public Company Board Membership During Past 5 Years:
• Wellpoint, Inc., a health benefits company, Director (2005-2010)
No. of Portfolios for which Board Member Serves: 26
The Fund 43
BOARD MEMBERS INFORMATION (Unaudited) (continued)
INTERESTED BOARD MEMBER
Gordon J. Davis (73)
Board Member (2006)
Principal Occupation During Past 5 Years:
Partner in the law firm of Venable LLP (2012-present)
Partner in the law firm of Dewey & LeBoeuf LLP (1994-2012)
Other Public Company Board Memberships During Past 5 Years:
Consolidated Edison, Inc., a utility company, Director (1997-2014)
The Phoenix Companies, Inc., a life insurance company, Director (2000-2014)
No. of Portfolios for which Board Member Serves: 64
Gordon J. Davis is deemed to be an “interested person” (as defined under the Act) of the fund as a result of his affiliation with Venable LLP, which provides legal services to the fund.
———————
Once elected all Board Members serve for an indefinite term, but achieve Emeritus status upon reaching age 80.The address of the Board Members and Officers is c/o The Dreyfus Corporation, 200 Park Avenue, New York, New York 10166. Additional information about the Board Members is available in the fund’s Statement of Additional Information which can be obtained from Dreyfus free of charge by calling this toll free number: 1-800-DREYFUS.
William Hodding Carter III, Emeritus Board Member
Arnold S. Hiatt, Emeritus Board Member
44
OFFICERS OF THE FUND (Unaudited)

The Fund 45
OFFICERS OF THE FUND (Unaudited) (continued)

46
NOTES
For More Information
Ticker Symbol: DITEX
Telephone 1-800-DREYFUS
Mail The Dreyfus Family of Funds, 144 Glenn Curtiss Boulevard, Uniondale, NY 11556-0144
E-mail Send your request to info@dreyfus.com
Internet Information can be viewed online or downloaded at: http://www.dreyfus.com
The fund files its complete schedule of portfolio holdings with the Securities and Exchange
Commission (“SEC”) for the first and third quarters of each fiscal year on Form N-Q. The
fund’s Forms N-Q are available on the SEC’s website at http://www.sec.gov and may be
reviewed and copied at the SEC’s Public Reference Room in Washington, DC. Information on
the operation of the Public Reference Room may be obtained by calling 1-800-SEC-0330.
Information regarding how the fund voted proxies relating to portfolio securities for
the most recent 12-month period ended June 30 is available on the SEC’s website at
http://www.sec.gov and without charge, upon request, by calling 1-800-DREYFUS.

© 2015 MBSC Securities Corporation
Item 2. Code of Ethics.
The Registrant has adopted a code of ethics that applies to the Registrant's principal executive officer, principal financial officer, principal accounting officer or controller, or persons performing similar functions. There have been no amendments to, or waivers in connection with, the Code of Ethics during the period covered by this Report.
Item 3. Audit Committee Financial Expert.
The Registrant's Board has determined that Ehud Houminer, a member of the Audit Committee of the Board, is an audit committee financial expert as defined by the Securities and Exchange Commission (the "SEC"). Mr. Houminer is "independent" as defined by the SEC for purposes of audit committee financial expert determinations.
Item 4. Principal Accountant Fees and Services.
(a) Audit Fees. The aggregate fees billed for each of the last two fiscal years (the "Reporting Periods") for professional services rendered by the Registrant's principal accountant (the "Auditor") for the audit of the Registrant's annual financial statements or services that are normally provided by the Auditor in connection with the statutory and regulatory filings or engagements for the Reporting Periods, were $32,792 in 2014 and $33,612 in 2015.
(b) Audit-Related Fees. The aggregate fees billed in the Reporting Periods for assurance and related services by the Auditor that are reasonably related to the performance of the audit of the Registrant's financial statements and are not reported under paragraph (a) of this Item 4 were $6,120 in 2014 and $6,273 in 2015. These services consisted of one or more of the following: (i) agreed upon procedures related to compliance with Internal Revenue Code section 817(h), (ii) security counts required by Rule 17f-2 under the Investment Company Act of 1940, as amended, (iii) advisory services as to the accounting or disclosure treatment of Registrant transactions or events and (iv) advisory services to the accounting or disclosure treatment of the actual or potential impact to the Registrant of final or proposed rules, standards or interpretations by the Securities and Exchange Commission, the Financial Accounting Standards Boards or other regulatory or standard-setting bodies.
The aggregate fees billed in the Reporting Periods for non-audit assurance and related services by the Auditor to the Registrant's investment adviser (not including any sub-investment adviser whose role is primarily portfolio management and is subcontracted with or overseen by another investment adviser), and any entity controlling, controlled by or under common control with the investment adviser that provides ongoing services to the Registrant ("Service Affiliates"), that were reasonably related to the performance of the annual audit of the Service Affiliate, which required pre-approval by the Audit Committee were $0 in 2014 and $0 in 2015.
(c) Tax Fees. The aggregate fees billed in the Reporting Periods for professional services rendered by the Auditor for tax compliance, tax advice, and tax planning ("Tax Services") were $4,249 in 2014 and $2,901 in 2015. These services consisted of: (i) review or preparation of U.S. federal, state, local and excise tax returns; (ii) U.S. federal, state and local tax planning, advice and assistance regarding statutory, regulatory or administrative developments; and (iii) tax advice regarding tax qualification matters and/or treatment of various financial instruments held or proposed to be acquired or held. The aggregate fees billed in the Reporting Periods for Tax Services by the Auditor to Service Affiliates, which required pre-approval by the Audit Committee were $0 in 2014 and $0 in 2015.
(d) All Other Fees. The aggregate fees billed in the Reporting Periods for products and services provided by the Auditor, other than the services reported in paragraphs (a) through (c) of this Item, were $2,315 in 2014 and $3,774 in 2015. These services included a review of the Registrant's anti-money laundering program.
The aggregate fees billed in the Reporting Periods for Non-Audit Services by the Auditor to Service Affiliates, other than the services reported in paragraphs (b) through (c) of this Item, which required pre-approval by the Audit Committee, were $0 in 2014 and $0 in 2015.
(e)(1) Audit Committee Pre-Approval Policies and Procedures. The Registrant's Audit Committee has established policies and procedures (the "Policy") for pre-approval (within specified fee limits) of the Auditor's engagements for non-audit services to the Registrant and Service Affiliates without specific case-by-case consideration. The pre-approved services in the Policy can include pre-approved audit services, pre-approved audit-related services, pre-approved tax services and pre-approved all other services. Pre-approval considerations include whether the proposed services are compatible with maintaining the Auditor's independence. Pre-approvals pursuant to the Policy are considered annually.
(e)(2) Note: None of the services described in paragraphs (b) through (d) of this Item 4 were approved by the Audit Committee pursuant to paragraph (c)(7)(i)(C) of Rule 2-01 of Regulation S-X.
(f) None of the hours expended on the principal accountant's engagement to audit the registrant's financial statements for the most recent fiscal year were attributed to work performed by persons other than the principal account's full-time, permanent employees.
Non-Audit Fees. The aggregate non-audit fees billed by the Auditor for services rendered to the Registrant, and rendered to Service Affiliates, for the Reporting Periods were $40,974,357 in 2014 and $20,773,877 in 2015.
Auditor Independence. The Registrant's Audit Committee has considered whether the provision of non-audit services that were rendered to Service Affiliates, which were not pre-approved (not requiring pre-approval), is compatible with maintaining the Auditor's independence.
Item 5. Audit Committee of Listed Registrants.
Not applicable. [CLOSED-END FUNDS ONLY]
Item 6. Investments.
(a) Not applicable.
Item 7. Disclosure of Proxy Voting Policies and Procedures for Closed-End Management Investment Companies.
Not applicable. [CLOSED-END FUNDS ONLY]
Item 8. Portfolio Managers of Closed-End Management Investment Companies.
Not applicable. [CLOSED-END FUNDS ONLY, beginning with reports for periods ended on and after December 31, 2005]
Item 9. Purchases of Equity Securities by Closed-End Management Investment Companies and Affiliated Purchasers.
Not applicable. [CLOSED-END FUNDS ONLY]
Item 10. Submission of Matters to a Vote of Security Holders.
There have been no material changes to the procedures applicable to Item 10.
Item 11. Controls and Procedures.
(a) The Registrant's principal executive and principal financial officers have concluded, based on their evaluation of the Registrant's disclosure controls and procedures as of a date within 90 days of the filing date of this report, that the Registrant's disclosure controls and procedures are reasonably designed to ensure that information required to be disclosed by the Registrant on Form N-CSR is recorded, processed, summarized and reported within the required time periods and that information required to be disclosed by the Registrant in the reports that it files or submits on Form N-CSR is accumulated and communicated to the Registrant's management, including its principal executive and principal financial officers, as appropriate to allow timely decisions regarding required disclosure.
(b) There were no changes to the Registrant's internal control over financial reporting that occurred during the second fiscal quarter of the period covered by this report that have materially affected, or are reasonably likely to materially affect, the Registrant's internal control over financial reporting.
Item 12. Exhibits.
(a)(1) Code of ethics referred to in Item 2.
(a)(2) Certifications of principal executive and principal financial officers as required by Rule 30a-2(a) under the Investment Company Act of 1940.
(a)(3) Not applicable.
(b) Certification of principal executive and principal financial officers as required by Rule 30a-2(b) under the Investment Company Act of 1940.
SIGNATURES
Pursuant to the requirements of the Securities Exchange Act of 1934 and the Investment Company Act of 1940, the Registrant has duly caused this Report to be signed on its behalf by the undersigned, thereunto duly authorized.
DREYFUS INTERMEDIATE MUNICIPAL BOND FUND, INC.
By: /s/ Bradley J. Skapyak | |
Bradley J. Skapyak, President
| |
Date: | July 20, 2015 |
| |
Pursuant to the requirements of the Securities Exchange Act of 1934 and the Investment Company Act of 1940, this Report has been signed below by the following persons on behalf of the Registrant and in the capacities and on the dates indicated. | |
| |
By: /s/ Bradley J. Skapyak | |
Bradley J. Skapyak, President
| |
Date: | July 20, 2015 |
| |
By: /s/ James Windels | |
James Windels, Treasurer
| |
Date: | July 20, 2015 |
| |
EXHIBIT INDEX
(a)(1) Code of ethics referred to in Item 2.
(a)(2) Certifications of principal executive and principal financial officers as required by Rule 30a-2(a) under the Investment Company Act of 1940. (EX-99.CERT)
(b) Certification of principal executive and principal financial officers as required by Rule 30a-2(b) under the Investment Company Act of 1940. (EX-99.906CERT)
Exhibit A
Persons Covered by the Code of Ethics
Bradley J. Skapyak | President | (Principal Executive Officer) |
|
|
|
James Windels |
Treasurer | (Principal Financial and Accounting Officer) |
Revised as of January 1, 2010