UNITED STATES
SECURITIES AND EXCHANGE COMMISSION
Washington, D.C. 20549
e
Form 10-K
c
(Mark One)
| |
☑ | ANNUAL REPORT PURSUANT TO SECTION 13 OR 15(d) OF THE SECURITIES EXCHANGE ACT OF 1934 |
For the fiscal year ended December 27, 2024
Or
| |
☐ | TRANSITION REPORT PURSUANT TO SECTION 13 OR 15(d) OF THE SECURITIES EXCHANGE ACT OF 1934 |
For the transition period from to
Commission file number: 0-11634
STAAR SURGICAL COMPANY
(Exact name of registrant as specified in its charter)
| | |
Delaware | | 95-3797439 |
(State or other jurisdiction of incorporation or organization) | | (I.R.S. Employer Identification No.) |
25510 Commercentre Drive Lake Forest, California | |
92630
|
(Address of Principal Executive Offices) | | (Zip Code) |
(626) 303-7902
(Registrant’s telephone number, including area code)
Securities registered pursuant to Section 12(b) of the Act:
| | |
Title of each class | Trading Symbol(s) | Name of each exchange on which registered |
Common | STAA | NASDAQ |
Securities registered pursuant to Section 12(g) of the Act: None
Indicate by check mark if the registrant is a well-known seasoned issuer, as defined in Rule 405 of the Securities Act. Yes ☑ No ☐
Indicate by check mark if the registrant is not required to file reports pursuant to Section 13 or Section 15(d) of the Act. Yes ☐ No ☑
Indicate by check mark whether the registrant (1) has filed all reports required to be filed by Section 13 or 15(d) of the Securities Exchange Act of 1934 during the preceding 12 months (or for such shorter period that the registrant was required to file such reports), and (2) has been subject to such filing requirements for the past 90 days. Yes ☑ No ☐
Indicate by check mark whether the registrant has submitted electronically every Interactive Data File required to be submitted pursuant to Rule 405 of Regulation S-T (§ 232.405 of this chapter) during the preceding 12 months (or for such shorter period that the registrant was required to submit such files). Yes ☑ No ☐
Indicate by check mark whether the registrant is a large accelerated filer, an accelerated filer, a non-accelerated filer, a smaller reporting company, or an emerging growth company. See the definitions of “large accelerated filer,” “accelerated filer,” “smaller reporting company,” and “emerging growth company” in Rule 12b-2 of the Exchange Act.
| | | | |
Large accelerated filer | ☑ | | Accelerated filer | ☐ |
Non-accelerated filer | ☐ | | Smaller reporting company | ☐ |
Emerging growth company | ☐ | | | |
If an emerging growth company, indicate by check mark if the registrant has elected not to use the extended transition period for complying with any new or revised financial accounting standards provided pursuant to Section 13(a) of the Exchange Act. ☐
Indicate by check mark whether the registrant has filed a report on and attestation to its management’s assessment of the effectiveness of its internal control over financial reporting under Section 404(b) of the Sarbanes-Oxley Act (15 U.S.C. 7262(b)) by the registered public accounting firm that prepared or issued its audit report. ☑
If securities are registered pursuant to Section 12(b) of the Act, indicate by check mark whether the financial statements of the registrant included in the filing reflect the correction of an error to previously issued financial statements. ☐
Indicate by check mark whether any of those error corrections are restatements that required a recovery analysis of incentive-based compensation received by any of the registrant’s executive officers during the relevant recovery period pursuant to §240.10D-1(b). ☐
Indicate by check mark whether the registrant is a shell company (as defined in Rule 12b-2 of the Exchange Act). Yes ☐ No ☑
The aggregate market value of the voting and non-voting common equity held by non-affiliates of the registrant as of June 28, 2024, the last business day of the registrant’s most recently completed second fiscal quarter, was approximately $2,340,566,448 based on the closing price per share of $47.61 of the registrant’s Common Stock on that date.
The registrant has 49,325,372 shares of common stock, par value $0.01 per share, issued and outstanding as of February 18, 2025.
DOCUMENTS INCORPORATED BY REFERENCE
Portions of the registrant’s definitive proxy statement relating to its 2025 annual meeting of stockholders, which will be filed with the Securities and Exchange Commission pursuant to Regulation 14A within 120 days of the close of the registrant’s last fiscal year, are incorporated by reference into Part III of this report.
STAAR SURGICAL COMPANY
TABLE OF CONTENTS
PART I
SPECIAL NOTE REGARDING FORWARD-LOOKING STATEMENTS AND INDUSTRY DATA
This Annual Report on Form 10-K (Annual Report) contains statements that constitute “forward-looking statements” within the meaning of Section 27A of the Securities Act of 1933, as amended (Securities Act), and Section 21E of the Securities Exchange Act of 1934, as amended (Exchange Act), and the Private Securities Litigation Reform Act of 1995, and is subject to the safe harbor created therein. All statements other than statements of historical or current facts in this report or referred to or incorporated by reference into this report are forward-looking statements. These statements include comments regarding the intent, belief or current expectations of the Company and its management. In some cases, readers can recognize forward-looking statements by the use of words like “anticipate,” “estimate,” “expect,” “project,” “intend,” “may,” “plan,” “believe,” “will,” “should,” “could,” “forecast,” “potential,” “continue,” “ongoing” (or the negative of these words and similar words or expressions) although not all forward-looking statements contain these words. Forward-looking statements contained in this Annual Report include, without limitation, statements regarding: our future earnings, revenue, sales, profit margins, expense rate, cash, effective tax rate, product mix, capital expense or any other financial items; our expectations regarding the demand for ICLs in China and the macroeconomic trends in China; the plans, strategies, and objectives of management for future operations or prospects for achieving such plans, including statements under the caption “Strategic Imperatives for 2025” in Part II. Item 7. “Management’s Discussion and Analysis of Financial Condition and Results of Operations”; statements regarding new, existing, or improved products, including but not limited to, expectations for success of new, existing, and improved products in the U.S. or international markets or government approval of a new or improved products; commercialization of new or improved products; future economic conditions or size of market opportunities; expected costs of operations; statements of belief, including as to achieving business plans for 2025 and beyond; expected regulatory activities and approvals, product launches, and any statements of assumptions underlying any of the foregoing. We caution investors and prospective investors that any such forward-looking statements are not guarantees of future performance and involve risks, uncertainties, assumptions and other factors, which if they do not materialize or prove correct, could cause actual results to differ materially from those expressed or implied by such forward-looking statements. We caution you not to place undue reliance on these forward-looking statements and to note they speak only as of the date hereof. Factors that could cause actual results to differ materially from those set forth in the forward-looking statements are included in the risk factors set forth in Item 1A, “Risk Factors.” We disclaim any intention or obligation to update or revise any financial projections or forward-looking statements due to new information or other events, except as required by law.
This Annual Report contains estimates, projections and other information concerning the ophthalmic industry, our business, and the markets for certain medical conditions, procedures, and products. Information that is based on estimates, forecasts, projections, market research or similar methodologies is inherently subject to uncertainties and actual events or circumstances may differ materially from the estimates and forecasts reflected in this information. Unless otherwise expressly stated, we obtained this industry, business, market, and other data from reports, research surveys, studies, and similar data prepared by market research firms and other third parties, industry, medical and general publications, government data, and similar sources.
In order to assist investors and prospective investors with an understanding of the ophthalmic industry, our business, certain medical conditions, procedures and products, we have included in this Annual Report a discussion of the structure and function of the human eye, commencing on page 8, and a glossary explaining many of the technical terms used in this Annual Report, commencing on page 15.
ITEM 1. Business
STAAR Surgical Company designs, develops, manufactures, and sells implantable lenses for the eye and accessory delivery systems used to deliver the lenses into the eye. We are the leading manufacturer of phakic implantable lenses used worldwide in corrective or “refractive” surgery. We have been dedicated solely to ophthalmic surgery for over 40 years. Our goal is to position our refractive lenses throughout the world as primary and premium solutions for patients seeking visual freedom from wearing eyeglasses or contact lenses while achieving excellent visual acuity through refractive vision correction. Unless the context indicates otherwise, “we,” “us,” the “Company,” and “STAAR” refer to STAAR Surgical Company and its consolidated subsidiaries.
STAAR generates worldwide revenue almost exclusively from sales of our implantable Collamer lenses, or “ICLs.” Our ICLs are made from Collamer, which is a proprietary collagen copolymer material created and exclusively used by STAAR to make our lenses soft, flexible and biocompatible with the eye. Our ICLs are phakic lenses, meaning that they are implanted into the eye without removing the eye’s natural crystalline lens. This
distinguishes an ICL procedure from other refractive procedures, as it does not involve the removal of corneal eye tissue. All of our ICLs are foldable, which allows the surgeon to insert them into the eye through a small incision during minimally invasive surgery. Further, while ICLs are intended to be permanent, our ICLs are reversible lens implants, meaning they can be removed by a doctor if desired.
We market and sell our ICLs for refractive surgery to treat myopia (nearsightedness) as our “EVO” family of lenses. We believe our EVO lenses are an “Evolution in Visual Freedom” designed to provide premium refractive outcomes while optimizing patient comfort. Our EVO family of lenses includes our EVO ICL, EVO+ ICL, and EVO Visian ICL. Our newest offering, EVO Viva, has an extended depth of focus (EDoF) optic, which is designed to treat myopia with presbyopia (age-related loss of ability to focus). We also market and sell an ICL lens to treat hyperopia (farsightedness), which we call our Visian ICL. We make our ICL product offerings available in multiple models, powers and lengths, including some with toric ICL (TICL) versions to correct for astigmatism (blurred vision). Not all of our products are currently available in all markets where we sell ICLs today.
STAAR employs a commercialization strategy that strives for sustainable, profitable growth. Our growth strategy includes making our complete ICL product line available in our existing geographic markets and expanding into attractive markets where we do not sell our products today. In addition, we are focused on driving awareness of the ICL procedure and the clinical benefits of our ICLs, and providing surgeon training, support and education, particularly in our newer markets. Historically, the Company also manufactured and sold intraocular lenses (or “IOLs”) for use in surgery to treat cataracts. As the Company has focused its business and strategy on its ICL product offerings, we have phased out our cataract IOL product line. For the fiscal year ended December 27, 2024, approximately 100% of our net sales were generated from sales of ICLs.
Operations
STAAR has significant operations globally. For the fiscal year ended December 27, 2024, the Company generated 94% of its reported worldwide revenue from product sales outside the United States. STAAR sells its products in more than 75 countries, with direct distribution (i.e., via STAAR representatives) in Japan, the U.S., Germany, Spain, Singapore, Canada, and the U.K., with a combination of direct distribution and independent distribution (i.e., via distributors and STAAR representatives) in China, Korea, India, France, Benelux, and Italy, and with independent distribution in the remainder of the countries where we sell.
STAAR maintains operational and administrative facilities in the U.S., Switzerland, and Japan. An overview of STAAR’s current global operations and key facilities is as follows:
•United States. STAAR’s global administrative offices, principal manufacturing, warehouse, and distribution facilities are located in Monrovia, California. We manufacture the raw material for Collamer lenses in our facility in Aliso Viejo, California. STAAR also operates a technology center housing its research and development (R&D) team and labs in Tustin, California. Our corporate headquarters, including our executive offices, our EVO Experience Center, and additional operational facilities, are located in Lake Forest, California.
•Switzerland. STAAR operates an administrative, distribution and operational facility in Brügg, Switzerland under its wholly owned subsidiary, STAAR Surgical AG. We are in the process of expanding our manufacturing capabilities for STAAR’s ICL products in our Nidau, Switzerland facility.
•Japan. STAAR operates administrative and distribution facilities in Japan under its wholly owned subsidiary, STAAR Japan Inc. (STAAR Japan). STAAR Japan’s administrative facilities are in Tokyo and Osaka, and its distribution facility is in Musashino City, in greater Tokyo.
We also maintain commercial offices in China, Germany, Spain, India, Singapore, and the U.K.
Financial Information about Segments and Geographic Areas
100% of the Company’s sales are generated from the ophthalmic surgical product segment and, therefore, the Company operates as one operating segment for financial reporting purposes. The Company’s principal products are ICLs used in refractive surgery. See Note 16 to the Consolidated Financial Statements for financial information about product lines and operations in geographic areas.
Principal Products
STAAR’s principal products are ICLs used in refractive surgery, including our EVO family of lenses. In designing our ICL product offerings, we seek to delight patients and surgeons by:
•Improving patient outcomes;
•Minimizing patient risk; and
•Simplifying ophthalmic procedures and post-operative care for the surgeon and the patient.
Refractive surgery corrects visual disorders that have traditionally been treated by eyeglasses or contact lenses. The field of refractive surgery includes both lens-based procedures, using products like our ICLs, and laser-based procedures like LASIK. Our ICL products are designed to treat a wide range of refractive conditions within commonly known vision disorders such as myopia (nearsightedness), hyperopia (farsightedness), astigmatism (blurred vision) and presbyopia (age-related loss of ability to focus).
All of our ICLs fold for minimally invasive implantation. During a quick surgical procedure, the ICL will be implanted behind the iris and in front of the natural crystalline lens, using techniques similar to those used to implant an IOL during cataract surgery, except that the natural lens remains intact in the eye. Lenses of this type are generically called “phakic IOLs” or “phakic implants” because they work along with the patient’s natural lens, or phakos, rather than replacing it. The surgeon typically implants the ICL using topical anesthesia on an outpatient basis. The patient usually experiences immediate vision improvement within a day. Typically, ICL surgery is an elective procedure paid for or financed by the patient.
Our EVO ICL is the only posterior chamber phakic IOL approved by the U.S. Food and Drug Administration (FDA) for marketing and sale in the U.S., and we believe it is the world’s largest selling phakic IOL. Our biocompatible Collamer material belongs to a family of materials known as collagen copolymers. Collagen copolymers are compounds formed by joining molecules of collagen derived from biological sources with synthetic monomer molecules. The proprietary Collamer material is exclusive to us. We believe that the biocompatibility of the Collamer material used for our ICL product line is a significant factor in the ability to place this lens safely in the posterior chamber of the eye.
STAAR began selling the ICL for myopia for use outside the U.S. in 1997. U.S. sales commenced in 2006. In September 2011, STAAR launched the ICL with CentraFLOW technology, commonly known as EVO ICL, which uses a port in the center of the ICL optic in markets outside the U.S. The port is of a size intended to optimize the flow of fluid within the eye without affecting the quality of vision. The central port also eliminates the need for the surgeon to perform a YAG peripheral iridotomy procedure days before the ICL implant. The CentraFLOW technology makes the visual outcomes of the ICL available through a relatively quick and comfortable surgical implantation experience. We are authorized to sell the EVO ICL in all countries where we sell our ICL family of lenses. In December 2015, we received the CE Mark for EVO+, an ICL with CentraFLOW technology and an expanded optical zone of up to 20%. We believe the expanded optical zone may further improve certain patients’ visual experience, thus making the ICL increasingly desirable for both patients and ophthalmic surgeons. We are authorized to sell the EVO+ in the following regions: the approximately 31 countries that require the European Union CE Mark, Korea, Japan, India, Canada, the U.S., Hong Kong, Turkey, and several countries in the Middle East. In March 2022, the U.S. FDA granted approval of the EVO ICL, EVO+ ICL, and the EVO Visian ICL (for the correction of myopia and myopia with astigmatism). The Visian ICL for hyperopia, which treats farsightedness, is sold primarily in countries that require the European Union CE Mark. In July 2020, we received the CE Mark for EVO Viva, a presbyopia-correcting ICL with an aspheric EDoF optic. We commenced certifying surgeons located in countries that recognize the CE Mark to implant the EVO Viva lens. The EVO Viva lens adds near and intermediate vision correction for patients with presbyopia. We believe the EVO Viva lens will assist certain patients with eliminating the burdens of reading glasses or frequent replacement contact lenses. The launch of EVO ICL and EVO+ ICL have helped drive our growth, and in March 2024, STAAR announced the achievement of a significant milestone for the Company, having sold an aggregate of more than 3,000,000 ICLs worldwide.
We make our ICL product offerings available in multiple models, powers and lengths, including some with toric ICL (TICL) versions to correct for astigmatism. As a result, we manufacture hundreds of different types of lenses. This requires us to carry a significant amount of inventory to meet customer preference for rapid delivery. We are investing in our manufacturing and operations capabilities to be able to meet forecasted demand and further shorten lead times.
According to Market Scope, LLC a publisher of ophthalmic industry data, approximately 5.2 million refractive procedures, primarily laser vision procedures, were expected to be performed worldwide in 2024. The incidence of myopia is growing globally, with high myopia becoming more common according to recently published articles, affecting nearly 5 billion and 1 billion people, respectively, by 2050 (Global Prevalence of Myopia and High Myopia and Temporal Trends from 2000 through 2050, Ophthalmology, Vol. 123, No. 5, May 2016; Global trends in myopia management attitudes and strategies in clinical practice, Contact Lens and anterior Eye, Vol. 39, 2016). We believe this will result in a significantly increased number of patients seeking refractive procedures. We believe that over the past decade negative publicity regarding LASIK has reduced patient interest in the LASIK procedure. The ICL is a lens-based refractive procedure (unlike LASIK), and STAAR has sold more than 3,000,000 ICLs to date. Surgeons have published hundreds of peer-reviewed articles with clinical data regarding the safety, effectiveness, and visual quality of the ICL. We believe the ICL provides a safe and effective solution for the growing number of patients with refractive conditions who will seek visual freedom from eyeglasses and contact lenses.
We plan to continue to develop and launch innovative products to support clinical needs and to address the increasing demands of our customers. As part of our sales and marketing efforts, we attend and participate in major ophthalmic conventions around the world and invest in market development, practice support, healthcare professional training and patient outreach. We have started working more closely with leading refractive clinics to drive awareness of the ICL procedure and the clinical benefits of our ICLs and to enhance education and practice development. Our marketing programs seek to position our ICL products as a premium and primary option for appropriate patients at the clinic and via digital and social media. We believe that surgeon education and training is critical to the continued adoption of the ICL procedure. In April 2024, we announced the launch of STAAR University, which offers surgeons access to publications, key clinical outcomes data, and other resources to support clinical confidence. In September 2024, we announced the opening of a new EVO Experience Center at our headquarters in Lake Forest, CA, to serve as a hub for comprehensive, hands-on training and education in lens-based vision correction. STAAR offers a comprehensive range of professional education programs to support ophthalmic professionals including wet labs, peer mentorship, and proctorship.
Sales of ICLs accounted for approximately 100% of our total sales in fiscal 2024, approximately 99% of our total sales in fiscal 2023, and approximately 95% of our total sales in fiscal 2022.
Other Products
While STAAR generates worldwide revenue almost exclusively from sales of our ICLs, we also record Other Products revenue, which includes sales of IOLs, delivery systems and normal recurring sales adjustments such as sales return allowances. Historically, the Company manufactured and sold IOLs for use in surgery to treat cataracts, as well as injectors for use in cataract surgery and injector parts. Sales from these cataract IOLs and other surgical products, as well as sales adjustments such as return allowances, are recorded as Other Products revenue. As the Company has focused its business and strategy on its ICL product offerings, we have phased out sales of our cataract IOLs and other surgical products. We did not record revenue from cataract IOL sales in fiscal 2024, and we do not expect such sales in the future. Other Products revenue accounted for less than 1% of our total sales in fiscal 2024, and approximately 1% of our total sales in fiscal 2023, and approximately 5% of our total sales in fiscal 2022.
Sources and Availability of Raw Materials
STAAR uses a wide range of raw materials in the production of our ICLs. STAAR purchases most of the raw materials and components from external suppliers. Some of our raw materials are single-sourced due to regulatory constraints, cost effectiveness, availability, quality, and vendor reliability issues. Many of our components are standard parts or materials and are available from a variety of sources. We do not typically pursue regulatory and quality certification of multiple sources of supply.
Patents, Trademarks, and Licenses
We strive to protect our investment in the research, development, manufacturing, and marketing of our products through the use of patents, trademarks, licenses, trade secrets, and copyrights. We own or have rights to a number of patents, licenses, trademarks, copyrights, trade secrets, know-how and other intellectual property related and important to our business. As of December 27, 2024, we owned approximately 66 United States and foreign patents and had 21 patent applications pending. We rely more on trade secrets than patents and believe that no particular patent is so important that its loss or expiration would materially adversely affect our operations as a whole.
Our intellectual property generally relates to the design, production, and manufacture of the Collamer lens material and related materials, ICLs and related lenses, and lens delivery systems for folding intraocular lenses
(injectors and cartridges, both stand-alone and preloaded) used with ICLs. We believe it would require extensive time and effort for a competitor to duplicate our intellectual property and processes to develop a product with comparable capabilities to our ICL family of products.
Worldwide, we sell all of our major products under trademarks we consider to be important to our business. STAAR®, STAAR Surgical™, EVO ICL™, EVO+ ICL™, EVO Visian® ICL™, EVO Viva™, Evolution in Visual Freedom®, Visian®, Collamer®, CentraFLOW®, and AquaPORT®, are trademarks or registered trademarks of STAAR in the U.S., the European Union, or other countries. The scope and duration of trademark protection varies widely throughout the world. In some countries, trademark protection continues only as long as the mark is used. Other countries require registration of trademarks and the payment of registration fees. Trademark registrations are generally for fixed but renewable terms. This Annual Report may refer to these and other trademarks and tradenames. Solely for convenience, our trademarks and tradenames referred to in this Annual Report may appear without the ® or ™ symbols, but such references are not intended to indicate in any way that we will not assert, to the fullest extent under applicable law, our rights to these trademarks and tradenames. This Annual Report may also include trademarks owned by other parties, and all other such trademarks mentioned in this Annual Report are the property of their respective owners.
We protect our proprietary technology, in part, through confidentiality and nondisclosure agreements with employees, consultants, and other parties. Our confidentiality agreements with employees and consultants generally contain standard provisions requiring those individuals to assign to STAAR, without additional consideration, inventions conceived or reduced to practice by them while employed or retained by STAAR, subject to customary exceptions. We cannot provide any assurance that employees and consultants will abide by the confidentiality or other terms of their agreements. Despite measures taken to protect our intellectual property, unauthorized parties may copy aspects of our products or obtain and use information that we regard as proprietary.
Seasonality
While certain individual markets may be impacted by seasonal trends on a quarterly basis, in the aggregate, seasonality does not materially affect our sales.
Working Capital Requirements
There are no special inventory requirements or credit terms extended to customers that have a material adverse effect on our working capital.
Distribution and Customers
We market our products to a variety of health care providers, including ophthalmic surgeons, vision centers, surgical centers, hospitals, government facilities, and distributors. Ophthalmologists are the primary users of our products.
We sell our products directly through our own sales representatives in Japan, the U.S., Germany, Spain, Singapore, Canada, and the U.K. We sell through a combination of our own representatives and independent distributors in China, Korea, India, France, Benelux, and Italy. We sell through independent distributors in other countries. Our products are sold in more than 75 countries worldwide. We maintain a global marketing team, as well as regional marketing personnel to support the promotion and sale of our products. The global marketing department supports selling efforts by developing and providing promotional materials, speakers’ programs, digital and social media sites, participation in trade shows and technical presentations. Where we distribute products directly, we rely on local sales representatives to help generate sales by promoting and demonstrating our products with physicians. Our clinical affairs personnel provide training and educational courses globally.
Two customers, our China distributors who sell into China and Hong Kong, accounted for approximately 51% of our consolidated net sales during fiscal 2024. Net sales to our China distributors during each of the last three fiscal years were as follows:
| | | | | | | | |
Net Sales to China Distributors | |
Fiscal Year | | Net Sales
($, in thousands) | | | Net Sales as Percentage of Consolidated Net Sales | |
2024 | | $ | 161,321 | | | | 51.4 | % |
2023 | | $ | 185,554 | | | | 57.6 | % |
2022 | | $ | 148,167 | | | | 52.1 | % |
Our agreements with our distributors in China provide for minimum inventory requirements based on forecasted demand. These requirements are intended to establish minimum levels of inventory in-country to mitigate potential delays associated with importation and logistics, as well as to establish a sufficient supply of lenses to support quick and efficient delivery and fulfillment for surgical procedures. Our distributors often purchase lenses above the minimums required by their agreements. During fiscal 2024, our distributors purchased lenses above such minimums in anticipation of higher procedural volumes during what is typically a summer “high season” in China. Due to dynamic macroeconomic conditions and other factors, the number of ICL procedures performed during the high season and the second half of 2024 overall was lower than expected. Accordingly, our distributors in China held, as of December 27, 2024, elevated levels of ICL product inventory. Given the size of the Company’s business in China relative to its net sales in the rest of the world, macroeconomic conditions in China have a significant impact on the Company’s business, operations, and financial results. The sluggish economy and weak consumer consumption in China negatively impacted the Company’s financial results for fiscal 2024, and as discussed further in “Management’s Discussion and Analysis of Financial Condition and Results of Operations,” is expected to continue to impact demand for our ICLs in China in fiscal 2025.
Backlog
We generally keep sufficient inventory on hand to ship product immediately or shortly after receipt of an order. As we offer different types of ICLs to treat different refractive conditions, and our ICLs are manufactured to address refractive prescriptions across a broad range of correction, we maintain a large number of Stock Keeping Units (SKUs). The challenge of maintaining inventory in all models can result in a backlog in customer orders. During fiscal 2024, we continued to increase our inventory levels to meet the significant level of anticipated demand for our ICL lenses and to support quick and efficient delivery and fulfillment for surgical procedures. Increasing our inventory levels also helps mitigate risks associated with potential disruptions to our manufacturing and production process. We currently manufacture all of our ICL products at a single facility in Monrovia, California. To mitigate the risk of fire, flood, earthquake, terrorism or other natural or man-made disasters, including manufacturing challenges such as equipment or information technology (IT) failure, we have increased our inventory levels. We maintain this inventory at different sites in the United States, Switzerland, and Japan. As of December 27, 2024, finished goods inventory, net was $43.3 million, or 194 Days’ Inventory on Hand (DOH), including consignment inventory.
Government Contracts
No material portion of our business is subject to renegotiation of profits or termination of any particular contract or subcontract at the election of the U.S. Government.
Competition
Competition in the ophthalmic surgical product market is intense and is primarily driven by technological innovation and the regulatory approval required to commercialize products in the key markets around the world. The development of new or improved products may make existing products less attractive, reduce them to commodity status or even make them obsolete. To remain competitive, companies such as STAAR must devote continued efforts and significant financial resources to enhance their existing products and to develop new products.
Our ICL technology competes with other elective surgical procedures such as laser vision correction (e.g., LASIK) for those consumers who are looking for an alternative to eyeglasses or contact lenses to correct their vision, and to a lesser extent phakic lens implants.
We believe our primary competition in selling the ICL to patients seeking surgery to correct refractive conditions lies not in similar products to the ICL, but in laser surgical procedures. Alcon (formerly a part of Novartis), Johnson & Johnson (formerly Advanced Medical Optics or AMO), Bausch Health Companies (formerly Valeant, Bausch & Lomb or B+L), and Carl Zeiss Meditec AG, all market lasers for corneal refractive surgery and promote their sales worldwide.
Phakic implants that compete with the ICL are also available in the marketplace. The two principal types of phakic implantable lenses are (1) posterior chamber designs like the ICL, including lenses made by Biotech Vision Care, Care Group, and Eyebright and (2) iris clip anterior chamber designs, including lenses made by Ophtec. While most competing lenses are made from types of silicone or acrylic, we believe our ICLs offer compelling clinical advantages due to our proprietary Collamer lens material, as well as their design and features. We also believe our track record of safety and effectiveness, and high levels of patient satisfaction, are competitive advantages relative to laser surgical procedures and other implantable lenses. Notably, our EVO ICL is the only foldable, minimally invasive posterior chamber phakic intraocular lens approved for sale in the U.S. In addition, competitors from Asia are beginning to
appear in the market with their low-cost version of a posterior chamber implantable contact lens, increasing the level of competition.
The Human Eye
The following discussion provides background information on the structure, function, and some of the disorders of the human eye to enhance the reader’s understanding of our products described in this Annual Report. The human eye is a specialized sensory organ capable of receiving visual images and transmitting them to the visual center in the brain. The eye has an anterior segment and a posterior segment that are separated by the natural crystalline lens.
The anterior segment consists of the cornea, the iris and ciliary body and the trabecular meshwork. It is filled with a water-based fluid called aqueous humor and is divided, by the iris, into an anterior chamber and a posterior chamber. The cornea is a clear lens at the front of the eye through which light first passes and is focused toward the back of the eye. The interior surface of the cornea is lined with a single layer of flat, tile-like endothelial cells, whose function is to maintain the transparency of the cornea. The iris is a pigmented muscular curtain located behind the cornea which opens and closes to regulate the amount of light entering the eye through the pupil, an opening at the center of the iris. The crystalline lens, located behind the iris, completes the focusing of light and can change shape to focus objects at different distances onto the retina, located in the back of the eye. The trabecular meshwork, a drainage channel located between the iris and the surrounding white portion of the eye, maintains a normal pressure in the anterior chamber of the eye by draining excess aqueous humor.
The posterior segment of the eye that is behind the natural lens is filled with a jelly-like material called the vitreous humor. The retina is a layer of nerve tissue in the back of the eye consisting of millions of light receptors called rods and cones, which receive the light image and transmit it to the brain via the optic nerve.
Common visual disorders, disease or trauma can affect the eye. One of the most prevalent ocular disorders is cataracts. Cataract formation is generally an age-related disorder that involves the hardening and loss of transparency of the natural crystalline lens, impairing visual acuity.
Refractive disorders, which generally are not age-related, include myopia, hyperopia, and astigmatism. A normal, well-functioning eye receives images of objects at varying distances from the eye and focuses the images on the retina. Refractive errors occur when the eye’s natural optical system does not properly focus an image on the retina. Myopia, also known as nearsightedness, occurs when the eye’s lens focuses images in front of the retina. Hyperopia, or farsightedness, occurs when the eye’s lens focuses images behind the plane of the retina. Individuals with myopia or hyperopia may also have astigmatism. Astigmatism is due to an irregular curvature of the cornea or defects in the natural lens that causes light to not focus at a single depth in the eye resulting in blurred vision. Presbyopia is an age-related refractive disorder that limits a person’s ability to see in the near and middle-distance range as the natural crystalline lens loses its elasticity, reducing the eye’s ability to accommodate or adjust its focus for varying distances.
Regulatory Matters
Nearly all countries where we sell our products have regulations requiring premarket clearance or approval of medical devices by governmental or regulatory authorities. Various federal, state, local and foreign laws also apply to our operations, including, among other things, working conditions, laboratory, clinical, advertising and promotions, and design and manufacturing practices, and the use and disposal of hazardous or potentially hazardous substances.
The requirements for clearance or approval to market medical products vary widely by country. The requirements range from minimal requirements to rigorous requirements comparable to those established by the U.S. FDA. Obtaining clearance or approval to distribute medical products is complex, costly, and time-consuming in virtually all the major markets where we sell medical devices. We cannot give any assurance that any new medical devices we develop will be cleared or approved in any country where we propose to sell our medical devices or, if approved, whether such approvals will be granted in a timely or cost-effective manner, be as broad in scope as we seek, or be conditioned on post-market study requirements or restrictive labeling. We also cannot give any assurance that if our medical devices are approved for sale in a country, subsequent action will not be taken by the responsible regulatory authorities in the country with respect to our medical devices that might affect our ability to maintain the required approvals in the country or to continue to sell our medical devices in the country. The regulatory requirements in our most important current markets, China, Europe, Japan, Korea and the U.S., are discussed below.
Medical Device Regulations in the United States.
Under the United States Federal Food, Drug & Cosmetic Act, as amended (the Act), the FDA has the authority to regulate, among other things, the design, development, manufacturing, preclinical and clinical testing, labeling,
product safety, marketing, sales, distribution, premarket clearance and approval, recordkeeping, reporting, advertising, promotion, post-market surveillance, and import and export of medical devices.
Most of our products are classified as medical devices intended for human use within the meaning of the Act and, therefore, are subject to FDA regulation.
Each medical device we seek to commercially distribute in the United States must first receive clearance to market under a notification submitted pursuant to Section 510(k) of the Act, known as the 510(k) premarket notification, or premarket approval (PMA) from the FDA, unless specifically exempted by the agency or subject to another form of FDA premarket review. The FDA classifies all medical devices into one of three classes. The FDA establishes procedures for compliance based upon the device’s classification as Class I (general controls, such as establishment registration and device listing with FDA, labeling and record-keeping requirements), Class II (performance standards in addition to general controls) or Class III (PMA required before commercial marketing). Devices deemed to pose lower risk are categorized as either Class I (low risk) or II (moderate risk). Manufacturers of Class II devices are generally required to submit to the FDA a 510(k) premarket notification requesting clearance of the device for commercial distribution in the United States. Most low risk (Class I) devices and some Class II devices are exempt from this requirement. The FDA deems Class III devices to pose the greatest risk and are the most extensively regulated. These devices include life-supporting, life sustaining, or implantable devices, or devices deemed not substantially equivalent to a previously 510(k) cleared device. The effect of assigning a device to Class III is to require each manufacturer to submit to the FDA a PMA that includes information on the safety and effectiveness of the device. The FDA reviews device applications and notifications through its Office of Device Evaluation (ODE).
510(k) Clearance. Our lens injector systems are Class I devices subject to the 510(k) premarket review and clearance process. A medical device that is substantially equivalent to either a previously-cleared medical device or a device that was in commercial distribution before May 28, 1976 for which the FDA has not yet called for the submission of a PMA, or is a device that has been reclassified from Class III to either Class II or I may be eligible for the FDA’s 510(k) premarket notification process. FDA clearance under Section 510(k) of the Act does not imply that the safety, reliability, and effectiveness of the medical device has been approved or validated by the FDA. The review period and FDA determination as to substantial equivalence generally takes from three to twelve months from the date the application is submitted and filed. However, the process may take significantly longer, and clearance is never assured. Although many 510(k) premarket notifications are cleared without clinical data, in some cases, the FDA requires significant clinical data to support substantial equivalence. In reviewing a premarket notification, the FDA may request additional information including clinical data, which may significantly prolong the review process.
After a device receives 510(k) clearance, any modification that could significantly affect its safety or effectiveness, or that would constitute a major change in its intended use, will require a new 510(k) clearance or could require premarket approval. The FDA requires each manufacturer to make its own initial determination as to whether a change meets this threshold. However, the FDA can review any such decision and can disagree with a manufacturer’s determination. If the FDA disagrees with a manufacturer’s determination, the FDA can require the manufacturer to cease marketing or recall the modified device until 510(k) clearance or a PMA is obtained.
Premarket Approval. Our ICL products are Class III devices subject to the PMA approval process and not 510(k) clearance. The more rigorous PMA process requires us to demonstrate that a new medical device is safe and effective for its intended use. The FDA may require that a PMA be supported by, among other things, extensive technical, pre-clinical, clinical testing, manufacturing, and labeling data to demonstrate to the FDA’s satisfaction, the safety and effectiveness of the device.
After a PMA application is submitted and filed, the FDA begins an in-depth review of the submitted information, which typically takes between six and twelve months, but may take significantly longer depending on the questions received from the FDA regarding the application. During the review period, the FDA may request additional information or clarification of information already provided. In addition to its own review, the FDA may organize an independent advisory panel of experts to review the PMA whenever a device is the first of its kind or the FDA otherwise determines panel review is warranted. The FDA holds panels on a regular basis, but the need to schedule panel review usually adds some weeks or months to the review process. In addition, the FDA will conduct a pre-approval inspection of the manufacturing facility to ensure compliance with Quality System Regulation (QSR) which imposes elaborate design, development, testing, control, validation, documentation, complaint handling, supplier control, and other quality assurance procedures in the design and manufacturing process. The FDA may approve a PMA application with post-approval conditions intended to ensure the safety and effectiveness of the device including, among other things, restrictions on labeling, promotion, sale and distribution and conduct of additional post-approval clinical studies or collection of long-term follow-up from patients in the clinical study that supported approval. Failure
to comply with the conditions of approval can result in materially adverse enforcement action, including the loss or withdrawal of the approval.
If a manufacturer plans to make significant modifications to the manufacturing process, labeling, or design of an approved PMA device, the manufacturer must submit an application called a “PMA Supplement” regarding the change. The FDA generally reviews PMA Supplements on a 180-day agency timetable, which may be extended if significant questions arise in review of the supplement. A manufacturer may implement limited changes prior to the FDA’s review of a PMA Supplement. The FDA designates some PMA Supplements as “panel-track” supplements, which means that the agency believes review by an advisory panel may be warranted. Designation as a panel-track supplement does not necessarily mean that panel review will occur.
Clinical or Market Trials. A clinical trial is typically required to support a PMA application and is sometimes required for a 510(k) premarket notification. Clinical trials conducted to support premarket clearance or approval generally require submission of an application for an Investigational Device Exemption (IDE) to the FDA. Appropriate data must support the IDE application, such as animal and laboratory testing results, showing that it is safe to test the device in humans and that the investigational protocol is scientifically sound. The IDE application must be approved by the FDA for a specified number of patients, unless the product is deemed eligible for more abbreviated IDE requirements. Clinical trials for a significant risk device may begin once the FDA approves the IDE application. All FDA-regulated clinical studies, whether significant or non-significant risk, must be approved and overseen by the appropriate institutional review boards (IRBs) for each clinical trial, and informed consent of the patients participating in the clinical trial must be obtained. After a trial begins, the FDA may place it on hold or terminate it, if, among other reasons, it concludes that the clinical subjects are exposed to an unacceptable health risk. Any trials we conduct in the United States must be conducted in accordance with FDA regulations as well as other federal regulations and state laws concerning human subject protection and privacy. Moreover, the results of a clinical trial may not be sufficient to obtain clearance or approval of the product.
Oversight of compliance with quality, medical device reporting, clinical study, and other regulations. Both before and after we receive premarket clearance or approval and release a product commercially, we have ongoing responsibilities under FDA regulations. The FDA reviews design and manufacturing practices, labeling and record keeping, product complaints and manufacturer’s required reports of adverse experiences, product corrections and removals, and other information to identify potential problems with marketed medical devices. We are also subject to periodic inspection by the FDA for compliance with the FDA’s QSR and other requirements, such as requirements for advertising and promotion. The Good Manufacturing Practice (GMP) regulations for medical devices embodied in the QSR govern the methods used in, and the facilities and controls used for, the design, manufacture, packaging, labeling, and servicing of all finished medical devices intended for human use.
The FDA’s Bioresearch Monitoring Program (BIMO), reviews our activities as a sponsor of clinical research. BIMO conducts facilities inspections as part of a program designed to ensure that data and information contained in requests for IDEs, PMA applications and 510(k) submissions are scientifically valid, reliable, and accurate. Another objective of the program is to ensure that human subjects are protected from undue hazard or risk during scientific investigations.
If the FDA were to conclude that we are not in compliance with applicable laws or regulations, or that any of our medical devices are ineffective or pose an unreasonable health risk, the FDA could require us to notify health professionals and others that the devices present unreasonable risk or substantial harm to public health, order a recall, repair, replacement, or refund of the devices, detain, or seize adulterated or misbranded medical devices, or ban the medical devices. The FDA may also issue warning letters or untitled letters, refuse our request for 510(k) clearance or PMA approval, revoke existing 510(k) clearances or PMA approvals previously granted, impose operating restrictions, enjoin, and restrain certain violations of applicable law pertaining to medical devices and assess civil or criminal penalties against our officers, employees, or us. The FDA may also recommend prosecution to the Department of Justice. In the case of devices subject to pending premarket clearance or approval applications, FDA has broad authority to halt the review of applications and require significant additional data analyses, audits, and other corrective actions where clinical data contained in an application are deemed to be actually or potentially unreliable, inaccurate, or not in compliance with clinical study or good clinical practice requirements.
Healthcare Fraud and Abuse Laws and Regulations in the United States.
Even though we do not control referrals of healthcare services or bill directly to Medicare, Medicaid or other third-party payers, certain federal, state and international healthcare laws and regulations pertaining to fraud and abuse and patients’ rights may be applicable to our business. We may be subject to healthcare fraud and abuse and patient
privacy regulation by the federal government, the states and the international jurisdictions in which we conduct our business. The regulations that may affect our ability to operate include, without limitation:
•the federal Anti-Kickback Statute, which prohibits, among other things, any person from knowingly and willfully offering, soliciting, receiving, or providing remuneration, directly or indirectly, to induce either the referral of an individual, for an item or service or the purchasing or ordering of a good or service, for which payment may be made under federal healthcare programs such as the Medicare and Medicaid programs;
•the federal False Claims Act, which prohibits, among other things, individuals, or entities from knowingly presenting, or causing to be presented, false claims, or knowingly using false statements, to obtain payment from the federal government, and which may apply to entities that provide coding and billing advice to customers;
•federal criminal laws that prohibit executing a scheme to defraud any healthcare benefit program or making false statements relating to healthcare matters;
•the federal physician sunshine requirements under the Patient Protection and Affordable Care Act of 2010, which requires manufacturers of drugs, devices, biologics, and medical supplies to report annually to the Centers for Medicare & Medicaid Services information related to payments and other transfers of value relating to certain drugs, devices, biologics, and medical supplies to physicians, other healthcare providers, and teaching hospitals, and ownership and investment interests held by physicians and other healthcare providers and their immediate family members;
•the federal Health Insurance Portability and Accountability Act of 1996, as amended by the Health Information Technology for Economic and Clinical Health Act of 2009, which governs the conduct of certain electronic healthcare transactions and protects the security and privacy of protected health information; and
•state and international law equivalents of each of the above federal laws, such as anti-kickback and false claims laws which may apply to items or services reimbursed by any third-party payer, including commercial insurers; state laws that require device companies to comply with the industry’s voluntary compliance guidelines and the applicable compliance guidance promulgated by the federal government, or otherwise restrict payments that may be made to healthcare providers and other potential referral sources; state and international laws that require device manufacturers to report information related to payments and other transfers of value to physicians and other healthcare providers or marketing expenditures; and state and international laws governing the privacy and security of health information in certain circumstances, which may differ from each other and may not have the same effect, thus complicating compliance efforts.
Because of the breadth of these laws and the narrowness of the statutory exceptions and safe harbors available, it is possible that some of our business activities could be subject to challenge under one or more of such laws. In addition, recent health care reform legislation has strengthened these laws. For example, the Health Care Reform Law, among other things, amends the intent requirement of the Federal Anti-Kickback Statute and criminal healthcare fraud statutes. A person or entity no longer needs to have actual knowledge of the statute or specific intent to violate it. In addition, the Patient Protection and Affordable Care Act provides that the government may assert that a claim including items or services resulting from a violation of the Federal Anti-Kickback Statute constitutes a false or fraudulent claim for purposes of the False Claims Act.
Medical Device Regulations Outside the United States.
CE Marking. In the European Economic Area (EEA), which is comprised of the 27 Member States of the European Union plus Norway, Iceland, and Liechtenstein, legacy medical devices must comply with the essential requirements of the EU Medical Devices Directive (Council Directive 93/42/EEC). Compliance with the essential requirements of the EU Medical Device Directive is a prerequisite to be able to affix a Conformité Européenne Mark (CE Mark), without which medical devices cannot be marketed or sold in the EEA. To demonstrate compliance with the essential requirements, medical device manufacturers must undergo a conformity assessment procedure, which varies according to the type of medical device and its classification.
The method of assessing conformity varies depending on the class of the product, but normally involves a combination of self-assessment by the manufacturer and a third-party assessment by a “Notified Body.” Notified Bodies are a group of private quality-monitoring organizations that are accredited to review medical devices and to monitor quality systems and adverse event reporting. The independent Notified Bodies perform, on a privatized basis, functions similar to the FDA in the U.S. and the Pharmaceuticals and Medical Devices Agency (PMDA) in Japan.
Our facilities in the United States and Switzerland are subject to regular inspection by a designated Notified Body. Other countries, such as Switzerland and the United Kingdom, have voluntarily adopted laws and regulations that largely mirror those of the European Union with respect to medical devices, and a number of countries outside of Europe permit importation of devices bearing the CE Mark.
The European Union regulatory bodies finalized a new Medical Device Regulation (MDR) in 2017, which replaced the existing Directives and provided three years for transition and compliance. The MDR will change several aspects of the existing regulatory framework, such as updating clinical data requirements and introducing new ones, such as Unique Device Identification (UDI). We and the Notified Bodies who will oversee compliance to the new MDR face uncertainties and increased costs as the MDR is rolled out and enforced by the European Commission and EEA Competent Authorities, creating risks in several areas, including the CE Marking process and data transparency, in the upcoming years. In March 2023, the European Union extended the EU MDR transition periods for devices transitioning to the EU MDR from May 2024 to May 2026 for class III implantable custom-made devices, and December 31, 2027 for class III and implantable class IIb devices. The exit of the UK from the European Union (BREXIT) in 2020 resulted in the requirement to re-certify our preloaded acrylic cataract IOL under a non-UK Notified Body, and to separately register our CE Marked products for sale in the UK. In 2023, the UK extended to June 2028 the allowance of medical devices with a valid declaration and CE marking to be placed on the Great Britain market. The failure of Switzerland and the EU to enter into a Mutual Recognition Agreement resulted in a change of our EC Authorized Representative, discontinuance of the pre-loaded acrylic cataract IOL for the Swiss market, and registration of our remaining products under Swiss law. We have since stopped manufacturing our preloaded acrylic cataract IOL and have phased out sales of our cataract IOLs as we focus on growing our ICL business.
We have affixed the CE Mark to all our principal products sold in CE Mark jurisdictions including ICLs and delivery systems. In July 2022, our Notified Body in the European Union, DEKRA, certified the CE Marking for our currently certified and commercially available ICLs, delivery systems, and calculation software under the new MDR. During the fourth quarter of 2021 and the first quarter of 2022, DEKRA performed audits of our US and Swiss facilities certifying them to the MDR requirements, EN ISO 13485:2016 as well as to the “Medical Device Single Audit Program” (MDSAP). MDSAP provides for a single audit recognized by Australia, Brazil, Canada, Japan and the United States demonstrating routine compliance with QSR/GMP requirements.
Medical Device Regulation in Japan. The Japanese Ministry of Health, Labor, and Welfare (MHLW) regulates the sale of medical devices under Japan’s Pharmaceuticals and Medical Devices Act (PMD Act). The Pharmaceuticals and Medical Devices Agency (PMDA), a quasi-governmental organization, performs many of the medical device review functions for MHLW. Medical devices generally must undergo thorough safety examinations and demonstrate medical effectiveness before the MHLW grants shonin (premarket device approval) or ninsho (premarket certification). Manufacturers and resellers (referred to as Marketing Authorization Holders or MAHs) must also satisfy certain requirements before the MHLW grants a business license, or kyoka. Requirements for manufacturers and MAHs include compliance with Japanese regulations covering GQP (good quality practice) and GVP (good vigilance practice), which largely include conformity to the ISO 13485 standard and are similar to good manufacturing practice and post-market surveillance requirements in the United States, as well as the assignment of internal supervisors over marketing, quality assurance, and safety control.
Approval for a new medical device that lacks a substantial equivalent in the Japanese market will generally require the submission of clinical trial data. Only a licensed MAH can apply for premarket device approval in Japan, and in most cases, the clinical trial data must include data gathered from Japanese subjects. For example, STAAR Japan conducted a separate clinical trial in Japan for the shonin application for the ICL. Also, approval for a new medical device will require the manufacturer to undertake to reexamine the safety and effectiveness of the device with a review of post-market data gathered within a certain period - normally four years - after approval. The specific post-market reexamination requirement for a medical device is announced at the time of approval.
STAAR Japan currently holds shonin approval for the ICL products, preloaded injectors, and their associated lenses, and kyoka licensing as a manufacturer and MAH of medical devices. The sponsor of a clinical trial submitted to the PMDA must strictly follow Good Clinical Practice (GCP) standards and must follow the trial with standard Good Post-Market Study Practice (GPSP) reporting and a follow-up program. MHLW and PMDA also assess the quality management systems of manufacturers and the conformity of products to the requirements of the PMD Act. STAAR is subject to inspection for compliance by these agencies. A company’s failure to comply with the PMD Act can result in severe penalties, including revocation or suspension of a company’s business license and possible criminal sanctions. If the PMDA were to conclude that we are not in compliance with applicable laws or regulations, or that any of our medical devices are ineffective or pose an unreasonable health risk, they could take a variety of regulatory or legal actions, similar to the U.S. FDA, which could have a material and negative impact on the Company.
Medical Device Regulation in China and Korea. Sales of our products in China and Korea, as in other countries, are also subject to regulatory requirements.
In China, medical devices such as our ICLs are mainly regulated by Regulations on the Supervision and Administration of Medical Device (Decree No. 739) promulgated by the State Council. National Medical Products Administration (NMPA) is the governmental authority principally responsible for the supervision and administration of medical devices in China.
Each medical device intended for commercial distribution in China is subject to a mandatory filing or registration regime regulated by the NMPA. The classification of such devices mainly determines the filing pathways. China has a three-class classification system, from Class I (lowest risk) to Class III (highest risk). Most of STAAR’s medical devices are Class II and Class III devices and are subject to a restricted registration pathway. Applicants are required to submit a product technical requirements (PTR) document, which shall mainly include the performance indicators and testing methods of the medical device. Also, applicants must have samples of the device tested in a government-recognized lab or submit in-house or qualified third-party testing results. The PTR, test reports, quality system documents, labeling information, together with other registration documents, are submitted to the Center for Medical Device Evaluation (CMDE) division of the NMPA for technical evaluation.
If approved, NMPA issues the medical device a registration license valid for five years. The manufacturer submits a renewal application before the license expiration date to renew a medical device’s registration.
After approval, in case of substantial changes to the design, raw materials, manufacturing process, and indications, among other things, that may affect the medical device's safety and effectiveness, the manufacturer applies to NMPA for approval of such registration changes. In case of minor changes that do not affect the medical device's safety and effectiveness, the manufacturer submits a change notification to NMPA.
While STAAR Surgical AG and STAAR Surgical Company hold the licenses, STAAR China serves as a local agent. The local agent is authorized to submit the registration application materials to NMPA, and provides maintenance support and technical service, oversees the registration and clinical trial process. Under Decree 1, Medical Device Adverse Event Reporting and Reevaluation, the license holder bears the primary responsibility for monitoring medical device adverse events (AEs) and establishing an AE monitoring system. The local agent helps manage AEs in case of device malfunction.
The license holder and local agent are responsible for carrying out self-inspection of the quality management system periodically. They are also responsible for identifying, monitoring, and trending adverse events related to the medical device.
In Korea, a registration of medical devices such as our ICLs is overseen by the Ministry of Food and Drug Safety (MFDS) pursuant to the Medical Device Act. The Medical Device Safety Bureau of the MFDS holds primary responsibility for medical device regulations, while departments within the National Institute of Food and Drug Safety Evaluation (NIFDS) oversee the evaluation and research of medical devices. Medical devices require registration and/or approval prior to commercialization. In Korea, medical device classification closely follows the Global Harmonization Task Force (GHTF) Classification guidelines, with Class I, II, III and IV designations being ranked from low- to high-risk categorization. The registration review route depends on the risk classification of the device. Typically, the MFDS requires similar documentation as required to obtain a CE Mark. Our distributor in Korea is contractually required to obtain, with our assistance, the necessary health registrations, governmental approvals, or clearances to import, market and sell our products. In Korea, we provide our distributor with information and data to obtain appropriate registrations and approvals, and the distributor obtains such registrations. In addition to the device registration, MFDS requires all devices Class II and above to comply with Korean Good Manufacturing Practice (KGMP) quality system standards in order to be marketed in Korea. KGMP standards are based on ISO 13485 quality system standards. However, they are not identical. Therefore, ISO 13485 certificates issued by a notified body in the EU will not be sufficient. To obtain KGMP certification, documents that pertain to all areas of compliance, including design, risk assessment, technical requirements and any other quality system requirements, need to be submitted to an MFDS-authorized third party. Our distributor in Korea submits the application on behalf of STAAR. After the application is submitted, the manufacturing site undergoes either a paper audit or an onsite inspection/audit by an authorized third party and MFDS. Medical device registration licenses do not expire, but the KGMP certificate must be renewed every three years.
If the NMPA or MFDS were to conclude that we are not in compliance with applicable laws or regulations, or that any of our medical devices are ineffective or pose an unreasonable health risk, they could take a variety of
regulatory or legal actions in their respective countries, similar to the U.S. FDA, which could have a material and negative impact on the Company.
Third-Party Coverage and Reimbursement.
Health care providers generally rely on third-party payers, including governmental payers such as Medicare and Medicaid, private insurance plans and workers’ compensation plans, to cover and reimburse the cost of medical devices and related services. These third-party payers may deny coverage or reimbursement for a medical device if they determine that the product or procedure using the product was not medically appropriate or necessary, and they are increasingly challenging the price of medical devices and services.
Our ICL products generally are not covered by third-party payers, and patients incur out-of-pocket costs for these products and related procedures using our products. Our cataract IOL products used in cataract procedures generally are covered by third-party payers in whole or in part depending upon a variety of factors, including the specific product used and geographic location where the procedure using the covered product is performed. The market for some of our IOL products therefore is influenced by third-party payers’ policies.
Other Regulations.
Our business and our ICL products are subject to extensive regulation by numerous other governmental agencies, both within the U.S. and internationally. In the U.S., apart from the agencies discussed above, our facilities, operations, employees, and products are regulated by the Environmental Protection Agency, the Occupational Health & Safety Administration, the Department of Labor, the Department of Commerce, the Department of Treasury, the Department of Justice and others. State agencies also regulate our facilities, operations, employees, and products within their respective states. Government agencies internationally also regulate public health, product registration, manufacturing, environmental conditions, labor, exports, imports, bribery and corruption and other aspects of our global operations. Any failure to comply with applicable legal and regulatory obligations could result in fines and penalties, restrictions on certain business activities, and other remedial measures, which if significant, could disrupt our operations, distract management, and harm our business.
The advertising and promotion of our ICL products is also subject to extensive regulation, which can vary significantly from country to country. In the U.S., the FDA and the Federal Trade Commission regulate the advertising and promotion of our products and require that the claims we make are consistent with our regulatory clearances and approvals, that there is adequate and reasonable data to substantiate the claims and that our promotional labeling and advertising is neither false nor misleading. Many international regulators impose similar requirements, but some jurisdictions impose significant restrictions on the ability of medical device companies to engage in advertising and promotion activities. Because a key element of our growth strategy is to drive awareness of the ICL procedure and the clinical benefits of our ICLs, limitations on our ability to advertise and promote our ICL products could harm our business.
In addition, we are subject to U.S. federal and state and foreign data privacy, security and data breach notification laws governing the collection, use, disclosure and protection of health-related and other personal information. In the U.S., numerous federal and state laws and regulations, including data breach notification laws, health information privacy and security laws and consumer protection laws and regulations govern the collection, use, disclosure, and protection of health-related and other personal information. In addition, certain foreign laws govern the privacy and security of personal data, including health-related data. Privacy and security laws, regulations, and other obligations are constantly evolving, may conflict with each other to complicate compliance efforts, and can result in investigations, proceedings, or actions that lead to significant civil and/or criminal penalties and restrictions on data processing.
Research and Development
We focus on furthering technological advancements in the ophthalmic products industry through the development of innovative premium ophthalmic products (lenses and accessory delivery systems), materials and designs. We maintain active internal research and development programs. To achieve our business objectives, we will continue our investment in research and development.
During 2025, we intend to continue our focus on research and development in the following areas:
•Development of new presbyopia-correcting phakic intraocular lenses that simultaneously correct sphere and cylinder (i.e., astigmatism);
•Development of preloaded injector systems for ophthalmic medical devices; and
•Development of a new generation of ophthalmic medical devices and materials.
Environmental Matters
We are subject to federal, state, local and foreign environmental laws, and regulations. We believe that our operations comply in all material respects with applicable environmental laws and regulations in each country where we do business. We do not expect compliance with these laws to affect materially our capital expenditures, earnings, or competitive position. We have no plans to invest in material capital expenditures for environmental control facilities for the remainder of our current fiscal year. We are not aware of any pending actions, litigation or significant financial obligations arising from current or past environmental practices that are likely to have a material adverse impact on our financial position. However, environmental problems relating to our properties could develop in the future, and such problems could require significant expenditures. In addition, we cannot predict changes in environmental legislation or regulations that may be adopted or enacted in the future and that may adversely affect us.
We seek to achieve our corporate goals in an environmentally sustainable manner. Our most recent Sustainability Report, which includes information about our approach to environmental, social and governance (or “ESG”) at STAAR, is available in the Investors section of our website, www.staar.com, under the Sustainability tab. We established a cross-functional climate risk committee to identify the risks presented by climate change and opportunities to reduce our environmental impact. STAAR has undertaken several projects designed to reduce energy and waste, such as our investment in solar photovoltaic panels at three locations in California (our principal manufacturing facility in Monrovia, our precision manufacturing center of excellence facility in Lake Forest, and our technology center in Tustin).
Human Capital
Our goal is to develop, manufacture and sell ophthalmic products throughout the world as primary and premium solutions for patients seeking visual freedom from wearing eyeglasses or contact lenses while achieving excellent visual acuity through refractive vision correction. To achieve our goal, we continually seek to attract, develop and retain talented people. We strive to make STAAR a diverse, inclusive, safe workplace, with opportunities for employees to grow and develop their careers. We offer competitive compensation and benefits.
As of December 27, 2024, we had approximately 1,211 employees, of which 404 were employed outside the U.S. Of the 1,211 employees, 1,157 were regular full-time, and 54 were temporary. In fiscal year 2024, we added approximately 262 employees (including 54 temporary employees). Our global overall turnover rate in fiscal year 2024 was approximately 7.6% (excluding temporary employees), below the overall turnover rate of approximately 18.9% in the medical device industry. Management periodically provides human capital management updates and data to our Board of Directors.
The health and safety of our employees is a top priority. We created and we follow various safety policies and procedures, and we offer health insurance and wellness programs. We invest in our employees by offering numerous training opportunities, such as to teach new skills, provide career development opportunities and communicate expectations regarding business conduct and ethics. In addition to salaries, we provide additional compensation and benefits programs (which vary by country) such as cash bonuses, stock awards, a 401(k) plan, health insurance benefits, health savings and flexible spending accounts, paid time off, family leave, and employee assistance programs, among others.
Additional Information
We make available free of charge through our website, www.staar.com, our Annual Report on Form 10-K, Quarterly Reports on Form 10-Q, Current Reports on Form 8-K and amendments to any reports filed or furnished pursuant to Section 13(a) of the Securities Exchange Act of 1934, as soon as reasonably practicable, after those reports are filed with or furnished to the Securities and Exchange Commission (SEC).
The SEC maintains an Internet site that contains reports, proxy and information statements, and other information regarding STAAR and other issuers that file electronically with the SEC at http://www.sec.gov.
Glossary
The following glossary is intended to help the reader understand some of the terms used in this Annual Report.
acrylic – a broadly used family of plastics. Acrylic materials used in IOLs have been both water repelling (hydrophobic) and water-absorbing (hydrophilic).
aspheric – aspheric lenses are lenses that are designed in a shape that creates a more clearly focused image than traditional spheric lenses. By reducing spherical aberrations, IOLs that feature aspheric optics generally deliver better night vision and contrast sensitivity than spheric IOLs.
collagen copolymer - compounds formed by joining molecules of collagen derived from biological sources with synthetic monomer molecules. STAAR’s proprietary Collamer material is a collagen copolymer engineered specifically for use in implantable lenses.
contrast sensitivity - the ability to visually distinguish an object from its background.
crystalline lens – the natural lens that is present in the eye at birth, which is a clear structure, located behind the iris that changes shape to focus light onto the retina.
excimer laser – a specialized ultraviolet laser used in ophthalmology to cut or shape eye tissue. The excimer laser is used during LASIK and PRK surgery.
foldable IOL – an intraocular lens made of flexible material, which can be inserted with an injector system through a small incision in minimally invasive eye surgery.
hyperopia – the refractive disorder commonly known as farsightedness, which occurs when the eye’s lens focuses images behind the plane of the retina rather than on the retinal surface. An adult with moderate to high hyperopia cannot see close objects without eyeglasses or contact lenses. Because presbyopia often results in the need for reading glasses, it is sometimes confused with farsightedness.
intraocular – within the eye.
injector or injector system – a device in the form of a syringe that is used to deliver a foldable IOL into the eye through a slender nozzle in minimally invasive eye surgery.
iridotomy – a small hole created in the iris, usually made with a YAG laser. Prior to implantation of some ICL models a YAG peripheral iridotomy is made in an unobtrusive area at the periphery of the iris to ensure continued fluid flow in the eye after implantation. The ICL with CentraFLOW technology, marketed with the brand names EVO and EVO+, have a central port for fluid flow, which eliminates the need for an iridotomy or iridectomy.
LASIK – an acronym for laser-assisted in-situ keratomileusis, a surgical operation that reshapes the cornea to correct nearsightedness, farsightedness, or astigmatism. LASIK involves first the cutting of a hinged flap to separate the surface layer of the cornea, using a microkeratome (a special blade) or a laser. An excimer laser is then used to ablate tissue and reshape the inner cornea, after which the flap is returned to position.
myopia – the refractive disorder also known as nearsightedness, which occurs when the eye’s lens focuses images in front of the retina rather than on the retinal surface. A person with myopia cannot clearly see distant objects without eyeglasses or contact lenses.
ophthalmologist – a surgeon who specializes in the diseases and disorders of the eye and the related visual pathway.
ophthalmic – of or related to the eye.
optic – the central part of an IOL or ICL, the part that functions as a lens and focuses images on the retina.
PRK – an acronym for photorefractive keratectomy, the first type of laser surgical operation to correct nearsightedness, farsightedness, or astigmatism.
preloaded injector - an IOL packaged and shipped in a pre-sterilized, disposable injector. This differs from the conventional method of packaging IOLs, which requires the surgeon or an assistant to manually load each lens into an injector before surgery.
presbyopia – an age-related condition in which the crystalline lens loses its ability to focus on both near and far objects. People who have had normal vision will typically begin to need eyeglasses for reading or other close tasks at some point after age 40 due to presbyopia.
QSR - the U.S. FDA’s Quality System Regulation, or current Good Manufacturing Practice (cGMP) regulation, includes requirements related to the methods used in, and the facilities and controls used for, designing, manufacturing, packaging, labeling, storing, installing, and servicing of medical devices intended for human use. The regulation sets
forth the framework for medical device manufacturers to follow in achieving quality requirements, including requirements related to complaint handling and control of purchased or supplied services, components, and materials bearing on the quality of medical devices.
RLE – refractive lens exchange, a refractive surgical procedure in which the natural crystalline lens is removed and replaced with an IOL (essentially the same as cataract surgery but performed primarily to address refractive issues not to remove a cataract).
refractive market – as used in this report “refractive market” means the overall market volume for refractive surgical procedures of all kinds, including LASIK, PRK, RLE, the ICL product family and other phakic IOLs. As used in this Annual Report, the term does not include sales of non-surgical products like eyeglasses and contact lenses.
silicone – a type of plastic often used in implantable devices that is inert, generally flexible and water-repelling.
spheric lenses – a spheric lens has surfaces that are shaped like sections of a sphere.
toric – refers to the shape of a lens designed to correct astigmatism, which has greater refractive power in some sections of the lens than others.
YAG – an acronym for yttrium-aluminum-garnet, a mineral crystal. Lasers using neodymium-doped yttrium aluminum garnet crystals (Nd:YAG) generate a high-energy beam that can be used in a number of ophthalmic procedures, including creating iridotomies before implantation of some models of the ICL.
ITEM 1A. Risk Factors
Investment in our securities involves a high degree of risk. Investors should carefully consider the following risk factors, in addition to other information contained in this Annual Report and other filings that we make from time to time with the SEC, before making a decision to invest in our common stock. Any of the following risks, as well as other risks that we cannot foresee at this time or that we currently view to be immaterial, could materially and adversely affect our business, financial condition, results of operations or cash flows. The trading price of our common stock could decline due to any of these risks, and investors may lose all or part of their investment. This Annual Report contains forward-looking statements that involve risks and uncertainties. Actual results could differ materially from those anticipated or implied in these forward-looking statements because of factors beyond our control, including the risks faced by us described below. Moreover, except where the risk factors below specifically describe factors, events, or contingencies as having occurred, these risk factors are not representations of whether the factors, events, or contingencies mentioned have or have not occurred. Instead, they reflect our beliefs and opinions as to the factors, events, or contingencies that could adversely affect us in the future.
Risks Related to Our Business
We reported a decrease in revenue and a net loss in fiscal 2024, and we may not be able to return to our growth and profitability trajectory.
For the fiscal year ended December 27, 2024, we reported $313.9 million of net sales, a decrease of 3% compared to $322.4 million in fiscal 2023, and we incurred a net loss of $20.2 million compared to net income of $21.3 million in fiscal 2023. Prior to fiscal 2024, we had reported over ten years of annual net sales growth, and we had delivered net income profitability since 2018. Our results in fiscal 2024 were negatively impacted by a significant decline in ICL sales in China in the fourth quarter ended December 27, 2024. We believe the sluggish economy and weak consumer consumption that contributed to fluctuating demand for ICL procedures in China in fiscal 2024 will continue in fiscal 2025, and we cannot predict when the macroeconomic conditions will improve in China or whether the demand for ICL procedures in China will return to historical levels in the foreseeable future. While we intend to return to sales growth and profitability in the future, there can be no guarantee that we will achieve our growth and profitability plans. Further, our growth and profitability are challenged by the competitive nature of our industry and the other risks to our business detailed herein.
Our reliance on independent distributors in international markets exposes us to commercial and other risks.
Outside the U.S., except for our direct commercial operations in Japan, Germany, Spain, Canada, the U.K. and Singapore, we sell our products through independent distributors who generally control the importation and marketing of our products within their territories. We generally grant exclusive rights to these distributors and rely on them to understand local market conditions, to diligently sell our products, and to comply with local laws and regulations. Our agreements with distributors and local laws can make it difficult for us to quickly change from a distributor who we
feel is underperforming. When we do terminate an independent distributor, which occurs from time to time, we may lose customers who have been dealing with that distributor and may be required to compensate the distributor for termination. Because these distributors are independent, it may be difficult for us to detect failures in our distributors’ performance or compliance. Actions by independent distributors could result in declining sales in that territory, harm to the reputation of our company or our products, or legal liability. For example, if our China distributors, which accounted for approximately 51% of our fiscal 2024 consolidated net sales, ceased to serve as our distributors, or significantly underperformed our expectations, we may experience a substantial reduction in sales.
In addition, our distributors buy products from us in bulk shipments in advance of anticipated demand, which they use to satisfy orders from hospital customers based on scheduled surgeries. The timing of these bulk purchases can create volatility in our revenue and profitability. Further, if orders from hospital customers fall short of anticipated demand, our distributors may have elevated inventories, which could cause them to reduce their future purchases from us until surgical volumes improve. If orders from hospital customers exceed anticipated demand, our distributors may not have sufficient inventory and may be unable to satisfy orders from hospital customers for surgical procedures, which could lead to lost sales opportunities.
A slowdown or disruption to the Chinese economy or worsening trade relations between the U.S. and China could materially impact our business and results of operations.
China accounted for approximately 51% of our fiscal 2024 consolidated net sales. After a robust start to fiscal 2024, China experienced slowing growth in 2024, which some analysts believe may continue into 2025. The sluggish economy and weak consumer consumption in China negatively impacted the Company’s financial results for fiscal 2024. A significant or prolonged slowdown in the Chinese economy could materially impact our business and results of operations in the future. In addition, if social or political unrest were to disrupt business in China, or if other events in China significantly reduced or disrupted business activities in China, that may materially and adversely harm our business.
Further, changes in trade restrictions or new or increased tariffs or quotas, embargoes, sanctions, countersanctions, customs restrictions, or other interventions or geopolitical conflicts resulting from deteriorating relations between China and the U.S. would adversely impact our sales and operations in the region. As an example, on February 1, 2025, the U.S. government announced a 10% tariffs on product imports from certain countries, including China. In response, China announced that they would impose counter tariffs of 10% to 15% on select goods imported from the U.S. If maintained, the newly announced tariffs and the potential escalation of trade disputes could pose a significant risk to our business and would affect our sales in China. See the risk factor below captioned “Because our business is global, our sales and profits may fluctuate or decline in response to changes in foreign currency exchange rates and/or other international risks, including tariffs” for a further discussion of the risks from changes to the trade policies and tariffs between the U.S. and China.
Unfavorable economic conditions or negative publicity concerning complications of laser eye surgery, or medical devices in general, could hurt sales of our refractive products.
For the year ended December 27, 2024, approximately 100% of our revenue was generated from sales of ICL lenses used in refractive procedures. Refractive surgery is an elective procedure generally not covered by health insurance. Patients must pay for the procedure, frequently through installment financing arrangements with third parties. They can defer the choice to have refractive surgery if they lack the disposable income to pay for it or do not feel their income is secure. Economic stagnation, lack of consumer confidence or a recession in any of our larger markets could slow ICL sales growth or, if severe, cause declines in sales, which could materially harm our business.
We believe that negative publicity in the past regarding the potential complications of refractive surgery and potential patient dissatisfaction, in particular because of LASIK and other corneal laser-based procedures, decreased patient interest in LASIK as well as all other refractive procedures. Depending on the nature and severity of any future negative publicity about refractive surgery, the growth of ICL sales could be limited or could decline due to decreased patient interest in all refractive surgery, including our ICL.
Disruptions in our supply chain or failure to adequately forecast product demand could result in significant delays or lost sales.
The loss of a material supplier could significantly disrupt our business. In some cases, we obtain components used in certain of our products from single sources. If we experience difficulties acquiring sufficient quantities of required materials or products from our existing suppliers, or if our suppliers are found to be non-compliant with the U.S. FDA’s QSR, other applicable laws, or STAAR’s requirements, then qualifying and obtaining the required
regulatory approvals to use alternative suppliers may be a lengthy and uncertain process during which production could be delayed and we could lose sales.
Our sources of supply for raw materials may be threatened by shortages and other market forces, by natural disasters, climate impacts, or public health crises or other disruptive events, or by the supplier’s failure to maintain adequate quality or a recall initiated by the supplier. Even when substitute suppliers are available, the need to verify the substitute supplier’s regulatory compliance and the quality standards of the replacement material could significantly delay production and materially reduce our sales. In particular, we manufacture the proprietary collagen-containing raw material used in our ICLs. If the supply of these collagen-containing raw materials is disrupted, it could result in our inability to manufacture our ICL products and would have a material adverse effect on STAAR.
While our net sales decreased in fiscal 2024 compared to fiscal 2023, we intend to return to sales growth, and we will be dependent on our suppliers to help support such growth. Any failure by us to forecast demand for or to maintain an adequate supply of, raw material and finished product could result in an interruption in the supply of certain products, which could impact sales of that product. If our suppliers or we are unable or our suppliers are unwilling to meet our increased manufacturing requirements, we may not be able to produce enough materials or products in a timely manner, which could impact our sales.
Because our business is global, our sales and profits may fluctuate or decline in response to changes in foreign currency exchange rates and/or other international risks, including tariffs.
Activities outside the U.S. accounted for approximately 94% of our total sales during 2024. Foreign currency fluctuations could result in volatility of our revenue. The results of operations and the financial position of our Japanese subsidiary are reported in Japanese yen and then translated into U.S. dollars at the applicable exchange rates for inclusion in our consolidated financial statements, exposing us to translation risk. In addition, we are exposed to transaction risk because we incur some of our sales and expenses in currencies other than the U.S. dollar. Our most significant currency exposures are to the Japanese yen, the euro, and the Swiss franc, and the exchange rates between these currencies and the U.S. dollar may fluctuate substantially. We do not actively hedge our exposure to currency rate fluctuations. Any strengthening of the U.S. dollar would likely negatively impact our results. We price some of our products in U.S. dollars, and thus changes in exchange rates can make our products more expensive in some offshore markets and reduce our sales. Inflation could also make our products more expensive and increase the credit risks to which we are exposed. Future foreign currency fluctuations could favorably or unfavorably impact and increase the volatility of our revenue, profitability, and stock price.
Economic, social, and political conditions, laws, practices, and local customs vary widely among the countries in which we sell our products. Our operations outside of the U.S. face a number of risks and potential costs, including, enjoying less stringent protection of intellectual property, and facing economic, political, and social uncertainty in some countries, especially in emerging markets. For example, sales in certain Asian and developing markets may result in lower margins and higher exposure to intellectual property infringement or counterfeits. Given the size of the Company’s business in China relative to its net sales in the rest of the world, macroeconomic conditions in China have a significant impact on the Company’s business, operations, and financial results. Our results in fiscal 2024 were negatively impacted by a significant decline in ICL sales in China in the fourth quarter ended December 27, 2024, where the sluggish economy and weak consumer consumption contributed to fluctuating demand for ICL procedures. If China experiences a significant or prolonged slowdown or disruption to its economy, or social or political unrest, we may experience a significant reduction in sales in the future.
Further, trade disputes or tensions between the United States and its significant trading partners may adversely affect our sales, including as a result of the imposition of tariffs or other barriers or restrictions on trade, or increase our costs. The institution of trade tariffs both globally and between the U.S. and China specifically could negatively impact the overall economic condition in our markets, including China, which could have a negative effect on our sales. As an example, on February 1, 2025, the U.S. government announced a 25% tariff on product imports from certain countries, including Mexico and Canada, and 10% tariffs on product imports from certain countries, including China. In response, China announced that they would impose counter tariffs of 10% to 15% on select goods imported from the U.S. If maintained, the newly announced tariffs and the potential escalation of trade disputes could pose a significant risk to our business and would affect our revenue and cost of goods sold. The extent, focus and duration of any such tariffs and the resulting impact on general economic conditions and on our business are uncertain and depend on various factors, such as negotiations between the U.S. and affected countries, the responses of other countries or regions, exemptions or exclusions that may be granted, availability and cost of alternative sources of supply, and demand for our products in affected markets. Further, actions we take to adapt to new tariffs or trade restrictions may cause us to modify our operations or forgo business opportunities.
In addition, new laws or regulations in China or elsewhere applicable to foreign medical device companies could negatively impact our business. Also, we are exposed to credit and collectability risk on our trade receivables with customers in certain international markets. There can be no assurance we can effectively limit our credit risk and avoid losses and our ability to transfer foreign earnings to the U.S. may be subject to taxes or restricted or result in incurring substantial costs. Our continued success as a global company depends, in part, on our ability to develop and implement policies and strategies that are effective in anticipating and managing these and other risks in the countries where we do business. These and other risks may have a material adverse effect on our operations in any particular country and on our business, financial condition and results of operations as a whole.
Changes in our effective tax rate or additional tax liabilities could adversely impact our net income.
We are subject to income taxes as well as non-income-based taxes in Switzerland, the U.S. and various other jurisdictions in which we operate. The laws and regulations in these jurisdictions are inherently complex and we will be obliged to make judgments and interpretations about the application of these laws and regulations to us, including our subsidiaries and our operations and businesses. Those laws and regulations include those related to any restructuring of intercompany operations, holdings or financings, the valuation of intercompany services; cross-border payments between affiliated companies; and the related effects on income tax, VAT and transfer tax. Further, our tax liabilities could be adversely affected by numerous other factors, including income before taxes being lower than anticipated in countries with lower statutory tax rates and higher than anticipated in countries with higher statutory tax rates, changes in the valuation of deferred income tax assets and liabilities, and changes in tax laws and regulations. Although we believe our tax estimates are reasonable, any changes in our judgments and interpretation of tax laws or any material differences as a result of any audits could result in unfavorable tax adjustments that may have an adverse effect on our overall tax liability.
Changes in tax laws could result in additional tax liabilities.
Changes in tax laws can and do occur. For example, in 2017, the U.S. government enacted the Tax Cuts and Jobs Act, which is complex and continues to be further clarified with supplemental guidance. Changes to tax laws may require us to make significant judgment in determining the appropriate provision and related accruals for these taxes. Thus, as a result, such changes could result in substantially higher taxes and a significant adverse effect on our results of operations, financial conditions and liquidity. In addition, the Organization for Economic Co-operation and Development (OECD), has published proposals covering a number of issues, including country-by-country reporting, permanent establishment rules, transfer pricing rules, tax treaties and taxation of the digital economy. On October 8, 2021, the OECD/G20 inclusive framework on Base Erosion and Profit Shifting (the Inclusive Framework) published a statement updating and finalizing the key components of a two-pillar plan on global tax reform originally agreed on July 1, 2021, and a timetable for implementation by 2023. The timetable for implementation has since been extended to 2024 and, with respect to certain components of the plan, to 2025. Under pillar one, a portion of the residual profits of multinational businesses with global turnover above €20 billion and a profit margin above 10% will be allocated to market jurisdictions where such allocated profits would be taxed. Under pillar two, the Inclusive Framework has agreed on a global minimum corporate tax rate of 15% for companies with revenue above €750 million, calculated on a jurisdictional basis. On February 1, 2023, the U.S. Financial Accounting Standards Board indicated that they believe the minimum tax imposed under pillar two is an alternative minimum tax, and, accordingly, deferred tax assets and liabilities associated with the minimum tax would not be recognized or adjusted for the estimated future effects of the minimum tax but would be recognized in the period incurred. The detail of the proposals is subject to change and the impact to us will need to be determined by reference to the final rules.
We are vulnerable to any loss of use of our principal manufacturing facility.
We currently manufacture all of our ICL products at a single facility in Monrovia, California. If our manufacturing facility suffered a disruption, shutdown or catastrophic loss due to fire, flood, earthquake, terrorism or other natural or man-made disasters, including manufacturing challenges such as equipment or IT failure, it could have a material adverse effect on our operations. Our manufacturing facility has been, and may in the future be, adversely impacted by weather and fire events, and it is located in a region where earthquakes could cause catastrophic loss. Developing additional manufacturing sites may require significant expense for personnel and equipment and a long period to obtain regulatory approvals. We are in the process of expanding our manufacturing capabilities for STAAR’s ICL products in our Nidau, Switzerland facility. This is a complex process that is subject to numerous risks and uncertainties, and there can be no guarantee that this facility will be prepared and approved by regulators for manufacturing.
In our major markets, regulatory approval to manufacture materials and sell our products is generally limited to the current manufacturing site, and changing the site requires applications to and approval from regulatory bodies
prior to commercialization. To satisfy our own quality standards as well as regulations, we must follow strict protocols to confirm that products and materials made at a new site are equivalent to those made at the currently approved site. Even minor changes in equipment, supplies or processes require validation. Unanticipated delays with a transferred process or difficulties in manufacturing a transferred material could interrupt our supply of products. Any sustained interruption in supply could cause us to lose market share and harm our business, financial condition and results of operations.
If any or a portion of our facilities were to experience a catastrophic loss, or if one of our facilities is found not to be in compliance with regulatory requirements, it could disrupt our operations, delay production and shipments, delay or reduce sales and revenue and result in large expenses to repair or replace the facility, as well as lost customers or sales. Our insurance for property damage and business interruption may not cover any particular loss, or, if covered, be sufficient. We do not carry insurance or reserve funds for interruptions or potential losses arising from earthquakes or terrorism.
Public health crises, political crises, and other catastrophic events or other events outside of our control may impact our business.
In 2024, we generated approximately 94% of our total sales outside the U.S. A natural disaster (such as a climate-related event or otherwise), public health crisis (such as a pandemic or epidemic), political crisis (such as terrorism, war, political instability or other conflict), or other events outside of our control that may occur anywhere around the world, may adversely impact our business and operating results. Moreover, these types of events could negatively impact surgeon or patient spending in the impacted region(s) or depending upon the severity, globally, which could adversely impact our operating results.
The extent to which a pandemic, public health or political crisis in the future impacts our business, operations, and financial results, including the duration and magnitude of such effects, will depend on numerous evolving factors that are uncertain and cannot be predicted, including the following: the duration and scope of the pandemic, public health or political crisis; the impact it has on global and regional economies and economic activity, including the duration and magnitude of its impact on consumer spending; how quickly and to what extent more customary economic and operating conditions can resume; its impact on our customers’ facilities; levels of consumer confidence; whether our preventative measures such as remote working arrangements, changes to manufacturing work areas, such as adherence to social distancing guidelines, and other workforce changes will impact operational efficiency or inventory levels; our ability to obtain supplies from vendors or transport products to customers; or adverse impacts to any other element of our supply chain; the impact on regulatory agencies, including the review and approval process; the impact on clinical studies; the ability of our customers to successfully navigate the impacts of the pandemic, public health or political crisis, such as resuming activities and growing patient interest in our lenses; and actions governments, businesses and individuals take in response to the pandemic, public health or political crisis.
In addition, a prolonged pandemic, public health or political crisis could adversely impact our ability to recruit and/or retain employees and the continued service and availability of skilled personnel necessary to run our complex production operations, as well as members of our management team, third-party suppliers, distributors and vendors. To the extent our management or other personnel are impacted in significant numbers and are not available to perform their job duties (for example, for health and safety reasons), we could experience delays in, or the suspension of, our manufacturing operations, research and product development activities, regulatory work streams, and other important commercial and operational functions.
The loss of key employees, or our inability to recruit, hire and retain skilled and experienced personnel, could negatively impact our ability to effectively manage and expand our business.
Our success depends on the skills, experience and performance of our senior management and other key employees. The loss or incapacity of existing members of our executive management team could negatively impact our operations, particularly if we experience difficulties in hiring qualified successors. Further, it could be particularly detrimental if any key employee or employees went to work for a competitor. Also, our future success depends on our ability to identify, attract, train, motivate and retain other highly skilled personnel. Failure to do so may adversely affect our results. We do not maintain insurance policies to cover the cost of replacing the services of any of our key employees who may unexpectedly die or become disabled.
We compete with much larger companies and low-cost Asian manufacturers.
We believe our primary competition in selling the ICL to patients seeking surgery to correct refractive conditions lies not in similar products to the ICL, but in laser surgical procedures. Alcon (formerly a part of Novartis), Johnson
& Johnson (formerly Advanced Medical Optics or AMO), Bausch Health Companies (formerly Valeant, Bausch & Lomb or B+L), and Carl Zeiss Meditec AG, all market lasers for corneal refractive surgery and promote their sales worldwide. Each of these companies has much greater financial, technical, marketing and distribution resources and brand name recognition than we do, and some of them have large international markets for a full suite of ophthalmic products. Their greater resources for research, development and marketing, and their greater capacity to offer comprehensive products and equipment to providers, makes for intense competition. We also face competition from other phakic implantable lenses, including lenses made by Biotech Vision Care, Care Group, Eyebright, and Ophtec. Increasingly, competitors from Asia are beginning to appear in some markets with their low-cost version of an implantable contact lens, which competes with our ICL. With our commercial success with the ICL, additional companies may seek to enter the refractive phakic intraocular lens market.
We could experience losses due to product liability claims.
We have been subject to product liability claims in the past and may experience such claims in the future. Product liability claims against us may not be covered, may exceed the coverage limits of our insurance policies or cause us to record a loss in excess of our deductible. A product liability claim that exceeds our insurance coverage could materially harm our business, financial condition, and results of operations. Even if an insurance policy covers a product liability loss, we must generally pay for losses until they reach the level of the policy’s stated deductible or retention amount after which the insurer begins paying. The payment of retentions or deductibles for a significant number of claims could have a material adverse effect on our business, financial condition, and results of operations.
Any product liability claim would divert managerial and financial resources and could harm our reputation with customers. We cannot assure investors that we will not have product liability claims in the future or that such claims would not have a material adverse effect on our business.
Our defined benefit pension plans are currently underfunded and we may be subject to significant increases in pension benefit obligations under those pension plans.
We sponsor two defined benefit pension plans through our wholly owned Swiss and Japanese subsidiaries, which we refer to as the “Swiss Plan” and the “Japan Plan”, respectively. Both plans are underfunded and may require significant cash payments. We determine our pension benefit obligations and funding status using many assumptions. If the investment performance does not meet our expectations, or if other actuarial assumptions are modified, or not realized, we may be required to contribute more than we currently expect and increase our future pension benefit obligations to be funded from our operations. Our pension plans taken together are underfunded by approximately $6.7 million ($0.4 million for the Japan Plan and $6.3 million for the Swiss Plan) as of December 27, 2024. If our cash flow from operations is insufficient to fund our worldwide pension obligations, as well as other cash requirements, we may have to seek additional capital.
Our activities involve hazardous materials, emissions, and use of an irradiator and may subject us to environmental liability.
Our manufacturing, research and development activities involve the use of hazardous materials and equipment and use of an irradiator. Federal, state and local laws and regulations govern the use, manufacturing, storage, handling and disposal of these materials and certain waste products in the places where we have operations. We cannot eliminate the risk of accidental contamination or injury from these materials and equipment. Remedial environmental actions could require us to incur substantial unexpected costs, which could materially and adversely affect our financial condition and results of operations. If we were involved in an environmental accident or found to be in substantial non-compliance with applicable environmental laws, it could harm our reputation, and we could be held liable for damages or penalized with fines.
Data corruption, cyber-based attacks or network security breaches and/or noncompliance with data protection and privacy regulations could negatively impact our operations.
We depend on information technology networks and our information technology infrastructure for electronic communications among our locations around the world and between our personnel and our subsidiaries, customers, and suppliers. The integrity and protection of our customer, vendor, supplier, employee, and other Company data that we collect, use and store, including personal information, is an important part of our business. Addressing applicable and evolving security and privacy regulations may increase our operating costs or adversely affect our business operations.
Certain of our employees, contractors and vendors have access to and use personal information in the ordinary course of our business. The secure processing, maintenance and transmission of this information is critical to our
operations. Despite our security measures and business controls, our information technology and infrastructure may be vulnerable to attacks by hackers, breaches due to employee, contractor or vendor error, or malfeasance, systems error (whether as a result of an intentional breach, a natural disaster or human error) or other disruptions or subject to the inadvertent or intentional unauthorized release of information. Any such occurrence could compromise our networks and the information stored thereon could be accessed, publicly disclosed, lost or stolen. Any such access, disclosure or other loss of information could result in legal claims or proceedings, and liability under laws that protect the privacy of personal information and regulatory penalties, disrupt our operations and the supply of products we provide to our clients, compromise our intellectual property or other confidential business information, or damage our reputation, any of which could adversely affect our profitability, revenue and competitive position. Many of our employees currently work remotely, which may make us more vulnerable to cyberattacks. While we have not experienced a material system failure, accident or security breach to date, we cannot assure you that our data protection efforts and our investment in information technology will prevent significant breakdowns, data leakages, breaches in our systems or other cyber incidents that could have a material adverse effect upon our reputation, business, operations or financial condition. We continue to invest in our cybersecurity program to enhance current capabilities and also implement new capabilities in our effort to keep pace with the changing threat landscape. Also, certain of our information technology systems are not redundant, and our disaster recovery planning is not sufficient for every eventuality. Despite any precautions we may take, such events could materially harm our reputation and financial results. Moreover, while we maintain cyber insurance, it may be insufficient to address any potential loss incurred. We also rely on third parties to host or otherwise process some of this data (such as cloud-based computing). Elements of our information technology systems that we outsource to third parties may also be vulnerable to various types of attacks or disruptions. Any failure by a third party to prevent security breaches could have adverse consequences for us.
We are subject to various data protection and privacy regulations in different jurisdictions, including the General Data Protection Regulation (Regulation (EU) 2016/679) (GDPR) and the California Consumer Privacy Act. We have made and continue to engage in compliance efforts to satisfy these and other regulations, however, we may be unsuccessful in complying with applicable requirements, and may be at risk of enforcement actions and/or subject to fines, including those imposed by a data protection authority. As a result, we may incur substantial expense in complying with data protection and privacy regulations, exposure resulting from a data breach, ransomware or non-compliance and may be distracted from other aspects of our business.
The increased use of social media platforms and mobile technologies presents additional risks and challenges.
Social media platforms and mobile technologies are increasingly being used to communicate about our products and the health conditions they are intended to treat. Their use poses risks to our business and requires specific attention and monitoring. For example, patients, surgeons, competitors, or others may use these channels to comment on our products, including the safety or effectiveness of a product and to report an alleged adverse event. Negative posts or comments about us or our business on any social networking web site could harm our reputation. In addition, our employees may use social media tools and mobile technologies inappropriately, which may give rise to liability, or which could lead to the exposure of sensitive information. In either case, such uses of social media and mobile technologies could have a material adverse effect on our business, financial condition, and results of operations.
Acquisitions of technologies, products, and businesses could disrupt our operations, involve increased expenses and present risks not contemplated at the time of the transactions.
We may consider and, as appropriate, make acquisitions of technologies, products, and businesses that we believe are complementary to our business. Acquisitions typically entail many risks and could result in difficulties in integrating the operations, personnel, technologies, and products acquired, and mitigating the risk of unknown liabilities some of which may result in significant payments or charges to earnings.
If we are unable to successfully integrate our acquisitions with our existing business, we may not obtain the advantages that the acquisitions were intended to create, which may materially adversely affect our business, and our ability to develop and introduce new products. Actual costs and sales synergies, if achieved at all, may be lower than we expect and may take longer to achieve than we anticipate. Acquisitions may also divert management’s attention from our core business. Furthermore, the products of companies we acquire may overlap with our products or those of our customers, creating conflicts with existing relationships or with other commitments that are detrimental to the integrated businesses.
If we are not able to manage growth successfully, it could adversely affect our business, financial condition, and results of operations.
While our net sales decreased in fiscal 2024 compared to fiscal 2023, we intend to return to sales growth. Growth can place a significant strain on our financial, operational, and managerial resources. In order to support our growth, we must continue to implement and enhance our managerial, operational and financial systems, expand our operations, and continue to recruit and train qualified personnel. There can be no assurance that our strategic and operational planning will allow us to adequately manage anticipated growth. Factors such as a failure to follow specific internal practices and procedures, equipment malfunction, environmental factors or damage to one or more of our facilities could adversely affect our ability to manufacture our products. For example, in the second half of 2021, as we increased production to meet increased demand, we experienced a decline in product yield. In the event of a slower-than-planned manufacturing output, we may be unable to quickly meet customer demand. In the event of a significant manufacturing challenge, we may experience delays in meeting product demand which could adversely affect our results of operations and financial condition.
In addition, the expense associated with increased manufacturing, sales and marketing to meet increased demand may exceed our expectations. Further, we manufacture our ICLs in the U.S., and inflationary pressures could result in increased costs in our supply chain, which may be difficult to pass along to our customers. Any inability to successfully manage growth could materially and adversely affect our business, financial condition, and results of operation.
Corporate responsibility, specifically related to environmental, social and governance (ESG) matters, may impose additional costs, expose us to reputational and emerging areas of risks, and could negatively affect our business.
In order to comply with global ESG regulations and reporting requirements, we have been investing in our ESG resources and capabilities. Further, some investors, stockholders, customers, suppliers and other third parties have been increasingly focusing on ESG and corporate responsibility practices and reporting. Companies that do not adapt to or comply with the evolving regulations, requirements, expectations and standards, or which are perceived to have not responded appropriately, may suffer from reputational damage and result in the business, financial condition and/or stock price of a company being materially and adversely affected. This may result in a significant increase in additional expenses (e.g., direct or indirect cost of energy, materials, manufacturing, distribution, packaging and other operating costs) to comply with evolving regulations and/or third-party requirements that could adversely impact our business or profitability.
In response to certain stakeholder expectations, we have commenced reporting of our sustainability endeavors and future plans. These disclosures reflect our current aspirations and are not guarantees that we will be able to achieve them. Our efforts to accomplish and accurately report on these plans present numerous risks, any of which could have a material negative impact on us. Our pursuit of certain practices, as well as our ability to achieve any goal, including with respect to ESG-related initiatives, is subject to numerous risks, many of which are outside of our control. Certain shareholders may reduce or eliminate their holdings of our stock based on ESG issues. At the same time, certain stakeholders and regulators have increasingly expressed or pursued opposing views, legislation and investment expectations with respect to sustainability initiatives, including the enactment or proposal of “Anti-ESG” legislation or policies. If our sustainability practices do not meet evolving investor or other stakeholder expectations and standards or if we are unable to satisfy all stakeholders, our reputation, our ability to attract or retain employees, our sales and our attractiveness as an investment or business partner could be negatively impacted. Similarly, our failure or perceived failure to pursue or fulfill certain targets or goals, or to satisfy various reporting standards could also have negative impacts and expose us to government enforcement actions and private litigation.
Finally, we expect to incur additional costs and require additional resources to monitor, report, and comply with our various ESG practices, as well as new and anticipated global regulations focused on ESG. If we fail to adopt ESG standards or practices as quickly as some stakeholders desire, report on our efforts or practices accurately, or satisfy the expectations of our various stakeholders who have varied perspectives on sustainability practices and global regulators, our reputation, business, financial performance and growth may be adversely impacted.
Climate changes and extreme weather conditions could negatively affect our business.
Climate changes and extreme weather conditions could create financial risk to our business. Global physical climate changes, including unseasonable weather conditions and earthquakes, could disrupt our operations by impacting the availability and cost of water, energy, or materials within our supply chain, and could also increase insurance and other operating costs. This could in turn put pressure on our manufacturing costs and result in reduced profit margins associated with certain of our products. In the U.S., we have several offices and facilities located in
Southern California, which has experienced weather events and fires and is a region where earthquakes could cause catastrophic loss. Climate changes and extreme weather conditions could impact our facilities and employees in Southern California and around the world. Climate-related transitional risks, such as changing regulations, could also increase our costs and adversely impact our operations or financial performance.
Risks Related to the Ophthalmic Products Industry
Unless we keep pace with advances in our industry and persuade physicians to adopt our new products, our sales will not grow and may decline.
Our future growth depends, in part, on our ability to timely develop products to treat diseases and disorders of the eye that are more effective, safer, or incorporate emerging technologies better than our competitors’ products, and are accepted by physicians and patients. Sales of our existing products may decline rapidly if one of our competitors introduces a superior product, or if we announce a new product of our own. If we focus on research and development or technologies that do not lead to better products, more effective or advanced products could surpass our current and planned products. In addition, such product development efforts could require a significant investment of resources. If we are able to develop new products, we must manufacture these products economically and market them successfully by demonstrating to enough eye-care professionals the overall benefits of using them. If we do not timely develop new products that meet market demand or if there is insufficient demand for our new products, our sales and results of operations could be harmed. For example, it is uncertain whether physicians in countries that recognize the CE Mark will adopt the EVO Viva lens for use in presbyopic eyes, which our Notified Body approved for marketing and sale in July 2020.
Resources devoted to research and development may not yield new ophthalmic products that achieve regulatory approval or commercial success.
Development of new implantable technology, from discovery through testing and registration to initial product launch, is expensive and time-consuming. Because of the complexities and uncertainties of ophthalmic research and development, products we are developing, including those currently in development, may not complete the development process or obtain the regulatory approvals required for us to successfully market the products. Our new products, including those currently under development, may fail to become commercially successful.
We may be required to conduct extensive clinical trials to demonstrate safety and effectiveness of new or enhanced ophthalmic products, such clinical trials are expensive, complex, can take years to complete, and have highly uncertain outcomes.
In order to further advance the development of, and ultimately receive regulatory approval to manufacture and sell, our new ophthalmic products or product enhancements, we may be required to conduct extensive clinical trials to demonstrate their safety and effectiveness to the satisfaction of the U.S. FDA or regulatory authorities in other countries. Clinical trials are expensive, complex, can take many years to complete, and have highly uncertain outcomes. Delays, setbacks, or failures can occur at any time, or in any phase of the clinical trials, and can result from concerns about safety, a lack of demonstrated effectiveness, or poor study or trial design. The commencement and completion of clinical trials may be delayed or prevented by many factors, including, but not limited to:
•an inability to reach agreement with regulatory authorities regarding the scope or extent of a proposed clinical trial;
•an inability to timely identify and reach agreement on acceptable terms with prospective clinical trial sites and entities involved in the conduct of our clinical trials;
•failure by third-party clinical trial managers to comply with applicable regulations or protocols;
•flaws in the design of the clinical trials;
•slower than expected rates of patient recruitment and enrollment;
•periodic amendments to clinical trial protocols to address certain variables which arise during the course of a trial;
•lack of effectiveness of our products; or
•unforeseen safety issues.
Complying with government regulation substantially increases the cost of developing, manufacturing and selling our ophthalmic products.
Competing in the ophthalmic products industry requires us to introduce new or improved products and processes continuously, and to submit these to the U.S. FDA and other regulatory bodies for clearance or approval. Obtaining clearance or approval can be a long and expensive process, and clearance or approval is never certain. For example, the U.S. FDA or another country’s regulatory agency, could require us to conduct an additional clinical trial prior to granting clearance or approval of a product and such clinical trial could take a long time and have substantial expense. Furthermore, there is no assurance that clearance or approval will be granted.
If a regulatory authority delays or does not grant approval of a potentially significant product, the potential sales of the product and its value to us can be substantially reduced. Even if the U.S. FDA or another regulatory agency clears or approves a product, the clearance or approval may limit the indicated patient populations or uses of the product, or may otherwise limit our ability to promote, sell and distribute the product, or may require expensive post-marketing studies or surveillance. If we cannot obtain timely regulatory clearance or approval of our new products, or if the clearance or approval is too narrow, we will not be able to successfully market these products, which would eliminate or reduce our potential sales and earnings.
In addition, the U.S. FDA and other regulatory authorities may change their clearance and approval policies, adopt additional regulations, or revise existing regulations, or take other actions which may prevent or delay approval or clearance of our products under development, cause the loss of previously received approvals or clearances or impact our ability to modify our currently cleared products on a timely basis. Also, we expect to incur additional costs complying with the European Union’s new Medical Device Regulation.
We depend on proprietary technology, but our intellectual property protections may be limited.
While we rely on various intellectual property laws, contractual provisions and confidentiality procedures and copyright laws to protect the proprietary aspects of our technology, we rely more on trade secrets and know-how, which may not prevent third parties from using publicly available information to access our technology. The ophthalmic industry is competitive, and new products and technologies are regularly being brought to market. With respect to our patents, any of them may be challenged, invalidated, circumvented or rendered unenforceable. Any of our pending patent applications may fail to result in an issued patent or fail to provide meaningful protection against competitors or competitive technology. Litigation may be necessary to enforce our intellectual property rights, and to protect or determine the validity and scope of our proprietary rights. We also challenge others’ patents or patent applications from time to time. Any litigation could result in substantial expense, may reduce our profits, and may not adequately protect our intellectual property rights. In addition, we may be exposed to future litigation by third parties based on claims that our products infringe their intellectual property rights. This risk is exacerbated by the fact that the validity and breadth of claims covered by patents in our industry may involve complex legal issues that are open to dispute. Any litigation or claims against or instituted by us, whether or not successful, could result in substantial costs, divert resources and the efforts of our personnel away from daily operations, harm our reputation, result in the impairment of our intellectual property rights, limit our ability to pursue future products and/or otherwise materially adversely impact our business.
We may not successfully replace our existing products, including those that lose or have lost patent protection.
As our existing patents expire, many of which already expired over the past several years, our competitors may introduce products using the same technology. Because of this possible increase in competition, we may lose sales and/or may need to reduce our prices to maintain sales of our products, which would make them less profitable. If we fail to develop and successfully launch new products and/or obtain new patents, our sales and profits with respect to our products could decline significantly. We may not be able to develop and successfully launch more advanced replacement products.
While we will continue developing intellectual property protections for our future products, third parties may pursue blocking patents that limit our ability to manufacture such products.
We plan to continue relying on our intellectual property rights to protect products and technology that we may develop or employ in the future, but third parties may develop and obtain patents covering such products or technology. In such event, we may need to obtain licenses for such patents. However, we may not be able to obtain licenses on reasonable terms, if at all, which could limit our ability to manufacture our future products and operate our business.
Risks Related to Regulatory and Compliance
We are subject to extensive government regulation worldwide, which increases our costs and could prevent us from selling our products.
We are regulated by regional, national, state and local agencies in the U.S. as well as governmental authorities in those countries in which we manufacture or distribute products. These regulations may govern the research, development, manufacturing, and commercial activities relating to medical devices, including their design, pre-clinical and clinical testing, clearance or approval, production, labeling, sale, distribution, import, export, post-market surveillance, advertising, dissemination of information and promotion. Failure to receive necessary approvals in international jurisdictions on a timely basis, or at all, could harm our business and operating results. In addition, regulations and requirements for approvals vary by country, which can significantly increase the costs to sell our products in these international jurisdictions. Any failure to comply with applicable legal and regulatory obligations could result in fines and penalties, restrictions on certain business activities, and other remedial measures, which if significant, could disrupt of our operations, distract management, and harm our business.
Regulatory issues may adversely impact our operations.
If we cannot maintain compliance with a particular jurisdiction’s regulatory requirements, it could adversely impact our financial performance and have a material adverse effect on our ongoing business and operations. We plan to remain in compliance with regulatory requirements established by applicable global regulatory agencies, however, there can be no guaranty that we will do so. We expect to continue to devote resources and attention to our quality systems and compliance and other regulatory requirements as part of the ordinary course of business. We cannot ensure that our efforts will be successful and failure to achieve or maintain compliance may materially and adversely impact our business and operations.
Laws pertaining to healthcare fraud and abuse could materially adversely affect our business, financial condition, and results of operations.
Our relationships with physicians, and other healthcare providers are subject to scrutiny under various U.S. and international bribery, fraud and abuse, anti-kickback, false claims, privacy, and similar laws, collectively referred to as “healthcare compliance laws.” Healthcare compliance laws are broad, sometimes ambiguous, complex, and subject to change and changing interpretations, which could restrict our sales or marketing practices. Possible sanctions for violation of these healthcare compliance laws include fines, civil and criminal penalties, exclusion from government healthcare programs, and despite our compliance efforts, we face the risk of an enforcement activity or a finding of a violation of these laws. For example, in 2022 a Japanese trade association (Japan Fair Trade Council of the Medical Devices Industry) ruled that our subsidiary in Japan improperly implemented a program with surgeons and hospitals to obtain videos of cataract surgeries where our cataract intraocular lenses were used.
We have entered into a variety of agreements with healthcare professionals. We have also adopted a Code of Business Conduct and Ethics as well as a Compliance Program for Interactions with Healthcare Professionals which govern our relationships with healthcare professionals to bolster our compliance with healthcare compliance laws. While our relationships with healthcare professionals are structured to comply with applicable laws and we provide training on these laws and our Code and Program, it is possible that enforcement authorities may view our relationships as prohibited arrangements that must be restructured or for which we would be subject to other significant civil or criminal penalties or debarment. In any event, any enforcement review of or action against us as a result of such review, regardless of outcome, could be costly and time consuming. Additionally, we cannot predict the impact of any changes in or interpretations of these laws. If our operations are found to be in violation of any of the laws described above or any other governmental regulations that apply to us now or in the future, we may be subject to penalties, including civil and criminal penalties, damages, fines, and disgorgement, any of which could adversely affect our ability to operate our business and our financial results.
If we recall a product, the cost and damage to our reputation could harm our business.
We have voluntarily recalled our products in the past and recalls could take place again. We may also be subject to recalls initiated by manufacturers of products we distribute. We cannot eliminate the risk of a material recall in the future. Recalls can result in lost sales of the recalled products themselves and can result in further lost sales while replacement products are manufactured, especially if the replacements must be redesigned or approved by regulatory authorities prior to distribution. If recalled products have already been implanted, we may bear some or all of the cost of corrective surgery. Recalls may also damage our professional reputation and the reputation of our products. The
inconvenience caused by recalls and related interruptions in supply, the underlying causal issues, and the damage to our reputation, could cause professionals to discontinue using our products.
Companies are required to maintain certain records of actions, even if they determine such actions are not reportable to the U.S. FDA or other regulatory bodies. If we determine that certain actions do not require notification of the FDA or others, the FDA or other regulatory bodies may disagree with our determinations and require us to report those actions as recalls. In addition, the FDA or other regulatory bodies could take enforcement action for failing to report the recalls when they were conducted or failing to timely report or initiate a reportable product action. Moreover, depending on the corrective action we take to redress a product’s deficiencies or defects, the FDA or other regulatory bodies may require, or we may decide, that we will need to obtain new approvals or clearances for the device before we may market or distribute the corrected device. Seeking such approvals or clearances may delay our ability to replace the recalled devices in a timely manner.
Changes in U.S. FDA or international regulations related to product approval, including those that apply retroactively, could make us less competitive and harm our business.
U.S. FDA and foreign regulations depend heavily on administrative interpretation, and we cannot assure investors that future interpretations made by the FDA or other regulatory bodies, with possible retroactive effect, will not adversely affect us. Additionally, any changes, whether in interpretation or substance, in existing regulations or policies, or any future adoption of new regulations or policies by relevant regulatory bodies, could rescind, prevent or delay approval of our products, which could materially impact our competitive position, business, and financial results. Further, we or our distributors have obtained regulatory approvals outside the United States for many of our products. We or our distributors may be unable to maintain regulatory qualifications, clearances or approvals in these countries or obtain qualifications, clearances, or approvals in other countries. If we are not successful in doing so, our business and financial condition will be harmed.
If our products cause or contribute to a death or a serious injury, we may face voluntary corrective actions, agency enforcement actions and harm to our results.
Under the U.S. FDA regulations, we are required to provide the FDA with a Medical Device Report (MDR) for any incident in which our product may have caused or contributed to a death or serious injury or in which our product malfunctioned and, if the malfunction were to recur, would likely cause or contribute to death or serious injury. In addition, all manufacturers placing medical devices in international markets, such as European Union and Asian markets, are legally bound to report any serious or potentially serious incidents involving devices they produce or sell to the relevant authority in the jurisdiction where the incident occurred. Any adverse event involving our products, including those requiring an MDR, could result in future voluntary corrective actions, such as product actions or customer notifications, or agency actions, such as inspection, mandatory recall, or other enforcement action. Any corrective action, whether voluntary or involuntary, as well as defending ourselves in a lawsuit, will require the dedication of our time and capital, distract management from operating our business, and may harm our reputation and financial results.
The decision to file an MDR involves a judgment by us as the manufacturer. We have made decisions that certain types of events are not reportable to the FDA or other regulatory bodies; however, there can be no assurance that the FDA or other regulatory bodies will agree with our decisions. If we fail to report adverse events to the FDA or other regulatory bodies within the required timeframes, or at all, or if the FDA or other regulatory bodies disagree with any of our determinations regarding the reportability of certain events, the FDA or other regulatory bodies could take enforcement actions against us, which could have an adverse impact on our reputation and financial results.
If we modify our products, we may have to obtain new marketing clearances or approvals or may have to cease marketing or recall the modified products until clearances or approvals are obtained.
Our ICL products are Class III devices subject to the PMA approval process in the United States. Any significant modification to a PMA approved device, including modifications to the manufacturing process, labeling or design, requires a PMA Supplement. U.S. FDA guidelines establish different types of PMA Supplements depending on the type of modification, with different data and information requirements and different timelines for FDA review and approval. If we modify our ICL products in a way that requires a PMA Supplement, it could require a lengthy and expensive review process with the FDA. Further, the FDA may not agree with our decisions regarding whether a new approval is necessary, or what type of PMA Supplement may be required. In the past, we have modified some of our 510(k) cleared and PMA approved products and have determined based on our review of the applicable FDA guidance that in certain instances new clearances or approvals were not required. If the FDA were to disagree with our determination and require us to submit new clearances or approvals, we could be required to cease marketing and/or
to recall the modified product until we obtain clearance or approval, and we may be subject to significant regulatory fines or penalties.
Regulatory agencies in other countries similarly require approval or clearance prior to our marketing or selling products in those countries. We rely on our distributors to obtain regulatory clearances or approvals of our products in certain countries outside of the United States. If we or our distributors are unable to obtain additional clearances or approvals needed to market existing products, new products or modified products in the United States or elsewhere or obtain these clearances or approvals in a timely fashion or at all, or if our existing clearances or approvals are revoked or restricted, our revenues and profitability may decline.
Non-compliance with anti-corruption laws could lead to penalties or harm our reputation.
We are subject to anti-corruption laws in the jurisdictions in which we operate, including the U.S. Foreign Corrupt Practices Act (FCPA). Any failure to comply with these laws, even if inadvertent, could result in significant penalties or otherwise harm our reputation, business, financial condition and results of operations. Our reliance on foreign subsidiaries and independent distributors requires vigilance in maintaining our policy against participation in corrupt or non-compliant activity, including, for example, with respect to our 2022 internal review of compliance with certain regulations in the Japanese market related to sales of pre-loaded aphakic intraocular lenses for use in cataract surgery (IOLs, not ICLs). In many of our markets outside the U.S., doctors and hospital administrators may be deemed government officials. Despite precautions we may take, non-compliance may occur that could harm our reputation and financial results. Other U.S. companies in the medical device and pharmaceutical field have faced criminal penalties under the FCPA for allowing their employees or agents to deviate from appropriate practices in doing business with such individuals.
Investigations and allegations, whether or not they lead to enforcement action or litigation, can materially harm our business and our reputation.
Our failure to comply with the requirements of the U.S. FDA or other regulators can result in civil and criminal fines, the recall of products, the total or partial suspension of manufacturing or distribution, seizure of products, injunctions, lawsuits, failure to obtain approval of pending product applications, withdrawal of existing product approvals, exclusion from participation in government healthcare programs and other sanctions. Any threatened or actual government enforcement action can also generate adverse publicity and require us to divert substantial resources from more productive uses in our business. Enforcement actions could affect our ability to distribute our products commercially and could materially harm our business.
In addition, negative publicity about investigations or allegations of misconduct, even without a finding of misconduct, could harm our reputation with healthcare professionals and also with the market for our common stock. Responding to investigations or conducting internal investigations can be costly, time-consuming, and disruptive to our business.
Risks Related to Ownership of Our Common Stock
The market price of our common stock has been and will likely continue to be volatile.
The market price for our common stock has fluctuated widely. The closing price of our common stock ranged from $23.93 to $52.25 per share during the year ended December 27, 2024. Our stock price could continue to experience significant fluctuations in response to factors such as market perceptions, quarterly variations in operating results, operating results that vary from the expectations of securities analysts and investors, changes in financial estimates, changes in the business and market valuations of competitors, announcements by us or our competitors of a material nature, additions or departures of key personnel, future sales of our common stock and stock volume fluctuations. Also, general political and economic conditions such as a recession or interest rate fluctuations, public health crises, geopolitical tensions or conflicts, may adversely affect the stock market in general, and, in turn, the market price of our common stock.
Because we do not intend to pay dividends, stockholders will benefit from an investment in our common stock only if it appreciates in value.
We have not paid any cash dividends on our common stock since our inception. We currently expect to retain any earnings for use to further develop our business, and do not expect to declare cash dividends on our common stock in the foreseeable future. The declaration and payment of any such dividends in the future depends upon our earnings, financial condition, capital needs, and other factors deemed relevant by our Board of Directors, and may be restricted by future agreements with lenders. As a result, the success of an investment in our common stock will depend entirely
upon any future appreciation. There is no guarantee that our common stock will appreciate in value or even maintain the price at which stockholders purchase their shares.
Our Certificate of Incorporation and Bylaws, anti-takeover provisions of Delaware law, and contractual provisions could delay or prevent an acquisition or sale of our Company. Our Certificate of Incorporation empowers our Board to issue one or more series of preferred stock, and to determine the rights of each such series as provided in our Certificate of Incorporation. These provisions give our Board the ability to deter, discourage or make more difficult a change in control of our Company, even if such a change in control could be deemed in the interest of our stockholders or if such a change in control would provide our stockholders with a substantial premium for their shares over the then-prevailing market price for our common stock. Our Certificate of Incorporation and Bylaws contain other provisions that could have an anti-takeover effect, including the following:
•stockholders cannot act by consent;
•stockholders cannot fill vacancies on our Board;
•certain provisions, including those related to changing the number of directors, limiting our stockholders’ ability to fill vacancies on our Board, prohibiting stockholder action by written consent, and amending such provisions, cannot be altered, amended or repealed, and provisions inconsistent therewith cannot be adopted, without the affirmative vote of holders of at least two-thirds in voting power of our outstanding shares of common stock entitled to vote thereon; and
•stockholders must give advance notice to nominate directors or propose other business.
In addition, we are generally subject to the anti-takeover provisions of Section 203 of the Delaware General Corporation Law, which regulates corporate acquisitions. These provisions could discourage potential acquisition proposals and could delay or prevent a change in control transaction. They could also have the effect of discouraging tender offers for our common stock or prevent changes in our management.
Ownership of our common stock is concentrated among a few investors, which may affect the ability of a third party to acquire control of us. Substantial sales by such investors could cause our common stock price to decline.
Our largest investor beneficially owns approximately 22% of our outstanding common stock, and our largest three investors beneficially own approximately 51% of our outstanding common stock. Two of our current six directors were recommended by investors. The sale of a substantial number of shares of our common stock by any or all of our largest investors or our other stockholders within a short period of time could cause our common stock price to decline, make it more difficult for us to raise funds through future offerings of our common stock or acquire other businesses using our common stock as consideration.
In addition, having such a concentration of ownership may have the effect of making it more difficult for a third party to acquire, or of discouraging a third party from seeking to acquire, a majority of our outstanding common stock or control of our Board, including through a proxy solicitation.
Future sales of our common stock could reduce our stock price.
We could issue additional shares of common or preferred stock to raise additional capital or for other corporate purposes without stockholder approval. In addition, we could designate and sell a class of preferred stock with preferential rights over our common stock with respect to dividends or other distributions. Also, we have filed in the past, and may file in the future, a universal shelf registration statement with the Securities and Exchange Commission to cover the public offering and sale of our equity or debt securities. Sales of our common or preferred stock under the shelf registration or in other transactions could dilute the interest of existing stockholders and reduce the market price of our common stock. Even in the absence of such sales, the perception among investors that additional sales of equity securities may take place could reduce the market price of our common stock.
None.
ITEM 1C. Cybersecurity
Risk Management and Strategy
We have established policies and processes for assessing, identifying, and managing material risk from cybersecurity threats, and we have integrated these processes into our overall risk management program. We assess material risks from cybersecurity threats, including any potential unauthorized occurrence on or conducted through our information systems that may result in adverse effects on the confidentiality, integrity, or availability of our information systems or any information residing therein.
We have adopted as the governance framework for our cybersecurity program the National Institute of Standards and Technology (NIST) Cybersecurity Framework (CSF). We use this framework as a guide to help us identify, assess, respond to, and manage cybersecurity risks relevant to our business. Our cybersecurity risk management program includes:
•periodic risk assessments designed to help identify material cybersecurity risks to our critical systems, information, and our broader enterprise information technology (IT) environment;
•skilled internal information security (IS) and data privacy personnel, who support our cybersecurity risk assessment processes, our security controls, and our response to cybersecurity incidents;
•external service providers, where appropriate, to monitor, assess, test, or otherwise assist with aspects of our security controls, and to support risk mitigation efforts;
•training for our employees on cybersecurity awareness and the importance of protecting information assets, including “phishing” tests;
•periodic reviews of key cybersecurity policies, and updating as needed;
•information governance policy and a cybersecurity incident response plan that includes procedures for monitoring data use and responding to cybersecurity incidents; and
•a third-party risk management process for service providers, suppliers, and vendors.
Based on the information available to us as of the date of this Annual Report, we believe that risks from cybersecurity threats, including as a result of any prior cybersecurity incidents, have not materially affected us, including our business strategy, results of operations, or financial condition, and as of the date of this Annual Report, we are not aware of any material risks from cybersecurity threats that are reasonably likely to do so. However, we cannot eliminate all risks from cybersecurity threats or provide assurances that the Company will not be materially affected by such risks in the future. Additional information on cybersecurity risks we face can be found in Item 1A, Risk Factors, which should be read in conjunction with the foregoing information.
Governance
Our Board considers cybersecurity risk as part of its risk oversight function and has delegated oversight of cybersecurity, including data security risk mitigation efforts, to the Audit Committee. Under the Audit Committee charter, the Audit Committee has responsibility for discussing with management the Company’s policies with respect to risk assessment and risk management, including guidelines and policies to govern the process by which the Company’s exposure to risk is handled.
The Audit Committee receives reports from management on the Company’s cybersecurity risks and the Company’s cybersecurity program. In addition, management updates the Audit Committee, as necessary, regarding any material cybersecurity incidents. The Audit Committee regularly updates the Board on such matters ,and the Board also periodically receives presentations from management directly on our cybersecurity risk management.
Our management team is responsible for assessing and managing our material risks from cybersecurity threats and reporting on such risks to the Audit Committee. Our management team oversees efforts to prevent, detect, mitigate, and remediate cybersecurity risks and incidents through various means, which may include threat briefings from internal personnel and external service providers, as well as alerts and reports produced by security tools deployed in the information technology environment.
STAAR utilizes internal personnel and external service providers to support the Company’s cybersecurity efforts. Our Chief Information Officer (CIO) leads a team of IS professionals who have primary responsibility for our overall cybersecurity risk management program and supervises both our internal personnel and our retained external
cybersecurity consultants. Our CIO has over two decades of experience, including experience building IT and IS functions and teams, as well as cybersecurity programs. Our CIO holds an M.B.A. in management, has an audit and accounting background, and serves on the SoCalCIO Board, a Southern California organization developing and supporting local CIOs. The CIO and IS team collaborate closely with STAAR’s legal, privacy, and internal audit functions to address cybersecurity and data privacy risks. The Company’s internal IS and data privacy specialists have certifications from various organizations, including ISC2 (Certified Information Security Systems Professional or CISSP), Global Information Assurance (GIAC), the Computing Technology Industry Association (CompTIA) and International Association of Privacy Professionals (IAPP).
ITEM 2. Properties
Our operations are conducted in leased facilities throughout the world. STAAR maintains operational and administrative facilities in the U.S., Switzerland, and Japan. Our global administrative offices, principal manufacturing, warehouse, and distribution facilities are located in Monrovia, California. We manufacture the raw material for Collamer lenses in our facility in Aliso Viejo, California. STAAR also operates a technology center housing its research and development (R&D) team and labs in Tustin, California. Our corporate headquarters, including our executive offices, our EVO Experience Center, and additional operational facilities, are located in Lake Forest, California. STAAR Surgical AG maintains administrative offices, warehouse and distribution facilities in Nidau and Brügg, Switzerland. We are in the process of expanding our manufacturing capabilities for STAAR’s ICL products in our Nidau, Switzerland facility. STAAR Japan maintains administrative offices in Tokyo and Osaka, Japan and a distribution facility in Musashino City, in greater Tokyo, Japan. We also maintain commercial offices in China, Germany, Spain, India, Singapore, and the U.K.
We believe our existing properties are well maintained, in good operating condition and are adequate to support our present level of operations. We also believe that we could increase capacity as needed.
ITEM 3. Legal Proceedings
See Note 12 to the Consolidated Financial Statements in this Annual Report on Form 10-K for information about Litigation and Claims, which is hereby incorporated by reference.
ITEM 4. Mine Safety Disclosures
None.
PART II
ITEM 5. Market for Registrant’s Common Equity, Related Stockholder Matters, and Issuer Purchases of Equity Securities
Market Information
Our common stock is traded on the Nasdaq Global Market (NASDAQ) under the symbol “STAA.”
Holders
As of February 18, 2025, there were approximately 245 holders of record of our common stock. The number of beneficial owners of our common stock is substantially greater than the number of record holders, because a large portion of our common stock is held in street name by brokers and other nominees.
Dividends
We have not paid any cash dividends on our common stock since our inception. We currently expect to retain any earnings for use to further develop our business and not to declare cash dividends in the foreseeable future. The declaration and payment of any such dividends depends upon the Company’s earnings, financial condition, capital needs, and other factors deemed relevant by the Board and may be restricted by future agreements with lenders.
Stock Performance Graph
This performance graph shall not be deemed “filed” for purposes of Section 18 of the Exchange Act or incorporated by reference into any filing of STAAR Surgical Company under the Securities Act or the Exchange Act, except as shall be expressly set forth by specific reference in such filing.
The following graph and table show the cumulative total stockholder return during the last five years in (i) our common stock, (ii) the NASDAQ Composite Index and (iii) the S&P 400 Health Care Index. The graph assumes that
$100 was invested at the closing price of our common stock on the last trading day of fiscal year 2019 and all dividends (if any) were reinvested. We have never paid dividends on our common stock and have no present plans to do so. Stockholder returns over the indicated period should not be considered indicative of future performance.
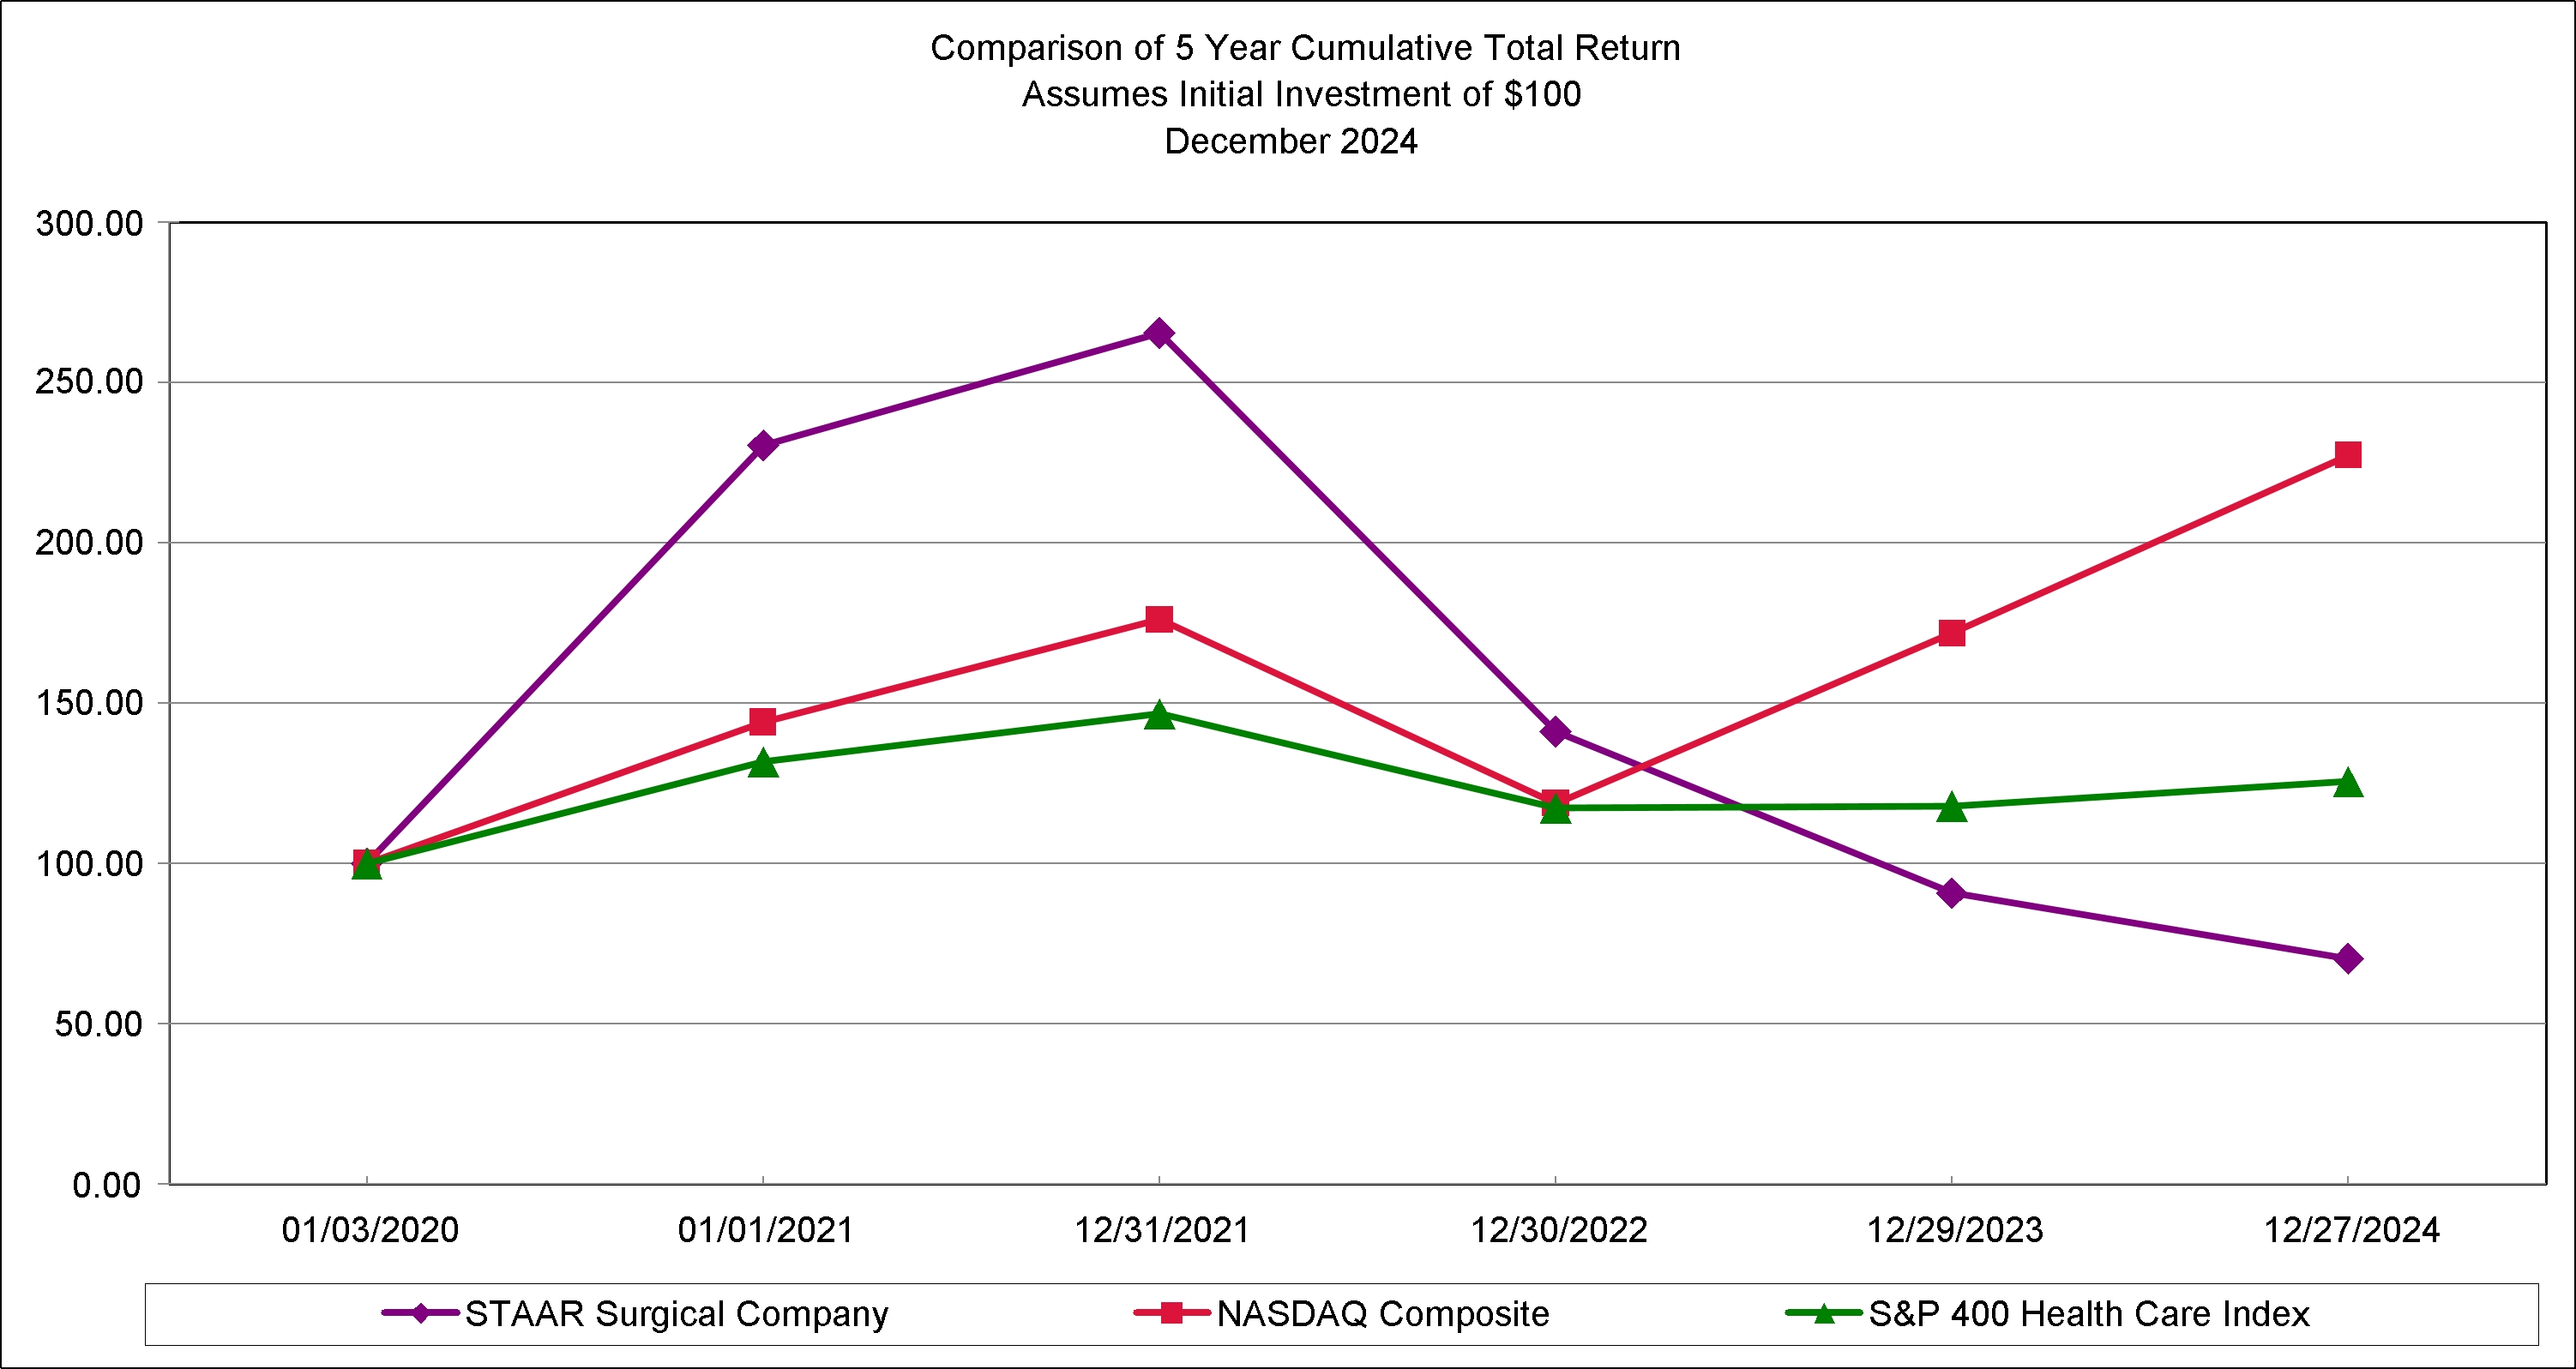
Prepared by Zacks Investment Research, Inc. Used with Permission. All rights reserved.
| | | | | | | | | | | | | | | | | | | | | | | | |
Total Returns Index for Fiscal Years: | | 2019 | | | 2020 | | | 2021 | | | 2022 | | | 2023 | | | 2024 | |
STAAR Surgical Company | | $ | 100.00 | | | $ | 230.42 | | | $ | 265.56 | | | $ | 141.17 | | | $ | 90.76 | | | $ | 70.39 | |
The Nasdaq Composite Index | | | 100.00 | | | | 144.12 | | | | 176.09 | | | | 118.80 | | | | 171.83 | | | | 227.37 | |
S&P 400 Health Care Index | | | 100.00 | | | | 131.76 | | | | 146.72 | | | | 117.30 | | | | 117.90 | | | | 125.56 | |
ITEM 6. [Reserved]
ITEM 7. Management’s Discussion and Analysis of Financial Condition and Results of Operations
The following Management’s Discussion and Analysis of Financial Condition and Results of Operations is intended to promote understanding of our financial condition and results of operations. You should read the following discussion and analysis of our financial condition and results of operations in conjunction with the Consolidated Financial Statements and the Notes to those statements included in this Annual Report. This discussion includes forward-looking statements that involve risks and uncertainties. Our actual results may differ materially from those anticipated in these forward-looking statements as a result of numerous factors, including those described in this Annual Report in Item 1A. “Risk Factors.”
Overview
STAAR Surgical Company designs, develops, manufactures, and sells implantable lenses for the eye and accessory delivery systems used to deliver the lenses into the eye. We are the leading manufacturer of phakic implantable lenses used worldwide in corrective or “refractive” surgery. We have been dedicated solely to ophthalmic surgery for over 40 years. Our goal is to position our refractive lenses throughout the world as primary and premium solutions for patients seeking visual freedom from wearing eyeglasses or contact lenses while achieving excellent visual acuity through refractive vision correction.
STAAR generates worldwide revenue almost exclusively from sales of our implantable Collamer lenses, or “ICLs.” Our ICLs are made from Collamer, which is a proprietary collagen copolymer material created and exclusively used by STAAR to make our lenses soft, flexible and biocompatible with the eye. Our ICLs are phakic lenses, meaning that they are implanted into the eye without removing the eye’s natural crystalline lens. This distinguishes an ICL procedure from other refractive procedures, as it does not involve the removal of corneal eye tissue. All of our ICLs are foldable, which allows the surgeon to insert them into the eye through a small incision during minimally invasive surgery. Further, while ICLs are intended to be permanent, our ICLs are reversible lens implants, meaning they can be removed by a doctor if desired.
We market and sell our ICLs for refractive surgery to treat myopia (nearsightedness) as our “EVO” family of lenses. We believe our EVO lenses are an “Evolution in Visual Freedom” designed to provide premium refractive outcomes while optimizing patient comfort. Our EVO family of lenses includes our EVO ICL, EVO+ ICL, and EVO Visian ICL. Our newest offering, EVO Viva, has an extended depth of focus (EDoF) optic, which is designed to treat myopia with presbyopia (age-related loss of ability to focus). We also market and sell an ICL lens to treat hyperopia (farsightedness), which we call our Visian ICL. We make our ICL product offerings available in multiple models, powers and lengths, including some with toric ICL (TICL) versions to correct for astigmatism (blurred vision). Not all of our products are currently available in all markets where we sell ICLs today.
STAAR employs a commercialization strategy that strives for sustainable, profitable growth. Our growth strategy includes making our complete ICL product line available in our existing geographic markets and expanding into attractive markets where we do not sell our products today. In addition, we are focused on driving awareness of the ICL procedure and the clinical benefits of our ICLs, and providing surgeon training, support and education, particularly in our newer markets. Historically, the Company also manufactured and sold intraocular lenses (or IOLs) for use in surgery to treat cataracts. As the Company has focused its business and strategy on its ICL product offerings, we have phased out our cataract IOL product line. For the fiscal year ended December 27, 2024, approximately 100% our net sales were generated from sales of ICLs.
Business Environment and Factors Affecting Comparability
Given the size of the Company’s business in China relative to its net sales in the rest of the world, macroeconomic conditions in China have a significant impact on the Company’s business, operations, and financial results. For the fiscal year ended December 27, 2024, we reported $313.9 million of net sales, a decrease of 3% compared to $322.4 million in fiscal 2023, and we incurred a net loss of $20.2 million compared to net income of $21.3 million in fiscal 2023. Prior to fiscal 2024, we had reported over ten years of annual net sales growth, and we had delivered net income profitability since 2018. Our results in fiscal 2024 were negatively impacted by a significant decline in ICL sales in China in the fourth quarter ended December 27, 2024, where the sluggish economy and weak consumer consumption contributed to fluctuating demand for ICL procedures.
During the fourth quarter ended December 27, 2024, we shipped a $27.5 million order of ICLs to one of our distributors in China. After the shipment was received, the distributor raised concerns about the ongoing fluctuations in procedural volumes in China and forecasted demand for fiscal 2025. Following discussions with the distributor, the distributor requested extended payment terms for the order, and we agreed. From time to time, we agree to extended
payment terms with our distributors, but given that these payment terms were significantly longer than the terms included in our distributor agreement, we determined that under accounting principles generally accepted in the U.S. (“GAAP”), collectability was not probable, and we did not recognize the revenue associated with the shipment in the quarter ended December 27, 2024. As the shipment was received by the distributor, and control of the product passed to the distributor, the product is no longer recorded in our inventory. Ordinarily, we recognize revenue upon shipment of product, and we record cost of sales when we recognize revenue based on the matching principle under GAAP. In this instance, we did not recognize the revenue, but we did recognize costs of sales associated with this order of $3.9 million, which had a negative impact on our gross profit and gross profit margin for the fourth quarter and fiscal year ended December 27, 2024. As the control of the inventory transferred to the distributor, accounting rules require us to record the costs of sales upon such transfer, even if revenue is not recognized until a future period.
Under the extended payment terms, the distributor agreed to pay for the $27.5 million order by the end of the quarter ending September 26, 2025. Revenue for the order will not be recognized until payments are received from the distributor, at which point the collectability concern is alleviated. Because the cost of sales associated with this order was recognized in the quarter ended December 27, 2024, there will be no associated cost of sales for this order when the revenue is recognized, resulting in a 100% gross profit in the period payments are received. While we did not recognize revenue on this order upon shipment, we believe that having these ICLs in-country in China can help address challenges and delays associated with importation and logistics and can mitigate potential impacts from geopolitical risk and tariff changes.
Our agreements with our distributors in China provide for minimum inventory requirements based on forecasted demand. During fiscal 2024, our distributors purchased lenses above such minimums in anticipation of higher procedural volumes during what is typically a summer “high season” in China. Due to dynamic macroeconomic conditions and other factors, the number of ICL procedures performed during the high season and the second half of 2024 overall was lower than expected. Accordingly, our distributors in China held, as of December 27, 2024, elevated levels of ICL product inventory. We believe that volatility in surgical procedure volumes will continue until consumer confidence stabilizes and ultimately improves in China. As a result, we believe that the level of ICL inventory held by our distributors in China is sufficient to meet currently expected procedure volumes for at least the first half of fiscal 2025. We therefore anticipate we will report minimal China ICL sales in the first half of fiscal 2025. As China in-country inventory is reduced during the first half of fiscal 2025, we would expect our China revenue to normalize. However, our ability to successfully address these challenges will depend on a number of factors, including the risk of a prolonged slowdown or disruption in China and the institution of trade tariffs both globally and between the U.S. and China, as set forth in Item 1A. “Risk Factors.”
During fiscal 2025, we will continue to assess appropriate inventory levels, both inventory held by us and inventory held by our distributors. We generally keep sufficient inventory on hand to ship product immediately or shortly after receipt of an order. In addition, our distributors hold their own inventory in-country based on forecasted demand. During fiscal 2024, we increased our inventory levels to meet the significant level of anticipated demand for our ICL lenses, to support quick and efficient delivery and fulfillment for surgical procedures, and to mitigate risks associated with potential disruptions to our manufacturing and production process. During fiscal 2025, we expect to adjust our production output based on forecasted demand and optimize the level of inventory held by us and held by our distributors.
See Item 1. “Business,” for a discussion of:
•Distribution and Customers
•Research and Development
Strategic Imperatives for 2025
We believe we have a significant opportunity to fundamentally transform how myopia and other refractive conditions are treated. We want to be the first choice for doctors and for patients seeking visual freedom from wearing eyeglasses or contact lenses. A key focus in 2025 will be supporting our business in China as we work to navigate the macroeconomic challenges and position the Company for growth once the market recovers. Across our markets, we
recognize the need to further educate and train ophthalmic surgeons about our ICLs and our ICL procedure. In 2025, we intend to increase the number of strategic collaborations with leading refractive surgeons and practices in the U.S. to collaborate on marketing, training and education activities. We also plan to leverage our new EVO Experience Center at our headquarters in Lake Forest, CA, to conduct additional hands-on training and education in lens-based vision correction. In addition, we are continuing to invest in enhanced systems and tools to make ordering and fulfillment faster and easier. In 2025, we will also continue to drive awareness of the ICL procedure to reach even more potential patients and effectively communicate the clinical benefits of our ICLs. While we work to launch our existing product portfolio in attractive global markets, we also intend to continue to invest in product innovation in 2025.
Results of Operations
The following table sets forth the percentage of total sales represented by certain items reflected in the Company’s Consolidated Statement of Operations for the period indicated.
| | | | | | | | | | | | |
| | Percentage of Net Sales | |
| | 2024 | | | 2023 | | | 2022 | |
Net sales | | | 100.0 | % | | | 100.0 | % | | | 100.0 | % |
Cost of sales | | | 23.7 | % | | | 21.6 | % | | | 21.5 | % |
Gross profit | | | 76.3 | % | | | 78.4 | % | | | 78.5 | % |
General and administrative | | | 28.6 | % | | | 22.4 | % | | | 19.2 | % |
Selling and marketing | | | 34.5 | % | | | 33.4 | % | | | 31.2 | % |
Research and development | | | 17.2 | % | | | 13.8 | % | | | 12.7 | % |
Total selling, general and administrative | | | 80.3 | % | | | 69.6 | % | | | 63.1 | % |
Operating income (loss) | | | (4.0 | )% | | | 8.8 | % | | | 15.4 | % |
Total other income, net | | | 1.0 | % | | | 1.7 | % | | | 0.6 | % |
Income (loss) before income taxes | | | (3.0 | )% | | | 10.5 | % | | | 16.0 | % |
Provision for income taxes | | | 3.6 | % | | | 3.8 | % | | | 2.1 | % |
Net income (loss) | | | (6.6 | )% | | | 6.7 | % | | | 13.9 | % |
Net Sales
The following table presents our net sales, by product for the fiscal years presented (dollars in thousands):
| | | | | | | | | | | | | | | | | | | | | | | | |
| | 2024 | | | 2023 | | | 2022 | |
| | % of Total | | | Sales | | | % of Total | | | Sales | | | % of Total | | | Sales | |
ICLs | | | 99.6 | % | | $ | 312,543 | | | | 99.1 | % | | $ | 319,427 | | | | 94.8 | % | | $ | 269,712 | |
Other product sales | | | | | | | | | | | | | | | | | | |
Cataract IOLs | | | 0.0 | % | | | — | | | | 0.3 | % | | | 1,139 | | | | 3.4 | % | | | 9,638 | |
Other surgical products | | | 0.4 | % | | | 1,358 | | | | 0.6 | % | | | 1,849 | | | | 1.8 | % | | | 5,041 | |
Total other product sales | | | 0.4 | % | | | 1,358 | | | | 0.9 | % | | | 2,988 | | | | 5.2 | % | | | 14,679 | |
Net sales | | | 100.0 | % | | $ | 313,901 | | | | 100.0 | % | | $ | 322,415 | | | | 100.0 | % | | $ | 284,391 | |
Net sales for 2024 decreased 3% from 2023. The decrease in net sales was due to decreased ICL sales of $6.9 million and decreased other product sales of $1.6 million.
Net sales for 2023 increased 13% from 2022. The increase in net sales was due to increased ICL sales of $49.7 million, partially offset by a decrease in other product sales of $11.7 million.
Total ICL sales for 2024 decreased 2% from 2023, with units down 6%. The sales decrease was driven by the APAC region, which decreased 6% with units down 9%. The decrease in the APAC region was driven by decreased sales in China, primarily related to the $27.5 million order in December 2024 for which we did not recognize revenue discussed above, partially offset by sales growth in India, other APAC Distributors, Japan and Korea. The Europe, Middle East and Africa region sales increased 10% with unit growth up 17%, due primarily to sales increases in our distributor markets. The Americas region sales increased 16%, with unit increase of 17%, due primarily to sales growth in the U.S. Changes in foreign currency unfavorably impacted ICL sales by $2.7 million, which impacted our Japan and Europe, Middle East and Africa markets. ICL sales represented 99.6% of our total sales for fiscal year 2024.
Total ICL sales for 2023 increased 18% from 2022, with unit growth up 19%. The sales increase was driven by the APAC region, which grew 21% with unit growth of 22%, primarily due to sales growth in China, other APAC Distributors, India, Japan and Korea. The Europe, Middle East and Africa region sales increased 7% with units similar to prior year, due to sales growth in our distributor markets and direct markets. The Americas region sales increased
11%, with unit increase of 9%, due primarily to sales growth in the U.S. Changes in foreign currency unfavorably impacted ICL sales by $1.8 million, which impacted our Japan and Europe, Middle East and Africa markets. ICL sales represented 99.1% of our total sales for fiscal year 2023.
Other product sales include cataract IOLs, delivery systems and normal recurring sales adjustments such as sales return allowances. As a result of third-party materials and supply chain challenges that affected our cataract IOLs and associated delivery devices, we have phased out sales of our cataract IOLs as we focus on growing our ICL business. During 2023, we stopped manufacturing cataract IOLs, and we did not sell any cataract IOLs in 2024. Other product sales for 2024 decreased 55% from 2023, mainly due to decreased sales of cataract IOLs and cataract IOL injector parts, partially offset by increased sales of delivery systems. Changes in foreign currency unfavorably impacted other product sales by $0.1 million. Other product sales represented less than 1.0% of our total sales for fiscal year 2024.
Other product sales in 2023 decreased 80% from 2022, mainly due to decreased sales of cataract IOLs and cataract IOL injector parts and increased sales returns reserves related to cataract IOLs. Changes in foreign currency unfavorably impacted other product sales by $0.3 million. Other product sales represented 1.0% of our total sales for fiscal year 2023.
Gross Profit
The following table presents our gross profit and gross profit margin for the fiscal years presented (dollars in thousands):
| | | | | | | | | | | | | | | | | | | | |
| | | | | | | | | | | Percentage Change | |
| | 2024 | | | 2023 | | | 2022 | | | 2024 vs. 2023 | | | 2023 vs. 2022 | |
Gross profit | | $ | 239,582 | | | $ | 252,651 | | | $ | 223,383 | | | | (5.2 | )% | | | 13.1 | % |
Gross profit margin | | | 76.3 | % | | | 78.4 | % | | | 78.5 | % | | | | | | |
Gross profit for 2024 decreased 5.2% from 2023. Gross profit margin decreased to 76.3% of revenue for 2024 compared to 78.4% of revenue for 2023. The decrease in gross profit and gross profit margin was primarily due to the recognition of $3.9 million of cost of sales associated with our shipment of $27.5 million of ICLs to one of our distributors in China in the quarter ended December 27, 2024, for which we did not recognize revenue due to extended payment terms with the distributor. Gross profit and gross profit margin for fiscal 2024 were also negatively impacted by period costs associated with the expansion of the Company’s manufacturing capabilities in its Nidau, Switzerland facility, as well as the temporary idling of its U.S. manufacturing facility during the holiday season and for facility upgrades.
Gross profit for 2023 increased 13.1% from 2022. Gross profit margin increased to 78.4% of revenue for 2023 compared to 78.5% of revenue for 2022, due to reserves related to cataract IOLs and increased period costs associated with manufacturing expansion projects, offset by an increased mix of ICL sales, which carry a higher margin.
General and Administrative Expense
The following table presents our general and administrative expense for the fiscal years presented (dollars in thousands):
| | | | | | | | | | | | | | | | | | | | |
| | | | | | | | | | | Percentage Change | |
| | 2024 | | | 2023 | | | 2022 | | | 2024 vs. 2023 | | | 2023 vs. 2022 | |
General and administrative expense | | $ | 89,898 | | | $ | 72,319 | | | $ | 54,742 | | | | 24.3 | % | | | 32.1 | % |
Percentage of sales | | | 28.6 | % | | | 22.4 | % | | | 19.2 | % | | | | | | |
General and administrative expenses for 2024 increased 24.3% from 2023, due to increased outside services, facilities costs, salary-related and payroll tax expenses and bonus and stock-based compensation expenses.
General and administrative expenses for 2023 increased 32.1% from 2022, due to increased salary-related and payroll tax expenses, outside services, facilities costs, bonus and stock-based compensation expenses and Japan one-time employee benefits.
Selling and Marketing Expense
The following table presents our selling and marketing expense for the fiscal years presented (dollars in thousands):
| | | | | | | | | | | | | | | | | | | | |
| | | | | | | | | | | Percentage Change | |
| | 2024 | | | 2023 | | | 2022 | | | 2024 vs. 2023 | | | 2023 vs. 2022 | |
Selling and marketing expense | | $ | 108,322 | | | $ | 107,834 | | | $ | 88,856 | | | | 0.5 | % | | | 21.4 | % |
Percentage of sales | | | 34.5 | % | | | 33.4 | % | | | 31.2 | % | | | | | | |
Selling and marketing expenses for 2024 increased 0.5% from 2023, due to increased salary-related payroll tax expenses, trade shows and sales meeting expenses, costs and charges associated with the opening of our new EVO Experience Center, sales commission expenses and travel expenses, offset by decreased advertising and promotional activities.
Selling and marketing expenses for 2023 increased 21.4% from 2022, due to increased advertising and promotional activities, salary-related payroll tax expenses, sales commission expenses and travel expenses, partially offset by bonus and stock-based compensation expenses.
Research and Development Expense
The following table presents our research and development expense for the fiscal years presented (dollars in thousands):
| | | | | | | | | | | | | | | | | | | | |
| | | | | | | | | | | Percentage Change | |
| | 2024 | | | 2023 | | | 2022 | | | 2024 vs. 2023 | | | 2023 vs. 2022 | |
Research and development expense | | $ | 53,973 | | | $ | 44,401 | | | $ | 35,983 | | | | 21.6 | % | | | 23.4 | % |
Percentage of sales | | | 17.2 | % | | | 13.8 | % | | | 12.7 | % | | | | | | |
Research and development expenses for 2024 increased 21.6% from 2023 due to increased salary-related and payroll tax expenses, purchases of in-process research and development related to external AI tools for measurement and lens size selection and outside services related to professional and medical education, partially offset by decreased clinical expenses associated with our U.S. post-approval clinical trials.
Research and development expenses for 2023 increased 23.4% from 2022 due to increased salary-related and payroll tax expenses and clinical expenses associated with our U.S. post-approval clinical trials.
Research and development expense consist primarily of compensation and related costs for personnel responsible for the research and development of new and existing products, the regulatory and clinical activities required to acquire and maintain product approvals globally and medical affairs expenses. These costs are expensed as incurred.
Other Income, Net
The following table presents our other income, net for the fiscal years presented (dollars in thousands):
| | | | | | | | | | | | | | | | | | | | |
| | | | | | | | | | | Percentage Change | |
| | 2024 | | | 2023 | | | 2022 | | | 2024 vs. 2023 | | | 2023 vs. 2022 | |
Other income, net | | $ | 3,559 | | | $ | 5,599 | | | $ | 1,750 | | | | (36.4 | )% | | | — | * |
Percentage of sales | | | 1.0 | % | | | 1.7 | % | | | 0.6 | % | | | | | | |
* Denotes change is greater than +100%.
The change in other income, net for 2024 was due to increased foreign exchange losses (primarily Japanese Yen and euro) and lower interest income as a result of lower balances of investments available for sale. The change in other income, net for 2023 was due to increased interest income as a result of higher interest rates during 2023.
Other income, net generally relates to interest income earned on cash, cash equivalents and investments available for sale, interest expense on finance lease obligations, gains or losses on foreign currency transactions, and royalty income. The table below summarizes the year over year changes in other income, net (in thousands):
| | | | | | | | |
| | Favorable (Unfavorable) | |
| | 2024 vs. 2023 | | | 2023 vs. 2022 | |
Interest income, net | | $ | (1,075 | ) | | $ | 4,538 | |
Foreign exchange | | | (1,766 | ) | | | (202 | ) |
Royalty income | | | 434 | | | | (730 | ) |
Other | | | 367 | | | | 243 | |
Net change in other income, net | | $ | (2,040 | ) | | $ | 3,849 | |
Provision for Income Taxes
The following table presents our provision for income taxes for the fiscal years presented (in thousands):
| | | | | | | | | | | | | | | | | | | | |
| | | | | | | | | | | Percentage Change | |
| | 2024 | | | 2023 | | | 2022 | | | 2024 vs. 2023 | | | 2023 vs. 2022 | |
Provision for income taxes | | $ | 11,156 | | | $ | 12,349 | | | $ | 5,887 | | | | (9.7 | )% | | | — | * |
Effective tax rate | | | (123.2 | )% | | | 36.6 | % | | | 12.9 | % | | | | | | |
* Denotes change is greater than +100%.
Our effective tax rates differ from the U.S. federal statutory rate of 21% for 2024, 2023 and 2022, respectively, primarily due to the income taxes generated in foreign jurisdictions and realizability of deferred tax assets. Also impacting our effective tax rates was a $4.5 million recapture of our U.S. valuation allowance in 2024, $3.3 million recapture of our U.S. valuation allowance in 2023 and a $0.9 million release of our U.S. valuation allowance in 2022. Also during 2024, we recognized $1.5 million of unrecognized benefits, including interest, related to uncertain tax positions taken by us. There were no unrecognized benefits related to uncertain tax positions taken by us in 2023 or 2022.
Liquidity and Capital Resources
Our principal sources of liquidity are cash, cash equivalents, investments available for sale and cash flow from operating activities. We believe these sources of liquidity will be sufficient to meet our anticipated cash needs, including working capital needs, capital expenditures and contractual obligations for at least 12 months from the issuance date of the financial statements included in this Annual Report. We expect that cash flow from operating activities may fluctuate in future periods as a result of a number of factors, including fluctuations in our operating results, working capital needs, capital expenditures, and capital deployment decisions. In addition, future capital requirements will depend on many factors including our growth rate in net sales, the timing and extent of spending to support our growth strategy, the expansion of selling and marketing activities, the timing of introductions of new products, as well as global macroeconomic factors. If our anticipated future cash flow from operating activities is insufficient to satisfy our future capital requirements in the long-term, we may need to seek additional capital.
Our financial condition at December 27, 2024, December 29, 2023 and December 30, 2022 included the following (in thousands):
| | | | | | | | | | | | | | | | | | | | |
| | 2024 | | | 2023 | | | 2022 | | | 2024 vs. 2023 | | | 2023 vs. 2022 | |
Cash and cash equivalents | | $ | 144,159 | | | $ | 183,038 | | | $ | 86,480 | | | $ | (38,879 | ) | | $ | 96,558 | |
Investments available for sale | | | 86,335 | | | | 49,391 | | | | 139,061 | | | | 36,944 | | | | (89,670 | ) |
Total | | $ | 230,494 | | | $ | 232,429 | | | $ | 225,541 | | | $ | (1,935 | ) | | $ | 6,888 | |
| | | | | | | | | | | | | | | |
Current assets | | $ | 367,940 | | | $ | 365,269 | | | $ | 311,723 | | | $ | 2,671 | | | $ | 53,546 | |
Current liabilities | | $ | 70,306 | | | $ | 65,036 | | | $ | 51,716 | | | $ | 5,270 | | | $ | 13,320 | |
Working capital | | $ | 297,634 | | | $ | 300,233 | | | $ | 260,007 | | | $ | (2,599 | ) | | $ | 40,226 | |
Cash and cash equivalents include cash and balances in deposits and money market accounts held at banks and financial institutions. Our investment policy primary objective is capital preservation while maximizing our return on investment. Investments available for sale may include U.S. government and corporate debt securities, commercial paper, certain certificates deposit and related security types, that are rated by two nationally recognized statistical rating organizations with minimum investment grade ratings of AAA to A-/A-1+ to A-2, or the equivalent. The maturity of individual investments may not extend 24 months from the date of purchase. There are also limits to the amount of credit exposure in any given security type. We do not have any off-balance sheet arrangements.
Our current liquidity and capital resources, as discussed above, will enable us to meet our known contractual obligations as of December 27, 2024 (in thousands):
| | | | | | | | | | | | | | | | | | | | |
| | Payments Due by Period | |
Contractual Obligations | | Total | | | 1 Year | | | 2 – 3 Years | | | 4 – 5 Years | | | More than 5 Years | |
Finance lease obligations (Note 8)* | | $ | 42 | | | $ | 42 | | | $ | — | | | $ | — | | | $ | — | |
Operating lease obligations (Note 8)* | | | 51,301 | | | | 6,449 | | | | 11,533 | | | | 14,076 | | | | 19,243 | |
Pension benefit payments (Note 10)* | | | 6,737 | | | | 137 | | | | 353 | | | | 4,171 | | | | 2,076 | |
Asset retirement obligation (Note 12)* | | | 42 | | | | 28 | | | | — | | | | 14 | | | | — | |
Open purchase orders (Note 12)* | | | 12,948 | | | | 11,536 | | | | 1,148 | | | | 264 | | | | — | |
Total | | $ | 71,070 | | | $ | 18,192 | | | $ | 13,034 | | | $ | 18,525 | | | $ | 21,319 | |
* Refer to the Notes to the Consolidated Financial Statements in this Annual Report on Form 10-K.
Overview of changes in cash and cash equivalents and other working capital accounts
The following table presents a summary of cash flows for the fiscal years presented (dollars in thousands):
| | | | | | | | | | | | |
| | 2024 | | | 2023 | | | 2022 | |
Cash flows from: | | | | | | | | | |
Operating activities | | $ | 15,725 | | | $ | 14,594 | | | $ | 35,715 | |
Investing activities | | | (59,217 | ) | | | 74,347 | | | | (156,376 | ) |
Financing activities | | | 5,724 | | | | 7,415 | | | | 8,297 | |
Effect of exchange rate changes | | | (1,111 | ) | | | 202 | | | | (862 | ) |
Net change in cash and cash equivalents | | | (38,879 | ) | | | 96,558 | | | | (113,226 | ) |
Cash and cash equivalents, at beginning of year | | | 183,038 | | | | 86,480 | | | | 199,706 | |
Cash and cash equivalents, at end of year | | $ | 144,159 | | | $ | 183,038 | | | $ | 86,480 | |
For 2024, cash provided by operating activities consisted of $41.3 million in non-cash items primarily related to stock-based compensation expenses, partially offset by a $20.2 million net loss and $5.4 million in working-capital changes primarily related to the capitalization of cloud-based software and changes in inventories, partially offset by changes in accounts receivable. For 2023, cash provided by operating activities consisted of $34.1 million in non-cash items primarily related to stock-based compensation expenses and $21.3 million in net income, offset by $40.8 million in working-capital changes primarily related to changes in accounts receivable and inventories, partially offset by changes in other current liabilities. For 2022, cash provided by operating activities consisted of $39.7 million in net income and $24.9 million in non-cash items primarily related to stock-based compensation expenses, offset by $28.9 million in working-capital changes primarily related to changes in accounts receivable.
Since 2022 we decided to invest our cash in investments available for sale, in accordance with our investment policy. For 2024, cash used in investing activities resulted from $80.2 million in purchases of investments available for sale and $23.4 million in purchases of property, plant and equipment, partially offset from proceeds from the sale or maturity of investments available for sale of $44.4 million that was used to supplement working-capital. For 2023, cash provided by investment activities resulted from proceeds from the sale or maturity of investments available for sale of $144.8 million that was used to supplement working-capital, partially offset by $52.3 million in purchases of investments available for sale and $18.2 million in purchases of property, plant and equipment. For 2022, cash used in investment activities resulted from $155.7 million in purchases of investments available for sale and $18.1 million in purchases of property, plant and equipment, partially offset by $17.5 million of proceeds from the maturity of investments available for sale. Our investment in property, plant and equipment during 2024, 2023 and 2022, was primarily due to investments in manufacturing facilities.
For 2024, cash provided by financing activities of $5.7 million consisted primarily from the exercise of stock options of $7.4 million, partially offset by $1.5 million to repurchase employee common stock for taxes withheld. For 2023, cash provided by financing activities of $7.4 million consisted primarily from the exercise of stock options of $9.7 million, partially offset by $2.1 million to repurchase employee common stock for taxes withheld. For 2022, cash provided by financing activities of $8.3 million consisted primarily of proceeds from the exercise of stock options.
Accounts receivable, net was $77.9 million and $94.7 million at December 27, 2024 and December 29, 2023, respectively. Days’ Sales Outstanding (DSO) was 145 and 113 days for 2024 and 2023, respectively. As of December 27, 2024 and December 29, 2023, the Company’s China distributors accounted for 58% and 70%, respectively, of the Company’s consolidated trade receivables. During fiscal 2024, the Company’s China distributors increased their purchases in anticipation of higher procedural volumes during what is typically a summer “high
season” in China. Due to dynamic macroeconomic conditions and other factors, the number of ICL procedures performed during the high season and the second half of 2024 overall was lower than expected. Accordingly, our distributors in China held, as of December 27, 2024, elevated levels of ICL product inventory. Our distributor agreements typically provide for payment terms between 30 and 90 days. Our DSO was higher in 2024, in part, due to the higher levels of purchases by our China distributors during the year and the lower than anticipated procedural volumes. Our China distributors have made additional payments since December 27, 2024. Prior to adding a second China distributor in fiscal 2024, we had one distributor in China. The increase in DSO in 2023 was due to extended payment terms with our China distributor due to unfavorable foreign currency conditions at such time. We have solid relationships with our distributors in China, and we believe collectability for such accounts receivable balances are reasonably assured. We do not believe the increases in net accounts receivable reflect a trend, nor that it would have a material impact on cash flows as our available liquidity and capital resources had sufficient working capital despite the increases in net accounts receivable.
Inventories, net was $43.3 million and $35.1 million at December 27, 2024 and December 29, 2023, respectively. Days’ Inventory on Hand (DOH) was 194 and 142 days for 2024 and 2023, respectively, for finished goods, including consignment inventory. In fiscal 2023 and fiscal 2024, we increased our production and inventory to support anticipated sales growth of ICL products and to support quick and efficient delivery and fulfillment for surgical procedures. Increasing our inventory levels also helps mitigate risks associated with potential disruptions to our manufacturing and production process. We intend to continue to assess appropriate inventory levels, and during fiscal 2025, we expect to adjust our production output based on forecasted demand and optimize the level of inventory held by us and held by our distributors.
Critical Accounting Estimates
Our accounting policies are more fully described in Note 1 of the Consolidated Financial Statements. As disclosed in Note 1, the preparation of financial statements in accordance with accounting principles generally accepted in the United States of America requires management to make significant estimates and assumptions about future events that affect the amounts reported in the financial statements and accompanying notes. Actual results may differ, significantly at times, from these estimates if actual conditions differ from our assumptions.
We believe the following discussion represents our most critical accounting estimates, which are those that are most important to the portrayal of our financial condition and results of operations and require management’s most difficult, subjective and complex judgments.
Sales Return Reserves
We provide allowances for sales returns such that returns are matched against the sales from which they originated. While such allowances have historically been within our expectations, we cannot guarantee that we will continue to experience the same return rates that we have in the past. Measurement of such returns is based on an expected loss model which requires consideration of, among other factors, historical returns experience and current/anticipated trends, including the need to adjust for current conditions and product lines, the entry of a competitor, and judgments about the probable effects of relevant observable data. We consider all available information in our quarterly assessments of the adequacy of the allowance for sales returns.
Stock-Based Compensation
We account for the issuance of stock options by estimating the fair value using the Black-Scholes pricing model. This model’s calculations include the exercise price, the market price of shares on grant date, risk-free interest rates, expected term of the award, expected volatility of our stock and expected dividend yield. Stock-based compensation expense for other stock-based awards is measured at the date of grant based on the fair value of the award, which is the closing price of our common stock on the date of grant. For those awards which contain a performance condition, stock-based compensation expense will be recognized when it is probable that the performance condition will be achieved, net of an estimate of pre-vesting forfeitures, over the requisite service period based on the grant-date fair value of the stock. We reassess the probability of vesting at each reporting period and adjust stock-based compensation expense based on our probability assessment.
Income Taxes
In evaluating our ability to recover the deferred tax assets within a jurisdiction from which they arise, we consider all available positive and negative evidence, including scheduled reversals of deferred tax liabilities, projected future taxable income, tax-planning strategies, and results of recent operations. In projecting future taxable income, we begin with historical results and incorporate assumptions including overall current and projected business and industry
conditions, projected sales growth, margins, costs and income by jurisdiction, the amount of future federal, state, and foreign pretax operating income, the reversal of temporary differences and the successful implementation of feasible and prudent tax-planning strategies. These assumptions require significant judgment about the forecasts of future taxable income and are consistent with the plans and estimates management uses to manage its businesses. In evaluating the objective evidence that historical results provide, we also consider three years of cumulative operating results. Valuation allowances, or reductions to deferred tax assets, are recognized if, based on the weight of all the available evidence, it is more likely than not that some portion or all of the deferred tax asset may not be realized.
Inventories
We provide estimated inventory allowances for excess, slow moving, expiring and obsolete inventory as well as inventory whose carrying value is more than net realizable value. These reserves are based on current assessments about future demands, market conditions and related management initiatives. If market conditions and actual demands are less favorable than those projected by management, additional inventory write-downs may be required. We regularly review inventory quantities on hand and record a provision for excess and obsolete inventory based primarily on the expiration of products with a shelf life of less than four months, estimated forecasts of product demand and production requirements for the next twelve months. Several factors may influence the realizability of our inventories, including significant changes in demand, decisions to exit a product line, technological change, and new product development. While such inventory losses have historically been within our expectations and the provisions established, we cannot guarantee that we will continue to experience the same loss rates that we have in the past.
Employee Defined Benefit Plans - Pension
The liabilities and annual income or expense of our pension plans are determined using methodologies that involve several actuarial assumptions, the most significant of which are the discount rate, expected years of service, salary increases and the expected long-term rate of asset return. The fair values of plan assets are determined based on prevailing market prices.
Foreign Exchange Rate Impact
Management does not believe that the fluctuation in the value of the dollar in relation to the currencies of its suppliers or customers in the last three fiscal years has materially adversely affected our ability to purchase or sell products at agreed upon prices. However, currency exchange fluctuations do impact our net sales and results of operations as discussed under Item 7A. Quantitative and Qualitative Disclosures About Market Risk. No assurance can be given that adverse currency exchange rate fluctuations will not occur in the future, which could significantly affect our operating results. We do not currently hedge transactions to offset changes in foreign currency.
Inflation
Management believes inflation has not had a significant impact on our net sales and revenues and on income from continuing operations during the past three years.
Recent Accounting Pronouncements
See “Part II. Item 8. “Financial Statements and Supplementary Data – Note 1 – Organization and Description of Business and Accounting Policies – Recent Accounting Pronouncements Not Yet Adopted” of this Annual Report on Form 10-K.
ITEM 7A. Quantitative and Qualitative Disclosures About Market Risk
In the normal course of business, our operations are exposed to risks associated with fluctuations in interest rates and foreign currency exchange rates. The Company manages its risks based on management’s judgment of the appropriate trade-off between risks, opportunity, and costs and does not generally enter into interest rate or foreign exchange rate hedge instruments.
Foreign Currency Exchange Risk
Fluctuations in the rate of exchange between the U.S. dollar and foreign currencies in which we transact business could adversely affect our financial results. Activities outside the U.S. accounted for approximately 94% of our total sales during 2024. The results of operations and the financial position of our Japanese subsidiary are reported in Japanese yen and then translated into U.S. dollars at the applicable exchange rates for inclusion in our Consolidated Financial Statements, exposing us to translation risk. In addition, we are exposed to transaction risk because we incur some of our sales and expenses in currencies other than the U.S. dollar. Our most significant currency exposures are
to the Japanese yen, the euro, and the Swiss franc, and the exchange rates between these currencies and the U.S. dollar may fluctuate substantially. We do not actively hedge our exposure to currency rate fluctuations.
As our international subsidiaries operate in and are net recipients of currencies other than the U.S. dollar, our sales benefit from a weaker dollar and are reduced by a stronger dollar relative to major currencies worldwide (primarily, the euro and the Japanese yen). Accordingly, changes in exchange rates, and particularly the strengthening of the U.S. dollar, may negatively affect our consolidated sales and gross profit as expressed in U.S. dollars. Fluctuations during any given reporting period result in the re-measurement of our foreign currency denominated cash, receivables, and payables, generating currency transaction gains or losses and are reported in total other income, net in our Consolidated Statements of Operations. In the normal course of business, we also face risks that are either non-financial or non-quantifiable. Such risks include those set forth in Item 1A. “Risk Factors.”
We price some of our products in U.S. dollars, and thus changes in exchange rates can make our products more expensive in some offshore markets and reduce our sales. Our sales in China, for example, are denominated in U.S. dollars. Our China distributors, who sell into China and Hong Kong, collectively accounted for approximately 51% of our consolidated net sales during fiscal 2024. If the U.S. dollar strengthens relative to the Chinese yuan, it becomes more expensive for our China distributor to purchase ICLs and to pay prior accounts receivable balances. In the event of significant foreign exchange volatility in the future, the Company may extend or modify payment or other terms with its customers to mitigate the potential impact on our sales.
ITEM 8. Financial Statements and Supplementary Data
Financial Statements and the Report of Independent Registered Public Accounting Firm are filed with this Annual Report on Form 10-K in a separate section following Part IV, as shown on the index under Item 15 of this Annual Report.
ITEM 9. Changes in and Disagreements with Accountants on Accounting and Financial Disclosure
None.
ITEM 9A. Controls and Procedures
Attached as exhibits to this Annual Report on Form 10-K are certifications of STAAR’s Chief Executive Officer, our principal executive officer (PEO), and Chief Financial Officer, our principal financial officer (PFO), which are required to be made by Rule 13a-14 or Rule 15d-14 of the Securities Exchange Act of 1934, as amended (the Exchange Act). This item includes information concerning the controls and controls evaluation referred to in the certifications. This item should be read in conjunction with the certifications for a more complete understanding of the certifications.
Evaluation of Disclosure Controls and Procedures
We maintain disclosure controls and procedures that are designed to ensure that information required to be disclosed in our reports filed or submitted under the Exchange Act is recorded, processed, summarized and reported within the time periods specified in the SEC’s rules and forms, and that such information is accumulated and communicated to our management, including our PEO and PFO, as appropriate, to allow timely decisions regarding required disclosure. In designing and evaluating the disclosure controls and procedures, management recognizes that any controls and procedures, no matter how well designed and operated, can only provide reasonable assurance of achieving the desired control objectives, and in reaching a reasonable level of assurance, management necessarily is required to apply its judgment in evaluating the cost-benefit relationship of possible controls and procedures.
As of the end of the period covered by this Annual Report, our management carried out an evaluation, with the participation of our PEO and PFO, of the effectiveness of the disclosure controls and procedures of the Company. Based on that evaluation, our PEO and PFO concluded, as of December 27, 2024, that our disclosure controls and procedures were effective at the reasonable assurance level.
Changes in Internal Control over Financial Reporting
There was no change during the fiscal quarter ended December 27, 2024 that has materially affected, or is reasonably likely to materially affect, our internal control over financial reporting.
Management’s Annual Report on Internal Control over Financial Reporting
The Company’s management, including our PEO and PFO, is responsible for establishing and maintaining adequate internal control over financial reporting (as such term is defined in Exchange Act Rule 13a-15(f) and
15d-15(f)) for the Company. The Company’s internal control over financial reporting is designed to provide reasonable assurance regarding the reliability of financial reporting and the preparation of consolidated financial statements in accordance with generally accepted accounting principles in the United States of America.
Because of its inherent limitations, a system of internal control over financial reporting may not prevent or detect misstatements and can provide only reasonable, not absolute assurance, that its objectives will be achieved. Further, because of changing conditions, effectiveness of internal control over financial reporting may vary over time. The Company’s processes contain self-monitoring mechanisms, and actions are taken to correct deficiencies as they are identified.
Management has assessed the effectiveness of the Company’s internal control over financial reporting as of December 27, 2024, based on the criteria for effective internal control described in Internal Control — Integrated Framework (2013) issued by the Committee of Sponsoring Organizations of the Treadway Commission. Based on its assessment, management concluded that the Company’s internal control over financial reporting was effective as of December 27, 2024.
The report of BDO USA, P.C., our independent registered public accounting firm, regarding its audit of the Company’s internal control over financial reporting follows below.
Report of Independent Registered Public Accounting Firm
Shareholders and Board of Directors
STAAR Surgical Company
Lake Forest, California
Opinion on Internal Control over Financial Reporting
We have audited STAAR Surgical Company’s (the “Company’s”) internal control over financial reporting as of December 27, 2024, based on criteria established in Internal Control – Integrated Framework (2013) issued by the Committee of Sponsoring Organizations of the Treadway Commission (the “COSO criteria”). In our opinion, the Company maintained, in all material respects, effective internal control over financial reporting as of December 27, 2024, based on the COSO criteria.
We also have audited, in accordance with the standards of the Public Company Accounting Oversight Board (United States) (“PCAOB”), the consolidated balance sheets of the Company as of December 27, 2024 and December 29, 2023, the related consolidated statements of operations, comprehensive income (loss), stockholders’ equity, and cash flows for each of the three fiscal years in the period ended December 27, 2024, and the related notes and financial statement schedule listed in the accompanying index and our report dated February 21, 2025 expressed an unqualified opinion thereon.
Basis for Opinion
The Company’s management is responsible for maintaining effective internal control over financial reporting and for its assessment of the effectiveness of internal control over financial reporting, included in the accompanying Item 9A, Management’s Annual Report on Internal Control over Financial Reporting. Our responsibility is to express an opinion on the Company’s internal control over financial reporting based on our audit. We are a public accounting firm registered with the PCAOB and are required to be independent with respect to the Company in accordance with U.S. federal securities laws and the applicable rules and regulations of the Securities and Exchange Commission and the PCAOB.
We conducted our audit of internal control over financial reporting in accordance with the standards of the PCAOB. Those standards require that we plan and perform the audit to obtain reasonable assurance about whether effective internal control over financial reporting was maintained in all material respects. Our audit included obtaining an understanding of internal control over financial reporting, assessing the risk that a material weakness exists, and testing and evaluating the design and operating effectiveness of internal control based on the assessed risk. Our audit also included performing such other procedures as we considered necessary in the circumstances. We believe that our audit provides a reasonable basis for our opinion.
Definition and Limitations of Internal Control over Financial Reporting
A company’s internal control over financial reporting is a process designed to provide reasonable assurance regarding the reliability of financial reporting and the preparation of financial statements for external purposes in accordance with generally accepted accounting principles. A company’s internal control over financial reporting includes those policies and procedures that (1) pertain to the maintenance of records that, in reasonable detail, accurately and fairly reflect the transactions and dispositions of the assets of the company; (2) provide reasonable assurance that transactions are recorded as necessary to permit preparation of financial statements in accordance with generally accepted accounting principles, and that receipts and expenditures of the company are being made only in accordance with authorizations of management and directors of the company; and (3) provide reasonable assurance regarding prevention or timely detection of unauthorized acquisition, use, or disposition of the company’s assets that could have a material effect on the financial statements.
Because of its inherent limitations, internal control over financial reporting may not prevent or detect misstatements. Also, projections of any evaluation of effectiveness to future periods are subject to the risk that controls may become inadequate because of changes in conditions, or that the degree of compliance with the policies or procedures may deteriorate.
/s/ BDO USA, P.C.
Los Angeles, California
February 21, 2025
ITEM 9B. Other Information
During the quarter ended December 27, 2024, no director or officer (as defined in Rule 16a-1(f) under the Exchange Act) of the Company adopted or terminated any “Rule 10b5-1 trading arrangements” or any “non-Rule 10b5-1 trading arrangement” (in each case, as defined in Item 408(a) of Regulation S-K).
ITEM 9C. Disclosure Regarding Foreign Jurisdictions that Prevent Inspections
None.
PART III
Certain information required by Part III is omitted from this Annual Report because the Company will file a definitive proxy statement within 120 days after the close of its fiscal year ended December 27, 2024, pursuant to Regulation 14A (the “Proxy Statement”) for its 2025 annual meeting of stockholders, and certain information included in the Proxy Statement is incorporated herein by reference.
ITEM 10. Directors, Executive Officers and Corporate Governance
Information regarding our executive officers will be set forth in the Proxy Statement under the caption “Information Regarding Executive Officers,” which is incorporated herein by reference and made a part hereof in response to the information required by Item 10.
Information regarding our directors and certain corporate governance and other matters will be set forth in the Proxy Statement under the captions “Proposal No. 1: Election of Directors,” “Information Regarding Director Nominees,” and “Corporate Governance,” which is incorporated herein by reference and made a part hereof in response to the information required by Item 10.
The Corporate Governance Guidelines adopted by our Board of Directors, as well as the charters of the Audit Committee, the Nominating and Governance Committee and the Compensation Committee of the Board are each posted in the Investors section of our website, www.staar.com, under the Investor Resources & FAQs tab, as a Corporate Governance Document.
We have adopted a Code of Business Conduct and Ethics that applies to all our directors, officers, and employees, including our Principal Executive Officer, Principal Financial Officer, Principal Accounting Officer, or Controller, or persons performing similar functions. The Code of Business Conduct and Ethics is posted in the Investors section of our website, www.staar.com, under the Investor Resources & FAQs tab, as a Corporate Governance Document. We intend to disclose any future amendments to certain provisions of the Code of Business Conduct and Ethics, or waivers thereunder granted to executive officers and directors, on our website within four business days of such amendment or waiver.
We have adopted an Insider Trading Policy that governs the purchase, sale, and other dispositions of our securities by directors, officers and employees, as well as by the Company itself. We believe our policies and procedures are reasonably designed to promote compliance with insider trading laws, rules and regulations and applicable listing standards applicable to us. The Insider Trading Policy is posted in the Investors section of our website, www.staar.com, under the Investor Resources & FAQs tab, as a Corporate Governance Document, and a copy is filed with this Annual Report on Form 10-K as Exhibit 19.1.
ITEM 11. Executive Compensation
Information regarding compensation of our executives and directors will be set forth in the Proxy Statement under the captions “Compensation Discussion and Analysis,” “Compensation Tables,” and “Compensation of Directors,” which is incorporated herein by reference and made a part hereof in response to the information required by Item 11.
ITEM 12. Security Ownership of Certain Beneficial Owners and Management and Related Stockholder Matters
Information regarding security ownership of certain beneficial owners and management will be set forth in the Proxy Statement under the caption “Security Ownership of Principal Shareholders and Management,” which is incorporated herein by reference and made a part hereof in response to the information required by Item 12.
Information regarding securities authorized for issuance under equity compensation plans will be set forth in the Proxy Statement under the caption “Equity Compensation Plan Information,” which is incorporated herein by reference and made a part hereof in response to the information required by Item 12.
ITEM 13. Certain Relationships and Related Transactions, and Director Independence
Information regarding certain relationships and related transactions and director independence will be set forth in the Proxy Statement under the captions “Review of Related Person Transactions,” and “Corporate Governance,” which is incorporated herein by reference and made a part hereof in response to the information required by Item 13.
ITEM 14. Principal Accounting Fees and Services
Information regarding principal accounting fees and services will be set forth in the Proxy Statement under the caption “Proposal No. 2: Ratification of Independent Registered Public Accounting Firm - Principal Accountant Fees and Services,” which is incorporated herein by reference and made a part hereof in response to the information required by Item 14.
PART IV
ITEM 15. Exhibits and Financial Statement Schedules
We have filed the following documents as part of this Annual Report on Form 10-K:
All other schedules have been omitted because they are not required, not applicable, or the required information is otherwise included.
| | | | |
(3) | | | Index to Exhibits |
|
| | | | |
Exhibit Number | | | Description |
| | | |
3.1 | |
| Amended and Restated Certificate of Incorporation (incorporated by reference to Appendix 2 of the Company’s Proxy Statement on Form DEF 14A as filed with the Commission on April 26, 2018). |
| | | |
3.2 | | | Amended and Restated Bylaws (incorporated by reference to Exhibit 3.1 to the Company’s Current Report on Form 8-K as filed with the Commission on February 1, 2023). |
| | | |
4.1 | | | Form of Certificate for Common Stock, par value $0.01 per share (incorporated by reference to Exhibit 4.1 to Amendment No. 1 to the Company’s Registration Statement on Form 8 A/A as filed with the Commission on April 18, 2003). |
| | | |
4.2 | | | Description of the Registrant’s Securities (incorporated by reference to Exhibit 4.3 to the Company’s Annual Report on Form 10-K, for the year ended January 3, 2020, as filed with the Commission on February 26, 2020). |
| | | |
10.1 | # | | Form of Indemnity Agreement between the Company and certain officers and directors (incorporated by reference to Exhibit 10.38 to the Company’s Quarterly Report on Form 10-Q, for the period ended June 29, 2018, as filed with the Commission on August 1, 2018). |
| | | |
| | | |
10.2 | # | | Form of Severance Agreement between the Company and certain executives (incorporated by reference to Exhibit 10.31 to the Company’s Quarterly Report on Form 10-Q, for the period ended March 31, 2023, as filed with the Commission on May 3, 2023). |
| | | |
10.3 | # | | Form of Executive Change in Control Agreement between the Company and certain officers (incorporated by Reference to Exhibit 10.3 to the Company’s Annual Report on Form 10-K, for the year ended December 29, 2023, as filed with the Commission on February 27, 2024). |
| | | |
10.4 | # | | Letter of the Company dated July 27, 2015 to Keith Holliday, Vice President, Research and Development, regarding compensation (incorporated by reference to Exhibit 10.38 to the Company’s Quarterly Report on Form 10-Q, for the period ended October 2, 2015, as filed with the Commission on November 4, 2015). |
| | | |
10.5 | # | | Letter of the Company dated September 11, 2017 to Scott Barnes, Chief Medical Officer, regarding compensation (incorporated by reference to Exhibit 10.36 to the Company’s Annual Report on Form 10-K, for the year ended January 3, 2020, as filed with the Commission on February 26, 2020). |
| | | |
10.6 | # | | Letter of the Company dated June 30, 2020 to Patrick Williams, Chief Financial Officer, regarding compensation (incorporated by reference to Exhibit 10.38 to the Company’s Quarterly Report on Form 10-Q, for the period ended July 3, 2020, as filed with the Commission on August 5, 2020). |
| | | |
10.7 | # | | Employment Agreement effective January 1, 2023 by and between the Company and Thomas G. Frinzi, Chief Executive Officer (incorporated by reference to Exhibit 10.1 to the Company’s Current Report on Form 8-K as filed with the Commission on December 19, 2022). |
| | | |
10.8 | # | | Letter of the Company dated March 24, 2023 to Magda Michna, Chief Clinical, Regulatory and Medical Affairs Officer, regarding compensation (incorporated by reference to Exhibit 10.30 to the Company’s Quarterly Report on Form 10-Q, for the period ended March 31, 2023, as filed with the Commission on May 3, 2023). |
| | | |
10.9 | # | | Letter of the Company dated March 24, 2023 to Warren Foust, Chief Operating Officer, regarding compensation (incorporated by reference to Exhibit 10.1 to the Company’s Current Report on Form 8-K as filed with the Commission on March 29, 2023). |
| | | |
10.10 | # | | Letter of the Company, dated October 24, 2023 to Nathaniel Sisitsky, General Counsel, regarding compensation (incorporated by Reference to Exhibit 10.13 to the Company’s Annual Report on Form 10-K, for the year ended December 29, 2023, as filed with the Commission on February 27, 2024). |
| | | |
10.11 | | | Form of Distributorship Agreement (incorporated by reference to Exhibit 10.37 to the Company’s Quarterly Report on Form 10-Q, for the period ended June 29, 2018, as filed with the Commission on August 1, 2018). |
| | | |
10.12 | | | Standard Industrial/Commercial Multi-Tenant Lease-Gross dated April 5, 2000 entered into between the Company and Kilroy Realty, L.P. (incorporated by reference to Exhibit 10.46 to the Company’s Annual Report on Form 10-K, for the year ended December 29, 2000, as filed with the Commission on March 29, 2001). |
| | | |
10.13 | | | Tenth Amendment of Lease dated May 13, 2022, by and between the Company and Oxford Spectrum Wilson LLC (incorporated by Reference to Exhibit 10.20 to the Company’s Annual Report on Form 10-K, for the year ended December 29, 2023, as filed with the Commission on February 27, 2024). |
| | | |
10.14 | | | Tenancy Agreement dated June 13, 2019 between Einfache Gesellschaft Calderari & Schwab. and STAAR Surgical AG (incorporated by reference to Exhibit 10.37 to the Company’s Quarterly Report on Form 10-Q, for the period ended June 28, 2019, as filed with the Commission on July 31, 2019). |
| | | |
10.15 | | | Lease Agreement entered into on September 14, 2020 between Calderari & Schwab and STAAR Surgical AG (incorporated by reference to Exhibit 10.39 to the Company’s Current Report on Form 8-K as filed with the Commission on September 14, 2020). |
| | | |
10.16 | | | Lease Agreement dated August 10, 2017 by and between the Company and 2000 Gold L.P. (incorporated by reference to Exhibit 10.46 to the Company’s Quarterly Report on Form 10-Q, for the period ended September 29, 2017, as filed with the Commission on November 8, 2017). |
| | | |
| | | |
10.17 | | | First Amendment to Lease Agreement dated March 23, 2023 between the Company and 2000 Gold L.P. (incorporated by Reference to Exhibit 10.24 to the Company’s Annual Report on Form 10-K, for the year ended December 29, 2023, as filed with the Commission on February 27, 2024). |
| | | |
10.18 | | | Lease Agreement commencing dated March 19, 2018 between the Company and Bukewihge Properties, LLC (incorporated by reference to Exhibit 10.36 to the Company’s Quarterly Report on Form 10-Q, for the period ended March 30, 2018, as filed with the Commission on May 2, 2018). |
| | | |
10.19 | | | First Amendment to Lease Agreement dated August 11, 2022 between the Company and Bukewihge Properties, LLC (incorporated by reference to Exhibit 10.27 to the Company’s Annual Report on Form 10-K, for the year ended December 30, 2022, as filed with the Commission on February 23, 2023). |
| | | |
10.20 | | | Second Amendment to Lease Agreement dated November 15, 2023 between the Company and Bukewihge Properties, LLC (incorporated by Reference to Exhibit 10.27 to the Company’s Annual Report on Form 10-K, for the year ended December 29, 2023, as filed with the Commission on February 27, 2024). |
| | | |
10.21 | # | | STAAR Surgical Company Amended and Restated Omnibus Equity Incentive Plan (incorporated by reference to Exhibit 10.1 to the Company’s Current Report on Form 8-K as filed with the Commission on June 21, 2024). |
| | | |
10.22 | # | | Amendment No. 1 to the STAAR Surgical Company Amended and Restated Omnibus Equity Incentive Plan (incorporated by reference to Exhibit 10.2 to the Company’s Current Report on Form 8-K as filed with the Commission on June 21, 2024). |
| | | |
10.23 | # | | Form of Option Grant and Stock Option Agreement for employees (incorporated by reference to Exhibit 10.35 to the Company’s Annual Report on Form 10-K, for the year ended December 30, 2016, as filed with the Commission on March 2, 2017). |
| | | |
10.34 | # | | Form of Option Grant and Stock Option Agreement for Non-Employee Directors (incorporated by reference to Exhibit 10.36 to the Company’s Annual Report on Form 10-K, for the year ended December 30, 2016, as filed with the Commission on March 2, 2017). |
| | | |
10.25 | # | | Form of Restricted Stock Unit Grant and Agreement (incorporated by reference to Exhibit 10.37 to the Company’s Annual Report on Form 10-K, for the year ended December 30, 2016, as filed with the Commission on March 2, 2017). |
| | | |
10.26 | # | | Form of Restricted Stock Award Grant and Restricted Stock Award Agreement (incorporated by reference to Exhibit 10.38 to the Company’s Annual Report on Form 10-K, for the year ended December 30, 2016, as filed with the Commission on March 2, 2017). |
| | | |
19.1 | * | | Insider Trading Policy. |
| | | |
21.1 | * | | List of Subsidiaries. |
| | | |
23.1 | * | | Consent of BDO USA, P.C. |
| | | |
31.1 | * | | Certification Pursuant to Rule 13a-14(a) of the Securities Exchange Act of 1934, Adopted Pursuant to Section 302 of the Sarbanes-Oxley Act of 2002. |
| | | |
31.2 | * | | Certification Pursuant to Rule 13a-14(a) of the Securities Exchange Act of 1934, Adopted Pursuant to Section 302 of the Sarbanes-Oxley Act of 2002. |
| | | |
32.1 | ** | | Certification Pursuant to 18 U.S.C. Section 1350, Adopted Pursuant to Section 906 of the Sarbanes-Oxley Act of 2002. |
| | | |
97.1 | | | Compensation Recoupment (Clawback) Policy (incorporated by Reference to Exhibit 97.1 to the Company’s Annual Report on Form 10-K, for the year ended December 29, 2023, as filed with the Commission on February 27, 2024). |
| | | |
| | | |
101.INS | * | | Inline XBRL Instance Document – the instance document does not appear in the Interactive Data File because its XBRL tags are embedded within the Inline XBRL document. |
| | | |
101.SCH | * | | Inline XBRL Taxonomy Extension Schema With Embedded Linked Documents. |
| | | |
104 | | | The cover page from the Company’s Annual Report on Form 10-K for the fiscal year ended December 27, 2024, has been formatted in Inline XBRL with applicable taxonomy extension information contained in Exhibit 101. |
| | | |
| | | |
| # | | Management contract or compensatory plan, contract or arrangement. |
| | | |
| * | | Filed herewith. |
| | | |
| ** | | Certification furnished herewith solely to accompany this annual report pursuant to 18 U.S.C. Section 1350. Certification is not deemed “filed” for purposes of Section 18 of the Exchange Act or otherwise subject to the liability of that section. Such certification is not deemed to be incorporated by reference into any filing under the Securities Act or the Exchange Act except to the extent that the registrant specifically incorporates it by reference. |
| | | |
ITEM 16. Form 10-K Summary
None.
SIGNATURES
Pursuant to the requirements of Section 13 or 15(d) of the Securities Exchange Act of 1934, the registrant has duly caused this report to be signed on its behalf by the undersigned, thereunto duly authorized.
| | | |
| STAAR SURGICAL COMPANY |
|
|
|
|
|
Date: February 21, 2025 | By: | /s/ THOMAS G. FRINZI |
|
|
| Thomas G. Frinzi |
|
|
| President, Chief Executive Officer and Chair of the Board |
|
|
| (principal executive officer) |
|
Pursuant to the requirements of the Securities Exchange Act of 1934, this report has been signed below by the following persons on behalf of the registrant and in the capacities and on the dates indicated.
| | | | |
Name |
| Title |
| Date |
|
|
|
|
|
/s/ THOMAS G. FRINZI
|
| President, Chief Executive Officer and Chair of the Board, Director |
|
February 21, 2025
|
Thomas G. Frinzi |
| (principal executive officer) |
| |
|
|
|
| |
/s/ PATRICK F. WILLIAMS |
| Vice President, Chief Financial Officer |
| February 21, 2025 |
Patrick F. Williams |
| (principal accounting and financial officer) |
| |
| | | | |
/s/ ARTHER C. BUTCHER | | Director | | February 21, 2025 |
Arthur C. Butcher |
|
|
| |
| | | | |
/s/ STEPHEN C. FARRELL |
| Director |
| February 21, 2025 |
Stephen C. Farrell |
|
|
| |
| | | | |
/s/ WEI JIANG |
| Director |
| February 21, 2025 |
Wei Jiang |
|
|
| |
| | | | |
/s/ AIMEE S. WEISNER |
| Director |
| February 21, 2025 |
Aimee S. Weisner |
|
|
|
|
| | | | |
/s/ ELIZABETH YEU |
| Director |
| February 21, 2025 |
Elizabeth Yeu |
|
|
|
|
| | | | |
/s/ LILIAN ZHOU | | Director | | February 21, 2025 |
Lilian Zhou | | | | |
STAAR SURGICAL COMPANY AND SUBSIDIARIES
CONSOLIDATED FINANCIAL STATEMENTS
Years Ended December 27, 2024, December 29, 2023 and December 30, 2022
TABLE OF CONTENTS
| | |
Report of Independent Registered Public Accounting Firm (BDO USA, P.C.; Los Angeles, California; PCAOB ID#243) |
| F-2 |
|
| |
Consolidated Balance Sheets at December 27, 2024 and December 29, 2023 |
| F-4 |
|
| |
Consolidated Statements of Operations for the years ended December 27, 2024, December 29, 2023 and December 30, 2022 |
| F-5 |
|
| |
Consolidated Statements of Comprehensive Income (Loss) for the years ended December 27, 2024, December 29, 2023 and December 30, 2022 |
| F-6 |
|
| |
Consolidated Statements of Stockholders’ Equity for the years ended December 27, 2024, December 29, 2023 and December 30, 2022 |
| F-7 |
|
| |
Consolidated Statements of Cash Flows for the years ended December 27, 2024, December 29, 2023 and December 30, 2022 |
| F-8 |
|
| |
Notes to Consolidated Financial Statements |
| F-9 |
|
| |
Schedule II Valuation and Qualifying Accounts and Reserves |
| F-40 |
REPORT OF INDEPENDENT REGISTERED PUBLIC ACCOUNTING FIRM
Shareholders and Board of Directors
STAAR Surgical Company
Lake Forest, California
Opinion on the Consolidated Financial Statements
We have audited the accompanying consolidated balance sheets of STAAR Surgical Company (the “Company”) as of December 27, 2024 and December 29, 2023, the related consolidated statements of operations, comprehensive income (loss), stockholders’ equity, and cash flows for each of the three fiscal years in the period ended December 27, 2024, and the related notes and financial statement schedule listed in the accompanying index (collectively referred to as the “consolidated financial statements”). In our opinion, the consolidated financial statements present fairly, in all material respects, the financial position of the Company at December 27, 2024 and December 29, 2023, and the results of its operations and its cash flows for each of the three fiscal years in the period ended December 27, 2024, in conformity with accounting principles generally accepted in the United States of America.
We also have audited, in accordance with the standards of the Public Company Accounting Oversight Board (United States) (“PCAOB”), the Company's internal control over financial reporting as of December 27, 2024, based on criteria established in Internal Control – Integrated Framework (2013) issued by the Committee of Sponsoring Organizations of the Treadway Commission (“COSO”) and our report dated February 21, 2025 expressed an unqualified opinion thereon.
Basis for Opinion
These consolidated financial statements are the responsibility of the Company’s management. Our responsibility is to express an opinion on the Company’s consolidated financial statements based on our audits. We are a public accounting firm registered with the PCAOB and are required to be independent with respect to the Company in accordance with the U.S. federal securities laws and the applicable rules and regulations of the Securities and Exchange Commission and the PCAOB.
We conducted our audits in accordance with the standards of the PCAOB. Those standards require that we plan and perform the audit to obtain reasonable assurance about whether the consolidated financial statements are free of material misstatement, whether due to error or fraud.
Our audits included performing procedures to assess the risks of material misstatement of the consolidated financial statements, whether due to error or fraud, and performing procedures that respond to those risks. Such procedures included examining, on a test basis, evidence regarding the amounts and disclosures in the consolidated financial statements. Our audits also included evaluating the accounting principles used and significant estimates made by management, as well as evaluating the overall presentation of the consolidated financial statements. We believe that our audits provide a reasonable basis for our opinion.
Critical Audit Matter
The critical audit matter communicated below is a matter arising from the current period audit of the consolidated financial statements that was communicated or required to be communicated to the audit committee and that: (1) relates to accounts or disclosures that are material to the consolidated financial statements and (2) involved our especially challenging, subjective, or complex judgments. The communication of the critical audit matter does not alter in any way our opinion on the consolidated financial statements, taken as a whole, and we are not, by communicating the critical audit matter below, providing a separate opinion on the critical audit matter or on the accounts or disclosures to which it relates.
Income Tax Provision
As described in Notes 1 and 9 to the consolidated financial statements, the Company operates in multiple international markets and is subject to income taxes in the U.S. and numerous foreign jurisdictions. The tax provision is based on management’s understanding of current enacted tax laws and tax rates of each tax jurisdiction and assessing the realizability of the deferred tax assets. In evaluating the Company’s ability to realize the deferred tax assets, management considers the positive and negative evidence, including the reversals of deferred tax assets and liabilities, projected future taxable income, tax-planning strategies, and results of recent operations.
We identified the realization of the Company’s deferred tax assets, including the judgment and estimation regarding projected taxable income as a critical audit matter. The principal considerations in our determination are the significant judgments required in the development of forecasts and certain assumptions related to the projected sales growth, margins, costs and income by jurisdiction that are used to assess the realizability of deferred tax assets. Auditing these elements involved especially subjective and complex auditor judgment due to the nature of audit evidence and extent of audit effort required to address these matters, including the need to involve personnel with specialized knowledge and skills.
The primary procedures we performed to address this critical audit matter included:
•Assessing the reasonableness of the Company’s projected forecasts and certain related assumptions against the Company’s historical performance, industry-wide performance, macro-economic factors, and evidence obtained in other areas of the audit.
•Utilizing personnel with specialized knowledge and skills in domestic and international tax law to assist in: (i) evaluating the application of tax laws used in management’s allocation methodologies based on the Company’s structure and operations, (ii) evaluating the appropriateness of the transfer pricing positions taken by assessing the intercompany transactions and the rates used to cross charge and allocate costs based on transfer pricing agreements, and (iii) evaluating both positive and negative evidence and assessing the reasonableness of certain assumptions used in the Company’s valuation allowance assessment.
/s/ BDO USA, P.C.
We have served as the Company's auditor since 1993.
Los Angeles, California
February 21, 2025
STAAR SURGICAL COMPANY AND SUBSIDIARIES
CONSOLIDATED BALANCE SHEETS
December 27, 2024 and December 29, 2023
(In thousands, except par value amounts)
| | | | | | | | |
| | 2024 | | | 2023 | |
ASSETS | | | | | | |
Current assets: | | | | | | |
Cash and cash equivalents | | $ | 144,159 | | | $ | 183,038 | |
Investments available for sale (amortized cost basis of $86,346 and
$37,843 at December 27, 2024 and December 29, 2023, respectively) | | | 86,335 | | | | 37,688 | |
Accounts receivable trade, net of allowance for credit losses of $32
and $191 at December 27, 2024 and December 29, 2023, respectively | | | 77,897 | | | | 94,704 | |
Inventories, net | | | 43,305 | | | | 35,130 | |
Prepayments, deposits and other current assets | | | 16,244 | | | | 14,709 | |
Total current assets | | | 367,940 | | | | 365,269 | |
Investments available for sale (amortized cost basis of $11,590 at
December 29, 2023) | | | — | | | | 11,703 | |
Property, plant and equipment, net | | | 84,889 | | | | 66,835 | |
Finance lease right-of-use assets, net | | | 37 | | | | 183 | |
Operating lease right-of-use assets, net | | | 36,850 | | | | 34,387 | |
Goodwill | | | 1,786 | | | | 1,786 | |
Deferred income taxes | | | 788 | | | | 5,190 | |
Other assets | | | 17,234 | | | | 3,339 | |
Total assets | | $ | 509,524 | | | $ | 488,692 | |
LIABILITIES AND STOCKHOLDERS’ EQUITY | | | | | | |
Current liabilities: | | | | | | |
Accounts payable | | $ | 16,704 | | | $ | 13,557 | |
Obligations under finance leases | | | 42 | | | | 165 | |
Obligations under operating leases | | | 3,894 | | | | 4,202 | |
Allowance for sales returns | | | 6,579 | | | | 6,174 | |
Other current liabilities | | | 43,087 | | | | 40,938 | |
Total current liabilities | | | 70,306 | | | | 65,036 | |
Obligations under finance leases | | | — | | | | 42 | |
Obligations under operating leases | | | 34,807 | | | | 31,425 | |
Deferred income taxes | | | 297 | | | | 1,077 | |
Asset retirement obligations | | | 42 | | | | 103 | |
Pension liability | | | 6,737 | | | | 5,055 | |
Total liabilities | | | 112,189 | | | | 102,738 | |
Commitments and contingencies (Note 12) | | | | | | |
Stockholders’ equity: | | | | | | |
Common stock, $0.01 par value; 60,000 shares authorized: 49,294 and
48,839 shares issued and outstanding at December 27, 2024 and
December 29, 2023, respectively | | | 493 | | | | 488 | |
Additional paid-in capital | | | 471,449 | | | | 436,947 | |
Accumulated other comprehensive income (loss) | | | (7,031 | ) | | | (4,113 | ) |
Accumulated deficit | | | (67,576 | ) | | | (47,368 | ) |
Total stockholders’ equity | | | 397,335 | | | | 385,954 | |
Total liabilities and stockholders’ equity | | $ | 509,524 | | | $ | 488,692 | |
The accompanying notes are an integral part of these consolidated financial statements.
STAAR SURGICAL COMPANY AND SUBSIDIARIES
CONSOLIDATED STATEMENTS OF OPERATIONS
Years Ended December 27, 2024, December 29, 2023 and December 30, 2022
(In thousands, except per share amounts)
| | | | | | | | | | | | |
| | 2024 | | | 2023 | | | 2022 | |
Net sales | | $ | 313,901 | | | $ | 322,415 | | | $ | 284,391 | |
Cost of sales | | | 74,319 | | | | 69,764 | | | | 61,008 | |
Gross profit | | | 239,582 | | | | 252,651 | | | | 223,383 | |
Selling, general and administrative expenses: | | | | | | | | | |
General and administrative | | | 89,898 | | | | 72,319 | | | | 54,742 | |
Selling and marketing | | | 108,322 | | | | 107,834 | | | | 88,856 | |
Research and development | | | 53,973 | | | | 44,401 | | | | 35,983 | |
Total selling, general and administrative expenses | | | 252,193 | | | | 224,554 | | | | 179,581 | |
Operating income (loss) | | | (12,611 | ) | | | 28,097 | | | | 43,802 | |
Other income, net: | | | | | | | | | |
Interest income, net | | | 5,911 | | | | 6,986 | | | | 2,448 | |
Loss on foreign currency transactions | | | (3,675 | ) | | | (1,909 | ) | | | (1,707 | ) |
Royalty income | | | 508 | | | | 74 | | | | 804 | |
Other income, net | | | 815 | | | | 448 | | | | 205 | |
Total other income, net | | | 3,559 | | | | 5,599 | | | | 1,750 | |
Income (loss) before income taxes | | | (9,052 | ) | | | 33,696 | | | | 45,552 | |
Provision for income taxes | | | 11,156 | | | | 12,349 | | | | 5,887 | |
Net income (loss) | | $ | (20,208 | ) | | $ | 21,347 | | | $ | 39,665 | |
Net income (loss) per share: | | | | | | | | | |
Basic | | $ | (0.41 | ) | | $ | 0.44 | | | $ | 0.83 | |
Diluted | | $ | (0.41 | ) | | $ | 0.43 | | | $ | 0.80 | |
Weighted average shares outstanding: | | | | | | | | | |
Basic | | | 49,125 | | | | 48,523 | | | | 47,987 | |
Diluted | | | 49,125 | | | | 49,427 | | | | 49,380 | |
The accompanying notes are an integral part of these consolidated financial statements.
STAAR SURGICAL COMPANY AND SUBSIDIARIES
CONSOLIDATED STATEMENTS OF COMPREHENSIVE INCOME (LOSS)
Years Ended December 27, 2024, December 29, 2023 and December 30, 2022
(In thousands)
| | | | | | | | | | | | |
| | 2024 | | | 2023 | | | 2022 | |
Net income (loss) | | $ | (20,208 | ) | | $ | 21,347 | | | $ | 39,665 | |
Other comprehensive income (loss): | | | | | | | | | |
Defined benefit plans: | | | | | | | | | |
Net change in plan assets | | | (1,830 | ) | | | (3,946 | ) | | | 6,509 | |
Reclassification into other income (expense), net | | | (77 | ) | | | (357 | ) | | | 187 | |
Investments available for sale: | | | | | | | | | |
Change in unrealized gain (loss) | | | 28 | | | | 363 | | | | (406 | ) |
Reclassification into other income (expense), net | | | 3 | | | | — | | | | — | |
Foreign currency translation loss | | | (1,775 | ) | | | (1,095 | ) | | | (2,090 | ) |
Tax effect | | | 733 | | | | 766 | | | | 4 | |
Other comprehensive income (loss), net of tax | | | (2,918 | ) | | | (4,269 | ) | | | 4,204 | |
Comprehensive income (loss) | | $ | (23,126 | ) | | $ | 17,078 | | | $ | 43,869 | |
The accompanying notes are an integral part of these consolidated financial statements.
STAAR SURGICAL COMPANY AND SUBSIDIARIES
CONSOLIDATED STATEMENTS OF STOCKHOLDERS’ EQUITY
Years Ended December 27, 2024, December 29, 2023 and December 30, 2022
(In thousands)
| | | | | | | | | | | | | | | | | | | | | | | | |
| | Common Stock Shares | | | Common Stock Par Value | | | Additional Paid-In Capital | | | Accumulated Other Compre-hensive Income (Loss) | | | Accumulated Deficit | | | Total | |
Balance, at December 31, 2021 | | | 47,716 | | | $ | 477 | | | $ | 373,519 | | | $ | (4,048 | ) | | $ | (108,380 | ) | | $ | 261,568 | |
Net income | | | — | | | | — | | | | — | | | | — | | | | 39,665 | | | | 39,665 | |
Other comprehensive income | | | — | | | | — | | | | — | | | | 4,204 | | | | — | | | | 4,204 | |
Common stock issued upon exercise of options | | | 427 | | | | 4 | | | | 8,418 | | | | — | | | | — | | | | 8,422 | |
Stock-based compensation | | | — | | | | — | | | | 22,252 | | | | — | | | | — | | | | 22,252 | |
Unvested restricted stock | | | 7 | | | | — | | | | — | | | | — | | | | — | | | | — | |
Vested restricted and performance stock units | | | 62 | | | | 1 | | | | — | | | | — | | | | — | | | | 1 | |
Balance, at December 30, 2022 | | | 48,212 | | | | 482 | | | | 404,189 | | | | 156 | | | | (68,715 | ) | | | 336,112 | |
Net income | | | — | | | | — | | | | — | | | | — | | | | 21,347 | | | | 21,347 | |
Other comprehensive loss | | | — | | | | — | | | | — | | | | (4,269 | ) | | | — | | | | (4,269 | ) |
Common stock issued upon exercise of options | | | 518 | | | | 5 | | | | 9,667 | | | | — | | | | — | | | | 9,672 | |
Stock-based compensation | | | — | | | | — | | | | 25,188 | | | | — | | | | — | | | | 25,188 | |
Repurchase of employee common stock for taxes withheld | | | (35 | ) | | | — | | | | (2,097 | ) | | | — | | | | — | | | | (2,097 | ) |
Unvested restricted stock | | | 14 | | | | — | | | | — | | | | — | | | | — | | | | — | |
Vested restricted and performance stock units | | | 130 | | | | 1 | | | | — | | | | — | | | | — | | | | 1 | |
Balance, at December 29, 2023 | | | 48,839 | | | | 488 | | | | 436,947 | | | | (4,113 | ) | | | (47,368 | ) | | | 385,954 | |
Net loss | | | — | | | | — | | | | — | | | | — | | | | (20,208 | ) | | | (20,208 | ) |
Other comprehensive loss | | | — | | | | — | | | | — | | | | (2,918 | ) | | | — | | | | (2,918 | ) |
Common stock issued upon exercise of options | | | 315 | | | | 3 | | | | 7,389 | | | | — | | | | — | | | | 7,392 | |
Stock-based compensation | | | — | | | | — | | | | 28,618 | | | | — | | | | — | | | | 28,618 | |
Repurchase of employee common stock for taxes withheld | | | (44 | ) | | | — | | | | (1,505 | ) | | | — | | | | — | | | | (1,505 | ) |
Unvested restricted stock | | | 16 | | | | — | | | | — | | | | — | | | | — | | | | — | |
Forfeited restricted stock | | | (5 | ) | | | — | | | | — | | | | — | | | | — | | | | — | |
Vested restricted and performance stock units | | | 173 | | | | 2 | | | | — | | | | — | | | | — | | | | 2 | |
Balance, at December 27, 2024 | | | 49,294 | | | $ | 493 | | | $ | 471,449 | | | $ | (7,031 | ) | | $ | (67,576 | ) | | $ | 397,335 | |
The accompanying notes are an integral part of these consolidated financial statements.
STAAR SURGICAL COMPANY AND SUBSIDIARIES
CONSOLIDATED STATEMENTS OF CASH FLOWS
Years Ended December 27, 2024, December 29, 2023 and December 30, 2022
(In thousands)
| | | | | | | | | | | | |
| | 2024 | | | 2023 | | | 2022 | |
Cash flows from operating activities: | | | | | | | | | |
Net income (loss) | | $ | (20,208 | ) | | $ | 21,347 | | | $ | 39,665 | |
Adjustments to reconcile net income (loss) to net cash provided by
operating activities: | | | | | | | | | |
Depreciation of property, plant, and equipment | | | 6,891 | | | | 5,111 | | | | 4,481 | |
Amortization of intangibles | | | — | | | | 13 | | | | 28 | |
Impairment of intangibles | | | — | | | | 154 | | | | — | |
Accretion/amortization of investments available for sale | | | (1,091 | ) | | | (2,501 | ) | | | (1,198 | ) |
Deferred income taxes | | | 3,590 | | | | 3,264 | | | | (2,254 | ) |
Change in net pension liability | | | 26 | | | | (956 | ) | | | 53 | |
Loss on disposal of property and equipment | | | 1,694 | | | | 73 | | | | 65 | |
Stock-based compensation expense | | | 27,210 | | | | 23,516 | | | | 20,371 | |
Change in asset retirement obligation | | | (53 | ) | | | (102 | ) | | | 47 | |
Provision for sales returns and credit losses | | | 286 | | | | 663 | | | | 913 | |
Inventory provision | | | 2,782 | | | | 4,851 | | | | 2,423 | |
Changes in working capital: | | | | | | | | | |
Accounts receivable | | | 16,493 | | | | (32,760 | ) | | | (19,601 | ) |
Inventories | | | (10,000 | ) | | | (14,361 | ) | | | (7,943 | ) |
Prepayments, deposits, and other assets | | | (15,363 | ) | | | (3,413 | ) | | | (2,549 | ) |
Accounts payable | | | 75 | | | | (701 | ) | | | 1,805 | |
Other current liabilities | | | 3,393 | | | | 10,396 | | | | (591 | ) |
Net cash provided by operating activities | | | 15,725 | | | | 14,594 | | | | 35,715 | |
Cash flows from investing activities: | | | | | | | | | |
Acquisition of property and equipment | | | (23,394 | ) | | | (18,188 | ) | | | (18,108 | ) |
Purchase of investments available for sale | | | (80,240 | ) | | | (52,313 | ) | | | (155,748 | ) |
Proceeds from maturity of investments available for sale | | | 43,103 | | | | 143,548 | | | | 17,121 | |
Proceeds from sale of investments available for sale | | | 1,314 | | | | 1,300 | | | | 359 | |
Net cash provided by (used in) investing activities | | | (59,217 | ) | | | 74,347 | | | | (156,376 | ) |
Cash flows from financing activities: | | | | | | | | | |
Repayment of finance lease obligations | | | (165 | ) | | | (161 | ) | | | (126 | ) |
Repurchase of employee common stock for taxes withheld | | | (1,505 | ) | | | (2,097 | ) | | | — | |
Proceeds from the exercise of stock options | | | 7,392 | | | | 9,672 | | | | 8,422 | |
Proceeds from vested restricted stock | | | 2 | | | | 1 | | | | 1 | |
Net cash provided by financing activities | | | 5,724 | | | | 7,415 | | | | 8,297 | |
Effect of exchange rate changes on cash and cash equivalents | | | (1,111 | ) | | | 202 | | | | (862 | ) |
Increase (decrease) in cash and cash equivalents | | | (38,879 | ) | | | 96,558 | | | | (113,226 | ) |
Cash and cash equivalents, at beginning of year | | | 183,038 | | | | 86,480 | | | | 199,706 | |
Cash and cash equivalents, at end of year | | $ | 144,159 | | | $ | 183,038 | | | $ | 86,480 | |
The accompanying notes are an integral part of these consolidated financial statements.
STAAR SURGICAL COMPANY AND SUBSIDIARIES
NOTES TO CONSOLIDATED FINANCIAL STATEMENTS
Note 1 — Organization and Description of Business and Accounting Policies
Organization and Description of Business
STAAR Surgical Company, a Delaware corporation, was first incorporated in 1982, and together with its subsidiaries (the “Company”) designs, develops, manufactures, and sells implantable lenses for the eye and accessory delivery systems used to deliver the lenses into the eye. The Company generates worldwide revenue almost exclusively from sales of its implantable Collamer lenses (“ICLs”), which are used in corrective or “refractive” surgery. Historically, the Company also manufactured and sold intraocular lenses (“IOLs”), for use in surgery to treat cataracts. As the Company has focused its business and strategy on its ICL product offerings, it has phased out its cataract IOL product line.
The Company markets and sells ICLs for refractive surgery to treat myopia (nearsightedness) as its “EVO” family of lenses. The Company’s EVO family of lenses includes its EVO ICL, EVO+ ICL, and EVO Visian ICL. The Company’s newest offering, EVO Viva, has an extended depth of focus (EDoF) optic, which is designed to treat myopia with presbyopia (age-related loss of ability to focus). The Company also markets and sells an ICL lens to treat hyperopia (farsightedness), which is called Visian ICL. The Company makes its ICL product offerings available in multiple models, powers and lengths, including some with toric ICL (TICL) versions to correct for astigmatism (blurred vision). Not all of the Company’s products are currently available in all markets where it sells ICLs today.
As of December 27, 2024, the Company’s significant subsidiaries consisted of:
•STAAR Surgical AG, a wholly owned subsidiary organized under the laws of Switzerland (“STAAR AG”)
•STAAR Japan, Inc., a wholly owned subsidiary organized under the laws of Japan (“STAAR Japan”)
The Company operates as one operating segment, the ophthalmic surgical market, for financial reporting purposes (see Note 16).
Principles of Consolidation
The accompanying consolidated financial statements include the accounts of STAAR Surgical Company and its wholly-owned subsidiaries and have been prepared in accordance with accounting principles generally accepted in the United States of America (“GAAP”). All significant intercompany balances and transactions have been eliminated.
Fiscal Year and Interim Reporting Periods
The Company’s fiscal year ends on the Friday nearest December 31 and each of the Company’s quarterly reporting periods generally consists of 13 weeks. Fiscal years 2024, 2023 and 2022 are based on a 52-week period.
Segment Reporting
The Company adopted Accounting Standards Update (“ASU”) 2023-07 as of the beginning of fiscal 2024. The Company operates in one reportable segment, ophthalmic surgical product segment, as all of the Company’s sales are generated from ophthalmic surgical products. The accounting policies for of the ophthalmic surgical product segment are the same as those described in Note 1 of the Consolidated Financial Statements.
The Company’s chief operating decision maker (“CODM”) has been identified as the Chief Executive Officer and President. The CODM assesses performance for the ophthalmic surgical product segment by comparing actual results to forecasts and decides how to allocate resources, i.e., headcount and compensation, based on net income or on operating results, if a net loss, that is reported on the Consolidated Statements of Operations.
The measure of segment assets is reported on the balance sheet as total consolidated assets.
See “Note 1 – Organization and Description of Business and Accounting Policies – Concentration of Credit Risk and Sales,” “Note 16 – Disaggregation of Revenues, Geographic Sales and Product Sales” and “Note 17 – Geographic Assets” for specific information regarding the Company’s sales and long-lived assets.
STAAR SURGICAL COMPANY AND SUBSIDIARIES
NOTES TO CONSOLIDATED FINANCIAL STATEMENTS (CONTINUED)
Note 1 — Organization and Description of Business and Accounting Policies (Continued)
Foreign Currency
The functional currency of STAAR Japan is the Japanese yen. The functional currency of STAAR AG is the U.S. dollar.
Assets and liabilities of STAAR Japan are translated at rates of exchange in effect at the close of the period. Sales and expenses are translated at the weighted average of exchange rates in effect during the period. Net foreign translation gain (loss) was as follows (in thousands):
| | | | | | | | | | | | |
| | Years Ended | |
| | 2024 | | | 2023 | | | 2022 | |
Foreign currency translation loss(1) | | $ | (1,775 | ) | | $ | (1,095 | ) | | $ | (2,090 | ) |
Loss on foreign currency transactions(2) | | | (3,675 | ) | | | (1,909 | ) | | | (1,707 | ) |
(1) Shown as a separate line item on the Consolidated Statements of Comprehensive Income (Loss).
(2) Shown as a separate line item on the Consolidated Statements of Operations.
Cash and Cash Equivalents
Cash and cash equivalents include cash and balances in deposits and money market accounts held at banks and financial institutions with original maturities of three months or less. Such balances generally exceed the federal insurance limits; however, the Company periodically assesses the financial condition of the institutions and believes that the risk of any loss is minimal. The book value of money market accounts approximates fair value and are classified as Level 1.
The consolidated financial statements have been prepared in conformity with GAAP and, as such, include amounts based on significant estimates and judgments of management with consideration given to materiality. Estimates used include determining valuation allowances for uncollectible trade receivables, sales returns reserves, obsolete and excess inventory reserves, deferred income taxes, and tax reserves, including valuation allowances for deferred tax assets, pension liabilities, evaluation of asset impairment, in determining the useful life of depreciable and definite-lived intangible assets, and in the variables and assumptions used to calculate and record stock-based compensation. Actual results could differ materially from those estimates.
Significant estimates used include determining valuation allowances for sales returns reserves, obsolete and excess inventory reserves, deferred income taxes, and tax reserves, including valuation allowances for deferred tax assets, pension liabilities, and in the variables and assumptions used to calculate and record stock-based compensation. Other estimates made by management not considered to be significant include determining valuation allowances for uncollectible trade receivables, evaluation of asset impairment, and in determining the useful life of depreciable and definite-lived intangible assets.
Revenue Recognition
The Company recognizes revenue when its contractual performance obligations with customers are satisfied and collectability is reasonably assured. The Company’s performance obligations are generally limited to single sales orders with product shipping to the customer within a month of receipt of the sales order. Substantially all of the Company’s revenues are recognized at a point-in-time when control of its products transfers to the customer, which is typically upon shipment (as discussed below). Payment for product sales is typically collected within a short period following transfer of control of product. The Company presents sales tax and similar taxes it collects from its customers on a net basis (excluded from revenues).
From time to time, the Company consigns or ships inventory to third parties outside the United States in advance of anticipated demand. While the Company does not recognize revenue on shipment of consigned inventory, the Company believes it can help address challenges and delays associated with importation and logistics. Further, the Company believes that increasing the amount of product in-country can mitigate potential impacts from geopolitical risk and tariff changes.
STAAR SURGICAL COMPANY AND SUBSIDIARIES
NOTES TO CONSOLIDATED FINANCIAL STATEMENTS (CONTINUED)
Note 1 — Organization and Description of Business and Accounting Policies (Continued)
Revenue Recognition (Continued)
Historically, the Company marketed and sold cataract IOLs and related injectors and injector parts. The Company phased out sales of such products in fiscal 2023, and it did not sell any such products in fiscal 2024. Sales of such products involved sales by the Company of injector parts to an unrelated customer and supplier (collectively referred to as “supplier”) whereby these injector part sales were either made as a final sale to the supplier or, were sold to be combined with an acrylic cataract IOL by the supplier into finished goods inventory (a preloaded acrylic cataract IOL). These finished goods were then sold back to the Company at an agreed upon, contractual price. The Company made a profit margin on either type of sale with the supplier and each type of sale was made under separate purchase and sales orders between the two parties resulting in cash settlement for the orders sold or repurchased. For parts that were sold as a final sale, the Company recognized a sale, and those sales were classified as other product sales in total net sales. For the injector parts that were sold to be combined with an acrylic cataract IOL into finished goods, the Company recorded the transaction at its carrying value deferring any profit margin as contra-inventory, until the finished goods inventory was sold to an end-customer (not the supplier) at which point the Company recognized revenues.
For all sales, the Company is considered the principal in the transaction as the Company is the party providing specified goods it has control over prior to when control is transferred to the customer. Cost of sales includes cost of production, freight and distribution, and inventory provisions, net of any purchase discounts. Shipping and handling activities that occur after the customer obtains control of the goods are recognized as fulfillment costs.
The Company disaggregates its revenue into the following categories: non-consignment sales and consignment sales.
•Non-consignment Sales – The Company recognizes revenue from non-consignment product sales at a point-in-time when control has been transferred, which is typically at shipping point, except for certain customers and for STAAR Japan, which is typically recognized when the customer receives the product. The Company does not have significant deferred revenues as of December 27, 2024, December 29, 2023 and December 30, 2022, as delivery to the customer is generally made within the same or the next day of shipment. In December 2024, the Company shipped a $27.5 million order of ICLs to one of its distributors in China. The distributor requested extended payment terms, and the Company agreed. As these payment terms were significantly longer than the terms included in the Company’s distributor agreement, management determined that collectability was not probable, and the Company did not recognize the revenue associated with the shipment in the quarter ended December 27, 2024. However, as the shipment was received by the distributor, and control of the product passed to the distributor, the cost of the inventory was charged to cost of sales in the quarter ended December 27, 2024. Revenue for this order will not be recognized until payments are received from the distributor, at which point the collectability concern is alleviated.
•Consignment Sales – The Company’s products are marketed to ophthalmic surgeons, hospitals, ambulatory surgery centers or vision centers, and distributors. ICLs may be offered to surgeons and hospitals on a consignment basis, and historically, cataract IOLs were also offered on a consignment basis. The Company maintains title and risk of loss on consigned inventory and recognizes revenue for consignment inventory at a point-in-time when the Company is notified that the lenses have been implanted, thus completing the performance obligation.
See Note 16 for additional information on disaggregation of revenues, geographic sales information and product sales.
STAAR SURGICAL COMPANY AND SUBSIDIARIES
NOTES TO CONSOLIDATED FINANCIAL STATEMENTS (CONTINUED)
Note 1 — Organization and Description of Business and Accounting Policies (Continued)
Revenue Recognition (Continued)
The Company also enters into certain strategic cooperation agreements with customers in which, as consideration for certain commitments made by the customer, including minimum purchase commitments, the Company agrees, among other things, to share the expense for marketing, educational training and general support of the Company’s products. The provisions in these arrangements allow for these payments to be made directly to the customer or payments can be made directly to a third party for distinct marketing, educational training and general support services provided to or on behalf of the customer by the third party. For payments the Company makes to another party or reimburses the customer for distinct marketing and support services, the Company recognizes these payments as sales and marketing expense as incurred. These strategic cooperation agreements are generally for periods of 12 months or more with quarterly minimum purchase commitments. The Company recognizes sales and marketing expenses in the period in which it expects the customer will achieve its minimum purchase commitment, generally quarterly, and any unpaid amounts are recorded in other current liabilities on the Consolidated Balance Sheets, see Note 7. Reimbursements made directly to the customer for general marketing incentives are treated as a reduction in revenues. The Company’s performance obligations generally occur in the same quarter as the shipment of product. Sales and marketing expenses for distinct services were as follows (in thousands):
| | | | | | | | | | | | |
| | Years Ended | |
| | 2024 | | | 2023 | | | 2022 | |
Marketing and support services related to strategic cooperation agreements | | $ | 3,342 | | | $ | 1,891 | | | $ | 1,662 | |
Since the payments for distinct or non-distinct services occur within the quarter corresponding with the purchases made by the customer and the shipments made by the Company to that customer, there is no remaining performance obligation by the Company to the customer. Accordingly, there are no deferred revenues associated with these types of arrangements as of December 27, 2024, December 29, 2023 and December 30, 2022.
Allowance for Credit Losses
The Company performs ongoing credit evaluations of its customers and adjusts credit limits based on customer payment history and credit worthiness, as determined by the Company’s review of its customers’ current credit information. The Company continuously monitors collections and payments from customers and maintains a provision for estimated credit losses and uncollectible accounts based upon an expected loss model which considers its historical experience, any specific customer collection issues that have been identified and other relevant observable data, including current economic conditions. Amounts determined to be uncollectible are written off against the allowance for credit losses.
Concentration of Credit Risk and Sales
Financial instruments that potentially subject the Company to credit risk principally consist of trade receivables. This risk is limited due to the large number of customers comprising the Company’s customer base, and their geographic dispersion. As of December 27, 2024 and December 29, 2023, the Company’s China distributors accounted for 58% and 70%, respectively, of the Company’s consolidated trade receivables. Ongoing credit evaluations of customers’ financial condition are performed and, generally, no collateral is required. The Company maintains reserves for potential credit losses and such losses, taken together, have not exceeded management’s expectations.
The Company’s China distributors accounted for 51%, 58% and 52% of the Company’s consolidated net sales for the years ended 2024, 2023 and 2022, respectively.
STAAR SURGICAL COMPANY AND SUBSIDIARIES
NOTES TO CONSOLIDATED FINANCIAL STATEMENTS (CONTINUED)
Note 1 — Organization and Description of Business and Accounting Policies (Continued)
Sales Return Reserve
The Company generally may permit returns of product if the product, upon issuance of a Return Goods Authorization, is returned within the time allowed by its return policies and records an allowance for estimated returns at the time revenue is recognized. The Company’s allowance for estimated returns is based on an expected loss model which considers historical and current/anticipated trends and experience, the impact of new product launches, the entry of a competitor, availability of timely and pertinent information and the various terms and arrangements offered, including sales with extended credit terms. For estimated returns, sales are reported net of estimated returns and cost of sales are reported net of estimated returns that can be resold. On the Consolidated Balance Sheets, the balances associated for estimated sales returns were as follows (in thousands):
| | | | | | | | |
| | 2024 | | | 2023 | |
Estimated returns - inventory(1) | | $ | 853 | | | $ | 818 | |
Allowance for sales returns | | | 6,579 | | | | 6,174 | |
(1)Recognized in inventories, net on the Consolidated Balance Sheets
Investments Available for Sale
Investments available for sale (“AFS”) are investments in debt securities for which the Company does not have the positive intent and ability to hold to maturity. The Company’s investment policy primary objective is capital preservation while maximizing its return on investment. Investments may include U.S. government and corporate debt securities, commercial paper, certain certificates of deposit and related security types, that are rated by two nationally recognized statistical rating organizations with minimum investment grade ratings of AAA to A-/A-1+ to A-2, or the equivalent. The maturity of individual investments may not extend 24 months from the date of purchase. There are also limits to the amount of credit exposure in any given security type. Investments AFS with maturities of twelve months or less, are classified as short-term, otherwise, they are classified as long-term. Accrued interest receivable is recognized in current investments AFS on the Consolidated Balance Sheets.
Investments AFS are measured at fair value and its unrealized gains and losses reported net of the allowance for credit losses and applicable income taxes, are recognized in accumulated other comprehensive income (loss) on the Consolidated Balance Sheets. The cost of investments AFS is adjusted for amortization of premiums and accretion of discounts to maturity. Interest earned, including amortization of premiums and accretion of discounts recognized, is included in interest income (expense) on the Consolidated Statements of Operations. The cost of investments for purposes of computing realized and unrealized gains and losses is based on the specific identification method.
The Company recognizes impairment of a debt security for which there has been a decline in fair value below amortized cost if management intends to sell the security, or it is more-likely-than-not that the Company will be required to sell the security before recovery of its amortized cost basis. Impairment related to credit losses is recognized in other income (expense) on the Consolidated Statements of Operations. Any portion of impairment not related to credit losses is recognized in accumulated other comprehensive income (loss) on the Consolidated Balance Sheets. The measurement of the credit loss component is equal to the difference between the debt security’s amortized cost basis and the present value of its expected future cash flows discounted at the security’s effective yield.
STAAR SURGICAL COMPANY AND SUBSIDIARIES
NOTES TO CONSOLIDATED FINANCIAL STATEMENTS (CONTINUED)
Note 1 — Organization and Description of Business and Accounting Policies (Continued)
Fair Value of Financial Instruments
Fair value is defined as the price that would be received to sell an asset or paid to transfer a liability in an orderly transaction between market participants at the measurement date. To increase the comparability of fair value measures, the following hierarchy prioritizes the inputs to valuation methodologies used to measure fair value:
•Level 1 – Inputs to the valuation methodology are quoted prices (unadjusted) for identical assets or liabilities in active markets.
•Level 2 – Inputs to the valuation methodology include quoted prices for similar assets or liabilities in active markets, and inputs that are observable for the assets or liability, either directly or indirectly, for substantially the full term of the financial instruments.
•Level 3 – Inputs to the valuation methodology are unobservable; that reflect management’s own assumptions about the assumptions market participants would make and significant to the fair value.
The carrying values reflected on the Consolidated Balance Sheets for cash and cash equivalents, trade accounts receivable, net, prepayments, deposits and other current assets, accounts payable and other current liabilities approximate their fair values because of the short maturity of these instruments.
Inventories, Net
Inventories, net are valued at the lower of cost, determined on a first-in, first-out basis, or net realizable value. Inventories include the costs of raw material, labor, and manufacturing overhead, work in process and finished goods. Inventories also include as a contra item, deferred margins for certain injector parts described under the revenue recognition policy. The Company provides estimated inventory allowances for excess, expiring, slow moving and obsolete inventory as well as inventory whose carrying value is in excess of net realizable value to properly reflect inventory at the lower of cost or market.
Property, Plant, and Equipment
Property, plant, and equipment are recorded at cost. Depreciation on property, plant, and equipment is computed using the straight-line method over the estimated useful lives of the assets as noted below. Leasehold improvements are amortized over the lesser of the estimated useful lives of the assets or the related expected lease term. Major improvements are capitalized, and minor replacements, maintenance and repairs are charged to expense as incurred.
Also included in property, plant and equipment is construction in process. Construction in process includes the cost of design plans and build out of facilities and the cost of equipment, as well as the direct costs incurred in the testing and validation of machinery and equipment and facilities before they are ready for productive use. Upon placement in service, costs are reclassified into the appropriate asset category and depreciation commences.
The estimated useful lives of assets are as follows:
| | |
Machinery and equipment | | 5-10 years |
Computer equipment and software | | 2-5 years |
Furniture and equipment | | 3-7 years |
Leasehold improvements | | The shorter of the useful life of the asset or the expected term of the associated lease |
Goodwill
Goodwill, which has an indefinite life, is not amortized but instead is tested for impairment on an annual basis or between annual tests if an event occurs or circumstances change that would indicate the carrying amount may be impaired. Impairment testing for goodwill is done at the reporting unit level. Reporting units can be one level below the operating segment level and can be combined when reporting units within the same operating segment have similar economic characteristics. The Company has determined that its reporting units have similar economic characteristics, and therefore, can be combined into one reporting unit for the purposes of goodwill impairment testing. The Company performed its annual impairment test and determined that its goodwill was not impaired. As of December 27, 2024 and December 29, 2023, the carrying value of goodwill was $1,786,000.
STAAR SURGICAL COMPANY AND SUBSIDIARIES
NOTES TO CONSOLIDATED FINANCIAL STATEMENTS (CONTINUED)
Note 1 — Organization and Description of Business and Accounting Policies (Continued)
Long-Lived Assets
The Company reviews property, plant, and equipment and intangible assets, excluding goodwill, for impairment whenever events or changes in circumstances indicate the carrying amount of an asset may not be recoverable. The Company measures recoverability of these assets by comparing the carrying value of such assets to the estimated undiscounted future cash flows the assets are expected to generate. When the estimated undiscounted future cash flows are less than their carrying amount, an impairment loss is recognized equal to the difference between the assets’ fair value and their carrying value. A review of long-lived assets was conducted as of December 27, 2024 and December 29, 2023 and no impairment was identified.
Amortization is computed on the straight-line basis, which is the Company’s best estimate of the economic benefits realized over the estimated useful lives of the assets which range from 3 to 20 years for patents, certain acquired rights and licenses, 10 years for customer relationships, and 3 to 10 years for developed technology.
During 2023, the Company recognized impairment of $154,000 for the remaining unamortized Japan patent and licenses related to cataract IOLs. Amortization expense for intangible assets were as follows (in thousands):
| | | | | | | | | | | | |
| | Years Ended | |
| | 2024 | | | 2023 | | | 2022 | |
Amortization expense | | $ | — | | | $ | 13 | | | $ | 28 | |
Cloud-Based Software Implementation Costs
The Company has entered into cloud-based software hosting arrangements for which it incurs implementation costs. Certain costs incurred during the application development stage are capitalized and included within Prepayments, deposits and other current assets or Other assets on the Consolidated Balance Sheet, depending on the short- or long-term nature of such costs, in line with the Company’s policy on the accounting for prepaid software hosting arrangements. Costs incurred during the preliminary project stage and post-implementation stage are expensed as incurred. Capitalized cloud-based software implementation costs are amortized, beginning on the date the related software or module is ready for its intended use, on a straight-line basis over the remaining term of the hosting arrangement. Amortization is recognized as a component of selling, general, and administrative expenses, in the same line item as the expense for the associated hosting arrangement.
As of December 27, 2024 and December 29, 2023, the Company recognized $15,763,000 and $2,406,000, respectively, of net capitalized cloud-based software implementation costs related to several systems, including enterprise resource planning and customer relationship management systems, recorded within Other assets on the Consolidated Balance Sheets. As of December 27, 2024, these assets are not currently placed into service. These assets are expected to be placed into service throughout 2025. No amortization of capitalized cloud-based software implementation costs was recognized during the years ended 2024 and 2023.
Lease Accounting
The Company recognizes right-of-use (“ROU”) assets and lease liabilities for leases with terms greater than twelve months on the Consolidated Balance Sheets. Leases are classified as either finance or operating, with classification affecting the pattern of expense recognition in the Consolidated Statements of Operations.
A contract contains a lease if the contract conveys the right to control an identified asset for a period of time in exchange for consideration. An asset is either explicitly identified or implicitly identified and must be physically distinct. In addition, the Company must have both the right to obtain substantially all of the economic benefits from use of the identified asset and has the right to direct the use of the identified asset.
STAAR SURGICAL COMPANY AND SUBSIDIARIES
NOTES TO CONSOLIDATED FINANCIAL STATEMENTS (CONTINUED)
Note 1 — Organization and Description of Business and Accounting Policies (Continued)
Lease Accounting (Continued)
Certain leases may have non-lease components such as common area maintenance expense for building leases and maintenance expenses for automobile leases. In general, the Company separates common area maintenance expense component from the value of the ROU asset and lease liability when evaluating rental properties, whereas the Company includes the maintenance and service components in the value of the ROU asset and lease liability while evaluating automobile leases.
When determining whether a lease is a finance lease or operating lease, the Company uses (i) greater than or equal to 75% to determine whether the lease term is a major part of the remaining economic life of the underlying asset and (ii) greater than or equal to 90% to determine whether the present value of the sum of lease payments is substantially all of the fair value of the underlying asset.
The Company uses either the rate implicit in the lease or its incremental borrowing rate as the discount rate in lease accounting. The Company also elected not to capitalize leases that have terms of twelve months or less.
The Company reviews ROU assets, for impairment whenever events or changes in circumstances indicate the carrying amount of an asset may not be recoverable. The Company measures recoverability of these assets by comparing the carrying value of such assets to the estimated undiscounted future cash flows the assets are expected to generate. When the estimated undiscounted future cash flows are less than their carrying amount, an impairment loss is recognized equal to the difference between the assets’ fair value and their carrying value.
There was one vendor that accounted for over 10% of the Company’s consolidated accounts payable as of December 27, 2024. There were no vendors that accounted for over 10% of the Company’s consolidated accounts payable as of December 29, 2023.
Research and Development Costs
Expenditures for research activities relating to product development and improvement are charged to expense as incurred.
Advertising Costs
Advertising costs, which are included in selling and marketing expenses, are expensed as incurred, and were as follows (in thousands):
| | | | | | | | | | | | |
| | Years Ended | |
| | 2024 | | | 2023 | | | 2022 | |
Advertising costs | | $ | 34,084 | | | $ | 46,680 | | | $ | 37,918 | |
Income Taxes
The Company recognizes deferred tax assets and liabilities for temporary differences between the financial reporting basis and the tax basis of the Company’s assets and liabilities, net operating loss and credit carryforwards, and uncertainty in income taxes, on a jurisdiction-by-jurisdiction basis. For each tax entity and tax jurisdiction, the Company presents deferred tax liabilities and assets, as well as any related valuation allowance, as a single non-current amount. The Company does not offset deferred tax liabilities and assets attributable to different tax entities or to different tax jurisdictions.
STAAR SURGICAL COMPANY AND SUBSIDIARIES
NOTES TO CONSOLIDATED FINANCIAL STATEMENTS (CONTINUED)
Note 1 — Organization and Description of Business and Accounting Policies (Continued)
Income Taxes (Continued)
In evaluating the Company’s ability to recover the deferred tax assets within a jurisdiction from which they arise, management considers all available positive and negative evidence, including scheduled reversals of deferred tax liabilities, projected future taxable income, tax-planning strategies, and results of recent operations. In projecting future taxable income, the Company begins with historical results and incorporates assumptions including overall current and projected business and industry conditions, projected sales growth, margins, costs and income by jurisdiction, the amount of future federal, state, and foreign pretax operating income, the reversal of temporary differences and the successful implementation of feasible and prudent tax-planning strategies. These assumptions require significant judgment about the forecasts of future taxable income and are consistent with the plans and estimates the Company uses to manage the underlying businesses. In evaluating the objective evidence that historical results provide, the Company also considers three years of cumulative operating results. Valuation allowances, or reductions to deferred tax assets, are recognized if, based on the weight of all the available evidence, it is more likely than not that some portion or all the deferred tax asset may not be realized. The impact on deferred taxes of changes in tax rates and laws, if any, are applied to the years during which temporary differences are expected to be settled and reflected in the financial statements in the period of enactment.
The Company has made a policy election to apply the incremental cash tax savings approach when analyzing the impact Global Intangible Low Tax Income (“GILTI”) could have on its U.S. valuation allowance. As a result of future expected GILTI inclusions, and because of the 2017 Tax Cuts and Jobs Act’s ordering rules, U.S. companies may now expect to utilize tax attribute carryforwards (e.g., net operating losses and deferred tax assets) for which a valuation allowance has historically been recorded (this is referred to as the “tax law ordering approach”). However, due to the mechanics of the GILTI rules, companies that have a GILTI inclusion may realize a reduced (or no) cash tax savings from utilizing such tax attribute carryforwards (this view is referred to as the “incremental cash tax savings approach”).
The Company recognizes the income tax benefit from an uncertain tax position when it is more likely than not that, based on technical merits, the position will be sustained upon examination, including resolutions of any related appeals or litigation processes. The amount of tax benefit recorded, if any, is limited to the extent it is not greater than 50 percent likely to be realized upon settlement with the taxing authority (that has full knowledge of all relevant information). Accrued interest, if any, related to uncertain tax positions is included as a component of income tax expense, and penalties, if incurred, are recognized as a component of operating income or loss.
Basic and Diluted Net Income (Loss) Per Share
The Company has only one class of common stock and no participating securities which would require the two-class method of calculating basic earnings per share. Basic per share information is calculated by dividing net income (loss) by the weighted average number of shares outstanding during the period, net of unvested stock-based awards. Diluted per share information is calculated by dividing net income (loss) by the weighted average number of shares outstanding during the period, adjusted for the effects of potentially dilutive securities using the treasury stock method. When the Company incurs a net loss, the number of diluted shares is equal to the number of basic shares. Potentially dilutive securities include the Company’s outstanding stock-based awards. As of December 27, 2024, the Company had outstanding grants of stock options, restricted stock units (“RSUs”), and performance stock units (“PSUs”). Stock options that are anti-dilutive, where their exercise price exceeds the average market price of the common stock, are not included in the treasury stock method calculation for diluted net income (loss) per share.
STAAR SURGICAL COMPANY AND SUBSIDIARIES
NOTES TO CONSOLIDATED FINANCIAL STATEMENTS (CONTINUED)
Note 1 — Organization and Description of Business and Accounting Policies (Continued)
Employee Defined Benefit Plans
The Company maintains a passive pension plan (the “Swiss Plan”) covering employees of STAAR AG. The Swiss Plan conforms to the features of a defined benefit plan. The Company also maintains a noncontributory defined benefit pension plan which covers substantially all the employees of STAAR Japan.
The Company recognizes the funded status, or difference between the fair value of plan assets and the projected benefit obligations of the pension plan on the Consolidated Balance Sheets, with a corresponding adjustment to accumulated other comprehensive income (loss). If the projected benefit obligation exceeds the fair value of plan assets, then that difference or unfunded status represents the pension liability. The Company records a net periodic pension cost in the Consolidated Statements of Operations. The liabilities and annual income or expense of both plans are determined using methodologies that involve several actuarial assumptions, the most significant of which are the discount rate and the expected long-term rate of asset return (asset returns and fair-value of plan assets are applicable for the Swiss Plan only). The fair values of plan assets are determined based on prevailing market prices.
Stock-Based Compensation
The Company maintains an Amended and Restated Omnibus Equity Incentive Plan, as amended (the “Equity Plan”). The Equity Plan provides the Company with the ability to grant various types of stock-based awards to executive officers, employees, consultants and members of its Board of Directors (the “Board”). The Equity Plan allows for awards of stock options, stock appreciation rights, restricted stock, RSUs, and other stock- and cash-based awards, including awards that are subject to service-based and performance-based vesting conditions. As of December 27, 2024, the Company had outstanding grants of stock options, restricted stock awards, RSUs and PSUs.
Stock-based compensation expense for all stock-based awards granted is based on the grant-date fair value of the award. The Company recognizes this compensation expense on a straight-line basis over the requisite service period of the award, which is generally the vesting term of three to four years for executive officers, employees and consultants, and one year for Board members.
For performance-based awards, vesting is contingent upon the Company meeting certain internally established performance conditions and is subject to the grantee’s continued service with the Company. The Company recognizes compensation expense for performance-based awards when the Company concludes that it is probable that the performance condition will be achieved, net of an estimate of pre-vesting forfeitures, over the requisite service period based on the grant-date fair value of the award. The Company reassesses the probability of vesting at each reporting period and adjusts compensation cost based on its probability assessment.
While the majority of the Company’s outstanding stock-based awards are stock options, RSUs and PSUs, the Company also, at times, grants awards in the form of restricted stock. Restricted stock awards provide for the issuance of common stock upon grant, subject to restrictions that lapse over the requisite service period of the award. For restricted stock awards granted to the Board, the restrictions lapse over a one-year service period and for executive officers and employees, it is typically a three-year service period. In each case the awards are subject to forfeiture (or acceleration, depending upon the circumstances) until the service period is completed. Restricted stock compensation expense is recognized on a straight-line basis over the requisite service period of one to three years, based on the grant-date fair value of the award.
Restricted stock awards are included in the Company’s shares of common stock issued and outstanding on the grant date. Shares subject to RSU and PSU awards are not issuable until the requisite service and applicable performance conditions are satisfied, so they are not included in the Company’s shares of common stock issued and outstanding until the vesting of such awards.
STAAR SURGICAL COMPANY AND SUBSIDIARIES
NOTES TO CONSOLIDATED FINANCIAL STATEMENTS (CONTINUED)
Note 1 — Organization and Description of Business and Accounting Policies (Continued)
Comprehensive Income (Loss)
The Company presents comprehensive income (loss) on the Consolidated Balance Sheets and the Consolidated Statements of Comprehensive Income (Loss). Total comprehensive income (loss) includes, in addition to the net income (loss), changes in equity that are excluded from the Consolidated Statements of Operations and are recorded directly into a separate section of stockholders’ equity on the Consolidated Balance Sheets. The following table summarizes the changes in the accumulated balances for each component of accumulated other comprehensive income (loss) attributable to the Company for the years ended December 27, 2024, December 29, 2023 and December 30, 2022 (in thousands):
| | | | | | | | | | | | | | | | | | | | |
| | Foreign Currency Translation | | | Investments Available for Sale | | | Defined Benefit Pension Plan – Japan | | | Defined Benefit Pension Plan – Switzerland | | | Accumulated Other Com-prehensive Income (Loss) | |
Balance, at December 31, 2021 | | $ | (88 | ) | | $ | — | | | $ | 192 | | | $ | (4,152 | ) | | $ | (4,048 | ) |
Other comprehensive income (loss) | | | (2,090 | ) | | | (406 | ) | | | (11 | ) | | | 6,707 | | | | 4,200 | |
Tax effect | | | 631 | | | | 70 | | | | 3 | | | | (700 | ) | | | 4 | |
Balance, at December 30, 2022 | | | (1,547 | ) | | | (336 | ) | | | 184 | | | | 1,855 | | | | 156 | |
Other comprehensive income (loss) | | | (1,095 | ) | | | 363 | | | | (182 | ) | | | (4,121 | ) | | | (5,035 | ) |
Tax effect | | | 345 | | | | (64 | ) | | | 54 | | | | 431 | | | | 766 | |
Balance, at December 29, 2023 | | | (2,297 | ) | | | (37 | ) | | | 56 | | | | (1,835 | ) | | | (4,113 | ) |
Other comprehensive income (loss) | | | (1,775 | ) | | | 31 | | | | 16 | | | | (1,923 | ) | | | (3,651 | ) |
Tax effect | | | 542 | | | | (5 | ) | | | (5 | ) | | | 201 | | | | 733 | |
Balance, at December 27, 2024 | | $ | (3,530 | ) | | $ | (11 | ) | | $ | 67 | | | $ | (3,557 | ) | | $ | (7,031 | ) |
Recent Accounting Pronouncements Not Yet Adopted
In December 2023, the Financial Accounting Standards Board (“FASB”) issued ASU 2023-09, “Income Taxes (Topic 740).” ASU 2023-09 improves the transparency about income tax information through improvements to income tax disclosures primarily related to the rate reconciliation and income taxes paid information. It also includes certain other amendments to improve the effectiveness of income tax disclosures regarding (a) income or loss from continuing operations disaggregated between domestic and foreign and (b) income tax expense or benefit from continuing operations disaggregated by federal, state and foreign. ASU 2023-09 is effective for annual periods beginning after December 15, 2024. The Company will adopt ASU 2023-09 at the beginning of fiscal year 2025. The Company is currently evaluating the disclosure requirements and its effect on the Consolidated Financial Statements.
In November 2024, the FASB issued ASU 2024-03, “Income Statement - Reporting Comprehensive Income - Expense Disaggregation Disclosures (Subtopic 220-40).” ASU 2024-03 does not change the expense captions an entity presents on the face of the income statement; rather it requires disaggregation of certain expense captions into specified categories in disclosures within the footnotes to the financial statements. ASU 2024-03 requires footnote disclosure about specific expenses to disaggregate, in a tabular presentation, each relevant expense caption on the face of the income statement that includes any of the following natural expenses: (1) purchases of inventory, (2) employee compensation, (3) depreciation, (4) intangible asset amortization and (5) depreciation, depletion and amortization recognized as part of oil- and gas-production activities or other types of depletion expenses. The tabular disclosure would also include certain other expenses, when applicable. ASU 2024-03 does not change or remove existing expense disclosure requirements; however, it may affect where that information appears in the footnotes to the financial statements. ASU 2024-03 is effective for annual periods beginning after December 15, 2026, and interim reporting periods beginning after December 15, 2027. The requirements will be applied prospectively with the option for retrospective application. Early adoption is permitted. The Company will adopt ASU 2024-03 at the beginning of fiscal year 2026. The Company is currently evaluating the disclosure requirements and its effect on the Consolidated Financial Statements.
STAAR SURGICAL COMPANY AND SUBSIDIARIES
NOTES TO CONSOLIDATED FINANCIAL STATEMENTS (CONTINUED)
Note 2 — Investments Available for Sale
During 2022, the Company started to invest its cash in investments AFS, in accordance with its investment policy. Investments AFS and the related fair value measurement consisted of the following (dollars in thousands):
| | | | | | | | | | | | | | | | | | | | | | | | |
| | December 27, 2024 | |
| | | | | | | | | | | | | | Fair Value Measurements | |
| | Amortized Cost | | | Unrealized Gains | | | Unrealized Losses | | | Estimated Fair Value | | | Level 1 | | | Level 2 | |
Commercial paper | | $ | 21,466 | | | $ | 4 | | | $ | (2 | ) | | $ | 21,468 | | | $ | — | | | $ | 21,468 | |
Certificates of deposit | | | 1,997 | | | | — | | | | — | | | | 1,997 | | | | — | | | | 1,997 | |
U.S. Treasury securities | | | 11,356 | | | | 3 | | | | (4 | ) | | | 11,355 | | | | 11,355 | | | | — | |
Corporate debt securities | | | 51,527 | | | | 14 | | | | (26 | ) | | | 51,515 | | | | — | | | | 51,515 | |
Total investments AFS | | $ | 86,346 | | | $ | 21 | | | $ | (32 | ) | | $ | 86,335 | | | $ | 11,355 | | | $ | 74,980 | |
| | | | | | | | | | | | | | | | | | |
| | December 29, 2023 | |
| | | | | | | | | | | | | | Fair Value Measurements | |
| | Amortized Cost | | | Unrealized Gains | | | Unrealized Losses | | | Estimated Fair Value | | | Level 1 | | | Level 2 | |
Commercial paper | | $ | 7,720 | | | $ | 9 | | | $ | — | | | $ | 7,729 | | | $ | — | | | $ | 7,729 | |
Certificates of deposit | | | 3,716 | | | | 4 | | | | — | | | | 3,720 | | | | — | | | | 3,720 | |
U.S. Treasury securities | | | 23,036 | | | | 3 | | | | (56 | ) | | | 22,983 | | | | 22,983 | | | | — | |
U.S. agency securities | | | 3,423 | | | | — | | | | (4 | ) | | | 3,419 | | | | — | | | | 3,419 | |
Corporate debt securities | | | 11,538 | | | | 12 | | | | (10 | ) | | | 11,540 | | | | — | | | | 11,540 | |
Total investments AFS | | $ | 49,433 | | | $ | 28 | | | $ | (70 | ) | | $ | 49,391 | | | $ | 22,983 | | | $ | 26,408 | |
The Company obtains the fair value from third-party pricing services. The pricing services utilize industry standard valuation models, including both income and market-based approaches and observable market inputs to determine value. These observable market inputs include reportable trades, benchmark yields, credit spreads, broker/dealer quotes, bids, offers and other industry and economic events.
The Company assessed each debt security (see Note 1 for information on composition of the portfolio) in a gross unrealized loss position to determine whether the decline in fair value below amortized cost was a result of credit losses or other factors, whether the Company expects to recover the amortized cost of the debt security, the Company’s intent to sell and whether it is more-likely-than-not that the Company will not be required to sell the debt security before the recovery of the amortized cost basis. There has been no allowance for expected credit losses recorded for the years ended 2024, 2023 and 2022.
The following table shows the fair value of investments AFS by contractual maturity (dollars in thousands):
| | | | | | | | | | | | |
| | As of December 27, 2024 | |
| | Within one year | | | After one year through five years | | | Total | |
Commercial paper | | $ | 21,468 | | | $ | — | | | $ | 21,468 | |
Certificates of deposit | | | 1,997 | | | | — | | | | 1,997 | |
U.S. Treasury securities | | | 11,355 | | | | — | | | | 11,355 | |
Corporate debt securities | | | 51,515 | | | | — | | | | 51,515 | |
Total investments AFS | | $ | 86,335 | | | $ | — | | | $ | 86,335 | |
STAAR SURGICAL COMPANY AND SUBSIDIARIES
NOTES TO CONSOLIDATED FINANCIAL STATEMENTS (CONTINUED)
Note 2 — Investments Available for Sale (Continued)
During 2024, several of the Company’s investments AFS with an aggregate fair value of $1,314,000 were subject to early redemption. The Company recognized a gain upon redemption of $3,000 for the year ended 2024. During 2023 and 2022, two of the Company’s investments AFS were the subject of a downgraded credit rating. The Company sold its investments of $1,300,000 and $359,000 during 2023 and 2022, respectively, in aggregate securities following the downgrade. The Company recognized a realized loss upon sale of less than $1,000 for the years ended 2023 and 2022.
Note 3 — Accounts Receivable Trade, Net
Accounts receivable trade, net consisted of the following (in thousands):
| | | | | | | | |
| | 2024 | | | 2023 | |
Domestic | | $ | 2,661 | | | $ | 2,009 | |
Foreign | | | 75,268 | | | | 92,886 | |
Total accounts receivable trade, gross | | | 77,929 | | | | 94,895 | |
Less allowance for credit losses | | | (32 | ) | | | (191 | ) |
Total accounts receivable trade, net | | $ | 77,897 | | | $ | 94,704 | |
Note 4 — Inventories, Net
Inventories, net consisted of the following (in thousands):
| | | | | | | | |
| | 2024 | | | 2023 | |
Raw materials and purchased parts | | $ | 9,705 | | | $ | 9,766 | |
Work in process | | | 8,168 | | | | 5,722 | |
Finished goods | | | 26,710 | | | | 23,150 | |
Total inventories, gross | | | 44,583 | | | | 38,638 | |
Less inventory reserves | | | (1,278 | ) | | | (3,508 | ) |
Total inventories, net | | $ | 43,305 | | | $ | 35,130 | |
Note 5 — Prepayments, Deposits and Other Current Assets
Prepayments, deposits and other current assets consisted of the following (in thousands):
| | | | | | | | |
| | 2024 | | | 2023 | |
Prepayments and deposits | | $ | 7,887 | | | $ | 5,924 | |
Prepaid rent | | | 2,910 | | | | 292 | |
Prepaid insurance | | | 2,432 | | | | 2,314 | |
Prepaid marketing | | | 670 | | | | 2,141 | |
Consumption tax receivable | | | 6 | | | | 820 | |
Value added tax (VAT) receivable | | | 1,359 | | | | 2,456 | |
Other(1) | | | 980 | | | | 762 | |
Total prepayments, deposits and other current assets | | $ | 16,244 | | | $ | 14,709 | |
(1) No individual category in “other” exceeds 5% of the total prepayments, deposits and other current assets.
STAAR SURGICAL COMPANY AND SUBSIDIARIES
NOTES TO CONSOLIDATED FINANCIAL STATEMENTS (CONTINUED)
Note 6 — Property, Plant and Equipment, Net
Property, plant and equipment, net consisted of the following (in thousands):
| | | | | | | | |
| | 2024 | | | 2023 | |
Machinery and equipment | | $ | 46,113 | | | $ | 30,874 | |
Computer equipment and software | | | 12,976 | | | | 8,495 | |
Furniture and fixtures | | | 7,627 | | | | 4,122 | |
Leasehold improvements | | | 19,766 | | | | 10,780 | |
Construction in process | | | 32,014 | | | | 40,364 | |
Total property, plant and equipment, gross | | | 118,496 | | | | 94,635 | |
Less accumulated depreciation | | | (33,607 | ) | | | (27,800 | ) |
Total property, plant and equipment, net | | $ | 84,889 | | | $ | 66,835 | |
Construction in process primarily consists of the build out and validation of machinery and equipment.
The Company recorded depreciation expense in the following categories as follows (in thousands):
| | | | | | | | | | | | |
| | Years Ended | |
| | 2024 | | | 2023 | | | 2022 | |
Cost of sales | | $ | 2,518 | | | $ | 1,405 | | | $ | 1,167 | |
General and administrative | | | 2,917 | | | | 1,912 | | | | 1,943 | |
Selling and marketing | | | 626 | | | | 1,095 | | | | 630 | |
Research and development | | | 683 | | | | 548 | | | | 581 | |
Total depreciation expense | | $ | 6,744 | | | $ | 4,960 | | | $ | 4,321 | |
Loss on disposal of property, plant and equipment was as follows (in thousands):
| | | | | | | | | | | | |
| | Years Ended | |
| | 2024 | | | 2023 | | | 2022 | |
Loss on disposal of property, plant and equipment | | $ | 1,694 | | | $ | 73 | | | $ | 65 | |
The loss recognized for the year ended 2024 consisted primarily of an asset that is no longer in use and was recorded in selling and marketing expense on the Consolidated Statements of Operations.
Note 7 — Other Current Liabilities
Other current liabilities consisted of the following (in thousands):
| | | | | | | | |
| | 2024 | | | 2023 | |
Accrued salaries and wages | | $ | 16,140 | | | $ | 12,519 | |
Accrued bonuses | | | 1,300 | | | | 3,456 | |
Accrued insurance | | | 2,701 | | | | 2,315 | |
Income taxes payable | | | 6,547 | | | | 10,848 | |
Marketing obligations | | | 2,699 | | | | 1,874 | |
Other(1) | | | 13,700 | | | | 9,926 | |
Total other current liabilities | | $ | 43,087 | | | $ | 40,938 | |
(1) No individual category in “Other” exceeds 5% of the other current liabilities.
STAAR SURGICAL COMPANY AND SUBSIDIARIES
NOTES TO CONSOLIDATED FINANCIAL STATEMENTS (CONTINUED)
Note 8 — Leases
Finance Leases
The Company entered into finance leases primarily related to purchases of equipment used for manufacturing, furniture and computer-related equipment. These finance leases are two to five years in length and have fixed payment amounts for the term of the contract and have options to purchase the assets at the end of the lease term. Supplemental balance sheet information related to finance leases consisted of the following (dollars in thousands):
| | | | | | | | |
| | 2024 | | | 2023 | |
Computer equipment and software | | $ | 2 | | | $ | 6 | |
Furniture and fixtures | | | 475 | | | | 475 | |
Finance lease ROU assets, gross | | | 477 | | | | 481 | |
Less accumulated depreciation | | | (440 | ) | | | (298 | ) |
Finance lease ROU assets, net | | $ | 37 | | | $ | 183 | |
| | | | | | |
Current finance lease obligations | | $ | 42 | | | $ | 165 | |
Long-term finance lease obligations | | | — | | | | 42 | |
Total finance lease liability | | $ | 42 | | | $ | 207 | |
Weighted-average remaining lease term (in years) | | | 0.3 | | | | 1.3 | |
Weighted-average discount rate | | | 4.25 | % | | | 4.24 | % |
Supplemental cash flow information related to finance leases consisted of the following (in thousands):
| | | | | | | | | | | | |
| | Years Ended | |
| | 2024 | | | 2023 | | | 2022 | |
Amortization of finance lease ROU asset | | $ | 147 | | | $ | 151 | | | $ | 160 | |
Interest on finance lease liabilities | | | 6 | | | | 12 | | | | 17 | |
Cash paid for amounts included in the measurement of finance lease liabilities: | | | | | | | | | |
Operating cash flows | | | 6 | | | | 12 | | | | 17 | |
Financing cash flows | | | 165 | | | | 161 | | | | 126 | |
Operating Leases
The Company entered into operating leases primarily related to real property (office, manufacturing and warehouse facilities), automobiles and copiers. These operating leases are two to ten years in length with options to extend. The Company does not include any lease extensions in the initial valuation unless the Company was reasonably certain to extend the lease. Depending on the lease, there are those with fixed payment amounts for the entire length of the contract or payments which increase periodically as noted in the contract or increased at an inflation rate indicator. For operating leases that increase using an inflation rate indicator, the Company used the inflation rate at the time the lease was entered into for the length of the lease term.
STAAR SURGICAL COMPANY AND SUBSIDIARIES
NOTES TO CONSOLIDATED FINANCIAL STATEMENTS (CONTINUED)
Note 8 — Leases (Continued)
Operating Leases (Continued)
Supplemental balance sheet information related to operating leases consisted of the following (dollars in thousands):
| | | | | | | | |
| | 2024 | | | 2023 | |
Machinery and equipment | | $ | 758 | | | $ | 735 | |
Computer equipment and software | | | 446 | | | | 446 | |
Real property | | | 47,648 | | | | 40,869 | |
Operating lease ROU assets, gross | | | 48,852 | | | | 42,050 | |
Less accumulated depreciation | | | (12,002 | ) | | | (7,663 | ) |
Operating lease ROU assets, net | | $ | 36,850 | | | $ | 34,387 | |
| | | | | | |
Current operating lease obligations | | $ | 3,894 | | | $ | 4,202 | |
Long-term operation lease obligations | | | 34,807 | | | | 31,425 | |
Total operating lease liability | | $ | 38,701 | | | $ | 35,627 | |
Weighted-average remaining lease term (in years) | | | 7.1 | | | | 7.3 | |
Weighted-average discount rate | | | 5.98 | % | | | 5.48 | % |
Supplemental cash flow information related to operating leases was as follows (in thousands):
| | | | | | | | | | | | |
| | Years Ended | |
| | 2024 | | | 2023 | | | 2022 | |
Operating lease cost | | $ | 8,574 | | | $ | 5,239 | | | $ | 4,473 | |
Cash paid for amounts included in the measurement of operating lease liabilities: | | | | | | | | | |
Operating cash flows | | | 6,016 | | | | 4,875 | | | | 4,171 | |
ROU assets obtained in exchange for new operating lease liabilities | | | 8,385 | | | | 8,498 | | | | 2,860 | |
Future Maturities of Lease Liabilities
Estimated future maturities of lease liabilities under operating and finance leases having initial or remaining non-cancelable lease terms more than one year are as follows (in thousands):
| | | | | | | | |
Year Ended | | Operating Leases | | | Finance Leases | |
2025 | | $ | 6,449 | | | $ | 42 | |
2026 | | | 4,486 | | | | — | |
2027 | | | 7,047 | | | | — | |
2028 | | | 6,998 | | | | — | |
2029 | | | 7,078 | | | | — | |
Thereafter | | | 19,243 | | | | — | |
Total minimum lease payments, including interest | | $ | 51,301 | | | $ | 42 | |
Less amounts representing interest | | | (12,600 | ) | | | — | |
Total lease liability | | $ | 38,701 | | | $ | 42 | |
STAAR SURGICAL COMPANY AND SUBSIDIARIES
NOTES TO CONSOLIDATED FINANCIAL STATEMENTS (CONTINUED)
Note 9 — Income Taxes
Provision for Income Taxes
Income (loss) from continuing operations before provision for income taxes was as follows (in thousands):
| | | | | | | | | | | | |
| | Years Ended | |
| | 2024 | | | 2023 | | | 2022 | |
Domestic | | $ | (52,859 | ) | | $ | (46,388 | ) | | $ | (25,366 | ) |
Foreign | | | 43,807 | | | | 80,084 | | | | 70,918 | |
Income (loss) before income taxes | | $ | (9,052 | ) | | $ | 33,696 | | | $ | 45,552 | |
The provision for income taxes consisted of the following (in thousands):
| | | | | | | | | | | | |
| | Years Ended | |
| | 2024 | | | 2023 | | | 2022 | |
Current tax provision: | | | | | | | | | |
U.S. federal | | $ | — | | | $ | — | | | $ | — | |
State | | | 27 | | | | 21 | | | | — | |
Foreign | | | 7,539 | | | | 9,064 | | | | 8,141 | |
Total current provision | | | 7,566 | | | | 9,085 | | | | 8,141 | |
Deferred tax provision (benefit): | | | | | | | | | |
U.S. federal | | | 3,738 | | | | 3,306 | | | | (1,821 | ) |
State | | | 137 | | | | 12 | | | | 82 | |
Foreign | | | (285 | ) | | | (54 | ) | | | (515 | ) |
Total deferred provision (benefit) | | | 3,590 | | | | 3,264 | | | | (2,254 | ) |
Provision for income taxes | | $ | 11,156 | | | $ | 12,349 | | | $ | 5,887 | |
A reconciliation of the statutory U.S. federal tax rate to the Company’s effective tax rate was as follows (dollars in thousands):
| | | | | | | | | | | | |
| | Years Ended | |
| | 2024 | | | 2023 | | | 2022 | |
| | Amount | | | Amount | | | Amount | |
Income (loss) before income taxes | | $ | (9,052 | ) | | $ | 33,696 | | | $ | 45,552 | |
Income tax expense: | | | | | | | | | |
Taxes at federal statutory tax rate | | | (1,901 | ) | | | 7,076 | | | | 9,566 | |
State taxes, net of federal income tax benefit | | | (330 | ) | | | 440 | | | | 3,673 | |
Equity compensation | | | 2,237 | | | | 1,035 | | | | (331 | ) |
Foreign rate differential | | | (3,902 | ) | | | (7,611 | ) | | | (6,997 | ) |
Foreign income inclusion | | | 9,659 | | | | 16,922 | | | | 14,583 | |
Net operating loss adjustments | | | — | | | | — | | | | 532 | |
Valuation allowance | | | 4,060 | | | | (4,233 | ) | | | (15,560 | ) |
Tax credits | | | (277 | ) | | | (930 | ) | | | (39 | ) |
Return to provision adjustment | | | 100 | | | | (284 | ) | | | 314 | |
Uncertain tax positions | | | 1,450 | | | | — | | | | — | |
Non-deductible expenses | | | 163 | | | | 134 | | | | 108 | |
Other | | | (103 | ) | | | (200 | ) | | | 38 | |
Total income tax expense | | $ | 11,156 | | | $ | 12,349 | | | $ | 5,887 | |
Effective tax rate | | | (123.2 | )% | | | 36.6 | % | | | 12.9 | % |
STAAR SURGICAL COMPANY AND SUBSIDIARIES
NOTES TO CONSOLIDATED FINANCIAL STATEMENTS (CONTINUED)
Note 9 — Income Taxes (Continued)
Deferred Tax Assets and Liabilities
Deferred income taxes reflect the net tax effects of temporary differences between the carrying amounts of assets and liabilities for financial reporting purposes and the amounts used for income tax purposes. Significant components of the Company’s deferred tax assets (liabilities) were as follows (in thousands):
| | | | | | | | |
| | 2024 | | | 2023 | |
Deferred tax assets: | | | | | | |
Accrued expenses | | $ | 1,230 | | | $ | 1,435 | |
Stock-based compensation | | | 6,103 | | | | 4,010 | |
Operating lease liability | | | 6,466 | | | | 6,162 | |
Net operating loss and other credit carryforwards | | | 44,083 | | | | 44,998 | |
Other deferred tax assets | | | 2,776 | | | | 2,376 | |
Gross deferred tax assets | | | 60,658 | | | | 58,981 | |
Valuation allowance | | | (46,804 | ) | | | (42,744 | ) |
Total deferred tax assets | | $ | 13,854 | | | $ | 16,237 | |
Deferred tax liabilities: | | | | | | |
Property, plant, equipment and intangibles | | $ | (5,976 | ) | | $ | (4,222 | ) |
Operating lease ROU assets | | | (6,066 | ) | | | (6,019 | ) |
Foreign taxes | | | (1,321 | ) | | | (1,883 | ) |
Total deferred tax liabilities | | | (13,363 | ) | | | (12,124 | ) |
Total net deferred tax assets | | $ | 491 | | | $ | 4,113 | |
The ultimate realization of deferred tax assets is dependent upon future generation of income during the periods in which temporary differences representing net future deductible amounts become deductible. Management considers the projected future income and tax planning strategies in making this assessment. In addition, management considers all other available positive and negative evidence in its analysis. This includes existing profits in foreign jurisdiction as well as projected future profits. Under the incremental cash tax savings approach, the total net deferred assets represent the Company’s net cash tax savings and benefit at December 27, 2024.
Under the incremental cash tax savings approach, the deferred tax asset valuation allowance activity was as follows (in thousands):
| | | | | | | | | | | | |
| | Years Ended | |
| | 2024 | | | 2023 | | | 2022 | |
Balance at beginning of period | | $ | (42,744 | ) | | $ | (46,977 | ) | | $ | (62,860 | ) |
Release (recapture) due to incremental cash tax savings | | | (4,456 | ) | | | (3,318 | ) | | | 910 | |
Current year change due to deferred tax asset realization | | | 396 | | | | 7,551 | | | | 14,973 | |
Balance at end of period | | $ | (46,804 | ) | | $ | (42,744 | ) | | $ | (46,977 | ) |
As of December 27, 2024, the Company had U.S. net operating loss (“NOL”) carryforwards consisting of the following (in thousands):
| | | | | | |
| | 2024 | | | Expiration Date |
Pre-2018 federal NOL carryforwards | | $ | 49,783 | | | will begin to expire in 2027 |
Post-2018 federal NOL carryforwards | | | 124,895 | | | indefinite |
State NOL carryforwards | | | 54,184 | | | will begin to expire in 2025 |
Post-2020 State NOL carryforwards that follow the federal NOL | | | 2,297 | | | indefinite |
STAAR SURGICAL COMPANY AND SUBSIDIARIES
NOTES TO CONSOLIDATED FINANCIAL STATEMENTS (CONTINUED)
Note 9 — Income Taxes (Continued)
Deferred Tax Assets and Liabilities (Continued)
As of December 27, 2024, the Company had U.S. tax credit carryforwards consisting of the following (in thousands):
| | | | | | |
| | 2024 | | | Expiration Date |
Federal credit carryforwards | | $ | 2,056 | | | will begin to expire in 2030 |
State research tax credit carryforwards | | | 916 | | | indefinite |
Federal foreign tax credit carryforwards | | | 2,013 | | | will begin to expire in 2028 |
The Company files income tax returns in the U.S. federal, various states and foreign jurisdictions. In the normal course of business, the Company is subject to examination by taxing authorities throughout the world. The following tax years remain subject to examination:
| | |
Significant jurisdictions | | Open Years |
U.S. Federal | | 2021 – 2023 |
U.S. States | | 2020 – 2023 |
Foreign | | 2020 – 2023 |
In various jurisdictions, years prior to 2020 remain open solely for the purposes of examination of the Company’s NOL and credit carryforwards.
Tax Holiday
The Company operates under a tax holiday in Switzerland from 2020 through 2029, which consists of two consecutive five year periods: 2020 - 2024 and 2025 - 2029. The tax holiday is conditional upon the Company meeting specific activity and investment requirements as outlined by the Swiss Tax Authorities. The impact of this tax holiday is as follows (in thousands, except per share amounts):
| | | | | | | | | | | | |
| | Years Ended | |
| | 2024 | | | 2023 | | | 2022 | |
Tax impact related to tax holidays | | $ | 4,466 | | | $ | 8,683 | | | $ | 7,394 | |
Impact of tax holidays on diluted earnings (loss) per share | | $ | 0.09 | | | $ | 0.17 | | | $ | 0.15 | |
Uncertain Tax Benefits
A reconciliation of the beginning and ending amount of unrecognized tax benefits, exclusive of interest, are included in other current liabilities as income taxes payable, is as follows (in thousands):
| | | | |
| | Year Ended | |
| | 2024 | |
Balance at beginning of period | | $ | — | |
Increases (decreases) - tax positions in prior period | | | 910 | |
Increases (decreases) - tax positions in current period | | | — | |
Balance at end of period | | $ | 910 | |
Interest of $540,000 was recognized for the year ended 2024 related to the 2024 uncertain tax positions. The Company expects a reduction of these uncertain tax positions within the next twelve months. There were no uncertain tax positions in 2023 or 2022.
STAAR SURGICAL COMPANY AND SUBSIDIARIES
NOTES TO CONSOLIDATED FINANCIAL STATEMENTS (CONTINUED)
Note 10 – Employee Benefit Plans
Defined Benefit Plan – Switzerland
The Company maintains a passive pension plan (the “Swiss Plan”) covering employees of STAAR AG, which is accounted for as a defined benefit plan.
In Switzerland employers are required to provide a minimum pension plan for their staff. Contributions of both the employees and employer finance the Swiss Plan. The amount of the contributions is defined by the plan regulations and cannot be decreased without amending the plan regulations. It is required that the employer contribute an amount equal to or greater than the employee contribution.
The following table shows the changes in the benefit obligation and plan assets and the Swiss Plan’s funded status (in thousands):
| | | | | | | | |
| | 2024 | | | 2023 | |
Change in Projected Benefit Obligation: | | | | | | |
Projected benefit obligation, beginning of period | | $ | 21,965 | | | $ | 21,463 | |
Service cost | | | 1,233 | | | | 916 | |
Interest cost | | | 340 | | | | 413 | |
Participant contributions | | | 979 | | | | 863 | |
Benefits deposited (paid) | | | (851 | ) | | | (7,101 | ) |
Actuarial (gain) loss | | | 692 | | | | 5,411 | |
Prior service credit | | | (313 | ) | | | — | |
Projected benefit obligation, end of period | | $ | 24,045 | | | $ | 21,965 | |
Change in Plan Assets: | | | | | | |
Plan assets at fair value, beginning of period | | $ | 17,381 | | | $ | 20,709 | |
Actual return on plan assets (including foreign currency impact) | | | (942 | ) | | | 1,922 | |
Employer contributions | | | 1,123 | | | | 988 | |
Participant contributions | | | 979 | | | | 863 | |
Benefits deposited (paid) | | | (851 | ) | | | (7,101 | ) |
Plan assets at fair value, end of period | | $ | 17,690 | | | $ | 17,381 | |
Funded status (pension liability), end of year(1) | | $ | (6,355 | ) | | $ | (4,584 | ) |
Amount Recognized in Accumulated Other Comprehensive Income
(Loss), net of tax: | | | | | | |
Actuarial loss on plan assets | | $ | (1,364 | ) | | $ | (38 | ) |
Actuarial loss on benefit obligation | | | (5,997 | ) | | | (5,378 | ) |
Actuarial gain recognized in current year | | | 1,952 | | | | 1,849 | |
Prior service credit | | | 1,242 | | | | 1,122 | |
Effect of curtailments | | | 610 | | | | 610 | |
Accumulated other comprehensive income (loss) | | $ | (3,557 | ) | | $ | (1,835 | ) |
Accumulated benefit obligation at year end | | $ | (22,540 | ) | | $ | (20,729 | ) |
(1) The underfunded balance was included in pension liability on the Consolidated Balance Sheets.
STAAR SURGICAL COMPANY AND SUBSIDIARIES
NOTES TO CONSOLIDATED FINANCIAL STATEMENTS (CONTINUED)
Note 10 – Employee Benefit Plans (Continued)
Defined Benefit Plan – Switzerland (Continued)
Net periodic pension cost associated with the Swiss Plan included the following components (in thousands):
| | | | | | | | | | | | |
| | Years Ended | |
| | 2024 | | | 2023 | | | 2022 | |
Service cost(1) | | $ | 1,233 | | | $ | 916 | | | $ | 1,133 | |
Interest cost(2) | | | 340 | | | | 413 | | | | 82 | |
Expected return on plan assets(2) | | | (540 | ) | | | (452 | ) | | | (494 | ) |
Prior service credit(2),(3) | | | (179 | ) | | | (179 | ) | | | (179 | ) |
Actuarial loss recognized in current period(2),(3) | | | 117 | | | | — | | | | 390 | |
Net periodic pension cost | | $ | 971 | | | $ | 698 | | | $ | 932 | |
(1) Recognized in selling general and administrative expenses on the Consolidated Statements of Operations.
(2) Recognized in other income, net, on the Consolidated Statements of Operations.
(3) Amounts reclassified from accumulated other comprehensive income (loss).
Changes in other comprehensive income (loss), net of tax, associated with the Swiss Plan included the following components (in thousands):
| | | | | | | | | | | | |
| | Years Ended | |
| | 2024 | | | 2023 | | | 2022 | |
Current year actuarial gain (loss) on plan assets | | $ | (1,326 | ) | | $ | 1,316 | | | $ | (432 | ) |
Current year actuarial gain (loss) on benefit obligation | | | (619 | ) | | | (4,847 | ) | | | 6,251 | |
Actuarial gain recorded in current year | | | 103 | | | | 2 | | | | 348 | |
Prior service credit | | | 120 | | | | (161 | ) | | | (160 | ) |
Change in other comprehensive gain (loss) | | $ | (1,722 | ) | | $ | (3,690 | ) | | $ | 6,007 | |
Net periodic pension cost and projected and accumulated pension obligation for the Company’s Swiss Plan were calculated using the following assumptions:
| | | | | | | | |
| | 2024 | | | 2023 | |
Discount rate | | | 1.0 | % | | | 1.5 | % |
Salary increases | | | 2.5 | % | | | 2.5 | % |
Expected return on plan assets | | | 3.0 | % | | | 3.0 | % |
Expected average remaining working lives in years | | | 9.8 | | | | 9.5 | |
The discount rates are based on an assumed duration of the pension obligations and estimated using the rates of returns for AAA and AA-rated Swiss and foreign CHF-denominated corporate bonds listed on the SIX Swiss Exchange. The salary increase rate was based on the Company’s best estimate of future increases over time. The expected long-term rate of return on plan assets is based on the expected asset allocation and assumptions concerning long-term interest rates, inflation rates, and risk premiums for equities above the risk-free rates of return. These assumptions take into consideration historical long-term rates of return for relevant asset categories.
Under Swiss law, pension funds are legally independent from the employer and all the contributions are invested with regulated entities. The Company has a contract with Allianz Suisse Life Insurance Company’s BVG Collective Foundation (the “Foundation”) to manage its Swiss pension fund. Multiple employers contract with the Foundation to manage the employers’ respective pension plans. The Foundation manages the pension plans of its contracted employers as a collective entity. The investment strategy is determined by the Foundation and applies to all members of the collective Foundation. There are no separate financial statements for each employer contract. The pension plan assets of all the employers that contract with the Foundation are comingled. They are considered multiple-employer plans and therefore accounted for as single-employer plans.
STAAR SURGICAL COMPANY AND SUBSIDIARIES
NOTES TO CONSOLIDATED FINANCIAL STATEMENTS (CONTINUED)
Note 10 – Employee Benefit Plans (Continued)
Defined Benefit Plan – Switzerland (Continued)
As there are no separate financial statements for each employer contract, there are no individual investments that can be directly attributed to the Company’s pension plan assets. However, the funds contributed by an employer are specifically earmarked for its employees and the total assets of the plan allocable to Company’s employees are separately tracked by the Foundation. The lack of visibility into the specific investments of the plan assets and how they are valued is a significant unobservable input, therefore, the Company considers the plan assets collectively to be Level 3 assets under the fair value hierarchy.
The table below sets forth the fair value of Plan assets at December 27, 2024 and December 29, 2023, and the related activity in years ended 2024 and 2023 (in thousands):
| | | | |
| | Insurance
Contracts
(Level 3) | |
Ending balance at December 30, 2022 | | $ | 20,709 | |
Actual return on plan assets | | | 1,922 | |
Purchases, sales, and settlement | | | (5,250 | ) |
Ending balance at December 29, 2023 | | $ | 17,381 | |
Actual return on plan assets | | | (942 | ) |
Purchases, sales, and settlement | | | 1,251 | |
Ending balance at December 27, 2024 | | $ | 17,690 | |
During fiscal year 2025, the Company expects to make cash contributions totaling approximately $1,224,000 to the Swiss Plan.
The estimated future benefit payments for the Swiss Plan are as follows (in thousands):
| | | | |
Year Ended | | Amount | |
2025 | | $ | 80 | |
2026 | | | 107 | |
2027 | | | 131 | |
2028 | | | 3,681 | |
2029 | | | 334 | |
Thereafter | | | 2,022 | |
Total | | $ | 6,355 | |
Defined Benefit Plan-Japan
STAAR Japan maintains a noncontributory defined benefit pension plan (“Japan Plan”) substantially covering all the employees of STAAR Japan. Benefits under the Japan Plan are earned, vested, and accumulated based on a point-system, primarily based on the combination of years of service, actual and expected future grades (management or non-management) and actual and future zone (performance) levels of the employees. Each point earned is worth a fixed monetary value, 1,000 Yen per point, regardless of the level grade or zone of the employee. Gross benefits are calculated based on the cumulative number of points earned over the service period multiplied by 1,000 Yen. The mandatory retirement age limit is 60 years old.
STAAR Japan administers the pension plan and funds the obligations of the Japan Plan from STAAR Japan’s operating cash flows. STAAR Japan is not required, and does not intend, to provide contributions to the Plan to meet benefit obligations and therefore does not have any plan assets. Benefit payments are made to beneficiaries as they become due.
STAAR SURGICAL COMPANY AND SUBSIDIARIES
NOTES TO CONSOLIDATED FINANCIAL STATEMENTS (CONTINUED)
Note 10 – Employee Benefit Plans (Continued)
Defined Benefit Plan-Japan (Continued)
The funded status of the benefit plan was as follows (in thousands):
| | | | | | | | |
| | 2024 | | | 2023 | |
Change in Projected Benefit Obligation: | | | | | | |
Projected benefit obligation, beginning of period | | $ | 471 | | | $ | 1,181 | |
Service cost | | | 56 | | | | 60 | |
Interest cost | | | 3 | | | | 3 | |
Actuarial (gain) loss | | | (40 | ) | | | 8 | |
Benefits paid | | | (60 | ) | | | (705 | ) |
Foreign exchange adjustment | | | (48 | ) | | | (76 | ) |
Projected benefit obligation, end of period | | $ | 382 | | | $ | 471 | |
Change in Plan Assets: | | | | | | |
Plan assets at fair value, beginning of period | | $ | — | | | $ | — | |
Actual return on plan assets | | | — | | | | — | |
Employer contributions | | | — | | | | — | |
Benefits paid | | | — | | | | — | |
Distribution of plan assets | | | — | | | | — | |
Foreign exchange adjustment | | | — | | | | — | |
Plan assets at fair value, end of period | | $ | — | | | $ | — | |
Funded status (pension liability), end of year(1) | | $ | (382 | ) | | $ | (471 | ) |
Amount Recognized in Accumulated Other Comprehensive Income
(Loss), net of tax: | | | | | | |
Actuarial loss | | $ | (25 | ) | | $ | (28 | ) |
Prior service cost | | | 3 | | | | 3 | |
Settlement | | | (102 | ) | | | (106 | ) |
Curtailment | | | (2 | ) | | | (2 | ) |
Net gain (loss) | | | 193 | | | | 189 | |
Accumulated other comprehensive income | | $ | 67 | | | $ | 56 | |
Accumulated benefit obligation at year end | | $ | (368 | ) | | $ | (446 | ) |
(1) The underfunded balance was included in pension liability on the Consolidated Balance Sheets.
Net periodic pension cost associated with the Japan Plan included the following components (in thousands):
| | | | | | | | | | | | |
| | Years Ended | |
| | 2024 | | | 2023 | | | 2022 | |
Service cost(1) | | $ | 56 | | | $ | 60 | | | $ | 116 | |
Interest cost(2) | | | 3 | | | | 3 | | | | 2 | |
Prior service credit(2),(3) | | | (5 | ) | | | (14 | ) | | | (24 | ) |
Settlement gain(2),(3) | | | (10 | ) | | | (160 | ) | | | — | |
Curtailment gain(2),(3) | | | — | | | | (4 | ) | | | — | |
Net periodic pension cost | | $ | 44 | | | $ | (115 | ) | | $ | 94 | |
(1) Recognized in selling general and administrative expenses on the Consolidated Statements of Operations.
(2) Recognized in other income, net, on the Consolidated Statements of Operations.
(3) Amounts reclassified from accumulated other comprehensive income (loss).
STAAR SURGICAL COMPANY AND SUBSIDIARIES
NOTES TO CONSOLIDATED FINANCIAL STATEMENTS (CONTINUED)
Note 10 – Employee Benefit Plans (Continued)
Defined Benefit Plan-Japan (Continued)
Changes in other comprehensive income (loss), net of tax, associated with the Japan Plan include the following components (in thousands):
| | | | | | | | | | | | |
| | Years Ended | |
| | 2024 | | | 2023 | | | 2022 | |
Amortization of actuarial loss | | $ | 3 | | | $ | 2 | | | $ | 5 | |
Prior service cost | | | — | | | | (1 | ) | | | (2 | ) |
Actuarial income (loss) recorded in current year | | | 4 | | | | (21 | ) | | | (11 | ) |
Settlement | | | 4 | | | | (106 | ) | | | — | |
Curtailment loss | | | — | | | | (2 | ) | | | — | |
Change in other comprehensive income (loss) | | $ | 11 | | | $ | (128 | ) | | $ | (8 | ) |
Net periodic pension cost and projected and accumulated pension obligation for the Company’s Japan Plan were calculated using the following assumptions:
| | | | | | | | |
| | 2024 | | | 2023 | |
Discount rate | | | 0.9 | % | | | 0.8 | % |
Salary increases | | | 5.0 | % | | | 4.8 | % |
Expected return on plan assets | | N/A | | | N/A | |
Expected average remaining working lives in years | | | 4.9 | | | | 6.0 | |
The discount rates are based on the yield curve of corporate bonds rated AA or higher. The salary increase average rate was based on the Company’s best estimate of future increases over time.
The estimated future benefit payments for the Japan Plan are as follows (in thousands):
| | | | |
Year Ended | | Amount | |
2025 | | $ | 57 | |
2026 | | | 58 | |
2027 | | | 57 | |
2028 | | | 64 | |
2029 | | | 92 | |
Thereafter | | | 54 | |
Total | | $ | 382 | |
Defined Contribution Plan
The Company has a 401(k) profit sharing plan (“401(k) Plan”) for the benefit of qualified employees in the U.S. During the year ended December 27, 2024, employees who participate may elect to make salary deferral contributions to the 401(k) Plan up to $23,000 of the employees’ eligible payroll subject to annual Internal Revenue Code maximum limitations (with a $7,500 annual catch-up contribution permitted for those over 50 years old). The Company’s contribution percentage is 80% of the employee’s contribution up to the first 6% of the employee’s compensation. In addition, STAAR may make a discretionary contribution to qualified employees, in accordance with the 401(k) Plan. The Company’s contributions, net of forfeitures, to the 401(k) Plan were as follows (in thousands):
| | | | | | | | | | | | |
| | Years Ended | |
| | 2024 | | | 2023 | | | 2022 | |
Employer contributions, net of forfeitures | | $ | 3,379 | | | $ | 2,720 | | | $ | 2,004 | |
STAAR SURGICAL COMPANY AND SUBSIDIARIES
NOTES TO CONSOLIDATED FINANCIAL STATEMENTS (CONTINUED)
Note 11 — Stockholders’ Equity
Incentive Plan
The Company maintains an Amended and Restated Omnibus Equity Incentive Plan, as amended (the “Equity Plan”). The Equity Plan allows for awards of stock options, stock appreciation rights, restricted stock, RSUs, and other stock- and cash-based awards, including awards that are subject to service-based and performance-based vesting conditions. As of December 27, 2024, the Company had outstanding grants of stock options, restricted stock awards, RSUs and PSUs.
Stock options granted under the Equity Plan are granted at fair market value on the date of grant, become exercisable generally over a three-year period, or as determined by the Board, and expire over periods not exceeding 10 years from the date of grant. Certain stock options and stock-based awards provide for accelerated vesting if there is a change in control and pre-established financial metrics are met (as defined in the Equity Plan). Grants of restricted stock outstanding under the Equity Plan generally vest over periods of one to three years. Grants of RSUs and PSUs outstanding under the Equity Plan generally vest based on service, performance, or a combination of both. On June 15, 2023, the Company’s stockholders approved a proposal to increase the number of shares that may be issued pursuant to stock-based awards granted under the Equity Plan, which increased the share pool by 2,170,000 shares. On June 19, 2024, the Company’s stockholders approved a proposal to increase the number of shares that may be issued pursuant to stock-based awards granted under the Equity Plan, which increased the share pool by 2,600,000 shares. As a result of such increases, a total of 22,805,000 shares may be issued pursuant to stock-based awards granted under the Equity Plan. As of December 27, 2024, there were 3,438,028 shares available for grants of stock-based awards under the Equity Plan.
Stock-Based Compensation
The following table represents the fair value of stock-based compensation granted during the year ended 2024 (in thousands):
| | | | |
| | Fair Value | |
Stock options | | $ | 13,522 | |
RSUs | | | 17,496 | |
PSUs | | | 14,665 | |
Restricted stock | | | 703 | |
Total stock-based compensation expense | | $ | 46,386 | |
The Company recorded stock-based compensation expense by award as follows (in thousands):
| | | | | | | | | | | | |
| | Years Ended | |
| | 2024 | | | 2023 | | | 2022 | |
Employee stock options | | $ | 13,824 | | | $ | 12,842 | | | $ | 10,403 | |
Restricted stock | | | 512 | | | | 548 | | | | 686 | |
RSUs | | | 11,739 | | | | 7,987 | | | | 4,512 | |
PSUs | | | 568 | | | | 1,270 | | | | 3,525 | |
Nonemployee stock options | | | 567 | | | | 869 | | | | 1,245 | |
Total stock-based compensation expense | | $ | 27,210 | | | $ | 23,516 | | | $ | 20,371 | |
The Company recorded stock-based compensation expense in the following categories (in thousands):
| | | | | | | | | | | | |
| | Years Ended | |
| | 2024 | | | 2023 | | | 2022 | |
Cost of sales | | $ | 1,192 | | | $ | 716 | | | $ | 501 | |
General and administrative | | | 14,122 | | | | 12,125 | | | | 9,402 | |
Selling and marketing | | | 4,583 | | | | 4,083 | | | | 4,795 | |
Research and development | | | 7,313 | | | | 6,592 | | | | 5,673 | |
Total stock-based compensation expense, net | | | 27,210 | | | | 23,516 | | | | 20,371 | |
Amounts capitalized as part of inventory | | | 1,408 | | | | 1,672 | | | | 1,881 | |
Total stock-based compensation expense, gross | | $ | 28,618 | | | $ | 25,188 | | | $ | 22,252 | |
STAAR SURGICAL COMPANY AND SUBSIDIARIES
NOTES TO CONSOLIDATED FINANCIAL STATEMENTS (CONTINUED)
Note 11 — Stockholders’ Equity (Continued)
Stock-Based Compensation (Continued)
As of December 27, 2024, total unrecognized compensation cost related to non-vested stock-based compensation arrangements granted under the Equity Plan were as follows (in thousands):
| | | | |
| | 2024 | |
Stock options | | $ | 18,474 | |
Restricted stock, RSUs and PSUs | | | 20,512 | |
Total unrecognized stock-based compensation cost | | $ | 38,986 | |
This cost is expected to be recognized over a weighted-average period of approximately two years.
Assumptions
The fair value of each stock option award is estimated on the date of grant using a Black-Scholes option valuation model applying the weighted-average assumptions noted in the following table. Expected volatilities are based on historical volatility of the Company’s stock. The expected term of stock options granted is derived from the historical exercises and post-vesting cancellations, and represents the period of time that stock options granted are expected to be outstanding. The Company has calculated a 8% estimated forfeiture rate based on historical forfeiture experience. The risk-free rate is based on the U.S. Treasury yield curve corresponding to the expected term at the time of the grant.
| | | | | | | | | | | | |
| | Years Ended | |
| | 2024 | | | 2023 | | | 2022 | |
Expected dividend yield | | | 0 | % | | | 0 | % | | | 0 | % |
Expected volatility | | | 59 | % | | | 60 | % | | | 54 | % |
Risk-free interest rate | | | 4.17 | % | | | 3.98 | % | | | 2.09 | % |
Expected term (in years) | | | 5.29 | | | | 5.05 | | | | 5.10 | |
Stock Options
A summary of stock option activity under the Equity Plan for the year ended December 27, 2024 was as follows:
| | | | | | | | | | | | | | | | |
| | Shares
(in 000’s) | | | Weighted-Average Exercise Price | | | Weighted-Average Remaining Contractual Term (years) | | | Aggregate Intrinsic Value (in 000’s) | |
Outstanding at December 29, 2023 | | | 2,630 | | | $ | 46.38 | | | | | | | |
Granted | | | 640 | | | | 37.81 | | | | | | | |
Exercised | | | (315 | ) | | | 23.52 | | | | | | | |
Forfeited or expired | | | (147 | ) | | | 70.43 | | | | | | | |
Outstanding at December 27, 2024 | | | 2,808 | | | $ | 45.72 | | | | 6.59 | | | $ | 3,961 | |
Exercisable at December 27, 2024 | | | 1,826 | | | $ | 47.03 | | | | 5.38 | | | $ | 3,961 | |
STAAR SURGICAL COMPANY AND SUBSIDIARIES
NOTES TO CONSOLIDATED FINANCIAL STATEMENTS (CONTINUED)
Note 11 — Stockholders’ Equity (Continued)
Stock Options (Continued)
A summary of unvested stock options activity under the Equity Plan for the year ended December 27, 2024 was as follows:
| | | | | | | | |
| | Shares
(in 000’s) | | | Weighted-Average Grant-Date Fair Value | |
Unvested at December 29, 2023 | | | 926 | | | $ | 30.09 | |
Granted | | | 640 | | | | 21.12 | |
Forfeited or expired | | | (147 | ) | | | 34.39 | |
Vested | | | (437 | ) | | | 29.66 | |
Unvested at December 27, 2024 | | | 982 | | | $ | 23.62 | |
The weighted average grant date fair value of stock options granted under the Equity Plan and the total intrinsic value of stock options exercised were as follows:
| | | | | | | | | | | | |
| | Years Ended | |
| | 2024 | | | 2023 | | | 2022 | |
Weighted-average grant-date fair value | | $ | 21.12 | | | $ | 28.36 | | | $ | 35.68 | |
Intrinsic value of options exercised (in thousands) | | $ | 4,150 | | | $ | 17,041 | | | $ | 25,000 | |
Restricted Stock, Restricted Stock Units and Performance Stock Units
A summary of restricted stock, RSU and PSU activity under the Equity Plan for the year ended December 27, 2024 was as follows:
| | | | | | | | | | | | | | | | | | | | | | | | |
| | Restricted Stock | | | Restricted Stock Units | | | Performance Stock Units | |
| | Units
(in 000’s) | | | Weighted-Average Grant-Date Fair Value | | | Units
(in 000’s) | | | Weighted-Average Grant-Date Fair Value | | | Units
(in 000’s) | | | Weighted-Average Grant-Date Fair Value | |
Outstanding at December 29, 2023 | | | 14 | | | $ | 47.61 | | | | 401 | | | $ | 55.75 | | | | 56 | | | $ | 74.80 | |
Granted | | | 17 | | | | 39.84 | | | | 464 | | | | 37.72 | | | | 390 | | | | 37.64 | |
Vested | | | (10 | ) | | | 46.88 | | | | (149 | ) | | | 58.56 | | | | (24 | ) | | | 74.80 | |
Forfeited | | | (5 | ) | | | 52.67 | | | | (21 | ) | | | 47.20 | | | | (16 | ) | | | 52.76 | |
Outstanding at December 27, 2024 | | | 16 | | | $ | 40.11 | | | | 695 | | | $ | 43.33 | | | | 406 | | | $ | 39.99 | |
The weighted average grant date fair value of restricted stock, RSU and PSU awards granted under the Equity Plan and the total fair value of awards vested were as follows:
| | | | | | | | | | | | |
| | Years Ended | |
| | 2024 | | | 2023 | | | 2022 | |
Weighted-average grant-date fair value | | $ | 37.73 | | | $ | 52.98 | | | $ | 74.98 | |
Fair value of awards vested (in thousands) | | $ | 6,283 | | | $ | 7,715 | | | $ | 5,023 | |
STAAR SURGICAL COMPANY AND SUBSIDIARIES
NOTES TO CONSOLIDATED FINANCIAL STATEMENTS (CONTINUED)
Note 12 — Commitments and Contingencies
Asset Retirement Obligation
The Company recorded certain Asset Retirement Obligations (“ARO”), in connection with the Company’s obligation to return its Japan facility to its “original condition,” as defined in the lease agreements. The Company has recorded approximately $42,000 and $103,000, representing the fair value of the ARO liability obligations in noncurrent liabilities at December 27, 2024 and December 29, 2023, respectively. These leases expire in 2025 and 2029.
Open Purchase Orders
As of December 27, 2024, there were open purchase orders of $12,948,000.
Severance Paid
For 2023 and 2022, the Company recognized expense of $1,392,000 and $297,000 for one-time employee benefits paid to certain employees in STAAR Japan who worked primarily in cataract IOL sales. These one-time employee benefits were recognized in general and administrative expense on the Consolidated Statements of Operations.
Indemnification Agreements
The Company has entered into indemnification agreements with its directors and officers that may require the Company: (a) to indemnify them against liabilities that may arise by reason of their status or service as directors or officers, except as prohibited by applicable law; (b) to advance their expenses incurred as a result of any proceeding against them as to which they could be indemnified; and (c) to make a good faith determination whether or not it is practicable for the Company to obtain directors’ and officers’ insurance. The Company currently has directors’ and officers’ liability insurance through a third-party carrier. Also, in connection with the sale of products and entering into business relationships in the ordinary course of business, the Company may make representations affirming, among other things, that its products do not infringe on the intellectual property rights of others and agrees to indemnify customers against third-party claims for such infringement as well as its negligence. The Company has not been required to make material payments under such provisions.
Tax Filings
The Company’s tax filings are subject to audit by taxing authorities in jurisdictions where it conducts business. These audits may result in assessments of additional taxes that are subsequently resolved with the authorities or potentially through the courts. Management believes the Company has adequately provided for taxes; however, final assessments, if any, could be significantly different than the amounts recorded in the Consolidated Financial Statements.
Employment Agreements
The Company’s Chief Executive Officer entered into an employment agreement with the Company, effective January 1, 2023. He and certain officers have as provisions of their agreements certain rights, including continuance of cash compensation and benefits, upon a “change in control,” which may include an acquisition of substantially all the Company’s assets, or termination “without cause or for good reason” as defined in the applicable agreements.
Litigation and Claims
From time to time, the Company is involved in various legal proceedings and other matters arising in the normal course of business. These legal proceedings and other matters may relate to, among other things, contractual rights and obligations, employment matters, or claims of product liability. STAAR maintains insurance coverage for various matters, including product liability and certain securities claims. While the Company does not believe that any of the claims known is likely to have a material adverse effect on the Company’s financial condition or results of operations, new claims or unexpected results of existing claims could lead to significant financial harm.
STAAR SURGICAL COMPANY AND SUBSIDIARIES
NOTES TO CONSOLIDATED FINANCIAL STATEMENTS (CONTINUED)
Note 13 — Related Party Transactions
The Company has made various advances to certain non-executive employees. Amounts due from employees are included in prepayments, deposits, and other current assets were as follows (in thousands):
| | | | | | | | |
| | 2024 | | | 2023 | |
Due from employees | | $ | 3 | | | $ | — | |
Note 14 — Supplemental Disclosure of Cash Flow Information
The Company’s non-cash investing and financing activities, and cash paid were as follows (in thousands):
| | | | | | | | | | | | |
| | Years Ended | |
| | 2024 | | | 2023 | | | 2022 | |
Non-cash investing and financing activities: | | | | | | | | | |
Purchase of property and equipment included in accounts payable | | $ | 3,118 | | | $ | 2,768 | | | $ | 1,314 | |
Cash paid: | | | | | | | | | |
Interest | | $ | 87 | | | $ | 75 | | | $ | 52 | |
Taxes | | $ | 10,978 | | | $ | 2,844 | | | $ | 6,633 | |
Note 15 — Basic and Diluted Net Income (Loss) Per Share
The following table sets forth the computation of basic and diluted net income (loss) per share (in thousands except per share amounts):
| | | | | | | | | | | | |
| | Years Ended | |
| | 2024 | | | 2023 | | | 2022 | |
Numerator: | | | | | | | | | |
Net income (loss) | | $ | (20,208 | ) | | $ | 21,347 | | | $ | 39,665 | |
Denominator: | | | | | | | | | |
Weighted average common shares outstanding | | | 49,125 | | | | 48,523 | | | | 47,991 | |
Less: Unvested restricted stock | | | — | | | | — | | | | (4 | ) |
Weighted average common shares outstanding for basic | | | 49,125 | | | | 48,523 | | | | 47,987 | |
Dilutive potential common stock outstanding: | | | | | | | | | |
Stock options | | | — | | | | 813 | | | | 1,310 | |
Unvested restricted stock | | | — | | | | 3 | | | | 2 | |
RSUs | | | — | | | | 56 | | | | 55 | |
PSUs | | | — | | | | 32 | | | | 26 | |
Weighted average common shares outstanding for diluted | | | 49,125 | | | | 49,427 | | | | 49,380 | |
Net income (loss) per share: | | | | | | | | | |
Basic | | $ | (0.41 | ) | | $ | 0.44 | | | $ | 0.83 | |
Diluted | | $ | (0.41 | ) | | $ | 0.43 | | | $ | 0.80 | |
Because the Company had a net loss for 2024, the number of diluted shares is equal to the number of basic shares. The following table sets forth (in thousands) the weighted average number of options to purchase shares of common stock, restricted stock, RSUs and PSUs with either exercise prices or unrecognized compensation cost per share greater than the average market price per share of the Company’s common stock, which were not included in the calculation of diluted per share amounts because the effects would be anti-dilutive.
| | | | | | | | | | | | |
| | Years Ended | |
| | 2024 | | | 2023 | | | 2022 | |
Stock options | | | 4,166 | | | | 2,073 | | | | 933 | |
Restricted stock, RSUs and PSUs | | | 212 | | | | 32 | | | | 18 | |
Total | | | 4,378 | | | | 2,105 | | | | 951 | |
STAAR SURGICAL COMPANY AND SUBSIDIARIES
NOTES TO CONSOLIDATED FINANCIAL STATEMENTS (CONTINUED)
Note 16 — Disaggregation of Revenues, Geographic Sales and Product Sales
In the following tables, revenues are disaggregated by category, sales by geographic market and sales by product line. The following breaks down revenues into the following categories (in thousands):
| | | | | | | | | | | | |
| | Years Ended | |
| | 2024 | | | 2023 | | | 2022 | |
Non-consignment sales | | $ | 293,573 | | | $ | 301,163 | | | $ | 264,620 | |
Consignment sales | | | 20,328 | | | | 21,252 | | | | 19,771 | |
Total net sales | | $ | 313,901 | | | $ | 322,415 | | | $ | 284,391 | |
The Company markets and sells its products in more than 75 countries and conducts its manufacturing in the United States. Other than China and Japan, the Company does not conduct business in any country in which its sales in that country exceed 10% of consolidated net sales. Sales are attributed to countries based on location of customers. The composition of the Company’s net sales to unaffiliated customers was as follows (in thousands):
| | | | | | | | | | | | |
| | Years Ended | |
| | 2024 | | | 2023 | | | 2022 | |
Domestic | | $ | 19,896 | | | $ | 17,221 | | | $ | 14,679 | |
Foreign: | | | | | | | | | |
China(1) | | | 161,321 | | | | 185,554 | | | | 148,167 | |
Japan | | | 41,836 | | | | 38,472 | | | | 43,093 | |
Other(2) | | | 90,848 | | | | 81,168 | | | | 78,452 | |
Total foreign sales | | | 294,005 | | | | 305,194 | | | | 269,712 | |
Total net sales | | $ | 313,901 | | | $ | 322,415 | | | $ | 284,391 | |
(1) The China region includes sales into China and Hong Kong.
(2) No other location individually exceeds 10% of the total net sales.
The Company’s principal product, ICLs, are used in refractive surgery. Historically the Company marketed and sold cataract IOLs and related injectors and injector parts. The Company phased out sales of such products in fiscal 2023, and it did not sell any such products in fiscal 2024 and it does not expect such sales in the future. The composition of the Company’s net sales by product line was as follows (in thousands):
| | | | | | | | | | | | |
| | Years Ended | |
| | 2024 | | | 2023 | | | 2022 | |
ICLs | | $ | 312,543 | | | $ | 319,427 | | | $ | 269,712 | |
Other product sales | | | | | | | | | |
Cataract IOLs | | | — | | | | 1,139 | | | | 9,638 | |
Other surgical products(1) | | | 1,358 | | | | 1,849 | | | | 5,041 | |
Total other product sales | | | 1,358 | | | | 2,988 | | | | 14,679 | |
Total net sales | | $ | 313,901 | | | $ | 322,415 | | | $ | 284,391 | |
(1) Other surgical products include delivery systems and normal recurring sales adjustments such as sales return allowances.
The Company sells its products internationally, which subjects the Company to several potential risks, including fluctuating exchange rates (to the extent the Company’s transactions are not in U.S. dollars), regulation of fund transfers by foreign governments, U.S. and foreign export and import duties and tariffs, and political instability.
STAAR SURGICAL COMPANY AND SUBSIDIARIES
NOTES TO CONSOLIDATED FINANCIAL STATEMENTS (CONTINUED)
Note 17 —Geographic Assets
The Company’s long-lived assets are located in the following geographical locations in which the Company operates. Other than the U.S. and Switzerland, no other geographic location exceeds 10% of each category of long-lived assets. The composition of the Company’s long-lived assets was as follows (in thousands):
| | | | | | | | | | | | | | | | |
| | 2024 | |
| | U.S. | | | Switzerland | | | Other(1) | | | Total | |
Property, plant and equipment, net | | $ | 68,318 | | | $ | 16,084 | | | $ | 487 | | | $ | 84,889 | |
Finance lease ROU assets, net | | | 37 | | | | — | | | | — | | | | 37 | |
Operating lease ROU assets, net | | | 27,754 | | | | 6,414 | | | | 2,682 | | | | 36,850 | |
Total | | $ | 96,109 | | | $ | 22,498 | | | $ | 3,169 | | | $ | 121,776 | |
| | | | | | | | | | | | |
| | 2023 | |
| | U.S. | | | Switzerland | | | Other(1) | | | Total | |
Property, plant and equipment, net | | $ | 55,851 | | | $ | 10,632 | | | $ | 352 | | | $ | 66,835 | |
Finance lease ROU assets, net | | | 182 | | | | — | | | | 1 | | | | 183 | |
Operating lease ROU assets, net | | | 26,501 | | | | 6,343 | | | | 1,543 | | | | 34,387 | |
Total | | $ | 82,534 | | | $ | 16,975 | | | $ | 1,896 | | | $ | 101,405 | |
(1) No other location individually exceeds 10% of each category of long-lived assets.
STAAR SURGICAL COMPANY AND SUBSDIARIES
SCHEDULE II — VALUATION AND QUALIFYING ACCOUNTS AND RESERVES
| | | | | | | | | | | | | | | | | | | | |
Column A | | Column B | | | Column C - Additions | | | Column D | | | Column E | |
Description | | Balance at Beginning of Year | | | Charged to costs and expenses | | | Charged to other accounts | | | Deductions | | | Balance at End of Year | |
| | (in thousands) | |
2024 | | | | | | | | | | | | | | | |
Allowance for credit losses | | $ | 191 | | | $ | 9 | | | $ | — | | | $ | 168 | | | $ | 32 | |
Sales return reserve | | | 6,174 | | | | 17,754 | | | | — | | | | 17,349 | | | | 6,579 | |
Deferred tax asset valuation allowance | | | 42,744 | | | | 4,456 | | | | — | | | | 396 | | | | 46,804 | |
| | $ | 49,109 | | | $ | 22,219 | | | $ | — | | | $ | 17,913 | | | $ | 53,415 | |
2023 | | | | | | | | | | | | | | | |
Allowance for credit losses | | $ | 20 | | | $ | 171 | | | $ | — | | | $ | — | | | $ | 191 | |
Sales return reserve | | | 5,706 | | | | 15,967 | | | | — | | | | 15,499 | | | | 6,174 | |
Deferred tax asset valuation allowance | | | 46,977 | | | | 3,318 | | | | — | | | | 7,551 | | | | 42,744 | |
| | $ | 52,703 | | | $ | 19,456 | | | $ | — | | | $ | 23,050 | | | $ | 49,109 | |
2022 | | | | | | | | | | | | | | | |
Allowance for credit losses | | $ | 43 | | | $ | 55 | | | $ | — | | | $ | 78 | | | $ | 20 | |
Sales return reserve | | | 4,816 | | | | 15,459 | | | | — | | | | 14,569 | | | | 5,706 | |
Deferred tax asset valuation allowance | | | 62,860 | | | | (910 | ) | | | — | | | | 14,973 | | | | 46,977 | |
| | $ | 67,719 | | | $ | 14,604 | | | $ | — | | | $ | 29,620 | | | $ | 52,703 | |