Exhibit 99.1

| Management’s discussion and analysis | 1 |
| 1 | Overview | 2 |
| | 1.1 | Financial highlights | 2 |
| | 1.2 | Key corporate and business developments | 3 |
| | 1.3 | Assumptions | 4 |
| 2 | Consolidated financial analysis | 5 |
| | 2.1 | BCE consolidated income statements | 5 |
| | 2.2 | Customer connections | 5 |
| | 2.3 | Operating revenues | 6 |
| | 2.4 | Operating costs | 7 |
| | 2.5 | Net earnings | 8 |
| | 2.6 | Adjusted EBITDA | 9 |
| | 2.7 | Severance, acquisition and other costs | 10 |
| | 2.8 | Depreciation and amortization | 10 |
| | 2.9 | Finance costs | 10 |
| | 2.10 | Other (expense) income | 10 |
| | 2.11 | Income taxes | 11 |
| | 2.12 | Net earnings attributable to common shareholders and EPS | 11 |
| 3 | Business segment analysis | 12 |
| | 3.1 | Bell Wireless | 12 |
| | 3.2 | Bell Wireline | 16 |
| | 3.3 | Bell Media | 20 |
| 4 | Financial and capital management | 23 |
| | 4.1 | Net debt | 23 |
| | 4.2 | Outstanding share data | 23 |
| | 4.3 | Cash flows | 24 |
| | 4.4 | Post-employment benefit plans | 26 |
| | 4.5 | Financial risk management | 26 |
| | 4.6 | Credit ratings | 28 |
| | 4.7 | Liquidity | 28 |
| 5 | Quarterly financial information | 29 |
| 6 | Regulatory environment | 30 |
| 7 | Business risks | 32 |
| 8 | Accounting policies, financial measures and controls | 34 |
| | 8.1 | Our accounting policies | 34 |
| | 8.2 | Non-GAAP financial measures and key performance indicators (KPIs) | 36 |
| | 8.3 | Controls and procedures | 39 |
| | | |
| Consolidated financial statements | 40 |
| | Consolidated income statements | 40 |
| | Consolidated statements of comprehensive income | 41 |
| | Consolidated statements of financial position | 42 |
| | Consolidated statements of changes in equity | 43 |
| | Consolidated statements of cash flows | 44 |
| Notes to consolidated financial statements | 45 |
| | Note 1 | Corporate information | 45 |
| | Note 2 | Basis of presentation and significant accounting policies | 45 |
| | Note 3 | Business acquisitions and dispositions | 46 |
| | Note 4 | Segmented information | 48 |
| | Note 5 | Operating costs | 50 |
| | Note 6 | Severance, acquisition and other costs | 50 |
| | Note 7 | Other (expense) income | 50 |
| | Note 8 | Earnings per share | 51 |
| | Note 9 | Debt | 51 |
| | Note 10 | Post-employment benefit plans | 51 |
| | Note 11 | Financial assets and liabilities | 52 |
| | Note 12 | Share capital | 53 |
| | Note 13 | Share-based payments | 54 |
| | Note 14 | Adoption of IFRS 15 | 55 |
| BCE Inc. 2018 SECOND QUARTER SHAREHOLDER REPORT |
|
| | | | |
| | MD&A | |
| Management’s discussion and analysis |
In this management’s discussion and analysis of financial condition and results of operations (MD&A),we,us,our,BCE andthe companymean, as the context may require, either BCE Inc. or, collectively, BCE Inc., Bell Canada, their subsidiaries, joint arrangements and associates.Bell means, as the context may require, either Bell Canada or, collectively, Bell Canada, its subsidiaries, joint arrangements and associates.MTSmeans, as the context may require, until March 17, 2017, either Manitoba Telecom Services Inc. or, collectively, Manitoba Telecom Services Inc. and its subsidiaries; and Bell MTSmeans, from March 17, 2017, the combined operations of MTS and Bell Canada in Manitoba.
All amounts in this MD&A are in millions of Canadian dollars, except where noted. Please refer to section 8.2,Non-GAAP financial measures and key performance indicators (KPIs)on pages 36 to 38 for a list of defined non-GAAP financial measures and KPIs.
Please refer to BCE’s unaudited consolidated financial statements for the second quarter of 2018 (Q2 2018 Financial Statements) when reading this MD&A. We also encourage you to read BCE’s MD&A for the year ended December 31, 2017 dated March 8, 2018 (BCE 2017 Annual MD&A) as updated in BCE’s MD&A for the first quarter of 2018 dated May 2, 2018 (BCE 2018 First Quarter MD&A). In preparing this MD&A, we have taken into account information available to us up to August 1, 2018, the date of this MD&A, unless otherwise stated.
As required by International Financial Reporting Standards (IFRS), effective January 1, 2018, we have adopted IFRS 15, Revenue from Contracts with Customers, as described in section 8.1,Our accounting policies, retrospectively to each period in 2017 previously reported. We have also reclassified some amounts from previous periods to make them consistent with the presentation for the current period. As a result of the adoption of IFRS 15, we have also updated certain of our assumptions set out in the BCE 2017 Annual MD&A.
You will find more information about us, including BCE’s annual information form for the year ended December 31, 2017 dated March 8, 2018 (BCE 2017 AIF) and recent financial reports, including the BCE 2017 Annual MD&A, on BCE’s website atBCE.ca, on SEDAR atsedar.comand on EDGAR atsec.gov.
This MD&A comments on our business operations, performance, financial position and other matters for the three months (Q2) and six months (YTD) ended June 30, 2018 and 2017.
| CAUTION REGARDING FORWARD-LOOKING STATEMENTS |
This MD&A, and in particular, but without limitation, the section and sub-sections entitledAssumptions, section 1.2,Key corporate and business developments, section 3.1, Bell Wireless – Key business developments, section 3.2,Bell Wireline – Key business developments, section 3.3, Bell Media – Key business developments, and section 6,Regulatory environment, contain forward-looking statements. These forward-looking statements include, without limitation, statements relating to our network deployment plans and related capital investments, BCE’s business outlook, objectives, plans and strategic priorities, and other statements that do not refer to historical facts. A statement we make is forward-looking when it uses what we know and expect today to make a statement about the future. Forward-looking statements are typically identified by the wordsassumption,goal,guidance,objective,outlook, project,strategy,target, and other similar expressions or future or conditional verbs such asaim,anticipate,believe,could,expect,intend,may,plan,seek,should,striveandwill. All such forward-looking statements are made pursuant to the safe harbour provisions of applicable Canadian securities laws and of the United States (U.S.)Private Securities Litigation Reform Act of 1995.
Unless otherwise indicated by us, forward-looking statements in this MD&A describe our expectations as at August 1, 2018 and, accordingly, are subject to change after that date. Except as may be required by Canadian securities laws, we do not undertake any obligation to update or revise any forward-looking statements, whether as a result of new information, future events or otherwise.
Forward-looking statements, by their very nature, are subject to inherent risks and uncertainties and are based on several assumptions both general and specific, which give rise to the possibility that actual results or events could differ materially from our expectations expressed in, or implied by, such forward-looking statements and that our business outlook, objectives, plans and strategic priorities may not be achieved. As a result, we cannot guarantee that any forward-looking statement will materialize and we caution you against relying on any of these forward-looking statements. Forward-looking statements are presented in this MD&A for the purpose of assisting investors and others in understanding our objectives, strategic priorities and business outlook as well as our anticipated operating environment. Readers are cautioned, however, that such information may not be appropriate for other purposes.
We have made certain economic, market and operational assumptions in preparing the forward-looking statements contained in this MD&A and, in particular, but without limitation, the forward-looking statements contained in the previously mentioned sections of this MD&A. These assumptions include, without limitation, the assumptions described in the various sections of this MD&A entitledAssumptions, which sections are incorporated by reference in this cautionary statement. We believe that our assumptions were reasonable at August 1, 2018. If our assumptions turn out to be inaccurate, our actual results could be materially different from what we expect. Unless otherwise indicated in this MD&A, or in the BCE 2018 First Quarter MD&A, the strategic priorities, business outlook and assumptions described in the BCE 2017 Annual MD&A remain substantially unchanged.
Important risk factors including, without limitation, competitive, regulatory, economic, financial, operational, technological and other risks that could cause actual results or events to differ materially from those expressed in, or implied by, the previously-mentioned forward looking statements and other forward-looking statements contained in this MD&A, include, but are not limited to, the risks described or referred to in section 6,Regulatory environment, and section 7,Business risks, which sections are incorporated by reference in this cautionary statement.
We caution readers that the risks described in the previously mentioned sections and in other sections of this MD&A are not the only ones that could affect us. Additional risks and uncertainties not currently known to us or that we currently deem to be immaterial may also have a material adverse effect on our financial position, financial performance, cash flows, business or reputation. Except as otherwise indicated by us, forward-looking statements do not reflect the potential impact of any special items or of any dispositions, monetizations, mergers, acquisitions, other business combinations or other transactions that may be announced or that may occur after August 1, 2018. The financial impact of these transactions and special items can be complex and depends on facts particular to each of them. We therefore cannot describe the expected impact in a meaningful way, or in the same way we present known risks affecting our business.
BCE Inc. 2018 SECOND QUARTER SHAREHOLDER REPORT 1 |
|
| | | | |
1 | MD&A | Overview | |
As required by IFRS, effective January 1, 2018, we have adopted IFRS 15, Revenue from Contracts with Customers, as described in section 8.1, Our accounting policies, retrospectively to each period in 2017 previously reported. We have also reclassified some amounts from previous periods to make them consistent with the presentation for the current period.
BCE Q2 2018 SELECTED QUARTERLY INFORMATION
| BCE INCOME STATEMENTS – SELECTED INFORMATION |
| Q2 2018 | | Q2 2017 | | $ CHANGE | | % CHANGE | | YTD 2018 | | YTD 2017 | | $ CHANGE | | % CHANGE | |
Operating revenues | | | | | | | | | | | | | | | | |
Service | 5,129 | | 5,078 | | 51 | | 1.0 | % | 10,093 | | 9,889 | | 204 | | 2.1 | % |
Product | 657 | | 610 | | 47 | | 7.7 | % | 1,283 | | 1,135 | | 148 | | 13.0 | % |
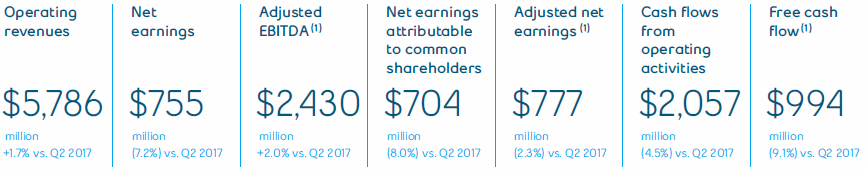
Total operating revenues | 5,786 | | 5,688 | | 98 | | 1.7 | % | 11,376 | | 11,024 | | 352 | | 3.2 | % |
Operating costs | (3,356 | ) | (3,306 | ) | (50 | ) | (1.5 | %) | (6,692 | ) | (6,476 | ) | (216 | ) | (3.3 | %) |
Adjusted EBITDA | 2,430 | | 2,382 | | 48 | | 2.0 | % | 4,684 | | 4,548 | | 136 | | 3.0 | % |
Adjusted EBITDA margin(1) | 42.0 | % | 41.9 | % | | | 0.1 | pts | 41.2 | % | 41.3 | % | | | (0.1 | ) pts |
Net earnings attributable to: | | | | | | | | | | | | | | | | |
Common shareholders | 704 | | 765 | | (61 | ) | (8.0 | %) | 1,365 | | 1,407 | | (42 | ) | (3.0 | %) |
Preferred shareholders | 35 | | 32 | | 3 | | 9.4 | % | 71 | | 63 | | 8 | | 12.7 | % |
Non-controlling interest | 16 | | 17 | | (1 | ) | (5.9 | %) | 28 | | 32 | | (4 | ) | (12.5 | %) |
Net earnings | 755 | | 814 | | (59 | ) | (7.2 | %) | 1,464 | | 1,502 | | (38 | ) | (2.5 | %) |
Adjusted net earnings | 777 | | 795 | | (18 | ) | (2.3 | %) | 1,496 | | 1,498 | | (2 | ) | (0.1 | %) |
Net earnings per common share (EPS) | 0.79 | | 0.85 | | (0.06 | ) | (7.1 | %) | 1.52 | | 1.58 | | (0.06 | ) | (3.8 | %) |
Adjusted EPS(1) | 0.86 | | 0.89 | | (0.03 | ) | (3.4 | %) | 1.66 | | 1.69 | | (0.03 | ) | (1.8 | %) |
| (1) | Adjusted EBITDA, adjusted EBITDA margin, adjusted net earnings, adjusted EPS and free cash flow are non-GAAP financial measures and do not have any standardized meaning under IFRS. Therefore, they are unlikely to be comparable to similar measures presented by other issuers. See section 8.2,Non-GAAP financial measures and key performance indicators (KPIs) – Adjusted EBITDA and adjusted EBITDA margin, Adjusted net earnings and adjusted EPSandFree cash flow and dividend payout ratioin this MD&A for more details, including reconciliations to the most comparable IFRS financial measure. |
| (2) | At the beginning of Q1 2018, we adjusted our postpaid wireless subscriber base to remove 16,116 subscribers with a corresponding increase to our high-speed Internet subscribers to reflect the transfer of fixed wireless Internet subscribers. |
| (3) | At the beginning of Q1 2018, our high-speed Internet subscriber base was increased by 19,835, our Internet protocol television (IPTV) by 14,599 and our residential NAS by 23,441, mainly as a result of a small acquisition made in Q1 2018. |
| (4) | As of January 1, 2018, business NAS was removed from our NAS subscriber base due to its declining relevance as a KPI given migrations from voice to Internet protocol (IP) result in NAS losses without a corresponding decline in revenues. Previously reported periods were retroactively adjusted. |
| 2 BCE Inc. 2018 SECOND QUARTER SHAREHOLDER REPORT |
|
| | | | |
| | 1 | MD&A | Overview |
| BCE STATEMENTS OF CASH FLOWS – SELECTED INFORMATION |
| | Q2 2018 | | Q2 2017 | | $ CHANGE | | % CHANGE | | YTD 2018 | | YTD 2017 | | $ CHANGE | | % CHANGE | |
Cash flows from operating activities | 2,057 | | 2,154 | | (97 | ) | (4.5 | %) | 3,553 | | 3,467 | | 86 | | 2.5 | % |
Capital expenditures | (1,056 | ) | (1,042 | ) | (14 | ) | (1.3 | %) | (1,987 | ) | (1,894 | ) | (93 | ) | (4.9 | %) |
Free cash flow | 994 | | 1,094 | | (100 | ) | (9.1 | %) | 1,531 | | 1,583 | | (52 | ) | (3.3 | %) |
| Q2 2018 FINANCIAL HIGHLIGHTS |
BCE generated revenue growth of 1.7% in Q2 2018, compared to last year, reflecting both higher service and product revenues of 1.0% and 7.7%, respectively. The increase was driven by Bell Wireless and Bell Wireline, moderated by a modest decline at Bell Media. The growth was led by ongoing increases in wireless, Internet, IPTV, and IP-based services revenues, as well as higher product revenues resulting from greater sales volumes, offset in part by the continued erosion in voice, satellite TV and legacy data revenues. The ongoing but moderating decline in our business markets and the continued softness in the media advertising market further pressured revenues.
Net earnings decreased by 7.2% in the second quarter of 2018, compared to the same period last year, due to higher other expense and higher depreciation and amortization expense, partly offset by higher adjusted EBITDA, as growing revenues more than offset an increase in operating costs.
Q2 2018 adjusted EBITDA increased by 2.0%, compared to last year, mainly due to service revenue flow-through, coupled with ongoing effective cost management, which was moderated by escalating content and programming costs.
BCE’s EPS of $0.79 in Q2 2018 decreased by $0.06 compared to the same period last year.
Excluding the impact of severance, acquisition and other costs, net mark-to-market (losses) gains on derivatives used to economically hedge equity settled share-based compensation plans, net (losses) gains on investments, early debt redemption costs and impairment charges, adjusted net earnings in the second quarter of 2018 was $777 million, or $0.86 per common share, compared to $795 million, or $0.89 per common share, for the same period last year.
Cash flows from operating activities in the second quarter of 2018 decreased by $97 million, compared to Q2 2017, due mainly to a decrease in cash from working capital, partly offset by higher adjusted EBITDA.
Free cash flow in Q2 2018 decreased by $100 million, compared to the same period last year, mainly due to lower cash flows from operating activities excluding acquisition and other costs paid.
| 1.2 Key corporate and business developments |
BELL AWARDED SUPERNET CONTRACT BY GOVERNMENT OF ALBERTA
On July 3, 2018, Bell announced that it had been awarded a multi-year contract to operate Alberta SuperNet, the Alberta government-led initiative providing broadband network connectivity to schools, hospitals, libraries, municipal and indigenous offices, government facilities, enterprise business customers and Internet service providers in 429 urban and rural communities throughout the province. Bell currently owns and operates the SuperNet network assets serving 27 urban centres in Alberta.
On June 30, 2018, Bell entered into an agreement to acquire the Alberta operations of Axia NetMedia Corporation, the Calgary-based operator of SuperNet’s rural assets. The transaction is expected to close by the end of August 2018. The acquisition ensures the continuation of SuperNet services for rural customers while enhancing connectivity opportunities for Alberta and national enterprise customers doing business throughout the province.
| RECOGNITION OF BELL’S ENVIRONMENTAL LEADERSHIP |
Bell was named one of Canada’s Greenest Employers by Canada’s Top 100 Employers program for the second consecutive year. The award recognizes Bell’s focus on minimizing our environmental impact, our leadership in implementing an ISO 14001 certified Environmental Management System and the success of our ongoing initiatives to reduce waste and save energy. The following are some highlights from 2017:
- At Bell offices across Canada, we reduced electricity consumption by over 30,000 Megawatt hours (MWh), enough to power 3,000 homes for a year
- We reduced fuel consumption by more than 500,000 litres by using telematics systems in 85% of Bell vehicles and following eco-driving practices such as limiting idling
- We diverted 64% of our waste, including 100 tonnes of computer equipment, from landfills through reuse and recycling programs
- We recovered 200,536 phones through the Bell Blue Box program, which donates proceeds to mental health organizations across Canada as part of Bell Let’s Talk
On June 19, 2018, Bell Canada announced the renewal of its medium term notes (MTN) program, enabling Bell Canada to offer up to $3 billion of MTN debentures from time to time until April 20, 2020. The MTN debentures will be fully and unconditionally guaranteed by BCE. Consistent with past practice, the MTN program was renewed to continue to provide Bell Canada with financial flexibility and efficient access to the Canadian and U.S. capital markets.
BCE Inc. 2018 SECOND QUARTER SHAREHOLDER REPORT 3 |
|
| | | | |
1 | MD&A | Overview | |
As at the date of this MD&A, our forward-looking statements set out in the BCE 2017 Annual MD&A, as updated or supplemented in the BCE 2018 First Quarter MD&A and in this MD&A, are based on certain assumptions including, without limitation, the following economic and market assumptions as well as the various assumptions referred to under the sub-sections entitledAssumptionsset out in section 3,Business segment analysisof this MD&A.
ASSUMPTIONS ABOUT THE CANADIAN ECONOMY
- Lower economic growth, given the Bank of Canada’s most recent estimated growth in Canadian gross domestic product of 2.0% in 2018
- Employment gains expected to slow in 2018, as the overall level of business investment is expected to remain soft
- Interest rates expected to increase modestly in 2018
- Canadian dollar expected to remain at near current levels. Further movements may be impacted by the degree of strength of the U.S. dollar, interest rates and changes in commodity prices
MARKET ASSUMPTIONS
- A higher level of wireline and wireless competition in consumer, business and wholesale markets
- Higher, but slowing, wireless industry penetration and smartphone adoption
- A soft media advertising market, due to variable demand, and continued escalation of costs to secure TV programming
- Ongoing linear TV subscriber erosion, due to growing cord-cutter and cord-never customer segments
| 4 BCE Inc. 2018 SECOND QUARTER SHAREHOLDER REPORT |
|
| | | | |
| | 2 | MD&A | Consolidated financial analysis |
| 2 Consolidated financial analysis |
This section provides detailed information and analysis about BCE’s performance in Q2 and YTD 2018 compared with Q2 and YTD 2017. It focuses on BCE’s consolidated operating results and provides financial information for our Bell Wireless, Bell Wireline and Bell Media business segments. For further discussion and analysis of our business segments, refer to section 3, Business segment analysis.
As required by IFRS, effective January 1, 2018, we have adopted IFRS 15, Revenue from Contracts with Customers, as described in section 8.1, Our accounting policies, retrospectively to each period in 2017 previously reported. We have also reclassified some amounts from previous periods to make them consistent with the presentation for the current period.
| 2.1BCE consolidated income statements |
| Q2 2018 | | Q2 2017 | | $ CHANGE | | % CHANGE | | YTD 2018 | | YTD 2017 | | $ CHANGE | | % CHANGE | |
Operating revenues | | | | | | | | | | | | | | | | |
Service | 5,129 | | 5,078 | | 51 | | 1.0 | % | 10,093 | | 9,889 | | 204 | | 2.1 | % |
Product | 657 | | 610 | | 47 | | 7.7 | % | 1,283 | | 1,135 | | 148 | | 13.0 | % |
Total operating revenues | 5,786 | | 5,688 | | 98 | | 1.7 | % | 11,376 | | 11,024 | | 352 | | 3.2 | % |
Operating costs | (3,356 | ) | (3,306 | ) | (50 | ) | (1.5 | %) | (6,692 | ) | (6,476 | ) | (216 | ) | (3.3 | %) |
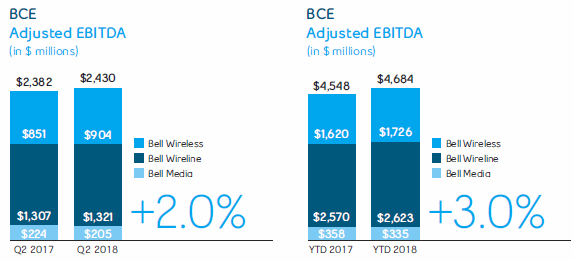
Adjusted EBITDA | 2,430 | | 2,382 | | 48 | | 2.0 | % | 4,684 | | 4,548 | | 136 | | 3.0 | % |
Adjusted EBITDA margin | 42.0 | % | 41.9 | % | | | 0.1 | pts | 41.2 | % | 41.3 | % | | | (0.1 | ) pts |
Severance, acquisition and other costs | (24 | ) | (36 | ) | 12 | | 33.3 | % | (24 | ) | (120 | ) | 96 | | 80.0 | % |
Depreciation | (787 | ) | (767 | ) | (20 | ) | (2.6 | %) | (1,567 | ) | (1,491 | ) | (76 | ) | (5.1 | %) |
Amortization | (221 | ) | (210 | ) | (11 | ) | (5.2 | %) | (433 | ) | (395 | ) | (38 | ) | (9.6 | %) |
Finance costs | | | | | | | | | | | | | | | | |
Interest expense | (246 | ) | (238 | ) | (8 | ) | (3.4 | %) | (486 | ) | (472 | ) | (14 | ) | (3.0 | %) |
Interest on post-employment benefit obligations | (17 | ) | (18 | ) | 1 | | 5.6 | % | (34 | ) | (36 | ) | 2 | | 5.6 | % |
Other (expense) income | (88 | ) | (1 | ) | (87 | ) | n.m. | | (149 | ) | 16 | | (165 | ) | n.m. | |
Income taxes | (292 | ) | (298 | ) | 6 | | 2.0 | % | (527 | ) | (548 | ) | 21 | | 3.8 | % |
Net earnings | 755 | | 814 | | (59 | ) | (7.2 | %) | 1,464 | | 1,502 | | (38 | ) | (2.5 | %) |
Net earnings attributable to: | | | | | | | | | | | | | | | | |
Common shareholders | 704 | | 765 | | (61 | ) | (8.0 | %) | 1,365 | | 1,407 | | (42 | ) | (3.0 | %) |
Preferred shareholders | 35 | | 32 | | 3 | | 9.4 | % | 71 | | 63 | | 8 | | 12.7 | % |
Non-controlling interest | 16 | | 17 | | (1 | ) | (5.9 | %) | 28 | | 32 | | (4 | ) | (12.5 | %) |
Net earnings | 755 | | 814 | | (59 | ) | (7.2 | %) | 1,464 | | 1,502 | | (38 | ) | (2.5 | %) |
Adjusted net earnings | 777 | | 795 | | (18 | ) | (2.3 | %) | 1,496 | | 1,498 | | (2 | ) | (0.1 | %) |
EPS | 0.79 | | 0.85 | | (0.06 | ) | (7.1 | %) | 1.52 | | 1.58 | | (0.06 | ) | (3.8 | %) |
Adjusted EPS | 0.86 | | 0.89 | | (0.03 | ) | (3.4 | %) | 1.66 | | 1.69 | | (0.03 | ) | (1.8 | %) |
n.m.: not meaningful
TOTAL BCE CONNECTIONS
| Q2 2018 | | Q2 2017 | | % CHANGE | |
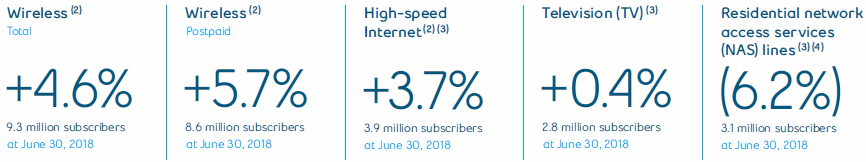
Wireless subscribers(1) | 9,309,534 | | 8,901,291 | | 4.6 | % |
Postpaid(1) | 8,593,113 | | 8,126,264 | | 5.7 | % |
High-speed Internet subscribers(1)(2) | 3,856,555 | | 3,718,677 | | 3.7 | % |
TV (Satellite and IPTV subscribers)(2) | 2,835,227 | | 2,824,016 | | 0.4 | % |
IPTV(2) | 1,599,142 | | 1,481,434 | | 7.9 | % |
Total growth services | 16,001,316 | | 15,443,984 | | 3.6 | % |
Wireline residential NAS lines(2) | 3,126,551 | | 3,332,976 | | (6.2 | %) |
Total services(3) | 19,127,867 | | 18,776,960 | | 1.9 | % |
| (1) | At the beginning of Q1 2018, we adjusted our postpaid wireless subscriber base to remove 16,116 subscribers with a corresponding increase to our high-speed Internet subscribers to reflect the transfer of fixed wireless Internet subscribers. |
| (2) | At the beginning of Q1 2018, our high-speed Internet subscriber base was increased by 19,835, our IPTV by 14,599 and our residential NAS by 23,441, mainly as a result of a small acquisition made in Q1 2018. |
| (3) | As of January 1, 2018, business NAS was removed from our NAS subscriber base due to its declining relevance as a KPI given migrations from voice to IP result in NAS losses without a corresponding decline in revenues. Previously reported periods were retroactively adjusted. |
BCE Inc. 2018 SECOND QUARTER SHAREHOLDER REPORT 5 |
|
| | | | |
2 | MD&A | Consolidated financial analysis | |
BCE NET ACTIVATIONS (LOSSES)
| Q2 2018 | | Q2 2017 | | % CHANGE | | YTD 2018 | | YTD 2017 | | % CHANGE | |
Wireless subscribers | 114,486 | | 66,916 | | 71.1 | % | 158,863 | | 67,588 | | 135.0 | % |
Postpaid | 122,092 | | 88,611 | | 37.8 | % | 190,579 | | 124,393 | | 53.2 | % |
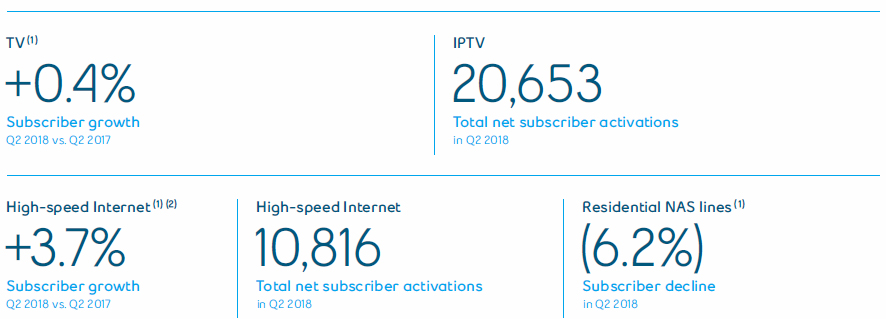
High-speed Internet subscribers | 10,816 | | 1,407 | | 668.7 | % | 30,463 | | 16,396 | | 85.8 | % |
TV (Satellite and IPTV subscribers) | 809 | | (13,337 | ) | 106.1 | % | (11,672 | ) | (29,000 | ) | 59.8 | % |
IPTV | 20,653 | | 16,427 | | 25.7 | % | 34,226 | | 38,829 | | (11.9 | %) |
Total growth services | 126,111 | | 54,986 | | 129.4 | % | 177,654 | | 54,984 | | 223.1 | % |
Wireline residential NAS lines | (70,665 | ) | (67,005 | ) | (5.5 | %) | (128,198 | ) | (140,426 | ) | 8.7 | % |
Total services | 55,446 | | (12,019 | ) | 561.3 | % | 49,456 | | (85,442 | ) | 157.9 | % |
BCE added 126,111 net new customer connections to its growth services in Q2 2018, a significant improvement over the 54,986 net new customer connections achieved in Q2 2017. This was comprised of:
- 122,092 postpaid wireless customers, and the net loss of 7,606 prepaid wireless customers
- 10,816 high-speed Internet customers
- 20,653 IPTV customers and 19,844 satellite TV net customer losses
In the first six months of the year, BCE added 177,654 net new customer connections to its growth services, a significant improvement over the 54,984 net new customer connections achieved last year. This consisted of:
- 190,579 postpaid wireless customers, and the net loss of 31,716 prepaid wireless customers
- 30,463 high-speed Internet customers
- 34,226 IPTV customers and 45,898 satellite TV net customer losses
Residential NAS net losses were 70,665 in Q2 2018, increasing by 5.5% over Q2 2017. Conversely, in the first half of the year, residential NAS net losses were 128,198, representing an improvement of 8.7% compared to the same period last year.
Total BCE customer connections across all services increased by 1.9% in Q2 2018 compared to last year, driven by an increase in our growth services customer base, moderated by continued erosion in residential NAS lines.
At June 30, 2018, BCE customer connections totaled 19,127,867 and consisted of the following:
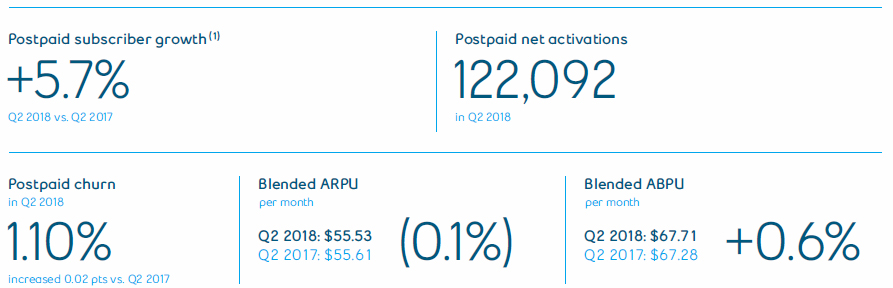
- 9,309,534 wireless subscribers, up 4.6% compared to Q2 2017, and included 8,593,113 postpaid wireless subscribers, an increase of 5.7% compared to the prior year
- 3,856,555 high-speed Internet subscribers, 3.7% higher year over year
- 2,835,227 total TV subscribers, up 0.4% compared to Q2 2017, and included 1,599,142 IPTV customers, representing an increase of 7.9% year over year
- 3,126,551 residential NAS lines, a decline of 6.2% compared to Q2 2017

| Q2 2018 | | Q2 2017 | | $ CHANGE | | % CHANGE | | YTD 2018 | | YTD 2017 | | $ CHANGE | | % CHANGE | |
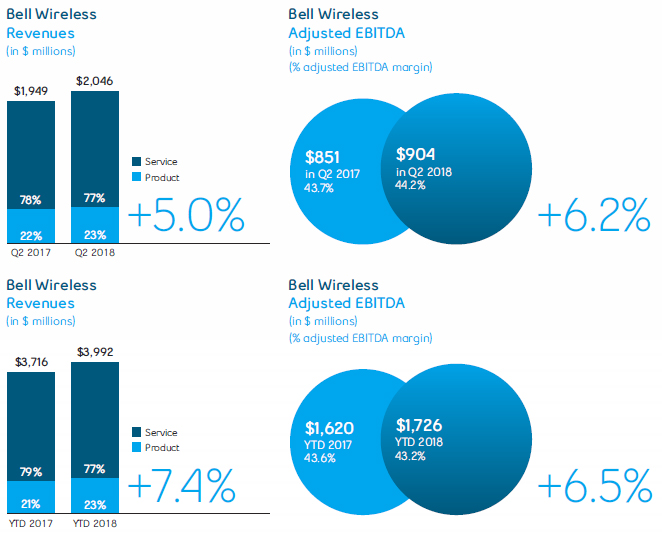
Bell Wireless | 2,046 | | 1,949 | | 97 | | 5.0 | % | 3,992 | | 3,716 | | 276 | | 7.4 | % |
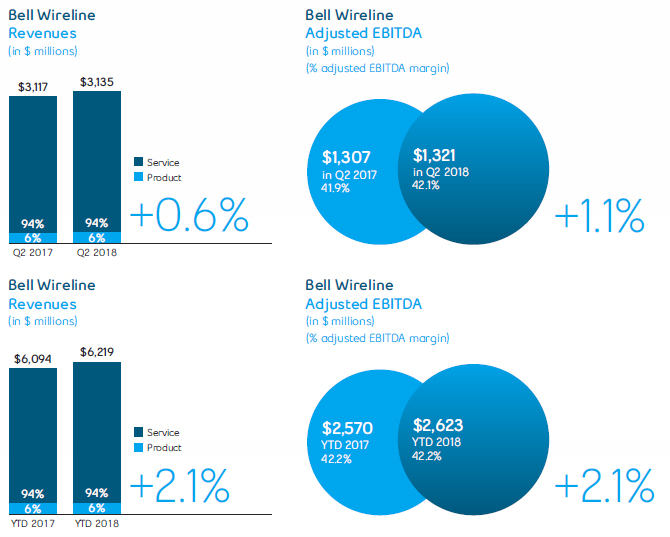
Bell Wireline | 3,135 | | 3,117 | | 18 | | 0.6 | % | 6,219 | | 6,094 | | 125 | | 2.1 | % |
Bell Media | 791 | | 796 | | (5 | ) | (0.6 | %) | 1,540 | | 1,547 | | (7 | ) | (0.5 | %) |
Inter-segment eliminations | (186 | ) | (174 | ) | (12 | ) | (6.9 | %) | (375 | ) | (333 | ) | (42 | ) | (12.6 | %) |
Total BCE operating revenues | 5,786 | | 5,688 | | 98 | | 1.7 | % | 11,376 | | 11,024 | | 352 | | 3.2 | % |
| 6 BCE Inc. 2018 SECOND QUARTER SHAREHOLDER REPORT |
|
| | | | |
| | 2 | MD&A | Consolidated financial analysis |
BCE
Total operating revenues at BCE increased by 1.7% in Q2 2018 and by 3.2% in the first half of the year, compared to the same periods in 2017, attributable to growth in both our Bell Wireless and Bell Wireline segments, offset by a decline in our Bell Media segment. This consisted of service revenues of $5,129 million in Q2 2018 and $10,093 million in the first six months of the year, increasing by 1.0% and 2.1%, respectively, over the same periods last year. Product revenues of $657 million in Q2 2018 and $1,283 million in the first half of 2018, grew by 7.7% and 13.0% respectively, compared to the same periods last year. Year-to-date operating revenues were also favourably impacted by the acquisition of MTS on March 17, 2017.
BELL WIRELESS
Bell Wireless operating revenues increased by 5.0% in Q2 2018 and by 7.4% year to date, compared to the same periods last year, due to both higher service and product revenues. Service revenues increased by 3.6% in the quarter and by 4.8% in the first half of the year, driven by a higher postpaid subscriber base as blended ARPU remained relatively unchanged compared to last year. Product revenues grew by 9.8% in the current quarter and by 17.4% year to date, due to a larger proportion of premium smartphone devices in our sales mix and higher retail handset prices resulting in a greater allocation of revenues to product revenues, as well as higher sales volumes from greater gross activations. The growth in year-to-date operating revenues was also favourably impacted by the acquisition of MTS, moderated by the unfavourable retroactive impact in Q1 2018 of the Canadian Radio-television and Telecommunications Commission (CRTC) decision on wholesale wireless domestic roaming rates of $14 million.
BELL WIRELINE
Bell Wireline operating revenues grew by 0.6% in the second quarter of 2018 and by 2.1% in the first half of the year, compared to the same periods last year, reflecting service revenue growth of 0.4% and 1.9%, respectively, as well as product revenue growth of 3.9% and 4.1%, respectively. The increase in service revenues was driven by continued growth in Internet and IPTV subscribers, greater household ARPU, higher IP-based services revenue, and the contribution from the acquisition of AlarmForce Industries Inc (AlarmForce) in January 2018. This was moderated by ongoing erosion in our voice, satellite TV and legacy data services, combined with greater residential customer acquisition, retention and bundle discounts to match aggressive offers from cable competitors. The continuing but moderating decline in our business markets reflected the benefit from the G7 summit and the Ontario general election held during Q2 2018. The growth in product revenues was driven by increased sales of telecommunications equipment along with the contribution from the acquisition of AlarmForce. Year-to-date revenues were also favourably impacted by the acquisition of MTS.
BELL MEDIA
Bell Media operating revenues decreased by 0.6%, in Q2 2018 and by 0.5% in the first six months of the year, compared to the same periods in 2017, due to lower advertising revenues driven by continued market softness, viewership declines and the ongoing shift in customer spending to over-the-top (OTT) and digital platforms. These pressures were moderated by increased advertising revenues as a result of the broadcast of the 2018 Fédération Internationale de Football Association (FIFA) World Cup, and higher out-of-home (OOH) advertising revenues mainly as a result of increased demand on digital faces. The decline in year-to-date advertising revenues also reflected the shift in advertising dollars in Q1 2018 to the main broadcaster of the PyeongChang 2018 Winter Olympics. The decrease in operating revenues was mitigated in part by higher subscriber revenues mainly due to continued growth in our TV Everywhere GO and CraveTV products along with the recent launch of TSN and RDS Direct, our direct-to-consumer sports streaming services and rate increases to certain broadcasting distribution undertakings (BDUs).
| Q2 2018 | | Q2 2017 | | $ CHANGE | | % CHANGE | | YTD 2018 | | YTD 2017 | | $ CHANGE | | % CHANGE | |
Bell Wireless | (1,142 | ) | (1,098 | ) | (44 | ) | (4.0 | %) | (2,266 | ) | (2,096 | ) | (170 | ) | (8.1 | %) |
Bell Wireline | (1,814 | ) | (1,810 | ) | (4 | ) | (0.2 | %) | (3,596 | ) | (3,524 | ) | (72 | ) | (2.0 | %) |
Bell Media | (586 | ) | (572 | ) | (14 | ) | (2.4 | %) | (1,205 | ) | (1,189 | ) | (16 | ) | (1.3 | %) |
Inter-segment eliminations | 186 | | 174 | | 12 | | 6.9 | % | 375 | | 333 | | 42 | | 12.6 | % |
Total BCE operating costs | (3,356 | ) | (3,306 | ) | (50 | ) | (1.5 | %) | (6,692 | ) | (6,476 | ) | (216 | ) | (3.3 | %) |
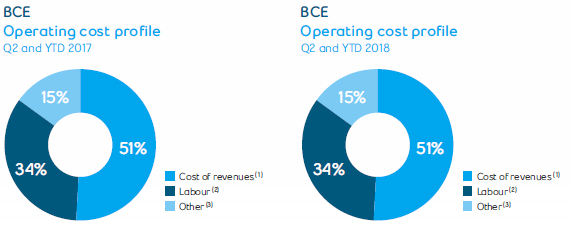
| (1) | Cost of revenues includes costs of wireless devices and other equipment sold, network and content costs, and payments to other carriers. |
| (2) | Labour costs (net of capitalized costs) include wages, salaries and related taxes and benefits, post-employment benefit plans service cost, and other labour costs, including contractor and outsourcing costs. |
| (3) | Other operating costs include marketing, advertising and sales commission costs, bad debt expense, taxes other than income taxes, information technology (IT) costs, professional service fees and rent. |
BCE Inc. 2018 SECOND QUARTER SHAREHOLDER REPORT 7 |
|
| | | | |
2 | MD&A | Consolidated financial analysis | |
BCE
Total BCE operating costs grew by 1.5% in Q2 2018 and by 3.3% in the first half of the year, compared to the same periods in 2017, due to higher costs across all three of our segments.
BELL WIRELESS
Bell Wireless operating costs increased by 4.0% in Q2 2018, compared to last year as a result of:
- Increased product cost of goods sold due to greater sales volumes and higher handset costs
- Increased labour costs to support the growth of the business
- Higher network operating costs driven by the expansion of network capacity to support subscriber growth and increased data consumption
These factors were partially offset by:
Operating costs for the first half of the year were up 8.1%, compared to last year, driven by the higher costs as noted above, as well as increased costs related to the acquisition of MTS and greater advertising expense due to the PyeongChang 2018 Winter Olympics.
BELL WIRELINE
Bell Wireline operating costs increased by 0.2% in Q2 2018 and by 2.0% in the first half of the year, compared to the same periods in 2017, attributable to:
- Increased expenses from the acquisition of AlarmForce
- Higher marketing expense mainly in our residential market to support subscriber acquisition, including increased advertising spend in Q1 2018 during the PyeongChang 2018 Winter Olympics
- Higher cost of goods sold driven by increased product sales
- Greater programming and content costs in our TV business from contractual rate increases
These factors were partially offset by:
- Reduced labour costs attributable to workforce reductions, savings from lower call volumes to customer service centers, and lower vendor contract expenses
- Decreased payments to other carriers resulting from lower sales of international long distance minutes
Operating expenses in the first half of the year, compared to last year, were further unfavourably impacted by the acquisition of MTS and higher pension expense due to a gain in Q1 2017 on post-employment benefit expense related to an alignment of certain Bell Aliant defined benefit (DB) pension plans with those of Bell Canada.
BELL MEDIA
Bell Media operating costs increased by $14 million or 2.4% in Q2 2018 and by $16 million or 1.3% in the first six months of the year, compared to the corresponding periods last year, as a result of:
- Continued escalation of programming and content costs for sports broadcast rights, primarily relating to the 2018 FIFA World Cup rights and production costs, as well as ongoing content expansion for CraveTV
- Higher OOH expenses driven by the revenue growth
These factors were partially offset by:
- Lower labour costs driven mainly by workforce reductions
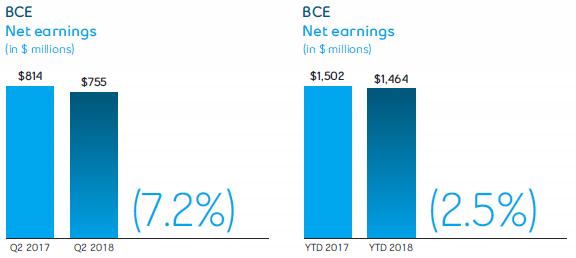
Net earnings decreased by 7.2% in the second quarter of 2018, compared to the same period last year, due to higher other expense and higher depreciation and amortization expense, partly offset by higher adjusted EBITDA, as growing revenues more than offset an increase in operating costs.
Year to date, net earnings of $1,464 million decreased by 2.5%, compared to the same period last year, due to higher other expense and higher depreciation and amortization expense, partly offset by higher adjusted EBITDA, as growing revenues more than offset an increase in operating costs, and lower severance, acquisition and other costs.
| 8 BCE Inc. 2018 SECOND QUARTER SHAREHOLDER REPORT |
|
| | | | |
| | 2 | MD&A | Consolidated financial analysis |
| Q2 2018 | | Q2 2017 | | $ CHANGE | | % CHANGE | | YTD 2018 | | YTD 2017 | | $ CHANGE | | % CHANGE | |
Bell Wireless | 904 | | 851 | | 53 | | 6.2 | % | 1,726 | | 1,620 | | 106 | | 6.5 | % |
Bell Wireline | 1,321 | | 1,307 | | 14 | | 1.1 | % | 2,623 | | 2,570 | | 53 | | 2.1 | % |
Bell Media | 205 | | 224 | | (19 | ) | (8.5 | %) | 335 | | 358 | | (23 | ) | (6.4 | %) |
Total BCE adjusted EBITDA | 2,430 | | 2,382 | | 48 | | 2.0 | % | 4,684 | | 4,548 | | 136 | | 3.0 | % |
BCE
BCE’s adjusted EBITDA increased by 2.0% in Q2 2018 and by 3.0% in the first six months of the year, compared to the same periods last year, attributable to growth in both our Bell Wireless and Bell Wireline segments, offset in part by a decline in our Bell Media segment. This resulted in adjusted EBITDA margin of 42.0% in Q2 2018, representing an increase over the 41.9% experienced in Q2 2017. Conversely, the adjusted EBITDA margin declined from 41.3% in the first six months of 2017 to 41.2% in the same period in 2018, reflecting a $14 million retroactive regulatory impact from the CRTC decision on wholesale wireless domestic roaming rates in Q1 2018.
The increase in adjusted EBITDA was driven by higher wireless, Internet, IPTV and IP-based revenues, along with continued effective cost containment. This was moderated by the ongoing erosion in our voice, satellite TV and legacy data revenues, lower media revenues, higher cost of goods sold and escalating programming and content costs. The first half of the year was also favourably impacted by the contribution from the acquisition of MTS, offset in part by higher pension expense due to a gain realized in Q1 2017.
BELL WIRELESS
Bell Wireless adjusted EBITDA grew by 6.2% in Q2 2018 and by 6.5% in the first six months of the year, compared to the same periods last year, driven by higher operating revenues, moderated by increased operating expenses. The first half of the year was also favourably impacted by the acquisition of MTS, offset in part by the unfavourable retroactive impact of the CRTC decision on wholesale wireless domestic roaming rates of $14 million.
BELL WIRELINE
Bell Wireline adjusted EBITDA grew by 1.1% in Q2 2018 and by 2.1% during the first six months of the year, compared to the same periods last year, due to continued growth in Internet, IPTV and IP-based revenues, and disciplined cost management. This was offset in part by the continued erosion of voice, satellite TV and legacy data revenues, including continued but moderating pressures in our business market. Additionally, the first half of the year was favourably impacted by the acquisition of MTS, offset in part by increased pension expense as a result of a gain realized in Q1 2017.
BELL MEDIA
Bell Media adjusted EBITDA decreased by 8.5% in Q2 2018 and by 6.4% in the first half of the year, compared to the same periods in 2017, due to lower operating revenues combined with higher operating expenses.
BCE Inc. 2018 SECOND QUARTER SHAREHOLDER REPORT 9 |
|
| | | | |
2 | MD&A | Consolidated financial analysis | |
| 2.7Severance, acquisition and other costs |
2018
Severance, acquisition and other costs of $24 million in the second quarter of 2018 and on a year-to-date basis included:
- Severance costs related to workforce reduction initiatives of $15 million in Q2 2018 and $24 million on a year-to-date basis
- Acquisition and other costs of $9 million in Q2 2018 and nil on a year-to-date basis, including transaction costs, such as legal and financial advisory fees, related to completed or potential acquisitions
2017
Severance, acquisition and other costs of $36 million in the second quarter of 2017 and $120 million on a year-to-date basis included:
- Severance costs related to workforce reduction initiatives of $16 million in Q2 2017 and $47 million on a year-to-date basis
- Acquisition and other costs of $20 million in Q2 2017 and $73 million on a year-to-date basis, including transaction costs, such as legal and financial advisory fees, related to completed or potential acquisitions, severance and integration costs relating to the MTS acquisition as well as a loss on sale of spectrum licences to Xplornet Communications Inc. incurred in Q1 2017.
| 2.8Depreciation and amortization |
DEPRECIATION
Depreciation in the second quarter and on a year-to-date basis in 2018 increased by $20 million and $76 million, respectively, compared to the same periods in 2017, mainly due to a higher asset base as we continued to invest in our broadband and wireless networks as well as our IPTV service. The year-to-date increase in depreciation also reflects the acquisition of MTS.
AMORTIZATION
Amortization in the second quarter and on a year-to-date basis in 2018 increased by $11 million and $38 million, respectively, compared to the same periods in 2017, mainly due to a higher asset base. The year-to-date increase in amortization also reflects the acquisition of MTS.
INTEREST EXPENSE
Interest expense in the second quarter of 2018 and on a year-to-date basis in 2018 increased by $8 million and $14 million, respectively, compared to the same periods last year, mainly as a result of higher average debt levels. The year-to-date increase in interest expense also reflects the acquisition of MTS.
INTEREST ON POST-EMPLOYMENT BENEFIT OBLIGATIONS
Interest on our post-employment benefit obligations is based on market conditions that existed at the beginning of the year. On January 1, 2018, the discount rate was 3.6% compared to 4.0% on January 1, 2017.
In the second quarter of 2018 and on a year-to-date basis in 2018, interest expense on post-employment benefit obligations decreased by $1 million and $2 million, respectively, compared to the same periods last year, due to a lower discount rate, partly offset by a higher post-employment benefit obligation at the beginning of the year.
The impacts of changes in market conditions during the year are recognized in the other comprehensive income (loss) (OCI).
| 2.10Other (expense) income |
2018
Other expense of $88 million in the second quarter of 2018 included losses from our equity investments which included BCE’s share of an obligation to repurchase at fair value the minority interest in one of BCE’s joint ventures, net mark-to-market losses on derivatives used to economically hedge equity settled share-based compensation plans and early debt redemption costs.
Other expense of $149 million on a year-to-date basis in 2018 included net mark-to-market losses on derivatives used to economically hedge equity settled share-based compensation plans, losses from our equity investments which included BCE’s share of an obligation to repurchase at fair value the minority interest in one of BCE’s joint ventures and early debt redemption costs.
2017
Other expense of $1 million in the second quarter of 2017 included losses on retirements and disposals of property, plant and equipment and intangible assets, partly offset by income from our equity investments.
Other income of $16 million on a year-to-date basis in 2017 included income from our equity investments and mark-to-market gains on derivatives used to economically hedge equity settled share-based compensation plans, partly offset by losses on retirements and disposals of property, plant and equipment and intangible assets and losses on investments.
| 10 BCE Inc. 2018 SECOND QUARTER SHAREHOLDER REPORT |
|
| | | | |
| | 2 | MD&A | Consolidated financial analysis |
Income taxes in the second quarter of 2018 decreased by $6 million, compared to the same period last year, due mainly to lower taxable income.
Income taxes on a year-to-date basis in 2018 decreased by $21 million compared to the same period last year, due mainly to lower taxable income and a higher value of uncertain tax positions favourably resolved in 2018 compared to 2017.
| 2.12Net earnings attributable to common shareholders and EPS |
Net earnings attributable to common shareholders of $704 million in the second quarter of 2018 decreased by $61 million, compared to the same period last year, due to higher other expense and higher depreciation and amortization expense, partly offset by higher adjusted EBITDA, as growing revenues more than offset an increase in operating costs.
Year to date, net earnings attributable to common shareholders of $1,365 million decreased by $42 million, compared to the same period last year, due to higher other expense and higher depreciation and amortization expense, partly offset by higher adjusted EBITDA, as growing revenues more than offset an increase in operating costs, and lower severance, acquisition and other costs.
BCE’s EPS of $0.79 in Q2 2018 and $1.52 on a year-to-date basis in 2018 decreased by $0.06, respectively, compared to the same periods last year.
Excluding the impact of severance, acquisition and other costs, net mark-to-market (losses) gains on derivatives used to economically hedge equity settled share-based compensation plans, net (losses) gains on investments, early debt redemption costs and impairment charges, adjusted net earnings in the second quarter of 2018 was $777 million, or $0.86 per common share, compared to $795 million, or $0.89 per common share, for the same period last year. Adjusted net earnings in the first half of 2018 was $1,496 million, or $1.66 per common share, compared to $1,498 million, or $1.69 per common share, for the first six months of 2017.
BCE Inc. 2018 SECOND QUARTER SHAREHOLDER REPORT 11 |
|
| | | | |
3 | MD&A | Business segment analysis
Bell Wireless | |
| 3 Business segment analysis |
KEY BUSINESS DEVELOPMENTS
VIRGIN MOBILE RANKED HIGHEST IN CUSTOMER CARE SATISFACTION
Virgin Mobile Canada (Virgin Mobile) was ranked highest in overall customer care satisfaction in the J.D. Power 2018 Canada Wireless Customer Care Study for the second consecutive year. The study was based on an online survey of more than 5,000 Canadian wireless customers about their service experiences. As the top-ranked provider, Virgin Mobile was cited for its strong performance in satisfaction with phone, in-store and online support as well as clarity of information on company websites, user forums and social media.
MOBILE DEVICE LINEUP EXPANDED
Bell Mobility’s extensive device lineup continued to expand in Q2 2018 with the addition of a number of new Fourth Generation (4G) long-term evolution (LTE) and LTE advanced (LTE-A) devices from leading handset manufacturers, including the LG G7 ThinQ, the Sony Xperia XZ2, Huawei’s P20 and P20 Pro smartphones featuring advanced Leica cameras, BlackBerry’s KEY2 and the Sonim XP8, a rugged device built for demanding work environments with a dedicated Push-to-Talk button.
BELL DELIVERS INNOVATIVE INTERNET OF THINGS FUEL MONITORING SOLUTION
On June 14, 2018, Bell entered into a multi-year agreement with Superior Propane, a subsidiary of Superior Plus Corp., to deliver a comprehensive fuel tank monitoring solution for its business and residential customers on Bell’s national LTE mobile network. Leveraging Bell’s leadership in the fast-growing Internet of Things sector, the remote monitoring solution provides reliable and accurate data on fuel levels at Superior customer locations across the country.
| FINANCIAL PERFORMANCE ANALYSIS |
Q2 2018 PERFORMANCE HIGHLIGHTS
| 12 BCE Inc. 2018 SECOND QUARTER SHAREHOLDER REPORT |
|
| | | | |
| | 3 | MD&A | Business segment analysis
Bell Wireless |
| (1) | At the beginning of Q1 2018, we adjusted our postpaid wireless subscriber base to remove 16,116 subscribers with a corresponding increase to our high-speed Internet subscribers to reflect the transfer of fixed wireless Internet subscribers. |
BELL WIRELESS RESULTS
REVENUES
| Q2 2018 | | Q2 2017 | | $ CHANGE | | % CHANGE | | YTD 2018 | | YTD 2017 | | $ CHANGE | | % CHANGE | |
External service revenues | 1,562 | | 1,508 | | 54 | | 3.6 | % | 3,062 | | 2,923 | | 139 | | 4.8 | % |
Inter-segment service revenues | 12 | | 11 | | 1 | | 9.1 | | 24 | | 21 | | 3 | | 14.3 | % |
Total operating service revenues | 1,574 | | 1,519 | | 55 | | 3.6 | % | 3,086 | | 2,944 | | 142 | | 4.8 | % |
External product revenues | 470 | | 430 | | 40 | | 9.3 | % | 904 | | 771 | | 133 | | 17.3 | % |
Inter-segment product revenues | 2 | | — | | 2 | | n.m. | | 2 | | 1 | | 1 | | 100.0 | % |
Total operating product revenues | 472 | | 430 | | 42 | | 9.8 | % | 906 | | 772 | | 134 | | 17.4 | % |
Total Bell Wireless revenues | 2,046 | | 1,949 | | 97 | | 5.0 | % | 3,992 | | 3,716 | | 276 | | 7.4 | % |
Bell Wireless operating revenuesincreased by 5.0% in Q2 2018 and by 7.4% year to date, compared to the same periods last year, due to both higher service and product revenues.
- Service revenuesincreased by 3.6% in this quarter and by 4.8% for the first half of the year, driven by a higher postpaid subscriber base with a stable blended ARPU. The growth in year-to-date service revenues was also favourably impacted by the acquisition of MTS, moderated by the unfavourable retroactive impact of the CRTC decision on wholesale wireless domestic roaming rates of $14 million.
- Product revenuesgrew by 9.8% in the current quarter and by 17.4% year to date, due to a larger proportion of premium smartphone devices in our sales mix and higher retail handset prices resulting in a greater allocation of revenues to product revenues, along with higher sales volumes from greater gross activations. The first half of the year was also favourably impacted by the acquisition of MTS and higher upgrade volumes.
OPERATING COSTS AND ADJUSTED EBITDA
| Q2 2018 | | Q2 2017 | | $ CHANGE | | % CHANGE | | YTD 2018 | | YTD 2017 | | $ CHANGE | | % CHANGE | |
Operating costs | (1,142 | ) | (1,098 | ) | (44 | ) | (4.0 | %) | (2,266 | ) | (2,096 | ) | (170 | ) | (8.1 | %) |
Adjusted EBITDA | 904 | | 851 | | 53 | | 6.2 | % | 1,726 | | 1,620 | | 106 | | 6.5 | % |
Total adjusted EBITDA margin | 44.2 | % | 43.7 | % | | | 0.5 | pts | 43.2 | % | 43.6 | % | | | (0.4 | ) pts |
Bell Wireless operating costsincreased by 4.0% in Q2 2018, compared to last year as a result of:
- Increased product cost of goods sold due to greater sales volumes and higher handset costs
- Increased labour costs to support the growth of the business
- Higher network operating costs driven by the expansion of network capacity to support subscriber growth and increased data consumption
These factors were partially offset by:
Operating costs for the first half of the year were up 8.1%, driven by the higher costs as noted above, as well as increased costs related to the acquisition of MTS and greater advertising expense due to the PyeongChang 2018 Winter Olympics.
Bell Wireless adjusted EBITDAgrew by 6.2% in Q2 2018 and by 6.5% in the first six months of the year, compared to the same periods last year, driven by higher operating revenues, moderated by increased operating expenses. The first half of the year was also favourably impacted by the acquisition of MTS, offset in part by the unfavourable retroactive impact of the CRTC decision on wholesale wireless domestic roaming rates of $14 million. Adjusted EBITDA margin, based on wireless operating revenues, increased by 0.5 pts in Q2 2018, compared to the prior year, due to the revenue growth flow-through. Conversely, the year-to-date EBITDA margin was 0.4 pts lower, compared to last year, due to the higher proportion of low-margin product sales in our total revenue base.
BCE Inc. 2018 SECOND QUARTER SHAREHOLDER REPORT 13 |
|
| | | | |
3 | MD&A | Business segment analysis
Bell Wireless | |
BELL WIRELESS OPERATING METRICS
| Q2 2018 | | Q2 2017 | | CHANGE | | % CHANGE | | YTD 2018 | | YTD 2017 | | CHANGE | | % CHANGE | |
Blended ARPU ($/month) | 55.53 | | 55.61 | | (0.08 | ) | (0.1 | %) | 54.91 | | 54.97 | | (0.06 | ) | (0.1 | %) |
Blended ABPU ($/month) | 67.71 | | 67.28 | | 0.43 | | 0.6 | % | 67.14 | | 66.48 | | 0.66 | | 1.0 | % |
Gross activations | 468,152 | | 403,418 | | 64,734 | | 16.0 | % | 872,942 | | 751,870 | | 121,072 | | 16.1 | % |
Postpaid | 394,136 | | 339,392 | | 54,744 | | 16.1 | % | 741,455 | | 636,008 | | 105,447 | | 16.6 | % |
Prepaid | 74,016 | | 64,026 | | 9,990 | | 15.6 | % | 131,487 | | 115,862 | | 15,625 | | 13.5 | % |
Net activations (losses) | 114,486 | | 66,916 | | 47,570 | | 71.1 | % | 158,863 | | 67,588 | | 91,275 | | 135.0 | % |
Postpaid | 122,092 | | 88,611 | | 33,481 | | 37.8 | % | 190,579 | | 124,393 | | 66,186 | | 53.2 | % |
Prepaid | (7,606 | ) | (21,695 | ) | 14,089 | | 64.9 | % | (31,716 | ) | (56,805 | ) | 25,089 | | 44.2 | % |
Blended churn % (average per month) | 1.28 | % | 1.27 | % | | | (0.01 | ) pts | 1.29 | % | 1.31 | % | | | 0.02 | pts |
Postpaid | 1.10 | % | 1.08 | % | | | (0.02 | ) pts | 1.12 | % | 1.12 | % | | | — | |
Prepaid | 3.34 | % | 3.19 | % | | | (0.15 | ) pts | 3.37 | % | 3.24 | % | | | (0.13 | ) pts |
Subscribers(1) | 9,309,534 | | 8,901,291 | | 408,243 | | 4.6 | % | 9,309,534 | | 8,901,291 | | 408,243 | | 4.6 | % |
Postpaid(1) | 8,593,113 | | 8,126,264 | | 466,849 | | 5.7 | % | 8,593,113 | | 8,126,264 | | 466,849 | | 5.7 | % |
Prepaid | 716,421 | | 775,027 | | (58,606 | ) | (7.6 | %) | 716,421 | | 775,027 | | (58,606 | ) | (7.6 | %) |
| (1) | At the beginning of Q1 2018, we adjusted our postpaid wireless subscriber base to remove 16,116 subscribers with a corresponding increase to our high-speed Internet subscribers to reflect the transfer of fixed wireless Internet subscribers. |
Blended ARPUwas stable with a small decline of 0.1% for both Q2 2018 and the first half of the year, compared to the same periods last year, driven by lower data and voice overages due to greater take rate of plans with higher usage thresholds, lower ARPU from the long-term mobile services contract with Shared Services Canada and the dilutive impact on blended ARPU from the continued ramp-up in prepaid subscribers from Lucky Mobile. A larger proportion of premium smartphone devices in our sales mix and higher retail handset prices resulted in a greater allocation of revenues to product revenues, consequently unfavourably impacting blended ARPU. This decline was moderated by a higher proportion of postpaid customers in our total subscriber base, the flow-through of 2017 and 2018 pricing changes, increased demand for larger data plans driven by greater data consumption enabled by the higher speeds achieved from the continued expansion of our LTE and LTE-A networks and increased roaming revenues.
Blended ABPUapproximates the average amount billed to customers on a monthly basis and is the same as blended ARPU prior to the adoption of IFRS 15. Blended ABPU increased by 0.6% and 1.0%, in Q2 2018 and the first half of the year, respectively, compared to the same periods last year and was similarly impacted by the items affecting ARPU. However, since ABPU is based on average billing, it is not unfavorably impacted by the greater allocation to product revenues resulting from the shift in handset mix to premium devices and higher retail handset prices.
Total gross wireless activationsincreased by 16.0% in Q2 2018 and by 16.1% in the first half of the year, compared to the same periods in 2017, due to both higher postpaid and prepaid gross activations.
- Postpaid gross activationsincreased by 16.1% in the current quarter and by 16.6% year to date, reflecting our mobile network speed and technology leadership, effective sales execution across our retail channels, along with the continued on-boarding of customers from the long-term mobile services contract with Shared Services Canada. The first six months of the year were also favourably impacted by the contribution from the acquisition of MTS.
- Prepaid gross activationsincreased by 15.6% in Q2 2018 and by 13.5% year to date, driven by the contribution from Lucky Mobile
Blended wireless churnof 1.28% increased by 0.01 pts in the second quarter of 2018 reflecting both higher postpaid and prepaid churn. In the first six months of the year, the blended churn of 1.29% improved by 0.02 pts.
- Postpaid churnof 1.10% increased by 0.02 pts in Q2 2018, driven by greater promotional pricing in the market, more off-contract subscribers and greater business customer deactivations. In the first half of the year, the postpaid churn of 1.12% was stable compared to the same period last year.
- Prepaid churnincreased by 0.15 pts in the current quarter and by 0.13 pts year to date, to 3.34% and 3.37%, respectively, reflecting a declining subscriber base, in part offset by lower deactivations
Postpaid net activationsincreased by 37.8% in Q2 2018 and by 53.2% year to date, compared to the same periods last year, due to an increase in gross activations, partially offset by higher customer deactivations.
Prepaid net customer lossesimproved by 64.9% in the second quarter of 2018 and by 44.2% year to date, compared to the same periods last year, due to an increase in gross activations and lower customer deactivations.
Wireless subscribersat June 30, 2018 totaled 9,309,534, up 4.6% from 8,901,291 subscribers reported at the end of Q2 2017. The proportion of Bell Wireless customers subscribing to postpaid services increased by 1.0 pts to 92% in Q2 2018, compared to the same period in 2017.
| 14 BCE Inc. 2018 SECOND QUARTER SHAREHOLDER REPORT |
|
| | | | |
| | 3 | MD&A | Business segment analysis
Bell Wireless |
As at the date of this MD&A, our forward-looking statements set out in the BCE 2017 Annual MD&A, as updated or supplemented in the BCE 2018 First Quarter MD&A and in this MD&A, are based on certain assumptions including, without limitation, the following assumptions and the assumptions referred to in each of the other business segment discussions set out in this section 3,Business segment analysis, as well as the economic and market assumptions referred to in section 1.3,Assumptions, of this MD&A.
- Maintain our market share of incumbent wireless postpaid net additions
- Continued adoption of smartphone devices, tablets and data applications, as well as the introduction of more 4G LTE and LTE-A devices and new data services
- Higher handset cost, driven by a higher sales mix of premium devices, increased new customer activations and more customer device upgrades attributable to a higher number of off-contract subscribers due to earlier expiries under two-year contracts
- Wireless revenue growth driven by postpaid subscriber base expansion and a higher volume of handset sales
- Expansion of the LTE-A network coverage to approximately 92% of the Canadian population
- Ability to monetize increasing data usage and customer subscriptions to new data services
- Ongoing technological improvements by handset manufacturers and from faster data network speeds that allow customers to optimize the use of our services
- No material financial, operational or competitive consequences of changes in regulations affecting our wireless business
BCE Inc. 2018 SECOND QUARTER SHAREHOLDER REPORT 15 |
|
| | | | |
3 | MD&A | Business segment analysis
Bell Wireline | |
KEY BUSINESS DEVELOPMENTS
EXPANSION OF ALL-FIBRE BROADBAND NETWORK ACROSS THE GTA/905 REGION
As part of Bell’s plan to deploy all-fibre connections to an additional 1.3 million homes and businesses throughout the populous and fast-growing Greater Toronto Area (GTA)/905 region surrounding Toronto, Bell announced projects in Q2 2018 in a number of communities as part of this buildout, including: approximately 60,000 homes and business locations throughout the City of Oshawa; more than 28,000 residences and businesses in the Municipality of Clarington; approximately 15,000 homes and business locations throughout the City of Orillia; and approximately 38,000 residences and business locations in the Chatham-Kent region.
With a direct fibre footprint encompassing more than 4.2 million homes and commercial locations across our expansive wireline footprint at the end of Q2 2018, up from approximately 3.7 million at the end of 2017, Bell offers the largest Gigabit Internet service footprint in Canada.
BELL LEADS THE WAY IN INTERNET SPEED RANKINGS
Bell took the top spot in PCMag’s “The Fastest ISPs of 2018: Canada,” delivering the highest overall Internet speed index ever recorded in Canada to date by the magazine and scoring more than 30% higher than our nearest competitor. Atlantic Canada’s Bell Aliant also took second place in the speed tests while Manitoba’s Bell MTS moved into the top 10 for the first time. PCMag’s conclusions were based on nearly 12,000 tests of Canadian Internet service providers large and small between September 2017 and June 2018.
NEW DOWNLOAD & GO FIBE TV APP FEATURE TO WATCH RECORDINGS OFFLINE
In another television innovation from Bell, Fibe TV customers in Ontario, Québec and Atlantic Canada can now download their personal video recorder recordings with the Fibe TV app to watch on iOS and Android mobile devices even without Wi-Fi. Download & Go joins Restart, Wireless TV, the Fibe TV app and Alt TV in a growing list of service innovations that have made Bell the leading television provider in Canada.
BELL RECOGNIZED AS CANADIAN SECURITY SERVICES LEADER
Bell was named a Canadian leader in security services by global IT and telecom advisory firm International Data Corporation (IDC) in its 2018 Canadian Security Services Vendor Assessment Report for the third consecutive year. IDC’s review of Canada’s major security service providers highlights Bell’s exceptionally broad range of professional services including cloud security, advanced threat detection and proactive mitigation, backed by our highly qualified team and world-class networks. The report also cites Bell’s ability to support next-generation technologies as key to our ongoing leadership in this fast-growing line of business.
| FINANCIAL PERFORMANCE ANALYSIS |
Q2 2018 PERFORMANCE HIGHLIGHTS
| 16 BCE Inc. 2018 SECOND QUARTER SHAREHOLDER REPORT |
|
| | | | |
| | 3 | MD&A | Business segment analysis
Bell Wireline |
| (1) | At the beginning of Q1 2018, our high-speed Internet subscriber base was increased by 19,835, our IPTV by 14,599 and our residential NAS by 23,441, mainly as a result of a small acquisition made in Q1 2018. |
| (2) | At the beginning of Q1 2018, we adjusted our high-speed Internet subscriber base to add 16,116 subscribers with a corresponding decrease to our postpaid wireless subscribers to reflect the transfer of fixed wireless Internet subscribers. |
BELL WIRELINE RESULTS
REVENUES
| Q2 2018 | | Q2 2017 | | $ CHANGE | | % CHANGE | | YTD 2018 | | YTD 2017 | | $ CHANGE | | % CHANGE | |
Data | 1,869 | | 1,812 | | 57 | | 3.1 | % | 3,689 | | 3,531 | | 158 | | 4.5 | % |
Voice | 957 | | 1,020 | | (63 | ) | (6.2 | %) | 1,907 | | 2,001 | | (94 | ) | (4.7 | %) |
Other services | 64 | | 55 | | 9 | | 16.4 | % | 127 | | 99 | | 28 | | 28.3 | % |
Total external service revenues | 2,890 | | 2,887 | | 3 | | 0.1 | % | 5,723 | | 5,631 | | 92 | | 1.6 | % |
Inter-segment service revenues | 57 | | 49 | | 8 | | 16.3 | % | 116 | | 98 | | 18 | | 18.4 | % |
Total operating service revenues | 2,947 | | 2,936 | | 11 | | 0.4 | % | 5,839 | | 5,729 | | 110 | | 1.9 | % |
Data | 98 | | 95 | | 3 | | 3.2 | % | 202 | | 194 | | 8 | | 4.1 | % |
Equipment and other | 89 | | 85 | | 4 | | 4.7 | % | 177 | | 170 | | 7 | | 4.1 | % |
Total external product revenues | 187 | | 180 | | 7 | | 3.9 | % | 379 | | 364 | | 15 | | 4.1 | % |
Inter-segment product revenues | 1 | | 1 | | — | | — | | 1 | | 1 | | — | | — | |
Total operating product revenues | 188 | | 181 | | 7 | | 3.9 | % | 380 | | 365 | | 15 | | 4.1 | % |
Total Bell Wireline revenues | 3,135 | | 3,117 | | 18 | | 0.6 | % | 6,219 | | 6,094 | | 125 | | 2.1 | % |
Bell Wireline operating revenuesgrew by 0.6% in Q2 2018 and by 2.1% in the first six months of 2018, compared to the same periods in 2017, as a result of higher data, other services and product revenues, offset in part by ongoing declines in voice revenue.
Bell Wireline operating service revenuesincreased by 0.4% and 1.9% in Q2 2018 and the first half of the year, respectively, compared to the same periods last year, driven by continued growth in Internet and IPTV subscribers, greater household ARPU, higher IP-based services revenue, and the contribution from the acquisition of AlarmForce. Additionally, the first six months of the year were favourably impacted by the acquisition of MTS. This was moderated by ongoing erosion in our voice, satellite TV and legacy data services, combined with greater residential customer acquisition, retention and bundle discounts to match aggressive offers from cable competitors. The continuing but moderating decline in our business markets reflected the benefit from the G7 summit and the Ontario general election held during Q2 2018.
- Data revenuesgrew by 3.1% in Q2 2018 and by 4.5% during the first half of the year, compared to the same periods last year, due to growth in Internet and IPTV subscribers along with rate increases, as well as greater IP-based services revenue driven by the G7 summit and higher professional services revenue from the Ontario general election. This was partly offset by higher acquisition, retention and bundle discounts on residential services due to aggressive offers from cable competitors, the continued decline in our satellite TV subscriber base, and ongoing legacy data erosion due in part to migrations to IP-based services and competitive pricing pressures in our business and wholesale markets. Year-to-date revenues were also favourably impacted by the acquisition of MTS.
- Voice revenuesdecreased by 6.2% in Q2 2018 and by 4.7% in the first six months of the year, compared to the same periods last year, resulting from continued NAS line erosion due to technological substitution to wireless and Internet-based services, large business customer conversions to IP-based data services, combined with competitive pricing pressures, which unfavourably impacted both local and access and long distance revenues. Ongoing long distance rate pressures in our residential market from customer adoption of premium rate plans coupled with reduced sales of international long distance minutes in our wholesale market, also unfavourably impacted voice revenues. This was mitigated by rate increases on our voice services and the contribution from the acquisition of MTS which favourably impacted the first six months of the year.
- Other services revenuesincreased by 16.4% in Q2 2018 and by 28.3% in the first half of the year, compared to the same periods last year, due to the acquisition of AlarmForce.
Bell Wireline product revenuesgrew by 3.9% and 4.1%, in Q2 2018 and year to date, respectively, compared to the same periods in 2017, resulting from increased sales of telecommunication equipment along with the contribution from the acquisition of AlarmForce. Year-to-date revenues were also favourably impacted by the acquisition of MTS.
BCE Inc. 2018 SECOND QUARTER SHAREHOLDER REPORT 17 |
|
| | | | |
3 | MD&A | Business segment analysis
Bell Wireline | |
OPERATING COSTS AND ADJUSTED EBITDA
| Q2 2018 | | Q2 2017 | | $ CHANGE | | % CHANGE | | YTD 2018 | | YTD 2017 | | $ CHANGE | | % CHANGE | |
Operating costs | (1,814 | ) | (1,810 | ) | (4 | ) | (0.2 | %) | (3,596 | ) | (3,524 | ) | (72 | ) | (2.0 | %) |
Adjusted EBITDA | 1,321 | | 1,307 | | 14 | | 1.1 | % | 2,623 | | 2,570 | | 53 | | 2.1 | % |
Adjusted EBITDA margin | 42.1 | % | 41.9 | % | | | 0.2 | pts | 42.2 | % | 42.2 | % | | | — | |
Bell Wireline operating costs increased by 0.2% in Q2 2018 and by 2.0% in the first half of the year, compared to the same periods in 2017, driven by:
- Increased expenses from the acquisition of AlarmForce
- Higher marketing expense mainly in our residential market to support subscriber acquisition, including increased advertising spend in Q1 2018 during the PyeongChang 2018 Winter Olympics
- Higher cost of goods sold driven by increased product sales
- Greater programming and content costs in our TV business from contractual rate increases
These factors were partially offset by:
- Reduced labour costs attributable to workforce reductions, savings from lower call volumes to customer service centers, and lower vendor contract expenses
- Decreased payments to other carriers resulting from lower sales of international long distance minutes
Operating expenses in the first half of the year, compared to last year, were further unfavourably impacted by the acquisition of MTS and higher pension expense due to a gain in Q1 2017 on post-employment benefit expense related to an alignment of certain Bell Aliant DB pension plans with those of Bell Canada.
Bell Wireline adjusted EBITDAgrew by 1.1% in Q2 2018 and by 2.1% during the first six months of the year, compared to the same periods last year. Adjusted EBITDA margin of 42.1% in Q2 2018 increased by 0.2 pts whereas year-to-date adjusted EBITDA margin of 42.2% was stable compared to last year. The year-over-year increase in adjusted EBITDA was driven by continued growth in Internet, IPTV and IP-based revenues, and disciplined cost management. This was offset in part by the continued erosion of voice, satellite TV and legacy data revenues, including continued but moderating pressures in our business market. Additionally, the first half of the year, was favourably impacted by the acquisition of MTS, offset in part by increased pension expense as a result of a gain realized in Q1 2017.
BELL WIRELINE OPERATING METRICS
DATA
High-speed Internet
| Q2 2018 | | Q2 2017 | | CHANGE | | % CHANGE | | YTD 2018 | | YTD 2017 | | CHANGE | | % CHANGE | |
High-speed Internet net activations | 10,816 | | 1,407 | | 9,409 | | 668.7 | % | 30,463 | | 16,396 | | 14,067 | | 85.8 | % |
High-speed Internet subscribers(1)(2) | 3,856,555 | | 3,718,677 | | 137,878 | | 3.7 | % | 3,856,555 | | 3,718,677 | | 137,878 | | 3.7 | % |
| (1) | At the beginning of Q1 2018, our high-speed Internet subscriber base was increased by 19,835, mainly as a result of a small acquisition made in Q1 2018. |
| (2) | At the beginning of Q1 2018, we adjusted our high-speed Internet subscriber base to add 16,116 subscribers with a corresponding decrease to our postpaid wireless subscribers to reflect the transfer of fixed wireless Internet subscribers. |
High-speed Internet subscriber net activationsgrew by 9,409 in Q2 2018 and by 14,067 in the first half of the year, compared to the same periods in 2017, driven by higher net activations from Home Internet service by Virgin Mobile, greater retail gross activations in our fibre-to-the-home (FTTH) footprint and higher IPTV pull-through. The growth was moderated by aggressive offers from cable competitors in both our retail and wholesale markets, an increased number of retail customers coming off promotional offers, as well as greater student deactivations.
High-speed Internet subscribersat June 30, 2018 totaled 3,856,555 up 3.7% from the end of Q2 of last year.
TV
| Q2 2018 | | Q2 2017 | | CHANGE | | % CHANGE | | YTD 2018 | | YTD 2017 | | CHANGE | | % CHANGE | |
Net subscriber activations (losses) | 809 | | (13,337 | ) | 14,146 | | 106.1 | % | (11,672 | ) | (29,000 | ) | 17,328 | | 59.8 | % |
IPTV | 20,653 | | 16,427 | | 4,226 | | 25.7 | % | 34,226 | | 38,829 | | (4,603 | ) | (11.9 | %) |
Total subscribers(1) | 2,835,227 | | 2,824,016 | | 11,211 | | 0.4 | % | 2,835,227 | | 2,824,016 | | 11,211 | | 0.4 | % |
IPTV(1) | 1,599,142 | | 1,481,434 | | 117,708 | | 7.9 | % | 1,599,142 | | 1,481,434 | | 117,708 | | 7.9 | % |
| (1) | At the beginning of Q1 2018, our IPTV subscriber base was increased by 14,599 as a result of a small acquisition made in Q1 2018. |
IPTV net subscriber activations increasedby 25.7% in Q2 2018, compared to the same period last year, driven by higher activations from Alt TV, our application-based live TV service launched in May 2017, greater gross activations in our FTTH and fibre-to-the-node footprint and increased new footprint expansion in 2018. This was moderated by higher deactivations attributable to aggressive service bundle offers from cable competitors, a higher number of retail customers coming off promotional offers, increased substitution of traditional TV services with OTT services, reduced customer migrations from satellite TV, and the impact of maturing Fibe TV markets. Year-to-date IPTV net additions declined by 11.9% as higher deactivations, driven by the factors described above, were only partially offset by increased activations.
Satellite TV net subscriber lossesimproved by 33.3% in Q2 2018 and by 32.3% in the first half of the year, compared to the same periods last year, resulting from lower retail deactivations and less migrations to IPTV reflecting a more mature subscriber base geographically better-suited for satellite TV service, improved retention rates, along with a fewer number of customers coming off promotional offers. This was moderated by aggressive residential promotional offers from cable competitors, primarily in our non-FTTH footprint.
| 18 BCE Inc. 2018 SECOND QUARTER SHAREHOLDER REPORT |
|
| | | | |
| | 3 | MD&A | Business segment analysis
Bell Wireline |
Total TV net subscriber activations(IPTV and satellite TV combined) improved by 14,146 in Q2 2018, compared to Q2 2017, resulting from fewer satellite TV net losses, along with higher IPTV net activations. Net subscriber losses improved by 17,328 in the first six months of the year, compared to last year, due to lower satellite TV net losses, offset in part by fewer IPTV net activations.
IPTV subscribersat June 30, 2018 totaled 1,599,142, up 7.9% from 1,481,434 subscribers reported at the end of Q2 2017.
Satellite TV subscribersat June 30, 2018 totaled 1,236,085, down 7.9% from 1,342,582 subscribers at the end of Q2 2017.
Total TV subscribers(IPTV and satellite TV combined) at June 30, 2018 were 2,835,227, representing a 0.4% increase since the end of the second quarter of 2017.
Voice
| Q2 2018 | | Q2 2017 | | CHANGE | | % CHANGE | | YTD 2018 | | YTD 2017 | | CHANGE | | % CHANGE | |
Residential NAS lines(1) | 3,126,551 | | 3,332,976 | | (206,425 | ) | (6.2 | %) | 3,126,551 | | 3,332,976 | | (206,425 | ) | (6.2 | %) |
Residential NAS net losses | (70,665 | ) | (67,005 | ) | (3,660 | ) | (5.5 | %) | (128,198 | ) | (140,426 | ) | 12,228 | | 8.7 | % |
| (1) | At the beginning of Q1 2018, our residential NAS subscriber base was increased by 23,441 as a result of a small acquisition made in Q1 2018. |
Residential NAS net losses increasedby 5.5% in Q2 2018, compared to Q2 2017, attributable to lower activations due to aggressive competitive offers from cable TV providers, combined with continued wireless and Internet-based technology substitution. Conversely, during the first six months of the year, residential NAS net losses improved by 8.7% resulting from fewer deactivations due to richer retention offers, along with a reduced number of customers coming off promotional offers in the first quarter of 2018.
Residential NAS subscribersat June 30, 2018 totaled 3,126,551, down 6.2% from 3,332,976 subscribers reported at the end of Q2 2017. This represented an increase in the rate of erosion compared to the 1.9% decline experienced in the second quarter of 2017, mainly due to the year-over-year increase in subscribers from the acquisition of MTS which benefited Q2 2017.
As at the date of this MD&A, our forward-looking statements set out in the BCE 2017 Annual MD&A, as updated or supplemented in the BCE 2018 First Quarter MD&A and in this MD&A, are based on certain assumptions including, without limitation, the following assumptions and the assumptions referred to in each of the other business segment discussions set out in this section 3,Business segment analysis, as well as the economic and market assumptions referred to in section 1.3,Assumptions, of this MD&A.
- Positive full-year adjusted EBITDA growth
- Continued growth in residential IPTV and Internet subscribers
- Increasing wireless and Internet-based technological substitution
- Residential services household ARPU growth from increased penetration of multi-product households and price increases
- Aggressive residential service bundle offers from cable TV competitors in our local wireline areas
- Continued large business customer migration to IP-based systems
- Ongoing competitive repricing pressures in our business and wholesale markets
- Continued competitive intensity in our small and mid-sized business markets as cable operators and other telecom competitors continue to intensify their focus on business customers
- Traditional high-margin product categories challenged by large global cloud and OTT providers of business voice and data solutions expanding into Canada with on-demand services
- Accelerating customer adoption of OTT services resulting in downsizing of TV packages
- Ongoing deployment of direct fibre and growing consumption of OTT TV services and on-demand streaming video, as well as the proliferation of devices, such as tablets, that consume vast quantities of bandwidth, will require considerable ongoing capital investment
- Realization of cost savings related to management workforce attrition and retirements, lower contracted rates from our suppliers, reduction of traffic that is not on our network and operating synergies from the integration of MTS
- No material financial, operational or competitive consequences of changes in regulations affecting our wireline business
BCE Inc. 2018 SECOND QUARTER SHAREHOLDER REPORT 19 |
|
| | | | |
3 | MD&A | Business segment analysis
Bell Media | |
KEY BUSINESS DEVELOPMENTS
CTV IS CANADA’S MOST-WATCHED NETWORK FOR 17TH YEAR IN A ROW
CTV ended the core 2017/2018 television viewing season (fall, winter and spring) as the most-watched Canadian television network in primetime for a 17th year in a row. Final data from Numeris, a primary provider of viewership figures for television and radio outlets in Canada, confirmed that CTV had more top 20 programs in key demographics than all other competitors combined, with 12 of the top 20 among viewers aged 18 to 34. In addition, CTV laid claim to 6 or more of the top 10 programs in total viewers and all key demographics and delivered the top 4 new programs of the season. Numeris data also confirmed that CTV delivered 38% more viewers than its next closest competitor for those aged 25 to 54 and had 51% more live viewers than its closest competitor.
BELL MEDIA UNVEILS CTV-BRANDED CHANNELS AND MOVIE SERVICES
Bell Media will rebrand four of its leading entertainment specialty channels as CTV properties to leverage Canada’s favourite TV brand. Space, Bravo, Comedy, and Gusto will become CTV Sci-Fi, CTV Drama, CTV Comedy, and CTV Life. They will be joined by CTV Movies and CTV Vault, two new ad-supported video-on-demand (VOD) services, in a new CTV digital super-hub featuring all seven services. The rebrand of the four specialties will be preceded by the launch of two, new digital VOD services, CTV Movies and CTV Vault. The CTV super-hub will be available on connected devices everywhere, including the web, iOS, Android, Chromecast, Apple and Android TV, Xbox One, and Samsung smart TVs.
BELL MEDIA LAUNCHES TSN DIRECT AND RDS DIRECT
On June 7, 2018, Bell Media launched TSN Direct and RDS Direct, making TSN and RDS content available direct to consumers through a monthly subscription. Current TSN and RDS subscribers with participating television providers can continue to stream these networks, and have access to the on-demand content and bonus streams through the TSN app or TSN.ca/Live, and the RDS app or RDS.ca. TSN Direct and RDS Direct are available for $24.99 a month with no contract, allowing digital subscribers to access TSN and RDS’ programming through their computer, tablet, mobile device, Apple TV, Samsung SmartTV, and Xbox One, with more platforms to be announced soon.
NEW AND EXTENDED MULTI-YEAR STUDIO DEALS FOR TMN
Canada’s leading premium pay TV service, The Movie Network (TMN), secured exclusive deals with most major movie studios, delivering to subscribers the biggest Hollywood hit movies and film franchises across a variety of platforms including linear, on-demand, and digital for years to come. TMN has now locked in the exclusive, Canadian, first-window rights for film titles from: 20th Century Fox and Fox Searchlight Films; Entertainment One; Sony Pictures Entertainment; Universal Pictures and Focus Features; and Warner Bros. International Television Distribution. As was previously announced, Bell Media has also entered into a long-term agreement with Lionsgate to distribute Lionsgate’s future theatrical releases in Canada in a first pay window, and bring the Starz brand to Canada. These movie deals, coupled with the long-term agreements secured with premium TV brands HBO, SHOWTIME, and Starz, make Bell Media’s suite of Pay TV linear and streaming services home to some of the most critically acclaimed programming in the world. TMN has also secured offline viewing rights for these film titles that will continue to keep TMN growing across all platforms.
TERMINATION OF AGREEMENT TO ACQUIRE SÉRIES+ AND HISTORIA SPECIALTY CHANNELS
On October 17, 2017, BCE entered into an agreement with Corus Entertainment Inc. (Corus) to acquire French-language specialty channels Séries+ and Historia. On May 28, 2018, the Competition Bureau announced that it did not approve the sale of the channels to BCE. As a result, BCE and Corus terminated their agreement.
| 20 BCE Inc. 2018 SECOND QUARTER SHAREHOLDER REPORT |
|
| | | | |
| | 3 | MD&A | Business segment analysis
Bell Media |
| FINANCIAL PERFORMANCE ANALYSIS |
Q2 2018 PERFORMANCE HIGHLIGHTS
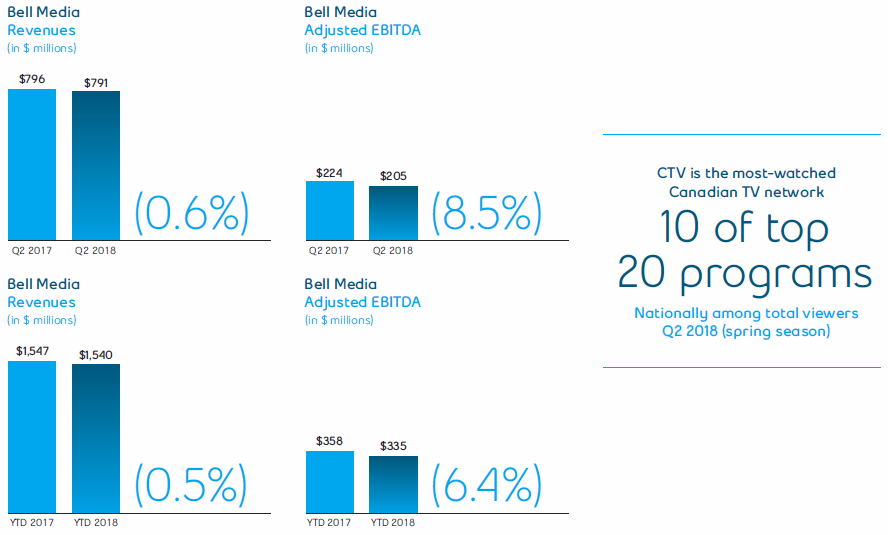
BELL MEDIA RESULTS
REVENUES
| Q2 2018 | | Q2 2017 | | $ CHANGE | | % CHANGE | | YTD 2018 | | YTD 2017 | | $ CHANGE | | % CHANGE | |
Total external revenues | 677 | | 683 | | (6 | ) | (0.9 | %) | 1,308 | | 1,335 | | (27 | ) | (2.0 | %) |
Inter-segment revenues | 114 | | 113 | | 1 | | 0.9 | % | 232 | | 212 | | 20 | | 9.4 | % |
Total Bell Media revenues | 791 | | 796 | | (5 | ) | (0.6 | %) | 1,540 | | 1,547 | | (7 | ) | (0.5 | %) |
Bell Media operating revenuesdecreased by $5 million, or 0.6%, in Q2 2018 and decreased by $7 million or 0.5% in the first six months of the year, compared to the same periods in 2017, driven by lower advertising revenues, offset in part by higher subscriber revenues.
Advertising revenuesdecreased in both Q2 2018 and in the first six months of 2018, compared to the same periods last year, driven by continued market softness, viewership declines and the ongoing shift in customer spending to OTT and digital platforms. These pressures were moderated by increased TV advertising revenues as a result of the broadcast of the 2018 FIFA World Cup and higher OOH advertising revenues mainly as a result of increased demand on digital faces. The decline in year-to-date advertising revenues also reflected the shift in advertising dollars in Q1 2018 to the main broadcaster of the PyeongChang 2018 Winter Olympics.
Subscriber revenuesgrew in both the second quarter and first six months of 2018, compared to the same periods last year, mainly due to continued subscriber growth in our TV Everywhere GO and CraveTV products along with the recent launch of TSN and RDS Direct, our direct-to-consumer sports streaming services, and rate increases to certain BDUs.
OPERATING COSTS AND ADJUSTED EBITDA
| Q2 2018 | | Q2 2017 | | $ CHANGE | | % CHANGE | | YTD 2018 | | YTD 2017 | | $ CHANGE | | % CHANGE | |
Operating costs | (586 | ) | (572 | ) | (14 | ) | (2.4 | %) | (1,205 | ) | (1,189 | ) | (16 | ) | (1.3 | %) |
Adjusted EBITDA | 205 | | 224 | | (19 | ) | (8.5 | %) | 335 | | 358 | | (23 | ) | (6.4 | %) |
Adjusted EBITDA margin | 25.9 | % | 28.1 | % | | | (2.2 | ) pts | 21.8 | % | 23.1 | % | | | (1.3 | ) pts |
BCE Inc. 2018 SECOND QUARTER SHAREHOLDER REPORT 21 |
|
| | | | |
3 | MD&A | Business segment analysis
Bell Media | |
Bell Media operating costs increased by $14 million or 2.4% in Q2 2018 and by $16 million or 1.3% in the first six months of the year, compared to the corresponding periods last year, mainly due to:
- Continued escalation of programming and content costs for sports broadcast rights, primarily 2018 FIFA World Cup rights and production costs, as well as ongoing content expansion for CraveTV
- Higher OOH expenses driven by the revenue growth
These factors were partially offset by:
- Lower labour costs driven mainly by workforce reductions
Bell Media adjusted EBITDAdecreased by 8.5% in Q2 2018 and by 6.4% in the first half of the year, compared to the same periods last year, as a result of lower operating revenues combined with higher operating expenses.
BELL MEDIA OPERATING METRICS
- CTV was the top ranked network in Canada for the 14th consecutive spring season among all key adult demographics in primetime, with ten of the top 20 programs nationally in key demographics. Among all key demographics, CTV had more shows in the spring top 20 than any other network.
- Bell Media continued to lead the Canadian TV media digital landscape in views, minutes watched, and videos served, with monthly averages of 436 million total views, 985 million minutes spent, and 79 million videos served. Bell Media was seventh among online properties in the country, reaching 67% of the digital audience and hit an all time monthly high in April 2018 with nearly 21 million unique visitors.
- Bell Media remained Canada’s top radio broadcaster, reaching 17.0 million listeners who spent 71.8 million hours tuned in each week
- Astral is one of Canada’s leading OOH advertising companies, reaching 14 million consumers weekly, with an offering of five innovative product lines and owning more than 31,000 advertising faces strategically located in key urban cities across the country
As at the date of this MD&A, our forward-looking statements set out in the BCE 2017 Annual MD&A, as updated or supplemented in the BCE 2018 First Quarter MD&A and in this MD&A, are based on certain assumptions including, without limitation, the following assumptions and the assumptions referred to in each of the other business segment discussions set out in this section 3,Business segment analysis, as well as the economic and market assumptions referred to in section 1.3,Assumptions, of this MD&A.
- Revenue performance is expected to reflect an improving TV advertising sales trajectory supported by our broadcast of the 2018 FIFA World Cup, further CraveTV subscriber growth and continued growth in outdoor advertising
- Operating cost growth driven by higher TV programming and sports broadcast rights costs, as well as continued investment in CraveTV content
- Continued scaling of CraveTV
- Ability to successfully acquire and produce highly rated programming and differentiated content
- Building and maintaining strategic supply arrangements for content across all screens and platforms
- Increased revenue generation from monetization of content rights and Bell Media properties across all platforms
- TV unbundling and growth in OTT viewing expected to result in lower subscriber levels for many Bell Media TV properties
- No material financial, operational or competitive consequences of changes in regulations affecting our media business
| 22 BCE Inc. 2018 SECOND QUARTER SHAREHOLDER REPORT |
|
| | | | |
| | 4 | MD&A | Financial and capital management |
| 4 Financial and capital management |
This section tells you how we manage our cash and capital resources to carry out our strategy and deliver financial results. It provides an analysis of our financial condition, cash flows and liquidity on a consolidated basis.
| JUNE 30, 2018 | | DECEMBER 31, 2017 | | $ CHANGE | | % CHANGE | |
Debt due within one year | 5,732 | | 5,178 | | 554 | | 10.7 | % |
Long-term debt | 18,367 | | 18,215 | | 152 | | 0.8 | % |
Preferred shares(2) | 2,002 | | 2,002 | | — | | — | |
Cash and cash equivalents | (390 | ) | (625 | ) | 235 | | 37.6 | % |
Net debt | 25,711 | | 24,770 | | 941 | | 3.8 | % |
| (1) | Net debt is a non-GAAP financial measure and does not have a standardized meaning under IFRS. Therefore, it is unlikely to be comparable to similar measures presented by other issuers. See section 8.2,Non-GAAP financial measures and key performance indicators (KPIs) – Net debtin this MD&A for more details including a reconciliation to the most comparable IFRS financial measure. |
| (2) | 50% of outstanding preferred shares of $4,004 million in 2018 and 2017 are classified as debt consistent with the treatment by some credit rating agencies. |
The increase of $706 million in total debt comprised of debt due within one year and long-term debt was due to:
- the issuance by Bell Canada of Series M-47 MTN debentures and Series US-1 notes with total principal amounts of $500 million and US $750 million (CAD $967 million), respectively
- an increase in our notes payable (net of repayments) of $40 million
- a net increase of $99 million in our other debt and finance lease obligations
Partly offset by:
- the early redemption of Series M-28 MTN debentures in the principal amount of $400 million
- the early redemption of Series M-33 debentures in the principal amount of $300 million
- the early redemption of Series 9 notes in the principal amount of $200 million
The decrease in cash and cash equivalents of $235 million was due mainly to:
- $1,324 million of dividends paid on BCE common shares
- $244 million paid for business acquisitions mainly related to the acquisition of AlarmForce
- $175 million paid for the repurchase of common shares through a NCIB
- $137 million paid for the purchase on the open market of shares for the settlement of share-based payments
- $46 million acquisition and other costs paid
- $41 million return of capital to non-controlling interest
- $36 million acquisition of spectrum licences
Partly offset by:
- $1,531 million of free cash flow
- $263 million of debt issuances (net of repayments)
- $68 million of disposition of intangibles and other assets for the sale of AlarmForce’s approximate 39,000 customer accounts to TELUS Communications Inc. (Telus)
| 4.2Outstanding share data |
| NUMBER | |
COMMON SHARES OUTSTANDING | OF SHARES | |
Outstanding, January 1, 2018 | 900,996,640 | |
Shares issued for the acquisition of AlarmForce | 22,531 | |
Shares issued under employee stock option plan | 59,756 | |
Repurchase of common shares | (3,085,697 | ) |
Outstanding, June 30, 2018 | 897,993,230 | |
BCE Inc. 2018 SECOND QUARTER SHAREHOLDER REPORT 23 |
|
| | | | |
4 | MD&A | Financial and capital management | |
| NUMBER OF | | WEIGHTED AVERAGE | |
STOCK OPTIONS OUTSTANDING | OPTIONS | | EXERCISE PRICE ($) | |
Outstanding, January 1, 2018 | 10,490,249 | | 55 | |
Granted | 3,651,802 | | 57 | |
Exercised(1) | (59,756 | ) | 39 | |
Forfeited | (4,641 | ) | 59 | |
Outstanding, June 30, 2018 | 14,077,654 | | 56 | |
Exercisable, June 30, 2018 | 4,606,773 | | 52 | |
| (1) | The weighted average share price for options exercised during the six months ended June 30, 2018 was $56. |
| Q2 2018 | | Q2 2017 | | $ CHANGE | | % CHANGE | | YTD 2018 | | YTD 2017 | | $ CHANGE | | % CHANGE | |
Cash flows from operating activities | 2,057 | | 2,154 | | (97 | ) | (4.5 | %) | 3,553 | | 3,467 | | 86 | | 2.5 | % |
Capital expenditures | (1,056 | ) | (1,042 | ) | (14 | ) | (1.3 | %) | (1,987 | ) | (1,894 | ) | (93 | ) | (4.9 | %) |
Cash dividends paid on preferred shares | (35 | ) | (30 | ) | (5 | ) | (16.7 | %) | (68 | ) | (73 | ) | 5 | | 6.8 | % |
Cash dividends paid by subsidiaries to non-controlling interest | — | | (9 | ) | 9 | | 100.0 | % | (13 | ) | (21 | ) | 8 | | 38.1 | % |
Acquisition and other costs paid | 28 | | 21 | | 7 | | 33.3 | % | 46 | | 104 | | (58 | ) | (55.8 | %) |
Free cash flow | 994 | | 1,094 | | (100 | ) | (9.1 | %) | 1,531 | | 1,583 | | (52 | ) | (3.3 | %) |
Business acquisitions | (21 | ) | — | | (21 | ) | n.m. | | (244 | ) | (1,635 | ) | 1,391 | | 85.1 | % |
Acquisition and other costs paid | (28 | ) | (21 | ) | (7 | ) | (33.3 | %) | (46 | ) | (104 | ) | 58 | | 55.8 | % |
Acquisition of spectrum licences | — | | — | | — | | — | | (36 | ) | — | | (36 | ) | n.m. | |
Disposition of intangibles and other assets | — | | 323 | | (323 | ) | (100.0 | %) | 68 | | 323 | | (255 | ) | (78.9 | %) |
Other investing activities | (20 | ) | (5 | ) | (15 | ) | n.m. | | (55 | ) | (14 | ) | (41 | ) | n.m. | |
Net (repayment) issuance of debt instruments | (973 | ) | (705 | ) | (268 | ) | (38.0 | %) | 263 | | 845 | | (582 | ) | (68.9 | %) |
Issue of common shares | 1 | | 41 | | (40 | ) | (97.6 | %) | 2 | | 89 | | (87 | ) | (97.8 | %) |
Repurchase of common shares | — | | — | | — | | — | | (175 | ) | — | | (175 | ) | n.m. | |
Repurchase of shares for settlement of share-based payments | (49 | ) | (45 | ) | (4 | ) | (8.9 | %) | (137 | ) | (141 | ) | 4 | | 2.8 | % |
Cash dividends paid on common shares | (678 | ) | (626 | ) | (52 | ) | (8.3 | %) | (1,324 | ) | (1,220 | ) | (104 | ) | (8.5 | %) |
Return of capital to non-controlling interest | (12 | ) | — | | (12 | ) | n.m. | | (41 | ) | — | | (41 | ) | n.m. | |
Other financing activities | (23 | ) | (9 | ) | (14 | ) | n.m. | | (41 | ) | (22 | ) | (19 | ) | (86.4 | %) |
Net (decrease) increase in cash and cash equivalents | (809 | ) | 47 | | (856 | ) | n.m. | | (235 | ) | (296 | ) | 61 | | 20.6 | % |
n.m.: not meaningful
| CASH FLOWS FROM OPERATING ACTIVITIES AND FREE CASH FLOW |
Cash flows from operating activities in the second quarter of 2018 decreased by $97 million, compared to Q2 2017, due mainly to a decrease in cash from working capital, partly offset by higher adjusted EBITDA.
Cash flows from operating activities in the first half of 2018 increased by $86 million, compared to the first half of 2017, due mainly to higher adjusted EBITDA, lower acquisition and other costs paid and improved working capital.
Free cash flow in the second quarter of 2018 decreased by $100 million compared to the same period last year, mainly due to lower cash flows from operating activities excluding acquisition and other costs paid.
Free cash flow on a year-to-year basis in 2018 decreased by $52 million compared to the same period last year, mainly due to higher capital expenditures, partly offset by higher cash flows from operating activities excluding acquisition and other costs paid.
| 24 BCE Inc. 2018 SECOND QUARTER SHAREHOLDER REPORT |
|
| | | | |
| | 4 | MD&A | Financial and capital management |
| Q2 2018 | | Q2 2017 | | $ CHANGE | | % CHANGE | | YTD 2018 | | YTD 2017 | | $ CHANGE | | % CHANGE | |
Bell Wireless | 179 | | 191 | | 12 | | 6.3 | % | 343 | | 327 | | (16 | ) | (4.9 | %) |
Capital intensity ratio | 8.7 | % | 9.8 | % | | | 1.1 | pts | 8.6 | % | 8.8 | % | | | 0.2 | pts |
Bell Wireline | 845 | | 818 | | (27 | ) | (3.3 | %) | 1,592 | | 1,509 | | (83 | ) | (5.5 | %) |
Capital intensity ratio | 27.0 | % | 26.2 | % | | | (0.8 | ) pts | 25.6 | % | 24.8 | % | | | (0.8 | ) pts |
Bell Media | 32 | | 33 | | 1 | | 3.0 | % | 52 | | 58 | | 6 | | 10.3 | % |
Capital intensity ratio | 4.0 | % | 4.1 | % | | | 0.1 | pts | 3.4 | % | 3.7 | % | | | 0.3 | pts |
BCE | 1,056 | | 1,042 | | (14 | ) | (1.3 | %) | 1,987 | | 1,894 | | (93 | ) | (4.9 | %) |
Capital intensity ratio | 18.3 | % | 18.3 | % | | | — | | 17.5 | % | 17.2 | % | | | (0.3 | ) pts |
BCE capital expendituresof $1,056 million in Q2 2018 and $1,987 million in the first six months of the year, increased by $14 million and $93 million, respectively, compared to the same periods last year. Capital expenditures as a percentage of revenue (capital intensity ratio) of 18.3% in Q2 2018 remained unchanged compared to Q2 2017, whereas year-to-date capital intensity of 17.5% increased by 0.3 pts, compared to the first half of 2017. The year-over-year variances reflected:
- Higher capital spending in our wireline segment of $27 million and $83 million in Q2 2018 and year to date, respectively, driven by our continued expansion of broadband fibre directly to more homes and businesses and greater investment to support our growing Internet and TV subscriber bases. The year-to-date increase over last year also reflected the impact from the acquisition of MTS.
- Lower wireless capital investment in Q2 2018 of $12 million, while spending in the first six months of the year increased by $16 million. Although our wireless capital spending is at a slower pace compared to last year, particularly in Q2 2018, we continue to expand our LTE-A network including the deployment of wireless small-cells to optimize mobile coverage, signal quality and data backhaul, as well as increase network capacity to support the growth in subscribers and data consumption. In the first six months of the year, the acquisition of MTS contributed to a year-over-year increase in capital expenditures.
On January 5, 2018, BCE acquired all of the issued and outstanding shares of AlarmForce for a total consideration of $182 million, of which $181 million was paid in cash and the remaining $1 million through the issuance of 22,531 BCE common shares.
On March 17, 2017, BCE acquired all of the issued and outstanding common shares of MTS for a total consideration of $2,933 million, of which $1,339 million was paid in cash and the remaining $1,594 million through the issuance of approximately 27.6 million BCE common shares.
On January 3, 2017, BCE acquired all of the issued and outstanding common shares of Cieslok Media Ltd., for a total cash consideration of $161 million.
| DISPOSITION OF INTANGIBLE AND OTHER ASSETS |
During Q1 2018, BCE sold AlarmForce’s approximate 39,000 customer accounts in British Columbia, Alberta and Saskatchewan to Telus for total proceeds of approximately $68 million.
During Q2 2017, BCE completed the divestiture of approximately one-quarter of postpaid wireless subscribers and 15 retail locations previously held by MTS, as well as certain Manitoba network assets, to Telus for total proceeds of $323 million.
2018
In the second quarter of 2018, we repaid $973 million of debt, net of issuances. This included the early redemption of Series M-28 MTN debentures, Series M-33 debentures and Series 9 notes in the principal amounts of $400 million, $300 million and $200 million, respectively, and payments of finance leases and other debt of $170 million, partly offset by the issuances (net of repayments) of $97 million of notes payable.
In the first half of 2018, we issued $263 million of debt, net of repayments. This included the issuances of Series M-47 MTN debentures and Series US-1 notes at Bell Canada with total principal amounts of $500 million and US $750 million (CAD $967 million), respectively and the issuances (net of repayments) of $40 million of notes payable. These issuances were partly offset by the early redemption of Series M-28 MTN debentures, Series M-33 debentures and Series 9 notes in the principal amounts of $400 million, $300 million and $200 million, respectively, and payments of finance leases and other debt of $344 million.
BCE Inc. 2018 SECOND QUARTER SHAREHOLDER REPORT 25 |
|
| | | | |
4 | MD&A | Financial and capital management | |
2017
In the second quarter of 2017, we repaid $705 million of debt, net of issuances. This included a decrease in our loans secured by trade receivables of $360 million, the early redemption of Series M-35 debentures with a principal amount of $350 million and payments of finance leases and other debt of $122 million, partly offset by the issuance (net of repayments) of $127 million of notes payable.
In the first half of 2017, we issued $845 million of debt, net of repayments. This included the issuance of Series M-44 and M-45 MTN debentures at Bell Canada with principal amounts of $1 billion and $500 million, respectively, and the issuance (net of repayments) of $435 million of notes payable. These issuances were partly offset by the repayment of borrowings under our unsecured committed term credit facility of $480 million, the early redemption of Series M-35 debentures with a principal amount of $350 million, payments of finance leases and other debt of $250 million and a decrease in our loans secured by trade receivables of $10 million.
| REPURCHASE OF COMMON SHARES |
In Q1 2018, BCE repurchased and cancelled 3,085,697 common shares for a total cost of $175 million. Of the total cost, $69 million represents stated capital and $3 million represents the reduction of the contributed surplus attributable to these common shares. The remaining $103 million was charged to the deficit.
| CASH DIVIDENDS PAID ON COMMON SHARES |
In the second quarter of 2018, cash dividends paid on common shares increased by $52 million compared to Q2 2017, due to a higher dividend paid in Q2 2018, of $0.7550 per common share compared to $0.7175 per common share in Q2 2017, and a higher number of outstanding common shares principally as a result of shares issued for the acquisition of MTS.
In the first half of 2018, cash dividends paid on common shares increased by $104 million compared to 2017, due to a higher dividend paid in the second half of 2018 of $1.4725 per common share compared to $1.40 per common share for the same period last year, and a higher number of outstanding common shares principally as a result of shares issued for the acquisition of MTS.
| 4.4Post-employment benefit plans |
For the three and six months ended June 30, 2018, we recorded a decrease in our post-employment benefit obligations and a gain, before taxes, in OCI of $502 million and $348 million, respectively. This was due to a higher actual discount rate of 3.7% at June 30, 2018, as compared to 3.6% at March 31, 2018 and December 31, 2017 and a higher-than-expected return on plan assets in Q2 2018.
For the three and six months ended June 30, 2017, we recorded an increase in our post-employment benefit obligations and a loss, before taxes, in OCI of $351 million and $793 million, respectively. This was due to a lower actual discount rate of 3.6% at June 30, 2017, as compared to 3.8% at March 31, 2017 and 4.0% at December 31, 2016. The loss was partly offset by a higher-than-expected return on plan assets.
| 4.5Financial risk management |
FAIR VALUE
The following table provides the fair value details of financial instruments measured at amortized cost in the statements of financial position.
| | | JUNE 30, 2018 | DECEMBER 31, 2017 |
| | | | CARRYING | | FAIR | | CARRYING | | FAIR | |
| | CLASSIFICATION | FAIR VALUE METHODOLOGY | VALUE | | VALUE | | VALUE | | VALUE | |
CRTC tangible benefits obligation | Trade payables and other liabilities and non-current liabilities | Present value of estimated future cash flows discounted using observable market interest rates | 79 | | 78 | | 111 | | 110 | |
CRTC deferral account obligation | Trade payables and other liabilities and non-current liabilities | Present value of estimated future cash flows discounted using observable market interest rates | 119 | | 121 | | 124 | | 128 | |
Debt securities, finance leases and other debt | Debt due within one year and long-term debt | Quoted market price of debt or present value of future cash flows discounted using observable market interest rates | 19,868 | | 21,490 | | 19,321 | | 21,298 | |
| 26 BCE Inc. 2018 SECOND QUARTER SHAREHOLDER REPORT |
|
| | | | |
| | 4 | MD&A | Financial and capital management |
The following table provides the fair value details of financial instruments measured at fair value in the statements of financial position.
| | CLASSIFICATION | CARRYING VALUE OF
ASSET (LIABILITY) | | FAIR VALUE |
QUOTED PRICES IN
ACTIVE MARKETS
FOR IDENTICAL
ASSETS (LEVEL 1) | | OBSERVABLE
MARKET DATA
(LEVEL 2)(1) | | NON-OBSERVABLE
MARKET INPUTS
(LEVEL 3)(2) | |
| June 30, 2018 | | | | | | | | | |
Publicly-traded and privately-held
investments(3) | Other non-current assets | 104 | | 1 | | — | | 103 | |
Derivative financial instruments | Other current assets, trade payables and other liabilities, other non-current assets and liabilities | (5 | ) | — | | (5 | ) | — | |
Maple Leaf Sports & Entertainment Ltd. (MLSE) financial liability(4) | Trade payables and other liabilities | (135 | ) | — | | — | | (135 | ) |
Other | Other non-current assets and liabilities | 70 | | — | | 116 | | (46 | ) |
December 31, 2017 | | | | | | | | | |
Publicly-traded and privately-held investments(3) | Other non-current assets | 103 | | 1 | | — | | 102 | |
Derivative financial instruments | Other current assets, trade payables and other liabilities, other non-current assets and liabilities | (48 | ) | — | | (48 | ) | — | |
MLSE financial liability(4) | Trade payables and other liabilities | (135 | ) | — | | — | | (135 | ) |
Other | Other non-current assets and liabilities | 60 | | — | | 106 | | (46 | ) |
| (1) | Observable market data such as equity prices, interest rates, swap rate curves and foreign currency exchange rates. |
| (2) | Non-observable market inputs such as discounted cash flows and earnings multiples. A reasonable change in our assumptions would not result in a significant increase (decrease) to our level 3 financial instruments. |
| (3) | Unrealized gains and losses are recorded in OCI and impairment charges are recorded inOther (expense) income in the income statements. |
| (4) | Represents BCE’s obligation to repurchase the BCE Master Trust Fund’s (Master Trust) 9% interest in MLSE at a price not less than an agreed minimum price should the Master Trust exercise its put option. The obligation to repurchase is marked to market each reporting period and the gain or loss is recorded in Other (expense) income in the income statements. |
We use forward contracts, options and cross currency interest rate swaps to manage foreign currency risk related to anticipated purchases and sales and certain foreign currency denominated debt.
A 10% depreciation (appreciation) in the value of the Canadian dollar relative to the U.S. dollar would result in a gain (loss) of $2 million ($3 million) recognized in net earnings at June 30, 2018 and a gain (loss) of 139 million ($134 million) recognized inOther comprehensive income (loss)at June 30, 2018, with all other variables held constant.
In Q1 2018, we entered into a cross currency interest rate swap with a notional amount of $750 million in U.S. dollars ($967 million in Canadian dollars) to hedge the U.S. currency exposure of our Series US-1 notes maturing in 2048. See Note 9,Debt, in BCE’s Q2 2018 Financial Statements.
The following table provides further details on our outstanding foreign currency forward contracts and options as at June 30, 2018.
| TYPE OF HEDGE | BUY CURRENCY | | AMOUNT TO RECEIVE | | SELL CURRENCY | | AMOUNT TO PAY | | MATURITY | | HEDGED ITEM | |
Cash flow | USD | | 2,499 | | CAD | | 3,244 | | 2018 | | Commercial paper | |
Cash flow | USD | | 450 | | CAD | | 584 | | 2018 | | Anticipated transactions | |
Cash flow | CAD | | 46 | | USD | | 36 | | 2018-2019 | | Anticipated transactions | |
Cash flow | USD | | 775 | | CAD | | 968 | | 2019 | | Anticipated transactions | |
Cash flow | USD | | 76 | | CAD | | 96 | | 2020-2021 | | Anticipated transactions | |
Economic | USD | | 19 | | CAD | | 24 | | 2018 | | Anticipated transactions | |
Economic – call options | USD | | 33 | | CAD | | 41 | | 2018 | | Anticipated transactions | |
Economic – put options | USD | | 99 | | CAD | | 119 | | 2018 | | Anticipated transactions | |
A 1% increase (decrease) in interest rates would result in a decrease (increase) of $31 million in net earnings at June 30, 2018.
We use equity forward contracts on BCE’s common shares to economically hedge the cash flow exposure related to the settlement of equity settled share-based compensation plans and the equity price risk related to a cash-settled share-based payment plan. The fair value of our equity forward contracts at June 30, 2018 was a liability of $85 million.
A 5% increase (decrease) in the market price of BCE’s common shares at June 30, 2018 would result in a gain (loss) of $33 million recognized in net earnings, with all other variables held constant.
BCE Inc. 2018 SECOND QUARTER SHAREHOLDER REPORT 27 |
|
| | | | |
4 | MD&A | Financial and capital management | |
BCE’s and Bell Canada’s key credit ratings remain unchanged from those described in the BCE 2017 Annual MD&A.
Our cash requirements remain substantially unchanged from those described in the BCE 2017 Annual MD&A.
RECENT DEVELOPMENTS IN LEGAL PROCEEDINGS
The following are updates to the legal proceedings described in the BCE 2017 AIF under section 8,Legal Proceedings.
IP INFRINGEMENT LAWSUITS CONCERNING IPTV SYSTEMS
Mediatube Corp.’s appeal of the decision of the Federal Court to dismiss the claim filed on April 23, 2013 against Bell Canada and Bell Aliant Regional Communications, Limited Partnership (now Bell Canada) is now expected to be heard by the Federal Court of Appeal in September or October 2018 instead of May 20, 2018.
PURPORTED CLASS ACTION CONCERNING PROMOTIONAL PRICING
On May 14, 2018, the Québec Superior Court dismissed the plaintiff’s application for authorization to institute a class action filed on July 4, 2016 against Bell Canada and other defendants (including telecommunications companies and other service providers). On July 4, 2018, the plaintiff appealed this decision to the Québec Court of Appeal.
| 28 BCE Inc. 2018 SECOND QUARTER SHAREHOLDER REPORT |
|
| | | | |
| | 5 | MD&A | Quarterly financial information |
| 5 Quarterly financial information |
BCE’s Q2 2018 Financial Statements were prepared in accordance with IFRS, as issued by the International Accounting Standards Board (IASB), under International Accounting Standard (IAS) 34, Interim Financial Reporting and were approved by BCE’s board of directors on August 1, 2018.
The following table, which was also prepared in accordance with IFRS, shows selected consolidated financial data of BCE for the eight most recent completed quarters.
| | | | | | | | | | | | | 2016 PRIOR TO THE | |
| 2018 | 2017 | ADOPTION OF IFRS 15 | |
| Q2 | | Q1 | | Q4 | | Q3 | | Q2 | | Q1 | | Q4 | | Q3 | |
Operating revenues | | | | | | | | | | | | | | | | |
Service | 5,129 | | 4,964 | | 5,152 | | 5,054 | | 5,078 | | 4,811 | | 5,169 | | 5,025 | |
Product | 657 | | 626 | | 884 | | 643 | | 610 | | 525 | | 533 | | 382 | |
Total operating revenues | 5,786 | | 5,590 | | 6,036 | | 5,697 | | 5,688 | | 5,336 | | 5,702 | | 5,407 | |
Adjusted EBITDA | 2,430 | | 2,254 | | 2,329 | | 2,405 | | 2,382 | | 2,166 | | 2,121 | | 2,236 | |
Severance, acquisition and other costs | (24 | ) | — | | (47 | ) | (23 | ) | (36 | ) | (84 | ) | (11 | ) | (25 | ) |
Depreciation | (787 | ) | (780 | ) | (783 | ) | (760 | ) | (767 | ) | (724 | ) | (719 | ) | (706 | ) |
Amortization | (221 | ) | (212 | ) | (208 | ) | (207 | ) | (210 | ) | (185 | ) | (165 | ) | (161 | ) |
Net earnings | 755 | | 709 | | 698 | | 850 | | 814 | | 688 | | 699 | | 800 | |
Net earnings attributable to common shareholders | 704 | | 661 | | 656 | | 803 | | 765 | | 642 | | 657 | | 752 | |
Net earnings per common share | | | | | | | | | | | | | | | | |
Basic | 0.79 | | 0.73 | | 0.72 | | 0.90 | | 0.85 | | 0.73 | | 0.75 | | 0.87 | |
Diluted | 0.79 | | 0.73 | | 0.72 | | 0.90 | | 0.85 | | 0.73 | | 0.75 | | 0.87 | |
Average number of common shares outstanding – basic (millions) | 898.0 | | 900.2 | | 900.6 | | 900.4 | | 900.1 | | 875.7 | | 870.5 | | 869.9 | |
BCE Inc. 2018 SECOND QUARTER SHAREHOLDER REPORT 29 |
|
| | | | |
6 | MD&A | Regulatory environment | |
The following is an update to the regulatory initiatives and proceedings described in the BCE 2017 Annual MD&A under section 3.3,Principal business risksand section 8,Regulatory environment, as subsequently updated in the BCE 2018 First Quarter MD&A.
| LEGISLATIVE REVIEWS OF KEY LEGISLATION |
On June 5, 2018, the Minister of Innovation, Science and Economic Development (ISED) and the Minister of Canadian Heritage announced the launch of a review of the Broadcasting Act, the Radiocommunication Act and the Telecommunications Act. The legislative review is intended to modernize these Acts to better address new realities impacting the broadcasting and telecommunications industries. The review will be led by a panel of external experts who will engage in consultations with industry members and Canadian consumers. The panel is to return a report with recommendations for legislative reforms by January 31, 2020. While reforms of these key pieces of legislation could have material impacts for our broadcasting, telecommunications and wireless businesses, it is unclear what recommendations the panel may make, what impacts those recommendations may have, if adopted, and when any adopted reforms would come into force.
CRTC REPORT ON THE SALES PRACTICES OF LARGE TELECOMMUNICATIONS CARRIERS
On June 14, 2018, the Governor in Council issued an Order in Council directing the CRTC to make a report regarding the retail sales practices of Canada’s large telecommunications carriers. In preparing its report, the CRTC is to investigate whether large service providers are engaging in misleading or aggressive sales tactics, the controls that those carriers have in place to prevent misleading or aggressive sales tactics, existing consumer protections that promote fair treatment of consumers, and the most effective ways to expand consumer protections. The CRTC is to provide its report no later than February 28, 2019. On July 16, 2018, the CRTC launched Telecom and Broadcasting Notice of Consultation CRTC 2018-246 to examine the matters set out in the Order in Council. It is unclear what the CRTC may conclude as a result of this investigation. If the CRTC finds that intervention is required, it is not clear what interventions it would recommend and which may ultimately be adopted. As a result, we are unable to assess what potential impact, if any, the CRTC’s report may have on our business.
CHANGES TO SIMULTANEOUS SUBSTITUTION
On May 10, 2018, the Supreme Court of Canada granted leave for Bell Canada and Bell Media to appeal the decision of the Federal Court of Appeal concerning the application of Broadcasting Order CRTC 2016-335 pursuant to which the CRTC eliminated simultaneous substitution for the Super Bowl. Leave was also granted to the National Football League to appeal on the same matter, to be heard in conjunction with the Bell Canada and Bell Media appeal. The appeals will be heard on December 4, 2018.
CRTC REPORT ON FUTURE PROGRAMMING DISTRIBUTION MODELS
On September 27, 2017, the Governor in Council, at the recommendation of the Minister of Canadian Heritage, issued a direction to the CRTC asking it to examine the distribution model or models of programming that are likely to exist in the future, how Canadians would access that programming, and the extent to which those models will ensure a vibrant domestic market that is capable of supporting the continued creation, production and distribution of Canadian programming, including original entertainment and information programming. On May 31, 2018, the CRTC released its broad ranging report entitled “Harnessing Change: The Future of Programming Distribution in Canada”. The Minister of Canadian Heritage indicated that the CRTC’s report will be used to inform a review of the Broadcasting Act and the Telecommunications Act. While there are recommendations in the report that could reflect positively on BCE’s business, it is unclear how the CRTC’s report, or future legislative reviews, may impact our business.
CONSULTATION ON RELEASING MILLIMETRE WAVE SPECTRUM TO SUPPORT FIFTH GENERATION (5G)
On June 6, 2018, ISED launched a consultation entitled “Addendum to the Consultation on Releasing Millimetre Wave Spectrum to Support 5G”. Through this addendum consultation, ISED is seeking stakeholder feedback on releasing additional spectrum in the 26 Gigahertz band for flexible use to support 5G networks and systems, in addition to the frequency bands currently under consultation through the Millimetre Wave Consultation. As 5G is expected to be the next major advancement in mobile telecommunications standards, access to the millimetre wave spectrum will be important in order to facilitate the development and adoption of 5G technology. It is unclear what, if any, impact the results of this consultation could have on our business.
AUCTION OF RESIDUAL SPECTRUM LICENCES
On December 19, 2017, ISED released a decision entitled “Licensing Framework for Residual Spectrum Licences in the 700 Megahertz (MHz), 2500 MHz, 2300 MHz and PCS G Bands”. On June 29, 2018, ISED announced the final results of the auction. There were six different licence winners that won a total of 61 licences for a total of $43.4 million. We did not participate in the auction.
| 30 BCE Inc. 2018 SECOND QUARTER SHAREHOLDER REPORT |
|
| | | | |
| | 6 | MD&A | Regulatory environment |
CONSULTATION ON THE SPECTRUM OUTLOOK 2018 TO 2022
On October 6, 2017, ISED initiated a consultation entitled “Consultation on the Spectrum Outlook 2018 to 2022”. On June 6, 2018, ISED released the results of its spectrum outlook consultation in a document entitled “Spectrum Outlook 2018 to 2022” (Spectrum Outlook Report). The purpose of the Spectrum Outlook Report is to provide stakeholders with an overview of ISED’s overall approach and planned activities related to meeting the expected demand for commercial mobile services, licence exempt applications, satellite services and wireless backhaul services over the next five years. The Spectrum Outlook Report also addresses issues related to access to spectrum and enabling new technologies. At this point in time, it is unclear what impact, if any, the Spectrum Outlook Report could have on our business.
CONSULTATION ON 3500 MHZ SPECTRUM
On June 6, 2018, ISED issued the “Consultation on Revisions to the 3500 MHz Band to Accommodate Flexible Use and Preliminary Consultation on Changes to the 3800 MHz Band”. ISED is seeking comments on issues such as allowing flexible use spectrum licences in the 3450-3475 MHz band, the amount of spectrum existing licence holders need to return if they decide to convert their existing licences to flexible use licences, the transition plan for existing licence holders, and the extent to which the 3700-4200 MHz band can accommodate coexisting services (e.g. fixed-satellite service with mobile and/or fixed wireless access). ISED will launch a consultation on the technical, policy and licensing framework for flexible use licences in the 3500 MHz band after releasing its decision regarding the issues raised in this consultation. It is unclear what impact the results of this consultation and future related processes could have on our business.
PERSONAL INFORMATION PROTECTION AND ELECTRONIC DOCUMENTS ACT
On September 28, 2017, the Office of the Privacy Commissioner of Canada (OPC) issued its Notice of Consultation and Call for Comments on Draft Consent Guidance Documents. The specific guidance documents at issue in this consultation are entitled “Draft Guidelines: Obtaining Meaningful Online Consent” and “Draft Guidelines: Inappropriate Data Practices – Interpretation and Application of Subsection 5(3)”. The OPC issued these guidelines on May 24, 2018. The OPC indicated that its “Guidance on inappropriate data practices: Interpretation and application of subsection 5(3)” will be applied as of July 1, 2018, and that its “Guidelines for obtaining meaningful consent” will be applied as of January 1, 2019. The OPC’s guidelines could have significant impacts concerning how personal information may be collected, used and disclosed for analytics and marketing purposes.
BCE Inc. 2018 SECOND QUARTER SHAREHOLDER REPORT 31 |
|
| | | | |
7 | MD&A | Business risks | |
A risk is the possibility that an event might happen in the future that could have a negative effect on our financial position, financial performance, cash flows, business or reputation. Part of managing our business is to understand what these potential risks could be and to mitigate them where we can.
The actual effect of any event could be materially different from what we currently anticipate. The risks described in this MD&A are not the only ones that could affect us. Additional risks and uncertainties not currently known to us or that we currently deem to be immaterial may also materially and adversely affect our financial position, financial performance, cash flows, business or reputation.
In the BCE 2017 Annual MD&A, we provided a detailed review of risks that could affect our financial position, financial performance, cash flows, business or reputation and that could cause actual results or events to differ materially from our expectations expressed in or implied by our forward-looking statements. This detailed description of risks is updated in the BCE 2018 First Quarter MD&A and in this MD&A. The risks described in the BCE 2017 Annual MD&A, as updated in the BCE 2018 First Quarter MD&A and in this MD&A, include, without limitation, risks associated with:
- the intensity of competitive activity, including from new and emerging competitors, and the resulting impact on the cost of retaining existing customers and attracting new ones, as well as on our market shares, service volumes and pricing strategies
- the level of technological substitution and the presence of alternative service providers contributing to reduced utilization of our traditional wireline services
- regulatory initiatives, proceedings and decisions, government consultations and government positions that affect us and influence our business, including, in particular, those relating to mandatory access to networks, spectrum auctions, approval of acquisitions, broadcast licensing and foreign ownership requirements
- the inability to protect our physical and non-physical assets, including networks, IT systems, offices, corporate stores and sensitive information, from events and attacks such as cyber threats, and damage from fire and natural disasters
- security and data leakage exposure if security control protocols applicable to our cloud-based solutions are bypassed
- the adverse effect of the fundamental separation of content and connectivity, which is changing our TV and media ecosystems and may accelerate the disconnection of TV services and the reduction of TV spending, as well as the fragmentation of, and changes in, the advertising market
- competition with global competitors, in addition to traditional Canadian competitors, for programming content could drive significant increases in content acquisition costs and challenge our ability to secure key content
- adverse economic and financial market conditions, a declining level of retail and commercial activity, and the resulting negative impact on the demand for, and prices of, our products and services and the level of bad debts
- the failure to optimize network and IT deployment and upgrade timelines, accurately assess the potential of new technologies, and invest and evolve in the appropriate direction
- the failure to continue investment in a disciplined and strategic manner in next-generation capabilities, including real-time information-based customer service strategies
- the inability to drive a positive customer experience resulting, in particular, from the failure to embrace new approaches and challenge operational limitations
- the complexity in our operations resulting from multiple technology platforms, billing systems, marketing databases and a myriad of rate plans, promotions and product offerings
- the failure to maintain optimal network operating performance in the context of significant increases in capacity demands on our Internet and wireless networks
- the failure to implement or maintain highly effective IT systems supported by an effective governance and operating framework
- the risk that we may need to incur significant capital expenditures beyond our capital intensity target in order to provide additional capacity and reduce network congestion
- the failure to generate anticipated benefits from our corporate restructurings, system replacements and upgrades, process redesigns and the integration of business acquisitions
- events affecting the functionality of, and our ability to protect, test, maintain and replace, our networks, IT systems, equipment and other facilities
- in-orbit and other operational risks to which the satellites used to provide our satellite TV services are subject
- the failure to attract and retain employees with the appropriate skill sets and to drive their performance in a safe and secure environment
- labour disruptions
- the inability to access adequate sources of capital and generate sufficient cash flows from operations to meet our cash requirements, fund capital expenditures and provide for planned growth
- uncertainty as to whether dividends will be declared by BCE’s board of directors or whether BCE’s dividend payout policy will be maintained
- the inability to manage various credit, liquidity and market risks
- pension obligation volatility and increased contributions to post-employment benefit plans
- higher taxes due to new tax laws or changes thereto or in the interpretation thereof, and the inability to predict the outcome of government audits
- the failure to reduce costs as well as unexpected increases in costs
- the failure to evolve practices to effectively monitor and control fraudulent activities
- online content theft and piracy and the absence of effective legal recourses to combat them
- events affecting the continuity of supply of products and services that we need to operate our business and to comply with various obligations from our third-party suppliers, outsourcers and consultants
- the failure of our procurement and vendor management practices to address risk exposures associated with existing and new supplier models
| 32 BCE Inc. 2018 SECOND QUARTER SHAREHOLDER REPORT |
|
| | | | |
| | 7 | MD&A | Business risks |
- the quality of our products and services and the extent to which they may be subject to manufacturing defects or fail to comply with applicable government regulations and standards
- unfavourable resolution of legal proceedings and, in particular, class actions
- unfavourable changes in applicable laws and the failure to proactively address our legal and regulatory obligations
- health concerns about radiofrequency emissions from wireless communications devices
- the inability to maintain customer service and our networks operational in the event of the occurrence of epidemics, pandemics and other health risks
- the failure to recognize and adequately respond to climate change concerns or public and governmental expectations on environmental matters
We caution that the foregoing list of risk factors is not exhaustive and other factors could also adversely affect our results.
Please see section 9,Business risks, of the BCE 2017 Annual MD&A for a more complete description of the above-mentioned and other risks, which section, and the other sections of the BCE 2017 Annual MD&A referred to therein, are incorporated by reference in this section 7.
In addition, please also see section 4.7,Liquidity – Litigationin this MD&A for an update to the legal proceedings described in the BCE 2017 AIF, which section is incorporated by reference in this section 7. Please also see section 6,Regulatory environment, in this MD&A and in the BCE 2018 First Quarter MD&A for an update to the regulatory initiatives and proceedings described in the BCE 2017 Annual MD&A, which sections 6 are incorporated by reference in this section 7.
Except for the updates set out in section 4.7,Liquidity – Litigation, in section 6,Regulatory environmentand in this section 7, Business risks in this MD&A, as well as in section 6,Regulatory environmentin the BCE 2018 First Quarter MD&A, the risks described in the BCE 2017 Annual MD&A remain substantially unchanged.
| UPDATE TO THE DESCRIPTION OF BUSINESS RISKS |
FINANCIAL MANAGEMENT
The economic environment, pension rules or ineffective governance could have an adverse effect on our pension obligations, liquidity and financial performance, and we may be required to increase contributions to our post-employment benefit plans in the future.
In June 2018, we filed updated post-employment benefit plans valuations as of December 31, 2017, which confirmed our expected funding for 2018 as disclosed in the BCE 2017 Annual MD&A.
BCE Inc. 2018 SECOND QUARTER SHAREHOLDER REPORT 33 |
|
| | | | |
8 | MD&A | Accounting policies, financial measures and controls | |
| 8 Accounting policies, financial measures and controls |
| 8.1Our accounting policies |
BCE’s Q2 2018 Financial Statements were prepared in accordance with IFRS, as issued by the IASB, under IAS 34 – Interim Financial Reporting and were approved by BCE’s board of directors on August 1, 2018. These financial statements were prepared using the same basis of presentation, accounting policies and methods of computations as outlined in Note 2,Significant accounting policiesin BCE’s consolidated financial statements for the year ended December 31, 2017, except as noted below. BCE’s Q2 2018 Financial Statements do not include all of the notes required in the annual financial statements.
| ADOPTION OF NEW ACCOUNTING STANDARDS |
As required, effective January 1, 2018, we adopted the following new accounting standards.
IFRS 15
We applied IFRS 15, Revenue from Contracts with Customers, retrospectively to each prior reporting period presented. IFRS 15 establishes principles to record revenues from contracts for the sale of products or services, unless the contracts are in the scope of other IFRSs.
IFRS 15 principally affects the timing of revenue recognition and how we classify revenues between product and service in our Bell Wireless segment. IFRS 15 also affects how we account for costs to obtain a contract.
- Under multiple-element arrangements, revenue allocated to a satisfied performance obligation is no longer limited to the amount that is not contingent upon the satisfaction of additional performance obligations. Although the total revenue recognized during the term of a contract is largely unaffected, revenue recognition may be accelerated and reflected ahead of the associated cash inflows. This results in the recognition of a contract asset on the balance sheet, corresponding to the amount of revenue recognized and not yet billed to a customer. The contract asset is realized over the term of the customer contract.
- As revenues allocated to a satisfied performance obligation are no longer limited to the non-contingent amount, a greater proportion of the total revenue recognized during the term of certain customer contracts may be attributed to a delivered product, resulting in a corresponding decrease in service revenue
- Sales commissions and any other incremental costs of obtaining a contract with a customer are recognized on the statement of financial position and amortized on a systematic basis that is consistent with the period and pattern of transfer to the customer of the related products or services, except as noted below
Under IFRS 15, we apply the following practical expedients.
- Completed contracts that begin and end within the same annual reporting period and those completed before January 1, 2017 are not restated
- Contracts modified prior to January 1, 2017 are not restated. The aggregate effect of these modifications is reflected when identifying the satisfied and unsatisfied performance obligations, determining the transaction price and allocating the transaction price to the satisfied and unsatisfied performance obligations.
- When our right to consideration from a customer corresponds directly with the value to the customer of the products and services transferred to date, we recognize revenue in the amount to which we have a right to invoice. For such contracts and for performance obligations that are part of a contract that has an original expected duration of one year or less, the transaction price amount allocated to the remaining performance obligations and an explanation of when we expect to recognise that amount as revenue are not disclosed.
- Costs of obtaining a contract that would be amortized within one year or less are immediately expensed
IFRS 9
We applied IFRS 9, Financial Instruments (as revised in July 2014) and the related consequential amendments to other IFRSs retrospectively, except for the changes to hedge accounting described below which are applied prospectively. In accordance with the transition requirements, comparative periods have not been restated. The adoption of IFRS 9 did not have a significant impact on the carrying amounts of our financial instruments as at January 1, 2018. As a result of the adoption of IFRS 9, our January 1, 2018 deficit increased by $4 million.
IFRS 9 replaces the classification and measurement models in IAS 39, Financial Instruments: Recognition and Measurement, with a single model under which financial assets are classified and measured at amortized cost, fair value through other comprehensive income (FVOCI) or fair value through profit or loss (FVTPL). This classification is based on the business model in which a financial asset is managed and its contractual cash flow characteristics and eliminates the IAS 39 categories of held-to-maturity, loans and receivables and available-for-sale. The adoption of IFRS 9 did not, however, change the measurement bases of our financial assets.
- Cash and cash equivalents and derivative instruments measured at FVTPL under IAS 39 continue to be measured as such under IFRS 9
- Portfolio investments in equity securities and certain derivative instruments that qualify for cash flow hedge accounting measured at FVOCI under IAS 39 continue to be measured as such under IFRS 9
- Trade and other receivables continue to be measured at amortized cost under IFRS 9
| 34 BCE Inc. 2018 SECOND QUARTER SHAREHOLDER REPORT |
|
| | | | |
| | 8 | MD&A | Accounting policies, financial measures and controls |
The impairment of financial assets under IFRS 9 is based on an expected credit loss (ECL) model, as opposed to the incurred loss model in IAS 39. IFRS 9 applies to financial assets measured at amortized cost and contract assets and requires that we consider factors that include historical, current and forward-looking information when measuring the ECL. We use the simplified approach for measuring losses based on the lifetime ECL for trade receivables and contract assets. Amounts considered uncollectible are written off and recognized inOperating costsin the income statement.
We have adopted the general hedge accounting model in IFRS 9 which requires that we ensure hedge accounting relationships are consistent with our risk management objectives and strategies. We also apply a more qualitative and forward-looking approach in assessing hedge effectiveness as a retrospective assessment is no longer required.
- Under IFRS 9, amounts related to cash flow hedges of anticipated purchases of non-financial assets settled during the period are reclassified from Accumulated other comprehensive income to the initial cost of the non-financial asset when it is recognized. Under IAS 39, such amounts were reclassified from Other comprehensive income. Amounts related to cash flow hedges of other anticipated purchases continue to be reclassified from Other comprehensive income to net earnings under IFRS 9.
| FUTURE CHANGES TO ACCOUNTING STANDARDS |
As outlined in Note 2,Significant accounting policiesin our consolidated financial statements for the year ended December 31, 2017, the IASB issued IFRS 16 – Leases with an effective date of January 1, 2019.
We continue to make progress towards adoption of IFRS 16 according to our detailed implementation plan. It is not yet possible to make a reliable estimate of the impact of the new standard on our financial statements. We will adopt IFRS 16 on January 1, 2019, using a modified retrospective approach.
As a result of adopting IFRS 15, we have changed the comparative figures for the three and six months ended June 30, 2017 and the year ended December 31, 2017. The impacts of adopting IFRS 15 on our previously reported results for the three and six months ended June 30, 2017 are provided below. The impacts of adopting IFRS 15 on our statement of financial position as at January 1, 2017 and December 31, 2017, our consolidated income statement and consolidated statement of cash flows for the year ended December 31, 2017, along with updated 2017 annual disclosures are included in Note 3,Adoption of IFRS 15, of our unaudited consolidated financial statements for the period ended March 31, 2018.
CONSOLIDATED INCOME STATEMENTS
The table below shows the impacts of adopting IFRS 15 on our previously reported consolidated income statements for the three and six months ended June 30, 2017.
| THREE MONTHS ENDED JUNE 30, 2017 | SIX MONTHS ENDED JUNE 30, 2017 |
(IN MILLIONS OF CANADIAN DOLLARS, EXCEPT SHARE AMOUNTS) | 2017 AS
PREVIOUSLY
REPORTED | | IFRS 15 IMPACTS | | 2017 UPON
ADOPTION
OF IFRS 15 | | 2017 AS
PREVIOUSLY
REPORTED | | IFRS 15 IMPACTS | | 2017 UPON
ADOPTION
OF IFRS 15 | |
Operating revenues | 5,699 | | (11 | ) | 5,688 | | 11,083 | | (59 | ) | 11,024 | |
Operating costs | (3,318 | ) | 12 | | (3,306 | ) | (6,488 | ) | 12 | | (6,476 | ) |
Severance, acquisition and other costs | (36 | ) | — | | (36 | ) | (120 | ) | — | | (120 | ) |
Depreciation | (769 | ) | 2 | | (767 | ) | (1,491 | ) | — | | (1,491 | ) |
Amortization | (211 | ) | 1 | | (210 | ) | (396 | ) | 1 | | (395 | ) |
Finance costs | | | | | | | | | | | | |
Interest expense | (238 | ) | — | | (238 | ) | (472 | ) | — | | (472 | ) |
Interest on post-employment benefit obligations | (18 | ) | — | | (18 | ) | (36 | ) | — | | (36 | ) |
Other (expense) income | (1 | ) | — | | (1 | ) | 16 | | — | | 16 | |
Income taxes | (297 | ) | (1 | ) | (298 | ) | (560 | ) | 12 | | (548 | ) |
Net earnings | 811 | | 3 | | 814 | | 1,536 | | (34 | ) | 1,502 | |
Net earnings attributable to: | | | | | | | | | | | | |
Common shareholders | 762 | | 3 | | 765 | | 1,441 | | (34 | ) | 1,407 | |
Preferred shareholders | 32 | | — | | 32 | | 63 | | — | | 63 | |
Non-controlling interest | 17 | | — | | 17 | | 32 | | — | | 32 | |
Net earnings | 811 | | 3 | | 814 | | 1,536 | | (34 | ) | 1,502 | |
Net earnings per common share – basic and diluted | 0.84 | | 0.01 | | 0.85 | | 1.62 | | (0.04 | ) | 1.58 | |
Average number of common shares outstanding – basic (millions) | 900.1 | | — | | 900.1 | | 888.0 | | — | | 888.0 | |
BCE Inc. 2018 SECOND QUARTER SHAREHOLDER REPORT 35 |
|
| | | | |
8 | MD&A | Accounting policies, financial measures and controls | |
CONSOLIDATED STATEMENT OF CASH FLOWS
The table below shows the impacts of adopting IFRS 15 on select line items of our previously reported 2017 statement of cash flows for the three and six months ended June 30, 2017.
| THREE MONTHS ENDED JUNE 30, 2017 | SIX MONTHS ENDED JUNE 30, 2017 |
| | 2017 AS
PREVIOUSLY
REPORTED | | IFRS 15 IMPACTS | | 2017 UPON
ADOPTION
OF IFRS 15 | | 2017 AS
PREVIOUSLY
REPORTED | | IFRS 15 IMPACTS | | 2017 UPON
ADOPTION
OF IFRS 15 | |
Cash flows from operating activities | | | | | | | | | | | | |
Net earnings | 811 | | 3 | | 814 | | 1,536 | | (34 | ) | 1,502 | |
Depreciation and amortization | 980 | | (3 | ) | 977 | | 1,887 | | (1 | ) | 1,886 | |
Income taxes | 297 | | 1 | | 298 | | 560 | | (12 | ) | 548 | |
Net change in operating assets and liabilities | 242 | | (1 | ) | 241 | | 8 | | 47 | | 55 | |
Cash flows from operating activities | 2,154 | | — | | 2,154 | | 3,467 | | — | | 3,467 | |
| 8.2Non-GAAP financial measures and key performance indicators (KPIs) |
This section describes the non-GAAP financial measures and KPIs we use in this MD&A to explain our financial results. It also provides reconciliations of the non-GAAP financial measures to the most comparable IFRS financial measures.
In Q1 2018, we updated our definition of adjusted net earnings and adjusted EPS to exclude net mark-to-market losses (gains) on derivatives used to economically hedge equity settled share-based compensation plans as they may affect the comparability of our financial results and could potentially distort the analysis of trends in business performance. Adjusted net earnings and adjusted EPS for 2017 have also been updated for comparability purposes.
| ADJUSTED EBITDA AND ADJUSTED EBITDA MARGIN |
The terms adjusted EBITDA and adjusted EBITDA margin do not have any standardized meaning under IFRS. Therefore, they are unlikely to be comparable to similar measures presented by other issuers.
We define adjusted EBITDA as operating revenues less operating costs, as shown in BCE’s consolidated income statements. Adjusted EBITDA for BCE’s segments is the same as segment profit as reported in Note 4,Segmented information, in BCE’s Q2 2018 Financial Statements. We define adjusted EBITDA margin as adjusted EBITDA divided by operating revenues.
We use adjusted EBITDA and adjusted EBITDA margin to evaluate the performance of our businesses as they reflect their ongoing profitability. We believe that certain investors and analysts use adjusted EBITDA to measure a company’s ability to service debt and to meet other payment obligations or as a common measurement to value companies in the telecommunications industry. We believe that certain investors and analysts also use adjusted EBITDA and adjusted EBITDA margin to evaluate the performance of our businesses. Adjusted EBITDA is also one component in the determination of short-term incentive compensation for all management employees.
Adjusted EBITDA and adjusted EBITDA margin have no directly comparable IFRS financial measure. Alternatively, the following table provides a reconciliation of net earnings to adjusted EBITDA.
| Q2 2018 | | Q2 2017 | | YTD 2018 | | YTD 2017 | |
Net earnings | 755 | | 814 | | 1,464 | | 1,502 | |
Severance, acquisition and other costs | 24 | | 36 | | 24 | | 120 | |
Depreciation | 787 | | 767 | | 1,567 | | 1,491 | |
Amortization | 221 | | 210 | | 433 | | 395 | |
Finance costs | | | | | | | | |
Interest expense | 246 | | 238 | | 486 | | 472 | |
Interest on post-employment benefit obligations | 17 | | 18 | | 34 | | 36 | |
Other expense (income) | 88 | | 1 | | 149 | | (16 | ) |
Income taxes | 292 | | 298 | | 527 | | 548 | |
Adjusted EBITDA | 2,430 | | 2,382 | | 4,684 | | 4,548 | |
BCE operating revenues | 5,786 | | 5,688 | | 11,376 | | 11,024 | |
Adjusted EBITDA margin | 42.0 | % | 41.9 | % | 41.2 | % | 41.3 | % |
| 36 BCE Inc. 2018 SECOND QUARTER SHAREHOLDER REPORT |
|
| | | | |
| | 8 | MD&A | Accounting policies, financial measures and controls |
| ADJUSTED NET EARNINGS AND ADJUSTED EPS |
The terms adjusted net earnings and adjusted EPS do not have any standardized meaning under IFRS. Therefore, they are unlikely to be comparable to similar measures presented by other issuers.
We define adjusted net earnings as net earnings attributable to common shareholders before severance, acquisition and other costs, net mark-to-market losses (gains) on derivatives used to economically hedge equity settled share-based compensation plans, net losses (gains) on investments, early debt redemption costs and impairment charges. We define adjusted EPS as adjusted net earnings per BCE common share.
We use adjusted net earnings and adjusted EPS, and we believe that certain investors and analysts use these measures, among other ones, to assess the performance of our businesses without the effects of severance, acquisition and other costs, net mark-to-market losses (gains) on derivatives used to economically hedge equity settled share-based compensation plans, net losses (gains) on investments, early debt redemption costs and impairment charges, net of tax and non-controlling (NCI). We exclude these items because they affect the comparability of our financial results and could potentially distort the analysis of trends in business performance. Excluding these items does not imply they are non-recurring.
The most comparable IFRS financial measures are net earnings attributable to common shareholders and EPS. The following table is a reconciliation of net earnings attributable to common shareholders and EPS to adjusted net earnings on a consolidated basis and per BCE common share (adjusted EPS), respectively.
| Q2 2018 | Q2 2017 | YTD 2018 | YTD 2017 |
| TOTAL | | PER SHARE | | TOTAL | | PER SHARE | | TOTAL | | PER SHARE | | TOTAL | | PER SHARE | |
Net earnings attributable to common shareholders | 704 | | 0.79 | | 765 | | 0.85 | | 1,365 | | 1.52 | | 1,407 | | 1.58 | |
Severance, acquisition and other costs | 18 | | 0.02 | | 27 | | 0.04 | | 17 | | 0.02 | | 92 | | 0.11 | |
Net mark-to-market losses (gains) on derivatives used to economically hedge equity settled share-based compensation plans | 22 | | 0.02 | | — | | — | | 78 | | 0.09 | | (18 | ) | (0.02 | ) |
Net losses on investments | 20 | | 0.02 | | — | | — | | 20 | | 0.02 | | 14 | | 0.02 | |
Early debt redemption costs | 13 | | 0.01 | | 3 | | — | | 13 | | 0.01 | | 3 | | — | |
Impairment charges | — | | — | | — | | — | | 3 | | — | | — | | — | |
Adjusted net earnings | 777 | | 0.86 | | 795 | | 0.89 | | 1,496 | | 1.66 | | 1,498 | | 1.69 | |
| FREE CASH FLOW AND DIVIDEND PAYOUT RATIO |
The terms free cash flow and dividend payout ratio do not have any standardized meaning under IFRS. Therefore, they are unlikely to be comparable to similar measures presented by other issuers.
We define free cash flow as cash flows from operating activities, excluding acquisition and other costs paid (which include significant litigation costs) and voluntary pension funding, less capital expenditures, preferred share dividends and dividends paid by subsidiaries to NCI. We exclude acquisition and other costs paid and voluntary pension funding because they affect the comparability of our financial results and could potentially distort the analysis of trends in business performance. Excluding these items does not imply they are non-recurring.
We consider free cash flow to be an important indicator of the financial strength and performance of our businesses because it shows how much cash is available to pay dividends, repay debt and reinvest in our company. We believe that certain investors and analysts use free cash flow to value a business and its underlying assets and to evaluate the financial strength and performance of our businesses. The most comparable IFRS financial measure is cash flows from operating activities.
We define dividend payout ratio as dividends paid on common shares divided by free cash flow. We consider dividend payout ratio to be an important indicator of the financial strength and performance of our businesses because it shows the sustainability of the company’s dividend payments.
The following table is a reconciliation of cash flows from operating activities to free cash flow on a consolidated basis.
| Q2 2018 | | Q2 2017 | | YTD 2018 | | YTD 2017 | |
Cash flows from operating activities | 2,057 | | 2,154 | | 3,553 | | 3,467 | |
Capital expenditures | (1,056 | ) | (1,042 | ) | (1,987 | ) | (1,894 | ) |
Cash dividends paid on preferred shares | (35 | ) | (30 | ) | (68 | ) | (73 | ) |
Cash dividends paid by subsidiaries to NCI | — | | (9 | ) | (13 | ) | (21 | ) |
Acquisition and other costs paid | 28 | | 21 | | 46 | | 104 | |
Free cash flow | 994 | | 1,094 | | 1,531 | | 1,583 | |
BCE Inc. 2018 SECOND QUARTER SHAREHOLDER REPORT 37 |
|
| | | | |
8 | MD&A | Accounting policies, financial measures and controls | |
The term net debt does not have any standardized meaning under IFRS. Therefore, it is unlikely to be comparable to similar measures presented by other issuers.
We define net debt as debt due within one year plus long-term debt and 50% of preferred shares, less cash and cash equivalents, as shown in BCE’s consolidated statements of financial position. We include 50% of outstanding preferred shares in our net debt as it is consistent with the treatment by certain credit rating agencies.
We consider net debt to be an important indicator of the company’s financial leverage because it represents the amount of debt that is not covered by available cash and cash equivalents. We believe that certain investors and analysts use net debt to determine a company’s financial leverage.
Net debt has no directly comparable IFRS financial measure, but rather is calculated using several asset and liability categories from the statements of financial position, as shown in the following table.
| JUNE 30, 2018 | | DECEMBER 31, 2017 | |
Debt due within one year | 5,732 | | 5,178 | |
Long-term debt | 18,367 | | 18,215 | |
50% of outstanding preferred shares | 2,002 | | 2,002 | |
Cash and cash equivalents | (390 | ) | (625 | ) |
Net debt | 25,711 | | 24,770 | |
The net debt leverage ratio does not have any standardized meaning under IFRS. Therefore, it is unlikely to be comparable to similar measures presented by other issuers. We use, and believe that certain investors and analysts use, the net debt leverage ratio as a measure of financial leverage.
The net debt leverage ratio represents net debt divided by adjusted EBITDA. For the purposes of calculating our net debt leverage ratio, adjusted EBITDA is twelve-month trailing adjusted EBITDA.
| ADJUSTED EBITDA TO NET INTEREST EXPENSE RATIO |
The ratio of adjusted EBITDA to net interest expense does not have any standardized meaning under IFRS. Therefore, it is unlikely to be comparable to similar measures presented by other issuers. We use, and believe that certain investors and analysts use, the adjusted EBITDA to net interest expense ratio as a measure of financial health of the company.
The adjusted EBITDA to net interest expense ratio represents adjusted EBITDA divided by net interest expense. For the purposes of calculating our adjusted EBITDA to net interest expense ratio, adjusted EBITDA is twelve-month trailing adjusted EBITDA. Net interest expense is twelve-month trailing net interest expense as shown in our statements of cash flows, plus 50% of declared preferred share dividends as shown in our income statements.
In addition to the non-GAAP financial measures described previously, we use a number of KPIs to measure the success of our strategic imperatives. These KPIs are not accounting measures and may not be comparable to similar measures presented by other issuers.
| KPI | DEFINITION |
| ARPU | Average revenue per user (ARPU) or subscriber is a measure used to track our recurring revenue streams, which has been updated to reflect the adoption of IFRS 15. Wireless blended ARPU is calculated by dividing certain service revenues by the average subscriber base for the specified period and is expressed as a dollar unit per month. |
| ABPU | Average billing per user (ABPU) approximates the average amount billed to customers on a monthly basis, which is used to track our recurring billing streams. This measure is the same as blended ARPU prior to the adoption of IFRS 15. Wireless blended ABPU is calculated by dividing certain customer billings by the average subscriber base for the specified period and is expressed as a dollar unit per month. |
| Capital intensity | Capital expenditures divided by operating revenues. |
| Churn | Churn is the rate at which existing subscribers cancel their services. It is a measure of our ability to retain our customers. Wireless churn is calculated by dividing the number of deactivations during a given period by the average number of subscribers in the base for the specified period and is expressed as a percentage per month. |
| Subscriber unit | Wireless subscriber unit is comprised of an active revenue-generating unit (e.g. mobile device, tablet or wireless Internet products), with a unique identifier (typically International Mobile Equipment Identity (IMEI) number), that has access to our wireless networks. We report wireless subscriber units in two categories: postpaid and prepaid. Prepaid subscriber units are considered active for a period of 120 days following the expiry of the subscriber’s prepaid balance. Wireline subscriber unit consists of an active revenue-generating unit with access to our services, including Internet, satellite TV, IPTV, and/or NAS. A subscriber is included in our subscriber base when the service has been installed and is operational at the customer premise and a billing relationship has been established. - Internet, IPTV and satellite TV subscribers have access to stand-alone services, and are primarily represented by a dwelling unit
- NAS subscribers are based on a line count and are represented by a unique telephone number
|
| 38 BCE Inc. 2018 SECOND QUARTER SHAREHOLDER REPORT |
|
| | | | |
| | 8 | MD&A | Accounting policies, financial measures and controls |
| 8.3Controls and procedures |
CHANGES IN INTERNAL CONTROL OVER FINANCIAL REPORTING
No changes were made in our internal control over financial reporting during the quarter ended June 30, 2018 that have materially affected, or are reasonably likely to materially affect, our internal control over financial reporting. We have completed the design of internal controls with respect to the adoption of IFRS 15 and are implementing them with no significant changes to our internal control over financial reporting.
| | | | BCE Inc. 2018 SECOND QUARTER SHAREHOLDER REPORT 39 |
|
| | | | |
| Consolidated financial statements | | |
| Consolidated financial statements |
| Consolidated income statements |
| FOR THE PERIOD ENDED JUNE 30 | | | THREE MONTHS | SIX MONTHS |
| (IN MILLIONS OF CANADIAN DOLLARS, EXCEPT SHARE AMOUNTS) (UNAUDITED) | NOTE | | 2018 | | 2017 | | 2018 | | 2017 | |
Operating revenues | 4 | | 5,786 | | 5,688 | | 11,376 | | 11,024 | |
Operating costs | 4, 5 | | (3,356 | ) | (3,306 | ) | (6,692 | ) | (6,476 | ) |
Severance, acquisition and other costs | 4, 6 | | (24 | ) | (36 | ) | (24 | ) | (120 | ) |
Depreciation | 4 | | (787 | ) | (767 | ) | (1,567 | ) | (1,491 | ) |
Amortization | 4 | | (221 | ) | (210 | ) | (433 | ) | (395 | ) |
Finance costs | | | | | | | | | | |
Interest expense | | | (246 | ) | (238 | ) | (486 | ) | (472 | ) |
Interest on post-employment benefit obligations | 10 | | (17 | ) | (18 | ) | (34 | ) | (36 | ) |
Other (expense) income | 7 | | (88 | ) | (1 | ) | (149 | ) | 16 | |
Income taxes | | | (292 | ) | (298 | ) | (527 | ) | (548 | ) |
Net earnings | | | 755 | | 814 | | 1,464 | | 1,502 | |
Net earnings attributable to: | | | | | | | | | | |
Common shareholders | | | 704 | | 765 | | 1,365 | | 1,407 | |
Preferred shareholders | | | 35 | | 32 | | 71 | | 63 | |
Non-controlling interest | | | 16 | | 17 | | 28 | | 32 | |
Net earnings | | | 755 | | 814 | | 1,464 | | 1,502 | |
Net earnings per common share – basic and diluted | 8 | | 0.79 | | 0.85 | | 1.52 | | 1.58 | |
Average number of common shares outstanding – basic (millions) | | | 898.0 | | 900.1 | | 899.1 | | 888.0 | |
| 40 BCE Inc. 2018 SECOND QUARTER SHAREHOLDER REPORT | | | |
|
| | | | |
| | Consolidated financial statements | |
| Consolidated statements of comprehensive income |
| FOR THE PERIOD ENDED JUNE 30 | THREE MONTHS | SIX MONTHS |
| (IN MILLIONS OF CANADIAN DOLLARS) (UNAUDITED) | 2018 | | 2017 | | 2018 | | 2017 | |
Net earnings | 755 | | 814 | | 1,464 | | 1,502 | |
Other comprehensive income (loss), net of income taxes | | | | | | | | |
Items that will be subsequently reclassified to net earnings | | | | | | | | |
Net change in value of derivatives designated as cash flow hedges, net of income taxes of ($2) million and $9 million for the three months ended June 30, 2018 and 2017, respectively, and ($5) million and $12 million for the six months ended June 30, 2018 and 2017, respectively(1) | 7 | | (30 | ) | 14 | | (39 | ) |
Items that will not be reclassified to net earnings | | | | | | | | |
Actuarial gains (losses) on post-employment benefit plans, net of income taxes of ($136) million and $95 million for the three months ended June 30, 2018 and 2017, respectively, and ($94) million and $214 million for the six months ended June 30, 2018 and 2017, respectively(2) | 366 | | (256 | ) | 254 | | (579 | ) |
Net change in value of derivatives designated as cash flow hedges, net of income taxes of ($6) million and nil for the three months ended June 30, 2018 and 2017, respectively, and ($13) million and nil for the six months ended June 30, 2018 and 2017, respectively(1) | 16 | | — | | 35 | | — | |
Other comprehensive income (loss) | 389 | | (286 | ) | 303 | | (618 | ) |
Total comprehensive income | 1,144 | | 528 | | 1,767 | | 884 | |
Total comprehensive income attributable to: | | | | | | | | |
Common shareholders | 1,091 | | 479 | | 1,665 | | 789 | |
Preferred shareholders | 35 | | 32 | | 71 | | 63 | |
Non-controlling interest | 18 | | 17 | | 31 | | 32 | |
Total comprehensive income | 1,144 | | 528 | | 1,767 | | 884 | |
| (1) | Amounts relating to the net change in value of derivatives for the three and six month periods ended June 30, 2017 have not been restated, in accordance with the transition requirements upon adoption ofIFRS 9 – Financial Instrumentson January 1, 2018. See Note 2,Basis of presentation and significant accounting policiesfor further details. |
| (2) | The discount rate used to value our post-employment benefit obligations at June 30, 2018 was 3.7% compared to 3.6% at March 31, 2018 and December 31, 2017. The discount rate used to value our post-employment benefit obligations at June 30, 2017 was 3.6% compared to 3.8% at March 31, 2017 and 4.0% at December 31, 2016. |
| | | | BCE Inc. 2018 SECOND QUARTER SHAREHOLDER REPORT 41 |
|
| | | | |
| Consolidated financial statements | | |
| Consolidated statements of financial position |
| (IN MILLIONS OF CANADIAN DOLLARS) (UNAUDITED) | NOTE | | JUNE 30, 2018 | | DECEMBER 31, 2017 | |
ASSETS | | | | | | |
Current assets | | | | | | |
Cash | | | 254 | | 442 | |
Cash equivalents | | | 136 | | 183 | |
Trade and other receivables | | | 2,932 | | 3,129 | |
Inventory | | | 436 | | 380 | |
Contract assets | | | 856 | | 832 | |
Contract costs | | | 345 | | 350 | |
Prepaid expenses | | | 376 | | 217 | |
Other current assets | | | 222 | | 122 | |
Total current assets | | | 5,557 | | 5,655 | |
Non-current assets | | | | | | |
Contract assets | | | 414 | | 431 | |
Contract costs | | | 287 | | 286 | |
Property, plant and equipment | | | 24,392 | | 24,029 | |
Intangible assets | | | 13,407 | | 13,258 | |
Deferred tax assets | | | 156 | | 144 | |
Investments in associates and joint ventures | | | 803 | | 814 | |
Other non-current assets | | | 975 | | 757 | |
Goodwill | 3 | | 10,568 | | 10,428 | |
Total non-current assets | | | 51,002 | | 50,147 | |
Total assets | | | 56,559 | | 55,802 | |
LIABILITIES | | | | | | |
Current liabilities | | | | | | |
Trade payables and other liabilities | | | 3,603 | | 3,875 | |
Contract liabilities | | | 687 | | 693 | |
Interest payable | | | 177 | | 168 | |
Dividends payable | | | 701 | | 678 | |
Current tax liabilities | | | 148 | | 140 | |
Debt due within one year | 9 | | 5,732 | | 5,178 | |
Total current liabilities | | | 11,048 | | 10,732 | |
Non-current liabilities | | | | | | |
Contract liabilities | | | 196 | | 201 | |
Long-term debt | 9 | | 18,367 | | 18,215 | |
Deferred tax liabilities | | | 3,139 | | 2,870 | |
Post-employment benefit obligations | 10 | | 1,987 | | 2,108 | |
Other non-current liabilities | | | 1,098 | | 1,051 | |
Total non-current liabilities | | | 24,787 | | 24,445 | |
Total liabilities | | | 35,835 | | 35,177 | |
EQUITY | | | | | | |
Equity attributable to BCE shareholders | | | | | | |
Preferred shares | 12 | | 4,004 | | 4,004 | |
Common shares | 12 | | 20,027 | | 20,091 | |
Contributed surplus | | | 1,151 | | 1,162 | |
Accumulated other comprehensive income (loss) | | | 34 | | (17 | ) |
Deficit | | | (4,811 | ) | (4,938 | ) |
Total equity attributable to BCE shareholders | | | 20,405 | | 20,302 | |
Non-controlling interest | | | 319 | | 323 | |
Total equity | | | 20,724 | | 20,625 | |
Total liabilities and equity | | | 56,559 | | 55,802 | |
| 42 BCE Inc. 2018 SECOND QUARTER SHAREHOLDER REPORT | | | |
|
| | | | |
| | Consolidated financial statements | |
| Consolidated statements of changes in equity |
FOR THE PERIOD ENDED JUNE 30, 2018
(IN MILLIONS OF CANADIAN DOLLARS) (UNAUDITED) | | | ATTRIBUTABLE TO BCE SHAREHOLDERS | | | | |
| | | | | | | | | ACCUMU- | | | | | | | | | |
| | | | | | | | | LATED | | | | | | | | | |
| | | | | | | | | OTHER | | | | | | | | | |
| | | | | | | | | COMPRE- | | | | | | NON- | | | |
| | | | | | | CONTRI- | | HENSIVE | | | | | | CONTROL- | | | |
| | | PREFERRED | | COMMON | | BUTED | | (LOSS) | | | | | | LING | | TOTAL | |
| NOTE | | SHARES | | SHARES | | SURPLUS | | INCOME | | DEFICIT | | TOTAL | | INTEREST | | EQUITY | |
Balance at December 31, 2017 | | | 4,004 | | 20,091 | | 1,162 | | (17 | ) | (4,938 | ) | 20,302 | | 323 | | 20,625 | |
Adoption of IFRS 9 | 2 | | — | | — | | — | | — | | (4 | ) | (4 | ) | — | | (4 | ) |
Balance at January 1, 2018 | | | 4,004 | | 20,091 | | 1,162 | | (17 | ) | (4,942 | ) | 20,298 | | 323 | | 20,621 | |
Net earnings | | | — | | — | | — | | — | | 1,436 | | 1,436 | | 28 | | 1,464 | |
Other comprehensive income | | | — | | — | | — | | 46 | | 254 | | 300 | | 3 | | 303 | |
Total comprehensive income | | | — | | — | | — | | 46 | | 1,690 | | 1,736 | | 31 | | 1,767 | |
Common shares issued under employee stock option plan | | | — | | 4 | | — | | — | | — | | 4 | | — | | 4 | |
Other share-based compensation | | | — | | — | | (8 | ) | — | | (23 | ) | (31 | ) | — | | (31 | ) |
Repurchase of common shares | 12 | | — | | (69 | ) | (3 | ) | — | | (103 | ) | (175 | ) | — | | (175 | ) |
Common shares issued for the acquisition of AlarmForce Industries Inc. (AlarmForce) | 3 | | — | | 1 | | — | | — | | — | | 1 | | — | | 1 | |
Dividends declared on BCE common and preferred shares | | | — | | — | | — | | — | | (1,427 | ) | (1,427 | ) | — | | (1,427 | ) |
Dividends declared by subsidiaries to non-controlling interest | | | — | | — | | — | | — | | — | | — | | (3 | ) | (3 | ) |
Settlement of cash flow hedges transferred to the cost basis of hedged items | | | — | | — | | — | | 5 | | — | | 5 | | — | | 5 | |
Return of capital to non-controlling interest | | | — | | — | | — | | — | | (6 | ) | (6 | ) | (35 | ) | (41 | ) |
Other | | | — | | — | | — | | — | | — | | — | | 3 | | 3 | |
Balance at June 30, 2018 | | | 4,004 | | 20,027 | | 1,151 | | 34 | | (4,811 | ) | 20,405 | | 319 | | 20,724 | |
FOR THE PERIOD ENDED JUNE 30, 2017
(IN MILLIONS OF CANADIAN DOLLARS) (UNAUDITED) | | | ATTRIBUTABLE TO BCE SHAREHOLDERS | | | | |
| | | | | | | | | ACCUMU- | | | | | | | | | |
| | | | | | | | | LATED | | | | | | | | | |
| | | | | | | | | OTHER | | | | | | | | | |
| | | | | | | | | COMPRE- | | | | | | NON- | | | |
| | | | | | | CONTRI- | | HENSIVE | | | | | | CONTROL- | | | |
| | | PREFERRED | | COMMON | | BUTED | | INCOME | | | | | | LING | | TOTAL | |
| NOTE | | SHARES | | SHARES | | SURPLUS | | (LOSS) | | DEFICIT | | TOTAL | | INTEREST | | EQUITY | |
Balance at January 1, 2017 | | | 4,004 | | 18,370 | | 1,160 | | 46 | | (4,978 | ) | 18,602 | | 314 | | 18,916 | |
Net earnings | | | — | | — | | — | | — | | 1,470 | | 1,470 | | 32 | | 1,502 | |
Other comprehensive loss | | | — | | — | | — | | (39 | ) | (579 | ) | (618 | ) | — | | (618 | ) |
Total comprehensive (loss) income | | | — | | — | | — | | (39 | ) | 891 | | 852 | | 32 | | 884 | |
Common shares issued under employee stock option plan | | | — | | 93 | | (5 | ) | — | | — | | 88 | | — | | 88 | |
Common shares issued under employee savings plan | | | — | | 5 | | — | | — | | — | | 5 | | — | | 5 | |
Other share-based compensation | | | — | | — | | (10 | ) | — | | (17 | ) | (27 | ) | — | | (27 | ) |
Common shares issued for the acquisition of Manitoba Telecom Services Inc. (MTS) | 3 | | — | | 1,594 | | — | | — | | — | | 1,594 | | — | | 1,594 | |
Dividends declared on BCE common and preferred shares | | | — | | — | | — | | — | | (1,334 | ) | (1,334 | ) | — | | (1,334 | ) |
Dividends declared by subsidiaries to non-controlling interest | | | — | | — | | — | | — | | — | | — | | (22 | ) | (22 | ) |
Balance at June 30, 2017 | | | 4,004 | | 20,062 | | 1,145 | | 7 | | (5,438 | ) | 19,780 | | 324 | | 20,104 | |
| | | | BCE Inc. 2018 SECOND QUARTER SHAREHOLDER REPORT 43 |
|
| | | | |
| Consolidated financial statements | | |
| Consolidated statements of cash flows |
| FOR THE PERIOD ENDED JUNE 30 | | | THREE MONTHS | SIX MONTHS |
| (IN MILLIONS OF CANADIAN DOLLARS) (UNAUDITED) | NOTE | | 2018 | | 2017 | | 2018 | | 2017 | |
Cash flows from operating activities | | | | | | | | | | |
Net earnings | | | 755 | | 814 | | 1,464 | | 1,502 | |
Adjustments to reconcile net earnings to cash flows from operating activities | | | | | | | | | | |
Severance, acquisition and other costs | 6 | | 24 | | 36 | | 24 | | 120 | |
Depreciation and amortization | | | 1,008 | | 977 | | 2,000 | | 1,886 | |
Post-employment benefit plans cost | 10 | | 80 | | 82 | | 170 | | 150 | |
Net interest expense | | | 243 | | 235 | | 481 | | 465 | |
Losses on investments | 7 | | — | | — | | — | | 12 | |
Income taxes | | | 292 | | 298 | | 527 | | 548 | |
Contributions to post-employment benefit plans | | | (74 | ) | (86 | ) | (161 | ) | (174 | ) |
Payments under other post-employment benefit plans | | | (19 | ) | (19 | ) | (38 | ) | (38 | ) |
Severance and other costs paid | | | (33 | ) | (40 | ) | (68 | ) | (81 | ) |
Interest paid | | | (252 | ) | (249 | ) | (488 | ) | (472 | ) |
Income taxes paid (net of refunds) | | | (113 | ) | (114 | ) | (397 | ) | (402 | ) |
Acquisition and other costs paid | | | (28 | ) | (21 | ) | (46 | ) | (104 | ) |
Net change in operating assets and liabilities | | | 174 | | 241 | | 85 | | 55 | |
Cash flows from operating activities | | | 2,057 | | 2,154 | | 3,553 | | 3,467 | |
Cash flows used in investing activities | | | | | | | | | | |
Capital expenditures | | | (1,056 | ) | (1,042 | ) | (1,987 | ) | (1,894 | ) |
Business acquisitions | 3 | | (21 | ) | — | | (244 | ) | (1,635 | ) |
Disposition of intangibles and other assets | 3 | | — | | 323 | | 68 | | 323 | |
Acquisition of spectrum licences | | | — | | — | | (36 | ) | — | |
Other investing activities | | | (20 | ) | (5 | ) | (55 | ) | (14 | ) |
Cash flows used in investing activities | | | (1,097 | ) | (724 | ) | (2,254 | ) | (3,220 | ) |
Cash flows used in financing activities | | | | | | | | | | |
Increase in notes payable | | | 97 | | 127 | | 40 | | 435 | |
Decrease in securitized trade receivables | | | (2 | ) | (360 | ) | (2 | ) | (10 | ) |
Issue of long-term debt | 9 | | — | | — | | 1,466 | | 1,496 | |
Repayment of long-term debt | 9 | | (1,068 | ) | (472 | ) | (1,241 | ) | (1,076 | ) |
Issue of common shares | | | 1 | | 41 | | 2 | | 89 | |
Repurchase of shares for settlement of share-based payments | | | (49 | ) | (45 | ) | (137 | ) | (141 | ) |
Repurchase of common shares | 12 | | — | | — | | (175 | ) | — | |
Cash dividends paid on common shares | | | (678 | ) | (626 | ) | (1,324 | ) | (1,220 | ) |
Cash dividends paid on preferred shares | | | (35 | ) | (30 | ) | (68 | ) | (73 | ) |
Cash dividends paid by subsidiaries to non-controlling interest | | | — | | (9 | ) | (13 | ) | (21 | ) |
Return of capital to non-controlling interest | | | (12 | ) | — | | (41 | ) | — | |
Other financing activities | | | (23 | ) | (9 | ) | (41 | ) | (22 | ) |
Cash flows used in financing activities | | | (1,769 | ) | (1,383 | ) | (1,534 | ) | (543 | ) |
Net decrease in cash | | | (421 | ) | (19 | ) | (188 | ) | (183 | ) |
Cash at beginning of period | | | 675 | | 439 | | 442 | | 603 | |
Cash at end of period | | | 254 | | 420 | | 254 | | 420 | |
Net (decrease) increase in cash equivalents | | | (388 | ) | 66 | | (47 | ) | (113 | ) |
Cash equivalents at beginning of period | | | 524 | | 71 | | 183 | | 250 | |
Cash equivalents at end of period | | | 136 | | 137 | | 136 | | 137 | |
| 44 BCE Inc. 2018 SECOND QUARTER SHAREHOLDER REPORT | | | |
|
| | | | |
| | Notes to consolidated financial statements | |
| Notes to consolidated financial statements |
These consolidated interim financial statements (financial statements) should be read in conjunction with BCE’s 2017 annual consolidated financial statements, approved by BCE’s board of directors on March 8, 2018.
These notes are unaudited.
We,us,our,BCE andthe companymean, as the context may require, either BCE Inc. or, collectively, BCE Inc., Bell Canada, their subsidiaries, joint arrangements and associates.MTSmeans, as the context may require, until March 17, 2017, either Manitoba Telecom Services Inc. or, collectively, Manitoba Telecom Services Inc. and its subsidiaries; and Bell MTSmeans, from March 17, 2017, the combined operations of MTS and Bell Canada in Manitoba.
| Note 1Corporate information |
BCE is incorporated and domiciled in Canada. BCE’s head office is located at 1, Carrefour Alexander-Graham-Bell, Verdun, Québec, Canada. BCE is a telecommunications and media company providing wireless, wireline, Internet and television (TV) services to residential, business and wholesale customers nationally across Canada. Our Bell Media segment provides conventional, specialty and pay TV, digital media, radio broadcasting services and out-of-home (OOH) advertising services to customers nationally across Canada.
| Note 2Basis of presentation and significant accounting policies |
These financial statements were prepared in accordance with International Financial Reporting Standards (IFRS), as issued by the International Accounting Standards Board (IASB), under International Accounting Standard (IAS) 34 – Interim Financial Reporting and were approved by BCE’s board of directors on August 1, 2018. These financial statements were prepared using the same basis of presentation, accounting policies and methods of computation as outlined in Note 2,Significant accounting policiesin our consolidated financial statements for the year ended December 31, 2017, except as noted below. The impacts of adopting IFRS 15 on our previously reported results for the three and six months ended June 30, 2017 are provided in Note 14,Adoption of IFRS 15. The impacts of adopting IFRS 15 on our statement of financial position as at January 1, 2017 and December 31, 2017, our consolidated income statement and consolidated statement of cash flows for the year ended December 31, 2017, along with updated 2017 annual disclosures are included in Note 3,Adoption of IFRS 15, of our unaudited consolidated financial statements for the period ended March 31, 2018.
These financial statements do not include all of the notes required in annual financial statements.
All amounts are in millions of Canadian dollars, except where noted.
| ADOPTION OF NEW ACCOUNTING STANDARDS |
As required, effective January 1, 2018, we adopted the following new accounting standards.
IFRS 15
We applied IFRS 15, Revenue from Contracts with Customers, retrospectively to each prior reporting period presented. IFRS 15 establishes principles to record revenues from contracts for the sale of products or services, unless the contracts are in the scope of other IFRSs.
IFRS 15 principally affects the timing of revenue recognition and how we classify revenues between product and service in our Bell Wireless segment. IFRS 15 also affects how we account for costs to obtain a contract.
- Under multiple-element arrangements, revenue allocated to a satisfied performance obligation is no longer limited to the amount that is not contingent upon the satisfaction of additional performance obligations. Although the total revenue recognized during the term of a contract is largely unaffected, revenue recognition may be accelerated and reflected ahead of the associated cash inflows. This results in the recognition of a contract asset on the balance sheet, corresponding to the amount of revenue recognized and not yet billed to a customer. The contract asset is realized over the term of the customer contract.
- As revenues allocated to a satisfied performance obligation are no longer limited to the non-contingent amount, a greater proportion of the total revenue recognized during the term of certain customer contracts may be attributed to a delivered product, resulting in a corresponding decrease in service revenue
- Sales commissions and any other incremental costs of obtaining a contract with a customer are recognized on the statement of financial position and amortized on a systematic basis that is consistent with the period and pattern of transfer to the customer of the related products or services, except as noted below
Under IFRS 15, we apply the following practical expedients.
- Completed contracts that begin and end within the same annual reporting period and those completed before January 1, 2017 are not restated
- Contracts modified prior to January 1, 2017 are not restated. The aggregate effect of these modifications is reflected when identifying the satisfied and unsatisfied performance obligations, determining the transaction price and allocating the transaction price to the satisfied and unsatisfied performance obligations.
- When our right to consideration from a customer corresponds directly with the value to the customer of the products and services transferred to date, we recognize revenue in the amount to which we have a right to invoice. For such contracts and for performance obligations that are part of a contract that has an original expected duration of one year or less, the transaction price amount allocated to the remaining performance obligations and an explanation of when we expect to recognise that amount as revenue are not disclosed.
- Costs of obtaining a contract that would be amortized within one year or less are immediately expensed
| | | | BCE Inc. 2018 SECOND QUARTER SHAREHOLDER REPORT 45 |
|
| | | | |
| Notes to consolidated financial statements | | |
IFRS 9
We applied IFRS 9, Financial Instruments (as revised in July 2014) and the related consequential amendments to other IFRSs retrospectively, except for the changes to hedge accounting described below which are applied prospectively. In accordance with the transition requirements, comparative periods have not been restated. The adoption of IFRS 9 did not have a significant impact on the carrying amounts of our financial instruments as at January 1, 2018. As a result of the adoption of IFRS 9, our January 1, 2018 deficit increased by $4 million.
IFRS 9 replaces the classification and measurement models in IAS 39, Financial Instruments: Recognition and Measurement, with a single model under which financial assets are classified and measured at amortized cost, fair value through other comprehensive income (FVOCI) or fair value through profit or loss (FVTPL). This classification is based on the business model in which a financial asset is managed and its contractual cash flow characteristics and eliminates the IAS 39 categories of held-to-maturity, loans and receivables and available-for-sale. The adoption of IFRS 9 did not, however, change the measurement bases of our financial assets.
- Cash and cash equivalents and derivative instruments measured at FVTPL under IAS 39 continue to be measured as such under IFRS 9
- Portfolio investments in equity securities and certain derivative instruments that qualify for cash flow hedge accounting measured at FVOCI under IAS 39 continue to be measured as such under IFRS 9
- Trade and other receivables continue to be measured at amortized cost under IFRS 9
The impairment of financial assets under IFRS 9 is based on an expected credit loss (ECL) model, as opposed to the incurred loss model in IAS 39. IFRS 9 applies to financial assets measured at amortized cost and contract assets and requires that we consider factors that include historical, current and forward-looking information when measuring the ECL. We use the simplified approach for measuring losses based on the lifetime ECL for trade receivables and contract assets. Amounts considered uncollectible are written off and recognized inOperating costsin the income statement.
We have adopted the general hedge accounting model in IFRS 9 which requires that we ensure hedge accounting relationships are consistent with our risk management objectives and strategies. We also apply a more qualitative and forward-looking approach in assessing hedge effectiveness as a retrospective assessment is no longer required.
- Under IFRS 9, amounts related to cash flow hedges of anticipated purchases of non-financial assets settled during the period are reclassified from Accumulated other comprehensive income to the initial cost of the non-financial asset when it is recognized. Under IAS 39, such amounts were reclassified from Other comprehensive income. Amounts related to cash flow hedges of other anticipated purchases continue to be reclassified from Other comprehensive income to net earnings under IFRS 9.
| FUTURE CHANGES TO ACCOUNTING STANDARDS |
As outlined in Note 2,Significant accounting policiesin our consolidated financial statements for the year ended December 31, 2017, the IASB issued IFRS 16 – Leases with an effective date of January 1, 2019.
We continue to make progress towards adoption of IFRS 16 according to our detailed implementation plan. It is not yet possible to make a reliable estimate of the impact of the new standard on our financial statements. We will adopt IFRS 16 on January 1, 2019, using a modified retrospective approach.
| Note 3Business acquisitions and dispositions |
2018
ACQUISITION OF ALARMFORCE
On January 5, 2018, BCE acquired all of the issued and outstanding shares of AlarmForce for a total consideration of $182 million, of which $181 million was paid in cash and the remaining $1 million through the issuance of 22,531 BCE common shares.
Subsequent to the acquisition of AlarmForce, on January 5, 2018, BCE sold AlarmForce’s approximate 39,000 customer accounts in British Columbia, Alberta and Saskatchewan to TELUS Communications Inc. (Telus) for total proceeds of approximately $68 million.
AlarmForce provides security alarm monitoring, personal emergency response monitoring, video surveillance and related services to residential and commercial subscribers. The acquisition of AlarmForce supports our strategic expansion in the Connected Home marketplace.
AlarmForce is included in our Bell Wireline segment in our consolidated financial statements.
| 46 BCE Inc. 2018 SECOND QUARTER SHAREHOLDER REPORT | | | |
|
| | | | |
| | Notes to consolidated financial statements | |
The purchase price allocation includes provisional estimates, in particular for finite-life intangible assets. The following table summarizes the fair value of the consideration paid and the fair value assigned to each major class of assets and liabilities.
| TOTAL | |
Cash consideration | 181 | |
Issuance of 22,531 BCE common shares(1) | 1 | |
Total cost to be allocated | 182 | |
Assets held for sale(2) | 68 | |
Property, plant and equipment | 8 | |
Finite-life intangible assets(3) | 34 | |
Indefinite-life intangible assets | 1 | |
Deferred tax liabilities | (7 | ) |
Other non-current liabilities | (1 | ) |
| 103 | |
Cash and cash equivalents | 4 | |
Fair value of net assets acquired | 107 | |
Goodwill(4) | 75 | |
| (1) | Recorded at fair value based on the market price of BCE common shares on the acquisition date. |
| (2) | Consists mainly of customer relationships recorded at fair value less costs to sell. |
| (3) | Consists mainly of customer relationships. |
| (4) | Goodwill arises principally from expected synergies and future growth and is not deductible for tax purposes. Goodwill arising from the transaction was allocated to our Bell Wireline group of CGUs. |
Revenues of $26 million and net earnings of $2 million from AlarmForce are included in the consolidated income statements from the date of acquisition. These amounts reflect the amortization of certain elements of the purchase price allocation and related tax adjustments.
| TERMINATION OF AGREEMENT TO ACQUIRE SÉRIES+ AND HISTORIA SPECIALTY CHANNELS |
On October 17, 2017, BCE entered into an agreement with Corus Entertainment Inc. (Corus) to acquire French-language specialty channels Séries+ and Historia. On May 28, 2018, the Competition Bureau announced that it did not approve the sale of the channels to BCE. As a result, BCE and Corus terminated their agreement.
| FUTURE BUSINESS ACQUISITIONS |
On June 30, 2018, Bell entered into an agreement to acquire a corporation that provides broadband network services to commercial and government accounts. The transaction is valued at approximately $152 million and is expected to close by the end of August 2018.
2017
ACQUISITION OF MTS
On March 17, 2017, BCE acquired all of the issued and outstanding common shares of MTS for a total consideration of $2,933 million, of which $1,339 million was paid in cash and the remaining $1,594 million through the issuance of approximately 27.6 million BCE common shares. BCE funded the cash component of the transaction through debt financing.
Revenues of $271 million and net earnings of $38 million from the acquired MTS operations are included in the consolidated income statements from the date of acquisition. BCE’s consolidated operating revenues and net earnings for the six months ended June 30, 2017 would have been $11,217 million and $1,513 million, respectively, had the acquisition of MTS occurred on January 1, 2017. These amounts reflect the elimination of intercompany transactions, financing costs and the amortization of certain elements of the purchase price allocation and related tax adjustments.
During Q2 2017, BCE completed the divestiture of approximately one-quarter of postpaid wireless subscribers and 15 retail locations previously held by MTS, as well as certain Manitoba network assets, to Telus for total proceeds of $323 million.
| ACQUISITION OF CIESLOK MEDIA LTD. (CIESLOK MEDIA) |
On January 3, 2017, BCE acquired all of the issued and outstanding common shares of Cieslok Media for a total cash consideration of $161 million.
The transaction did not have a significant impact on our consolidated operating revenues and net earnings for the six months ended June 30, 2017.
| | | | BCE Inc. 2018 SECOND QUARTER SHAREHOLDER REPORT 47 |
|
| | | | |
| Notes to consolidated financial statements | | |
| Note 4Segmented information |
Our results are reported in three segments: Bell Wireless, Bell Wireline and Bell Media. Our segments reflect how we manage our business and how we classify our operations for planning and measuring performance.
On March 17, 2017, BCE acquired all of the issued and outstanding common shares of MTS. The results from the acquired MTS operations are included in our Bell Wireless and Bell Wireline segments from the date of acquisition.
The following tables present financial information by segment for the three month periods ended June 30, 2018 and 2017.
| | | | BELL | | BELL | | BELL | | INTERSEGMENT | | | |
| FOR THE THREE MONTH PERIOD ENDED JUNE 30, 2018 | NOTE | | WIRELESS | | WIRELINE | | MEDIA | | ELIMINATIONS | | BCE | |
Operating revenues | | | | | | | | | | | | |
External customers | | | 2,032 | | 3,077 | | 677 | | — | | 5,786 | |
Inter-segment | | | 14 | | 58 | | 114 | | (186 | ) | — | |
Total operating revenues | | | 2,046 | | 3,135 | | 791 | | (186 | ) | 5,786 | |
Operating costs | 5 | | (1,142 | ) | (1,814 | ) | (586 | ) | 186 | | (3,356 | ) |
Segment profit(1) | | | 904 | | 1,321 | | 205 | | — | | 2,430 | |
Severance, acquisition and other costs | 6 | | (3 | ) | (13 | ) | (8 | ) | — | | (24 | ) |
Depreciation and amortization | | | (165 | ) | (803 | ) | (40 | ) | — | | (1,008 | ) |
Finance costs | | | | | | | | | | | | |
Interest expense | | | | | | | | | | | (246 | ) |
Interest on post-employment benefit obligations | 10 | | | | | | | | | | (17 | ) |
Other expense | 7 | | | | | | | | | | (88 | ) |
Income taxes | | | | | | | | | | | (292 | ) |
Net earnings | | | | | | | | | | | 755 | |
| (1) | The chief operating decision maker uses primarily one measure of profit to make decisions and assess performance, being operating revenues less operating costs. |
| | | | BELL | | BELL | | BELL | | INTERSEGMENT | | | |
| FOR THE THREE MONTH PERIOD ENDED JUNE 30, 2017 | NOTE | | WIRELESS | | WIRELINE | | MEDIA | | ELIMINATIONS | | BCE | |
Operating revenues | | | | | | | | | | | | |
External customers | | | 1,938 | | 3,067 | | 683 | | — | | 5,688 | |
Inter-segment | | | 11 | | 50 | | 113 | | (174 | ) | — | |
Total operating revenues | | | 1,949 | | 3,117 | | 796 | | (174 | ) | 5,688 | |
Operating costs | 5 | | (1,098 | ) | (1,810 | ) | (572 | ) | 174 | | (3,306 | ) |
Segment profit(1) | | | 851 | | 1,307 | | 224 | | — | | 2,382 | |
Severance, acquisition and other costs | 6 | | — | | (35 | ) | (1 | ) | — | | (36 | ) |
Depreciation and amortization | | | (143 | ) | (796 | ) | (38 | ) | — | | (977 | ) |
Finance costs | | | | | | | | | | | | |
Interest expense | | | | | | | | | | | (238 | ) |
Interest on post-employment benefit obligations | 10 | | | | | | | | | | (18 | ) |
Other expense | 7 | | | | | | | | | | (1 | ) |
Income taxes | | | | | | | | | | | (298 | ) |
Net earnings | | | | | | | | | | | 814 | |
| (1) | The chief operating decision maker uses primarily one measure of profit to make decisions and assess performance, being operating revenues less operating costs. |
| 48 BCE Inc. 2018 SECOND QUARTER SHAREHOLDER REPORT | | | |
|
| | | | |
| | Notes to consolidated financial statements | |
The following tables present financial information by segment for the six month periods ended June 30, 2018 and 2017.
| | | | BELL | | BELL | | BELL | | INTERSEGMENT | | | |
| FOR THE SIX MONTH PERIOD ENDED JUNE 30, 2018 | NOTE | | WIRELESS | | WIRELINE | | MEDIA | | ELIMINATIONS | | BCE | |
Operating revenues | | | | | | | | | | | | |
External customers | | | 3,966 | | 6,102 | | 1,308 | | — | | 11,376 | |
Inter-segment | | | 26 | | 117 | | 232 | | (375 | ) | — | |
Total operating revenues | | | 3,992 | | 6,219 | | 1,540 | | (375 | ) | 11,376 | |
Operating costs | 5 | | (2,266 | ) | (3,596 | ) | (1,205 | ) | 375 | | (6,692 | ) |
Segment profit(1) | | | 1,726 | | 2,623 | | 335 | | — | | 4,684 | |
Severance, acquisition and other costs | 6 | | (6 | ) | (8 | ) | (10 | ) | — | | (24 | ) |
Depreciation and amortization | | | (325 | ) | (1,598 | ) | (77 | ) | — | | (2,000 | ) |
Finance costs | | | | | | | | | | | | |
Interest expense | | | | | | | | | | | (486 | ) |
Interest on post-employment benefit obligations | 10 | | | | | | | | | | (34 | ) |
Other expense | 7 | | | | | | | | | | (149 | ) |
Income taxes | | | | | | | | | | | (527 | ) |
Net earnings | | | | | | | | | | | 1,464 | |
| (1) | The chief operating decision maker uses primarily one measure of profit to make decisions and assess performance, being operating revenues less operating costs. |
| | | | BELL | | BELL | | BELL | | INTERSEGMENT | | | |
| FOR THE SIX MONTH PERIOD ENDED JUNE 30, 2017 | NOTE | | WIRELESS | | WIRELINE | | MEDIA | | ELIMINATIONS | | BCE | |
Operating revenues | | | | | | | | | | | | |
External customers | | | 3,694 | | 5,995 | | 1,335 | | — | | 11,024 | |
Inter-segment | | | 22 | | 99 | | 212 | | (333 | ) | — | |
Total operating revenues | | | 3,716 | | 6,094 | | 1,547 | | (333 | ) | 11,024 | |
Operating costs | 5 | | (2,096 | ) | (3,524 | ) | (1,189 | ) | 333 | | (6,476 | ) |
Segment profit(1) | | | 1,620 | | 2,570 | | 358 | | — | | 4,548 | |
Severance, acquisition and other costs | 6 | | (5 | ) | (102 | ) | (13 | ) | — | | (120 | ) |
Depreciation and amortization | | | (281 | ) | (1,532 | ) | (73 | ) | — | | (1,886 | ) |
Finance costs | | | | | | | | | | | | |
Interest expense | | | | | | | | | | | (472 | ) |
Interest on post-employment benefit obligations | 10 | | | | | | | | | | (36 | ) |
Other income | 7 | | | | | | | | | | 16 | |
Income taxes | | | | | | | | | | | (548 | ) |
Net earnings | | | | | | | | | | | 1,502 | |
| (1) | The chief operating decision maker uses primarily one measure of profit to make decisions and assess performance, being operating revenues less operating costs. |
| REVENUES BY SERVICES AND PRODUCTS |
| | THREE MONTHS | SIX MONTHS |
| FOR THE PERIOD ENDED JUNE 30 | 2018 | | 2017 | | 2018 | | 2017 | |
Services(1) | | | | | | | | |
Wireless | 1,562 | | 1,508 | | 3,062 | | 2,923 | |
Data | 1,869 | | 1,812 | | 3,689 | | 3,531 | |
Voice | 957 | | 1,020 | | 1,907 | | 2,001 | |
Media | 677 | | 683 | | 1,308 | | 1,335 | |
Other services | 64 | | 55 | | 127 | | 99 | |
Total services | 5,129 | | 5,078 | | 10,093 | | 9,889 | |
Products(2) | | | | | | | | |
Wireless | 470 | | 430 | | 904 | | 771 | |
Data | 98 | | 95 | | 202 | | 194 | |
Equipment and other | 89 | | 85 | | 177 | | 170 | |
Total products | 657 | | 610 | | 1,283 | | 1,135 | |
Total operating revenues | 5,786 | | 5,688 | | 11,376 | | 11,024 | |
| (1) | Our service revenues are generally recognized over time. |
| (2) | Our product revenues are generally recognized at a point in time. |
| | | | BCE Inc. 2018 SECOND QUARTER SHAREHOLDER REPORT 49 |
|
| | | | |
| Notes to consolidated financial statements | | |
| | | | THREE MONTHS | SIX MONTHS |
| FOR THE PERIOD ENDED JUNE 30 | NOTE | | 2018 | | 2017 | | 2018 | | 2017 | |
Labour costs | | | | | | | | | | |
Wages, salaries and related taxes and benefits | | | (1,090 | ) | (1,072 | ) | (2,148 | ) | (2,075 | ) |
Post-employment benefit plans service cost (net of capitalized amounts) | 10 | | (63 | ) | (64 | ) | (136 | ) | (114 | ) |
Other labour costs(1) | | | (262 | ) | (264 | ) | (510 | ) | (517 | ) |
Less: | | | | | | | | | | |
Capitalized labour | | | 288 | | 268 | | 543 | | 513 | |
Total labour costs | | | (1,127 | ) | (1,132 | ) | (2,251 | ) | (2,193 | ) |
Cost of revenues(2) | | | (1,720 | ) | (1,678 | ) | (3,430 | ) | (3,305 | ) |
Other operating costs(3) | | | (509 | ) | (496 | ) | (1,011 | ) | (978 | ) |
Total operating costs | | | (3,356 | ) | (3,306 | ) | (6,692 | ) | (6,476 | ) |
| (1) | Other labour costs include contractor and outsourcing costs. |
| (2) | Cost of revenues includes costs of wireless devices and other equipment sold, network and content costs, and payments to other carriers. |
| (3) | Other operating costs include marketing, advertising and sales commission costs, bad debt expense, taxes other than income taxes, IT costs, professional service fees and rent. |
| Note 6Severance, acquisition and other costs |
| | THREE MONTHS | SIX MONTHS |
| FOR THE PERIOD ENDED JUNE 30 | 2018 | | 2017 | | 2018 | | 2017 | |
Severance | (15 | ) | (16 | ) | (24 | ) | (47 | ) |
Acquisition and other | (9 | ) | (20 | ) | — | | (73 | ) |
Total severance, acquisition and other costs | (24 | ) | (36 | ) | (24 | ) | (120 | ) |
Severance costs consist of charges related to workforce reduction initiatives.
| ACQUISITION AND OTHER COSTS |
Acquisition and other costs consist of transaction costs, such as legal and financial advisory fees, related to completed or potential acquisitions, employee severance costs related to the purchase of a business, the costs to integrate acquired companies into our operations and litigation costs, when they are significant. Acquisition costs also include a loss on transfer of spectrum licences relating to the MTS acquisition in 2017.
| Note 7Other (expense) income |
| | | | THREE MONTHS | SIX MONTHS |
| FOR THE PERIOD ENDED JUNE 30 | NOTE | | 2018 | | 2017 | | 2018 | | 2017 | |
Net mark-to-market (losses) gains on derivatives used to economically hedge equity settled share-based compensation plans(1) | | | (30 | ) | 1 | | (107 | ) | 25 | |
Equity (losses) income from investments in associates and joint ventures | | | | | | | | | | |
Losses on investments(2) | | | (20 | ) | — | | (20 | ) | (2 | ) |
Operations | | | (20 | ) | 12 | | (3 | ) | 31 | |
Early debt redemption costs | 9 | | (18 | ) | (4 | ) | (18 | ) | (4 | ) |
Impairment of assets | | | — | | — | | (4 | ) | — | |
Losses on retirements and disposals of property, plant and equipment and intangible assets | | | (2 | ) | (9 | ) | (1 | ) | (26 | ) |
Losses on investments | | | — | | — | | — | | (12 | ) |
Other(1) | | | 2 | | (1 | ) | 4 | | 4 | |
Total other (expense) income | | | (88 | ) | (1 | ) | (149 | ) | 16 | |
| (1) | We have reclassified amounts from the previous period to make them consistent with the presentation for the current period. |
| (2) | The $20 million loss in 2018 represents BCE’s share of an obligation to repurchase at fair value the minority interest in one of BCE’s joint ventures. The obligation is marked to market each reporting period and the gain or loss on investment is recorded as equity gains or losses from investments in associates and joint ventures. |
| 50 BCE Inc. 2018 SECOND QUARTER SHAREHOLDER REPORT | | | |
|
| | | | |
| | Notes to consolidated financial statements | |
The following table shows the components used in the calculation of basic and diluted earnings per common share for earnings attributable to common shareholders.
| | THREE MONTHS | SIX MONTHS |
| FOR THE PERIOD ENDED JUNE 30 | 2018 | | 2017 | | 2018 | | 2017 | |
Net earnings attributable to common shareholders – basic | 704 | | 765 | | 1,365 | | 1,407 | |
Dividends declared per common share (in dollars) | 0.7550 | | 0.7175 | | 1.5100 | | 1.4350 | |
Weighted average number of common shares outstanding (in millions) | | | | | | | | |
Weighted average number of common shares outstanding – basic | 898.0 | | 900.1 | | 899.1 | | 888.0 | |
Assumed exercise of stock options(1) | 0.3 | | 0.9 | | 0.3 | | 0.8 | |
Weighted average number of common shares outstanding – diluted (in millions) | 898.3 | | 901.0 | | 899.4 | | 888.8 | |
| (1) | The calculation of the assumed exercise of stock options includes the effect of the average unrecognized future compensation cost of dilutive options. It excludes options for which the exercise price is higher than the average market value of a BCE common share. The number of excluded options was 12,050,731 for both the second quarter of 2018 and for the first half of 2018, compared to 31,722 for the second quarter of 2017 and 5,803,983 for the first half of 2017. |
2018
On May 4, 2018, Bell Canada redeemed, prior to maturity, its 3.50% Series M-28 medium term notes (MTN) debentures, having an outstanding principal amount of $400 million which were due on September 10, 2018.
On April 16, 2018, Bell Canada redeemed, prior to maturity, its 4.59% Series 9 notes, having an outstanding principal amount of $200 million which were due on October 1, 2018. In addition, on the same date, Bell Canada redeemed, prior to maturity, its 5.52% Series M-33 debentures, having an outstanding principal amount of $300 million, which were due on February 26, 2019.
In Q2 2018, we incurred early debt redemption charges of $18 million which were recorded inOther (expense) incomein the income statement.
In Q2 2018, Bell Canada reclassified its $1 billion 3.35% Series M-25 debentures, which mature on June 18, 2019, from long-term debt to debt due within one year.
On March 29, 2018, Bell Canada issued 4.464% Series US-1 notes under its 2016 trust indenture, with a principal amount of US $750 million (CAD $967 million), which mature on April 1, 2048. The Series US-1 Notes have been hedged for foreign currency fluctuations through a cross currency interest rate swap. See Note 11,Financial assets and liabilities, for additional details.
On March 12, 2018, Bell Canada issued 3.35% Series M-47 MTN debentures under its 1997 trust indenture, with a principal amount of $500 million, which mature on March 12, 2025.
| Note 10Post-employment benefit plans |
POST-EMPLOYMENT BENEFIT PLANS COST
We provide pension and other benefits for most of our employees. These include defined benefit (DB) pension plans, defined contribution (DC) pension plans and other post-employment benefits (OPEBs).
COMPONENTS OF POST-EMPLOYMENT BENEFIT PLANS SERVICE COST
| | THREE MONTHS | SIX MONTHS |
| FOR THE PERIOD ENDED JUNE 30 | 2018 | | 2017 | | 2018 | | 2017 | |
DB pension | (53 | ) | (53 | ) | (106 | ) | (101 | ) |
DC pension | (24 | ) | (24 | ) | (57 | ) | (55 | ) |
OPEBs | (1 | ) | (1 | ) | (2 | ) | (3 | ) |
Plan amendment gain on OPEBs | — | | — | | — | | 16 | |
Less: | | | | | | | | |
Capitalized benefit plans cost | 15 | | 14 | | 29 | | 29 | |
Total post-employment benefit plans service cost included in operating costs | (63 | ) | (64 | ) | (136 | ) | (114 | ) |
Other costs recognized in severance, acquisition and other costs | — | | (4 | ) | (4 | ) | (4 | ) |
Total post-employment benefit plans service cost | (63 | ) | (68 | ) | (140 | ) | (118 | ) |
| | | | BCE Inc. 2018 SECOND QUARTER SHAREHOLDER REPORT 51 |
|
| | | | |
| Notes to consolidated financial statements | | |
COMPONENTS OF POST-EMPLOYMENT BENEFIT PLANS FINANCING COST
| | THREE MONTHS | SIX MONTHS |
| FOR THE PERIOD ENDED JUNE 30 | 2018 | | 2017 | | 2018 | | 2017 | |
DB pension | (5 | ) | (5 | ) | (11 | ) | (9 | ) |
OPEBs | (12 | ) | (13 | ) | (23 | ) | (27 | ) |
Total interest on post-employment benefit obligations | (17 | ) | (18 | ) | (34 | ) | (36 | ) |
| Note 11Financial assets and liabilities |
FAIR VALUE
The following table provides the fair value details of financial instruments measured at amortized cost in the statements of financial position.
| | | JUNE 30, 2018 | DECEMBER 31, 2017 |
| | | | CARRYING | | FAIR | | CARRYING | | FAIR | |
| | CLASSIFICATION | FAIR VALUE METHODOLOGY | VALUE | | VALUE | | VALUE | | VALUE | |
CRTC tangible benefits obligation | Trade payables and other liabilities and non-current liabilities | Present value of estimated future cash flows discounted using observable market interest rates | 79 | | 78 | | 111 | | 110 | |
CRTC deferral account obligation | Trade payables and other liabilities and non-current liabilities | Present value of estimated future cash flows discounted using observable market interest rates | 119 | | 121 | | 124 | | 128 | |
Debt securities, finance leases and other debt | Debt due within one year and long-term debt | Quoted market price of debt or present value of future cash flows discounted using observable market interest rates | 19,868 | | 21,490 | | 19,321 | | 21,298 | |
The following table provides the fair value details of financial instruments measured at fair value in the statements of financial position.
| | CLASSIFICATION | CARRYING VALUE OF
ASSET (LIABILITY) | | FAIR VALUE |
QUOTED PRICES IN
ACTIVE MARKETS
FOR IDENTICAL
ASSETS (LEVEL 1) | | OBSERVABLE
MARKET DATA
(LEVEL 2)(1) | | NON-OBSERVABLE
MARKET INPUTS
(LEVEL 3)(2) | |
| June 30, 2018 | | | | | | | | | |
Publicly-traded and privately-held
investments | Other non-current assets | 104 | | 1 | | — | | 103 | |
Derivative financial instruments | Other current assets, trade payables and other liabilities, other non-current assets and liabilities | (5 | ) | — | | (5 | ) | — | |
Maple Leaf Sports & Entertainment Ltd. (MLSE) financial liability(3) | Trade payables and other liabilities | (135 | ) | — | | — | | (135 | ) |
Other | Other non-current assets and liabilities | 70 | | — | | 116 | | (46 | ) |
December 31, 2017 | | | | | | | | | |
Publicly-traded and privately-held investments | Other non-current assets | 103 | | 1 | | — | | 102 | |
Derivative financial instruments | Other current assets, trade payables and other liabilities, other non-current assets and liabilities | (48 | ) | — | | (48 | ) | — | |
MLSE financial liability(3) | Trade payables and other liabilities | (135 | ) | — | | — | | (135 | ) |
Other | Other non-current assets and liabilities | 60 | | — | | 106 | | (46 | ) |
| (1) | Observable market data such as equity prices, interest rates, swap rate curves and foreign currency exchange rates. |
| (2) | Non-observable market inputs such as discounted cash flows and earnings multiples. A reasonable change in our assumptions would not result in a significant increase (decrease) to our level 3 financial instruments. |
| (3) | Represents BCE’s obligation to repurchase the BCE Master Trust Fund’s (Master Trust) 9% interest in MLSE at a price not less than an agreed minimum price should the Master Trust exercise its put option. The obligation to repurchase is marked to market each reporting period and the gain or loss is recorded in Other (expense) income in the income statements. |
| 52 BCE Inc. 2018 SECOND QUARTER SHAREHOLDER REPORT | | | |
|
| | | | |
| | Notes to consolidated financial statements | |
We use forward contracts, options and cross currency interest rate swaps to manage foreign currency risk related to anticipated purchases and sales and certain foreign currency denominated debt.
A 10% depreciation (appreciation) in the value of the Canadian dollar relative to the U.S. dollar would result in a gain (loss) of $2 million ($3 million) recognized in net earnings at June 30, 2018 and a gain (loss) of $139 million ($134 million) recognized inOther comprehensive income (loss)at June 30, 2018, with all other variables held constant.
In Q1 2018, we entered into a cross currency interest rate swap with a notional amount of $750 million in U.S. dollars ($967 million in Canadian dollars) to hedge the U.S. currency exposure of our Series US-1 notes maturing in 2048. See Note 9,Debt, for additional details.
The following table provides further details on our outstanding foreign currency forward contracts and options as at June 30, 2018.
| TYPE OF HEDGE | BUY CURRENCY | | AMOUNT TO RECEIVE | | SELL CURRENCY | | AMOUNT TO PAY | | MATURITY | | HEDGED ITEM | |
| Cash flow | USD | | 2,499 | | CAD | | 3,244 | | 2018 | | Commercial paper | |
| Cash flow | USD | | 450 | | CAD | | 584 | | 2018 | | Anticipated transactions | |
| Cash flow | CAD | | 46 | | USD | | 36 | | 2018-2019 | | Anticipated transactions | |
| Cash flow | USD | | 775 | | CAD | | 968 | | 2019 | | Anticipated transactions | |
| Cash flow | USD | | 76 | | CAD | | 96 | | 2020-2021 | | Anticipated transactions | |
| Economic | USD | | 19 | | CAD | | 24 | | 2018 | | Anticipated transactions | |
| Economic – call options | USD | | 33 | | CAD | | 41 | | 2018 | | Anticipated transactions | |
| Economic – put options | USD | | 99 | | CAD | | 119 | | 2018 | | Anticipated transactions | |
A 1% increase (decrease) in interest rates would result in a decrease (increase) of $31 million in net earnings at June 30, 2018.
We use equity forward contracts on BCE’s common shares to economically hedge the cash flow exposure related to the settlement of equity settled share-based compensation plans and the equity price risk related to a cash-settled share-based payment plan. The fair value of our equity forward contracts at June 30, 2018 was a liability of $85 million.
A 5% increase (decrease) in the market price of BCE’s common shares at June 30, 2018 would result in a gain (loss) of $33 million recognized in net earnings, with all other variables held constant.
NORMAL COURSE ISSUER BID PROGRAM (NCIB)
In Q1 2018, BCE repurchased and canceled 3,085,697 common shares for a total cost of $175 million. Of the total cost, $69 million represents stated capital and $3 million represents the reduction of the contributed surplus attributable to these common shares. The remaining $103 million was charged to the deficit.
| CONVERSION OF FIRST PREFERRED SHARES |
On March 1, 2018, 397,181 of BCE’s 5,069,935 fixed-rate Cumulative Redeemable First Preferred Shares, Series AC (Series AC Preferred Shares) were converted, on a one-for-one basis, into floating rate Cumulative Redeemable First Preferred Shares, Series AD (Series AD Preferred Shares). In addition, on March 1, 2018, 5,356,937 of BCE’s 14,930,065 Series AD Preferred Shares were converted, on a one-for-one basis, into Series AC Preferred Shares.
The annual fixed dividend rate on BCE’s Series AC Preferred Shares was reset for the next five years, effective March 1, 2018, at 4.38% from 3.55%. The Series AD Preferred Shares continue to pay a monthly floating cash dividend.
| | | | BCE Inc. 2018 SECOND QUARTER SHAREHOLDER REPORT 53 |
|
| | | | |
| Notes to consolidated financial statements | | |
| Note 13Share-based payments |
The following share-based payment amounts are included in the income statements as operating costs.
| | THREE MONTHS | SIX MONTHS |
| FOR THE PERIOD ENDED JUNE 30 | 2018 | | 2017 | | 2018 | | 2017 | |
Employee savings plan (ESP) | (7 | ) | (7 | ) | (14 | ) | (14 | ) |
Restricted share units (RSUs) and performance share units (PSUs) | (11 | ) | (10 | ) | (30 | ) | (27 | ) |
Other(1) | (2 | ) | (2 | ) | (6 | ) | (5 | ) |
Total share-based payments | (20 | ) | (19 | ) | (50 | ) | (46 | ) |
| (1) | Includes deferred share plan (DSP), deferred share units (DSUs) and stock options. |
The following tables summarize the change in outstanding ESP shares, RSUs/PSUs, DSUs and stock options for the period ended June 30, 2018.
ESP
| NUMBER OF | |
| ESP SHARES | |
Unvested contributions, January 1, 2018 | 1,039,030 | |
Contributions(1) | 331,987 | |
Dividends credited | 26,960 | |
Vested | (255,867 | ) |
Forfeited | (71,395 | ) |
Unvested contributions, June 30, 2018 | 1,070,715 | |
| (1) | The weighted average fair value of the shares contributed during the six months ended June 30, 2018 was $56. |
RSUs/PSUs
| NUMBER OF | |
| RSUs/PSUs | |
Outstanding, January 1, 2018 | 2,740,392 | |
Granted(1) | 958,411 | |
Dividends credited | 71,863 | |
Settled | (1,010,626 | ) |
Forfeited | (20,287 | ) |
Outstanding, June 30, 2018 | 2,739,753 | |
| (1) | The weighted average fair value of the RSUs/PSUs granted during the six months ended June 30, 2018 was $57. |
DSUs
| NUMBER OF DSUs | |
Outstanding, January 1, 2018 | 4,309,528 | |
Issued(1) | 69,659 | |
Settlement of RSUs/PSUs | 112,675 | |
Dividends credited | 116,172 | |
Settled | (181,645 | ) |
Outstanding, June 30, 2018 | 4,426,389 | |
| (1) | The weighted average fair value of the DSUs issued during the six months ended June 30, 2018 was $55. |
STOCK OPTIONS
| | NUMBER OF
OPTIONS | | WEIGHTED AVERAGE
EXERCISE PRICE ($) | |
Outstanding, January 1, 2018 | 10,490,249 | | 55 | |
Granted | 3,651,802 | | 57 | |
Exercised(1) | (59,756 | ) | 39 | |
Forfeited | (4,641 | ) | 59 | |
Outstanding, June 30, 2018 | 14,077,654 | | 56 | |
Exercisable, June 30, 2018 | 4,606,773 | | 52 | |
| (1) | The weighted average share price for options exercised during the six months ended June 30, 2018 was $56. |
| 54 BCE Inc. 2018 SECOND QUARTER SHAREHOLDER REPORT | | | |
|
| | | | |
| | Notes to consolidated financial statements | |
ASSUMPTIONS USED IN STOCK OPTION PRICING MODEL
The fair value of options granted was determined using a variation of a binomial option pricing model that takes into account factors specific to the share incentive plans, such as the vesting period. The following table shows the principal assumptions used in the valuation.
| 2018 | |
Weighted average fair value per option granted | $2.13 | |
Weighted average share price | $57 | |
Weighted average exercise price | $57 | |
Dividend yield | 5 | % |
Expected volatility | 12 | % |
Risk-free interest rate | 2 | % |
Expected life (years) | 4 | |
Expected volatilities are based on the historical volatility of BCE’s share price. The risk-free rate used is equal to the yield available on Government of Canada bonds at the date of grant with a term equal to the expected life of the options.
| Note 14Adoption of IFRS 15 |
As a result of adopting IFRS 15, we have changed the comparative figures for the three and six months ended June 30, 2017 and the year ended December 31, 2017. The impacts of adopting IFRS 15 on our previously reported results for the three and six months ended June 30, 2017 are provided below. The impacts of adopting IFRS 15 on our statement of financial position as at January 1, 2017 and December 31, 2017, our consolidated income statement and consolidated statement of cash flows for the year ended December 31, 2017, along with updated 2017 annual disclosures are included in Note 3,Adoption of IFRS 15, of our unaudited consolidated financial statements for the period ended March 31, 2018.
| CONSOLIDATED INCOME STATEMENTS |
The table below shows the impacts of adopting IFRS 15 on our previously reported consolidated income statements for the three and six months ended June 30, 2017.
| | THREE MONTHS ENDED JUNE 30, 2017 | SIX MONTHS ENDED JUNE 30, 2017 |
| (IN MILLIONS OF CANADIAN DOLLARS, EXCEPT SHARE AMOUNTS) | 2017 AS
PREVIOUSLY
REPORTED | | IFRS 15 IMPACTS | | 2017 UPON
ADOPTION
OF IFRS 15 | | 2017 AS
PREVIOUSLY
REPORTED | | IFRS 15 IMPACTS | | 2017 UPON
ADOPTION
OF IFRS 15 | |
Operating revenues | 5,699 | | (11 | ) | 5,688 | | 11,083 | | (59 | ) | 11,024 | |
Operating costs | (3,318 | ) | 12 | | (3,306 | ) | (6,488 | ) | 12 | | (6,476 | ) |
Severance, acquisition and other costs | (36 | ) | — | | (36 | ) | (120 | ) | — | | (120 | ) |
Depreciation | (769 | ) | 2 | | (767 | ) | (1,491 | ) | — | | (1,491 | ) |
Amortization | (211 | ) | 1 | | (210 | ) | (396 | ) | 1 | | (395 | ) |
Finance costs | | | | | | | | | | | | |
Interest expense | (238 | ) | — | | (238 | ) | (472 | ) | — | | (472 | ) |
Interest on post-employment benefit obligations | (18 | ) | — | | (18 | ) | (36 | ) | — | | (36 | ) |
Other (expense) income | (1 | ) | — | | (1 | ) | 16 | | — | | 16 | |
Income taxes | (297 | ) | (1 | ) | (298 | ) | (560 | ) | 12 | | (548 | ) |
Net earnings | 811 | | 3 | | 814 | | 1,536 | | (34 | ) | 1,502 | |
Net earnings attributable to: | | | | | | | | | | | | |
Common shareholders | 762 | | 3 | | 765 | | 1,441 | | (34 | ) | 1,407 | |
Preferred shareholders | 32 | | — | | 32 | | 63 | | — | | 63 | |
Non-controlling interest | 17 | | — | | 17 | | 32 | | — | | 32 | |
Net earnings | 811 | | 3 | | 814 | | 1,536 | | (34 | ) | 1,502 | |
Net earnings per common share – basic and diluted | 0.84 | | 0.01 | | 0.85 | | 1.62 | | (0.04 | ) | 1.58 | |
Average number of common shares outstanding – basic (millions) | 900.1 | | — | | 900.1 | | 888.0 | | — | | 888.0 | |
| | | | BCE Inc. 2018 SECOND QUARTER SHAREHOLDER REPORT 55 |
|
| | | | |
| Notes to consolidated financial statements | | |
The table below provides a reconciliation of our deficit at June 30, 2017 from amounts previously reported in 2017 to the amounts reported under IFRS 15. All amounts are after tax.
| AT JUNE 30, 2017 | |
Total deficit as previously reported | (6,466 | ) |
Timing of revenue recognition | 777 | |
Cost to obtain a contract | 251 | |
Total deficit upon adoption of IFRS 15 | (5,438 | ) |
| CONSOLIDATED STATEMENT OF CASH FLOWS |
The table below shows the impacts of adopting IFRS 15 on select line items of our previously reported 2017 statement of cash flows for the three and six months ended June 30, 2017.
| THREE MONTHS ENDED JUNE 30, 2017 | SIX MONTHS ENDED JUNE 30, 2017 |
| | 2017 AS
PREVIOUSLY
REPORTED | | IFRS 15 IMPACTS | | 2017 UPON
ADOPTION
OF IFRS 15 | | 2017 AS
PREVIOUSLY
REPORTED | | IFRS 15 IMPACTS | | 2017 UPON
ADOPTION
OF IFRS 15 | |
Cash flows from operating activities | | | | | | | | | | | | |
Net earnings | 811 | | 3 | | 814 | | 1,536 | | (34 | ) | 1,502 | |
Depreciation and amortization | 980 | | (3 | ) | 977 | | 1,887 | | (1 | ) | 1,886 | |
Income taxes | 297 | | 1 | | 298 | | 560 | | (12 | ) | 548 | |
Net change in operating assets and liabilities | 242 | | (1 | ) | 241 | | 8 | | 47 | | 55 | |
Cash flows from operating activities | 2,154 | | — | | 2,154 | | 3,467 | | — | | 3,467 | |
| 56 BCE Inc. 2018 SECOND QUARTER SHAREHOLDER REPORT | | | |
|
This document has been filed by BCE Inc. with the Canadian provincial securities regulatory authorities and the U.S. Securities and Exchange Commission. It can be found on BCE Inc.’s website atBCE.ca, on SEDAR atwww.sedar.comand on EDGAR atwww.sec.govor is available upon request from: INVESTOR RELATIONS Building A, 8th floor
1 Carrefour Alexander-Graham-Bell
Verdun, Québec H3E 3B3 e-mail: investor.relations@bce.ca
tel: 1-800-339-6353
fax: 514-786-3970 BCE.ca For additional copies of this document, please contact investor relations. | For further information concerning BCE Inc.’s Dividend Reinvestment and Stock Purchase Plan (DRP), direct deposit of dividend payments, the elimination of multiple mailings or the receipt of quarterly reports, please contact: AST TRUST COMPANY (CANADA) 1 Toronto Street, Suite 1200
Toronto, Ontario M5C 2V6 tel: 416 682-3861 or 1 800 561-0934
fax: 514 985-8843 or 1 888 249-6189
e-mail: bce@astfinancial.com |
Pour obtenir un exemplaire de la version française de ce document, contactez les Relations avec les investisseurs.