- WEBNF Dashboard
- Financials
- Filings
- Holdings
- Transcripts
-
ETFs
-
Insider
- Institutional
- Shorts
-
6-K Filing
Westpac Banking (WEBNF) 6-KCurrent report (foreign)
Filed: 4 May 20, 10:13am
Exhibit 1
 | ASX Release 4 MAY 2020 Level 18, 275 Kent Street Sydney, NSW, 2000 Westpac 2020 Interim Financial Results Announcement (incorporating requirements of Appendix 4D) Westpac Banking Corporation (“Westpac”) today provides the attached Westpac 2020 Interim Financial Results Announcement (incorporating requirements of Appendix 4D). For further information: David LordingAndrew Bowden Group Head of Media RelationsHead of Investor Relations 0419 683 411T. (02) 8253 4008 (ext. 24008) M. 0438 284 863 This document has been authorised for release by Tim Hartin, Group Company Secretary. |
 | 2020 Interim Financial Results For the six months ended 31 March 2020 Incorporating the requirements of Appendix 4D Westpac Banking Corporation ABN 33 007 457 141 A Westpac Little Ripper drone in flight above bushfire affected areas. A trial initiative supported by Westpac, in partnership with WIRES, is using innovative technology to assist with wildlife search and rescue. |
 | Results Announcement to the market ASX Appendix 4D Results for announcement to the market1 Report for the half year ended 31 March 20202 1. This document comprises the Westpac Group 2020 Interim Financial Results, including the 2020 Interim Financial Report contained in Section 4 and is provided to the Australian Securities Exchange under Listing Rule 4.2A. 2. This report should be read in conjunction with the Westpac Group Annual Report 2019 and any public announcements made in the period by the Westpac Group in accordance with the continuous disclosure requirements of the Corporations Act 2001 and ASX Listing Rules. 3. Comprises reported interest income, interest expense and non-interest income. 4. Above comparisons are to the reported results for the six months ended 31 March 2019. 5. The Board has deferred the decision on determining an interim dividend and no dividend will be paid in June 2020. |
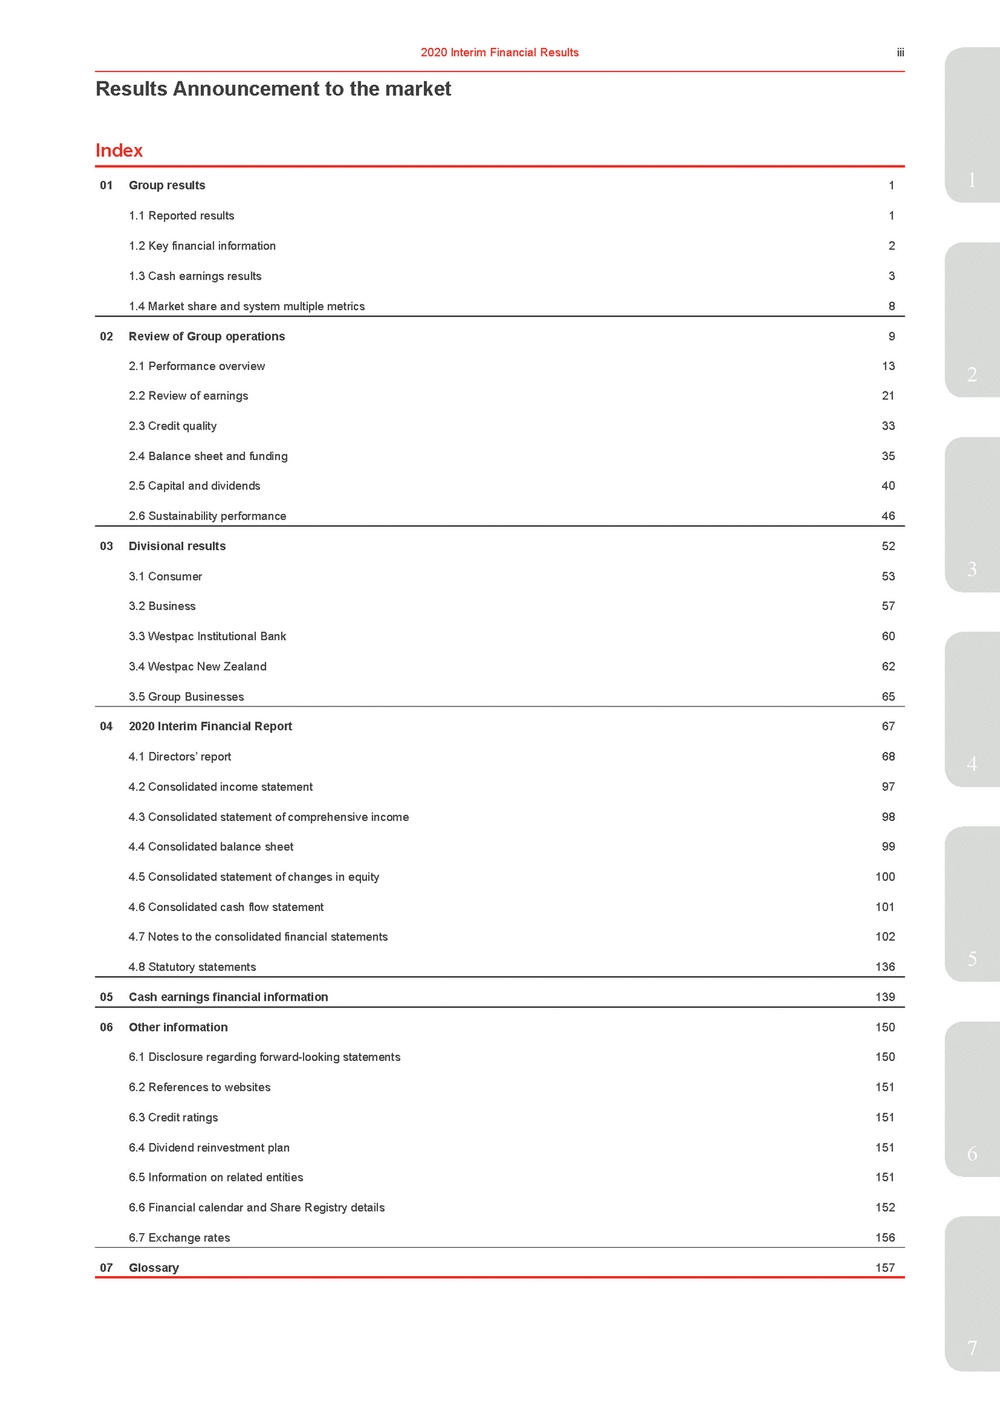 | Index 01 Group results11 1.1 Reported results1 1.2 Key financial information2 1.3 Cash earnings results3 1.4 Market share and system multiple metrics8 02 Review of Group operations9 2.1 Performance overview132 2.2 Review of earnings21 2.3 Credit quality33 2.4 Balance sheet and funding35 2.5 Capital and dividends40 2.6 Sustainability performance46 03 Divisional results52 3.1 Consumer533 3.2 Business57 3.3 Westpac Institutional Bank60 3.4 Westpac New Zealand62 3.5 Group Businesses65 04 2020 Interim Financial Report67 4.1 Directors’ report684 4.2 Consolidated income statement97 4.3 Consolidated statement of comprehensive income98 4.4 Consolidated balance sheet99 4.5 Consolidated statement of changes in equity100 4.6 Consolidated cash flow statement101 4.7 Notes to the consolidated financial statements102 4.8 Statutory statements1365 05 Cash earnings financial information139 06 Other information150 6.1 Disclosure regarding forward-looking statements150 6.2 References to websites151 6.3 Credit ratings151 6.4 Dividend reinvestment plan1516 6.5 Information on related entities151 6.6 Financial calendar and Share Registry details152 6.7 Exchange rates156 07 Glossary157 7 |
 | Results Announcement to the market In this Interim Financial Results Announcement (Results Announcement) references to ‘Westpac’, ‘WBC’, ‘Westpac Group’, ‘the Group’, ‘we’, ‘us’ and ‘our’ are to Westpac Banking Corporation and its controlled entities, unless it clearly means just Westpac Banking Corporation. All references to $ in this Results Announcement are to Australian dollars unless otherwise stated. Financial calendar Interim Results Announcement released4 May 2020 Ex-dividend date for interim dividend1 TBD Record date for interim dividend (Sydney)1 TBD Interim dividend payable1 TBD Final Results Announcement (scheduled) 2 November 2020 1. The Board has deferred the decision on determining an interim dividend and no dividend will be paid in June 2020. |
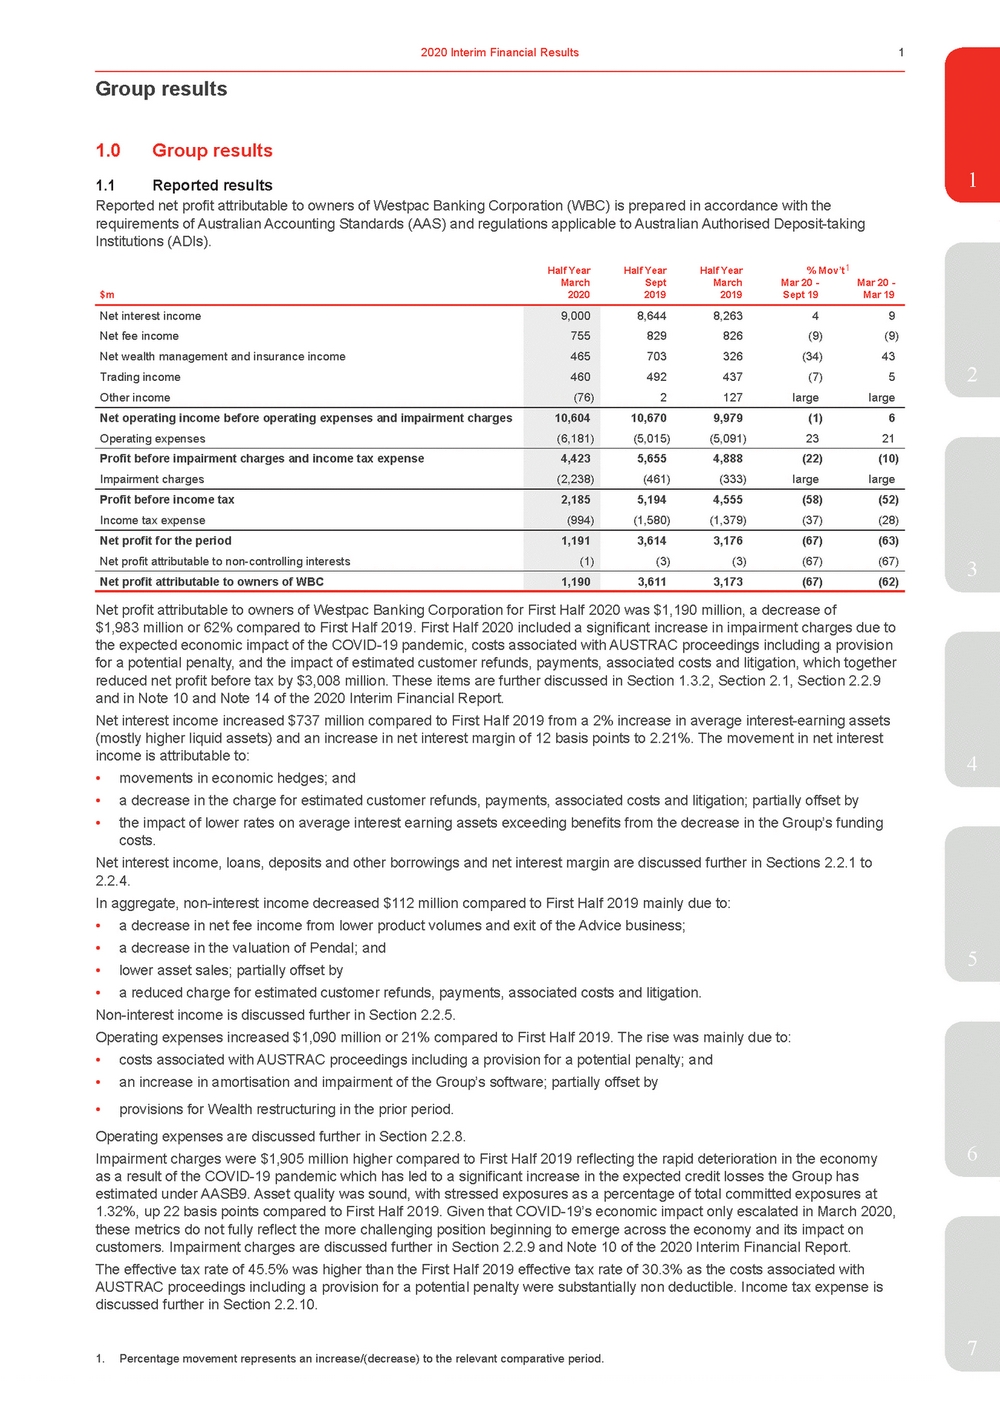 | 1.0Group results 1.1Reported results1 Reported net profit attributable to owners of Westpac Banking Corporation (WBC) is prepared in accordance with the requirements of Australian Accounting Standards (AAS) and regulations applicable to Australian Authorised Deposit-taking Institutions (ADIs). Half YearHalf YearHalf Year% Mov’t1 March $m2020 Sept 2019 March 2019 Mar 20 - Sept 19 Mar 20 - Mar 19 Net interest income Net fee income Net wealth management and insurance income Trading income Other income 9,000 755 465 460 (76) 8,6448,26349 829826(9)(9) 703326(34)43 492437(7)5 2127largelarge Net operating income before operating expenses and impairment charges Operating expenses 10,604 (6,181) 10,6709,979(1)6 (5,015)(5,091)2321 Profit before impairment charges and income tax expense Impairment charges 4,423 (2,238) 5,6554,888(22)(10) (461)(333)largelarge Profit before income tax Income tax expense 2,185 (994) 5,1944,555(58)(52) (1,580)(1,379)(37)(28) Net profit for the period Net profit attributable to non-controlling interests 1,191 (1) 3,6143,176(67)(63) (3)(3)(67)(67) Net profit attributable to owners of WBC 1,190 3,6113,173(67)(62) 3 Net profit attributable to owners of Westpac Banking Corporation for First Half 2020 was $1,190 million, a decrease of $1,983 million or 62% compared to First Half 2019. First Half 2020 included a significant increase in impairment charges due to the expected economic impact of the COVID-19 pandemic, costs associated with AUSTRAC proceedings including a provision for a potential penalty, and the impact of estimated customer refunds, payments, associated costs and litigation, which together reduced net profit before tax by $3,008 million. These items are further discussed in Section 1.3.2, Section 2.1, Section 2.2.9 and in Note 10 and Note 14 of the 2020 Interim Financial Report. Net interest income increased $737 million compared to First Half 2019 from a 2% increase in average interest-earning assets (mostly higher liquid assets) and an increase in net interest margin of 12 basis points to 2.21%. The movement in net interest income is attributable to:4 •movements in economic hedges; and •a decrease in the charge for estimated customer refunds, payments, associated costs and litigation; partially offset by •the impact of lower rates on average interest earning assets exceeding benefits from the decrease in the Group’s funding costs. Net interest income, loans, deposits and other borrowings and net interest margin are discussed further in Sections 2.2.1 to 2.2.4. In aggregate, non-interest income decreased $112 million compared to First Half 2019 mainly due to: •a decrease in net fee income from lower product volumes and exit of the Advice business; •a decrease in the valuation of Pendal; and 5 •lower asset sales; partially offset by •a reduced charge for estimated customer refunds, payments, associated costs and litigation. Non-interest income is discussed further in Section 2.2.5. Operating expenses increased $1,090 million or 21% compared to First Half 2019. The rise was mainly due to: •costs associated with AUSTRAC proceedings including a provision for a potential penalty; and •an increase in amortisation and impairment of the Group’s software; partially offset by •provisions for Wealth restructuring in the prior period. Operating expenses are discussed further in Section 2.2.8. Impairment charges were $1,905 million higher compared to First Half 2019 reflecting the rapid deterioration in the economy6 as a result of the COVID-19 pandemic which has led to a significant increase in the expected credit losses the Group has estimated under AASB9. Asset quality was sound, with stressed exposures as a percentage of total committed exposures at 1.32%, up 22 basis points compared to First Half 2019. Given that COVID-19’s economic impact only escalated in March 2020, these metrics do not fully reflect the more challenging position beginning to emerge across the economy and its impact on customers. Impairment charges are discussed further in Section 2.2.9 and Note 10 of the 2020 Interim Financial Report. The effective tax rate of 45.5% was higher than the First Half 2019 effective tax rate of 30.3% as the costs associated with AUSTRAC proceedings including a provision for a potential penalty were substantially non deductible. Income tax expense is discussed further in Section 2.2.10. 7 |
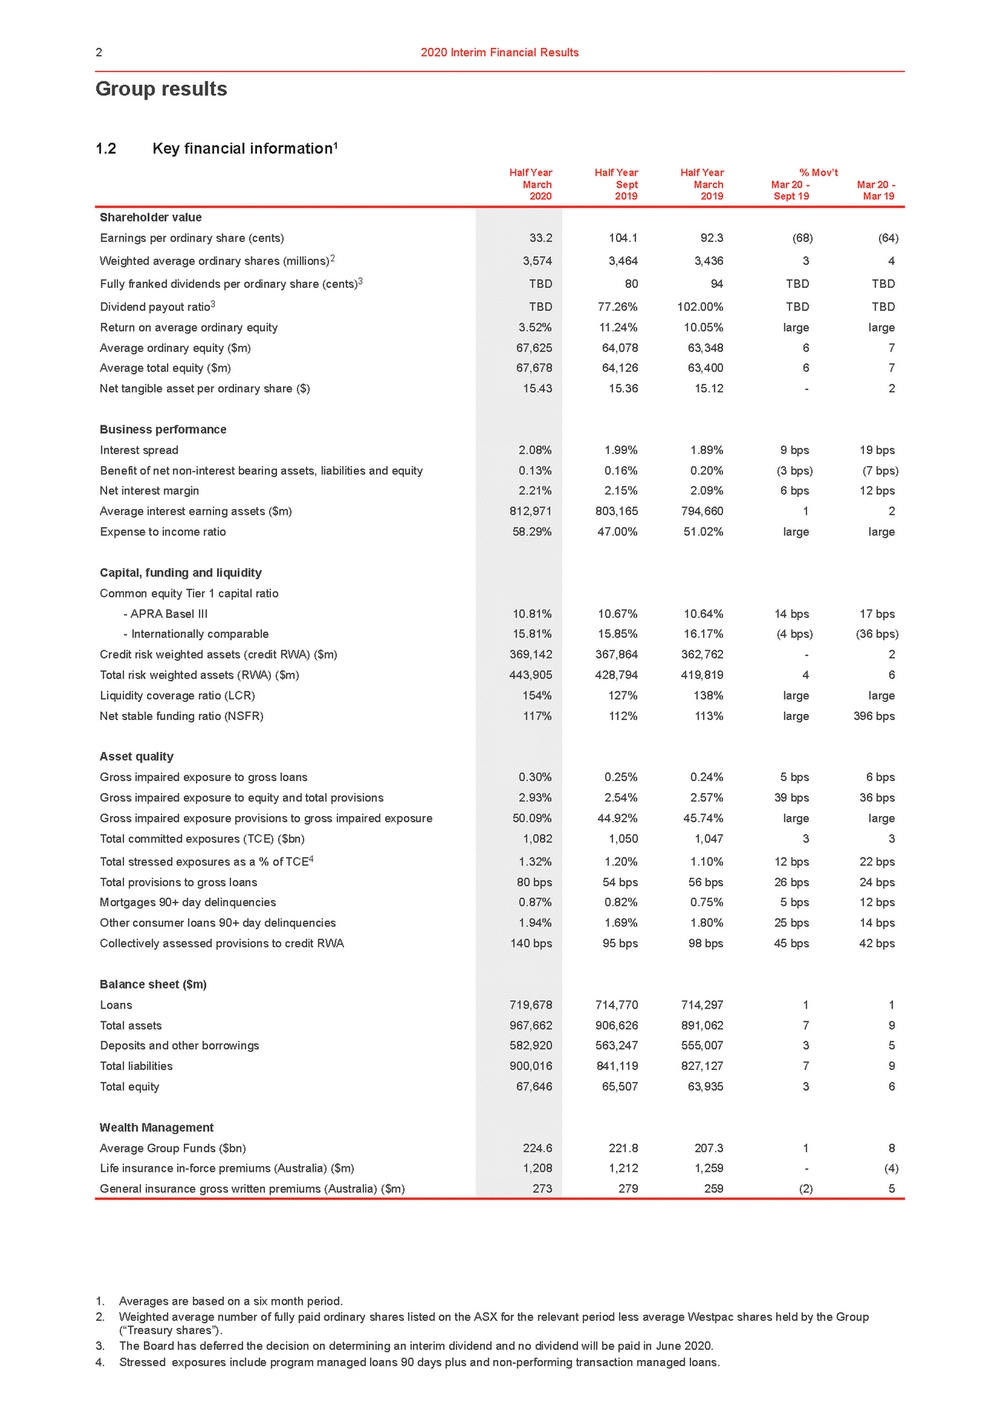 | Group results 1. Averages are based on a six month period. 2. Weighted average number of fully paid ordinary shares listed on the ASX for the relevant period less average Westpac shares held by the Group (“Treasury shares”). 3. The Board has deferred the decision on determining an interim dividend and no dividend will be paid in June 2020. 4. Stressed exposures include program managed loans 90 days plus and non-performing transaction managed loans. |
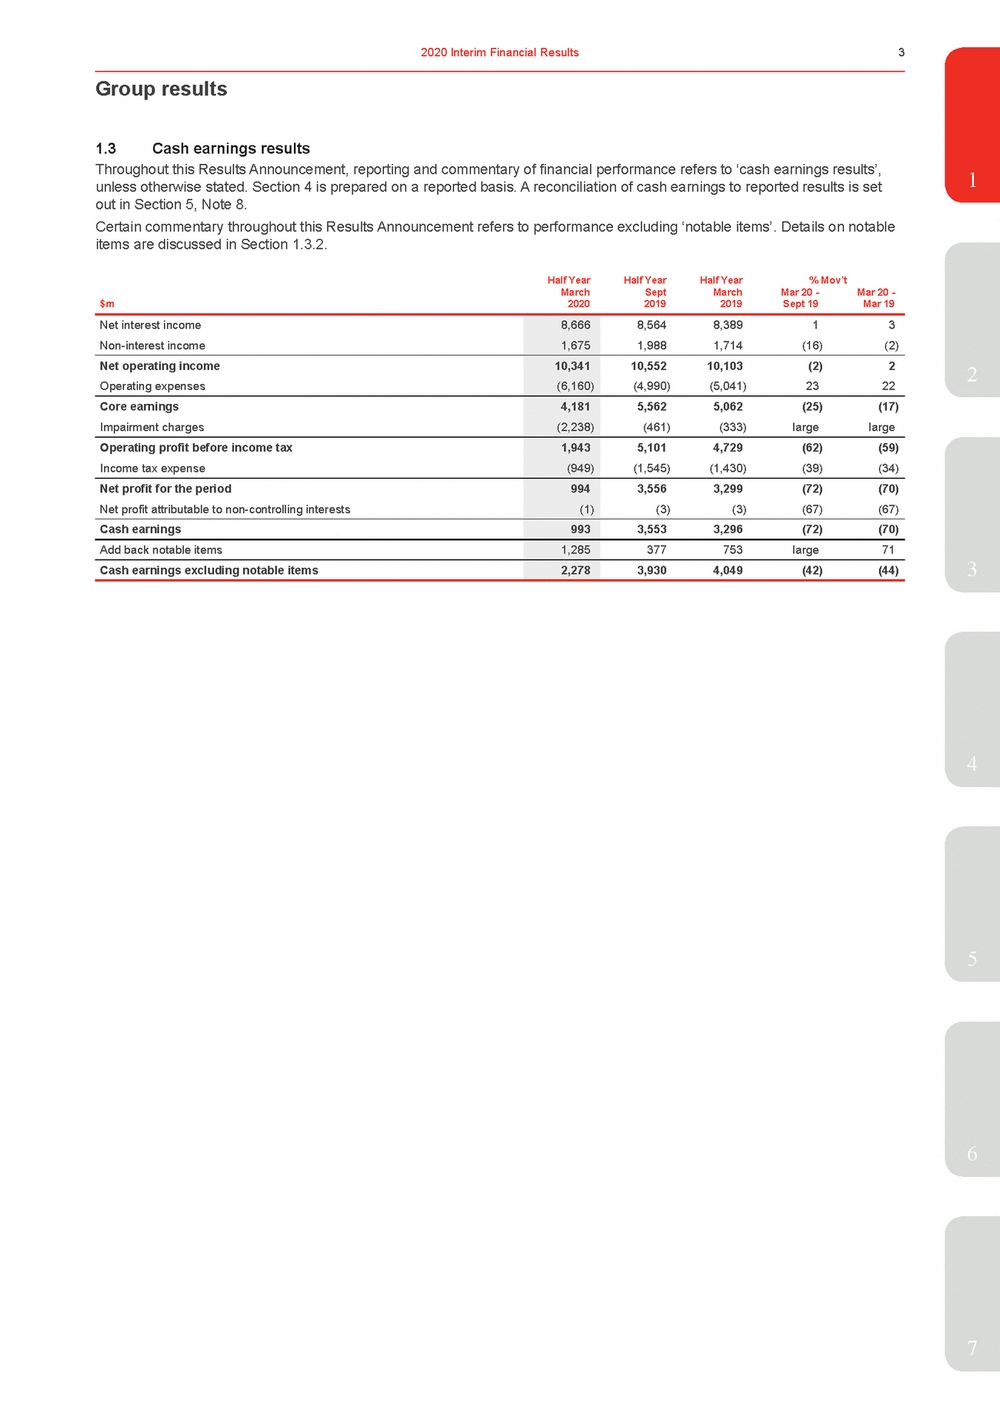 | 1.3 Cash earnings results 1 Certain commentary throughout this Results Announcement refers to performance excluding ‘notable items’. Details on notable items are discussed in Section 1.3.2. Half YearHalf YearHalf Year% Mov’t March $m2020 Sept 2019 March 2019 Mar 20 - Sept 19 Mar 20 - Mar 19 Net interest income Non-interest income 8,666 1,675 8,5648,38913 1,9881,714(16)(2) Net operating income Operating expenses 10,341 (6,160) 10,55210,103(2)2 (4,990)(5,041)2322 Core earnings Impairment charges 4,181 (2,238) 5,5625,062(25)(17) (461)(333)largelarge Operating profit before income tax Income tax expense 1,943 (949) 5,1014,729(62)(59) (1,545)(1,430)(39)(34) Net profit for the period Net profit attributable to non-controlling interests 994 (1) 3,5563,299(72)(70) (3)(3)(67)(67) Cash earnings 993 3,5533,296(72)(70) Add back notable items 1,285 377753large71 Cash earnings excluding notable items 2,278 3,9304,049(42)(44) 3 4 5 6 7 |
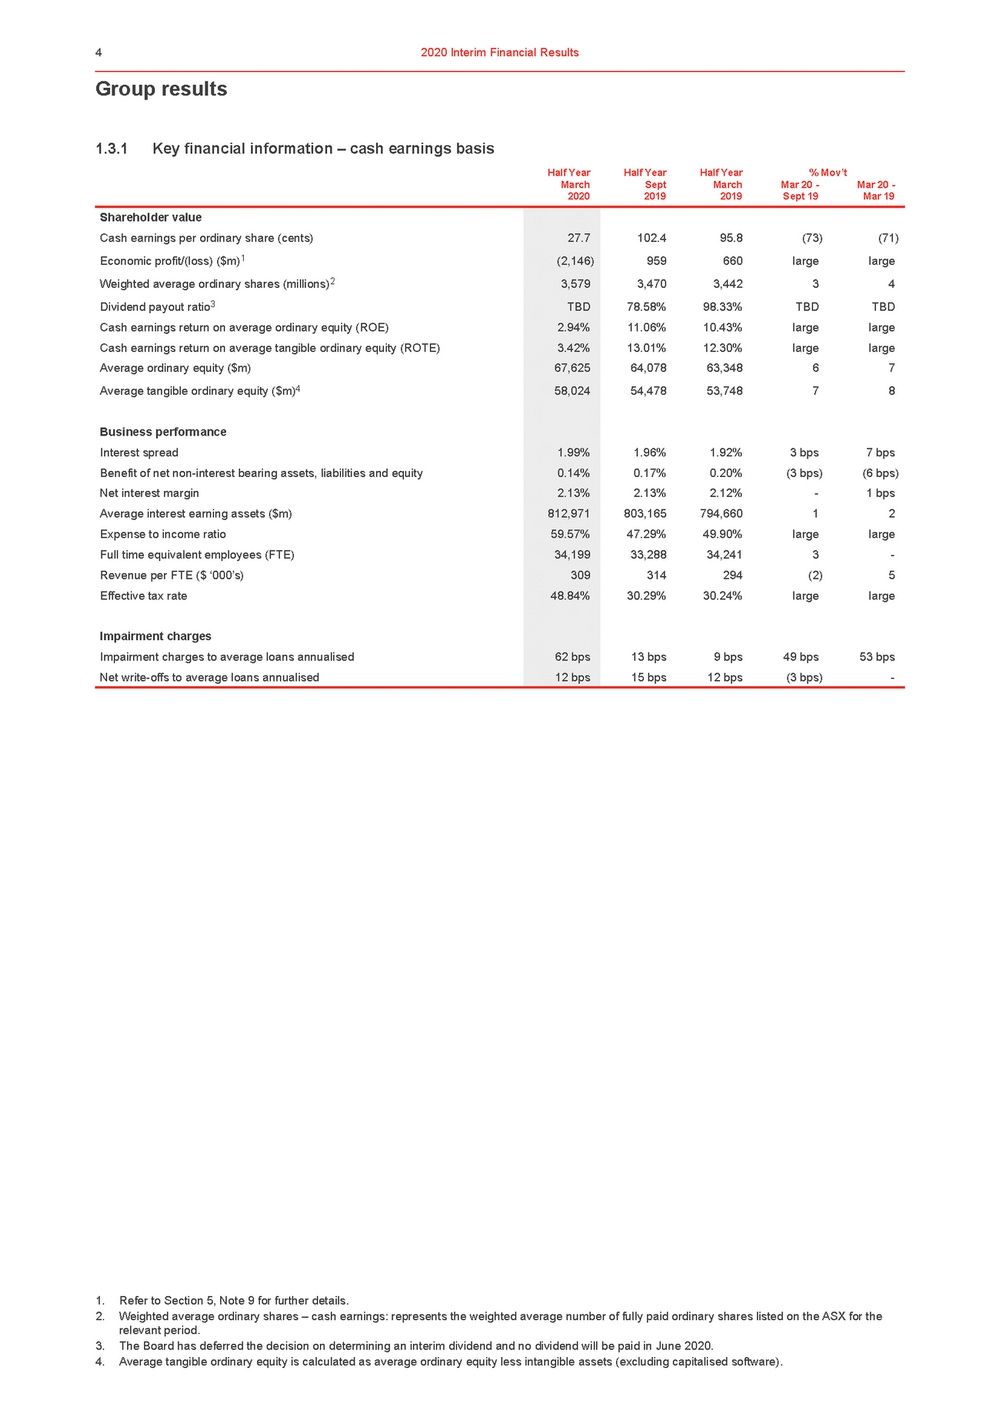 | Group results 1. Refer to Section 5, Note 9 for further details. 2. Weighted average ordinary shares – cash earnings: represents the weighted average number of fully paid ordinary shares listed on the ASX for the relevant period. 3. The Board has deferred the decision on determining an interim dividend and no dividend will be paid in June 2020. 4. Average tangible ordinary equity is calculated as average ordinary equity less intangible assets (excluding capitalised software). |
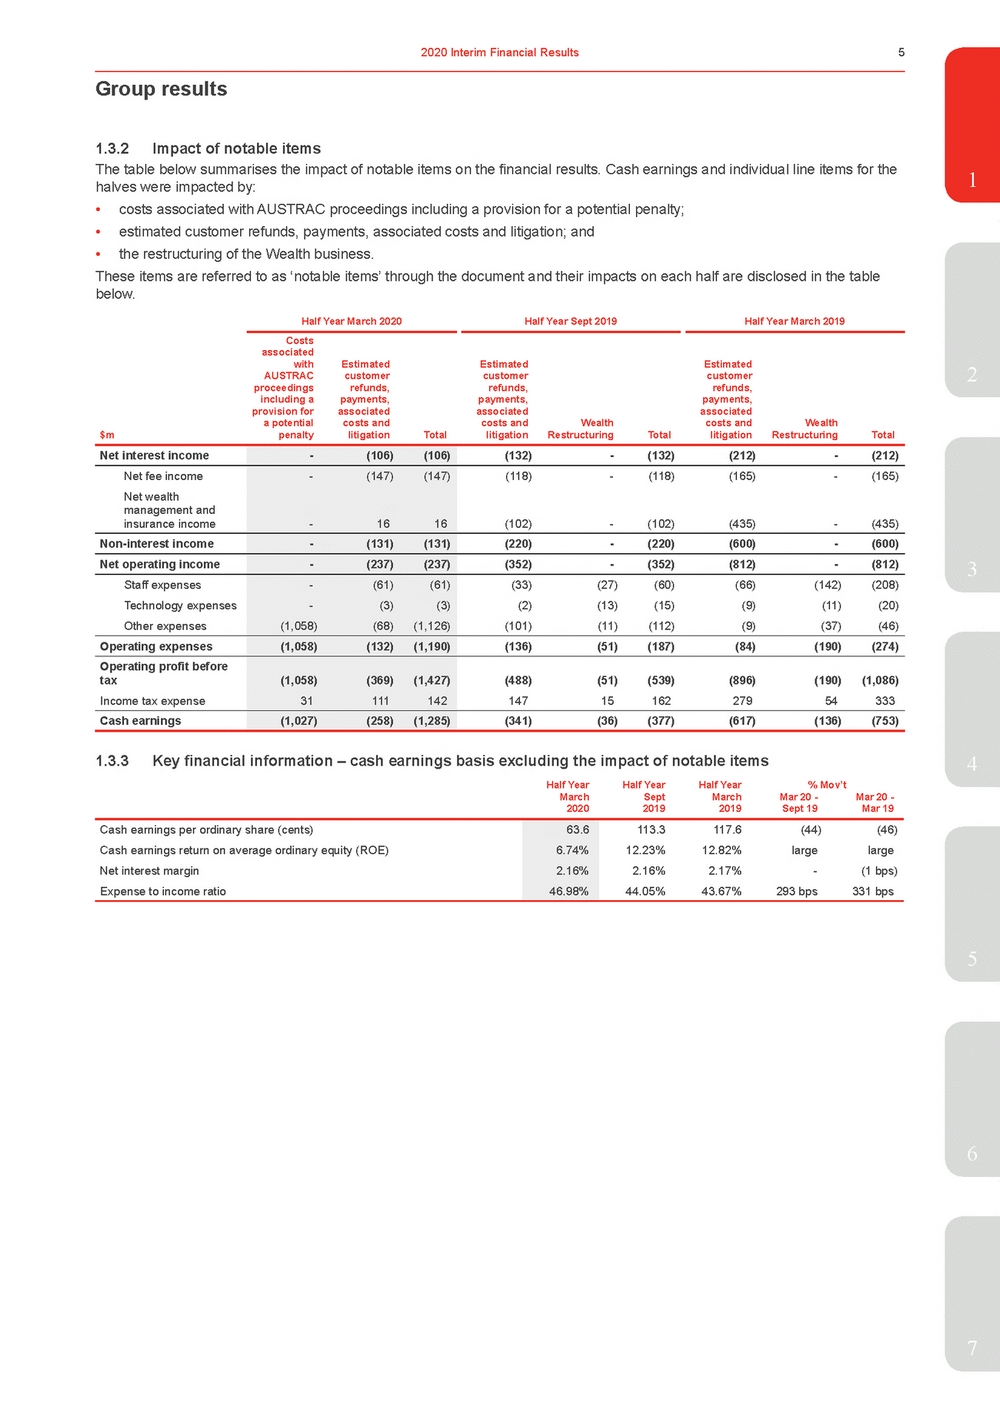 | 1 halves were impacted by: •costs associated with AUSTRAC proceedings including a provision for a potential penalty; •estimated customer refunds, payments, associated costs and litigation; and •the restructuring of the Wealth business. These items are referred to as ‘notable items’ through the document and their impacts on each half are disclosed in the table below. Half Year March 2020Half Year Sept 2019Half Year March 2019 Costs associated with Estimated Estimated Estimated AUSTRAC customer customer customer proceedings refunds, refunds, refunds, including a payments, payments, payments, provision for associated associated associated a potential costs and costs and Wealth costs and Wealth penalty litigation Total litigation Restructuring Total litigation Restructuring Total $m Net interest income -(106)(106) (132)-(132)(212)-(212) Net fee income Net wealth management and insurance income -(147)(147) -1616 (118)-(118)(165)-(165) (102)-(102)(435)-(435) Non-interest income -(131)(131) (220)-(220)(600)-(600) Net operating income -(237)(237) (352)-(352)(812)-(812) Staff expenses Technology expenses Other expenses -(61)(61) - (3)(3) (1,058)(68)(1,126) (33)(27) (60)(66)(142)(208) (2)(13)(15)(9) (11)(20) (101)(11)(112)(9)(37)(46) Operating expenses (1,058)(132)(1,190) (136)(51)(187)(84)(190)(274) Operating profit before tax Income tax expense (1,058)(369)(1,427) 31111142 (488)(51)(539)(896)(190)(1,086) 1471516227954333 Cash earnings (1,027)(258)(1,285) (341)(36)(377)(617)(136)(753) 1.3.3Key financial information – cash earnings basis excluding the impact of notable items4 Half YearHalf YearHalf Year% Mov’t 5 6 7 |
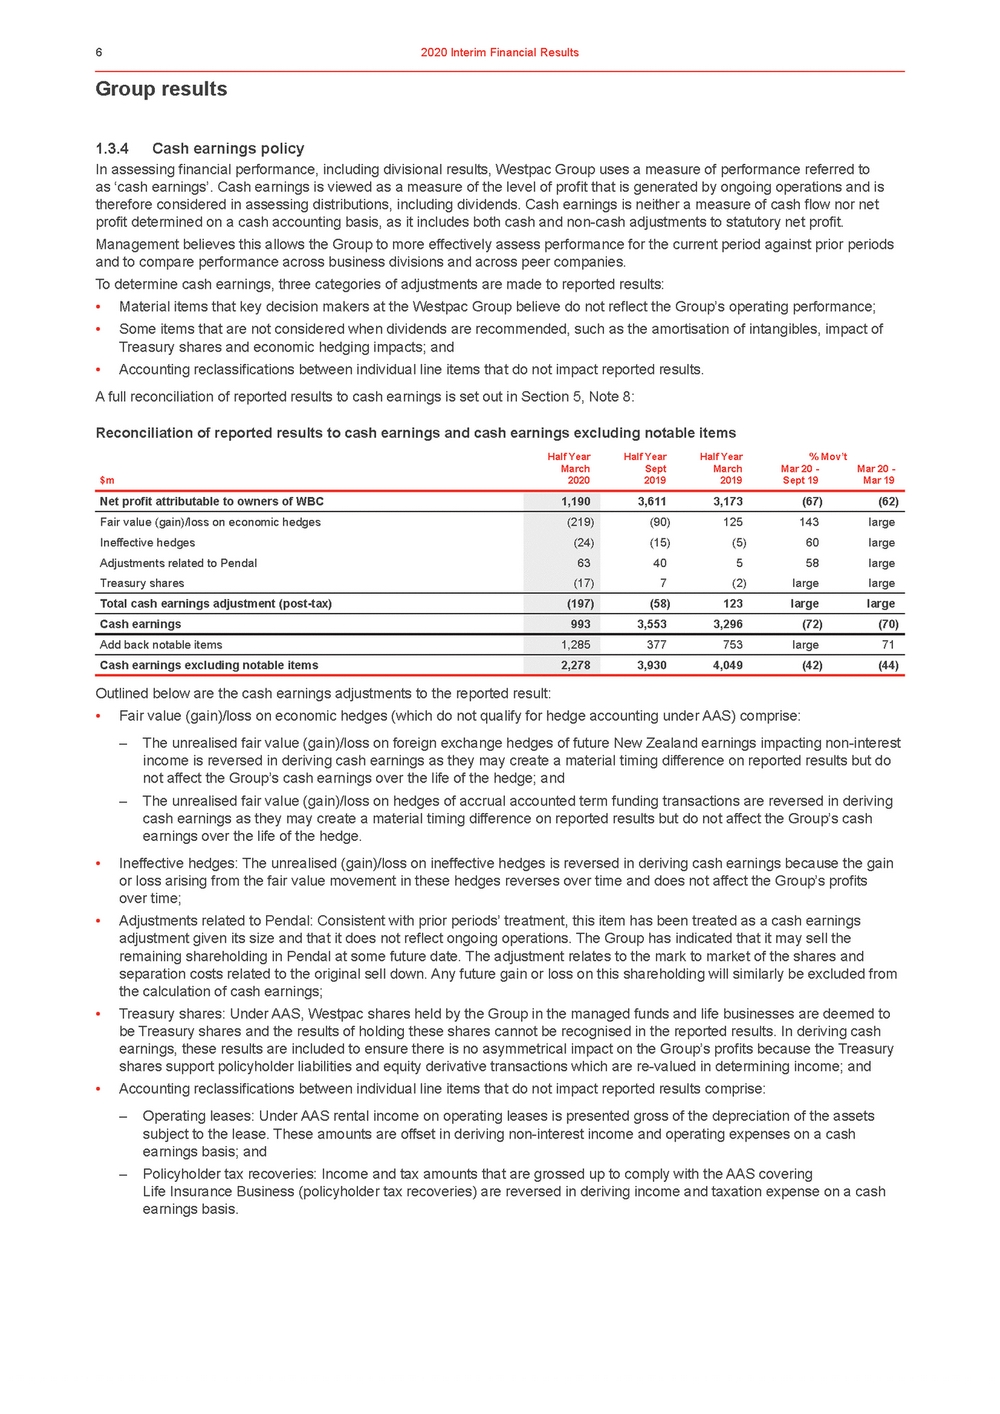 | Group results 1.3.4Cash earnings policy In assessing financial performance, including divisional results, Westpac Group uses a measure of performance referred to as ‘cash earnings’. Cash earnings is viewed as a measure of the level of profit that is generated by ongoing operations and is therefore considered in assessing distributions, including dividends. Cash earnings is neither a measure of cash flow nor net profit determined on a cash accounting basis, as it includes both cash and non-cash adjustments to statutory net profit. Management believes this allows the Group to more effectively assess performance for the current period against prior periods and to compare performance across business divisions and across peer companies. To determine cash earnings, three categories of adjustments are made to reported results: •Material items that key decision makers at the Westpac Group believe do not reflect the Group’s operating performance; •Some items that are not considered when dividends are recommended, such as the amortisation of intangibles, impact of Treasury shares and economic hedging impacts; and •Accounting reclassifications between individual line items that do not impact reported results. A full reconciliation of reported results to cash earnings is set out in Section 5, Note 8: Reconciliation of reported results to cash earnings and cash earnings excluding notable items Half YearHalf YearHalf Year% Mov’t March $m2020 Sept 2019 March 2019 Mar 20 - Sept 19 Mar 20 - Mar 19 Outlined below are the cash earnings adjustments to the reported result: •Fair value (gain)/loss on economic hedges (which do not qualify for hedge accounting under AAS) comprise: – The unrealised fair value (gain)/loss on foreign exchange hedges of future New Zealand earnings impacting non-interest income is reversed in deriving cash earnings as they may create a material timing difference on reported results but do not affect the Group’s cash earnings over the life of the hedge; and – The unrealised fair value (gain)/loss on hedges of accrual accounted term funding transactions are reversed in deriving cash earnings as they may create a material timing difference on reported results but do not affect the Group’s cash earnings over the life of the hedge. •Ineffective hedges: The unrealised (gain)/loss on ineffective hedges is reversed in deriving cash earnings because the gain or loss arising from the fair value movement in these hedges reverses over time and does not affect the Group’s profits over time; •Adjustments related to Pendal: Consistent with prior periods’ treatment, this item has been treated as a cash earnings adjustment given its size and that it does not reflect ongoing operations. The Group has indicated that it may sell the remaining shareholding in Pendal at some future date. The adjustment relates to the mark to market of the shares and separation costs related to the original sell down. Any future gain or loss on this shareholding will similarly be excluded from the calculation of cash earnings; •Treasury shares: Under AAS, Westpac shares held by the Group in the managed funds and life businesses are deemed to be Treasury shares and the results of holding these shares cannot be recognised in the reported results. In deriving cash earnings, these results are included to ensure there is no asymmetrical impact on the Group’s profits because the Treasury shares support policyholder liabilities and equity derivative transactions which are re-valued in determining income; and •Accounting reclassifications between individual line items that do not impact reported results comprise: – Operating leases: Under AAS rental income on operating leases is presented gross of the depreciation of the assets subject to the lease. These amounts are offset in deriving non-interest income and operating expenses on a cash earnings basis; and – Policyholder tax recoveries: Income and tax amounts that are grossed up to comply with the AAS covering Life Insurance Business (policyholder tax recoveries) are reversed in deriving income and taxation expense on a cash earnings basis. |
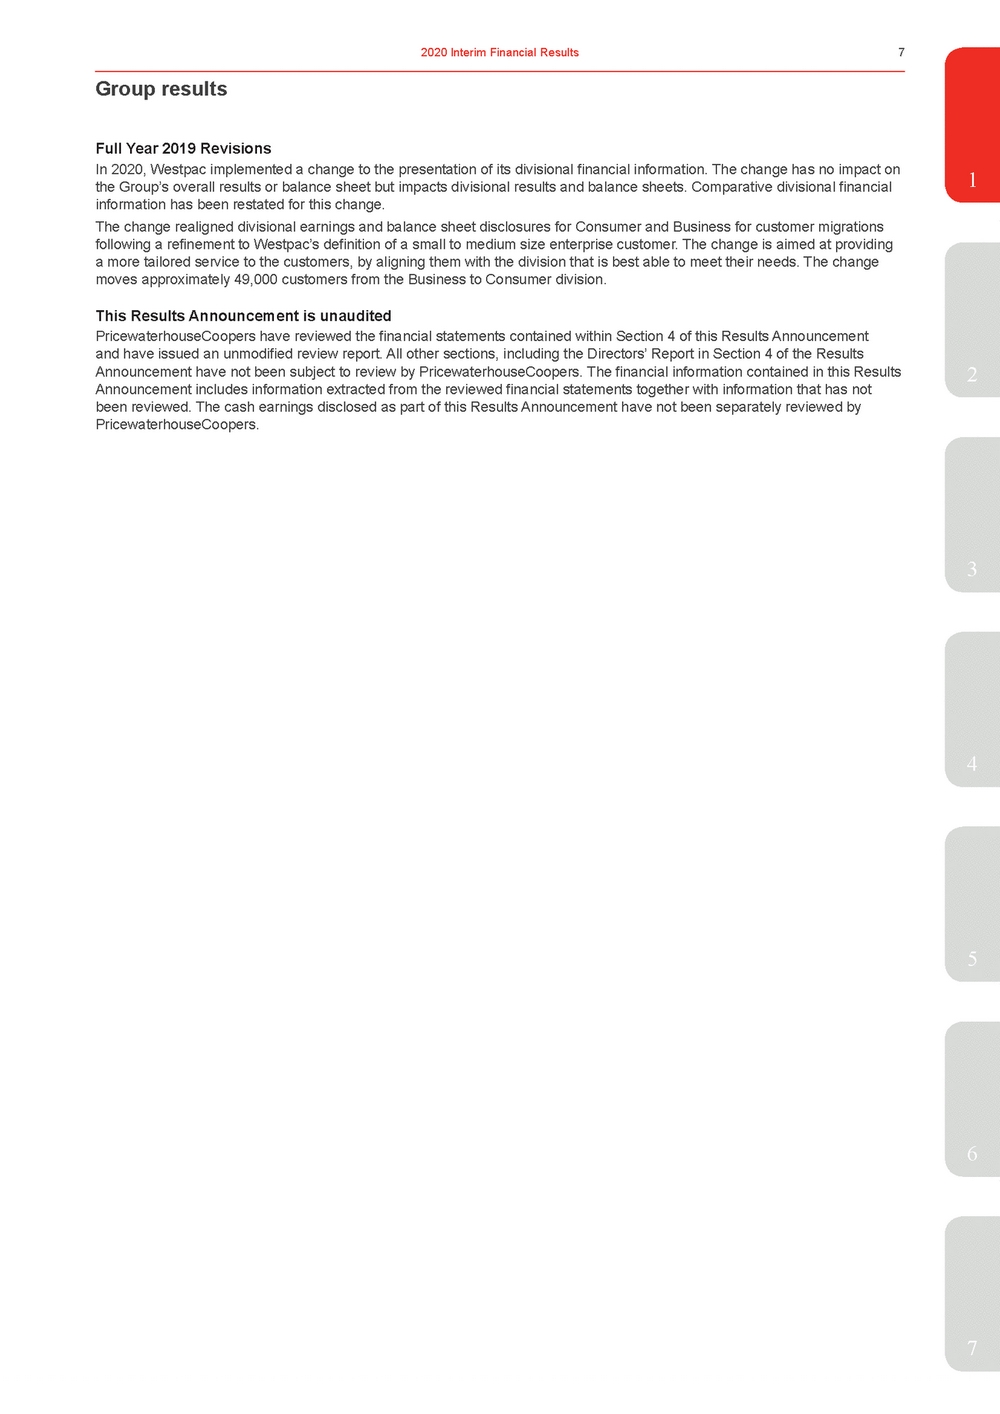 | 1 the Group’s overall results or balance sheet but impacts divisional results and balance sheets. Comparative divisional financial information has been restated for this change. The change realigned divisional earnings and balance sheet disclosures for Consumer and Business for customer migrations following a refinement to Westpac’s definition of a small to medium size enterprise customer. The change is aimed at providing a more tailored service to the customers, by aligning them with the division that is best able to meet their needs. The change moves approximately 49,000 customers from the Business to Consumer division. This Results Announcement is unaudited PricewaterhouseCoopers have reviewed the financial statements contained within Section 4 of this Results Announcement and have issued an unmodified review report. All other sections, including the Directors’ Report in Section 4 of the Results Announcement have not been subject to review by PricewaterhouseCoopers. The financial information contained in this Results2 Announcement includes information extracted from the reviewed financial statements together with information that has not been reviewed. The cash earnings disclosed as part of this Results Announcement have not been separately reviewed by PricewaterhouseCoopers. 3 4 5 6 7 |
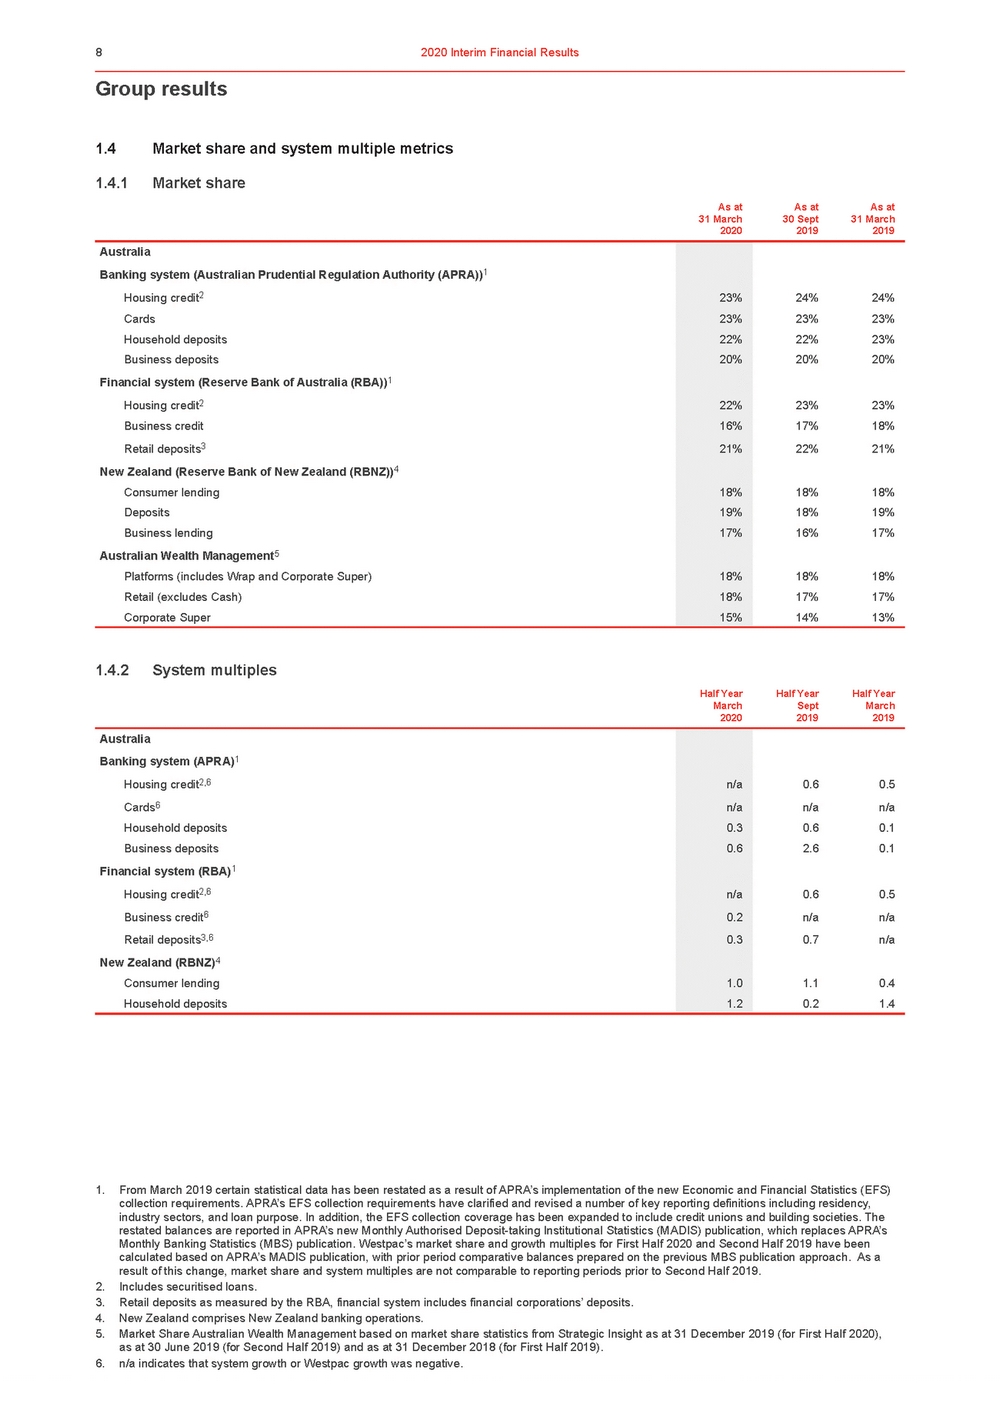 | Group results 1.4Market share and system multiple metrics 1.4.1Market share As atAs atAs at Australia Banking system (Australian Prudential Regulation Authority (APRA))1 31 March 2020 30 Sept 2019 31 March 2019 Financial system (Reserve Bank of Australia (RBA))1 Housing credit2 22% 23% 23% Business credit 16% 17% 18% Retail deposits3 21% 22% 21% New Zealand (Reserve Bank of New Zealand (RBNZ))4 1.4.2System multiples Half YearHalf YearHalf Year Australia Banking system (APRA)1 March 2020 Sept 2019 March 2019 Housing credit2,6 n/a0.60.5 Cards6 n/an/an/a Household deposits0.30.60.1 Business deposits0.62.60.1 Financial system (RBA)1 Housing credit2,6 n/a0.60.5 Business credit6 0.2n/an/a Retail deposits3,6 0.30.7n/a New Zealand (RBNZ)4 Consumer lending1.01.10.4 Household deposits1.20.21.4 1. From March 2019 certain statistical data has been restated as a result of APRA’s implementation of the new Economic and Financial Statistics (EFS) collection requirements. APRA’s EFS collection requirements have clarified and revised a number of key reporting definitions including residency, industry sectors, and loan purpose. In addition, the EFS collection coverage has been expanded to include credit unions and building societies. The restated balances are reported in APRA’s new Monthly Authorised Deposit-taking Institutional Statistics (MADIS) publication, which replaces APRA’s Monthly Banking Statistics (MBS) publication. Westpac’s market share and growth multiples for First Half 2020 and Second Half 2019 have been calculated based on APRA’s MADIS publication, with prior period comparative balances prepared on the previous MBS publication approach. As a result of this change, market share and system multiples are not comparable to reporting periods prior to Second Half 2019. 2. Includes securitised loans. 3. Retail deposits as measured by the RBA, financial system includes financial corporations’ deposits. 4. New Zealand comprises New Zealand banking operations. 5. Market Share Australian Wealth Management based on market share statistics from Strategic Insight as at 31 December 2019 (for First Half 2020), as at 30 June 2019 (for Second Half 2019) and as at 31 December 2018 (for First Half 2019). 6. n/a indicates that system growth or Westpac growth was negative. |
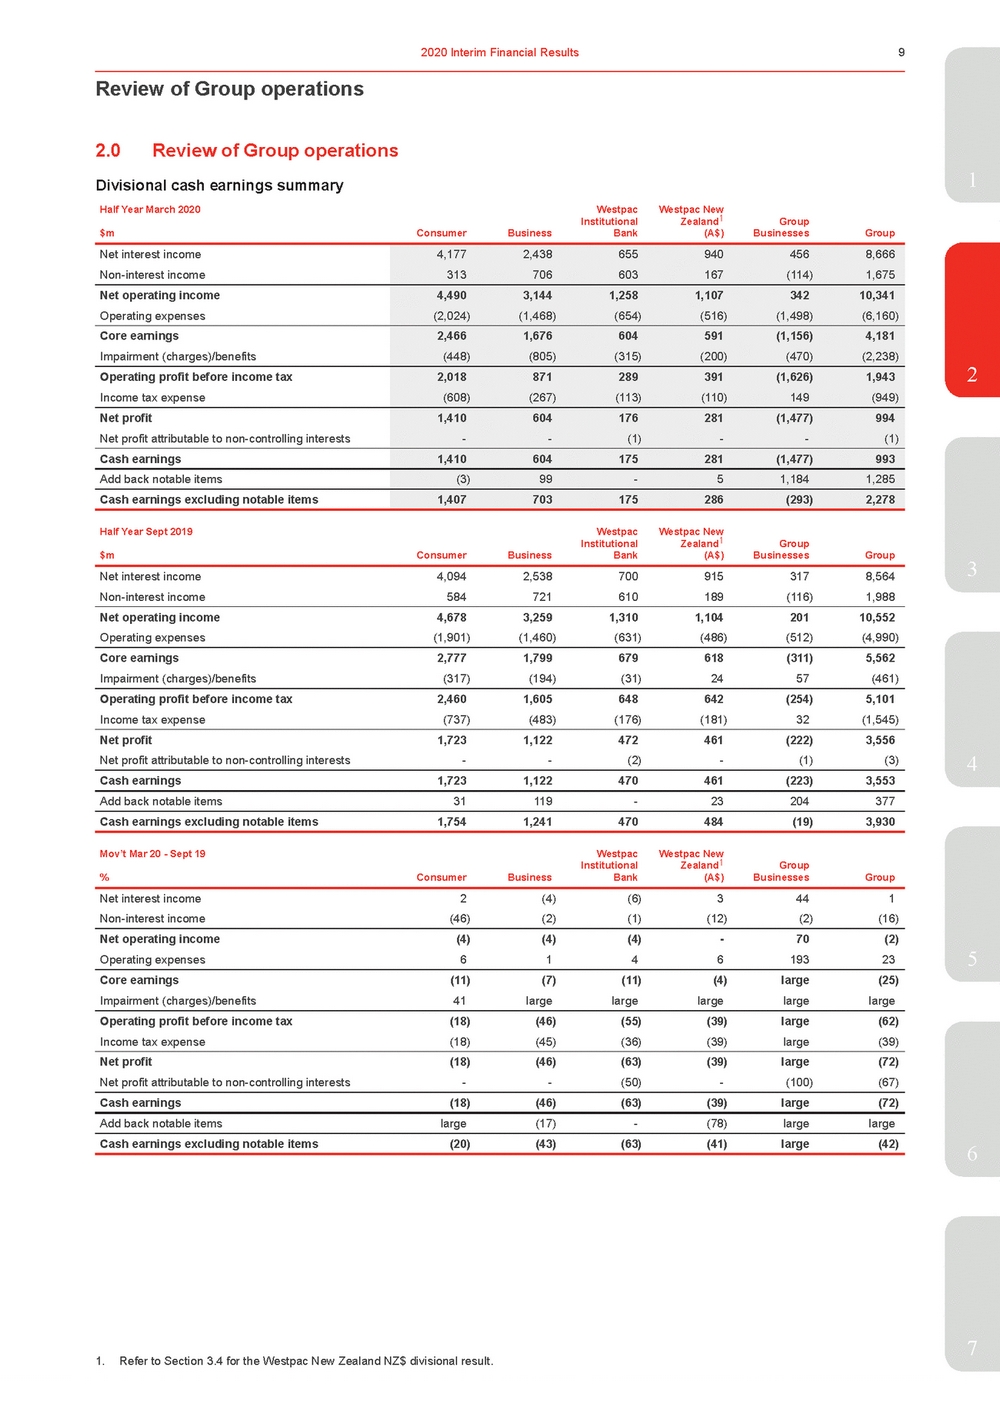 | 2.0Review of Group operations Divisional cash earnings summary1 Half Year March 2020 $m ConsumerBusiness Westpac Institutional Bank Westpac New Zealand1 (A$) Group BusinessesGroup Net interest income Non-interest income 4,1772,438 313706 655940 603167 4568,666 (114)1,675 Net operating income Operating expenses 4,4903,144 (2,024)(1,468) 1,2581,107 (654)(516) 34210,341 (1,498)(6,160) Core earnings Impairment (charges)/benefits 2,4661,676 (448)(805) 604591 (315)(200) (1,156)4,181 (470)(2,238) Operating profit before income tax Income tax expense 2,018871 (608)(267) 289391 (113)(110) (1,626)1,943 149(949) Net profit Net profit attributable to non-controlling interests 1,410604 --176281 (1)-(1,477)994 -(1) Cash earnings 1,410604 175281 (1,477)993 Add back notable items (3)99 -5 1,1841,285 Cash earnings excluding notable items 1,407703 175286 (293)2,278 Half Year Sept 2019 $m ConsumerBusiness Westpac Institutional Bank Westpac New Zealand1 (A$) Group BusinessesGroup Net interest income4,0942,5387009153178,5643 Non-interest income584721610189(116)1,988 Net operating income4,6783,2591,3101,10420110,552 Operating expenses(1,901)(1,460)(631)(486)(512)(4,990) Core earnings2,7771,799679618(311)5,562 Impairment (charges)/benefits(317)(194)(31)2457(461) Operating profit before income tax2,4601,605648642(254)5,101 Income tax expense(737)(483)(176)(181)32(1,545) Net profit1,7231,122472461(222)3,556 Net profit attributable to non-controlling interests--(2)-(1)(3)4 Cash earnings1,7231,122470461(223)3,553 Add back notable items31119-23204377 Cash earnings excluding notable items1,7541,241470484(19)3,930 Mov’t Mar 20 - Sept 19 % ConsumerBusiness Westpac Institutional Bank Westpac New Zealand1 (A$) Group BusinessesGroup Net interest income2(4)(6)3441 Non-interest income(46)(2)(1)(12)(2)(16) Net operating income(4)(4)(4)-70(2) Operating expenses6146193235 Core earnings (11)(7) (11)(4)large(25) Impairment (charges)/benefits 41largelargelarge largelarge Operating profit before income tax (18) (46) (55) (39)large(62) Income tax expense (18) (45) (36) (39) large(39) Net profit (18) (46) (63) (39)large(72) Net profit attributable to non-controlling interests-- (50) - (100)(67) Cash earnings (18) (46) (63) (39)large(72) Add back notable itemslarge (17)-(78) largelarge Cash earnings excluding notable items (20) (43) (63) (41)large(42) 7 1. Refer to Section 3.4 for the Westpac New Zealand NZ$ divisional result. |
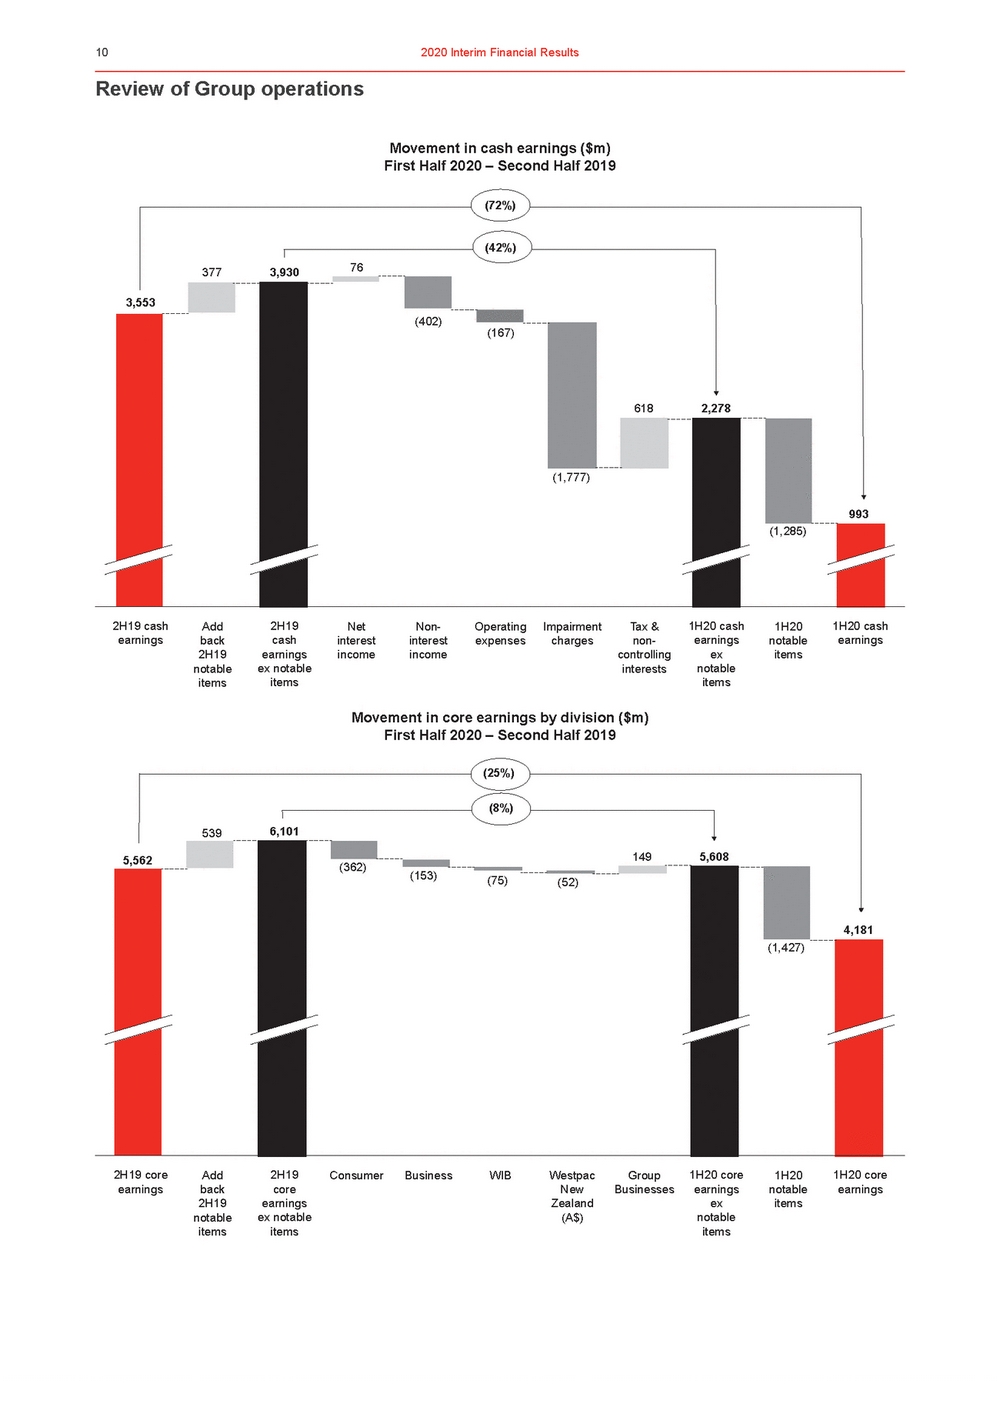 | Review of Group operations Movement in cash earnings ($m) First Half 2020 – Second Half 2019 (72%) 3773,93076 (42%) 3,553 (402) (167) 6182,278 (1,777) (1,285) 993 Movement in core earnings by division ($m) First Half 2020 – Second Half 2019 (25%) 5,562 5396,101 (362) (8%) (153)(75)(52) 1495,608 (1,427) 4,181 |
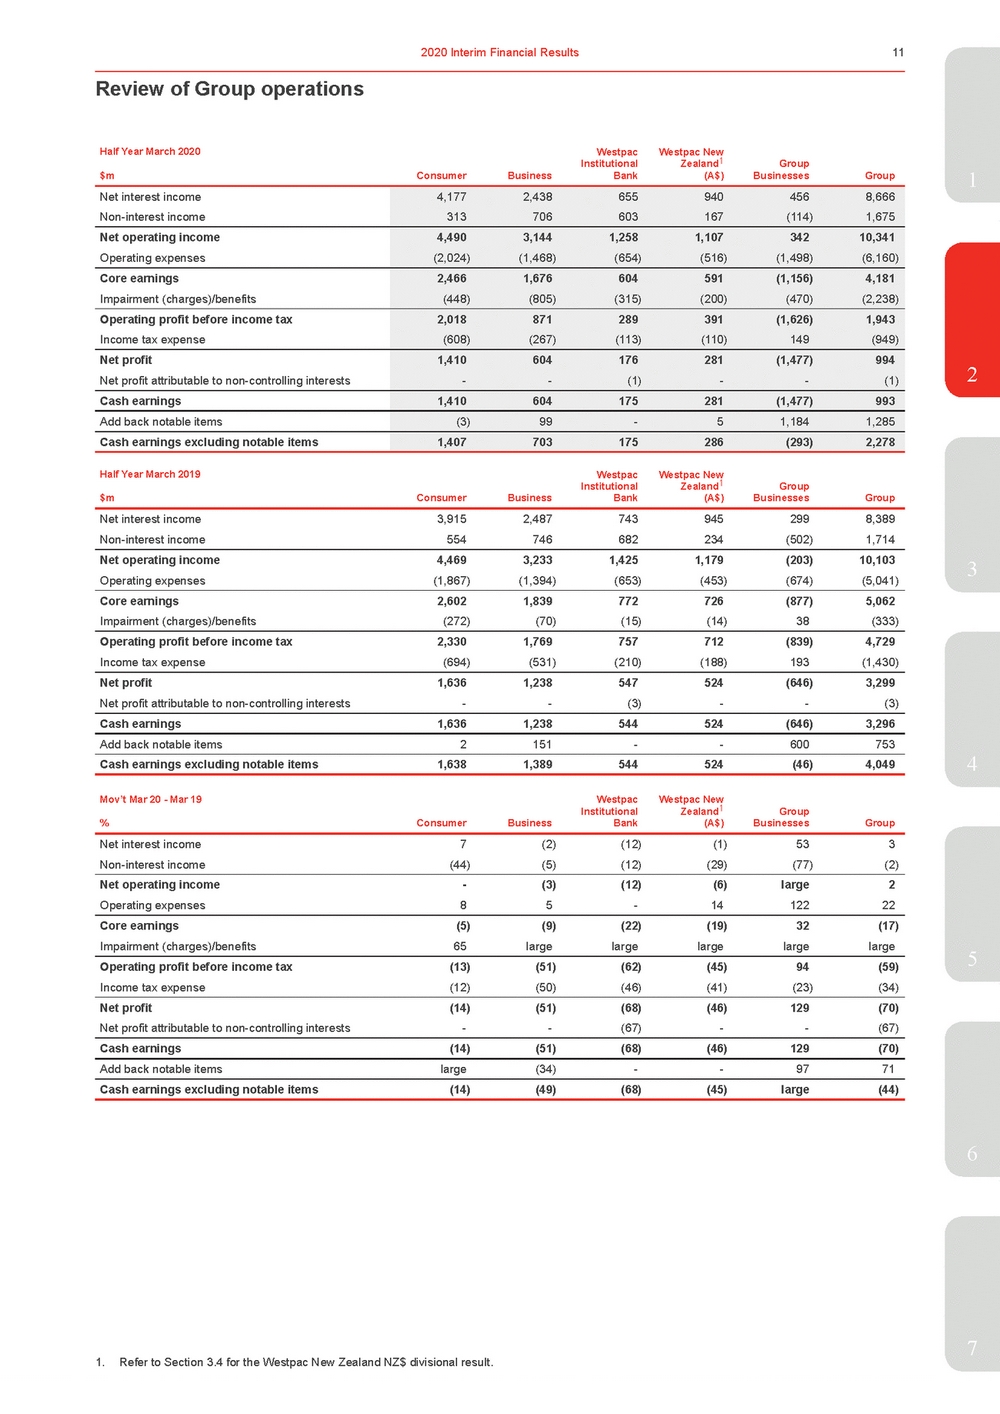 | Net interest income Non-interest income 4,1772,438 313706 655940 603167 4568,666 (114)1,675 Net operating income Operating expenses 4,4903,144 (2,024)(1,468) 1,2581,107 (654)(516) 34210,341 (1,498)(6,160) Core earnings Impairment (charges)/benefits 2,4661,676 (448)(805) 604591 (315)(200) (1,156)4,181 (470)(2,238) Operating profit before income tax Income tax expense 2,018871 (608)(267) 289391 (113)(110) (1,626)1,943 149(949) Net profit Net profit attributable to non-controlling interests 1,410604 --176281 (1)-(1,477)994 -(1) Cash earnings 1,410604 175281 (1,477)993 Add back notable items (3)99 -5 1,1841,285 Cash earnings excluding notable items 1,407703 175286 (293)2,278 Half Year March 2020 Westpac Westpac New $m Consumer Business Institutional Bank Zealand1 (A$) Group Businesses Group 2 Half Year March 2019 Westpac Institutional Westpac New Zealand1 Group $m Consumer Business Bank (A$) Businesses Group Net interest income 3,915 2,487 743 945 299 8,389 Non-interest income 554 746 682 234 (502) 1,714 Net operating income 4,469 3,233 1,425 1,179 (203) 10,103 Operating expenses (1,867) (1,394) (653) (453) (674) (5,041) Core earnings 2,602 1,839 772 726 (877) 5,062 Impairment (charges)/benefits (272) (70) (15) (14) 38 (333) Operating profit before income tax 2,330 1,769 757 712 (839) 4,729 Income tax expense (694) (531) (210) (188) 193 (1,430) Net profit 1,636 1,238 547 524 (646) 3,299 Net profit attributable to non-controlling interests - - (3) - - (3) Cash earnings 1,636 1,238 544 524 (646) 3,296 Add back notable items 2 151 - - 600 753 Cash earnings excluding notable items 1,638 1,389 544 524 (46) 4,049 Mov’t Mar 20 - Mar 19 Westpac Institutional Westpac New Zealand1 Group % Consumer Business Bank (A$) Businesses Group Net interest income 7 (2) (12) (1) 53 3 Non-interest income (44) (5) (12) (29) (77) (2) Net operating income - (3) (12) (6) large 2 Operating expenses 8 5 - 14 122 22 Core earnings (5) (9) (22) (19) 32 (17) Impairment (charges)/benefits 65 large large large large large Operating profit before income tax (13) (51) (62) (45) 94 (59) Income tax expense (12) (50) (46) (41) (23) (34) Net profit (14) (51) (68) (46) 129 (70) Net profit attributable to non-controlling interests - - (67) - - (67) Cash earnings (14) (51) (68) (46) 129 (70) Add back notable items large (34) - - 97 71 Cash earnings excluding notable items (14) (49) (68) (45) large (44) 4 5 6 7 1. Refer to Section 3.4 for the Westpac New Zealand NZ$ divisional result. |
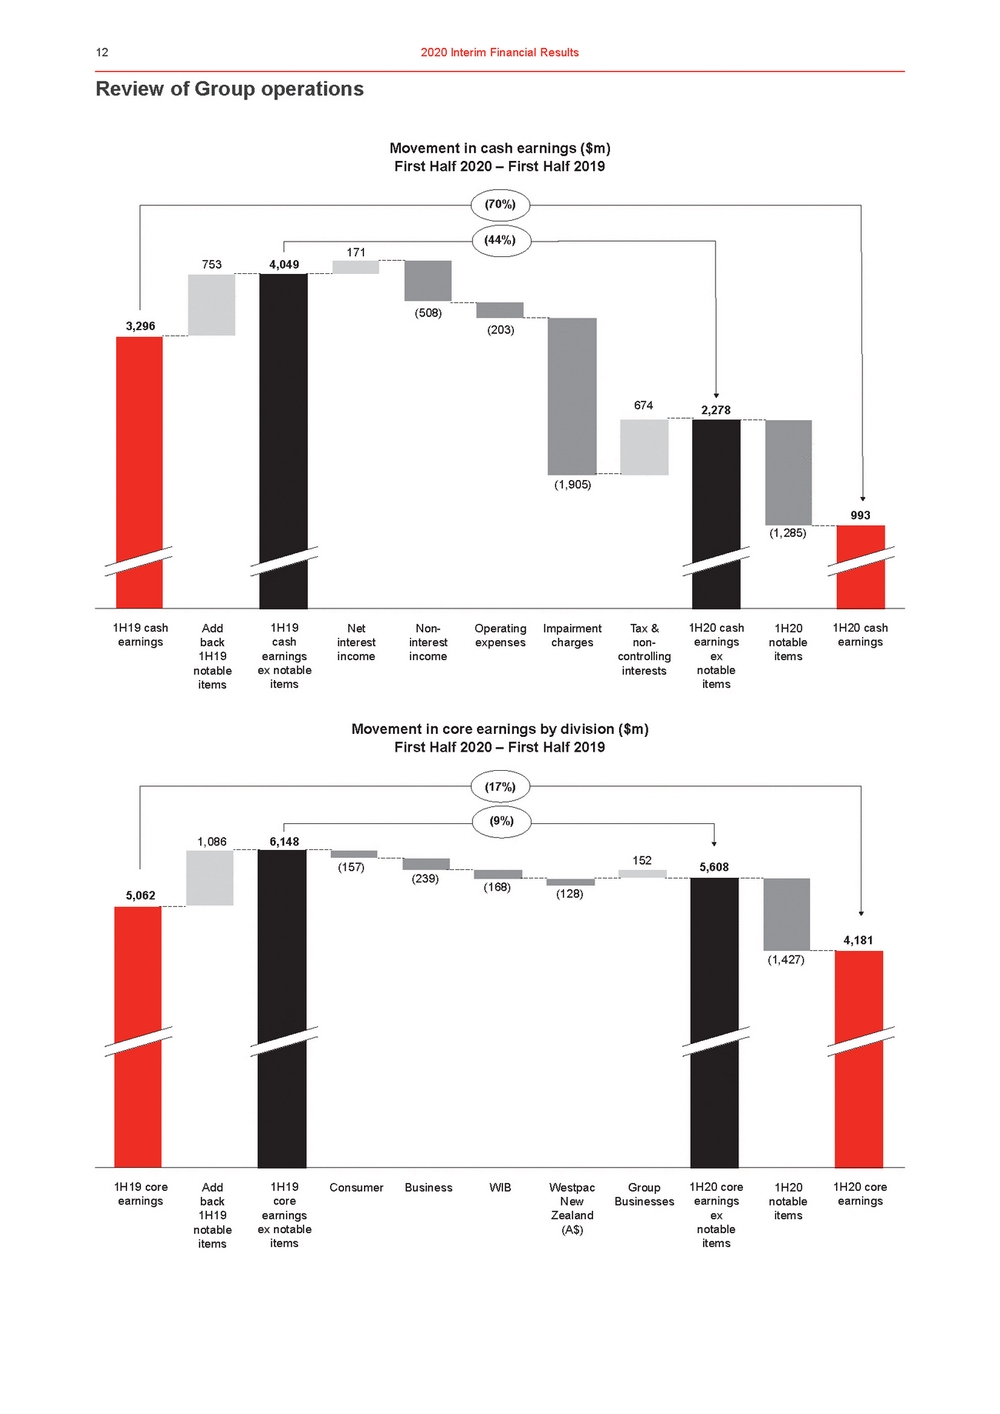 | Review of Group operations Movement in cash earnings ($m) First Half 2020 – First Half 2019 (70%) 7534,049 171 (44%) 3,296 (508) (203) 6742,278 (1,905) (1,285) 993 Movement in core earnings by division ($m) First Half 2020 – First Half 2019 (17%) 5,062 1,0866,148 (157) (239) (9%) (168)(128) 1525,608 (1,427) 4,181 |
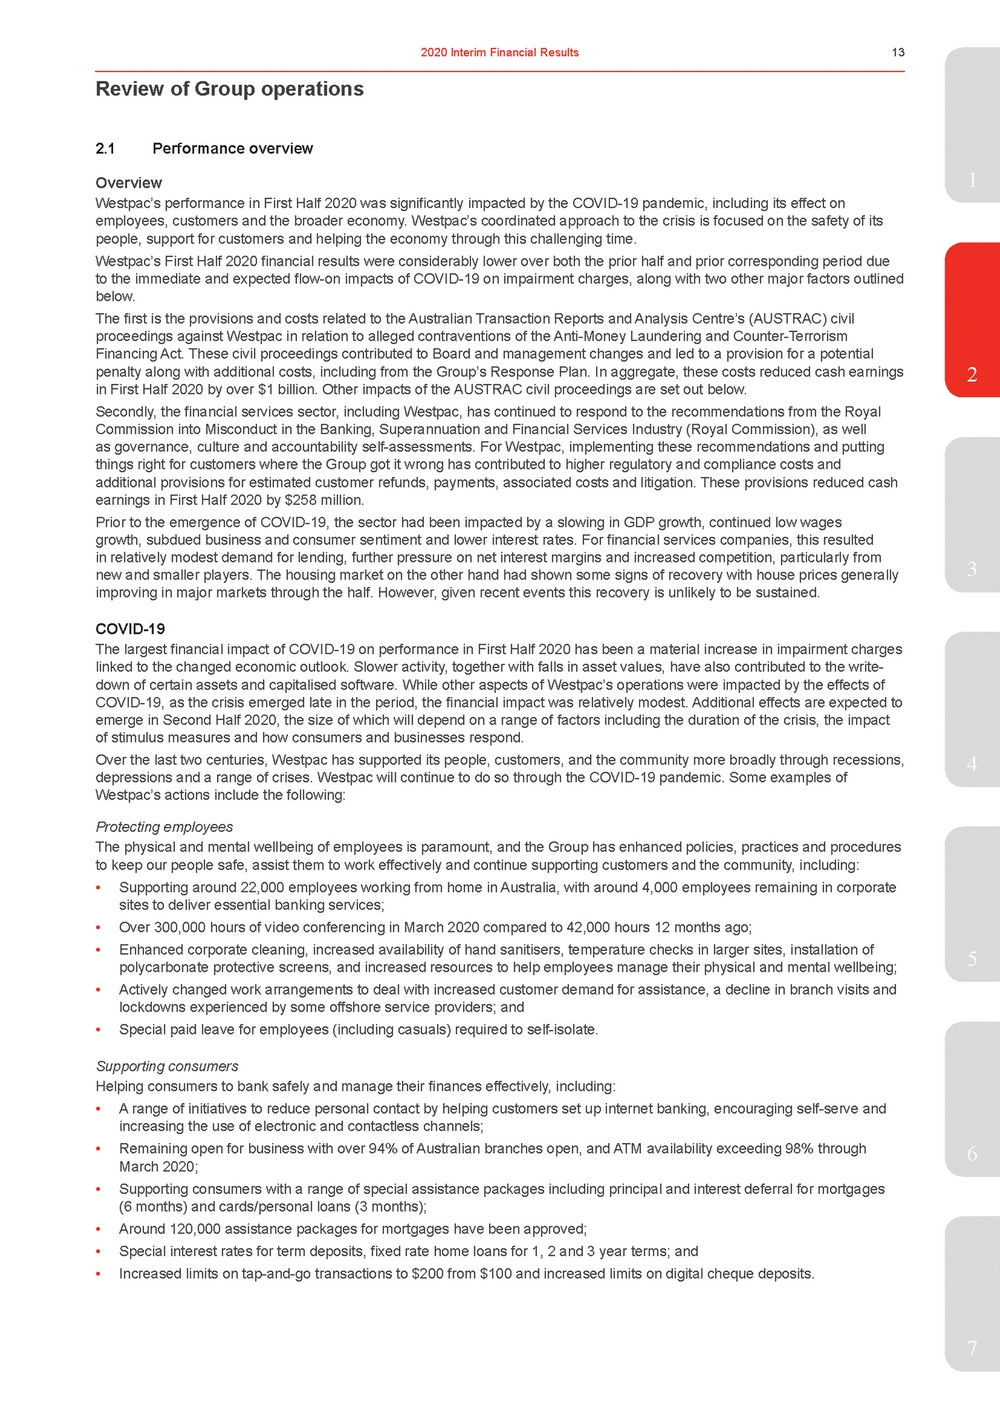 | 2.1Performance overview Overview1 Westpac’s performance in First Half 2020 was significantly impacted by the COVID-19 pandemic, including its effect on employees, customers and the broader economy. Westpac’s coordinated approach to the crisis is focused on the safety of its people, support for customers and helping the economy through this challenging time. Westpac’s First Half 2020 financial results were considerably lower over both the prior half and prior corresponding period due to the immediate and expected flow-on impacts of COVID-19 on impairment charges, along with two other major factors outlined below. The first is the provisions and costs related to the Australian Transaction Reports and Analysis Centre’s (AUSTRAC) civil proceedings against Westpac in relation to alleged contraventions of the Anti-Money Laundering and Counter-Terrorism Financing Act. These civil proceedings contributed to Board and management changes and led to a provision for a potential penalty along with additional costs, including from the Group’s Response Plan. In aggregate, these costs reduced cash earnings2 in First Half 2020 by over $1 billion. Other impacts of the AUSTRAC civil proceedings are set out below. Secondly, the financial services sector, including Westpac, has continued to respond to the recommendations from the Royal Commission into Misconduct in the Banking, Superannuation and Financial Services Industry (Royal Commission), as well as governance, culture and accountability self-assessments. For Westpac, implementing these recommendations and putting things right for customers where the Group got it wrong has contributed to higher regulatory and compliance costs and additional provisions for estimated customer refunds, payments, associated costs and litigation. These provisions reduced cash earnings in First Half 2020 by $258 million. Prior to the emergence of COVID-19, the sector had been impacted by a slowing in GDP growth, continued low wages growth, subdued business and consumer sentiment and lower interest rates. For financial services companies, this resulted in relatively modest demand for lending, further pressure on net interest margins and increased competition, particularly from new and smaller players. The housing market on the other hand had shown some signs of recovery with house prices generally3 improving in major markets through the half. However, given recent events this recovery is unlikely to be sustained. COVID-19 The largest financial impact of COVID-19 on performance in First Half 2020 has been a material increase in impairment charges linked to the changed economic outlook. Slower activity, together with falls in asset values, have also contributed to the write-down of certain assets and capitalised software. While other aspects of Westpac’s operations were impacted by the effects of COVID-19, as the crisis emerged late in the period, the financial impact was relatively modest. Additional effects are expected to emerge in Second Half 2020, the size of which will depend on a range of factors including the duration of the crisis, the impact of stimulus measures and how consumers and businesses respond. Over the last two centuries, Westpac has supported its people, customers, and the community more broadly through recessions,4 depressions and a range of crises. Westpac will continue to do so through the COVID-19 pandemic. Some examples of Westpac’s actions include the following: Protecting employees The physical and mental wellbeing of employees is paramount, and the Group has enhanced policies, practices and procedures to keep our people safe, assist them to work effectively and continue supporting customers and the community, including: •Supporting around 22,000 employees working from home in Australia, with around 4,000 employees remaining in corporate sites to deliver essential banking services; •Over 300,000 hours of video conferencing in March 2020 compared to 42,000 hours 12 months ago; 5 •Actively changed work arrangements to deal with increased customer demand for assistance, a decline in branch visits and lockdowns experienced by some offshore service providers; and •Special paid leave for employees (including casuals) required to self-isolate. Supporting consumers Helping consumers to bank safely and manage their finances effectively, including: •A range of initiatives to reduce personal contact by helping customers set up internet banking, encouraging self-serve and increasing the use of electronic and contactless channels; •Remaining open for business with over 94% of Australian branches open, and ATM availability exceeding 98% through6 March 2020; •Supporting consumers with a range of special assistance packages including principal and interest deferral for mortgages (6 months) and cards/personal loans (3 months); •Around 120,000 assistance packages for mortgages have been approved; •Special interest rates for term deposits, fixed rate home loans for 1, 2 and 3 year terms; and •Increased limits on tap-and-go transactions to $200 from $100 and increased limits on digital cheque deposits. 7 |
 | Review of Group operations Supporting businesses Helping businesses manage their finances through these challenging times, including: •Payment deferral options for businesses with certain loans of up to $10 million; •Seconding certain of the Group’s business specialists into contact centres to support businesses manage their cash flow; •Approved over 31,000 assistance packages; •Providing unsecured loans of up to $0.25 million for 3 years for businesses with turnover <$50 million (50% guaranteed by the Federal Government); •Providing temporary funding to businesses waiting for JobKeeper payments; •Working closely with large corporates and institutions to support liquidity needs with WIB supporting a $5 billion increase in lending late in First Half 2020; and •Special interest rates and fees: 200 basis point discount on overdrafts, 100 basis point discount on cash-based loans, fees waived on merchant terminal rentals for up to 3 months, no establishment fee for equipment finance loans. Supporting the economy and community As one of Australia’s and New Zealand’s major banks, Westpac plays a critical role in supporting the economy and the communities in which it operates, including: •Materially improving system stability and resilience, with a 48% reduction in high severity incidents while keeping our systems and data safe from external hacks; •Supporting State governments with debt purchases and data insights on the impacts of the COVID-19 on consumers and businesses; •Updating the Group’s employee matching gifts program to support certain COVID-19 related causes; •With their major sponsor impacted by the effects of COVID-19, St.George Bank stepped in to help fund Little Wings which provides a free service to help rural families travel to the Sydney Children’s Hospital to receive vital medical treatment; •Working constructively with government and the industry to develop effective support mechanisms for customers. Through First Half 2020, Westpac responded to the severe bushfires that impacted much of eastern Australia by setting up practical, on-the-ground support for customers, our people and for those caring for affected communities. Some of the initiatives included: allocating $3.8 million for emergency cash grants for consumers and businesses, making mortgage payments for one year for those losing their principal residence and providing low interest rates on loans to help businesses rebuild. Additional community support included funds for financial counselling along with donations to the Salvation Army’s Disaster Appeal, state bushfire appeals and to various volunteer services. For our people, Westpac provided uncapped paid leave to emergency services volunteers in bushfire affected areas along with grants of $5,000 to employees needing emergency relief. CEO priorities Following his appointment as CEO, Peter King announced some changes to the Group’s priorities which reflect Westpac’s immediate regulatory and compliance needs, responding to the more challenging operating environment and actions to improve Westpac’s performance focus. These priorities also reaffirm the Group’s customer focus and its service orientation. The four priorities are: 1. Customer Franchise – in the short term, support customers through the COVID-19 crisis. Longer term, grow the customer base and deepen relationships through superior service; 2. Performance Discipline – simplify the portfolio and drive improved execution across the Group’s banking businesses; 3. Digital Transformation – build a common and upgraded technology platform, and migrate more activity to digital; and 4. Risk Management – build a stronger risk culture driven from the first line. Implement recommendations of the Group’s Culture, Governance and Accountability (CGA) self-assessment and the Royal Commission and respond to AUSTRAC matters, including implementing the response plan. Financial performance summary With this backdrop, cash earnings for First Half 2020 were $993 million, down $2,560 million or 72% on Second Half 2019 and $2,303 million lower (or 70%) than First Half 2019. The result was significantly affected by higher impairment charges along with AUSTRAC related costs and other notable items. The notable items help to explain Westpac’s performance and include estimated customer refunds, payments, associated costs and litigation and are explained later in this overview with more information in Sections 1.3.2 and Section 4.7, Note 14. The cash earnings impact of notable items was $1,285 million in First Half 2020 (compared to $377 million in Second Half 2019 and $753 million in First Half 2019). Excluding notable items, cash earnings were $2,278 million, down $1,652 million or 42% over Second Half 2019 and down 44% compared to First Half 2019 with most of that decline due to the significant increase in impairment charges. Earnings excluding notable items are summarised later in this overview. |
 | margins. Balance sheet growth was relatively modest for most of First Half 2020 although a flight to quality and higher demand for liquidity saw loans and customer deposits end First Half 2020 up 1% and 4% respectively.1 The decline in non-interest income in First Half 2020 of 16% was mostly due to higher insurance claims from severe storms and bushfires while wealth income was also lower. Expenses were higher, up 23% over the prior half, with most of the increase due to AUSTRAC related costs. Excluding this and other notable items, expenses were 3% higher reflecting increased risk and compliance costs, some asset write-downs and higher software amortisation. Asset quality metrics were sound over First Half 2020 with impaired exposures to gross loans of 30 basis points at 31 March 2020 compared to 25 basis points at 30 September 2019. Stressed exposures to total committed exposures ended the half at 1.32% compared to 1.20% at 30 September 2019. Given the effects of COVID-19 only began to escalate in March, these metrics do not reflect the more difficult position beginning to emerge across the economy and its impact on customers. While there was a small rise in stressed exposures at March 2020, a significant change in the economic and industry outlook related to the COVID-19 pandemic has led to impairment charges of $2,238 million in First Half 2020, up $1,777 million over the2 prior half and up $1,905 million over the prior corresponding period. Assessing the likely impact of the COVID-19 outbreak was the main contributor to the increased impairment charges in First Half 2020. The increase in impairment charges lifted impairment provisions and provision coverage ratios with the ratio of collectively assessed provisions to credit risk weighted assets of 1.40% at 31 March 2020 up from 0.95% at 30 September 2019. The lower cash earnings, combined with capital raised in the half, translated to a decline in return and per share metrics. The cash earnings return on equity was 2.9% in First Half 2020 down from 11.1% in Second Half 2019. Cash earnings per ordinary share were 27.7 cents in First Half 2020, down around 73% over both the prior half and prior corresponding period. Excluding notable items, cash earnings per share were 63.6 cents. Cash earnings were lower across all divisions with a decline in core earnings and higher impairment charges across the Group. Reviewing movements on the prior corresponding period, in First Half 2020 cash earnings were 70% lower than First Half 2019.3 Excluding notable items, First Half 2020 cash earnings were 44% lower than First Half 2019. Most of this decline was from the increase in impairment charges and higher notable items. On capital, Westpac completed an institutional share placement and a retail share purchase plan in the half, raising $2.8 billion. These lifted capital levels and contributed to a 3.5% increase in shares on issue. As a result, the Group reported a common equity tier 1 (CET1) capital ratio of 10.8% at 31 March 2020 compared to 10.7% at 30 September 2019 and 10.6% at 31 March 2019. The higher capital ratio was achieved while absorbing higher risk weighted assets (RWA) from an additional $500 million operational risk capital overlay from APRA associated with the AUSTRAC matter, and payment of the final 2019 dividend. Interest rate risk in the banking book RWA was also higher, including from a $500 million capital overlay that will apply until a new IRRBB model is finalised and approved. Net tangible assets per share were $15.43 at 31 March 2020 compared to $15.36 at 30 September 2019.4 The Group’s funding and liquidity was strong over the half with liquidity ratios remaining comfortably above regulatory minimums. Higher customer deposit growth relative to loan growth lifted the deposit to loan ratio to over 75% while the liquidity coverage ratio (LCR) and the net stable funding ratio (NSFR) ended the half at 154% and 117% respectively. Dividends The Board has deferred the decision on determining an interim dividend and no dividend will be paid in June 2020. This was a difficult decision given many retail shareholders rely on our dividends. Westpac remains well provisioned and capitalised. Nevertheless, the Board recognises the uncertain economic and operating conditions and how these may develop over the next six months. The Board also accepted APRA’s consistent guidance on dividends and being prudent at this point in time. Westpac has kept APRA informed about its stress testing scenarios and capital position. WBC has not received any concerns from APRA on the bank’s capital position. The Board will continue to review5 dividend options over the course of this year. Westpac will continue to assess opportunities to improve capital utilisation across the Group. The strategic review of Specialist Businesses will also consider ways to further optimise capital. Refer to Significant Developments in the Directors’ Report (Section 4.1) for information on Specialist Businesses. Bank Levy Despite the lower earnings, the Government’s Bank Levy cost $196 million in First Half 2020, similar to the $198 million in Second Half 2019. The Bank Levy in First Half 2020 was equal to 20% of cash earnings and is equivalent to 4 cents per share and is included in net interest income where it reduced net interest margin by 5 basis points. In aggregate, taxes paid along with the Bank Levy give Westpac an adjusted effective tax rate of 50.8%.6 7 |
 | Review of Group operations AUSTRAC Civil Proceedings On 20 November 2019, AUSTRAC launched civil proceedings against Westpac in the Federal Court of Australia, lodging a Statement of Claim with the Court. Westpac had previously disclosed that it had self-reported to AUSTRAC a failure to report a large number of international funds transfer instructions (IFTIs) and that AUSTRAC was also investigating a number of other areas relating to Westpac’s processes, procedures and monitoring. Commencement of the civil proceedings has significantly impacted Westpac and has contributed to: •The stepping down of the CEO, Brian Hartzer, and the appointment of Peter King as CEO; •The Chairman Lindsay Maxsted bringing forward his retirement and the subsequent appointment of John McFarlane as Westpac Chairman (from April 2020); •Cancellation of the annual short-term incentives for the CEO and the Group Executives for Full Year 2020. •The commencement of a detailed response plan to immediately lift the Group’s financial crime standards and protect people from online child exploitation; •A provision for a potential penalty of $900 million (not tax deductible) relating to AUSTRAC’s civil proceedings along with additional costs associated with the response plan (earnings impact of $127 million after tax); •Additional investigations by the corporate regulator (ASIC) and the prudential regulator (APRA), along with APRA imposing an additional operational risk capital overlay equal to $500 million; and •The launch of shareholder class actions in Australia and in the United States. Since the civil proceedings were launched, Westpac has been in discussions and mediation with AUSTRAC seeking to agree a Statement of Agreed Facts and Admissions along with a proposed penalty that could be put to the Court on a joint basis with AUSTRAC. At the case management hearing on 30 March 2020, the Court ordered that the parties file a Statement of Agreed Facts and Admissions with the Court by 8 May 2020, and that Westpac file a Defence in relation to the remaining matters by 15 May 2020. Westpac considered the available information and has made a provision of $900 million for a potential penalty in relation to AUSTRAC’s 20 November 2019 Statement of Claim. The provision has been taken in circumstances where there remains considerable uncertainty on the approach the Court might take in assessing the appropriate penalty and where there remains a prospect that Westpac and AUSTRAC could agree a penalty which could be recommended to the Court on a joint basis (which the Court would have regard to but not be obliged to accept). The Court’s decision on the appropriate penalty will likely involve balancing many different competing and complex factors and the exercise of discretion. Accordingly, the actual penalty paid by Westpac may be materially higher or lower than the current provision. Further details on this provision can be found in Section 4.7, Note 14. On 24 November 2019 Westpac announced a detailed response plan to the AUSTRAC proceedings. This response plan included three elements and progress over the half included: Response plan elementsProgress Immediate fixes•Reported outstanding IFTIs to AUSTRAC. •Closed relevant Australasian Cash Management and LitePay products. Lifting our standards•Established a new Board Financial Crime Committee. •Appointed Promontory to provide assurance over Westpac’s assessment of management accountability in relation to the issues raised in the AUSTRAC proceedings and the adequacy of Westpac’s Financial Crime Program. •Established an independent Advisory Panel to review Board risk governance and Board accountability in relation to the issues raised in the AUSTRAC proceedings. •Updated transaction monitoring rules and implemented enhanced oversight of the processes. Protecting people•Investing to reduce human impact of financial crime, including partnerships with International Justice Mission and Save the Children. •Established the Safer Children, Safer Communities Roundtable to guide investments for a program of work to support the prevention of online child exploitation. Further details on the AUSTRAC matter can be found in Significant Developments and Risk Factors in the Directors’ Report (Section 4.1) and in Section 4.7, Note 14. |
 | 1 In First Half 2020, and following the AUSTRAC Statement of Claim, APRA requested that Westpac reassess its CGA remediation plan to determine whether it is ‘fit for purpose’. The reassessment is underway and due to be completed by 30 June 2020. In parallel with the reassessment, Westpac is continuing to implement recommendations from its various programs of work, including: •Royal Commission: Of the 49 Royal Commission recommendations relevant to Westpac, 13 are implemented, 22 are being implemented, and 14 are awaiting further regulatory clarity; and •CGA self-assessment: Implementing the CGA remediation plan, with 67% of recommendations implemented for design2 effectiveness as at 31 March 2020. Customer remediation Through its ‘get it right, put it right’ initiatives, products, processes and policies have continued to be reviewed to identify where the Group may not have got it right for customers. Where problems have been identified, the Group has committed to fix them and refund customers. These initiatives identified a number of issues that have required remediation. The Group booked an after-tax cost of $258 million for provisions for estimated customer refunds and payments, associated costs and litigation in First Half 2020. The cost of major items in First Half 2020 related to: •Provisions for estimated refunds to certain business customers who were provided with business loans where they should3 have been provided with loans covered by the National Consumer Credit Protection Act and the National Credit Code; •Provisions for estimated compensation to customers on the Group’s platforms who were not advised of certain corporate actions. As these customers may have missed out on value associated with these actions a compensating payment is being made; and •Provisions for estimated refunds to some BT customers where certain wealth fees were inadequately disclosed. Management of the Group’s key customer remediation programs have been centralised in the Group’s remediation hub and over 600,000 customers have now received over $350 million in refunds. Financial performance First Half 2020 – Second Half 20191 Cash earnings of $993 million, were down $2,560 million or 72% over Second Half 2019. The decline in cash earnings was4 principally due to higher impairment charges and higher charges for notable items. To help explain Westpac’s performance, certain major items in this result are described as ‘notable items’. These include: •Provisions for estimated customer refunds and payments, associated costs, and litigation; •Restructuring costs associated with the reset of Westpac’s wealth strategy in 2019; •A provision for a potential penalty relating to AUSTRAC’s civil proceedings; and •Costs associated with Westpac’s AUSTRAC response plan. Throughout this Results Announcement, the term ‘notable items’ refers only to these items. Notable items are also discussed further in Section 1.3.2 and Section 4.7, Note 14. Notable items impact cash earnings, the major income statement line items and certain performance metrics. The following5 tables present the quantum of these items and their impact on movements in the income statement (Table 1) and certain performance metrics (Table 2) over the last three halves. 6 7 1. Unless otherwise stated. |
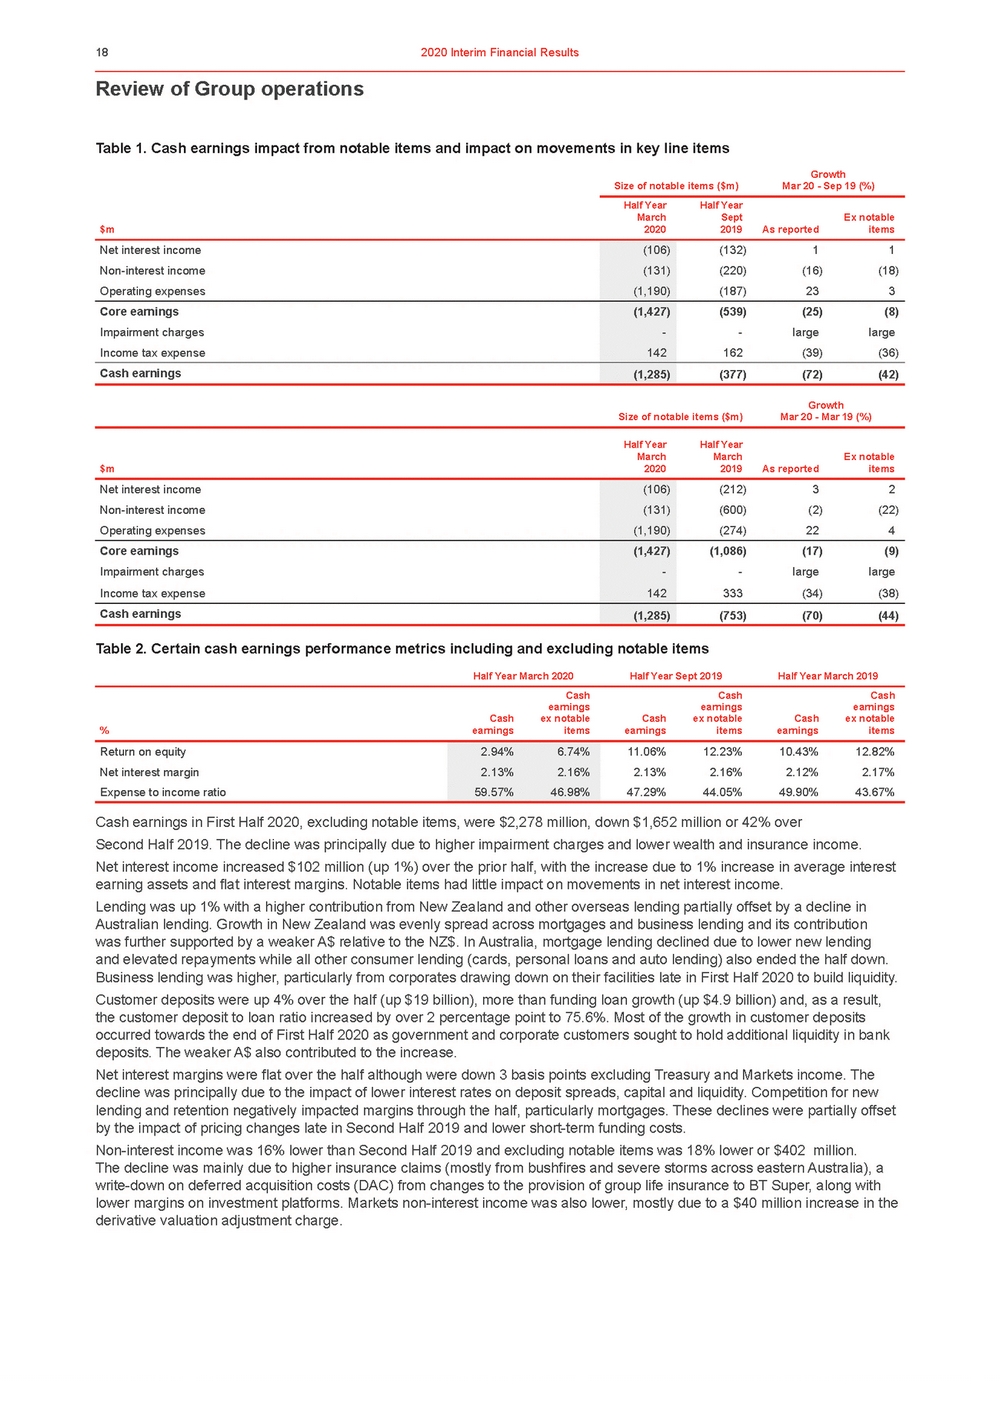 | Review of Group operations Table 1. Cash earnings impact from notable items and impact on movements in key line items Size of notable items ($m) Half YearHalf Year Growth Mar 20 - Sep 19 (%) March $m2020 Sept 2019 As reported Ex notable items Size of notable items ($m) Growth Mar 20 - Mar 19 (%) Half YearHalf Year March $m2020 March 2019 As reported Ex notable items Table 2. Certain cash earnings performance metrics including and excluding notable items Half Year March 2020Half Year Sept 2019Half Year March 2019 Cash earnings in First Half 2020, excluding notable items, were $2,278 million, down $1,652 million or 42% over Second Half 2019. The decline was principally due to higher impairment charges and lower wealth and insurance income. Net interest income increased $102 million (up 1%) over the prior half, with the increase due to 1% increase in average interest earning assets and flat interest margins. Notable items had little impact on movements in net interest income. Lending was up 1% with a higher contribution from New Zealand and other overseas lending partially offset by a decline in Australian lending. Growth in New Zealand was evenly spread across mortgages and business lending and its contribution was further supported by a weaker A$ relative to the NZ$. In Australia, mortgage lending declined due to lower new lending and elevated repayments while all other consumer lending (cards, personal loans and auto lending) also ended the half down. Business lending was higher, particularly from corporates drawing down on their facilities late in First Half 2020 to build liquidity. Customer deposits were up 4% over the half (up $19 billion), more than funding loan growth (up $4.9 billion) and, as a result, the customer deposit to loan ratio increased by over 2 percentage point to 75.6%. Most of the growth in customer deposits occurred towards the end of First Half 2020 as government and corporate customers sought to hold additional liquidity in bank deposits. The weaker A$ also contributed to the increase. Net interest margins were flat over the half although were down 3 basis points excluding Treasury and Markets income. The decline was principally due to the impact of lower interest rates on deposit spreads, capital and liquidity. Competition for new lending and retention negatively impacted margins through the half, particularly mortgages. These declines were partially offset by the impact of pricing changes late in Second Half 2019 and lower short-term funding costs. Non-interest income was 16% lower than Second Half 2019 and excluding notable items was 18% lower or $402 million. The decline was mainly due to higher insurance claims (mostly from bushfires and severe storms across eastern Australia), a write-down on deferred acquisition costs (DAC) from changes to the provision of group life insurance to BT Super, along with lower margins on investment platforms. Markets non-interest income was also lower, mostly due to a $40 million increase in the derivative valuation adjustment charge. |
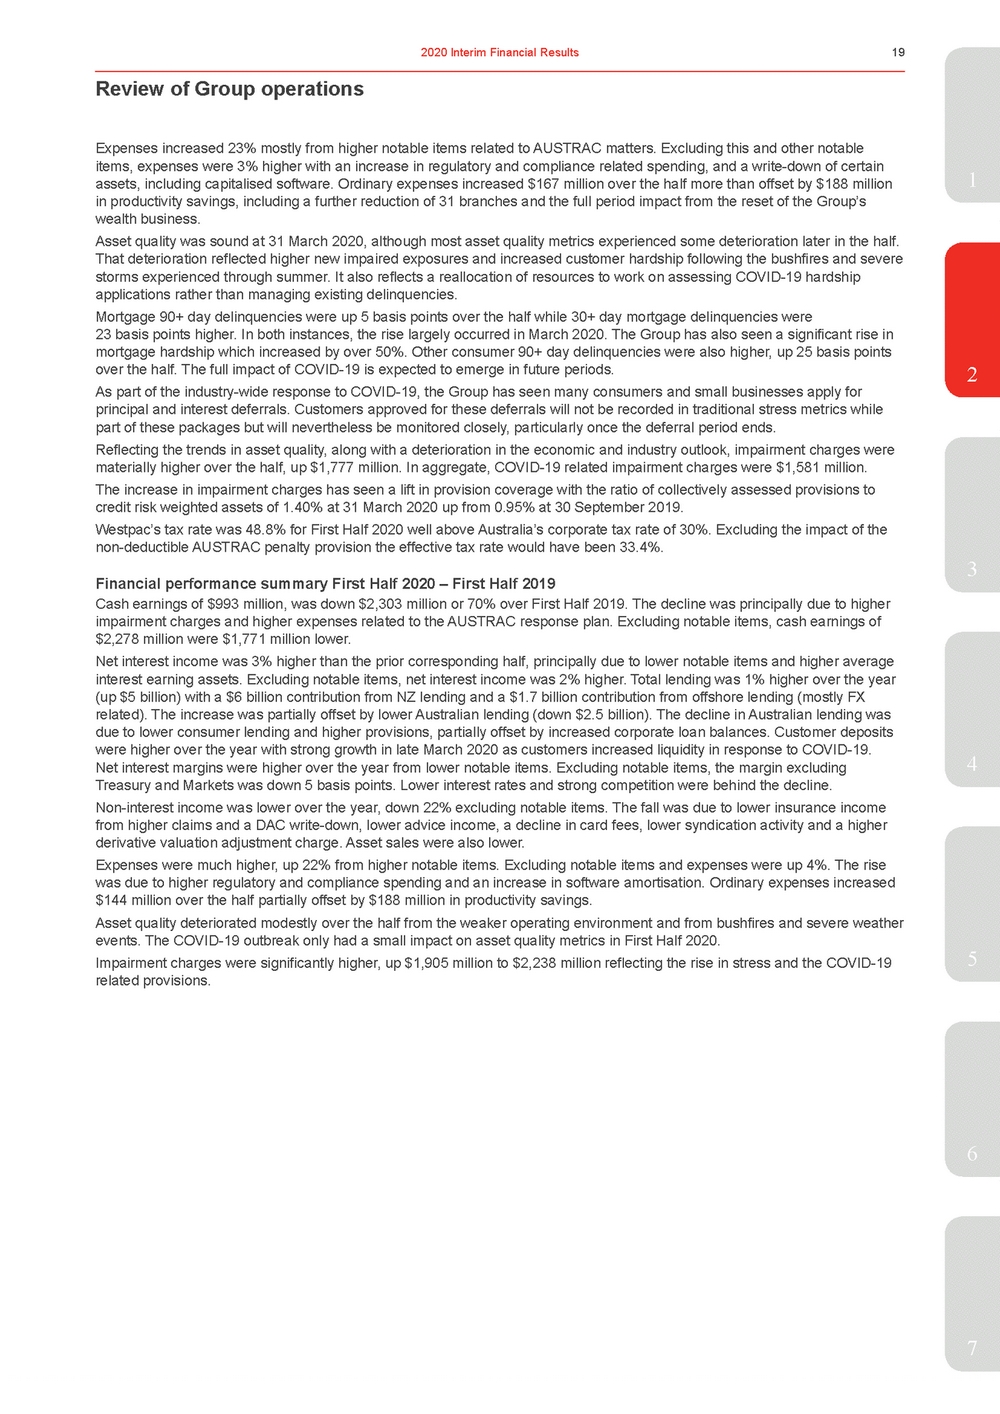 | items, expenses were 3% higher with an increase in regulatory and compliance related spending, and a write-down of certain assets, including capitalised software. Ordinary expenses increased $167 million over the half more than offset by $188 million1 in productivity savings, including a further reduction of 31 branches and the full period impact from the reset of the Group’s wealth business. Asset quality was sound at 31 March 2020, although most asset quality metrics experienced some deterioration later in the half. That deterioration reflected higher new impaired exposures and increased customer hardship following the bushfires and severe storms experienced through summer. It also reflects a reallocation of resources to work on assessing COVID-19 hardship applications rather than managing existing delinquencies. Mortgage 90+ day delinquencies were up 5 basis points over the half while 30+ day mortgage delinquencies were 23 basis points higher. In both instances, the rise largely occurred in March 2020. The Group has also seen a significant rise in mortgage hardship which increased by over 50%. Other consumer 90+ day delinquencies were also higher, up 25 basis points over the half. The full impact of COVID-19 is expected to emerge in future periods.2 As part of the industry-wide response to COVID-19, the Group has seen many consumers and small businesses apply for principal and interest deferrals. Customers approved for these deferrals will not be recorded in traditional stress metrics while part of these packages but will nevertheless be monitored closely, particularly once the deferral period ends. Reflecting the trends in asset quality, along with a deterioration in the economic and industry outlook, impairment charges were materially higher over the half, up $1,777 million. In aggregate, COVID-19 related impairment charges were $1,581 million. The increase in impairment charges has seen a lift in provision coverage with the ratio of collectively assessed provisions to credit risk weighted assets of 1.40% at 31 March 2020 up from 0.95% at 30 September 2019. Westpac’s tax rate was 48.8% for First Half 2020 well above Australia’s corporate tax rate of 30%. Excluding the impact of the non-deductible AUSTRAC penalty provision the effective tax rate would have been 33.4%. 3 Financial performance summary First Half 2020 – First Half 2019 Cash earnings of $993 million, was down $2,303 million or 70% over First Half 2019. The decline was principally due to higher impairment charges and higher expenses related to the AUSTRAC response plan. Excluding notable items, cash earnings of $2,278 million were $1,771 million lower. Net interest income was 3% higher than the prior corresponding half, principally due to lower notable items and higher average interest earning assets. Excluding notable items, net interest income was 2% higher. Total lending was 1% higher over the year (up $5 billion) with a $6 billion contribution from NZ lending and a $1.7 billion contribution from offshore lending (mostly FX related). The increase was partially offset by lower Australian lending (down $2.5 billion). The decline in Australian lending was due to lower consumer lending and higher provisions, partially offset by increased corporate loan balances. Customer deposits were higher over the year with strong growth in late March 2020 as customers increased liquidity in response to COVID-19. Net interest margins were higher over the year from lower notable items. Excluding notable items, the margin excluding4 Treasury and Markets was down 5 basis points. Lower interest rates and strong competition were behind the decline. Non-interest income was lower over the year, down 22% excluding notable items. The fall was due to lower insurance income from higher claims and a DAC write-down, lower advice income, a decline in card fees, lower syndication activity and a higher derivative valuation adjustment charge. Asset sales were also lower. Expenses were much higher, up 22% from higher notable items. Excluding notable items and expenses were up 4%. The rise was due to higher regulatory and compliance spending and an increase in software amortisation. Ordinary expenses increased $144 million over the half partially offset by $188 million in productivity savings. Asset quality deteriorated modestly over the half from the weaker operating environment and from bushfires and severe weather events. The COVID-19 outbreak only had a small impact on asset quality metrics in First Half 2020. Impairment charges were significantly higher, up $1,905 million to $2,238 million reflecting the rise in stress and the COVID-195 related provisions. 6 7 |
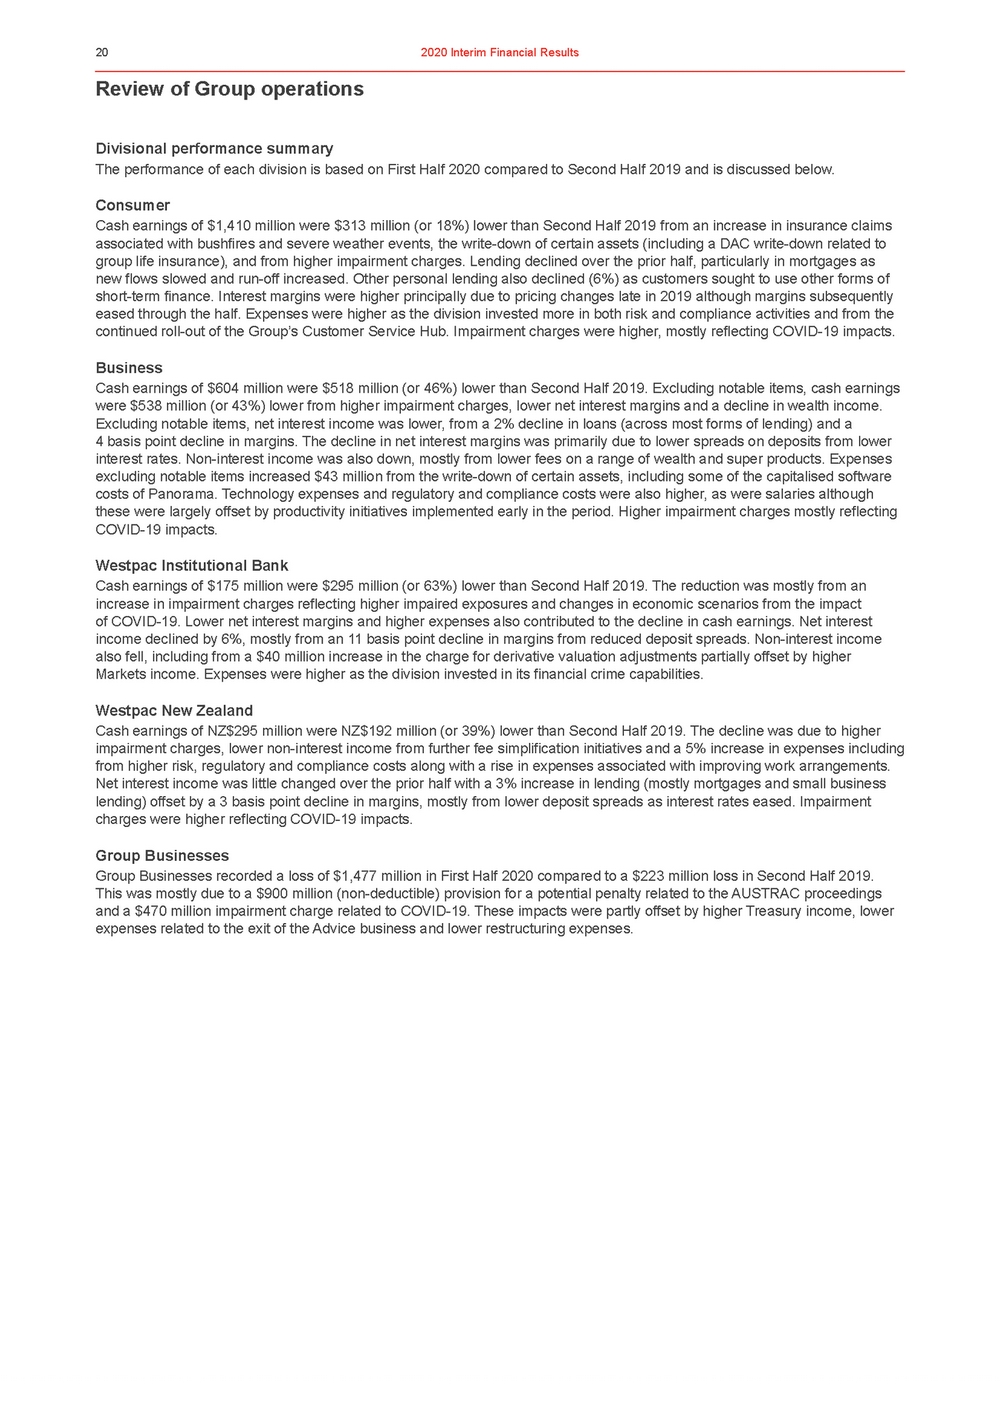 | Review of Group operations Divisional performance summary The performance of each division is based on First Half 2020 compared to Second Half 2019 and is discussed below. Consumer Cash earnings of $1,410 million were $313 million (or 18%) lower than Second Half 2019 from an increase in insurance claims associated with bushfires and severe weather events, the write-down of certain assets (including a DAC write-down related to group life insurance), and from higher impairment charges. Lending declined over the prior half, particularly in mortgages as new flows slowed and run-off increased. Other personal lending also declined (6%) as customers sought to use other forms of short-term finance. Interest margins were higher principally due to pricing changes late in 2019 although margins subsequently eased through the half. Expenses were higher as the division invested more in both risk and compliance activities and from the continued roll-out of the Group’s Customer Service Hub. Impairment charges were higher, mostly reflecting COVID-19 impacts. Business Cash earnings of $604 million were $518 million (or 46%) lower than Second Half 2019. Excluding notable items, cash earnings were $538 million (or 43%) lower from higher impairment charges, lower net interest margins and a decline in wealth income. Excluding notable items, net interest income was lower, from a 2% decline in loans (across most forms of lending) and a 4 basis point decline in margins. The decline in net interest margins was primarily due to lower spreads on deposits from lower interest rates. Non-interest income was also down, mostly from lower fees on a range of wealth and super products. Expenses excluding notable items increased $43 million from the write-down of certain assets, including some of the capitalised software costs of Panorama. Technology expenses and regulatory and compliance costs were also higher, as were salaries although these were largely offset by productivity initiatives implemented early in the period. Higher impairment charges mostly reflecting COVID-19 impacts. Westpac Institutional Bank Cash earnings of $175 million were $295 million (or 63%) lower than Second Half 2019. The reduction was mostly from an increase in impairment charges reflecting higher impaired exposures and changes in economic scenarios from the impact of COVID-19. Lower net interest margins and higher expenses also contributed to the decline in cash earnings. Net interest income declined by 6%, mostly from an 11 basis point decline in margins from reduced deposit spreads. Non-interest income also fell, including from a $40 million increase in the charge for derivative valuation adjustments partially offset by higher Markets income. Expenses were higher as the division invested in its financial crime capabilities. Westpac New Zealand Cash earnings of NZ$295 million were NZ$192 million (or 39%) lower than Second Half 2019. The decline was due to higher impairment charges, lower non-interest income from further fee simplification initiatives and a 5% increase in expenses including from higher risk, regulatory and compliance costs along with a rise in expenses associated with improving work arrangements. Net interest income was little changed over the prior half with a 3% increase in lending (mostly mortgages and small business lending) offset by a 3 basis point decline in margins, mostly from lower deposit spreads as interest rates eased. Impairment charges were higher reflecting COVID-19 impacts. Group Businesses Group Businesses recorded a loss of $1,477 million in First Half 2020 compared to a $223 million loss in Second Half 2019. This was mostly due to a $900 million (non-deductible) provision for a potential penalty related to the AUSTRAC proceedings and a $470 million impairment charge related to COVID-19. These impacts were partly offset by higher Treasury income, lower expenses related to the exit of the Advice business and lower restructuring expenses. |
 | 2.2.1Net interest income11 Half YearHalf YearHalf Year% Mov’t March 2020 Sept 2019 March 2019 Mar 20 - Sept 19 Mar 20 - Mar 19 Net interest Income ($m) Net interest income excluding Treasury & Markets Treasury net interest income2 Markets net interest income 8,155 444 67 8,2108,081(1)1 2732406385 8168(17)(1) Net interest income Add back notable items 8,666 106 8,5648,38913 132212(20)(50) Net interest income excluding notable items 8,772 8,6968,60112 Average interest earning assets ($m) Loans Third party liquid assets3 Other interest earning assets 675,273 115,771 21,927 675,756674,159--107,78697,222719 19,62323,27912(6) Average interest earning assets 812,971 803,165794,66012 Net interest margin (%) Group net interest margin Group net interest margin excluding Treasury & Markets4 2.13% 2.01% 2.13%2.12%-1 bps 2.04%2.04%(3 bps)(3 bps) Excluding notable items (%) Group net interest margin Group net interest margin excluding Treasury & Markets4 2.16% 2.04% 2.16%2.17%-(1 bps) 2.07%2.09%(3 bps)(5 bps) 3 First Half 2020 – Second Half 2019 Net interest income increased $102 million or 1% compared to Second Half 2019. Key features include: •A 1% increase in average interest earning assets primarily from New Zealand lending and higher holdings of third party liquid assets, partially offset by a reduction in Australian mortgage balances; •Group net interest margin was flat at 2.13%. Group net interest margin excluding Treasury and Markets, and notable items decreased 3 basis points. The decline was primarily due to lower interest rates impacting customer deposit spreads and4 income earned on capital, along with higher holdings of third party liquid assets. These were partially offset by pricing changes on Australian variable rate mortgages. Refer to section 2.2.4 for further details on net interest margin; and •Treasury and Markets net interest income increased $157 million or 44%, with higher Treasury revenue primarily driven by positioning for interest rate changes, partially offset by lower markets net interest income. First Half 2020 – First Half 2019 Net interest income increased $277 million or 3% compared to First Half 2019. Key features include: •A 2% growth in average interest earning assets, primarily from New Zealand mortgages and higher holdings of third party liquid assets, partially offset by lower institutional bank lending; •Group net interest margin increased 1 basis point to 2.13%. Group net interest margin excluding Treasury and Markets, and5 notable items decreased 5 basis points. The decline was primarily due to lower interest rates impacting customer deposit spreads and income earned on capital, along with higher holdings of third party liquid assets. These were partially offset by lower short term funding costs and pricing changes on Australian variable rate mortgages. Refer to section 2.2.4 for further details on net interest margin; and •The contribution from Treasury and Markets increased $203 million or 66%, with higher Treasury revenue primarily driven by positioning for interest rate changes. 6 1. Refer to Section 4, Note 3 for reported results breakdown. Refer to Section 5, Note 3 for cash earnings results breakdown. As discussed in Section 1.3, commentary is reflected on a cash earnings basis. 2. Treasury net interest income excludes capital benefit. 3. Refer Glossary for definition.7 4Calculated by dividing net interest income excluding Treasury and Markets by total average interest earning assets. |
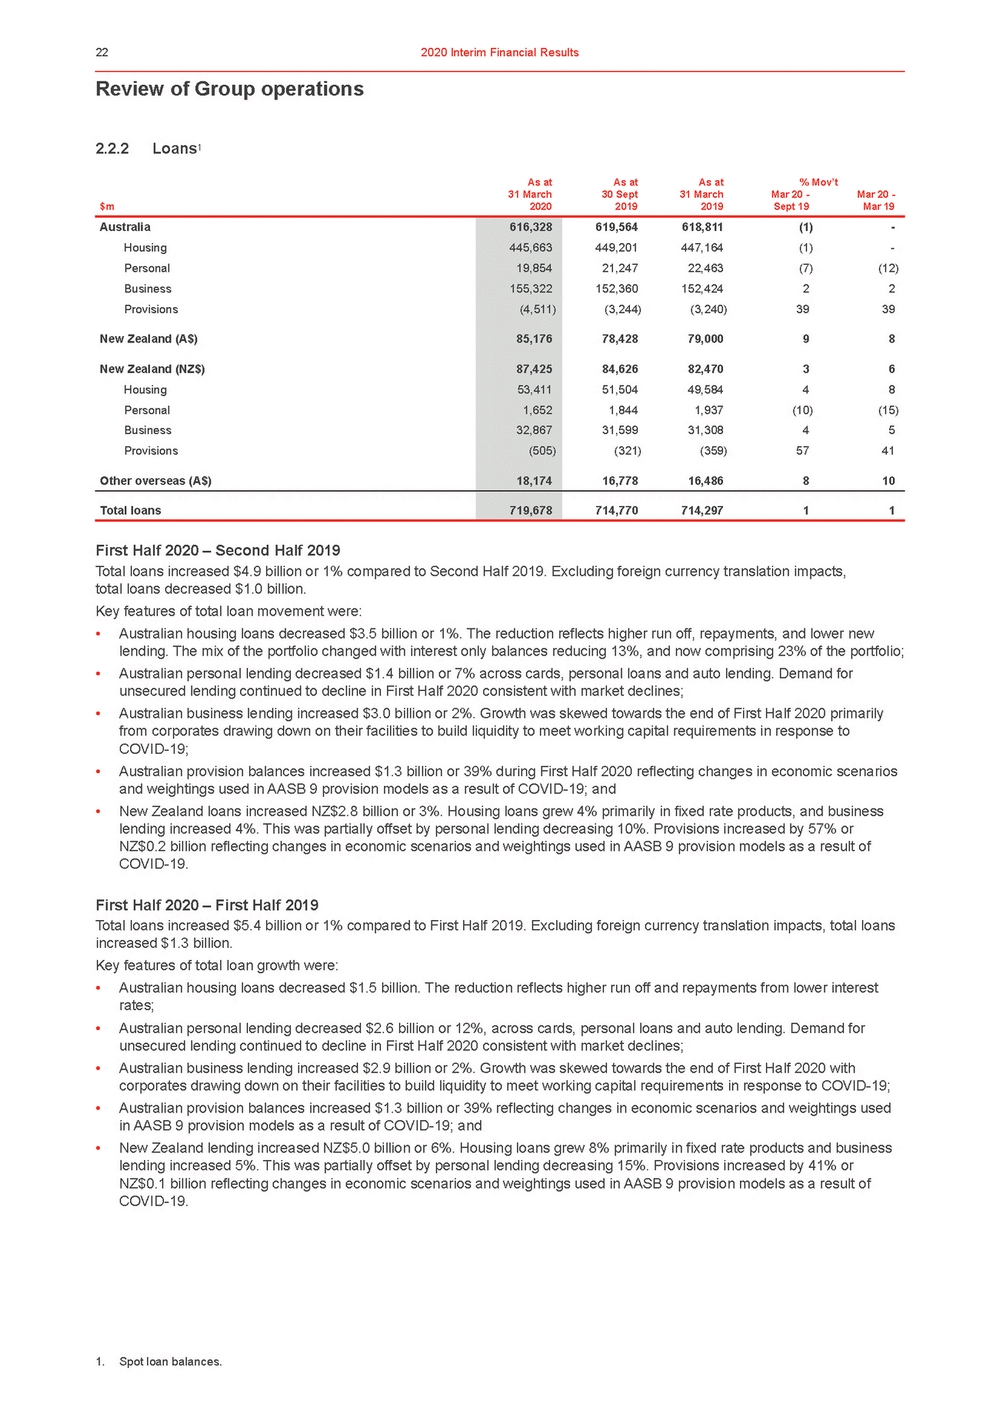 | Review of Group operations 2.2.2Loans1 As atAs atAs at% Mov’t 31 March $m2020 30 Sept 2019 31 March 2019 Mar 20 - Sept 19 Mar 20 - Mar 19 First Half 2020 – Second Half 2019 Total loans increased $4.9 billion or 1% compared to Second Half 2019. Excluding foreign currency translation impacts, total loans decreased $1.0 billion. Key features of total loan movement were: •Australian housing loans decreased $3.5 billion or 1%. The reduction reflects higher run off, repayments, and lower new lending. The mix of the portfolio changed with interest only balances reducing 13%, and now comprising 23% of the portfolio; •Australian personal lending decreased $1.4 billion or 7% across cards, personal loans and auto lending. Demand for unsecured lending continued to decline in First Half 2020 consistent with market declines; •Australian business lending increased $3.0 billion or 2%. Growth was skewed towards the end of First Half 2020 primarily from corporates drawing down on their facilities to build liquidity to meet working capital requirements in response to COVID-19; •Australian provision balances increased $1.3 billion or 39% during First Half 2020 reflecting changes in economic scenarios and weightings used in AASB 9 provision models as a result of COVID-19; and •New Zealand loans increased NZ$2.8 billion or 3%. Housing loans grew 4% primarily in fixed rate products, and business lending increased 4%. This was partially offset by personal lending decreasing 10%. Provisions increased by 57% or NZ$0.2 billion reflecting changes in economic scenarios and weightings used in AASB 9 provision models as a result of COVID-19. First Half 2020 – First Half 2019 Total loans increased $5.4 billion or 1% compared to First Half 2019. Excluding foreign currency translation impacts, total loans increased $1.3 billion. Key features of total loan growth were: •Australian housing loans decreased $1.5 billion. The reduction reflects higher run off and repayments from lower interest rates; •Australian personal lending decreased $2.6 billion or 12%, across cards, personal loans and auto lending. Demand for unsecured lending continued to decline in First Half 2020 consistent with market declines; •Australian business lending increased $2.9 billion or 2%. Growth was skewed towards the end of First Half 2020 with corporates drawing down on their facilities to build liquidity to meet working capital requirements in response to COVID-19; •Australian provision balances increased $1.3 billion or 39% reflecting changes in economic scenarios and weightings used in AASB 9 provision models as a result of COVID-19; and •New Zealand lending increased NZ$5.0 billion or 6%. Housing loans grew 8% primarily in fixed rate products and business lending increased 5%. This was partially offset by personal lending decreasing 15%. Provisions increased by 41% or NZ$0.1 billion reflecting changes in economic scenarios and weightings used in AASB 9 provision models as a result of COVID-19. 1. Spot loan balances. |
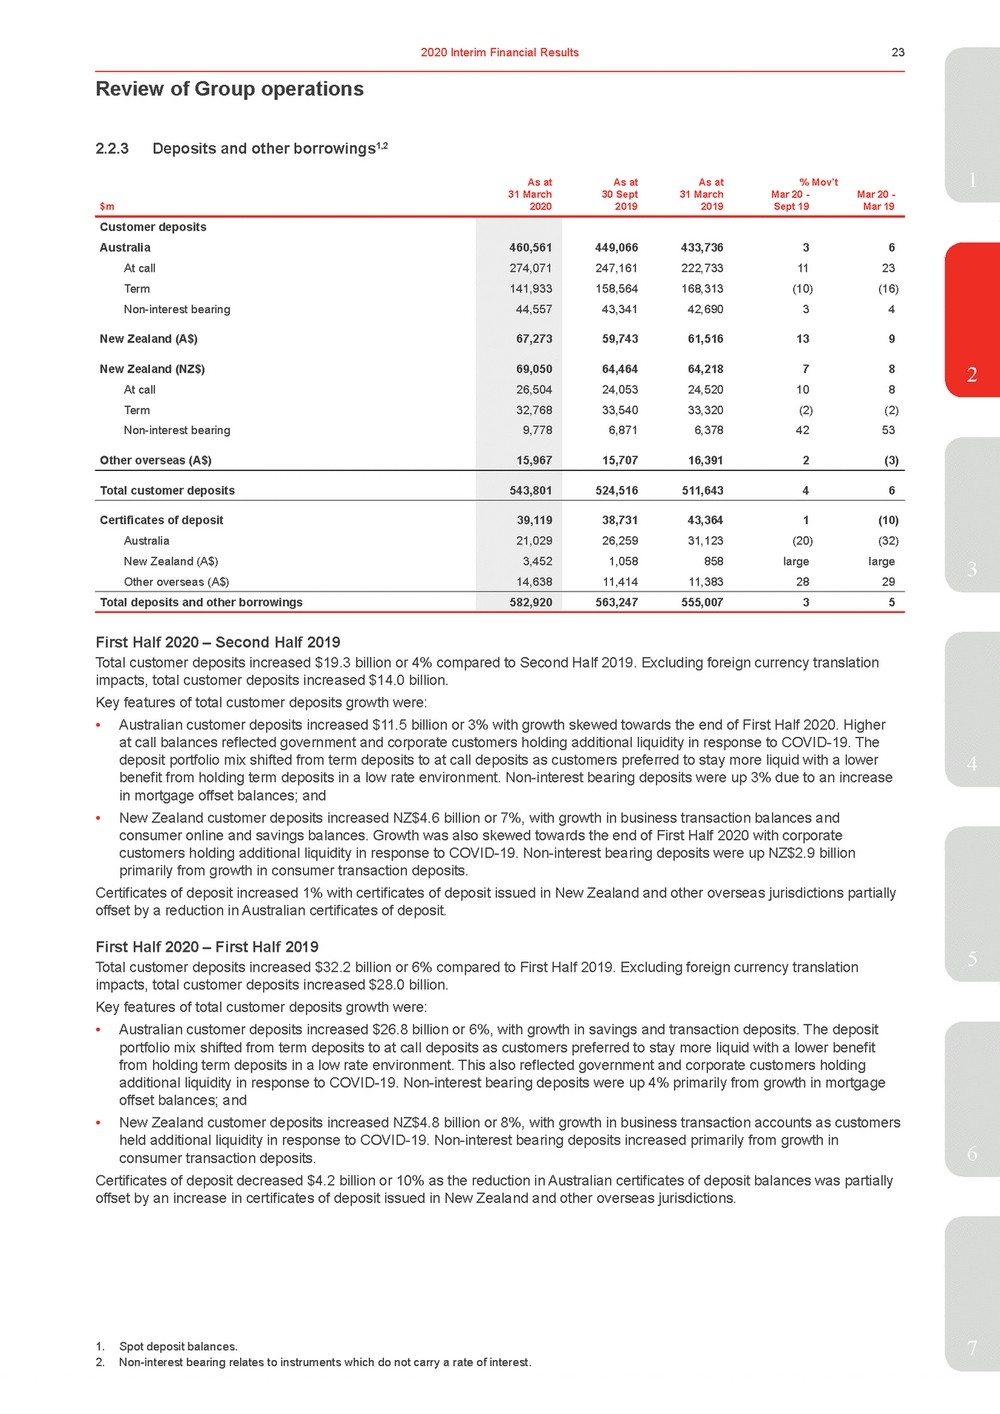 | 2.2.3Deposits and other borrowings1,2 As atAs atAs at% Mov’t1 31 March $m2020 30 Sept 2019 31 March 2019 Mar 20 - Sept 19 Mar 20 - Mar 19 Customer deposits Australia At call Term Non-interest bearing New Zealand (A$) New Zealand (NZ$) At call Term Non-interest bearing Other overseas (A$) 460,561 274,071 141,933 44,557 67,273 69,050 26,504 32,768 9,778 15,967 449,066433,73636 247,161222,7331123 158,564168,313(10)(16) 43,34142,69034 59,74361,516139 64,46464,21878 24,05324,520108 33,54033,320(2)(2) 6,8716,3784253 15,70716,3912(3) Total customer deposits 543,801 524,516511,64346 Certificates of deposit Australia New Zealand (A$) Other overseas (A$) 39,119 21,029 3,452 14,638 38,73143,3641(10) 26,25931,123(20)(32) 1,058858largelarge 11,41411,3832829 Total deposits and other borrowings 582,920 563,247555,00735 3 First Half 2020 – Second Half 2019 Total customer deposits increased $19.3 billion or 4% compared to Second Half 2019. Excluding foreign currency translation impacts, total customer deposits increased $14.0 billion. Key features of total customer deposits growth were: •Australian customer deposits increased $11.5 billion or 3% with growth skewed towards the end of First Half 2020. Higher at call balances reflected government and corporate customers holding additional liquidity in response to COVID-19. The deposit portfolio mix shifted from term deposits to at call deposits as customers preferred to stay more liquid with a lower4 benefit from holding term deposits in a low rate environment. Non-interest bearing deposits were up 3% due to an increase in mortgage offset balances; and •New Zealand customer deposits increased NZ$4.6 billion or 7%, with growth in business transaction balances and consumer online and savings balances. Growth was also skewed towards the end of First Half 2020 with corporate customers holding additional liquidity in response to COVID-19. Non-interest bearing deposits were up NZ$2.9 billion primarily from growth in consumer transaction deposits. Certificates of deposit increased 1% with certificates of deposit issued in New Zealand and other overseas jurisdictions partially offset by a reduction in Australian certificates of deposit. First Half 2020 – First Half 2019 Total customer deposits increased $32.2 billion or 6% compared to First Half 2019. Excluding foreign currency translation5 impacts, total customer deposits increased $28.0 billion. Key features of total customer deposits growth were: •Australian customer deposits increased $26.8 billion or 6%, with growth in savings and transaction deposits. The deposit portfolio mix shifted from term deposits to at call deposits as customers preferred to stay more liquid with a lower benefit from holding term deposits in a low rate environment. This also reflected government and corporate customers holding additional liquidity in response to COVID-19. Non-interest bearing deposits were up 4% primarily from growth in mortgage offset balances; and •New Zealand customer deposits increased NZ$4.8 billion or 8%, with growth in business transaction accounts as customers held additional liquidity in response to COVID-19. Non-interest bearing deposits increased primarily from growth in consumer transaction deposits.6 Certificates of deposit decreased $4.2 billion or 10% as the reduction in Australian certificates of deposit balances was partially offset by an increase in certificates of deposit issued in New Zealand and other overseas jurisdictions. 1. Spot deposit balances.7 2. Non-interest bearing relates to instruments which do not carry a rate of interest. |
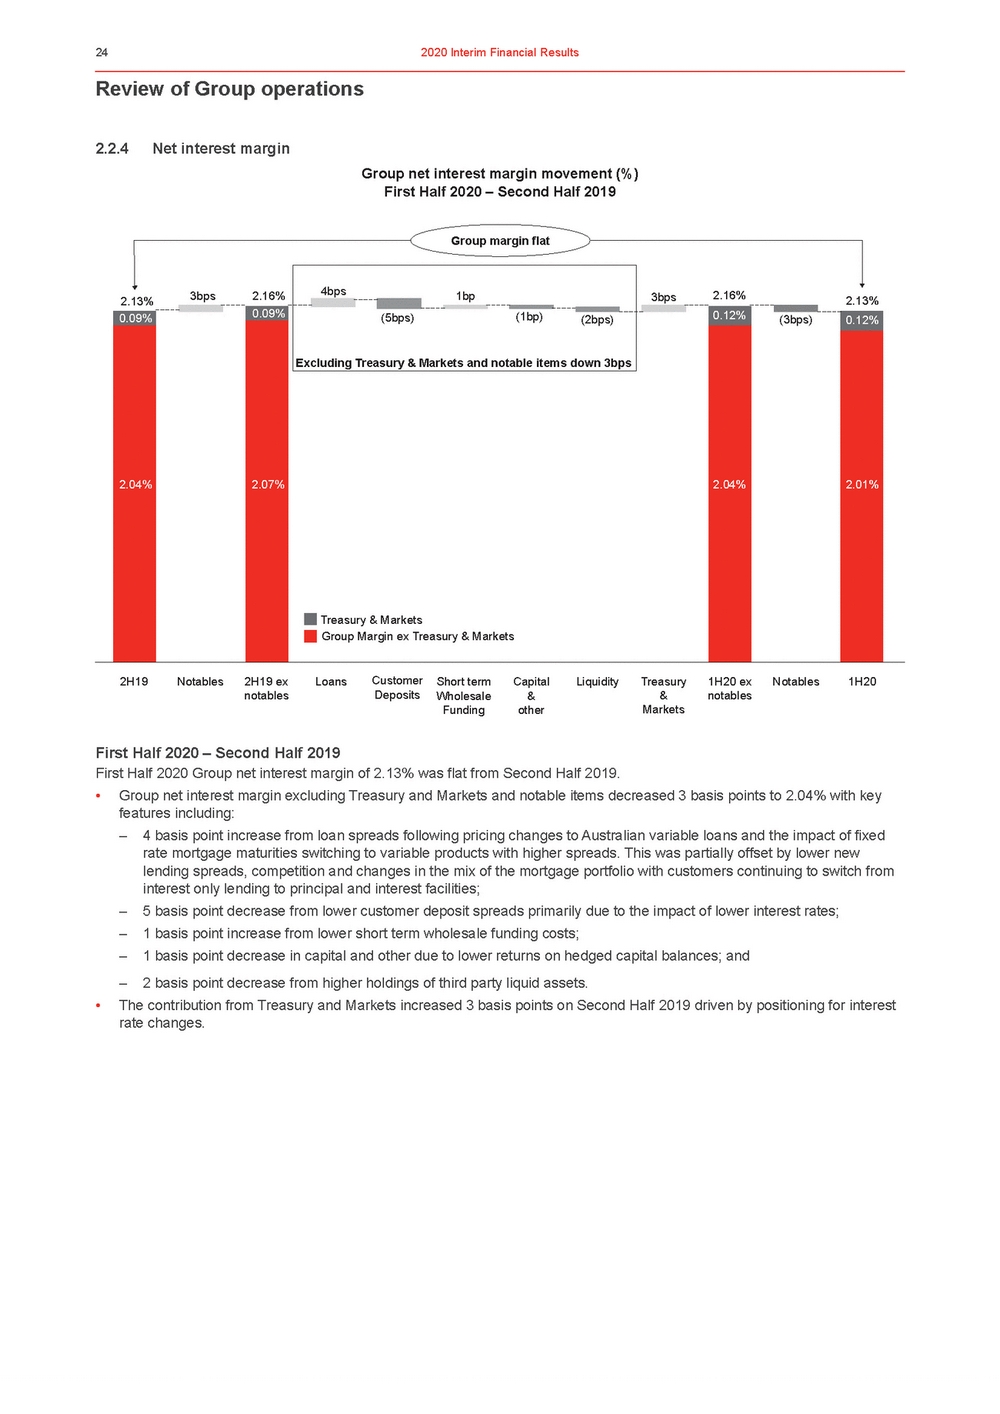 | Review of Group operations 2.2.4Net interest margin Group net interest margin movement (%) First Half 2020 – Second Half 2019 Group margin flat 2.13% 3bps 2.16%4bps1bp3bps 2.16% 2.13% 0.09% 0.09% (5bps)(1bp)(2bps) 0.12% (3bps) 0.12% Excluding Treasury & Markets and notable items down 3bps 2.04% 2.07%2.04% 2.01% Treasury & Markets Group Margin ex Treasury & Markets First Half 2020 – Second Half 2019 First Half 2020 Group net interest margin of 2.13% was flat from Second Half 2019. •Group net interest margin excluding Treasury and Markets and notable items decreased 3 basis points to 2.04% with key features including: – 4 basis point increase from loan spreads following pricing changes to Australian variable loans and the impact of fixed rate mortgage maturities switching to variable products with higher spreads. This was partially offset by lower new lending spreads, competition and changes in the mix of the mortgage portfolio with customers continuing to switch from interest only lending to principal and interest facilities; – 5 basis point decrease from lower customer deposit spreads primarily due to the impact of lower interest rates; – 1 basis point increase from lower short term wholesale funding costs; – 1 basis point decrease in capital and other due to lower returns on hedged capital balances; and – 2 basis point decrease from higher holdings of third party liquid assets. •The contribution from Treasury and Markets increased 3 basis points on Second Half 2019 driven by positioning for interest rate changes. |
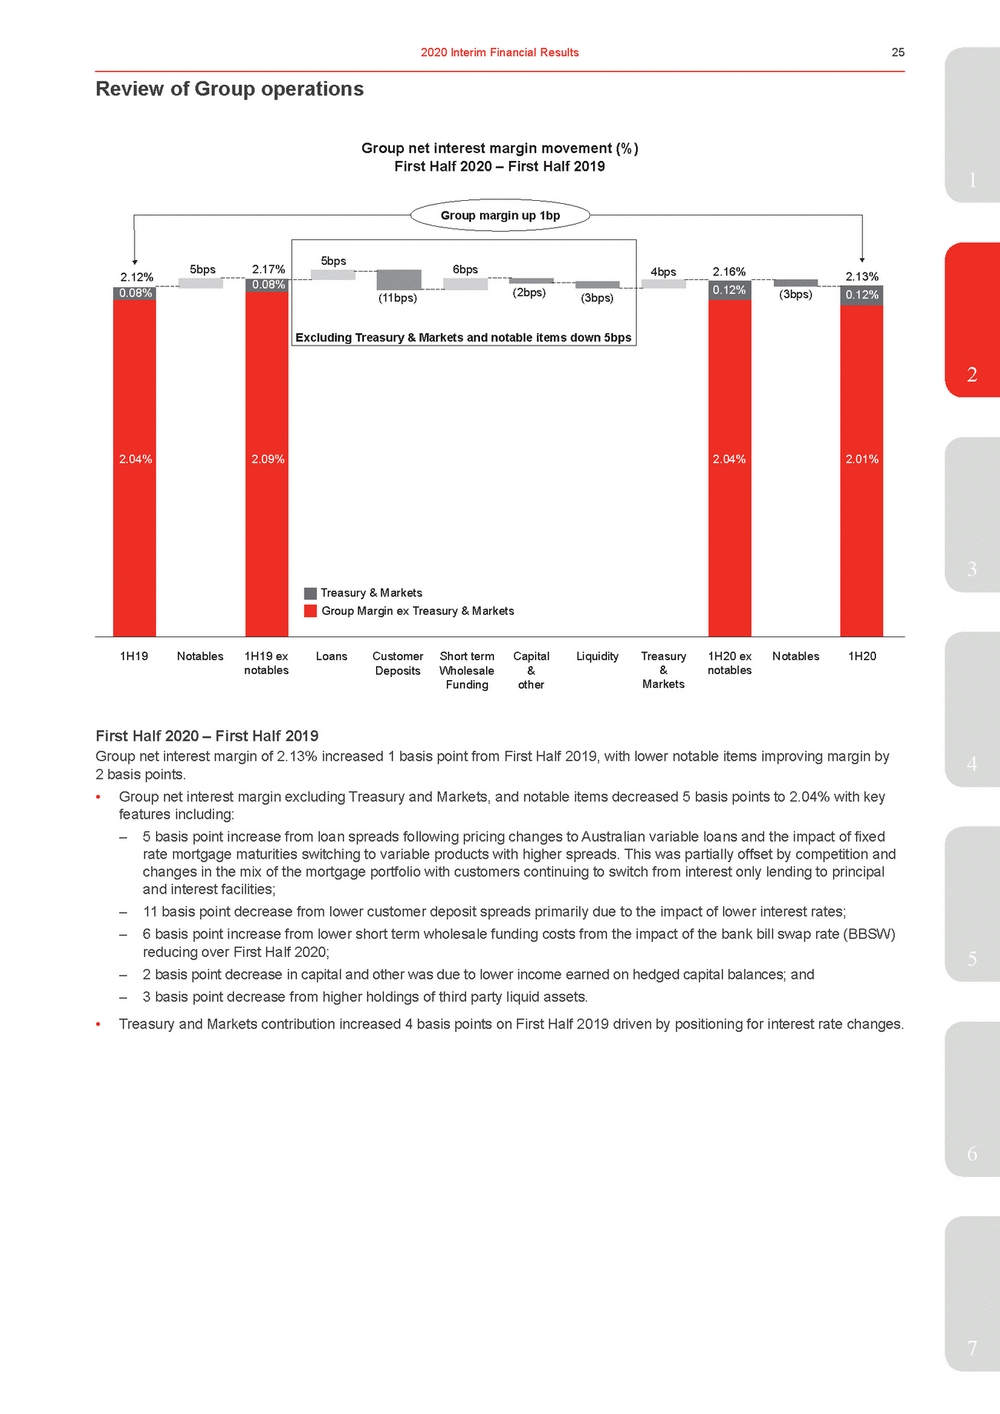 | Group net interest margin movement (%) First Half 2020 – First Half 2019 1 Group margin up 1bp 2.12% 0.08% 5bps 2.17% 0.08% 5bps 6bps4bps (11bps)(2bps)(3bps) 2.16% 0.12% (3bps) 2.13% 0.12% Excluding Treasury & Markets and notable items down 5bps 2 2.04% 2.09%2.04% 2.01% 3 Treasury & Markets Group Margin ex Treasury & Markets First Half 2020 – First Half 2019 4 2 basis points. •Group net interest margin excluding Treasury and Markets, and notable items decreased 5 basis points to 2.04% with key features including: – 5 basis point increase from loan spreads following pricing changes to Australian variable loans and the impact of fixed rate mortgage maturities switching to variable products with higher spreads. This was partially offset by competition and changes in the mix of the mortgage portfolio with customers continuing to switch from interest only lending to principal and interest facilities; – 11 basis point decrease from lower customer deposit spreads primarily due to the impact of lower interest rates; – 6 basis point increase from lower short term wholesale funding costs from the impact of the bank bill swap rate (BBSW) reducing over First Half 2020;5 – 2 basis point decrease in capital and other was due to lower income earned on hedged capital balances; and – 3 basis point decrease from higher holdings of third party liquid assets. •Treasury and Markets contribution increased 4 basis points on First Half 2019 driven by positioning for interest rate changes. 6 7 |
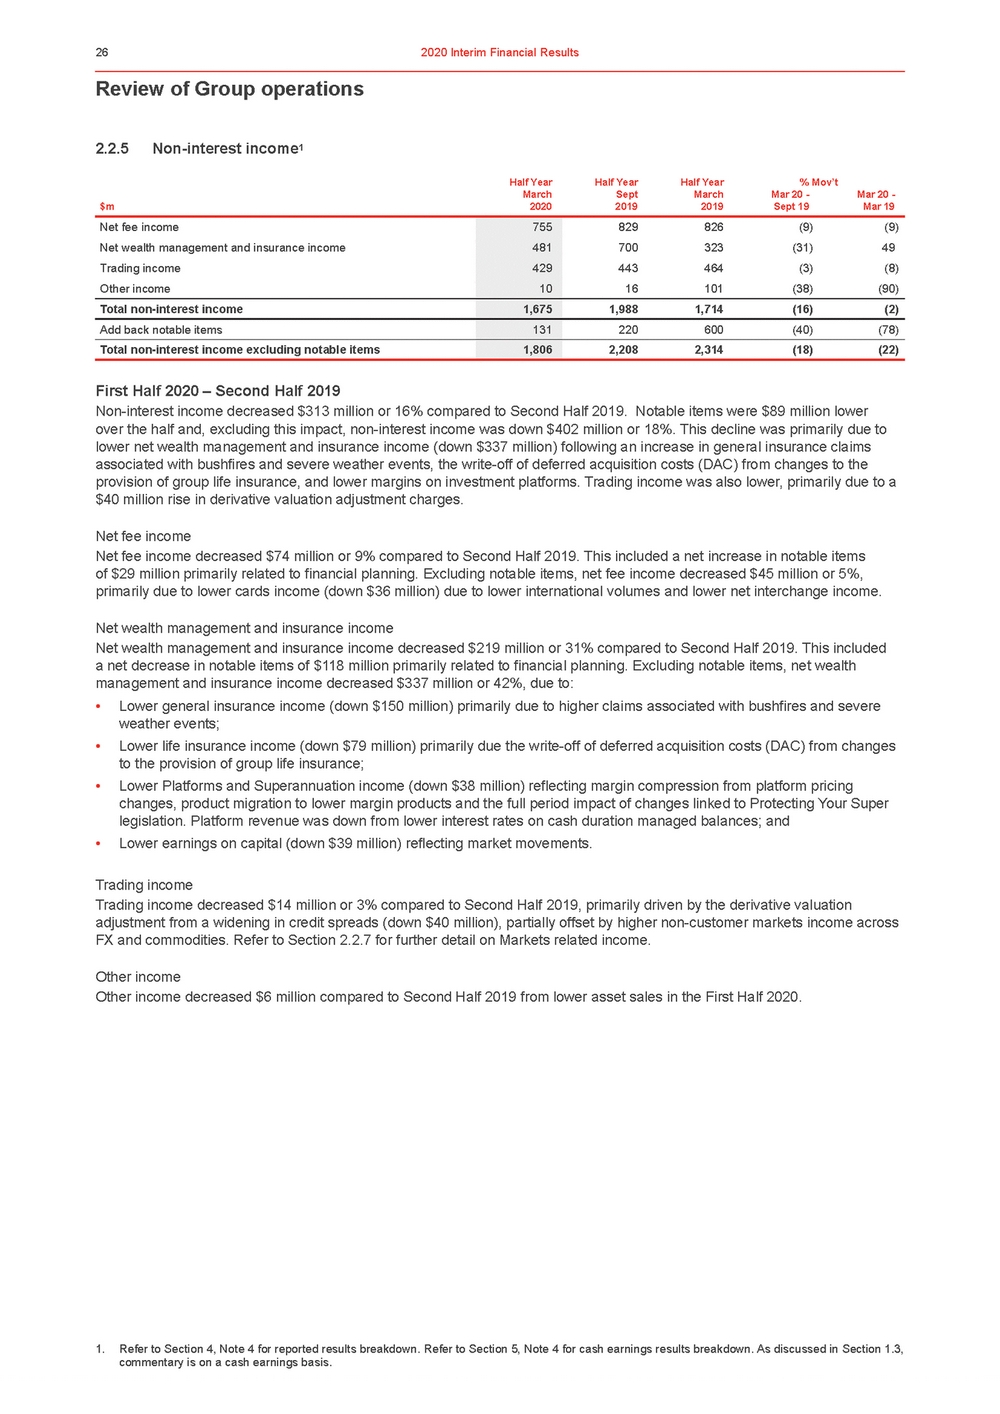 | Review of Group operations 2.2.5Non-interest income1 Half YearHalf YearHalf Year% Mov’t March $m2020 Sept 2019 March 2019 Mar 20 - Sept 19 Mar 20 - Mar 19 First Half 2020 – Second Half 2019 Non-interest income decreased $313 million or 16% compared to Second Half 2019. Notable items were $89 million lower over the half and, excluding this impact, non-interest income was down $402 million or 18%. This decline was primarily due to lower net wealth management and insurance income (down $337 million) following an increase in general insurance claims associated with bushfires and severe weather events, the write-off of deferred acquisition costs (DAC) from changes to the provision of group life insurance, and lower margins on investment platforms. Trading income was also lower, primarily due to a $40 million rise in derivative valuation adjustment charges. Net fee income Net fee income decreased $74 million or 9% compared to Second Half 2019. This included a net increase in notable items of $29 million primarily related to financial planning. Excluding notable items, net fee income decreased $45 million or 5%, primarily due to lower cards income (down $36 million) due to lower international volumes and lower net interchange income. Net wealth management and insurance income Net wealth management and insurance income decreased $219 million or 31% compared to Second Half 2019. This included a net decrease in notable items of $118 million primarily related to financial planning. Excluding notable items, net wealth management and insurance income decreased $337 million or 42%, due to: •Lower general insurance income (down $150 million) primarily due to higher claims associated with bushfires and severe weather events; •Lower life insurance income (down $79 million) primarily due the write-off of deferred acquisition costs (DAC) from changes to the provision of group life insurance; •Lower Platforms and Superannuation income (down $38 million) reflecting margin compression from platform pricing changes, product migration to lower margin products and the full period impact of changes linked to Protecting Your Super legislation. Platform revenue was down from lower interest rates on cash duration managed balances; and •Lower earnings on capital (down $39 million) reflecting market movements. Trading income Trading income decreased $14 million or 3% compared to Second Half 2019, primarily driven by the derivative valuation adjustment from a widening in credit spreads (down $40 million), partially offset by higher non-customer markets income across FX and commodities. Refer to Section 2.2.7 for further detail on Markets related income. Other income Other income decreased $6 million compared to Second Half 2019 from lower asset sales in the First Half 2020. 1. Refer to Section 4, Note 4 for reported results breakdown. Refer to Section 5, Note 4 for cash earnings results breakdown. As discussed in Section 1.3, commentary is on a cash earnings basis. |
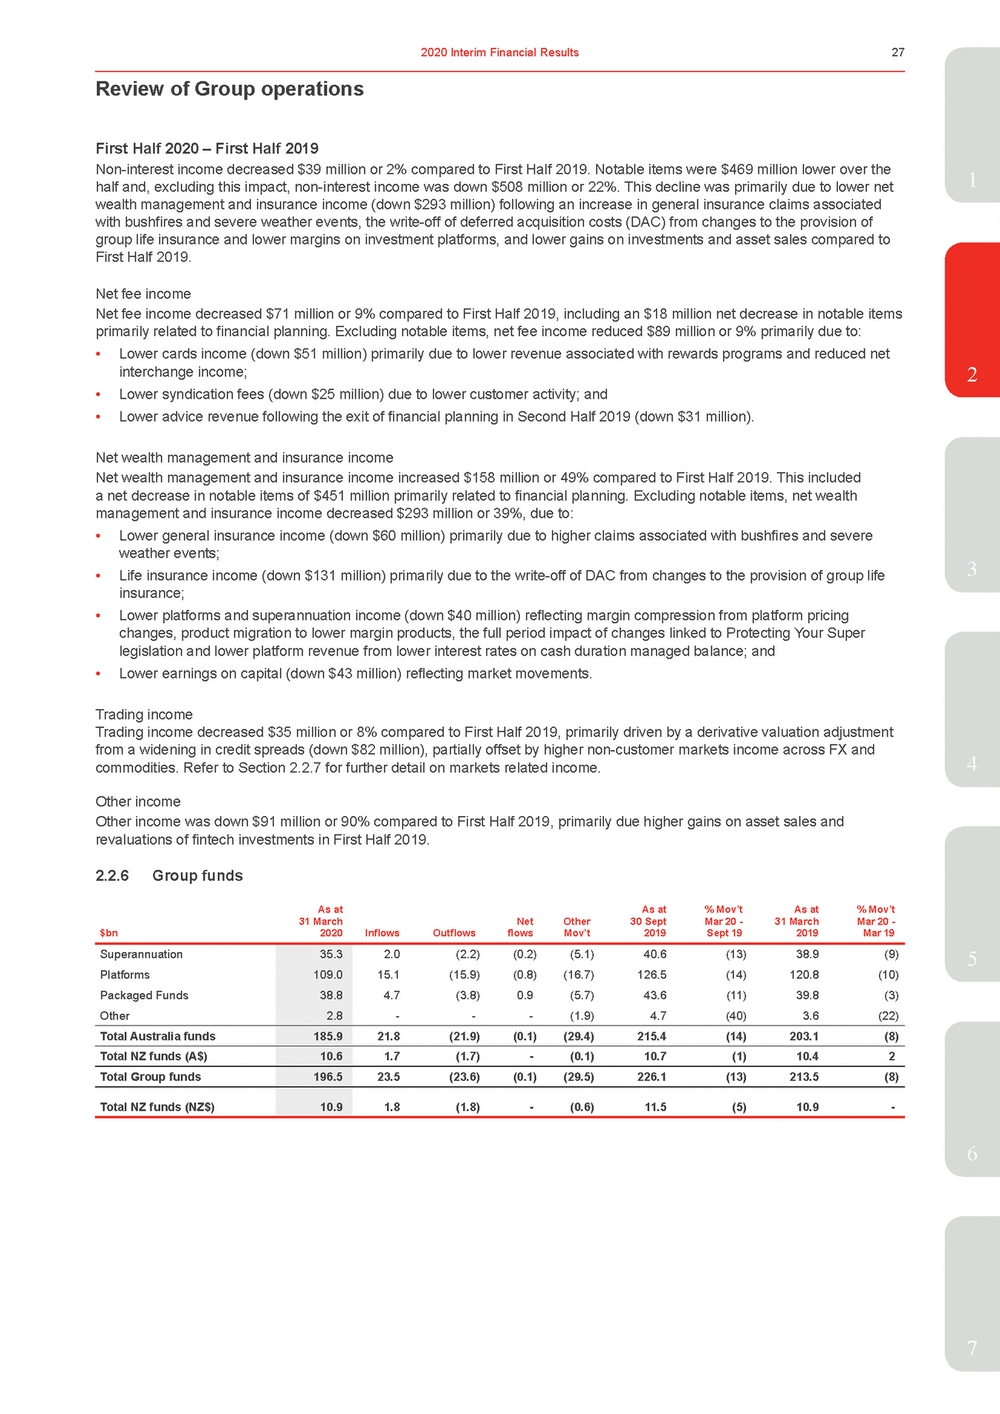 | First Half 2020 – First Half 2019 1 Net fee income Net fee income decreased $71 million or 9% compared to First Half 2019, including an $18 million net decrease in notable items primarily related to financial planning. Excluding notable items, net fee income reduced $89 million or 9% primarily due to: •Lower cards income (down $51 million) primarily due to lower revenue associated with rewards programs and reduced net interchange income;2 •Lower syndication fees (down $25 million) due to lower customer activity; and •Lower advice revenue following the exit of financial planning in Second Half 2019 (down $31 million). Net wealth management and insurance income Net wealth management and insurance income increased $158 million or 49% compared to First Half 2019. This included a net decrease in notable items of $451 million primarily related to financial planning. Excluding notable items, net wealth management and insurance income decreased $293 million or 39%, due to: •Lower general insurance income (down $60 million) primarily due to higher claims associated with bushfires and severe weather events; •Life insurance income (down $131 million) primarily due to the write-off of DAC from changes to the provision of group life3 insurance; •Lower platforms and superannuation income (down $40 million) reflecting margin compression from platform pricing changes, product migration to lower margin products, the full period impact of changes linked to Protecting Your Super legislation and lower platform revenue from lower interest rates on cash duration managed balance; and •Lower earnings on capital (down $43 million) reflecting market movements. Trading income Trading income decreased $35 million or 8% compared to First Half 2019, primarily driven by a derivative valuation adjustment from a widening in credit spreads (down $82 million), partially offset by higher non-customer markets income across FX and commodities. Refer to Section 2.2.7 for further detail on markets related income.4 Other income Other income was down $91 million or 90% compared to First Half 2019, primarily due higher gains on asset sales and revaluations of fintech investments in First Half 2019. 2.2.6Group funds As at As at % Mov’t As at % Mov’t 31 March Net Other 30 Sept Mar 20 - 31 March Mar 20 - 2020 Inflows Outflows flows Mov’t 2019 Sept 19 2019 Mar 19 Superannuation Platforms Packaged Funds Other 35.3 109.0 38.8 2.8 2.0(2.2)(0.2)(5.1)40.6(13)38.9(9) 15.1(15.9)(0.8)(16.7)126.5(14)120.8(10) 4.7(3.8)0.9(5.7)43.6(11)39.8(3) ---(1.9)4.7(40)3.6(22) Total Australia funds 185.9 21.8(21.9)(0.1)(29.4)215.4(14)203.1(8) Total NZ funds (A$) 10.6 1.7(1.7)-(0.1)10.7(1)10.42 Total Group funds 196.5 23.5(23.6)(0.1)(29.5)226.1(13)213.5(8) Total NZ funds (NZ$) 10.9 1.8(1.8)-(0.6)11.5(5)10.9-6 7 |
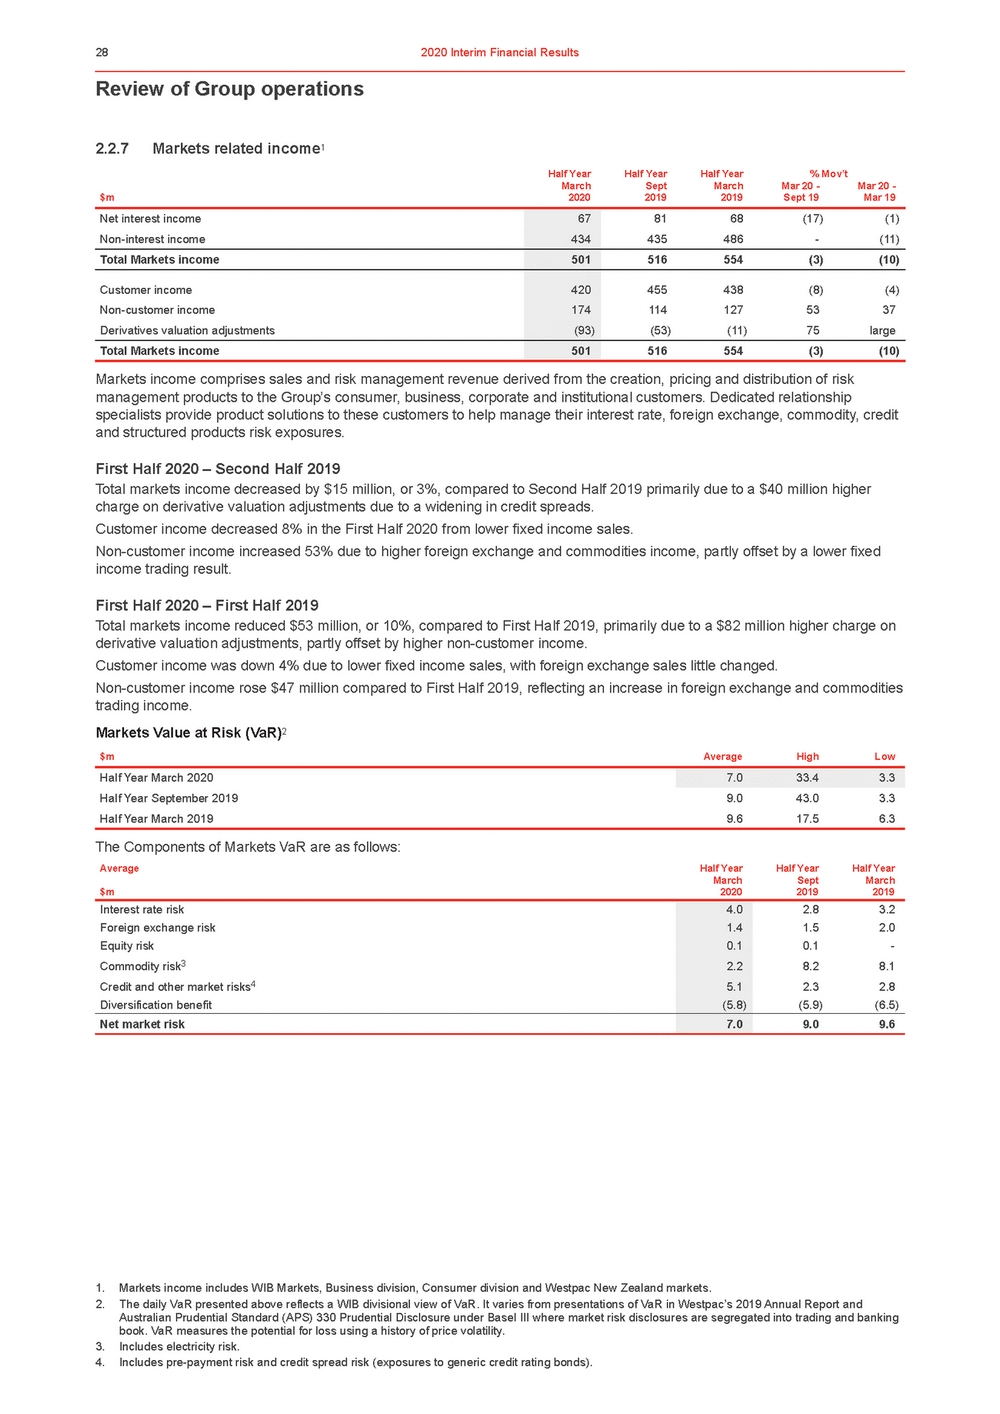 | 2.2.7 Markets related income1 Half Year March Half Year Sept Half Year March % Mov’t Mar 20 - Mar 20 - $m 2020 2019 2019 Sept 19 Mar 19 Markets income comprises sales and risk management revenue derived from the creation, pricing and distribution of risk management products to the Group’s consumer, business, corporate and institutional customers. Dedicated relationship specialists provide product solutions to these customers to help manage their interest rate, foreign exchange, commodity, credit and structured products risk exposures. First Half 2020 – Second Half 2019 Total markets income decreased by $15 million, or 3%, compared to Second Half 2019 primarily due to a $40 million higher charge on derivative valuation adjustments due to a widening in credit spreads. Customer income decreased 8% in the First Half 2020 from lower fixed income sales. Non-customer income increased 53% due to higher foreign exchange and commodities income, partly offset by a lower fixed income trading result. First Half 2020 – First Half 2019 Total markets income reduced $53 million, or 10%, compared to First Half 2019, primarily due to a $82 million higher charge on derivative valuation adjustments, partly offset by higher non-customer income. Customer income was down 4% due to lower fixed income sales, with foreign exchange sales little changed. Non-customer income rose $47 million compared to First Half 2019, reflecting an increase in foreign exchange and commodities trading income. Markets Value at Risk (VaR)2 $mAverageHighLow Half Year March 20207.033.43.3 Half Year September 20199.043.03.3 Half Year March 20199.617.56.3 The Components of Markets VaR are as follows: AverageHalf YearHalf YearHalf Year March $m2020 Sept 2019 March 2019 1. Markets income includes WIB Markets, Business division, Consumer division and Westpac New Zealand markets. 2. The daily VaR presented above reflects a WIB divisional view of VaR. It varies from presentations of VaR in Westpac’s 2019 Annual Report and Australian Prudential Standard (APS) 330 Prudential Disclosure under Basel III where market risk disclosures are segregated into trading and banking book. VaR measures the potential for loss using a history of price volatility. 3. Includes electricity risk. 4. Includes pre-payment risk and credit spread risk (exposures to generic credit rating bonds). |
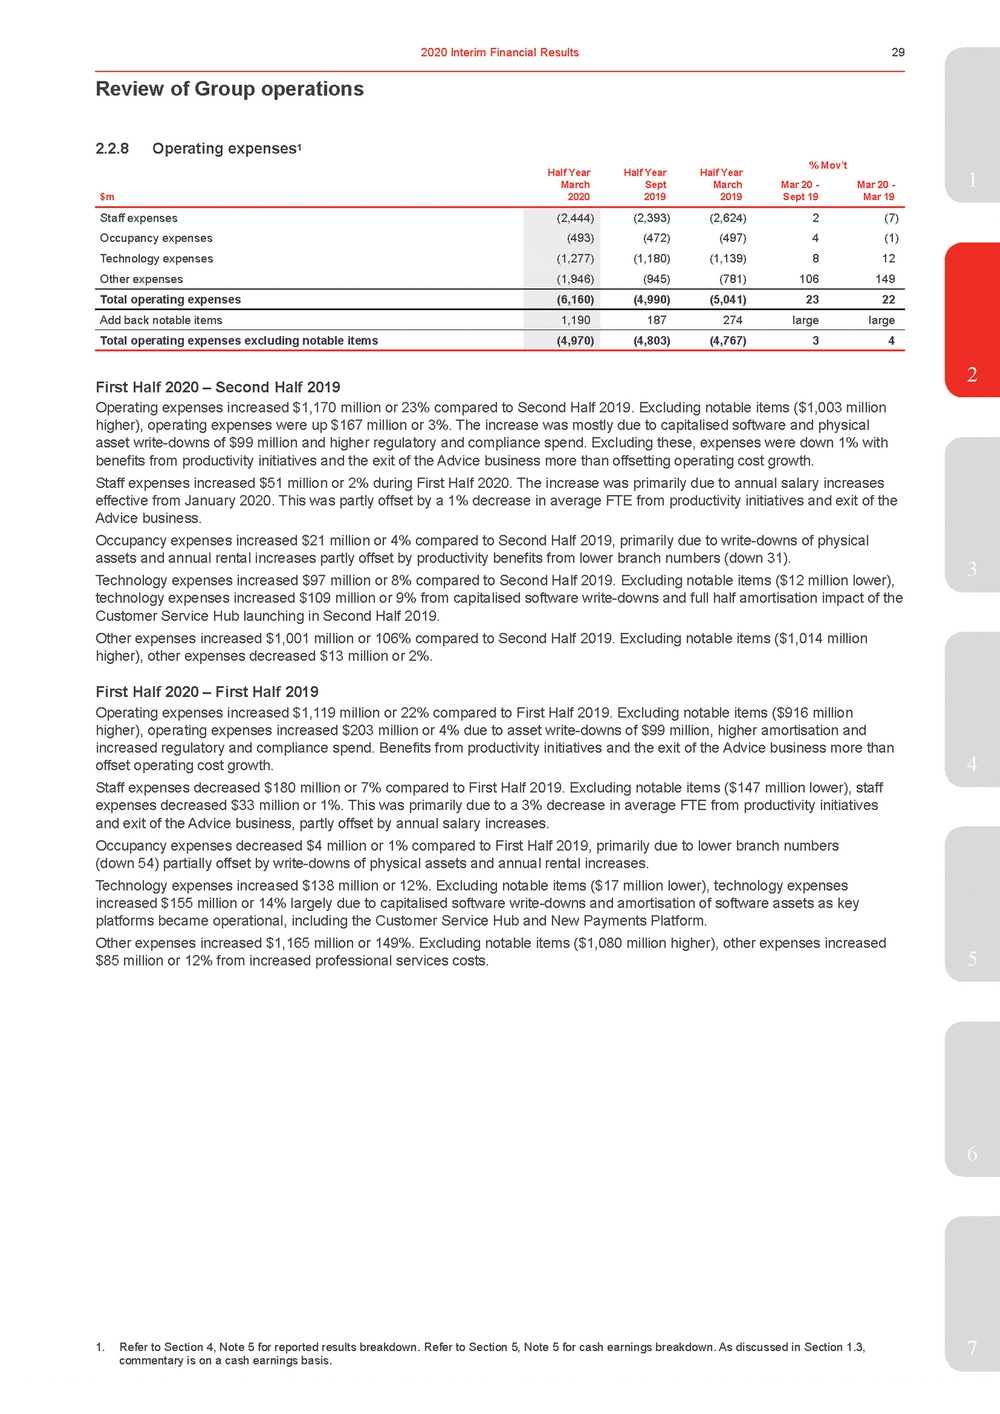 | Half YearHalf YearHalf Year % Mov’t 1 March $m2020 Sept 2019 March 2019 Mar 20 - Sept 19 Mar 20 - Mar 19 2 First Half 2020 – Second Half 2019 Operating expenses increased $1,170 million or 23% compared to Second Half 2019. Excluding notable items ($1,003 million higher), operating expenses were up $167 million or 3%. The increase was mostly due to capitalised software and physical asset write-downs of $99 million and higher regulatory and compliance spend. Excluding these, expenses were down 1% with benefits from productivity initiatives and the exit of the Advice business more than offsetting operating cost growth. Staff expenses increased $51 million or 2% during First Half 2020. The increase was primarily due to annual salary increases effective from January 2020. This was partly offset by a 1% decrease in average FTE from productivity initiatives and exit of the Advice business. Occupancy expenses increased $21 million or 4% compared to Second Half 2019, primarily due to write-downs of physical assets and annual rental increases partly offset by productivity benefits from lower branch numbers (down 31). 3 Technology expenses increased $97 million or 8% compared to Second Half 2019. Excluding notable items ($12 million lower), technology expenses increased $109 million or 9% from capitalised software write-downs and full half amortisation impact of the Customer Service Hub launching in Second Half 2019. Other expenses increased $1,001 million or 106% compared to Second Half 2019. Excluding notable items ($1,014 million higher), other expenses decreased $13 million or 2%. First Half 2020 – First Half 2019 Operating expenses increased $1,119 million or 22% compared to First Half 2019. Excluding notable items ($916 million higher), operating expenses increased $203 million or 4% due to asset write-downs of $99 million, higher amortisation and increased regulatory and compliance spend. Benefits from productivity initiatives and the exit of the Advice business more than offset operating cost growth.4 Staff expenses decreased $180 million or 7% compared to First Half 2019. Excluding notable items ($147 million lower), staff expenses decreased $33 million or 1%. This was primarily due to a 3% decrease in average FTE from productivity initiatives and exit of the Advice business, partly offset by annual salary increases. Occupancy expenses decreased $4 million or 1% compared to First Half 2019, primarily due to lower branch numbers (down 54) partially offset by write-downs of physical assets and annual rental increases. Technology expenses increased $138 million or 12%. Excluding notable items ($17 million lower), technology expenses increased $155 million or 14% largely due to capitalised software write-downs and amortisation of software assets as key platforms became operational, including the Customer Service Hub and New Payments Platform. Other expenses increased $1,165 million or 149%. Excluding notable items ($1,080 million higher), other expenses increased $85 million or 12% from increased professional services costs.5 6 1. Refer to Section 4, Note 5 for reported results breakdown. Refer to Section 5, Note 5 for cash earnings breakdown. As discussed in Section 1.3,7 commentary is on a cash earnings basis. |
 | Review of Group operations Full Time Equivalent (FTE) employees As atAs atAs at% Mov’t Number of FTE 31 March 2020 30 Sept 2019 31 March 2019 Mar 20 - Sept 19 Mar 20 - Mar 19 First Half 2020 – Second Half 2019 Spot FTE increased by 911 or 3% compared to Second Half 2019, mainly due to increased regulatory, risk, compliance and remediation personnel, increased customer activity and the decision to insource Customer Care capabilities from external partners, partially offset by productivity initiatives across the Group. First Half 2020 – First Half 2019 Spot FTE was slightly lower compared to First Half 2019, mainly due to productivity initiatives across the Group which more than offset increased regulatory, risk compliance and remediation personnel, increased customer activity and the decision to insource Customer Care capabilities from external partners. Investment spend Half YearHalf YearHalf Year% Mov’t March $m2020 Sept 2019 March 2019 Mar 20 - Sept 19 Mar 20 - Mar 19 The Group invested $728 million in First Half 2020, with 41% directed to growth and productivity initiatives, 46% to regulatory change, and 13% to other technology programs. The 7% decline in investment spend in First Half 2020 compared to Second Half 2019 is consistent with the normal pattern of annual investment and December annual leave where spending is typically lower in the first half of the year. Spending reflects the completion of some major projects early First Half 2020 partially offset by higher investment in regulatory and compliance frameworks (9% higher compared to Second Half 2019), particularly around financial crime. Compared to the prior corresponding period, investment spend was 1% higher, mainly due to higher regulatory change investment which was up 72%. Across major investment categories the following progress was achieved in First Half 2020: Regulatory Change •Enhanced financial crime risk management capability including system upgrades, automation of exception reporting, enhanced alert and case management capabilities and improved data quality and controls; •Updated systems and processes to meet new regulatory obligations including: The Banking Code of Practice, comprehensive credit reporting, open banking, Protecting Your Super legislation and APRA’s economics and financial statistics reporting; and •Delivered new and updated APRA Prudential Standards reporting (including APS221). 1. Averages are based on a six month period. |
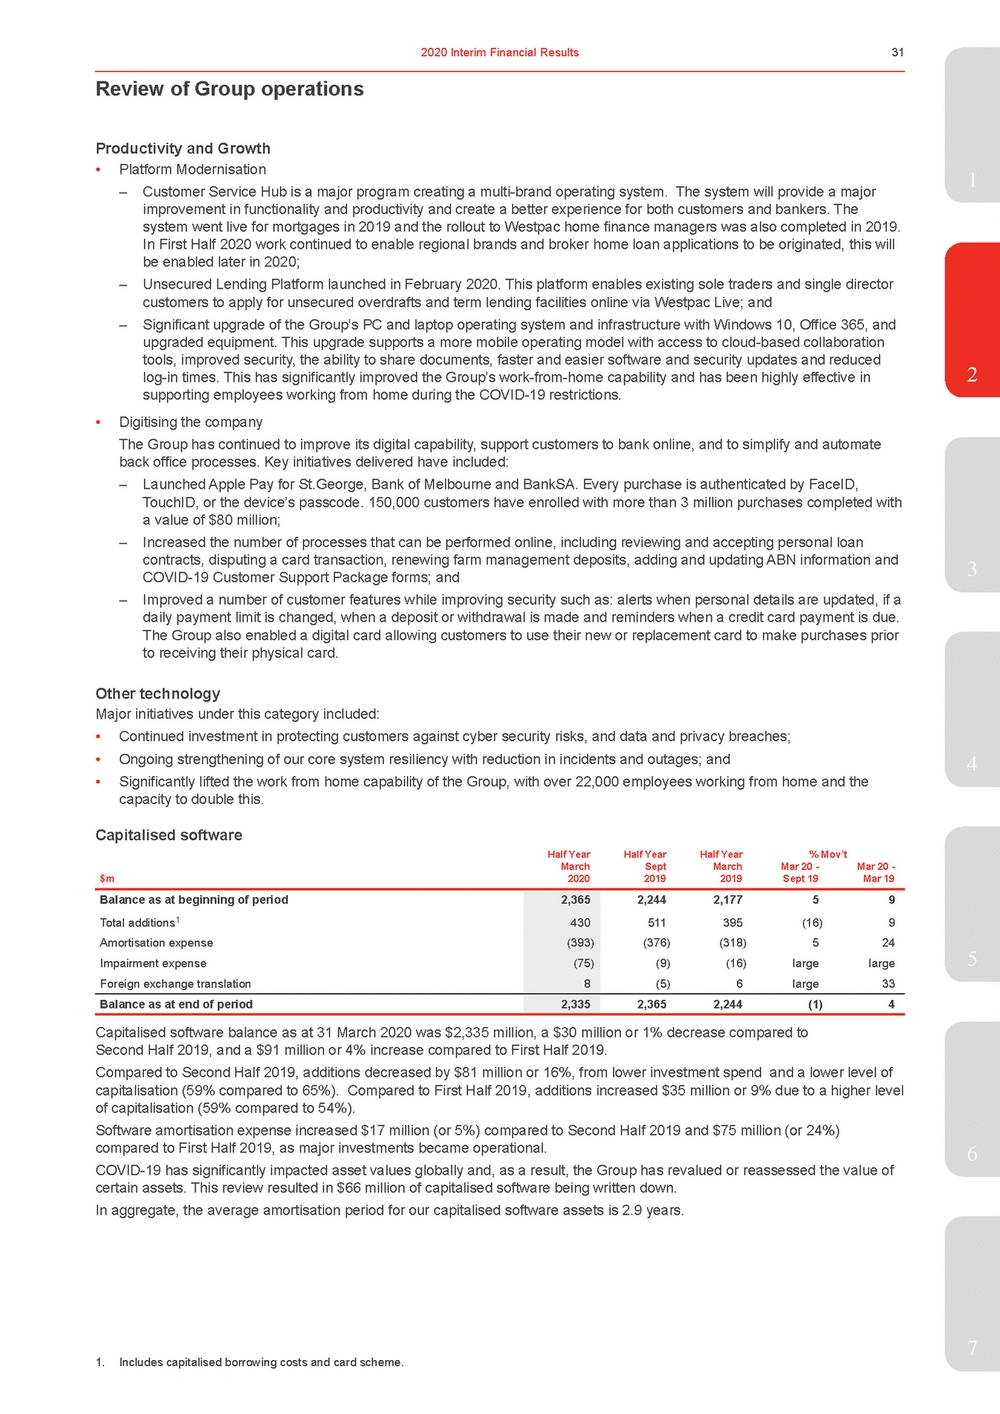 | •Platform Modernisation1 – Customer Service Hub is a major program creating a multi-brand operating system. The system will provide a major improvement in functionality and productivity and create a better experience for both customers and bankers. The system went live for mortgages in 2019 and the rollout to Westpac home finance managers was also completed in 2019. In First Half 2020 work continued to enable regional brands and broker home loan applications to be originated, this will be enabled later in 2020; – Unsecured Lending Platform launched in February 2020. This platform enables existing sole traders and single director customers to apply for unsecured overdrafts and term lending facilities online via Westpac Live; and – Significant upgrade of the Group’s PC and laptop operating system and infrastructure with Windows 10, Office 365, and upgraded equipment. This upgrade supports a more mobile operating model with access to cloud-based collaboration tools, improved security, the ability to share documents, faster and easier software and security updates and reduced log-in times. This has significantly improved the Group’s work-from-home capability and has been highly effective in2 supporting employees working from home during the COVID-19 restrictions. •Digitising the company The Group has continued to improve its digital capability, support customers to bank online, and to simplify and automate back office processes. Key initiatives delivered have included: – Launched Apple Pay for St.George, Bank of Melbourne and BankSA. Every purchase is authenticated by FaceID, TouchID, or the device’s passcode. 150,000 customers have enrolled with more than 3 million purchases completed with a value of $80 million; 3 – Improved a number of customer features while improving security such as: alerts when personal details are updated, if a daily payment limit is changed, when a deposit or withdrawal is made and reminders when a credit card payment is due. The Group also enabled a digital card allowing customers to use their new or replacement card to make purchases prior to receiving their physical card. Other technology Major initiatives under this category included: •Continued investment in protecting customers against cyber security risks, and data and privacy breaches; •Ongoing strengthening of our core system resiliency with reduction in incidents and outages; and4 •Significantly lifted the work from home capability of the Group, with over 22,000 employees working from home and the capacity to double this. Capitalised software Half YearHalf YearHalf Year% Mov’t March $m2020 Sept 2019 March 2019 Mar 20 - Sept 19 Mar 20 - Mar 19 Balance as at beginning of period Total additions1 Amortisation expense Impairment expense Foreign exchange translation 2,365 430 (393) (75) 8 2,2442,17759 511395(16)9 (376) (318)524 (9)(16)largelarge (5)6large33 Balance as at end of period 2,335 2,3652,244(1)4 Capitalised software balance as at 31 March 2020 was $2,335 million, a $30 million or 1% decrease compared to Second Half 2019, and a $91 million or 4% increase compared to First Half 2019. Compared to Second Half 2019, additions decreased by $81 million or 16%, from lower investment spend and a lower level of capitalisation (59% compared to 65%). Compared to First Half 2019, additions increased $35 million or 9% due to a higher level of capitalisation (59% compared to 54%). Software amortisation expense increased $17 million (or 5%) compared to Second Half 2019 and $75 million (or 24%) compared to First Half 2019, as major investments became operational.6 COVID-19 has significantly impacted asset values globally and, as a result, the Group has revalued or reassessed the value of certain assets. This review resulted in $66 million of capitalised software being written down. In aggregate, the average amortisation period for our capitalised software assets is 2.9 years. 7 1. Includes capitalised borrowing costs and card scheme. |
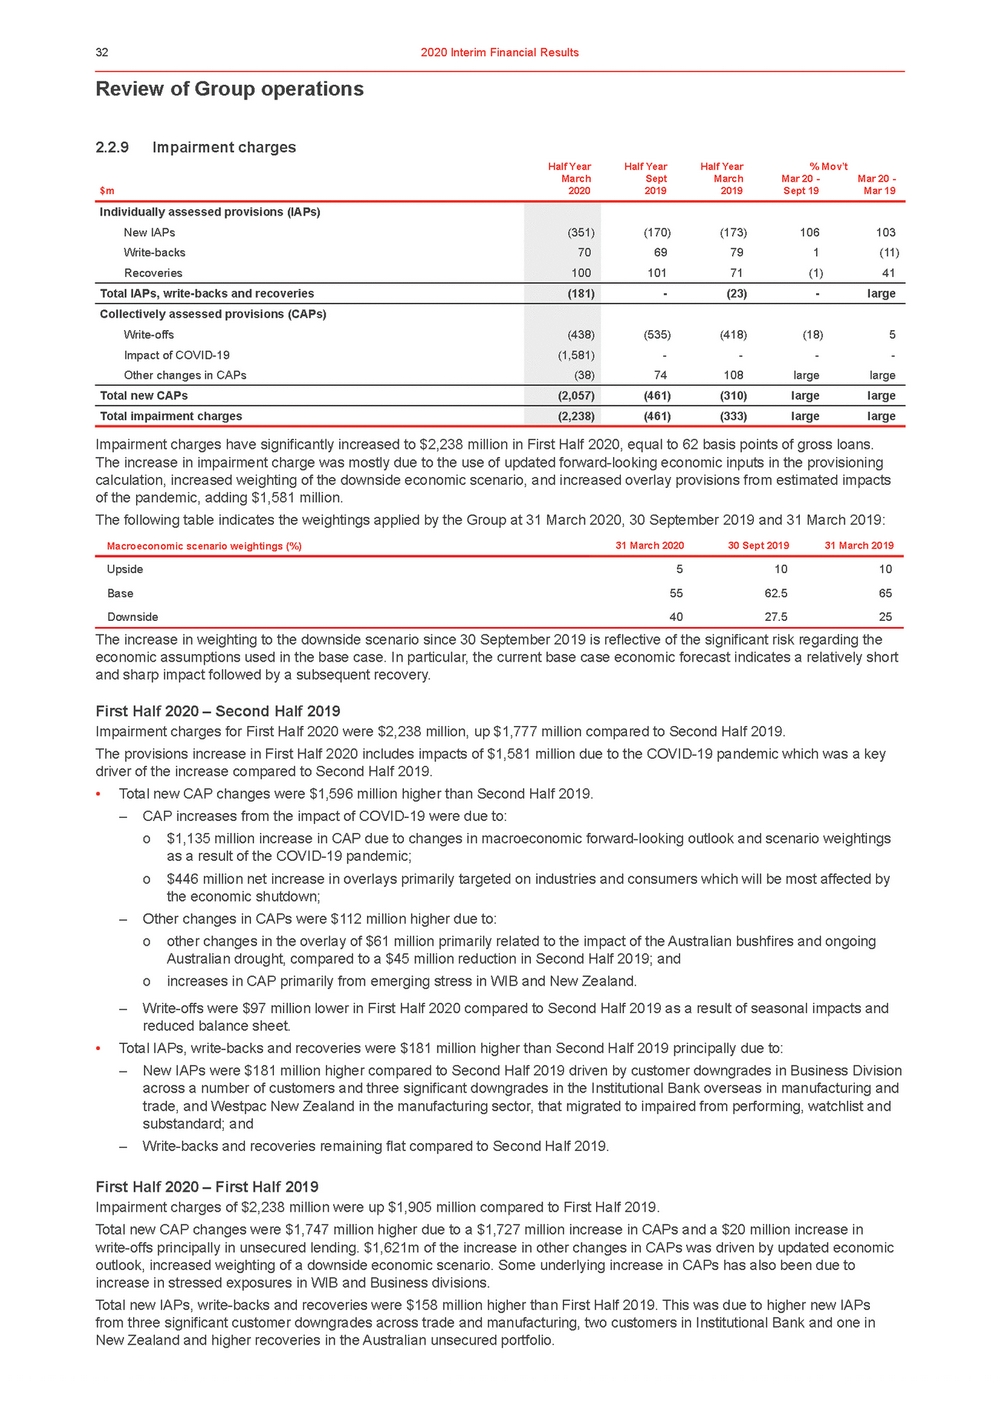 | 2.2.9 Impairment charges Half Year March Half Year Sept Half Year March % Mov’t Mar 20 - Mar 20 - $m 2020 2019 2019 Sept 19 Mar 19 Impairment charges have significantly increased to $2,238 million in First Half 2020, equal to 62 basis points of gross loans. The increase in impairment charge was mostly due to the use of updated forward-looking economic inputs in the provisioning calculation, increased weighting of the downside economic scenario, and increased overlay provisions from estimated impacts of the pandemic, adding $1,581 million. The following table indicates the weightings applied by the Group at 31 March 2020, 30 September 2019 and 31 March 2019: The increase in weighting to the downside scenario since 30 September 2019 is reflective of the significant risk regarding the economic assumptions used in the base case. In particular, the current base case economic forecast indicates a relatively short and sharp impact followed by a subsequent recovery. First Half 2020 – Second Half 2019 Impairment charges for First Half 2020 were $2,238 million, up $1,777 million compared to Second Half 2019. The provisions increase in First Half 2020 includes impacts of $1,581 million due to the COVID-19 pandemic which was a key driver of the increase compared to Second Half 2019. •Total new CAP changes were $1,596 million higher than Second Half 2019. – CAP increases from the impact of COVID-19 were due to: o $1,135 million increase in CAP due to changes in macroeconomic forward-looking outlook and scenario weightings as a result of the COVID-19 pandemic; o $446 million net increase in overlays primarily targeted on industries and consumers which will be most affected by the economic shutdown; – Other changes in CAPs were $112 million higher due to: o other changes in the overlay of $61 million primarily related to the impact of the Australian bushfires and ongoing Australian drought, compared to a $45 million reduction in Second Half 2019; and o increases in CAP primarily from emerging stress in WIB and New Zealand. – Write-offs were $97 million lower in First Half 2020 compared to Second Half 2019 as a result of seasonal impacts and reduced balance sheet. •Total IAPs, write-backs and recoveries were $181 million higher than Second Half 2019 principally due to: – New IAPs were $181 million higher compared to Second Half 2019 driven by customer downgrades in Business Division across a number of customers and three significant downgrades in the Institutional Bank overseas in manufacturing and trade, and Westpac New Zealand in the manufacturing sector, that migrated to impaired from performing, watchlist and substandard; and – Write-backs and recoveries remaining flat compared to Second Half 2019. First Half 2020 – First Half 2019 Impairment charges of $2,238 million were up $1,905 million compared to First Half 2019. Total new CAP changes were $1,747 million higher due to a $1,727 million increase in CAPs and a $20 million increase in write-offs principally in unsecured lending. $1,621m of the increase in other changes in CAPs was driven by updated economic outlook, increased weighting of a downside economic scenario. Some underlying increase in CAPs has also been due to increase in stressed exposures in WIB and Business divisions. Total new IAPs, write-backs and recoveries were $158 million higher than First Half 2019. This was due to higher new IAPs from three significant customer downgrades across trade and manufacturing, two customers in Institutional Bank and one in New Zealand and higher recoveries in the Australian unsecured portfolio. |
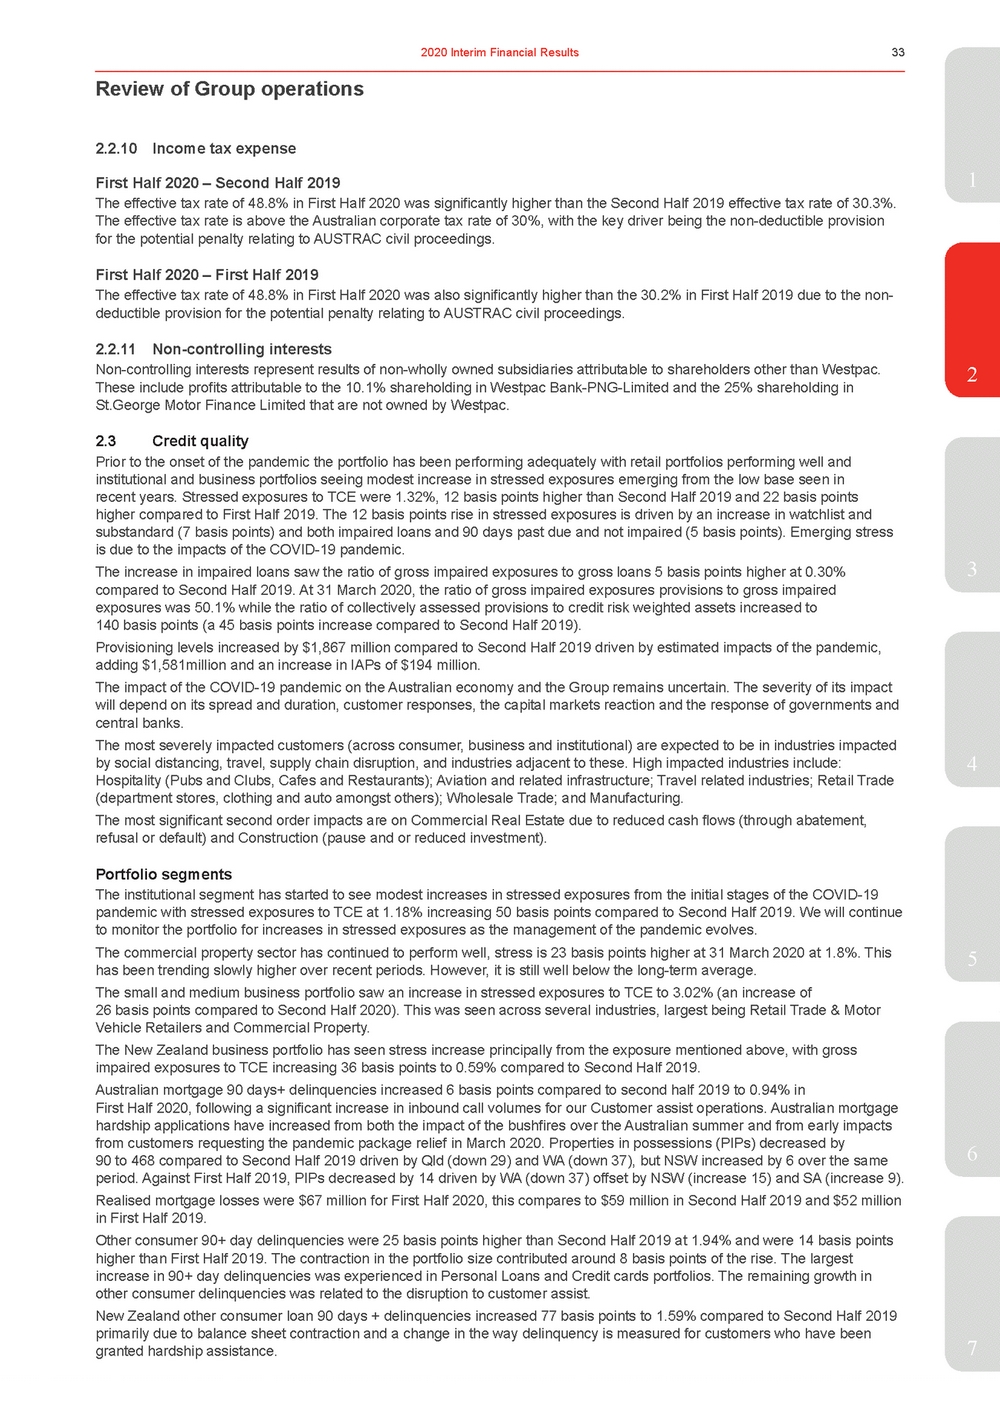 | First Half 2020 – Second Half 20191 The effective tax rate of 48.8% in First Half 2020 was significantly higher than the Second Half 2019 effective tax rate of 30.3%. The effective tax rate is above the Australian corporate tax rate of 30%, with the key driver being the non-deductible provision for the potential penalty relating to AUSTRAC civil proceedings. First Half 2020 – First Half 2019 The effective tax rate of 48.8% in First Half 2020 was also significantly higher than the 30.2% in First Half 2019 due to the non-deductible provision for the potential penalty relating to AUSTRAC civil proceedings. 2.2.11 Non-controlling interests Non-controlling interests represent results of non-wholly owned subsidiaries attributable to shareholders other than Westpac.2 These include profits attributable to the 10.1% shareholding in Westpac Bank-PNG-Limited and the 25% shareholding in St.George Motor Finance Limited that are not owned by Westpac. 2.3Credit quality Prior to the onset of the pandemic the portfolio has been performing adequately with retail portfolios performing well and institutional and business portfolios seeing modest increase in stressed exposures emerging from the low base seen in recent years. Stressed exposures to TCE were 1.32%, 12 basis points higher than Second Half 2019 and 22 basis points higher compared to First Half 2019. The 12 basis points rise in stressed exposures is driven by an increase in watchlist and substandard (7 basis points) and both impaired loans and 90 days past due and not impaired (5 basis points). Emerging stress is due to the impacts of the COVID-19 pandemic. The increase in impaired loans saw the ratio of gross impaired exposures to gross loans 5 basis points higher at 0.30%3 compared to Second Half 2019. At 31 March 2020, the ratio of gross impaired exposures provisions to gross impaired exposures was 50.1% while the ratio of collectively assessed provisions to credit risk weighted assets increased to 140 basis points (a 45 basis points increase compared to Second Half 2019). Provisioning levels increased by $1,867 million compared to Second Half 2019 driven by estimated impacts of the pandemic, adding $1,581million and an increase in IAPs of $194 million. The impact of the COVID-19 pandemic on the Australian economy and the Group remains uncertain. The severity of its impact will depend on its spread and duration, customer responses, the capital markets reaction and the response of governments and central banks. The most severely impacted customers (across consumer, business and institutional) are expected to be in industries impacted by social distancing, travel, supply chain disruption, and industries adjacent to these. High impacted industries include:4 Hospitality (Pubs and Clubs, Cafes and Restaurants); Aviation and related infrastructure; Travel related industries; Retail Trade (department stores, clothing and auto amongst others); Wholesale Trade; and Manufacturing. The most significant second order impacts are on Commercial Real Estate due to reduced cash flows (through abatement, refusal or default) and Construction (pause and or reduced investment). Portfolio segments The institutional segment has started to see modest increases in stressed exposures from the initial stages of the COVID-19 pandemic with stressed exposures to TCE at 1.18% increasing 50 basis points compared to Second Half 2019. We will continue to monitor the portfolio for increases in stressed exposures as the management of the pandemic evolves. The commercial property sector has continued to perform well, stress is 23 basis points higher at 31 March 2020 at 1.8%. This5 has been trending slowly higher over recent periods. However, it is still well below the long-term average. The small and medium business portfolio saw an increase in stressed exposures to TCE to 3.02% (an increase of 26 basis points compared to Second Half 2020). This was seen across several industries, largest being Retail Trade & Motor Vehicle Retailers and Commercial Property. The New Zealand business portfolio has seen stress increase principally from the exposure mentioned above, with gross impaired exposures to TCE increasing 36 basis points to 0.59% compared to Second Half 2019. Australian mortgage 90 days+ delinquencies increased 6 basis points compared to second half 2019 to 0.94% in 6 90 to 468 compared to Second Half 2019 driven by Qld (down 29) and WA (down 37), but NSW increased by 6 over the same period. Against First Half 2019, PIPs decreased by 14 driven by WA (down 37) offset by NSW (increase 15) and SA (increase 9). Realised mortgage losses were $67 million for First Half 2020, this compares to $59 million in Second Half 2019 and $52 million in First Half 2019. Other consumer 90+ day delinquencies were 25 basis points higher than Second Half 2019 at 1.94% and were 14 basis points higher than First Half 2019. The contraction in the portfolio size contributed around 8 basis points of the rise. The largest increase in 90+ day delinquencies was experienced in Personal Loans and Credit cards portfolios. The remaining growth in other consumer delinquencies was related to the disruption to customer assist. New Zealand other consumer loan 90 days + delinquencies increased 77 basis points to 1.59% compared to Second Half 2019 primarily due to balance sheet contraction and a change in the way delinquency is measured for customers who have been granted hardship assistance.7 |
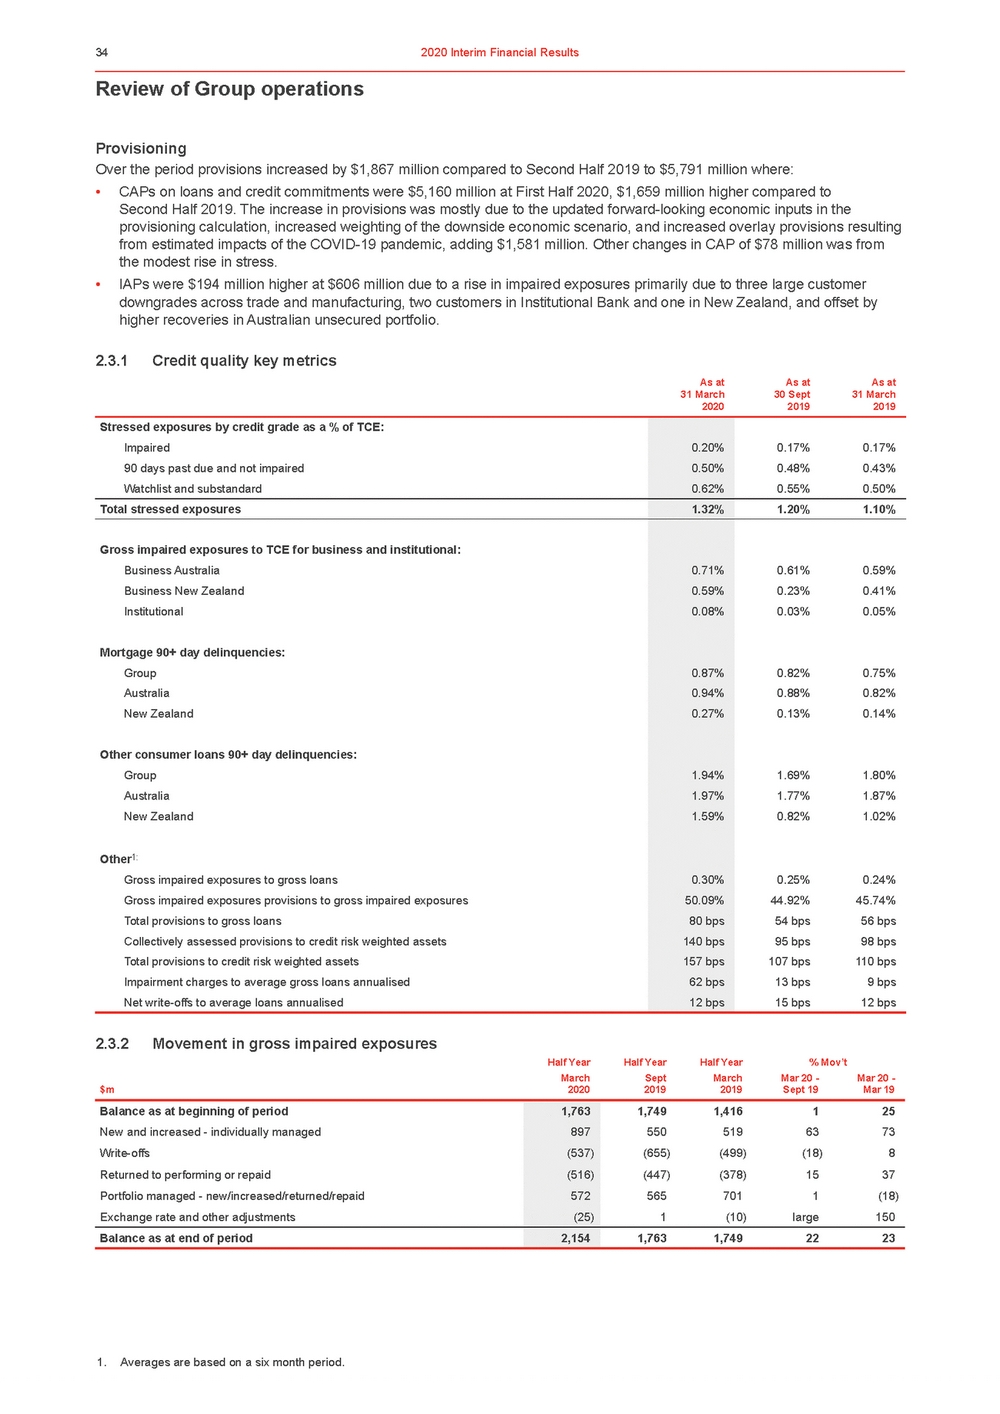 | Review of Group operations Provisioning Over the period provisions increased by $1,867 million compared to Second Half 2019 to $5,791 million where: •CAPs on loans and credit commitments were $5,160 million at First Half 2020, $1,659 million higher compared to Second Half 2019. The increase in provisions was mostly due to the updated forward-looking economic inputs in the provisioning calculation, increased weighting of the downside economic scenario, and increased overlay provisions resulting from estimated impacts of the COVID-19 pandemic, adding $1,581 million. Other changes in CAP of $78 million was from the modest rise in stress. •IAPs were $194 million higher at $606 million due to a rise in impaired exposures primarily due to three large customer downgrades across trade and manufacturing, two customers in Institutional Bank and one in New Zealand, and offset by higher recoveries in Australian unsecured portfolio. 2.3.1Credit quality key metrics As atAs atAs at 31 March 2020 30 Sept 2019 31 March 2019 2.3.2 Movement in gross impaired exposures Half Year Half Year Half Year % Mov’t $m March 2020 Sept 2019 March 2019 Mar 20 - Sept 19 Mar 20 - Mar 19 1. Averages are based on a six month period. |
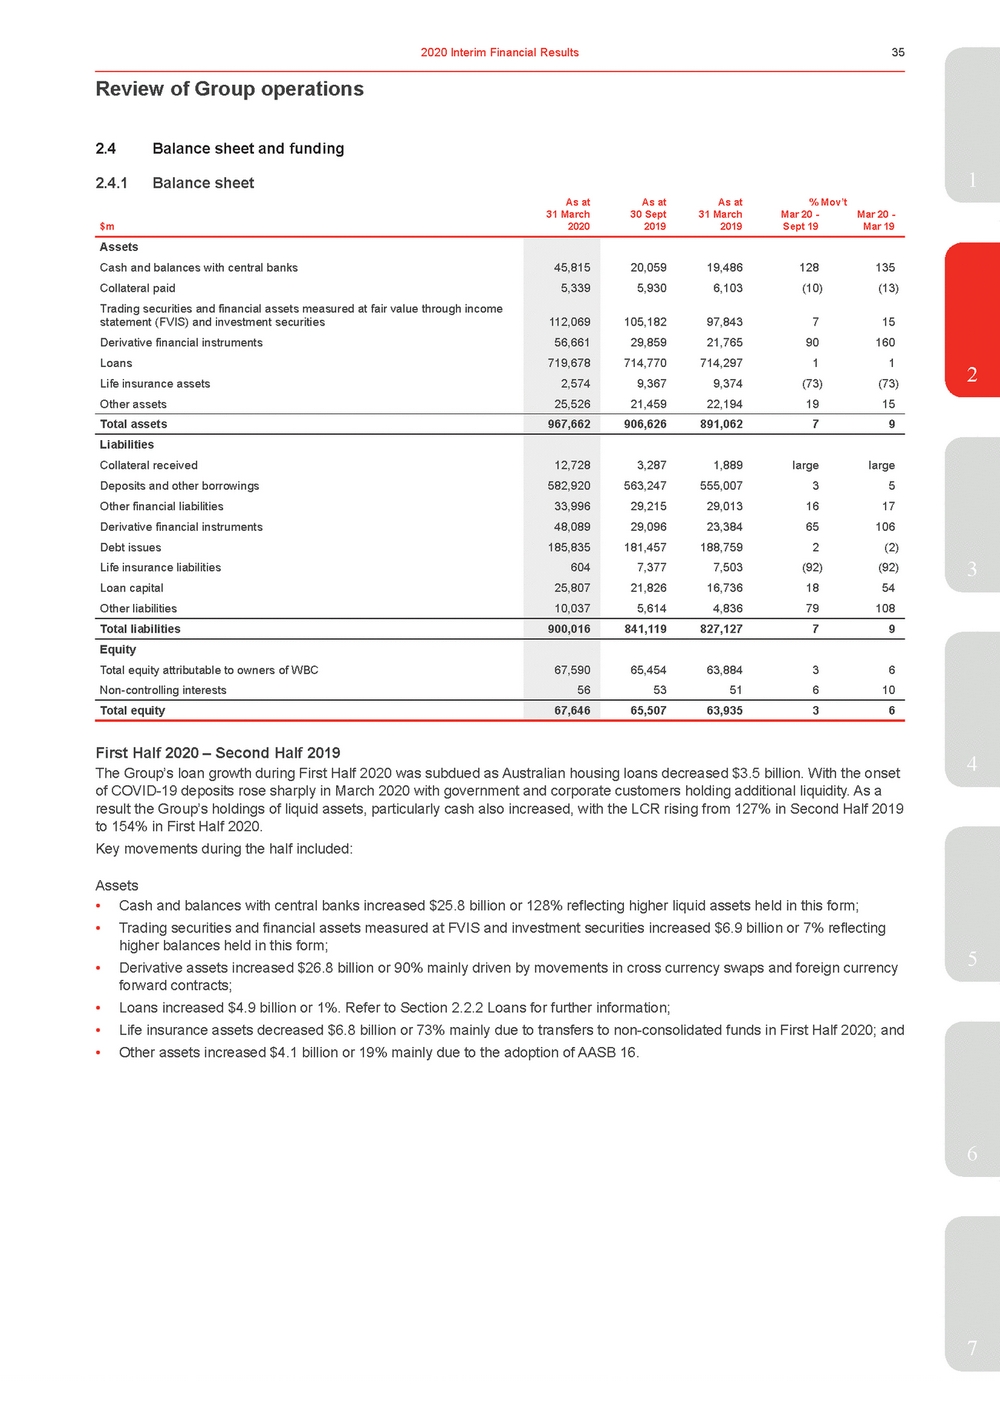 | 2.4.1Balance sheet 1 As atAs atAs at% Mov’t 31 March $m2020 30 Sept 2019 31 March 2019 Mar 20 - Sept 19 Mar 20 - Mar 19 Assets Cash and balances with central banks Collateral paid Trading securities and financial assets measured at fair value through income statement (FVIS) and investment securities Derivative financial instruments Loans Life insurance assets Other assets 45,815 5,339 112,069 56,661 719,678 2,574 25,526 20,05919,486128135 5,9306,103(10)(13) 105,18297,843715 29,85921,76590160 714,770714,29711 9,3679,374(73)(73) 21,45922,1941915 Total assets 967,662 906,626891,06279 Liabilities Collateral received Deposits and other borrowings Other financial liabilities Derivative financial instruments Debt issues Life insurance liabilities Loan capital Other liabilities 12,728 582,920 33,996 48,089 185,835 604 25,807 10,037 3,2871,889largelarge 563,247555,00735 29,21529,0131617 29,09623,38465106 181,457188,7592(2) 7,3777,503(92)(92) 21,82616,7361854 5,6144,83679108 Total liabilities 900,016 841,119827,12779 Equity Total equity attributable to owners of WBC Non-controlling interests 67,590 56 65,45463,88436 5351610 Total equity 67,646 65,50763,93536 3 4 The Group’s loan growth during First Half 2020 was subdued as Australian housing loans decreased $3.5 billion. With the onset of COVID-19 deposits rose sharply in March 2020 with government and corporate customers holding additional liquidity. As a result the Group’s holdings of liquid assets, particularly cash also increased, with the LCR rising from 127% in Second Half 2019 to 154% in First Half 2020. Key movements during the half included: Assets •Cash and balances with central banks increased $25.8 billion or 128% reflecting higher liquid assets held in this form; •Trading securities and financial assets measured at FVIS and investment securities increased $6.9 billion or 7% reflecting higher balances held in this form; •Derivative assets increased $26.8 billion or 90% mainly driven by movements in cross currency swaps and foreign currency5 forward contracts; •Loans increased $4.9 billion or 1%. Refer to Section 2.2.2 Loans for further information; •Life insurance assets decreased $6.8 billion or 73% mainly due to transfers to non-consolidated funds in First Half 2020; and •Other assets increased $4.1 billion or 19% mainly due to the adoption of AASB 16. 6 7 |
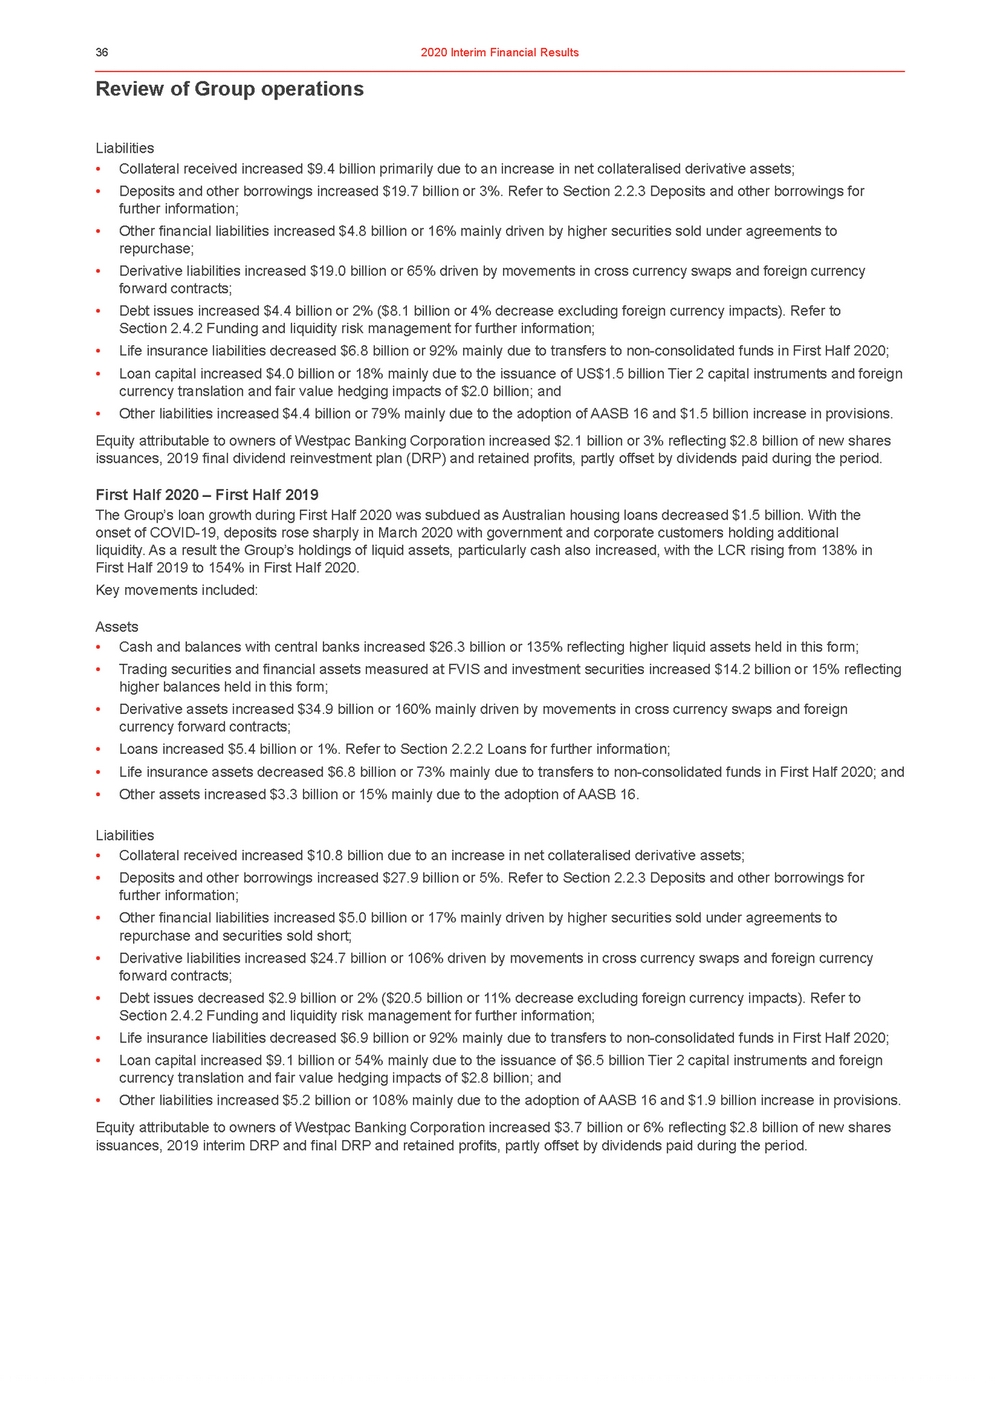 | Review of Group operations Liabilities •Collateral received increased $9.4 billion primarily due to an increase in net collateralised derivative assets; •Deposits and other borrowings increased $19.7 billion or 3%. Refer to Section 2.2.3 Deposits and other borrowings for further information; •Other financial liabilities increased $4.8 billion or 16% mainly driven by higher securities sold under agreements to repurchase; •Derivative liabilities increased $19.0 billion or 65% driven by movements in cross currency swaps and foreign currency forward contracts; •Debt issues increased $4.4 billion or 2% ($8.1 billion or 4% decrease excluding foreign currency impacts). Refer to Section 2.4.2 Funding and liquidity risk management for further information; •Life insurance liabilities decreased $6.8 billion or 92% mainly due to transfers to non-consolidated funds in First Half 2020; •Loan capital increased $4.0 billion or 18% mainly due to the issuance of US$1.5 billion Tier 2 capital instruments and foreign currency translation and fair value hedging impacts of $2.0 billion; and •Other liabilities increased $4.4 billion or 79% mainly due to the adoption of AASB 16 and $1.5 billion increase in provisions. Equity attributable to owners of Westpac Banking Corporation increased $2.1 billion or 3% reflecting $2.8 billion of new shares issuances, 2019 final dividend reinvestment plan (DRP) and retained profits, partly offset by dividends paid during the period. First Half 2020 – First Half 2019 The Group’s loan growth during First Half 2020 was subdued as Australian housing loans decreased $1.5 billion. With the onset of COVID-19, deposits rose sharply in March 2020 with government and corporate customers holding additional liquidity. As a result the Group’s holdings of liquid assets, particularly cash also increased, with the LCR rising from 138% in First Half 2019 to 154% in First Half 2020. Key movements included: Assets •Cash and balances with central banks increased $26.3 billion or 135% reflecting higher liquid assets held in this form; •Trading securities and financial assets measured at FVIS and investment securities increased $14.2 billion or 15% reflecting higher balances held in this form; •Derivative assets increased $34.9 billion or 160% mainly driven by movements in cross currency swaps and foreign currency forward contracts; •Loans increased $5.4 billion or 1%. Refer to Section 2.2.2 Loans for further information; •Life insurance assets decreased $6.8 billion or 73% mainly due to transfers to non-consolidated funds in First Half 2020; and •Other assets increased $3.3 billion or 15% mainly due to the adoption of AASB 16. Liabilities •Collateral received increased $10.8 billion due to an increase in net collateralised derivative assets; •Deposits and other borrowings increased $27.9 billion or 5%. Refer to Section 2.2.3 Deposits and other borrowings for further information; •Other financial liabilities increased $5.0 billion or 17% mainly driven by higher securities sold under agreements to repurchase and securities sold short; •Derivative liabilities increased $24.7 billion or 106% driven by movements in cross currency swaps and foreign currency forward contracts; •Debt issues decreased $2.9 billion or 2% ($20.5 billion or 11% decrease excluding foreign currency impacts). Refer to Section 2.4.2 Funding and liquidity risk management for further information; •Life insurance liabilities decreased $6.9 billion or 92% mainly due to transfers to non-consolidated funds in First Half 2020; •Loan capital increased $9.1 billion or 54% mainly due to the issuance of $6.5 billion Tier 2 capital instruments and foreign currency translation and fair value hedging impacts of $2.8 billion; and •Other liabilities increased $5.2 billion or 108% mainly due to the adoption of AASB 16 and $1.9 billion increase in provisions. Equity attributable to owners of Westpac Banking Corporation increased $3.7 billion or 6% reflecting $2.8 billion of new shares issuances, 2019 interim DRP and final DRP and retained profits, partly offset by dividends paid during the period. |
 | 1 risk is inherent for all banks as intermediaries between depositors and borrowers. The Group has a liquidity risk management framework which seeks to meet cash flow obligations under a wide range of market conditions, including name specific and market-wide stress scenarios, as well as meeting the regulatory requirements of the LCR and NSFR. The challenges presented by COVID-19 to the global economy since January 2020 have highlighted the speed and extent to which financial markets can become dislocated and the critical importance of banks maintaining sufficient liquidity at all times. We believe the Group is well positioned for these challenges, having maintained funding and liquidity metrics comfortably above regulatory minimums before the crisis. At 31 March 2020, the Group’s LCR was 154% and its NSFR was 117% compared to regulatory minimums of 100% for both. On 19 March 2020, the Reserve Bank announced extensive measures aimed at providing liquidity to financial markets and to support the banks in providing credit to businesses. As well as lowering the cash rate, these measures included injecting extra liquidity into the financial system through daily market operations, the purchasing of Australian Government2 bonds in the secondary market, increasing the interest rate on Exchange Settlement Balances, and the introduction of the Term Funding Facility (TFF). The primary purpose of the TFF is to support lending to Australian businesses. In aggregate, ADIs have access to at least $90 billion under the TFF, comprised of an Initial Allowance for each ADI, plus an Additional Allowance. Based on the terms of the facility, Westpac’s Initial Allowance is $17.9 billion and can be drawn down until 30 September 2020. The Additional Allowance is based on the growth in lending provided by the ADI to both large businesses and SMEs from the quarter ending 31 January 2020 to the quarter ending 31 January 2021 and can be drawn down until 31 March 2021. Funding is provided to ADIs through the TFF at a fixed interest rate of 25 basis points, for a maximum of three years. To access the TFF, ADIs must pledge eligible collateral, which includes self-securitised residential mortgage-backed securities. Under the regulatory approach to the TFF, the Initial Allowance and Additional Allowance may be included in the calculation of3 the LCR and NSFR to the extent an ADI has sufficient unencumbered collateral. Westpac has included the full amount of its Initial Allowance in the LCR and NSFR calculations for 31 March 2020. Liquidity The Group has a number of sources of liquidity that provide a buffer against periods of liquidity stress. These include High Quality Liquid Assets (HQLA) and the Committed Liquidity Facility (CLF), both of which are used to meet the Group’s LCR requirements. The Group also has access to non-HQLA and other assets that are eligible for re-purchase with a central bank under certain conditions. •At 31 March 2020, Westpac held $121.0 billion in HQLA (30 September 2019: $89.9 billion). HQLA include cash, deposits with central banks, government securities and other high quality securities that are repo-eligible with the RBA. The HQLA portfolio is managed within the Group’s risk appetite and within regulatory requirements.4 •Westpac’s CLF allocation for the 2020 calendar year, as approved by APRA, is $52 billion (2019 calendar year: $54 billion). The CLF is a commitment by the RBA to provide funds secured by high-quality collateral through a period of liquidity stress. This commitment can be counted by ADIs towards meeting the LCR requirement given the limited amount of government debt in Australia. In order to have access to a CLF, ADIs must satisfy qualifying conditions and are required to pay a fee to the RBA on the approved undrawn facility. The fee was increase by the RBA on 1 January 2020 to 17 basis points (from 15 basis points) and will increase to 20 basis points on 1 January 2021. •The Group also holds a portfolio of non-HQLA liquid assets that are repo-eligible with the Reserve Bank of Australia. These include private securities and self-originated AAA-rated mortgage backed securities. The Group’s total unencumbered liquid assets were $199.9 billion as at 31 March 2020 (30 September 2019: $169.9 billion). 5 LCR The LCR enhances banks’ short-term resilience, requiring them to hold sufficient HQLA, as defined, to withstand 30 days under a regulator-defined acute stress scenario. In addition to HQLA, Australian ADIs including Westpac also have access to the CLF, as set out above, to meet the requirements of the LCR. Westpac’s LCR for 31 March 2020 calculated on a spot basis was 154% (30 September 2019: 127%). The inclusion of Westpac’s allowance of the TFF added 14 percentage points to the ratio. Other movements in the Group’s LCR reflect an increase in HQLA by $31.1 billion over the half, while net cash outflows (NCOs) increased by $10.2 billion. NSFR The NSFR is designed to encourage banks’ longer-term funding resilience. To comply, banks are required to maintain an NSFR6 of at least 100% at all times. Westpac had an NSFR of 117% at 31 March 2020 (30 September 2019: 112%). The inclusion of Westpac’s allowance of the TFF added 2 percentage points to the ratio. Other movements in the Group’s NSFR over the half mainly reflect a $21 billion increase in available stable funding, due to deposits (up $9 billion), wholesale funding (up $9 billion) and other (up $3 billion). Required stable funding increased by $2 billion excluding the impact of the TFF. Funding The Group monitors the composition and stability of its funding so that it remains within the Group’s funding risk appetite. This includes compliance with both the LCR and NSFR. The composition of the Group’s funding mix was little changed over the half. 7 |
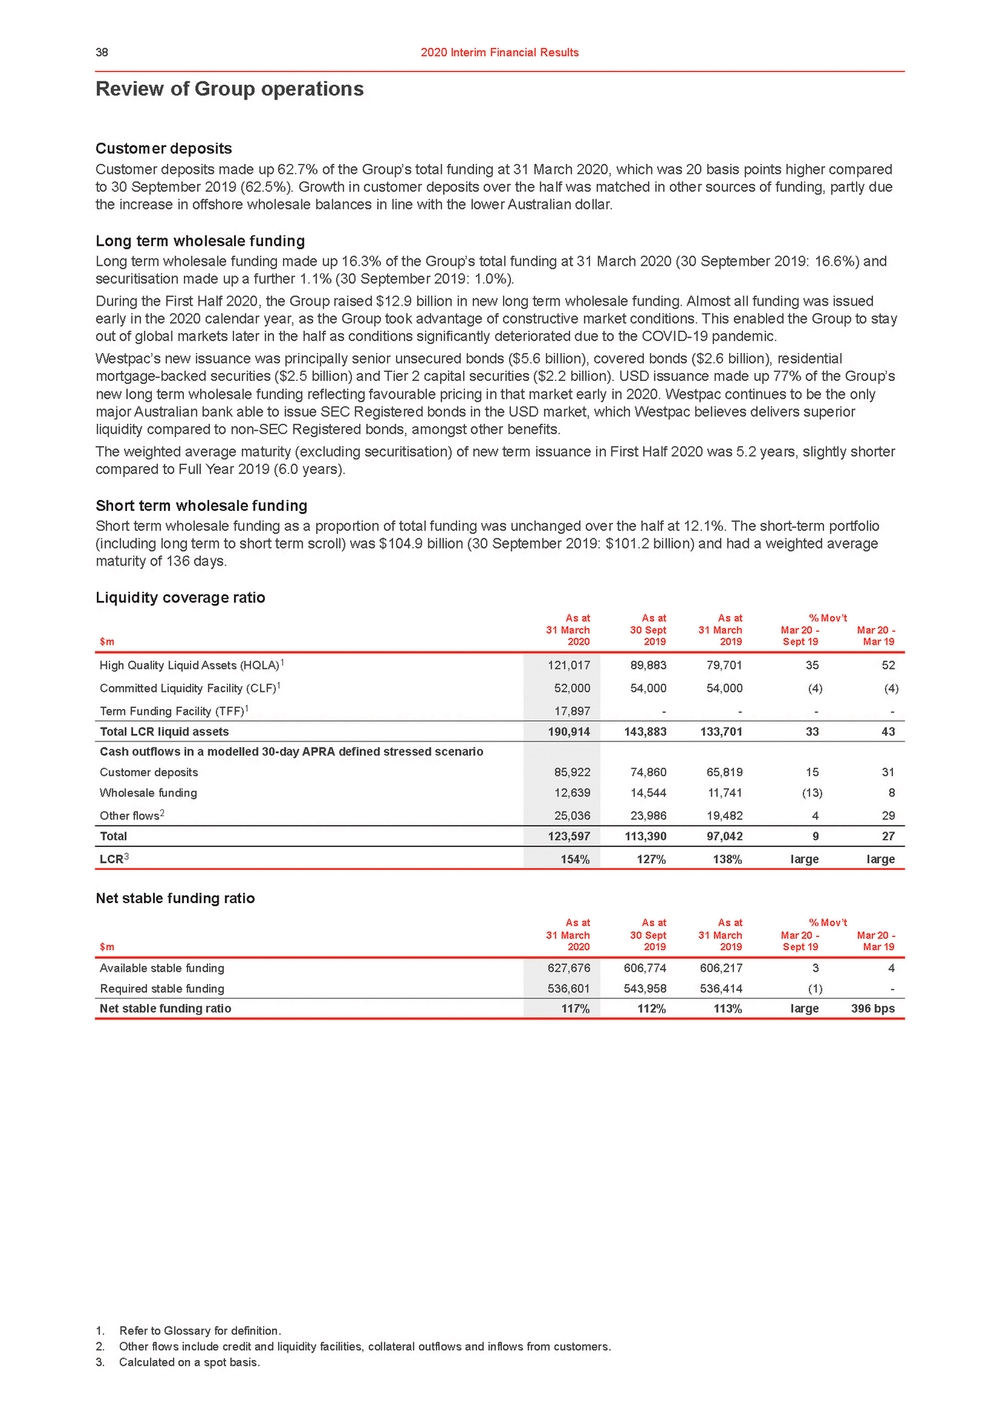 | Review of Group operations Customer deposits Customer deposits made up 62.7% of the Group’s total funding at 31 March 2020, which was 20 basis points higher compared to 30 September 2019 (62.5%). Growth in customer deposits over the half was matched in other sources of funding, partly due the increase in offshore wholesale balances in line with the lower Australian dollar. Long term wholesale funding Long term wholesale funding made up 16.3% of the Group’s total funding at 31 March 2020 (30 September 2019: 16.6%) and securitisation made up a further 1.1% (30 September 2019: 1.0%). During the First Half 2020, the Group raised $12.9 billion in new long term wholesale funding. Almost all funding was issued early in the 2020 calendar year, as the Group took advantage of constructive market conditions. This enabled the Group to stay out of global markets later in the half as conditions significantly deteriorated due to the COVID-19 pandemic. Westpac’s new issuance was principally senior unsecured bonds ($5.6 billion), covered bonds ($2.6 billion), residential mortgage-backed securities ($2.5 billion) and Tier 2 capital securities ($2.2 billion). USD issuance made up 77% of the Group’s new long term wholesale funding reflecting favourable pricing in that market early in 2020. Westpac continues to be the only major Australian bank able to issue SEC Registered bonds in the USD market, which Westpac believes delivers superior liquidity compared to non-SEC Registered bonds, amongst other benefits. The weighted average maturity (excluding securitisation) of new term issuance in First Half 2020 was 5.2 years, slightly shorter compared to Full Year 2019 (6.0 years). Short term wholesale funding Short term wholesale funding as a proportion of total funding was unchanged over the half at 12.1%. The short-term portfolio (including long term to short term scroll) was $104.9 billion (30 September 2019: $101.2 billion) and had a weighted average maturity of 136 days. Liquidity coverage ratio As atAs atAs at% Mov’t 31 March $m2020 30 Sept 2019 31 March 2019 Mar 20 - Sept 19 Mar 20 - Mar 19 Net stable funding ratio As atAs atAs at% Mov’t 31 March $m2020 30 Sept 2019 31 March 2019 Mar 20 - Sept 19 Mar 20 - Mar 19 1. Refer to Glossary for definition. 2. Other flows include credit and liquidity facilities, collateral outflows and inflows from customers. 3. Calculated on a spot basis. |
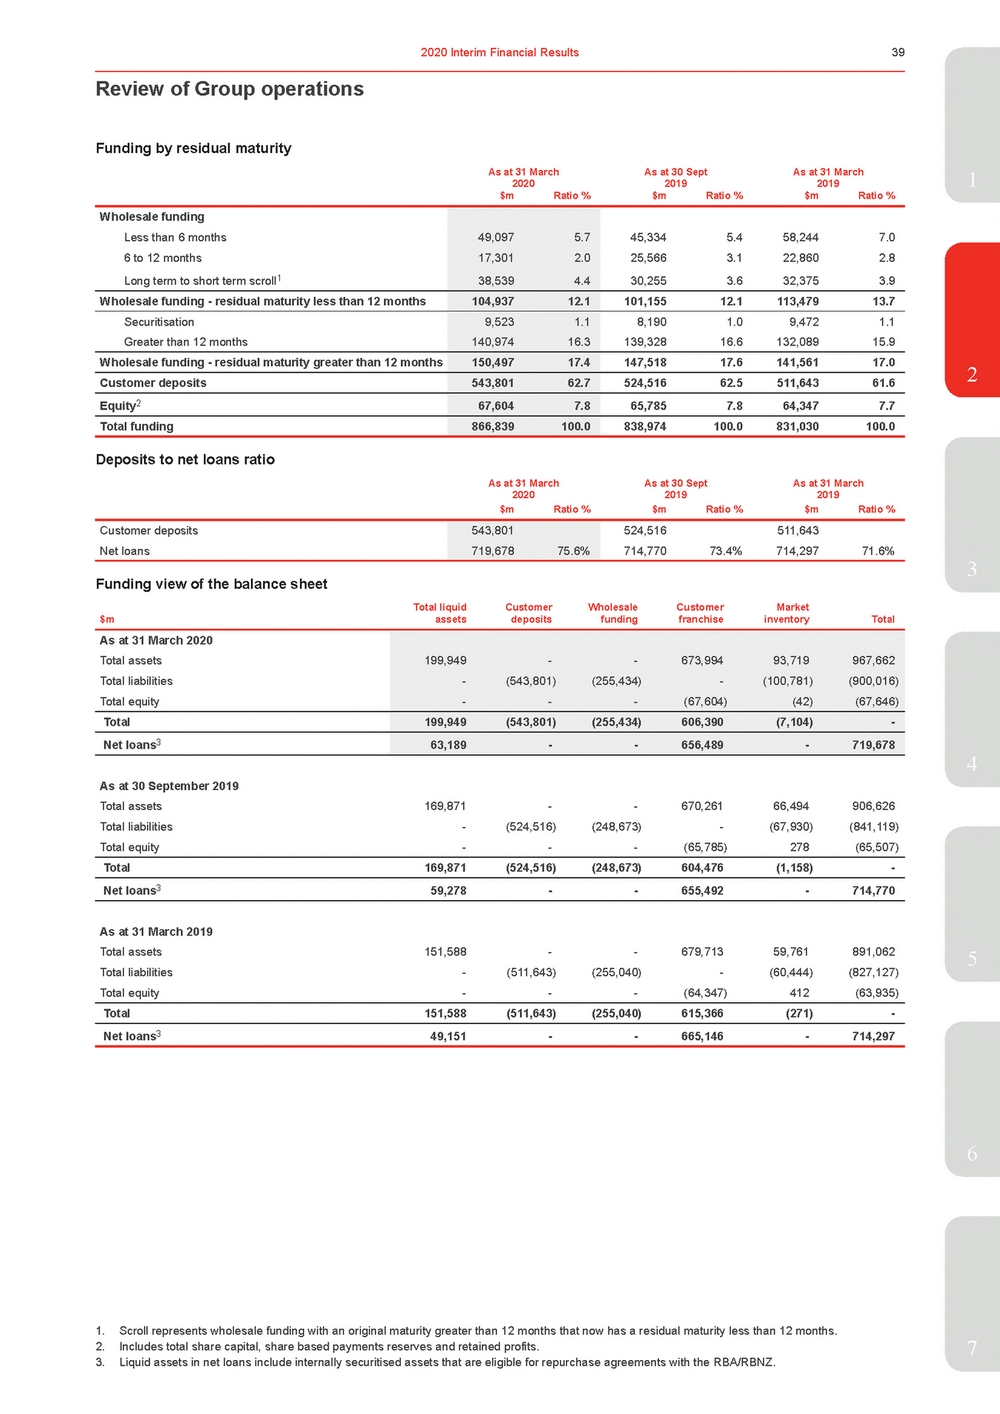 | Wholesale funding Less than 6 months 6 to 12 months Long term to short term scroll1 49,0975.7 17,3012.0 38,5394.4 45,3345.458,2447.0 25,5663.122,8602.8 30,2553.632,3753.9 Wholesale funding - residual maturity less than 12 months 104,93712.1 101,15512.1113,47913.7 Securitisation Greater than 12 months 9,5231.1 140,97416.3 8,1901.09,4721.1 139,32816.6132,08915.9 Wholesale funding - residual maturity greater than 12 months 150,49717.4 147,51817.6141,56117.0 Customer deposits 543,80162.7 524,51662.5511,64361.6 Equity2 67,6047.8 65,7857.864,3477.7 Total funding 866,839100.0 838,974100.0831,030100.0 Deposits to net loans ratio As at 31 March 2020 As at 30 Sept 2019 As at 31 March 2019 $mRatio %$mRatio %$mRatio % Customer deposits543,801524,516511,643 Net loans719,67875.6%714,77073.4%714,29771.6% Funding view of the balance sheet $m Total liquid assets Customer deposits Wholesale funding Customer franchise Market inventory Total As at 30 September 2019 Total assets 169,871 - - 670,261 66,494 906,626 Total liabilities - (524,516) (248,673) - (67,930) (841,119) Total equity - - - (65,785) 278 (65,507) Total 169,871 (524,516) (248,673) 604,476 (1,158) - Net loans3 59,278 - - 655,492 - 714,770 As at 31 March 2019 Total assets 151,588 - - 679,713 59,761 891,062 Total liabilities - (511,643) (255,040) - (60,444) (827,127) Total equity - - - (64,347) 412 (63,935) Total 151,588 (511,643) (255,040) 615,366 (271) - Net loans3 49,151 - - 665,146 - 714,297 5 6 1. Scroll represents wholesale funding with an original maturity greater than 12 months that now has a residual maturity less than 12 months. 2. Includes total share capital, share based payments reserves and retained profits.7 3. Liquid assets in net loans include internally securitised assets that are eligible for repurchase agreements with the RBA/RBNZ. |
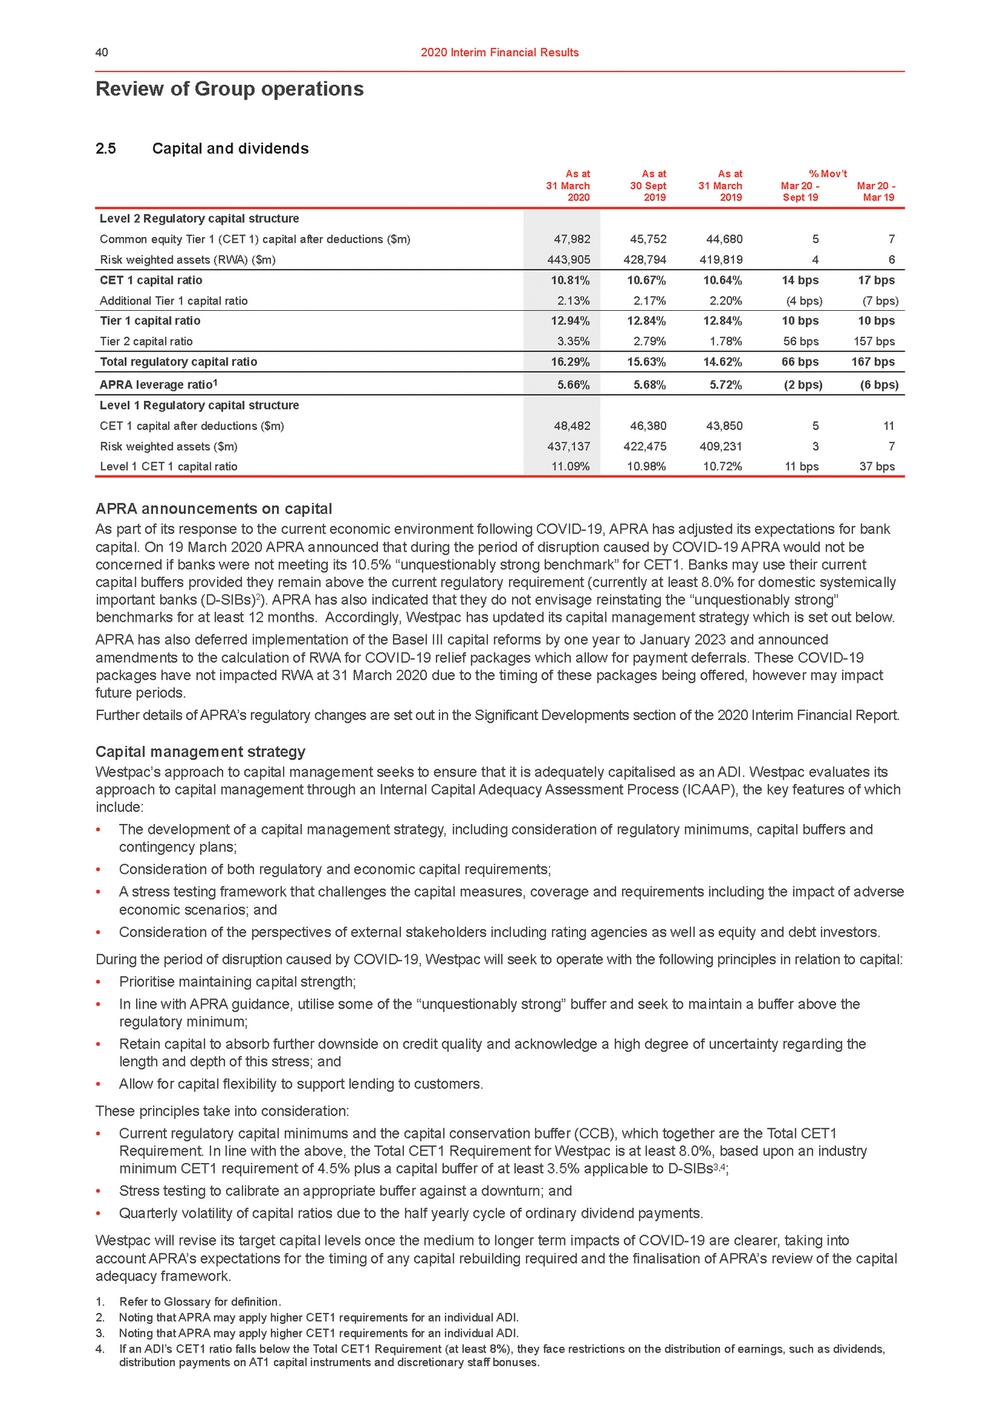 | 2.5 Capital and dividends As at 31 March As at 30 Sept As at 31 March % Mov’t Mar 20 - Mar 20 - 2020 2019 2019 Sept 19 Mar 19 APRA announcements on capital As part of its response to the current economic environment following COVID-19, APRA has adjusted its expectations for bank capital. On 19 March 2020 APRA announced that during the period of disruption caused by COVID-19 APRA would not be concerned if banks were not meeting its 10.5% “unquestionably strong benchmark” for CET1. Banks may use their current capital buffers provided they remain above the current regulatory requirement (currently at least 8.0% for domestic systemically important banks (D-SIBs)2). APRA has also indicated that they do not envisage reinstating the “unquestionably strong” benchmarks for at least 12 months. Accordingly, Westpac has updated its capital management strategy which is set out below. APRA has also deferred implementation of the Basel III capital reforms by one year to January 2023 and announced amendments to the calculation of RWA for COVID-19 relief packages which allow for payment deferrals. These COVID-19 packages have not impacted RWA at 31 March 2020 due to the timing of these packages being offered, however may impact future periods. Further details of APRA’s regulatory changes are set out in the Significant Developments section of the 2020 Interim Financial Report. Capital management strategy Westpac’s approach to capital management seeks to ensure that it is adequately capitalised as an ADI. Westpac evaluates its approach to capital management through an Internal Capital Adequacy Assessment Process (ICAAP), the key features of which include: •The development of a capital management strategy, including consideration of regulatory minimums, capital buffers and contingency plans; •Consideration of both regulatory and economic capital requirements; •A stress testing framework that challenges the capital measures, coverage and requirements including the impact of adverse economic scenarios; and •Consideration of the perspectives of external stakeholders including rating agencies as well as equity and debt investors. During the period of disruption caused by COVID-19, Westpac will seek to operate with the following principles in relation to capital: •Prioritise maintaining capital strength; •In line with APRA guidance, utilise some of the “unquestionably strong” buffer and seek to maintain a buffer above the regulatory minimum; •Retain capital to absorb further downside on credit quality and acknowledge a high degree of uncertainty regarding the length and depth of this stress; and •Allow for capital flexibility to support lending to customers. These principles take into consideration: •Current regulatory capital minimums and the capital conservation buffer (CCB), which together are the Total CET1 Requirement. In line with the above, the Total CET1 Requirement for Westpac is at least 8.0%, based upon an industry minimum CET1 requirement of 4.5% plus a capital buffer of at least 3.5% applicable to D-SIBs3,4; •Stress testing to calibrate an appropriate buffer against a downturn; and •Quarterly volatility of capital ratios due to the half yearly cycle of ordinary dividend payments. Westpac will revise its target capital levels once the medium to longer term impacts of COVID-19 are clearer, taking into account APRA’s expectations for the timing of any capital rebuilding required and the finalisation of APRA’s review of the capital adequacy framework. 1. Refer to Glossary for definition. 2. Noting that APRA may apply higher CET1 requirements for an individual ADI. 3. Noting that APRA may apply higher CET1 requirements for an individual ADI. 4. If an ADI’s CET1 ratio falls below the Total CET1 Requirement (at least 8%), they face restrictions on the distribution of earnings, such as dividends, distribution payments on AT1 capital instruments and discretionary staff bonuses. |
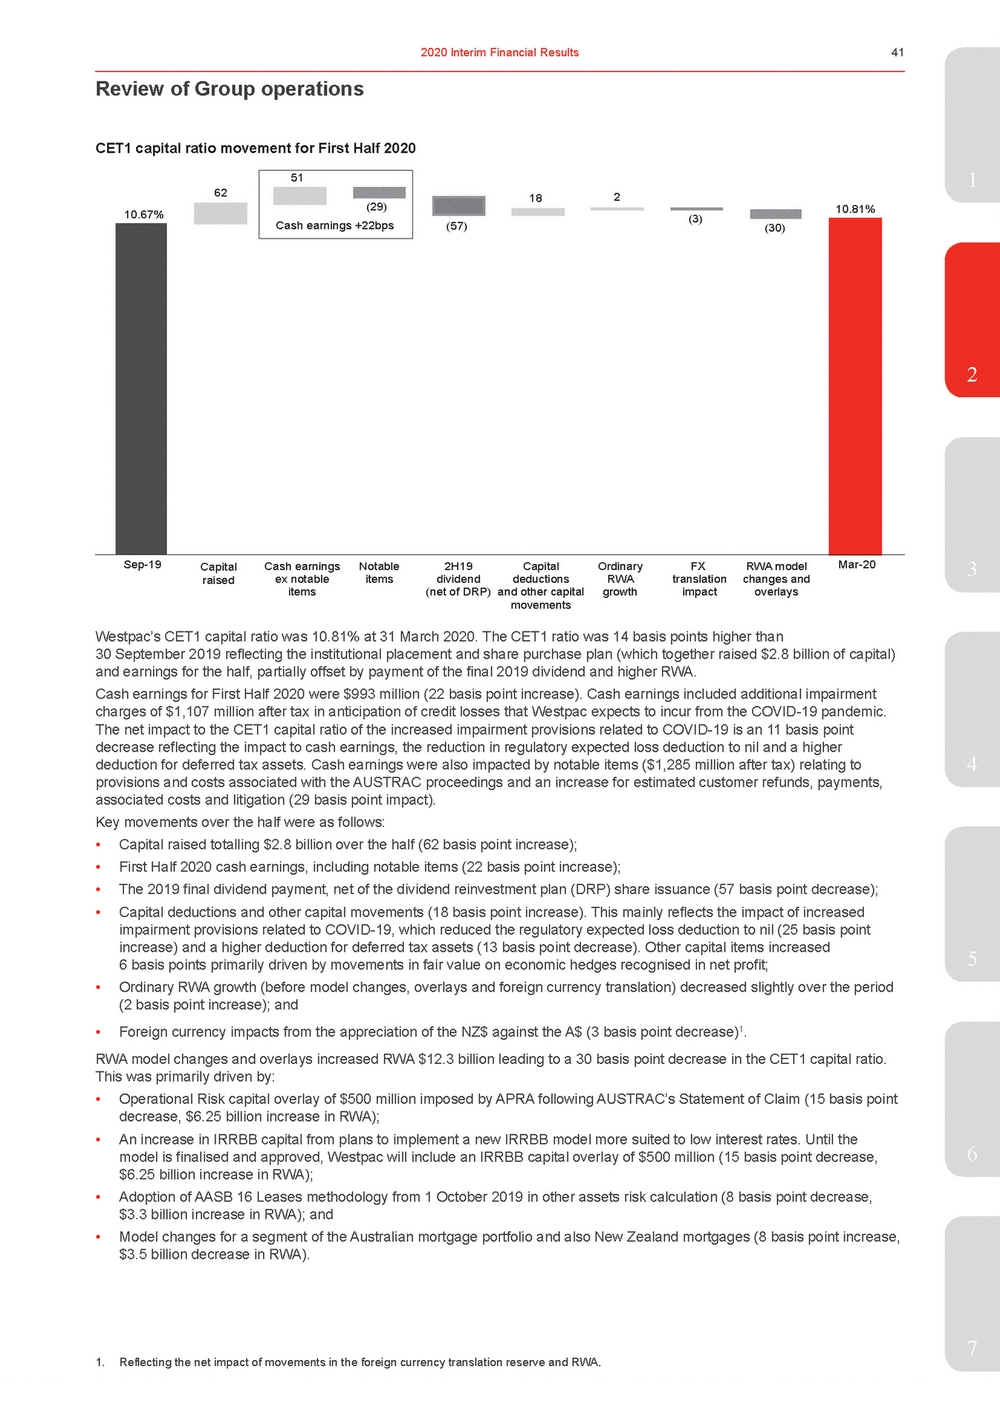 | 10.67% 62 (29) Cash earnings +22bps 18 (57) 2 (3) (30) 10.81% 2 Sep-19 Capital Cash earnings Notable 2H19 Capital Ordinary FX RWA model Mar-20 raised ex notable items dividend deductions RWA translation changes and items (net of DRP) and other capital growth impact overlays movements Westpac’s CET1 capital ratio was 10.81% at 31 March 2020. The CET1 ratio was 14 basis points higher than 30 September 2019 reflecting the institutional placement and share purchase plan (which together raised $2.8 billion of capital) and earnings for the half, partially offset by payment of the final 2019 dividend and higher RWA. Cash earnings for First Half 2020 were $993 million (22 basis point increase). Cash earnings included additional impairment charges of $1,107 million after tax in anticipation of credit losses that Westpac expects to incur from the COVID-19 pandemic. The net impact to the CET1 capital ratio of the increased impairment provisions related to COVID-19 is an 11 basis point decrease reflecting the impact to cash earnings, the reduction in regulatory expected loss deduction to nil and a higher deduction for deferred tax assets. Cash earnings were also impacted by notable items ($1,285 million after tax) relating to4 provisions and costs associated with the AUSTRAC proceedings and an increase for estimated customer refunds, payments, associated costs and litigation (29 basis point impact). Key movements over the half were as follows: •Capital raised totalling $2.8 billion over the half (62 basis point increase); •First Half 2020 cash earnings, including notable items (22 basis point increase); •The 2019 final dividend payment, net of the dividend reinvestment plan (DRP) share issuance (57 basis point decrease); •Capital deductions and other capital movements (18 basis point increase). This mainly reflects the impact of increased impairment provisions related to COVID-19, which reduced the regulatory expected loss deduction to nil (25 basis point increase) and a higher deduction for deferred tax assets (13 basis point decrease). Other capital items increased 6 basis points primarily driven by movements in fair value on economic hedges recognised in net profit;5 •Ordinary RWA growth (before model changes, overlays and foreign currency translation) decreased slightly over the period (2 basis point increase); and •Foreign currency impacts from the appreciation of the NZ$ against the A$ (3 basis point decrease)1. RWA model changes and overlays increased RWA $12.3 billion leading to a 30 basis point decrease in the CET1 capital ratio. This was primarily driven by: •Operational Risk capital overlay of $500 million imposed by APRA following AUSTRAC’s Statement of Claim (15 basis point decrease, $6.25 billion increase in RWA); •An increase in IRRBB capital from plans to implement a new IRRBB model more suited to low interest rates. Until the model is finalised and approved, Westpac will include an IRRBB capital overlay of $500 million (15 basis point decrease,6 $6.25 billion increase in RWA); •Adoption of AASB 16 Leases methodology from 1 October 2019 in other assets risk calculation (8 basis point decrease, $3.3 billion increase in RWA); and •Model changes for a segment of the Australian mortgage portfolio and also New Zealand mortgages (8 basis point increase, $3.5 billion decrease in RWA). 7 1. Reflecting the net impact of movements in the foreign currency translation reserve and RWA. |
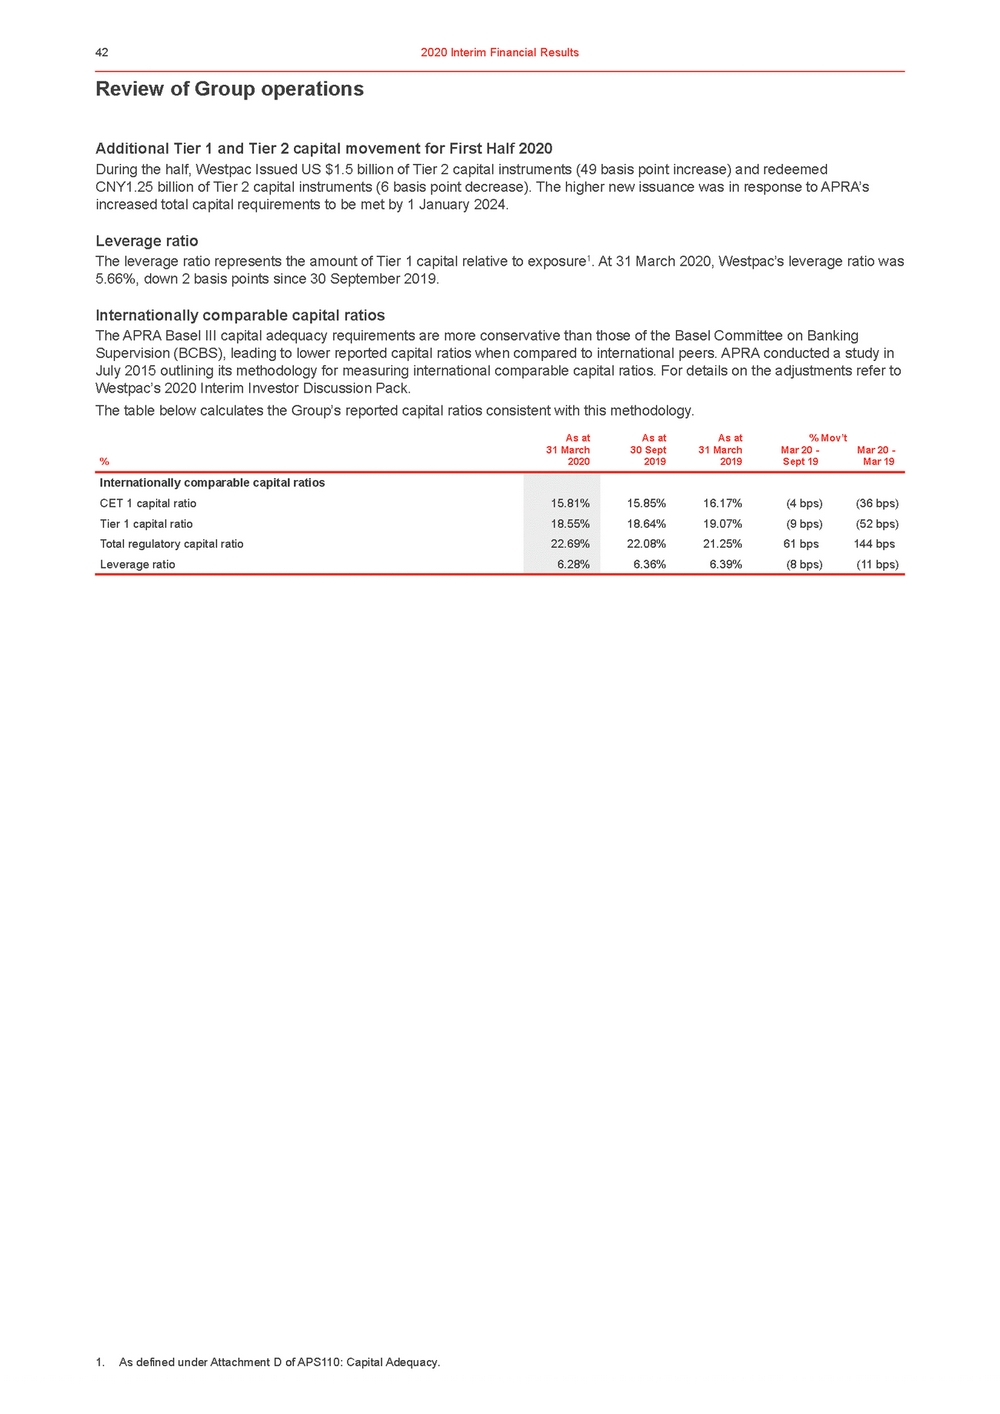 | Review of Group operations Additional Tier 1 and Tier 2 capital movement for First Half 2020 During the half, Westpac Issued US $1.5 billion of Tier 2 capital instruments (49 basis point increase) and redeemed CNY1.25 billion of Tier 2 capital instruments (6 basis point decrease). The higher new issuance was in response to APRA’s increased total capital requirements to be met by 1 January 2024. Leverage ratio The leverage ratio represents the amount of Tier 1 capital relative to exposure1. At 31 March 2020, Westpac’s leverage ratio was 5.66%, down 2 basis points since 30 September 2019. Internationally comparable capital ratios The APRA Basel III capital adequacy requirements are more conservative than those of the Basel Committee on Banking Supervision (BCBS), leading to lower reported capital ratios when compared to international peers. APRA conducted a study in July 2015 outlining its methodology for measuring international comparable capital ratios. For details on the adjustments refer to Westpac’s 2020 Interim Investor Discussion Pack. The table below calculates the Group’s reported capital ratios consistent with this methodology. 1. As defined under Attachment D of APS110: Capital Adequacy. |
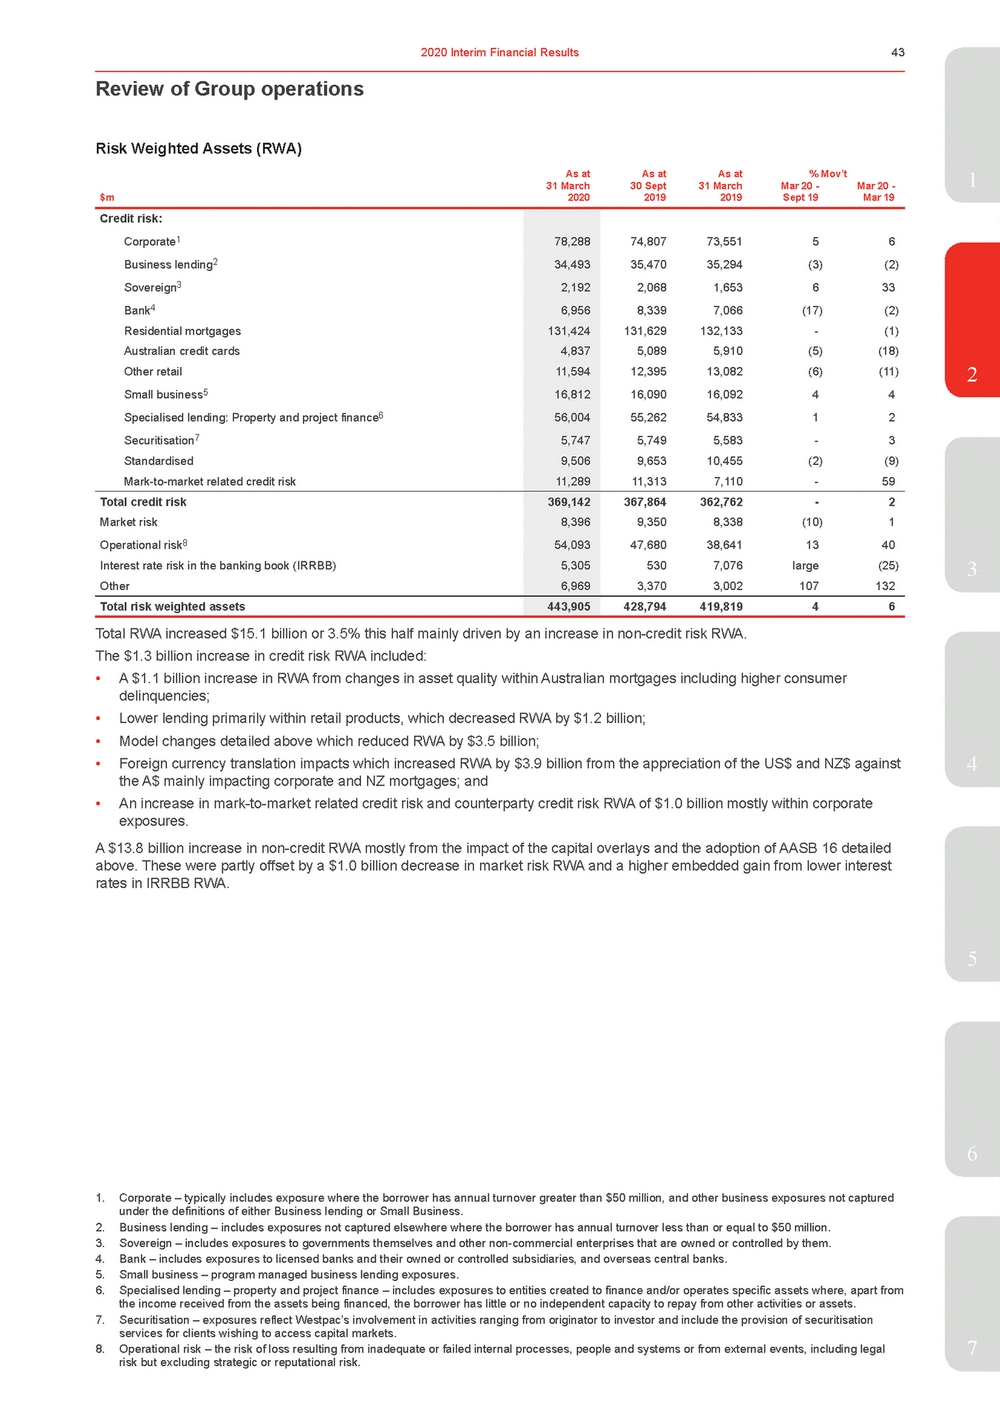 | 31 March $m2020 30 Sept 2019 31 March 2019 Mar 20 - Sept 19 Mar 20 - Mar 19 Credit risk: Corporate1 Business lending2 Sovereign3 Bank4 Residential mortgages Australian credit cards Other retail Small business5 Specialised lending: Property and project finance6 Securitisation7 Standardised Mark-to-market related credit risk 78,288 34,493 2,192 6,956 131,424 4,837 11,594 16,812 56,004 5,747 9,506 11,289 74,80773,55156 35,47035,294(3)(2) 2,0681,653633 8,3397,066(17)(2) 131,629132,133-(1) 5,0895,910(5)(18) 12,39513,082(6)(11) 16,09016,09244 55,26254,83312 5,7495,583-3 9,65310,455(2)(9) 11,3137,110-59 Total credit risk Market risk Operational risk8 Interest rate risk in the banking book (IRRBB) Other 369,142 8,396 54,093 5,305 6,969 367,864362,762-2 9,3508,338(10)1 47,68038,6411340 5307,076large(25) 3,3703,002107132 Total risk weighted assets 443,905 428,794419,81946 3 Total RWA increased $15.1 billion or 3.5% this half mainly driven by an increase in non-credit risk RWA. The $1.3 billion increase in credit risk RWA included: •A $1.1 billion increase in RWA from changes in asset quality within Australian mortgages including higher consumer delinquencies; • Lower lending primarily within retail products, which decreased RWA by $1.2 billion; • Model changes detailed above which reduced RWA by $3.5 billion; • Foreign currency translation impacts which increased RWA by $3.9 billion from the appreciation of the US$ and NZ$ against 4 the A$ mainly impacting corporate and NZ mortgages; and •An increase in mark-to-market related credit risk and counterparty credit risk RWA of $1.0 billion mostly within corporate exposures. A $13.8 billion increase in non-credit RWA mostly from the impact of the capital overlays and the adoption of AASB 16 detailed above. These were partly offset by a $1.0 billion decrease in market risk RWA and a higher embedded gain from lower interest rates in IRRBB RWA. 5 6 1. Corporate – typically includes exposure where the borrower has annual turnover greater than $50 million, and other business exposures not captured under the definitions of either Business lending or Small Business. 2. Business lending – includes exposures not captured elsewhere where the borrower has annual turnover less than or equal to $50 million. 3. Sovereign – includes exposures to governments themselves and other non-commercial enterprises that are owned or controlled by them. 4. Bank – includes exposures to licensed banks and their owned or controlled subsidiaries, and overseas central banks. 5. Small business – program managed business lending exposures. 6. Specialised lending – property and project finance – includes exposures to entities created to finance and/or operates specific assets where, apart from the income received from the assets being financed, the borrower has little or no independent capacity to repay from other activities or assets. 7. Securitisation – exposures reflect Westpac’s involvement in activities ranging from originator to investor and include the provision of securitisation services for clients wishing to access capital markets. 8. Operational risk – the risk of loss resulting from inadequate or failed internal processes, people and systems or from external events, including legal7 risk but excluding strategic or reputational risk. |
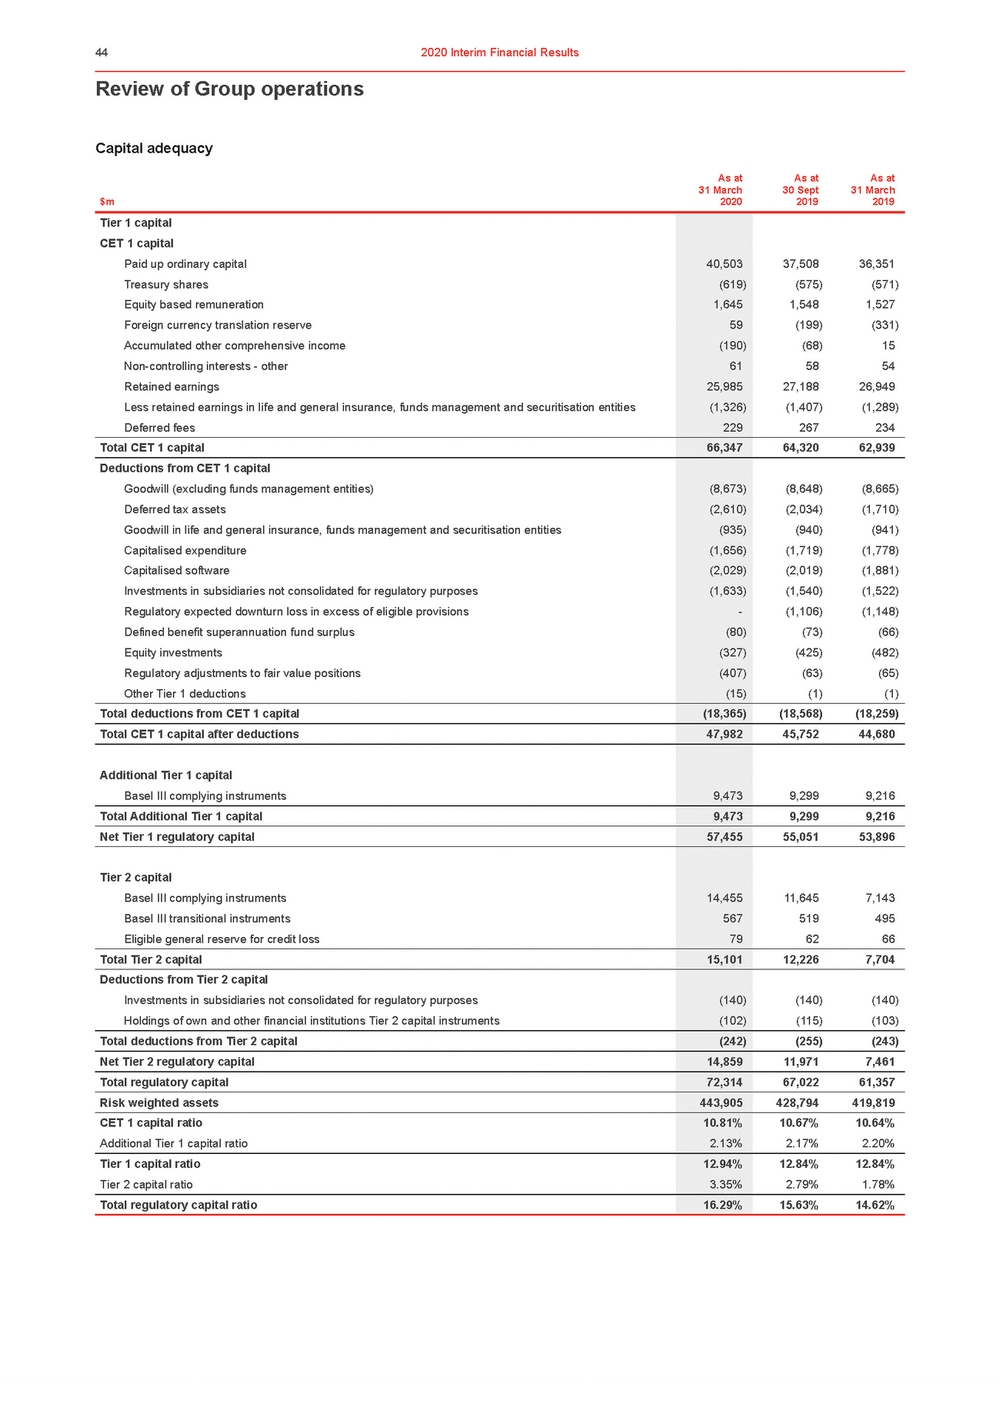 | Review of Group operations Capital adequacy As atAs atAs at 31 March $m2020 30 Sept 2019 31 March 2019 |
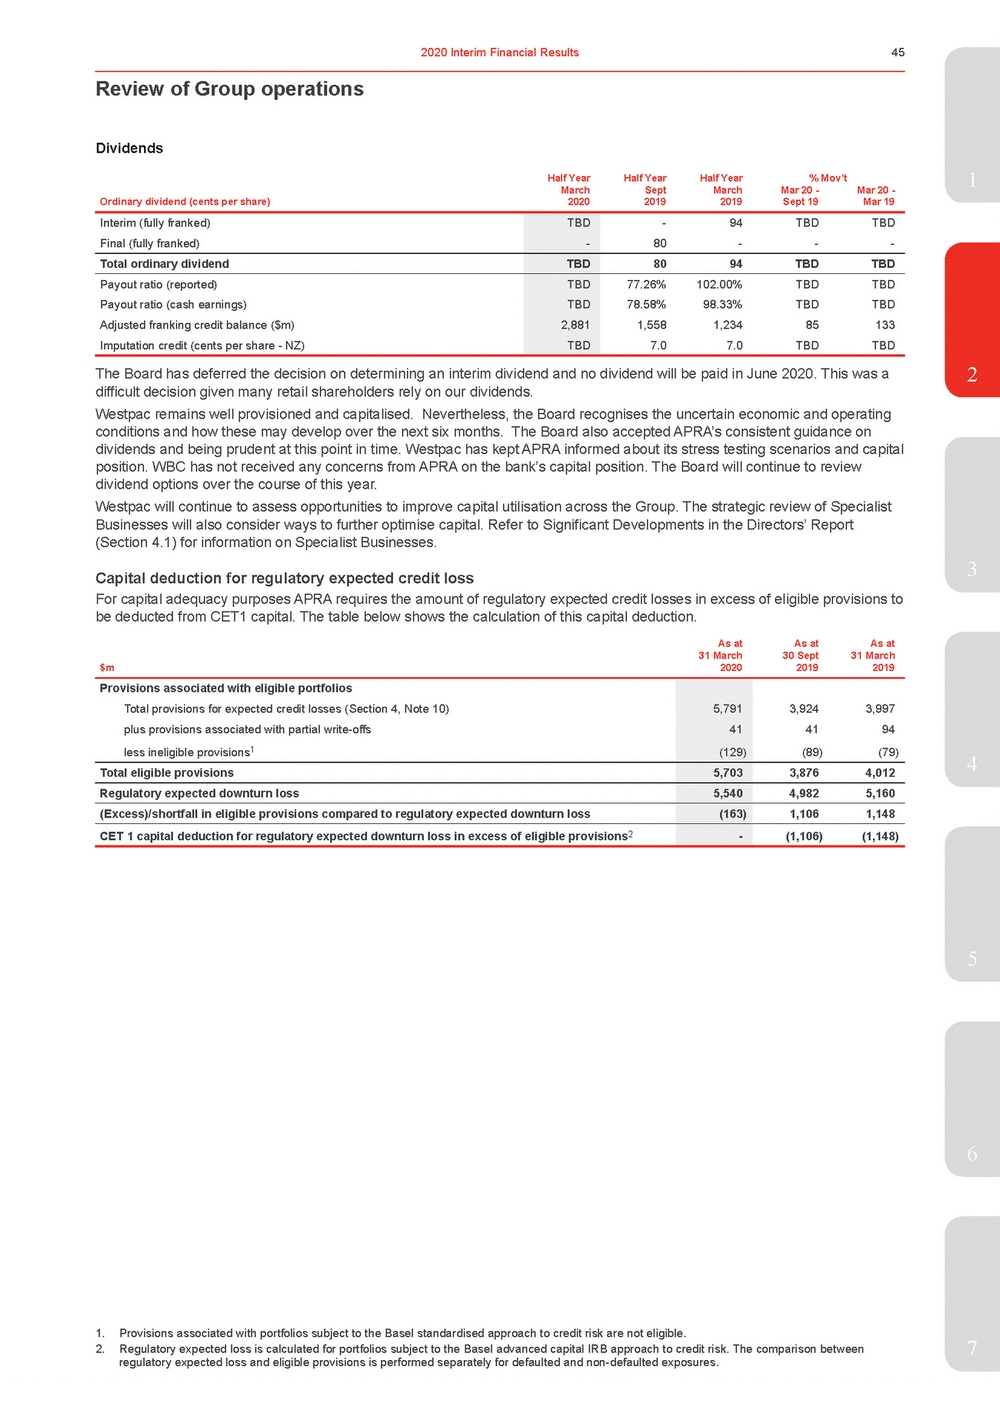 | Half YearHalf YearHalf Year% Mov’t1 Ordinary dividend (cents per share) March 2020 Sept 2019 March 2019 Mar 20 - Sept 19 Mar 20 - Mar 19 The Board has deferred the decision on determining an interim dividend and no dividend will be paid in June 2020. This was a2 difficult decision given many retail shareholders rely on our dividends. Westpac remains well provisioned and capitalised. Nevertheless, the Board recognises the uncertain economic and operating conditions and how these may develop over the next six months. The Board also accepted APRA’s consistent guidance on dividends and being prudent at this point in time. Westpac has kept APRA informed about its stress testing scenarios and capital position. WBC has not received any concerns from APRA on the bank’s capital position. The Board will continue to review dividend options over the course of this year. Westpac will continue to assess opportunities to improve capital utilisation across the Group. The strategic review of Specialist Businesses will also consider ways to further optimise capital. Refer to Significant Developments in the Directors’ Report (Section 4.1) for information on Specialist Businesses. Capital deduction for regulatory expected credit loss3 For capital adequacy purposes APRA requires the amount of regulatory expected credit losses in excess of eligible provisions to be deducted from CET1 capital. The table below shows the calculation of this capital deduction. As atAs atAs at 31 March $m2020 30 Sept 2019 31 March 2019 Provisions associated with eligible portfolios Total provisions for expected credit losses (Section 4, Note 10) plus provisions associated with partial write-offs less ineligible provisions1 5,791 41 (129) 3,9243,997 4194 (89)(79) Total eligible provisions 5,703 3,8764,012 Regulatory expected downturn loss 5,540 4,9825,160 (Excess)/shortfall in eligible provisions compared to regulatory expected downturn loss (163) 1,1061,148 CET 1 capital deduction for regulatory expected downturn loss in excess of eligible provisions2 - (1,106)(1,148) 5 6 1. Provisions associated with portfolios subject to the Basel standardised approach to credit risk are not eligible. 2. Regulatory expected loss is calculated for portfolios subject to the Basel advanced capital IRB approach to credit risk. The comparison between7 regulatory expected loss and eligible provisions is performed separately for defaulted and non-defaulted exposures. |
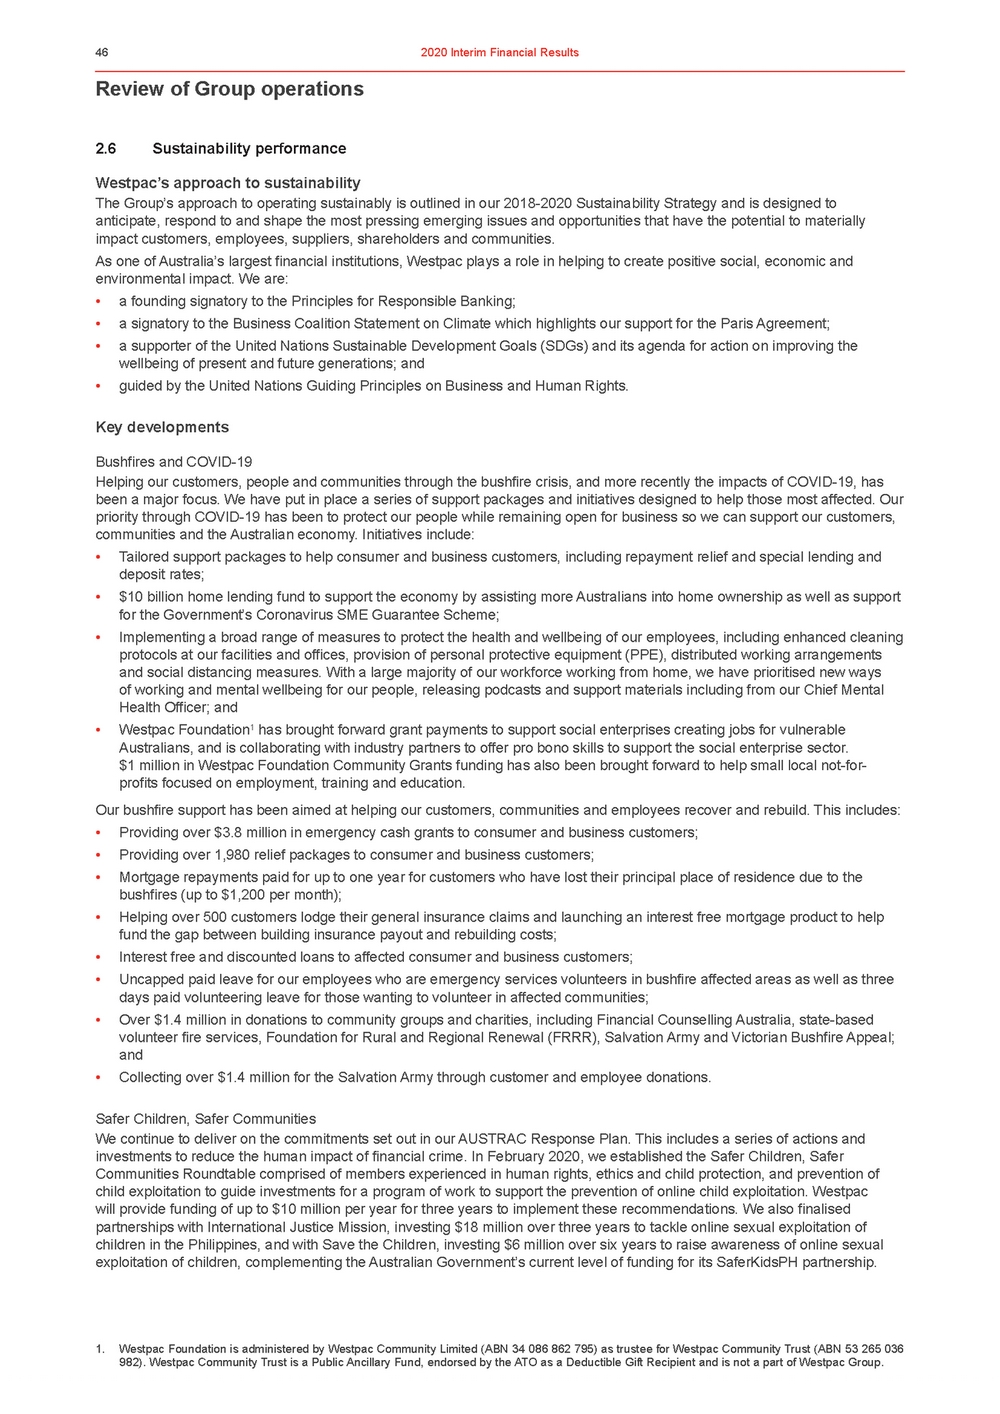 | Review of Group operations 2.6Sustainability performance Westpac’s approach to sustainability The Group’s approach to operating sustainably is outlined in our 2018-2020 Sustainability Strategy and is designed to anticipate, respond to and shape the most pressing emerging issues and opportunities that have the potential to materially impact customers, employees, suppliers, shareholders and communities. As one of Australia’s largest financial institutions, Westpac plays a role in helping to create positive social, economic and environmental impact. We are: •a founding signatory to the Principles for Responsible Banking; •a signatory to the Business Coalition Statement on Climate which highlights our support for the Paris Agreement; •a supporter of the United Nations Sustainable Development Goals (SDGs) and its agenda for action on improving the wellbeing of present and future generations; and •guided by the United Nations Guiding Principles on Business and Human Rights. Key developments Bushfires and COVID-19 Helping our customers, people and communities through the bushfire crisis, and more recently the impacts of COVID-19, has been a major focus. We have put in place a series of support packages and initiatives designed to help those most affected. Our priority through COVID-19 has been to protect our people while remaining open for business so we can support our customers, communities and the Australian economy. Initiatives include: •Tailored support packages to help consumer and business customers, including repayment relief and special lending and deposit rates; •$10 billion home lending fund to support the economy by assisting more Australians into home ownership as well as support for the Government’s Coronavirus SME Guarantee Scheme; •Implementing a broad range of measures to protect the health and wellbeing of our employees, including enhanced cleaning protocols at our facilities and offices, provision of personal protective equipment (PPE), distributed working arrangements and social distancing measures. With a large majority of our workforce working from home, we have prioritised new ways of working and mental wellbeing for our people, releasing podcasts and support materials including from our Chief Mental Health Officer; and •Westpac Foundation1 has brought forward grant payments to support social enterprises creating jobs for vulnerable Australians, and is collaborating with industry partners to offer pro bono skills to support the social enterprise sector. $1 million in Westpac Foundation Community Grants funding has also been brought forward to help small local not-for-profits focused on employment, training and education. Our bushfire support has been aimed at helping our customers, communities and employees recover and rebuild. This includes: •Providing over $3.8 million in emergency cash grants to consumer and business customers; •Providing over 1,980 relief packages to consumer and business customers; •Mortgage repayments paid for up to one year for customers who have lost their principal place of residence due to the bushfires (up to $1,200 per month); •Helping over 500 customers lodge their general insurance claims and launching an interest free mortgage product to help fund the gap between building insurance payout and rebuilding costs; •Interest free and discounted loans to affected consumer and business customers; •Uncapped paid leave for our employees who are emergency services volunteers in bushfire affected areas as well as three days paid volunteering leave for those wanting to volunteer in affected communities; •Over $1.4 million in donations to community groups and charities, including Financial Counselling Australia, state-based volunteer fire services, Foundation for Rural and Regional Renewal (FRRR), Salvation Army and Victorian Bushfire Appeal; and •Collecting over $1.4 million for the Salvation Army through customer and employee donations. Safer Children, Safer Communities We continue to deliver on the commitments set out in our AUSTRAC Response Plan. This includes a series of actions and investments to reduce the human impact of financial crime. In February 2020, we established the Safer Children, Safer Communities Roundtable comprised of members experienced in human rights, ethics and child protection, and prevention of child exploitation to guide investments for a program of work to support the prevention of online child exploitation. Westpac will provide funding of up to $10 million per year for three years to implement these recommendations. We also finalised partnerships with International Justice Mission, investing $18 million over three years to tackle online sexual exploitation of children in the Philippines, and with Save the Children, investing $6 million over six years to raise awareness of online sexual exploitation of children, complementing the Australian Government’s current level of funding for its SaferKidsPH partnership. 1. Westpac Foundation is administered by Westpac Community Limited (ABN 34 086 862 795) as trustee for Westpac Community Trust (ABN 53 265 036 982). Westpac Community Trust is a Public Ancillary Fund, endorsed by the ATO as a Deductible Gift Recipient and is not a part of Westpac Group. |
 | We have updated our Climate Change Position Statement and 2023 Action Plan, which re-affirms our 2015 commitment to managing our business in alignment with the Paris Agreement and the need to transition to a net zero emissions economy by1 2050. We also updated our Human Rights Position Statement and 2023 Action Plan which lays out the principles that guide our approach to human rights and sets out a series of actions for how we will continue to embed respect for human rights into our business practices and stakeholder relationships. Both statements were approved by the Board in April 2020 and are available on our website. Performance against our 2018-2020 Sustainability Strategy The table below summarises additional progress against the goals set out in our Sustainability Strategy. All data in the table is for the period 1 October 2019 to 31 March 2020, unless stated otherwise. Priority areasGoalsHalf Year 2020 performance2 Help more people better understand •Continued to offer financial health check programs for superannuation members, including the digital Wealth Review tool and My Wellbeing online portal; Helping people their financial position, •Delivered a range of financial literacy programs to individuals, businesses, not-make better financial decisions Helping people by being there when it matters most to them Helping people create a prosperous nation improving their financial confidence Help people recover from financial hardship Help people lift out of a difficult time and recover stronger Helping our most vulnerable customers Build the workforce of the future Invest and back the people and ideas shaping Australia Back the growth of climate change solutions Bring together partners and harness the Group’s capacity to tackle pressing social issues that matter most to the nation for-profit organisations and community groups through Westpac’s Davidson Institute in Australia and the Managing Your Money program in New Zealand; and •Delivered financial capability communications for different demographic segments including for young Australians, in partnership with Year 13; women, via Ruby Connection; and older Australians, via Starts at 60. •Helped customers experiencing financial hardship, issuing over 34,700 financial assistance packages. •Refer to the ‘Bushfires and COVID-19’ updates provided in the Key developments section3 above. •Developed a Vulnerable Customer Standard to provide guidance to staff when supporting customers in vulnerable circumstances; •Assisted over 1,700 customers since launching the Priority Assist team to support customers experiencing vulnerable circumstances, including domestic and family violence and financial abuse; •Enhanced our series of Life Moments tools and resources to assist customers and their families going through challenging circumstances such as the loss of a loved one, divorce or separation, with over 125,000 visits to the Life Moments web page; and •Supported over 4,500 Indigenous Australians since the establishment in December 2018 of4 a dedicated Customer Care team to support remote Indigenous communities. •Over 2,400 employees from our Consumer division completed ‘Own the Moment’ workshops – providing training to help frontline employees deepen their relationships with customers and deliver on Our Service Promise; and •Partnered with Macquarie University to deliver our Core Lending Program, with over 800 business bankers completing this program since launching through The Business Institute. •Westpac Scholars Trust¹ has awarded $3.9 million in educational scholarships to the next 64 Westpac Scholars, bringing the total cohort to 479; •Westpac Foundation2 job creation grants to social enterprises helped to create 539 jobs3 for vulnerable Australians;5 •Added 208 businesses through our Many Rivers partnership; cumulatively the partnership is currently supporting 2,495 people with jobs2, with 868 identifying as Indigenous; •Maintained a portfolio of direct investment in nine early stage companies; and •Current commitment to Reinventure of $150 million across three funds, supporting Reinventure’s investment in 27 early stage companies. •Increased lending to climate change solutions, taking total committed exposure to $9.7 billion, progressing towards our 2020 target of $10 billion; and •Facilitated $4.5 billion in funding for climate change solutions, exceeding our 2020 target of $3 billion. •Continued involvement in the implementation of the Principles for Responsible Banking, an initiative of the United Nations Environment Programme Finance Initiative (UNEP FI); and6 •Refer to the ‘AUSTRAC – Safer Children, Safer Communities’ update provided in the Key developments section above. 1. Westpac Scholars Trust (ABN 35 600 251 071) is administered by Westpac Scholars Limited (ABN 72 168 847 041) as trustee for the Westpac Scholars Trust. Westpac Scholars Trust is a private charitable trust and is not a part of Westpac Group. 2. Westpac Foundation is administered by Westpac Community Limited (ABN 34 086 862 795) as trustee for Westpac Community Trust (ABN 53 265 036 982). Westpac Community Trust is a Public Ancillary Fund, endorsed by the ATO as a Deductible Gift Recipient and is not a part of Westpac Group. 3. Jobs created through the Westpac Foundation job creation grants to social enterprises and Many Rivers job creation are for the year ended7 31 December 2019. |
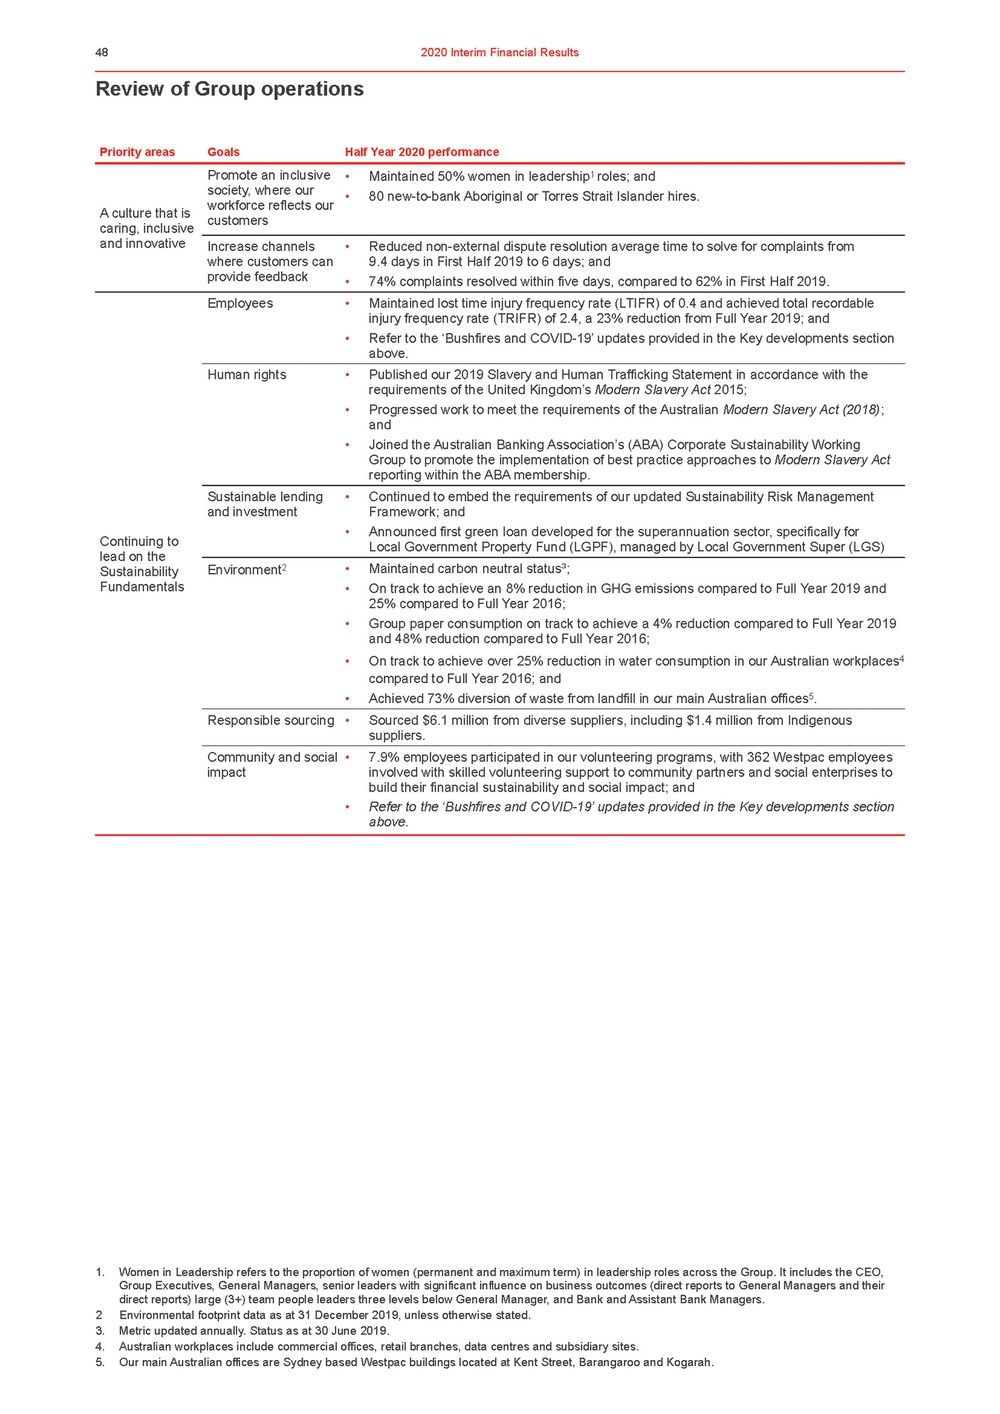 | Review of Group operations Priority areasGoalsHalf Year 2020 performance A culture that is caring, inclusive and innovative Promote an inclusive society, where our workforce reflects our customers Increase channels where customers can provide feedback •Maintained 50% women in leadership1 roles; and •80 new-to-bank Aboriginal or Torres Strait Islander hires. •Reduced non-external dispute resolution average time to solve for complaints from 9.4 days in First Half 2019 to 6 days; and •74% complaints resolved within five days, compared to 62% in First Half 2019. Employees•Maintained lost time injury frequency rate (LTIFR) of 0.4 and achieved total recordable injury frequency rate (TRIFR) of 2.4, a 23% reduction from Full Year 2019; and •Refer to the ‘Bushfires and COVID-19’ updates provided in the Key developments section above. Human rights•Published our 2019 Slavery and Human Trafficking Statement in accordance with the requirements of the United Kingdom’s Modern Slavery Act 2015; •Progressed work to meet the requirements of the Australian Modern Slavery Act (2018); and •Joined the Australian Banking Association’s (ABA) Corporate Sustainability Working Group to promote the implementation of best practice approaches to Modern Slavery Act reporting within the ABA membership. Continuing to lead on the Sustainable lending and investment •Continued to embed the requirements of our updated Sustainability Risk Management Framework; and •Announced first green loan developed for the superannuation sector, specifically for Local Government Property Fund (LGPF), managed by Local Government Super (LGS) Sustainability Fundamentals Environment2 •Maintained carbon neutral status³; •On track to achieve an 8% reduction in GHG emissions compared to Full Year 2019 and 25% compared to Full Year 2016; •Group paper consumption on track to achieve a 4% reduction compared to Full Year 2019 and 48% reduction compared to Full Year 2016; •On track to achieve over 25% reduction in water consumption in our Australian workplaces4 compared to Full Year 2016; and •Achieved 73% diversion of waste from landfill in our main Australian offices5. Responsible sourcing •Sourced $6.1 million from diverse suppliers, including $1.4 million from Indigenous suppliers. Community and social •7.9% employees participated in our volunteering programs, with 362 Westpac employees impact involved with skilled volunteering support to community partners and social enterprises to build their financial sustainability and social impact; and •Refer to the ‘Bushfires and COVID-19’ updates provided in the Key developments section above. 1. Women in Leadership refers to the proportion of women (permanent and maximum term) in leadership roles across the Group. It includes the CEO, Group Executives, General Managers, senior leaders with significant influence on business outcomes (direct reports to General Managers and their direct reports) large (3+) team people leaders three levels below General Manager, and Bank and Assistant Bank Managers. 2Environmental footprint data as at 31 December 2019, unless otherwise stated. 3. Metric updated annually. Status as at 30 June 2019. 4. Australian workplaces include commercial offices, retail branches, data centres and subsidiary sites. 5. Our main Australian offices are Sydney based Westpac buildings located at Kent Street, Barangaroo and Kogarah. |
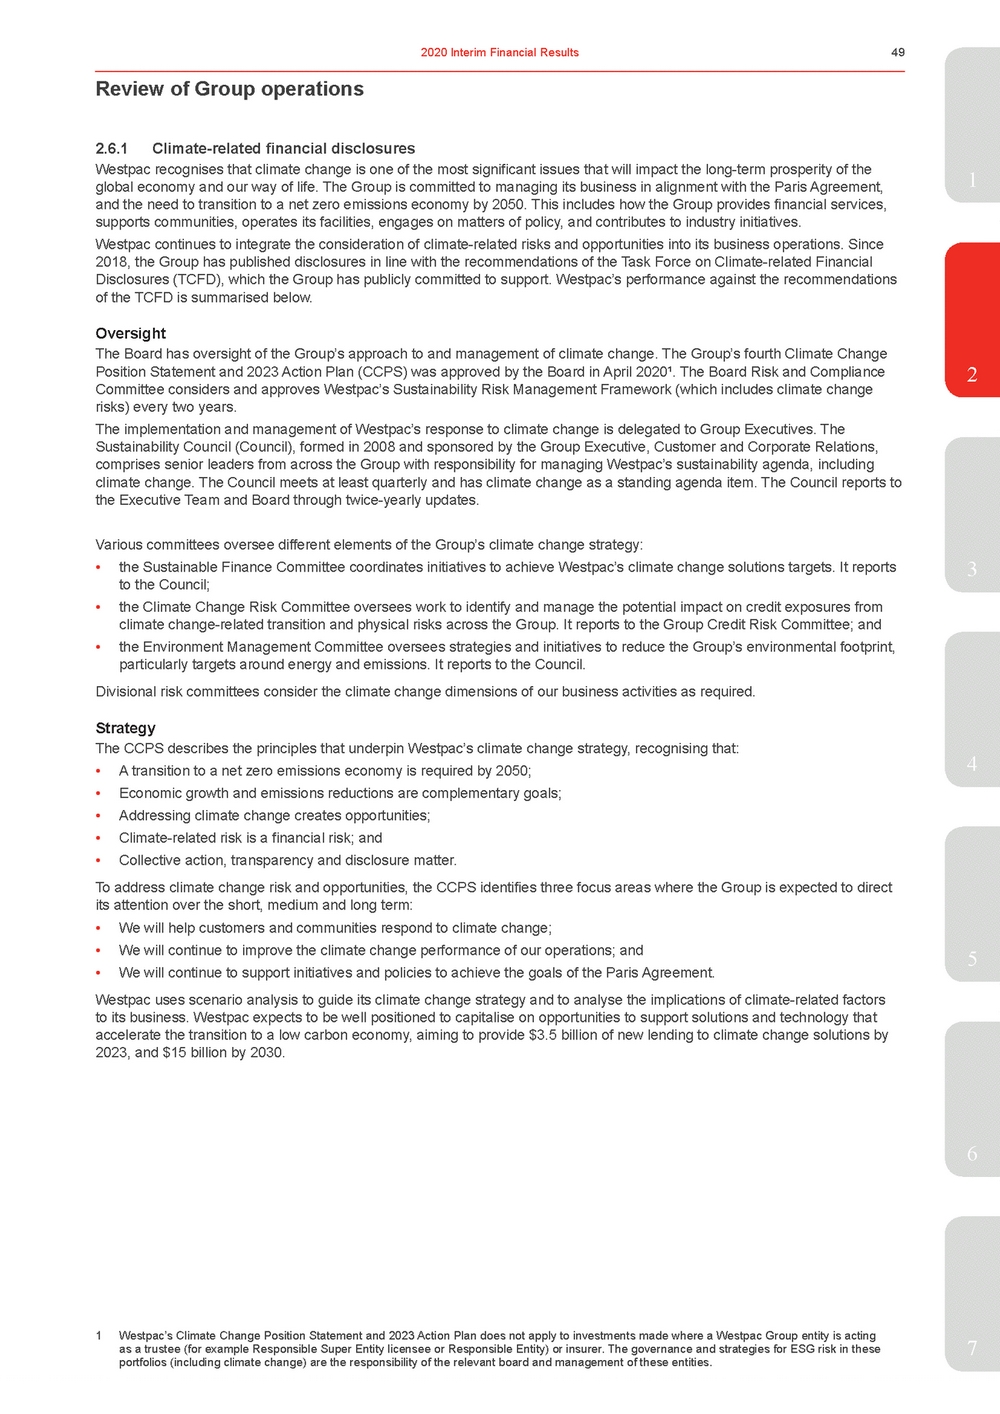 | 1 global economy and our way of life. The Group is committed to managing its business in alignment with the Paris Agreement, and the need to transition to a net zero emissions economy by 2050. This includes how the Group provides financial services, supports communities, operates its facilities, engages on matters of policy, and contributes to industry initiatives. Westpac continues to integrate the consideration of climate-related risks and opportunities into its business operations. Since 2018, the Group has published disclosures in line with the recommendations of the Task Force on Climate-related Financial Disclosures (TCFD), which the Group has publicly committed to support. Westpac’s performance against the recommendations of the TCFD is summarised below. Oversight The Board has oversight of the Group’s approach to and management of climate change. The Group’s fourth Climate Change Position Statement and 2023 Action Plan (CCPS) was approved by the Board in April 2020¹. The Board Risk and Compliance2 Committee considers and approves Westpac’s Sustainability Risk Management Framework (which includes climate change risks) every two years. The implementation and management of Westpac’s response to climate change is delegated to Group Executives. The Sustainability Council (Council), formed in 2008 and sponsored by the Group Executive, Customer and Corporate Relations, comprises senior leaders from across the Group with responsibility for managing Westpac’s sustainability agenda, including climate change. The Council meets at least quarterly and has climate change as a standing agenda item. The Council reports to the Executive Team and Board through twice-yearly updates. Various committees oversee different elements of the Group’s climate change strategy: •the Sustainable Finance Committee coordinates initiatives to achieve Westpac’s climate change solutions targets. It reports3 to the Council; •the Climate Change Risk Committee oversees work to identify and manage the potential impact on credit exposures from climate change-related transition and physical risks across the Group. It reports to the Group Credit Risk Committee; and •the Environment Management Committee oversees strategies and initiatives to reduce the Group’s environmental footprint, particularly targets around energy and emissions. It reports to the Council. Divisional risk committees consider the climate change dimensions of our business activities as required. Strategy The CCPS describes the principles that underpin Westpac’s climate change strategy, recognising that: •A transition to a net zero emissions economy is required by 2050;4 •Economic growth and emissions reductions are complementary goals; •Addressing climate change creates opportunities; •Climate-related risk is a financial risk; and •Collective action, transparency and disclosure matter. To address climate change risk and opportunities, the CCPS identifies three focus areas where the Group is expected to direct its attention over the short, medium and long term: •We will help customers and communities respond to climate change; •We will continue to improve the climate change performance of our operations; and5 •We will continue to support initiatives and policies to achieve the goals of the Paris Agreement. Westpac uses scenario analysis to guide its climate change strategy and to analyse the implications of climate-related factors to its business. Westpac expects to be well positioned to capitalise on opportunities to support solutions and technology that accelerate the transition to a low carbon economy, aiming to provide $3.5 billion of new lending to climate change solutions by 2023, and $15 billion by 2030. 6 1Westpac’s Climate Change Position Statement and 2023 Action Plan does not apply to investments made where a Westpac Group entity is acting as a trustee (for example Responsible Super Entity licensee or Responsible Entity) or insurer. The governance and strategies for ESG risk in these7 portfolios (including climate change) are the responsibility of the relevant board and management of these entities. |
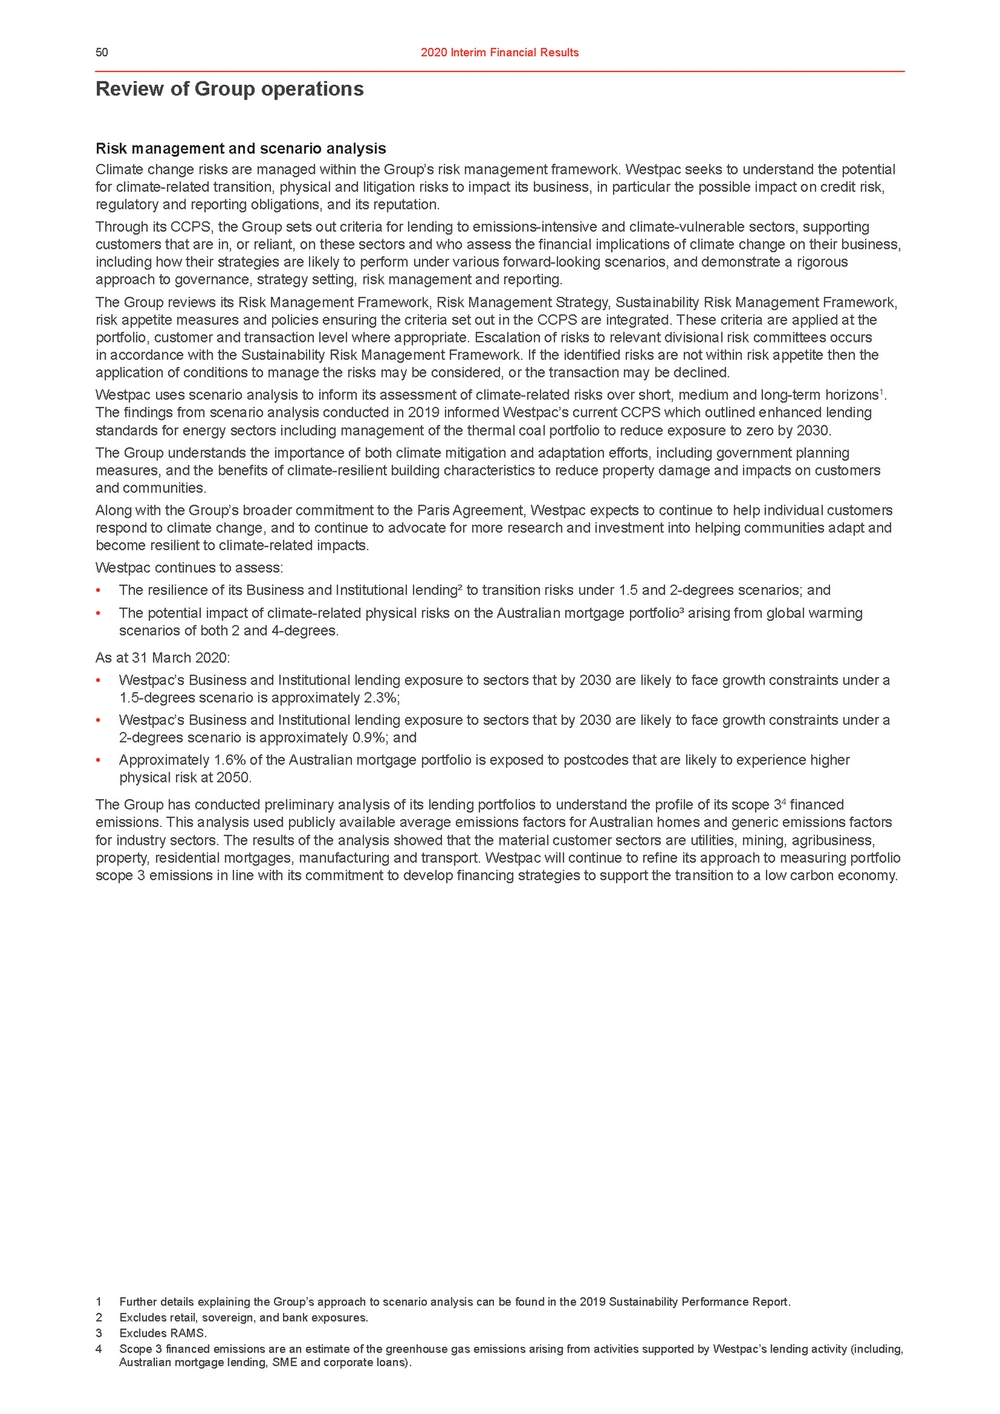 | Review of Group operations Risk management and scenario analysis Climate change risks are managed within the Group’s risk management framework. Westpac seeks to understand the potential for climate-related transition, physical and litigation risks to impact its business, in particular the possible impact on credit risk, regulatory and reporting obligations, and its reputation. Through its CCPS, the Group sets out criteria for lending to emissions-intensive and climate-vulnerable sectors, supporting customers that are in, or reliant, on these sectors and who assess the financial implications of climate change on their business, including how their strategies are likely to perform under various forward-looking scenarios, and demonstrate a rigorous approach to governance, strategy setting, risk management and reporting. The Group reviews its Risk Management Framework, Risk Management Strategy, Sustainability Risk Management Framework, risk appetite measures and policies ensuring the criteria set out in the CCPS are integrated. These criteria are applied at the portfolio, customer and transaction level where appropriate. Escalation of risks to relevant divisional risk committees occurs in accordance with the Sustainability Risk Management Framework. If the identified risks are not within risk appetite then the application of conditions to manage the risks may be considered, or the transaction may be declined. Westpac uses scenario analysis to inform its assessment of climate-related risks over short, medium and long-term horizons1. The findings from scenario analysis conducted in 2019 informed Westpac’s current CCPS which outlined enhanced lending standards for energy sectors including management of the thermal coal portfolio to reduce exposure to zero by 2030. The Group understands the importance of both climate mitigation and adaptation efforts, including government planning measures, and the benefits of climate-resilient building characteristics to reduce property damage and impacts on customers and communities. Along with the Group’s broader commitment to the Paris Agreement, Westpac expects to continue to help individual customers respond to climate change, and to continue to advocate for more research and investment into helping communities adapt and become resilient to climate-related impacts. Westpac continues to assess: •The resilience of its Business and Institutional lending² to transition risks under 1.5 and 2-degrees scenarios; and •The potential impact of climate-related physical risks on the Australian mortgage portfolio³ arising from global warming scenarios of both 2 and 4-degrees. As at 31 March 2020: •Westpac’s Business and Institutional lending exposure to sectors that by 2030 are likely to face growth constraints under a 1.5-degrees scenario is approximately 2.3%; •Westpac’s Business and Institutional lending exposure to sectors that by 2030 are likely to face growth constraints under a 2-degrees scenario is approximately 0.9%; and •Approximately 1.6% of the Australian mortgage portfolio is exposed to postcodes that are likely to experience higher physical risk at 2050. The Group has conducted preliminary analysis of its lending portfolios to understand the profile of its scope 34 financed emissions. This analysis used publicly available average emissions factors for Australian homes and generic emissions factors for industry sectors. The results of the analysis showed that the material customer sectors are utilities, mining, agribusiness, property, residential mortgages, manufacturing and transport. Westpac will continue to refine its approach to measuring portfolio scope 3 emissions in line with its commitment to develop financing strategies to support the transition to a low carbon economy. 1Further details explaining the Group’s approach to scenario analysis can be found in the 2019 Sustainability Performance Report. 2Excludes retail, sovereign, and bank exposures. 3Excludes RAMS. 4Scope 3 financed emissions are an estimate of the greenhouse gas emissions arising from activities supported by Westpac’s lending activity (including, Australian mortgage lending, SME and corporate loans). |
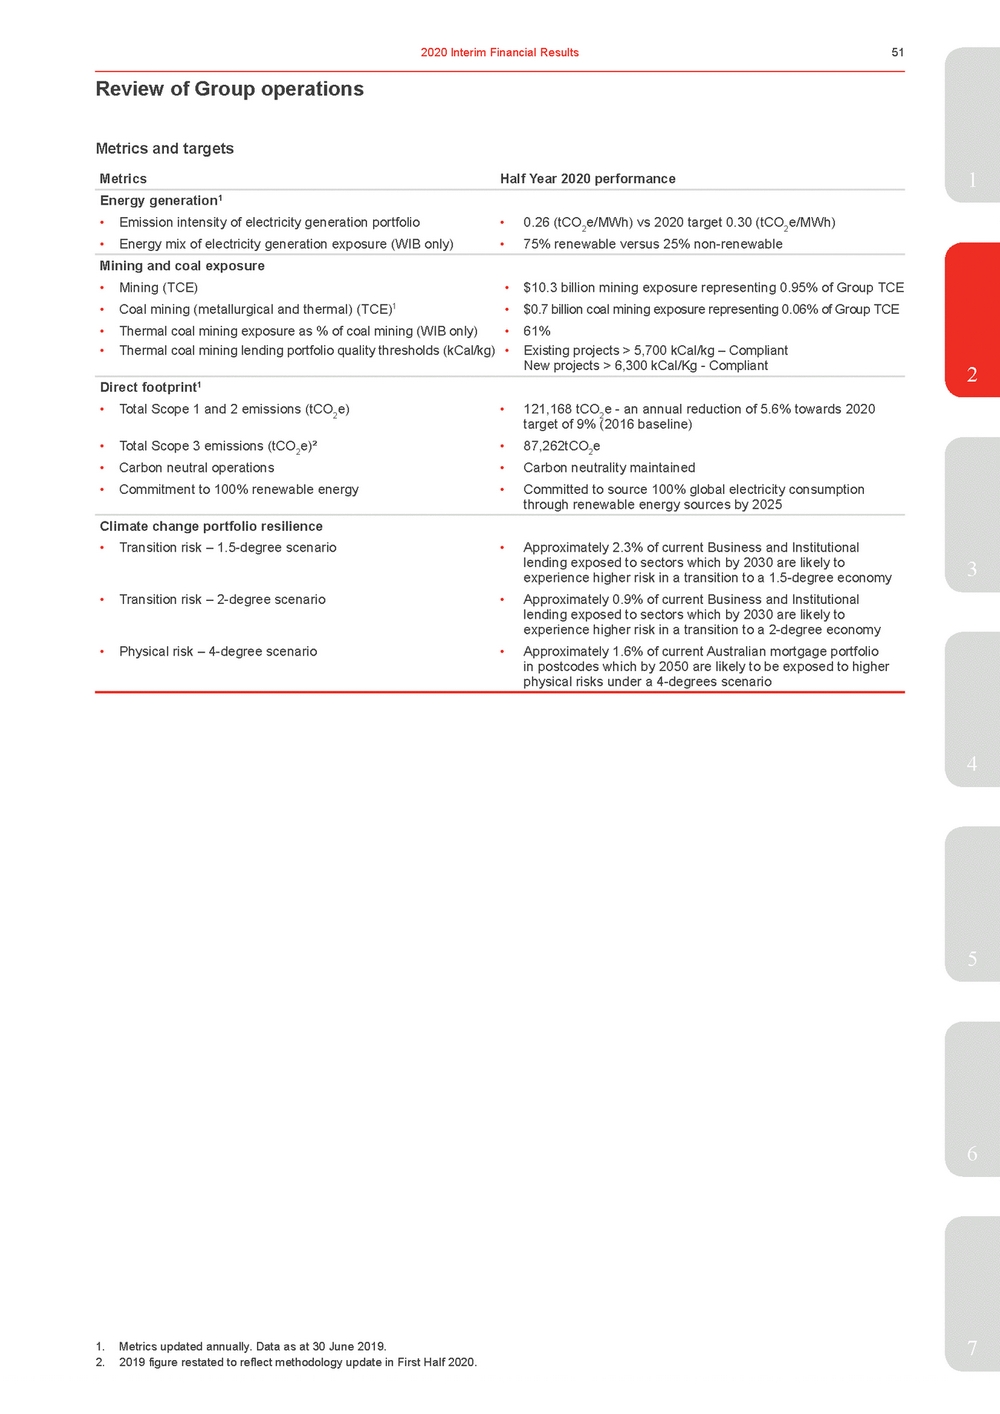 | MetricsHalf Year 2020 performance1 Energy generation1 • Emission intensity of electricity generation portfolio•0.26 (tCO e/MWh) vs 2020 target 0.30 (tCO e/MWh) 2 2 • Energy mix of electricity generation exposure (WIB only)•75% renewable versus 25% non-renewable Mining and coal exposure • Mining (TCE)• $10.3 billion mining exposure representing 0.95% of Group TCE • Coal mining (metallurgical and thermal) (TCE)1 • $0.7 billion coal mining exposure representing 0.06% of Group TCE • Thermal coal mining exposure as % of coal mining (WIB only) • Thermal coal mining lending portfolio quality thresholds (kCal/kg) Direct footprint1 • 61% • Existing projects > 5,700 kCal/kg – Compliant New projects > 6,300 kCal/Kg - Compliant2 • Total Scope 1 and 2 emissions (tCO e)•121,168 tCO e - an annual reduction of 5.6% towards 2020 2 2 target of 9% (2016 baseline) • Total Scope 3 emissions (tCO e)²•87,262tCO e 2 2 • Carbon neutral operations•Carbon neutrality maintained • Commitment to 100% renewable energy•Committed to source 100% global electricity consumption through renewable energy sources by 2025 Climate change portfolio resilience 3 • Transition risk – 2-degree scenario•Approximately 0.9% of current Business and Institutional lending exposed to sectors which by 2030 are likely to experience higher risk in a transition to a 2-degree economy • Physical risk – 4-degree scenario•Approximately 1.6% of current Australian mortgage portfolio in postcodes which by 2050 are likely to be exposed to higher physical risks under a 4-degrees scenario 4 5 6 1. Metrics updated annually. Data as at 30 June 2019.7 2. 2019 figure restated to reflect methodology update in First Half 2020. |
 | Divisional results 3.0Divisional results Comparative divisional results have been restated. These changes have no impact on the overall Group’s results or balance sheet. Refer Section 4, Note 2. Notable items The table below shows the impact of notable items on the divisions in First Half 2020 and Second Half 2019. Notable items are discussed in Section 1.3.2. These items are discussed further in Note 14 of the 2020 Interim Financial Report. Westpac Westpac New Institutional Zealand Group Consumer Business Bank (A$) Businesses Group |
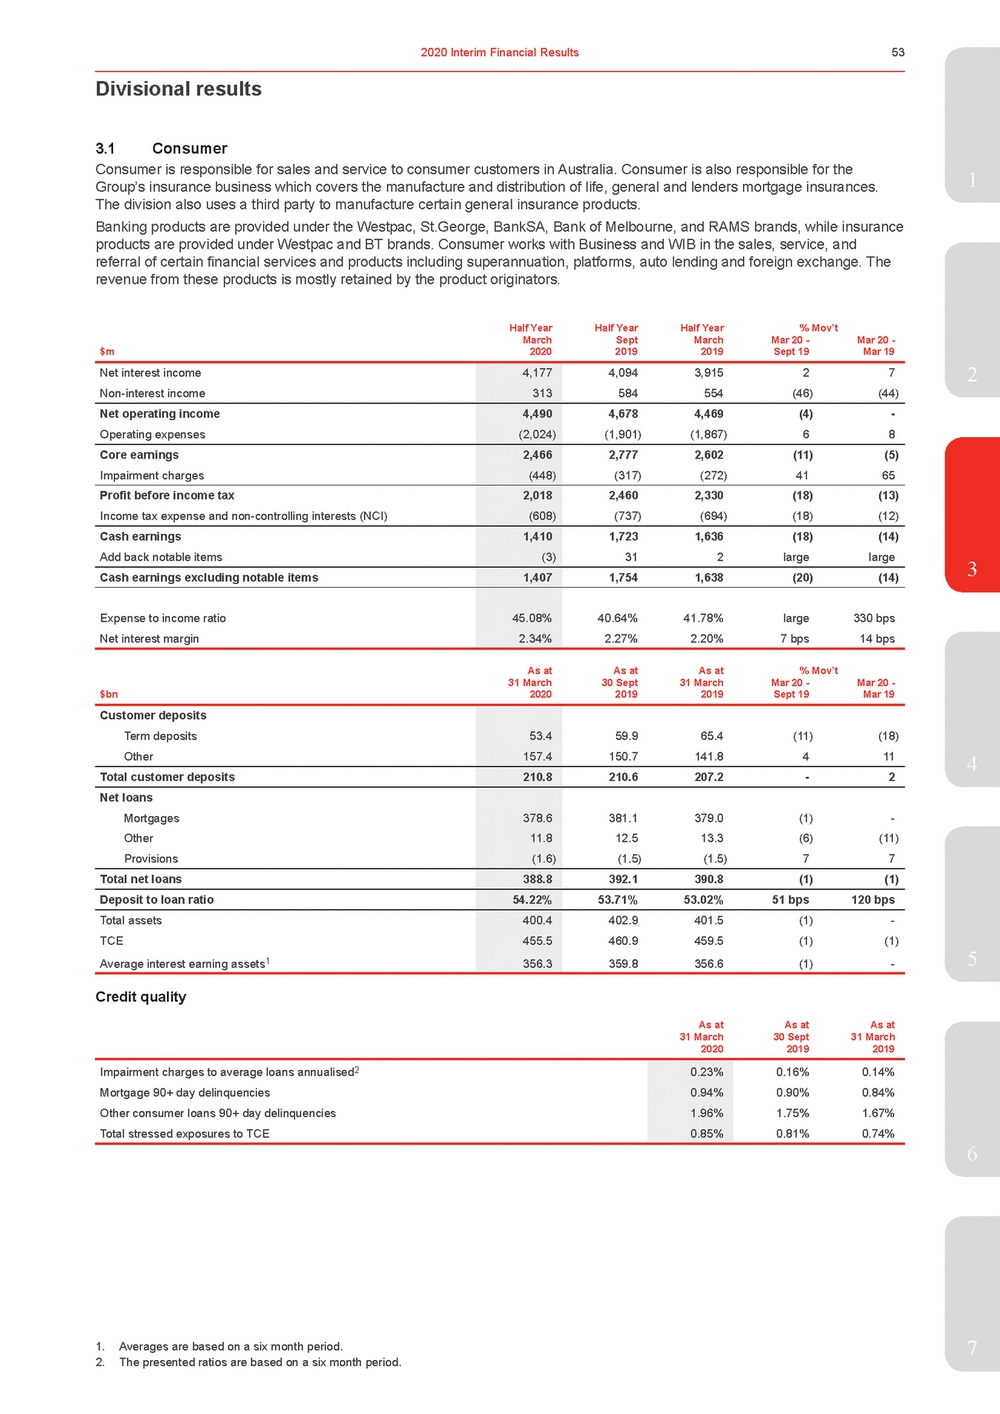 | 3.1Consumer 1 Banking products are provided under the Westpac, St.George, BankSA, Bank of Melbourne, and RAMS brands, while insurance products are provided under Westpac and BT brands. Consumer works with Business and WIB in the sales, service, and referral of certain financial services and products including superannuation, platforms, auto lending and foreign exchange. The revenue from these products is mostly retained by the product originators. Half YearHalf YearHalf Year% Mov’t March $m2020 Sept 2019 March 2019 Mar 20 - Sept 19 Mar 20 - Mar 19 Net interest income Non-interest income 4,177 313 4,0943,91527 584554(46)(44) Net operating income Operating expenses 4,490 (2,024) 4,6784,469(4)-(1,901)(1,867)68 Core earnings Impairment charges 2,466 (448) 2,7772,602(11)(5) (317)(272)4165 Profit before income tax Income tax expense and non-controlling interests (NCI) 2,018 (608) 2,4602,330(18)(13) (737)(694)(18)(12) Cash earnings Add back notable items 1,410 (3) 1,7231,636(18)(14) 312largelarge Cash earnings excluding notable items 1,407 1,7541,638(20)(14) Expense to income ratio Net interest margin 45.08% 2.34% 40.64%41.78%large330 bps 2.27%2.20%7 bps14 bps 3 As atAs atAs at% Mov’t $bn 31 March 2020 30 Sept 2019 31 March 2019 Mar 20 - Sept 19 Mar 20 - Mar 19 Customer deposits Term deposits Other 53.4 157.4 59.965.4(11)(18) 150.7141.8411 Total customer deposits 210.8 210.6207.2-2 Net loans Mortgages Other Provisions 378.6 11.8 (1.6) 381.1379.0(1)-12.513.3(6)(11) (1.5)(1.5) 77 Total net loans 388.8 392.1390.8(1)(1) Deposit to loan ratio 54.22% 53.71%53.02%51 bps120 bps Total assets TCE Average interest earning assets1 400.4 455.5 356.3 402.9401.5(1)-460.9459.5(1)(1) 359.8356.6(1)-5 Credit quality As atAs atAs at 31 March 2020 30 Sept 2019 31 March 2019 Impairment charges to average loans annualised2 0.23% 0.16% 0.14% Mortgage 90+ day delinquencies 0.94% 0.90% 0.84% Other consumer loans 90+ day delinquencies 1.96% 1.75% 1.67% Total stressed exposures to TCE 0.85% 0.81% 0.74% 6 1. Averages are based on a six month period. 7 2. The presented ratios are based on a six month period. |
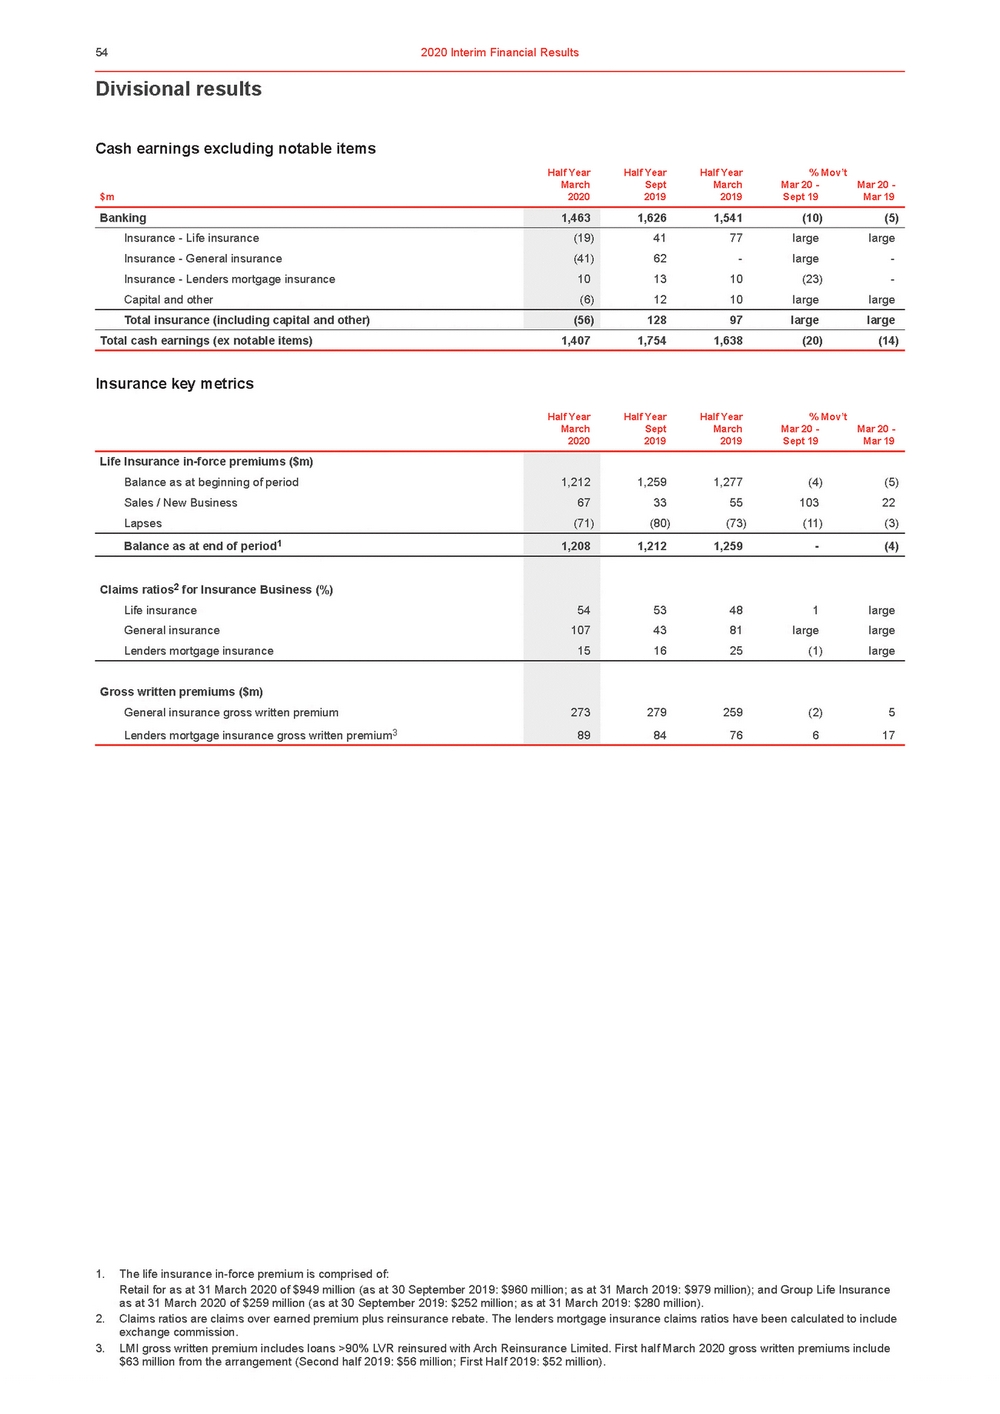 | Divisional results Cash earnings excluding notable items Half YearHalf YearHalf Year% Mov’t March Banking 1,463 1,6261,541(10)(5) Insurance - Life insurance Insurance - General insurance Insurance - Lenders mortgage insurance Capital and other (19) (41) 10 (6) 4177largelarge 62-large-1310(23)-1210largelarge Total insurance (including capital and other) (56) 12897largelarge Total cash earnings (ex notable items) 1,407 1,754 1,638 (20) (14) Insurance key metrics Half Year March Half Year Sept Half Year March % Mov’t Mar 20 - Mar 20 - 2020 2019 2019 Sept 19 Mar 19 Sept 2019 March 2019 Mar 20 - Sept 19 Mar 20 - Mar 19 1. The life insurance in-force premium is comprised of: Retail for as at 31 March 2020 of $949 million (as at 30 September 2019: $960 million; as at 31 March 2019: $979 million); and Group Life Insurance as at 31 March 2020 of $259 million (as at 30 September 2019: $252 million; as at 31 March 2019: $280 million). 2. Claims ratios are claims over earned premium plus reinsurance rebate. The lenders mortgage insurance claims ratios have been calculated to include exchange commission. 3. LMI gross written premium includes loans >90% LVR reinsured with Arch Reinsurance Limited. First half March 2020 gross written premiums include $63 million from the arrangement (Second half 2019: $56 million; First Half 2019: $52 million). |
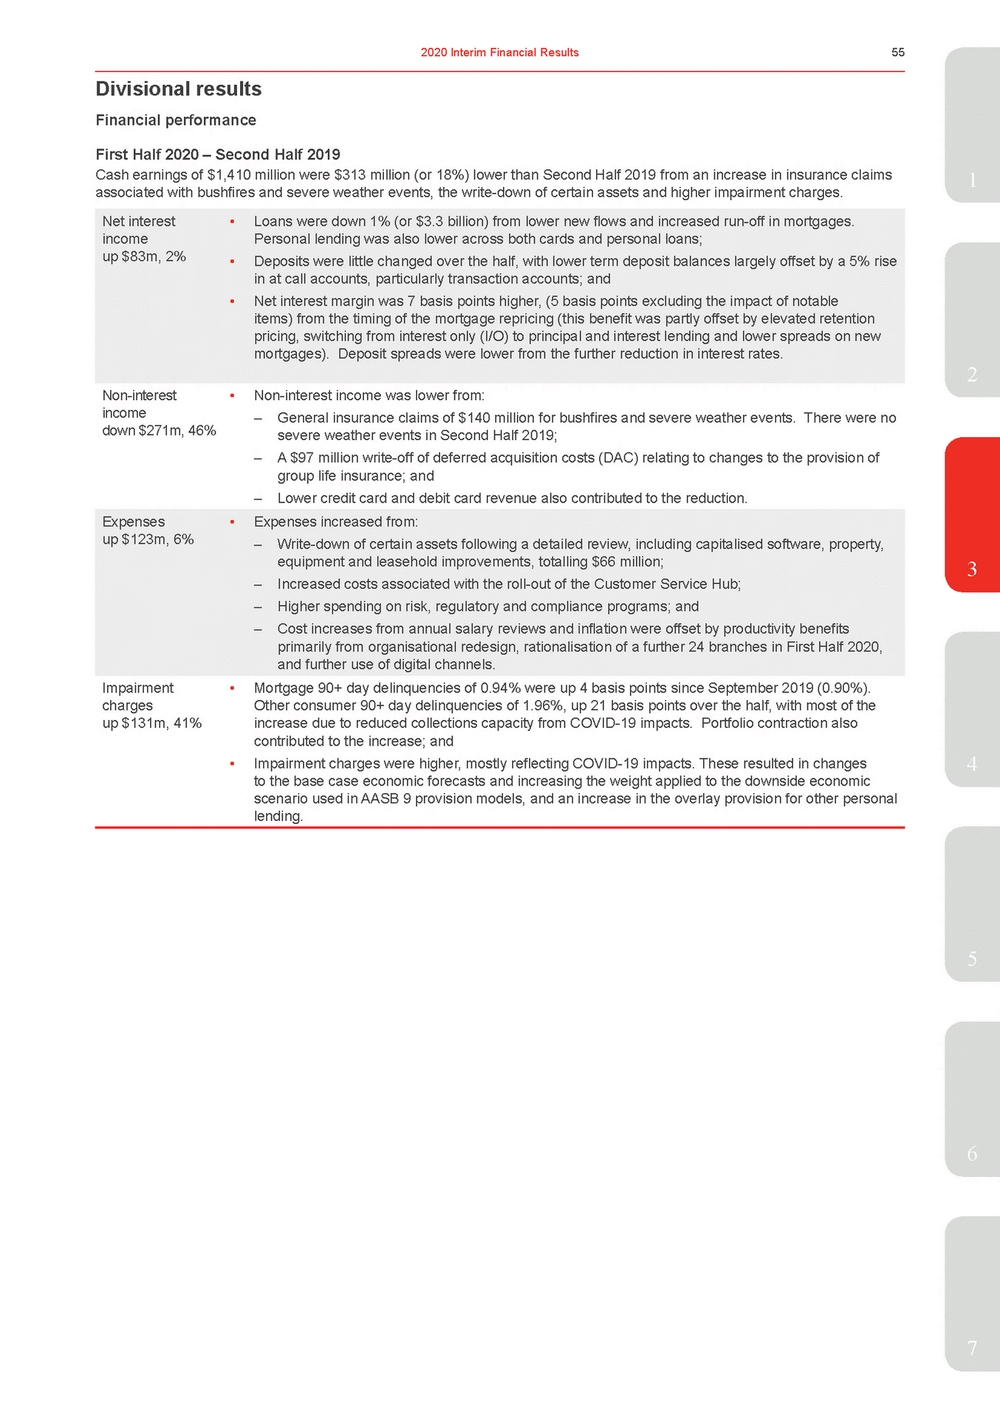 | First Half 2020 – Second Half 2019 Cash earnings of $1,410 million were $313 million (or 18%) lower than Second Half 2019 from an increase in insurance claims1 associated with bushfires and severe weather events, the write-down of certain assets and higher impairment charges. Net interest income up $83m, 2% Non-interest income down $271m, 46% Expenses up $123m, 6% Impairment charges up $131m, 41% •Loans were down 1% (or $3.3 billion) from lower new flows and increased run-off in mortgages. Personal lending was also lower across both cards and personal loans; •Deposits were little changed over the half, with lower term deposit balances largely offset by a 5% rise in at call accounts, particularly transaction accounts; and •Net interest margin was 7 basis points higher, (5 basis points excluding the impact of notable items) from the timing of the mortgage repricing (this benefit was partly offset by elevated retention pricing, switching from interest only (I/O) to principal and interest lending and lower spreads on new mortgages). Deposit spreads were lower from the further reduction in interest rates. 2 •Non-interest income was lower from: – General insurance claims of $140 million for bushfires and severe weather events. There were no severe weather events in Second Half 2019; – A $97 million write-off of deferred acquisition costs (DAC) relating to changes to the provision of group life insurance; and – Lower credit card and debit card revenue also contributed to the reduction. •Expenses increased from: – Write-down of certain assets following a detailed review, including capitalised software, property, equipment and leasehold improvements, totalling $66 million;3 – Increased costs associated with the roll-out of the Customer Service Hub; – Higher spending on risk, regulatory and compliance programs; and – Cost increases from annual salary reviews and inflation were offset by productivity benefits primarily from organisational redesign, rationalisation of a further 24 branches in First Half 2020, and further use of digital channels. •Mortgage 90+ day delinquencies of 0.94% were up 4 basis points since September 2019 (0.90%). Other consumer 90+ day delinquencies of 1.96%, up 21 basis points over the half, with most of the increase due to reduced collections capacity from COVID-19 impacts. Portfolio contraction also contributed to the increase; and •Impairment charges were higher, mostly reflecting COVID-19 impacts. These resulted in changes4 to the base case economic forecasts and increasing the weight applied to the downside economic scenario used in AASB 9 provision models, and an increase in the overlay provision for other personal lending. 5 6 7 |
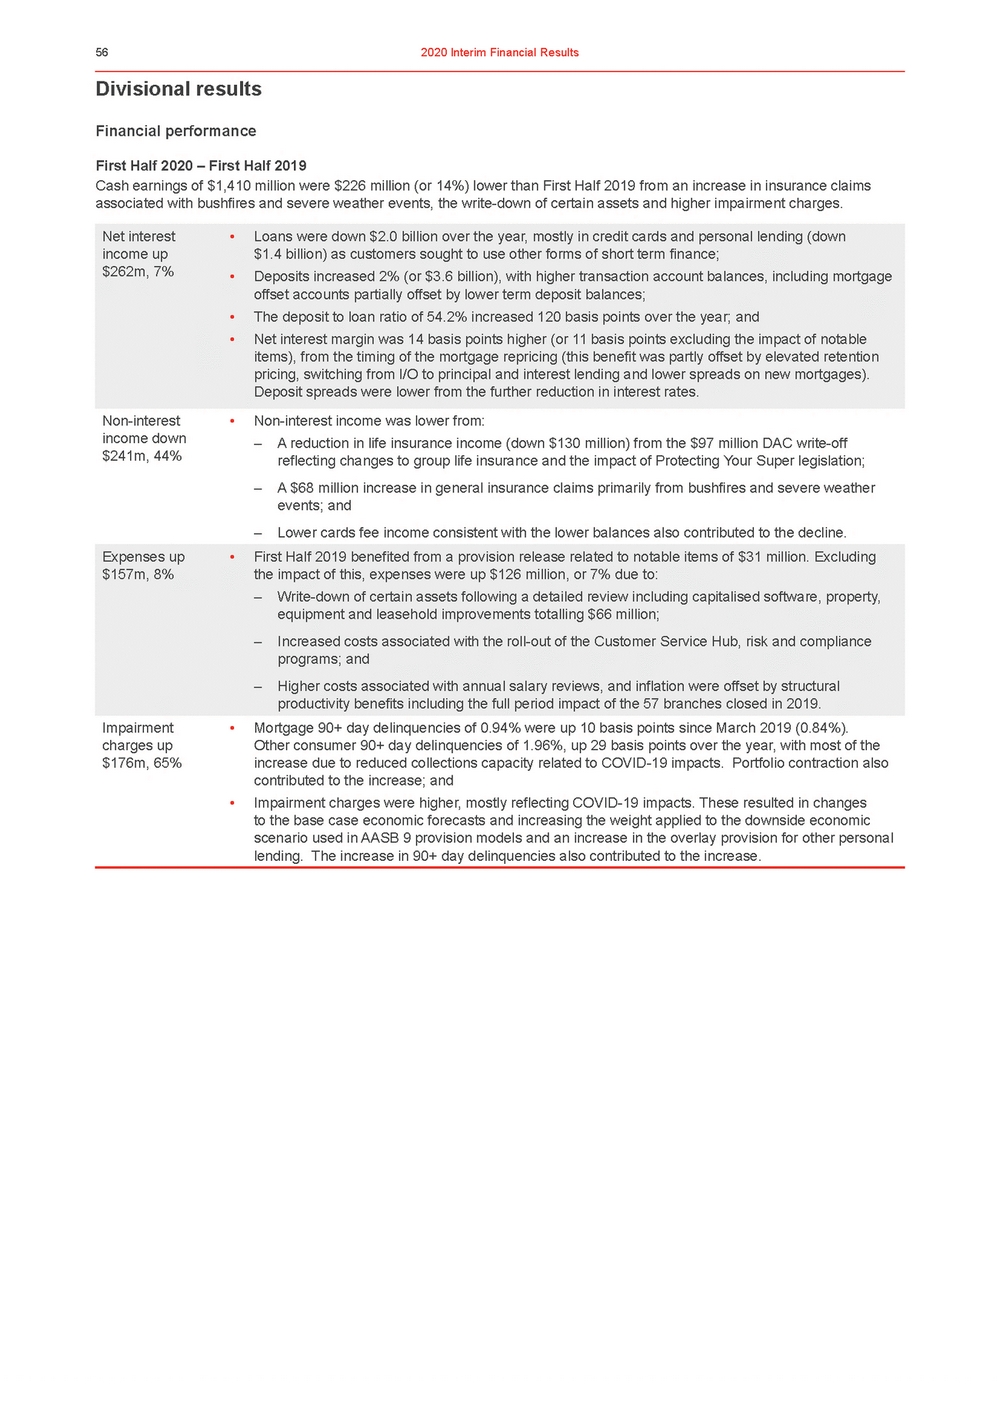 | Divisional results Financial performance First Half 2020 – First Half 2019 Cash earnings of $1,410 million were $226 million (or 14%) lower than First Half 2019 from an increase in insurance claims associated with bushfires and severe weather events, the write-down of certain assets and higher impairment charges. Net interest income up $262m, 7% •Loans were down $2.0 billion over the year, mostly in credit cards and personal lending (down $1.4 billion) as customers sought to use other forms of short term finance; •Deposits increased 2% (or $3.6 billion), with higher transaction account balances, including mortgage offset accounts partially offset by lower term deposit balances; •The deposit to loan ratio of 54.2% increased 120 basis points over the year; and •Net interest margin was 14 basis points higher (or 11 basis points excluding the impact of notable items), from the timing of the mortgage repricing (this benefit was partly offset by elevated retention pricing, switching from I/O to principal and interest lending and lower spreads on new mortgages). Deposit spreads were lower from the further reduction in interest rates. Non-interest income down $241m, 44% Expenses up $157m, 8% Impairment charges up $176m, 65% •Non-interest income was lower from: – A reduction in life insurance income (down $130 million) from the $97 million DAC write-off reflecting changes to group life insurance and the impact of Protecting Your Super legislation; – A $68 million increase in general insurance claims primarily from bushfires and severe weather events; and – Lower cards fee income consistent with the lower balances also contributed to the decline. •First Half 2019 benefited from a provision release related to notable items of $31 million. Excluding the impact of this, expenses were up $126 million, or 7% due to: – Write-down of certain assets following a detailed review including capitalised software, property, equipment and leasehold improvements totalling $66 million; – Increased costs associated with the roll-out of the Customer Service Hub, risk and compliance programs; and – Higher costs associated with annual salary reviews, and inflation were offset by structural productivity benefits including the full period impact of the 57 branches closed in 2019. •Mortgage 90+ day delinquencies of 0.94% were up 10 basis points since March 2019 (0.84%). Other consumer 90+ day delinquencies of 1.96%, up 29 basis points over the year, with most of the increase due to reduced collections capacity related to COVID-19 impacts. Portfolio contraction also contributed to the increase; and •Impairment charges were higher, mostly reflecting COVID-19 impacts. These resulted in changes to the base case economic forecasts and increasing the weight applied to the downside economic scenario used in AASB 9 provision models and an increase in the overlay provision for other personal lending. The increase in 90+ day delinquencies also contributed to the increase. |
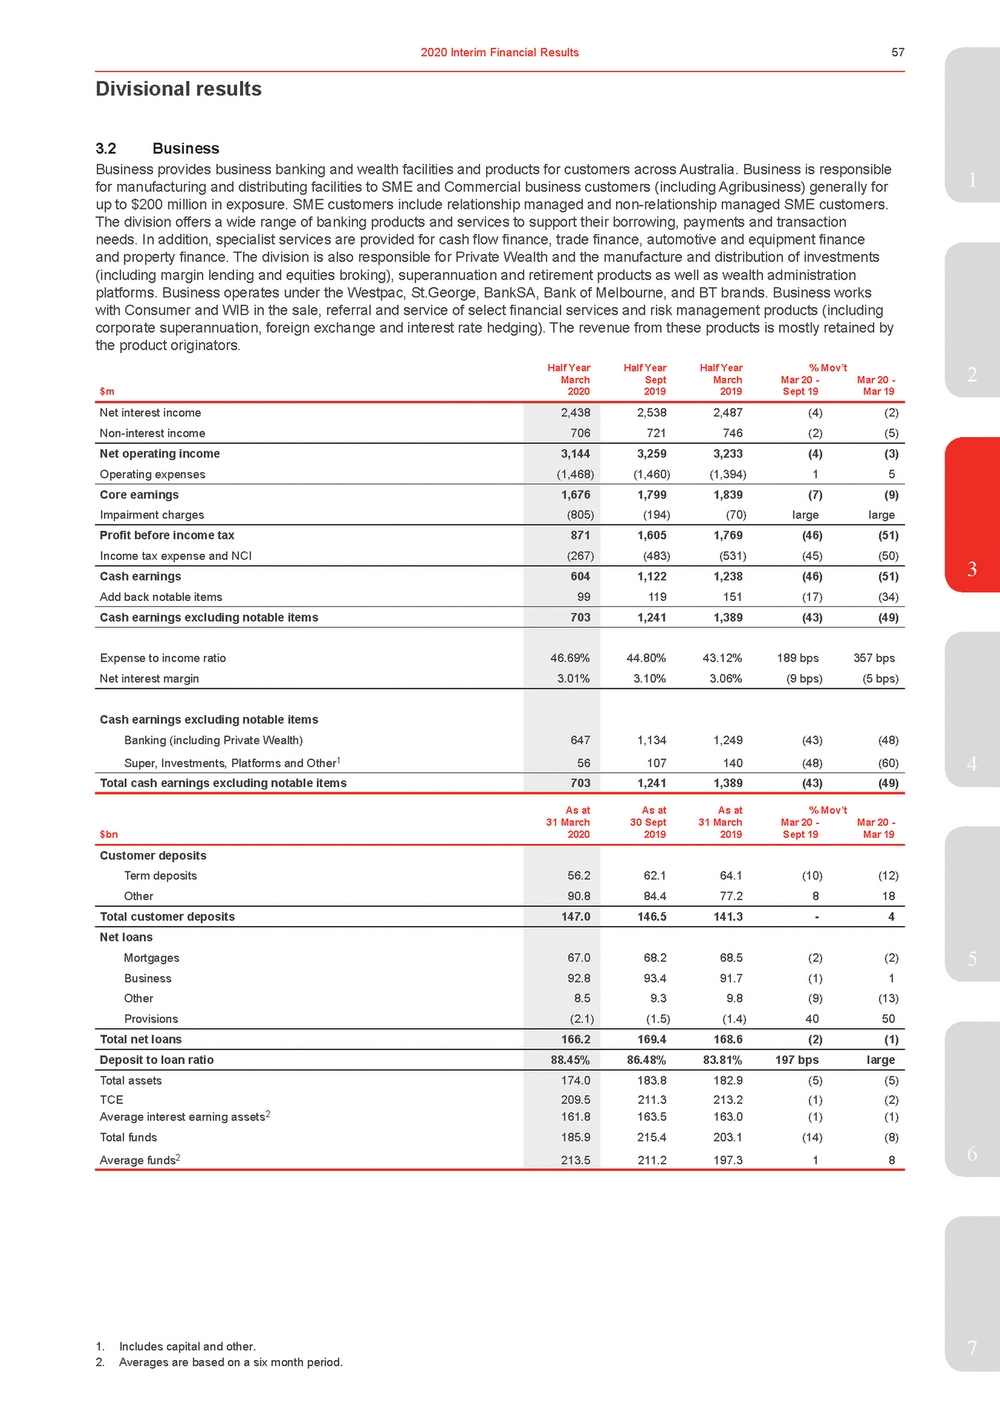 | 1 for manufacturing and distributing facilities to SME and Commercial business customers (including Agribusiness) generally for up to $200 million in exposure. SME customers include relationship managed and non-relationship managed SME customers. The division offers a wide range of banking products and services to support their borrowing, payments and transaction needs. In addition, specialist services are provided for cash flow finance, trade finance, automotive and equipment finance and property finance. The division is also responsible for Private Wealth and the manufacture and distribution of investments (including margin lending and equities broking), superannuation and retirement products as well as wealth administration platforms. Business operates under the Westpac, St.George, BankSA, Bank of Melbourne, and BT brands. Business works with Consumer and WIB in the sale, referral and service of select financial services and risk management products (including corporate superannuation, foreign exchange and interest rate hedging). The revenue from these products is mostly retained by the product originators. Half YearHalf YearHalf Year% Mov’t2 March $m2020 Sept 2019 March 2019 Mar 20 - Sept 19 Mar 20 - Mar 19 Net interest income Non-interest income 2,438 706 2,5382,487(4)(2) 721746(2)(5) Net operating income Operating expenses 3,144 (1,468) 3,2593,233(4)(3) (1,460)(1,394)15 Core earnings Impairment charges 1,676 (805) 1,7991,839(7)(9) (194)(70)largelarge Profit before income tax Income tax expense and NCI 871 (267) 1,6051,769(46)(51) (483)(531)(45)(50) Cash earnings Add back notable items 604 99 1,1221,238(46)(51) 119151(17)(34) Cash earnings excluding notable items 703 1,2411,389(43)(49) Expense to income ratio Net interest margin 46.69% 3.01% 44.80%43.12%189 bps357 bps 3.10%3.06%(9 bps)(5 bps) Cash earnings excluding notable items Banking (including Private Wealth) Super, Investments, Platforms and Other1 647 56 1,1341,249(43)(48) 107140(48)(60) Total cash earnings excluding notable items 703 1,2411,389(43)(49) 4 As atAs atAs at% Mov’t $bn 31 March 2020 30 Sept 2019 31 March 2019 Mar 20 - Sept 19 Mar 20 - Mar 19 Customer deposits Term deposits Other 56.2 90.8 62.164.1(10)(12) 84.477.2818 Total customer deposits 147.0 146.5141.3-4 Net loans Mortgages Business Other Provisions 67.0 92.8 8.5 (2.1) 68.268.5(2)(2) 93.491.7(1)1 9.3 9.8 (9)(13) (1.5)(1.4)40 50 Total net loans 166.2 169.4168.6(2)(1) Deposit to loan ratio 88.45% 86.48%83.81%197 bpslarge Total assets TCE Average interest earning assets2 Total funds Average funds2 174.0 209.5 161.8 185.9 213.5 183.8182.9(5)(5) 211.3213.2(1)(2) 163.5163.0(1)(1) 215.4203.1(14)(8) 211.2197.318 6 1. Includes capital and other.7 2. Averages are based on a six month period. |
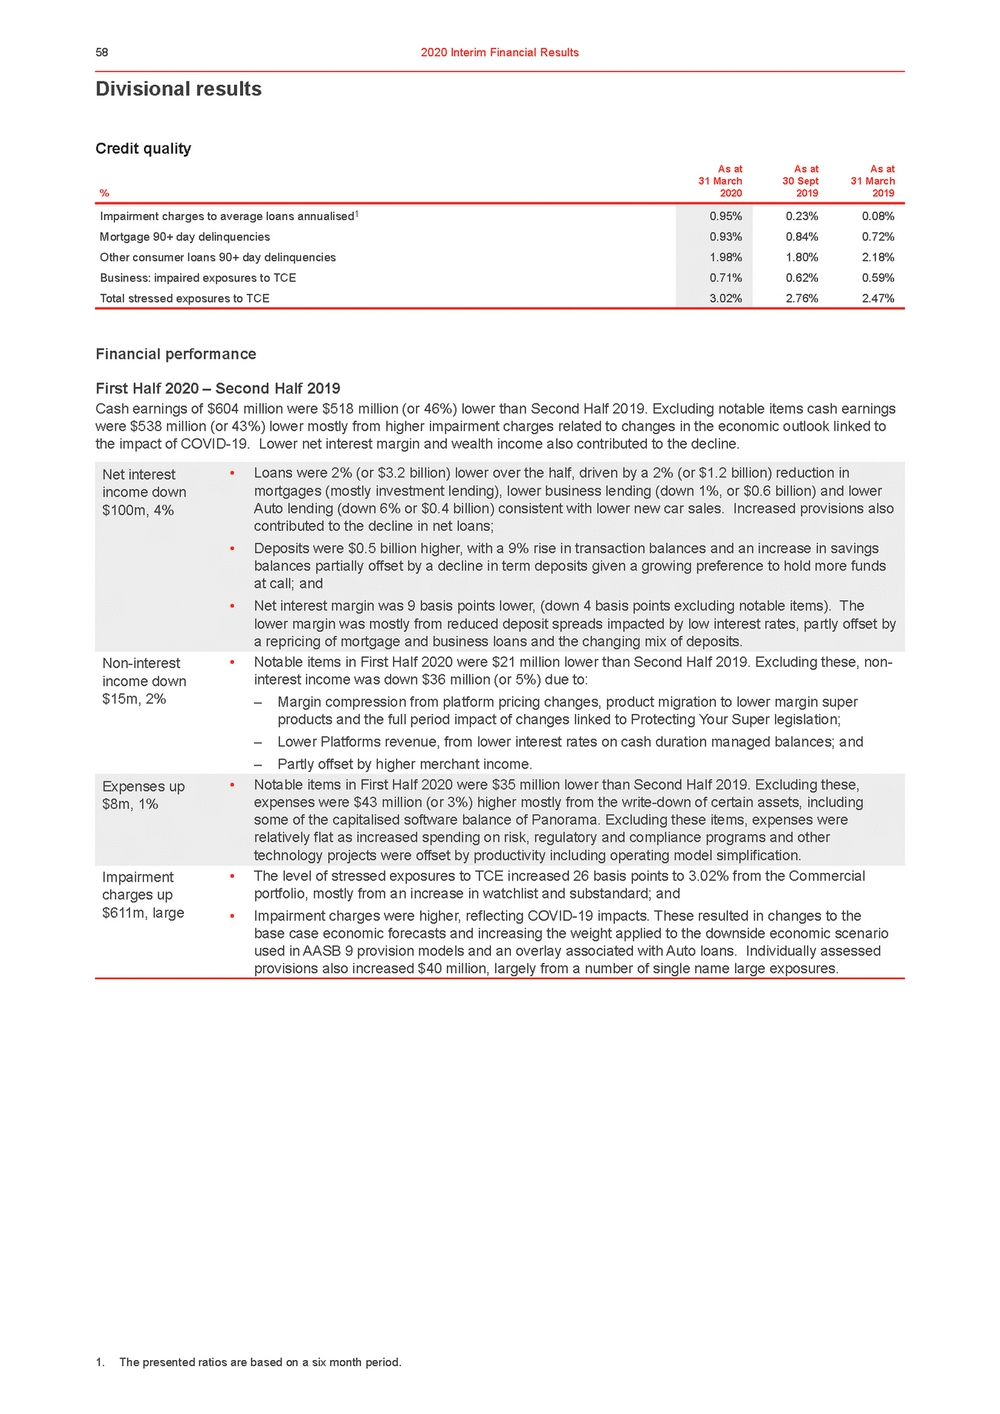 | Divisional results Credit quality As atAs atAs at 31 March %2020 30 Sept 2019 31 March 2019 Impairment charges to average loans annualised1 0.95% 0.23% 0.08% Mortgage 90+ day delinquencies 0.93% 0.84% 0.72% Other consumer loans 90+ day delinquencies 1.98% 1.80% 2.18% Business: impaired exposures to TCE 0.71% 0.62% 0.59% Total stressed exposures to TCE 3.02% 2.76% 2.47% Financial performance First Half 2020 – Second Half 2019 Cash earnings of $604 million were $518 million (or 46%) lower than Second Half 2019. Excluding notable items cash earnings were $538 million (or 43%) lower mostly from higher impairment charges related to changes in the economic outlook linked to the impact of COVID-19. Lower net interest margin and wealth income also contributed to the decline. Net interest income down $100m, 4% Non-interest income down $15m, 2% Expenses up $8m, 1% Impairment charges up $611m, large •Loans were 2% (or $3.2 billion) lower over the half, driven by a 2% (or $1.2 billion) reduction in mortgages (mostly investment lending), lower business lending (down 1%, or $0.6 billion) and lower Auto lending (down 6% or $0.4 billion) consistent with lower new car sales. Increased provisions also contributed to the decline in net loans; •Deposits were $0.5 billion higher, with a 9% rise in transaction balances and an increase in savings balances partially offset by a decline in term deposits given a growing preference to hold more funds at call; and •Net interest margin was 9 basis points lower, (down 4 basis points excluding notable items). The lower margin was mostly from reduced deposit spreads impacted by low interest rates, partly offset by a repricing of mortgage and business loans and the changing mix of deposits. •Notable items in First Half 2020 were $21 million lower than Second Half 2019. Excluding these, non-interest income was down $36 million (or 5%) due to: – Margin compression from platform pricing changes, product migration to lower margin super products and the full period impact of changes linked to Protecting Your Super legislation; – Lower Platforms revenue, from lower interest rates on cash duration managed balances; and – Partly offset by higher merchant income. •Notable items in First Half 2020 were $35 million lower than Second Half 2019. Excluding these, expenses were $43 million (or 3%) higher mostly from the write-down of certain assets, including some of the capitalised software balance of Panorama. Excluding these items, expenses were relatively flat as increased spending on risk, regulatory and compliance programs and other technology projects were offset by productivity including operating model simplification. •The level of stressed exposures to TCE increased 26 basis points to 3.02% from the Commercial portfolio, mostly from an increase in watchlist and substandard; and •Impairment charges were higher, reflecting COVID-19 impacts. These resulted in changes to the base case economic forecasts and increasing the weight applied to the downside economic scenario used in AASB 9 provision models and an overlay associated with Auto loans. Individually assessed provisions also increased $40 million, largely from a number of single name large exposures. 1. The presented ratios are based on a six month period. |
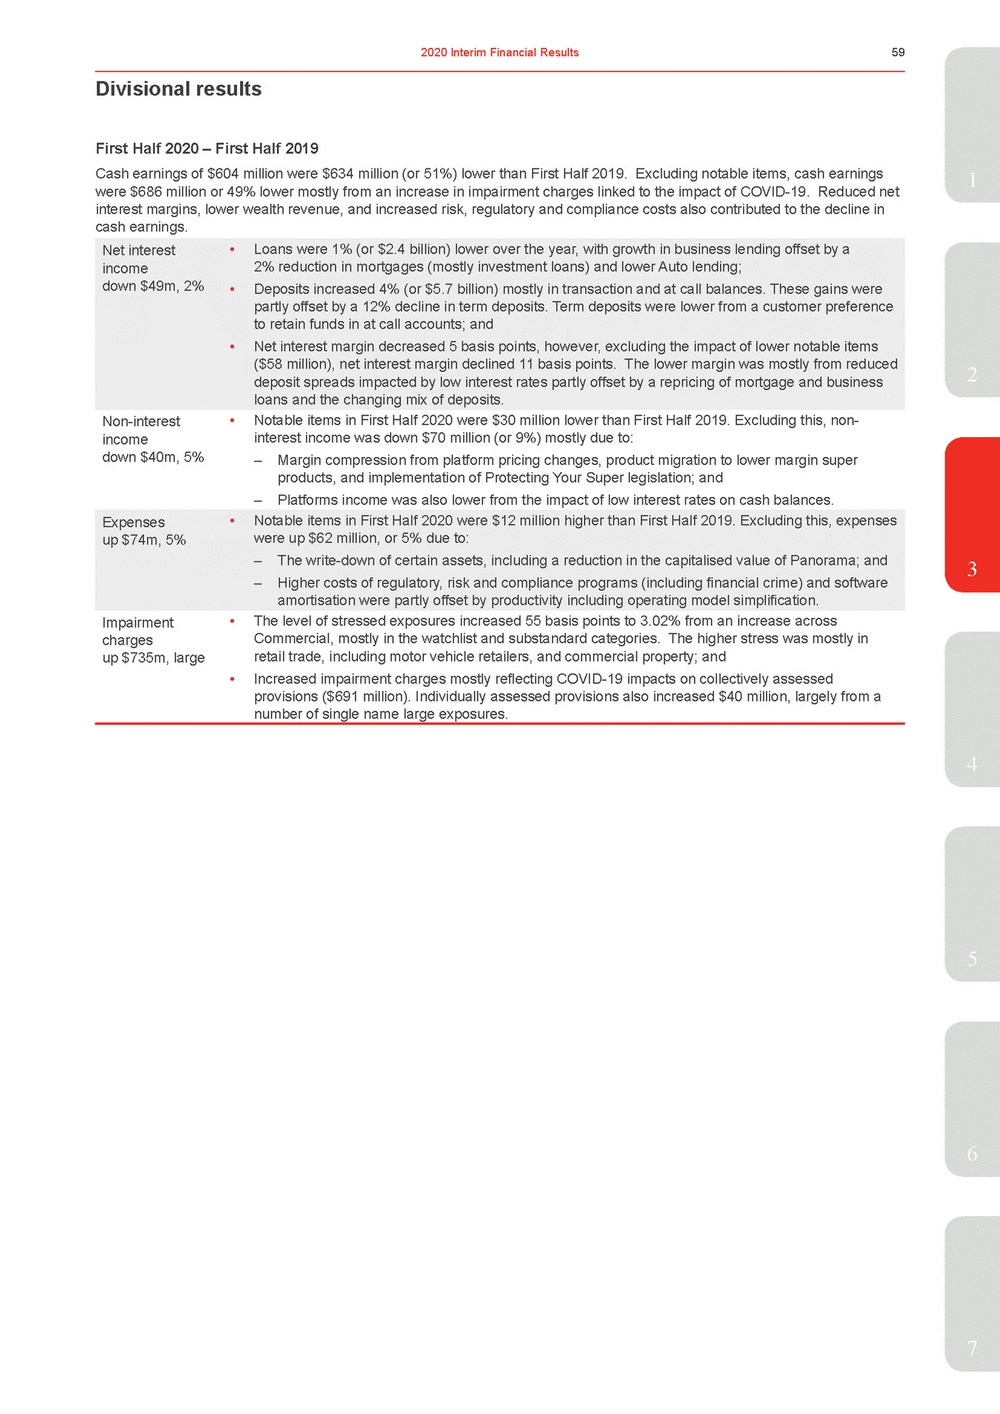 | Cash earnings of $604 million were $634 million (or 51%) lower than First Half 2019. Excluding notable items, cash earnings1 were $686 million or 49% lower mostly from an increase in impairment charges linked to the impact of COVID-19. Reduced net interest margins, lower wealth revenue, and increased risk, regulatory and compliance costs also contributed to the decline in cash earnings. Net interest income down $49m, 2% Non-interest income down $40m, 5% Expenses up $74m, 5% Impairment charges up $735m, large •Loans were 1% (or $2.4 billion) lower over the year, with growth in business lending offset by a 2% reduction in mortgages (mostly investment loans) and lower Auto lending; •Deposits increased 4% (or $5.7 billion) mostly in transaction and at call balances. These gains were partly offset by a 12% decline in term deposits. Term deposits were lower from a customer preference to retain funds in at call accounts; and 2 •Notable items in First Half 2020 were $30 million lower than First Half 2019. Excluding this, non-interest income was down $70 million (or 9%) mostly due to: – Margin compression from platform pricing changes, product migration to lower margin super products, and implementation of Protecting Your Super legislation; and – Platforms income was also lower from the impact of low interest rates on cash balances. •Notable items in First Half 2020 were $12 million higher than First Half 2019. Excluding this, expenses were up $62 million, or 5% due to: – The write-down of certain assets, including a reduction in the capitalised value of Panorama; and3 – Higher costs of regulatory, risk and compliance programs (including financial crime) and software amortisation were partly offset by productivity including operating model simplification. •The level of stressed exposures increased 55 basis points to 3.02% from an increase across Commercial, mostly in the watchlist and substandard categories. The higher stress was mostly in retail trade, including motor vehicle retailers, and commercial property; and •Increased impairment charges mostly reflecting COVID-19 impacts on collectively assessed provisions ($691 million). Individually assessed provisions also increased $40 million, largely from a number of single name large exposures. 4 5 6 7 |
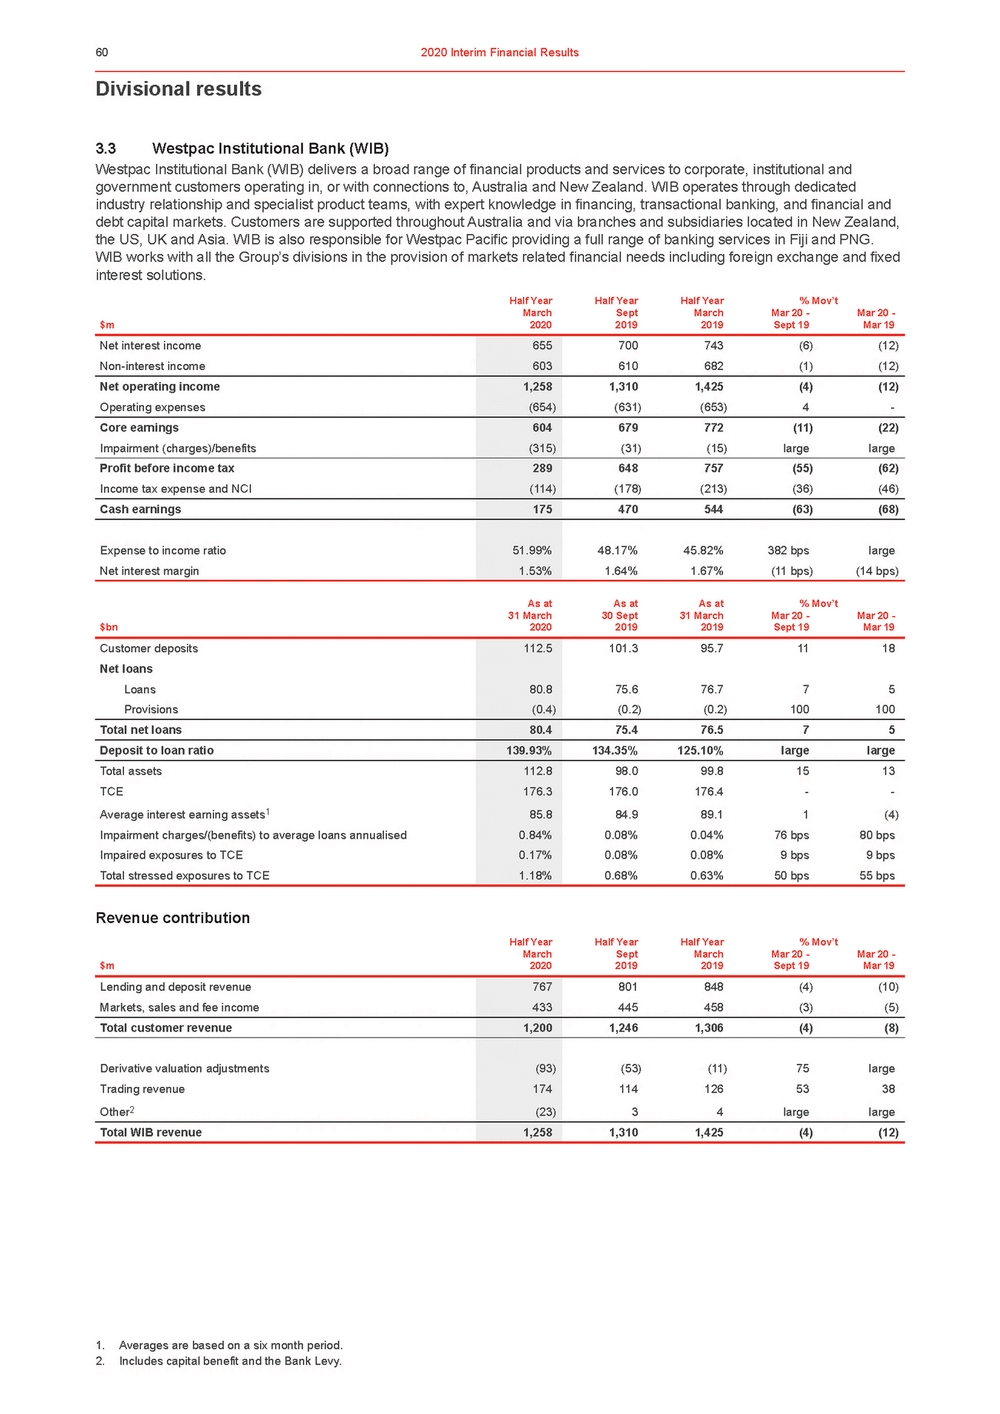 | Divisional results 3.3Westpac Institutional Bank (WIB) Westpac Institutional Bank (WIB) delivers a broad range of financial products and services to corporate, institutional and government customers operating in, or with connections to, Australia and New Zealand. WIB operates through dedicated industry relationship and specialist product teams, with expert knowledge in financing, transactional banking, and financial and debt capital markets. Customers are supported throughout Australia and via branches and subsidiaries located in New Zealand, the US, UK and Asia. WIB is also responsible for Westpac Pacific providing a full range of banking services in Fiji and PNG. WIB works with all the Group’s divisions in the provision of markets related financial needs including foreign exchange and fixed interest solutions. Half YearHalf YearHalf Year% Mov’t March $m2020 Sept 2019 March 2019 Mar 20 - Sept 19 Mar 20 - Mar 19 As atAs atAs at% Mov’t $bn 31 March 2020 30 Sept 2019 31 March 2019 Mar 20 - Sept 19 Mar 20 - Mar 19 Revenue contribution Half YearHalf YearHalf Year% Mov’t March $m2020 Sept 2019 March 2019 Mar 20 - Sept 19 Mar 20 - Mar 19 1. Averages are based on a six month period. 2. Includes capital benefit and the Bank Levy. |
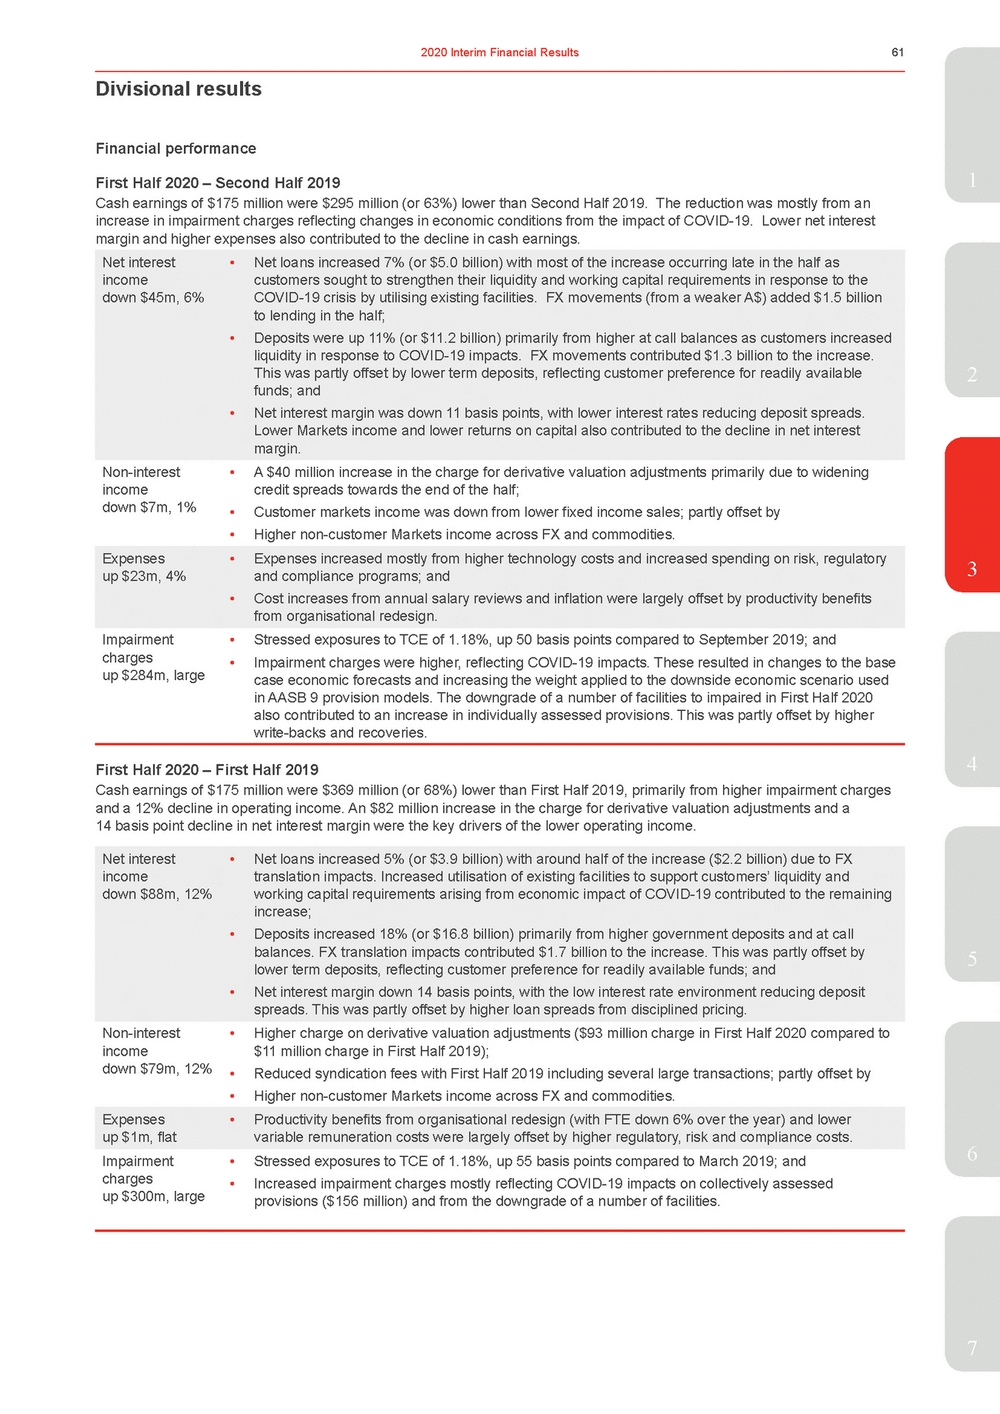 | Cash earnings of $175 million were $295 million (or 63%) lower than Second Half 2019. The reduction was mostly from an increase in impairment charges reflecting changes in economic conditions from the impact of COVID-19. Lower net interest margin and higher expenses also contributed to the decline in cash earnings. Net interest income down $45m, 6% Non-interest income down $7m, 1% Expenses up $23m, 4% Impairment charges up $284m, large •Net loans increased 7% (or $5.0 billion) with most of the increase occurring late in the half as customers sought to strengthen their liquidity and working capital requirements in response to the COVID-19 crisis by utilising existing facilities. FX movements (from a weaker A$) added $1.5 billion to lending in the half; •Deposits were up 11% (or $11.2 billion) primarily from higher at call balances as customers increased liquidity in response to COVID-19 impacts. FX movements contributed $1.3 billion to the increase. This was partly offset by lower term deposits, reflecting customer preference for readily available2 funds; and •Net interest margin was down 11 basis points, with lower interest rates reducing deposit spreads. Lower Markets income and lower returns on capital also contributed to the decline in net interest margin. •A $40 million increase in the charge for derivative valuation adjustments primarily due to widening credit spreads towards the end of the half; •Customer markets income was down from lower fixed income sales; partly offset by •Higher non-customer Markets income across FX and commodities. 3 •Cost increases from annual salary reviews and inflation were largely offset by productivity benefits from organisational redesign. •Stressed exposures to TCE of 1.18%, up 50 basis points compared to September 2019; and •Impairment charges were higher, reflecting COVID-19 impacts. These resulted in changes to the base case economic forecasts and increasing the weight applied to the downside economic scenario used in AASB 9 provision models. The downgrade of a number of facilities to impaired in First Half 2020 also contributed to an increase in individually assessed provisions. This was partly offset by higher write-backs and recoveries. First Half 2020 – First Half 20194 Cash earnings of $175 million were $369 million (or 68%) lower than First Half 2019, primarily from higher impairment charges and a 12% decline in operating income. An $82 million increase in the charge for derivative valuation adjustments and a 14 basis point decline in net interest margin were the key drivers of the lower operating income. Net interest income down $88m, 12% Non-interest income down $79m, 12% Expenses up $1m, flat Impairment charges up $300m, large •Net loans increased 5% (or $3.9 billion) with around half of the increase ($2.2 billion) due to FX translation impacts. Increased utilisation of existing facilities to support customers’ liquidity and working capital requirements arising from economic impact of COVID-19 contributed to the remaining increase; 5 •Net interest margin down 14 basis points, with the low interest rate environment reducing deposit spreads. This was partly offset by higher loan spreads from disciplined pricing. •Higher charge on derivative valuation adjustments ($93 million charge in First Half 2020 compared to $11 million charge in First Half 2019); •Reduced syndication fees with First Half 2019 including several large transactions; partly offset by •Higher non-customer Markets income across FX and commodities. •Productivity benefits from organisational redesign (with FTE down 6% over the year) and lower variable remuneration costs were largely offset by higher regulatory, risk and compliance costs. •Stressed exposures to TCE of 1.18%, up 55 basis points compared to March 2019; and6 •Increased impairment charges mostly reflecting COVID-19 impacts on collectively assessed provisions ($156 million) and from the downgrade of a number of facilities. 7 |
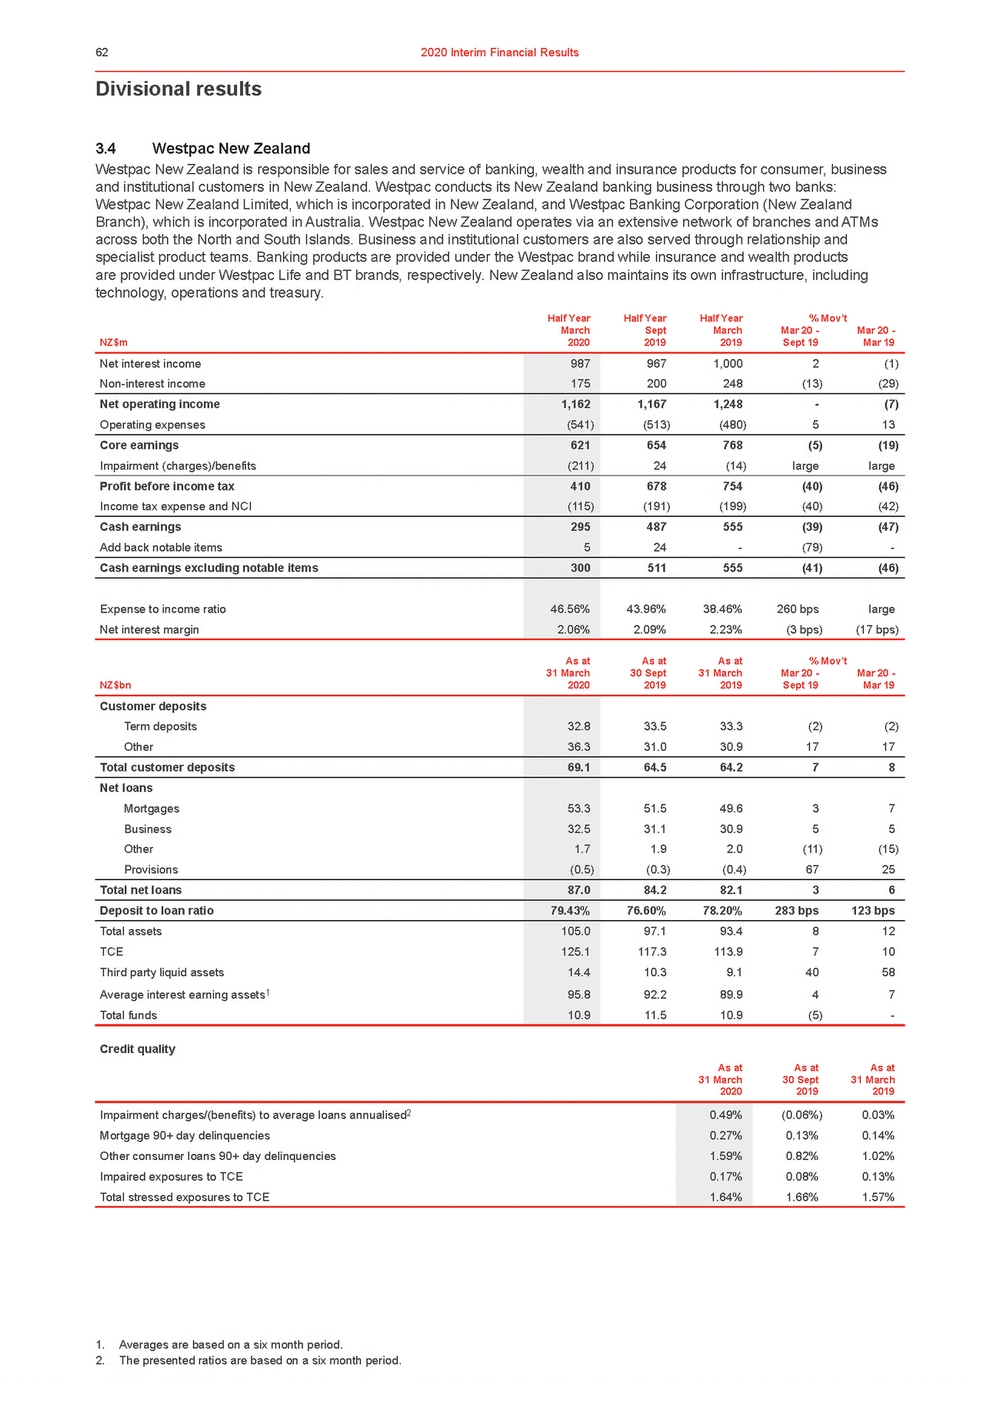 | Divisional results 3.4Westpac New Zealand Westpac New Zealand is responsible for sales and service of banking, wealth and insurance products for consumer, business and institutional customers in New Zealand. Westpac conducts its New Zealand banking business through two banks: Westpac New Zealand Limited, which is incorporated in New Zealand, and Westpac Banking Corporation (New Zealand Branch), which is incorporated in Australia. Westpac New Zealand operates via an extensive network of branches and ATMs across both the North and South Islands. Business and institutional customers are also served through relationship and specialist product teams. Banking products are provided under the Westpac brand while insurance and wealth products are provided under Westpac Life and BT brands, respectively. New Zealand also maintains its own infrastructure, including technology, operations and treasury. Half YearHalf YearHalf Year% Mov’t NZ$m March 2020 Sept 2019 March 2019 Mar 20 - Sept 19 Mar 20 - Mar 19 As atAs atAs at% Mov’t NZ$bn 31 March 2020 30 Sept 2019 31 March 2019 Mar 20 - Sept 19 Mar 20 - Mar 19 Credit quality As atAs atAs at 31 March 2020 30 Sept 2019 31 March 2019 Impairment charges/(benefits) to average loans annualised2 0.49% (0.06%) 0.03% Mortgage 90+ day delinquencies 0.27% 0.13% 0.14% Other consumer loans 90+ day delinquencies 1.59% 0.82% 1.02% Impaired exposures to TCE 0.17% 0.08% 0.13% Total stressed exposures to TCE 1.64% 1.66% 1.57% 1. Averages are based on a six month period. 2. The presented ratios are based on a six month period. |
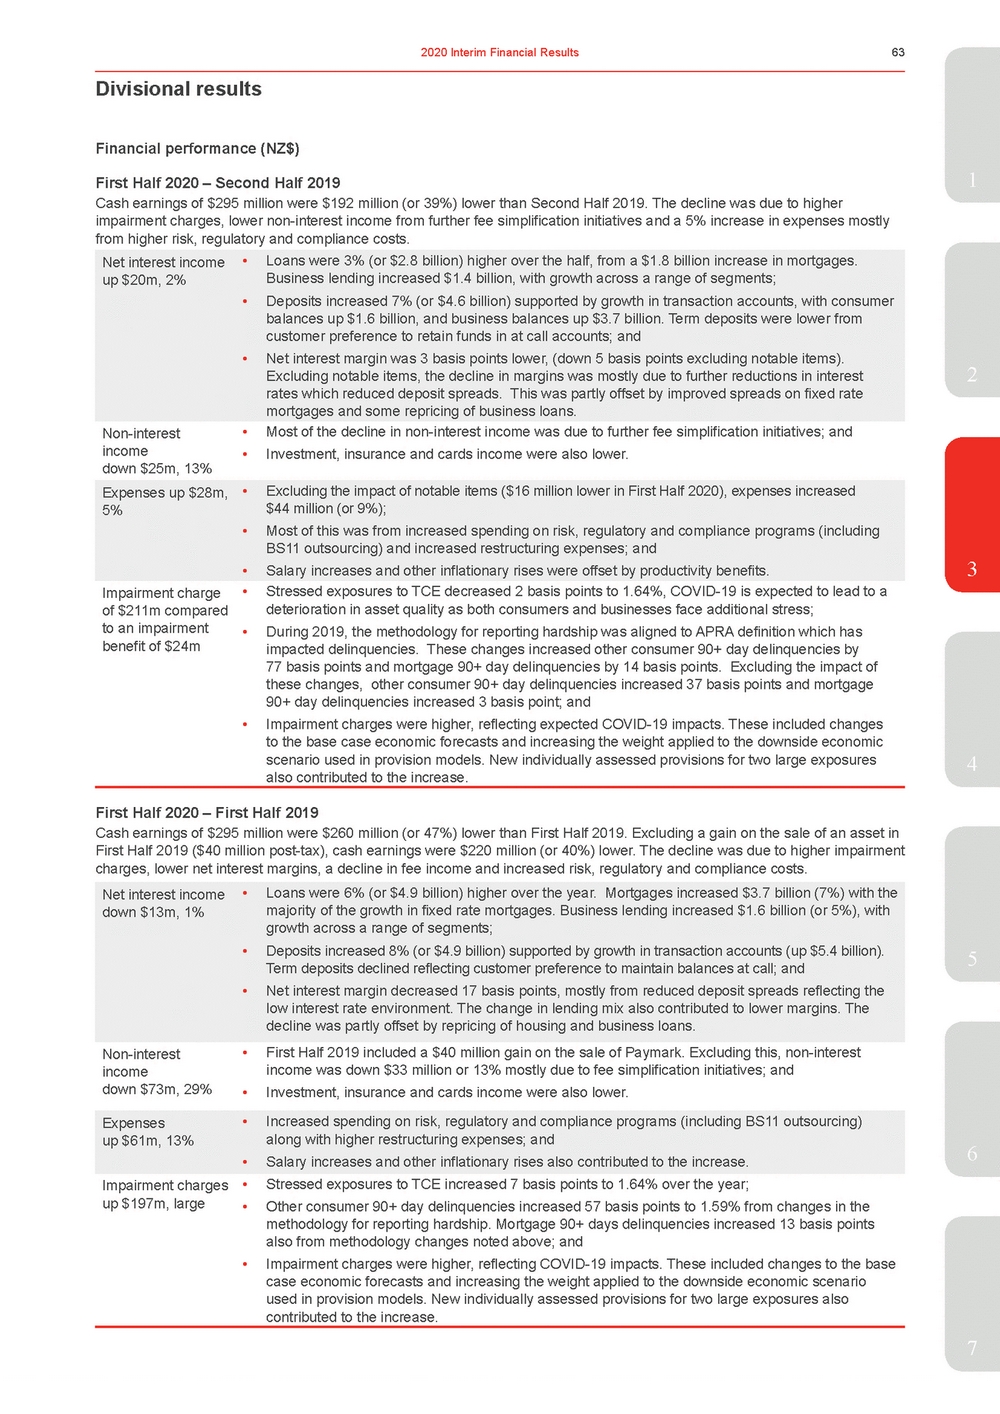 | Cash earnings of $295 million were $192 million (or 39%) lower than Second Half 2019. The decline was due to higher impairment charges, lower non-interest income from further fee simplification initiatives and a 5% increase in expenses mostly from higher risk, regulatory and compliance costs. Net interest income up $20m, 2% Non-interest income down $25m, 13% Expenses up $28m, 5% Impairment charge of $211m compared to an impairment benefit of $24m •Loans were 3% (or $2.8 billion) higher over the half, from a $1.8 billion increase in mortgages. Business lending increased $1.4 billion, with growth across a range of segments; •Deposits increased 7% (or $4.6 billion) supported by growth in transaction accounts, with consumer balances up $1.6 billion, and business balances up $3.7 billion. Term deposits were lower from customer preference to retain funds in at call accounts; and •Net interest margin was 3 basis points lower, (down 5 basis points excluding notable items). Excluding notable items, the decline in margins was mostly due to further reductions in interest2 rates which reduced deposit spreads. This was partly offset by improved spreads on fixed rate mortgages and some repricing of business loans. •Most of the decline in non-interest income was due to further fee simplification initiatives; and •Investment, insurance and cards income were also lower. •Excluding the impact of notable items ($16 million lower in First Half 2020), expenses increased $44 million (or 9%); •Most of this was from increased spending on risk, regulatory and compliance programs (including BS11 outsourcing) and increased restructuring expenses; and •Salary increases and other inflationary rises were offset by productivity benefits.3 •Stressed exposures to TCE decreased 2 basis points to 1.64%, COVID-19 is expected to lead to a deterioration in asset quality as both consumers and businesses face additional stress; •During 2019, the methodology for reporting hardship was aligned to APRA definition which has impacted delinquencies. These changes increased other consumer 90+ day delinquencies by 77 basis points and mortgage 90+ day delinquencies by 14 basis points. Excluding the impact of these changes, other consumer 90+ day delinquencies increased 37 basis points and mortgage 90+ day delinquencies increased 3 basis point; and •Impairment charges were higher, reflecting expected COVID-19 impacts. These included changes to the base case economic forecasts and increasing the weight applied to the downside economic scenario used in provision models. New individually assessed provisions for two large exposures4 also contributed to the increase. First Half 2020 – First Half 2019 Cash earnings of $295 million were $260 million (or 47%) lower than First Half 2019. Excluding a gain on the sale of an asset in First Half 2019 ($40 million post-tax), cash earnings were $220 million (or 40%) lower. The decline was due to higher impairment charges, lower net interest margins, a decline in fee income and increased risk, regulatory and compliance costs. Net interest income down $13m, 1% Non-interest income down $73m, 29% Expenses up $61m, 13% Impairment charges up $197m, large •Loans were 6% (or $4.9 billion) higher over the year. Mortgages increased $3.7 billion (7%) with the majority of the growth in fixed rate mortgages. Business lending increased $1.6 billion (or 5%), with growth across a range of segments; 5 Term deposits declined reflecting customer preference to maintain balances at call; and •Net interest margin decreased 17 basis points, mostly from reduced deposit spreads reflecting the low interest rate environment. The change in lending mix also contributed to lower margins. The decline was partly offset by repricing of housing and business loans. •First Half 2019 included a $40 million gain on the sale of Paymark. Excluding this, non-interest income was down $33 million or 13% mostly due to fee simplification initiatives; and •Investment, insurance and cards income were also lower. •Increased spending on risk, regulatory and compliance programs (including BS11 outsourcing) along with higher restructuring expenses; and •Salary increases and other inflationary rises also contributed to the increase.6 •Stressed exposures to TCE increased 7 basis points to 1.64% over the year; •Other consumer 90+ day delinquencies increased 57 basis points to 1.59% from changes in the methodology for reporting hardship. Mortgage 90+ days delinquencies increased 13 basis points also from methodology changes noted above; and •Impairment charges were higher, reflecting COVID-19 impacts. These included changes to the base case economic forecasts and increasing the weight applied to the downside economic scenario used in provision models. New individually assessed provisions for two large exposures also contributed to the increase. 7 |
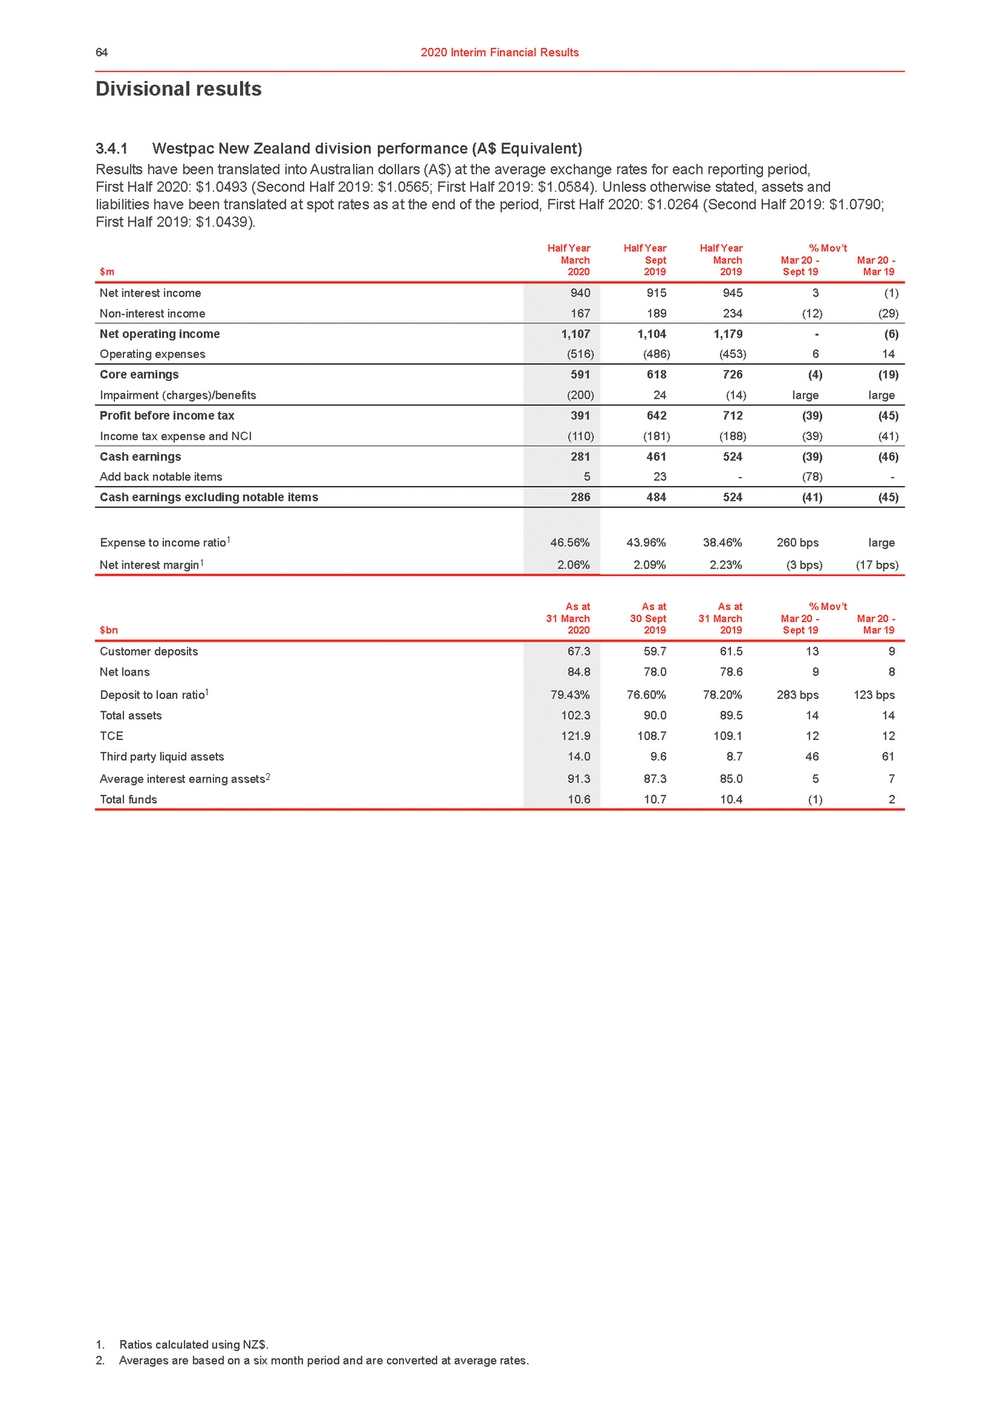 | Divisional results 3.4.1Westpac New Zealand division performance (A$ Equivalent) Results have been translated into Australian dollars (A$) at the average exchange rates for each reporting period, First Half 2020: $1.0493 (Second Half 2019: $1.0565; First Half 2019: $1.0584). Unless otherwise stated, assets and liabilities have been translated at spot rates as at the end of the period, First Half 2020: $1.0264 (Second Half 2019: $1.0790; First Half 2019: $1.0439). Half YearHalf YearHalf Year% Mov’t March $m2020 Sept 2019 March 2019 Mar 20 - Sept 19 Mar 20 - Mar 19 1. Ratios calculated using NZ$. 2. Averages are based on a six month period and are converted at average rates. |
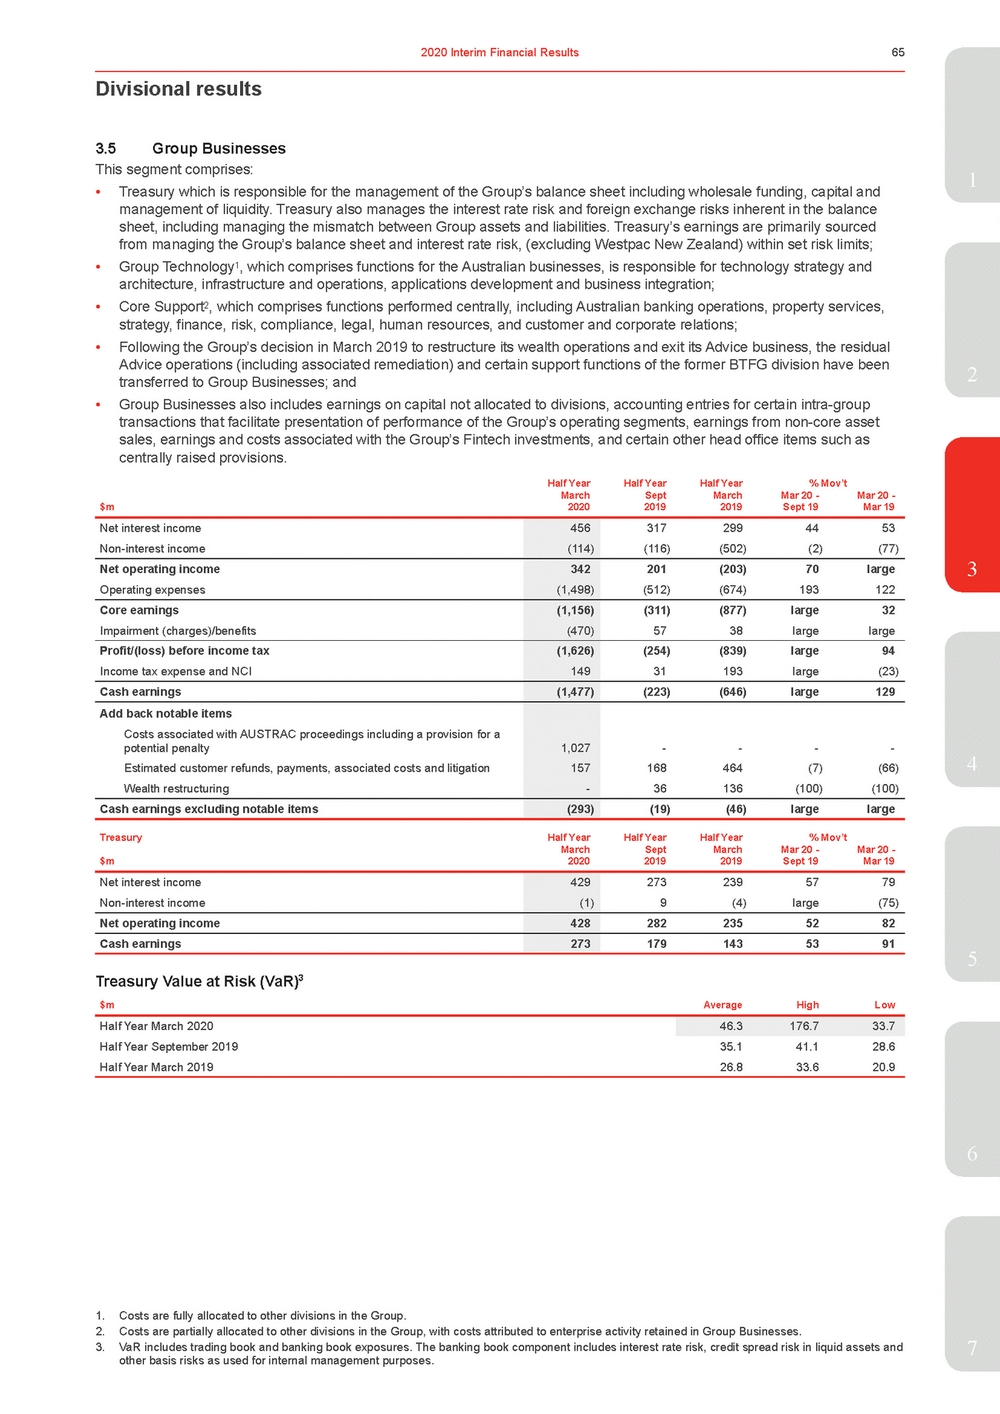 | This segment comprises:1 •Treasury which is responsible for the management of the Group’s balance sheet including wholesale funding, capital and management of liquidity. Treasury also manages the interest rate risk and foreign exchange risks inherent in the balance sheet, including managing the mismatch between Group assets and liabilities. Treasury’s earnings are primarily sourced from managing the Group’s balance sheet and interest rate risk, (excluding Westpac New Zealand) within set risk limits; •Group Technology1, which comprises functions for the Australian businesses, is responsible for technology strategy and architecture, infrastructure and operations, applications development and business integration; •Core Support2, which comprises functions performed centrally, including Australian banking operations, property services, strategy, finance, risk, compliance, legal, human resources, and customer and corporate relations; 2 •Group Businesses also includes earnings on capital not allocated to divisions, accounting entries for certain intra-group transactions that facilitate presentation of performance of the Group’s operating segments, earnings from non-core asset sales, earnings and costs associated with the Group’s Fintech investments, and certain other head office items such as centrally raised provisions. Half YearHalf YearHalf Year% Mov’t March $m2020 Sept 2019 March 2019 Mar 20 - Sept 19 Mar 20 - Mar 19 Net interest income Non-interest income 456 (114) 3172994453 (116)(502)(2)(77) Net operating income Operating expenses 342 (1,498) 201(203)70large (512)(674)193122 Core earnings Impairment (charges)/benefits (1,156) (470) (311)(877)large32 5738largelarge Profit/(loss) before income tax Income tax expense and NCI (1,626) 149 (254)(839)large94 31193large(23) Cash earnings (1,477) (223)(646)large129 Add back notable items Costs associated with AUSTRAC proceedings including a provision for a potential penalty Estimated customer refunds, payments, associated costs and litigation Wealth restructuring 1,027 157 - ----168464(7)(66) 36136(100)(100) Cash earnings excluding notable items (293) (19)(46)largelarge 4 TreasuryHalf YearHalf YearHalf Year% Mov’t March $m2020 Sept 2019 March 2019 Mar 20 - Sept 19 Mar 20 - Mar 19 Net interest income Non-interest income 429 (1) 2732395779 9(4)large(75) Net operating income 428 2822355282 Cash earnings 273 1791435391 Treasury Value at Risk (VaR)3 $mAverageHighLow Half Year March 202046.3176.733.7 Half Year September 201935.141.128.6 Half Year March 201926.833.620.9 6 1. Costs are fully allocated to other divisions in the Group. 2. Costs are partially allocated to other divisions in the Group, with costs attributed to enterprise activity retained in Group Businesses. 3. VaR includes trading book and banking book exposures. The banking book component includes interest rate risk, credit spread risk in liquid assets and7 other basis risks as used for internal management purposes. |
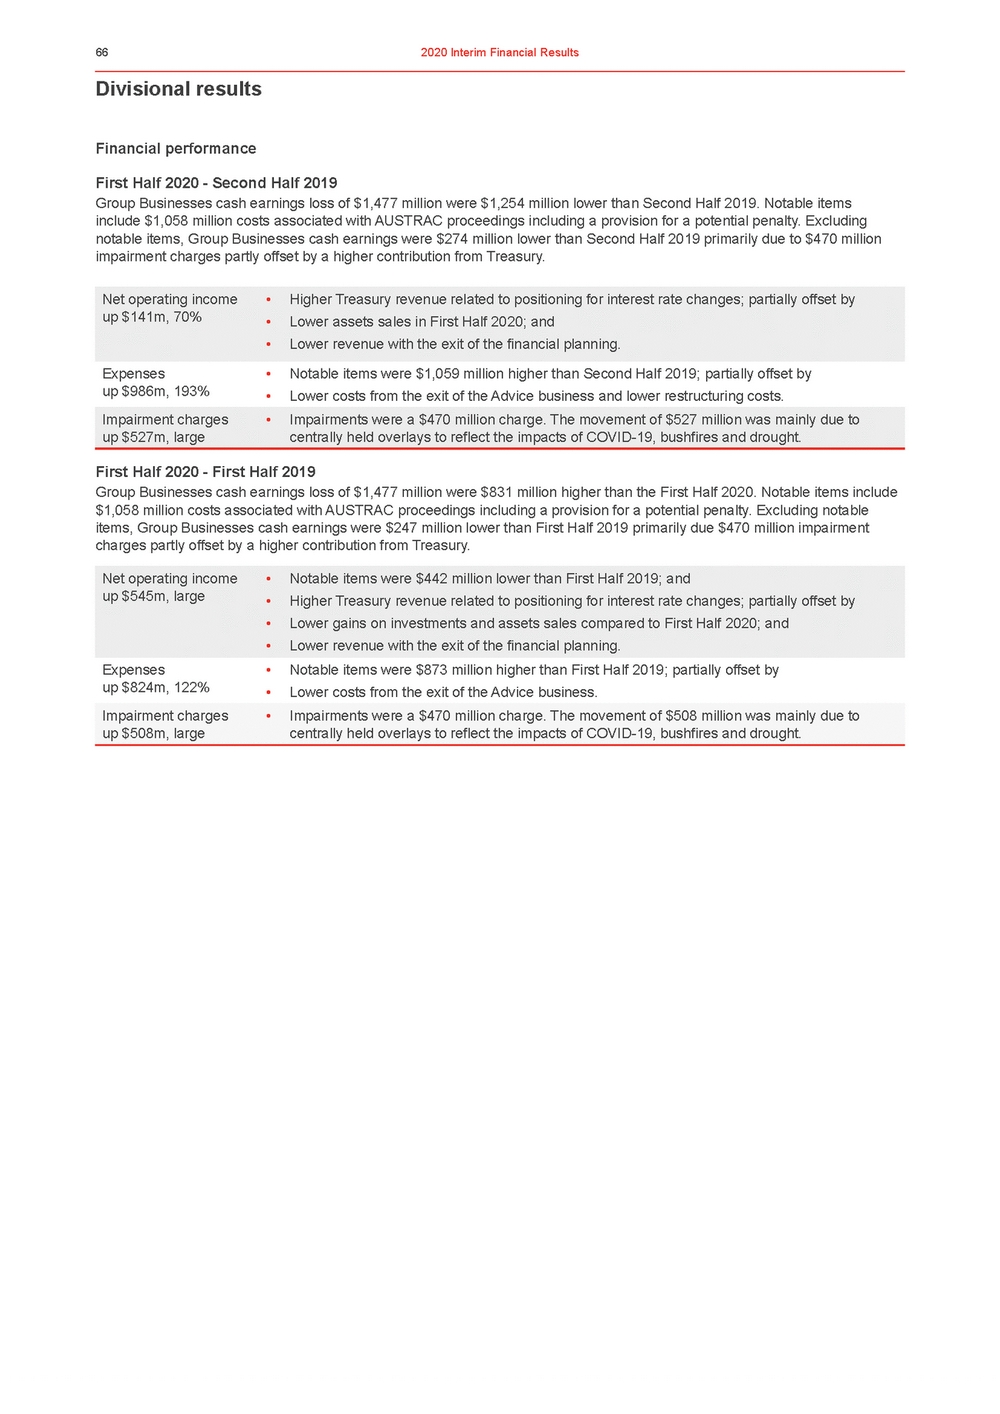 | Divisional results Financial performance First Half 2020 - Second Half 2019 Group Businesses cash earnings loss of $1,477 million were $1,254 million lower than Second Half 2019. Notable items include $1,058 million costs associated with AUSTRAC proceedings including a provision for a potential penalty. Excluding notable items, Group Businesses cash earnings were $274 million lower than Second Half 2019 primarily due to $470 million impairment charges partly offset by a higher contribution from Treasury. Net operating income up $141m, 70% •Higher Treasury revenue related to positioning for interest rate changes; partially offset by •Lower assets sales in First Half 2020; and •Lower revenue with the exit of the financial planning. Expenses up $986m, 193% Impairment charges up $527m, large •Notable items were $1,059 million higher than Second Half 2019; partially offset by •Lower costs from the exit of the Advice business and lower restructuring costs. •Impairments were a $470 million charge. The movement of $527 million was mainly due to centrally held overlays to reflect the impacts of COVID-19, bushfires and drought. First Half 2020 - First Half 2019 Group Businesses cash earnings loss of $1,477 million were $831 million higher than the First Half 2020. Notable items include $1,058 million costs associated with AUSTRAC proceedings including a provision for a potential penalty. Excluding notable items, Group Businesses cash earnings were $247 million lower than First Half 2019 primarily due $470 million impairment charges partly offset by a higher contribution from Treasury. Net operating income up $545m, large Expenses up $824m, 122% Impairment charges up $508m, large •Notable items were $442 million lower than First Half 2019; and •Higher Treasury revenue related to positioning for interest rate changes; partially offset by •Lower gains on investments and assets sales compared to First Half 2020; and •Lower revenue with the exit of the financial planning. •Notable items were $873 million higher than First Half 2019; partially offset by •Lower costs from the exit of the Advice business. •Impairments were a $470 million charge. The movement of $508 million was mainly due to centrally held overlays to reflect the impacts of COVID-19, bushfires and drought. |
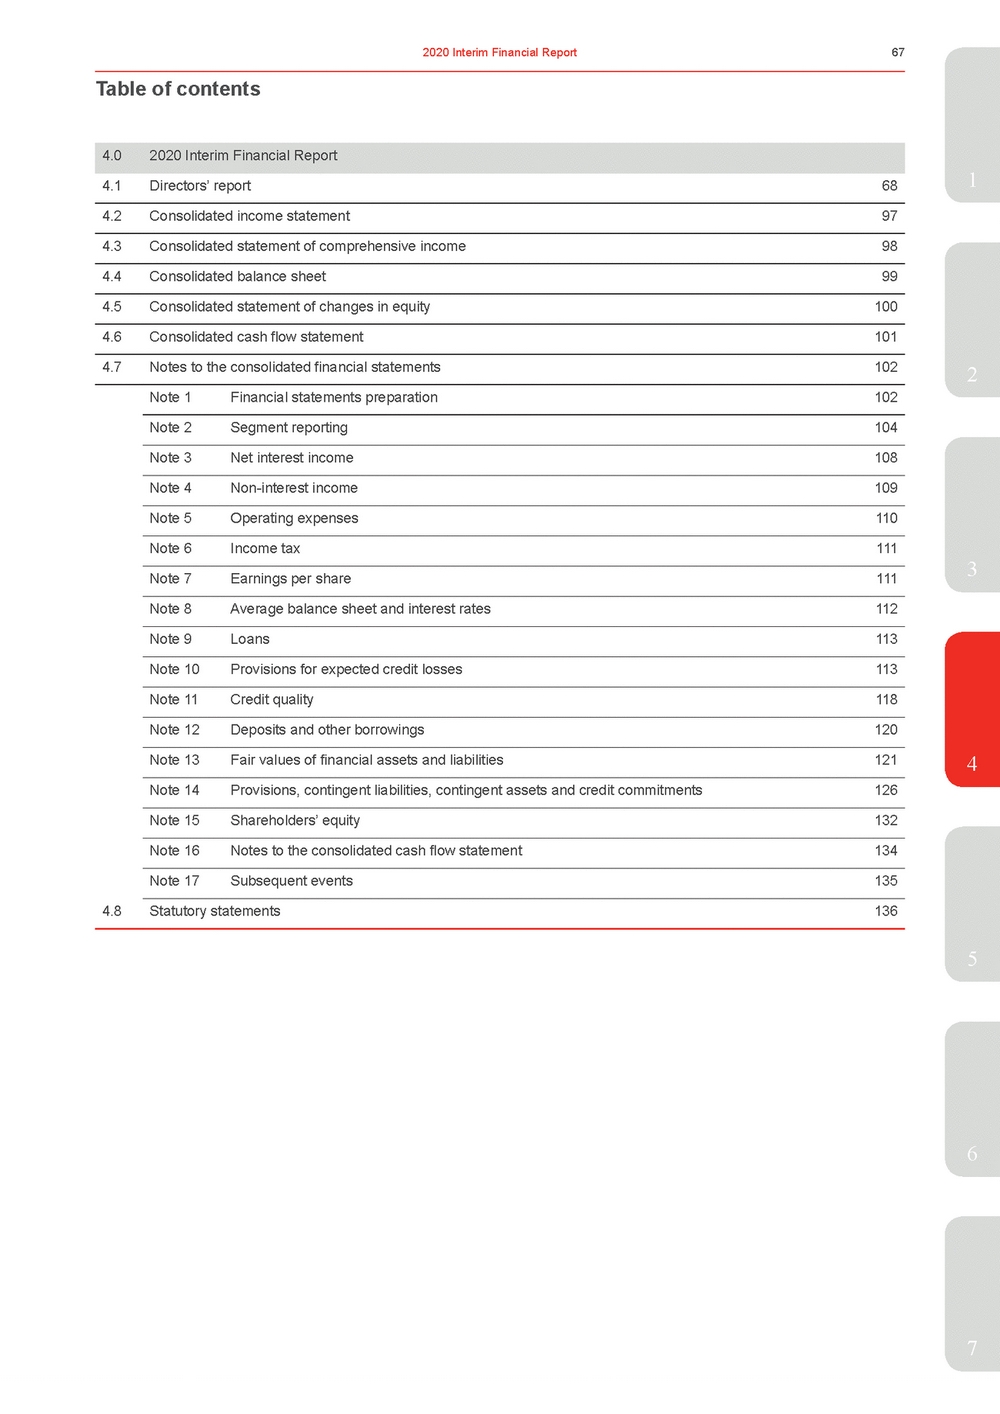 | 4.02020 Interim Financial Report 4.1Directors’ report681 4.2Consolidated income statement97 4.3Consolidated statement of comprehensive income98 4.4Consolidated balance sheet99 4.5Consolidated statement of changes in equity100 4.6Consolidated cash flow statement101 4.7Notes to the consolidated financial statements1022 Note 1Financial statements preparation102 Note 2Segment reporting104 Note 3Net interest income108 Note 4Non-interest income109 Note 5Operating expenses110 Note 6Income tax111 Note 7Earnings per share1113 Note 8Average balance sheet and interest rates112 Note 9Loans113 Note 10Provisions for expected credit losses113 Note 11Credit quality118 Note 12Deposits and other borrowings120 Note 13Fair values of financial assets and liabilities1214 Note 14Provisions, contingent liabilities, contingent assets and credit commitments126 Note 15Shareholders’ equity132 Note 16Notes to the consolidated cash flow statement134 Note 17Subsequent events135 4.8Statutory statements136 5 6 7 |
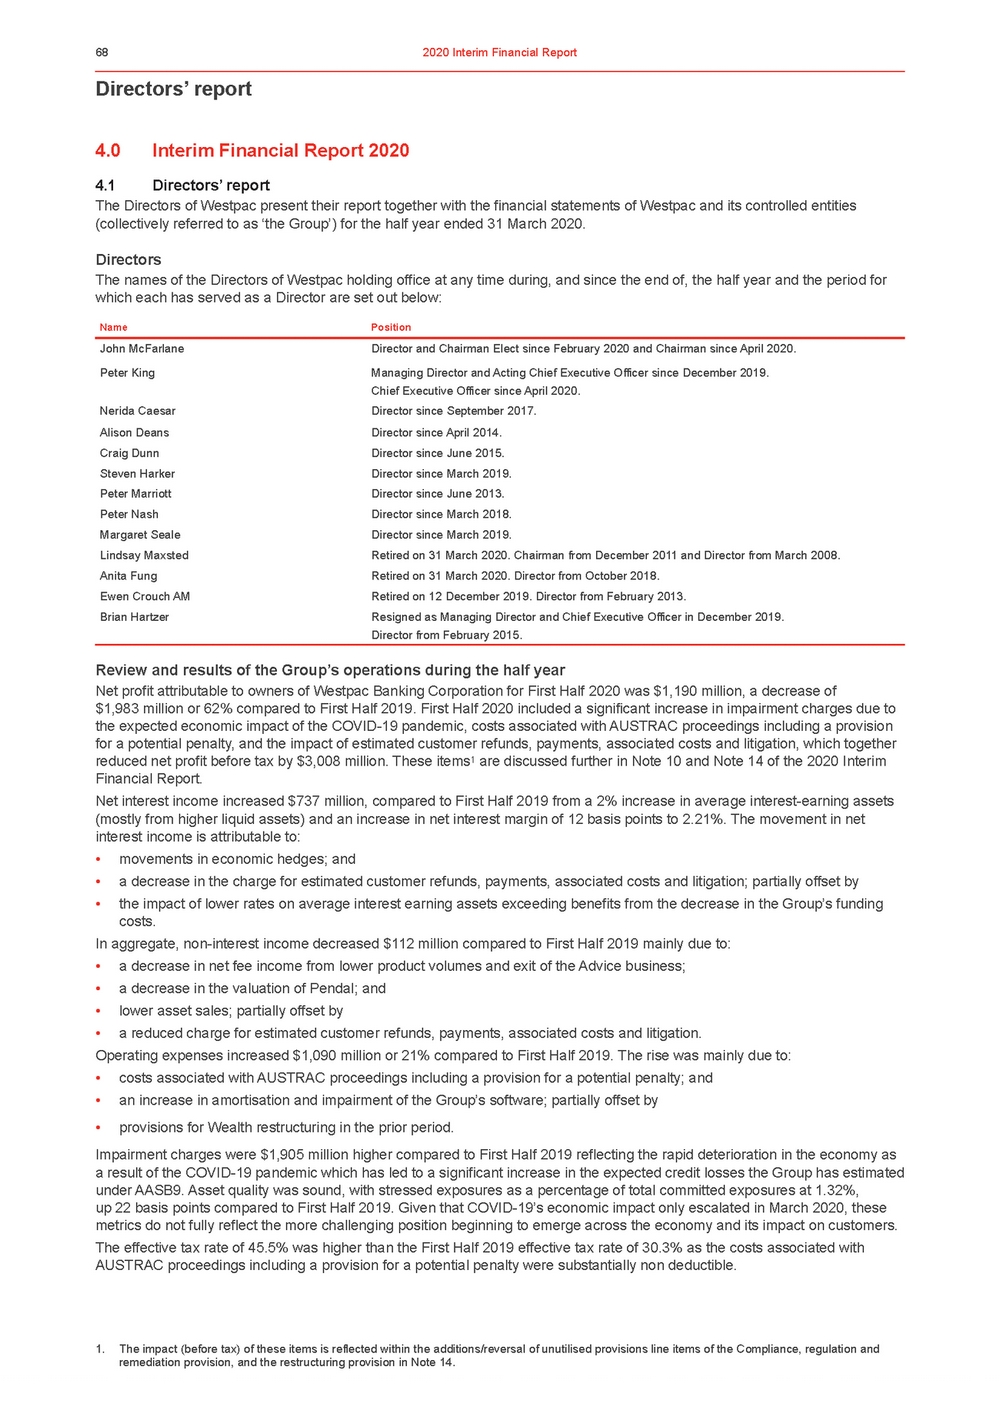 | Directors’ report 4.0Interim Financial Report 2020 4.1Directors’ report The Directors of Westpac present their report together with the financial statements of Westpac and its controlled entities (collectively referred to as ‘the Group’) for the half year ended 31 March 2020. Directors The names of the Directors of Westpac holding office at any time during, and since the end of, the half year and the period for which each has served as a Director are set out below: NamePosition John McFarlaneDirector and Chairman Elect since February 2020 and Chairman since April 2020. Peter KingManaging Director and Acting Chief Executive Officer since December 2019. Chief Executive Officer since April 2020. Nerida CaesarDirector since September 2017. Alison DeansDirector since April 2014. Craig DunnDirector since June 2015. Steven HarkerDirector since March 2019. Peter MarriottDirector since June 2013. Peter NashDirector since March 2018. Margaret SealeDirector since March 2019. Lindsay MaxstedRetired on 31 March 2020. Chairman from December 2011 and Director from March 2008. Anita FungRetired on 31 March 2020. Director from October 2018. Ewen Crouch AMRetired on 12 December 2019. Director from February 2013. Brian HartzerResigned as Managing Director and Chief Executive Officer in December 2019. Director from February 2015. Review and results of the Group’s operations during the half year Net profit attributable to owners of Westpac Banking Corporation for First Half 2020 was $1,190 million, a decrease of $1,983 million or 62% compared to First Half 2019. First Half 2020 included a significant increase in impairment charges due to the expected economic impact of the COVID-19 pandemic, costs associated with AUSTRAC proceedings including a provision for a potential penalty, and the impact of estimated customer refunds, payments, associated costs and litigation, which together reduced net profit before tax by $3,008 million. These items1 are discussed further in Note 10 and Note 14 of the 2020 Interim Financial Report. Net interest income increased $737 million, compared to First Half 2019 from a 2% increase in average interest-earning assets (mostly from higher liquid assets) and an increase in net interest margin of 12 basis points to 2.21%. The movement in net interest income is attributable to: •movements in economic hedges; and •a decrease in the charge for estimated customer refunds, payments, associated costs and litigation; partially offset by •the impact of lower rates on average interest earning assets exceeding benefits from the decrease in the Group’s funding costs. In aggregate, non-interest income decreased $112 million compared to First Half 2019 mainly due to: •a decrease in net fee income from lower product volumes and exit of the Advice business; •a decrease in the valuation of Pendal; and •lower asset sales; partially offset by •a reduced charge for estimated customer refunds, payments, associated costs and litigation. Operating expenses increased $1,090 million or 21% compared to First Half 2019. The rise was mainly due to: •costs associated with AUSTRAC proceedings including a provision for a potential penalty; and •an increase in amortisation and impairment of the Group’s software; partially offset by •provisions for Wealth restructuring in the prior period. Impairment charges were $1,905 million higher compared to First Half 2019 reflecting the rapid deterioration in the economy as a result of the COVID-19 pandemic which has led to a significant increase in the expected credit losses the Group has estimated under AASB9. Asset quality was sound, with stressed exposures as a percentage of total committed exposures at 1.32%, up 22 basis points compared to First Half 2019. Given that COVID-19’s economic impact only escalated in March 2020, these metrics do not fully reflect the more challenging position beginning to emerge across the economy and its impact on customers. The effective tax rate of 45.5% was higher than the First Half 2019 effective tax rate of 30.3% as the costs associated with AUSTRAC proceedings including a provision for a potential penalty were substantially non deductible. 1. The impact (before tax) of these items is reflected within the additions/reversal of unutilised provisions line items of the Compliance, regulation and remediation provision, and the restructuring provision in Note 14. |
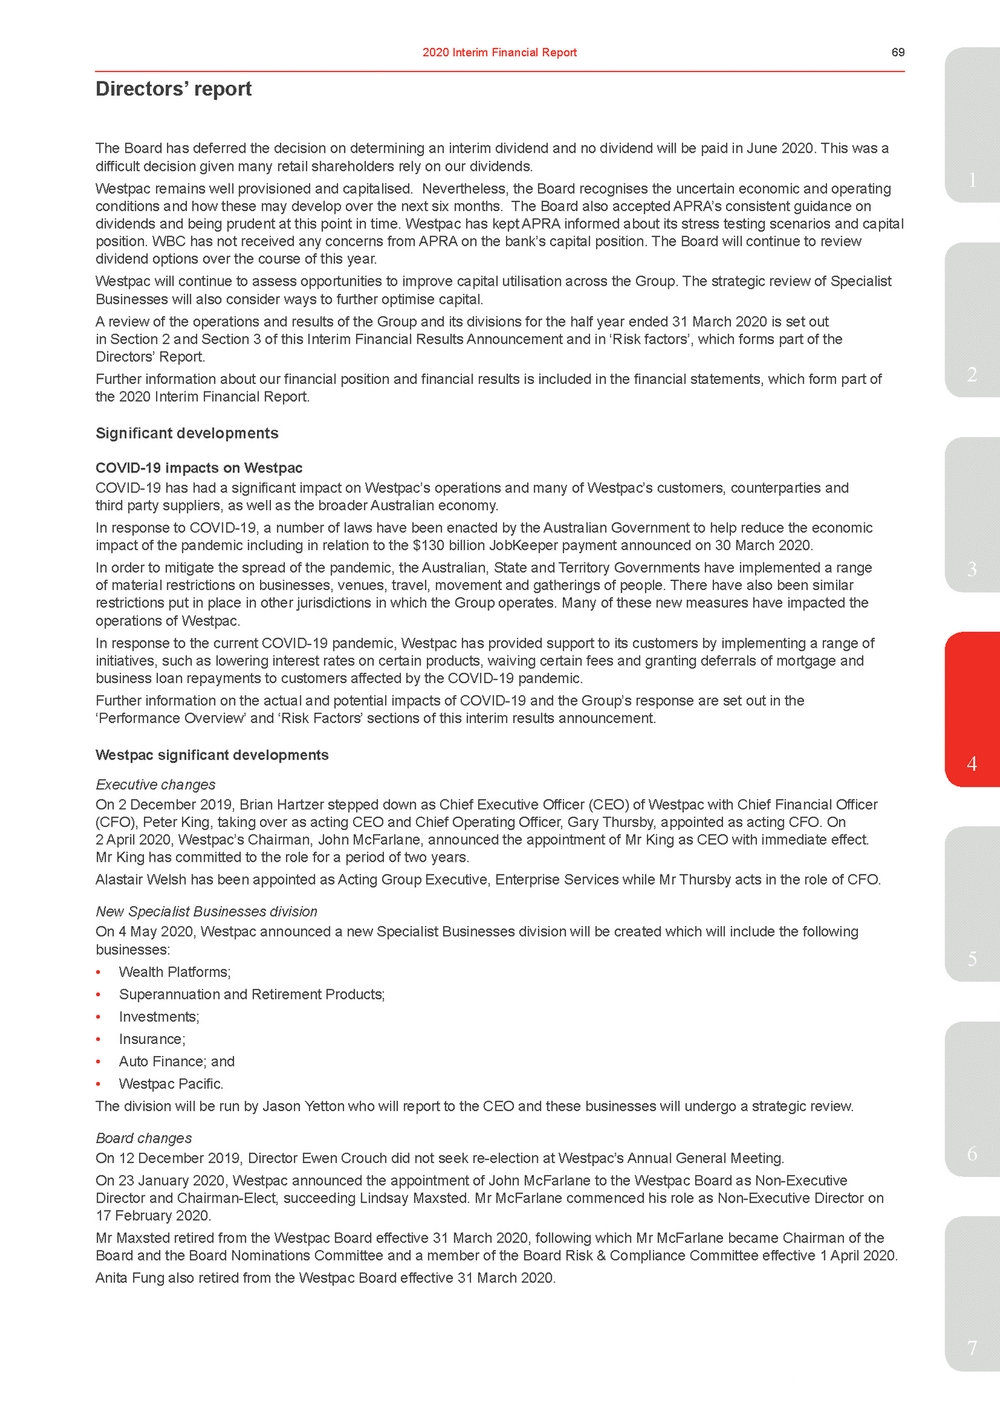 | difficult decision given many retail shareholders rely on our dividends. Westpac remains well provisioned and capitalised. Nevertheless, the Board recognises the uncertain economic and operating1 conditions and how these may develop over the next six months. The Board also accepted APRA’s consistent guidance on dividends and being prudent at this point in time. Westpac has kept APRA informed about its stress testing scenarios and capital position. WBC has not received any concerns from APRA on the bank’s capital position. The Board will continue to review dividend options over the course of this year. Westpac will continue to assess opportunities to improve capital utilisation across the Group. The strategic review of Specialist Businesses will also consider ways to further optimise capital. A review of the operations and results of the Group and its divisions for the half year ended 31 March 2020 is set out in Section 2 and Section 3 of this Interim Financial Results Announcement and in ‘Risk factors’, which forms part of the Directors’ Report. Further information about our financial position and financial results is included in the financial statements, which form part of2 the 2020 Interim Financial Report. Significant developments COVID-19 impacts on Westpac COVID-19 has had a significant impact on Westpac’s operations and many of Westpac’s customers, counterparties and third party suppliers, as well as the broader Australian economy. In response to COVID-19, a number of laws have been enacted by the Australian Government to help reduce the economic impact of the pandemic including in relation to the $130 billion JobKeeper payment announced on 30 March 2020. In order to mitigate the spread of the pandemic, the Australian, State and Territory Governments have implemented a range3 of material restrictions on businesses, venues, travel, movement and gatherings of people. There have also been similar restrictions put in place in other jurisdictions in which the Group operates. Many of these new measures have impacted the operations of Westpac. In response to the current COVID-19 pandemic, Westpac has provided support to its customers by implementing a range of initiatives, such as lowering interest rates on certain products, waiving certain fees and granting deferrals of mortgage and business loan repayments to customers affected by the COVID-19 pandemic. Further information on the actual and potential impacts of COVID-19 and the Group’s response are set out in the ‘Performance Overview’ and ‘Risk Factors’ sections of this interim results announcement. Westpac significant developments4 Executive changes On 2 December 2019, Brian Hartzer stepped down as Chief Executive Officer (CEO) of Westpac with Chief Financial Officer (CFO), Peter King, taking over as acting CEO and Chief Operating Officer, Gary Thursby, appointed as acting CFO. On 2 April 2020, Westpac’s Chairman, John McFarlane, announced the appointment of Mr King as CEO with immediate effect. Mr King has committed to the role for a period of two years. Alastair Welsh has been appointed as Acting Group Executive, Enterprise Services while Mr Thursby acts in the role of CFO. New Specialist Businesses division On 4 May 2020, Westpac announced a new Specialist Businesses division will be created which will include the following businesses:5 •Wealth Platforms; •Superannuation and Retirement Products; •Investments; •Insurance; •Auto Finance; and •Westpac Pacific. The division will be run by Jason Yetton who will report to the CEO and these businesses will undergo a strategic review. Board changes On 12 December 2019, Director Ewen Crouch did not seek re-election at Westpac’s Annual General Meeting.6 On 23 January 2020, Westpac announced the appointment of John McFarlane to the Westpac Board as Non-Executive Director and Chairman-Elect, succeeding Lindsay Maxsted. Mr McFarlane commenced his role as Non-Executive Director on 17 February 2020. Mr Maxsted retired from the Westpac Board effective 31 March 2020, following which Mr McFarlane became Chairman of the Board and the Board Nominations Committee and a member of the Board Risk & Compliance Committee effective 1 April 2020. Anita Fung also retired from the Westpac Board effective 31 March 2020. 7 |
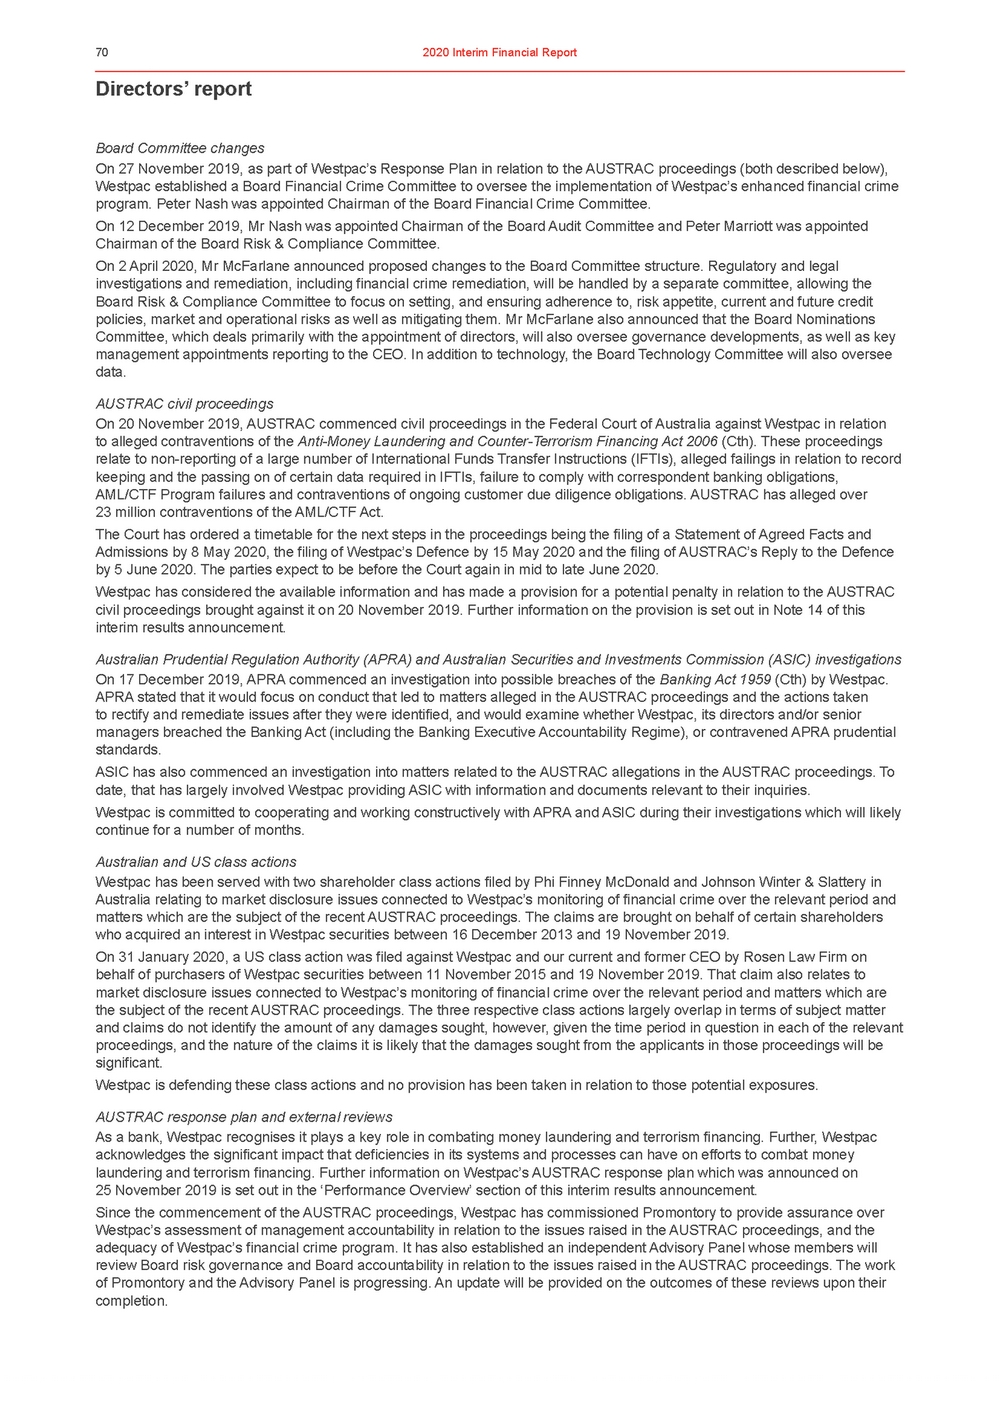 | Directors’ report Board Committee changes On 27 November 2019, as part of Westpac’s Response Plan in relation to the AUSTRAC proceedings (both described below), Westpac established a Board Financial Crime Committee to oversee the implementation of Westpac’s enhanced financial crime program. Peter Nash was appointed Chairman of the Board Financial Crime Committee. On 12 December 2019, Mr Nash was appointed Chairman of the Board Audit Committee and Peter Marriott was appointed Chairman of the Board Risk & Compliance Committee. On 2 April 2020, Mr McFarlane announced proposed changes to the Board Committee structure. Regulatory and legal investigations and remediation, including financial crime remediation, will be handled by a separate committee, allowing the Board Risk & Compliance Committee to focus on setting, and ensuring adherence to, risk appetite, current and future credit policies, market and operational risks as well as mitigating them. Mr McFarlane also announced that the Board Nominations Committee, which deals primarily with the appointment of directors, will also oversee governance developments, as well as key management appointments reporting to the CEO. In addition to technology, the Board Technology Committee will also oversee data. AUSTRAC civil proceedings On 20 November 2019, AUSTRAC commenced civil proceedings in the Federal Court of Australia against Westpac in relation to alleged contraventions of the Anti-Money Laundering and Counter-Terrorism Financing Act 2006 (Cth). These proceedings relate to non-reporting of a large number of International Funds Transfer Instructions (IFTIs), alleged failings in relation to record keeping and the passing on of certain data required in IFTIs, failure to comply with correspondent banking obligations, AML/CTF Program failures and contraventions of ongoing customer due diligence obligations. AUSTRAC has alleged over 23 million contraventions of the AML/CTF Act. The Court has ordered a timetable for the next steps in the proceedings being the filing of a Statement of Agreed Facts and Admissions by 8 May 2020, the filing of Westpac’s Defence by 15 May 2020 and the filing of AUSTRAC’s Reply to the Defence by 5 June 2020. The parties expect to be before the Court again in mid to late June 2020. Westpac has considered the available information and has made a provision for a potential penalty in relation to the AUSTRAC civil proceedings brought against it on 20 November 2019. Further information on the provision is set out in Note 14 of this interim results announcement. Australian Prudential Regulation Authority (APRA) and Australian Securities and Investments Commission (ASIC) investigations On 17 December 2019, APRA commenced an investigation into possible breaches of the Banking Act 1959 (Cth) by Westpac. APRA stated that it would focus on conduct that led to matters alleged in the AUSTRAC proceedings and the actions taken to rectify and remediate issues after they were identified, and would examine whether Westpac, its directors and/or senior managers breached the Banking Act (including the Banking Executive Accountability Regime), or contravened APRA prudential standards. ASIC has also commenced an investigation into matters related to the AUSTRAC allegations in the AUSTRAC proceedings. To date, that has largely involved Westpac providing ASIC with information and documents relevant to their inquiries. Westpac is committed to cooperating and working constructively with APRA and ASIC during their investigations which will likely continue for a number of months. Australian and US class actions Westpac has been served with two shareholder class actions filed by Phi Finney McDonald and Johnson Winter & Slattery in Australia relating to market disclosure issues connected to Westpac’s monitoring of financial crime over the relevant period and matters which are the subject of the recent AUSTRAC proceedings. The claims are brought on behalf of certain shareholders who acquired an interest in Westpac securities between 16 December 2013 and 19 November 2019. On 31 January 2020, a US class action was filed against Westpac and our current and former CEO by Rosen Law Firm on behalf of purchasers of Westpac securities between 11 November 2015 and 19 November 2019. That claim also relates to market disclosure issues connected to Westpac’s monitoring of financial crime over the relevant period and matters which are the subject of the recent AUSTRAC proceedings. The three respective class actions largely overlap in terms of subject matter and claims do not identify the amount of any damages sought, however, given the time period in question in each of the relevant proceedings, and the nature of the claims it is likely that the damages sought from the applicants in those proceedings will be significant. Westpac is defending these class actions and no provision has been taken in relation to those potential exposures. AUSTRAC response plan and external reviews As a bank, Westpac recognises it plays a key role in combating money laundering and terrorism financing. Further, Westpac acknowledges the significant impact that deficiencies in its systems and processes can have on efforts to combat money laundering and terrorism financing. Further information on Westpac’s AUSTRAC response plan which was announced on 25 November 2019 is set out in the ‘Performance Overview’ section of this interim results announcement. Since the commencement of the AUSTRAC proceedings, Westpac has commissioned Promontory to provide assurance over Westpac’s assessment of management accountability in relation to the issues raised in the AUSTRAC proceedings, and the adequacy of Westpac’s financial crime program. It has also established an independent Advisory Panel whose members will review Board risk governance and Board accountability in relation to the issues raised in the AUSTRAC proceedings. The work of Promontory and the Advisory Panel is progressing. An update will be provided on the outcomes of these reviews upon their completion. |
 | On 17 December 2019, APRA announced that in addition to its investigation into possible breaches of the Banking Act 1959 (Cth) by Westpac, it would initiate an extensive review program focused on Westpac’s risk governance. The review1 program will include risk management, accountability, remuneration and culture. On 23 March 2020, APRA advised that its supervision priorities outlined in January 2020 will be largely suspended until at least 30 September 2020 particularly where they involve intensive engagement with regulated entities. An element of APRA’s review will be the examination of the steps Westpac has been taking to strengthen risk governance, including through its self-assessment, which is referred to below. Operational risk capital overlays On 11 July 2019, Westpac received APRA’s response to its Culture, Governance and Accountability (CGA) self-assessment. In its response, APRA decided to apply an additional $500 million to Westpac’s operational risk capital requirement. This follows APRA concluding that Westpac was required to improve its management and oversight of non-financial risk. The additional2 capital requirement will remain in place until APRA is satisfied that Westpac has completed its action plan. The $500 million requirement, applied through an increase in risk weighted assets (RWA), took effect from 30 September 2019 and impacted Westpac’s Level 2 common equity tier 1 (CET1) capital ratio at 30 September 2019 by 16 basis points. As part of its announcement on 17 December 2019, APRA also imposed an additional $500 million capital overlay in response to the magnitude and nature of issues alleged by AUSTRAC in its Statement of Claim. The additional overlay applied from 31 December 2019. This change reduced Westpac’s Level 2 CET1 capital ratio by 15 basis points, as at 31 March 2020. Westpac reviews Financial crime In addition to the AML/CTF Response Plan and the financial crime improvements following the commencement of the3 AUSTRAC proceedings, Westpac continues to progress a significant multi-year program of work that is required to rectify its management of financial crime risks (including Anti-Money Laundering and Counter-Terrorism Financing (AML/CTF), sanctions, Anti-Bribery and Corruption, FATCA and Common Reporting Standards (CRS)). This extensive work involves a review of its AML/CTF policies, the completeness of data feeding into its AML/CTF systems and the adequacy and appropriateness of its AML/CTF processes and controls including in relation to important aspects of its money laundering and terrorism financing risk assessments and governance (which have been identified as needing to be strengthened). Westpac is continuing to implement a number of improvements to its AML/CTF program, governance, policies, systems and controls, including in relation to the issues identified in AUSTRAC’s Statement of Claim. Westpac is undertaking related remediation work in respect of certain controls and reporting practices and has engaged with and provided AUSTRAC with updates on this work. These remediation efforts relate to matters such as customer identification, customer and payment screening, risk assessments, ensuring appropriate controls over information relevant to the ‘tipping off’ prohibitions, ongoing and4 enhanced customer due diligence, transaction monitoring and regulatory reporting (including in relation to International Funds Transfer Instructions (IFTIs), Suspicious Matter Reports and Threshold Transaction Reports (TTRs)). As part of these efforts, Westpac has identified deficiencies in certain systems and controls relevant to its obligation to file TTRs. This has, over a number of years, resulted in instances where the Group has failed to report TTRs, as well as instances where the Group filed TTRs with incomplete or inaccurate information. The Group has self-reported these TTR deficiencies to AUSTRAC and is keeping AUSTRAC apprised of the status of its investigations. To date, the remediation has involved the late reporting of 17,870 TTRs to AUSTRAC. Additionally, there are multiple TTR reporting scenarios which based on the preliminary analysis undertaken to date (which has not been finally quantified or resolved), could amount to an estimated 60,000 to 90,000 TTRs that have not been reported to AUSTRAC. As part of the Group’s work to rectify its management of financial crime risks, the Group is also working to remediate gaps and5 enhance controls to support compliance with its FATCA and CRS obligations. The Group has been engaging with the Australian Tax Office (ATO) on its CRS remediation program and will continue to engage with the ATO on further programs of work. Details about the consequences of failing to comply with financial crime obligations is set out in the ‘Risk Factors’ section of this report. APRA self-assessment On 29 November 2018, Westpac submitted to APRA its self-assessment on its frameworks and practices in relation to governance, culture and accountability. Westpac has a program of work underway, under the oversight of the Westpac Board to address the recommendations identified in the self-assessment report (CGA Remediation Plan). Westpac is implementing the recommendations identified in the self-assessment. All implemented items will be subject to post-implementation verification to ensure durability of changes made.6 In light of the AUSTRAC proceedings, APRA has required Westpac to complete a reassessment of the existing CGA Remediation Plan. This reassessment will consider developments since the completion of the CGA self-assessment to verify if the existing recommendations and actions remain fit for purpose, and to identify any additional recommendations and actions that should be incorporated into the CGA Remediation Plan. External assurance over the reassessment process and outcomes will also be performed. The reassessment and updated plan will be submitted to APRA by 30 June 2020. Customer remediation Through the Group’s ‘get it right, put it right initiative’, Westpac is continuing to undertake a number of reviews to identify and resolve prior issues that have the potential to impact our customers and reputation. These internal reviews continue to identify a number of issues in respect of which we are takings steps or will take steps to put things right so that our customers are not at a 7 |
 | Directors’ report disadvantage from certain past practices, including making compensation/remediation payments to customers and/or providing refunds where identified. By undertaking these reviews, we can also continue to improve our processes and controls. Further information in relation to compliance, reputation and remediation provisions is included in Note 14 in this 2020 Interim Financial Report and further information on our ongoing customer remediation progress is included in the ‘Performance Overview’ section. Review of risk processes Westpac is upgrading its end to end risk management capabilities. This is part of an ongoing program of work that spans both financial and non-financial risk. A key component is the implementation of a refined three lines of defence model and uplifting risk capability across the organisation. Westpac believes that investing in and enhancing end to end risk management capabilities are essential imperatives. Recent reviews have identified various policies, systems, data, and risk capabilities which need to be strengthened. A detailed implementation plan to facilitate these improvements is progressing, which includes hiring additional experts in areas such as operational risk, stress testing, modelling, financial crime, risk systems and data management. Clearer accountability On 2 April 2020, the Chairman announced that the CEO had decided to put in place a clearer accountability regime which will speed up decision making and implementation, as well as defining more clearly who is individually accountable and for what. This transformation will see Westpac retain its focus on deepening customer relationships but move away from full matrix reporting and shift instead to a clearer line of business model. Regulatory and Government focus Regulatory response to the effects of COVID-19 In response to COVID-19, Australian domestic regulators have sought to initiate and re-prioritise activity that will assist financial institutions support customers through the conditions created by the pandemic. This has caused some regulatory activity to be deferred, while other projects have been accelerated due to their potential to assist economic recovery. The most significant of these updates or changes for Westpac are described in the relevant paragraphs below. On 23 March 2020, the Council of Financial Regulators used their quarterly statement to communicate their coordinated approach to the COVID-19 pandemic. The Reserve Bank of Australia (RBA) announced extensive measures to provide liquidity to financial markets and to support the banking system in providing credit to businesses. APRA announced that it would suspend the majority of its planned policy and supervision initiatives, including substantive public consultations and actions to finalise revisions of the prudential framework, until 30 September 2020. APRA stated it would progress certain data projects, such as data related to the impact of COVID-19 during this period. ASIC announced that at least until 30 September 2020, the Commission would give enforcement priority to matters where there is the risk of significant consumer harm, serious breaches of the law, risk to market integrity and time-critical matters. ASIC immediately suspended a number of near-term activities that were not time-critical. On 14 April 2020, both ASIC and APRA published detailed lists of deferred reviews, meetings, investigations and relief granted. From March 2020, the ACCC has been providing urgent interim authorisation for companies within various industries to discuss and put in place measures to allow access to essential services during the COVID-19 pandemic. This includes: •two urgent interim authorisations to allow the Australian Banking Association and certain of its participating members, including Westpac, to work together to implement a small business relief package, as well as to co-operate to provide supplementary relief packages for individuals and businesses affected by COVID-19; •the Australian Securitisation Forum, of which Westpac is a member, to allow its members to work together to assist smaller lenders to maintain liquidity and issue loans to consumers and small businesses during the economic disruption caused by COVID-19; and •the Financial Services Council, of which Westpac and St George are members, to allow its member life insurance companies to give effect to a commitment to ensure that frontline healthcare workers are not denied life insurance, charged higher premiums or excluded from benefits, due to exposure, or potential exposure, to COVID-19. Royal Commission into the banking, superannuation and financial services industries The Final Report of the Royal Commission into Misconduct in the Banking, Superannuation and Financial Services Industry (Final Report) and the Australian Government’s proposed response was released on 4 February 2019. Implementation of the 76 express recommendations in the Final Report is likely to continue to have a significant impact on banking and financial services entities and their regulators. Some of the most significant recommendations include those concerning the regulation of mortgage brokers, changes to regulatory breach reporting, changes to unsolicited sales of financial products and the removal of grandfathered commissions. In line with the Government’s Royal Commission implementation roadmap, on 31 January 2020 the Government released draft legislation for consultation in relation to a number of Royal Commission recommendations. The COVID-19 pandemic may alter the Government’s timeline for the passing of Royal Commission related legislation. In keeping with a desire to be proactive, some recommendations in the Final Report have been implemented unilaterally by Westpac (where possible and subject to any anticipated legislation or regulation being released). This approach may require Westpac to review and enhance its existing practices at a later date, and some recommendations previously implemented may require additional uplift of existing practices by Westpac, depending on the final legislation/regulation. |
 | Westpac either establishing new practices and procedures to meet the recommendations or having existing practices consistent with the recommendation.1 Additionally, the Group has commenced work in relation to all the recommendations that have been the subject of legislative activity and/or regulatory activity to date. This work will increase over the next 12 to 24 months as the Government completes its legislative agenda for the bulk of the outstanding recommendations. There are 22 recommendations where implementation is underway. Most of these recommendations will require legislative or regulatory action before implementation can be completed. The remaining 14 recommendations require legislative or regulatory action before implementation work can commence. Westpac is undertaking preparatory work where possible, including through participation in Government consultation. In anticipation of the removal of grandfathering of conflicted remuneration payable to financial advisers effective from 1 January 2021, we are also currently reviewing third party remuneration arrangements. Other impacts arising from the Royal Commission include a number of claims being brought against financial institutions in relation to certain matters considered during the Royal Commission, and the referral of several cases of misconduct to the2 financial regulators by Commissioner Hayne. Regulatory reviews and inquiries Provision of credit - reviews by and engagement with regulators The provision and availability of credit for residential mortgage holders, property investors and businesses has continued to be a key area of Government, regulator and industry focus in First Half 2020. Regulatory focus on credit from APRA has primarily related to serviceability at an industry level and impacts to credit quality and provisioning from COVID-19, while on 9 December 2019 ASIC released updated guidance on responsible lending obligations. Judicial guidance on the extent of responsible lending obligations was also obtained from the Federal Court in its judgment in ASIC’s responsible lending test case against Westpac (with the judgment currently subject to an appeal by ASIC). More information on these proceedings is set out in3 this section below. The economic disruption caused by the COVID-19 pandemic has led Westpac and other major banks to offer certain mortgage and business customers a deferral of certain interest and principal repayments of between 3 and 6 months. Both APRA and ASIC have supported the provision of credit to customers in these circumstances but will remain closely engaged to understand the impact of these measures on Westpac’s credit risk profile and liquidity. ASIC and APRA are taking an active interest in the number of hardship applications received by Westpac as the conditions caused by the pandemic continue to evolve. 4 oversight over our credit management frameworks. This program of work also addresses issues identified by Westpac’s internal assurance and audit teams. This work is progressing where possible during the conditions caused by COVID-19. Westpac expects further engagement with APRA on its work to improve its end to end credit processes. Australian Competition and Consumer Commission (ACCC) inquiry into home loan pricing On 14 October 2019, the ACCC was directed by the Treasurer of Australia to conduct an inquiry into home loan pricing during the period from 1 January 2019 to 31 October 2019. The inquiry has been established to: •investigate the prices charged for home loans across the sector; •consider how banks make pricing decisions, including their approach to passing on movements in the official cash rate; •examine differences in the prices paid by new and existing customers;5 •examine differences between the interest rates published by suppliers and the interest rates paid by customers; and •investigate barriers that may prevent consumers from switching lenders. An interim report was published on 27 April 2020 and a final report is due to the Treasurer by 30 September 2020. AFCA look back review On 4 February 2019, the Australian Government announced that, in response to the recommendations contained in the Royal Commission’s Final Report, it would expand the remit of the Australian Financial Complaints Authority (AFCA) for 12 months so that it can consider customer claims dating back to 1 January 2008 and award compensation where appropriate. AFCA has expanded its jurisdiction to consider these legacy complaints for an additional 12 month period to 30 June 2020. 6 Increased regulatory powers and oversight Financial Accountability Regime On 4 February 2019, the Australian Government announced that in response to the recommendations contained in the Royal Commission’s Final Report, it would extend the Banking Executive Accountability Regime to all APRA regulated entities. On 22 January 2020, the Australian Treasury released a Proposal Paper in relation to the proposed Financial Accountability Regime (FAR). The Proposal Paper provides for (amongst other things) ASIC and APRA to jointly administer the FAR and sets out enhanced penalties for individuals who fail to perform their obligations. Submissions on the Proposal Paper closed on 14 February 2020 and Westpac made a submission. Westpac is considering the potential implications of implementing the FAR including, for example, whether it will result in Westpac needing to appoint additional accountable persons. It is unclear 7 |
 | Directors’ report due to delays caused by the COVID-19 pandemic, when the exposure draft of the proposed legislation will be released by the Australian Treasury. ASIC Enforcement Review Taskforce On 16 April 2018, the Australian Government agreed to implement all of the recommendations made by the ASIC Enforcement Review Taskforce in its review of the suitability of ASIC’s existing regulatory tools. Progress continues to be made in implementing these recommendations, including: •the Financial Sector Reform (Hayne Royal Commission Response–Stronger Regulators (2019 Measures) Act 2020 (Cth) receiving royal assent on 17 February 2020. The Act implements a number of powers in line with the recommendations, relating to search warrants, access to telecommunications interception information, licensing and banning orders; •the Taskforce releasing a report on 2 October 2019, which sets out ASIC’s observations on director and officer oversight of non-financial risk, how directors and officers of large and complex financial services companies are discharging their duties in relation to oversight and monitoring of non-financial risk, and ways that governance practices could be improved; and •an exposure draft of the Financial Sector Reform (Hayne Royal Commission Response – Protecting Consumers (2020 Measures)) Bill 2020 (Cth) being released on 31 January 2020. If passed, the Bill would reform the breach reporting regime for Australian financial services and credit licensees. Due to the suspension of Parliament as a result of COVID-19, passage of the Bill has been delayed and it is not certain when it will be introduced and take effect. Product design and distribution obligations and product intervention power On 5 April 2019, the Treasury Laws Amendment (Design and Distribution Obligations and Product Intervention Powers) Act 2019 (Cth) received royal assent. The Act grants ASIC a product intervention power and introduces a new product design and distribution obligation on issuers and distributors. The product intervention powers came into force on 6 April 2019, with the design and distribution obligations due to come into effect on 5 April 2021. ACCC enforcement approach On 25 February 2020, the ACCC outlined its compliance and enforcement priorities in its annual Compliance and Enforcement Policy refresh. While competition issues in financial services is no longer specifically mentioned as an enforcement priority, criminal cartel conduct and anti-competitive conduct remain enduring priorities for the ACCC and there are currently two active cartel proceedings (neither involving Westpac) in the financial services industry. The ACCC is also currently undertaking market studies into home loan prices and insurance in Northern Australia. The ACCC’s competition enforcement approach and objectives are supported by increased budget support from the Australian Government announced in February 2020. On 27 March 2020, the ACCC announced that while its 2020 Compliance and Enforcement Priorities remain in place, it will re-focus its efforts to those priorities of most relevance to competition and consumer issues arising from the impact of COVID-19. Review into corporate criminal responsibility regime On 29 April 2020, the Australian Law Reform Commission delivered the final report to the Attorney-General in relation to its comprehensive review of Australia’s corporate criminal responsibility regime. The report is yet to be tabled in Parliament. Westpac will consider the findings and recommendations of the final report once it is publicly available. General regulatory changes affecting our business Banking Code of Practice The new ASIC approved Banking Code of Practice (Code) came into effect on 1 July 2019 for each bank that has subscribed to the Code (including Westpac). The Code includes a range of new measures including a commitment to take extra care with customers in vulnerable circumstances and to train staff to help in these circumstances, simplified loan contracts for small business written in plain English, better protection for guarantors and stronger enforcement of the Code via the independent Banking Code Compliance Committee. The Code has been further updated with key amendments to implement the recommendations contained in the Royal Commission’s Final Report. These changes, which have been approved by ASIC and conditionally authorised by the ACCC relate to having a greater focus on customers in remote areas and those with limited English, not allowing informal overdrafts on basic bank accounts without prior express agreement with the customer, abolishing dishonour fees and overdrawn fees on basic bank accounts and following AUSTRAC’s guidance on the identification and verification of persons of Aboriginal or Torres Strait Islander heritage. These updates were effective from 1 March 2020. Open banking regime The Treasury Laws Amendment (Consumer Data Right) Act 2019 (Cth) (CDR Act) received royal assent on 12 August 2019. The CDR Act amends the Competition and Consumer Act 2010 (Cth), the Privacy Act 1988 (Cth) and the Australian Information Commissioner Act 2010 (Cth) to introduce a consumer data right. The banking sector is the first sector to which the consumer data right will apply. The consumer data right gives customers in Australia a right to direct that their data (starting with banking data) be shared with accredited third parties. Data sharing facilitates competition through easier product comparison and switching. This has had significant implications for consumers and banks. On 20 December 2019, the ACCC announced that the commencement of Open Banking will be deferred from 1 February 2020 to 1 July 2020. Westpac will now be required to share credit card, debit card, deposit account and transaction account data from 1 July 2020. Other obligations under the Open Banking regime that were scheduled to commence on 1 July 2020 will be deferred to 1 November 2020. Westpac will be required to share data relating to mortgages, personal loans, joint accounts, closed accounts, direct debits and scheduled payments from 1 November 2020. Other brands in the Westpac Group will be |
 | credit and debit cards, deposit accounts and transaction accounts from 1 July 2020. The Competition and Consumer (Consumer Data Right) Rules 2020 (the CDR Rules) commenced on 6 February 2020. This is a1 key development as the CDR Rules set out how the consumer data right will operate. Both the CDR Act and CDR Rules contain new, detailed privacy protections under 13 Privacy Safeguards. The Privacy Safeguards deal with the disclosure, collection, use, accuracy, storage, security and deletion of consumer data right data. There are also 58 civil penalty provisions under the CDR Rules. A breach of the Privacy Safeguards or the CDR Rules could attract civil penalties of up to the greater of $10 million, three times any benefit obtained or 10% of 12 month annual turnover for corporations. Following discussions with the major banks and key participants on the potential impacts of COVID-19, the ACCC is intending to keep to the 1 July 2020 launch date. Details on how the ACCC intends to manage delays from COVID-19 related impacts are yet to be confirmed. We understand that the ACCC is considering an exemption process that will provide some flexibility to banks on implementation timing for a defined period of time.2 Comprehensive Credit Reporting (CCR) The National Consumer Credit Protection Amendment (Mandatory Credit Reporting and Other Measures) Bill 2019 (Cth) is currently before the Senate. The Bill requires the major banks to supply CCR data to credit reporting bodies and outlines how financial hardship cases should be reported. The Bill has not yet passed and there have been disruptions to the parliamentary schedule as a result of COVID-19. Nevertheless, Westpac is already participating in CCR on a voluntary basis. We are also working to implement hardship reporting requirements, noting the original compliance date of April 2021 in the Bill is likely to be amended. RBA Term Funding Facility On 19 March 2020, the RBA announced the establishment of a term funding facility (TFF) to provide funding to authorised3 deposit-taking institutions (ADIs) through repurchase transactions with the RBA. Each repurchase transaction under the TFF will be for a maximum term of three years at a fixed interest rate of 25 basis points. Participants in the TFF may access funding up to their funding allowance from 6 April 2020 and, in aggregate, ADIs will have access to at least $90 billion under the TFF. Westpac will have access to an Initial Allowance of at least $17.9 billion and intends to utilise the TFF as a source of wholesale funding. On 30 March 2020, APRA announced that it will allow ADIs to include the benefit of the Initial Allowance in the calculation of the Liquidity Coverage Ratio, Minimum Liquidity Holdings Ratio and Net Stable Funding Ratio from 31 March 2020, to the extent they have the necessary unencumbered collateral to access the TFF. For further information see section 2.4.2 (Funding and liquidity risk management). Other litigation 4 ASIC’s responsible lending litigation against Westpac On 1 March 2017, ASIC commenced Federal Court proceedings against Westpac in relation to certain home loans to consumers entered into between December 2011 and March 2015, which were automatically approved by Westpac’s systems as part of its broader processes. The proceedings were heard in May 2019. On 13 August 2019, the Court handed down its judgment in the proceedings, and dismissed ASIC’s case. ASIC filed an appeal in relation to the decision, which was heard in February 2020. Judgment on this appeal is pending. ASIC’s outbound scaled advice division proceedings On 22 December 2016, ASIC commenced Federal Court proceedings against BT Funds Management Limited (BTFM) and Westpac Securities Administration Limited (WSAL) in relation to a number of superannuation account consolidation campaigns conducted between 2013 and 2016. ASIC has alleged that in the course of some of these campaigns, customers were provided5 with personal advice in contravention of a number of Corporations Act 2001 (Cth) provisions, and selected 15 specific customers 6 ASIC’s proceedings against Westpac for poor financial advice by a financial planner On 14 June 2018, ASIC commenced proceedings in the Federal Court against Westpac in relation to alleged poor financial advice provided by a former financial planner, Mr Sudhir Sinha. Mr Sinha was dismissed by Westpac in November 2014 and subsequently banned by ASIC. Westpac has proactively initiated remediation to identify and compensate affected customers and has completed remediation activities. ASIC’s proceedings relate to advice provided by Mr Sinha in respect of four specific customer files. On 19 December 2019, the Federal Court of Australia handed down its judgment in the proceedings, imposing civil pecuniary penalties on Westpac totalling $9.15 million for contraventions of certain financial advice provisions in relation to the relevant customer files, together with an order that Westpac pay ASIC’s costs of the litigation, which are still being determined. Class action against Westpac Banking Corporation and Westpac Life Insurance Services Limited7 On 12 October 2017, a class action was filed in the Federal Court of Australia on behalf of customers who, since February 2011, obtained insurance issued by Westpac Life Insurance Services Limited (WLIS) on the recommendation of financial advisers |
 | Directors’ report employed within the Westpac Group. The plaintiffs have alleged that aspects of the financial advice provided by those advisers breached fiduciary and statutory duties owed to the advisers’ clients, including the duty to act in the best interests of the client, and that WLIS was knowingly involved in those alleged breaches. Westpac and WLIS are defending the proceedings. The matter has been set down for an initial trial in May 2021. Class action in the US relating to BBSW In August 2016, a class action was filed in the United States District Court for the Southern District of New York against Westpac and a number of other Australian and international banks and brokers alleging misconduct in relation to the bank bill swap reference rate. In April 2019, an amended claim was filed by the Plaintiffs. Westpac is defending the proceedings, which are now moving through the pre-trial stages. Class action relating to responsible lending On 21 February 2019, a class action against Westpac was commenced in the Federal Court of Australia. The Applicants filed a Further Amended Originating Application and Further Amended Statement of Claim on 11 February 2020. The claims allege that Westpac did not comply with its responsible lending obligations when entering into home loans with the Applicants and group members (as defined in the proceedings). The allegations in respect of the Applicants and group members include that, during the period from 1 January 2011 to 17 February 2018, Westpac failed to conduct reasonable inquiries about the customers’ financial situation, requirements and objectives, failed to take reasonable steps to verify the customer’s financial situation, and failed to conduct compliant assessments of suitability. The Applicants also allege that their loans were unsuitable. Westpac is defending the proceedings. Class action relating to cash in super On 5 September 2019, a class action against BT Funds Management Limited (BTFM) and Westpac Life Insurance Services Limited (WLIS) was commenced in the Federal Court of Australia in relation to aspects of BTFM’s BT Super for Life cash investment option. The claim follows other industry class actions as part of Slater and Gordon’s ‘Get your super back’ campaign. It is alleged in the proceedings that BTFM failed to adhere to a number of obligations under the general law, the relevant trust deed and the Superannuation Industry (Supervision) Act 1993 (Cth), and that WLIS was knowingly concerned with BTFM’s alleged contraventions. The damages sought by the claim are unspecified. BTFM and WLIS are defending the proceedings. Class action relating to consumer credit insurance On 28 February 2020, a class action was commenced against Westpac Banking Corporation and two Westpac subsidiaries in the Federal Court of Australia in relation to Westpac’s sale of consumer credit insurance (CCI). The claim follows other industry class actions as part of Slater and Gordon’s ‘Get your insurance back’ campaign. It is alleged in the proceedings that the Westpac entities failed to adhere to a number of obligations in selling CCI in conjunction with credit cards, personal loans and flexi loans. The damages sought by the claim are unspecified. The Westpac entities are defending the proceedings. Westpac no longer sells CCI products. Regulatory capital transactions Capital raising On 8 November 2019, Westpac issued $2 billion of fully paid ordinary shares under a share placement to sophisticated and institutional investors. In addition, on 11 December 2019, Westpac issued approximately $770 million of fully paid ordinary shares under a share purchase plan. Adoption of new accounting standards AASB 16: Leases (AASB 16) replaced AASB 117: Leases from 1 October 2019. AASB 16 requires all leases of greater than 12 months duration to be presented on balance sheet by the lessee as a right-of-use (ROU) asset and a lease liability. The lease liability recognised in other liabilities on initial application of the standard was $3.3 billion. The associated ROU assets of $3.2 billion were measured at an amount equal to the lease liability, less previously recognised accrued lease payments of $0.1 billion. There was no impact on retained earnings. Further details of the changes under the new standard are included in Note 1 in this 2020 Interim Financial Report. APRA regulatory changes and other changes affecting capital APRA announcements on capital As part of its response to the current economic environment following the COVID-19 pandemic, APRA has made the following announcements on capital: •Guidance on capital management: In a letter to all ADIs and insurers on 7 April 2020, APRA set out its guidance on capital management during the period of significant disruption caused by COVID-19. APRA outlined its expectations that discretionary capital distributions should be limited in the months ahead to ensure that ADIs and insurers instead use buffers and maintain capacity to continue to lend and underwrite insurance. This includes prudent reductions in dividends, taking into account the uncertain outlook for the operating environment and the need to preserve capacity to prioritise these critical |
 | that have been discussed with APRA and should nevertheless be at a materially reduced level. Westpac took this guidance into consideration when deferring its decision on the interim dividend, which is discussed further in the ‘Performance1 Overview’ section of this interim results announcement; •Adjustment to expectations for bank capital: On 19 March 2020 APRA adjusted its expectations for bank capital during the period of disruption caused by COVID-19. APRA confirmed that it would not be concerned if banks were not meeting its 10.5% “unquestionably strong” benchmark for CET1, and that banks may use their current capital buffers provided they remain above the current regulatory requirement (currently at least 8.0% for domestic systemically important banks, including Westpac). APRA has also indicated that they do not envisage reinstating the unquestionably strong benchmarks for at least 12-months. In light of APRA’s announcement, Westpac has revised its capital management strategy. As set out further in Section 2.5 of this interim results announcement, during the period of disruption caused by COVID-19, Westpac will seek to maintain a buffer above the regulatory minimum; •Amendments to the calculation of RWA for COVID-19 support packages. Where a support package provides an option to2 defer repayments for a period of time, for RWA calculation purposes, a bank need not treat the period of the repayment holiday as a period of arrears (provided the borrower had previously been meeting their repayment obligations). In addition, the Australian Government’s Coronavirus SME Guarantee Scheme is to be regarded as an eligible guarantee by the Australian Government for RWA calculation purposes. These COVID-19 support packages have not impacted RWA at 31 March 2020 due to the timing of these packages being offered, however may impact future periods; and •Deferral of APRA’s implementation of the Basel III capital reforms by a year to January 2023. APRA’s proposed revisions to subsidiary capital investment treatment On 15 October 2019, APRA released a discussion paper on proposed changes to APS 111 Capital Adequacy: Measurement of Capital. The key proposal is in relation to a parent ADI’s treatment of its equity investments in banking and insurance subsidiaries (Level 1). Westpac’s largest investment in banking and insurance subsidiaries is Westpac New Zealand Limited3 (WNZL). There is no impact from this proposal on the calculation of the Group’s reported regulatory capital ratios on a Level 2 basis. On a Level 1 basis, on a proforma basis as at 31 March 2020, it is estimated that applying APRA’s proposed approach would reduce Westpac’s Level 1 CET1 ratio by approximately 40bps ($1.6 billion). APRA has indicated that the updated standard will come into effect from 1 January 2021. Associations with Related Entities On 20 August 2019, APRA released the finalised prudential standard APS 222: Associations with Related Entities. The revised standard is intended to strengthen the ability of ADIs to monitor, limit and control risks arising from transactions and other associations with related entities. Key changes include revisions to the limit for exposure to ADIs from 50% of Total Capital to 25% of Tier 1 capital. Westpac’s largest exposure to a related entity is WNZL. As at 31 March 2020, Westpac would remain within the revised limits4 based on the current level of exposure to WNZL. On 16 April 2020, APRA announced that as part of its response to COVID-19 APRA is deferring implementation of the revised standard by 12-months to 1 January 2022. Additional loss absorbing capacity On 9 July 2019, APRA announced a requirement for the Australian major banks (including Westpac) to increase their total capital requirements by three percentage points of RWA as measured under the current capital adequacy framework. This increase in total capital will take full effect from 1 January 2024. 5 APRA is still targeting an additional four to five percentage points of loss-absorbing capacity. Over the next four years, APRA has stated that it will consider feasible alternative methods for raising the remaining 1-2 percentage points. Implementation of new interest rate risk in the banking book (IRRBB) model Westpac is implementing a new IRRBB model more suited to low interest rates which will need to be approved by APRA. Until the model is finalised and approved, Westpac has included an IRRBB capital overlay of $500 million. This change reduced Westpac’s Level 2 CET1 capital ratio by 15 basis points, as at 31 March 2020. 6 On 23 July 2019, APRA released for consultation a new draft prudential standard and supporting discussion paper on remuneration. It is aimed at clarifying and strengthening remuneration arrangements in APRA-regulated entities. The new standard will replace existing remuneration requirements under CPS/SPS 510 Governance. APRA has stated that, in response to the impact of COVID-19, the majority of its planned policy and supervision initiatives have been suspended. It is therefore unclear when the revised draft of CPS 511 will be released, and when implementation of the new prudential standard will occur. 7 |
 | Directors’ report International developments affecting Westpac Brexit The United Kingdom (UK) left the European Union (EU) on 31 January 2020, commencing a transition period until the end of 2020 while the UK and EU negotiate additional arrangements, with new rules to take effect on 1 January 2021. As Westpac’s business and operations are based predominantly in Australia and New Zealand, Westpac expects that the direct impact of a new trading relationship between the UK and EU is unlikely to be material to Westpac. Westpac continues to progress contingency planning and has been active in dialogue with affected customers. OTC derivatives reform International regulatory reforms relating to over-the-counter (OTC) derivatives continue to be implemented across the globe, with a current focus on initial margin and risk mitigation practices for non-centrally cleared derivatives. As of 1 September 2019, Westpac became subject to rules requiring the exchange of initial margin on certain non-cleared derivatives with other in-scope entities. Westpac is required to post and collect collateral on a gross basis. The collateral is held in segregated accounts with third party custodians. Global initial margin requirements will continue to be introduced in phases, however there has been a 12 month delay to the remaining commencement dates due to COVID-19. The phases continue until 1 September 2022 with a large number of additional counterparties being brought into scope. New Zealand COVID-19 impacts In response to COVID-19, a number of laws have been enacted by the New Zealand Government to help reduce the economic impact and it has implemented a range of material restrictions on businesses, venues, travel and movement. Many of these new measures have impacted WNZL’s operations. Also in response to COVID-19, there have been a number of new guidance updates published and regulatory delays announced by New Zealand regulators, including the Reserve Bank of New Zealand (RBNZ), the Financial Markets Authority (FMA), the Commerce Commission (the Commission) and the Companies Office. The most significant of these updates or changes for Westpac are described in the relevant paragraphs below. Freeze on NZ Bank Dividends On 2 April 2020, a decision was made by the RBNZ to freeze the distribution of dividends on ordinary shares by all banks in New Zealand during the period of economic uncertainty caused by COVID-19. Westpac is well capitalised and at 31 March 2020 had a Level 2 CET1 capital ratio of 10.8% and a Level 1 CET1 capital ratio of 11.1%. Non-payment of dividends from WNZL only affects Westpac’s Level 1 CET1 capital ratio. Government relief packages On 24 March 2020, the New Zealand Government announced mortgage and business finance support schemes for those whose income was impacted by COVID-19, to be implemented by the Government and retail banks (including WNZL). The schemes include payment deferrals for certain customers and a Business Finance Guarantee Scheme to provide short-term credit to solvent small and medium-sized firms. On 2 April 2020, the New Zealand Government announced that it would make temporary changes to companies legislation to provide insolvency relief for business impacted by COVID-19, including a business debt hibernation scheme. RBNZ steps to support liquidity and customer lending On 16 March 2020 the RBNZ announced that it would provide term funding through a Term Auction Facility (TAF) to give banks (including WNZL) the ability to access term funding, with collateralised loans out to a term of twelve months, in order to alleviate pressures in funding markets as a result of COVID-19. On 2 April 2020, the RBNZ announced that it would introduce a Term Lending Facility (TLF), to offer loans for a term of up to three years at low interest rates to ensure a stable source of funding to promote lending to businesses. Access to the funds is linked to banks’ lending under the Business Finance Guarantee Scheme. Also on 2 April 2020, the RBNZ reduced the Core Funding Ratio for banks (including WNZL) from 75% to 50%. With effect from 1 May 2020, the RBNZ removed loan-to-value restrictions to encourage continued bank lending to customers. RBNZ - Revised Outsourcing Policy WNZL is required to comply with RBNZ’s revised Outsourcing Policy (BS11) (Revised Outsourcing Policy) for all new outsourcing arrangements from 1 October 2017 and to maintain a compendium of all outsourcing arrangements from 1 October 2019. Work is underway to implement the other aspects of the Revised Outsourcing Policy by 30 September 2023 in line with the revised regulatory timeline as a result of COVID-19. As a result of complying with the Revised Outsourcing Policy, the ongoing cost of operating the WNZL business will increase, in addition to the costs of implementing the changes. RBNZ Capital Review On 5 December 2019, the RBNZ announced changes to the capital adequacy framework in New Zealand. The new framework includes the following key components: •Setting a Tier 1 capital requirement of 16% of RWA for systemically important banks (including WNZL) and 14% for all other banks; •Additional Tier 1 capital (‘AT1’) can comprise no more than 2.5% of the 16% Tier 1 capital requirement; •Eligible Tier 1 capital will comprise common equity and redeemable perpetual preference shares. Existing AT1 instruments will be phased out over a seven year period; |
 | 1 WNZL is already strongly capitalised with a Tier 1 capital ratio of 14.1% at 31 March 2020 based on the current RBNZ rules. On a pro forma basis, (including the new RWA and capital requirements) at 31 March 2020 and assuming a Tier 1 capital ratio of 16-17%, WNZL would require a further NZ$2.1-$2.7 billion of Tier 1 capital to meet the new requirements that are fully effective in 2028. In response to the impacts of COVID-19, and to support credit availability, the RBNZ has delayed the start date of the new capital regime by 12 months to 1 July 2021 and the RBNZ will consider further delays in 2021 if it considers that market conditions warrant it. Banks will be given up to seven years to comply. RBNZ - Review under section 95 of the Reserve Bank of New Zealand Act 1989 In June 2019, in response to a review under section 95 of the Reserve Bank of New Zealand Act 1989 of WNZL’s compliance2 with advanced internal rating based aspects of the RBNZ’s ‘Capital Adequacy Framework (Internal Models Based Approach)’ (BS2B), WNZL presented the RBNZ with a submission providing an overview of its credit risk rating system and activities undertaken to address compliance issues and enhance risk management practices. On 30 October 2019, the RBNZ informed WNZL that it had accepted the submission and measures undertaken by WNZL to achieve satisfactory compliance with BS2B, and that WNZL would retain its accreditation to use internal models for credit risk in the calculation of its regulatory capital requirements. With effect from 31 December 2019, the RBNZ removed the requirement imposed on WNZL since 31 December 2017 to maintain minimum regulatory capital ratios which were two percentage points higher than the ratios applying to other locally incorporated banks. Review of the Reserve Bank of New Zealand Act In November 2017, the New Zealand Government announced it would undertake a review of the Reserve Bank of New Zealand3 Act 1989 (RBNZ Review). The RBNZ Review will consist of two phases. The legislation for the recommended Phase 1 came into force on 1 April 2019. Phase 2 of the RBNZ Review considers the overarching objectives of the RBNZ’s institutional governance and decision-making, the macro-prudential framework, the current prudential supervision model, trans-Tasman coordination, supervision and enforcement and resolution and crisis management. In December 2019, the New Zealand Government announced in-principle decisions on Phase 2. Changes include that Reserve Bank of New Zealand Act 1989 will be replaced with two separate Acts – an ‘Institutional Act’ and a ‘Deposit Takers Act’. Cabinet also confirmed that work will continue on a cross-agency process to develop an executive accountability regime for banks and insurers. A third round of consultation on the Phase 2 review is underway with extended timescales due to COVID-19. The submissions due date has been extended to 23 October 2020 with legislation now expected to be introduced in late 2020 and 2021. 4 Conduct of Financial Institutions Review Following the developments and findings of the Financial Services Conduct and Culture Review and the Australian Royal Commission, the Financial Markets (Conduct of Institutions) Amendment Bill was introduced to Parliament on 11 December 2019. The Bill introduces a conduct licensing regime for banks, insurers and non-bank deposit takers and their intermediaries in respect of their conduct in relation to retail customers. The regime will require licensed institutions to comply with a fair conduct principle to treat consumers fairly, and establish, implement and maintain an effective fair conduct programme. It will also require institutions to comply with regulations that regulate incentives (including a prohibition on volume and value sales targets). The Bill is currently before the Select Committee. Reform of Credit Contracts and Consumer Finance Legislation The Credit Contracts Legislation Amendment Act received royal assent on 19 December 2019. The Act introduces a number5 of changes to the Credit Contracts and Consumer Finance Act, including new duties for directors and senior managers and increased penalties and statutory damages. The Act also introduces stricter requirements around suitability and affordability assessments as well as a cap for interest and fees of ‘high cost’ loans (being loans with annualised interest exceeding 50%). The Act will come into effect in stages from June 2020. The commencement date for new duties for directors and senior managers, and new requirements around suitability and affordability assessments, has been delayed by at least 6 months and will come into effect no earlier than 1 October 2021. 6 7 |
 | Directors’ report Risk factors Our business is subject to risks that can adversely impact our financial performance, financial condition and future performance. If any of the following risks occur, our business, prospects, reputation, financial performance or financial condition could be materially adversely affected, with the result that the trading price of our securities could decline and as a security holder you could lose all, or part, of your investment. You should carefully consider the risks described and the other information in this Interim Results Announcement and in our 2019 Annual Report before investing in our securities. The risks and uncertainties described below are not the only ones we face. Additional risks and uncertainties that we are unaware of, or that we currently deem to be immaterial, may also become important factors that affect us. Risks relating to our business Outbreaks of communicable diseases or a pandemic like COVID-19 have had, and could in the future have, an adverse effect on the Group The Group operates a large scale business and as part of the financial services industry delivers critical services which support the economy. The Group is vulnerable to the impacts of a communicable disease outbreak or a pandemic. The current and ongoing COVID-19 pandemic has disrupted, and will continue to disrupt, numerous industries and global supply chains, while measures to mitigate the severity of the pandemic, such as restrictions on businesses, venues, transport, movement and public gatherings of people, workplace closures, and the closure of public institutions such as schools and universities will negatively affect economic activity. We currently expect the COVID-19 pandemic to impact on our financial performance, among other adverse effects. At this time, however, it is not possible to estimate how long it will take to halt the spread of the virus or the longer term effects that the COVID-19 pandemic could have on the economy and Westpac’s business. The extent to which the COVID-19 pandemic impacts Westpac’s customers, business, financial performance and financial condition will depend on future developments which are evolving and highly uncertain. The significant decrease in economic activity resulting from the COVID-19 pandemic has affected, and will continue, for an unpredictable time, to affect demand for Westpac’s products and services. We expect that the COVID-19 pandemic will result in increased impairments, defaults and write-offs, which are likely to be material, due to financial stress caused to Westpac’s customers and counterparties, particularly those in the transport, manufacturing, education, retail trade, entertainment and hospitality, travel, tourism, agriculture, food and beverage, commercial property, construction, consulting and financial services sectors. Westpac has increased its provisions for expected credit losses due to the impact of COVID-19, however, as the full impact of the pandemic is highly uncertain, it is possible that Westpac will need to further increase these provisions in the future. For more information refer to Note 10 to the financial statements in this 2020 Interim Financial Report. The current COVID-19 pandemic has also resulted in declining asset values (see ‘Declines in asset markets could adversely affect our operations or profitability’) and volatility in global markets (see ‘We could suffer losses due to market volatility’ below). Further, adverse economic consequences may arise depending on how the COVID-19 pandemic progresses, potentially giving rise to a systemic economic shock (further information is set out below in ‘A systemic shock in relation to the Australian, New Zealand or other financial systems could have adverse consequences for Westpac or its customers or counterparties that would be difficult to predict and respond to’). In response to the current COVID-19 pandemic, Westpac has provided support to its customers by implementing a range of initiatives, such as lowering interest rates on certain products, waiving certain fees and granting deferrals of loan repayments to customers affected by the COVID-19 pandemic. These initiatives together with the impact of the COVID-19 pandemic on our customers will likely have a negative impact on the Group’s financial performance and may see the Group assume a greater level of risk than it would have under ordinary circumstances. In addition, there is a risk that Governments or regulators require, or seek to require, banks (including Westpac) to provide further support and accommodation to customers impacted by the COVID-19 pandemic in the future. This could involve the Group being required to forego interest payments, forgive certain principal amounts owing on loans as well as limitations being placed on the Group’s ability to foreclose on loans and enforce security. If this were to occur, there would be a further adverse impact on the Group’s financial performance and level of risk assumed by the Group. Actions taken by regulators in response to the COVID-19 pandemic have impacted and could in the future impact the Group. As an example, regulators in some overseas jurisdictions have exercised their powers to prevent banks from declaring dividends or undertaking share buy-backs. In New Zealand, the RBNZ made the decision to freeze the distribution of dividends on ordinary shares by all banks in New Zealand during the period of economic uncertainty caused by COVID-19. This prevents Westpac’s subsidiary Westpac New Zealand Limited from paying dividends and has a negative impact on Westpac’s Level 1 CET1 capital ratio. It is possible that APRA will take a similar approach in the future and prevent Westpac from declaring dividends to its investors. While APRA has not yet taken such action, it has written to Australian banks (including Westpac) and outlined its expectation that they limit any dividends and discretionary capital distributions in the coming months. Further information about actions taken by our regulators in response to COVID-19 is outlined in ‘Significant Developments’. Further, the impact and potential future impact of an outbreak of a communicable disease or a pandemic (such as the COVID-19 pandemic) on the Group’s business, financial performance and financial condition may be such that the Group determines (independent of any regulatory guidance) that it is necessary to suspend or reduce dividend payments and/or other capital distributions. |
 | pandemics (such as the COVID-19 pandemic). Westpac has been and may in the future be required to close workplaces and suspend providing services through certain offices, branches, ATMs or other channels. Any outbreak or pandemic may1 also negatively impact the ability of Westpac’s back-office, support functions and key suppliers to operate, in turn disrupting Westpac’s business and operations. The COVID-19 pandemic has to date resulted in offshore support centres and mortgage processing suppliers and other third party contractors being unable to provide services for a period of time. It has also required the closure of various Westpac and third party contractor support offices for periods of time including those situated in offshore jurisdictions, and may result in further disruptions to Westpac’s business activities and operations in the future. During the period when a communicable disease outbreak or pandemic (such as the COVID-19 pandemic) is occurring, Westpac may need to temporarily adjust its risk appetites, policies or controls so that it can respond to the broader impacts of the pandemic and protect the wellbeing of staff. These temporary adjustments could have unforeseen consequences and may, depending on the outcome, expose the Group to increased regulatory oversight and/or regulatory action. Further, to respond 2 Outbreaks of communicable diseases or pandemics (such as COVID-19), as with other large scale global events which have had a broad impact on the operation of economies around the world have had, and may in the future have, a negative impact on the Group’s business, prospects, financial performance and financial condition. There continues to be significant uncertainties associated with the COVID-19 pandemic, including with respect to the severity of the disease, the duration of the pandemic, actions that may be taken by governmental authorities and private businesses to attempt to contain the COVID-19 pandemic or to mitigate its impact and the potential for the COVID-19 pandemic to have longer term and lasting impacts on Westpac’s customers, business and operations. Westpac continues to monitor the situation and assess further possible implications, which could be material and adverse, to the Group’s business, prospects, financial performance and financial condition. The3 COVID-19 pandemic may also have the effect of heightening other risks described below. Our businesses are highly regulated and we have been and could be adversely affected by changes in laws, regulations or regulatory policy As a financial institution, we are subject to detailed laws and regulations in each of the jurisdictions in which we operate or obtain funding, including Australia, New Zealand, the United Kingdom, the United States and various jurisdictions in Asia and the Pacific. We are also supervised by a number of different regulatory and supervisory authorities which have broad administrative powers over our businesses. The Group’s business, prospects, reputation, financial performance and financial condition has been, and could in the future be affected by changes to law and regulation, changes to policies and changes in the supervisory activities and expectations of our regulators. The Group is currently operating in an environment where there is increased scrutiny of the financial services sector4 and specifically, increased scrutiny of financial services providers by regulators. In this environment, the Group faces increasing supervision and regulation in the jurisdictions in which we operate or obtain funding. There has also been an increase in the pace and scope of regulatory change. Regulatory change has directly and adversely affected the Group’s financial condition and financial position, and this dynamic could continue into the future. In recent years, laws have been introduced that required Westpac to maintain increased levels of liquidity and hold higher levels of, and better quality, capital and funding. Regulation also affects the way we operate our business. Regulation could require us to change our existing business models (including by imposing restrictions on the types of businesses we can conduct or the way in which we conduct those businesses) or amend our corporate structure. 5 Regulatory changes have affected, and could in the future, adversely affect one or more of our businesses, restrict our flexibility, require us to incur substantial costs, impact the profitability of one or more of our business lines, result in the Group being unable to increase or maintain market share and/or create pressure on our margins and fees, any of which could adversely affect our business, prospects, financial performance or financial condition. There are numerous sources of regulatory change that could affect our business. In some cases, changes to regulation are driven by international bodies, such as the Basel Committee on Banking Supervision (BCBS). Regulatory change may also flow from reviews and inquiries commissioned by Governments or regulators. These reviews and commissions of inquiry may lead to, and in some cases already have led to, substantial regulatory change or investigations, which could have a material impact on our business, prospects, reputation, financial performance or financial condition.6 It is also possible that governments or regulators in jurisdictions in which we operate or obtain funding might revise their application of existing regulatory policies that apply to, or impact, our business (including by instituting macro-prudential limits on lending). Regulators or governments may take this action for a variety of reasons, including for reasons relating to national interest and/or systemic stability. 7 |
 | Directors’ report The Group’s ability to successfully implement and manage regulatory change has been, and will in the future be, impacted by the current and ongoing COVID-19 pandemic or similar pandemics or outbreaks of communicable diseases. This has caused (and may in the future cause) significant disruptions and delays to regulatory change management projects, increasing the risk that the Group will be non-compliant with new regulation at the time it comes into effect. The Governmental responses to COVID-19 have seen the introduction of a significant body of new legislation, regulations and orders, the impact of which, together with an uncertain environment, are not necessarily foreseeable and may increase compliance risks. This body of new legislation, regulations and orders may also result in the Group incurring significant additional costs. The failure of the Group to appropriately manage and implement regulatory change, including by failing to implement effective processes to comply with new regulations, has, in some instances, resulted in, and could in the future result in, the Group failing to meet a compliance obligation. Further information about the consequences of failing to meet a compliance obligation is set out in the section titled ‘Our businesses are highly regulated and we have been or could be adversely affected by failing to comply with laws, regulations or regulatory policy’ below. Another consideration in managing regulatory change arises when regulation is introduced in one jurisdiction in which we operate that conflicts with the way it is introduced in other jurisdictions in which we operate. For further information about regulatory changes affecting the Group, refer to ‘Significant Developments’ and our 2019 Annual Report (specifically in the ‘Significant Developments’ section and the sections ‘Critical accounting assumptions and estimates’ and ‘Future developments’ in Note 1 to the financial statements). Our businesses are highly regulated and we have been or could be adversely affected by failing to comply with laws, regulations or regulatory policy We are responsible for ensuring that we comply with all applicable legal and regulatory requirements and industry codes of practice in the jurisdictions in which we operate or obtain funding, as well as meeting our ethical standards. The Group is subject to compliance risk, which is the risk of legal or regulatory sanction or financial or reputational loss, arising from our failure to abide by the compliance obligations required of us. This risk is exacerbated by the increasing complexity and volume of regulation and can also arise where we interpret our obligations and rights differently to our regulators or a Court, tribunal or other body. The potential for this to occur is heightened in circumstances where regulation is new, untested or not accompanied by extensive regulatory guidance or where a Court, tribunal or other body interprets regulation differently to such regulatory guidance. The Group employs a compliance management system which is designed to identify, assess and manage compliance risk. While this system is currently in place, it has not always been, and may not in the future be, effective. Breakdowns have and may occur in this system due, for example, to flaws in the design of controls or processes. This has resulted in, and may in the future result in, potential breaches of our compliance obligations, as well as poor customer outcomes. The risk of a breakdown occurring is heightened by the COVID-19 pandemic. The pandemic has resulted in large numbers of the Group’s staff and the staff of our third party contractors working remotely and these distributed working arrangements may have a negative impact on the effectiveness of some of the Group’s compliance controls and monitoring processes. The Group also depends on its employees, contractors, agents, authorised representatives and external service providers to ‘do the right thing’ for it to meet its compliance obligations. Inappropriate conduct by these individuals, such as neglecting to follow a policy or engaging in misconduct, has and could result in poor customer outcomes and a failure by the Group to comply with its compliance obligations. The distributed workforce arrangements employed in response to the COVID-19 pandemic may heighten the risk that policies will not be complied with, in turn leading to potential compliance breaches. This could occur because of deliberate actions taken by staff or it could occur inadvertently, with staff not realising how a policy applies in a remote working environment (particularly in relation to the use of technology and the protection of data and privacy). The Group’s failure, or suspected failure, to comply with a compliance obligation could lead to a regulator commencing surveillance or an investigation into the Group. The Group is currently subject to investigations and reviews by regulators (refer to ‘Significant Developments’ and Note 14 to the financial statements in this 2020 Interim Financial Report for more details), with the intensity of these reviews and investigations increasing. The Group has, and may need to continue, to devote significant business resources and incur substantial costs to respond to these reviews and investigations, and this may have an adverse effect on Westpac’s business, operations and financial performance. Depending on the circumstances, regulatory reviews and investigations have in the past and may in the future ultimately result in a regulator taking administrative or enforcement action against the Group and/or its representatives. Regulators could seek to pursue civil or criminal proceedings, seeking substantial fines, civil penalties or other enforcement outcomes. In addition, the failure or alleged failure of our competitors to comply with their obligations has led, and could in the future lead, to increased regulatory scrutiny across the financial services sector. In many cases, our regulators have very broad powers. For example, under the Banking Act 1959 (Cth), APRA can, in certain circumstances, issue a direction to us (such as a direction to comply with a prudential requirement, to conduct an audit, to remove a Director, executive officer or employee, to take remedial action or not to undertake transactions) or disqualify an ‘Accountable Person’ under the Banking and Executive Accountability Regime. APRA also has the power to require us to hold additional capital, which they have exercised against the Group. For example, APRA imposed a $500 million overlay to our operational risk capital requirement following the completion of our self-assessment into our frameworks and practices in relation to governance, culture and accountability. APRA also required us to hold an additional $500 million overlay following the commencement of civil penalty proceedings by AUSTRAC, citing Westpac’s heightened operational risk profile. If the Group incurs additional capital overlays in the future it may need to raise additional capital which could have an adverse impact on our business, prospects, financial performance and financial condition. |
 | regulators receive new powers. As an example, ASIC recently received the power to make orders that prevent issuers of financial products from engaging in certain conduct. This environment has also seen legislation passed that materially increases1 the penalties that can be imposed for corporate and financial sector misconduct. In particular, ASIC can commence civil penalty proceedings and seek significant civil penalties against an Australian Financial Services licensee (such as Westpac) for failing to do all things necessary to ensure that financial services provided under the licence are provided efficiently, honestly and fairly. The Group may also face significant penalties for failing to comply with other obligations, such as those provided for under the recently legislated Consumer Data Right. This trend towards increasingly severe penalties for failing to meet compliance obligations could continue in the future and be expanded into other areas of regulation that the Group is subject to. Changes may also occur in the oversight approach of regulators, which could result in a regulator preferring its enforcement powers over a more consultative approach. In recent years, there have been significant increases in the nature and scale of regulatory investigations, enforcement actions and the quantum of fines issued by global regulators. 2 APRA has publicly committed to a revised approach to enforcement as well. APRA has indicated that it will use enforcement where appropriate to prevent and address serious prudential risks and hold entities and individuals to account. The way in which regulators supervise and monitor institutions that they regulate has also changed in recent times. A key example of this is the ‘Close and Continuous Monitoring’ (CCM) program, which has involved ASIC staff conducting onsite reviews of these institutions, including Westpac. Westpac has had three onsite reviews completed as part of the CCM program. While ASIC, APRA and other regulators have indicated that their immediate focus is on responding to the impacts of the current COVID-19 pandemic and that they may pause or delay certain enforcement, supervisory activities or monitoring activities (including onsite reviews under the CCM program), the longer term trend towards enhanced supervision and monitoring and greater enforcement activity remains. It is also possible that there will be a shift in the nature of enforcement proceedings commenced by regulators. As well as3 conducting more civil penalty proceedings, our regulators may be more likely to bring criminal proceedings against institutions and/or their representatives in the future. Alternatively, regulators may elect to make criminal referrals to the Commonwealth Department of Public Prosecutions or other prosecutorial bodies. The provision of broad new powers to regulators, coupled with the increasingly active supervisory and enforcement approaches adopted by them, has increased the prospect of adverse regulatory action being brought against the Group. Further, the severity and consequences of that action are now greater, given the expansion of penalties for corporate and financial sector misconduct. The current and ongoing COVID-19 pandemic also has the potential to complicate the Group’s dealings with its regulators in a number of ways. In particular, disruptions to Westpac’s business, operations, third party contractors and suppliers resulting from the pandemic increase the risk that Westpac will not be able to satisfy prior commitments made to regulators about improving4 processes and/or addressing outstanding issues, potentially increasing the prospect of a regulator taking adverse action against the Group. Regulatory action commenced against the Group has exposed and may in the future expose the Group to an increased risk of litigation brought by third parties (including through class action proceedings), which may require the Group to pay compensation to third parties and/or undertake further remediation activities. Regulatory investigations, inquiries, litigation, fines, penalties, infringement notices, revocation, suspension or variation of conditions of relevant regulatory licences or other enforcement or administrative action or agreements (such as enforceable undertakings) could, either individually or in aggregate with other regulatory action, adversely affect our business, prospects, reputation, financial performance or financial condition. For further details about regulatory matters that may affect the Group, refer to ‘Significant Developments’.5 The failure to comply with financial crime obligations could have an adverse effect on our business and reputation The Group is subject to anti-money laundering and counter-terrorism financing (AML/CTF) laws, anti-bribery and corruption laws, economic and trade sanctions laws and tax transparency laws in the jurisdictions in which it operates. These laws can be complex and, in some circumstances, impose a diverse range of obligations. As a result, the environment in which the Group operates has heightened operational and compliance risks. For example, AML/CTF laws require Westpac and other regulated institutions to (amongst other things) undertake applicable customer identification procedures, conduct ongoing and enhanced due diligence on customers, maintain and comply with an AML/CTF program and undertake ongoing risk assessments. AML/CTF laws also require Westpac to report certain matters and transactions to regulators (including in relation to International Funds Transfer Instructions, Threshold Transaction Reports and Suspicious Matter Reports) and ensure that certain information6 is not disclosed to third parties in a way that would contravene the ‘tipping off’ provisions in AML/CTF legislation. In recent years there has been increased focus on compliance with financial crime obligations, with regulators around the globe commencing large-scale investigations and taking enforcement action where they have identified non-compliance (often seeking significant monetary penalties). Further, due to the large number of customers that the Group serves, and the large volume of transactions that the Group processes, the undetected failure or the ineffective implementation, monitoring or remediation of a system, policy, process or control (including in relation to a regulatory reporting obligation) has, and could in the future result in, a significant number of breaches of AML/CTF obligations. This in turn could lead to significant monetary penalties. While the Group has systems, policies, processes and controls in place that are designed to manage its financial crime obligations (including its reporting obligations), these have not always been, and may not in the future always be effective. This could be the case for a range of reasons, including, for example, a deficiency in the design of a control or a technology related failure.7 |
 | Directors’ report The Group is currently undertaking a significant multi-year program of work that is required to strengthen areas of control weaknesses in its financial crime management framework (including in relation to important aspects of its money laundering and terrorism financing risk assessments and governance) and rectify the management of this risk. For further information, refer to ‘Significant Developments’. As part of these efforts, Westpac has identified deficiencies in certain systems and controls relevant to its obligation to file TTRs. This has, over a number of years, resulted in instances where the Group has failed to report TTRs, as well as instances where the Group filed TTRs with incomplete or inaccurate information. The Group has self-reported these TTR deficiencies to AUSTRAC and is keeping AUSTRAC apprised of the status of its investigations. To date, this remediation has involved the late reporting of 17,870 TTRs to AUSTRAC. Additionally, there are multiple TTR reporting scenarios which based on the preliminary analysis undertaken to date (which has not been finally quantified or resolved), could amount to an estimated 60,000 to 90,000 TTRs that have not been reported to AUSTRAC. Although the Group provides updates to AUSTRAC and the Group’s other regulators on its remediation and program update activities, there is no assurance that AUSTRAC or the Group’s other regulators will agree that its remediation and program update activities will be adequate or effectively enhance the Group’s compliance programs. If we fail, or where we have failed, to comply with these financial crime obligations, we could face regulatory enforcement action such as litigation, significant fines, penalties and the revocation, suspension or variation of licence conditions, such as the civil penalty proceedings brought by AUSTRAC against Westpac on 20 November 2019 in relation to alleged contraventions of the Anti-Money Laundering and Terrorism Financing Act 2006 (Cth). Further information on the AUSTRAC proceedings and other financial crime matters is set out in ‘Significant Developments’. For information regarding the provision made for Westpac’s potential penalty in relation to these proceedings, refer to Note 14 to the financial statements in this 2020 Interim Financial Report. Non-compliance or alleged non-compliance with our obligations pertaining to the prevention of financial crime and public disclosure have also resulted in, and could lead to regulatory proceedings or other litigation commenced by third parties, (including Australian, US or other class action proceedings) and regulatory action in non-Australian jurisdictions in which we operate. Any such litigation or proceeding could cause significant financial and reputational damage to us. Reputational damage could result in the loss of customers or restrict the Group’s ability to access capital markets on favourable terms, which could have a material adverse effect on the Group’s business, reputation, results of operation and financial condition. Furthermore, any such material adverse effect could harm the Group’s credit ratings. Previous enforcement action by AUSTRAC against other institutions has resulted in a range of outcomes, depending on the nature and severity of the relevant conduct and its consequences, including substantial financial penalties. Reputational damage could harm our business and prospects Our ability to attract and retain customers and our prospects could be adversely affected if our reputation is damaged. Reputation risk is the risk of loss of reputation, stakeholder confidence or public trust and standing. It arises where there are differences between stakeholders’ current and emerging perceptions, beliefs and expectations and our past, current and planned activities, processes, performance and behaviours. There are various potential sources of reputational damage. Westpac’s reputation may be damaged where any of its service levels, products, policies, processes, practices or behaviours results, or is perceived to result, in a negative outcome for a customer or a class of customers. Other potential sources of reputational damage include the failure to effectively manage risks in accordance with our risk management frameworks, failure to comply with legal and regulatory requirements, enforcement or supervisory action taken by regulators, adverse findings from regulatory reviews (including Westpac-specific and industry-wide reviews), failure or perceived failure to adequately respond to external community needs, environmental, social and ethical issues, failure of information security systems, technology failures, security breaches and inadequate record keeping which may prevent Westpac from demonstrating that a past decision was appropriate at the time it was made. Westpac may suffer reputational damage where its conduct, practices, behaviours or business activities do not align with the evolving standards and expectations of the community, our customers, our regulators and/or other stakeholders. As these expectations may exceed the standard required in order to comply with the law, Westpac may incur reputational damage even where it has met its legal obligations. Our reputation could also be adversely affected by the actions of the financial services industry in general or from the actions of our competitors, customers, suppliers, joint-venture partners, strategic partners, other counterparties and accredited data recipients that the Group provides customer data to under Australia’s ‘Open Banking’ regime. Further, the risk of reputational damage may be heightened by factors such as the increasing use of social media or the increasing prevalence of interest groups which seek to publicly challenge the Group’s strategy or approach to aspects of its business. Failure, or perceived failure, to appropriately address issues that could or do give rise to reputational risk have, and could in the future, also impact the regulatory change agenda, give rise to additional legal risk, subject us to regulatory investigations, regulatory enforcement actions, fines and penalties or litigation brought by third parties (including class actions), require us to remediate and compensate customers and incur remediation costs or harm our reputation among customers, investors and the marketplace. This could lead to loss of business which could adversely affect our business, prospects, financial performance or financial condition. |
 | changes in laws, regulations or regulatory policy, and has resulted in, and may continue to result in, ongoing reputational damage to the Group, all of which has and may continue to have an adverse effect on our business1 and prospects The Royal Commission into Misconduct in the Banking, Superannuation and Financial Services Industry investigated (amongst other things) whether any conduct, practices, behaviours or business activities engaged in by financial services entities amounted to potential misconduct or fell below community standards and expectations. These investigations (including the public hearings, submissions, evidence and findings of the Royal Commission) had, and may continue to have, an adverse impact on the Group’s reputation and potentially the financial performance of the Group’s businesses. In addition, the case studies considered by the Royal Commission, and the Royal Commission’s findings, have led, and may in the future lead, to regulators commencing investigations and/or enforcement action against financial institutions (including the Group). This environment has also resulted in an increase in class actions or other litigation being commenced by the Group’s customers, including in relation to matters raised at the Royal Commission. For further information about this risk,2 refer to the section titled ‘We have and could suffer losses due to litigation (including class action proceedings)’ below. In addition, the recommendations made in the Final Report of the Commission have resulted and will, depending on how its recommendations are implemented, result in further changes to legislation, and further influence the policies and practices of our regulators. In some instances, this has already had, and may continue to have in the future, an adverse effect on our business, prospects, financial performance or financial condition. The Royal Commission has also led to increased political or regulatory scrutiny of the financial industry in New Zealand, and may continue to do so. We have and could suffer losses due to litigation (including class action proceedings) The Group (and individual entities within the Group) may, from time to time, be involved in legal proceedings, regulatory actions or arbitration arising from the conduct of their business and the performance of their legal and regulatory obligations.3 Proceedings could be commenced against the Group by a range of potential plaintiffs, such as our customers, shareholders, suppliers and counterparties. These plaintiffs may commence proceedings individually or they may commence class action proceedings. In recent years, there has been a substantial increase in the number of class action proceedings brought against financial services companies (and other organisations more broadly), many of which have resulted in significant monetary settlements. The risk of class action proceedings being commenced is heightened by findings from regulatory investigations or inquiries (such as the Royal Commission into Misconduct in the Financial Services Industry), adverse media, an adverse judgment or the settlement of proceedings brought by a regulator. Furthermore, there is a risk that class action proceedings commenced against a competitor could lead to similar class action proceedings being commenced against the Group. The growth in third party litigation funding in Australia has also contributed to a recent increase in the number of class actions4 being commenced in Australia. This trend may continue in light of recent court judgments which have clarified the courts’ approach to liability and loss on certain types of class action claims. This clarification may encourage plaintiffs, law firms and funders to bring and maintain class action proceedings, as well as potentially improve the ability of plaintiffs to establish certain types of class action claims. From time to time, class action proceedings are commenced against the Group. For further information about class action proceedings that the Group is currently involved in, refer to Note 14 to the financial statements in this 2020 Interim Financial Report. Litigation (including class action proceedings) may, either individually or in aggregate, adversely affect the Group’s business, operations, prospects, reputation or financial condition. This risk is heightened by the recent increases in the severity of penalties for certain breaches of the law. Such matters are subject to many uncertainties (for example, the outcome may not be able to be predicted accurately). Furthermore, the Group’s ability to respond to and defend litigation may be adversely affected5 by inadequate record keeping. Depending on the outcome of any litigation, the Group may be required to comply with broad court orders, including compliance orders, enforcement orders or otherwise pay money such as damages, fines, penalties or legal costs. The Group’s material provisions and contingent liabilities are described in Note 14 to the financial statements in this 2020 Interim Financial Report. There is a risk that the actual penalty paid following a settlement or determination by a Court in relation to any legal proceedings may be materially higher or lower than the amount of any provision or that any contingent liabilities may be larger than anticipated. This may occur in a wide range of situations, for example where the scope of existing litigation against the Group is expanded by the addition of further claims or causes of action. Further, there is a risk that additional litigation or other contingent liabilities may arise, all of which could adversely affect our business, prospects, reputation, financial performance or financial condition.6 We have suffered and could in the future suffer information security risks, including cyberattacks The proliferation of new technologies, the increasing use of the internet and telecommunications to conduct financial transactions and the growing sophistication and activities of attackers (including organised crime and state-sponsored actors) have resulted in increased information security risks for major financial institutions such as Westpac and our external service providers. The COVID-19 pandemic has exacerbated these risks by requiring a significant number of Westpac staff and third party contractors to work remotely or from alternative work sites, with these working arrangements potentially providing additional opportunities for malicious cyber actors to exploit. 7 |
 | Directors’ report While Westpac has systems in place to protect against, detect and respond to cyberattacks, these systems have not always been, and may not in the future always be effective. There can be no assurance that we will not suffer losses from cyberattacks or other information security breaches. The Group may not be able to anticipate and prevent a cyberattack, or it may not be able to implement effective measures to respond to a cyberattack in progress. Further, there is a risk that the Group will not be able to rectify or minimise the damage resulting from a cyberattack. If the Group is subject to a successful cyberattack, technology systems might fail to operate properly or become disabled and it could result in the unauthorised release, gathering, monitoring, misuse, loss or destruction of confidential, proprietary and other information of the Group, its employees, customers or third parties or otherwise adversely impact network access, business operations or availability of services. In addition, as cyber threats continue to evolve, we may be required to expend significant additional resources to modify or enhance our systems or to investigate and remediate any vulnerabilities or incidents. Our operations rely on the secure processing, storage and transmission of information on our computer systems and networks, and the systems and networks of external suppliers. Although we implement measures to protect the security, integrity and confidentiality of our information, there is a risk that the computer systems, software and networks on which we rely may be subject to security breaches, unauthorised access, malicious software, external attacks or internal breaches that could have an adverse impact on our confidential information or that of our customers and counterparties. Major banks in other jurisdictions have suffered security breaches from sophisticated cyberattacks. Our external service providers, and other parties that facilitate our business activities and financial platforms and infrastructure (such as clearing houses, payment systems and exchanges) are also subject to the risk of cyberattacks. Any such security breach could result in the loss of customers and business opportunities, significant disruption to Westpac’s operations, misappropriation of Westpac’s confidential information and/or that of our customers and damage to Westpac’s computers or systems and/or those of our customers. Such a security breach could also result in reputational damage, claims for compensation and regulatory investigations and penalties, which could adversely affect our business, prospects, financial performance or financial condition. Our risk and exposure to such threats remains heightened because of the evolving nature of technology, Westpac’s prominence within the financial services industry, the prominence of our customers (including those in the government, mining and health sectors), increasing obligations to make data and information available to external third parties and our plans to continue to improve and expand our internet and mobile banking infrastructure. We could suffer losses due to technology failures or our inability to appropriately manage and upgrade our technology The reliability, integrity and security of our information and technology is crucial in supporting our customers’ banking requirements and meeting our compliance obligations and our regulators’ expectations. While the Group has a number of processes in place to provide for and monitor the availability and recovery of our systems, there is a risk that our information and technology systems might fail to operate properly or become disabled, including as a result of events that are wholly or partially beyond our control. As an example, in response to the COVID-19 pandemic, more Westpac staff and third party contractors are required to work remotely or from alternative work sites, which may put additional stress on Westpac’s information technology infrastructure and systems. Similarly, the COVID-19 pandemic and the measures implemented by Governments to mitigate its spread are likely to result in increased demand being placed on critical national technology and communications infrastructure which the Group relies on. This could adversely impact the reliability of such infrastructure and increase the risk that our technology systems will not be able to operate properly or will become disabled for a period of time. If we incur a technology failure we may fail to meet a compliance obligation (such as the obligation to retain records and data for requisite periods of time), or our customers may be adversely affected. This could potentially result in reputational damage, remediation costs and a regulator commencing an investigation and/or taking administrative or enforcement action against us. The overuse or overreliance on legacy or outdated systems may heighten the risk of a technology failure occurring. Further, in order to continue to deliver new products and services to customers, comply with our regulatory obligations (such as obligations to report certain data and information to regulators) and meet the ongoing expectations of our regulators and our customers, we need to regularly renew and enhance our technology. We are constantly managing technology projects including projects to upgrade our technology platforms, consolidate technology platforms, simplify and enhance our technology and operations environment, assist us to comply with legal obligations, improve productivity and provide for a better customer experience. Failure to implement these projects or manage associated change effectively could result in cost overruns, unrealised productivity, operational instability, failure to meet compliance obligations, reputational damage and/or result in the loss of market share to competitors. In turn, this could place us at a competitive disadvantage and adversely affect our business, prospects, financial performance or financial condition. Adverse credit and capital market conditions or depositor preferences may significantly affect our ability to meet funding and liquidity needs and may increase our cost of funding We rely on deposits, and credit and capital markets, to fund our business and as a source of liquidity. Our liquidity and costs of obtaining funding are related to credit and capital market conditions. Global credit and capital markets can experience periods of extreme volatility, disruption and decreased liquidity. While there can be extended periods of stability in these markets, the environment remains unpredictable as evidenced by the Global Financial Crisis and the systemic impacts from the COVID-19 pandemic. The main risks we face are damage to market confidence, changes to the access and cost of funding and a slowing in global activity or other impacts on entities with whom we do business. |
 | Of this, around 68% was sourced outside Australia and New Zealand. Customer deposits provide around 63% of total funding. Customer deposits held by Westpac are comprised of both term deposits which can be withdrawn after a certain period of time1 and at call deposits which can be withdrawn at any time. A shift in investment preferences could result in deposit withdrawals by customers which could increase our need for funding from other, potentially less stable, or more expensive, forms of funding. If market conditions deteriorate due to economic, financial, political or other reasons (including the current and ongoing COVID-19 pandemic), there may also be a loss of confidence in bank deposits and we could experience unexpected deposit withdrawals. In this situation our funding costs may be adversely affected and our liquidity and our funding and lending activities may be constrained and our financial solvency threatened. If our current sources of funding prove to be insufficient, we may be forced to seek alternative financing. The availability of such alternative financing, and the terms on which it may be available, will depend on a variety of factors, including prevailing market conditions, the availability of credit, our credit ratings and credit market capacity. Even if available, these alternatives may be2 more expensive or on unfavourable terms, which could adversely affect our financial performance, liquidity, capital resources or financial condition. There is no assurance that we will be able to obtain adequate funding, do so at acceptable prices, or that we will be able to recover any additional costs. If Westpac is unable to source appropriate funding, we may also be forced to reduce our lending or begin selling liquid securities. Such actions may adversely impact our business, prospects, liquidity, capital resources, financial performance or financial condition. If Westpac is unable to source appropriate funding for an extended period, or if it can no longer sell liquid securities, there is a risk that Westpac will be unable to pay its debts as and when they become due and payable. Westpac enters into collateralised derivative obligations, which may require Westpac to post additional collateral based on movements in market rates, which has the potential to adversely affect Westpac’s liquidity or ability to use derivative obligations to hedge its interest rate, currency and other financial instrument risks.3 For a more detailed description of liquidity risk, refer to ‘Funding and liquidity risk’ in Note 21 to the financial statements in our 2019 Annual Report. Sovereign risk may destabilise financial markets adversely Sovereign risk is the risk that governments will default on their debt obligations, will be unable to refinance their debts as they fall due or will nationalise parts of their economy including assets of financial institutions such as Westpac. Sovereign defaults could negatively impact the value of our holdings of high quality liquid assets. There may also be a cascading effect to other markets and countries, the consequences of which, while difficult to predict, may be similar to or worse than those experienced during the Global Financial Crisis. Such an event could destabilise global financial markets, adversely affecting our liquidity, financial performance or financial condition. 4 Failure to maintain credit ratings could adversely affect our cost of funds, liquidity, competitive position and access to capital markets Credit ratings are independent opinions on our creditworthiness. Our credit ratings can affect the cost and availability of our funding from capital markets and other funding sources and they may be important to customers or counterparties when evaluating our products and services. Therefore, maintaining strong credit ratings is important. The credit ratings assigned to us by rating agencies are based on an evaluation of a number of factors, including our financial strength, the quality of our governance, structural considerations regarding the Australian financial system and the credit rating of the Australian Sovereign. A credit rating downgrade could be driven by a downgrade of the Australian Sovereign, the occurrence of one or more of the other risks identified in this section or by other events including changes to the methodologies used by the rating agencies to determine ratings. 5 The current and ongoing economic impacts of the COVID-19 pandemic have affected Westpac’s credit ratings and may continue to do so in the future. Credit rating agency Fitch recently downgraded its short-term and long-term ratings for the major Australian banks (including Westpac) by one notch, to A+ (from AA-) and F1 (from F1+) respectively, citing the significant economic consequences for Westpac’s core markets of Australia and New Zealand caused by the actions taken by governments to try and slow the spread of COVID-19. Fitch has maintained the rating outlook for the major Australian banks as “negative”, reflecting the major downside risk to Fitch’s economic outlook in light of the evolving global situation. S&P Global Ratings also revised its outlook for Westpac’s long-term issuer credit rating to ‘negative’, mirroring a similar change to their outlook for the Australian Sovereign. As the economic impacts from the COVID-19 pandemic continue, there is a risk that there will be further negative movement in our credit ratings. A downgrade or series of downgrades to our credit ratings could have an adverse effect on our cost of funds and related margins, collateral requirements, liquidity, competitive position and our access to capital markets. The extent and nature of these6 impacts would depend on various factors, including the extent of any ratings change, whether our ratings differ among agencies (split ratings) and whether any ratings changes also impact our competitors or the sector. 7 |
 | Directors’ report A systemic shock in relation to the Australian, New Zealand or other financial systems could have adverse consequences for Westpac or its customers or counterparties that would be difficult to predict and respond to There is a risk that a major systemic shock could occur that causes an adverse impact on the Australian, New Zealand or other financial systems. During the past decade the financial services industry and capital markets have been, and may continue to be, adversely affected by market volatility, global economic conditions, external events, geopolitical instability (such as threats of or actual conflict occurring around the world), and political developments. In particular, the economic impacts from the COVID-19 pandemic could be significant for the global economy including Australia and New Zealand. Any such market and economic disruptions could adversely affect financial institutions such as Westpac because consumer and business spending may decrease, unemployment may rise and demand for the products and services we provide may decline, thereby reducing our earnings. These conditions may also affect the ability of our borrowers to repay their loans or our counterparties to meet their obligations, causing us to incur higher credit losses and affect investors’ willingness to invest in the Group. These events could also result in the undermining of confidence in the financial system, reducing liquidity, impairing our access to funding and impairing our customers and counterparties and their businesses. If this were to occur, our business, prospects, financial performance or financial condition could be adversely affected. The nature and consequences of any such event are difficult to predict and there can be no certainty that we could respond effectively to any such event. Declines in asset markets could adversely affect our operations or profitability Recent and future declines in Australian, New Zealand or other asset markets, including equity, residential and commercial property and other asset markets have adversely affected, and could in the future adversely affect, our operations and profitability. Declining asset prices also impact our wealth management business. Earnings in our wealth management business are, in part, dependent on asset values because we typically receive fees based on the value of securities and/or assets held or managed. A decline in asset prices could negatively impact the earnings of this business. Declining asset prices could also impact customers and counterparties and the value of security (including residential and commercial property) we hold against loans and derivatives. This may impact our ability to recover amounts owing to us if customers or counterparties were to default. It may also affect our level of provisioning which in turn impacts our profitability and financial condition. Our business is substantially dependent on the Australian and New Zealand economies Our revenues and earnings are dependent on economic activity and the level of financial services our customers require. In particular, lending is dependent on various factors including economic growth, business investment, business and consumer sentiment, levels of employment, interest rates, asset prices and trade flows in the countries in which we operate. We conduct the majority of our business in Australia and New Zealand and, consequently, our performance is influenced by the level and cyclical nature of lending in these countries. These factors are in turn impacted by both domestic and international economic conditions, natural disasters and political events, and in particular, at present, are being impacted by the current and ongoing COVID-19 pandemic (see ‘Outbreaks of communicable diseases or a pandemic like COVID-19 have had, and could in the future have, an adverse effect on the Group’ above). A significant decrease in Australian and New Zealand housing valuations and commercial property valuations could adversely impact our home lending activities because borrowers with loans in excess of their property value show a higher propensity to default. In the event of defaults our security may be eroded, causing us to incur higher credit losses. The demand for our home lending products may also decline due to adverse changes in tax legislation (such as changes to tax rates, concessions or deductions), regulatory requirements or other buyer concerns about decreases in values. Adverse changes to economic and business conditions in Australia and New Zealand and other countries such as China, India, Japan and the US could also adversely affect the Australian economy and our customers. In particular, due to the current economic relationship between Australia and China, particularly in the mining and resources sectors, a slowdown in China’s economic growth, including as the result of the implementation of tariffs or other protectionist trade measures, could negatively impact the Australian economy. Changes in commodity prices, Chinese government policies and broader economic conditions could, in turn, result in reduced demand for our products and services and affect the ability of our borrowers to repay their loans. If this were to occur, it could negatively impact our business, prospects, financial performance or financial condition. Monetary policy can also significantly affect the Group. Interest rate settings (including low or negative rates), as well as other actions taken by central banks (such as quantitative easing), may adversely affect our cost of funds, the value of our lending and investments and our margins. Monetary policies also impact the broader economic conditions of the various jurisdictions that the Group operates or obtains funding in. These policies could affect demand for our products and services and/or have a negative impact on the Group’s customers and counterparties, potentially increasing the risk that they will default on their obligations to the Group. All of these factors could adversely affect our business, prospects, financial performance or financial condition. |
 | performance or financial condition Credit risk is the risk of financial loss where a customer or counterparty fails to meet their financial obligations to Westpac. It is a1 significant risk and arises primarily from our lending activities. We establish provisions for credit impairment based on current information and our expectations. If economic conditions deteriorate outside of our expectations, some customers and/or counterparties could experience higher levels of financial stress and we may experience a significant increase in defaults and write-offs, and be required to increase our provisioning. Such events would diminish available capital and could adversely affect our liquidity, capital resources, financial performance or financial condition. These risks are heightened due to the current COVID-19 pandemic which has negatively impacted economic activity and caused a wide range of customer segments to experience financial stress. To combat the spread of the COVID-19 pandemic, and in some cases, in response to government mandates to close businesses, many of Westpac’s customers have ceased or substantially reduced their operations for an indeterminate period of time. In addition, individuals may have been laid off,2 be unable to work, or have fewer hours of work as a result of ceased or reduced business operations. Westpac has received requests for assistance from both businesses and individual customers who have been affected, and Westpac has implemented a range of initiatives to support them. These initiatives have included granting principal and interest repayment holidays and interest capitalisation to certain affected customers. These initiatives will likely have a negative impact on the Group’s financial performance and may see the Group assume a greater level of risk than it would have under ordinary circumstances. The longer-term impact of the COVID-19 pandemic on our customers and the number and extent of defaults or impairments is uncertain, given the shape and timing of the recovery, the influence of significant government assistance packages on economic activity and the potential for consumers to demonstrate changed behaviour even after the COVID-19 pandemic is over. For example, consumers may decrease their discretionary spending on a permanent or long-term basis meaning certain industries may take longer to recover. For further information see ‘Outbreaks of communicable diseases or a pandemic like COVID-19 have had, and could in the3 future have, an adverse effect on the Group’ above. Credit risk also arises from certain derivative, clearing and settlement contracts we enter into, and from our dealings with, and holdings of, debt securities issued by other banks, financial institutions, companies, clearing houses, governments and government bodies, the financial conditions of which may be affected to varying degrees by economic conditions in global financial markets. For a discussion of our risk management procedures, including the management of credit risk, refer to the ‘Risk management’ section and Note 21 to the financial statements in our 2019 Annual Report. We face intense competition in all aspects of our business The financial services industry is highly competitive. We compete, both domestically and internationally, with a range of firms,4 including retail and commercial banks, asset managers, investment banking firms, brokerage firms, other financial service firms and businesses in other industries with emerging financial services aspirations. This includes specialist competitors that may not be subject to the same capital and regulatory requirements and therefore may be able to operate more efficiently. Digital technologies are changing consumer behaviour and the competitive environment. The use of digital channels by customers to conduct their banking continues to rise and emerging competitors are increasingly utilising new technologies and seeking to disrupt existing business models, including in relation to digital payment services. The Group faces competition from established providers of financial services as well as from banking businesses developed by non-financial services companies. The competitive environment may also change as a result of legislative reforms such as ‘Open Banking’, which will stimulate competition, improve customer choice and likely give rise to increased competition from new and existing industry participants. 5 Increased competition for deposits could also increase our cost of funding and lead us to seek access to other types of funding or reduce lending. We rely on bank deposits to fund a significant portion of our balance sheet and deposits have been a relatively stable source of funding. We compete with banks and other financial services firms for such deposits. To the extent that we are not able to successfully compete for deposits, we would be forced to rely more heavily on other, potentially less stable or more expensive forms of funding, or reduce lending. We are also dependent on our ability to offer products and services that match evolving customer preferences. If we are not successful in developing or introducing new products and services or responding or adapting to changes in customer preferences and habits, we may lose customers to our competitors. This could adversely affect our business, prospects, financial performance or financial condition.6 For more detail on how we address competitive pressures refer to ‘Competition’ in Section 1 of our 2019 Annual Report. 7 |
 | Directors’ report We could suffer losses due to market volatility We are exposed to market risk as a consequence of our trading activities in financial markets, our defined benefit plan and through the asset and liability management of our financial position. This is the risk of an adverse impact on earnings resulting from changes in market factors, such as foreign exchange rates, commodity prices, equity prices, and interest rates including the potential for low or negative interest rates. This includes interest rate risk in the banking book, such as the risk to interest income from a mismatch between the duration of assets and liabilities that arises in the normal course of business activities. Changes in market factors could be driven by a number of developments. As an example, the current and ongoing COVID-19 pandemic has resulted in and will likely continue to result in significant market volatility. Continuing uncertainty as to the longevity and severity of the threat to public health is likely to further disrupt markets in the period ahead and could result in adverse consequences to the value of market exposures held by the Group. Another example of a development that could lead to market volatility is the July 2017 announcement by the (FCA which regulates the London Interbank Offered Rate (“LIBOR”)), that it would not require panel banks to continue to submit rates for the calculation of the LIBOR benchmark after 2021. Accordingly, the continuation of LIBOR in its current form will not be guaranteed after 2021, and it appears likely that LIBOR will be discontinued or modified by 2021. Any such developments or future changes in the administration of LIBOR or any other benchmarks could result in adverse consequences to the return on, value of and market for securities and other instruments whose returns are linked to any such benchmark, including those securities or other instruments issued by the Group. If we were to suffer substantial losses due to any market volatility (including changes in the return on, value of or market for, securities or other instruments) it may adversely affect our business, prospects, liquidity, capital resources, financial performance or financial condition. For a discussion of our risk management procedures, including the management of market risk, refer to the ‘Risk management’ section in our 2019 Annual Report. We have and could suffer losses due to operational risks Operational risk is the risk of loss resulting from inadequate or failed internal processes, people and systems or from external events. It also includes, among other things, legal risk, reputational risk, technology risk, model risk and outsourcing risk, as well as the risk of business disruption due to external events such as natural disasters, pandemics or outbreaks of communicable diseases (such as the current and ongoing COVID-19 pandemic - see ‘Outbreaks of communicable diseases or a pandemic like COVID -19 have had, and could in the future have, an adverse effect on the Group’) environmental hazard, damage to critical utilities, and targeted activism and protest activity. While we have policies, processes and controls in place to manage these risks, these may not always have been, or continue to be effective. Ineffective processes and controls have resulted in, and could in the future result in an adverse outcome for Westpac’s customers. For example, a process breakdown could result in a customer not receiving a product on the terms and conditions, or at the pricing, they agreed to. In addition, inadequate record keeping may prevent Westpac from demonstrating that a past decision was appropriate at the time it was made or that a particular action or activity was undertaken. If this was to occur, Westpac may incur significant costs in paying refunds and compensation to customers, as well as remediating any underlying process breakdown. Failed processes could also result in Westpac incurring losses because it is not able to enforce its contractual rights. This could arise in circumstances where Westpac did not correctly document its rights or failed to perfect a security interest. These types of operational failures, may also result in increased regulatory scrutiny and depending on the nature of the failure and its impact, result in a regulator potentially commencing an investigation and/or taking other enforcement, administrative or supervisory action. We could incur losses from fraudulent applications for loans or from incorrect or fraudulent payments and settlements, particularly real-time payments. Fraudulent conduct can also emerge from external parties seeking to access the bank’s systems and customers’ accounts. If systems, procedures and protocols for managing fraud fail, or are ineffective, they could lead to losses which could adversely affect our customers, as well as our business, prospects, reputation, financial performance or financial condition. Westpac is also exposed to model risk, being the risk of loss arising from errors or inadequacies in data or a model, or in the control and use of a model. Westpac is required to retain and access data and documentation for specific retention periods in order to satisfy its compliance obligations. In some cases, Westpac also retains data to enable it to demonstrate that a past decision was appropriate at the time it was made. Failings in systems, processes and policies could all adversely affect Westpac’s ability to retain and access data. In recent times, financial services entities have been increasingly sharing data with third parties, such as suppliers and regulators (both domestic and offshore), in order to conduct their business activities and meet regulatory obligations. A breakdown in a process or control related to the transfer, storage or protection of data transferred to a third party, or the failure of a third party to use and handle this data correctly, could result in the Group failing to meet a compliance obligation (including any relevant privacy obligations) and/or have an adverse impact on our customers and the Group. Westpac also relies on a number of suppliers, both in Australia and overseas, to provide services to it and its customers. The current and ongoing COVID-19 pandemic is disrupting the ability for various of Westpac’s suppliers and third party contractors to operate, with these disruptions likely to continue into the future (for further information see ‘Outbreaks of communicable diseases or a pandemic like COVID -19 have had, and could in the future have, an adverse effect on the Group’). Failure by these third party contractors and suppliers to deliver services as required (whether due to the COVID-19 pandemic or for any other reasons) could disrupt Westpac’s ability to provide services and adversely impact Westpac’s operations, profitability or reputation. |
 | future, the technology systems used by the Group, its counterparties and/or financial infrastructure providers may fail to operate correctly and this may cause loss or damage to the Group and/or its counterparties.1 Operational risks can impact our reputation and result in financial losses which would adversely affect our financial performance or financial condition. For a discussion of our risk management procedures, including the management of operational risk, refer to the ‘Risk management’ section in our 2019 Annual Report. Poor data quality could adversely affect our business and operations Accurate, complete and reliable data, along with appropriate data governance frameworks and processes, is critical to the effective operation of Westpac’s business. Data plays a key role in our provision of products and services to customers, our systems (both customer-facing and back-office), our risk management frameworks and our decision-making and strategic planning.2 In some areas of our business and operations, we are affected by poor data quality. This poor data quality has arisen and could in the future arise in a number of ways, including through inadequacies in systems, processes and policies, or the ineffective implementation of data management frameworks and processes. Poor data quality could lead to failings in customer service, negative risk management outcomes, and deficiencies in credit systems and processes. These deficiencies in credit systems and processes could, in turn, have a negative impact on Westpac’s decision making in relation to the provision of credit and the terms on which it is provided. Poor data can also affect Westpac’s ability to comply with its compliance obligations (including obligations to report certain information to regulators), which could lead to a regulator taking action against the Group. Westpac also needs accurate data for its financial reporting processes (including the calculation of its risk-weighted assets). Due to the importance of data, the Group has and will likely continue to incur substantial costs and devote significant3 management effort to remediating data-related deficiencies. Further, the Group’s ongoing efforts to remediate data issues have been complicated and delayed by the disruption caused by the COVID-19 pandemic. The failure of the Group to remediate such data issues in a timely way could result in increased regulatory scrutiny, with regulators potentially exercising their supervisory powers against the Group to require the remediation of these issues. The consequences and effects arising from poor data quality could have an adverse impact on the Group’s business, operations, prospects, financial performance and/or financial condition. Operational risk, technology risk, conduct risk or compliance risk events have required, and could in the future require, Westpac to undertake customer remediation activity Westpac relies on a large number of policies, processes, procedures, systems and people to conduct its business. Breakdowns4 or deficiencies in one of these areas (arising from one or more operational risk, technology risk, conduct risk or compliance risk events) have resulted, and could in the future result in, adverse outcomes for customers which Westpac is required to remediate. These events could require the Group to incur significant remediation costs (which may include compensation payments to customers and costs associated with correcting the underlying issue) and result in reputational damage. There are significant challenges and risks involved in customer remediation activities. Westpac’s ability to investigate an adverse customer outcome that may require remediation could be impeded if the issue is a legacy matter spanning beyond our record retention period, or if our record keeping is otherwise inadequate. Depending on the nature of the issue, it may be difficult and take significant time to quantify and scope the remediation activity. 5 in Westpac failing to execute the remediation in a timely manner. A failure of this type could lead to a regulator commencing enforcement action against the Group. The ineffective or slow completion of a remediation also exposes the Group to increased reputational risk, with the Group potentially being criticised and challenged by regulators, affected customers, the media and other stakeholders, resulting in reputational damage. The significant challenges and risks involved in scoping and executing remediations in a timely way also create the potential for remediation costs actually incurred to be higher than those initially estimated by the Group. Further, if a remediation program is delayed (whether due to the impact of the COVID-19 pandemic or for other reasons) this could result in the Group incurring6 additional program administration costs above those originally anticipated and result in the Group paying higher remediation payments to affected customers in order to reflect the impact of the time value of money. If the Group cannot effectively scope, quantify or implement a remediation activity in a timely way, there could be a negative impact on our business, prospects, reputation, financial performance or financial condition. 7 |
 | Directors’ report We have and could suffer losses due to conduct risk Conduct risk is the risk that our provision of services and products results in unsuitable or unfair outcomes for our stakeholders or undermines market integrity. Conduct risk could occur through the provision of products and services to our customers that do not meet their needs or do not support market integrity, as well as the poor conduct of our employees, contractors, agents, authorised representatives and external service providers, which could include deliberate attempts by such individuals to circumvent Westpac’s controls, processes and procedures. This could occur through a failure to meet professional obligations to specific clients (including fiduciary and suitability requirements), poor product design and implementation, failure to adequately consider customer needs or selling products and services outside of customer target markets. Conduct risk may also arise where there has been a failure to adequately provide a product or services that we had agreed to provide a customer. While we have frameworks, policies, processes and controls that are designed to manage poor conduct outcomes, these policies and processes may not always have been or continue to be effective. The failure of these policies and processes could result in financial losses (including incurring substantial remediation costs and litigation by regulators and customers) and reputational damage and this could adversely affect our business, prospects, financial performance or financial condition. We could suffer losses and our business has been and could be adversely affected by the failure to adopt and implement effective risk management Our risk management framework includes risk management strategies, policies and internal controls involving processes and procedures intended to identify, monitor and manage risks facing the Group. However, our risk management framework has not always been, or may not in the future prove to be, effective. This could be because the design of the framework may be inadequate, which could result in key information not being provided to decision-makers in the right form and in a timely manner, or because of weaknesses in underlying data. There is also the possibility that key risk management policies, controls and processes may be ineffective, either due to inadequacies in their design, or because of the poor implementation of these policies, controls and processes. The potential for failings in the design and implementation of risk processes and controls is heightened if the Group does not have a sufficient number of appropriately skilled, adequately trained and qualified employees in key positions. There are also inherent limitations with any risk management framework as there may exist, or emerge in the future, risks that we have not anticipated or identified and our controls may not be effective. Risk management frameworks may also prove ineffective because of weaknesses in risk culture, which may result in risks and control weaknesses not being identified, escalated and acted upon. Further, while the development of appropriate remuneration structures can play an important role in supporting a sound risk culture, a deficiency in the design or operation of our remuneration structures could have a negative effect, potentially resulting in staff engaging in excessive risk taking behaviours. Risk management failings of the type outlined above could adversely affect the Group in numerous ways, with the Group potentially being exposed to higher levels of risk than expected, which may result in the Group incurring unexpected losses, breaches of compliance obligations and reputational damage. As part of the Group’s risk management framework, the Group measures and monitors risks against its risk appetite. Where the Group identifies a risk as being out-of-appetite, the Group needs to take steps to bring this risk back into appetite in a timely way. However, the Group may not always be able to achieve this within proposed timeframes. This may occur because, for example, the Group experiences delays in enhancing its information technology systems to better manage the out-of-appetite risk, or in recruiting sufficient numbers of appropriately trained staff to undertake required activities. It is also possible that, because of external factors beyond the Group’s control, certain risks may be inherently outside of appetite for periods of time. In addition, the Group is required to periodically review its risk management framework to determine whether it remains appropriate. If the Group is unable to bring risks back into appetite, or if it is determined that the Group’s risk management framework is no longer appropriate, the Group may incur unexpected losses and be required to undertake considerable remedial work, including incurring substantial costs. The failure to remedy this situation could result in increased scrutiny from regulators, who could take supervisory action such as requiring the Group to hold additional capital or directing the Group to spend money to enhance its risk management systems and controls. The Group has been adversely affected by weaknesses in risk management systems and controls in the recent past, with APRA requiring Westpac to hold additional capital following the completion of its Culture, Governance and Accountability self-assessment, as well as requiring Westpac to hold additional capital following the commencement of civil penalty proceedings by AUSTRAC. Inadequacies in addressing risks or in the Group’s risk management framework could also result in the Group failing to meet a compliance obligation and/or financial losses. If any of our governance or risk management processes and procedures prove ineffective or inadequate or are otherwise not appropriately implemented, we could suffer unexpected losses and reputational damage which could adversely affect our business, prospects, financial performance or financial condition. For a discussion of our risk management procedures, refer to the ‘Risk management’ section in our 2019 Annual Report. |
 | our business Key executives, employees and Directors play an integral role in the operation of Westpac’s business and its pursuit of1 its strategic objectives. The unexpected departure of an individual in a key role, or the Group’s failure to recruit and retain appropriately skilled and qualified persons into these roles, could each have an adverse effect on our business, prospects, reputation, financial performance or financial condition. Climate change may have adverse effects on our business We, our customers, external suppliers and communities in which we operate, may be adversely affected by the physical risks of climate change, including increases in temperatures, sea levels, and the frequency and severity of adverse climatic events including fires, storms, floods and droughts. These effects, whether acute or chronic in nature, may directly impact us and our customers through reputational damage, environmental factors, insurance risk and business disruption and may have an adverse impact on financial performance (including through an increase in defaults in credit exposures).2 Initiatives to mitigate or respond to adverse impacts of climate change (transition risks) may impact market and asset prices, economic activity, and customer behaviour, particularly in geographic locations and industry sectors adversely affected by these changes. Further, the failure or perceived failure to manage climate change appropriately may increase the risk that third parties commence litigation against the Group, with this type of climate-related litigation recently becoming more common. Failure to effectively manage and disclose these risks could adversely affect our business, prospects, reputation, financial performance or financial condition. We could suffer losses due to environmental factors We and our customers operate businesses and hold assets in a diverse range of geographic locations. Any significant environmental change or external event (including fire, storm, flood, earthquake, outbreaks or pandemics of communicable diseases such as the current and ongoing COVID-19 pandemic – see ‘Outbreaks of communicable diseases or a pandemic3 like COVID-19 have had, and could in the future have, an adverse effect on the Group’, civil unrest or terrorism) in any of these locations has the potential to disrupt business activities, impact on our operations, damage property and otherwise affect the value of assets held in the affected locations and our ability to recover amounts owing to us. In addition, such an event could have an adverse impact on economic activity, consumer and investor confidence, or the levels of volatility in financial markets, all of which could adversely affect our business, prospects, financial performance or financial condition. We could suffer losses due to insurance risk We have exposure to insurance risk in our life insurance, general insurance and lenders mortgage insurance businesses, which may adversely affect our business, operations or financial condition. Insurance risk is the risk in our licensed regulated insurance entities of lapses being greater than expected, or the costs of4 claims being greater than expected due to a failure in product design, underwriting, reinsurance arrangements or an increase in the severity and/or frequency of insured events. As an example, the current and ongoing COVID-19 pandemic and related economic impacts may lead to increased insurance claims, as well as potentially impact new business, lapses, and capital coverage for the Group’s insurance entities. In the life insurance business, risk arises primarily through mortality (death) and morbidity (illness and injury) risks, the costs of claims relating to those risks being greater than was anticipated when pricing those risks and policy lapses (including through an unexpected or sustained increase in the rate of policy lapses). In the general insurance business, insurance risk arises mainly through environmental factors (including storms, floods and bushfires) and other calamities, such as earthquakes and tsunamis, as well as general variability in home and contents insurance claim amounts. The frequency and severity of external events such as natural disasters is difficult to predict and it is possible that the amounts we reserve for potential losses from existing events, such as those arising from natural disaster5 events, may not be adequate to cover actual claims that may arise. In the lenders mortgage insurance business, insurance risk arises primarily from unexpected downturns in economic conditions leading to higher levels of mortgage defaults from unemployment or other economic factors. If our reinsurance arrangements are ineffective, this could lead to greater risk, and more losses than anticipated. There is also a risk that we will not be able to renew an expiring reinsurance arrangement on similar terms, including in relation to the cost, duration and amount of reinsurance cover provided under that arrangement. Changes in critical accounting estimates and judgements could expose the Group to losses The Group is required to make estimates, assumptions and judgements when applying accounting policies and preparing its financial statements, particularly in connection with the calculation of provisions (including those related to remediations or credit6 losses) and the determination of the fair value of financial instruments. A change in a critical accounting estimate, assumption and/or judgement resulting from new information or from changes in circumstances or experience could result in the Group incurring losses greater than those anticipated or provided for. This risk is currently heightened by the COVID-19 pandemic due to the unpredictable nature of the pandemic and uncertainty about the extent of its impact. In particular, it is possible that the Group will incur credit losses greater than its existing provisions for expected credit losses and that these provisions may need to be revised upward in the future. For further information, refer to Note 10 to the financial statements in this 2020 Interim Financial Report. If the Group’s actual and expected credit losses exceed those currently provided for, or if any of its other accounting judgements change in the future, there could be an adverse effect on the Group’s financial performance, financial condition and reputation. The Group’s financial performance and financial condition may also be impacted by changes to accounting standards or to generally accepted accounting principles.7 |
 | Directors’ report We could suffer losses due to impairment of capitalised software, goodwill and other intangible assets that may adversely affect our business, operations or financial condition In certain circumstances Westpac may be exposed to a reduction in the value of intangible assets. As at our balance date Westpac carried goodwill principally related to its investments in Australia, other intangible assets principally relating to assets recognised on acquisition of subsidiaries and capitalised software balances. Westpac is required to assess the recoverability of the goodwill and other intangible asset balances on at least an annual basis or wherever an indicator of impairment exists. For this purpose, Westpac uses a discounted cash flow calculation. Changes in the methodology or assumptions upon which the calculation is based, together with changes in expected future cash flows, could materially impact this assessment, resulting in the potential write-off of part or all of the intangible assets. In the event that an asset is no longer in use, or its value has been reduced or that its estimated useful life has declined, an impairment will be recorded, adversely impacting the Group’s financial condition. The estimates and assumptions used in assessing the useful life of an asset can be affected by a range of factors including changes in strategy and the rate of external changes in technology and regulatory requirements. We could suffer losses if we fail to syndicate or sell down underwritten securities As a financial intermediary, we underwrite listed and unlisted debt and equity securities. Underwriting activities include the development of solutions for corporate and institutional customers who need capital and investor customers who have an appetite for certain investment products. We may guarantee the pricing and placement of these facilities. We could suffer losses if we fail to syndicate or sell down our risk to other market participants. This risk is more pronounced in times of heightened market volatility, such as is currently being experienced globally during the COVID-19 pandemic. Certain strategic decisions may have adverse effects on our business Westpac, at times, evaluates and may implement strategic decisions and objectives including diversification, innovation, divestment or business expansion initiatives. The expansion or integration of a new business, or entry into a new business, can be complex and costly and may require Westpac to comply with additional local or foreign regulatory requirements which may carry additional risks. Westpac also acquires and invests in businesses owned and operated by external parties. These transactions involve a number of risks for the Group. For example, Westpac may incur financial losses if a business it invests in does not perform as anticipated or subsequently proves to be overvalued at the time that the transaction was entered into. In addition, we may be unable to successfully divest businesses or assets. These activities may, for a variety of reasons, not deliver the anticipated positive business results and could have a negative impact on our business, prospects, reputation, engagement with regulators, financial performance or financial condition. Electing not to pursue a course of action can have an adverse effect on the Group. If Westpac fails to appropriately respond to changes in the business environment it operates in (including changes related to economic, geopolitical, regulatory, technological, environmental, social and competitive factors) this could have a range of adverse effects on the Group’s business, such as being unable to increase or maintain market share as well as creating pressure on margins and fees, any of which could have a negative impact on the Group’s business, prospects, reputation, financial performance or financial condition. Rounding of amounts ASIC Corporations (Rounding in Financial/Directors’ Reports) Instrument 2016/191 applies to Westpac and in accordance with that Legislative Instrument all amounts have been rounded to the nearest million dollars unless otherwise stated. |
 | 1 2 3 4 5 6 7 |
 | Directors’ report Responsibility statement The Directors of Westpac Banking Corporation confirm that to the best of their knowledge: (i)the interim financial statements have been prepared in accordance with AASB 134 Interim Financial Reporting and are in compliance with IAS 34 Interim Financial Reporting issued by the International Accounting Standards Board; and (ii)the Directors’ Report includes a fair review of the information required by DTR 4.2.7 R of the Disclosure Guidance and Transparency Rules of the United Kingdom Financial Conduct Authority. Signed in accordance with a resolution of the Board of Directors. John McFarlanePeter King ChairmanManaging Director and Chief Executive Officer Sydney, Australia 4 May 2020 |
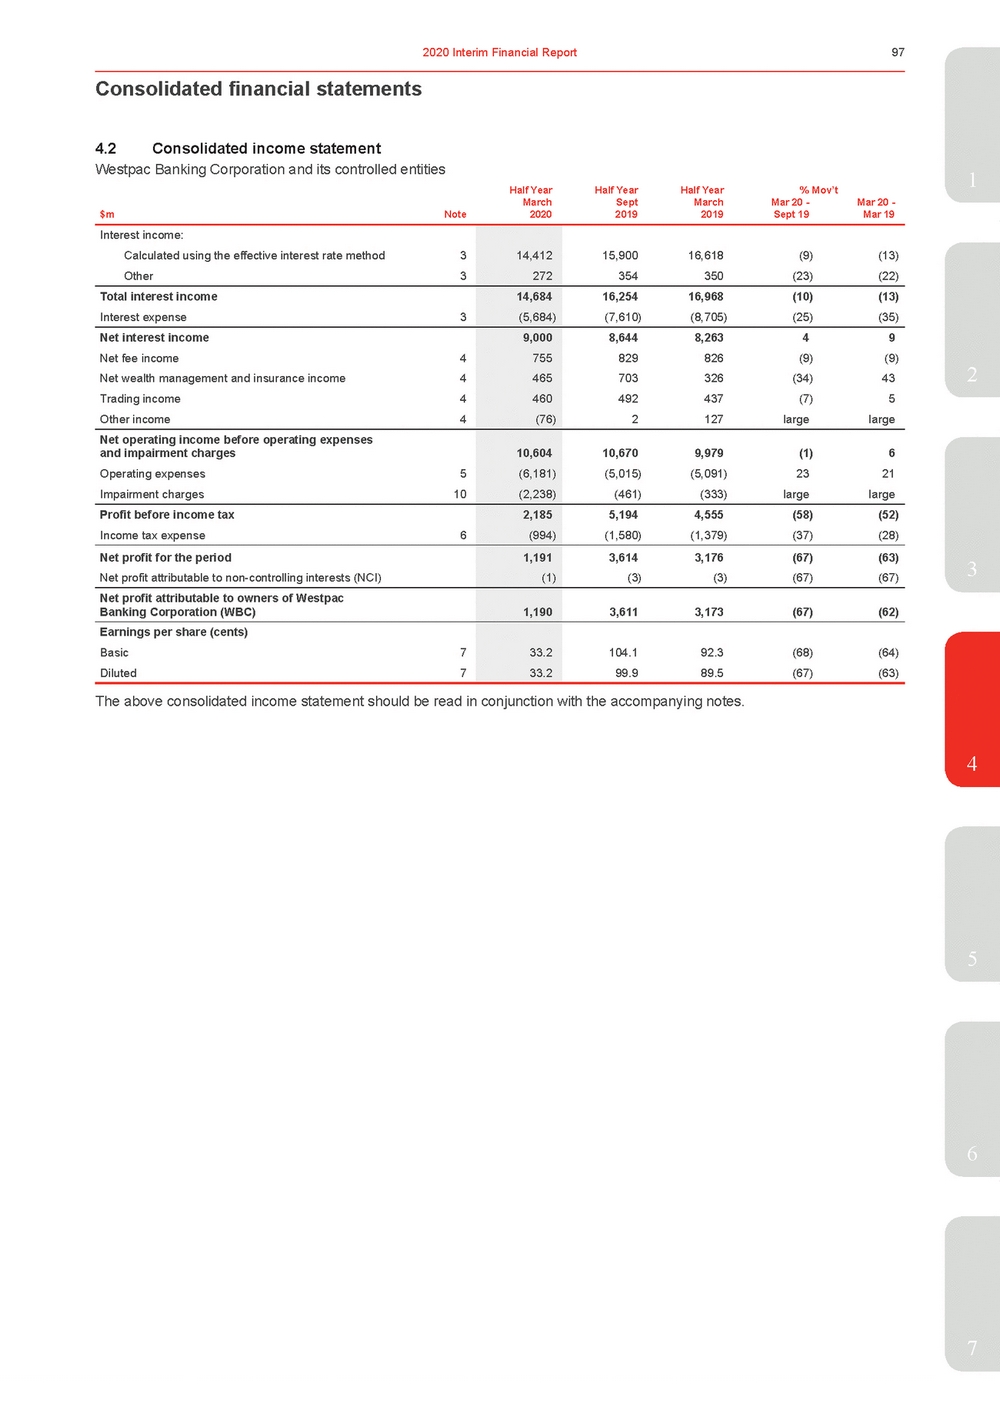 | Half Year Half Year Half Year % Mov’t March Sept March Mar 20 - Mar 20 - Note 2020 2019 2019 Sept 19 Mar 19 Interest income: Calculated using the effective interest rate method3 Other3 14,412 272 15,90016,618(9)(13) 354350(23)(22) Total interest income Interest expense3 14,684 (5,684) 16,25416,968(10)(13) (7,610)(8,705)(25)(35) Net interest income Net fee income4 Net wealth management and insurance income4 Trading income4 Other income4 9,000 755 465 460 (76) 8,6448,26349 829826(9)(9) 703326(34)43 492437(7)5 2127largelarge Net operating income before operating expenses and impairment charges Operating expenses5 Impairment charges10 10,604 (6,181) (2,238) 10,670 9,979 (1)6 (5,015)(5,091)2321 (461)(333)largelarge Profit before income tax Income tax expense6 2,185 (994) 5,1944,555(58)(52) (1,580)(1,379)(37)(28) Net profit for the period Net profit attributable to non-controlling interests (NCI) 1,191 (1) 3,6143,176(67)(63) (3)(3)(67)(67) Net profit attributable to owners of Westpac Banking Corporation (WBC) 1,190 3,6113,173(67)(62) Earnings per share (cents) Basic7 Diluted7 33.2 33.2 104.192.3(68)(64) 99.989.5(67)(63) 3 The above consolidated income statement should be read in conjunction with the accompanying notes. 4 5 6 7 |
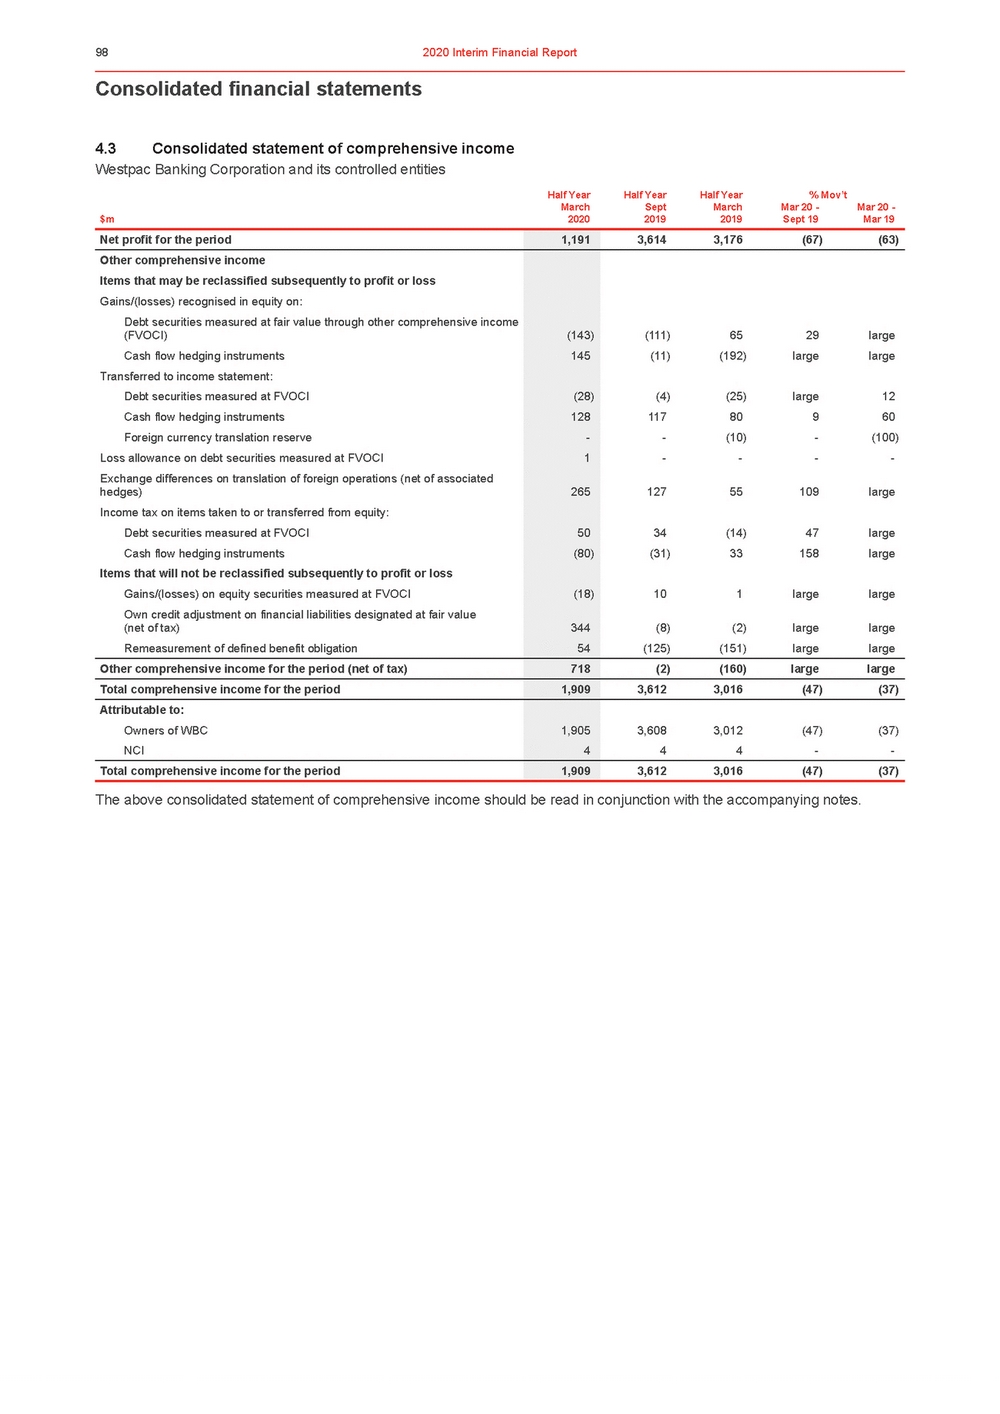 | Consolidated financial statements 4.3Consolidated statement of comprehensive income Westpac Banking Corporation and its controlled entities Half YearHalf YearHalf Year% Mov’t March $m2020 Sept 2019 March 2019 Mar 20 - Sept 19 Mar 20 - Mar 19 The above consolidated statement of comprehensive income should be read in conjunction with the accompanying notes. |
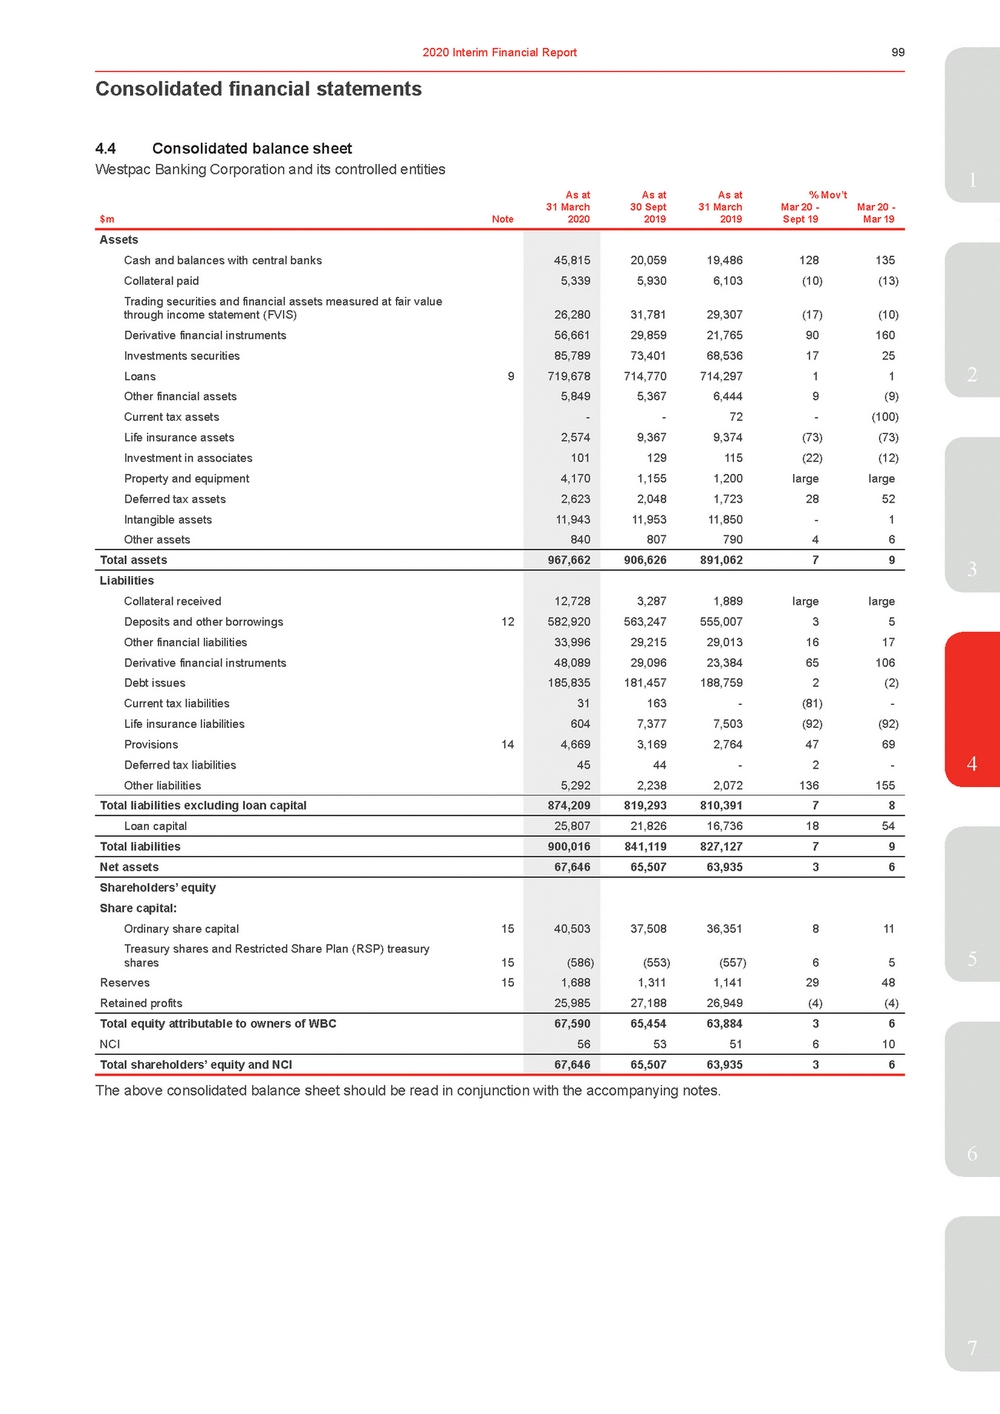 | As at As at As at % Mov’t 31 March 30 Sept 31 March Mar 20 - Mar 20 - Note 2020 2019 2019 Sept 19 Mar 19 Assets Cash and balances with central banks Collateral paid Trading securities and financial assets measured at fair value through income statement (FVIS) Derivative financial instruments Investments securities Loans9 Other financial assets Current tax assets Life insurance assets Investment in associates Property and equipment Deferred tax assets Intangible assets Other assets 45,815 5,339 26,280 56,661 85,789 719,678 5,849 - 2,574 101 4,170 2,623 11,943 840 20,05919,486128135 5,9306,103(10)(13) 31,78129,307(17)(10) 29,85921,76590160 73,40168,5361725 714,770714,29711 5,3676,4449(9) -72-(100) 9,3679,374(73)(73) 129115(22)(12) 1,1551,200largelarge 2,0481,7232852 11,95311,850-1 80779046 Total assets 967,662 906,626891,06279 Liabilities Collateral received Deposits and other borrowings12 Other financial liabilities Derivative financial instruments Debt issues Current tax liabilities Life insurance liabilities Provisions14 Deferred tax liabilities Other liabilities 12,728 582,920 33,996 48,089 185,835 31 604 4,669 45 5,292 3,2871,889largelarge 563,247555,00735 29,21529,0131617 29,09623,38465106 181,457188,7592(2) 163-(81)-7,3777,503(92)(92) 3,1692,7644769 44-2-2,2382,072136155 Total liabilities excluding loan capital 874,209 819,293810,39178 Loan capital 25,807 21,82616,7361854 Total liabilities 900,016 841,119827,12779 Net assets 67,646 65,50763,93536 Shareholders’ equity Share capital: Ordinary share capital15 Treasury shares and Restricted Share Plan (RSP) treasury shares15 Reserves15 Retained profits 40,503 (586) 1,688 25,985 37,50836,351811 (553)(557)65 1,3111,1412948 27,18826,949(4)(4) Total equity attributable to owners of WBC NCI 67,590 56 65,45463,88436 5351610 Total shareholders’ equity and NCI 67,646 65,50763,93536 3 4 5 The above consolidated balance sheet should be read in conjunction with the accompanying notes. 6 7 |
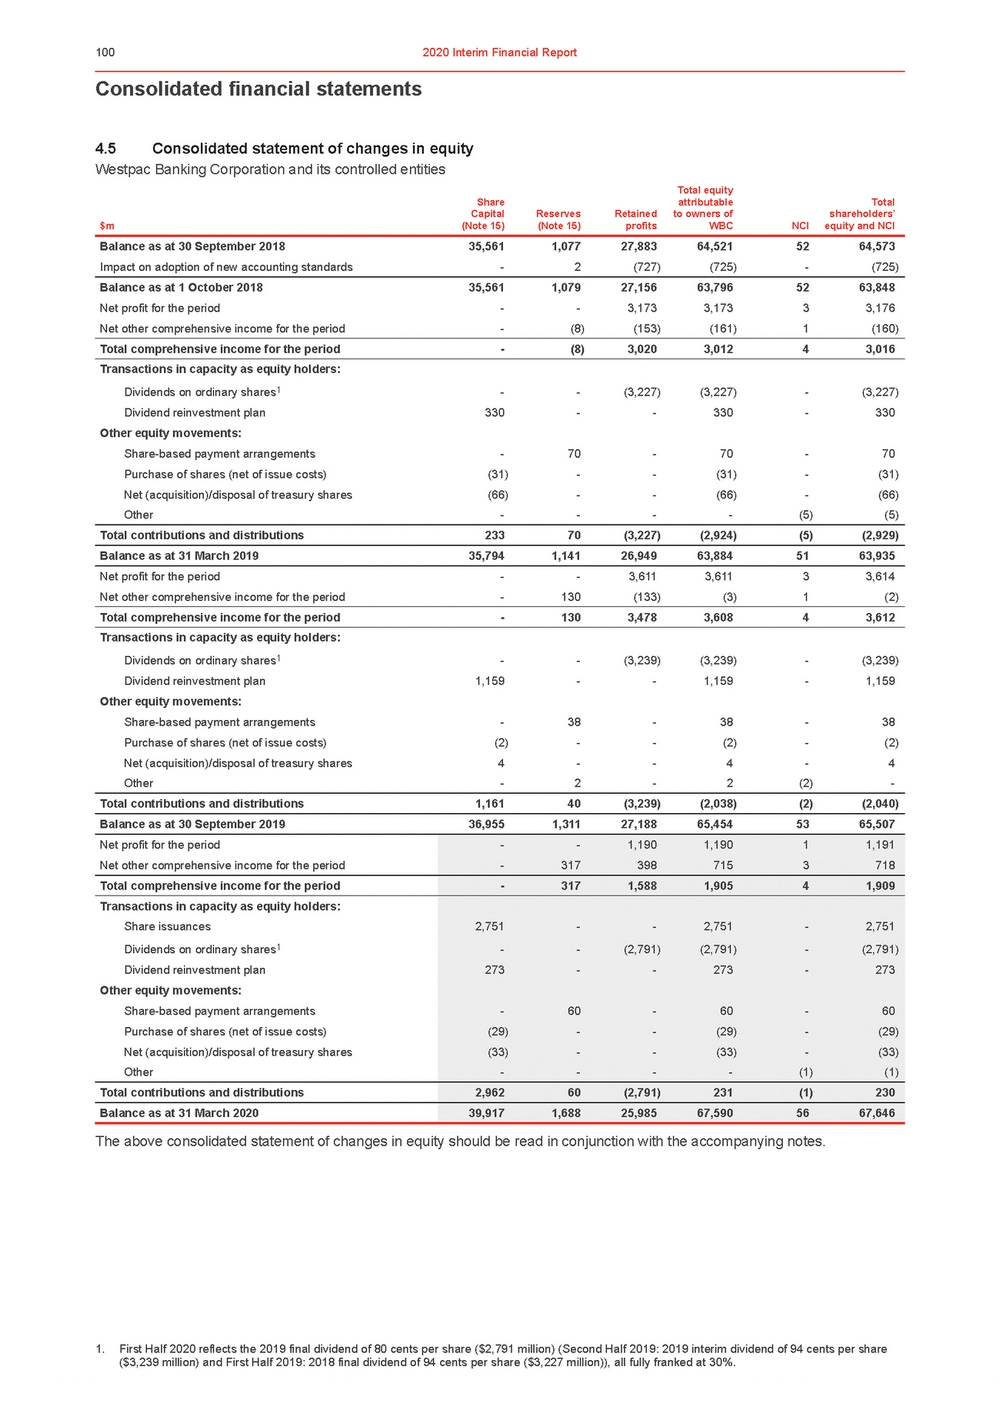 | Consolidated financial statements 4.5Consolidated statement of changes in equity Net profit for the period Net other comprehensive income for the period --1,1901,19011,191 -3173987153718 Total comprehensive income for the period -3171,5881,90541,909 Transactions in capacity as equity holders: Share issuances Dividends on ordinary shares1 Dividend reinvestment plan Other equity movements: Share-based payment arrangements Purchase of shares (net of issue costs) Net (acquisition)/disposal of treasury shares Other 2,751--2,751-2,751 --(2,791)(2,791)-(2,791) 273--273-273 -60-60-60 (29)--(29)-(29) (33)--(33)-(33) ----(1)(1) Total contributions and distributions 2,96260(2,791)231(1)230 Balance as at 31 March 2020 39,9171,68825,98567,5905667,646 1. First Half 2020 reflects the 2019 final dividend of 80 cents per share ($2,791 million) (Second Half 2019: 2019 interim dividend of 94 cents per share ($3,239 million) and First Half 2019: 2018 final dividend of 94 cents per share ($3,227 million)), all fully franked at 30%. |
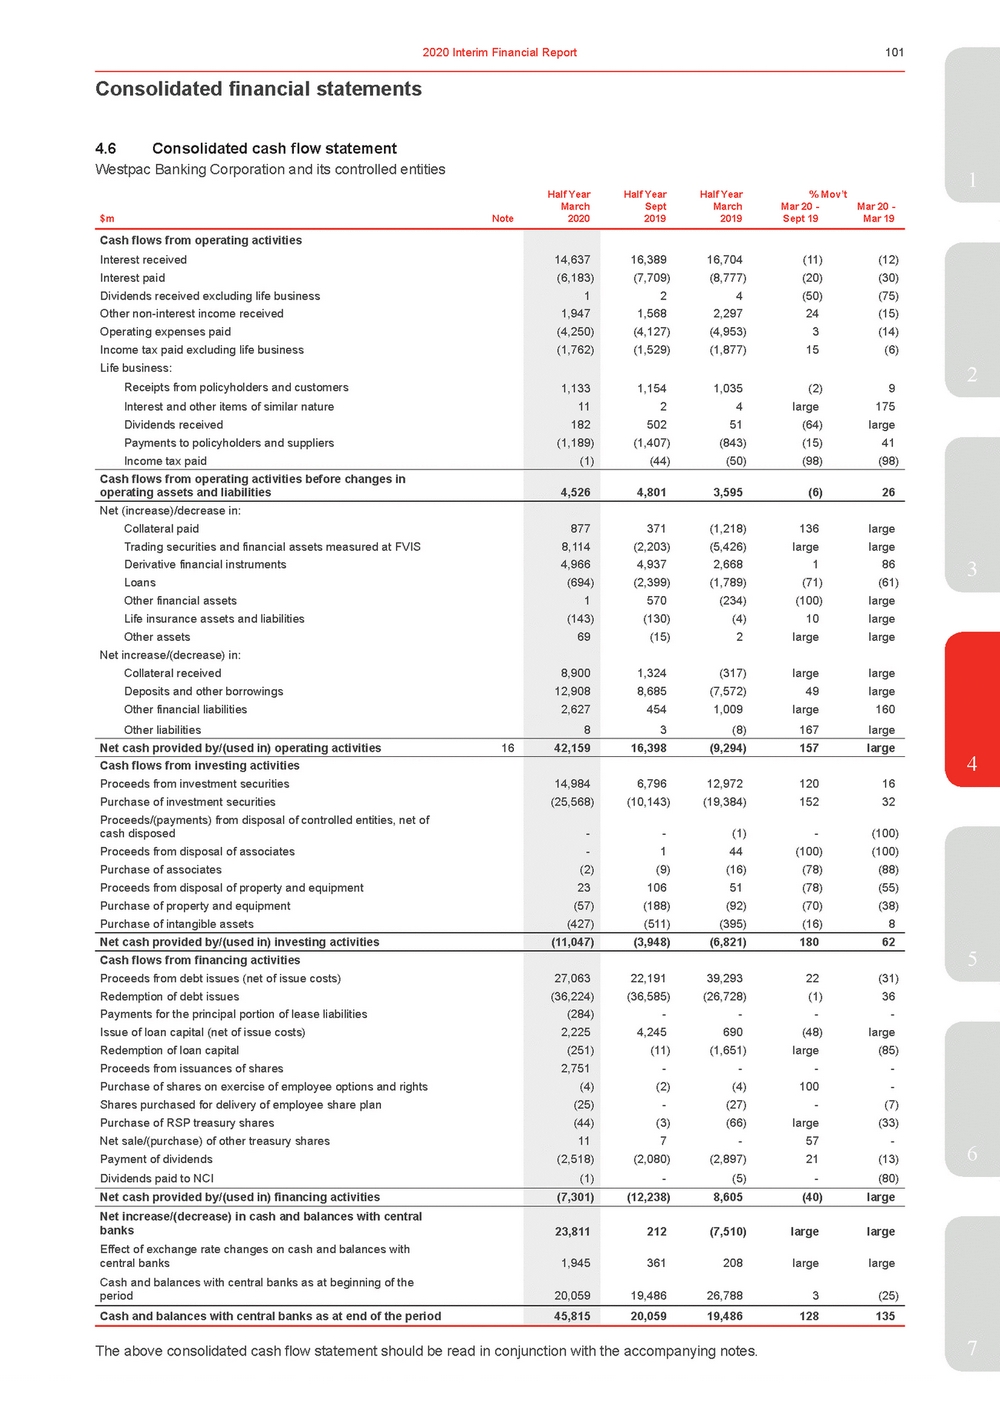 | Cash flows from operating activities Interest received Interest paid Dividends received excluding life business Other non-interest income received Operating expenses paid Income tax paid excluding life business Life business: Receipts from policyholders and customers Interest and other items of similar nature Dividends received Payments to policyholders and suppliers Income tax paid 14,637 (6,183) 1 1,947 (4,250) (1,762) 1,133 11 182 (1,189) (1) 16,38916,704 (11) (12) (7,709) (8,777) (20) (30) 24(50)(75) 1,568 2,297 24 (15) (4,127) (4,953) 3 (14) (1,529) (1,877) 15 (6) 1,154 1,035 (2) 9 24large175 50251(64)large (1,407)(843)(15) 41 (44) (50)(98)(98) Cash flows from operating activities before changes in operating assets and liabilities 4,526 4,8013,595(6)26 Net (increase)/decrease in: Collateral paid Trading securities and financial assets measured at FVIS Derivative financial instruments Loans Other financial assets Life insurance assets and liabilities Other assets Net increase/(decrease) in: Collateral received Deposits and other borrowings Other financial liabilities Other liabilities 877 8,114 4,966 (694) 1 (143) 69 8,900 12,908 2,627 8 371(1,218)136large (2,203)(5,426)largelarge 4,9372,668186 (2,399)(1,789)(71)(61) 570(234)(100) large (130) (4)10 large (15)2largelarge 1,324(317)largelarge 8,685(7,572)49large 4541,009large160 3(8)167large Net cash provided by/(used in) operating activities16 42,159 16,398(9,294)157large Cash flows from investing activities Proceeds from investment securities Purchase of investment securities Proceeds/(payments) from disposal of controlled entities, net of cash disposed Proceeds from disposal of associates Purchase of associates Proceeds from disposal of property and equipment Purchase of property and equipment Purchase of intangible assets 14,984 (25,568) - - (2) 23 (57) (427) 6,796 12,97212016 (10,143)(19,384)15232 -(1)-(100) 1 44(100)(100) (9)(16)(78) (88) 106 51 (78) (55) (188) (92) (70) (38) (511) (395) (16) 8 Net cash provided by/(used in) investing activities (11,047) (3,948)(6,821)18062 Cash flows from financing activities Proceeds from debt issues (net of issue costs) Redemption of debt issues Payments for the principal portion of lease liabilities Issue of loan capital (net of issue costs) Redemption of loan capital Proceeds from issuances of shares Purchase of shares on exercise of employee options and rights Shares purchased for delivery of employee share plan Purchase of RSP treasury shares Net sale/(purchase) of other treasury shares Payment of dividends Dividends paid to NCI 27,063 (36,224) (284) 2,225 (251) 2,751 (4) (25) (44) 11 (2,518) (1) 22,191 39,29322(31) (36,585)(26,728) (1) 36 ----4,245690(48)large (11)(1,651)large(85) ----(2)(4)100--(27)-(7) (3)(66)large(33) 7-57-(2,080)(2,897)21(13) -(5)-(80) Net cash provided by/(used in) financing activities (7,301) (12,238)8,605(40)large Net increase/(decrease) in cash and balances with central banks Effect of exchange rate changes on cash and balances with central banks Cash and balances with central banks as at beginning of the period 23,811 1,945 20,059 212(7,510)largelarge 361208largelarge 19,48626,7883(25) Cash and balances with central banks as at end of the period 45,815 20,05919,486128135 Half Year Half Year Half Year % Mov’t March Sept March Mar 20 - Mar 20 - Note 2020 2019 2019 Sept 19 Mar 19 2 3 4 5 6 The above consolidated cash flow statement should be read in conjunction with the accompanying notes.7 |
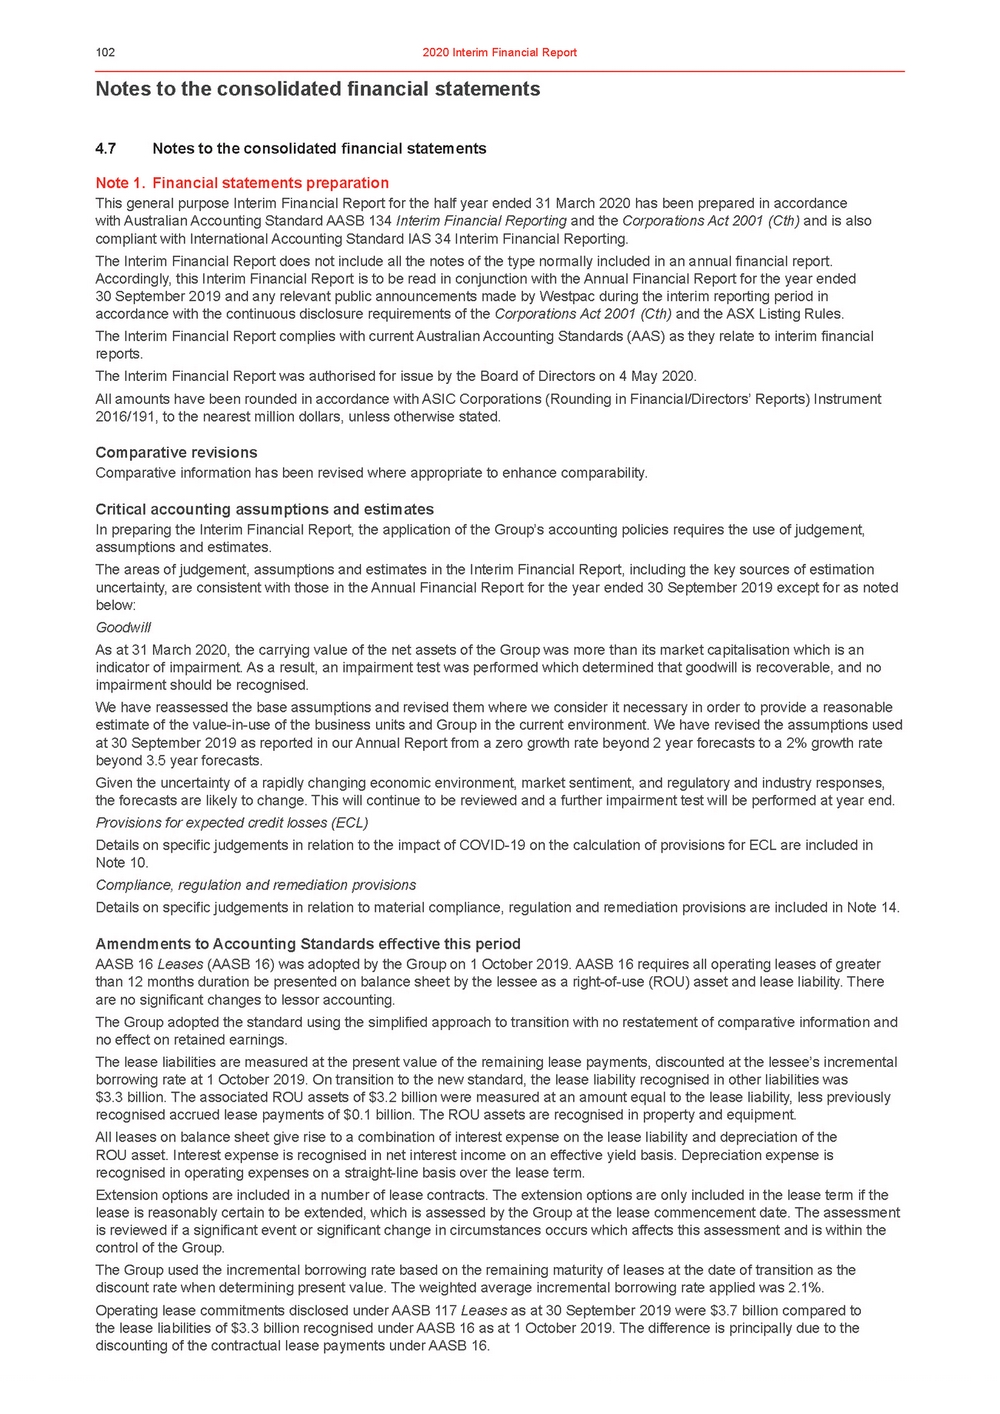 | Notes to the consolidated financial statements 4.7Notes to the consolidated financial statements Note 1. Financial statements preparation This general purpose Interim Financial Report for the half year ended 31 March 2020 has been prepared in accordance with Australian Accounting Standard AASB 134 Interim Financial Reporting and the Corporations Act 2001 (Cth) and is also compliant with International Accounting Standard IAS 34 Interim Financial Reporting. The Interim Financial Report does not include all the notes of the type normally included in an annual financial report. Accordingly, this Interim Financial Report is to be read in conjunction with the Annual Financial Report for the year ended 30 September 2019 and any relevant public announcements made by Westpac during the interim reporting period in accordance with the continuous disclosure requirements of the Corporations Act 2001 (Cth) and the ASX Listing Rules. The Interim Financial Report complies with current Australian Accounting Standards (AAS) as they relate to interim financial reports. The Interim Financial Report was authorised for issue by the Board of Directors on 4 May 2020. All amounts have been rounded in accordance with ASIC Corporations (Rounding in Financial/Directors’ Reports) Instrument 2016/191, to the nearest million dollars, unless otherwise stated. Comparative revisions Comparative information has been revised where appropriate to enhance comparability. Critical accounting assumptions and estimates In preparing the Interim Financial Report, the application of the Group’s accounting policies requires the use of judgement, assumptions and estimates. The areas of judgement, assumptions and estimates in the Interim Financial Report, including the key sources of estimation uncertainty, are consistent with those in the Annual Financial Report for the year ended 30 September 2019 except for as noted below: Goodwill As at 31 March 2020, the carrying value of the net assets of the Group was more than its market capitalisation which is an indicator of impairment. As a result, an impairment test was performed which determined that goodwill is recoverable, and no impairment should be recognised. We have reassessed the base assumptions and revised them where we consider it necessary in order to provide a reasonable estimate of the value-in-use of the business units and Group in the current environment. We have revised the assumptions used at 30 September 2019 as reported in our Annual Report from a zero growth rate beyond 2 year forecasts to a 2% growth rate beyond 3.5 year forecasts. Given the uncertainty of a rapidly changing economic environment, market sentiment, and regulatory and industry responses, the forecasts are likely to change. This will continue to be reviewed and a further impairment test will be performed at year end. Provisions for expected credit losses (ECL) Details on specific judgements in relation to the impact of COVID-19 on the calculation of provisions for ECL are included in Note 10. Compliance, regulation and remediation provisions Details on specific judgements in relation to material compliance, regulation and remediation provisions are included in Note 14. Amendments to Accounting Standards effective this period AASB 16 Leases (AASB 16) was adopted by the Group on 1 October 2019. AASB 16 requires all operating leases of greater than 12 months duration be presented on balance sheet by the lessee as a right-of-use (ROU) asset and lease liability. There are no significant changes to lessor accounting. The Group adopted the standard using the simplified approach to transition with no restatement of comparative information and no effect on retained earnings. The lease liabilities are measured at the present value of the remaining lease payments, discounted at the lessee’s incremental borrowing rate at 1 October 2019. On transition to the new standard, the lease liability recognised in other liabilities was $3.3 billion. The associated ROU assets of $3.2 billion were measured at an amount equal to the lease liability, less previously recognised accrued lease payments of $0.1 billion. The ROU assets are recognised in property and equipment. All leases on balance sheet give rise to a combination of interest expense on the lease liability and depreciation of the ROU asset. Interest expense is recognised in net interest income on an effective yield basis. Depreciation expense is recognised in operating expenses on a straight-line basis over the lease term. Extension options are included in a number of lease contracts. The extension options are only included in the lease term if the lease is reasonably certain to be extended, which is assessed by the Group at the lease commencement date. The assessment is reviewed if a significant event or significant change in circumstances occurs which affects this assessment and is within the control of the Group. The Group used the incremental borrowing rate based on the remaining maturity of leases at the date of transition as the discount rate when determining present value. The weighted average incremental borrowing rate applied was 2.1%. Operating lease commitments disclosed under AASB 117 Leases as at 30 September 2019 were $3.7 billion compared to the lease liabilities of $3.3 billion recognised under AASB 16 as at 1 October 2019. The difference is principally due to the discounting of the contractual lease payments under AASB 16. |
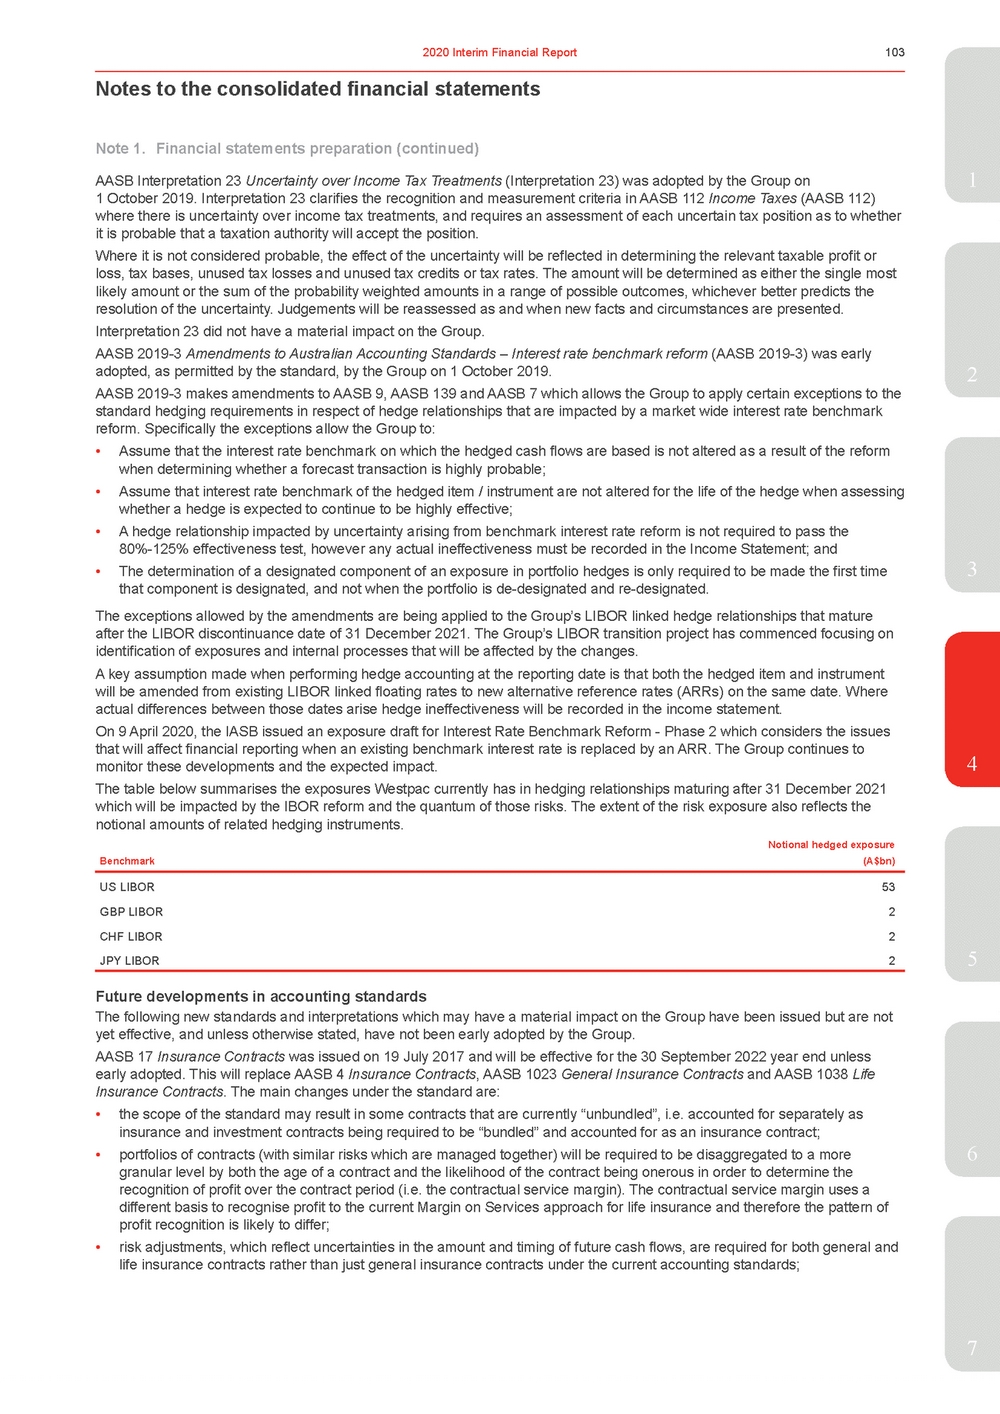 | AASB Interpretation 23 Uncertainty over Income Tax Treatments (Interpretation 23) was adopted by the Group on1 1 October 2019. Interpretation 23 clarifies the recognition and measurement criteria in AASB 112 Income Taxes (AASB 112) where there is uncertainty over income tax treatments, and requires an assessment of each uncertain tax position as to whether it is probable that a taxation authority will accept the position. Where it is not considered probable, the effect of the uncertainty will be reflected in determining the relevant taxable profit or loss, tax bases, unused tax losses and unused tax credits or tax rates. The amount will be determined as either the single most likely amount or the sum of the probability weighted amounts in a range of possible outcomes, whichever better predicts the resolution of the uncertainty. Judgements will be reassessed as and when new facts and circumstances are presented. Interpretation 23 did not have a material impact on the Group. AASB 2019-3 Amendments to Australian Accounting Standards – Interest rate benchmark reform (AASB 2019-3) was early adopted, as permitted by the standard, by the Group on 1 October 2019.2 AASB 2019-3 makes amendments to AASB 9, AASB 139 and AASB 7 which allows the Group to apply certain exceptions to the standard hedging requirements in respect of hedge relationships that are impacted by a market wide interest rate benchmark reform. Specifically the exceptions allow the Group to: •Assume that the interest rate benchmark on which the hedged cash flows are based is not altered as a result of the reform when determining whether a forecast transaction is highly probable; •Assume that interest rate benchmark of the hedged item / instrument are not altered for the life of the hedge when assessing whether a hedge is expected to continue to be highly effective; •A hedge relationship impacted by uncertainty arising from benchmark interest rate reform is not required to pass the 80%-125% effectiveness test, however any actual ineffectiveness must be recorded in the Income Statement; and •The determination of a designated component of an exposure in portfolio hedges is only required to be made the first time3 that component is designated, and not when the portfolio is de-designated and re-designated. The exceptions allowed by the amendments are being applied to the Group’s LIBOR linked hedge relationships that mature after the LIBOR discontinuance date of 31 December 2021. The Group’s LIBOR transition project has commenced focusing on identification of exposures and internal processes that will be affected by the changes. A key assumption made when performing hedge accounting at the reporting date is that both the hedged item and instrument will be amended from existing LIBOR linked floating rates to new alternative reference rates (ARRs) on the same date. Where actual differences between those dates arise hedge ineffectiveness will be recorded in the income statement. On 9 April 2020, the IASB issued an exposure draft for Interest Rate Benchmark Reform - Phase 2 which considers the issues that will affect financial reporting when an existing benchmark interest rate is replaced by an ARR. The Group continues to monitor these developments and the expected impact.4 The table below summarises the exposures Westpac currently has in hedging relationships maturing after 31 December 2021 which will be impacted by the IBOR reform and the quantum of those risks. The extent of the risk exposure also reflects the notional amounts of related hedging instruments. Benchmark (A$bn) US LIBOR 53 GBP LIBOR 2 CHF LIBOR 2 JPY LIBOR 2 5 Future developments in accounting standards The following new standards and interpretations which may have a material impact on the Group have been issued but are not yet effective, and unless otherwise stated, have not been early adopted by the Group. AASB 17 Insurance Contracts was issued on 19 July 2017 and will be effective for the 30 September 2022 year end unless early adopted. This will replace AASB 4 Insurance Contracts, AASB 1023 General Insurance Contracts and AASB 1038 Life Insurance Contracts. The main changes under the standard are: •the scope of the standard may result in some contracts that are currently “unbundled”, i.e. accounted for separately as insurance and investment contracts being required to be “bundled” and accounted for as an insurance contract; • portfolios of contracts (with similar risks which are managed together) will be required to be disaggregated to a more 6 granular level by both the age of a contract and the likelihood of the contract being onerous in order to determine the recognition of profit over the contract period (i.e. the contractual service margin). The contractual service margin uses a different basis to recognise profit to the current Margin on Services approach for life insurance and therefore the pattern of profit recognition is likely to differ; •risk adjustments, which reflect uncertainties in the amount and timing of future cash flows, are required for both general and life insurance contracts rather than just general insurance contracts under the current accounting standards; 7 |
 | Notes to the consolidated financial statements Note 1. Financial statements preparation (continued) •the contract boundary, which is the period over which profit is recognised, differs and is determined based on the ability to compel the policyholder to pay premiums or the substantive obligation to provide coverage/services. For some general insurance contracts (e.g. some lender mortgage insurance and reinsurance contracts) this may result in the contract boundary being longer. For life insurance, in particular term renewable contracts, the contract boundary is expected to be shorter. Both will be impacted by different patterns of profit recognition compared to the current standards; •a narrower definition of what acquisition costs may be deferred; •an election to recognise changes in assumptions regarding discount rate in other comprehensive income rather than in profit and loss; •an election to recognise changes in the fair value of assets supporting policy liabilities in other comprehensive income rather than through profit and loss; •reinsurance contracts and the associated liability are to be determined separately to the gross contract liability and may have different contract boundaries; and •additional disclosure requirements. The standard is expected to result in a reduction in the level of deferred acquisition costs, however the quantum of this and the profit and loss impacts to the Group are not yet practicable to determine. On 26 June 2019, the IASB issued an exposure draft proposing a number of amendments to the insurance contracts standard. These amendments were approved by the IASB, with some minor modifications, on 17 March 2020. These amendments include: •deferral of acquisition costs for anticipated renewals outside of the initial contract boundary; •further clarity on the contractual service margin; •ability to recognise a gain in the P&L for reinsurance contracts, to offset losses from onerous contracts on initial recognition; and •additional transitional provisions. In addition, the effective date of the standard will be deferred by two years to be applicable to the Group for the 30 September 2024 financial year. A revised Conceptual Framework (Framework) was issued in May 2019. This will be effective for the Group for the 30 September 2021 financial year. The revised Framework includes new definitions and recognition criteria for assets, liabilities, income and expenses and other relevant financial reporting concepts. The changes are not expected to have a material impact on the Group. Other amendments to existing standards that are not yet effective are not expected to have a material impact to the Group. Note 2. Segment reporting Operating segments are presented on a basis consistent with information provided internally to Westpac’s key decision makers and reflects the management of the business, rather than the legal structure of the Group. Internally, Westpac uses ‘cash earnings’ in assessing the financial performance of its divisions. Management believes this allows the Group to: •more effectively assess current year performance against prior years; •compare performance across business divisions; and •compare performance across peer companies. Cash earnings is viewed as a measure of the level of profit that is generated by ongoing operations and is therefore considered in assessing distributions, including dividends. Cash earnings is neither a measure of cash flow nor net profit determined on a cash accounting basis, as it includes both cash and non-cash adjustments to statutory net profit. To determine cash earnings, three categories of adjustments are made to statutory results: •material items that key decision makers at Westpac believe do not reflect ongoing operations; •some items that are not considered when dividends are recommended, such as the amortisation of intangibles, impact of Treasury shares and economic hedging impacts; and •accounting reclassifications between individual line items that do not impact statutory results. Reportable operating segments The operating segments are defined by the customers they service and the services they provide: •Consumer: – is responsible for sales and service of banking and financial products and services to consumer customers in Australia; – is also responsible for the Group’s Australian insurance business, which covers the manufacture and distribution of life, general and lenders mortgage insurance; and – operates under the Westpac, St.George, BankSA, Bank of Melbourne, RAMS and BT brands. |
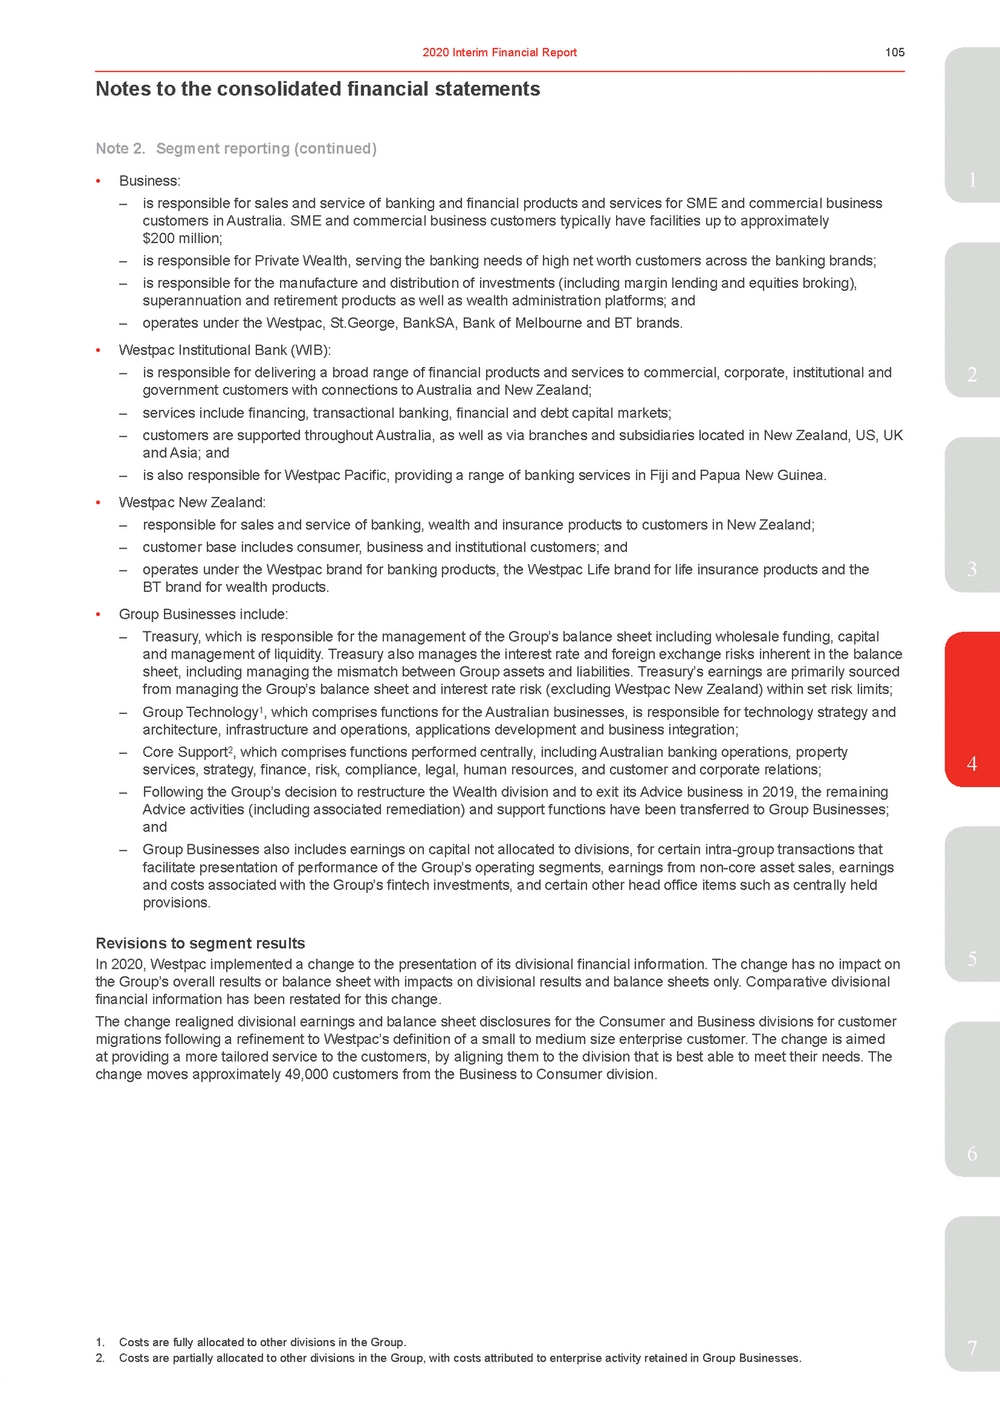 | •Business:1 – is responsible for sales and service of banking and financial products and services for SME and commercial business customers in Australia. SME and commercial business customers typically have facilities up to approximately $200 million; – is responsible for Private Wealth, serving the banking needs of high net worth customers across the banking brands; – is responsible for the manufacture and distribution of investments (including margin lending and equities broking), superannuation and retirement products as well as wealth administration platforms; and – operates under the Westpac, St.George, BankSA, Bank of Melbourne and BT brands. •Westpac Institutional Bank (WIB): – is responsible for delivering a broad range of financial products and services to commercial, corporate, institutional and2 government customers with connections to Australia and New Zealand; – services include financing, transactional banking, financial and debt capital markets; – customers are supported throughout Australia, as well as via branches and subsidiaries located in New Zealand, US, UK and Asia; and – is also responsible for Westpac Pacific, providing a range of banking services in Fiji and Papua New Guinea. •Westpac New Zealand: – responsible for sales and service of banking, wealth and insurance products to customers in New Zealand; – customer base includes consumer, business and institutional customers; and – operates under the Westpac brand for banking products, the Westpac Life brand for life insurance products and the3 BT brand for wealth products. •Group Businesses include: – Treasury, which is responsible for the management of the Group’s balance sheet including wholesale funding, capital and management of liquidity. Treasury also manages the interest rate and foreign exchange risks inherent in the balance sheet, including managing the mismatch between Group assets and liabilities. Treasury’s earnings are primarily sourced from managing the Group’s balance sheet and interest rate risk (excluding Westpac New Zealand) within set risk limits; – Group Technology1, which comprises functions for the Australian businesses, is responsible for technology strategy and architecture, infrastructure and operations, applications development and business integration; – Core Support2, which comprises functions performed centrally, including Australian banking operations, property services, strategy, finance, risk, compliance, legal, human resources, and customer and corporate relations; 4 – Following the Group’s decision to restructure the Wealth division and to exit its Advice business in 2019, the remaining Advice activities (including associated remediation) and support functions have been transferred to Group Businesses; and – Group Businesses also includes earnings on capital not allocated to divisions, for certain intra-group transactions that facilitate presentation of performance of the Group’s operating segments, earnings from non-core asset sales, earnings and costs associated with the Group’s fintech investments, and certain other head office items such as centrally held provisions. Revisions to segment results In 2020, Westpac implemented a change to the presentation of its divisional financial information. The change has no impact on5 the Group’s overall results or balance sheet with impacts on divisional results and balance sheets only. Comparative divisional financial information has been restated for this change. The change realigned divisional earnings and balance sheet disclosures for the Consumer and Business divisions for customer migrations following a refinement to Westpac’s definition of a small to medium size enterprise customer. The change is aimed at providing a more tailored service to the customers, by aligning them to the division that is best able to meet their needs. The change moves approximately 49,000 customers from the Business to Consumer division. 6 7 2. Costs are partially allocated to other divisions in the Group, with costs attributed to enterprise activity retained in Group Businesses. |
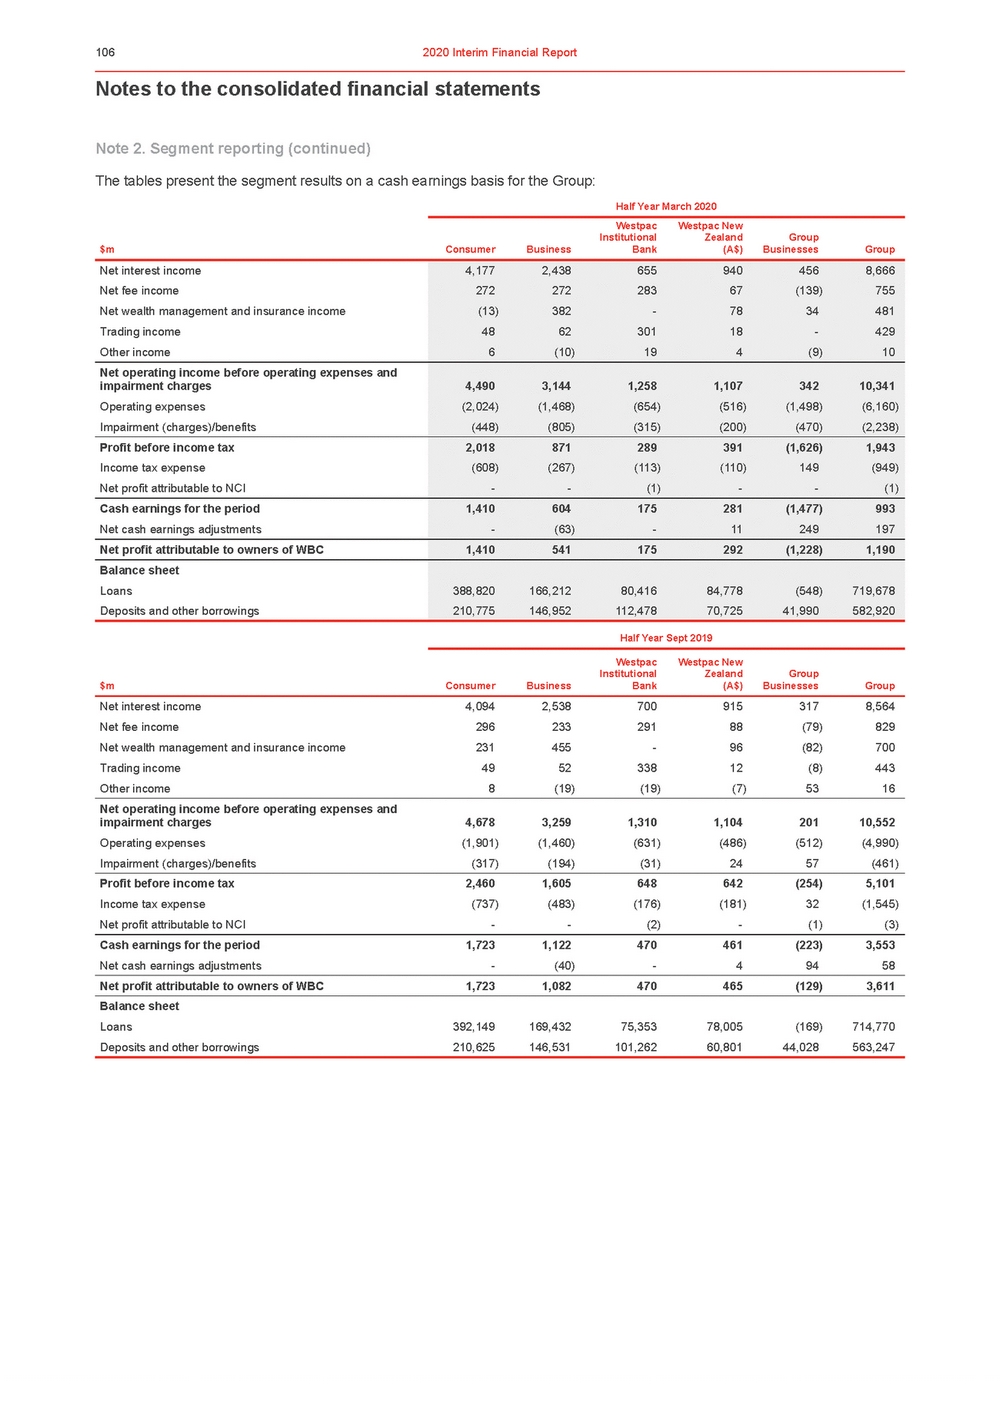 | Notes to the consolidated financial statements Note 2. Segment reporting (continued) The tables present the segment results on a cash earnings basis for the Group: Half Year March 2020 $mConsumerBusiness Westpac Institutional Bank Westpac New Zealand (A$) Group BusinessesGroup Half Year Sept 2019 |
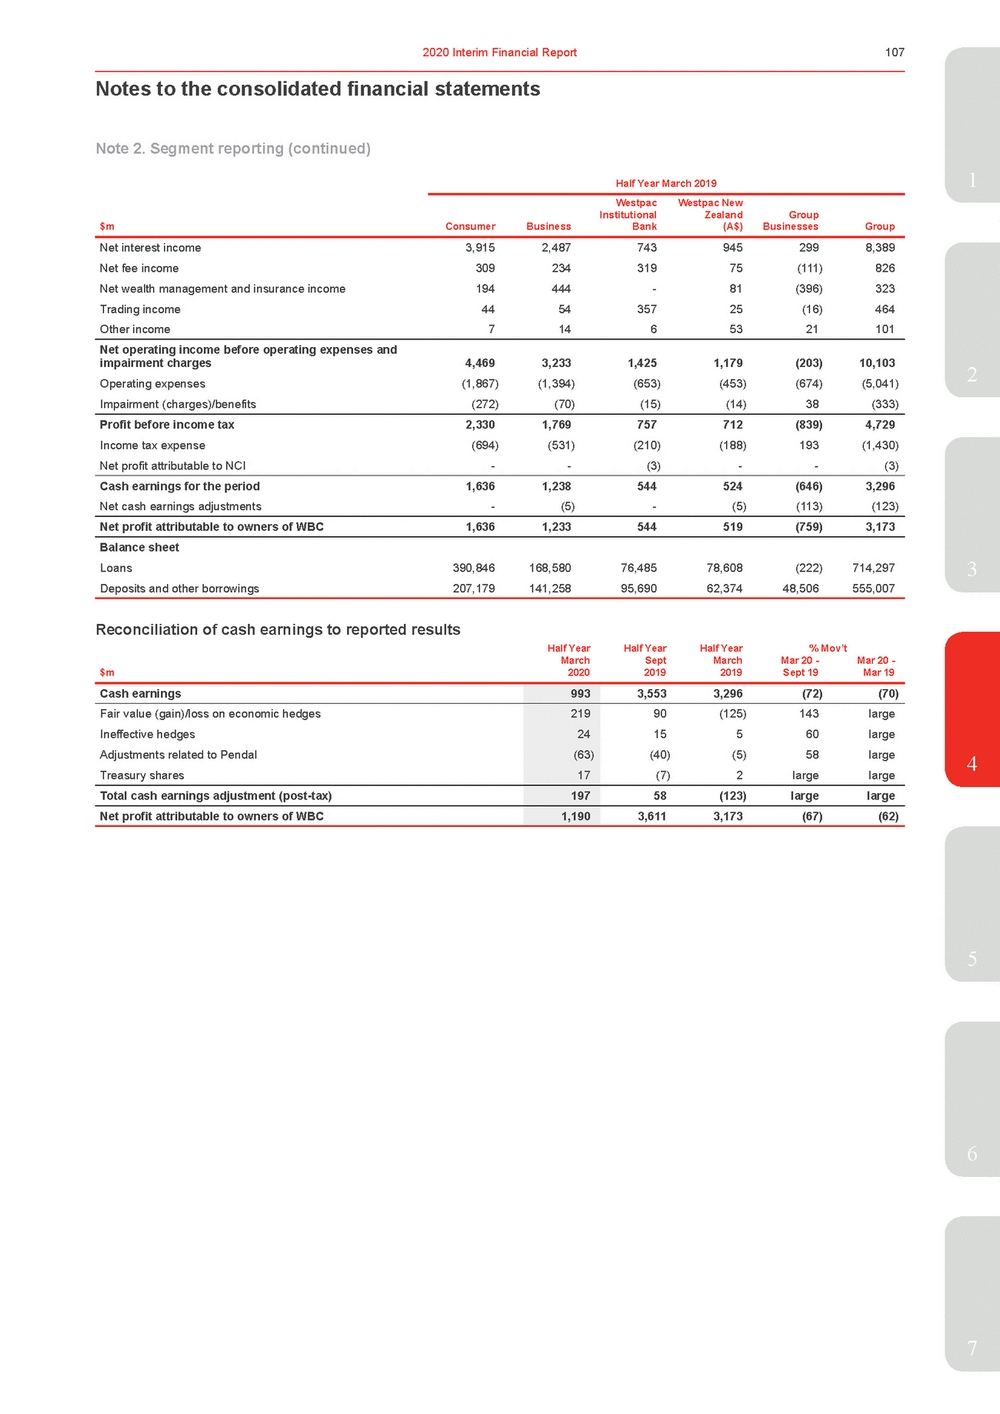 | Half Year March 20191 $m Consumer Business Westpac Institutional Bank Westpac New Zealand (A$) Group Businesses Group Net interest income 3,915 2,487 743 945 299 8,389 Net fee income 309 234 319 75 (111) 826 Net wealth management and insurance income 194 444 - 81 (396) 323 Trading income 44 54 357 25 (16) 464 Other income 7 14 6 53 21 101 Net operating income before operating expenses and impairment charges 4,469 3,233 1,425 1,179 (203) 10,103 Operating expenses (1,867) (1,394) (653) (453) (674) (5,041) Impairment (charges)/benefits (272) (70) (15) (14) 38 (333) Profit before income tax 2,330 1,769 757 712 (839) 4,729 Income tax expense (694) (531) (210) (188) 193 (1,430) Net profit attributable to NCI - - (3) - - (3) Cash earnings for the period 1,636 1,238 544 524 (646) 3,296 Net cash earnings adjustments - (5) - (5) (113) (123) Net profit attributable to owners of WBC 1,636 1,233 544 519 (759) 3,173 Balance sheet Loans 390,846 168,580 76,485 78,608 (222) 714,297 Deposits and other borrowings 207,179 141,258 95,690 62,374 48,506 555,007 Reconciliation of cash earnings to reported results Half Year March Half Year Sept Half Year March % Mov’t Mar 20 - Mar 20 - $m 2020 2019 2019 Sept 19 Mar 19 3 Cash earnings 993 3,5533,296(72)(70) Fair value (gain)/loss on economic hedges Ineffective hedges Adjustments related to Pendal Treasury shares 219 24 (63) 17 90(125)143large 15 560 large (40) (5)58 large (7)2largelarge Total cash earnings adjustment (post-tax) 197 58(123)largelarge Net profit attributable to owners of WBC 1,190 3,6113,173(67)(62) 5 6 7 |
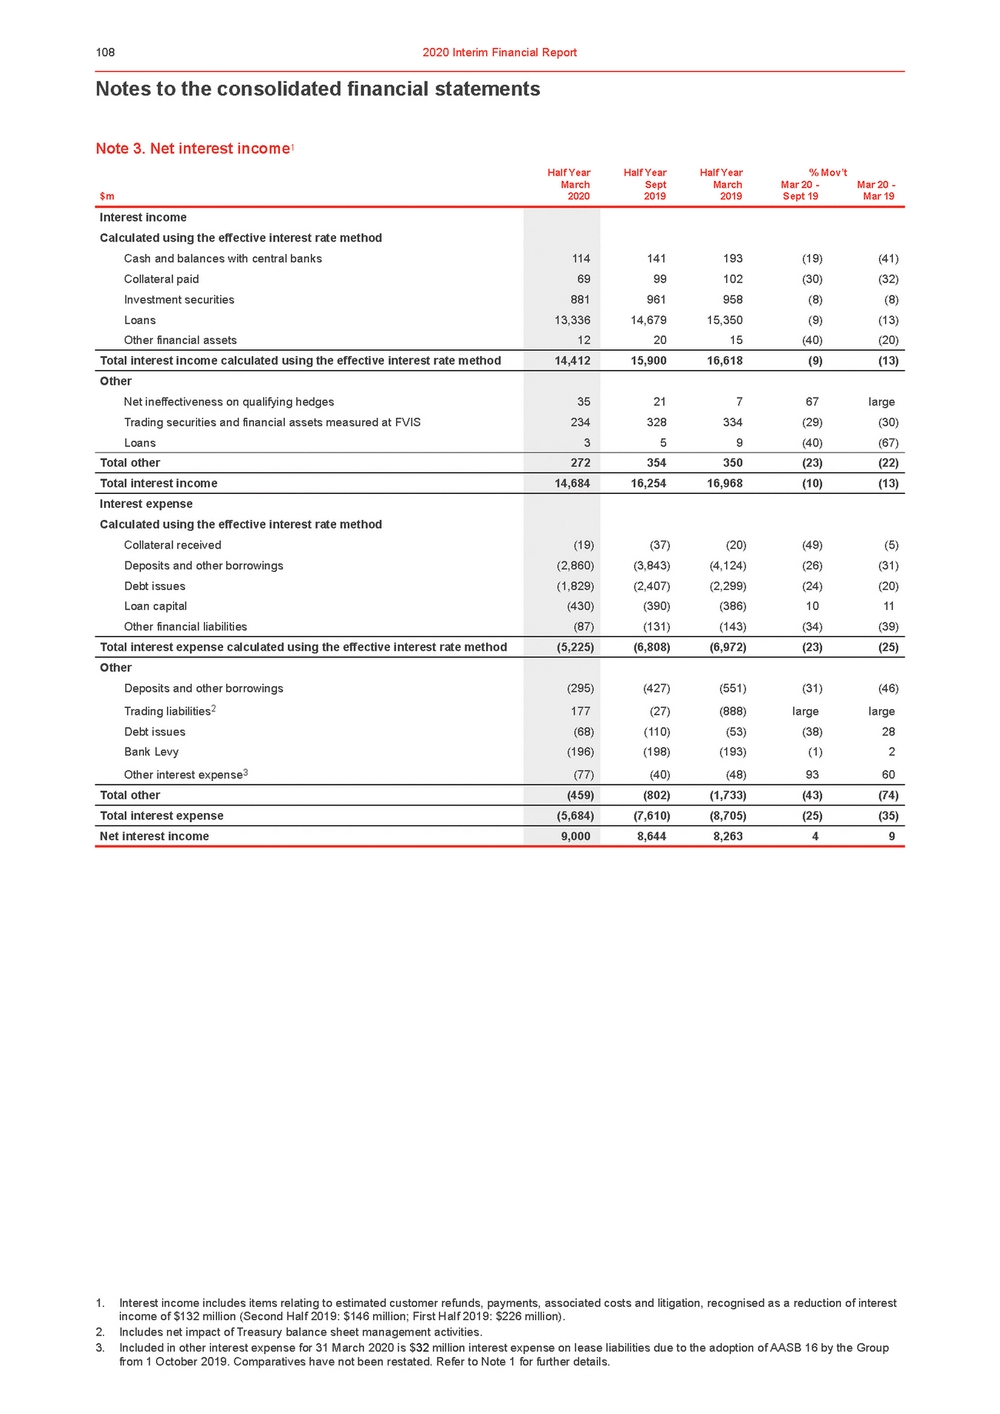 | Notes to the consolidated financial statements Note 3. Net interest income1 Half YearHalf YearHalf Year% Mov’t March $m2020 Sept 2019 March 2019 Mar 20 - Sept 19 Mar 20 - Mar 19 1. Interest income includes items relating to estimated customer refunds, payments, associated costs and litigation, recognised as a reduction of interest income of $132 million (Second Half 2019: $146 million; First Half 2019: $226 million). 2. Includes net impact of Treasury balance sheet management activities. 3. Included in other interest expense for 31 March 2020 is $32 million interest expense on lease liabilities due to the adoption of AASB 16 by the Group from 1 October 2019. Comparatives have not been restated. Refer to Note 1 for further details. |
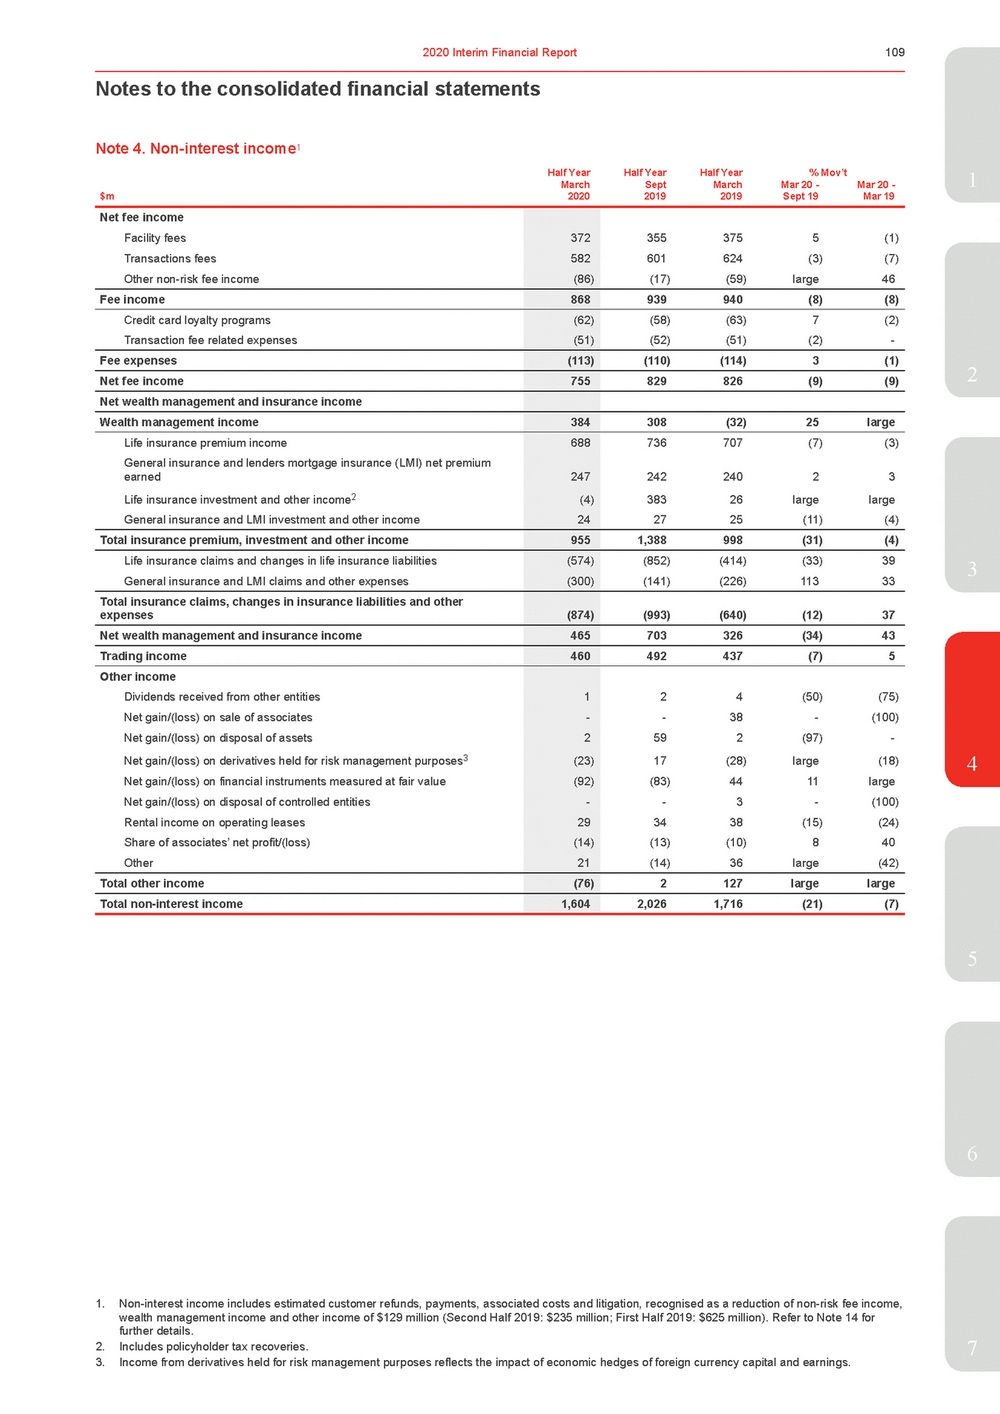 | Half YearHalf YearHalf Year% Mov’t1 March $m2020 Sept 2019 March 2019 Mar 20 - Sept 19 Mar 20 - Mar 19 Net fee income Facility fees Transactions fees Other non-risk fee income 372 582 (86) 3553755(1) 601624(3) (7) (17) (59)large46 Fee income 868 939940(8)(8) Credit card loyalty programs Transaction fee related expenses (62) (51) (58)(63)7(2) (52)(51)(2)-Fee expenses (113) (110)(114)3(1) Net fee income 755 829826(9)(9) Net wealth management and insurance income Wealth management income 384 308(32)25large Life insurance premium income General insurance and lenders mortgage insurance (LMI) net premium earned Life insurance investment and other income2 General insurance and LMI investment and other income 688 247 (4) 24 736707(7)(3) 24224023 38326largelarge 2725(11)(4) Total insurance premium, investment and other income 955 1,388998(31)(4) Life insurance claims and changes in life insurance liabilities General insurance and LMI claims and other expenses (574) (300) (852)(414)(33)39 (141)(226)11333 Total insurance claims, changes in insurance liabilities and other expenses (874) (993)(640)(12)37 Net wealth management and insurance income 465 703326(34)43 Trading income 460 492437(7)5 Other income Dividends received from other entities Net gain/(loss) on sale of associates Net gain/(loss) on disposal of assets Net gain/(loss) on derivatives held for risk management purposes3 Net gain/(loss) on financial instruments measured at fair value Net gain/(loss) on disposal of controlled entities Rental income on operating leases Share of associates’ net profit/(loss) Other 1 - 2 (23) (92) - 29 (14) 21 24(50)(75) -38-(100) 592(97)-17(28)large (18) (83) 4411large -3-(100) 34 38(15)(24) (13)(10) 8 40 (14) 36large(42) Total other income (76) 2127largelarge Total non-interest income 1,604 2,0261,716(21)(7) 3 4 5 6 1. Non-interest income includes estimated customer refunds, payments, associated costs and litigation, recognised as a reduction of non-risk fee income, wealth management income and other income of $129 million (Second Half 2019: $235 million; First Half 2019: $625 million). Refer to Note 14 for further details. 2. Includes policyholder tax recoveries.7 3. Income from derivatives held for risk management purposes reflects the impact of economic hedges of foreign currency capital and earnings. |
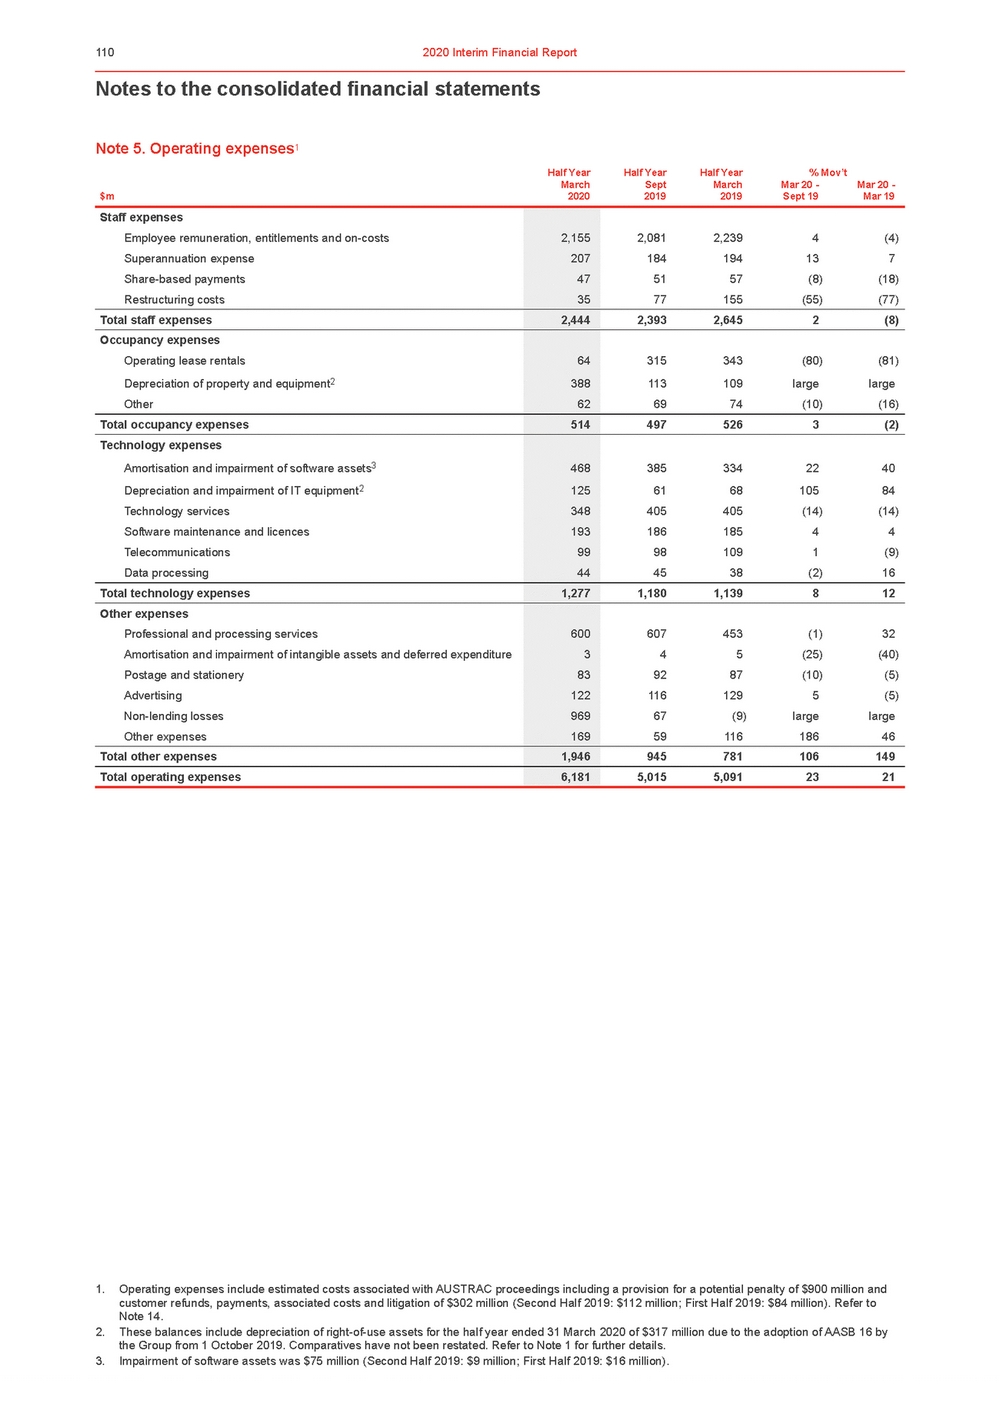 | Notes to the consolidated financial statements Note 5. Operating expenses1 Half YearHalf YearHalf Year% Mov’t March $m2020 Sept 2019 March 2019 Mar 20 - Sept 19 Mar 20 - Mar 19 1. Operating expenses include estimated costs associated with AUSTRAC proceedings including a provision for a potential penalty of $900 million and customer refunds, payments, associated costs and litigation of $302 million (Second Half 2019: $112 million; First Half 2019: $84 million). Refer to Note 14. 2. These balances include depreciation of right-of-use assets for the half year ended 31 March 2020 of $317 million due to the adoption of AASB 16 by the Group from 1 October 2019. Comparatives have not been restated. Refer to Note 1 for further details. 3. Impairment of software assets was $75 million (Second Half 2019: $9 million; First Half 2019: $16 million). |
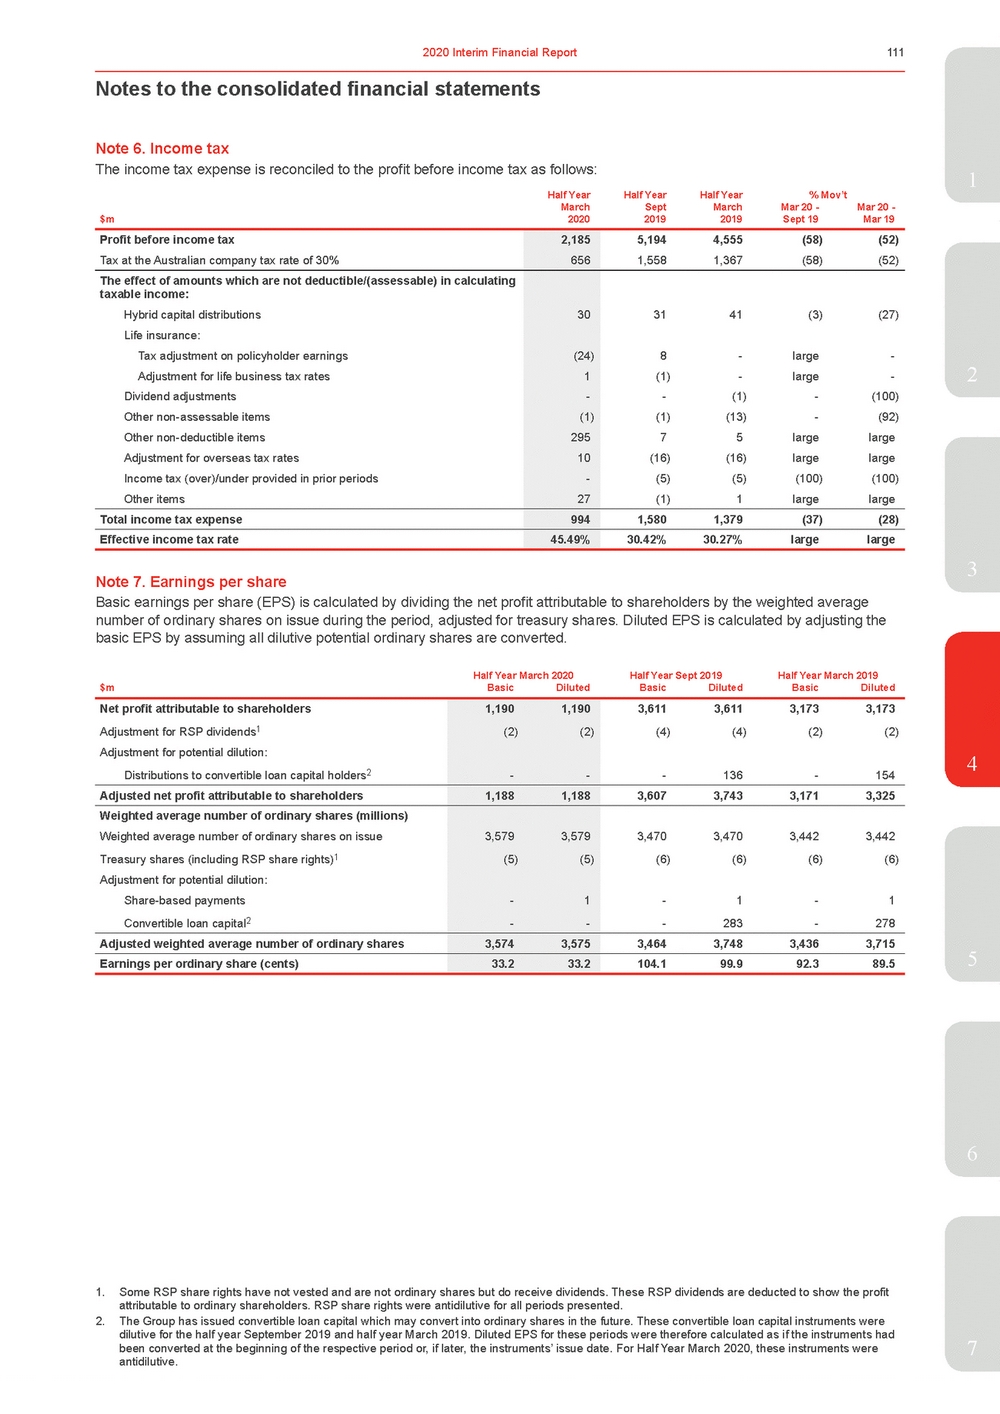 | ollows: 1 alf Year March Half Year Sept Half Year March % Mov’t Mar 20 - Mar 20 - 2020 2019 2019 Sept 19 Mar 19 H $m Profit before income tax Tax at the Australian company tax rate of 30% 2,185 656 5,1944,555(58)(52) 1,5581,367(58)(52) The effect of amounts which are not deductible/(assessable) in calculating taxable income: Hybrid capital distributions Life insurance: Tax adjustment on policyholder earnings Adjustment for life business tax rates Dividend adjustments Other non-assessable items Other non-deductible items Adjustment for overseas tax rates Income tax (over)/under provided in prior periods Other items 30 (24) 1 - (1) 295 10 - 27 31 41 (3) (27) 8 - large - (1) - large - - (1) - (100) (1) (13) - (92) 7 5 large large (16) (16) large large (5) (5) (100) (100) (1) 1 large large Total income tax expense 994 1,5801,379(37)(28) Effective income tax rate 45.49% 30.42%30.27%largelarge 3 Note 7. Earnings per share Basic earnings per share (EPS) is calculated by dividing the net profit attributable to shareholders by the weighted average number of ordinary shares on issue during the period, adjusted for treasury shares. Diluted EPS is calculated by adjusting the basic EPS by assuming all dilutive potential ordinary shares are converted. Half Year March 2020 Half Year Sept 2019 Half Year March 2019 BasicDiluted BasicDiluted BasicDiluted Net profit attributable to shareholders Adjustment for RSP dividends1 Adjustment for potential dilution: Distributions to convertible loan capital holders2 1,1901,190 (2)(2) --3,6113,6113,1733,173 (4)(4)(2)(2) -136-154 Adjusted net profit attributable to shareholders 1,1881,188 3,6073,7433,1713,325 Weighted average number of ordinary shares (millions) Weighted average number of ordinary shares on issue Treasury shares (including RSP share rights)1 Adjustment for potential dilution: Share-based payments Convertible loan capital2 3,5793,579 (5)(5) -1 --3,4703,4703,4423,442 (6)(6)(6)(6) -1-1 -283-278 Adjusted weighted average number of ordinary shares 3,5743,575 3,4643,7483,4363,715 Earnings per ordinary share (cents) 33.233.2 104.199.992.389.5 5 6 1. Some RSP share rights have not vested and are not ordinary shares but do receive dividends. These RSP dividends are deducted to show the profit attributable to ordinary shareholders. RSP share rights were antidilutive for all periods presented. 2. The Group has issued convertible loan capital which may convert into ordinary shares in the future. These convertible loan capital instruments were dilutive for the half year September 2019 and half year March 2019. Diluted EPS for these periods were therefore calculated as if the instruments had been converted at the beginning of the respective period or, if later, the instruments’ issue date. For Half Year March 2020, these instruments were7 antidilutive. |
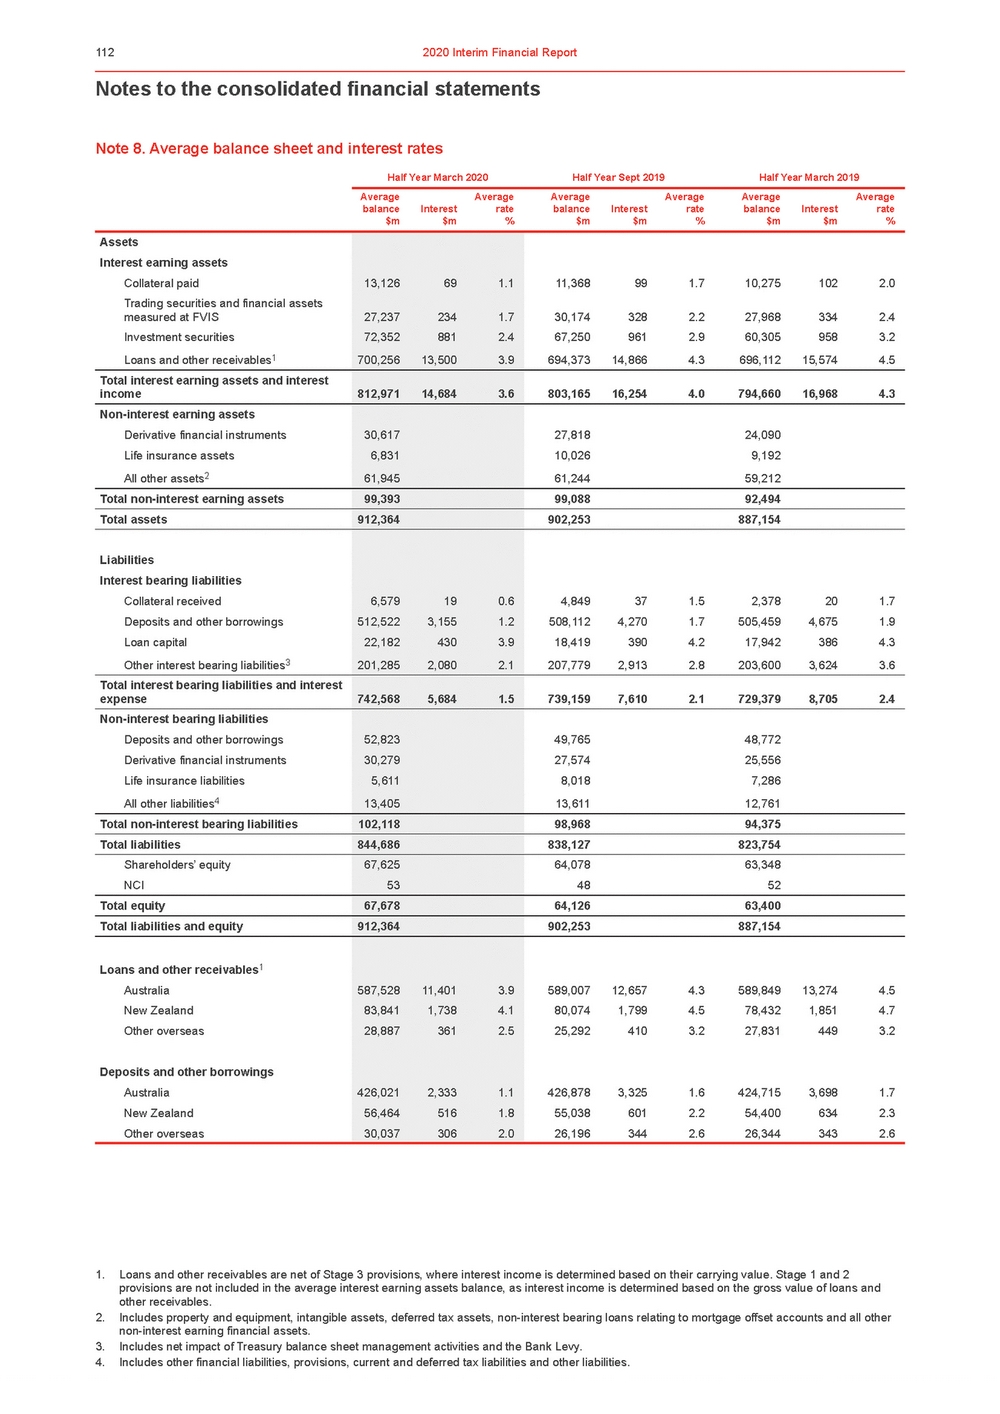 | Notes to the consolidated financial statements Note 8. Average balance sheet and interest rates Average Average Average Average Average Average balance Interest rate balance Interest rate balance Interest rate $m $m % $m $m % $m $m % 1. Loans and other receivables are net of Stage 3 provisions, where interest income is determined based on their carrying value. Stage 1 and 2 provisions are not included in the average interest earning assets balance, as interest income is determined based on the gross value of loans and other receivables. 2. Includes property and equipment, intangible assets, deferred tax assets, non-interest bearing loans relating to mortgage offset accounts and all other non-interest earning financial assets. 3. Includes net impact of Treasury balance sheet management activities and the Bank Levy. 4. Includes other financial liabilities, provisions, current and deferred tax liabilities and other liabilities. |
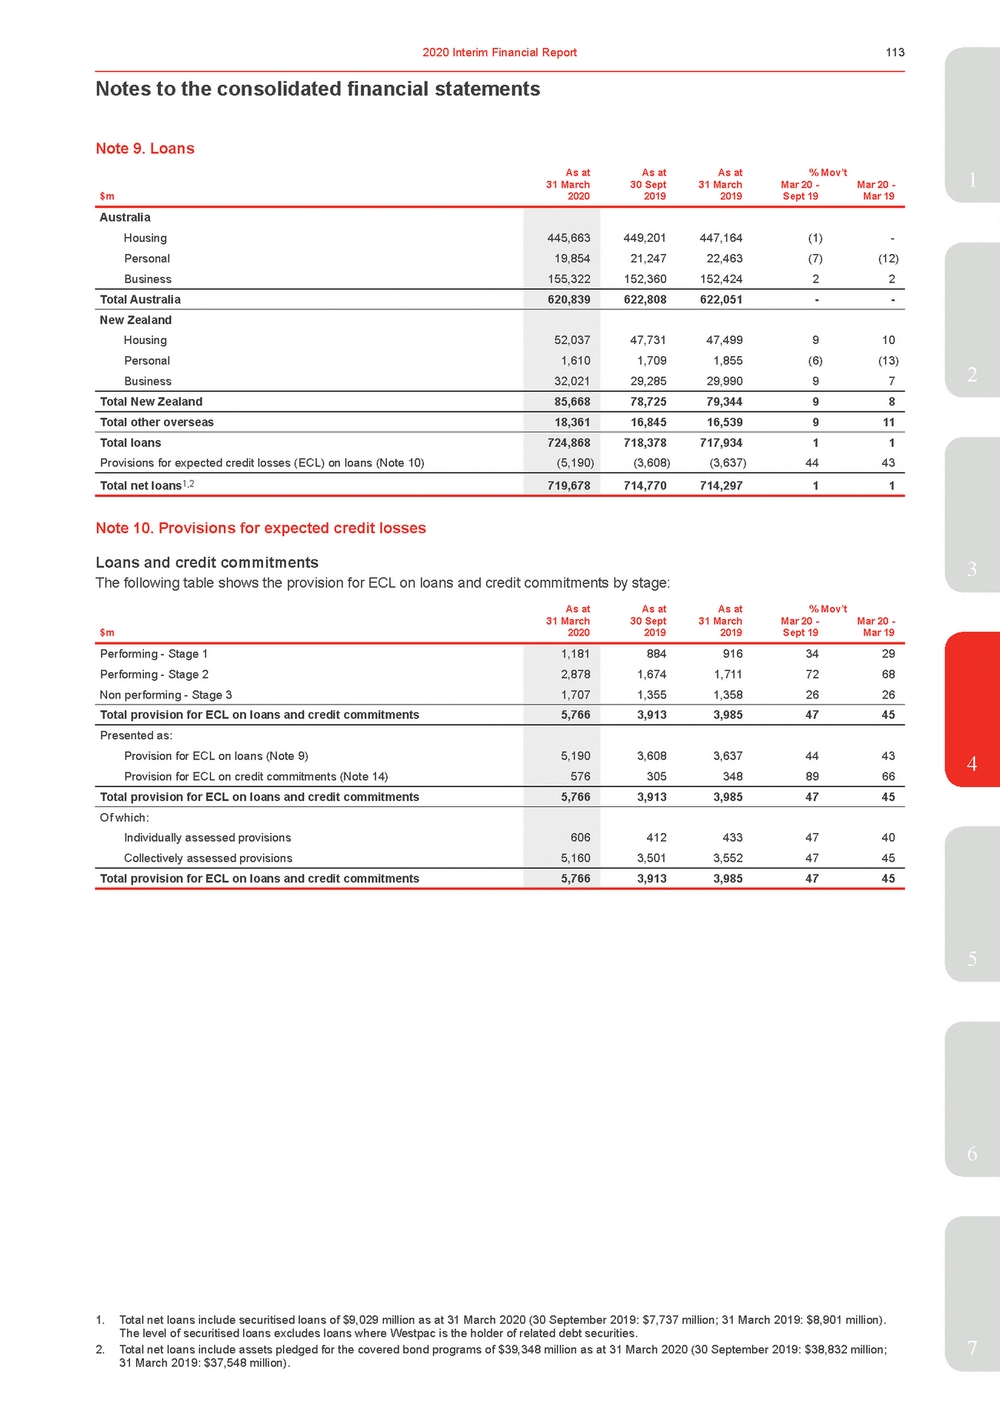 | As atAs atAs at% Mov’t1 31 March $m2020 30 Sept 2019 31 March 2019 Mar 20 - Sept 19 Mar 20 - Mar 19 Australia Housing Personal Business 445,663 19,854 155,322 449,201447,164(1)-21,24722,463(7)(12) 152,360152,42422 Total Australia 620,839 622,808622,051--New Zealand Housing Personal Business 52,037 1,610 32,021 47,73147,499910 1,7091,855(6)(13) 29,28529,99097 Total New Zealand 85,668 78,72579,34498 Total other overseas 18,361 16,84516,539911 Total loans Provisions for expected credit losses (ECL) on loans (Note 10) 724,868 (5,190) 718,378717,93411 (3,608)(3,637)4443 Total net loans1,2 719,678 714,770714,29711 Note 10. Provisions for expected credit losses Loans and credit commitments3 The following table shows the provision for ECL on loans and credit commitments by stage: As atAs atAs at% Mov’t 31 March $m2020 30 Sept 2019 31 March 2019 Mar 20 - Sept 19 Mar 20 - Mar 19 Performing - Stage 1 Performing - Stage 2 Non performing - Stage 3 1,181 2,878 1,707 8849163429 1,6741,7117268 1,3551,3582626 Total provision for ECL on loans and credit commitments 5,766 3,9133,9854745 Presented as: Provision for ECL on loans (Note 9) Provision for ECL on credit commitments (Note 14) 5,190 576 3,6083,6374443 3053488966 Total provision for ECL on loans and credit commitments 5,766 3,9133,9854745 Of which: Individually assessed provisions Collectively assessed provisions 606 5,160 4124334740 3,5013,5524745 Total provision for ECL on loans and credit commitments 5,766 3,9133,9854745 5 6 1. Total net loans include securitised loans of $9,029 million as at 31 March 2020 (30 September 2019: $7,737 million; 31 March 2019: $8,901 million). The level of securitised loans excludes loans where Westpac is the holder of related debt securities. 2. Total net loans include assets pledged for the covered bond programs of $39,348 million as at 31 March 2020 (30 September 2019: $38,832 million;7 31 March 2019: $37,548 million). |
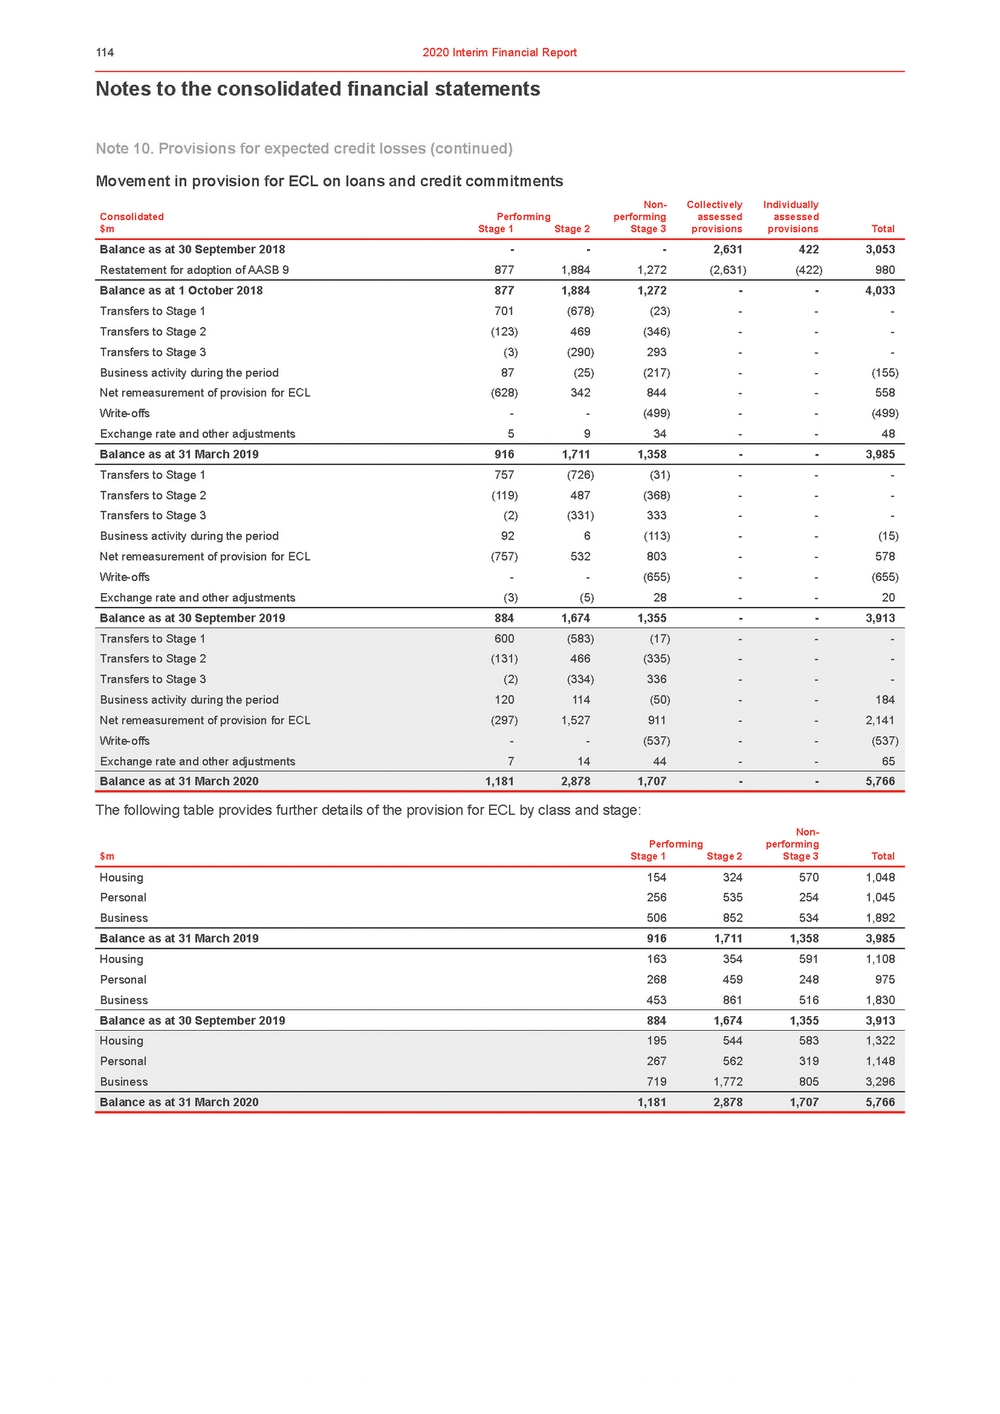 | Notes to the consolidated financial statements Note 10. Provisions for expected credit losses (continued) Movement in provision for ECL on loans and credit commitments |
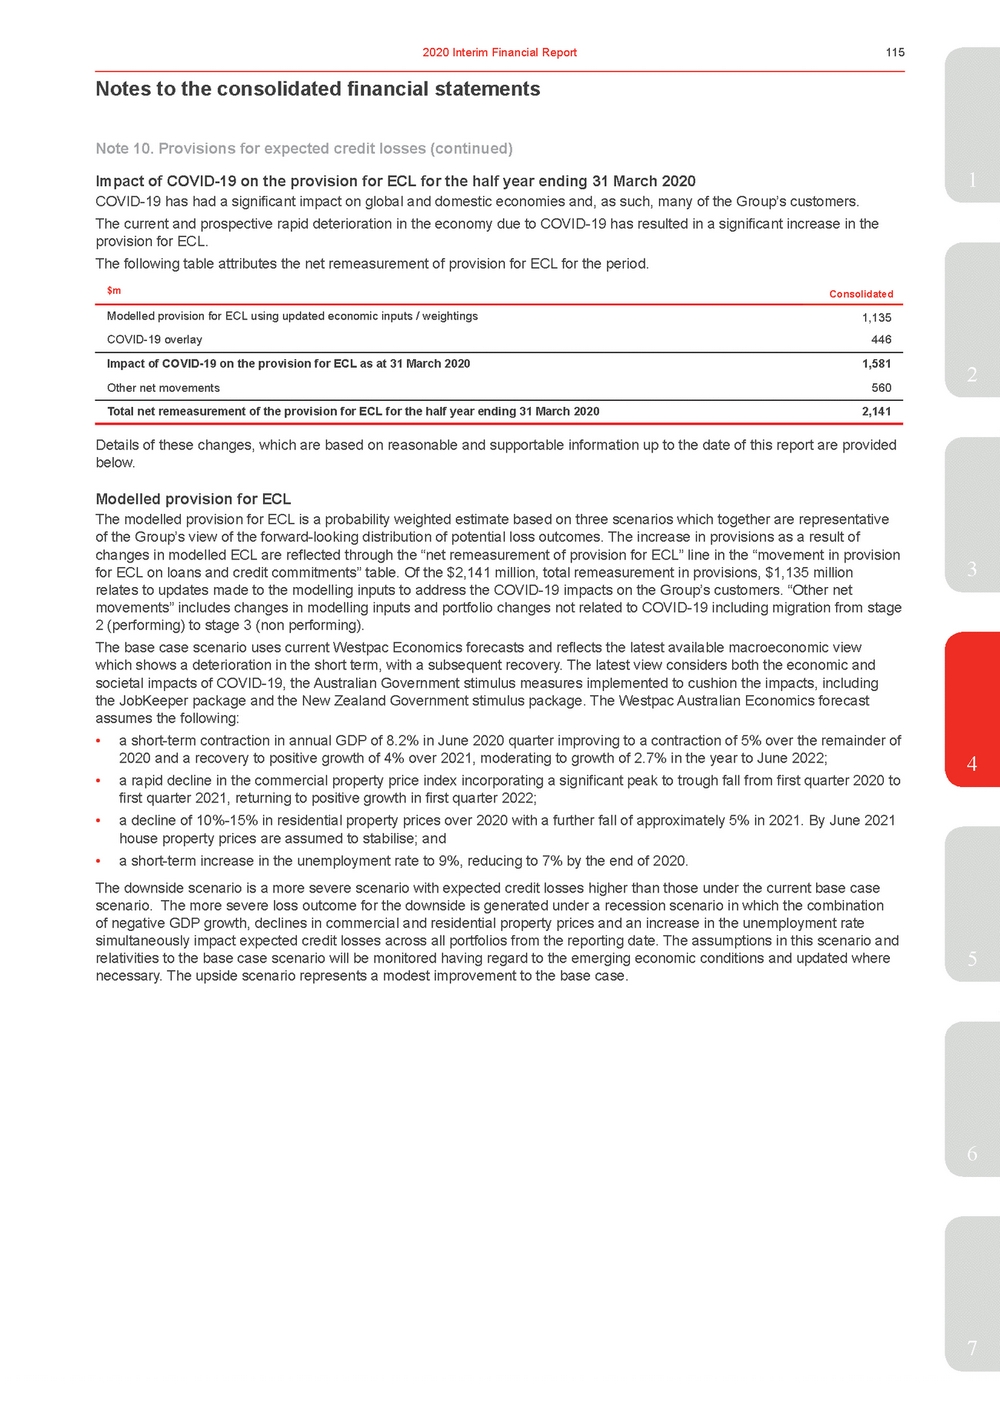 | COVID-19 has had a significant impact on global and domestic economies and, as such, many of the Group’s customers. The current and prospective rapid deterioration in the economy due to COVID-19 has resulted in a significant increase in the provision for ECL. The following table attributes the net remeasurement of provision for ECL for the period. $m Consolidated Modelled provision for ECL using updated economic inputs / weightings1,135 COVID-19 overlay446 Impact of COVID-19 on the provision for ECL as at 31 March 20201,581 Other net movements560 Total net remeasurement of the provision for ECL for the half year ending 31 March 20202,141 Details of these changes, which are based on reasonable and supportable information up to the date of this report are provided below. Modelled provision for ECL The modelled provision for ECL is a probability weighted estimate based on three scenarios which together are representative of the Group’s view of the forward-looking distribution of potential loss outcomes. The increase in provisions as a result of changes in modelled ECL are reflected through the “net remeasurement of provision for ECL” line in the “movement in provision for ECL on loans and credit commitments” table. Of the $2,141 million, total remeasurement in provisions, $1,135 million3 relates to updates made to the modelling inputs to address the COVID-19 impacts on the Group’s customers. “Other net movements” includes changes in modelling inputs and portfolio changes not related to COVID-19 including migration from stage 2 (performing) to stage 3 (non performing). The base case scenario uses current Westpac Economics forecasts and reflects the latest available macroeconomic view which shows a deterioration in the short term, with a subsequent recovery. The latest view considers both the economic and societal impacts of COVID-19, the Australian Government stimulus measures implemented to cushion the impacts, including the JobKeeper package and the New Zealand Government stimulus package. The Westpac Australian Economics forecast assumes the following: •a short-term contraction in annual GDP of 8.2% in June 2020 quarter improving to a contraction of 5% over the remainder of 2020 and a recovery to positive growth of 4% over 2021, moderating to growth of 2.7% in the year to June 2022;4 •a rapid decline in the commercial property price index incorporating a significant peak to trough fall from first quarter 2020 to first quarter 2021, returning to positive growth in first quarter 2022; •a decline of 10%-15% in residential property prices over 2020 with a further fall of approximately 5% in 2021. By June 2021 house property prices are assumed to stabilise; and •a short-term increase in the unemployment rate to 9%, reducing to 7% by the end of 2020. The downside scenario is a more severe scenario with expected credit losses higher than those under the current base case scenario. The more severe loss outcome for the downside is generated under a recession scenario in which the combination of negative GDP growth, declines in commercial and residential property prices and an increase in the unemployment rate simultaneously impact expected credit losses across all portfolios from the reporting date. The assumptions in this scenario and relativities to the base case scenario will be monitored having regard to the emerging economic conditions and updated where5 necessary. The upside scenario represents a modest improvement to the base case. 6 7 |
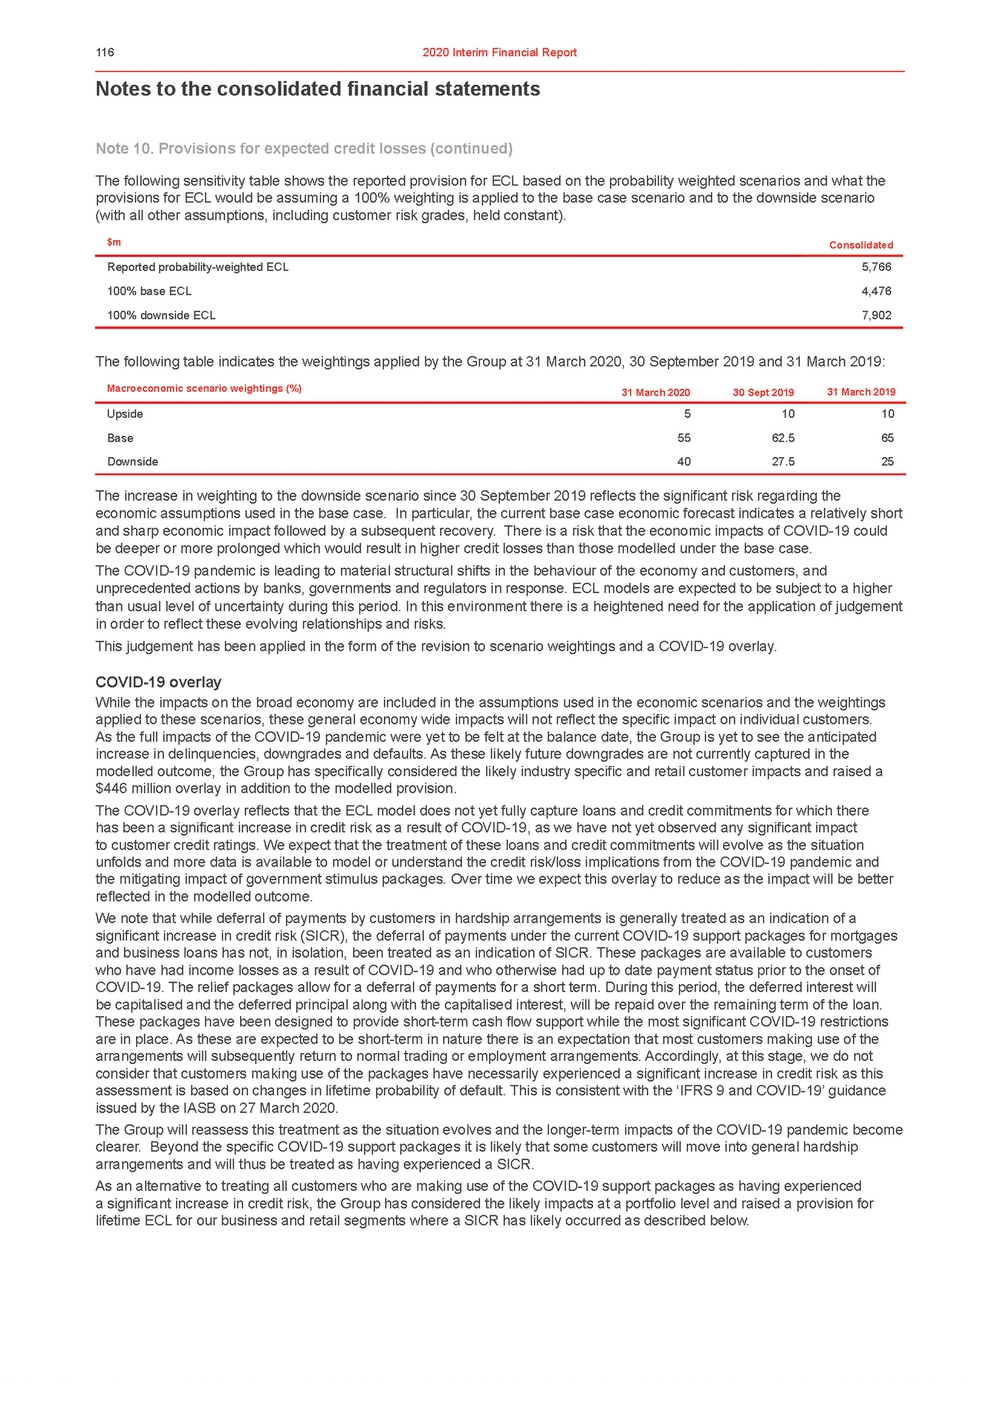 | Notes to the consolidated financial statements Note 10. Provisions for expected credit losses (continued) The following sensitivity table shows the reported provision for ECL based on the probability weighted scenarios and what the provisions for ECL would be assuming a 100% weighting is applied to the base case scenario and to the downside scenario (with all other assumptions, including customer risk grades, held constant). The following table indicates the weightings applied by the Group at 31 March 2020, 30 September 2019 and 31 March 2019: The increase in weighting to the downside scenario since 30 September 2019 reflects the significant risk regarding the economic assumptions used in the base case. In particular, the current base case economic forecast indicates a relatively short and sharp economic impact followed by a subsequent recovery. There is a risk that the economic impacts of COVID-19 could be deeper or more prolonged which would result in higher credit losses than those modelled under the base case. The COVID-19 pandemic is leading to material structural shifts in the behaviour of the economy and customers, and unprecedented actions by banks, governments and regulators in response. ECL models are expected to be subject to a higher than usual level of uncertainty during this period. In this environment there is a heightened need for the application of judgement in order to reflect these evolving relationships and risks. This judgement has been applied in the form of the revision to scenario weightings and a COVID-19 overlay. COVID-19 overlay While the impacts on the broad economy are included in the assumptions used in the economic scenarios and the weightings applied to these scenarios, these general economy wide impacts will not reflect the specific impact on individual customers. As the full impacts of the COVID-19 pandemic were yet to be felt at the balance date, the Group is yet to see the anticipated increase in delinquencies, downgrades and defaults. As these likely future downgrades are not currently captured in the modelled outcome, the Group has specifically considered the likely industry specific and retail customer impacts and raised a $446 million overlay in addition to the modelled provision. The COVID-19 overlay reflects that the ECL model does not yet fully capture loans and credit commitments for which there has been a significant increase in credit risk as a result of COVID-19, as we have not yet observed any significant impact to customer credit ratings. We expect that the treatment of these loans and credit commitments will evolve as the situation unfolds and more data is available to model or understand the credit risk/loss implications from the COVID-19 pandemic and the mitigating impact of government stimulus packages. Over time we expect this overlay to reduce as the impact will be better reflected in the modelled outcome. We note that while deferral of payments by customers in hardship arrangements is generally treated as an indication of a significant increase in credit risk (SICR), the deferral of payments under the current COVID-19 support packages for mortgages and business loans has not, in isolation, been treated as an indication of SICR. These packages are available to customers who have had income losses as a result of COVID-19 and who otherwise had up to date payment status prior to the onset of COVID-19. The relief packages allow for a deferral of payments for a short term. During this period, the deferred interest will be capitalised and the deferred principal along with the capitalised interest, will be repaid over the remaining term of the loan. These packages have been designed to provide short-term cash flow support while the most significant COVID-19 restrictions are in place. As these are expected to be short-term in nature there is an expectation that most customers making use of the arrangements will subsequently return to normal trading or employment arrangements. Accordingly, at this stage, we do not consider that customers making use of the packages have necessarily experienced a significant increase in credit risk as this assessment is based on changes in lifetime probability of default. This is consistent with the ‘IFRS 9 and COVID-19’ guidance issued by the IASB on 27 March 2020. The Group will reassess this treatment as the situation evolves and the longer-term impacts of the COVID-19 pandemic become clearer. Beyond the specific COVID-19 support packages it is likely that some customers will move into general hardship arrangements and will thus be treated as having experienced a SICR. As an alternative to treating all customers who are making use of the COVID-19 support packages as having experienced a significant increase in credit risk, the Group has considered the likely impacts at a portfolio level and raised a provision for lifetime ECL for our business and retail segments where a SICR has likely occurred as described below. |
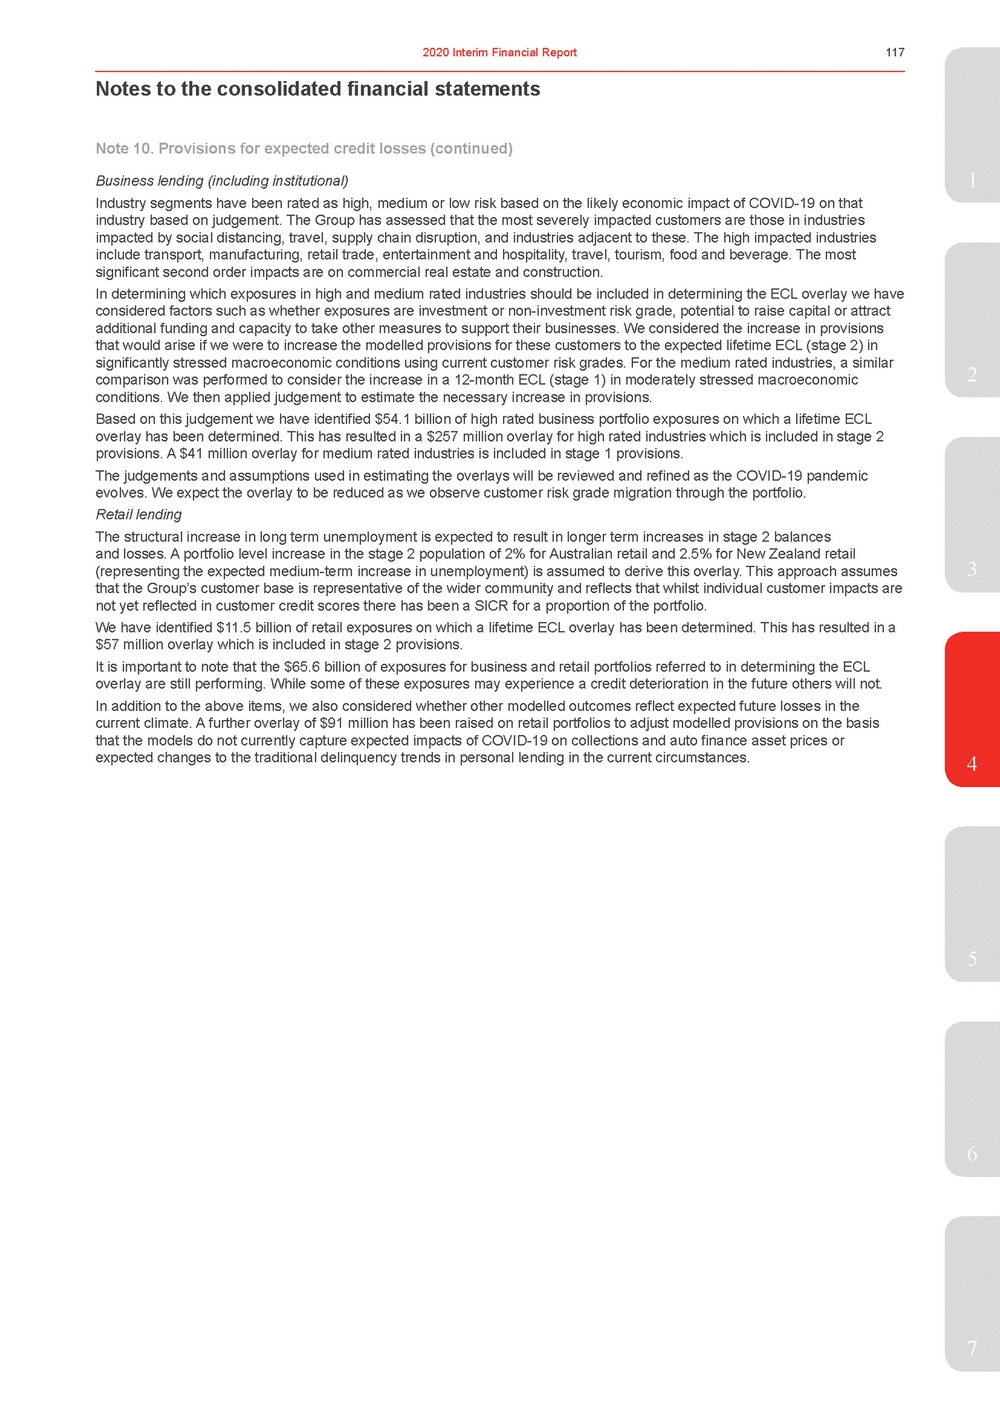 | Industry segments have been rated as high, medium or low risk based on the likely economic impact of COVID-19 on that industry based on judgement. The Group has assessed that the most severely impacted customers are those in industries impacted by social distancing, travel, supply chain disruption, and industries adjacent to these. The high impacted industries include transport, manufacturing, retail trade, entertainment and hospitality, travel, tourism, food and beverage. The most significant second order impacts are on commercial real estate and construction. In determining which exposures in high and medium rated industries should be included in determining the ECL overlay we have considered factors such as whether exposures are investment or non-investment risk grade, potential to raise capital or attract additional funding and capacity to take other measures to support their businesses. We considered the increase in provisions that would arise if we were to increase the modelled provisions for these customers to the expected lifetime ECL (stage 2) in significantly stressed macroeconomic conditions using current customer risk grades. For the medium rated industries, a similar comparison was performed to consider the increase in a 12-month ECL (stage 1) in moderately stressed macroeconomic2 conditions. We then applied judgement to estimate the necessary increase in provisions. Based on this judgement we have identified $54.1 billion of high rated business portfolio exposures on which a lifetime ECL overlay has been determined. This has resulted in a $257 million overlay for high rated industries which is included in stage 2 provisions. A $41 million overlay for medium rated industries is included in stage 1 provisions. The judgements and assumptions used in estimating the overlays will be reviewed and refined as the COVID-19 pandemic evolves. We expect the overlay to be reduced as we observe customer risk grade migration through the portfolio. Retail lending The structural increase in long term unemployment is expected to result in longer term increases in stage 2 balances and losses. A portfolio level increase in the stage 2 population of 2% for Australian retail and 2.5% for New Zealand retail (representing the expected medium-term increase in unemployment) is assumed to derive this overlay. This approach assumes3 that the Group’s customer base is representative of the wider community and reflects that whilst individual customer impacts are not yet reflected in customer credit scores there has been a SICR for a proportion of the portfolio. We have identified $11.5 billion of retail exposures on which a lifetime ECL overlay has been determined. This has resulted in a $57 million overlay which is included in stage 2 provisions. It is important to note that the $65.6 billion of exposures for business and retail portfolios referred to in determining the ECL overlay are still performing. While some of these exposures may experience a credit deterioration in the future others will not. In addition to the above items, we also considered whether other modelled outcomes reflect expected future losses in the current climate. A further overlay of $91 million has been raised on retail portfolios to adjust modelled provisions on the basis that the models do not currently capture expected impacts of COVID-19 on collections and auto finance asset prices or expected changes to the traditional delinquency trends in personal lending in the current circumstances.4 5 6 7 |
 | Notes to the consolidated financial statements Note 10. Provisions for expected credit losses (continued) Investment Securities – debt securities The following tables reconcile the provision for ECL on debt securities. Debt securities at $mFVOCI1 Debt securities at amortised cost Total debt securities Balance as at 30 September 2018---Restatement for adoption of AASB 92911 Balance as at 1 October 20182911 Stage 1 - change in the provision during the period-11 Balance as at 31 March 201921012 Stage 1 - change in the provision during the period-(1)(1) Balance as at 30 September 20192911 Stage 1 - change in the provision during the period11011 Stage 2 - change in the provision during the period-33 Balance as at 31 March 202032225 Reconciliation of impairment charges Half YearHalf YearHalf Year March $m2020 Sept 2019 March 2019 Note 11. Credit Quality The loans and credit commitments balance in stage 3 (non-performing) is represented by those loans and credit commitments which are in default. A default occurs when Westpac considered that the customer is unlikely to repay its credit obligations in full, irrespective of recourse by the Group to actions such as realising security, or the customer is more than 90 days past due on any material credit obligation. This definition of default is aligned to the APRA regulatory definition of default. These can be disaggregated into impaired loans and credit commitments (which is where the customer is unlikely to pay its credit obligations in full including restructured loans) and items 90 days past due, or otherwise in default but not impaired. Impaired loans and credit commitments include: •housing and business loans with insufficient security to cover the principal and interest payments owing (aligned to an impaired internal credit risk grade); •personal loans which are greater than 90 days past due; and •restructured loans (the original contractual terms have been modified to provide for concessions for a customer facing financial difficulties). 1. Impairment on debt securities at FVOCI is recognised in the income statement with a corresponding amount in other comprehensive income (refer to Note 15). There is no reduction of the carrying value of the debt securities which remains at fair value. |
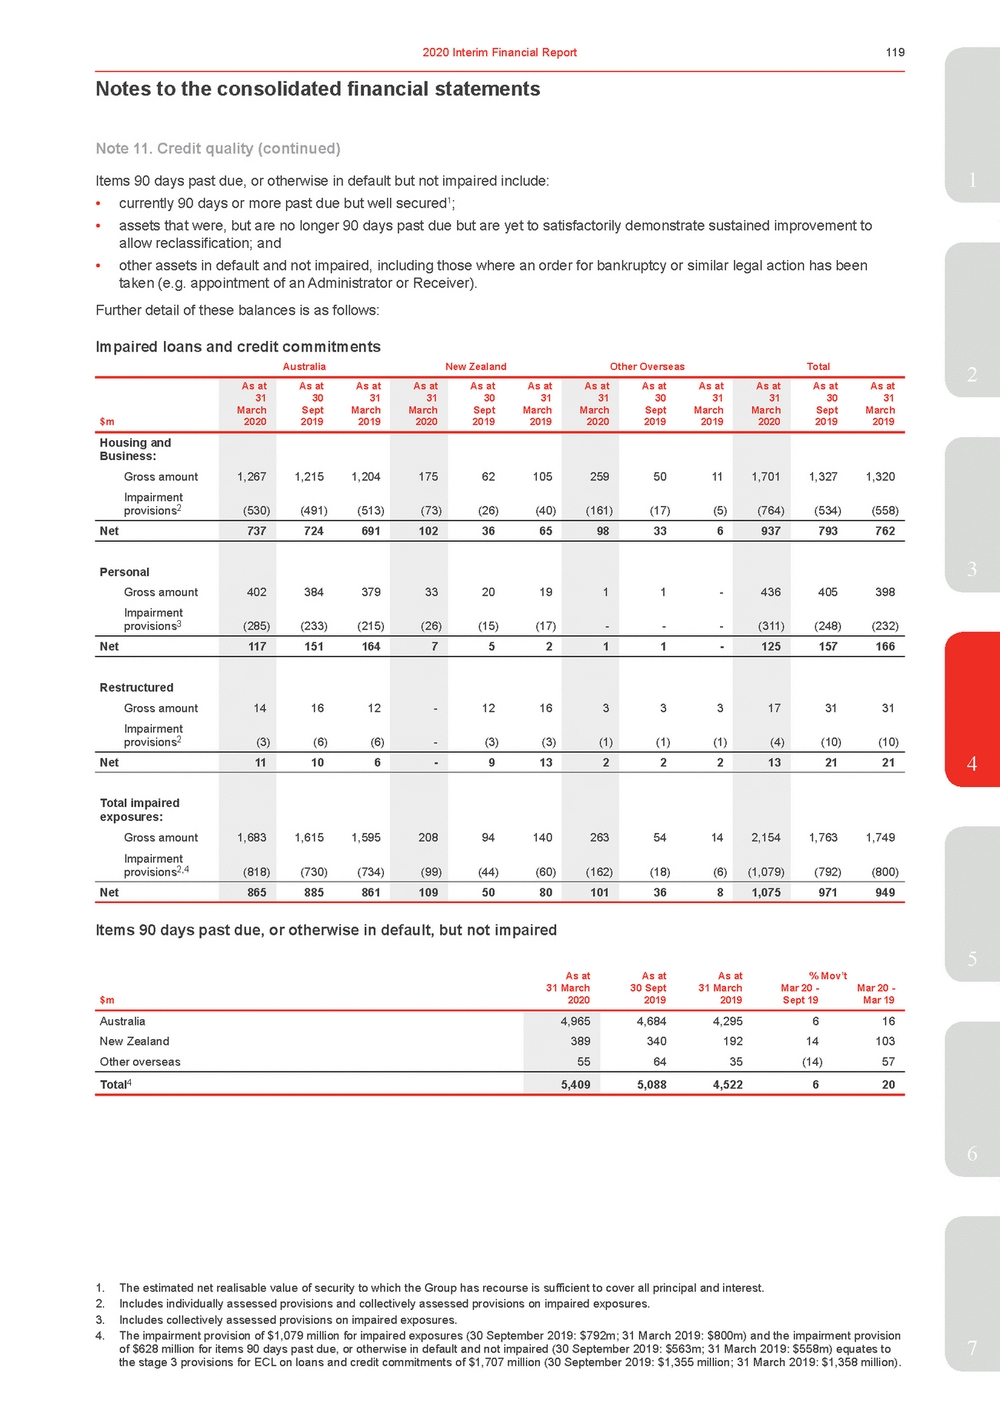 | Items 90 days past due, or otherwise in default but not impaired include:1 •currently 90 days or more past due but well secured1; •assets that were, but are no longer 90 days past due but are yet to satisfactorily demonstrate sustained improvement to allow reclassification; and •other assets in default and not impaired, including those where an order for bankruptcy or similar legal action has been taken (e.g. appointment of an Administrator or Receiver). Further detail of these balances is as follows: Impaired loans and credit commitments $m As at 31 March 2020 As atAs at 3031 SeptMarch 20192019 As at 31 March 2020 As atAs at 3031 SeptMarch 20192019 As at 31 March 2020 As atAs at 3031 SeptMarch 20192019 As at 31 March 2020 As atAs at 3031 SeptMarch 20192019 Housing and Business: Gross amount Impairment provisions2 1,267 (530) 1,2151,204 (491) (513) 175 (73) 62105 (26) (40) 259 (161) 5011 (17) (5) 1,701 (764) 1,3271,320 (534) (558) Net 737 724691 102 3665 98 336 937 793762 Personal Gross amount Impairment provisions3 402 (285) 384379 (233)(215) 33 (26) 20 19 (15)(17) 1 - 1--- 436 (311) 405398 (248)(232) Net 117 151164 7 52 1 1-125 157166 Restructured Gross amount Impairment provisions2 14 (3) 1612 (6) (6) - - 1216 (3) (3) 3 (1) 3 3 (1)(1) 17 (4) 31 31 (10)(10) Net 11 106 - 913 2 22 13 2121 Total impaired exposures: Gross amount Impairment provisions2,4 1,683 (818) 1,6151,595 (730) (734) 208 (99) 94140 (44) (60) 263 (162) 5414 (18) (6) 2,154 (1,079) 1,7631,749 (792) (800) Net 865 885861 109 5080 101 368 1,075 971949 3 4 Items 90 days past due, or otherwise in default, but not impaired 5 As at 31 March As at 30 Sept As at 31 March % Mov’t Mar 20 - Mar 20 - 2020 2019 2019 Sept 19 Mar 19 6 1. The estimated net realisable value of security to which the Group has recourse is sufficient to cover all principal and interest. 2. Includes individually assessed provisions and collectively assessed provisions on impaired exposures. 3. Includes collectively assessed provisions on impaired exposures. 4. The impairment provision of $1,079 million for impaired exposures (30 September 2019: $792m; 31 March 2019: $800m) and the impairment provision of $628 million for items 90 days past due, or otherwise in default and not impaired (30 September 2019: $563m; 31 March 2019: $558m) equates to7 the stage 3 provisions for ECL on loans and credit commitments of $1,707 million (30 September 2019: $1,355 million; 31 March 2019: $1,358 million). |
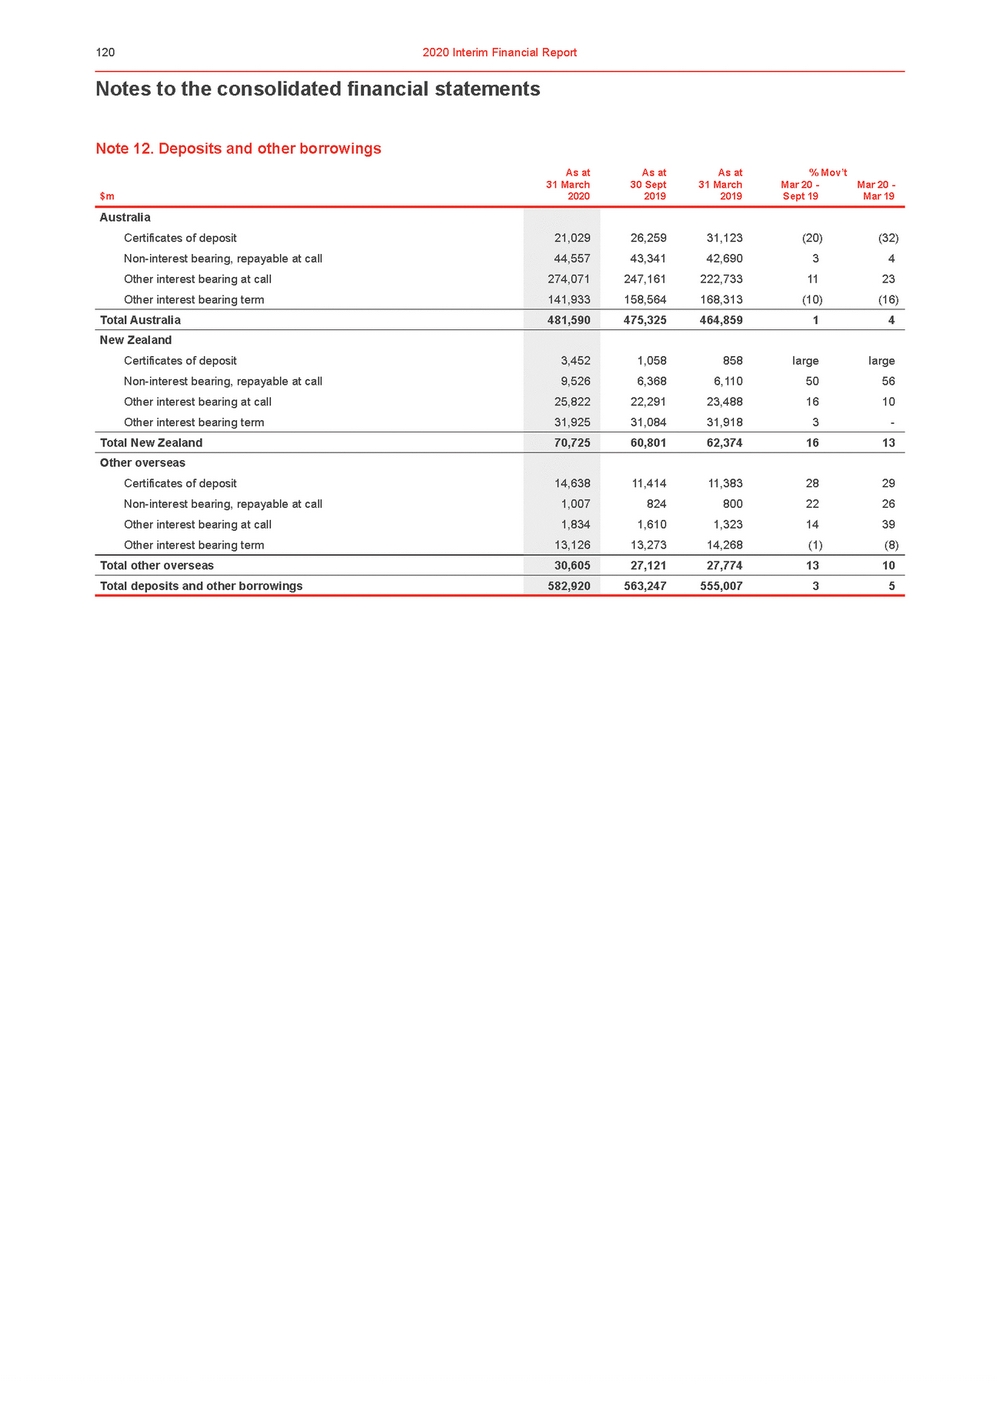 | Notes to the consolidated financial statements Note 12. Deposits and other borrowings As atAs atAs at% Mov’t 31 March $m2020 30 Sept 2019 31 March 2019 Mar 20 - Sept 19 Mar 20 - Mar 19 |
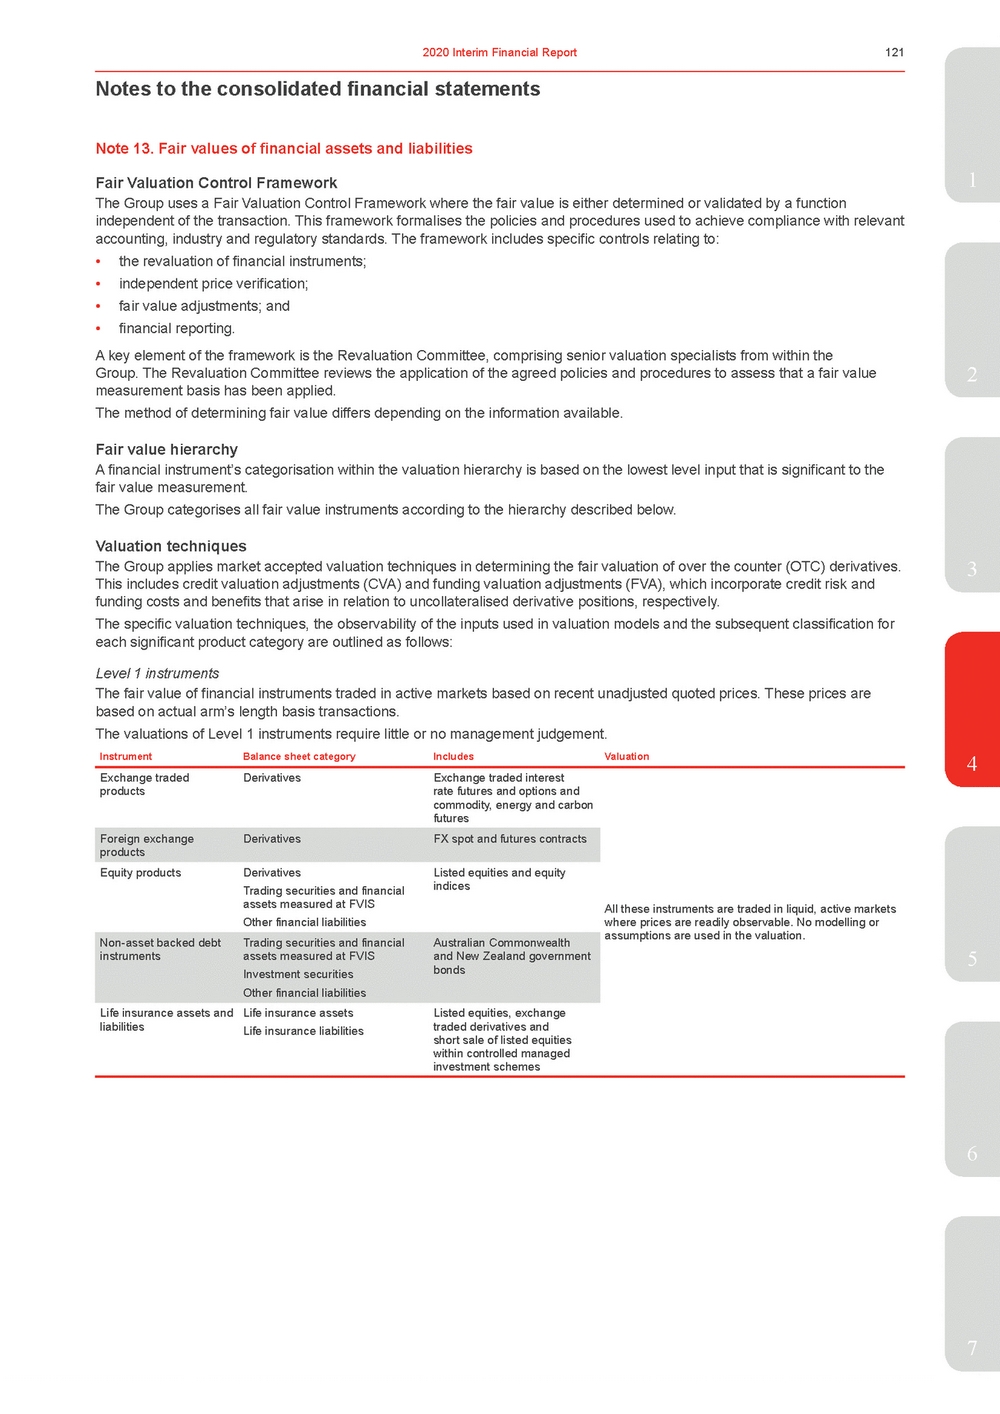 | Fair Valuation Control Framework1 The Group uses a Fair Valuation Control Framework where the fair value is either determined or validated by a function independent of the transaction. This framework formalises the policies and procedures used to achieve compliance with relevant accounting, industry and regulatory standards. The framework includes specific controls relating to: •the revaluation of financial instruments; •independent price verification; •fair value adjustments; and •financial reporting. A key element of the framework is the Revaluation Committee, comprising senior valuation specialists from within the Group. The Revaluation Committee reviews the application of the agreed policies and procedures to assess that a fair value2 measurement basis has been applied. The method of determining fair value differs depending on the information available. Fair value hierarchy A financial instrument’s categorisation within the valuation hierarchy is based on the lowest level input that is significant to the fair value measurement. The Group categorises all fair value instruments according to the hierarchy described below. Valuation techniques The Group applies market accepted valuation techniques in determining the fair valuation of over the counter (OTC) derivatives.3 This includes credit valuation adjustments (CVA) and funding valuation adjustments (FVA), which incorporate credit risk and funding costs and benefits that arise in relation to uncollateralised derivative positions, respectively. The specific valuation techniques, the observability of the inputs used in valuation models and the subsequent classification for each significant product category are outlined as follows: Level 1 instruments The fair value of financial instruments traded in active markets based on recent unadjusted quoted prices. These prices are based on actual arm’s length basis transactions. The valuations of Level 1 instruments require little or no management judgement. InstrumentBalance sheet categoryIncludesValuation4 Exchange traded products Foreign exchange products DerivativesExchange traded interest rate futures and options and commodity, energy and carbon futures DerivativesFX spot and futures contracts Equity productsDerivatives Trading securities and financial assets measured at FVIS Other financial liabilities Listed equities and equity indices All these instruments are traded in liquid, active markets where prices are readily observable. No modelling or Non-asset backed debt instruments Life insurance assets and liabilities Trading securities and financial assets measured at FVIS Investment securities Other financial liabilities Life insurance assets Life insurance liabilities Australian Commonwealth and New Zealand government bonds Listed equities, exchange traded derivatives and short sale of listed equities within controlled managed investment schemes assumptions are used in the valuation. 5 6 7 |
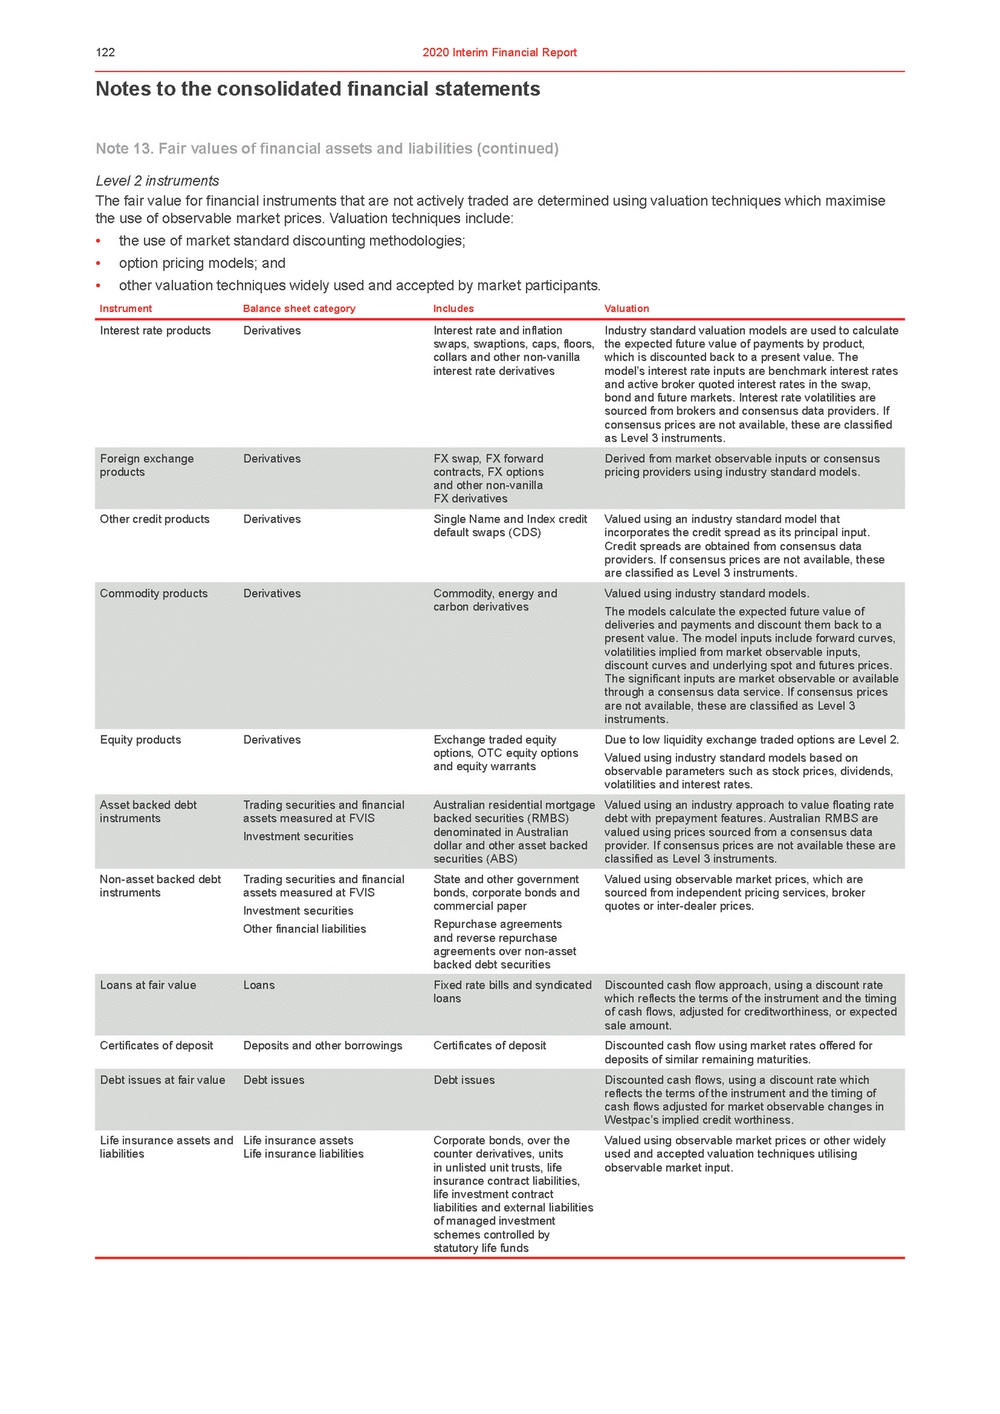 | Notes to the consolidated financial statements Note 13. Fair values of financial assets and liabilities (continued) Level 2 instruments The fair value for financial instruments that are not actively traded are determined using valuation techniques which maximise the use of observable market prices. Valuation techniques include: •the use of market standard discounting methodologies; •option pricing models; and •other valuation techniques widely used and accepted by market participants. InstrumentBalance sheet categoryIncludesValuation Interest rate productsDerivativesInterest rate and inflation swaps, swaptions, caps, floors, collars and other non-vanilla interest rate derivatives Industry standard valuation models are used to calculate the expected future value of payments by product, which is discounted back to a present value. The model’s interest rate inputs are benchmark interest rates and active broker quoted interest rates in the swap, bond and future markets. Interest rate volatilities are sourced from brokers and consensus data providers. If consensus prices are not available, these are classified as Level 3 instruments. Foreign exchange products DerivativesFX swap, FX forward contracts, FX options and other non-vanilla FX derivatives Derived from market observable inputs or consensus pricing providers using industry standard models. Other credit productsDerivativesSingle Name and Index credit default swaps (CDS) Commodity productsDerivativesCommodity, energy and carbon derivatives Equity productsDerivativesExchange traded equity options, OTC equity options and equity warrants Valued using an industry standard model that incorporates the credit spread as its principal input. Credit spreads are obtained from consensus data providers. If consensus prices are not available, these are classified as Level 3 instruments. Valued using industry standard models. The models calculate the expected future value of deliveries and payments and discount them back to a present value. The model inputs include forward curves, volatilities implied from market observable inputs, discount curves and underlying spot and futures prices. The significant inputs are market observable or available through a consensus data service. If consensus prices are not available, these are classified as Level 3 instruments. Due to low liquidity exchange traded options are Level 2. Valued using industry standard models based on observable parameters such as stock prices, dividends, volatilities and interest rates. Asset backed debt instruments Non-asset backed debt instruments Trading securities and financial assets measured at FVIS Investment securities Trading securities and financial assets measured at FVIS Investment securities Other financial liabilities Australian residential mortgage backed securities (RMBS) denominated in Australian dollar and other asset backed securities (ABS) State and other government bonds, corporate bonds and commercial paper Repurchase agreements and reverse repurchase agreements over non-asset backed debt securities Valued using an industry approach to value floating rate debt with prepayment features. Australian RMBS are valued using prices sourced from a consensus data provider. If consensus prices are not available these are classified as Level 3 instruments. Valued using observable market prices, which are sourced from independent pricing services, broker quotes or inter-dealer prices. Loans at fair valueLoansFixed rate bills and syndicated loans Discounted cash flow approach, using a discount rate which reflects the terms of the instrument and the timing of cash flows, adjusted for creditworthiness, or expected sale amount. Certificates of depositDeposits and other borrowingsCertificates of depositDiscounted cash flow using market rates offered for deposits of similar remaining maturities. Debt issues at fair valueDebt issuesDebt issuesDiscounted cash flows, using a discount rate which reflects the terms of the instrument and the timing of cash flows adjusted for market observable changes in Westpac’s implied credit worthiness. Life insurance assets and liabilities Life insurance assets Life insurance liabilities Corporate bonds, over the counter derivatives, units in unlisted unit trusts, life insurance contract liabilities, life investment contract liabilities and external liabilities of managed investment schemes controlled by statutory life funds Valued using observable market prices or other widely used and accepted valuation techniques utilising observable market input. |
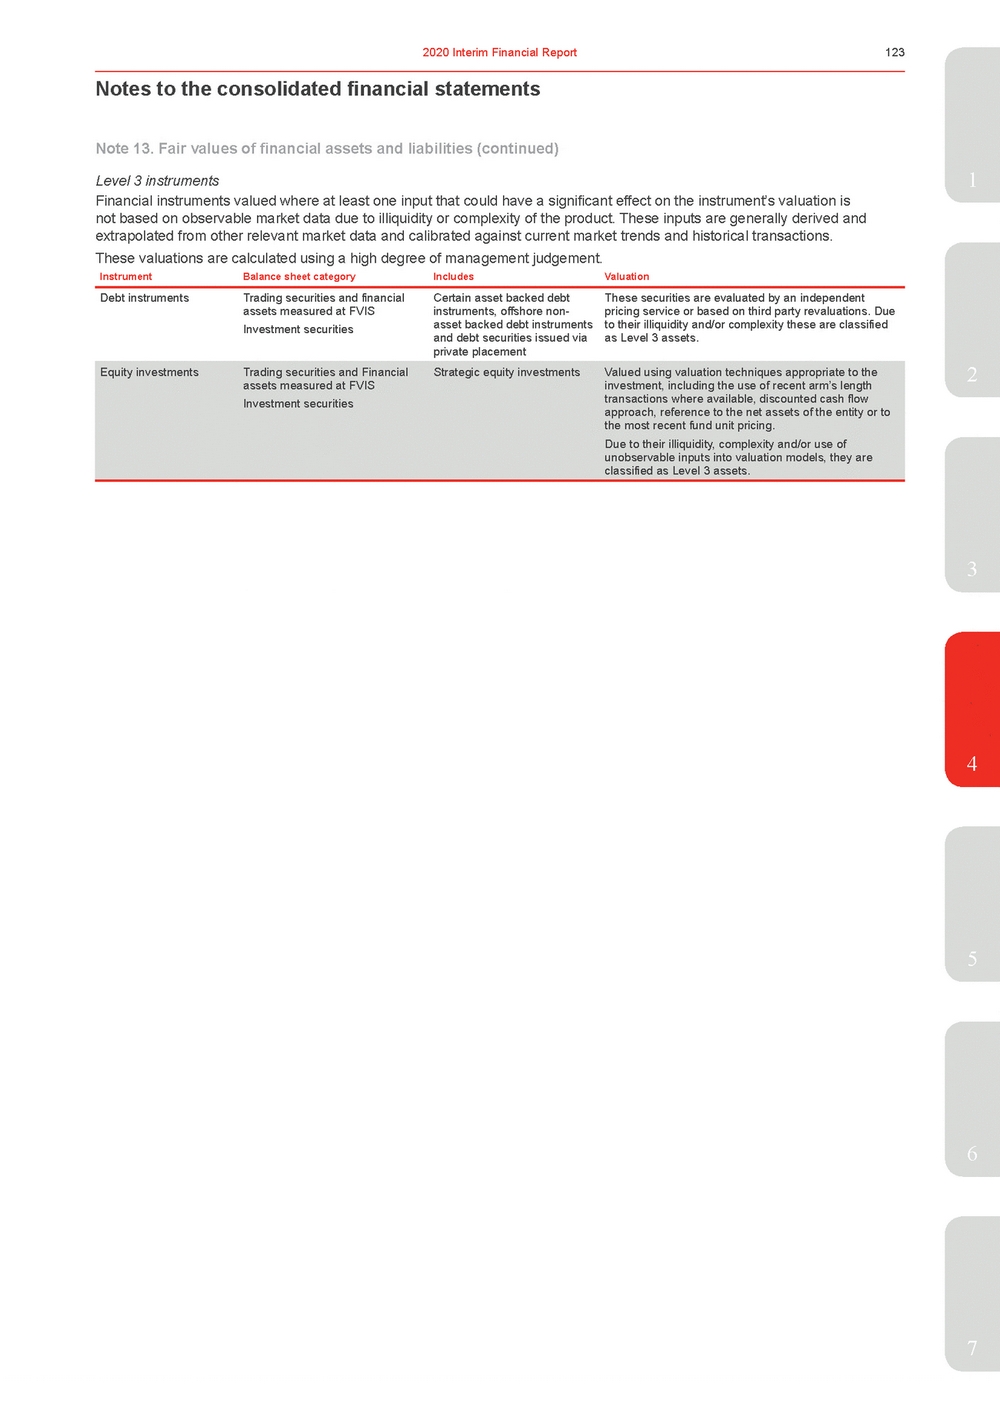 | Financial instruments valued where at least one input that could have a significant effect on the instrument’s valuation is not based on observable market data due to illiquidity or complexity of the product. These inputs are generally derived and extrapolated from other relevant market data and calibrated against current market trends and historical transactions. These valuations are calculated using a high degree of management judgement. InstrumentBalance sheet categoryIncludesValuation Debt instrumentsTrading securities and financial assets measured at FVIS Investment securities Certain asset backed debt instruments, offshore non-asset backed debt instruments and debt securities issued via private placement These securities are evaluated by an independent pricing service or based on third party revaluations. Due to their illiquidity and/or complexity these are classified as Level 3 assets. Equity investmentsTrading securities and Financial assets measured at FVIS Investment securities Strategic equity investmentsValued using valuation techniques appropriate to the investment, including the use of recent arm’s length transactions where available, discounted cash flow approach, reference to the net assets of the entity or to the most recent fund unit pricing. 2 3 4 5 6 7 |
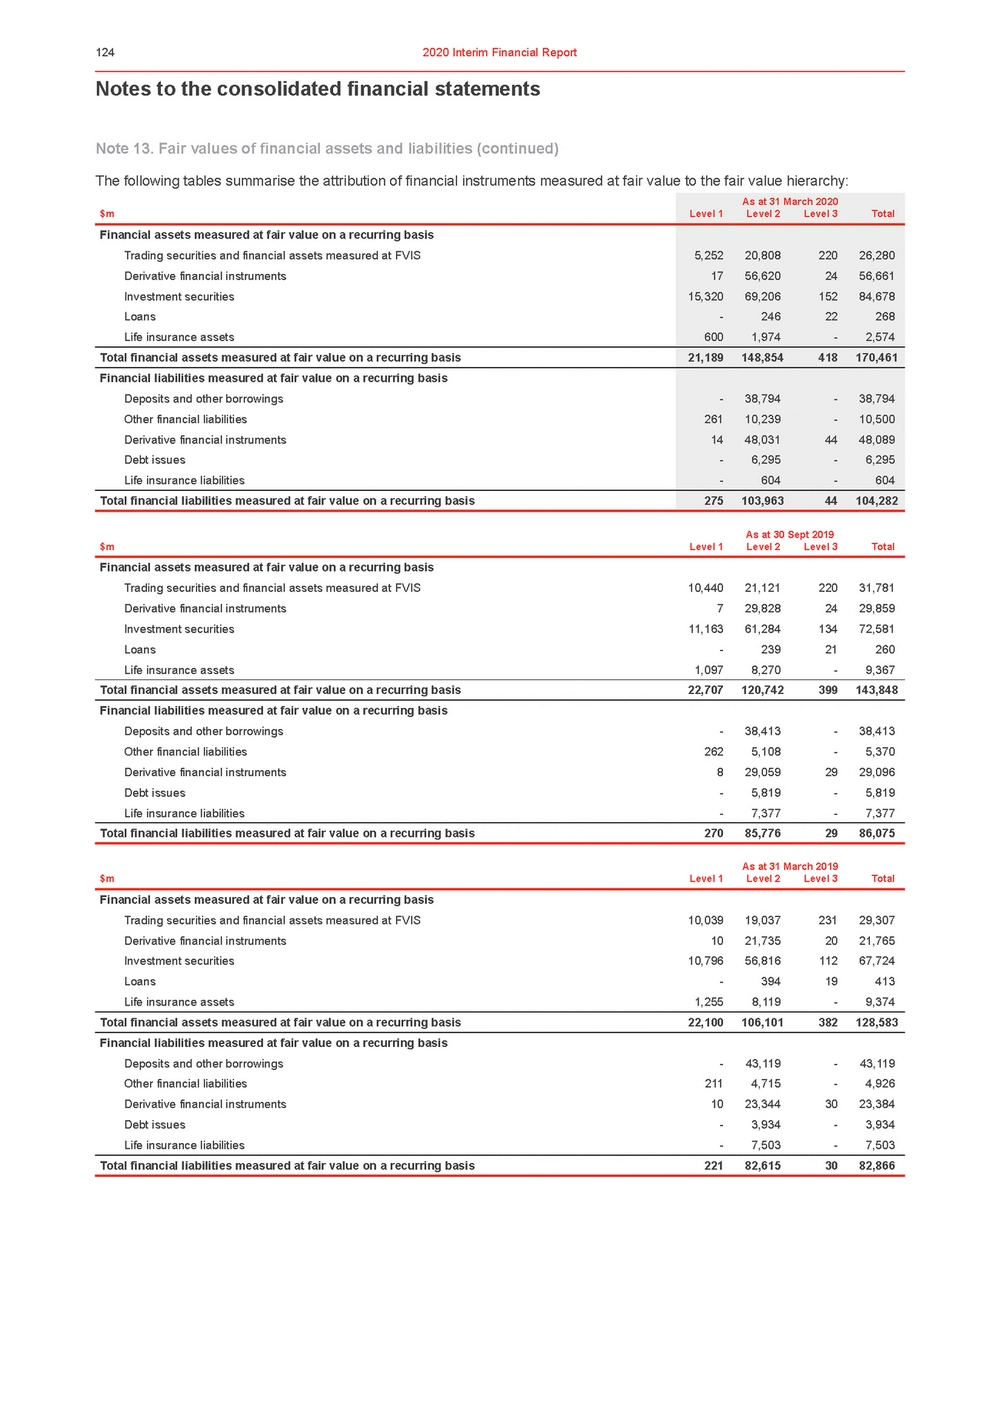 | Notes to the consolidated financial statements Note 13. Fair values of financial assets and liabilities (continued) The following tables summarise the attribution of financial instruments measured at fair value to the fair value hierarchy: $mLevel 1 Level 2Level 3Total Financial assets measured at fair value on a recurring basis Trading securities and financial assets measured at FVIS5,252 Derivative financial instruments17 Investment securities15,320 Loans-Life insurance assets600 20,80822026,280 56,6202456,661 69,20615284,678 24622268 1,974-2,574 Total financial assets measured at fair value on a recurring basis21,189 148,854418170,461 Financial liabilities measured at fair value on a recurring basis Deposits and other borrowings-Other financial liabilities261 Derivative financial instruments14 Debt issues-Life insurance liabilities-38,794-38,794 10,239-10,500 48,0314448,089 6,295-6,295 604-604 Total financial liabilities measured at fair value on a recurring basis275 103,96344104,282 As at 30 Sept 2019 |
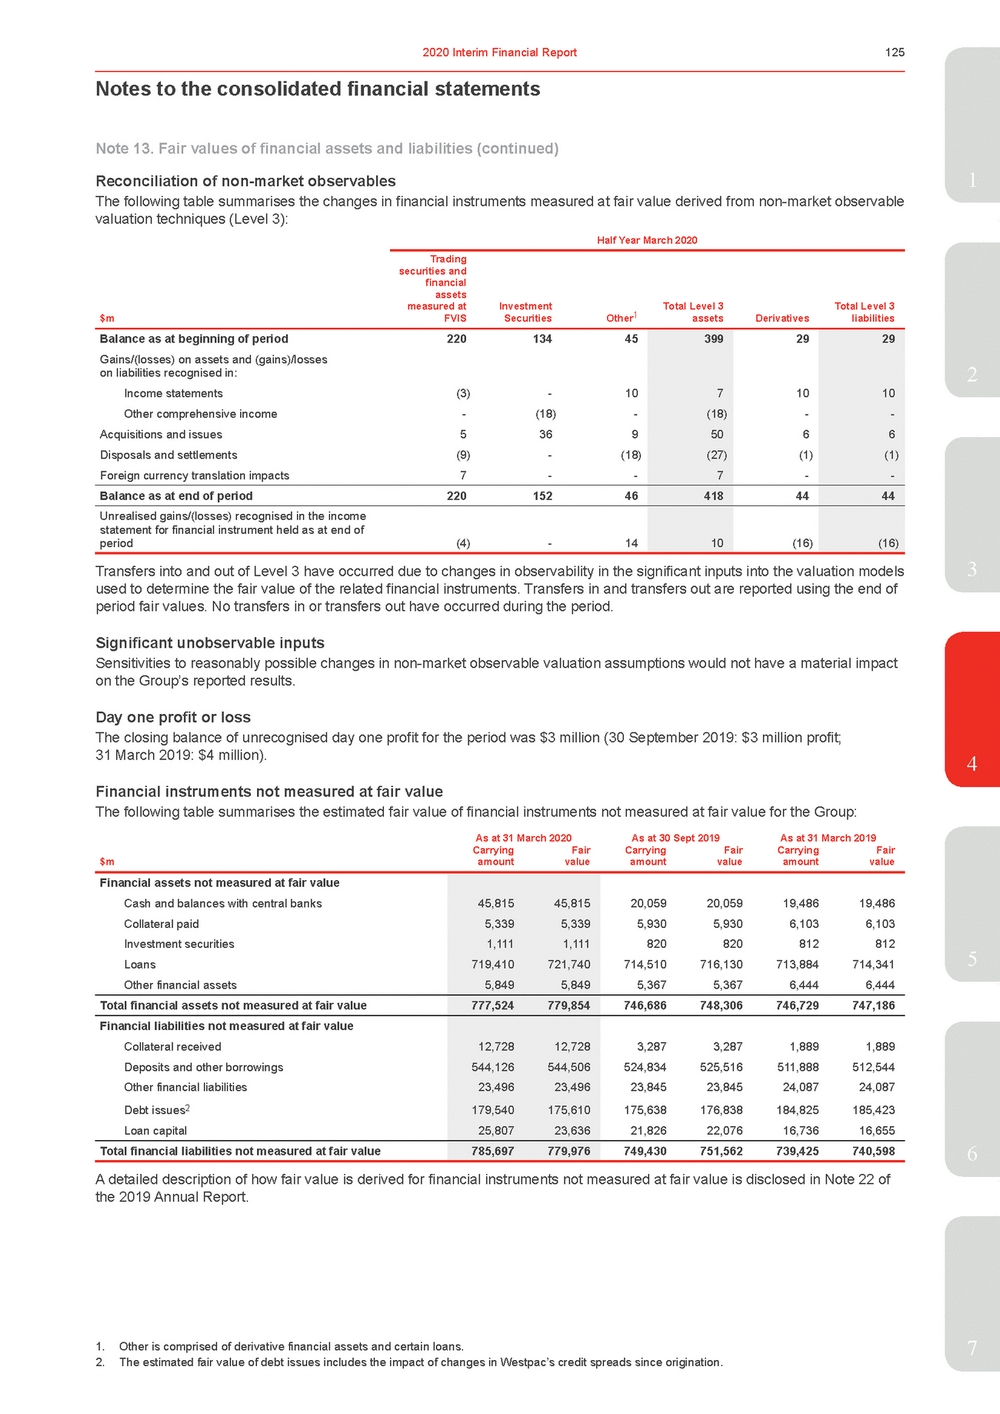 | The following table summarises the changes in financial instruments measured at fair value derived from non-market observable valuation techniques (Level 3): Trading securities and financial assets measured at Investment Half Year March 2020 Total Level 3 Total Level 3 $mFVIS SecuritiesOther1 assetsDerivatives liabilities Balance as at beginning of period22013445 Gains/(losses) on assets and (gains)/losses on liabilities recognised in: Income statements(3)-10 Other comprehensive income -(18)-Acquisitions and issues5 36 9 Disposals and settlements(9)-(18) Foreign currency translation impacts7--399 7 (18) 50 (27) 7 29 10 - 6 (1) - 29 10 - 6 (1) - Balance as at end of period22015246 418 44 44 Unrealised gains/(losses) recognised in the income statement for financial instrument held as at end of period(4)-14 10 (16) (16) Transfers into and out of Level 3 have occurred due to changes in observability in the significant inputs into the valuation models3 used to determine the fair value of the related financial instruments. Transfers in and transfers out are reported using the end of period fair values. No transfers in or transfers out have occurred during the period. Significant unobservable inputs Sensitivities to reasonably possible changes in non-market observable valuation assumptions would not have a material impact on the Group’s reported results. Day one profit or loss The closing balance of unrecognised day one profit for the period was $3 million (30 September 2019: $3 million profit; 31 March 2019: $4 million).4 Financial instruments not measured at fair value The following table summarises the estimated fair value of financial instruments not measured at fair value for the Group: As at 31 March 2020As at 30 Sept 2019As at 31 March 2019 Carrying $mamount Fair value Carrying amount Fair value Carrying amount Fair value Financial assets not measured at fair value Cash and balances with central banks Collateral paid Investment securities Loans Other financial assets 45,81545,815 5,3395,339 1,1111,111 719,410721,740 5,8495,849 20,05920,05919,48619,486 5,9305,9306,1036,103 820820812812 714,510716,130713,884714,341 5,3675,3676,4446,444 Total financial assets not measured at fair value 777,524779,854 746,686748,306746,729747,186 Financial liabilities not measured at fair value Collateral received Deposits and other borrowings Other financial liabilities Debt issues2 Loan capital 12,72812,728 544,126544,506 23,49623,496 179,540175,610 25,80723,636 3,2873,2871,8891,889 524,834525,516511,888512,544 23,84523,84524,08724,087 175,638176,838184,825185,423 21,82622,07616,73616,655 Total financial liabilities not measured at fair value 785,697779,976 749,430751,562739,425740,598 6 A detailed description of how fair value is derived for financial instruments not measured at fair value is disclosed in Note 22 of the 2019 Annual Report. 1. Other is comprised of derivative financial assets and certain loans.7 2. The estimated fair value of debt issues includes the impact of changes in Westpac’s credit spreads since origination. |
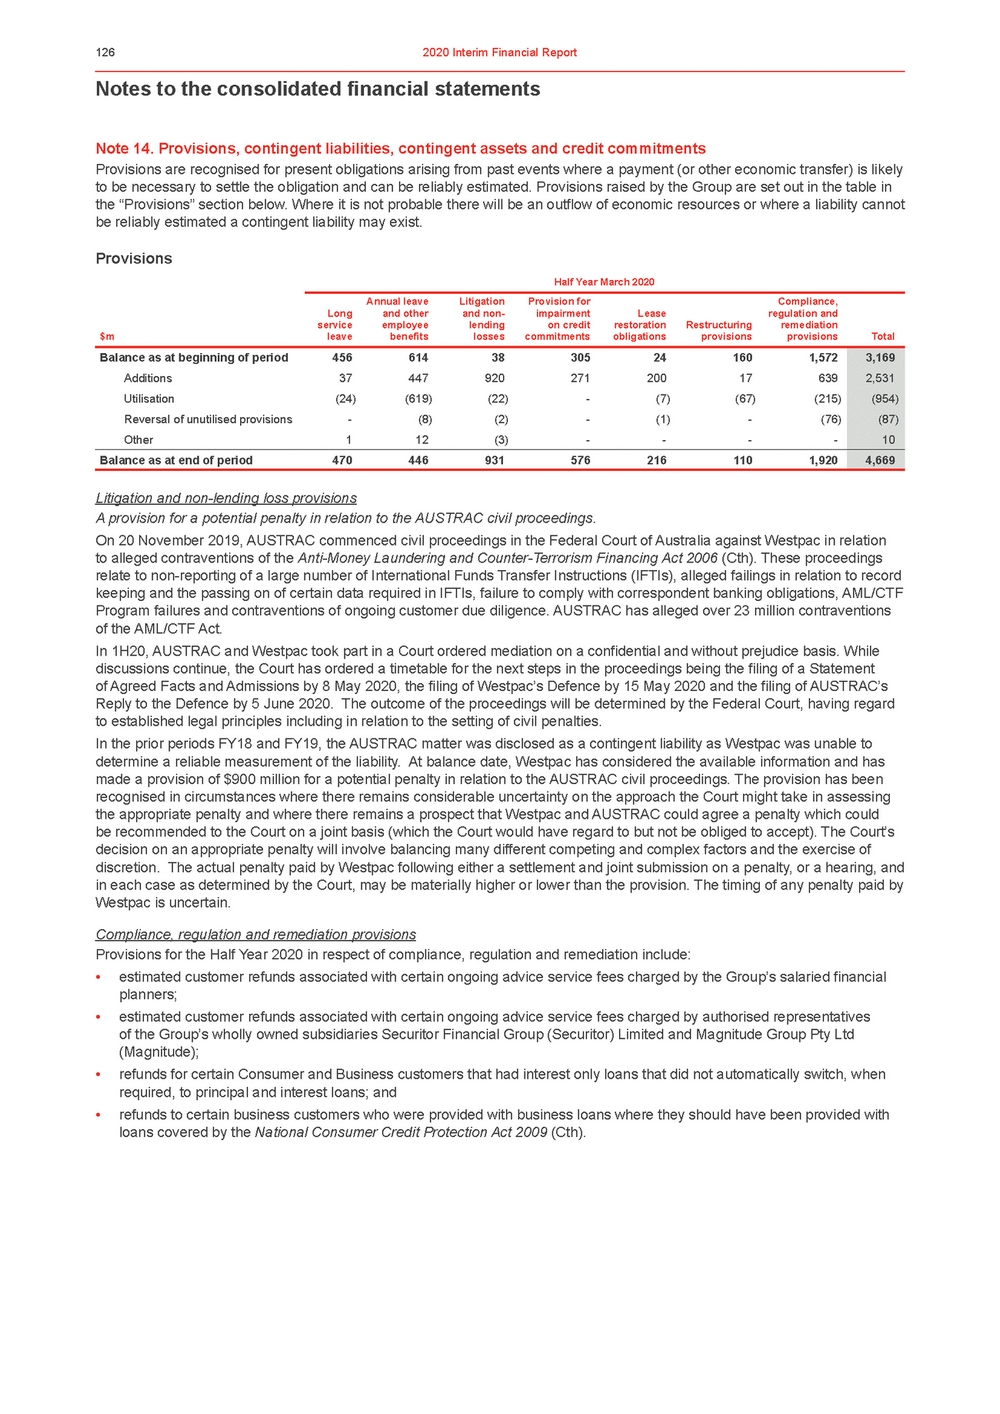 | Notes to the consolidated financial statements Note 14. Provisions, contingent liabilities, contingent assets and credit commitments Provisions are recognised for present obligations arising from past events where a payment (or other economic transfer) is likely to be necessary to settle the obligation and can be reliably estimated. Provisions raised by the Group are set out in the table in the “Provisions” section below. Where it is not probable there will be an outflow of economic resources or where a liability cannot be reliably estimated a contingent liability may exist. Provisions Half Year March 2020 Annual leave Litigation Provision for Compliance, Long and other and non-impairment Lease regulation and service employee lending on credit restoration Restructuring remediation leave benefits losses commitments obligations provisions provisions Total Litigation and non-lending loss provisions A provision for a potential penalty in relation to the AUSTRAC civil proceedings. On 20 November 2019, AUSTRAC commenced civil proceedings in the Federal Court of Australia against Westpac in relation to alleged contraventions of the Anti-Money Laundering and Counter-Terrorism Financing Act 2006 (Cth). These proceedings relate to non-reporting of a large number of International Funds Transfer Instructions (IFTIs), alleged failings in relation to record keeping and the passing on of certain data required in IFTIs, failure to comply with correspondent banking obligations, AML/CTF Program failures and contraventions of ongoing customer due diligence. AUSTRAC has alleged over 23 million contraventions of the AML/CTF Act. In 1H20, AUSTRAC and Westpac took part in a Court ordered mediation on a confidential and without prejudice basis. While discussions continue, the Court has ordered a timetable for the next steps in the proceedings being the filing of a Statement of Agreed Facts and Admissions by 8 May 2020, the filing of Westpac’s Defence by 15 May 2020 and the filing of AUSTRAC’s Reply to the Defence by 5 June 2020. The outcome of the proceedings will be determined by the Federal Court, having regard to established legal principles including in relation to the setting of civil penalties. In the prior periods FY18 and FY19, the AUSTRAC matter was disclosed as a contingent liability as Westpac was unable to determine a reliable measurement of the liability. At balance date, Westpac has considered the available information and has made a provision of $900 million for a potential penalty in relation to the AUSTRAC civil proceedings. The provision has been recognised in circumstances where there remains considerable uncertainty on the approach the Court might take in assessing the appropriate penalty and where there remains a prospect that Westpac and AUSTRAC could agree a penalty which could be recommended to the Court on a joint basis (which the Court would have regard to but not be obliged to accept). The Court’s decision on an appropriate penalty will involve balancing many different competing and complex factors and the exercise of discretion. The actual penalty paid by Westpac following either a settlement and joint submission on a penalty, or a hearing, and in each case as determined by the Court, may be materially higher or lower than the provision. The timing of any penalty paid by Westpac is uncertain. Compliance, regulation and remediation provisions Provisions for the Half Year 2020 in respect of compliance, regulation and remediation include: •estimated customer refunds associated with certain ongoing advice service fees charged by the Group’s salaried financial planners; •estimated customer refunds associated with certain ongoing advice service fees charged by authorised representatives of the Group’s wholly owned subsidiaries Securitor Financial Group (Securitor) Limited and Magnitude Group Pty Ltd (Magnitude); •refunds for certain Consumer and Business customers that had interest only loans that did not automatically switch, when required, to principal and interest loans; and •refunds to certain business customers who were provided with business loans where they should have been provided with loans covered by the National Consumer Credit Protection Act 2009 (Cth). |
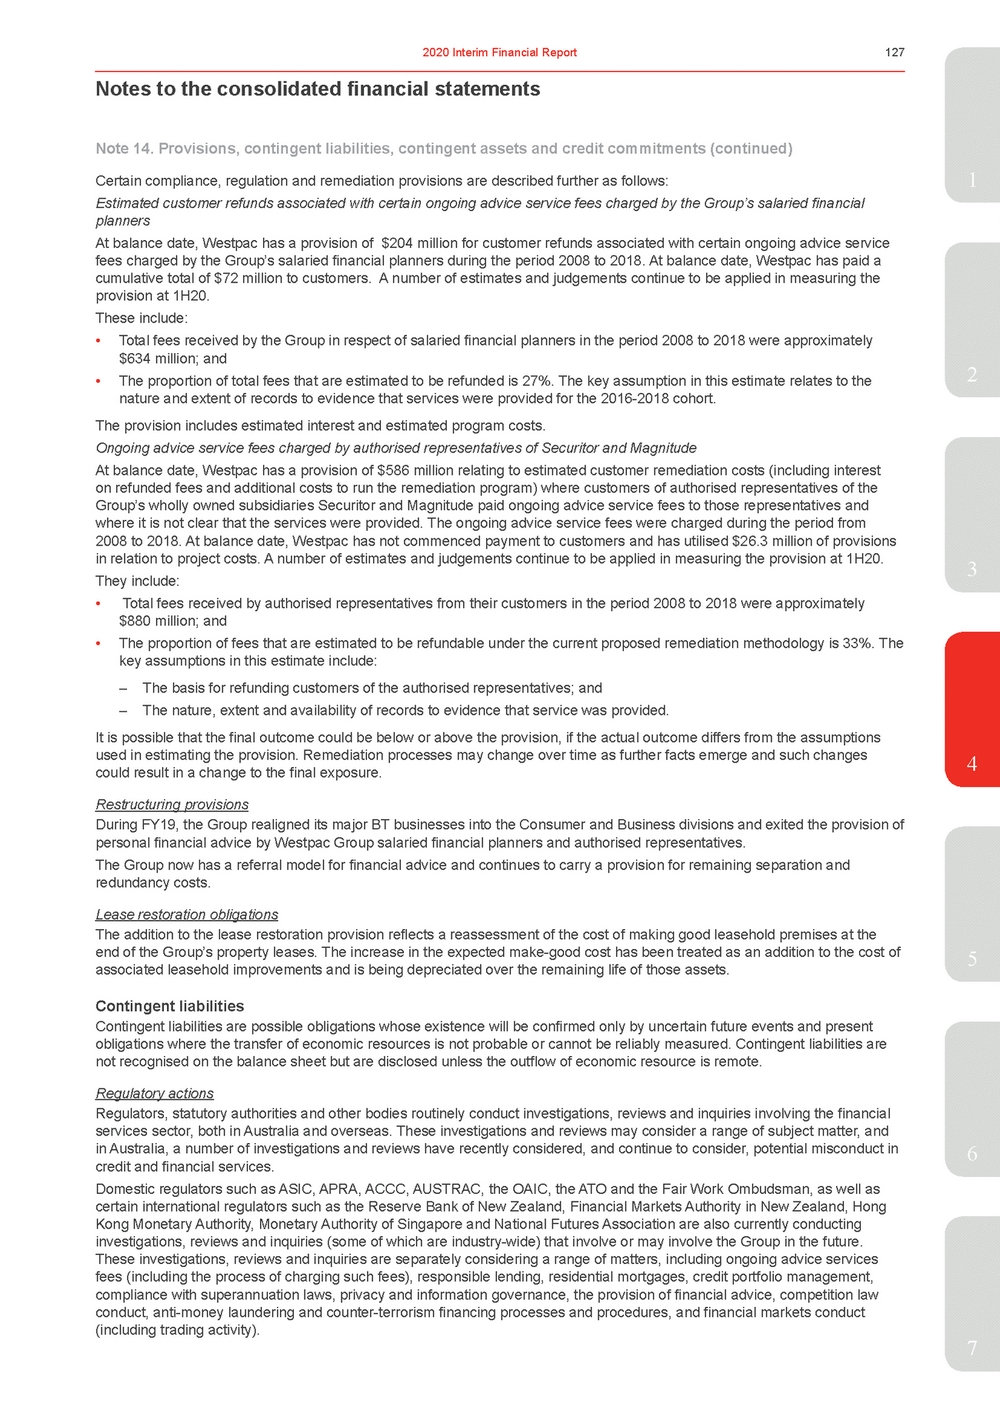 | Estimated customer refunds associated with certain ongoing advice service fees charged by the Group’s salaried financial planners At balance date, Westpac has a provision of $204 million for customer refunds associated with certain ongoing advice service fees charged by the Group’s salaried financial planners during the period 2008 to 2018. At balance date, Westpac has paid a cumulative total of $72 million to customers. A number of estimates and judgements continue to be applied in measuring the provision at 1H20. These include: •Total fees received by the Group in respect of salaried financial planners in the period 2008 to 2018 were approximately $634 million; and •The proportion of total fees that are estimated to be refunded is 27%. The key assumption in this estimate relates to the2 nature and extent of records to evidence that services were provided for the 2016-2018 cohort. The provision includes estimated interest and estimated program costs. Ongoing advice service fees charged by authorised representatives of Securitor and Magnitude At balance date, Westpac has a provision of $586 million relating to estimated customer remediation costs (including interest on refunded fees and additional costs to run the remediation program) where customers of authorised representatives of the Group’s wholly owned subsidiaries Securitor and Magnitude paid ongoing advice service fees to those representatives and where it is not clear that the services were provided. The ongoing advice service fees were charged during the period from 2008 to 2018. At balance date, Westpac has not commenced payment to customers and has utilised $26.3 million of provisions in relation to project costs. A number of estimates and judgements continue to be applied in measuring the provision at 1H20.3 They include: •Total fees received by authorised representatives from their customers in the period 2008 to 2018 were approximately $880 million; and •The proportion of fees that are estimated to be refundable under the current proposed remediation methodology is 33%. The key assumptions in this estimate include: – The basis for refunding customers of the authorised representatives; and – The nature, extent and availability of records to evidence that service was provided. 4 Restructuring provisions During FY19, the Group realigned its major BT businesses into the Consumer and Business divisions and exited the provision of personal financial advice by Westpac Group salaried financial planners and authorised representatives. The Group now has a referral model for financial advice and continues to carry a provision for remaining separation and redundancy costs. Lease restoration obligations The addition to the lease restoration provision reflects a reassessment of the cost of making good leasehold premises at the end of the Group’s property leases. The increase in the expected make-good cost has been treated as an addition to the cost of5 associated leasehold improvements and is being depreciated over the remaining life of those assets. Contingent liabilities Contingent liabilities are possible obligations whose existence will be confirmed only by uncertain future events and present obligations where the transfer of economic resources is not probable or cannot be reliably measured. Contingent liabilities are not recognised on the balance sheet but are disclosed unless the outflow of economic resource is remote. Regulatory actions Regulators, statutory authorities and other bodies routinely conduct investigations, reviews and inquiries involving the financial services sector, both in Australia and overseas. These investigations and reviews may consider a range of subject matter, and in Australia, a number of investigations and reviews have recently considered, and continue to consider, potential misconduct in6 credit and financial services. Domestic regulators such as ASIC, APRA, ACCC, AUSTRAC, the OAIC, the ATO and the Fair Work Ombudsman, as well as certain international regulators such as the Reserve Bank of New Zealand, Financial Markets Authority in New Zealand, Hong Kong Monetary Authority, Monetary Authority of Singapore and National Futures Association are also currently conducting investigations, reviews and inquiries (some of which are industry-wide) that involve or may involve the Group in the future. These investigations, reviews and inquiries are separately considering a range of matters, including ongoing advice services fees (including the process of charging such fees), responsible lending, residential mortgages, credit portfolio management, compliance with superannuation laws, privacy and information governance, the provision of financial advice, competition law conduct, anti-money laundering and counter-terrorism financing processes and procedures, and financial markets conduct (including trading activity). 7 |
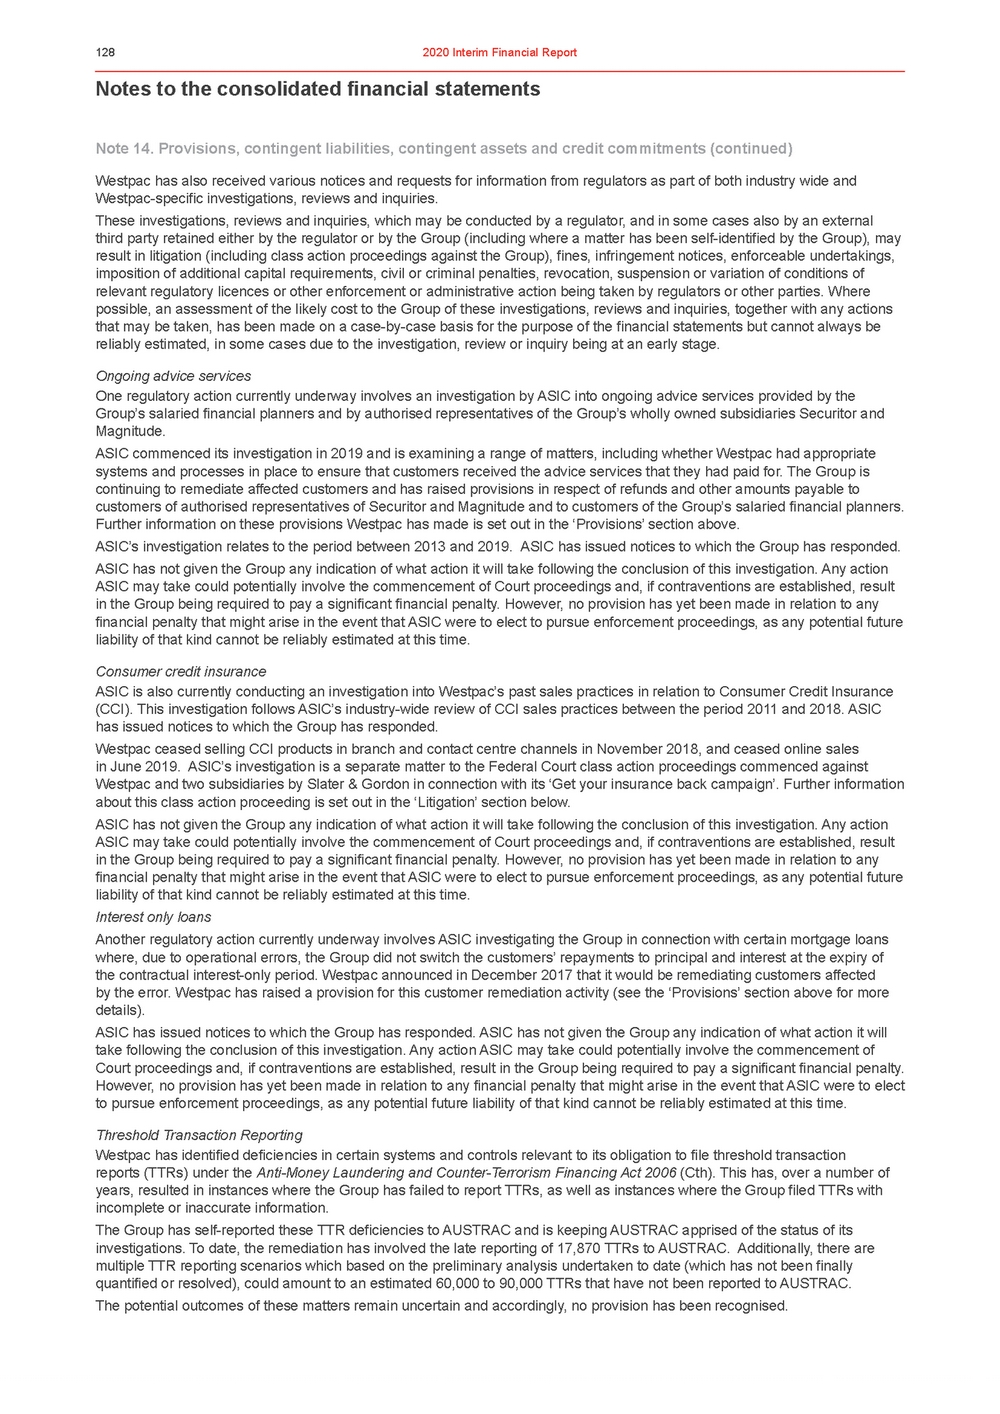 | Notes to the consolidated financial statements Note 14. Provisions, contingent liabilities, contingent assets and credit commitments (continued) Westpac has also received various notices and requests for information from regulators as part of both industry wide and Westpac-specific investigations, reviews and inquiries. These investigations, reviews and inquiries, which may be conducted by a regulator, and in some cases also by an external third party retained either by the regulator or by the Group (including where a matter has been self-identified by the Group), may result in litigation (including class action proceedings against the Group), fines, infringement notices, enforceable undertakings, imposition of additional capital requirements, civil or criminal penalties, revocation, suspension or variation of conditions of relevant regulatory licences or other enforcement or administrative action being taken by regulators or other parties. Where possible, an assessment of the likely cost to the Group of these investigations, reviews and inquiries, together with any actions that may be taken, has been made on a case-by-case basis for the purpose of the financial statements but cannot always be reliably estimated, in some cases due to the investigation, review or inquiry being at an early stage. Ongoing advice services One regulatory action currently underway involves an investigation by ASIC into ongoing advice services provided by the Group’s salaried financial planners and by authorised representatives of the Group’s wholly owned subsidiaries Securitor and Magnitude. ASIC commenced its investigation in 2019 and is examining a range of matters, including whether Westpac had appropriate systems and processes in place to ensure that customers received the advice services that they had paid for. The Group is continuing to remediate affected customers and has raised provisions in respect of refunds and other amounts payable to customers of authorised representatives of Securitor and Magnitude and to customers of the Group’s salaried financial planners. Further information on these provisions Westpac has made is set out in the ‘Provisions’ section above. ASIC’s investigation relates to the period between 2013 and 2019. ASIC has issued notices to which the Group has responded. ASIC has not given the Group any indication of what action it will take following the conclusion of this investigation. Any action ASIC may take could potentially involve the commencement of Court proceedings and, if contraventions are established, result in the Group being required to pay a significant financial penalty. However, no provision has yet been made in relation to any financial penalty that might arise in the event that ASIC were to elect to pursue enforcement proceedings, as any potential future liability of that kind cannot be reliably estimated at this time. Consumer credit insurance ASIC is also currently conducting an investigation into Westpac’s past sales practices in relation to Consumer Credit Insurance (CCI). This investigation follows ASIC’s industry-wide review of CCI sales practices between the period 2011 and 2018. ASIC has issued notices to which the Group has responded. Westpac ceased selling CCI products in branch and contact centre channels in November 2018, and ceased online sales in June 2019. ASIC’s investigation is a separate matter to the Federal Court class action proceedings commenced against Westpac and two subsidiaries by Slater & Gordon in connection with its ‘Get your insurance back campaign’. Further information about this class action proceeding is set out in the ‘Litigation’ section below. ASIC has not given the Group any indication of what action it will take following the conclusion of this investigation. Any action ASIC may take could potentially involve the commencement of Court proceedings and, if contraventions are established, result in the Group being required to pay a significant financial penalty. However, no provision has yet been made in relation to any financial penalty that might arise in the event that ASIC were to elect to pursue enforcement proceedings, as any potential future liability of that kind cannot be reliably estimated at this time. Interest only loans Another regulatory action currently underway involves ASIC investigating the Group in connection with certain mortgage loans where, due to operational errors, the Group did not switch the customers’ repayments to principal and interest at the expiry of the contractual interest-only period. Westpac announced in December 2017 that it would be remediating customers affected by the error. Westpac has raised a provision for this customer remediation activity (see the ‘Provisions’ section above for more details). ASIC has issued notices to which the Group has responded. ASIC has not given the Group any indication of what action it will take following the conclusion of this investigation. Any action ASIC may take could potentially involve the commencement of Court proceedings and, if contraventions are established, result in the Group being required to pay a significant financial penalty. However, no provision has yet been made in relation to any financial penalty that might arise in the event that ASIC were to elect to pursue enforcement proceedings, as any potential future liability of that kind cannot be reliably estimated at this time. Threshold Transaction Reporting Westpac has identified deficiencies in certain systems and controls relevant to its obligation to file threshold transaction reports (TTRs) under the Anti-Money Laundering and Counter-Terrorism Financing Act 2006 (Cth). This has, over a number of years, resulted in instances where the Group has failed to report TTRs, as well as instances where the Group filed TTRs with incomplete or inaccurate information. The Group has self-reported these TTR deficiencies to AUSTRAC and is keeping AUSTRAC apprised of the status of its investigations. To date, the remediation has involved the late reporting of 17,870 TTRs to AUSTRAC. Additionally, there are multiple TTR reporting scenarios which based on the preliminary analysis undertaken to date (which has not been finally quantified or resolved), could amount to an estimated 60,000 to 90,000 TTRs that have not been reported to AUSTRAC. The potential outcomes of these matters remain uncertain and accordingly, no provision has been recognised. |
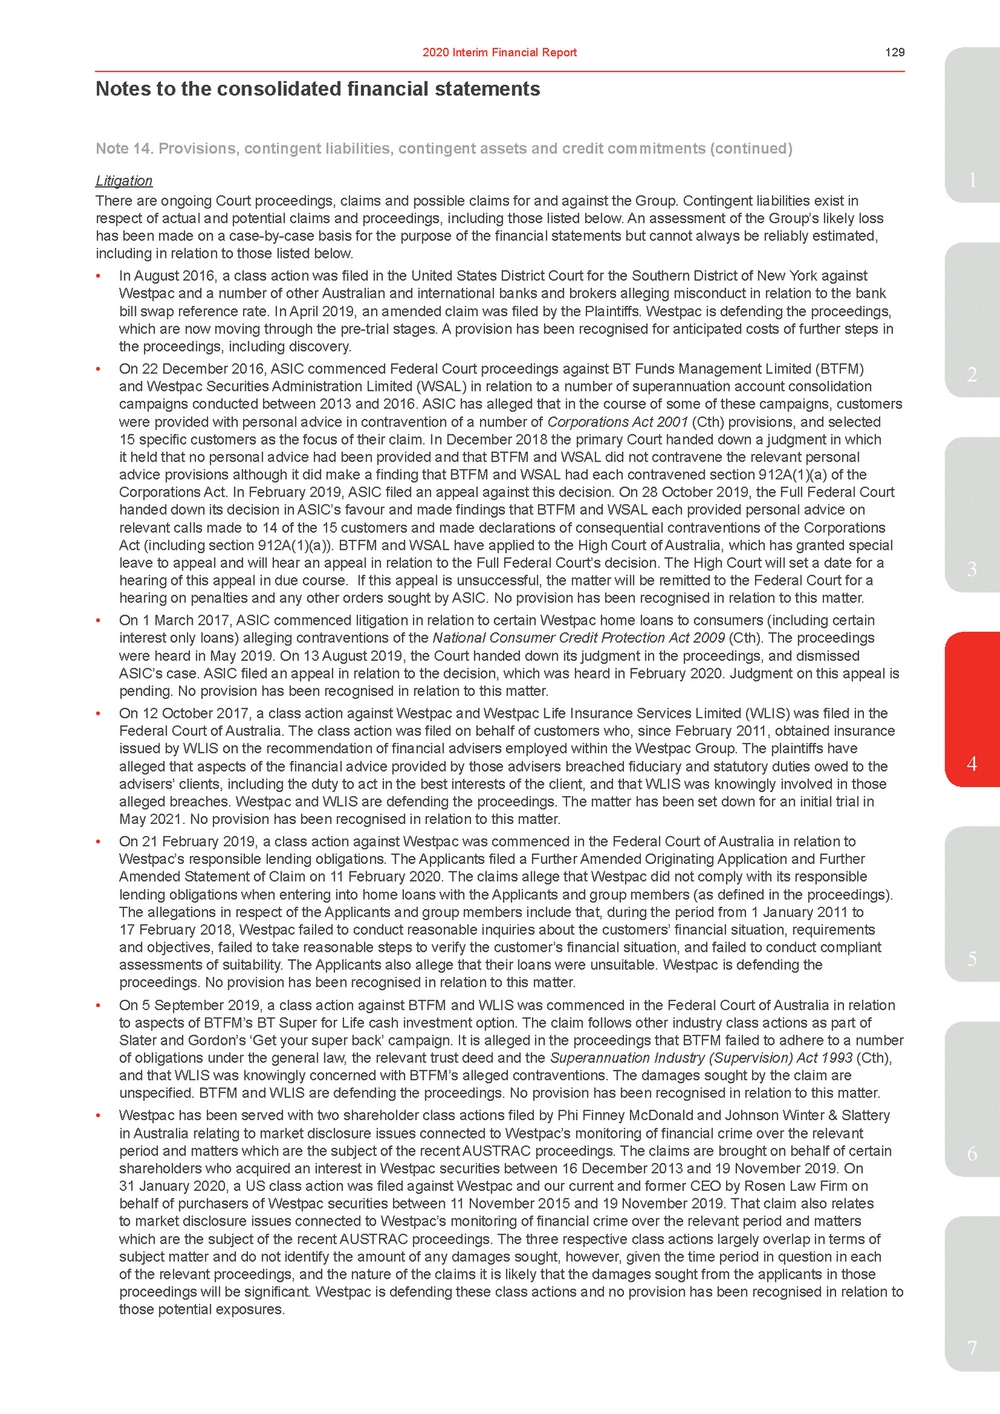 | There are ongoing Court proceedings, claims and possible claims for and against the Group. Contingent liabilities exist in respect of actual and potential claims and proceedings, including those listed below. An assessment of the Group’s likely loss has been made on a case-by-case basis for the purpose of the financial statements but cannot always be reliably estimated, including in relation to those listed below. •In August 2016, a class action was filed in the United States District Court for the Southern District of New York against Westpac and a number of other Australian and international banks and brokers alleging misconduct in relation to the bank bill swap reference rate. In April 2019, an amended claim was filed by the Plaintiffs. Westpac is defending the proceedings, which are now moving through the pre-trial stages. A provision has been recognised for anticipated costs of further steps in the proceedings, including discovery. •On 22 December 2016, ASIC commenced Federal Court proceedings against BT Funds Management Limited (BTFM)2 and Westpac Securities Administration Limited (WSAL) in relation to a number of superannuation account consolidation campaigns conducted between 2013 and 2016. ASIC has alleged that in the course of some of these campaigns, customers were provided with personal advice in contravention of a number of Corporations Act 2001 (Cth) provisions, and selected 15 specific customers as the focus of their claim. In December 2018 the primary Court handed down a judgment in which it held that no personal advice had been provided and that BTFM and WSAL did not contravene the relevant personal advice provisions although it did make a finding that BTFM and WSAL had each contravened section 912A(1)(a) of the Corporations Act. In February 2019, ASIC filed an appeal against this decision. On 28 October 2019, the Full Federal Court handed down its decision in ASIC’s favour and made findings that BTFM and WSAL each provided personal advice on relevant calls made to 14 of the 15 customers and made declarations of consequential contraventions of the Corporations Act (including section 912A(1)(a)). BTFM and WSAL have applied to the High Court of Australia, which has granted special leave to appeal and will hear an appeal in relation to the Full Federal Court’s decision. The High Court will set a date for a3 hearing of this appeal in due course. If this appeal is unsuccessful, the matter will be remitted to the Federal Court for a hearing on penalties and any other orders sought by ASIC. No provision has been recognised in relation to this matter. •On 1 March 2017, ASIC commenced litigation in relation to certain Westpac home loans to consumers (including certain interest only loans) alleging contraventions of the National Consumer Credit Protection Act 2009 (Cth). The proceedings were heard in May 2019. On 13 August 2019, the Court handed down its judgment in the proceedings, and dismissed ASIC’s case. ASIC filed an appeal in relation to the decision, which was heard in February 2020. Judgment on this appeal is pending. No provision has been recognised in relation to this matter. •On 12 October 2017, a class action against Westpac and Westpac Life Insurance Services Limited (WLIS) was filed in the Federal Court of Australia. The class action was filed on behalf of customers who, since February 2011, obtained insurance issued by WLIS on the recommendation of financial advisers employed within the Westpac Group. The plaintiffs have alleged that aspects of the financial advice provided by those advisers breached fiduciary and statutory duties owed to the4 advisers’ clients, including the duty to act in the best interests of the client, and that WLIS was knowingly involved in those alleged breaches. Westpac and WLIS are defending the proceedings. The matter has been set down for an initial trial in May 2021. No provision has been recognised in relation to this matter. •On 21 February 2019, a class action against Westpac was commenced in the Federal Court of Australia in relation to Westpac’s responsible lending obligations. The Applicants filed a Further Amended Originating Application and Further Amended Statement of Claim on 11 February 2020. The claims allege that Westpac did not comply with its responsible lending obligations when entering into home loans with the Applicants and group members (as defined in the proceedings). The allegations in respect of the Applicants and group members include that, during the period from 1 January 2011 to 17 February 2018, Westpac failed to conduct reasonable inquiries about the customers’ financial situation, requirements and objectives, failed to take reasonable steps to verify the customer’s financial situation, and failed to conduct compliant assessments of suitability. The Applicants also allege that their loans were unsuitable. Westpac is defending the5 proceedings. No provision has been recognised in relation to this matter. •On 5 September 2019, a class action against BTFM and WLIS was commenced in the Federal Court of Australia in relation to aspects of BTFM’s BT Super for Life cash investment option. The claim follows other industry class actions as part of Slater and Gordon’s ‘Get your super back’ campaign. It is alleged in the proceedings that BTFM failed to adhere to a number of obligations under the general law, the relevant trust deed and the Superannuation Industry (Supervision) Act 1993 (Cth), and that WLIS was knowingly concerned with BTFM’s alleged contraventions. The damages sought by the claim are unspecified. BTFM and WLIS are defending the proceedings. No provision has been recognised in relation to this matter. •Westpac has been served with two shareholder class actions filed by Phi Finney McDonald and Johnson Winter & Slattery in Australia relating to market disclosure issues connected to Westpac’s monitoring of financial crime over the relevant period and matters which are the subject of the recent AUSTRAC proceedings. The claims are brought on behalf of certain6 shareholders who acquired an interest in Westpac securities between 16 December 2013 and 19 November 2019. On 31 January 2020, a US class action was filed against Westpac and our current and former CEO by Rosen Law Firm on behalf of purchasers of Westpac securities between 11 November 2015 and 19 November 2019. That claim also relates to market disclosure issues connected to Westpac’s monitoring of financial crime over the relevant period and matters which are the subject of the recent AUSTRAC proceedings. The three respective class actions largely overlap in terms of subject matter and do not identify the amount of any damages sought, however, given the time period in question in each of the relevant proceedings, and the nature of the claims it is likely that the damages sought from the applicants in those proceedings will be significant. Westpac is defending these class actions and no provision has been recognised in relation to those potential exposures. 7 |
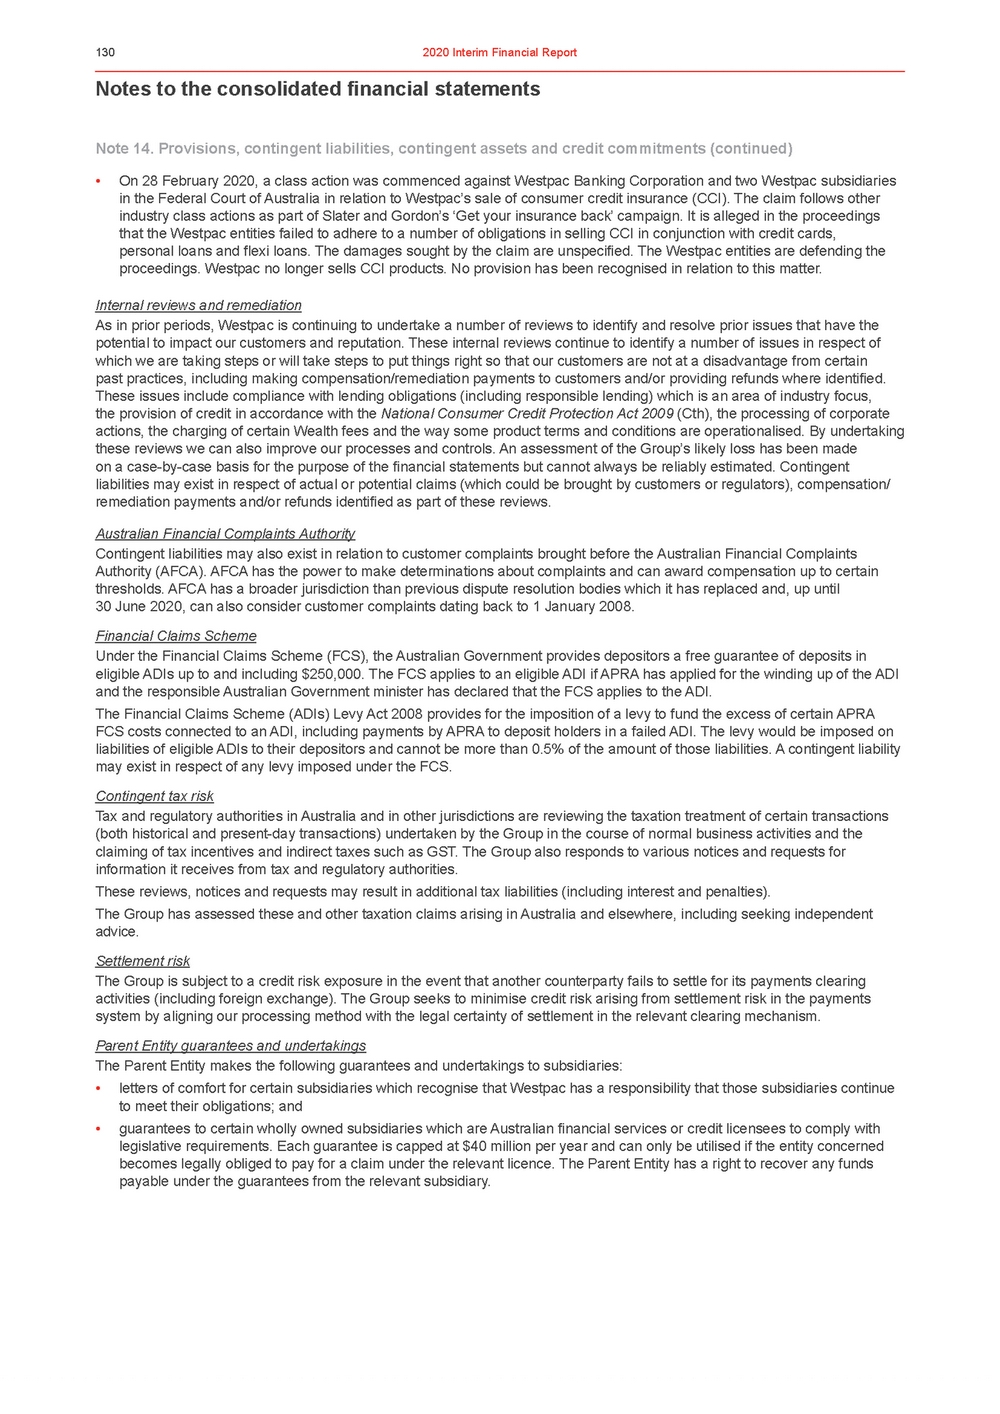 | Notes to the consolidated financial statements Note 14. Provisions, contingent liabilities, contingent assets and credit commitments (continued) •On 28 February 2020, a class action was commenced against Westpac Banking Corporation and two Westpac subsidiaries in the Federal Court of Australia in relation to Westpac’s sale of consumer credit insurance (CCI). The claim follows other industry class actions as part of Slater and Gordon’s ‘Get your insurance back’ campaign. It is alleged in the proceedings that the Westpac entities failed to adhere to a number of obligations in selling CCI in conjunction with credit cards, personal loans and flexi loans. The damages sought by the claim are unspecified. The Westpac entities are defending the proceedings. Westpac no longer sells CCI products. No provision has been recognised in relation to this matter. Internal reviews and remediation As in prior periods, Westpac is continuing to undertake a number of reviews to identify and resolve prior issues that have the potential to impact our customers and reputation. These internal reviews continue to identify a number of issues in respect of which we are taking steps or will take steps to put things right so that our customers are not at a disadvantage from certain past practices, including making compensation/remediation payments to customers and/or providing refunds where identified. These issues include compliance with lending obligations (including responsible lending) which is an area of industry focus, the provision of credit in accordance with the National Consumer Credit Protection Act 2009 (Cth), the processing of corporate actions, the charging of certain Wealth fees and the way some product terms and conditions are operationalised. By undertaking these reviews we can also improve our processes and controls. An assessment of the Group’s likely loss has been made on a case-by-case basis for the purpose of the financial statements but cannot always be reliably estimated. Contingent liabilities may exist in respect of actual or potential claims (which could be brought by customers or regulators), compensation/ remediation payments and/or refunds identified as part of these reviews. Australian Financial Complaints Authority Contingent liabilities may also exist in relation to customer complaints brought before the Australian Financial Complaints Authority (AFCA). AFCA has the power to make determinations about complaints and can award compensation up to certain thresholds. AFCA has a broader jurisdiction than previous dispute resolution bodies which it has replaced and, up until 30 June 2020, can also consider customer complaints dating back to 1 January 2008. Financial Claims Scheme Under the Financial Claims Scheme (FCS), the Australian Government provides depositors a free guarantee of deposits in eligible ADIs up to and including $250,000. The FCS applies to an eligible ADI if APRA has applied for the winding up of the ADI and the responsible Australian Government minister has declared that the FCS applies to the ADI. The Financial Claims Scheme (ADIs) Levy Act 2008 provides for the imposition of a levy to fund the excess of certain APRA FCS costs connected to an ADI, including payments by APRA to deposit holders in a failed ADI. The levy would be imposed on liabilities of eligible ADIs to their depositors and cannot be more than 0.5% of the amount of those liabilities. A contingent liability may exist in respect of any levy imposed under the FCS. Contingent tax risk Tax and regulatory authorities in Australia and in other jurisdictions are reviewing the taxation treatment of certain transactions (both historical and present-day transactions) undertaken by the Group in the course of normal business activities and the claiming of tax incentives and indirect taxes such as GST. The Group also responds to various notices and requests for information it receives from tax and regulatory authorities. These reviews, notices and requests may result in additional tax liabilities (including interest and penalties). The Group has assessed these and other taxation claims arising in Australia and elsewhere, including seeking independent advice. Settlement risk The Group is subject to a credit risk exposure in the event that another counterparty fails to settle for its payments clearing activities (including foreign exchange). The Group seeks to minimise credit risk arising from settlement risk in the payments system by aligning our processing method with the legal certainty of settlement in the relevant clearing mechanism. Parent Entity guarantees and undertakings The Parent Entity makes the following guarantees and undertakings to subsidiaries: •letters of comfort for certain subsidiaries which recognise that Westpac has a responsibility that those subsidiaries continue to meet their obligations; and •guarantees to certain wholly owned subsidiaries which are Australian financial services or credit licensees to comply with legislative requirements. Each guarantee is capped at $40 million per year and can only be utilised if the entity concerned becomes legally obliged to pay for a claim under the relevant licence. The Parent Entity has a right to recover any funds payable under the guarantees from the relevant subsidiary. |
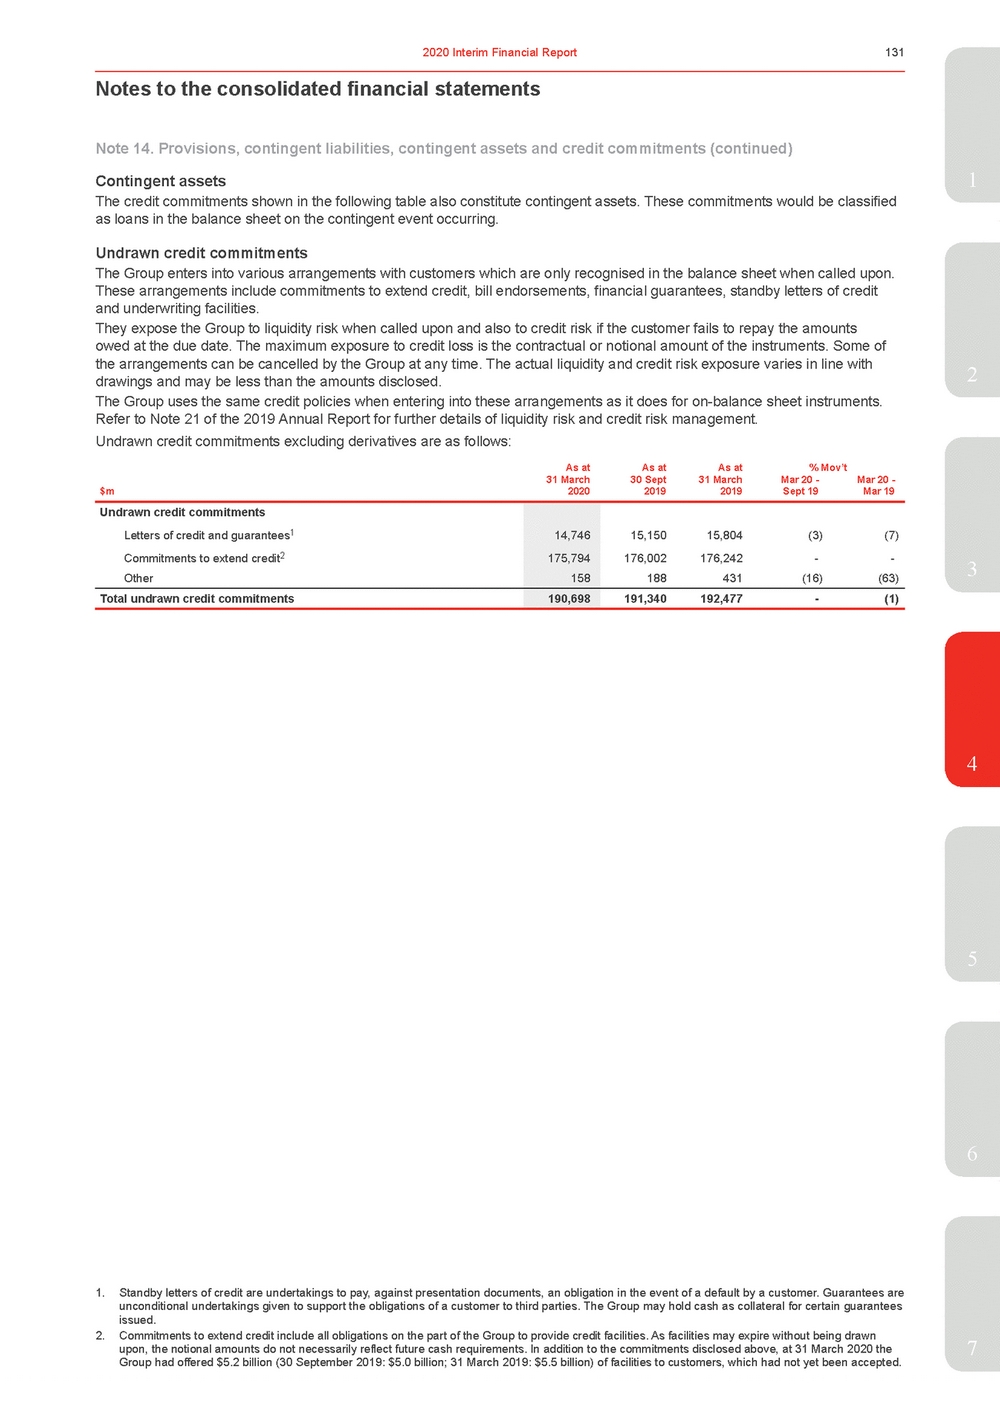 | The credit commitments shown in the following table also constitute contingent assets. These commitments would be classified as loans in the balance sheet on the contingent event occurring. Undrawn credit commitments The Group enters into various arrangements with customers which are only recognised in the balance sheet when called upon. These arrangements include commitments to extend credit, bill endorsements, financial guarantees, standby letters of credit and underwriting facilities. 2 The Group uses the same credit policies when entering into these arrangements as it does for on-balance sheet instruments. Refer to Note 21 of the 2019 Annual Report for further details of liquidity risk and credit risk management. Undrawn credit commitments excluding derivatives are as follows: As atAs atAs at% Mov’t 31 March $m2020 30 Sept 2019 31 March 2019 Mar 20 - Sept 19 Mar 20 - Mar 19 Undrawn credit commitments Letters of credit and guarantees1 Commitments to extend credit2 Other 14,746 175,794 158 15,15015,804(3)(7) 176,002176,242--188431(16)(63) Total undrawn credit commitments 190,698 191,340192,477-(1) 4 5 6 1. Standby letters of credit are undertakings to pay, against presentation documents, an obligation in the event of a default by a customer. Guarantees are unconditional undertakings given to support the obligations of a customer to third parties. The Group may hold cash as collateral for certain guarantees issued. 2. Commitments to extend credit include all obligations on the part of the Group to provide credit facilities. As facilities may expire without being drawn upon, the notional amounts do not necessarily reflect future cash requirements. In addition to the commitments disclosed above, at 31 March 2020 the7 Group had offered $5.2 billion (30 September 2019: $5.0 billion; 31 March 2019: $5.5 billion) of facilities to customers, which had not yet been accepted. |
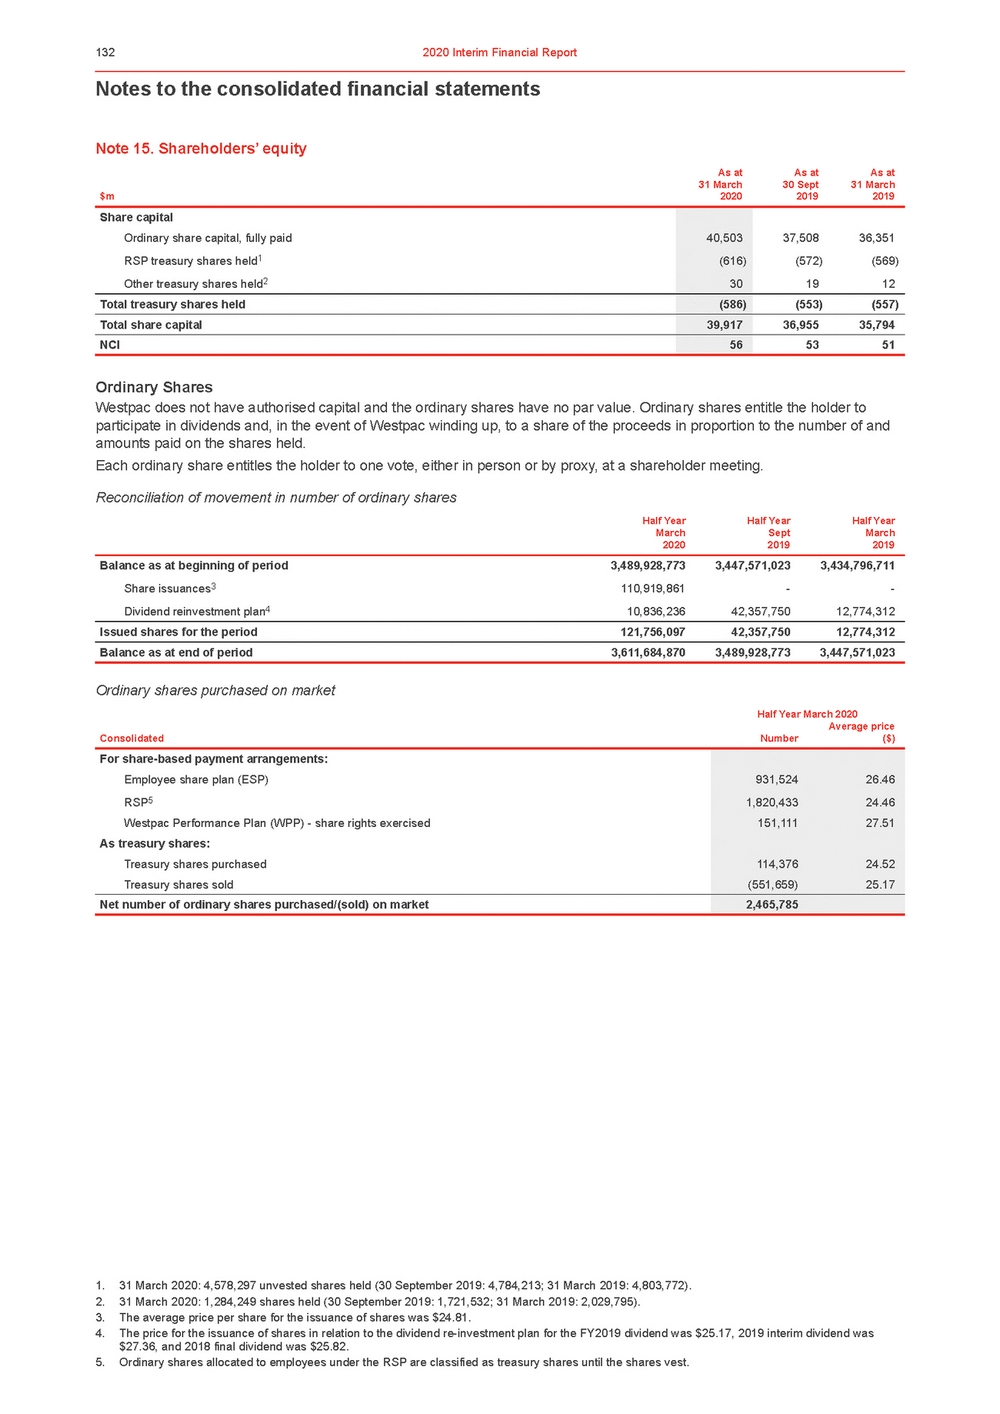 | Notes to the consolidated financial statements Note 15. Shareholders’ equity As atAs atAs at 31 March $m2020 30 Sept 2019 31 March 2019 Ordinary Shares Westpac does not have authorised capital and the ordinary shares have no par value. Ordinary shares entitle the holder to participate in dividends and, in the event of Westpac winding up, to a share of the proceeds in proportion to the number of and amounts paid on the shares held. Each ordinary share entitles the holder to one vote, either in person or by proxy, at a shareholder meeting. Reconciliation of movement in number of ordinary shares Half YearHalf YearHalf Year March 2020 Sept 2019 March 2019 Balance as at beginning of period3,489,928,7733,447,571,0233,434,796,711 Share issuances3 110,919,861--Dividend reinvestment plan4 10,836,23642,357,75012,774,312 Issued shares for the period121,756,09742,357,75012,774,312 Balance as at end of period3,611,684,8703,489,928,7733,447,571,023 Ordinary shares purchased on market Half Year March 2020 Average price ConsolidatedNumber($) 1. 31 March 2020: 4,578,297 unvested shares held (30 September 2019: 4,784,213; 31 March 2019: 4,803,772). 2. 31 March 2020: 1,284,249 shares held (30 September 2019: 1,721,532; 31 March 2019: 2,029,795). 3. The average price per share for the issuance of shares was $24.81. 4. The price for the issuance of shares in relation to the dividend re-investment plan for the FY2019 dividend was $25.17, 2019 interim dividend was $27.36, and 2018 final dividend was $25.82. 5. Ordinary shares allocated to employees under the RSP are classified as treasury shares until the shares vest. |
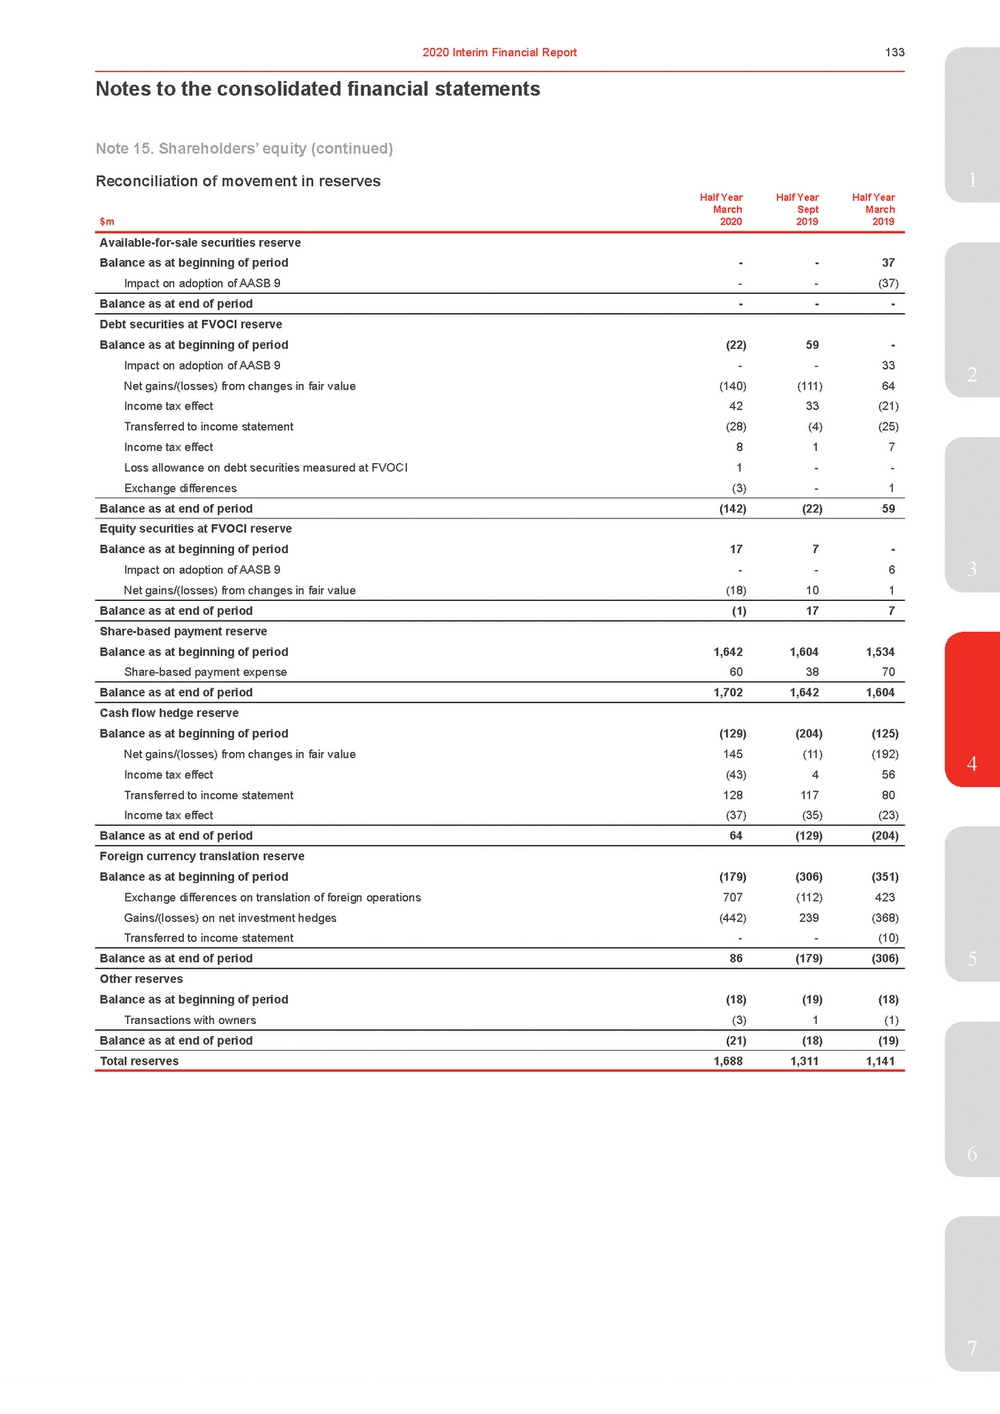 | Reconciliation of movement in reserves 1 Half YearHalf YearHalf Year $m Available-for-sale securities reserve March 2020 Sept 2019 March 2019 Balance as at beginning of period--37 Impact on adoption of AASB 9--(37) Balance as at end of period--- Debt securities at FVOCI reserve Balance as at beginning of period(22)59-Impact on adoption of AASB 9 - - 33 2 Net gains/(losses) from changes in fair value (140) (111) 64 Income tax effect 42 33 (21) Transferred to income statement (28) (4) (25) Income tax effect 8 1 7 Loss allowance on debt securities measured at FVOCI 1 - - Exchange differences (3) - 1 Balance as at end of period(142)(22)59 Equity securities at FVOCI reserve Balance as at beginning of period177-Impact on adoption of AASB 9 - - 6 3 Net gains/(losses) from changes in fair value (18) 10 1 Balance as at end of period(1)177 Share-based payment reserve Balance as at beginning of period1,6421,6041,534 Share-based payment expense 60 38 70 Balance as at end of period 1,702 1,642 1,604 Cash flow hedge reserve Balance as at beginning of period (129) (204) (125) Net gains/(losses) from changes in fair value 145 (11) (192) Income tax effect (43) 4 56 Transferred to income statement 128 117 80 Income tax effect (37) (35) (23) Balance as at end of period 64 (129) (204) Foreign currency translation reserve Balance as at beginning of period (179) (306) (351) Exchange differences on translation of foreign operations 707 (112) 423 Gains/(losses) on net investment hedges (442) 239 (368) Transferred to income statement - - (10) Balance as at end of period Other reserves 86 (179) (306) Balance as at beginning of period (18) (19) (18) Transactions with owners (3) 1 (1) Balance as at end of period (21) (18) (19) 5 Total reserves1,6881,3111,141 6 7 |
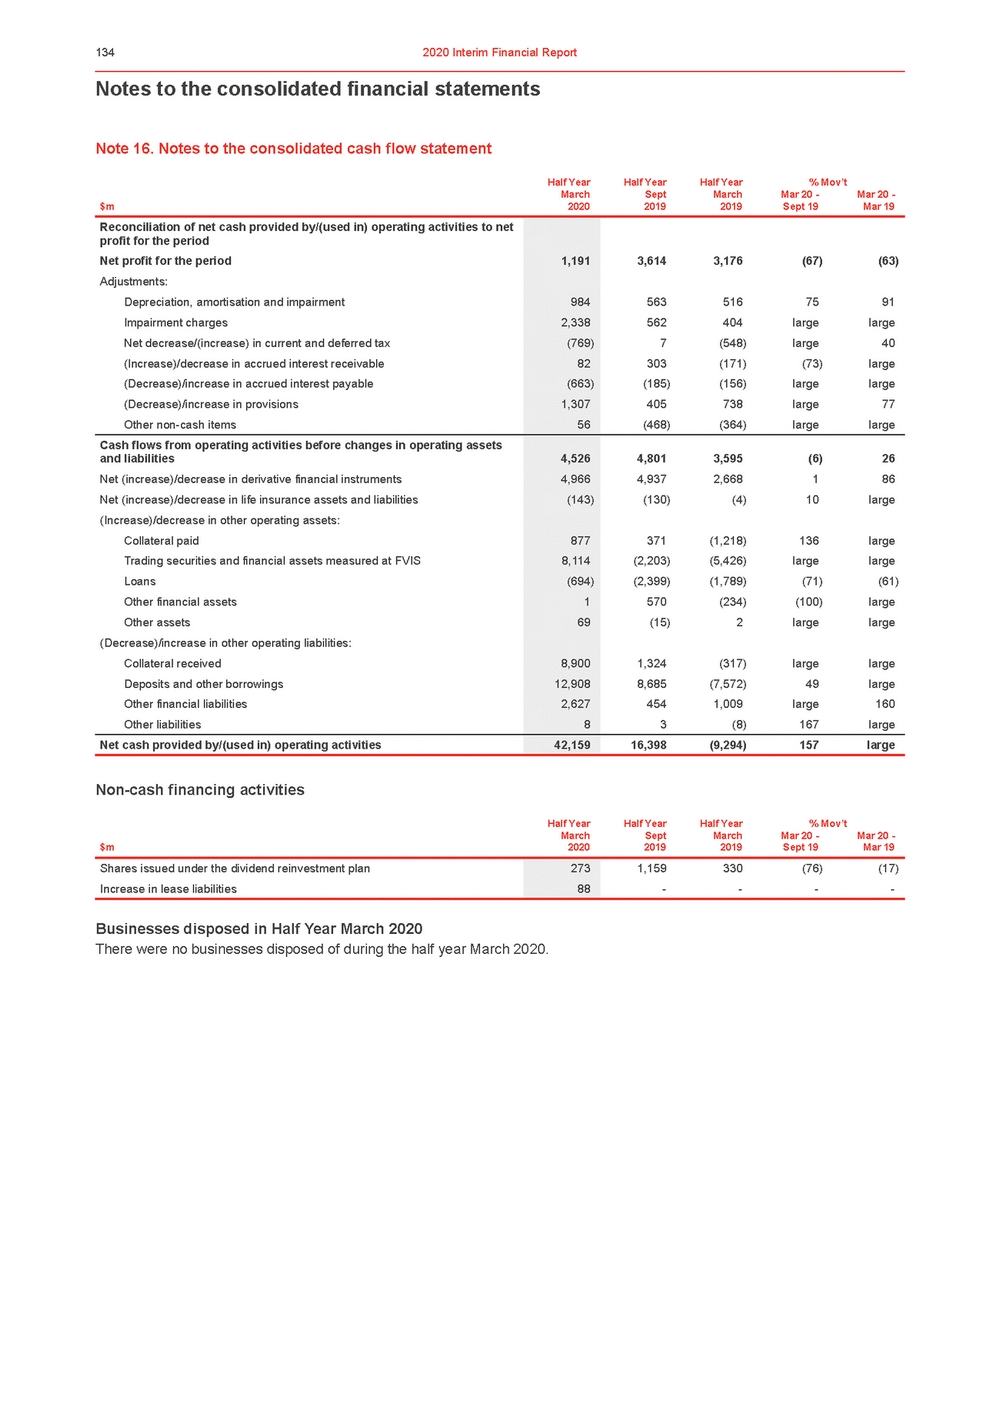 | Notes to the consolidated financial statements Note 16. Notes to the consolidated cash flow statement Half YearHalf YearHalf Year% Mov’t March $m2020 Sept 2019 March 2019 Mar 20 - Sept 19 Mar 20 - Mar 19 Non-cash financing activities Businesses disposed in Half Year March 2020 There were no businesses disposed of during the half year March 2020. |
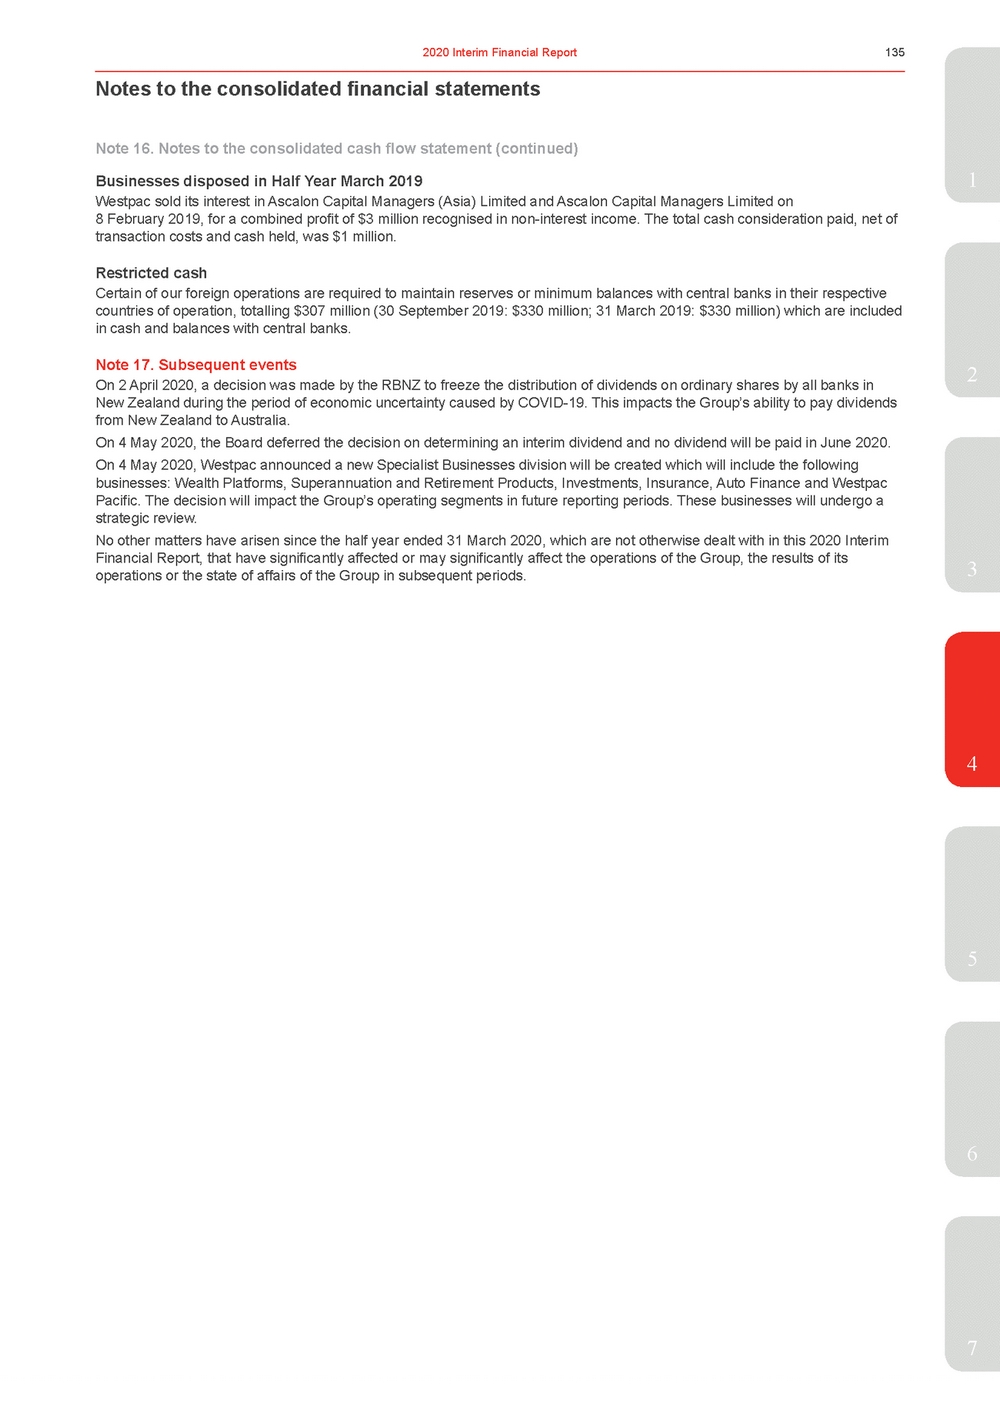 | Businesses disposed in Half Year March 20191 Westpac sold its interest in Ascalon Capital Managers (Asia) Limited and Ascalon Capital Managers Limited on 8 February 2019, for a combined profit of $3 million recognised in non-interest income. The total cash consideration paid, net of transaction costs and cash held, was $1 million. Restricted cash Certain of our foreign operations are required to maintain reserves or minimum balances with central banks in their respective countries of operation, totalling $307 million (30 September 2019: $330 million; 31 March 2019: $330 million) which are included in cash and balances with central banks. 2 On 2 April 2020, a decision was made by the RBNZ to freeze the distribution of dividends on ordinary shares by all banks in New Zealand during the period of economic uncertainty caused by COVID-19. This impacts the Group’s ability to pay dividends from New Zealand to Australia. On 4 May 2020, the Board deferred the decision on determining an interim dividend and no dividend will be paid in June 2020. On 4 May 2020, Westpac announced a new Specialist Businesses division will be created which will include the following businesses: Wealth Platforms, Superannuation and Retirement Products, Investments, Insurance, Auto Finance and Westpac Pacific. The decision will impact the Group’s operating segments in future reporting periods. These businesses will undergo a strategic review. No other matters have arisen since the half year ended 31 March 2020, which are not otherwise dealt with in this 2020 Interim Financial Report, that have significantly affected or may significantly affect the operations of the Group, the results of its operations or the state of affairs of the Group in subsequent periods.3 4 5 6 7 |
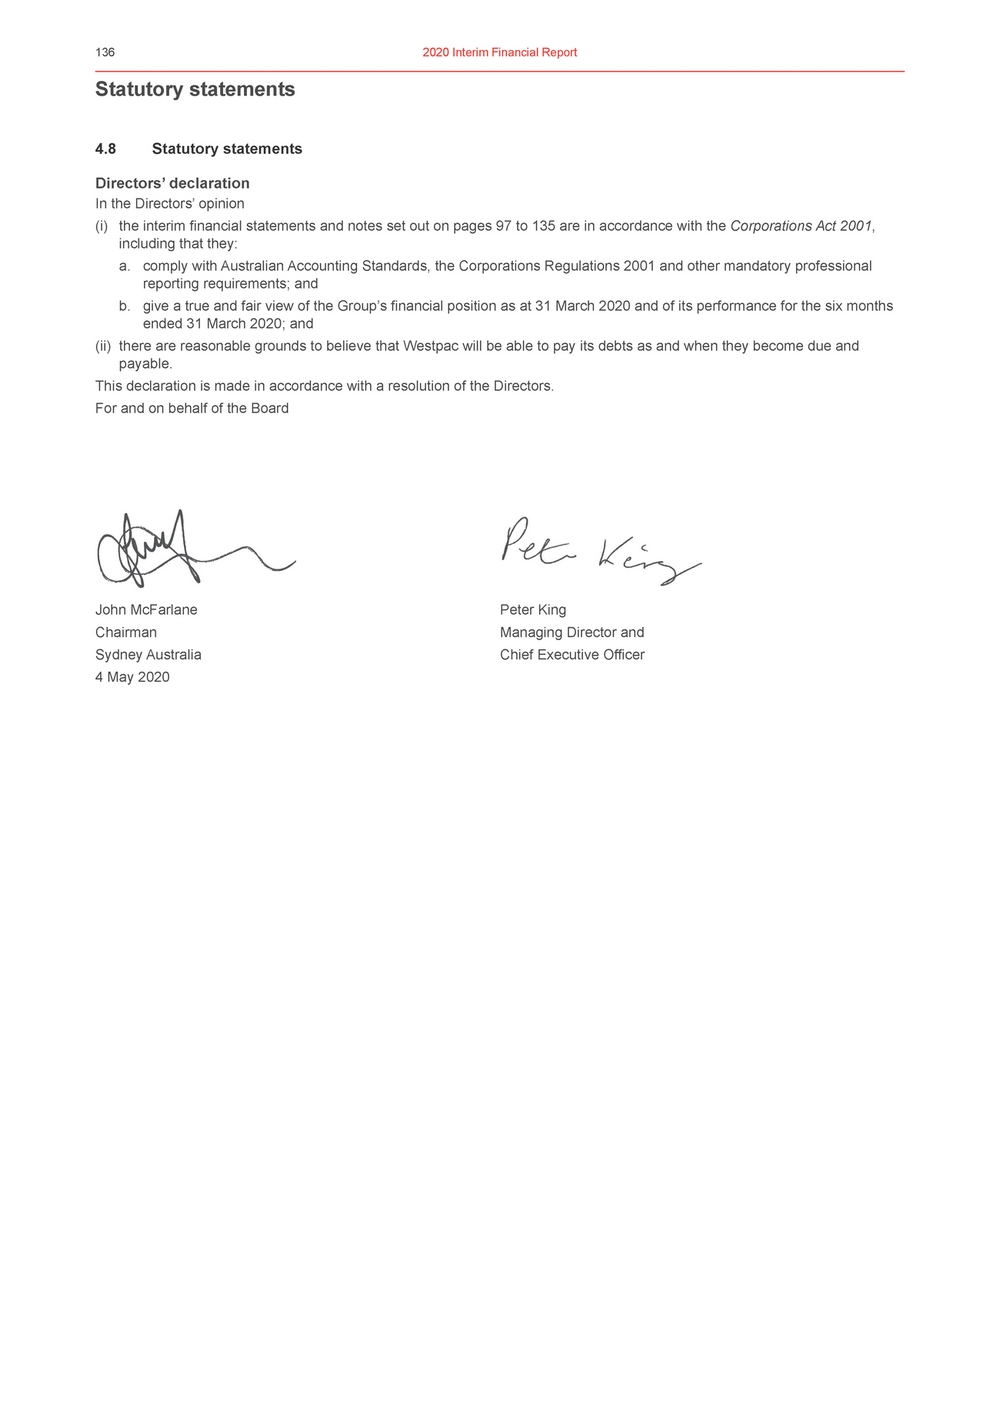 | Statutory statements 4.8Statutory statements Directors’ declaration In the Directors’ opinion (i) the interim financial statements and notes set out on pages 97 to 135 are in accordance with the Corporations Act 2001, including that they: a. comply with Australian Accounting Standards, the Corporations Regulations 2001 and other mandatory professional reporting requirements; and b. give a true and fair view of the Group’s financial position as at 31 March 2020 and of its performance for the six months ended 31 March 2020; and (ii) there are reasonable grounds to believe that Westpac will be able to pay its debts as and when they become due and payable. This declaration is made in accordance with a resolution of the Directors. For and on behalf of the Board John McFarlanePeter King ChairmanManaging Director and Sydney AustraliaChief Executive Officer 4 May 2020 |
 | 1 2 3 4 5 6 7 |
 | Statutory statements |
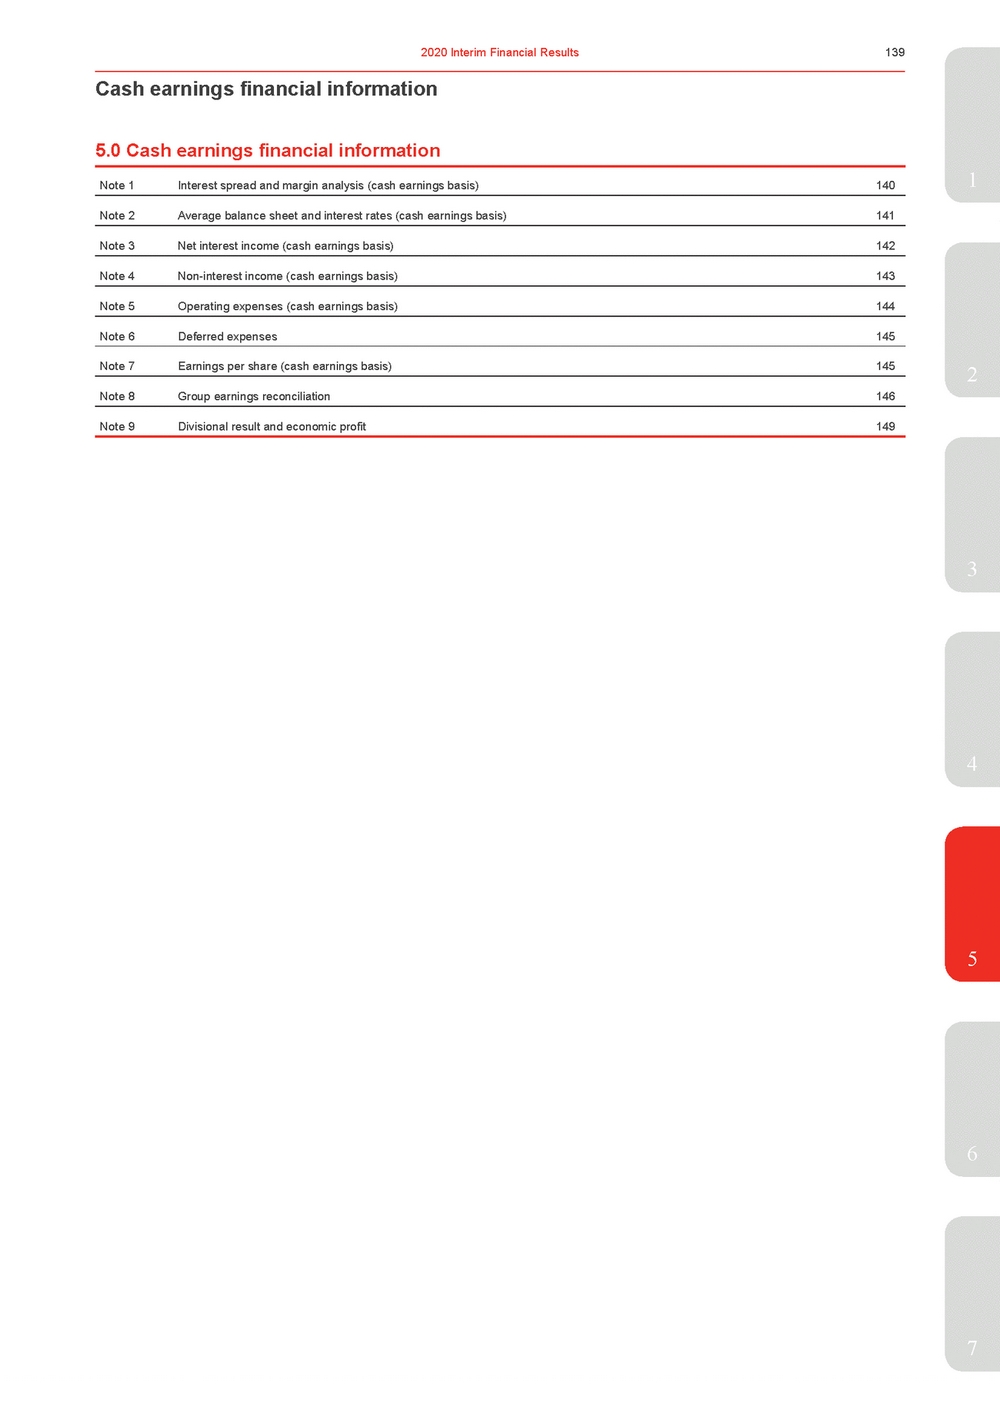 | 5.0 Cash earnings financial information Note 1 Interest spread and margin analysis (cash earnings basis) 140 Note 2Average balance sheet and interest rates (cash earnings basis)141 Note 3Net interest income (cash earnings basis)142 Note 4Non-interest income (cash earnings basis)143 Note 5Operating expenses (cash earnings basis)144 Note 6Deferred expenses145 Note 7Earnings per share (cash earnings basis)145 Note 8Group earnings reconciliation146 Note 9Divisional result and economic profit149 2 3 4 5 6 7 |
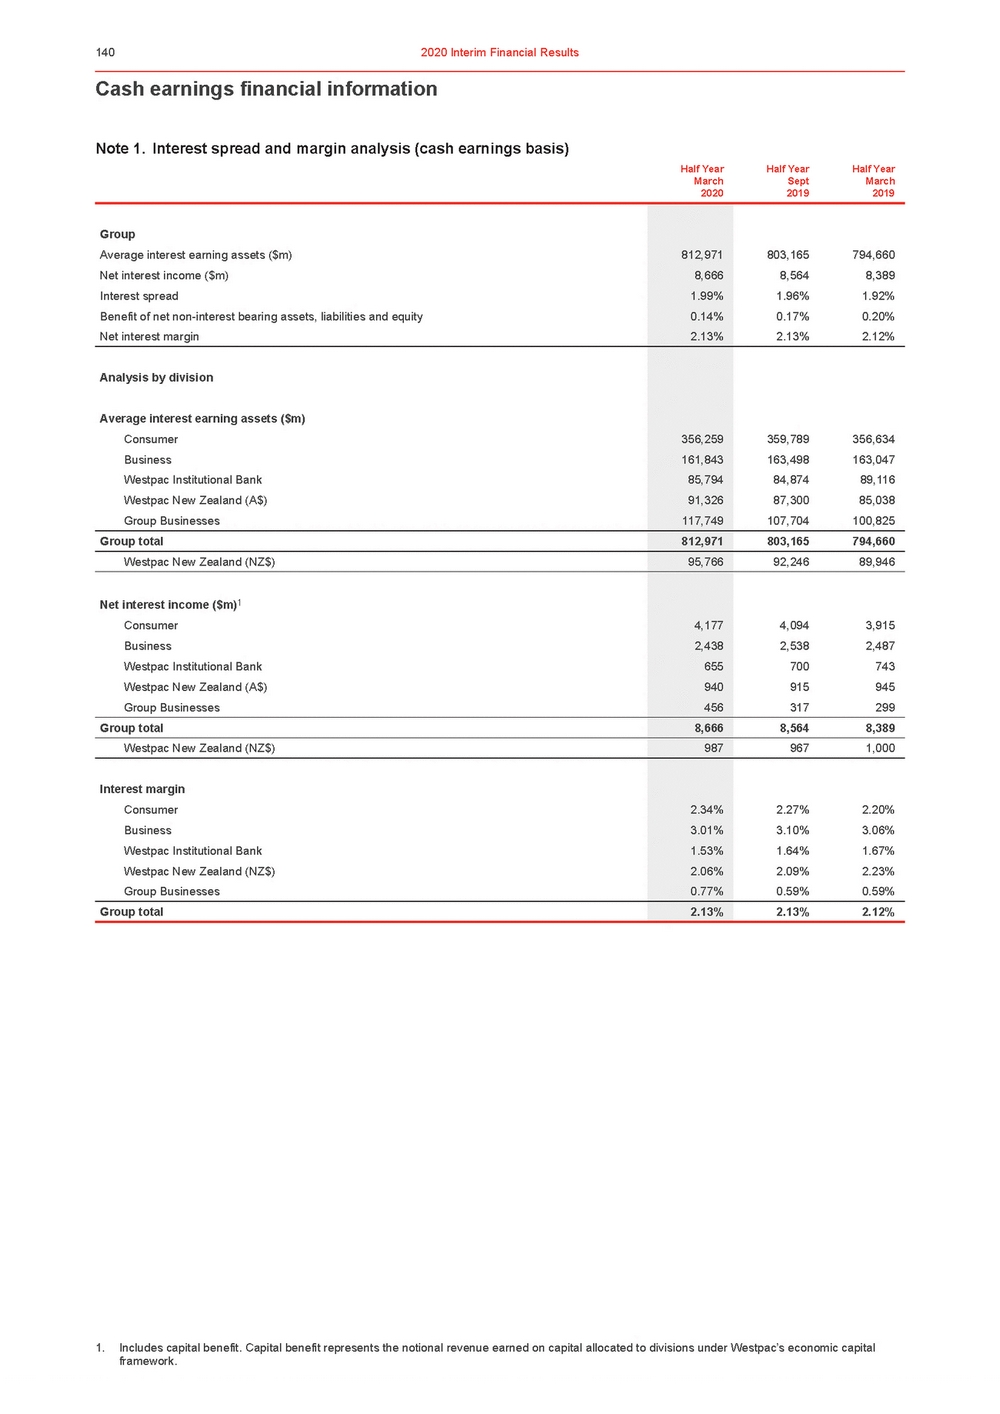 | Cash earnings financial information Note 1. Interest spread and margin analysis (cash earnings basis) Half YearHalf YearHalf Year March 2020 Sept 2019 March 2019 1. Includes capital benefit. Capital benefit represents the notional revenue earned on capital allocated to divisions under Westpac’s economic capital framework. |
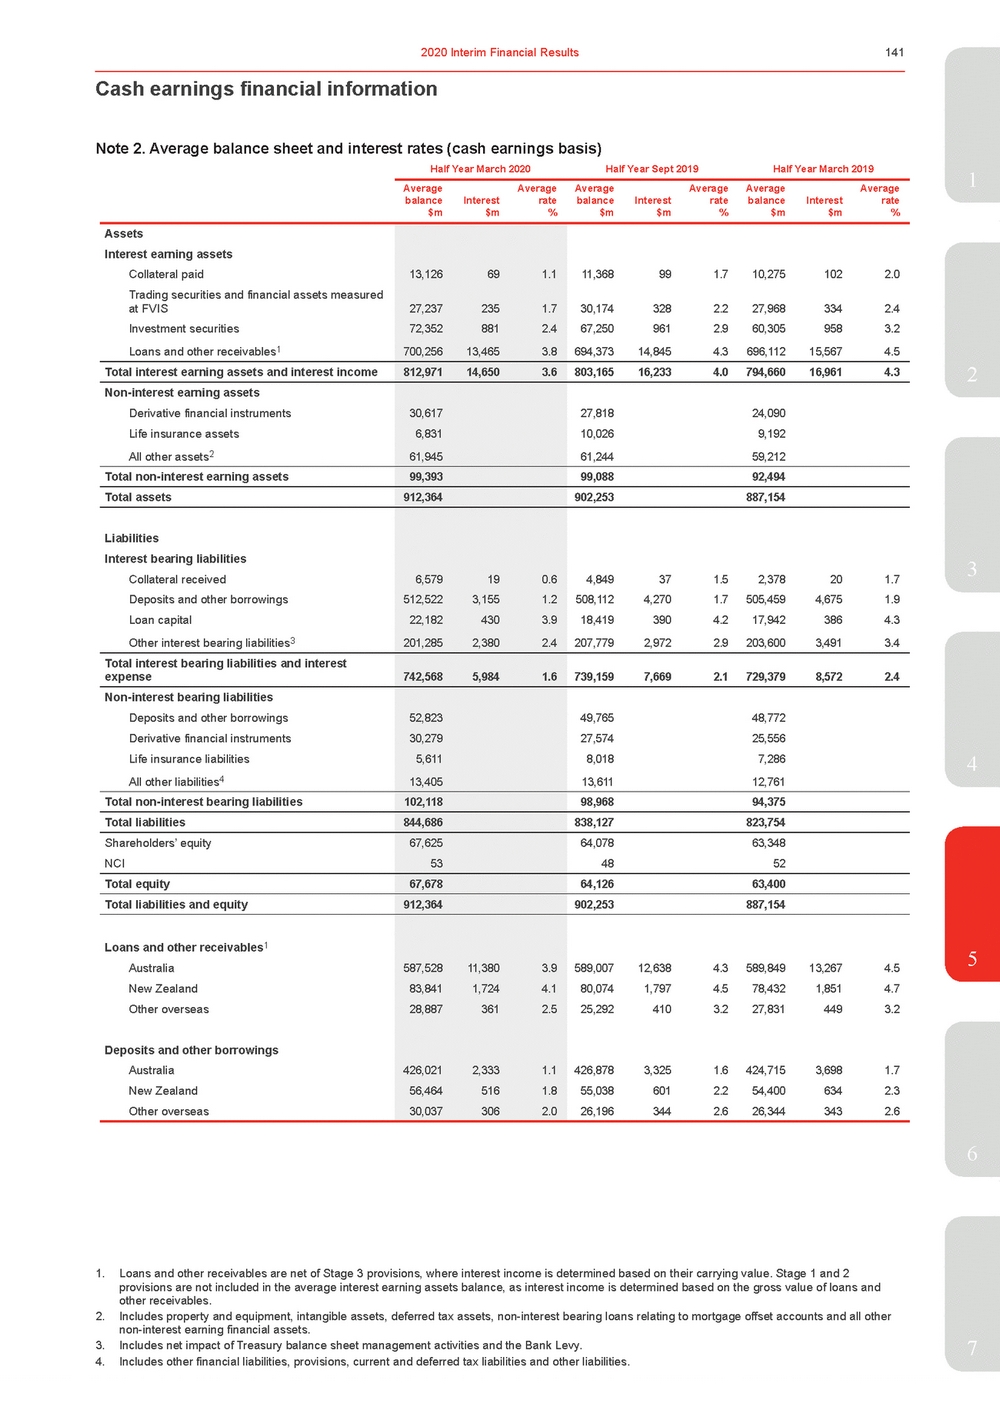 | Note 2. Average balance sheet and interest rates (cash earnings basis) 1 Assets Interest earning assets Collateral paid Trading securities and financial assets measured at FVIS Investment securities Loans and other receivables1 11,368991.710,2751022.0 30,1743282.227,9683342.4 67,2509612.960,3059583.2 694,37314,8454.3696,11215,5674.5 13,126 27,237 72,352 700,256 691.1 2351.7 8812.4 13,4653.8 Total interest earning assets and interest income 812,971 14,6503.6 803,16516,2334.0794,66016,9614.3 Non-interest earning assets Derivative financial instruments Life insurance assets All other assets2 30,617 6,831 61,945 27,81824,090 10,0269,192 61,24459,212 Total non-interest earning assets 99,393 99,08892,494 Total assets 912,364 902,253887,154 Liabilities Interest bearing liabilities Collateral received Deposits and other borrowings Loan capital Other interest bearing liabilities3 6,579 512,522 22,182 201,285 190.6 3,1551.2 4303.9 2,3802.4 4,849371.52,378201.7 508,1124,2701.7505,4594,6751.9 18,4193904.217,9423864.3 207,7792,9722.9203,6003,4913.4 Total interest bearing liabilities and interest expense 742,568 5,9841.6 739,1597,6692.1729,3798,5722.4 Non-interest bearing liabilities Deposits and other borrowings Derivative financial instruments Life insurance liabilities All other liabilities4 52,823 30,279 5,611 13,405 49,76548,772 27,57425,556 8,0187,286 13,61112,761 Total non-interest bearing liabilities 102,118 98,96894,375 Total liabilities 844,686 838,127823,754 Shareholders’ equity NCI 67,625 53 64,07863,348 4852 Total equity 67,678 64,12663,400 Total liabilities and equity 912,364 902,253887,154 Loans and other receivables1 Australia New Zealand Other overseas Deposits and other borrowings Australia New Zealand Other overseas 587,528 83,841 28,887 426,021 56,464 11,3803.9 1,7244.1 3612.5 2,3331.1 5161.8 589,00712,6384.3589,84913,2674.5 80,0741,7974.578,4321,8514.7 25,2924103.227,8314493.2 426,8783,3251.6424,7153,6981.7 55,0386012.254,4006342.3 26,1963442.626,3443432.6 30,0373062.0 3 4 5 6 1. Loans and other receivables are net of Stage 3 provisions, where interest income is determined based on their carrying value. Stage 1 and 2 provisions are not included in the average interest earning assets balance, as interest income is determined based on the gross value of loans and other receivables. 2. Includes property and equipment, intangible assets, deferred tax assets, non-interest bearing loans relating to mortgage offset accounts and all other non-interest earning financial assets. 3. Includes net impact of Treasury balance sheet management activities and the Bank Levy.7 4. Includes other financial liabilities, provisions, current and deferred tax liabilities and other liabilities. |
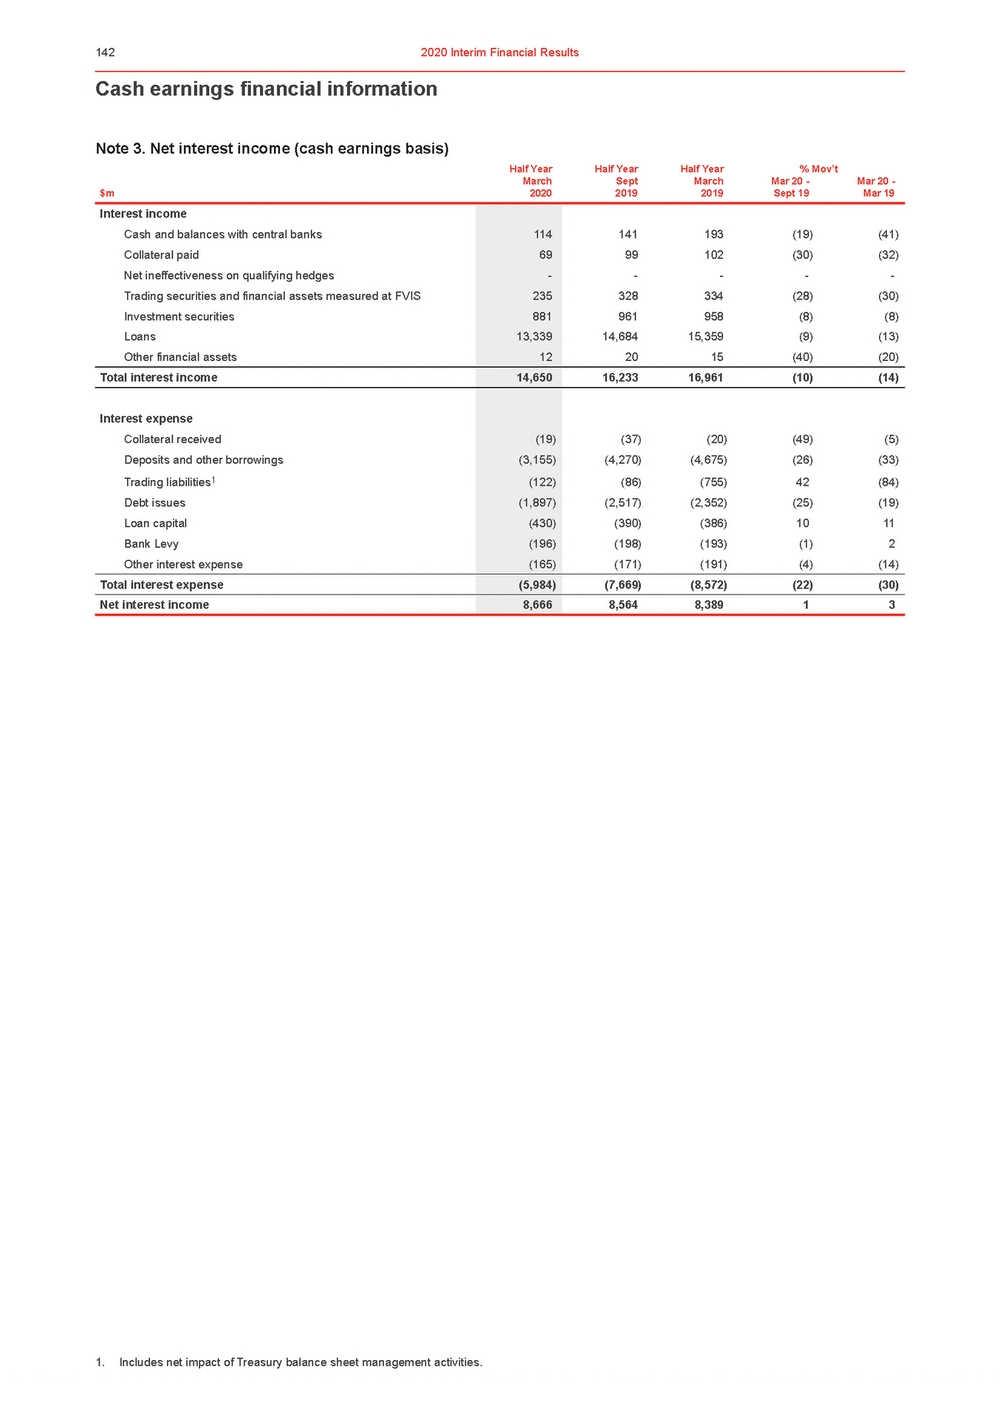 | Note 3. Net interest income (cash earnings basis) Half Year March Half Year Sept Half Year March % Mov’t Mar 20 - Mar 20 - $m 2020 2019 2019 Sept 19 Mar 19 1. Includes net impact of Treasury balance sheet management activities. |
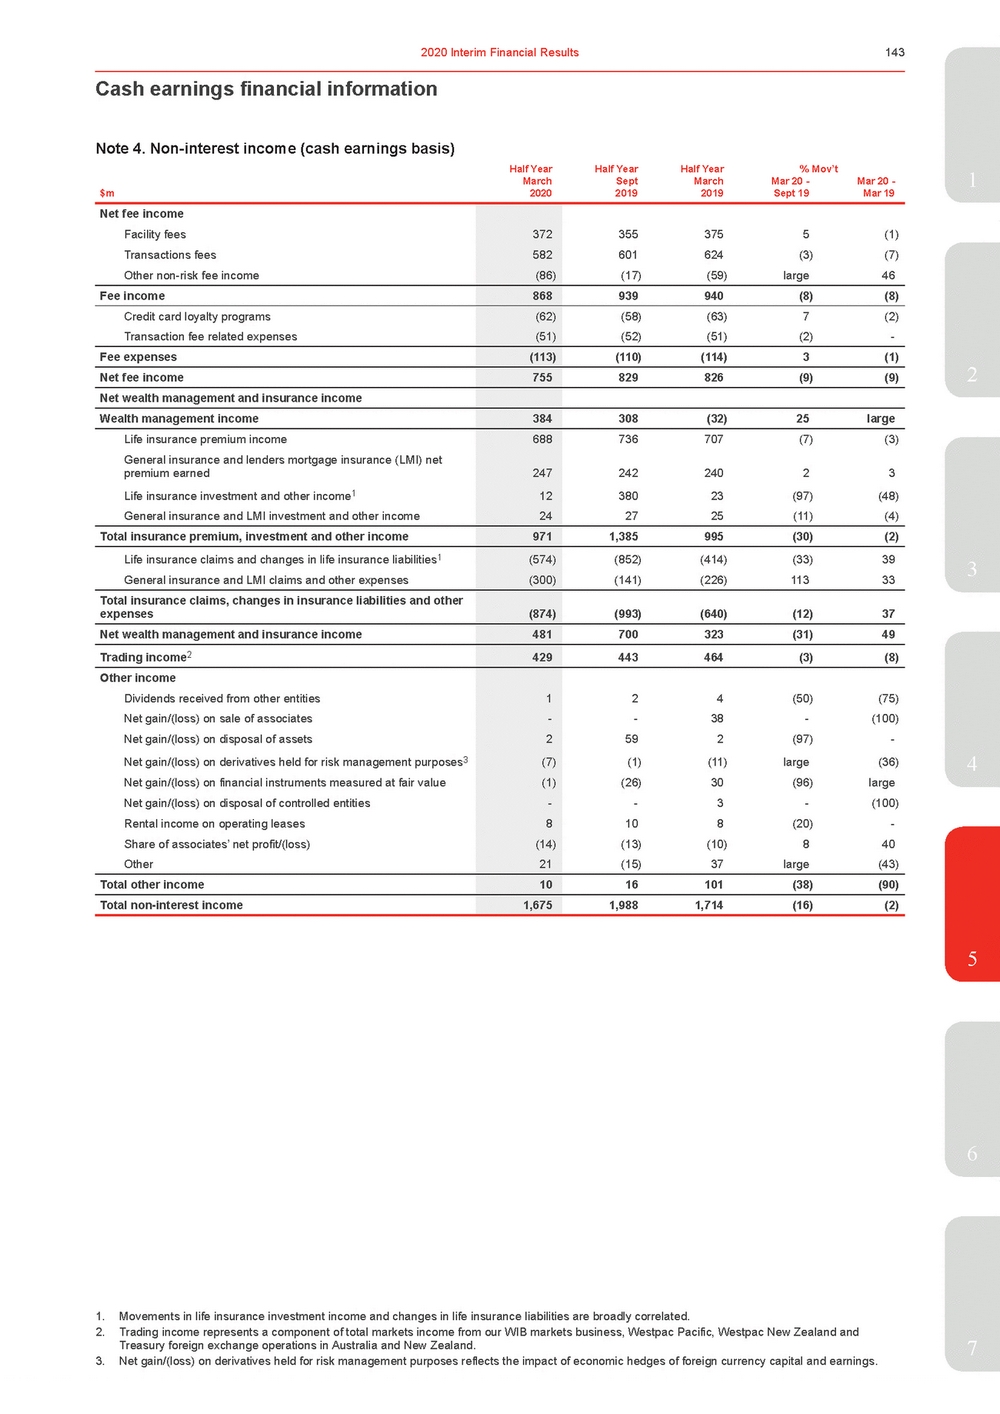 | Half YearHalf YearHalf Year% Mov’t March $m2020 Sept 2019 March 2019 Mar 20 - Sept 19 Mar 20 -1 Mar 19 Net fee income Facility fees Transactions fees Other non-risk fee income 372 582 (86) 3553755(1) 601624(3) (7) (17) (59)large46 Fee income 868 939940(8)(8) Credit card loyalty programs Transaction fee related expenses (62) (51) (58)(63)7(2) (52)(51)(2)-Fee expenses (113) (110)(114)3(1) Net fee income 755 829826(9)(9) Net wealth management and insurance income Wealth management income 384 308(32)25large Life insurance premium income General insurance and lenders mortgage insurance (LMI) net premium earned Life insurance investment and other income1 General insurance and LMI investment and other income 688 247 12 24 736707(7)(3) 24224023 38023(97)(48) 2725(11)(4) Total insurance premium, investment and other income 971 1,385995(30)(2) Life insurance claims and changes in life insurance liabilities1 General insurance and LMI claims and other expenses (574) (300) (852)(414) (33)39 (141)(226)11333 Total insurance claims, changes in insurance liabilities and other expenses (874) (993)(640)(12)37 Net wealth management and insurance income 481 700323(31)49 Trading income2 429 443464(3)(8) Other income Dividends received from other entities Net gain/(loss) on sale of associates Net gain/(loss) on disposal of assets Net gain/(loss) on derivatives held for risk management purposes3 Net gain/(loss) on financial instruments measured at fair value Net gain/(loss) on disposal of controlled entities Rental income on operating leases Share of associates’ net profit/(loss) Other 1 - 2 (7) (1) - 8 (14) 21 24(50)(75) -38-(100) 592(97)-(1)(11)large (36) (26) 30(96)large -3-(100) 10 8 (20) - (13) (10) 8 40 (15) 37 large (43) Total other income 10 16101(38)(90) Total non-interest income 1,675 1,9881,714(16)(2) 3 4 5 6 1. Movements in life insurance investment income and changes in life insurance liabilities are broadly correlated. 2. Trading income represents a component of total markets income from our WIB markets business, Westpac Pacific, Westpac New Zealand and Treasury foreign exchange operations in Australia and New Zealand.7 3. Net gain/(loss) on derivatives held for risk management purposes reflects the impact of economic hedges of foreign currency capital and earnings. |
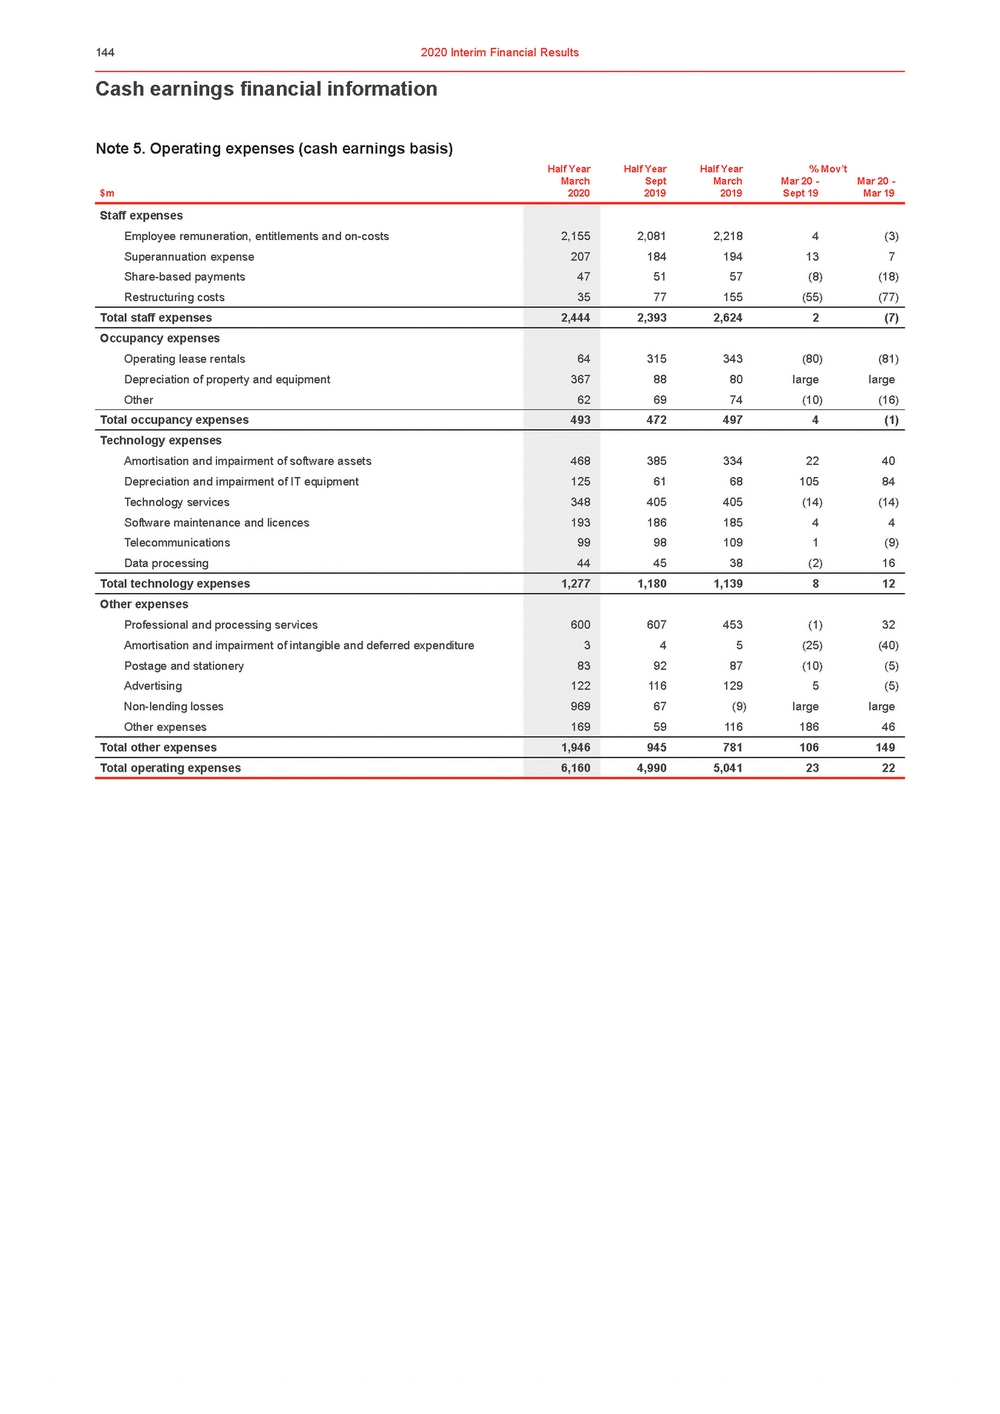 | Note 5. Operating expenses (cash earnings basis) Half Year March Half Year Sept Half Year March % Mov’t Mar 20 - Mar 20 - $m 2020 2019 2019 Sept 19 Mar 19 |
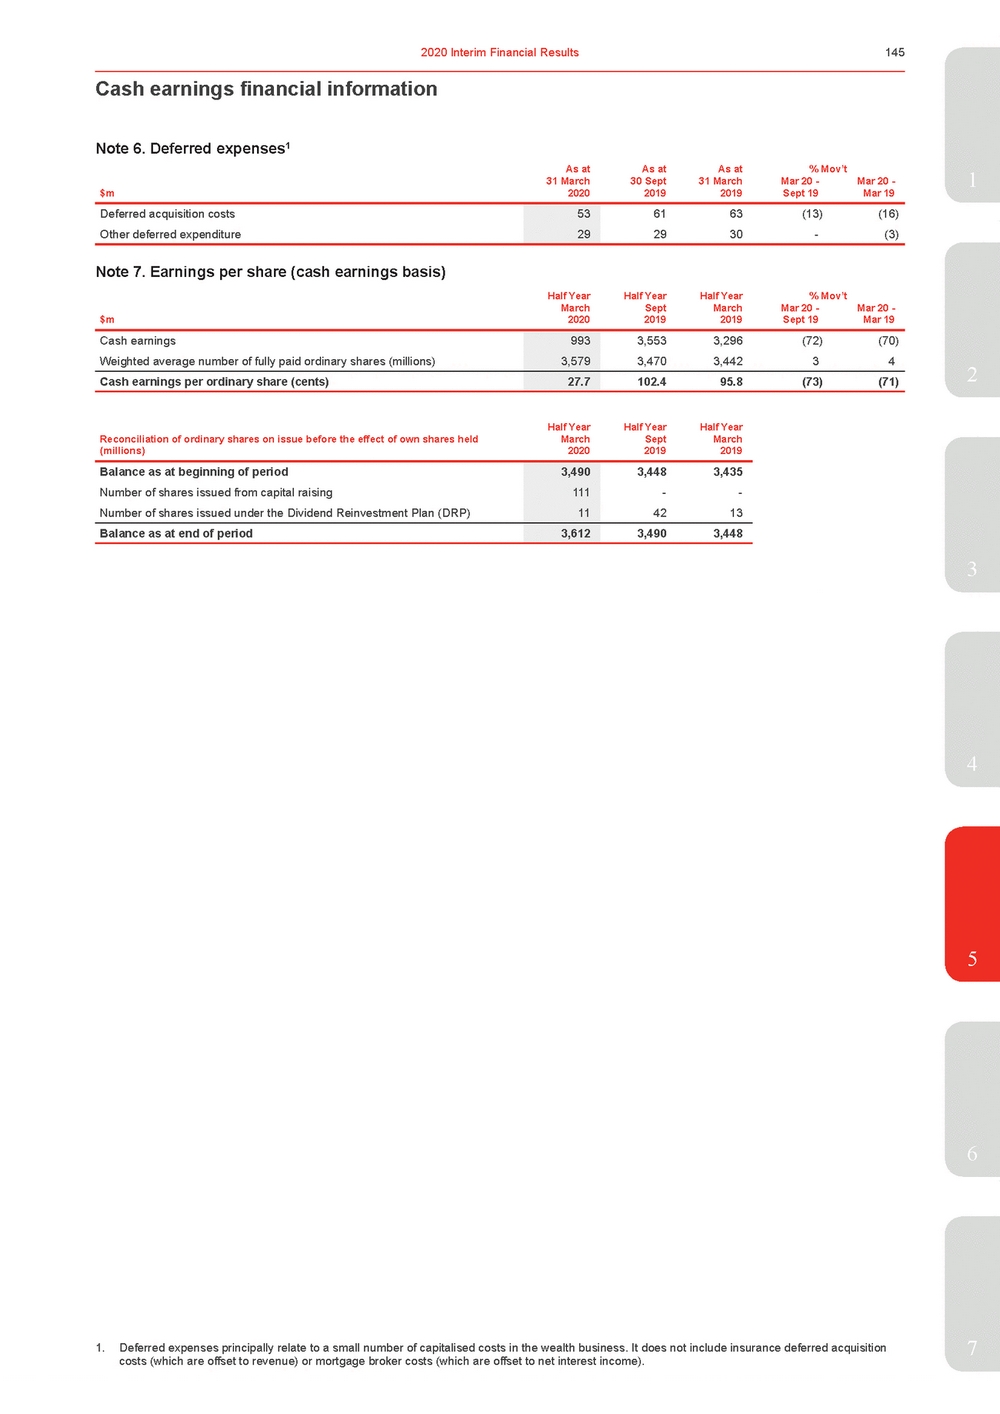 | As atAs atAs at% Mov’t $m 2020 2019 2019 Sept 19 Mar 19 Deferred acquisition costs 53 61 63 (13) (16) Other deferred expenditure 29 29 30 - (3) Note 7. Earnings per share (cash earnings basis) $m Half Year March 2020 Half Year Sept 2019 Half Year March 2019 % Mov’ Mar 20 - Sept 19 t Mar 20 - Mar 19 Reconciliation of ordinary shares on issue before the effect of own shares held Half Year March Half Year Sept Half Year March (millions) 2020 2019 2019 30 Sept 31 March Mar 20 - Mar 20 -1 Cash earnings Weighted average number of fully paid ordinary shares (millions) 993 3,579 3,5533,296(72)(70) 3,4703,44234 Cash earnings per ordinary share (cents) 27.7 102.495.8(73)(71) 3 4 5 6 1. Deferred expenses principally relate to a small number of capitalised costs in the wealth business. It does not include insurance deferred acquisition7 costs (which are offset to revenue) or mortgage broker costs (which are offset to net interest income). |
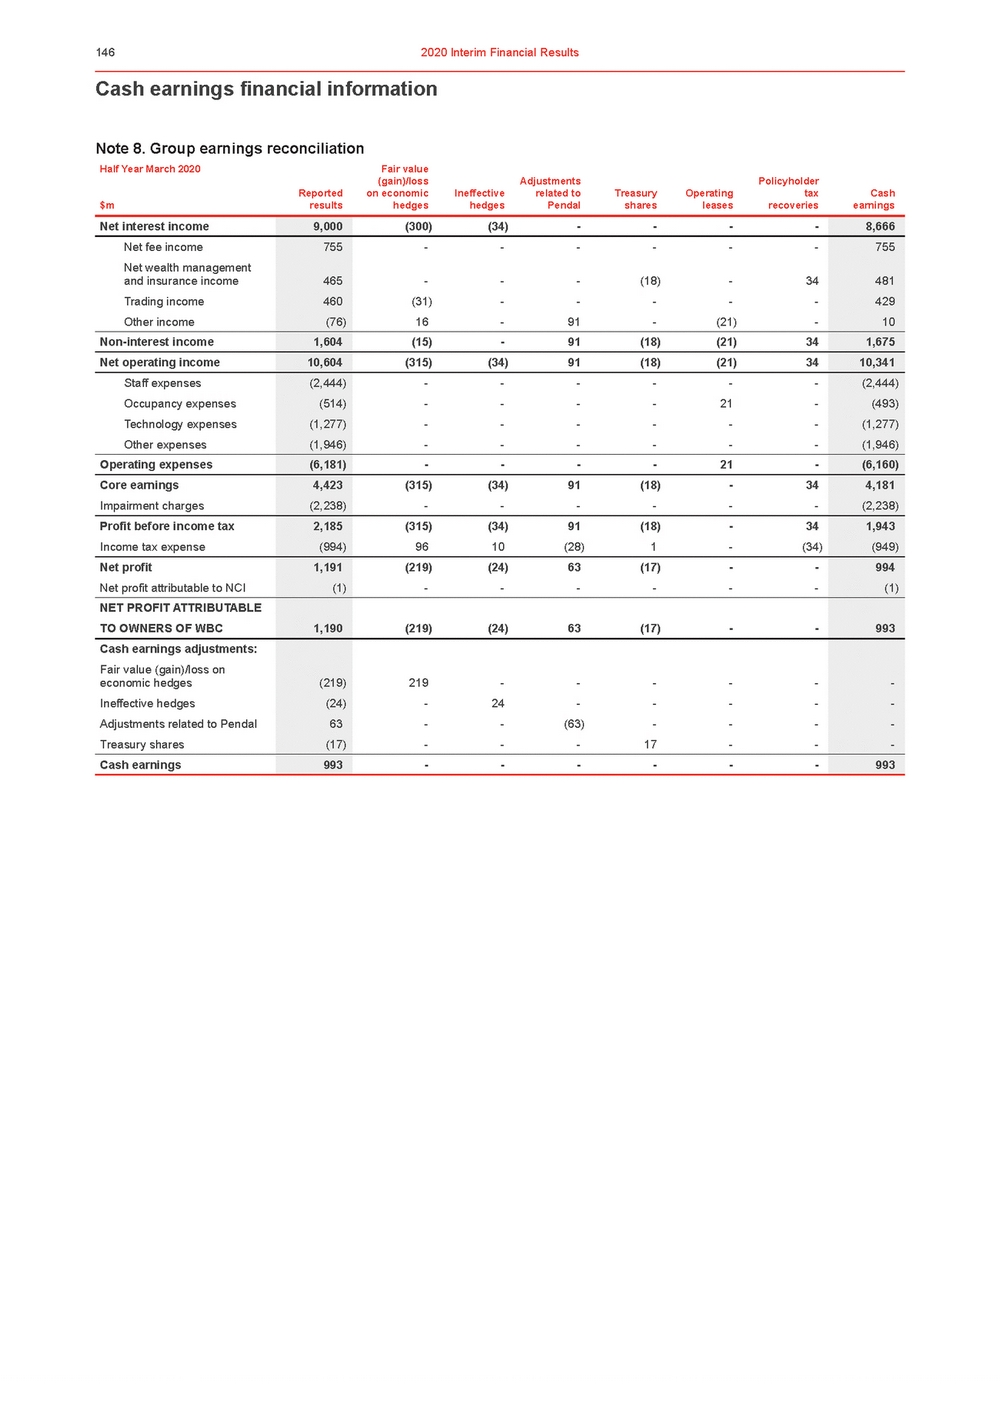 | Cash earnings financial information Note 8. Group earnings reconciliation (gain)/loss Adjustments Policyholder Reported on economic Ineffective related to Treasury Operating tax Cash results hedges hedges Pendal shares leases recoveries earnings $m |
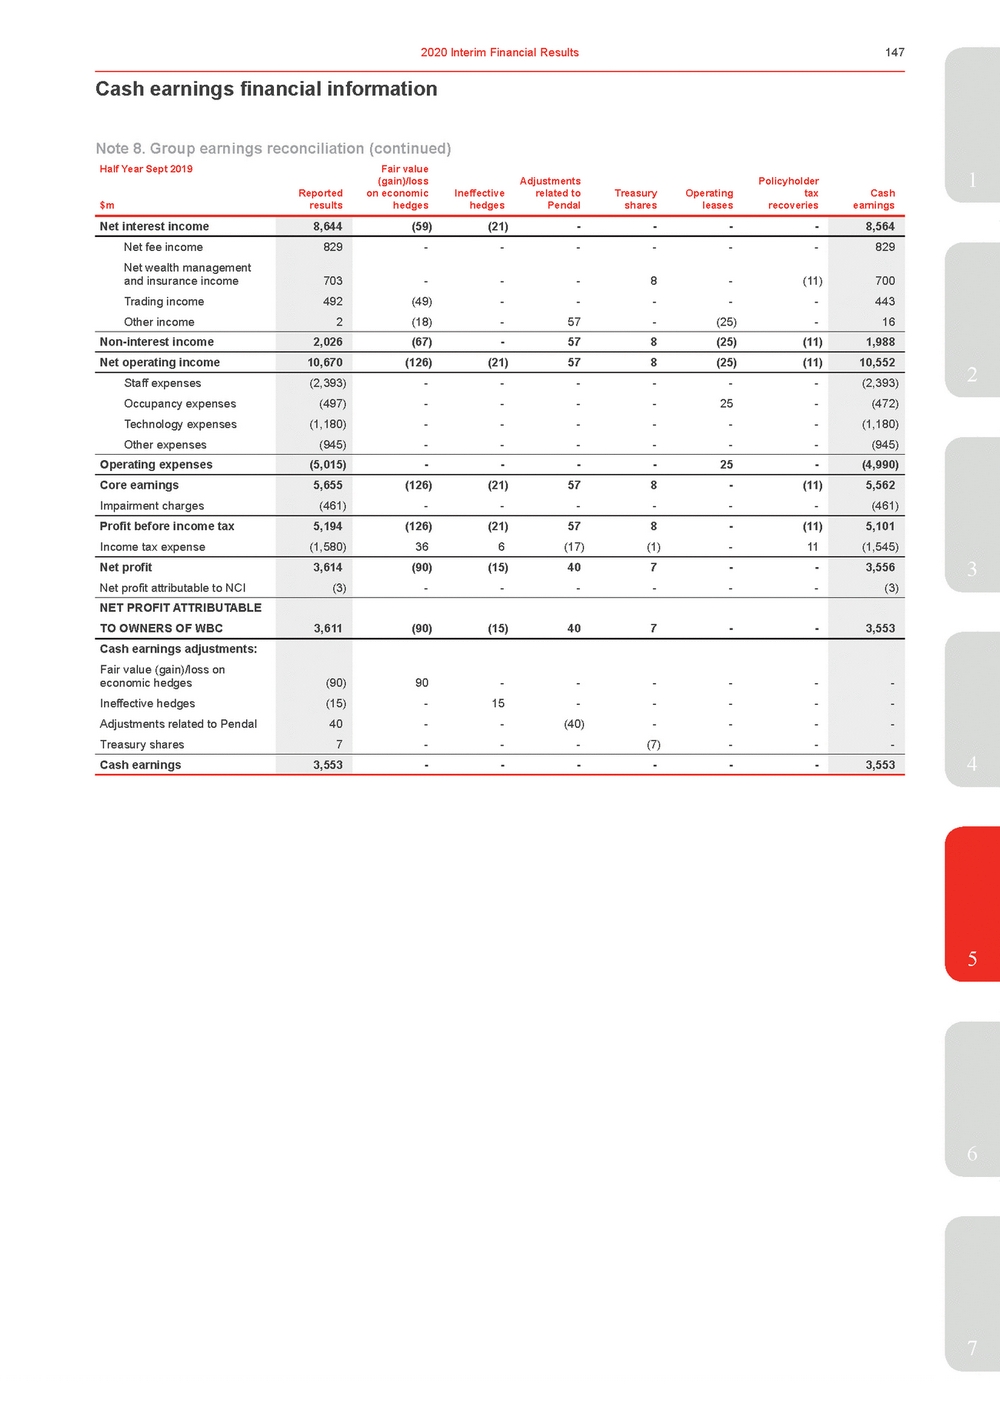 | Half Year Sept 2019 Fair value (gain)/loss Adjustments Policyholder Reported on economic Ineffective related to Treasury Operating tax Cash $m results hedges hedges Pendal shares leases recoveries earnings Net interest income 8,644 (59)(21)----8,564 Net fee income Net wealth management and insurance income Trading income Other income 829 703 492 2 ---------8-(11) (49)-----(18)-57 -(25)-829 700 443 16 Non-interest income 2,026 (67)-578(25)(11) 1,988 Net operating income 10,670 (126)(21)578(25)(11) 10,552 Staff expenses Occupancy expenses Technology expenses Other expenses (2,393) (497) (1,180) (945) ----------25-------------(2,393) (472) (1,180) (945) Operating expenses (5,015) ----25-(4,990) Core earnings Impairment charges 5,655 (461) (126)(21)578-(11) ------5,562 (461) Profit before income tax Income tax expense 5,194 (1,580) (126)(21)578-(11) 366(17)(1)-11 5,101 (1,545) Net profit Net profit attributable to NCI 3,614 (3) (90)(15)407--------3,556 (3) NET PROFIT ATTRIBUTABLE TO OWNERS OF WBC 3,611 (90)(15)407--3,553 Cash earnings adjustments: Fair value (gain)/loss on economic hedges Ineffective hedges Adjustments related to Pendal Treasury shares (90) (15) 40 7 90------15------(40)------(7)--- - - - Cash earnings 3,553 ------3,553 3 4 5 6 7 |
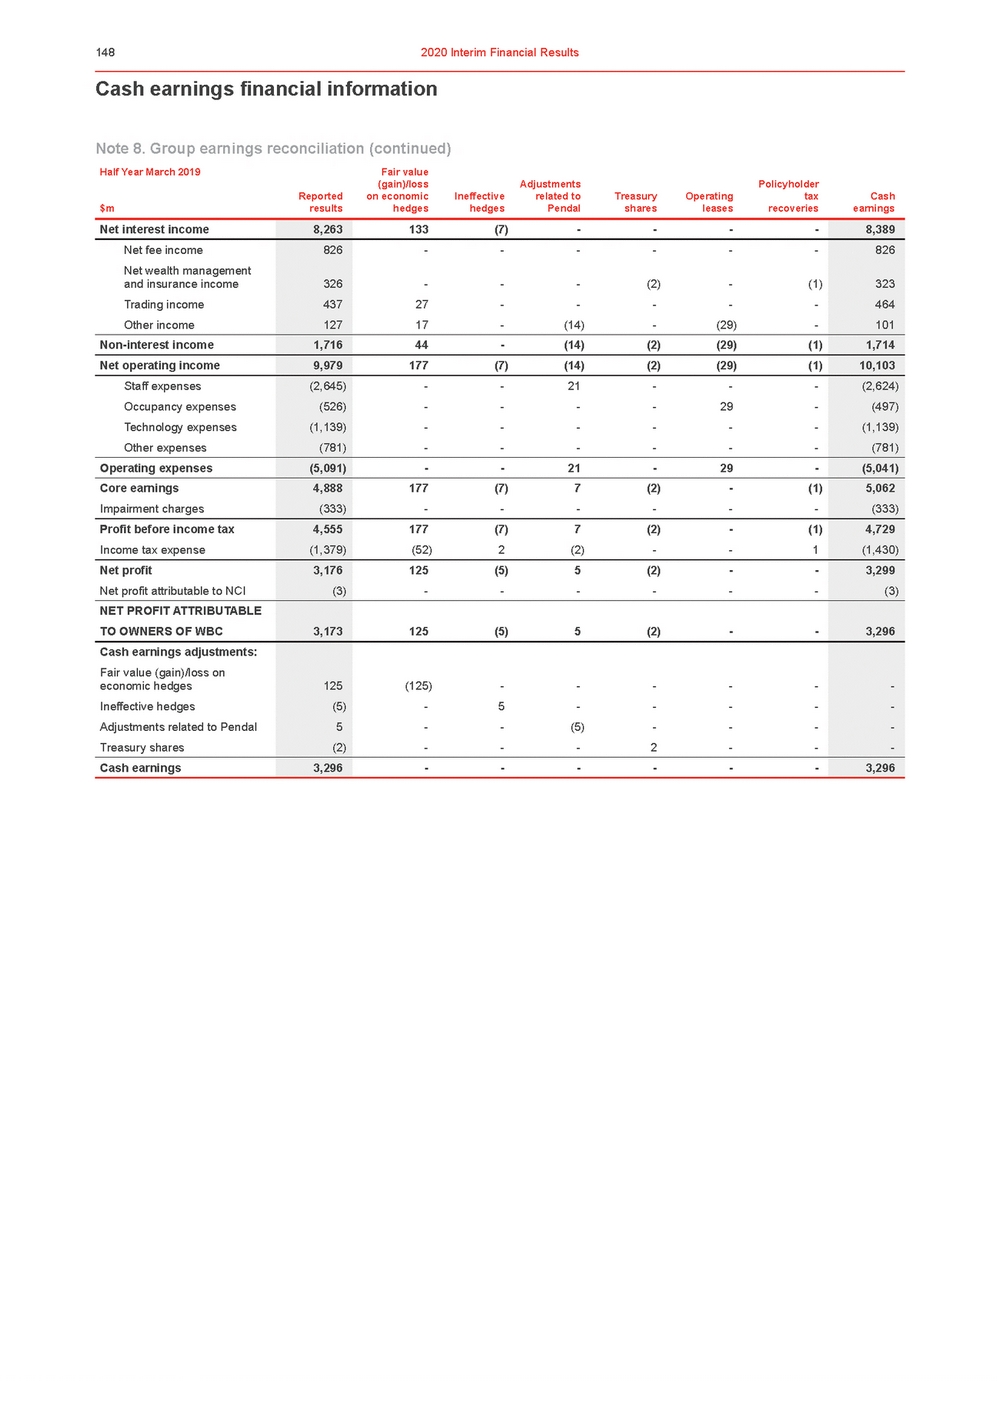 | Cash earnings financial information Half Year March 2019 Fair value (gain)/loss Adjustments Policyholder Reported on economic Ineffective related to Treasury Operating tax Cash $m results hedges hedges Pendal shares leases recoveries earnings |
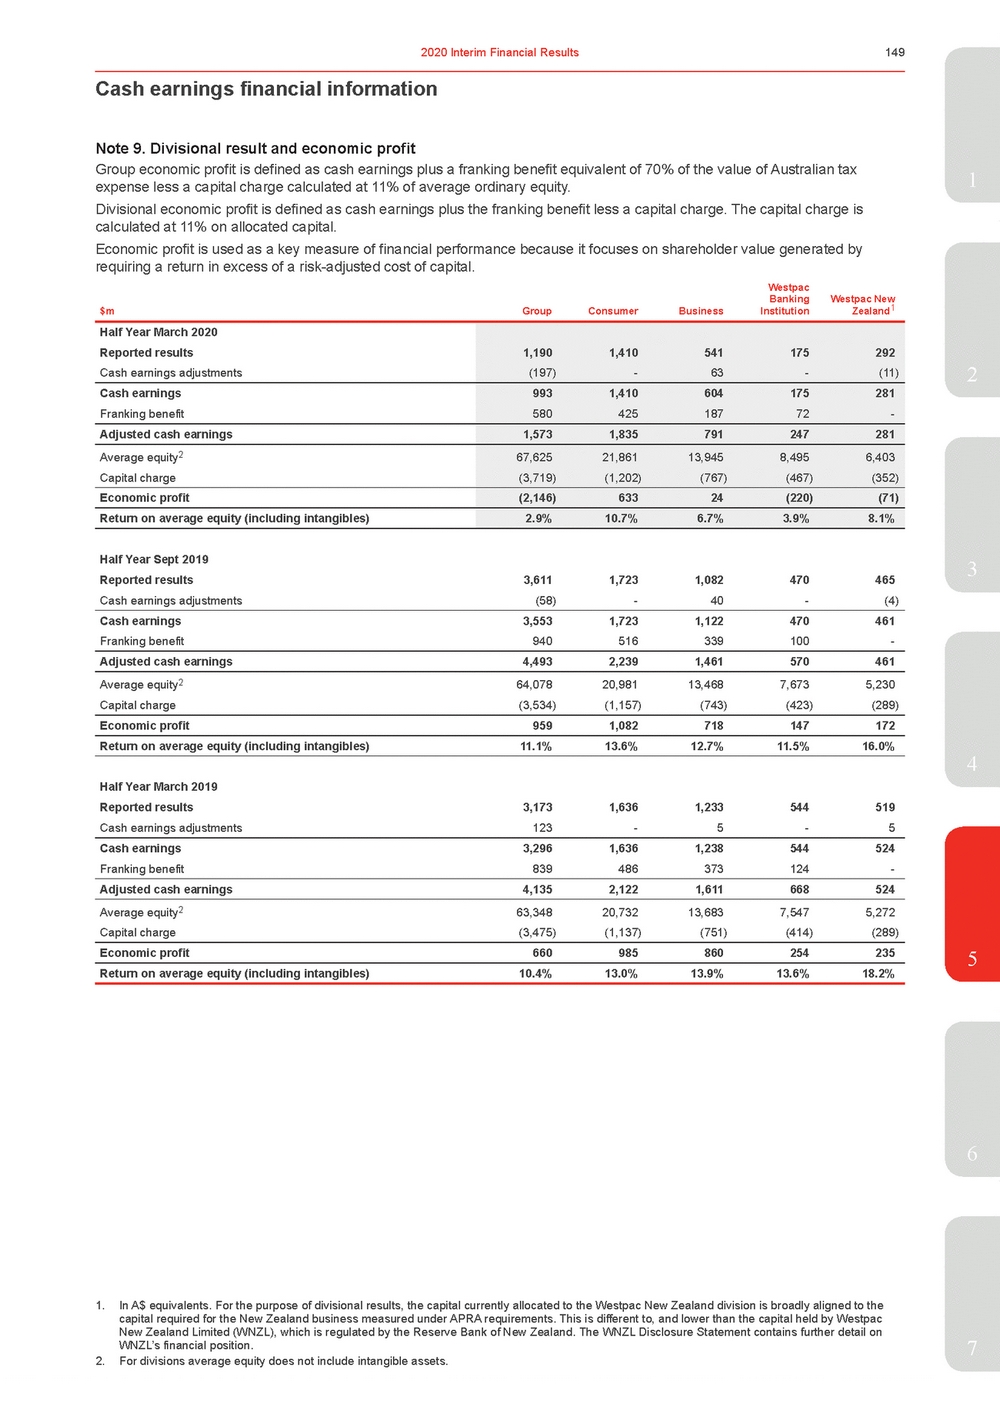 | 1 expense less a capital charge calculated at 11% of average ordinary equity. Divisional economic profit is defined as cash earnings plus the franking benefit less a capital charge. The capital charge is calculated at 11% on allocated capital. Economic profit is used as a key measure of financial performance because it focuses on shareholder value generated by requiring a return in excess of a risk-adjusted cost of capital. $mGroupConsumerBusiness Westpac Banking Institution Westpac New Zealand1 Half Year March 2020 Reported results Cash earnings adjustments 1,190 (197) 1,410541 -63 175292 -(11) Cash earnings Franking benefit 993 580 1,410604 425187 175281 72-Adjusted cash earnings 1,573 1,835791 247281 Average equity2 Capital charge 67,625 (3,719) 21,86113,945 (1,202)(767) 8,4956,403 (467)(352) Economic profit (2,146) 63324 (220)(71) Return on average equity (including intangibles) 2.9% 10.7%6.7% 3.9%8.1% Half Year Sept 2019 Reported results 3,611 1,723 1,082 470 465 Cash earnings adjustments (58) - 40 - (4) Cash earnings 3,553 1,723 1,122 470 461 Franking benefit 940 516 339 100 - Adjusted cash earnings 4,493 2,239 1,461 570 461 Average equity2 64,078 20,981 13,468 7,673 5,230 Capital charge (3,534) (1,157) (743) (423) (289) Economic profit 959 1,082 718 147 172 Return on average equity (including intangibles) 11.1% 13.6% 12.7% 11.5% 16.0% Half Year March 2019 Reported results 3,173 1,636 1,233 544 519 Cash earnings adjustments 123 - 5 - 5 Cash earnings 3,296 1,636 1,238 544 524 Franking benefit 839 486 373 124 - Adjusted cash earnings 4,135 2,122 1,611 668 524 Average equity2 63,348 20,732 13,683 7,547 5,272 Capital charge (3,475) (1,137) (751) (414) (289) Economic profit 660 985 860 254 235 Return on average equity (including intangibles) 10.4% 13.0% 13.9% 13.6% 18.2% 4 5 6 1. In A$ equivalents. For the purpose of divisional results, the capital currently allocated to the Westpac New Zealand division is broadly aligned to the capital required for the New Zealand business measured under APRA requirements. This is different to, and lower than the capital held by Westpac New Zealand Limited (WNZL), which is regulated by the Reserve Bank of New Zealand. The WNZL Disclosure Statement contains further detail on WNZL’s financial position.7 2. For divisions average equity does not include intangible assets. |
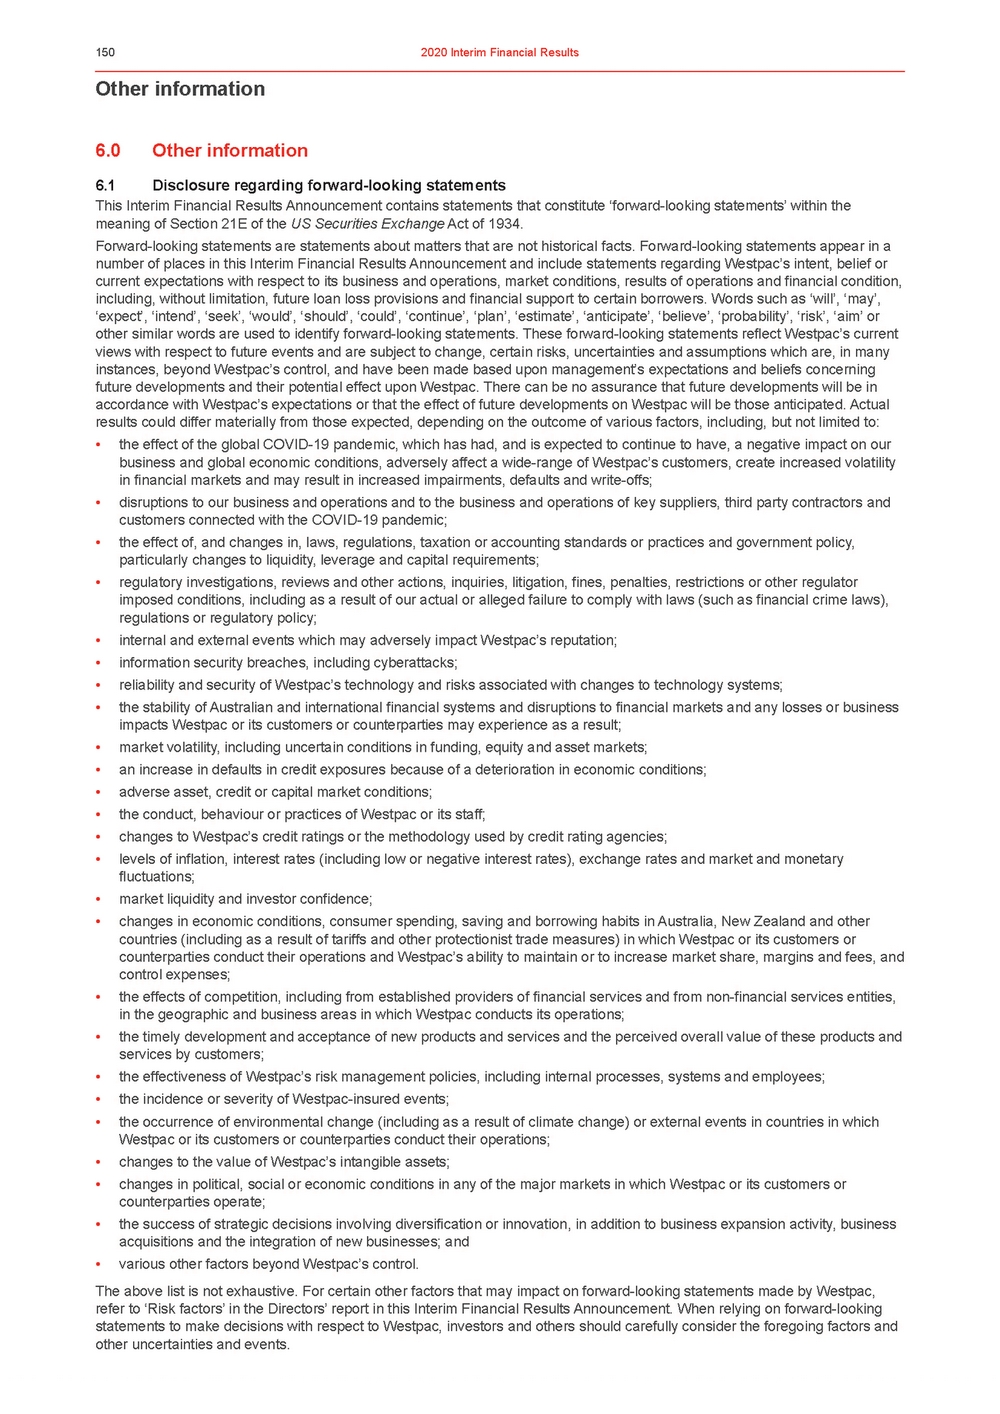 | Other information 6.0Other information 6.1Disclosure regarding forward-looking statements This Interim Financial Results Announcement contains statements that constitute ‘forward-looking statements’ within the meaning of Section 21E of the US Securities Exchange Act of 1934. Forward-looking statements are statements about matters that are not historical facts. Forward-looking statements appear in a number of places in this Interim Financial Results Announcement and include statements regarding Westpac’s intent, belief or current expectations with respect to its business and operations, market conditions, results of operations and financial condition, including, without limitation, future loan loss provisions and financial support to certain borrowers. Words such as ‘will’, ‘may’, ‘expect’, ‘intend’, ‘seek’, ‘would’, ‘should’, ‘could’, ‘continue’, ‘plan’, ‘estimate’, ‘anticipate’, ‘believe’, ‘probability’, ‘risk’, ‘aim’ or other similar words are used to identify forward-looking statements. These forward-looking statements reflect Westpac’s current views with respect to future events and are subject to change, certain risks, uncertainties and assumptions which are, in many instances, beyond Westpac’s control, and have been made based upon management’s expectations and beliefs concerning future developments and their potential effect upon Westpac. There can be no assurance that future developments will be in accordance with Westpac’s expectations or that the effect of future developments on Westpac will be those anticipated. Actual results could differ materially from those expected, depending on the outcome of various factors, including, but not limited to: •the effect of the global COVID-19 pandemic, which has had, and is expected to continue to have, a negative impact on our business and global economic conditions, adversely affect a wide-range of Westpac’s customers, create increased volatility in financial markets and may result in increased impairments, defaults and write-offs; •disruptions to our business and operations and to the business and operations of key suppliers, third party contractors and customers connected with the COVID-19 pandemic; •the effect of, and changes in, laws, regulations, taxation or accounting standards or practices and government policy, particularly changes to liquidity, leverage and capital requirements; •regulatory investigations, reviews and other actions, inquiries, litigation, fines, penalties, restrictions or other regulator imposed conditions, including as a result of our actual or alleged failure to comply with laws (such as financial crime laws), regulations or regulatory policy; •internal and external events which may adversely impact Westpac’s reputation; •information security breaches, including cyberattacks; •reliability and security of Westpac’s technology and risks associated with changes to technology systems; •the stability of Australian and international financial systems and disruptions to financial markets and any losses or business impacts Westpac or its customers or counterparties may experience as a result; •market volatility, including uncertain conditions in funding, equity and asset markets; •an increase in defaults in credit exposures because of a deterioration in economic conditions; •adverse asset, credit or capital market conditions; •the conduct, behaviour or practices of Westpac or its staff; •changes to Westpac’s credit ratings or the methodology used by credit rating agencies; •levels of inflation, interest rates (including low or negative interest rates), exchange rates and market and monetary fluctuations; •market liquidity and investor confidence; •changes in economic conditions, consumer spending, saving and borrowing habits in Australia, New Zealand and other countries (including as a result of tariffs and other protectionist trade measures) in which Westpac or its customers or counterparties conduct their operations and Westpac’s ability to maintain or to increase market share, margins and fees, and control expenses; •the effects of competition, including from established providers of financial services and from non-financial services entities, in the geographic and business areas in which Westpac conducts its operations; •the timely development and acceptance of new products and services and the perceived overall value of these products and services by customers; •the effectiveness of Westpac’s risk management policies, including internal processes, systems and employees; •the incidence or severity of Westpac-insured events; •the occurrence of environmental change (including as a result of climate change) or external events in countries in which Westpac or its customers or counterparties conduct their operations; •changes to the value of Westpac’s intangible assets; •changes in political, social or economic conditions in any of the major markets in which Westpac or its customers or counterparties operate; •the success of strategic decisions involving diversification or innovation, in addition to business expansion activity, business acquisitions and the integration of new businesses; and •various other factors beyond Westpac’s control. The above list is not exhaustive. For certain other factors that may impact on forward-looking statements made by Westpac, refer to ‘Risk factors’ in the Directors’ report in this Interim Financial Results Announcement. When relying on forward-looking statements to make decisions with respect to Westpac, investors and others should carefully consider the foregoing factors and other uncertainties and events. |
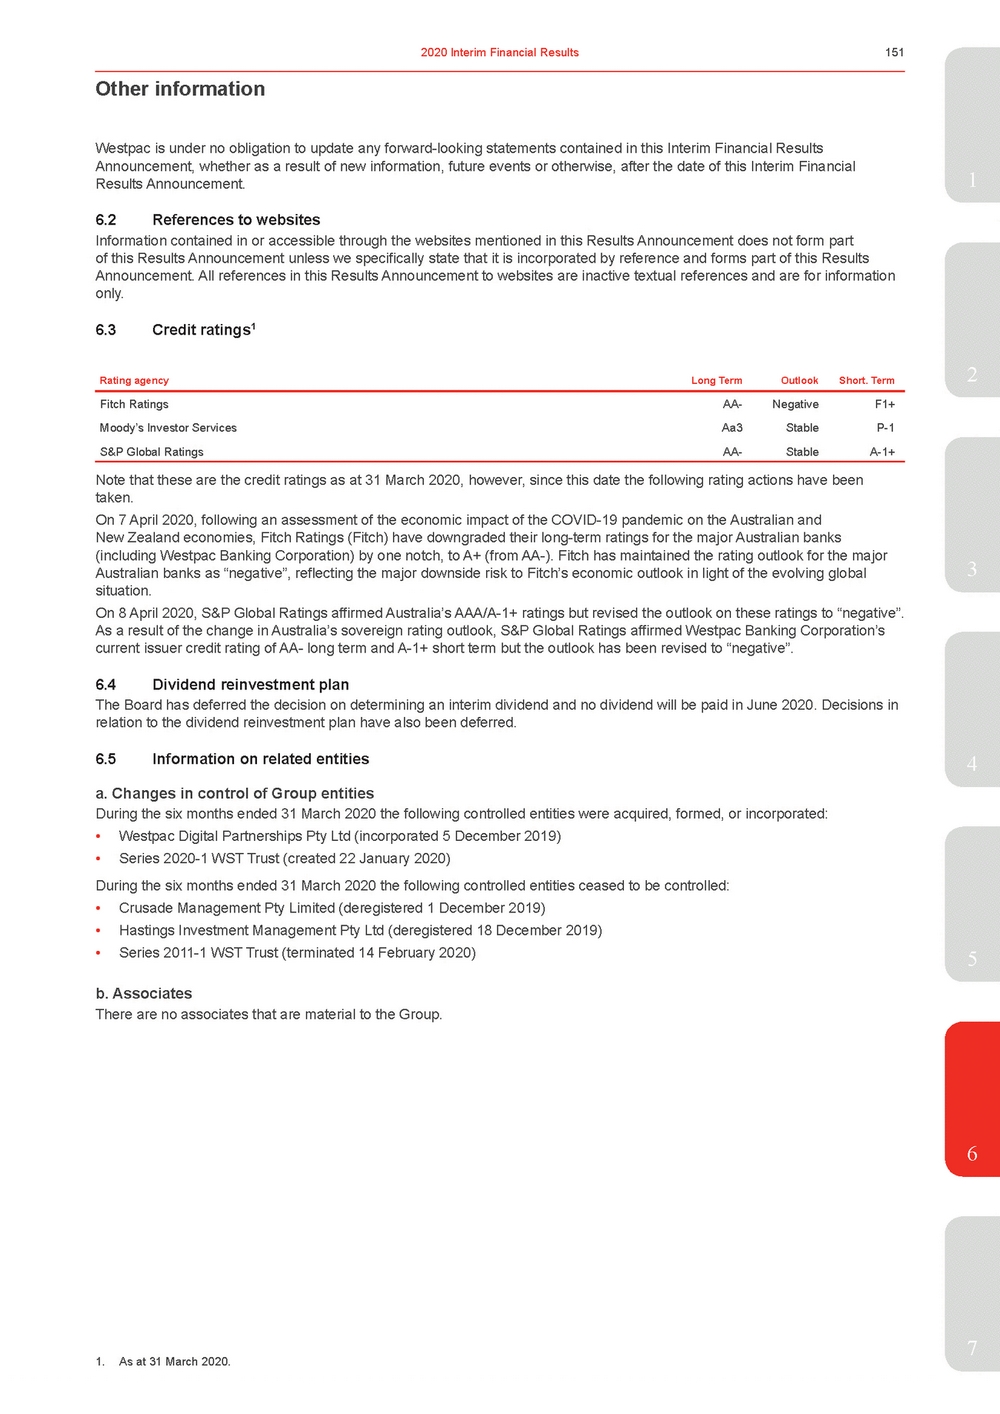 | Westpac is under no obligation to update any forward-looking statements contained in this Interim Financial Results Announcement, whether as a result of new information, future events or otherwise, after the date of this Interim Financial Results Announcement.1 6.2References to websites Information contained in or accessible through the websites mentioned in this Results Announcement does not form part of this Results Announcement unless we specifically state that it is incorporated by reference and forms part of this Results Announcement. All references in this Results Announcement to websites are inactive textual references and are for information only. 6.3Credit ratings1 Rating agency Long TermO utlookShort. Term Fitch RatingsAA-NegativeF1+ Moody’s Investor ServicesAa3StableP-1 S&P Global RatingsAA-StableA-1+ Note that these are the credit ratings as at 31 March 2020, however, since this date the following rating actions have been taken. On 7 April 2020, following an assessment of the economic impact of the COVID-19 pandemic on the Australian and New Zealand economies, Fitch Ratings (Fitch) have downgraded their long-term ratings for the major Australian banks (including Westpac Banking Corporation) by one notch, to A+ (from AA-). Fitch has maintained the rating outlook for the major Australian banks as “negative”, reflecting the major downside risk to Fitch’s economic outlook in light of the evolving global3 situation. On 8 April 2020, S&P Global Ratings affirmed Australia’s AAA/A-1+ ratings but revised the outlook on these ratings to “negative”. As a result of the change in Australia’s sovereign rating outlook, S&P Global Ratings affirmed Westpac Banking Corporation’s current issuer credit rating of AA-long term and A-1+ short term but the outlook has been revised to “negative”. 6.4Dividend reinvestment plan The Board has deferred the decision on determining an interim dividend and no dividend will be paid in June 2020. Decisions in relation to the dividend reinvestment plan have also been deferred. 6.5Information on related entities4 a. Changes in control of Group entities During the six months ended 31 March 2020 the following controlled entities were acquired, formed, or incorporated: •Westpac Digital Partnerships Pty Ltd (incorporated 5 December 2019) •Series 2020-1 WST Trust (created 22 January 2020) During the six months ended 31 March 2020 the following controlled entities ceased to be controlled: •Crusade Management Pty Limited (deregistered 1 December 2019) •Hastings Investment Management Pty Ltd (deregistered 18 December 2019) •Series 2011-1 WST Trust (terminated 14 February 2020)5 b. Associates There are no associates that are material to the Group. 6 7 1. As at 31 March 2020. |
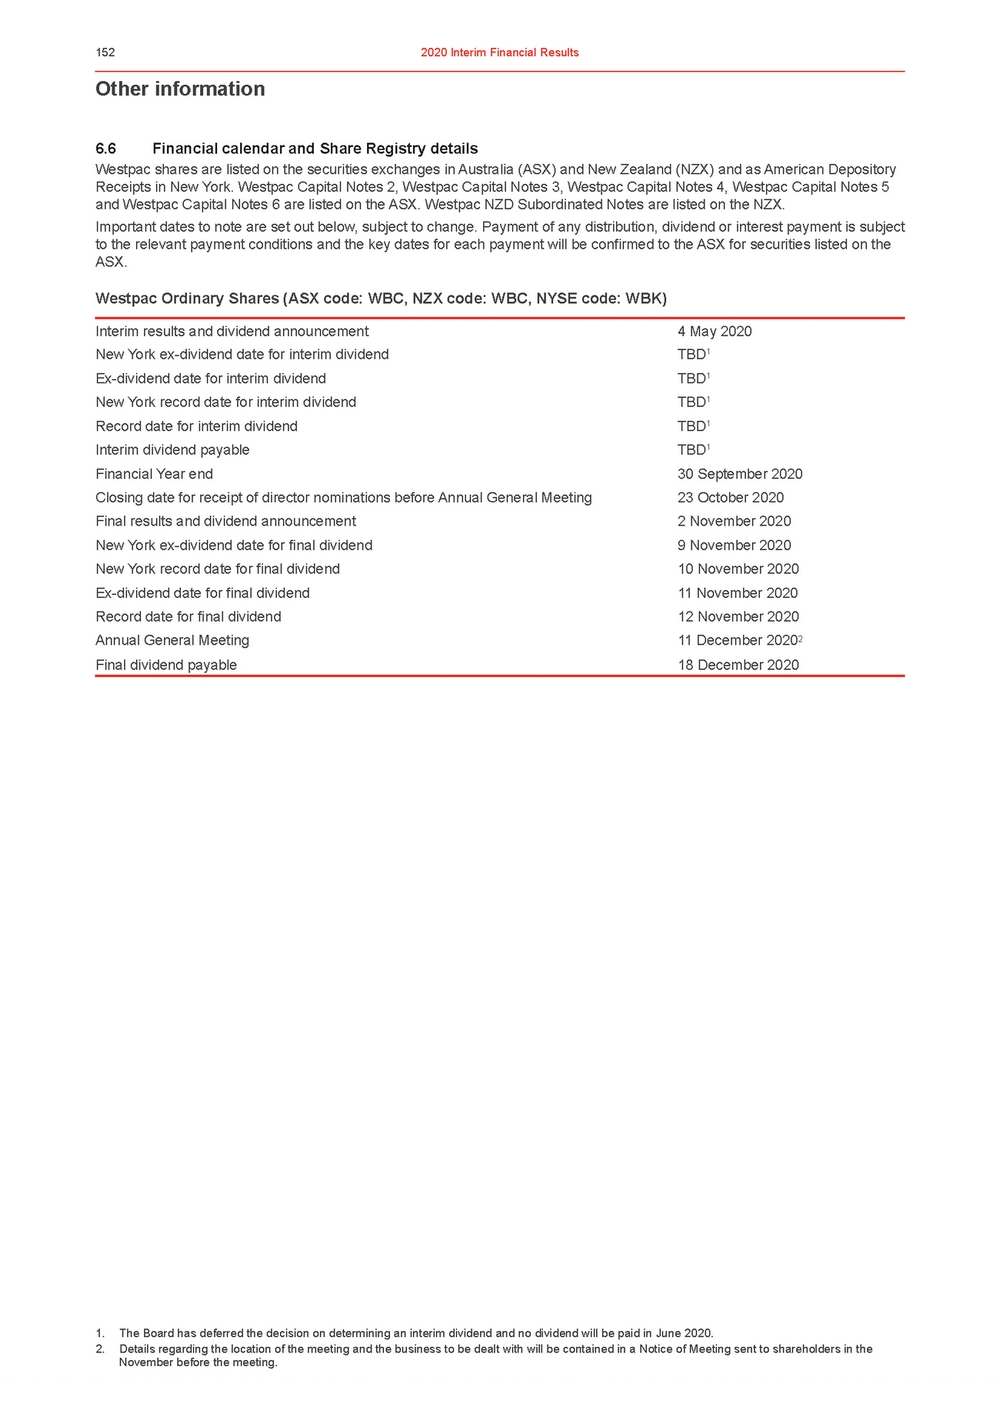 | Other information 6.6Financial calendar and Share Registry details Westpac shares are listed on the securities exchanges in Australia (ASX) and New Zealand (NZX) and as American Depository Receipts in New York. Westpac Capital Notes 2, Westpac Capital Notes 3, Westpac Capital Notes 4, Westpac Capital Notes 5 and Westpac Capital Notes 6 are listed on the ASX. Westpac NZD Subordinated Notes are listed on the NZX. Important dates to note are set out below, subject to change. Payment of any distribution, dividend or interest payment is subject to the relevant payment conditions and the key dates for each payment will be confirmed to the ASX for securities listed on the ASX. Westpac Ordinary Shares (ASX code: WBC, NZX code: WBC, NYSE code: WBK) Interim results and dividend announcement 4 May 2020 New York ex-dividend date for interim dividendTBD1 Ex-dividend date for interim dividendTBD1 New York record date for interim dividendTBD1 Record date for interim dividendTBD1 Interim dividend payableTBD1 Financial Year end30 September Closing date for receipt of director nominations before Annual General Meeting23 October 20 Final results and dividend announcement2 November 2 New York ex-dividend date for final dividend9 November 2 New York record date for final dividend10 November Ex-dividend date for final dividend11 November 2 Record date for final dividend12 November Annual General Meeting11 December 2 Final dividend payable18 December 20 020 020 2020 020 2020 0202 2020 1. The Board has deferred the decision on determining an interim dividend and no dividend will be paid in June 2020. 2. Details regarding the location of the meeting and the business to be dealt with will be contained in a Notice of Meeting sent to shareholders in the November before the meeting. |
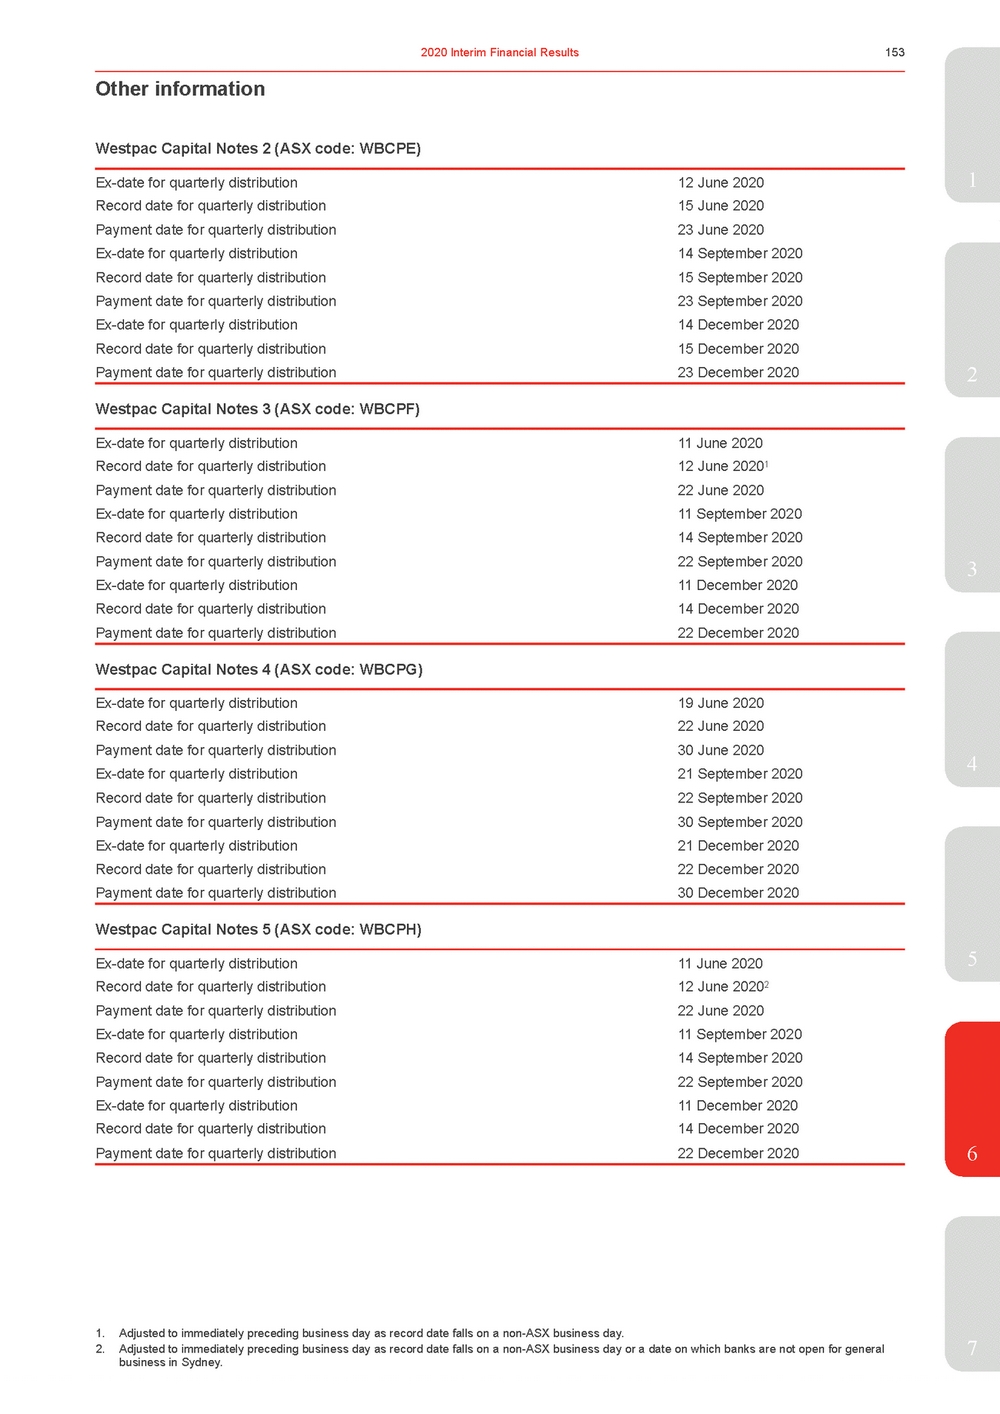 | Westpac Capital Notes 2 (ASX code: WBCPE) Ex-date for quarterly distribution 12 June 2020 Record date for quarterly distribution15 June 2020 Payment date for quarterly distribution23 June 2020 Ex-date for quarterly distribution14 September 2 Record date for quarterly distribution15 September 2 Payment date for quarterly distribution23 September 2 Ex-date for quarterly distribution14 December 2 Record date for quarterly distribution15 December 2 Payment date for quarterly distribution23 December 2 020 020 020 020 020 0202 Westpac Capital Notes 3 (ASX code: WBCPF) Ex-date for quarterly distribution 11 June 2020 Record date for quarterly distribution12 June 20201 Payment date for quarterly distribution22 June 2020 Ex-date for quarterly distribution11 September 2 Record date for quarterly distribution14 September 2 Payment date for quarterly distribution22 September 2 Ex-date for quarterly distribution11 December 2 Record date for quarterly distribution14 December 2 Payment date for quarterly distribution22 December 2 020 0203 020 020 020 Westpac Capital Notes 4 (ASX code: WBCPG) Ex-date for quarterly distribution 19 June 2020 Record date for quarterly distribution22 June 2020 Payment date for quarterly distribution30 June 2020 Ex-date for quarterly distribution21 September 2 Record date for quarterly distribution22 September 2 Payment date for quarterly distribution30 September 2 Ex-date for quarterly distribution21 December 2 Record date for quarterly distribution22 December 2 Payment date for quarterly distribution30 December 2 020 020 020 020 020 Westpac Capital Notes 5 (ASX code: WBCPH) Ex-date for quarterly distribution 11 June 2020 Record date for quarterly distribution12 June 20202 Payment date for quarterly distribution22 June 2020 Ex-date for quarterly distribution11 September 2 Record date for quarterly distribution14 September 2 Payment date for quarterly distribution22 September 2 Ex-date for quarterly distribution11 December 2 Record date for quarterly distribution14 December 2 Payment date for quarterly distribution22 December 2 020 020 020 020 020 0206 1. Adjusted to immediately preceding business day as record date falls on a non-ASX business day. 2. Adjusted to immediately preceding business day as record date falls on a non-ASX business day or a date on which banks are not open for general7 business in Sydney. |
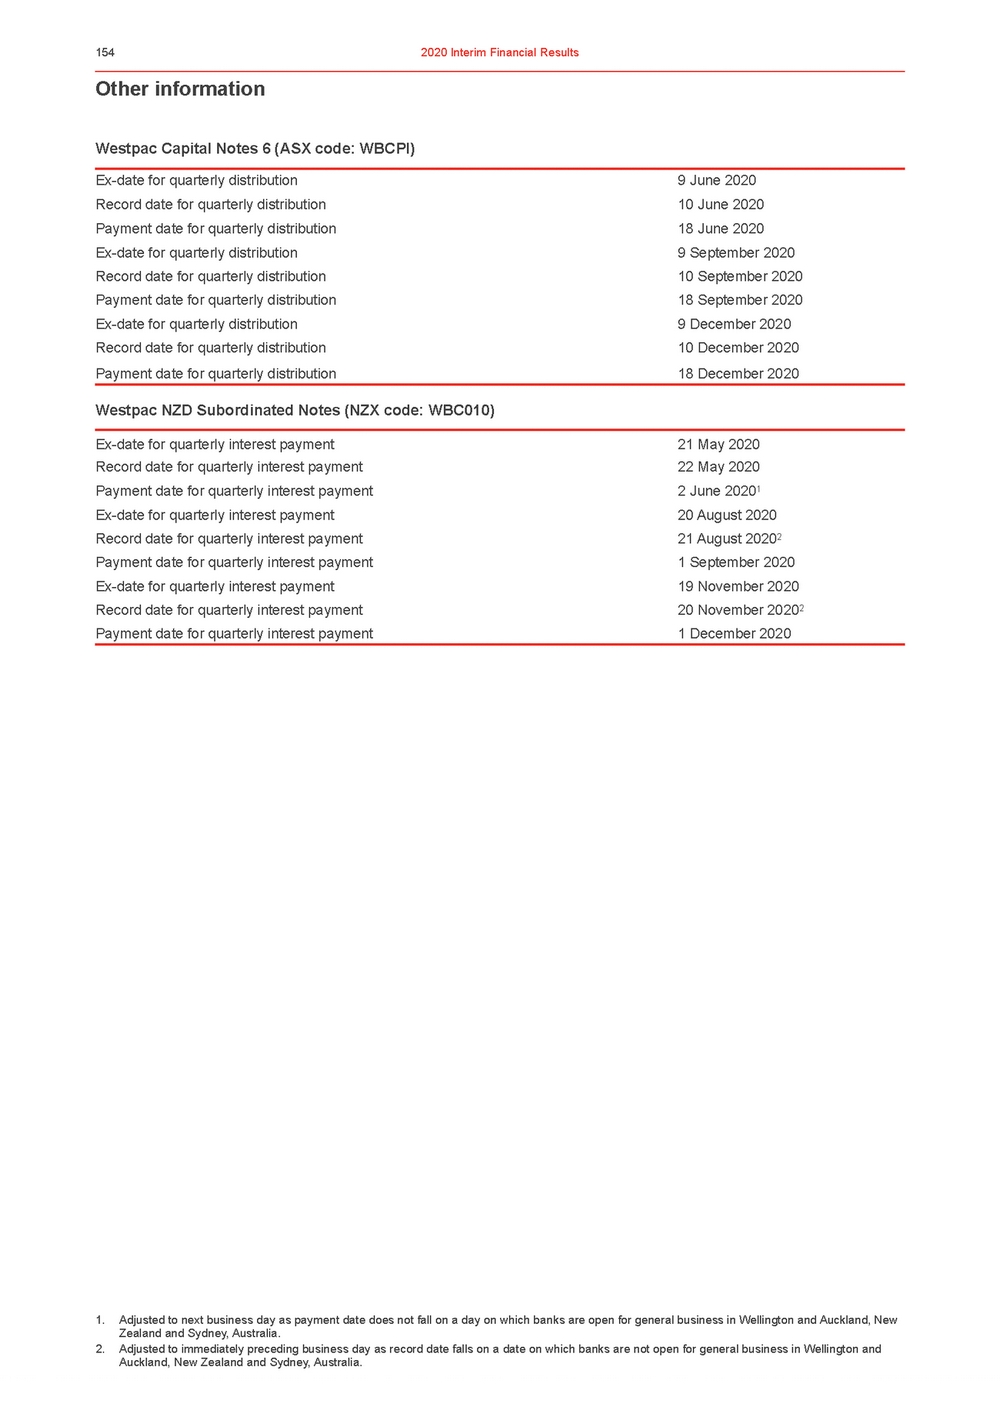 | Other information Westpac Capital Notes 6 (ASX code: WBCPI) Ex-date for quarterly distribution 9 June 2020 Record date for quarterly distribution10 June 2020 Payment date for quarterly distribution18 June 2020 Ex-date for quarterly distribution9 September 2 Record date for quarterly distribution10 September Payment date for quarterly distribution18 September Ex-date for quarterly distribution9 December 2 Record date for quarterly distribution10 December 2 Payment date for quarterly distribution18 December 2 2020 2020 020 020 020 Westpac NZD Subordinated Notes (NZX code: WBC010) Ex-date for quarterly interest payment 21 May 2020 Record date for quarterly interest payment22 May 2020 Payment date for quarterly interest payment2 June 20201 Ex-date for quarterly interest payment20 August 2020 Record date for quarterly interest payment21 August 2020 Payment date for quarterly interest payment1 September 2 Ex-date for quarterly interest payment19 November 2 Record date for quarterly interest payment20 November 2 Payment date for quarterly interest payment1 December 20 020 020 0202 20 1. Adjusted to next business day as payment date does not fall on a day on which banks are open for general business in Wellington and Auckland, New Zealand and Sydney, Australia. 2. Adjusted to immediately preceding business day as record date falls on a date on which banks are not open for general business in Wellington and Auckland, New Zealand and Sydney, Australia. |
 | Registered Office Level 181 275 Kent Street Sydney NSW 2000 Australia Telephone: +61 2 9155 7713 Facsimile: +61 2 8253 4128 International: +61 2 9155 7700 Website: www.westpac.com.au/westpacgroup Share Registries 2 AustraliaNew Zealand Ordinary shares on the main register, Westpac Capital Notes 2, Westpac Capital Notes 3, Westpac Capital Notes 4, Westpac Capital Notes 5, Westpac Capital Notes 6 Ordinary shares on the New Zealand branch register and Westpac NZD Subordinated Notes Link Market Services LimitedLink Market Services Limited Level 12, 680 George StreetLevel 11, Deloitte Centre, 80 Queen Street Sydney NSW 2000 AustraliaAuckland 1010 New Zealand3 Postal Address: Locked Bag A6015, Sydney South NSW 1235, Australia Postal Address: P.O. Box 91976, Auckland 1142, New Zealand Website: www.linkmarketservices.com.au Email: westpac@linkmarketservices.com.au Telephone: 1800 804 255 (toll free in Australia) International: +61 1800 804 255 Facsimile: +61 2 9287 0303 Website: www.linkmarketservices.co.nz Email: enquiries@linkmarketservices.co.nz Telephone: 0800 002 727 (toll free in New Zealand) International: +64 9 375 5998 Facsimile: +64 9 375 5990 4 New YorkFor further information contact: Depositary in USA for American Depositary Shares Listed on New York Stock Exchange (CUSIP 961214301) BNY Mellon Shareowner Services PO Box 505000, Louisville, KY 40233-5000, USA Telephone: +1 888 269 2377 (toll free in US) International: +1 201 680 6825 Media: David Lording, Head of Media Relations +61 419 683 411 Analysts and Investors: Andrew Bowden, Head of Investor Relations +61 438 284 8635 Email: shrrelations@cpushareownerservices.com Website: https://www-us.computershare.com/investor 6 7 |
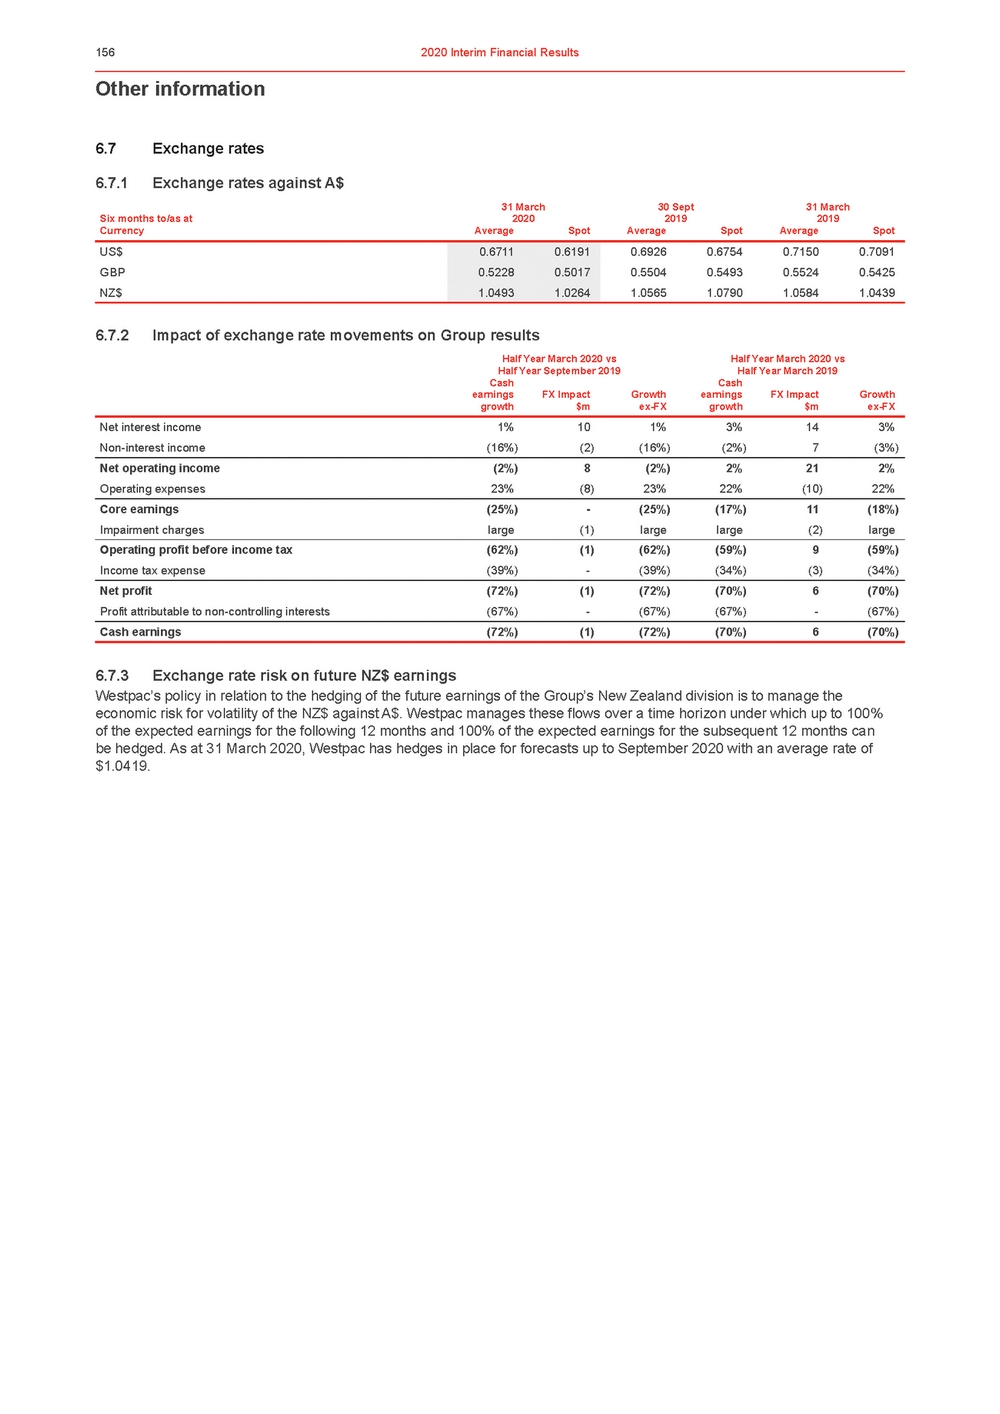 | Other information 6.7Exchange rates 6.7.1Exchange rates against A$ Six months to/as at 31 March 2020 30 Sept 2019 31 March 2019 CurrencyAverageSpotAverageSpotAverageSpot US$0.67110.61910.69260.67540.71500.7091 GBP0.52280.50170.55040.54930.55240.5425 NZ$1.04931.02641.05651.07901.05841.0439 6.7.2Impact of exchange rate movements on Group results Half Year March 2020 vs Half Year September 2019 Cash Half Year March 2020 vs Half Year March 2019 Cash 6.7.3Exchange rate risk on future NZ$ earnings Westpac’s policy in relation to the hedging of the future earnings of the Group’s New Zealand division is to manage the economic risk for volatility of the NZ$ against A$. Westpac manages these flows over a time horizon under which up to 100% of the expected earnings for the following 12 months and 100% of the expected earnings for the subsequent 12 months can be hedged. As at 31 March 2020, Westpac has hedges in place for forecasts up to September 2020 with an average rate of $1.0419. |
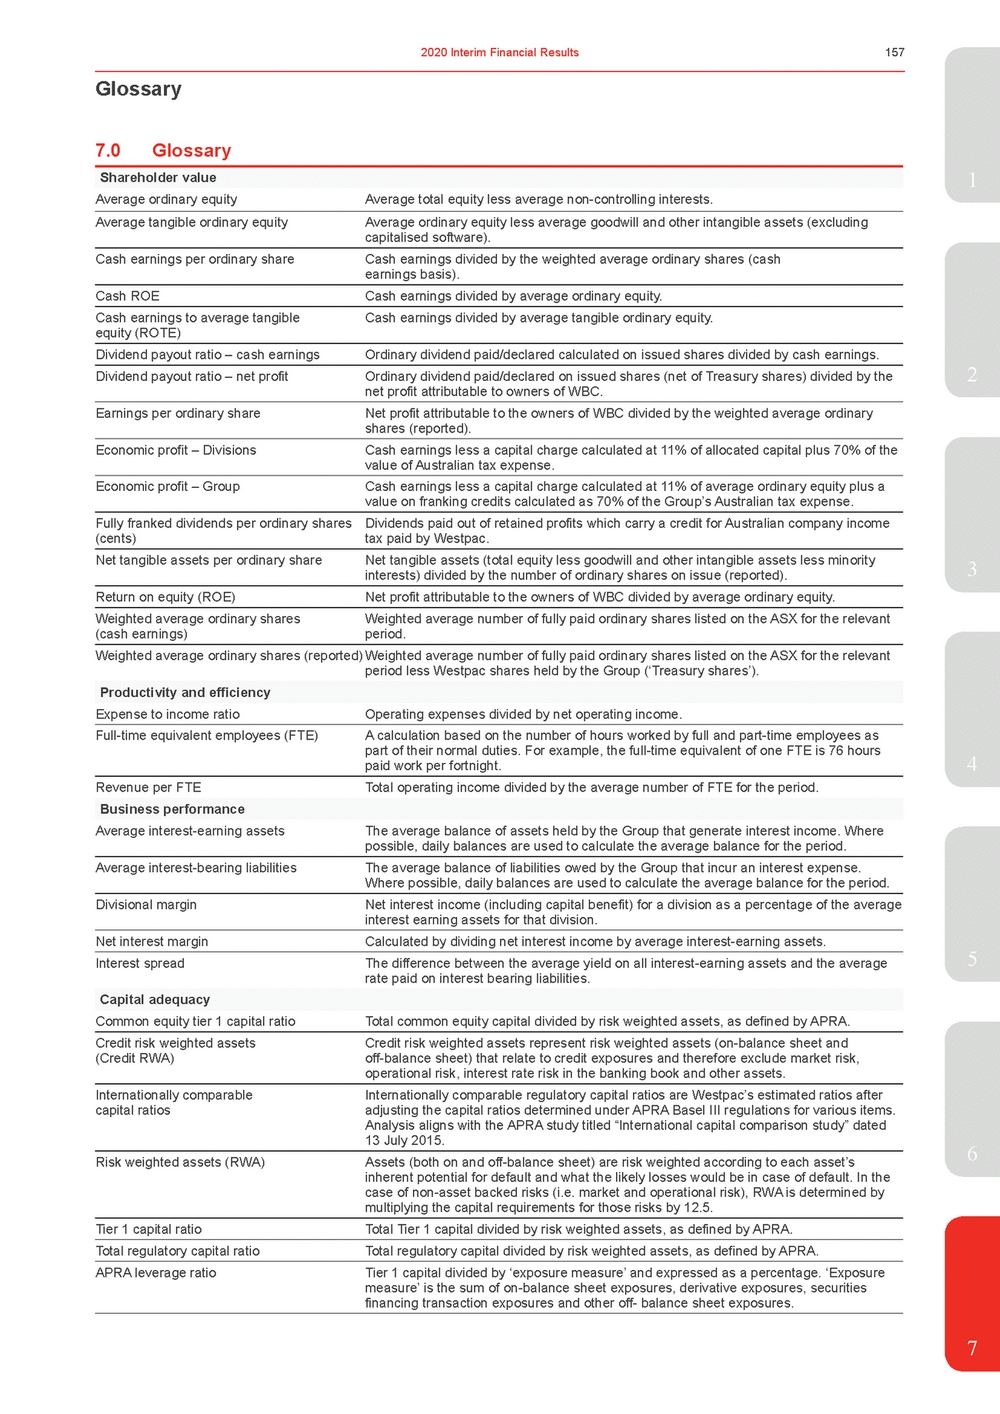 | 7.0Glossary Shareholder value1 Average ordinary equityAverage total equity less average non-controlling interests. Average tangible ordinary equityAverage ordinary equity less average goodwill and other intangible assets (excluding capitalised software). Cash earnings per ordinary shareCash earnings divided by the weighted average ordinary shares (cash earnings basis). Cash ROECash earnings divided by average ordinary equity. Cash earnings to average tangible equity (ROTE) Cash earnings divided by average tangible ordinary equity. Dividend payout ratio – cash earningsOrdinary dividend paid/declared calculated on issued shares divided by cash earnings. Dividend payout ratio – net profitOrdinary dividend paid/declared on issued shares (net of Treasury shares) divided by the2 net profit attributable to owners of WBC. Earnings per ordinary shareNet profit attributable to the owners of WBC divided by the weighted average ordinary shares (reported). Economic profit – DivisionsCash earnings less a capital charge calculated at 11% of allocated capital plus 70% of the value of Australian tax expense. Economic profit – GroupCash earnings less a capital charge calculated at 11% of average ordinary equity plus a value on franking credits calculated as 70% of the Group’s Australian tax expense. Fully franked dividends per ordinary shares (cents) Dividends paid out of retained profits which carry a credit for Australian company income tax paid by Westpac. 3 Return on equity (ROE)Net profit attributable to the owners of WBC divided by average ordinary equity. Weighted average ordinary shares (cash earnings) Weighted average number of fully paid ordinary shares listed on the ASX for the relevant period. Weighted average ordinary shares (reported) Weighted average number of fully paid ordinary shares listed on the ASX for the relevant period less Westpac shares held by the Group (‘Treasury shares’). Productivity and efficiency Expense to income ratioOperating expenses divided by net operating income. Full-time equivalent employees (FTE)A calculation based on the number of hours worked by full and part-time employees as part of their normal duties. For example, the full-time equivalent of one FTE is 76 hours paid work per fortnight.4 Revenue per FTETotal operating income divided by the average number of FTE for the period. Business performance Average interest-earning assetsThe average balance of assets held by the Group that generate interest income. Where possible, daily balances are used to calculate the average balance for the period. Average interest-bearing liabilitiesThe average balance of liabilities owed by the Group that incur an interest expense. Where possible, daily balances are used to calculate the average balance for the period. Divisional marginNet interest income (including capital benefit) for a division as a percentage of the average interest earning assets for that division. Net interest marginCalculated by dividing net interest income by average interest-earning assets. Interest spreadThe difference between the average yield on all interest-earning assets and the average5 rate paid on interest bearing liabilities. Capital adequacy Common equity tier 1 capital ratioTotal common equity capital divided by risk weighted assets, as defined by APRA. Credit risk weighted assets (Credit RWA) Internationally comparable capital ratios Credit risk weighted assets represent risk weighted assets (on-balance sheet and off-balance sheet) that relate to credit exposures and therefore exclude market risk, operational risk, interest rate risk in the banking book and other assets. Internationally comparable regulatory capital ratios are Westpac’s estimated ratios after adjusting the capital ratios determined under APRA Basel III regulations for various items. Analysis aligns with the APRA study titled “International capital comparison study” dated 13 July 2015. Risk weighted assets (RWA)Assets (both on and off-balance sheet) are risk weighted according to each asset’s6 inherent potential for default and what the likely losses would be in case of default. In the case of non-asset backed risks (i.e. market and operational risk), RWA is determined by multiplying the capital requirements for those risks by 12.5. Tier 1 capital ratioTotal Tier 1 capital divided by risk weighted assets, as defined by APRA. Total regulatory capital ratioTotal regulatory capital divided by risk weighted assets, as defined by APRA. APRA leverage ratioTier 1 capital divided by ‘exposure measure’ and expressed as a percentage. ‘Exposure measure’ is the sum of on-balance sheet exposures, derivative exposures, securities financing transaction exposures and other off-balance sheet exposures. 7 |
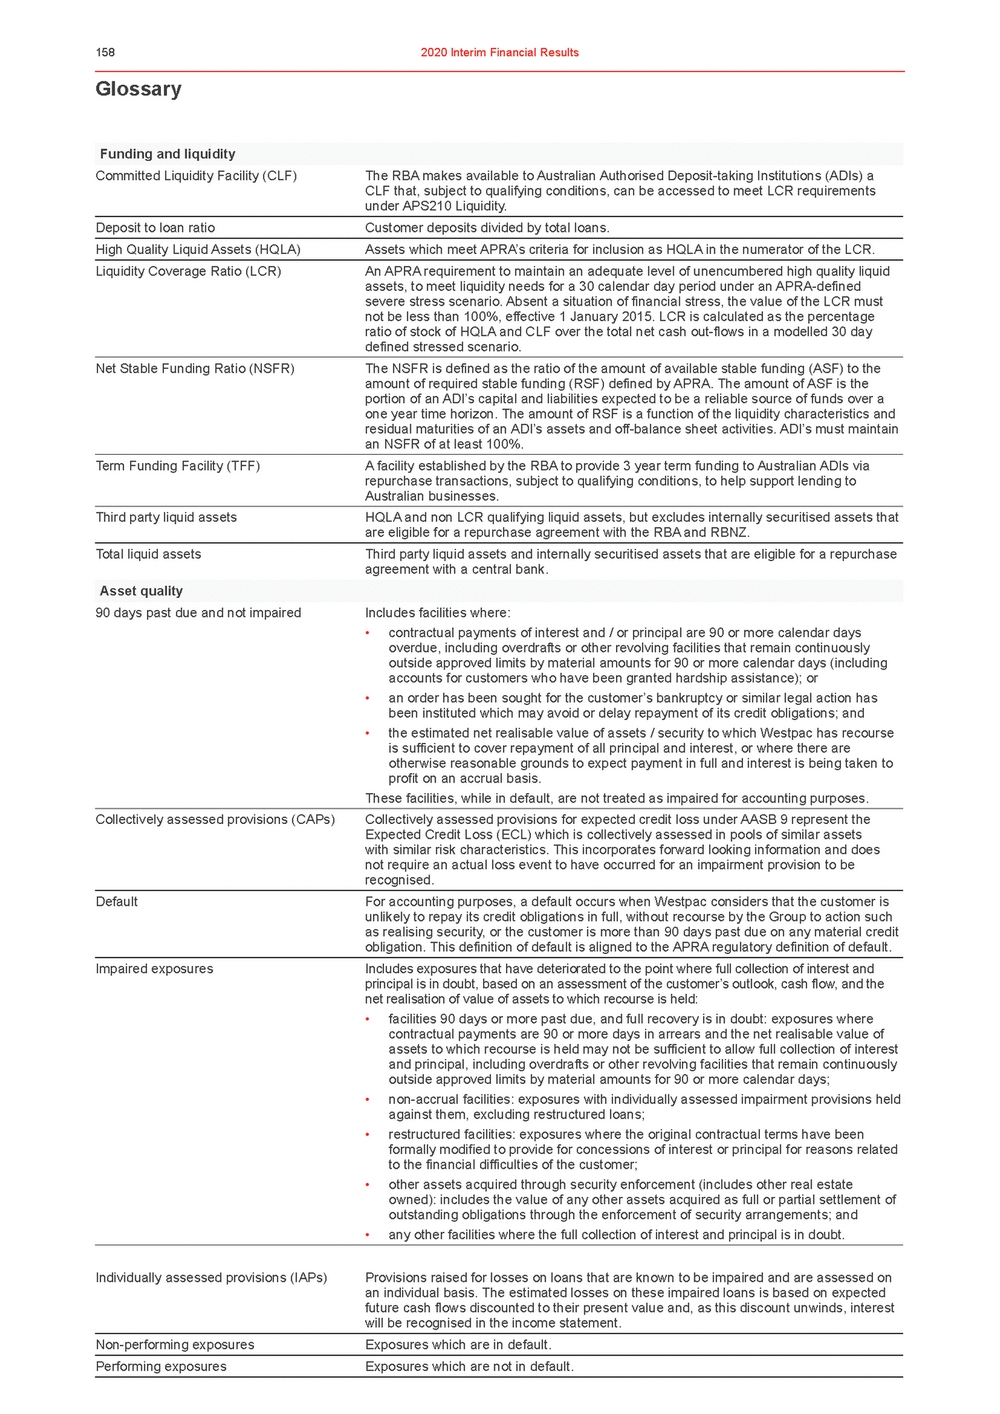 | Glossary Funding and liquidity Committed Liquidity Facility (CLF) The RBA makes available to Australian Authorised Deposit-taking Institutions (ADIs) a CLF that, subject to qualifying conditions, can be accessed to meet LCR requirements under APS210 Liquidity. Deposit to loan ratioCustomer deposits divided by total loans. High Quality Liquid Assets (HQLA)Assets which meet APRA’s criteria for inclusion as HQLA in the numerator of the LCR. Liquidity Coverage Ratio (LCR)An APRA requirement to maintain an adequate level of unencumbered high quality liquid assets, to meet liquidity needs for a 30 calendar day period under an APRA-defined severe stress scenario. Absent a situation of financial stress, the value of the LCR must not be less than 100%, effective 1 January 2015. LCR is calculated as the percentage ratio of stock of HQLA and CLF over the total net cash out-flows in a modelled 30 day defined stressed scenario. Net Stable Funding Ratio (NSFR)The NSFR is defined as the ratio of the amount of available stable funding (ASF) to the amount of required stable funding (RSF) defined by APRA. The amount of ASF is the portion of an ADI’s capital and liabilities expected to be a reliable source of funds over a one year time horizon. The amount of RSF is a function of the liquidity characteristics and residual maturities of an ADI’s assets and off-balance sheet activities. ADI’s must maintain an NSFR of at least 100%. Term Funding Facility (TFF)A facility established by the RBA to provide 3 year term funding to Australian ADIs via repurchase transactions, subject to qualifying conditions, to help support lending to Australian businesses. Third party liquid assetsHQLA and non LCR qualifying liquid assets, but excludes internally securitised assets that are eligible for a repurchase agreement with the RBA and RBNZ. Total liquid assetsThird party liquid assets and internally securitised assets that are eligible for a repurchase agreement with a central bank. Asset quality 90 days past due and not impairedIncludes facilities where: •contractual payments of interest and / or principal are 90 or more calendar days overdue, including overdrafts or other revolving facilities that remain continuously outside approved limits by material amounts for 90 or more calendar days (including accounts for customers who have been granted hardship assistance); or •an order has been sought for the customer’s bankruptcy or similar legal action has been instituted which may avoid or delay repayment of its credit obligations; and •the estimated net realisable value of assets / security to which Westpac has recourse is sufficient to cover repayment of all principal and interest, or where there are otherwise reasonable grounds to expect payment in full and interest is being taken to profit on an accrual basis. These facilities, while in default, are not treated as impaired for accounting purposes. Collectively assessed provisions (CAPs)Collectively assessed provisions for expected credit loss under AASB 9 represent the Expected Credit Loss (ECL) which is collectively assessed in pools of similar assets with similar risk characteristics. This incorporates forward looking information and does not require an actual loss event to have occurred for an impairment provision to be recognised. DefaultFor accounting purposes, a default occurs when Westpac considers that the customer is unlikely to repay its credit obligations in full, without recourse by the Group to action such as realising security, or the customer is more than 90 days past due on any material credit obligation. This definition of default is aligned to the APRA regulatory definition of default. Impaired exposuresIncludes exposures that have deteriorated to the point where full collection of interest and principal is in doubt, based on an assessment of the customer’s outlook, cash flow, and the net realisation of value of assets to which recourse is held: •facilities 90 days or more past due, and full recovery is in doubt: exposures where contractual payments are 90 or more days in arrears and the net realisable value of assets to which recourse is held may not be sufficient to allow full collection of interest and principal, including overdrafts or other revolving facilities that remain continuously outside approved limits by material amounts for 90 or more calendar days; •non-accrual facilities: exposures with individually assessed impairment provisions held against them, excluding restructured loans; •restructured facilities: exposures where the original contractual terms have been formally modified to provide for concessions of interest or principal for reasons related to the financial difficulties of the customer; •other assets acquired through security enforcement (includes other real estate owned): includes the value of any other assets acquired as full or partial settlement of outstanding obligations through the enforcement of security arrangements; and •any other facilities where the full collection of interest and principal is in doubt. Individually assessed provisions (IAPs)Provisions raised for losses on loans that are known to be impaired and are assessed on an individual basis. The estimated losses on these impaired loans is based on expected future cash flows discounted to their present value and, as this discount unwinds, interest will be recognised in the income statement. Non-performing exposuresExposures which are in default. Performing exposuresExposures which are not in default. |
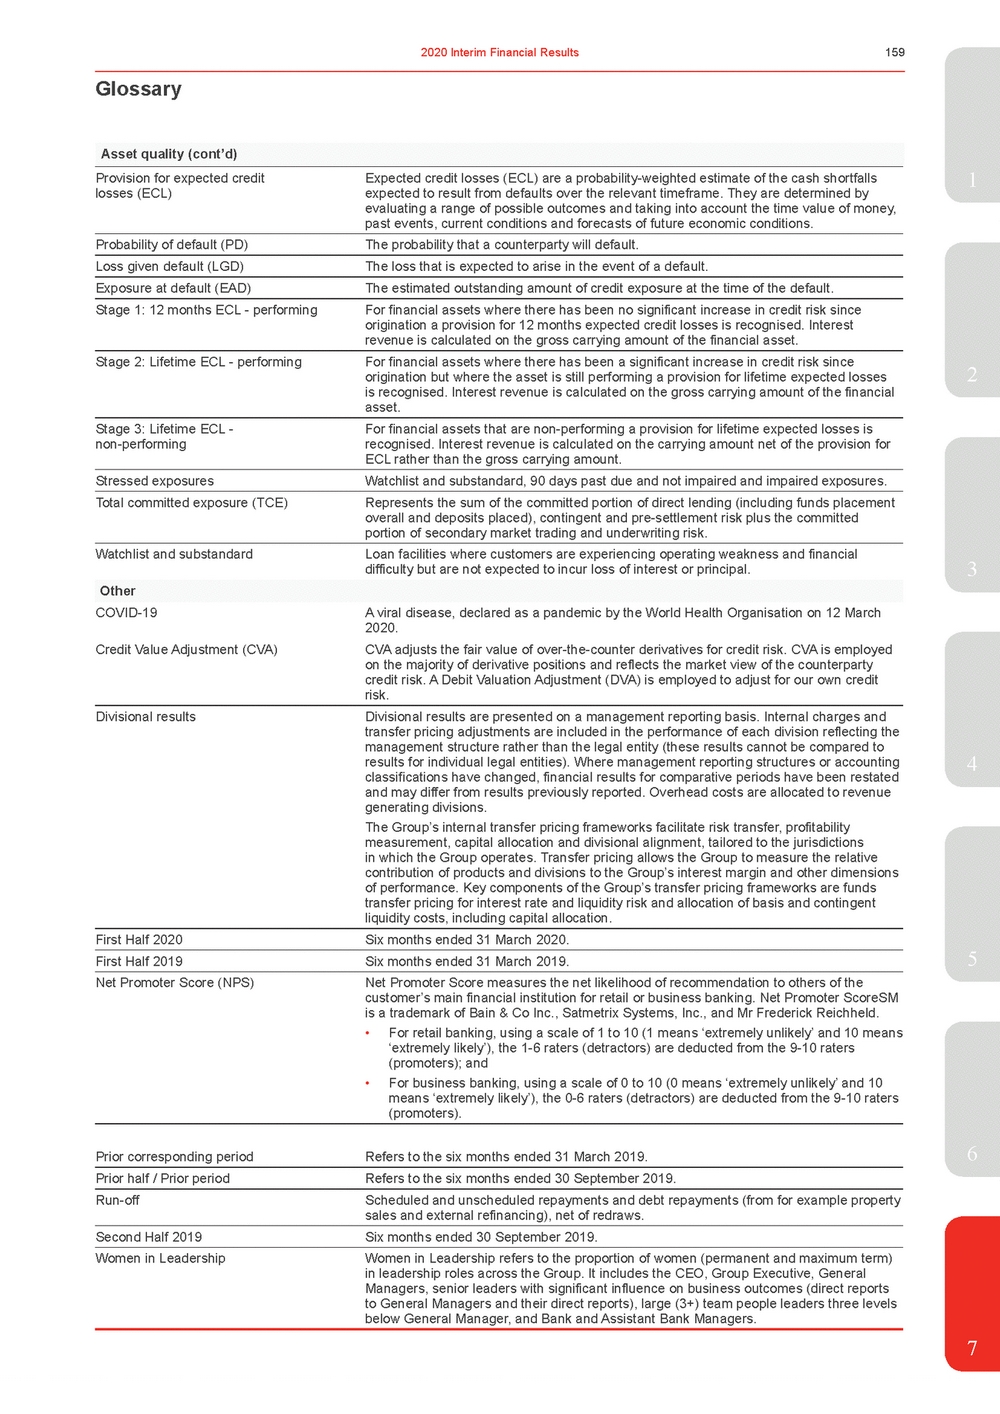 | Asset quality (cont’d) Provision for expected credit losses (ECL) Expected credit losses (ECL) are a probability-weighted estimate of the cash shortfalls1 expected to result from defaults over the relevant timeframe. They are determined by evaluating a range of possible outcomes and taking into account the time value of money, past events, current conditions and forecasts of future economic conditions. Probability of default (PD)The probability that a counterparty will default. Loss given default (LGD)The loss that is expected to arise in the event of a default. Exposure at default (EAD)The estimated outstanding amount of credit exposure at the time of the default. Stage 1: 12 months ECL - performingFor financial assets where there has been no significant increase in credit risk since origination a provision for 12 months expected credit losses is recognised. Interest revenue is calculated on the gross carrying amount of the financial asset. Stage 2: Lifetime ECL - performingFor financial assets where there has been a significant increase in credit risk since origination but where the asset is still performing a provision for lifetime expected losses2 is recognised. Interest revenue is calculated on the gross carrying amount of the financial asset. Stage 3: Lifetime ECL - non-performing For financial assets that are non-performing a provision for lifetime expected losses is recognised. Interest revenue is calculated on the carrying amount net of the provision for ECL rather than the gross carrying amount. Stressed exposuresWatchlist and substandard, 90 days past due and not impaired and impaired exposures. Total committed exposure (TCE)Represents the sum of the committed portion of direct lending (including funds placement overall and deposits placed), contingent and pre-settlement risk plus the committed portion of secondary market trading and underwriting risk. Watchlist and substandardLoan facilities where customers are experiencing operating weakness and financial difficulty but are not expected to incur loss of interest or principal.3 Other COVID-19A viral disease, declared as a pandemic by the World Health Organisation on 12 March 2020. Credit Value Adjustment (CVA)CVA adjusts the fair value of over-the-counter derivatives for credit risk. CVA is employed on the majority of derivative positions and reflects the market view of the counterparty credit risk. A Debit Valuation Adjustment (DVA) is employed to adjust for our own credit risk. Divisional resultsDivisional results are presented on a management reporting basis. Internal charges and transfer pricing adjustments are included in the performance of each division reflecting the management structure rather than the legal entity (these results cannot be compared to results for individual legal entities). Where management reporting structures or accounting4 classifications have changed, financial results for comparative periods have been restated and may differ from results previously reported. Overhead costs are allocated to revenue generating divisions. The Group’s internal transfer pricing frameworks facilitate risk transfer, profitability measurement, capital allocation and divisional alignment, tailored to the jurisdictions in which the Group operates. Transfer pricing allows the Group to measure the relative contribution of products and divisions to the Group’s interest margin and other dimensions of performance. Key components of the Group’s transfer pricing frameworks are funds transfer pricing for interest rate and liquidity risk and allocation of basis and contingent liquidity costs, including capital allocation. First Half 2020Six months ended 31 March 2020. First Half 2019Six months ended 31 March 2019.5 Net Promoter Score (NPS)Net Promoter Score measures the net likelihood of recommendation to others of the customer’s main financial institution for retail or business banking. Net Promoter ScoreSM is a trademark of Bain & Co Inc., Satmetrix Systems, Inc., and Mr Frederick Reichheld. •For retail banking, using a scale of 1 to 10 (1 means ‘extremely unlikely’ and 10 means ‘extremely likely’), the 1-6 raters (detractors) are deducted from the 9-10 raters (promoters); and •For business banking, using a scale of 0 to 10 (0 means ‘extremely unlikely’ and 10 means ‘extremely likely’), the 0-6 raters (detractors) are deducted from the 9-10 raters (promoters). Prior corresponding periodRefers to the six months ended 31 March 2019.6 Prior half / Prior periodRefers to the six months ended 30 September 2019. Run-offScheduled and unscheduled repayments and debt repayments (from for example property sales and external refinancing), net of redraws. Second Half 2019Six months ended 30 September 2019. Women in LeadershipWomen in Leadership refers to the proportion of women (permanent and maximum term) in leadership roles across the Group. It includes the CEO, Group Executive, General Managers, senior leaders with significant influence on business outcomes (direct reports to General Managers and their direct reports), large (3+) team people leaders three levels below General Manager, and Bank and Assistant Bank Managers. 7 |