Exhibit 1
| ASX Release 17 February 2025 Pillar 3 Report as at 31 December 2024 Westpac Banking Corporation (“Westpac”) today provides the attached Pillar 3 Report (December 2024). For further information: Hayden Cooper Justin McCarthy Group Head of Media Relations General Manager, Investor Relations 0402 393 619 0422 800 321 This document has been authorised for release by Tim Hartin, Company Secretary. Level 18, 275 Kent Street Sydney, NSW, 2000 |
| PILLAR 3 REPORT DECEMBER 2024 INCORPORATING THE REQUIREMENTS OF APS 330 WESTPAC BANKING CORPORATION ABN 33 007 457 141 |
| Acknowledgement of Indigenous Peoples Westpac acknowledges the First Peoples of Australia. We recognise their ongoing role as Traditional Owners of the land and waters of this country and pay our respects to Elders, past and present. We extend our respect to Westpac’s Aboriginal and Torres Strait Islander employees, partners, and stakeholders, and to the Indigenous Peoples in the other locations where we operate. In Aotearoa (New Zealand) we also acknowledge tāngata whenua and the unique relationship that Indigenous Peoples share with all New Zealanders under Te Tiriti o Waitangi. 2 WESTPAC GROUP DECEMBER 2024 PILLAR 3 REPORT Contents PILLAR 3 REPORT 3 Executive Summary 4 Introduction 6 Group Structure 7 Capital Overview 9 Leverage Ratio 12 Credit Risk Exposures 13 Securitisation 19 Liquidity Coverage Ratio 22 APPENDICES 23 Appendix I – APS 330 quantitative requirements 24 Appendix II – Exchange rates 25 DISCLOSURE REGARDING FORWARD-LOOKING STATEMENTS 26 GLOSSARY 28 In this report references to ‘Westpac’, ‘Westpac Group’, ‘the Group’, ‘we’, ‘us’ and ‘our’ are to Westpac Banking Corporation and its controlled entities (unless the context indicates otherwise). In this report, unless otherwise stated or the context otherwise requires, references to ‘$’, ‘AUD’ or ‘A$’ are to Australian dollars. References to ‘US$’, ‘USD’ or ‘US dollars’ are to United States dollars, references to ‘NZ$’, ‘NZD’ or ‘NZ dollars’ are to New Zealand dollars, references to 'GBP' are to British Pound Sterling and references to 'EUR' are to European Euro. Refer to Appendix II for information regarding the rates of exchange between the Australian dollar and other currencies applied by the Group as part of its operating activities as at 31 December 2024, 30 September 2024 and 31 December 2023. Any discrepancies between totals and sums of components in tables contained in this report are due to rounding. In this report, unless otherwise stated, disclosures reflect the Australian Prudential Regulation Authority’s (APRA) implementation of Basel III. Information contained in or accessible through the websites mentioned in this report does not form part of this report unless we specifically state that it is incorporated by reference and forms part of this report. Information on those websites owned by Westpac is current as at the date of this report. Except as required by law, we assume no obligation to revise or update those websites after the date of this report. We are not in a position to verify information on websites owned and/or operated by third parties. Westpac Banking Corporation ABN 33 007 457 141 |

| PILLAR 3 REPORT APPENDICES DISCLOSURE REGARDING FORWARD-LOOKING STATEMENTS GLOSSARY 3 PILLAR 3 REPORT EXECUTIVE SUMMARY INTRODUCTION GROUP STRUCTURE CAPITAL OVERVIEW LEVERAGE RATIO CREDIT RISK EXPOSURES SECURITISATION LIQUIDITY COVERAGE RATIO |

| 4 WESTPAC GROUP DECEMBER 2024 PILLAR 3 REPORT EXECUTIVE SUMMARY Key capital ratios 31 December 30 September 31 December % 2024 2024 2023 Level 2 regulatory capital structure Common equity Tier 1 (CET1) capital ratio 11.87 12.49 12.29 Additional Tier 1 capital ratio 2.30 2.33 2.45 Tier 1 capital ratio 14.17 14.82 14.74 Tier 2 capital ratio 7.38 6.56 6.30 Total regulatory capital ratio 21.55 21.38 21.04 APRA leverage ratio 5.11 5.30 5.41 Level 1 regulatory capital structure Level 1 CET1 capital ratio 12.06 12.69 12.45 CET1 CAPITAL RATIO MOVEMENT FOR FIRST QUARTER 2025 12.49% 37bps (58bps) (36bps) 2bps (1bps) (6bps) 11.87% Sep-24 Net profit Ordinary Dividend RWA movement Capital deductions and other items FX translation impacts Capital return Dec-24 The Level 2 CET1 capital ratio was 11.87% at 31 December 2024, 62 basis points lower than 30 September 2024. Key movements included: • First Quarter 2025 net profit: 37 basis points increase; • Payment of the 2024 final ordinary dividend: 58 basis points reduction; • RWA movement: 36 basis points decrease due to increases in credit RWA of 20 basis points and non-credit RWA of 16 basis points; and • Captial return: 6 basis points reduction comprising approximately $0.3 billion of on market share buybacks. The Level 1 CET1 capital ratio was 12.06% at 31 December 2024, 63 basis points lower than 30 September 2024 with movements in line with Level 2. Risk Weighted Assets 31 December 30 September 31 December $m 2024 2024 2023 Risk weighted assets at Level 2 Credit risk 354,127 345,964 337,949 Market risk 8,919 9,555 11,553 Operational risk 48,584 48,196 54,934 Interest rate risk in the banking book (IRRBB) 34,254 27,955 33,935 Other 5,517 5,760 5,056 Total RWA 451,401 437,430 443,427 Total Exposure at Default 1,218,791 1,182,086 1,187,223 |
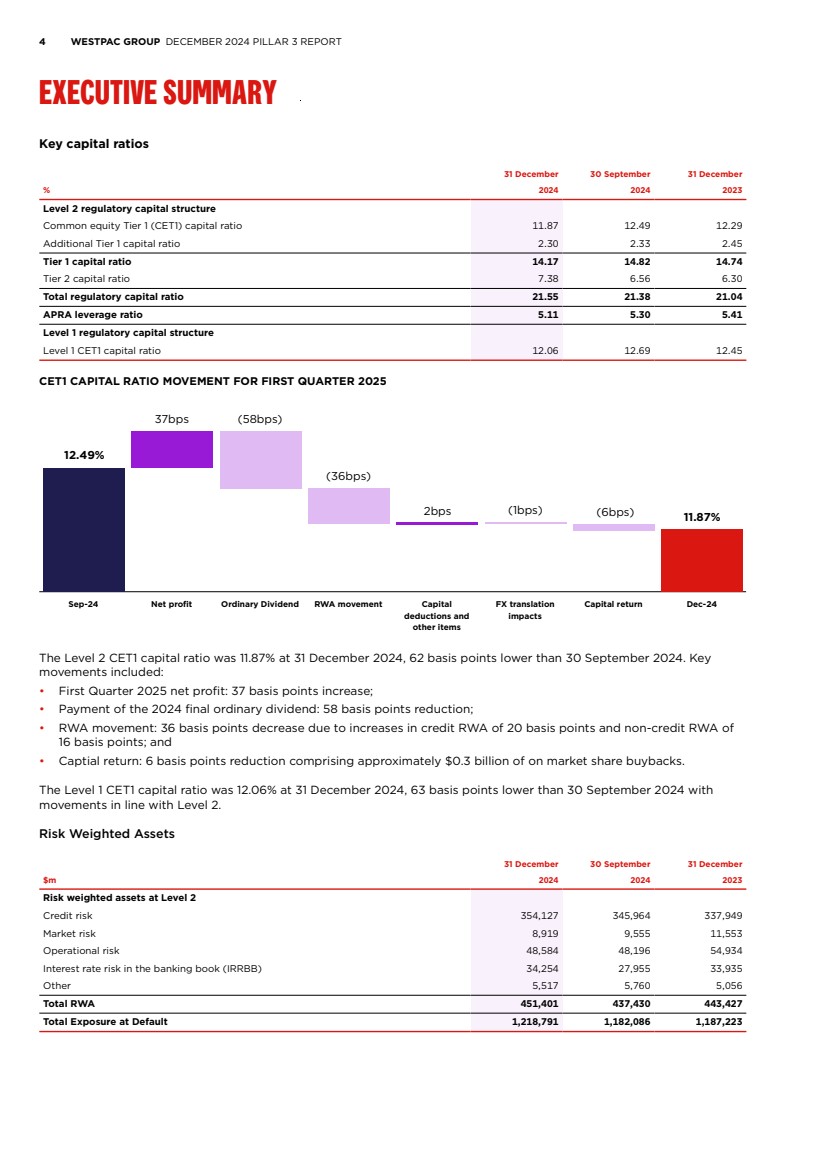
| PILLAR 3 REPORT APPENDICES DISCLOSURE REGARDING FORWARD-LOOKING STATEMENTS GLOSSARY 5 Total RWA increased by 3.2% to $451.4 billion over the quarter due to increases in both credit and non-credit RWA. Credit RWA increased by $8.2 billion. Key movements included: • A $6.4 billion increase from higher lending, primarily in Corporate, Financial Institutions and Residential Mortgages; • A $1.0 billion increase from foreign currency translation impacts, predominantly from the depreciation of the A$ against the US$; • A $0.9 billion increase from data and methodology refinements1 ; • A $0.8 billion increase from counterparty credit risk and credit valuation adjustment; and • A $1.0 billion decrease mainly due to improvements in Residential Mortgages delinquency rates. Non-credit RWA increased by $5.8 billion. Key movements included: • IRRBB RWA increased by $6.3 billion, mainly driven by: – A $4.8 billion increase in repricing and yield curve, basis and optionality risk in line with changes in the underlying banking book position and management of interest rate risk; and – A $1.5 billion increase from higher interest rates creating a regulatory embedded loss of $0.2 billion at 31 December 2024 compared to a $1.3 billion gain at 30 September 2024; and • Market RWA: decreased $0.6 billion mainly from lower market risk exposures. Exposure at Default (EAD) EAD increased by $36.7 billion over the quarter. Key movements included: • A $19.6 billion increase from higher lending, mainly in Residential Mortgages, Corporate and Financial Institutions; • A $9.8 billion increase in derivative exposures due to the increase in the mark-to-market value of derivatives from changes in underlying foreign currency exchange rates; • A $5.5 billion increase from foreign currency translation impacts; and • A $1.8 billion increase in Sovereign exposures, mainly driven by higher government bond holdings partly offset by a reduction in funds placed with central banks. Tier 2 capital movement for First Quarter 2025 Westpac issued $2.3 billion of Tier 2 capital instruments over the quarter. The impact of these transactions was an increase in the total regulatory capital ratio of approximately 51 basis points. Over the quarter, Tier 2 capital has also been impacted by foreign currency translation impacts (51 basis points impact to the total regulatory capital ratio). Domestic systemically important banks (D-SIBs), including Westpac, have a total capital requirement of 18.25% from 1 January 2026. At 31 December 2024, Westpac's total regulatory capital ratio was 21.55%, well above this total capital requirement. APRA has also announced further changes to banks' capital requirements as outlined in the Capital Overview section. Leverage ratio The leverage ratio represents the percentage of Tier 1 capital relative to the Exposures Measure2 . At 31 December 2024, Westpac’s leverage ratio was 5.11%, down 19 basis points from 30 September 2024. The ratio remains well above APRA's regulatory minimum requirement of 3.5%. The decrease in the leverage ratio from 30 September 2024 is due to an increase in total exposures of $29.6 billion and lower Tier 1 Regulatory Capital of $0.8 billion following payment of the 2024 final ordinary dividend. The Exposures Measure increase was mainly due to higher lending and an increase in derivatives exposures. Liquidity Coverage Ratio (LCR) Westpac’s average LCR for the quarter ended 31 December 2024 was 131% (30 September 2024: 133%), well above the regulatory minimum of 100%. The decrease in the ratio was mainly due to the lower holdings of average liquid assets. 1. This includes a $1 billion APRA RWA overlay pending rectification of the usage of a customer risk grade proxy on a small sub-set of non-retail exposures. 2. As defined under Attachment D of APS 110: Capital Adequacy. |
| 6 WESTPAC GROUP DECEMBER 2024 PILLAR 3 REPORT INTRODUCTION Westpac Banking Corporation is an Authorised Deposit-taking Institution (ADI) subject to regulation by APRA. APRA has accredited Westpac to apply advanced models permitted by the Basel III global capital adequacy regime to the measurement of its regulatory capital requirements. Westpac uses the Advanced Internal Ratings-Based approach (Advanced IRB) for credit risk and the Standardised Measurement Approach (SMA) for operational risk. In accordance with APS 330 Public Disclosure, financial institutions that have received the Advanced IRB accreditation, such as Westpac, are required to disclose prudential information about their risk management practices on a semi-annual basis. A subset of this information must be disclosed quarterly. In addition to this report, the regulatory disclosures section of the Westpac website1 contains the reporting requirements for: • Capital instruments under Attachment B of APS 330; and • The identification of potential Global-Systemically Important Banks (G-SIB) under Attachment H of APS 330 (disclosed annually). Capital instruments disclosures are updated when: • A new capital instrument is issued that will form part of regulatory capital; or • A capital instrument is redeemed, converted into CET1 capital, written off, or its terms and conditions are changed. 1. http://www.westpac.com.au/about-westpac/investor-centre/financial-information/regulatory-disclosures/ |
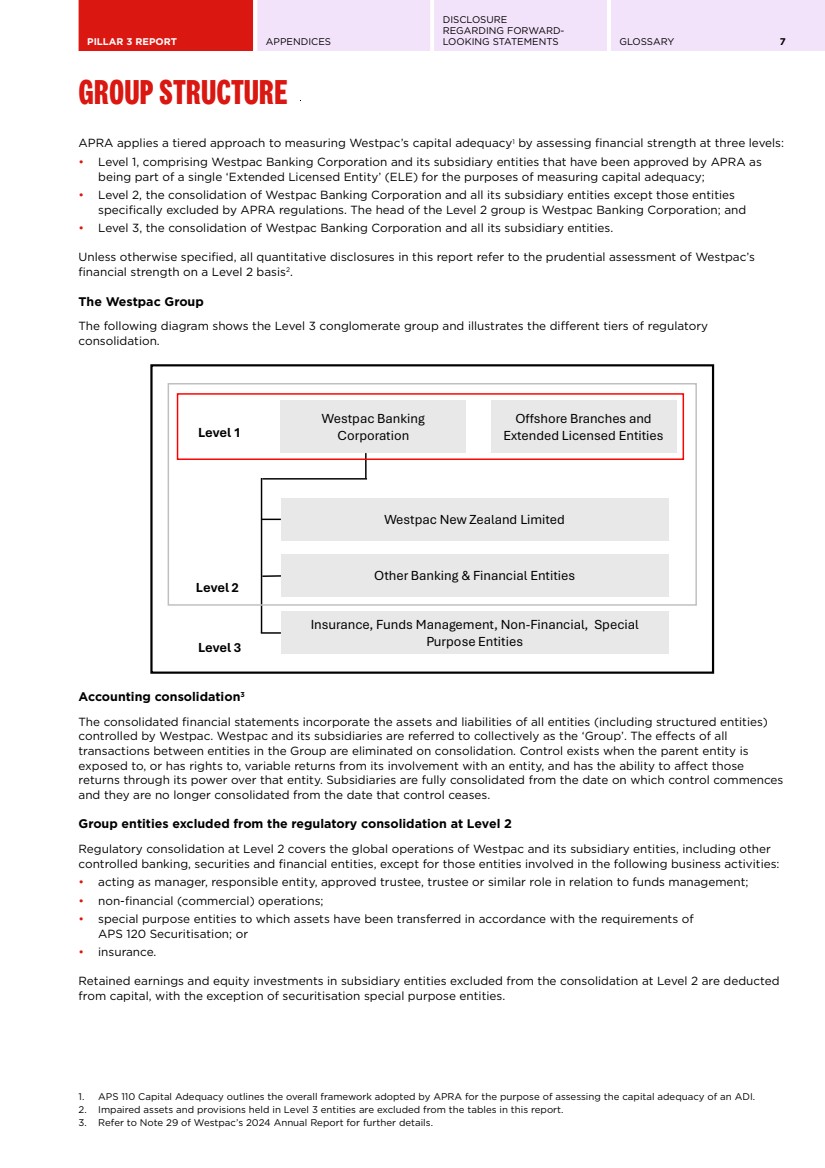
| PILLAR 3 REPORT APPENDICES DISCLOSURE REGARDING FORWARD-LOOKING STATEMENTS GLOSSARY 7 GROUP STRUCTURE APRA applies a tiered approach to measuring Westpac’s capital adequacy1 by assessing financial strength at three levels: • Level 1, comprising Westpac Banking Corporation and its subsidiary entities that have been approved by APRA as being part of a single ‘Extended Licensed Entity’ (ELE) for the purposes of measuring capital adequacy; • Level 2, the consolidation of Westpac Banking Corporation and all its subsidiary entities except those entities specifically excluded by APRA regulations. The head of the Level 2 group is Westpac Banking Corporation; and • Level 3, the consolidation of Westpac Banking Corporation and all its subsidiary entities. Unless otherwise specified, all quantitative disclosures in this report refer to the prudential assessment of Westpac’s financial strength on a Level 2 basis2 . The Westpac Group The following diagram shows the Level 3 conglomerate group and illustrates the different tiers of regulatory consolidation. Westpac Banking Corporation Offshore Branches and Extended Licensed Entities Westpac New Zealand Limited Other Banking & Financial Entities Insurance, Funds Management, Non-Financial, Special Purpose Entities Level 3 Level 2 Level 1 Accounting consolidation3 The consolidated financial statements incorporate the assets and liabilities of all entities (including structured entities) controlled by Westpac. Westpac and its subsidiaries are referred to collectively as the ‘Group’. The effects of all transactions between entities in the Group are eliminated on consolidation. Control exists when the parent entity is exposed to, or has rights to, variable returns from its involvement with an entity, and has the ability to affect those returns through its power over that entity. Subsidiaries are fully consolidated from the date on which control commences and they are no longer consolidated from the date that control ceases. Group entities excluded from the regulatory consolidation at Level 2 Regulatory consolidation at Level 2 covers the global operations of Westpac and its subsidiary entities, including other controlled banking, securities and financial entities, except for those entities involved in the following business activities: • acting as manager, responsible entity, approved trustee, trustee or similar role in relation to funds management; • non-financial (commercial) operations; • special purpose entities to which assets have been transferred in accordance with the requirements of APS 120 Securitisation; or • insurance. Retained earnings and equity investments in subsidiary entities excluded from the consolidation at Level 2 are deducted from capital, with the exception of securitisation special purpose entities. 1. APS 110 Capital Adequacy outlines the overall framework adopted by APRA for the purpose of assessing the capital adequacy of an ADI. 2. Impaired assets and provisions held in Level 3 entities are excluded from the tables in this report. 3. Refer to Note 29 of Westpac’s 2024 Annual Report for further details. |
| 8 WESTPAC GROUP DECEMBER 2024 PILLAR 3 REPORT GROUP STRUCTURE Subsidiary banking entities Westpac New Zealand Limited (WNZL), a subsidiary entity, is a registered bank incorporated in New Zealand and regulated by, among others, the Reserve Bank of New Zealand (RBNZ) for prudential purposes. WNZL uses both the Advanced IRB and Standardised methodologies for credit risk, and the SMA for operational risk. Other subsidiary banking entities in the Group include Westpac Bank - PNG - Limited and Westpac Europe GMBH. For the purposes of determining Westpac’s capital adequacy, subsidiary banking entities are consolidated at Level 2. Branch operations Westpac is one of Australia's leading providers of banking and selected financial services, operating under multiple brands in Australia and in New Zealand, with a small presence in Europe, North America and Asia. Westpac operates through a significant online capability supported by an extensive branch and ATM network, call centres and specialist relationship and product managers. Restrictions and major impediments on the transfer of funds or regulatory capital within the Group Certain subsidiary banking and trustee entities are subject to specific and local prudential regulation in their own right, including capital adequacy requirements and investment or intra-group exposure limits. Westpac seeks to ensure that its subsidiary entities are adequately capitalised and adhere to regulatory requirements at all times. Dividends and capital are repatriated in line with the Group’s policy subject to subsidiary Board approval and local regulations. Minimum capital (‘thin capitalisation’) rules Tax legislation in most jurisdictions in which the Group operates prescribes minimum levels of capital that must be retained in that jurisdiction to avoid a portion of the interest costs incurred in the jurisdiction ceasing to be tax deductible. Capital for these purposes includes both contributed capital and non-distributed retained earnings. Westpac seeks to maintain sufficient capital/retained earnings in these entities to comply with these rules. Tax costs associated with repatriation Repatriation of retained earnings (and capital) may result in tax being payable in either the jurisdiction from which the repatriation occurs or Australia on receipt of the relevant amounts. This cost would reduce the amount actually repatriated. Intra-group exposure limits Exposures to related entities are managed within the prudential limits prescribed by APRA in APS 222 Associations with Related Entities1 . Westpac has an internal limit structure and approval process governing credit exposures to related entities. This limit structure and approval process, combined with APRA’s prudential limits, is designed to reduce the potential for unacceptable contagion risk. RBNZ capital review2 The RBNZ capital adequacy framework became effective from 1 July 2022. The reforms commenced being phased in from 1 October 2021, with changes yet to be fully implemented including: • WNZL Tier 1 capital requirement will increase to 16% of RWA by 1 July 2028, of which 13.5% must be CET1 and up to 2.5% may be AT1; • WNZL’s total capital requirement will increase to 18% of RWA by 1 July 2028, of which up to 2% can be Tier 2 capital; and • Eligible Tier 1 capital will comprise common equity and redeemable perpetual preference shares. Existing AT1 capital instruments will be phased out by 1 July 2028. 1. For the purposes of APS 222, subsidiaries controlled by Westpac, other than subsidiaries that form part of the ELE, represent ‘related entities’. Prudential and internal limits apply to intra-group exposures between the ELE and related entities, both on an individual and aggregate basis. 2. WNZL’s references to CET1, AT1 and other capital measures are subject to RBNZ’s specific requirements and may not align with Australian requirements or definitions in the Glossary. |
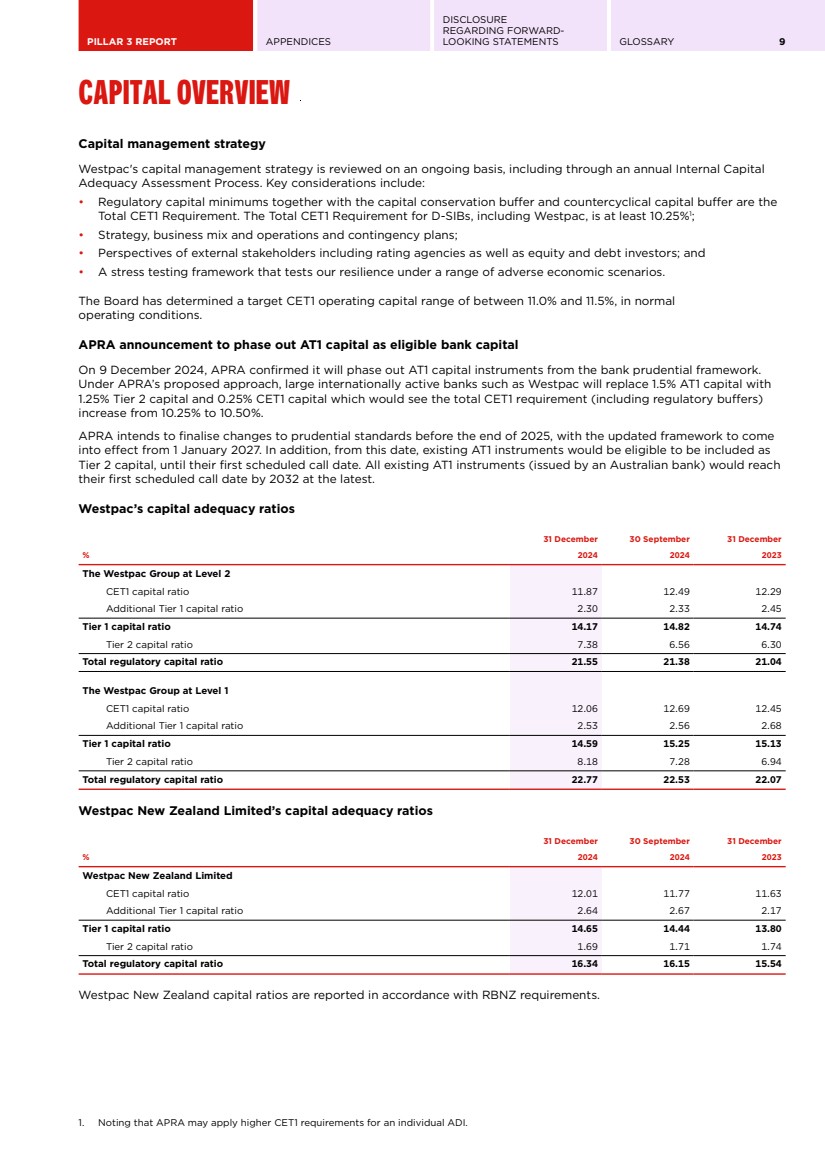
| PILLAR 3 REPORT APPENDICES DISCLOSURE REGARDING FORWARD-LOOKING STATEMENTS GLOSSARY 9 CAPITAL OVERVIEW Capital management strategy Westpac's capital management strategy is reviewed on an ongoing basis, including through an annual Internal Capital Adequacy Assessment Process. Key considerations include: • Regulatory capital minimums together with the capital conservation buffer and countercyclical capital buffer are the Total CET1 Requirement. The Total CET1 Requirement for D-SIBs, including Westpac, is at least 10.25%1 ; • Strategy, business mix and operations and contingency plans; • Perspectives of external stakeholders including rating agencies as well as equity and debt investors; and • A stress testing framework that tests our resilience under a range of adverse economic scenarios. The Board has determined a target CET1 operating capital range of between 11.0% and 11.5%, in normal operating conditions. APRA announcement to phase out AT1 capital as eligible bank capital On 9 December 2024, APRA confirmed it will phase out AT1 capital instruments from the bank prudential framework. Under APRA’s proposed approach, large internationally active banks such as Westpac will replace 1.5% AT1 capital with 1.25% Tier 2 capital and 0.25% CET1 capital which would see the total CET1 requirement (including regulatory buffers) increase from 10.25% to 10.50%. APRA intends to finalise changes to prudential standards before the end of 2025, with the updated framework to come into effect from 1 January 2027. In addition, from this date, existing AT1 instruments would be eligible to be included as Tier 2 capital, until their first scheduled call date. All existing AT1 instruments (issued by an Australian bank) would reach their first scheduled call date by 2032 at the latest. Westpac’s capital adequacy ratios 31 December 30 September 31 December % 2024 2024 2023 The Westpac Group at Level 2 CET1 capital ratio 11.87 12.49 12.29 Additional Tier 1 capital ratio 2.30 2.33 2.45 Tier 1 capital ratio 14.17 14.82 14.74 Tier 2 capital ratio 7.38 6.56 6.30 Total regulatory capital ratio 21.55 21.38 21.04 The Westpac Group at Level 1 CET1 capital ratio 12.06 12.69 12.45 Additional Tier 1 capital ratio 2.53 2.56 2.68 Tier 1 capital ratio 14.59 15.25 15.13 Tier 2 capital ratio 8.18 7.28 6.94 Total regulatory capital ratio 22.77 22.53 22.07 Westpac New Zealand Limited’s capital adequacy ratios 31 December 30 September 31 December % 2024 2024 2023 Westpac New Zealand Limited CET1 capital ratio 12.01 11.77 11.63 Additional Tier 1 capital ratio 2.64 2.67 2.17 Tier 1 capital ratio 14.65 14.44 13.80 Tier 2 capital ratio 1.69 1.71 1.74 Total regulatory capital ratio 16.34 16.15 15.54 Westpac New Zealand capital ratios are reported in accordance with RBNZ requirements. 1. Noting that APRA may apply higher CET1 requirements for an individual ADI. |
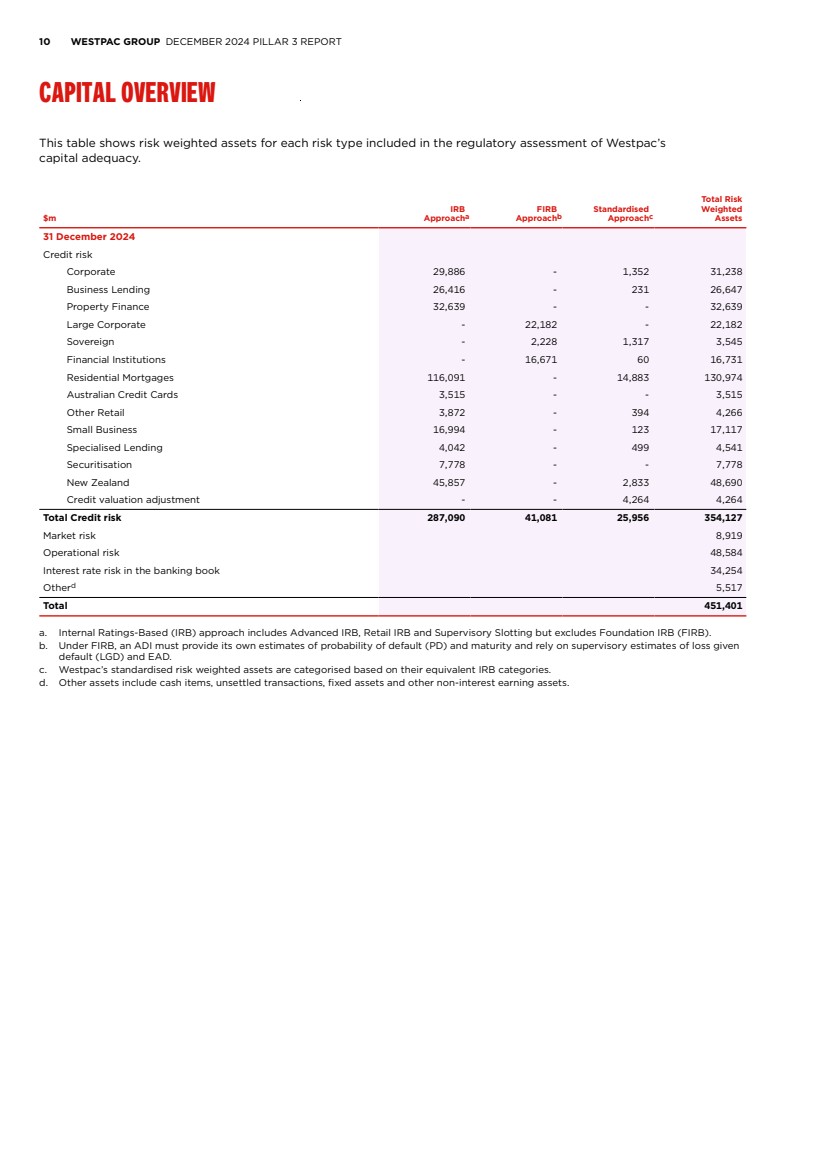
| 10 WESTPAC GROUP DECEMBER 2024 PILLAR 3 REPORT CAPITAL OVERVIEW This table shows risk weighted assets for each risk type included in the regulatory assessment of Westpac’s capital adequacy. $m IRB Approacha FIRB Approachb Standardised Approachc Total Risk Weighted Assets 31 December 2024 Credit risk Corporate 29,886 - 1,352 31,238 Business Lending 26,416 - 231 26,647 Property Finance 32,639 - - 32,639 Large Corporate - 22,182 - 22,182 Sovereign - 2,228 1,317 3,545 Financial Institutions - 16,671 60 16,731 Residential Mortgages 116,091 - 14,883 130,974 Australian Credit Cards 3,515 - - 3,515 Other Retail 3,872 - 394 4,266 Small Business 16,994 - 123 17,117 Specialised Lending 4,042 - 499 4,541 Securitisation 7,778 - - 7,778 New Zealand 45,857 - 2,833 48,690 Credit valuation adjustment - - 4,264 4,264 Total Credit risk 287,090 41,081 25,956 354,127 Market risk 8,919 Operational risk 48,584 Interest rate risk in the banking book 34,254 Otherd 5,517 Total 451,401 a. Internal Ratings-Based (IRB) approach includes Advanced IRB, Retail IRB and Supervisory Slotting but excludes Foundation IRB (FIRB). b. Under FIRB, an ADI must provide its own estimates of probability of default (PD) and maturity and rely on supervisory estimates of loss given default (LGD) and EAD. c. Westpac’s standardised risk weighted assets are categorised based on their equivalent IRB categories. d. Other assets include cash items, unsettled transactions, fixed assets and other non-interest earning assets. |
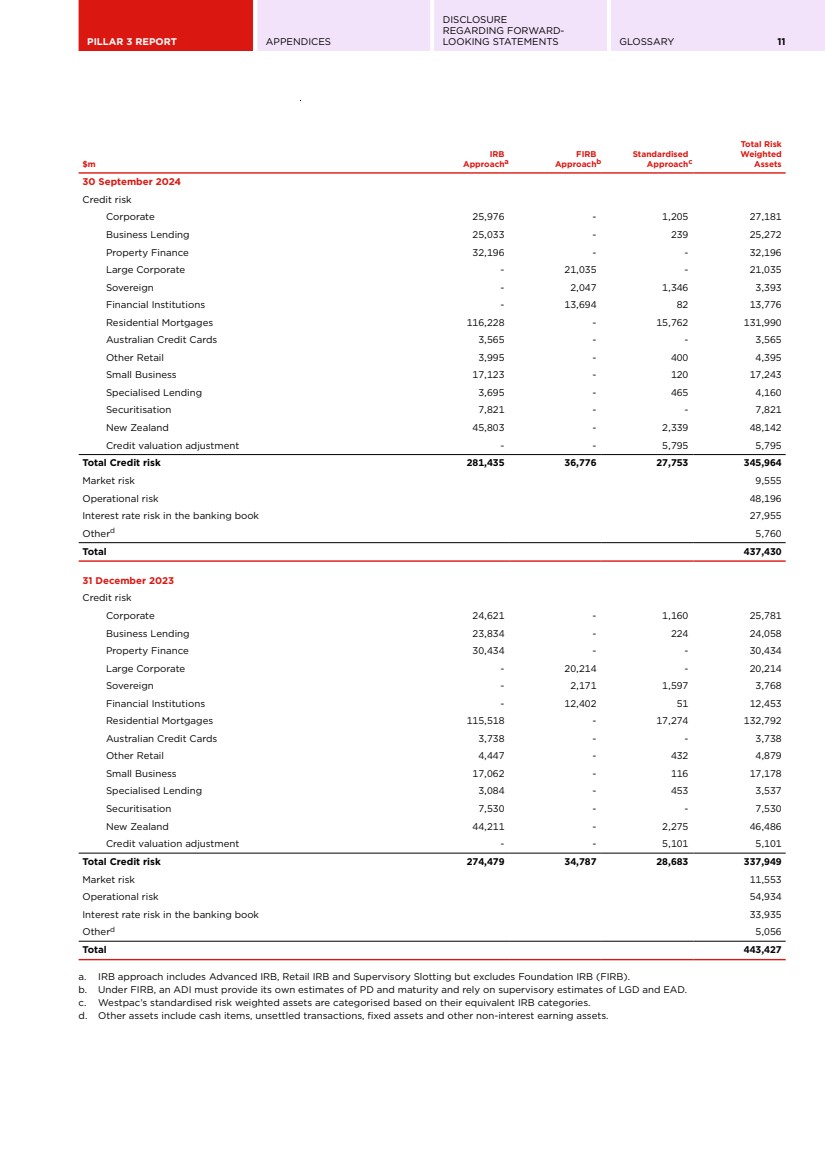
| PILLAR 3 REPORT APPENDICES DISCLOSURE REGARDING FORWARD-LOOKING STATEMENTS GLOSSARY 11 $m IRB Approacha FIRB Approachb Standardised Approachc Total Risk Weighted Assets 30 September 2024 Credit risk Corporate 25,976 - 1,205 27,181 Business Lending 25,033 - 239 25,272 Property Finance 32,196 - - 32,196 Large Corporate - 21,035 - 21,035 Sovereign - 2,047 1,346 3,393 Financial Institutions - 13,694 82 13,776 Residential Mortgages 116,228 - 15,762 131,990 Australian Credit Cards 3,565 - - 3,565 Other Retail 3,995 - 400 4,395 Small Business 17,123 - 120 17,243 Specialised Lending 3,695 - 465 4,160 Securitisation 7,821 - - 7,821 New Zealand 45,803 - 2,339 48,142 Credit valuation adjustment - - 5,795 5,795 Total Credit risk 281,435 36,776 27,753 345,964 Market risk 9,555 Operational risk 48,196 Interest rate risk in the banking book 27,955 Otherd 5,760 Total 437,430 31 December 2023 Credit risk Corporate 24,621 - 1,160 25,781 Business Lending 23,834 - 224 24,058 Property Finance 30,434 - - 30,434 Large Corporate - 20,214 - 20,214 Sovereign - 2,171 1,597 3,768 Financial Institutions - 12,402 51 12,453 Residential Mortgages 115,518 - 17,274 132,792 Australian Credit Cards 3,738 - - 3,738 Other Retail 4,447 - 432 4,879 Small Business 17,062 - 116 17,178 Specialised Lending 3,084 - 453 3,537 Securitisation 7,530 - - 7,530 New Zealand 44,211 - 2,275 46,486 Credit valuation adjustment - - 5,101 5,101 Total Credit risk 274,479 34,787 28,683 337,949 Market risk 11,553 Operational risk 54,934 Interest rate risk in the banking book 33,935 Otherd 5,056 Total 443,427 a. IRB approach includes Advanced IRB, Retail IRB and Supervisory Slotting but excludes Foundation IRB (FIRB). b. Under FIRB, an ADI must provide its own estimates of PD and maturity and rely on supervisory estimates of LGD and EAD. c. Westpac’s standardised risk weighted assets are categorised based on their equivalent IRB categories. d. Other assets include cash items, unsettled transactions, fixed assets and other non-interest earning assets. |
| 12 WESTPAC GROUP DECEMBER 2024 PILLAR 3 REPORT LEVERAGE RATIO Leverage Ratio The following table summarises Westpac’s leverage ratio. $ billion 31 Dec 2024 30 Sept 2024 30 June 2024 31 Mar 2024 Net Tier 1 Regulatory Capital 64.0 64.8 64.9 66.7 Total Exposures 1,252.5 1,222.9 1,207.1 1,214.9 Leverage ratio 5.11% 5.30% 5.38% 5.49% |

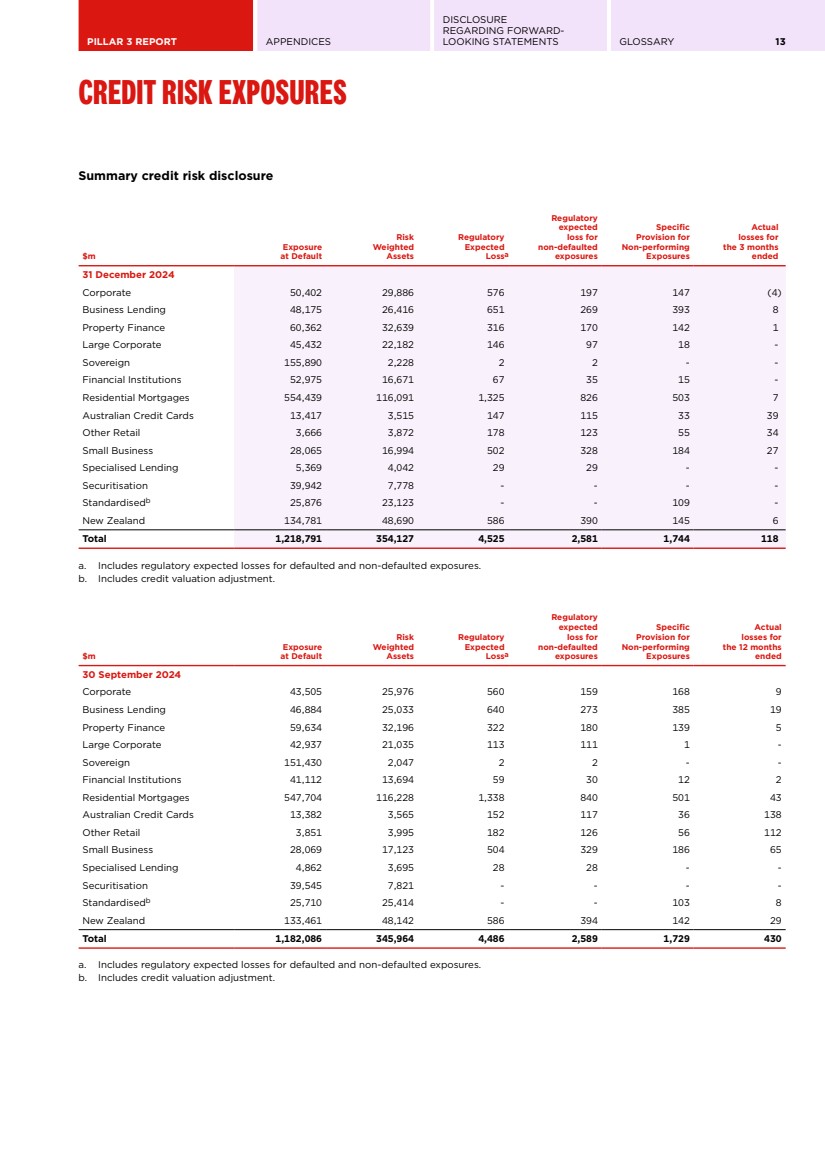
| PILLAR 3 REPORT APPENDICES DISCLOSURE REGARDING FORWARD-LOOKING STATEMENTS GLOSSARY 13 CREDIT RISK EXPOSURES Summary credit risk disclosure $m Exposure at Default Risk Weighted Assets Regulatory Expected Lossa Regulatory expected loss for non-defaulted exposures Specific Provision for Non-performing Exposures Actual losses for the 3 months ended 31 December 2024 Corporate 50,402 29,886 576 197 147 (4) Business Lending 48,175 26,416 651 269 393 8 Property Finance 60,362 32,639 316 170 142 1 Large Corporate 45,432 22,182 146 97 18 - Sovereign 155,890 2,228 2 2 - - Financial Institutions 52,975 16,671 67 35 15 - Residential Mortgages 554,439 116,091 1,325 826 503 7 Australian Credit Cards 13,417 3,515 147 115 33 39 Other Retail 3,666 3,872 178 123 55 34 Small Business 28,065 16,994 502 328 184 27 Specialised Lending 5,369 4,042 29 29 - - Securitisation 39,942 7,778 - - - - Standardisedb 25,876 23,123 - - 109 - New Zealand 134,781 48,690 586 390 145 6 Total 1,218,791 354,127 4,525 2,581 1,744 118 a. Includes regulatory expected losses for defaulted and non-defaulted exposures. b. Includes credit valuation adjustment. $m Exposure at Default Risk Weighted Assets Regulatory Expected Lossa Regulatory expected loss for non-defaulted exposures Specific Provision for Non-performing Exposures Actual losses for the 12 months ended 30 September 2024 Corporate 43,505 25,976 560 159 168 9 Business Lending 46,884 25,033 640 273 385 19 Property Finance 59,634 32,196 322 180 139 5 Large Corporate 42,937 21,035 113 111 1 - Sovereign 151,430 2,047 2 2 - - Financial Institutions 41,112 13,694 59 30 12 2 Residential Mortgages 547,704 116,228 1,338 840 501 43 Australian Credit Cards 13,382 3,565 152 117 36 138 Other Retail 3,851 3,995 182 126 56 112 Small Business 28,069 17,123 504 329 186 65 Specialised Lending 4,862 3,695 28 28 - - Securitisation 39,545 7,821 - - - - Standardisedb 25,710 25,414 - - 103 8 New Zealand 133,461 48,142 586 394 142 29 Total 1,182,086 345,964 4,486 2,589 1,729 430 a. Includes regulatory expected losses for defaulted and non-defaulted exposures. b. Includes credit valuation adjustment. |
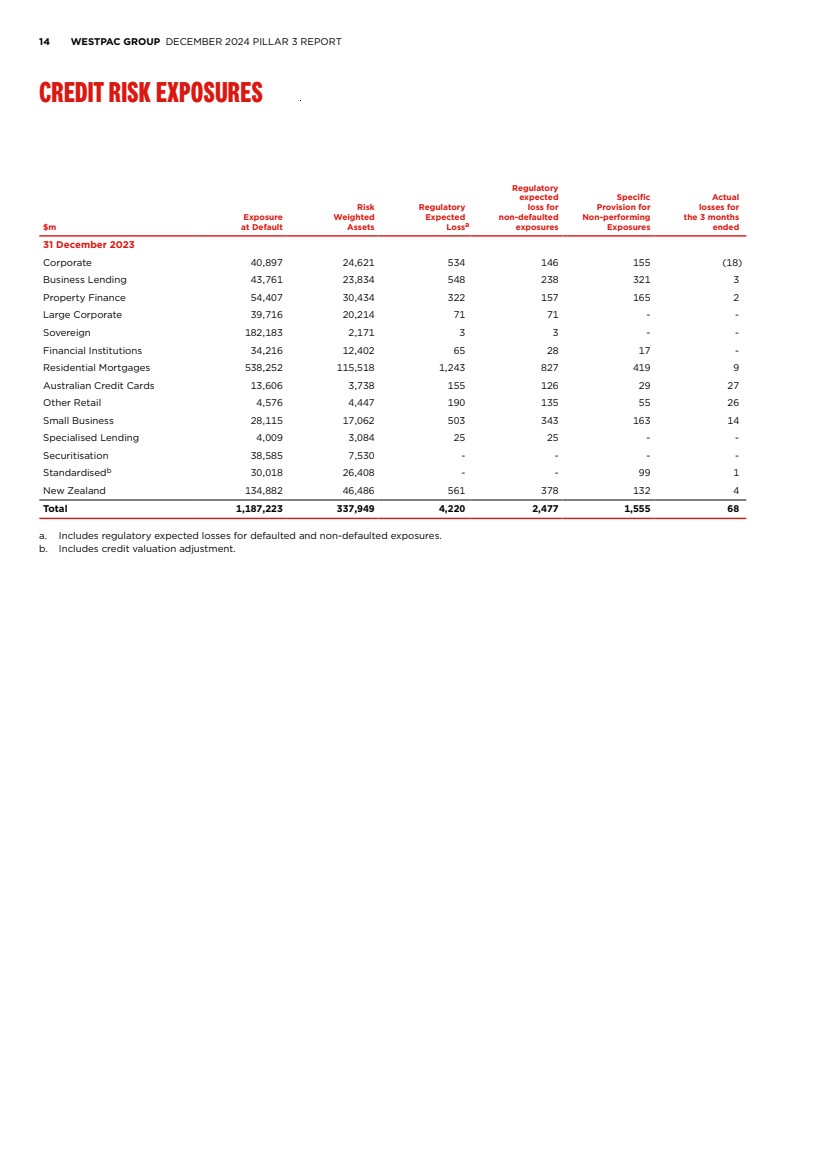
| 14 WESTPAC GROUP DECEMBER 2024 PILLAR 3 REPORT CREDIT RISK EXPOSURES $m Exposure at Default Risk Weighted Assets Regulatory Expected Lossa Regulatory expected loss for non-defaulted exposures Specific Provision for Non-performing Exposures Actual losses for the 3 months ended 31 December 2023 Corporate 40,897 24,621 534 146 155 (18) Business Lending 43,761 23,834 548 238 321 3 Property Finance 54,407 30,434 322 157 165 2 Large Corporate 39,716 20,214 71 71 - - Sovereign 182,183 2,171 3 3 - - Financial Institutions 34,216 12,402 65 28 17 - Residential Mortgages 538,252 115,518 1,243 827 419 9 Australian Credit Cards 13,606 3,738 155 126 29 27 Other Retail 4,576 4,447 190 135 55 26 Small Business 28,115 17,062 503 343 163 14 Specialised Lending 4,009 3,084 25 25 - - Securitisation 38,585 7,530 - - - - Standardisedb 30,018 26,408 - - 99 1 New Zealand 134,882 46,486 561 378 132 4 Total 1,187,223 337,949 4,220 2,477 1,555 68 a. Includes regulatory expected losses for defaulted and non-defaulted exposures. b. Includes credit valuation adjustment. |
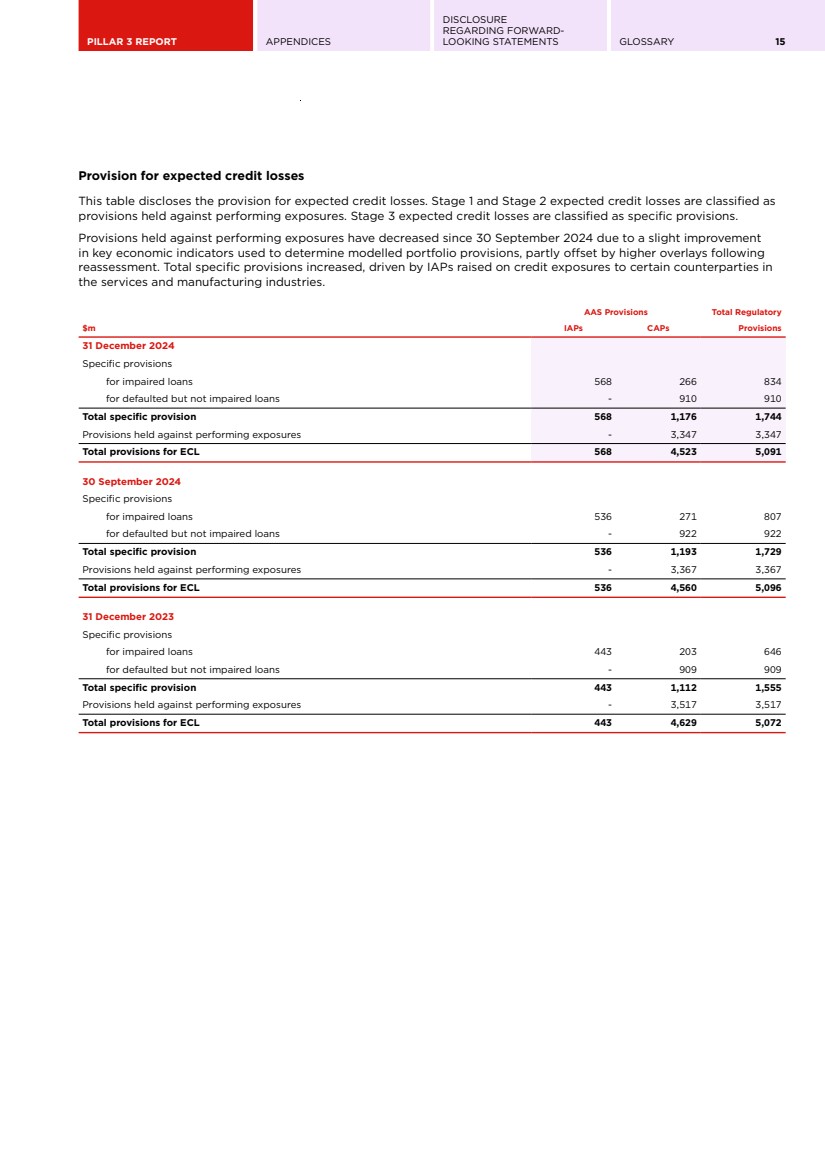
| PILLAR 3 REPORT APPENDICES DISCLOSURE REGARDING FORWARD-LOOKING STATEMENTS GLOSSARY 15 Provision for expected credit losses This table discloses the provision for expected credit losses. Stage 1 and Stage 2 expected credit losses are classified as provisions held against performing exposures. Stage 3 expected credit losses are classified as specific provisions. Provisions held against performing exposures have decreased since 30 September 2024 due to a slight improvement in key economic indicators used to determine modelled portfolio provisions, partly offset by higher overlays following reassessment. Total specific provisions increased, driven by IAPs raised on credit exposures to certain counterparties in the services and manufacturing industries. AAS Provisions Total Regulatory $m IAPs CAPs Provisions 31 December 2024 Specific provisions for impaired loans 568 266 834 for defaulted but not impaired loans - 910 910 Total specific provision 568 1,176 1,744 Provisions held against performing exposures - 3,347 3,347 Total provisions for ECL 568 4,523 5,091 30 September 2024 Specific provisions for impaired loans 536 271 807 for defaulted but not impaired loans - 922 922 Total specific provision 536 1,193 1,729 Provisions held against performing exposures - 3,367 3,367 Total provisions for ECL 536 4,560 5,096 31 December 2023 Specific provisions for impaired loans 443 203 646 for defaulted but not impaired loans - 909 909 Total specific provision 443 1,112 1,555 Provisions held against performing exposures - 3,517 3,517 Total provisions for ECL 443 4,629 5,072 |
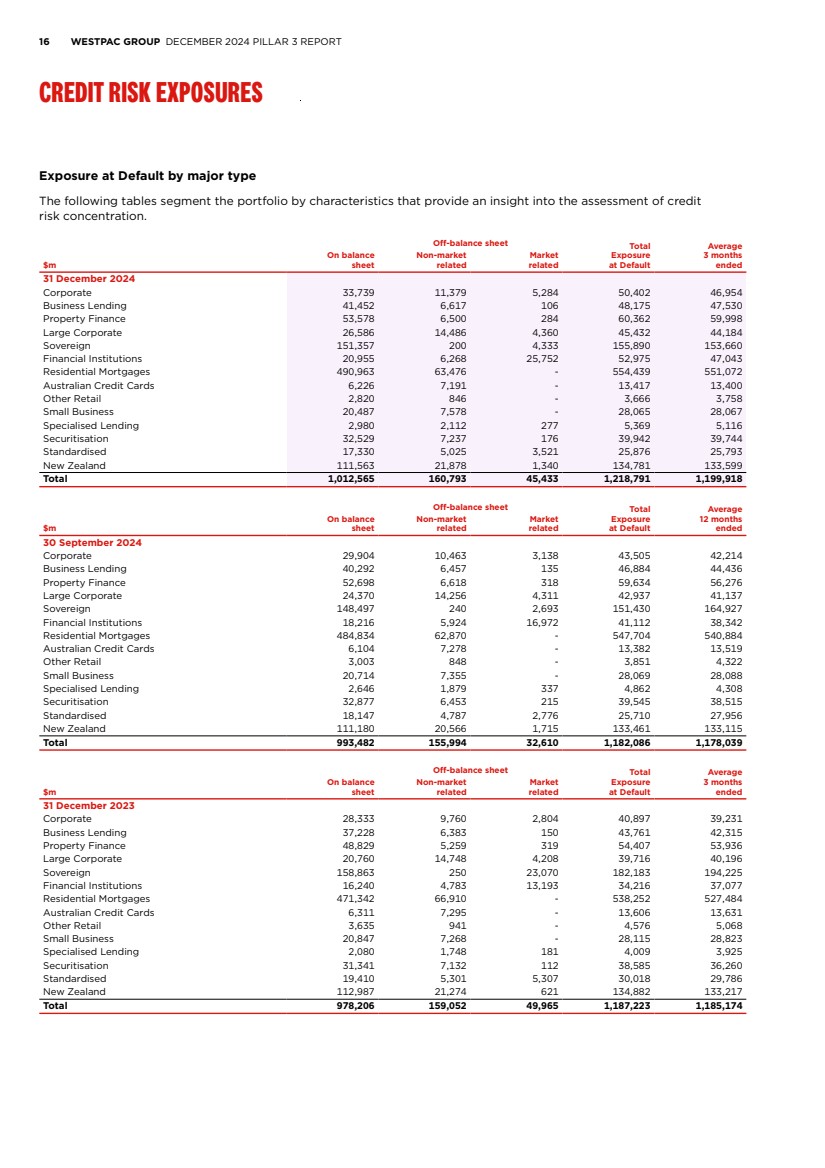
| 16 WESTPAC GROUP DECEMBER 2024 PILLAR 3 REPORT CREDIT RISK EXPOSURES Exposure at Default by major type The following tables segment the portfolio by characteristics that provide an insight into the assessment of credit risk concentration. Off-balance sheet Total Exposure at Default Average 3 months $m ended On balance sheet Non-market related Market related 31 December 2024 Corporate 33,739 11,379 5,284 50,402 46,954 Business Lending 41,452 6,617 106 48,175 47,530 Property Finance 53,578 6,500 284 60,362 59,998 Large Corporate 26,586 14,486 4,360 45,432 44,184 Sovereign 151,357 200 4,333 155,890 153,660 Financial Institutions 20,955 6,268 25,752 52,975 47,043 Residential Mortgages 490,963 63,476 - 554,439 551,072 Australian Credit Cards 6,226 7,191 - 13,417 13,400 Other Retail 2,820 846 - 3,666 3,758 Small Business 20,487 7,578 - 28,065 28,067 Specialised Lending 2,980 2,112 277 5,369 5,116 Securitisation 32,529 7,237 176 39,942 39,744 Standardised 17,330 5,025 3,521 25,876 25,793 New Zealand 111,563 21,878 1,340 134,781 133,599 Total 1,012,565 160,793 45,433 1,218,791 1,199,918 Off-balance sheet Total Exposure at Default Average 12 months $m ended On balance sheet Non-market related Market related 30 September 2024 Corporate 29,904 10,463 3,138 43,505 42,214 Business Lending 40,292 6,457 135 46,884 44,436 Property Finance 52,698 6,618 318 59,634 56,276 Large Corporate 24,370 14,256 4,311 42,937 41,137 Sovereign 148,497 240 2,693 151,430 164,927 Financial Institutions 18,216 5,924 16,972 41,112 38,342 Residential Mortgages 484,834 62,870 - 547,704 540,884 Australian Credit Cards 6,104 7,278 - 13,382 13,519 Other Retail 3,003 848 - 3,851 4,322 Small Business 20,714 7,355 - 28,069 28,088 Specialised Lending 2,646 1,879 337 4,862 4,308 Securitisation 32,877 6,453 215 39,545 38,515 Standardised 18,147 4,787 2,776 25,710 27,956 New Zealand 111,180 20,566 1,715 133,461 133,115 Total 993,482 155,994 32,610 1,182,086 1,178,039 Off-balance sheet Total Exposure at Default Average 3 months $m ended On balance sheet Non-market related Market related 31 December 2023 Corporate 28,333 9,760 2,804 40,897 39,231 Business Lending 37,228 6,383 150 43,761 42,315 Property Finance 48,829 5,259 319 54,407 53,936 Large Corporate 20,760 14,748 4,208 39,716 40,196 Sovereign 158,863 250 23,070 182,183 194,225 Financial Institutions 16,240 4,783 13,193 34,216 37,077 Residential Mortgages 471,342 66,910 - 538,252 527,484 Australian Credit Cards 6,311 7,295 - 13,606 13,631 Other Retail 3,635 941 - 4,576 5,068 Small Business 20,847 7,268 - 28,115 28,823 Specialised Lending 2,080 1,748 181 4,009 3,925 Securitisation 31,341 7,132 112 38,585 36,260 Standardised 19,410 5,301 5,307 30,018 29,786 New Zealand 112,987 21,274 621 134,882 133,217 Total 978,206 159,052 49,965 1,187,223 1,185,174 |
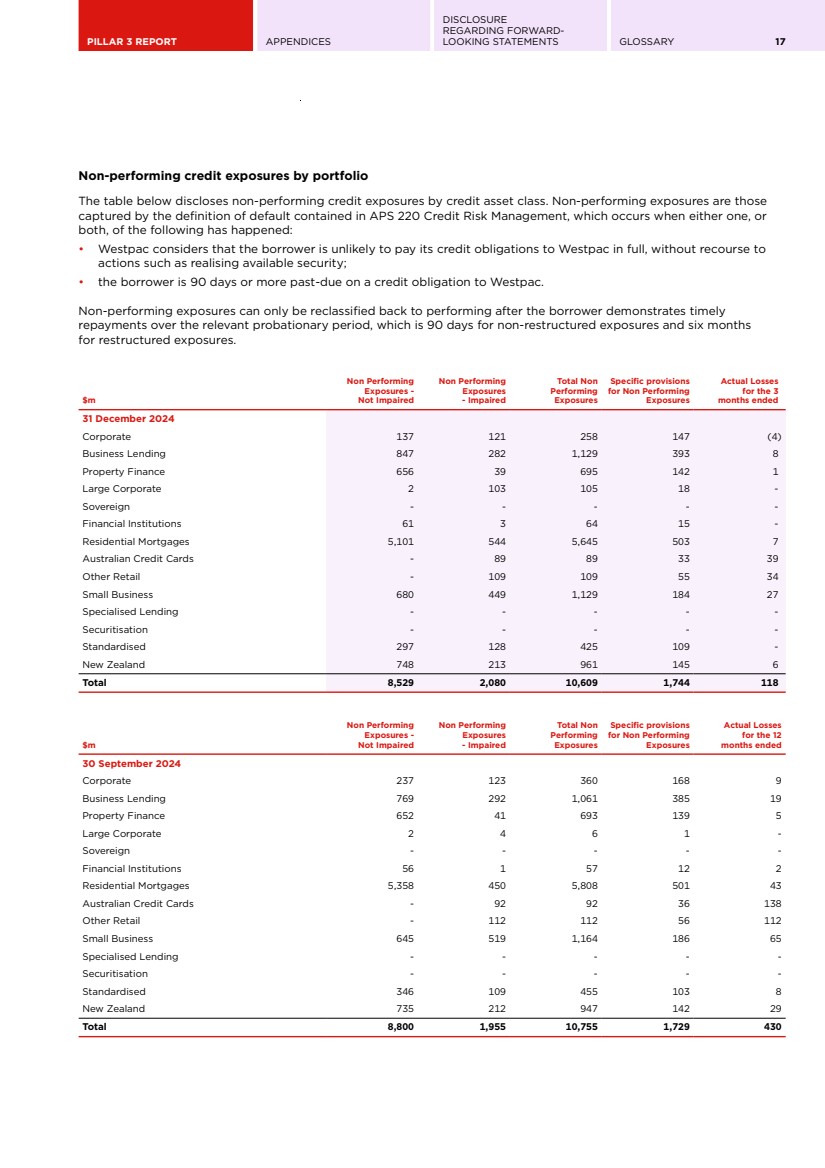
| PILLAR 3 REPORT APPENDICES DISCLOSURE REGARDING FORWARD-LOOKING STATEMENTS GLOSSARY 17 Non-performing credit exposures by portfolio The table below discloses non-performing credit exposures by credit asset class. Non-performing exposures are those captured by the definition of default contained in APS 220 Credit Risk Management, which occurs when either one, or both, of the following has happened: • Westpac considers that the borrower is unlikely to pay its credit obligations to Westpac in full, without recourse to actions such as realising available security; • the borrower is 90 days or more past-due on a credit obligation to Westpac. Non-performing exposures can only be reclassified back to performing after the borrower demonstrates timely repayments over the relevant probationary period, which is 90 days for non-restructured exposures and six months for restructured exposures. $m Non Performing Exposures - Not Impaired Non Performing Exposures - Impaired Total Non Performing Exposures Specific provisions for Non Performing Exposures Actual Losses for the 3 months ended 31 December 2024 Corporate 137 121 258 147 (4) Business Lending 847 282 1,129 393 8 Property Finance 656 39 695 142 1 Large Corporate 2 103 105 18 - Sovereign - - - - - Financial Institutions 61 3 64 15 - Residential Mortgages 5,101 544 5,645 503 7 Australian Credit Cards - 89 89 33 39 Other Retail - 109 109 55 34 Small Business 680 449 1,129 184 27 Specialised Lending - - - - - Securitisation - - - - - Standardised 297 128 425 109 - New Zealand 748 213 961 145 6 Total 8,529 2,080 10,609 1,744 118 $m Non Performing Exposures - Not Impaired Non Performing Exposures - Impaired Total Non Performing Exposures Specific provisions for Non Performing Exposures Actual Losses for the 12 months ended 30 September 2024 Corporate 237 123 360 168 9 Business Lending 769 292 1,061 385 19 Property Finance 652 41 693 139 5 Large Corporate 2 4 6 1 - Sovereign - - - - - Financial Institutions 56 1 57 12 2 Residential Mortgages 5,358 450 5,808 501 43 Australian Credit Cards - 92 92 36 138 Other Retail - 112 112 56 112 Small Business 645 519 1,164 186 65 Specialised Lending - - - - - Securitisation - - - - - Standardised 346 109 455 103 8 New Zealand 735 212 947 142 29 Total 8,800 1,955 10,755 1,729 430 |
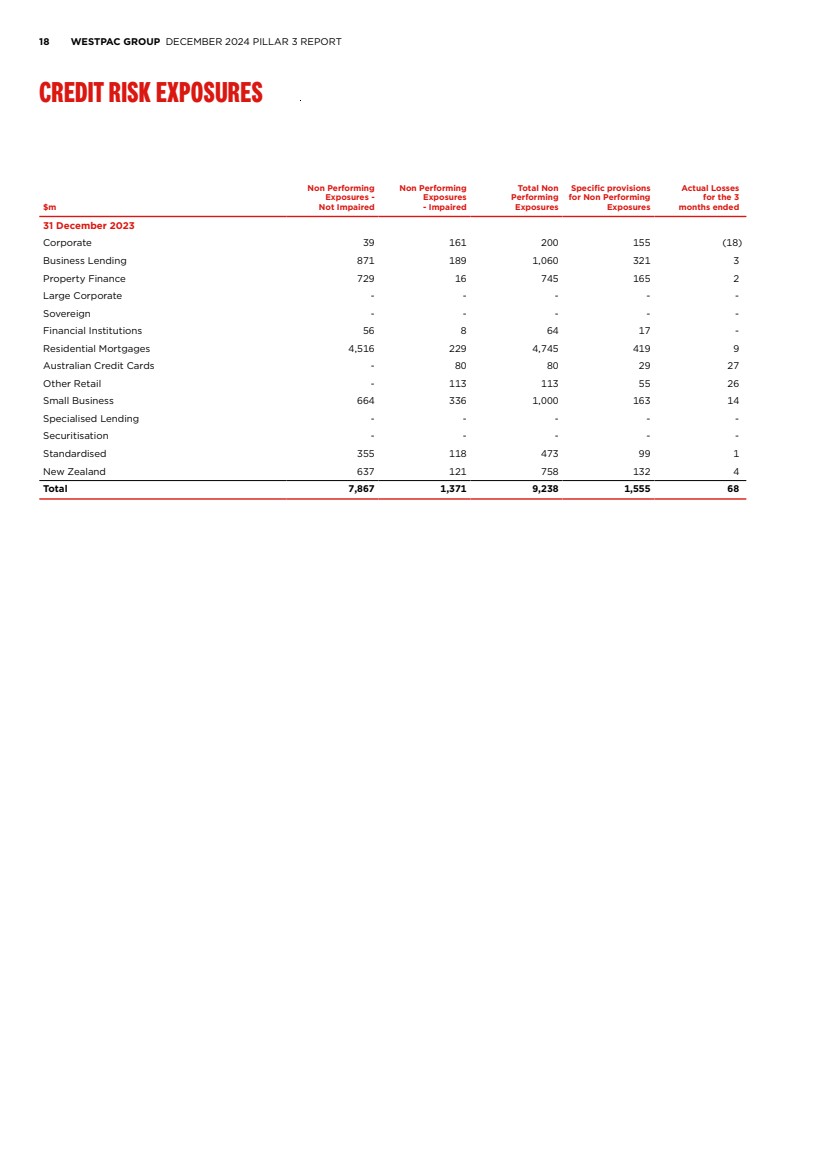
| 18 WESTPAC GROUP DECEMBER 2024 PILLAR 3 REPORT CREDIT RISK EXPOSURES $m Non Performing Exposures - Not Impaired Non Performing Exposures - Impaired Total Non Performing Exposures Specific provisions for Non Performing Exposures Actual Losses for the 3 months ended 31 December 2023 Corporate 39 161 200 155 (18) Business Lending 871 189 1,060 321 3 Property Finance 729 16 745 165 2 Large Corporate - - - - - Sovereign - - - - - Financial Institutions 56 8 64 17 - Residential Mortgages 4,516 229 4,745 419 9 Australian Credit Cards - 80 80 29 27 Other Retail - 113 113 55 26 Small Business 664 336 1,000 163 14 Specialised Lending - - - - - Securitisation - - - - - Standardised 355 118 473 99 1 New Zealand 637 121 758 132 4 Total 7,867 1,371 9,238 1,555 68 |
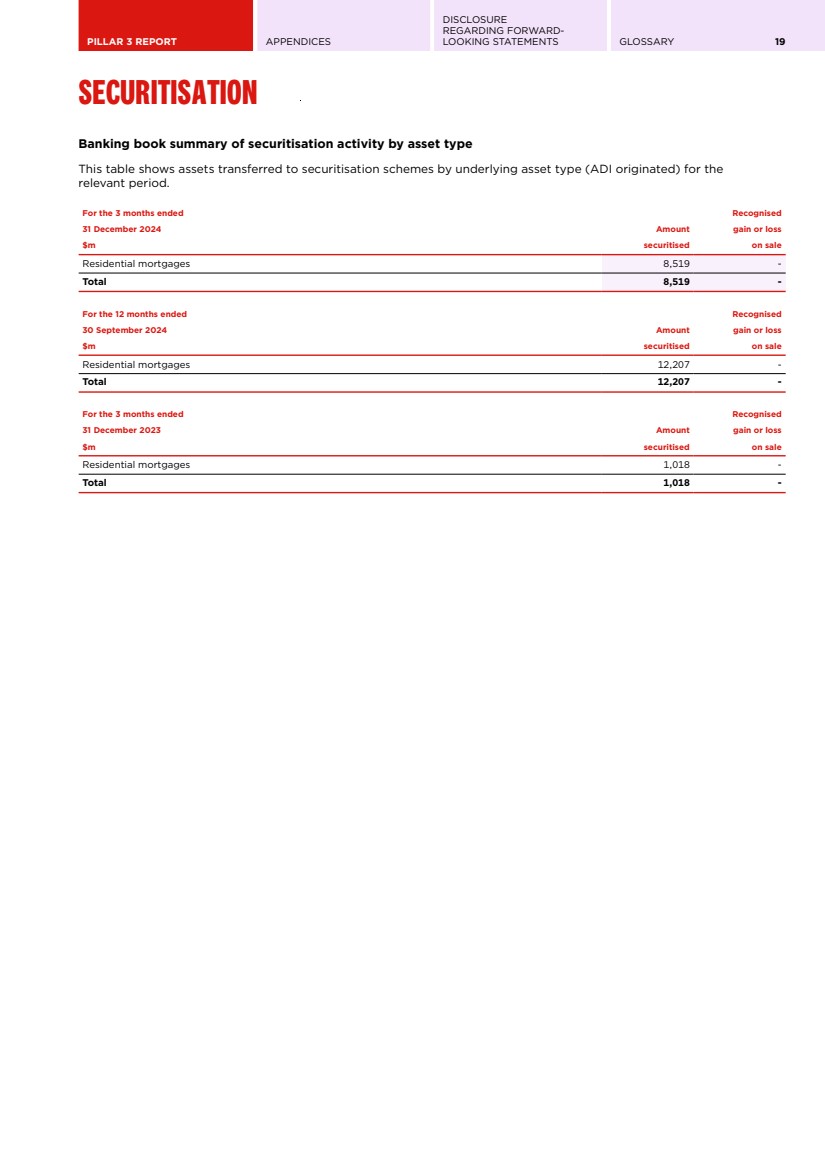
| PILLAR 3 REPORT APPENDICES DISCLOSURE REGARDING FORWARD-LOOKING STATEMENTS GLOSSARY 19 SECURITISATION Banking book summary of securitisation activity by asset type This table shows assets transferred to securitisation schemes by underlying asset type (ADI originated) for the relevant period. For the 3 months ended Recognised 31 December 2024 Amount gain or loss $m securitised on sale Residential mortgages 8,519 - Total 8,519 - For the 12 months ended Recognised 30 September 2024 Amount gain or loss $m securitised on sale Residential mortgages 12,207 - Total 12,207 - For the 3 months ended Recognised 31 December 2023 Amount gain or loss $m securitised on sale Residential mortgages 1,018 - Total 1,018 - |
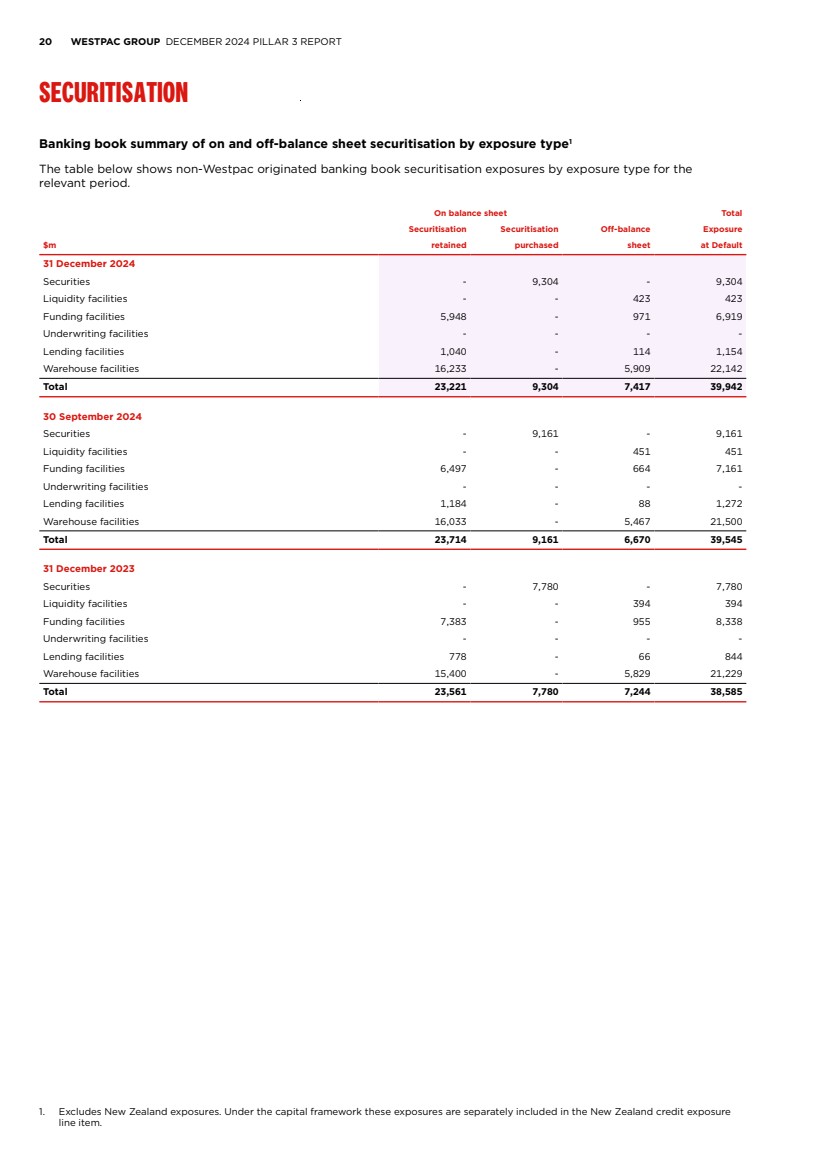
| 20 WESTPAC GROUP DECEMBER 2024 PILLAR 3 REPORT SECURITISATION Banking book summary of on and off-balance sheet securitisation by exposure type1 The table below shows non-Westpac originated banking book securitisation exposures by exposure type for the relevant period. On balance sheet Total Securitisation Securitisation Off-balance Exposure $m retained purchased sheet at Default 31 December 2024 Securities - 9,304 - 9,304 Liquidity facilities - - 423 423 Funding facilities 5,948 - 971 6,919 Underwriting facilities - - - - Lending facilities 1,040 - 114 1,154 Warehouse facilities 16,233 - 5,909 22,142 Total 23,221 9,304 7,417 39,942 30 September 2024 Securities - 9,161 - 9,161 Liquidity facilities - - 451 451 Funding facilities 6,497 - 664 7,161 Underwriting facilities - - - - Lending facilities 1,184 - 88 1,272 Warehouse facilities 16,033 - 5,467 21,500 Total 23,714 9,161 6,670 39,545 31 December 2023 Securities - 7,780 - 7,780 Liquidity facilities - - 394 394 Funding facilities 7,383 - 955 8,338 Underwriting facilities - - - - Lending facilities 778 - 66 844 Warehouse facilities 15,400 - 5,829 21,229 Total 23,561 7,780 7,244 38,585 1. Excludes New Zealand exposures. Under the capital framework these exposures are separately included in the New Zealand credit exposure line item. |
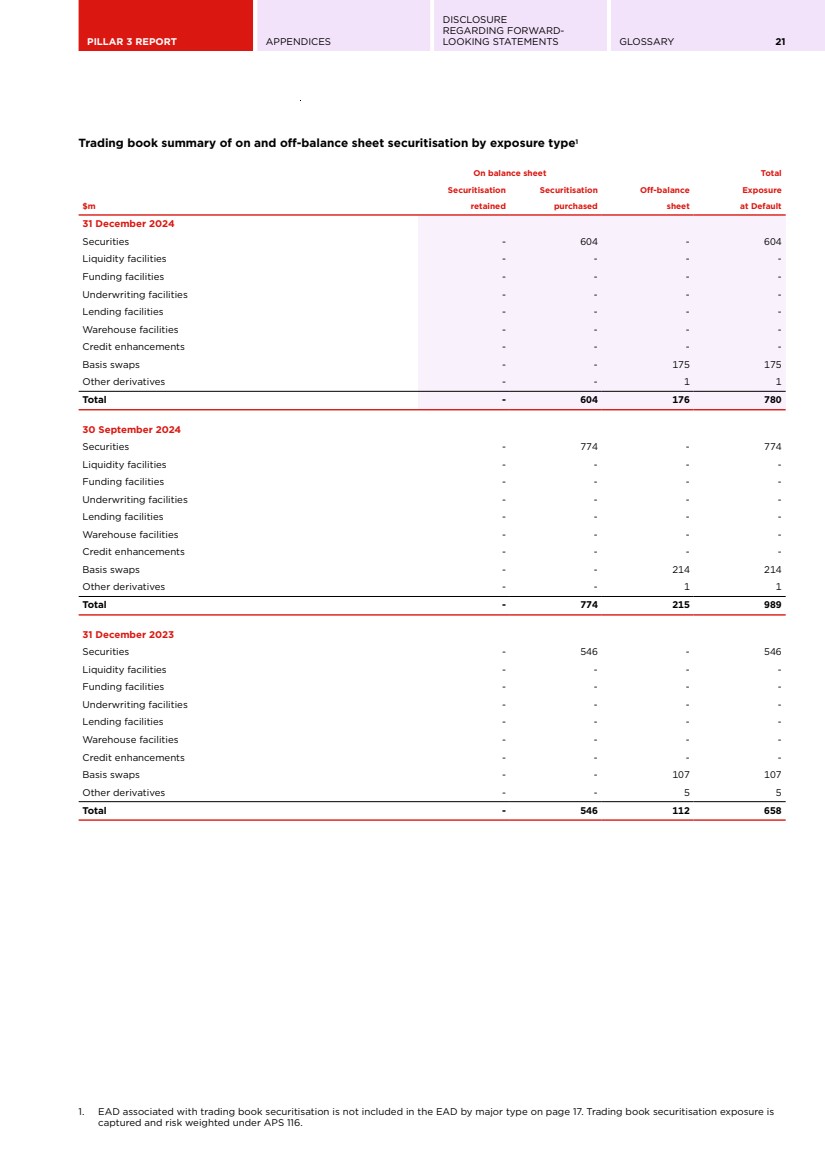
| PILLAR 3 REPORT APPENDICES DISCLOSURE REGARDING FORWARD-LOOKING STATEMENTS GLOSSARY 21 Trading book summary of on and off-balance sheet securitisation by exposure type1 On balance sheet Total Securitisation Securitisation Off-balance Exposure $m retained purchased sheet at Default 31 December 2024 Securities - 604 - 604 Liquidity facilities - - - - Funding facilities - - - - Underwriting facilities - - - - Lending facilities - - - - Warehouse facilities - - - - Credit enhancements - - - - Basis swaps - - 175 175 Other derivatives - - 1 1 Total - 604 176 780 30 September 2024 Securities - 774 - 774 Liquidity facilities - - - - Funding facilities - - - - Underwriting facilities - - - - Lending facilities - - - - Warehouse facilities - - - - Credit enhancements - - - - Basis swaps - - 214 214 Other derivatives - - 1 1 Total - 774 215 989 31 December 2023 Securities - 546 - 546 Liquidity facilities - - - - Funding facilities - - - - Underwriting facilities - - - - Lending facilities - - - - Warehouse facilities - - - - Credit enhancements - - - - Basis swaps - - 107 107 Other derivatives - - 5 5 Total - 546 112 658 1. EAD associated with trading book securitisation is not included in the EAD by major type on page 17. Trading book securitisation exposure is captured and risk weighted under APS 116. |
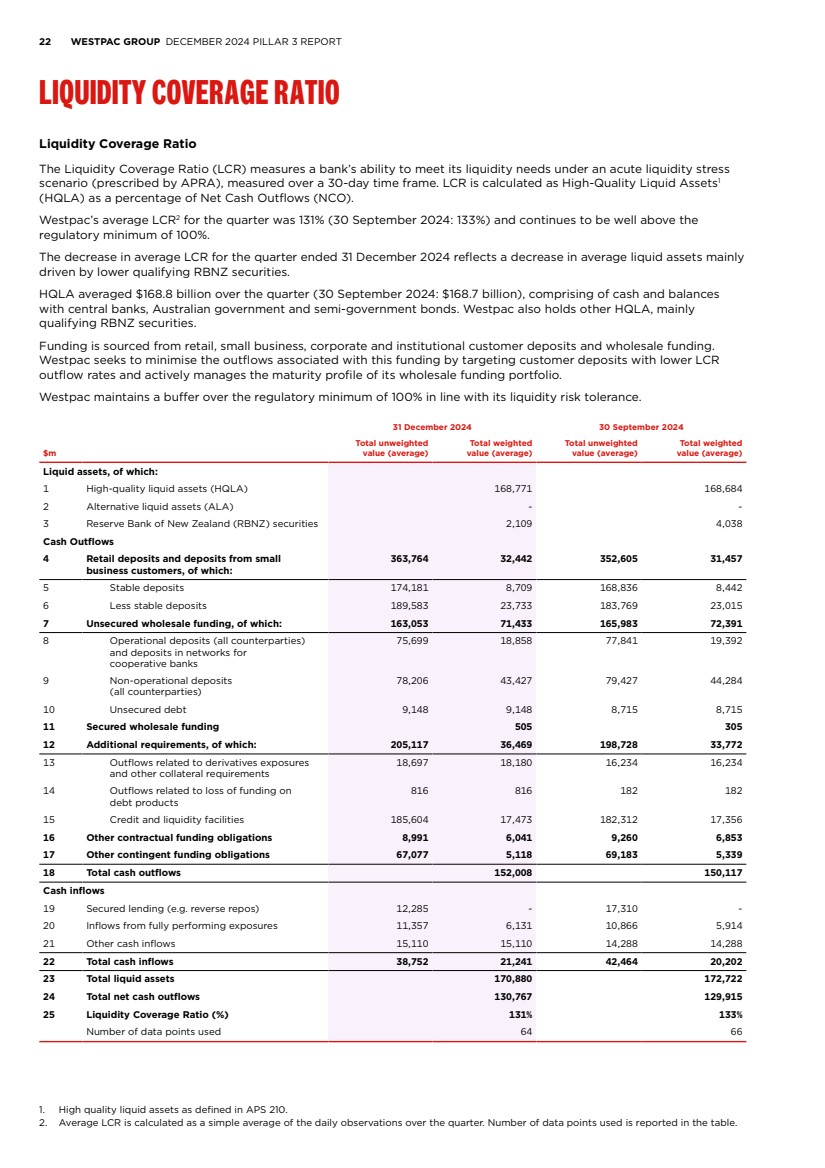
| 22 WESTPAC GROUP DECEMBER 2024 PILLAR 3 REPORT LIQUIDITY COVERAGE RATIO Liquidity Coverage Ratio The Liquidity Coverage Ratio (LCR) measures a bank’s ability to meet its liquidity needs under an acute liquidity stress scenario (prescribed by APRA), measured over a 30-day time frame. LCR is calculated as High-Quality Liquid Assets1 (HQLA) as a percentage of Net Cash Outflows (NCO). Westpac’s average LCR2 for the quarter was 131% (30 September 2024: 133%) and continues to be well above the regulatory minimum of 100%. The decrease in average LCR for the quarter ended 31 December 2024 reflects a decrease in average liquid assets mainly driven by lower qualifying RBNZ securities. HQLA averaged $168.8 billion over the quarter (30 September 2024: $168.7 billion), comprising of cash and balances with central banks, Australian government and semi-government bonds. Westpac also holds other HQLA, mainly qualifying RBNZ securities. Funding is sourced from retail, small business, corporate and institutional customer deposits and wholesale funding. Westpac seeks to minimise the outflows associated with this funding by targeting customer deposits with lower LCR outflow rates and actively manages the maturity profile of its wholesale funding portfolio. Westpac maintains a buffer over the regulatory minimum of 100% in line with its liquidity risk tolerance. 31 December 2024 30 September 2024 $m Total unweighted value (average) Total weighted value (average) Total unweighted value (average) Total weighted value (average) Liquid assets, of which: 1 High-quality liquid assets (HQLA) 168,771 168,684 2 Alternative liquid assets (ALA) - - 3 Reserve Bank of New Zealand (RBNZ) securities 2,109 4,038 Cash Outflows 4 Retail deposits and deposits from small business customers, of which: 363,764 32,442 352,605 31,457 5 Stable deposits 174,181 8,709 168,836 8,442 6 Less stable deposits 189,583 23,733 183,769 23,015 7 Unsecured wholesale funding, of which: 163,053 71,433 165,983 72,391 8 Operational deposits (all counterparties) and deposits in networks for cooperative banks 75,699 18,858 77,841 19,392 9 Non-operational deposits (all counterparties) 78,206 43,427 79,427 44,284 10 Unsecured debt 9,148 9,148 8,715 8,715 11 Secured wholesale funding 505 305 12 Additional requirements, of which: 205,117 36,469 198,728 33,772 13 Outflows related to derivatives exposures and other collateral requirements 18,697 18,180 16,234 16,234 14 Outflows related to loss of funding on debt products 816 816 182 182 15 Credit and liquidity facilities 185,604 17,473 182,312 17,356 16 Other contractual funding obligations 8,991 6,041 9,260 6,853 17 Other contingent funding obligations 67,077 5,118 69,183 5,339 18 Total cash outflows 152,008 150,117 Cash inflows 19 Secured lending (e.g. reverse repos) 12,285 - 17,310 - 20 Inflows from fully performing exposures 11,357 6,131 10,866 5,914 21 Other cash inflows 15,110 15,110 14,288 14,288 22 Total cash inflows 38,752 21,241 42,464 20,202 23 Total liquid assets 170,880 172,722 24 Total net cash outflows 130,767 129,915 25 Liquidity Coverage Ratio (%) 131% 133% Number of data points used 64 66 1. High quality liquid assets as defined in APS 210. 2. Average LCR is calculated as a simple average of the daily observations over the quarter. Number of data points used is reported in the table. |
| PILLAR 3 REPORT APPENDICES DISCLOSURE REGARDING FORWARD-LOOKING STATEMENTS GLOSSARY 23 APPENDICES APPENDIX I – APS 330 QUANTITATIVE REQUIREMENTS APPENDIX II – EXCHANGE RATES |

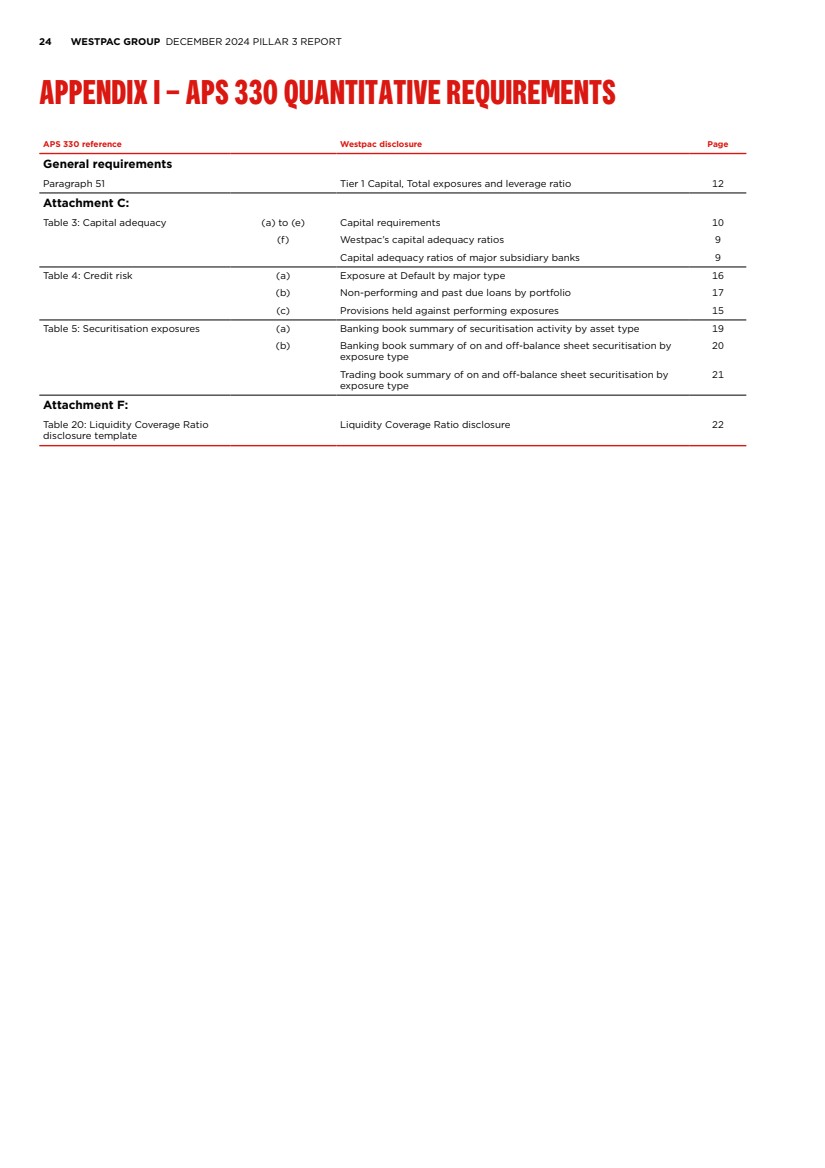
| 24 WESTPAC GROUP DECEMBER 2024 PILLAR 3 REPORT APPENDIX I – APS 330 QUANTITATIVE REQUIREMENTS APS 330 reference Westpac disclosure Page General requirements Paragraph 51 Tier 1 Capital, Total exposures and leverage ratio 12 Attachment C: Table 3: Capital adequacy (a) to (e) Capital requirements 10 (f) Westpac’s capital adequacy ratios 9 Capital adequacy ratios of major subsidiary banks 9 Table 4: Credit risk (a) Exposure at Default by major type 16 (b) Non-performing and past due loans by portfolio 17 (c) Provisions held against performing exposures 15 Table 5: Securitisation exposures (a) Banking book summary of securitisation activity by asset type 19 (b) Banking book summary of on and off-balance sheet securitisation by exposure type 20 Trading book summary of on and off-balance sheet securitisation by exposure type 21 Attachment F: Table 20: Liquidity Coverage Ratio disclosure template Liquidity Coverage Ratio disclosure 22 |
| PILLAR 3 REPORT APPENDICES DISCLOSURE REGARDING FORWARD-LOOKING STATEMENTS GLOSSARY 25 APPENDIX II – EXCHANGE RATES Exchange rates against A$ 31 December 30 September 31 December Currency 2024 2024 2023 USD 0.6217 0.6929 0.6842 GBP 0.4954 0.5176 0.5364 NZD 1.1041 1.0885 1.0769 EUR 0.5976 0.6207 0.6184 |

| 26 WESTPAC GROUP DECEMBER 2024 PILLAR 3 REPORT DISCLOSURE REGARDING FORWARD-LOOKING STATEMENTS |

| PILLAR 3 REPORT APPENDICES DISCLOSURE REGARDING FORWARD-LOOKING STATEMENTS GLOSSARY 27 DISCLOSURE REGARDING FORWARD-LOOKING STATEMENTS The information contained in this report contains statements that constitute “forward-looking statements” within the meaning of section 21E of the U.S. Securities Exchange Act of 1934. Forward-looking statements are statements that are not historical facts. Forward-looking statements appear in a number of places in this report and include statements regarding Westpac’s current intent, belief or expectations with respect to its business and operations, macro and micro economic and market conditions, results of operations and financial condition and performance, capital adequacy and liquidity and risk management, including, without limitation, future loan loss provisions and financial support to certain borrowers, forecasted economic indicators and performance metric outcomes, indicative drivers, climate- and other sustainability- related statements, commitments, targets, projections and metrics, and other estimated and proxy data. Words such as ‘will’, ‘may’, ‘expect’, ‘intend’, ‘seek’, ‘would’, ‘should’, ‘could’, ‘continue’, ‘plan’, ‘estimate’, ‘anticipate’, ‘believe’, ‘probability’, ‘indicative’, ‘risk’, ‘aim’, ‘outlook’, ‘forecast’, ‘f’cast’, ‘f’, ‘assumption’, ‘projection’, ‘target,’ goal’, ‘guidance’, 'objective', ‘ambition’ or other similar words are used to identify forward-looking statements. These forward-looking statements reflect Westpac’s current views on future events and are subject to change, certain known and unknown risks, uncertainties and assumptions and other factors which are, in many instances, beyond Westpac’s control (and the control of Westpac’s officers, employees, agents and advisors), and have been made based on management’s current expectations or beliefs concerning future developments and their potential effect upon Westpac. Forward-looking statements may also be made, verbally or in writing, by members of Westpac’s management or Board in connection with this report. Such statements are subject to the same limitations, uncertainties, assumptions and disclaimers set out in this report. There can be no assurance that future developments or performance will align with Westpac’s expectations or that the effect of future developments on Westpac will be those anticipated. Actual results could differ materially from those Westpac expects or which are expressed or implied in forward-looking statements, depending on various factors including, but not limited to, those described in the risk factors in Westpac’s 2024 Risk Factors. When relying on forward-looking statements to make decisions with respect to Westpac, investors and others should carefully consider such factors and other uncertainties and events. Except as required by law, Westpac assumes no obligation to revise or update any forward-looking statements in this report, whether from new information, future events, conditions or otherwise, after the date of this report. |

| 28 WESTPAC GROUP DECEMBER 2024 PILLAR 3 REPORT GLOSSARY |

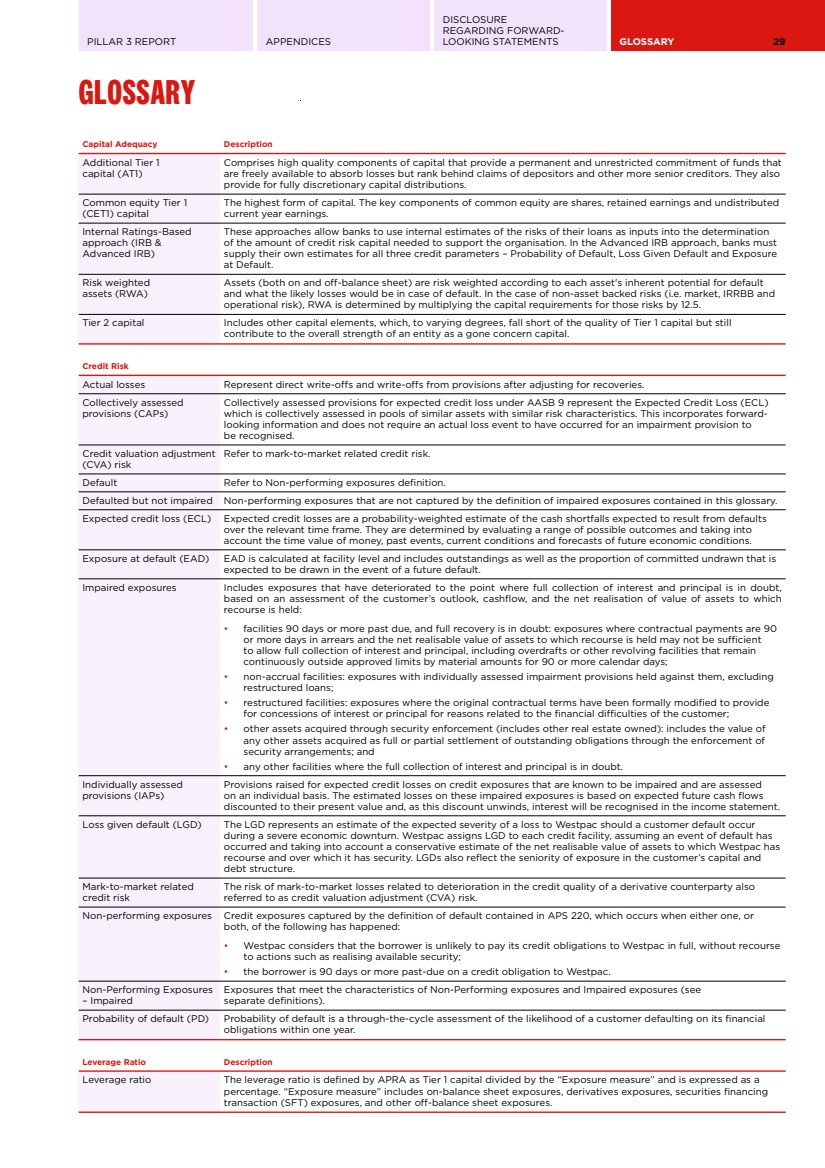
| PILLAR 3 REPORT APPENDICES DISCLOSURE REGARDING FORWARD-LOOKING STATEMENTS GLOSSARY 29 GLOSSARY Capital Adequacy Description Additional Tier 1 capital (AT1) Comprises high quality components of capital that provide a permanent and unrestricted commitment of funds that are freely available to absorb losses but rank behind claims of depositors and other more senior creditors. They also provide for fully discretionary capital distributions. Common equity Tier 1 (CET1) capital The highest form of capital. The key components of common equity are shares, retained earnings and undistributed current year earnings. Internal Ratings-Based approach (IRB & Advanced IRB) These approaches allow banks to use internal estimates of the risks of their loans as inputs into the determination of the amount of credit risk capital needed to support the organisation. In the Advanced IRB approach, banks must supply their own estimates for all three credit parameters – Probability of Default, Loss Given Default and Exposure at Default. Risk weighted assets (RWA) Assets (both on and off-balance sheet) are risk weighted according to each asset's inherent potential for default and what the likely losses would be in case of default. In the case of non-asset backed risks (i.e. market, IRRBB and operational risk), RWA is determined by multiplying the capital requirements for those risks by 12.5. Tier 2 capital Includes other capital elements, which, to varying degrees, fall short of the quality of Tier 1 capital but still contribute to the overall strength of an entity as a gone concern capital. Credit Risk Actual losses Represent direct write-offs and write-offs from provisions after adjusting for recoveries. Collectively assessed provisions (CAPs) Collectively assessed provisions for expected credit loss under AASB 9 represent the Expected Credit Loss (ECL) which is collectively assessed in pools of similar assets with similar risk characteristics. This incorporates forward-looking information and does not require an actual loss event to have occurred for an impairment provision to be recognised. Credit valuation adjustment (CVA) risk Refer to mark-to-market related credit risk. Default Refer to Non-performing exposures definition. Defaulted but not impaired Non-performing exposures that are not captured by the definition of impaired exposures contained in this glossary. Expected credit loss (ECL) Expected credit losses are a probability-weighted estimate of the cash shortfalls expected to result from defaults over the relevant time frame. They are determined by evaluating a range of possible outcomes and taking into account the time value of money, past events, current conditions and forecasts of future economic conditions. Exposure at default (EAD) EAD is calculated at facility level and includes outstandings as well as the proportion of committed undrawn that is expected to be drawn in the event of a future default. Impaired exposures Includes exposures that have deteriorated to the point where full collection of interest and principal is in doubt, based on an assessment of the customer’s outlook, cashflow, and the net realisation of value of assets to which recourse is held: • facilities 90 days or more past due, and full recovery is in doubt: exposures where contractual payments are 90 or more days in arrears and the net realisable value of assets to which recourse is held may not be sufficient to allow full collection of interest and principal, including overdrafts or other revolving facilities that remain continuously outside approved limits by material amounts for 90 or more calendar days; • non-accrual facilities: exposures with individually assessed impairment provisions held against them, excluding restructured loans; • restructured facilities: exposures where the original contractual terms have been formally modified to provide for concessions of interest or principal for reasons related to the financial difficulties of the customer; • other assets acquired through security enforcement (includes other real estate owned): includes the value of any other assets acquired as full or partial settlement of outstanding obligations through the enforcement of security arrangements; and • any other facilities where the full collection of interest and principal is in doubt. Individually assessed provisions (IAPs) Provisions raised for expected credit losses on credit exposures that are known to be impaired and are assessed on an individual basis. The estimated losses on these impaired exposures is based on expected future cash flows discounted to their present value and, as this discount unwinds, interest will be recognised in the income statement. Loss given default (LGD) The LGD represents an estimate of the expected severity of a loss to Westpac should a customer default occur during a severe economic downturn. Westpac assigns LGD to each credit facility, assuming an event of default has occurred and taking into account a conservative estimate of the net realisable value of assets to which Westpac has recourse and over which it has security. LGDs also reflect the seniority of exposure in the customer’s capital and debt structure. Mark-to-market related credit risk The risk of mark-to-market losses related to deterioration in the credit quality of a derivative counterparty also referred to as credit valuation adjustment (CVA) risk. Non-performing exposures Credit exposures captured by the definition of default contained in APS 220, which occurs when either one, or both, of the following has happened: • Westpac considers that the borrower is unlikely to pay its credit obligations to Westpac in full, without recourse to actions such as realising available security; • the borrower is 90 days or more past-due on a credit obligation to Westpac. Non-Performing Exposures – Impaired Exposures that meet the characteristics of Non-Performing exposures and Impaired exposures (see separate definitions). Probability of default (PD) Probability of default is a through-the-cycle assessment of the likelihood of a customer defaulting on its financial obligations within one year. Leverage Ratio Description Leverage ratio The leverage ratio is defined by APRA as Tier 1 capital divided by the “Exposure measure” and is expressed as a percentage. “Exposure measure” includes on-balance sheet exposures, derivatives exposures, securities financing transaction (SFT) exposures, and other off-balance sheet exposures. |
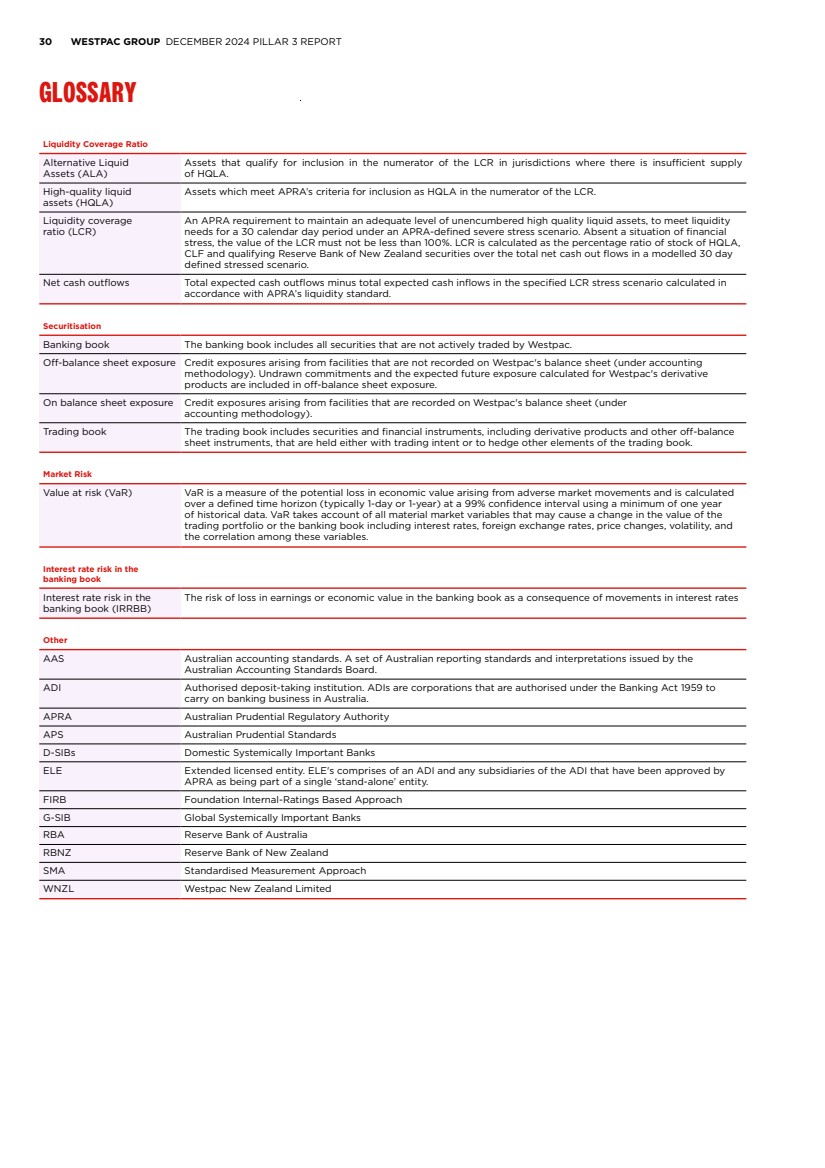
| 30 WESTPAC GROUP DECEMBER 2024 PILLAR 3 REPORT GLOSSARY Liquidity Coverage Ratio Alternative Liquid Assets (ALA) Assets that qualify for inclusion in the numerator of the LCR in jurisdictions where there is insufficient supply of HQLA. High-quality liquid assets (HQLA) Assets which meet APRA’s criteria for inclusion as HQLA in the numerator of the LCR. Liquidity coverage ratio (LCR) An APRA requirement to maintain an adequate level of unencumbered high quality liquid assets, to meet liquidity needs for a 30 calendar day period under an APRA-defined severe stress scenario. Absent a situation of financial stress, the value of the LCR must not be less than 100%. LCR is calculated as the percentage ratio of stock of HQLA, CLF and qualifying Reserve Bank of New Zealand securities over the total net cash out flows in a modelled 30 day defined stressed scenario. Net cash outflows Total expected cash outflows minus total expected cash inflows in the specified LCR stress scenario calculated in accordance with APRA’s liquidity standard. Securitisation Banking book The banking book includes all securities that are not actively traded by Westpac. Off-balance sheet exposure Credit exposures arising from facilities that are not recorded on Westpac's balance sheet (under accounting methodology). Undrawn commitments and the expected future exposure calculated for Westpac's derivative products are included in off-balance sheet exposure. On balance sheet exposure Credit exposures arising from facilities that are recorded on Westpac's balance sheet (under accounting methodology). Trading book The trading book includes securities and financial instruments, including derivative products and other off-balance sheet instruments, that are held either with trading intent or to hedge other elements of the trading book. Market Risk Value at risk (VaR) VaR is a measure of the potential loss in economic value arising from adverse market movements and is calculated over a defined time horizon (typically 1-day or 1-year) at a 99% confidence interval using a minimum of one year of historical data. VaR takes account of all material market variables that may cause a change in the value of the trading portfolio or the banking book including interest rates, foreign exchange rates, price changes, volatility, and the correlation among these variables. Interest rate risk in the banking book Interest rate risk in the banking book (IRRBB) The risk of loss in earnings or economic value in the banking book as a consequence of movements in interest rates Other AAS Australian accounting standards. A set of Australian reporting standards and interpretations issued by the Australian Accounting Standards Board. ADI Authorised deposit-taking institution. ADIs are corporations that are authorised under the Banking Act 1959 to carry on banking business in Australia. APRA Australian Prudential Regulatory Authority APS Australian Prudential Standards D-SIBs Domestic Systemically Important Banks ELE Extended licensed entity. ELE's comprises of an ADI and any subsidiaries of the ADI that have been approved by APRA as being part of a single ‘stand-alone’ entity. FIRB Foundation Internal-Ratings Based Approach G-SIB Global Systemically Important Banks RBA Reserve Bank of Australia RBNZ Reserve Bank of New Zealand SMA Standardised Measurement Approach WNZL Westpac New Zealand Limited |
| WESTPAC.COM.AU |