UNITED STATES
SECURITIES AND EXCHANGE COMMISSION
Washington, D.C. 20549
FORM N-CSR
CERTIFIED SHAREHOLDER REPORT OF
REGISTERED MANAGEMENT INVESTMENT COMPANIES
Investment Company Act file number 811-3732
MFS VARIABLE INSURANCE TRUST II
(Exact name of registrant as specified in charter)
111 Huntington Avenue, Boston, Massachusetts 02199
(Address of principal executive offices) (Zip code)
Christopher R. Bohane
Massachusetts Financial Services Company
111 Huntington Avenue
Boston, Massachusetts 02199
(Name and address of agents for service)
Registrant’s telephone number, including area code: (617) 954-5000
Date of fiscal year end: December 31
Date of reporting period: June 30, 2018
| ITEM 1. | REPORTS TO STOCKHOLDERS. |
Semiannual Report
June 30, 2018

MFS® Blended Research®
Core Equity Portfolio

MFS® Variable Insurance Trust II
CGS-SEM
MFS® Blended Research® Core Equity Portfolio
CONTENTS
The report is prepared for the general information of contract owners. It is authorized for distribution to prospective investors only when preceded or accompanied by a current prospectus.
NOT FDIC INSURED • MAY LOSE VALUE • NO BANK OR CREDIT UNION GUARANTEE • NOT A DEPOSIT • NOT INSURED BY ANY FEDERAL GOVERNMENT AGENCY OR NCUA/NCUSIF
MFS Blended Research Core Equity Portfolio
LETTER FROM THE EXECUTIVE CHAIRMAN

Dear Contract Owners:
Rising bond yields, international trade friction and geopolitical uncertainty have contributed to a measurable uptick in market volatility — a departure from the low-volatility environment that prevailed for much of 2017. In recent months, against this more challenging backdrop, global markets have given back some of the strong gains recorded during 2017 and early 2018. But global economic growth remains healthy, notwithstanding signs of a modest slowdown over the past few months, particularly in Europe and China.
Although the U.S. Federal Reserve continues to gradually raise interest rates and shrink its balance sheet, monetary policy remains accommodative around the world, with many central banks taking only tentative steps toward tighter policies. Newly enacted U.S. tax reforms have been welcomed by equity markets, while emerging market economies have recently had to contend with tighter financial conditions as a result of firmer U.S. Treasury yields and a stronger dollar. Around the world, inflation remains largely subdued, but tight labor markets and solid global demand have investors on the lookout for its potential resurgence. Increased U.S. protectionism is also a growing concern, as investors fear that trade disputes could dampen business sentiment, leading to slower global growth.
As a global investment manager, MFS® strives to create long-term value for clients through an active approach and an investment platform built on nearly a century of expertise. To make that long-term value meaningful for clients, we work to align with you on our beliefs, your needs and the time it takes to deliver on your desired outcomes.
Respectfully,

Robert J. Manning
Executive Chairman
MFS Investment Management
August 16, 2018
The opinions expressed in this letter are subject to change and may not be relied upon for investment advice. No forecasts can be guaranteed.
1
MFS Blended Research Core Equity Portfolio
PORTFOLIO COMPOSITION
Portfolio structure

| | | | |
| Top ten holdings | | | | |
| Microsoft Corp. | | | 4.5% | |
| Facebook, Inc., “A” | | | 3.3% | |
| Apple, Inc. | | | 3.0% | |
| Amazon.com, Inc. | | | 2.9% | |
| Johnson & Johnson | | | 2.6% | |
| Wells Fargo & Co. | | | 2.4% | |
| Bank of America Corp. | | | 2.3% | |
| Intel Corp. | | | 2.2% | |
| Cisco Systems, Inc. | | | 2.1% | |
| Boeing Co. | | | 2.0% | |
| | | | |
| Equity sectors | | | | |
| Technology | | | 22.3% | |
| Financial Services | | | 18.5% | |
| Health Care | | | 14.7% | |
| Industrial Goods & Services | | | 7.2% | |
| Consumer Staples | | | 6.0% | |
| Retailing | | | 5.8% | |
| Energy | | | 5.8% | |
| Leisure | | | 5.7% | |
| Utilities & Communications | | | 3.7% | |
| Special Products & Services | | | 3.2% | |
| Transportation | | | 2.6% | |
| Basic Materials | | | 1.9% | |
| Autos & Housing | | | 1.8% | |
Cash & Cash Equivalents includes any cash, investments in money market funds, short-term securities, and other assets less liabilities. Please see the Statement of Assets and Liabilities for additional information related to the fund’s cash position and other assets and liabilities.
Percentages are based on net assets as of June 30, 2018.
The portfolio is actively managed and current holdings may be different.
2
MFS Blended Research Core Equity Portfolio
EXPENSE TABLE
Fund Expenses Borne by the Contract Holders during the Period,
January 1, 2018 through June 30, 2018
As a contract holder of the fund, you incur ongoing costs, including management fees; distribution and/or service (12b-1) fees; and other fund expenses. This example is intended to help you understand your ongoing costs (in dollars) of investing in the fund and to compare these costs with the ongoing costs of investing in other mutual funds.
The example is based on an investment of $1,000 invested at the beginning of the period and held for the entire period January 1, 2018 through June 30, 2018.
Actual Expenses
The first line for each share class in the following table provides information about actual account values and actual expenses. You may use the information in this line, together with the amount you invested, to estimate the expenses that you paid over the period. Simply divide your account value by $1,000 (for example, an $8,600 account value divided by $1,000 = 8.6), then multiply the result by the number in the first line under the heading entitled “Expenses Paid During Period” to estimate the expenses you paid on your account during this period.
Hypothetical Example for Comparison Purposes
The second line for each share class in the following table provides information about hypothetical account values and hypothetical expenses based on the fund’s actual expense ratio and an assumed rate of return of 5% per year before expenses, which is not the fund’s actual return. The hypothetical account values and expenses may not be used to estimate the actual ending account balance or expenses you paid for the period. You may use this information to compare the ongoing costs of investing in the fund and other funds. To do so, compare this 5% hypothetical example with the 5% hypothetical examples that appear in the shareholder reports of the other funds.
Please note that the expenses shown in the table are meant to highlight the fund’s ongoing costs only and do not take into account the fees and expenses imposed under the variable contracts through which your investment in the fund is made. Therefore, the second line for each share class in the table is useful in comparing ongoing costs associated with an investment in vehicles (such as the fund) which fund benefits under variable annuity and variable life insurance contracts and to qualified pension and retirement plans only, and will not help you determine the relative total costs of investing in the fund through variable annuity and variable life insurance contracts. If the fees and expenses imposed under the variable contracts were included, your costs would have been higher.
| | | | | | | | | | | | | | | | | | |
| Share Class | | | | Annualized
Expense Ratio | | | Beginning
Account Value
1/01/18 | | | Ending Account Value
6/30/18 | | | Expenses Paid
During Period (p)
1/01/18-6/30/18 | |
| Initial Class | | Actual | | | 0.44% | | | | $1,000.00 | | | | $1,008.48 | | | | $2.19 | |
| | Hypothetical (h) | | | 0.44% | | | | $1,000.00 | | | | $1,022.61 | | | | $2.21 | |
| Service Class | | Actual | | | 0.69% | | | | $1,000.00 | | | | $1,007.25 | | | | $3.43 | |
| | Hypothetical (h) | | | 0.69% | | | | $1,000.00 | | | | $1,021.37 | | | | $3.46 | |
| (h) | 5% class return per year before expenses. |
| (p) | “Expenses Paid During Period” are equal to each class’s annualized expense ratio, as shown above, multiplied by the average account value over the period, multiplied by 181/365 (to reflect the one-half year period). |
3
MFS Blended Research Core Equity Portfolio
PORTFOLIO OF INVESTMENTS – 6/30/18 (unaudited)
The Portfolio of Investments is a complete list of all securities owned by your fund. It is categorized by broad-based asset classes.
| | | | | | | | |
| Issuer | | Shares/Par | | | Value ($) | |
| COMMON STOCKS – 99.2% | | | | | | | | |
| Aerospace – 4.4% | | | | | | | | |
| Boeing Co. | | | 29,041 | | | $ | 9,743,546 | |
| Honeywell International, Inc. | | | 47,247 | | | | 6,805,930 | |
| Lockheed Martin Corp. | | | 3,013 | | | | 890,131 | |
| Textron, Inc. | | | 40,024 | | | | 2,637,982 | |
| United Technologies Corp. | | | 8,774 | | | | 1,097,013 | |
| | | | | | | | |
| | | | | | $ | 21,174,602 | |
| | | | | | | | |
| Airlines – 0.6% | | | | | |
| Delta Air Lines, Inc. | | | 59,845 | | | $ | 2,964,721 | |
| | | | | | | | |
| Alcoholic Beverages – 0.9% | | | | | |
| Molson Coors Brewing Co. | | | 62,573 | | | $ | 4,257,467 | |
| | | | | | | | |
| Automotive – 1.5% | | | | | |
| General Motors Co. | | | 61,742 | | | $ | 2,432,635 | |
| Lear Corp. | | | 25,927 | | | | 4,817,496 | |
| | | | | | | | |
| | | | | | $ | 7,250,131 | |
| | | | | | | | |
| Biotechnology – 2.3% | | | | | |
| Biogen, Inc. (a) | | | 24,980 | | | $ | 7,250,195 | |
| Celgene Corp. (a) | | | 46,442 | | | | 3,688,424 | |
| | | | | | | | |
| | | | | | $ | 10,938,619 | |
| | | | | | | | |
| Business Services – 2.9% | | | | | |
| DXC Technology Co. | | | 75,226 | | | $ | 6,063,968 | |
| FleetCor Technologies, Inc. (a) | | | 31,482 | | | | 6,631,683 | |
| Global Payments, Inc. | | | 10,408 | | | | 1,160,388 | |
| | | | | | | | |
| | | | | | $ | 13,856,039 | |
| | | | | | | | |
| Cable TV – 1.8% | | | | | |
| Comcast Corp., “A” | | | 260,669 | | | $ | 8,552,550 | |
| | | | | | | | |
| Chemicals – 1.4% | | | | | |
| CF Industries Holdings, Inc. | | | 148,021 | | | $ | 6,572,132 | |
| | | | | | | | |
| Computer Software – 6.1% | | | | | |
| Adobe Systems, Inc. (a) | | | 27,052 | | | $ | 6,595,548 | |
| Microsoft Corp. | | | 216,120 | | | | 21,311,593 | |
| Perspecta, Inc. | | | 10,143 | | | | 208,439 | |
| Salesforce.com, Inc. (a) | | | 7,538 | | | | 1,028,183 | |
| | | | | | | | |
| | | | | | $ | 29,143,763 | |
| | | | | | | | |
| Computer Software – Systems – 3.8% | | | | | |
| Apple, Inc. | | | 76,907 | | | $ | 14,236,255 | |
| Hewlett Packard Enterprise | | | 258,036 | | | | 3,769,906 | |
| | | | | | | | |
| | | | | | $ | 18,006,161 | |
| | | | | | | | |
| Construction – 0.3% | | | | | |
| Owens Corning | | | 22,340 | | | $ | 1,415,686 | |
| | | | | | | | |
| Consumer Products – 0.2% | | | | | |
| Kimberly-Clark Corp. | | | 11,595 | | | $ | 1,221,417 | |
| | | | | | | | |
| Consumer Services – 0.3% | | | | | |
| Bookings Holdings, Inc. (a) | | | 773 | | | $ | 1,566,941 | |
| | | | | | | | |
| | | | | | | | |
| Issuer | | Shares/Par | | | Value ($) | |
| COMMON STOCKS – continued | |
| Electronics – 3.1% | | | | | | | | |
| Intel Corp. | | | 215,020 | | | $ | 10,688,644 | |
| NVIDIA Corp. | | | 16,967 | | | | 4,019,482 | |
| | | | | | | | |
| | | | | | $ | 14,708,126 | |
| | | | | | | | |
| Energy – Independent – 4.2% | | | | | |
| EOG Resources, Inc. | | | 62,355 | | | $ | 7,758,833 | |
| Phillips 66 | | | 58,173 | | | | 6,533,409 | |
| Pioneer Natural Resources Co. | | | 4,784 | | | | 905,324 | |
| Valero Energy Corp. | | | 43,225 | | | | 4,790,627 | |
| | | | | | | | |
| | | | | | $ | 19,988,193 | |
| | | | | | | | |
| Energy – Integrated – 0.6% | | | | | |
| Chevron Corp. | | | 2,265 | | | $ | 286,364 | |
| Exxon Mobil Corp. | | | 29,044 | | | | 2,402,810 | |
| | | | | | | | |
| | | | | | $ | 2,689,174 | |
| | | | | | | | |
| Food & Beverages – 3.0% | | | | | |
| General Mills, Inc. | | | 26,018 | | | $ | 1,151,557 | |
| PepsiCo, Inc. | | | 59,998 | | | | 6,531,982 | |
| Tyson Foods, Inc., “A” | | | 98,480 | | | | 6,780,348 | |
| | | | | | | | |
| | | | | | $ | 14,463,887 | |
| | | | | | | | |
| Gaming & Lodging – 2.3% | | | | | |
| Marriott International, Inc., “A” | | | 51,272 | | | $ | 6,491,035 | |
| Royal Caribbean Cruises Ltd. | | | 42,717 | | | | 4,425,481 | |
| | | | | | | | |
| | | | | | $ | 10,916,516 | |
| | | | | | | | |
| Health Maintenance Organizations – 1.4% | | | | | |
| Humana Inc. | | | 22,087 | | | $ | 6,573,754 | |
| | | | | | | | |
| Insurance – 4.3% | | | | | |
| Allstate Corp. | | | 53,865 | | | $ | 4,916,259 | |
| Berkshire Hathaway, Inc., “B” (a) | | | 14,719 | | | | 2,747,301 | |
| Hartford Financial Services Group, Inc. | | | 14,814 | | | | 757,440 | |
| MetLife, Inc. | | | 150,727 | | | | 6,571,697 | |
| Prudential Financial, Inc. | | | 59,978 | | | | 5,608,543 | |
| | | | | | | | |
| | | | | | $ | 20,601,240 | |
| | | | | | | | |
| Internet – 7.2% | | | | | |
| Alphabet, Inc., “A” (a) | | | 8,178 | | | $ | 9,234,516 | |
| Alphabet, Inc., “C” (a) | | | 8,500 | | | | 9,483,025 | |
| Facebook, Inc., “A” (a) | | | 82,279 | | | | 15,988,455 | |
| | | | | | | | |
| | | | | | $ | 34,705,996 | |
| | | | | | | | |
| Leisure & Toys – 1.3% | | | | | |
| Electronic Arts, Inc. (a) | | | 43,173 | | | $ | 6,088,256 | |
| | | | | | | | |
| Machinery & Tools – 2.8% | | | | | |
| AGCO Corp. | | | 18,036 | | | $ | 1,095,146 | |
| Eaton Corp. PLC | | | 87,888 | | | | 6,568,749 | |
| Ingersoll-Rand Co. Ltd., “A” | | | 20,201 | | | | 1,812,636 | |
| United Rentals, Inc. (a) | | | 25,258 | | | | 3,728,586 | |
| | | | | | | | |
| | | | | | $ | 13,205,117 | |
| | | | | | | | |
4
MFS Blended Research Core Equity Portfolio
Portfolio of Investments (unaudited) – continued
| | | | | | | | |
| Issuer | | Shares/Par | | | Value ($) | |
| COMMON STOCKS – continued | |
| Major Banks – 6.8% | | | | | | | | |
| Bank of America Corp. | | | 397,975 | | | $ | 11,218,915 | |
| JPMorgan Chase & Co. | | | 27,980 | | | | 2,915,516 | |
| Morgan Stanley | | | 141,105 | | | | 6,688,377 | |
| Wells Fargo & Co. | | | 208,183 | | | | 11,541,666 | |
| | | | | | | | |
| | | | | | $ | 32,364,474 | |
| | | | | | | | |
| Medical & Health Technology & Services – 3.5% | |
| Express Scripts Holding Co. (a) | | | 27,986 | | | $ | 2,160,799 | |
| HCA Healthcare, Inc. | | | 17,878 | | | | 1,834,283 | |
| McKesson Corp. | | | 46,056 | | | | 6,143,870 | |
| Walgreens Boots Alliance, Inc. | | | 110,793 | | | | 6,649,242 | |
| | | | | | | | |
| | | | | | $ | 16,788,194 | |
| | | | | | | | |
| Medical Equipment – 2.0% | | | | | | | | |
| Align Technology, Inc. (a) | | | 3,344 | | | $ | 1,144,116 | |
| Medtronic PLC | | | 99,091 | | | | 8,483,181 | |
| | | | | | | | |
| | | | | | $ | 9,627,297 | |
| | | | | | | | |
| Network & Telecom – 2.1% | | | | | | | | |
| Cisco Systems, Inc. | | | 234,911 | | | $ | 10,108,220 | |
| | | | | | | | |
| Oil Services – 1.0% | | | | | | | | |
| Schlumberger Ltd. | | | 73,627 | | | $ | 4,935,218 | |
| | | | | | | | |
| Other Banks & Diversified Financials – 3.7% | |
| Citigroup, Inc. | | | 73,486 | | | $ | 4,917,683 | |
| Discover Financial Services | | | 98,842 | | | | 6,959,465 | |
| Mastercard, Inc., “A” | | | 4,376 | | | | 859,971 | |
| Synchrony Financial | | | 146,783 | | | | 4,899,617 | |
| | | | | | | | |
| | | | | | $ | 17,636,736 | |
| | | | | | | | |
| Pharmaceuticals – 5.5% | | | | | | | | |
| Bristol-Myers Squibb Co. | | | 36,903 | | | $ | 2,042,212 | |
| Eli Lilly & Co. | | | 97,347 | | | | 8,306,619 | |
| Johnson & Johnson | | | 103,990 | | | | 12,618,147 | |
| Pfizer, Inc. | | | 95,530 | | | | 3,465,828 | |
| | | | | | | | |
| | | | | | $ | 26,432,806 | |
| | | | | | | | |
| Railroad & Shipping – 2.0% | | | | | | | | |
| Kansas City Southern Co. | | | 8,124 | | | $ | 860,819 | |
| Union Pacific Corp. | | | 62,517 | | | | 8,857,409 | |
| | | | | | | | |
| | | | | | $ | 9,718,228 | |
| | | | | | | | |
| Real Estate – 3.8% | | | | | | | | |
| Extra Space Storage, Inc., REIT | | | 52,630 | | | $ | 5,253,000 | |
| Host Hotels & Resorts, Inc., REIT | | | 146,435 | | | | 3,085,386 | |
| Life Storage, Inc., REIT | | | 16,114 | | | | 1,568,053 | |
| Store Capital Corp., REIT | | | 147,264 | | | | 4,035,034 | |
| Weyerhaeuser Co., REIT | | | 114,415 | | | | 4,171,571 | |
| | | | | | | | |
| | | | | | $ | 18,113,044 | |
| | | | | | | | |
| Restaurants – 0.3% | | | | | | | | |
| Aramark | | | 44,428 | | | $ | 1,648,279 | |
| | | | | | | | |
| | | | | | | | |
| Issuer | | Shares/Par | | | Value ($) | |
| COMMON STOCKS – continued | |
| Specialty Chemicals – 0.5% | | | | | | | | |
| Univar, Inc. (a) | | | 92,948 | | | $ | 2,438,955 | |
| | | | | | | | |
| Specialty Stores – 5.8% | | | | | | | | |
| Amazon.com, Inc. (a) | | | 8,196 | | | $ | 13,931,561 | |
| Best Buy Co., Inc. | | | 24,307 | | | | 1,812,816 | |
| Costco Wholesale Corp. | | | 33,163 | | | | 6,930,404 | |
| Ross Stores, Inc. | | | 46,486 | | | | 3,939,688 | |
| Urban Outfitters, Inc. (a) | | | 25,055 | | | | 1,116,200 | |
| | | | | | | | |
| | | | | | $ | 27,730,669 | |
| | | | | | | | |
| Telephone Services – 0.8% | | | | | | | | |
| Verizon Communications, Inc. | | | 76,313 | | | $ | 3,839,307 | |
| | | | | | | | |
| Tobacco – 1.8% | | | | | | | | |
| Philip Morris International, Inc. | | | 107,071 | | | $ | 8,644,913 | |
| | | | | | | | |
| Utilities – Electric Power – 2.9% | | | | | | | | |
| AES Corp. | | | 374,695 | | | $ | 5,024,660 | |
| Exelon Corp. | | | 175,993 | | | | 7,497,302 | |
| PPL Corp. | | | 31,811 | | | | 908,204 | |
| Vistra Energy Corp. (a) | | | 24,518 | | | | 580,096 | |
| | | | | | | | |
| | | | | | $ | 14,010,262 | |
| | | | | | | | |
Total Common Stocks
(Identified Cost, $371,508,237) | | | | | | $ | 474,897,090 | |
| | | | | | | | |
| |
| INVESTMENT COMPANIES (h) – 0.8% | | | | | |
| Money Market Funds – 0.8% | | | | | | | | |
| MFS Institutional Money Market Portfolio, 1.9% (v) (Identified Cost, $4,065,197) | | | 4,065,412 | | | $ | 4,065,412 | |
| | | | | | | | |
OTHER ASSETS, LESS
LIABILITIES – (0.0)% | | | | | | | (80,965 | ) |
| | | | | | | | |
| NET ASSETS – 100.0% | | | | | | $ | 478,881,537 | |
| | | | | | | | |
| (a) | | Non-income producing security. |
| (h) | | An affiliated issuer, which may be considered one in which the fund owns 5% or more of the outstanding voting securities, or a company which is under common control. At period end, the aggregate values of the fund’s investments in affiliated issuers and in unaffiliated issuers were $4,065,412 and $474,897,090, respectively. |
| (v) | | Affiliated issuer that is available only to investment companies managed by MFS. The rate quoted for the MFS Institutional Money Market Portfolio is the annualized seven-day yield of the fund at period end. |
The following abbreviations are used in this report and are defined:
| PLC | | Public Limited Company |
| REIT | | Real Estate Investment Trust |
See Notes to Financial Statements
5
MFS Blended Research Core Equity Portfolio
FINANCIAL STATEMENTS | STATEMENT OF ASSETS AND LIABILITIES (unaudited)
This statement represents your fund’s balance sheet, which details the assets and liabilities comprising the total value of the fund.
| | | | |
At 6/30/18 | | | | |
Assets | | | | |
Investments in unaffiliated issuers, at value (identified cost, $371,508,237) | | | $474,897,090 | |
Investments in affiliated issuers, at value (identified cost, $4,065,197) | | | 4,065,412 | |
Cash | | | 9,161 | |
Receivables for | | | | |
Investments sold | | | 15,998,523 | |
Fund shares sold | | | 1,345 | |
Dividends | | | 417,365 | |
Other assets | | | 1,591 | |
Total assets | | | $495,390,487 | |
Liabilities | | | | |
Payables for | | | | |
Investments purchased | | | $15,922,913 | |
Fund shares reacquired | | | 489,539 | |
Payable to affiliates | | | | |
Investment adviser | | | 16,006 | |
Shareholder servicing costs | | | 79 | |
Distribution and/or service fees | | | 3,654 | |
Payable for independent Trustees’ compensation | | | 100 | |
| Accrued expenses and other liabilities | | | 76,659 | |
Total liabilities | | | $16,508,950 | |
Net assets | | | $478,881,537 | |
Net assets consist of | | | | |
Paid-in capital | | | $301,463,187 | |
Unrealized appreciation (depreciation) | | | 103,389,068 | |
Accumulated net realized gain (loss) | | | 64,588,049 | |
Undistributed net investment income | | | 9,441,233 | |
Net assets | | | $478,881,537 | |
Shares of beneficial interest outstanding | | | 8,787,278 | |
| | | | | | | | | | | | |
| | | Net assets | | | Shares
outstanding | | | Net asset value
per share | |
Initial Class | | | $300,838,503 | | | | 5,500,902 | | | | $54.69 | |
Service Class | | | 178,043,034 | | | | 3,286,376 | | | | 54.18 | |
See Notes to Financial Statements
6
MFS Blended Research Core Equity Portfolio
FINANCIAL STATEMENTS | STATEMENT OF OPERATIONS (unaudited)
This statement describes how much your fund earned in investment income and accrued in expenses. It also describes any gains and/or losses generated by fund operations.
| | | | |
Six months ended 6/30/18 | | | | |
Net investment income (loss) | | | | |
Income | | | | |
Dividends | | | $4,555,629 | |
Dividends from affiliated issuers | | | 24,013 | |
Other | | | 5,229 | |
Total investment income | | | $4,584,871 | |
Expenses | | | | |
Management fee | | | $978,797 | |
Distribution and/or service fees | | | 223,979 | |
Shareholder servicing costs | | | 7,896 | |
Administrative services fee | | | 41,657 | |
Independent Trustees’ compensation | | | 7,084 | |
Custodian fee | | | 11,868 | |
Shareholder communications | | | 16,407 | |
Audit and tax fees | | | 26,502 | |
Legal fees | | | 2,803 | |
Miscellaneous | | | 10,212 | |
Total expenses | | | $1,327,205 | |
Reduction of expenses by investment adviser | | | (22,568 | ) |
Net expenses | | | $1,304,637 | |
Net investment income (loss) | | | $3,280,234 | |
Realized and unrealized gain (loss) | | | | |
Realized gain (loss) (identified cost basis) | | | | |
Unaffiliated issuers | | | $23,946,614 | |
Affiliated issuers | | | (638 | ) |
Net realized gain (loss) | | | $23,945,976 | |
Change in unrealized appreciation or depreciation | | | | |
Unaffiliated issuers | | | $(22,940,125 | ) |
Affiliated issuers | | | 215 | |
Net unrealized gain (loss) | | | $(22,939,910 | ) |
Net realized and unrealized gain (loss) | | | $1,006,066 | |
Change in net assets from operations | | | $4,286,300 | |
See Notes to Financial Statements
7
MFS Blended Research Core Equity Portfolio
FINANCIAL STATEMENTS | STATEMENTS OF CHANGES IN NET ASSETS
These statements describe the increases and/or decreases in net assets resulting from operations, any distributions, and any shareholder transactions.
| | | | | | | | |
| | | Six months ended
6/30/18 | | | Year ended
12/31/17 | |
| | | (unaudited) | | | | |
Change in net assets | | | | | | | | |
From operations | | | | | | | | |
Net investment income (loss) | | | $3,280,234 | | | | $6,161,470 | |
Net realized gain (loss) | | | 23,945,976 | | | | 40,921,145 | |
Net unrealized gain (loss) | | | (22,939,910 | ) | | | 44,745,227 | |
Change in net assets from operations | | | $4,286,300 | | | | $91,827,842 | |
Distributions declared to shareholders | | | | | | | | |
From net investment income | | | $— | | | | $(6,939,009 | ) |
From net realized gain | | | — | | | | (10,294,078 | ) |
Total distributions declared to shareholders | | | $— | | | | $(17,233,087 | ) |
Change in net assets from fund share transactions | | | $(27,892,051 | ) | | | $(48,097,121 | ) |
Total change in net assets | | | $(23,605,751 | ) | | | $26,497,634 | |
Net assets | | | | | | | | |
At beginning of period | | | 502,487,288 | | | | 475,989,654 | |
At end of period (including undistributed net investment income of $9,441,233 and
$6,160,999, respectively) | | | $478,881,537 | | | | $502,487,288 | |
See Notes to Financial Statements
8
MFS Blended Research Core Equity Portfolio
FINANCIAL STATEMENTS | FINANCIAL HIGHLIGHTS
The financial highlights table is intended to help you understand the fund’s financial performance for the semiannual period and the past 5 fiscal years. Certain information reflects financial results for a single fund share. The total returns in the table represent the rate that an investor would have earned (or lost) on an investment in the fund share class (assuming reinvestment of all distributions) held for the entire period.
| | | | | | | | | | | | | | | | | | | | | | | | |
| Initial Class | | Six months ended
6/30/18 | | | Year ended | |
| | | | 12/31/17 | | | 12/31/16 | | | 12/31/15 | | | 12/31/14 | | | 12/31/13 | |
| | | (unaudited) | | | | | | | | | | | | | | | | |
Net asset value, beginning of period | | | $54.23 | | | | $46.62 | | | | $48.56 | | | | $53.50 | | | | $48.31 | | | | $36.15 | |
| Income (loss) from investment operations | | | | | | | | | | | | | | | | | | | | | | | | |
Net investment income (loss) (d) | | | $0.39 | | | | $0.68 | | | | $0.74 | (c) | | | $0.76 | | | | $0.77 | | | | $0.71 | |
Net realized and unrealized gain (loss) | | | 0.07 | | | | 8.80 | | | | 3.24 | | | | (0.62 | ) | | | 5.28 | | | | 12.32 | |
Total from investment operations | | | $0.46 | | | | $9.48 | | | | $3.98 | | | | $0.14 | | | | $6.05 | | | | $13.03 | |
| Less distributions declared to shareholders | | | | | | | | | | | | | | | | | | | | | | | | |
From net investment income | | | $— | | | | $(0.78 | ) | | | $(0.72 | ) | | | $(0.87 | ) | | | $(0.86 | ) | | | $(0.87 | ) |
From net realized gain | | | — | | | | (1.09 | ) | | | (5.20 | ) | | | (4.21 | ) | | | — | | | | — | |
Total distributions declared to shareholders | | | $— | | | | $(1.87 | ) | | | $(5.92 | ) | | | $(5.08 | ) | | | $(0.86 | ) | | | $(0.87 | ) |
Net asset value, end of period (x) | | | $54.69 | | | | $54.23 | | | | $46.62 | | | | $48.56 | | | | $53.50 | | | | $48.31 | |
Total return (%) (k)(r)(s)(x) | | | 0.85 | (n) | | | 20.76 | | | | 8.45 | (c) | | | 1.13 | | | | 12.57 | | | | 36.40 | |
Ratios (%) (to average net assets)
and Supplemental data: | | | | | | | | | | | | | | | | | | | | | | | | |
Expenses before expense reductions | | | 0.45 | (a) | | | 0.46 | | | | 0.49 | (c) | | | 0.60 | | | | 0.60 | | | | 0.60 | |
Expenses after expense reductions (f) | | | 0.44 | (a) | | | 0.45 | | | | 0.44 | (c) | | | 0.45 | | | | 0.45 | | | | 0.50 | |
Net investment income (loss) (f) | | | 1.43 | (a) | | | 1.35 | | | | 1.56 | (c) | | | 1.45 | | | | 1.53 | | | | 1.68 | |
Portfolio turnover | | | 31 | (n) | | | 51 | | | | 49 | | | | 51 | | | | 41 | | | | 43 | |
Net assets at end of period (000 omitted) | | | $300,839 | | | | $320,384 | | | | $306,368 | | | | $319,721 | | | | $361,501 | | | | $367,674 | |
| | |
| Service Class | | Six months ended 6/30/18 | | | Year ended | |
| | | | 12/31/17 | | | 12/31/16 | | | 12/31/15 | | | 12/31/14 | | | 12/31/13 | |
| | | (unaudited) | | | | | | | | | | | | | | | | |
Net asset value, beginning of period | | | $53.79 | | | | $46.26 | | | | $48.26 | | | | $53.18 | | | | $48.02 | | | | $35.93 | |
| Income (loss) from investment operations | | | | | | | | | | | | | | | | | | | | | | | | |
Net investment income (loss) (d) | | | $0.32 | | | | $0.55 | | | | $0.61 | (c) | | | $0.62 | | | | $0.64 | | | | $0.60 | |
Net realized and unrealized gain (loss) | | | 0.07 | | | | 8.73 | | | | 3.22 | | | | (0.61 | ) | | | 5.23 | | | | 12.24 | |
Total from investment operations | | | $0.39 | | | | $9.28 | | | | $3.83 | | | | $0.01 | | | | $5.87 | | | | $12.84 | |
| Less distributions declared to shareholders | | | | | | | | | | | | | | | | | | | | | | | | |
From net investment income | | | $— | | | | $(0.66 | ) | | | $(0.63 | ) | | | $(0.72 | ) | | | $(0.71 | ) | | | $(0.75 | ) |
From net realized gain | | | — | | | | (1.09 | ) | | | (5.20 | ) | | | (4.21 | ) | | | — | | | | — | |
Total distributions declared to shareholders | | | $— | | | | $(1.75 | ) | | | $(5.83 | ) | | | $(4.93 | ) | | | $(0.71 | ) | | | $(0.75 | ) |
Net asset value, end of period (x) | | | $54.18 | | | | $53.79 | | | | $46.26 | | | | $48.26 | | | | $53.18 | | | | $48.02 | |
Total return (%) (k)(r)(s)(x) | | | 0.73 | (n) | | | 20.47 | | | | 8.17 | (c) | | | 0.87 | | | | 12.28 | | | | 36.05 | |
Ratios (%) (to average net assets)
and Supplemental data: | | | | | | | | | | | | | | | | | | | | | | | | |
Expenses before expense reductions | | | 0.70 | (a) | | | 0.71 | | | | 0.74 | (c) | | | 0.85 | | | | 0.85 | | | | 0.85 | |
Expenses after expense reductions (f) | | | 0.69 | (a) | | | 0.70 | | | | 0.69 | (c) | | | 0.70 | | | | 0.70 | | | | 0.75 | |
Net investment income (loss) (f) | | | 1.18 | (a) | | | 1.10 | | | | 1.30 | (c) | | | 1.20 | | | | 1.28 | | | | 1.44 | |
Portfolio turnover | | | 31 | (n) | | | 51 | | | | 49 | | | | 51 | | | | 41 | | | | 43 | |
Net assets at end of period (000 omitted) | | | $178,043 | | | | $182,103 | | | | $169,622 | | | | $143,427 | | | | $116,301 | | | | $134,107 | |
See Notes to Financial Statements
9
MFS Blended Research Core Equity Portfolio
Financial Highlights – continued
| (c) | Amount reflects a one-time reimbursement of expenses by the custodian (or former custodian) without which net investment income and performance would be lower and expenses would be higher. |
| (d) | Per share data is based on average shares outstanding. |
| (f) | Ratios do not reflect reductions from fees paid indirectly, if applicable. |
| (k) | The total return does not reflect expenses that apply to separate accounts. Inclusion of these charges would reduce the total return figures for all periods shown. |
| (r) | Certain expenses have been reduced without which performance would have been lower. |
| (s) | From time to time the fund may receive proceeds from litigation settlements, without which performance would be lower. |
| (x) | The net asset values and total returns have been calculated on net assets which include adjustments made in accordance with U.S. generally accepted accounting principles required at period end for financial reporting purposes. |
See Notes to Financial Statements
10
MFS Blended Research Core Equity Portfolio
NOTES TO FINANCIAL STATEMENTS (unaudited)
| (1) | | Business and Organization |
MFS Blended Research Core Equity Portfolio (the fund) is a diversified series of MFS Variable Insurance Trust II (the trust). The trust is organized as a Massachusetts business trust and is registered under the Investment Company Act of 1940, as amended, as an open-end management investment company. The shareholders of each series of the trust are separate accounts of insurance companies, which offer variable annuity and/or life insurance products, and qualified retirement and pension plans.
The fund is an investment company and accordingly follows the investment company accounting and reporting guidance of the Financial Accounting Standards Board (FASB) Accounting Standards Codification Topic 946 Financial Services – Investment Companies.
| (2) | | Significant Accounting Policies |
General – The preparation of financial statements in conformity with U.S. generally accepted accounting principles requires management to make estimates and assumptions that affect the reported amounts of assets and liabilities, and disclosure of contingent assets and liabilities at the date of the financial statements and the reported amounts of increases and decreases in net assets from operations during the reporting period. Actual results could differ from those estimates. In the preparation of these financial statements, management has evaluated subsequent events occurring after the date of the fund’s Statement of Assets and Liabilities through the date that the financial statements were issued.
Balance Sheet Offsetting – The fund’s accounting policy with respect to balance sheet offsetting is that, absent an event of default by the counterparty or a termination of the agreement, the International Swaps and Derivatives Association (ISDA) Master Agreement, or similar agreement, does not result in an offset of reported amounts of financial assets and financial liabilities in the Statement of Assets and Liabilities across transactions between the fund and the applicable counterparty. The fund’s right to setoff may be restricted or prohibited by the bankruptcy or insolvency laws of the particular jurisdiction to which a specific master netting agreement counterparty is subject. Balance sheet offsetting disclosures, to the extent applicable to the fund, have been included in the fund’s Significant Accounting Policies note under the captions for each of the fund’s in-scope financial instruments and transactions.
Investment Valuations – Equity securities, including restricted equity securities, are generally valued at the last sale or official closing price on their primary market or exchange as provided by a third-party pricing service. Equity securities, for which there were no sales reported that day, are generally valued at the last quoted daily bid quotation on their primary market or exchange as provided by a third-party pricing service. Short-term instruments with a maturity at issuance of 60 days or less may be valued at amortized cost, which approximates market value. Open-end investment companies are generally valued at net asset value per share. Securities and other assets generally valued on the basis of information from a third-party pricing service may also be valued at a broker/dealer bid quotation. In determining values, third-party pricing services can utilize both transaction data and market information such as yield, quality, coupon rate, maturity, type of issue, trading characteristics, and other market data.
The Board of Trustees has delegated primary responsibility for determining or causing to be determined the value of the fund’s investments (including any fair valuation) to the adviser pursuant to valuation policies and procedures approved by the Board. If the adviser determines that reliable market quotations are not readily available, investments are valued at fair value as determined in good faith by the adviser in accordance with such procedures under the oversight of the Board of Trustees. Under the fund’s valuation policies and procedures, market quotations are not considered to be readily available for most types of debt instruments and floating rate loans and many types of derivatives. These investments are generally valued at fair value based on information from third-party pricing services. In addition, investments may be valued at fair value if the adviser determines that an investment’s value has been materially affected by events occurring after the close of the exchange or market on which the investment is principally traded (such as foreign exchange or market) and prior to the determination of the fund’s net asset value, or after the halting of trading of a specific security where trading does not resume prior to the close of the exchange or market on which the security is principally traded. Events that occur on a frequent basis after foreign markets close (such as developments in foreign markets and significant movements in the U.S. markets) and prior to the determination of the fund’s net asset value may be deemed to have a material effect on the value of securities traded in foreign markets. Accordingly, the fund’s foreign equity securities may often be valued at fair value. The adviser generally relies on third-party pricing services or other information (such as the correlation with price movements of similar securities in the same or other markets; the type, cost and investment characteristics of the security; the business and financial condition of the issuer; and trading and other market data) to assist in determining whether to fair value and at what value to fair value an investment. The value of an investment for purposes of calculating the fund’s net asset value can differ depending on the source and method used to determine value. When fair valuation is used, the value of an investment used to determine the fund’s net asset value may differ from quoted or published prices for the same investment. There can be no assurance that the fund could obtain the fair value assigned to an investment if it were to sell the investment at the same time at which the fund determines its net asset value per share.
11
MFS Blended Research Core Equity Portfolio
Notes to Financial Statements (unaudited) – continued
Various inputs are used in determining the value of the fund’s assets or liabilities. These inputs are categorized into three broad levels. In certain cases, the inputs used to measure fair value may fall into different levels of the fair value hierarchy. In such cases, an investment’s level within the fair value hierarchy is based on the lowest level of input that is significant to the fair value measurement. The fund’s assessment of the significance of a particular input to the fair value measurement in its entirety requires judgment, and considers factors specific to the investment. Level 1 includes unadjusted quoted prices in active markets for identical assets or liabilities. Level 2 includes other significant observable market-based inputs (including quoted prices for similar securities, interest rates, prepayment speed, and credit risk). Level 3 includes unobservable inputs, which may include the adviser’s own assumptions in determining the fair value of investments. The following is a summary of the levels used as of June 30, 2018 in valuing the fund’s assets or liabilities:
| | | | | | | | | | | | | | | | |
| Financial Instruments | | Level 1 | | | Level 2 | | | Level 3 | | | Total | |
| Equity Securities | | | $474,897,090 | | | | $— | | | | $— | | | | $474,897,090 | |
| Mutual Funds | | | 4,065,412 | | | | — | | | | — | | | | 4,065,412 | |
| Total | | | $478,962,502 | | | | $— | | | | $— | | | | $478,962,502 | |
For further information regarding security characteristics, see the Portfolio of Investments.
Indemnifications – Under the fund’s organizational documents, its officers and Trustees may be indemnified against certain liabilities and expenses arising out of the performance of their duties to the fund. Additionally, in the normal course of business, the fund enters into agreements with service providers that may contain indemnification clauses. The fund’s maximum exposure under these agreements is unknown as this would involve future claims that may be made against the fund that have not yet occurred.
Investment Transactions and Income – Investment transactions are recorded on the trade date. Interest income is recorded on the accrual basis. Dividends received in cash are recorded on the ex-dividend date. Certain dividends from foreign securities will be recorded when the fund is informed of the dividend if such information is obtained subsequent to the ex-dividend date. Dividend payments received in additional securities are recorded on the ex-dividend date in an amount equal to the value of the security on such date.
The fund may receive proceeds from litigation settlements. Any proceeds received from litigation involving portfolio holdings are reflected in the Statement of Operations in realized gain/loss if the security has been disposed of by the fund or in unrealized gain/loss if the security is still held by the fund. Any other proceeds from litigation not related to portfolio holdings are reflected as other income in the Statement of Operations.
Tax Matters and Distributions – The fund intends to qualify as a regulated investment company, as defined under Subchapter M of the Internal Revenue Code, and to distribute all of its taxable income, including realized capital gains. As a result, no provision for federal income tax is required. The fund’s federal tax returns, when filed, will remain subject to examination by the Internal Revenue Service for a three year period. Management has analyzed the fund’s tax positions taken on federal and state tax returns for all open tax years and does not believe that there are any uncertain tax positions that require recognition of a tax liability. Foreign taxes, if any, have been accrued by the fund in the accompanying financial statements in accordance with the applicable foreign tax law. Foreign income taxes may be withheld by certain countries in which the fund invests. Additionally, capital gains realized by the fund on securities issued in or by certain foreign countries may be subject to capital gains tax imposed by those countries.
Distributions to shareholders are recorded on the ex-dividend date. Income and capital gain distributions are determined in accordance with income tax regulations, which may differ from U.S. generally accepted accounting principles. Certain capital accounts in the financial statements are periodically adjusted for permanent differences in order to reflect their tax character. These adjustments have no impact on net assets or net asset value per share. Temporary differences which arise from recognizing certain items of income, expense, gain or loss in different periods for financial statement and tax purposes will reverse at some time in the future. Distributions in excess of net investment income or net realized gains are temporary overdistributions for financial statement purposes resulting from differences in the recognition or classification of income or distributions for financial statement and tax purposes.
Book/tax differences primarily relate to wash sale loss deferrals.
The tax character of distributions declared to shareholders for the last fiscal year is as follows:
| | | | |
| | | Year ended | |
| | | 12/31/17 | |
| Ordinary income (including any short-term capital gains) | | | $6,939,009 | |
| Long-term capital gains | | | 10,294,078 | |
| Total distributions | | | $17,233,087 | |
12
MFS Blended Research Core Equity Portfolio
Notes to Financial Statements (unaudited) – continued
The federal tax cost and the tax basis components of distributable earnings were as follows:
| | | | |
| As of 6/30/18 | | | | |
| Cost of investments | | | $375,970,728 | |
| Gross appreciation | | | 109,848,106 | |
| Gross depreciation | | | (6,856,332 | ) |
| Net unrealized appreciation (depreciation) | | | $102,991,774 | |
| |
| As of 12/31/17 | | | | |
| Undistributed ordinary income | | | 6,506,052 | |
| Undistributed long-term capital gain | | | 40,677,507 | |
| Net unrealized appreciation (depreciation) | | | 125,948,491 | |
The aggregate cost above includes prior fiscal year end tax adjustments, if applicable.
Multiple Classes of Shares of Beneficial Interest – The fund offers multiple classes of shares, which differ in their respective distribution and/or service fees. The fund’s income, realized and unrealized gain (loss), and common expenses are allocated to shareholders based on the daily net assets of each class. Dividends are declared separately for each class. Differences in per share dividend rates are generally due to differences in separate class expenses. The fund’s distributions declared to shareholders as reported in the Statements of Changes in Net Assets are presented by class as follows:
| | | | | | | | | | | | | | | | |
| | | From net investment
income | | | From net realized
gain | |
| | | Six months ended
6/30/18 | | | Year ended
12/31/17 | | | Six months ended
6/30/18 | | | Year ended
12/31/17 | |
| Initial Class | | | $— | | | | $4,671,636 | | | | $— | | | | $6,553,119 | |
| Service Class | | | — | | | | 2,267,373 | | | | — | | | | 3,740,959 | |
| Total | | | $— | | | | $6,939,009 | | | | $— | | | | $10,294,078 | |
| (3) | | Transactions with Affiliates |
Investment Adviser – The fund has an investment advisory agreement with MFS to provide overall investment management and related administrative services and facilities to the fund. The management fee is computed daily and paid monthly at the following annual rates based on the fund’s average daily net assets:
| | | | |
| Up to $1 billion | | | 0.40% | |
| In excess of $1 billion and up to $2.5 billion | | | 0.375% | |
| In excess of $2.5 billion | | | 0.35% | |
MFS has agreed in writing to reduce its management fee by a specified amount if certain MFS mutual fund assets exceed thresholds agreed to by MFS and the fund’s Board of Trustees. For the six months ended June 30, 2018, this management fee reduction amounted to $22,568, which is included in the reduction of total expenses in the Statement of Operations. The management fee incurred for the six months ended June 30, 2018 was equivalent to an annual effective rate of 0.39% of the fund’s average daily net assets.
Distributor – MFS Fund Distributors, Inc. (MFD), a wholly-owned subsidiary of MFS, is the distributor of shares of the fund. The Trustees have adopted a distribution plan for the Service Class shares pursuant to Rule 12b-1 under the Investment Company Act of 1940.
The fund’s distribution plan provides that the fund will pay MFD distribution and/or service fees equal to 0.25% per annum of its average daily net assets attributable to Service Class shares as partial consideration for services performed and expenses incurred by MFD and financial intermediaries (including participating insurance companies that invest in the fund to fund variable annuity and variable life insurance contracts, sponsors of qualified retirement and pension plans that invest in the fund, and affiliates of these participating insurance companies and plan sponsors) in connection with the sale and distribution of the Service Class shares. MFD may subsequently pay all, or a portion, of the distribution and/or service fees to financial intermediaries.
Shareholder Servicing Agent – MFS Service Center, Inc. (MFSC), a wholly-owned subsidiary of MFS, receives a fee from the fund for its services as shareholder servicing agent. For the six months ended June 30, 2018, the fee was $7,751, which equated to 0.0032% annually of the fund’s average daily net assets. MFSC also receives payment from the fund for out-of-pocket expenses paid by MFSC on behalf of the fund. For the six months ended June 30, 2018, these costs amounted to $145.
Administrator – MFS provides certain financial, legal, shareholder communications, compliance, and other administrative services to the fund. Under an administrative services agreement, the fund reimburses MFS the costs incurred to provide these services. The
13
MFS Blended Research Core Equity Portfolio
Notes to Financial Statements (unaudited) – continued
fund is charged an annual fixed amount of $17,500 plus a fee based on average daily net assets. The administrative services fee incurred for the six months ended June 30, 2018 was equivalent to an annual effective rate of 0.0170% of the fund’s average daily net assets.
Trustees’ and Officers’ Compensation – The fund pays compensation to independent Trustees in the form of a retainer, attendance fees, and additional compensation to Board and Committee chairpersons. The fund does not pay compensation directly to Trustees or officers of the fund who are also officers of the investment adviser, all of whom receive remuneration for their services to the fund from MFS. Certain officers and Trustees of the fund are officers or directors of MFS, MFD, and MFSC.
Other – This fund and certain other funds managed by MFS (the funds) have entered into a service agreement (the ISO Agreement) which provides for payment of fees solely by the funds to Tarantino LLC in return for the provision of services of an Independent Senior Officer (ISO) for the funds. Frank L. Tarantino serves as the ISO and is an officer of the funds and the sole member of Tarantino LLC. The funds can terminate the ISO Agreement with Tarantino LLC at any time under the terms of the ISO Agreement. For the six months ended June 30, 2018, the fee paid by the fund under this agreement was $411 and is included in “Miscellaneous” expense in the Statement of Operations. MFS has agreed to bear all expenses associated with office space, other administrative support, and supplies provided to the ISO.
The fund invests in the MFS Institutional Money Market Portfolio which is managed by MFS and seeks current income consistent with preservation of capital and liquidity. This money market fund does not pay a management fee to MFS.
Effective January 2, 2018, the adviser has voluntarily undertaken to reimburse the fund from its own resources on a quarterly basis for the cost of investment research embedded in the cost of the fund’s securities trades. This agreement may be rescinded at any time. For the period January 2, 2018 to June 30, 2018, this reimbursement amounted to $5,143, which is included in “Other” income in the Statement of Operations.
For the six months ended June 30, 2018, purchases and sales of investments, other than short-term obligations, aggregated $149,026,236 and $174,834,591, respectively.
| (5) | | Shares of Beneficial Interest |
The fund’s Declaration of Trust permits the Trustees to issue an unlimited number of full and fractional shares of beneficial interest. Transactions in fund shares were as follows:
| | | | | | | | | | | | | | | | |
| | | Six months ended 6/30/18 | | | Year ended 12/31/17 | |
| | | Shares | | | Amount | | | Shares | | | Amount | |
| Shares sold | | | | | | | | | | | | | | | | |
Initial Class | | | 40,373 | | | | $2,213,462 | | | | 84,685 | | | | $4,227,596 | |
Service Class | | | 124,691 | | | | 6,702,749 | | | | 167,159 | | | | 8,469,294 | |
| | | 165,064 | | | | $8,916,211 | | | | 251,844 | | | | $12,696,890 | |
| Shares issued to shareholders in reinvestment of distributions | | | | | | | | | | | | | | | | |
Initial Class | | | — | | | | $— | | | | 225,279 | | | | $11,063,474 | |
Service Class | | | — | | | | — | | | | 123,248 | | | | 6,008,332 | |
| | | — | | | | $— | | | | 348,527 | | | | $17,071,806 | |
| Shares reacquired | | | | | | | | | | | | | | | | |
Initial Class | | | (447,619 | ) | | | $(24,562,739 | ) | | | (973,435 | ) | | | $(49,201,989 | ) |
Service Class | | | (224,054 | ) | | | (12,245,523 | ) | | | (571,295 | ) | | | (28,663,828 | ) |
| | | (671,673 | ) | | | $(36,808,262 | ) | | | (1,544,730 | ) | | | $(77,865,817 | ) |
| Net change | | | | | | | | | | | | | | | | |
Initial Class | | | (407,246 | ) | | | $(22,349,277 | ) | | | (663,471 | ) | | | $(33,910,919 | ) |
Service Class | | | (99,363 | ) | | | (5,542,774 | ) | | | (280,888 | ) | | | (14,186,202 | ) |
| | | (506,609 | ) | | | $(27,892,051 | ) | | | (944,359 | ) | | | $(48,097,121 | ) |
The fund and certain other funds managed by MFS participate in a $1.25 billion unsecured committed line of credit, subject to a $1 billion sublimit, provided by a syndication of banks under a credit agreement. Borrowings may be made for temporary financing needs. Interest is charged to each fund, based on its borrowings, generally at a rate equal to the higher of the Overnight Bank Funding rate or daily one month LIBOR plus an agreed upon spread. A commitment fee, based on the average daily, unused portion of the committed line of credit, is allocated among the participating funds. In addition, the fund and other funds managed by MFS have established unsecured uncommitted borrowing arrangements with certain banks for temporary financing needs. Interest is
14
MFS Blended Research Core Equity Portfolio
Notes to Financial Statements (unaudited) – continued
charged to each fund, based on its borrowings, at a rate equal to the Overnight Bank Funding rate plus an agreed upon spread. For the six months ended June 30, 2018, the fund’s commitment fee and interest expense were $1,614 and $0, respectively, and are included in “Miscellaneous” expense in the Statement of Operations.
| (7) | | Investments in Affiliated Issuers |
An affiliated issuer may be considered one in which the fund owns 5% or more of the outstanding voting securities, or a company which is under common control. For the purposes of this report, the fund assumes the following to be affiliated issuers:
| | | | | | | | | | | | | | | | | | |
| Affiliated Issuers | | | | Beginning
Shares/Par
Amount | | | Acquisitions
Shares/Par
Amount | | | Dispositions
Shares/Par
Amount | | | Ending
Shares/Par
Amount | |
| MFS Institutional Money Market Portfolio | | | | | 2,531,684 | | | | 29,709,140 | | | | (28,175,412 | ) | | | 4,065,412 | |
| | | | | |
| Affiliated Issuers | | Realized
Gain (Loss) | | Change in
Unrealized
Appreciation/
Depreciation | | | Capital Gain
Distributions | | | Dividend
Income | | | Ending
Value | |
| MFS Institutional Money Market Portfolio | | $(638) | | | $215 | | | | $— | | | | $24,013 | | | | $4,065,412 | |
15
MFS Blended Research Core Equity Portfolio
PROXY VOTING POLICIES AND INFORMATION
MFS votes proxies on behalf of the fund pursuant to proxy voting policies and procedures that are available without charge, upon request, by calling 1-800-225-2606, by visiting mfs.com/proxyvoting, or by visiting the SEC’s Web site at http://www.sec.gov.
Information regarding how the fund voted proxies relating to portfolio securities during the most recent twelve-month period ended June 30 is available by August 31 of each year without charge by visiting mfs.com/proxyvoting, or by visiting the SEC’s Web site at http://www.sec.gov.
QUARTERLY PORTFOLIO DISCLOSURE
The fund will file a complete schedule of portfolio holdings with the Securities and Exchange Commission (the Commission) for the first and third quarters of each fiscal year on Form N-Q. The fund’s Form N-Q is available on the EDGAR database on the Commission’s Internet Web site at http://www.sec.gov, and may be reviewed and copied at the:
Public Reference Room
Securities and Exchange Commission
100 F Street, NE, Room 1580
Washington, D.C. 20549
Information on the operation of the Public Reference Room may be obtained by calling the Commission at 1-800-SEC-0330. Copies of the fund’s Form N-Q also may be obtained, upon payment of a duplicating fee, by electronic request at the following e-mail address: publicinfo@sec.gov or by writing the Public Reference Section at the above address.
FURTHER INFORMATION
From time to time, MFS may post important information about the fund or the MFS funds on the MFS web site (mfs.com). This information is available at https://www.mfs.com/en-us/what-we-do/announcements.html or at mfs.com/vit2 by choosing the fund’s name.
INFORMATION ABOUT FUND CONTRACTS AND LEGAL CLAIMS
The fund has entered into contractual arrangements with an investment adviser, administrator, distributor, shareholder servicing agent, 529 program manager (if applicable), and custodian who each provide services to the fund. Unless expressly stated otherwise, shareholders are not parties to, or intended beneficiaries of these contractual arrangements, and these contractual arrangements are not intended to create any shareholder right to enforce them against the service providers or to seek any remedy under them against the service providers, either directly or on behalf of the fund.
Under the Trust’s By-Laws and Declaration of Trust, any claims asserted against or on behalf of the MFS Funds, including claims against Trustees and Officers, must be brought in state and federal courts located within the Commonwealth of Massachusetts.
16
Semiannual Report
June 30, 2018

MFS® Corporate Bond Portfolio

MFS® Variable Insurance Trust II
BDS-SEM
MFS® Corporate Bond Portfolio
CONTENTS
The report is prepared for the general information of contract owners. It is authorized for distribution to prospective investors only when preceded or accompanied by a current prospectus.
NOT FDIC INSURED • MAY LOSE VALUE • NO BANK OR CREDIT UNION GUARANTEE • NOT A DEPOSIT • NOT INSURED BY ANY FEDERAL GOVERNMENT AGENCY OR NCUA/NCUSIF
MFS Corporate Bond Portfolio
LETTER FROM THE EXECUTIVE CHAIRMAN

Dear Contract Owners:
Rising bond yields, international trade friction and geopolitical uncertainty have contributed to a measurable uptick in market volatility — a departure from the low-volatility environment that prevailed for much of 2017. In recent months, against this more challenging backdrop, global markets have given back some of the strong gains recorded during 2017 and early 2018. But global economic growth remains healthy, notwithstanding signs of a modest slowdown over the past few months, particularly in Europe and China.
Although the U.S. Federal Reserve continues to gradually raise interest rates and shrink its balance sheet, monetary policy remains accommodative around the world, with many central banks taking only tentative steps toward tighter policies. Newly enacted U.S. tax reforms have been welcomed by equity markets, while emerging market economies have recently had to contend with tighter financial conditions as a result of firmer U.S. Treasury yields and a stronger dollar. Around the world, inflation remains largely subdued, but tight labor markets and solid global demand have investors on the lookout for its potential resurgence. Increased U.S. protectionism is also a growing concern, as investors fear that trade disputes could dampen business sentiment, leading to slower global growth.
As a global investment manager, MFS® strives to create long-term value for clients through an active approach and an investment platform built on nearly a century of expertise. To make that long-term value meaningful for clients, we work to align with you on our beliefs, your needs and the time it takes to deliver on your desired outcomes.
Respectfully,

Robert J. Manning
Executive Chairman
MFS Investment Management
August 16, 2018
The opinions expressed in this letter are subject to change and may not be relied upon for investment advice. No forecasts can be guaranteed.
1
MFS Corporate Bond Portfolio
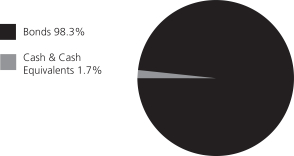
PORTFOLIO COMPOSITION
Portfolio structure (i)
| | | | |
| Fixed income sectors (i) | | | | |
| Investment Grade Corporates | | | 84.5% | |
High Yield Corporates
| | | 10.1% | |
| U.S. Treasury Securities | | | 2.7% | |
| Mortgage-Backed Securities | | | 0.5% | |
| Emerging Markets Bonds | | | 0.3% | |
| Commercial Mortgage-Backed Securities | | | 0.1% | |
| Asset-Backed Securities | | | 0.1% | |
| | | | |
| Composition including fixed income credit quality (a)(i) | |
| AA | | | 1.4% | |
| A | | | 24.6% | |
| BBB | | | 58.6% | |
| BB | | | 9.9% | |
| B | | | 0.5% | |
| CC | | | 0.1% | |
| D (o) | | | 0.0% | |
| U.S. Government | | | 2.7% | |
| Federal Agencies | | | 0.5% | |
| Not Rated (o) | | | 0.0% | |
| Cash & Cash Equivalents | | | 1.7% | |
| |
| Portfolio facts (i) | | | | |
| Average Duration (d) | | | 6.9 | |
| Average Effective Maturity (m) | | | 10.6 yrs. | |
| (a) | | For all securities other than those specifically described below, ratings are assigned to underlying securities utilizing ratings from Moody’s, Fitch, and Standard & Poor’s rating agencies and applying the following hierarchy: If all three agencies provide a rating, the middle rating (after dropping the highest and lowest ratings) is assigned; if two of the three agencies rate a security, the lower of the two is assigned. Ratings are shown in the S&P and Fitch scale (e.g., AAA). Securities rated BBB or higher are considered investment grade. All ratings are subject to change. U.S. Government includes securities issued by the U.S. Department of the Treasury. Federal Agencies includes rated and unrated U.S. Agency fixed-income securities, U.S. Agency mortgage-backed securities, and collateralized mortgage obligations of U.S. Agency mortgage-backed securities. Not Rated includes fixed income securities and fixed income derivatives, which have not been rated by any rating agency. The fund may or may not have held all of these instruments on this date. The fund is not rated by these agencies. |
| (d) | | Duration is a measure of how much a bond’s price is likely to fluctuate with general changes in interest rates, e.g., if rates rise 1.00%, a bond with a 5-year duration is likely to lose about 5.00% of its value due to the interest rate move. |
| (i) | | For purposes of this presentation, the components include the value of securities, and reflect the impact of the equivalent exposure of derivative positions, if any. These amounts may be negative from time to time. Equivalent exposure is a calculated amount that translates the derivative position into a reasonable approximation of the amount of the underlying asset that the portfolio would have to hold at a given point in time to have the same price sensitivity that results from the portfolio’s ownership of the derivative contract. When dealing with derivatives, equivalent exposure is a more representative measure of the potential impact of a position on portfolio performance than value. The bond component will include any accrued interest amounts. |
| (m) | | In determining each instrument’s effective maturity for purposes of calculating the fund’s dollar-weighted average effective maturity, MFS uses the instrument’s stated maturity or, if applicable, an earlier date on which MFS believes it is probable that a maturity-shortening device (such as a put, pre-refunding or prepayment) will cause the instrument to be repaid. Such an earlier date can be substantially shorter than the instrument’s stated maturity. |
Where the fund holds convertible bonds, they are treated as part of the equity portion of the portfolio.
Cash & Cash Equivalents includes any cash, investments in money market funds, short-term securities, and other assets less liabilities. Please see the Statement of Assets and Liabilities for additional information related to the fund’s cash position and other assets and liabilities.
Percentages are based on net assets as of June 30, 2018.
The portfolio is actively managed and current holdings may be different.
2
MFS Corporate Bond Portfolio
EXPENSE TABLE
Fund Expenses Borne by the Contract Holders during the Period,
January 1, 2018 through June 30, 2018
As a contract holder of the fund, you incur ongoing costs, including management fees; distribution and/or service (12b-1) fees; and other fund expenses. This example is intended to help you understand your ongoing costs (in dollars) of investing in the fund and to compare these costs with the ongoing costs of investing in other mutual funds.
The example is based on an investment of $1,000 invested at the beginning of the period and held for the entire period January 1, 2018 through June 30, 2018.
Actual Expenses
The first line for each share class in the following table provides information about actual account values and actual expenses. You may use the information in this line, together with the amount you invested, to estimate the expenses that you paid over the period. Simply divide your account value by $1,000 (for example, an $8,600 account value divided by $1,000 = 8.6), then multiply the result by the number in the first line under the heading entitled “Expenses Paid During Period” to estimate the expenses you paid on your account during this period.
Hypothetical Example for Comparison Purposes
The second line for each share class in the following table provides information about hypothetical account values and hypothetical expenses based on the fund’s actual expense ratio and an assumed rate of return of 5% per year before expenses, which is not the fund’s actual return. The hypothetical account values and expenses may not be used to estimate the actual ending account balance or expenses you paid for the period. You may use this information to compare the ongoing costs of investing in the fund and other funds. To do so, compare this 5% hypothetical example with the 5% hypothetical examples that appear in the shareholder reports of the other funds.
Please note that the expenses shown in the table are meant to highlight the fund’s ongoing costs only and do not take into account the fees and expenses imposed under the variable contracts through which your investment in the fund is made. Therefore, the second line for each share class in the table is useful in comparing ongoing costs associated with an investment in vehicles (such as the fund) which fund benefits under variable annuity and variable life insurance contracts and to qualified pension and retirement plans only, and will not help you determine the relative total costs of investing in the fund through variable annuity and variable life insurance contracts. If the fees and expenses imposed under the variable contracts were included, your costs would have been higher.
| | | | | | | | | | | | | | | | | | |
| Share Class | | | | Annualized
Expense Ratio | | | Beginning
Account Value
1/01/18 | | | Ending Account Value 6/30/18 | | | Expenses Paid
During Period (p)
1/01/18-6/30/18 | |
| Initial Class | | Actual | | | 0.63% | | | | $1,000.00 | | | | $964.78 | | | | $3.07 | |
| | Hypothetical (h) | | | 0.63% | | | | $1,000.00 | | | | $1,021.67 | | | | $3.16 | |
| Service Class | | Actual | | | 0.88% | | | | $1,000.00 | | | | $963.45 | | | | $4.28 | |
| | Hypothetical (h) | | | 0.88% | | | | $1,000.00 | | | | $1,020.43 | | | | $4.41 | |
| (h) | 5% class return per year before expenses. |
| (p) | “Expenses Paid During Period” are equal to each class’s annualized expense ratio, as shown above, multiplied by the average account value over the period, multiplied by 181/365 (to reflect the one-half year period). |
3
MFS Corporate Bond Portfolio
PORTFOLIO OF INVESTMENTS – 6/30/18 (unaudited)
The Portfolio of Investments is a complete list of all securities owned by your fund. It is categorized by broad-based asset classes.
| | | | | | | | |
| Issuer | | Shares/Par | | | Value ($) | |
| BONDS – 97.2% | | | | | | | | |
| Aerospace – 2.4% | | | | | |
Huntington Ingalls Industries, Inc.,
3.483%, 12/01/2027 | | $ | 630,000 | | | $ | 592,074 | |
| L3 Technologies, Inc., 3.85%, 6/15/2023 | | | 1,083,000 | | | | 1,080,748 | |
| Lockheed Martin Corp., 3.55%, 1/15/2026 | | | 964,000 | | | | 947,397 | |
Northrop Grumman Corp.,
2.55%, 10/15/2022 | | | 1,737,000 | | | | 1,673,118 | |
Northrop Grumman Corp.,
2.93%, 1/15/2025 | | | 1,488,000 | | | | 1,412,653 | |
| | | | | | | | |
| | | | | | $ | 5,705,990 | |
| | | | | | | | |
| Apparel Manufacturers – 0.6% | | | | | |
| Coach, Inc., 4.125%, 7/15/2027 | | $ | 1,518,000 | | | $ | 1,447,557 | |
| | | | | | | | |
| Asset-Backed & Securitized – 0.2% | | | | | |
| Bayview Financial Revolving Mortgage | | | | | | | | |
| Loan Trust, FLR, 3.702% (LIBOR-1mo. + 1.6%), 12/28/2040 (z) | | $ | 164,721 | | | $ | 150,452 | |
| Greenwich Capital Commercial | | | | | | | | |
| Funding Corp., 5.95%, 7/10/2038 | | | 115,433 | | | | 115,452 | |
| JPMorgan Chase Commercial | | | | | | | | |
Mortgage Securities Corp.,
5.964%, 7/15/2042 (n)(q) | | | 197,711 | | | | 136,276 | |
| Lehman Brothers Commercial Conduit | | | | | | | | |
| Mortgage Trust, 1.12%, 2/18/2030 (i) | | | 30,568 | | | | 2 | |
| Morgan Stanley Capital I, Inc., 1.303%, 11/15/2030 (i)(n) | | | 228,593 | | | | 11 | |
| | | | | | | | |
| | | | | | $ | 402,193 | |
| | | | | | | | |
| Automotive – 3.6% | | | | | |
Daimler Finance North America LLC,
3.35%, 5/04/2021 (n) | | $ | 1,963,000 | | | $ | 1,955,376 | |
Ford Motor Credit Co. LLC,
3.47%, 4/05/2021 | | | 529,000 | | | | 525,805 | |
| General Motors Co., 5.15%, 4/01/2038 | | | 606,000 | | | | 576,742 | |
| General Motors Co., 6.25%, 10/02/2043 | | | 1,257,000 | | | | 1,302,636 | |
General Motors Financial Co., Inc.,
3.45%, 4/10/2022 | | | 1,222,000 | | | | 1,200,765 | |
General Motors Financial Co., Inc.,
4.35%, 1/17/2027 | | | 472,000 | | | | 456,715 | |
| Lear Corp., 3.8%, 9/15/2027 | | | 1,276,000 | | | | 1,198,077 | |
| ZF North America Capital, Inc., 4.75%, 4/29/2025 (n) | | | 1,426,000 | | | | 1,425,812 | |
| | | | | | | | |
| | | | | | $ | 8,641,928 | |
| | | | | | | | |
| Broadcasting – 1.2% | | | | | |
| Netflix, Inc., 4.875%, 4/15/2028 (n) | | $ | 1,341,000 | | | $ | 1,278,201 | |
| Time Warner, Inc., 3.8%, 2/15/2027 | | | 1,054,000 | | | | 995,371 | |
| Time Warner, Inc., 5.35%, 12/15/2043 | | | 685,000 | | | | 668,879 | |
| | | | | | | | |
| | | | | | $ | 2,942,451 | |
| | | | | | | | |
| Brokerage & Asset Managers – 2.0% | | | | | |
| Charles Schwab Corp., 3.85%, 5/21/2025 | | $ | 1,140,000 | | | $ | 1,152,718 | |
| E*TRADE Financial Corp., 2.95%, 8/24/2022 | | | 858,000 | | | | 831,127 | |
| | | | | | | | |
| Issuer | | Shares/Par | | | Value ($) | |
| BONDS – continued | | | | | | | | |
| Brokerage & Asset Managers – continued | | | | | |
Intercontinental Exchange, Inc.,
2.75%, 12/01/2020 | | $ | 652,000 | | | $ | 645,682 | |
Intercontinental Exchange, Inc.,
3.75%, 12/01/2025 | | | 1,070,000 | | | | 1,061,975 | |
TD Ameritrade Holding Corp.,
3.3%, 4/01/2027 | | | 1,080,000 | | | | 1,030,532 | |
| | | | | | | | |
| | | | | | $ | 4,722,034 | |
| | | | | | | | |
| Building – 2.8% | | | | | |
| CRH America Finance, Inc., 4.5%, 4/04/2048 (n) | �� | $ | 896,000 | | | $ | 840,515 | |
Martin Marietta Materials, Inc.,
4.25%, 7/02/2024 | | | 850,000 | | | | 857,704 | |
Martin Marietta Materials, Inc.,
3.45%, 6/01/2027 | | | 504,000 | | | | 468,874 | |
Martin Marietta Materials, Inc.,
3.5%, 12/15/2027 | | | 747,000 | | | | 693,143 | |
| Masco Corp., 4.45%, 4/01/2025 | | | 560,000 | | | | 561,886 | |
| Masco Corp., 4.375%, 4/01/2026 | | | 476,000 | | | | 474,283 | |
| Owens Corning, 4.2%, 12/15/2022 | | | 460,000 | | | | 461,125 | |
| Owens Corning, 4.4%, 1/30/2048 | | | 729,000 | | | | 608,667 | |
| Standard Industries, Inc., 4.75%, 1/15/2028 (n) | | | 1,801,000 | | | | 1,652,417 | |
| | | | | | | | |
| | | | | | $ | 6,618,614 | |
| | | | | | | | |
| Business Services – 1.9% | | | | | |
| Cisco Systems, Inc., 2.2%, 2/28/2021 | | $ | 1,428,000 | | | $ | 1,401,011 | |
| Equinix, Inc., 5.75%, 1/01/2025 | | | 969,000 | | | | 975,977 | |
| Fidelity National Information Services, Inc., 3.5%, 4/15/2023 | | | 220,000 | | | | 217,438 | |
| Fidelity National Information Services, Inc., 5%, 10/15/2025 | | | 216,000 | | | | 227,106 | |
| MSCI, Inc., 5.75%, 8/15/2025 (n) | | | 1,464,000 | | | | 1,507,920 | |
| Tencent Holdings Ltd., 2.985%, 1/19/2023 (n) | | | 202,000 | | | | 196,402 | |
| | | | | | | | |
| | | | | | $ | 4,525,854 | |
| | | | | | | | |
| Cable TV – 3.5% | | | | | |
| Charter Communications | | | | | | | | |
| Operating LLC, 6.384%, 10/23/2035 | | $ | 886,000 | | | $ | 925,876 | |
| Cox Communications, Inc., 3.5%, 8/15/2027 (n) | | | 803,000 | | | | 746,999 | |
| Cox Communications, Inc., 4.6%, 8/15/2047 (n) | | | 332,000 | | | | 303,393 | |
| NBCUniversal Enterprise, Inc., 1.974%, 4/15/2019 (n) | | | 578,000 | | | | 573,685 | |
| Sirius XM Radio, Inc., 5.375%, 4/15/2025 (n) | | | 170,000 | | | | 167,663 | |
| Sirius XM Radio, Inc., 5.375%, 7/15/2026 (n) | | | 353,000 | | | | 339,763 | |
| Sirius XM Radio, Inc., 5%, 8/01/2027 (n) | | | 1,541,000 | | | | 1,442,761 | |
| Time Warner Cable, Inc., 8.25%, 4/01/2019 | | | 850,000 | | | | 881,652 | |
| Time Warner Cable, Inc., 5%, 2/01/2020 | | | 354,000 | | | | 361,391 | |
4
MFS Corporate Bond Portfolio
Portfolio of Investments (unaudited) – continued
| | | | | | | | |
| Issuer | | Shares/Par | | | Value ($) | |
| BONDS – continued | | | | | | | | |
| Cable TV – continued | | | | | |
| Time Warner Cable, Inc., 4.5%, 9/15/2042 | | $ | 955,000 | | | $ | 784,675 | |
Time Warner Entertainment Co. LP,
8.375%, 7/15/2033 | | | 266,000 | | | | 328,413 | |
| Videotron Ltd., 5%, 7/15/2022 | | | 1,555,000 | | | | 1,576,381 | |
| | | | | | | | |
| | | | | | $ | 8,432,652 | |
| | | | | | | | |
| Chemicals – 1.0% | | | | | |
LyondellBasell Industries N.V.,
5%, 4/15/2019 | | $ | 457,000 | | | $ | 461,518 | |
LyondellBasell Industries N.V.,
6%, 11/15/2021 | | | 1,256,000 | | | | 1,344,187 | |
| Sherwin-Williams Co., 4.5%, 6/01/2047 | | | 500,000 | | | | 477,207 | |
| | | | | | | | |
| | | | | | $ | 2,282,912 | |
| | | | | | | | |
| Computer Software – 0.8% | | | | | |
| Oracle Corp., 3.4%, 7/08/2024 | | $ | 1,107,000 | | | $ | 1,096,751 | |
| VeriSign, Inc., 4.625%, 5/01/2023 | | | 763,000 | | | | 767,769 | |
| | | | | | | | |
| | | | | | $ | 1,864,520 | |
| | | | | | | | |
| Computer Software – Systems – 0.3% | | | | | |
| Apple, Inc., 4.375%, 5/13/2045 | | $ | 383,000 | | | $ | 394,274 | |
| Apple, Inc., 4.25%, 2/09/2047 | | | 319,000 | | | | 323,545 | |
| | | | | | | | |
| | | | | | $ | 717,819 | |
| | | | | | | | |
| Consumer Products – 0.7% | | | | | |
Reckitt Benckiser Treasury Services PLC,
3%, 6/26/2027 (n) | | $ | 1,876,000 | | | $ | 1,744,185 | |
| | | | | | | | |
| Consumer Services – 2.6% | | | | | |
| Priceline Group, Inc., 3.65%, 3/15/2025 | | $ | 769,000 | | | $ | 752,098 | |
| Priceline Group, Inc., 3.6%, 6/01/2026 | | | 1,761,000 | | | | 1,713,642 | |
Service Corp. International,
5.375%, 1/15/2022 | | | 170,000 | | | | 171,700 | |
Service Corp. International,
5.375%, 5/15/2024 | | | 2,004,000 | | | | 2,049,090 | |
| Visa, Inc., 4.15%, 12/14/2035 | | | 1,413,000 | | | | 1,464,121 | |
| | | | | | | | |
| | | | | | $ | 6,150,651 | |
| | | | | | | | |
| Containers – 1.5% | | | | | |
| Ball Corp., 5%, 3/15/2022 | | $ | 682,000 | | | $ | 701,607 | |
| Ball Corp., 4%, 11/15/2023 | | | 691,000 | | | | 671,376 | |
| Ball Corp., 5.25%, 7/01/2025 | | | 1,030,000 | | | | 1,050,600 | |
| Sealed Air Corp., 5.5%, 9/15/2025 (n) | | | 1,150,000 | | | | 1,181,625 | |
| | | | | | | | |
| | | | | | $ | 3,605,208 | |
| | | | | | | | |
| Electrical Equipment – 1.0% | | | | | |
| Arrow Electronics, Inc., 3.5%, 4/01/2022 | | $ | 478,000 | | | $ | 471,403 | |
| Arrow Electronics, Inc., 3.875%, 1/12/2028 | | | 1,979,000 | | | | 1,854,516 | |
| | | | | | | | |
| | | | | | $ | 2,325,919 | |
| | | | | | | | |
| Electronics – 2.1% | | | | | |
| Broadcom Corp./Broadcom Cayman Finance Ltd., 3.875%, 1/15/2027 | | $ | 2,157,000 | | | $ | 2,040,203 | |
Flextronics International Ltd.,
4.625%, 2/15/2020 | | | 2,018,000 | | | | 2,048,700 | |
NXP B.V./NXP Funding LLC,
4.125%, 6/15/2020 (n) | | | 309,000 | | | | 312,090 | |
| | | | | | | | |
| Issuer | | Shares/Par | | | Value ($) | |
| BONDS – continued | | | | | | | | |
| Electronics – continued | | | | | | | | |
Tyco Electronics Group S.A.,
2.375%, 12/17/2018 | | $ | 229,000 | | | $ | 228,628 | |
Tyco Electronics Group S.A.,
3.5%, 2/03/2022 | | | 252,000 | | | | 253,215 | |
| | | | | | | | |
| | | | | | $ | 4,882,836 | |
| | | | | | | | |
| Emerging Market Sovereign – 0.3% | | | | | |
| Republic of South Africa, 5.65%, 9/27/2047 | | $ | 675,000 | | | $ | 607,500 | |
| | | | | | | | |
| Energy – Independent – 0.0% | | | | | |
| Diamondback Energy, Inc., 5.375%, 5/31/2025 (n) | | $ | 100,000 | | | $ | 99,750 | |
| | | | | | | | |
| Energy – Integrated – 0.5% | | | | | |
| Shell International Finance B.V., 3.75%, 9/12/2046 | | $ | 1,300,000 | | | $ | 1,208,420 | |
| | | | | | | | |
| Financial Institutions – 1.3% | | | | | |
| AerCap Ireland Capital Ltd., 4.625%, 10/30/2020 | | $ | 227,000 | | | $ | 231,270 | |
| AerCap Ireland Capital Ltd., 3.65%, 7/21/2027 | | | 1,426,000 | | | | 1,298,247 | |
International Lease Finance Corp.,
7.125%, 9/01/2018 (n) | | | 570,000 | | | | 573,719 | |
International Lease Finance Corp.,
5.875%, 8/15/2022 | | | 1,000,000 | | | | 1,060,505 | |
| | | | | | | | |
| | | | | | $ | 3,163,741 | |
| | | | | | | | |
| Food & Beverages – 5.1% | | | | | |
| Anheuser-Busch InBev Worldwide, Inc., 3.75%, 1/15/2022 | | $ | 3,348,000 | | | $ | 3,393,473 | |
| Anheuser-Busch InBev Worldwide, Inc., 4.7%, 2/01/2036 | | | 1,977,000 | | | | 2,003,782 | |
| Anheuser-Busch InBev Worldwide, Inc., 4.375%, 4/15/2038 | | | 527,000 | | | | 511,614 | |
| Aramark Services, Inc., 5%, 2/01/2028 (n) | | | 200,000 | | | | 191,000 | |
| Constellation Brands, Inc., 3.2%, 2/15/2023 | | | 878,000 | | | | 854,318 | |
| Constellation Brands, Inc., 4.25%, 5/01/2023 | | | 1,605,000 | | | | 1,636,327 | |
| Kraft Heinz Foods Co., 5%, 7/15/2035 | | | 290,000 | | | | 285,681 | |
| Kraft Heinz Foods Co., 6.5%, 2/09/2040 | | | 1,459,000 | | | | 1,645,037 | |
| Tyson Foods, Inc., 4.5%, 6/15/2022 | | | 598,000 | | | | 614,127 | |
| Tyson Foods, Inc., 5.15%, 8/15/2044 | | | 368,000 | | | | 380,395 | |
| Wm. Wrigley Jr. Co., 2.9%, 10/21/2019 (n) | | | 505,000 | | | | 503,719 | |
| | | | | | | | |
| | | | | | $ | 12,019,473 | |
| | | | | | | | |
| Forest & Paper Products – 0.8% | | | | | |
| Georgia-Pacific LLC, 5.4%, 11/01/2020 (n) | | $ | 806,000 | | | $ | 844,325 | |
| International Paper Co., 6%, 11/15/2041 | | | 860,000 | | | | 949,540 | |
| | | | | | | | |
| | | | | | $ | 1,793,865 | |
| | | | | | | | |
| Gaming & Lodging – 1.5% | | | | | |
| GLP Capital LP/GLP Financing II, Inc., 5.75%, 6/01/2028 | | $ | 1,365,000 | | | $ | 1,375,238 | |
| Hilton Domestic Operating Co., Inc., 5.125%, 5/01/2026 (n) | | | 474,000 | | | | 465,705 | |
| Marriott International, Inc., 4%, 4/15/2028 | | | 1,749,000 | | | | 1,707,870 | |
| | | | | | | | |
| | | | | | $ | 3,548,813 | |
| | | | | | | | |
5
MFS Corporate Bond Portfolio
Portfolio of Investments (unaudited) – continued
| | | | | | | | |
| Issuer | | Shares/Par | | | Value ($) | |
| BONDS – continued | | | | | | | | |
| Insurance – 1.0% | | | | | |
American International Group, Inc.,
4.7%, 7/10/2035 | | $ | 1,010,000 | | | $ | 982,548 | |
American International Group, Inc.,
4.5%, 7/16/2044 | | | 917,000 | | | | 853,940 | |
| Unum Group, 4%, 3/15/2024 | | | 637,000 | | | | 632,062 | |
| | | | | | | | |
| | | | | | $ | 2,468,550 | |
| | | | | | | | |
| Insurance – Health – 1.8% | | | | | |
| Aetna, Inc., 2.8%, 6/15/2023 | | $ | 508,000 | | | $ | 484,037 | |
| Centene Corp., 5.375%, 6/01/2026 (n) | | | 766,000 | | | | 776,058 | |
| UnitedHealth Group, Inc., 2.7%, 7/15/2020 | | | 1,350,000 | | | | 1,341,938 | |
| UnitedHealth Group, Inc., 4.625%, 7/15/2035 | | | 1,690,000 | | | | 1,777,424 | |
| | | | | | | | |
| | | | | | $ | 4,379,457 | |
| | | | | | | | |
| Insurance – Property & Casualty – 3.0% | | | | | |
| Berkshire Hathaway, Inc., 2.75%, 3/15/2023 | | $ | 828,000 | | | $ | 810,291 | |
| Chubb INA Holdings, Inc., 2.3%, 11/03/2020 | | | 343,000 | | | | 336,896 | |
| CNA Financial Corp., 5.875%, 8/15/2020 | | | 1,570,000 | | | | 1,648,409 | |
Liberty Mutual Group, Inc.,
4.85%, 8/01/2044 (n) | | | 951,000 | | | | 950,987 | |
Marsh & McLennan Cos., Inc.,
2.55%, 10/15/2018 | | | 678,000 | | | | 677,702 | |
Marsh & McLennan Cos., Inc.,
4.8%, 7/15/2021 | | | 900,000 | | | | 935,792 | |
Marsh & McLennan Cos., Inc.,
3.5%, 6/03/2024 | | | 779,000 | | | | 771,082 | |
Marsh & McLennan Cos., Inc.,
4.35%, 1/30/2047 | | | 471,000 | | | | 468,513 | |
| Swiss Re Ltd., 4.25%, 12/06/2042 (n) | | | 468,000 | | | | 468,881 | |
| | | | | | | | |
| | | | | | $ | 7,068,553 | |
| | | | | | | | |
| Machinery & Tools – 0.4% | | | | | |
CNH Industrial Capital LLC,
3.85%, 11/15/2027 | | $ | 905,000 | | | $ | 843,976 | |
| | | | | | | | |
| Major Banks – 13.8% | | | | | |
| Bank of America Corp., 3.124% to 1/20/2022, FLR to 1/20/2023 | | $ | 1,232,000 | | | $ | 1,211,652 | |
| Bank of America Corp., 3.004%, 12/20/2023 | | | 739,000 | | | | 716,488 | |
| Bank of America Corp., 4.125%, 1/22/2024 | | | 1,917,000 | | | | 1,948,554 | |
| Bank of America Corp., 4.2%, 8/26/2024 | | | 1,434,000 | | | | 1,441,484 | |
| Bank of America Corp., 3.419% to 12/20/2027, FLR to 12/20/2028 | | | 834,000 | | | | 785,356 | |
| Bank of America Corp., 6.1% to 3/17/2025, FLR to 12/29/2049 | | | 1,420,000 | | | | 1,475,948 | |
| Bank of America Corp., 5.875% to 3/15/2028, FLR to 12/31/2059 | | | 936,000 | | | | 914,940 | |
Barclays PLC, 4.338% to 5/16/2023,
FLR to 5/16/2024 | | | 700,000 | | | | 691,346 | |
Credit Suisse Group AG,
3.869%, 1/12/2029 (n) | | | 674,000 | | | | 633,781 | |
| Goldman Sachs Group, Inc., 3.85%, 1/26/2027 | | | 608,000 | | | | 583,879 | |
| HSBC Holdings PLC, 4.375%, 11/23/2026 | | | 941,000 | | | | 924,998 | |
HSBC Holdings PLC, 6% to 5/22/2027,
FLR to 11/22/2065 | | | 611,000 | | | | 566,702 | |
| | | | | | | | |
| Issuer | | Shares/Par | | | Value ($) | |
| BONDS – continued | | | | | | | | |
| Major Banks – continued | | | | | |
| JPMorgan Chase & Co., 4.25%, 10/15/2020 | | $ | 442,000 | | | $ | 451,856 | |
| JPMorgan Chase & Co., 4.5%, 1/24/2022 | | | 790,000 | | | | 817,186 | |
| JPMorgan Chase & Co., 3.25%, 9/23/2022 | | | 2,397,000 | | | | 2,374,780 | |
| JPMorgan Chase & Co., 3.125%, 1/23/2025 | | | 688,000 | | | | 657,941 | |
| JPMorgan Chase & Co., 3.964% to 11/15/2047, FLR to 11/15/2048 | | | 1,500,000 | | | | 1,348,708 | |
| JPMorgan Chase & Co., 3.897% to 1/23/2048, FLR to 1/23/2049 | | | 1,111,000 | | | | 997,528 | |
| JPMorgan Chase & Co., 6.75% to 2/01/2024, FLR to 1/29/2049 | | | 1,221,000 | | | | 1,327,837 | |
| Morgan Stanley, 5.5%, 7/28/2021 | | | 1,245,000 | | | | 1,317,439 | |
| Morgan Stanley, 3.125%, 7/27/2026 | | | 2,972,000 | | | | 2,764,629 | |
| Morgan Stanley, 3.971% to 7/22/2037, FLR to 7/22/2038 | | | 665,000 | | | | 616,174 | |
| PNC Bank N.A., 2.6%, 7/21/2020 | | | 1,585,000 | | | | 1,565,857 | |
| Royal Bank of Scotland Group, PLC, FLR, 4.892% (LIBOR-3mo. + 1.754%), 5/18/2029 | | | 1,175,000 | | | | 1,169,770 | |
| Sumitomo Mitsui Financial Group, Inc., 3.102%, 1/17/2023 | | | 1,861,000 | | | | 1,818,365 | |
| UBS Group Funding (Switzerland) AG, 4.253%, 3/23/2028 (n) | | | 1,688,000 | | | | 1,677,157 | |
| Wachovia Corp., 6.605%, 10/01/2025 | | | 1,270,000 | | | | 1,431,374 | |
| Wells Fargo & Co., 4.1%, 6/03/2026 | | | 476,000 | | | | 466,433 | |
| | | | | | | | |
| | | | | | $ | 32,698,162 | |
| | | | | | | | |
| Medical & Health Technology & Services – 4.7% | | | | | |
Becton, Dickinson and Co.,
3.734%, 12/15/2024 | | $ | 161,000 | | | $ | 157,176 | |
Becton, Dickinson and Co.,
4.685%, 12/15/2044 | | | 1,083,000 | | | | 1,049,728 | |
Becton, Dickinson and Co.,
4.669%, 6/06/2047 | | | 1,655,000 | | | | 1,599,427 | |
| CVS Health Corp., 5.05%, 3/25/2048 | | | 492,000 | | | | 500,706 | |
| HCA, Inc., 4.75%, 5/01/2023 | | | 910,000 | | | | 907,725 | |
| HCA, Inc., 5.25%, 6/15/2026 | | | 963,000 | | | | 956,452 | |
| Laboratory Corp. of America Holdings, 3.25%, 9/01/2024 | | | 917,000 | | | | 886,554 | |
| Laboratory Corp. of America Holdings, 4.7%, 2/01/2045 | | | 900,000 | | | | 880,538 | |
| Life Technologies Corp., 6%, 3/01/2020 | | | 2,172,000 | | | | 2,263,975 | |
Thermo Fisher Scientific, Inc.,
2.95%, 9/19/2026 | | | 555,000 | | | | 512,720 | |
Thermo Fisher Scientific, Inc.,
4.1%, 8/15/2047 | | | 1,544,000 | | | | 1,461,079 | |
| | | | | | | | |
| | | | | | $ | 11,176,080 | |
| | | | | | | | |
| Medical Equipment – 2.7% | | | | | | | | |
| Abbott Laboratories, 2.9%, 11/30/2021 | | $ | 2,291,000 | | | $ | 2,254,972 | |
| Abbott Laboratories, 4.75%, 11/30/2036 | | | 1,636,000 | | | | 1,723,029 | |
| Medtronic, Inc., 3.5%, 3/15/2025 | | | 1,061,000 | | | | 1,049,876 | |
| Medtronic, Inc., 4.375%, 3/15/2035 | | | 381,000 | | | | 394,030 | |
| Teleflex, Inc., 4.625%, 11/15/2027 | | | 125,000 | | | | 118,125 | |
| Zimmer Biomet Holdings, Inc., FLR, 3.076% (LIBOR-3mo. + 0.75%), 3/19/2021 | | | 774,000 | | | | 775,305 | |
| | | | | | | | |
| | | | | | $ | 6,315,337 | |
| | | | | | | | |
6
MFS Corporate Bond Portfolio
Portfolio of Investments (unaudited) – continued
| | | | | | | | |
| Issuer | | Shares/Par | | | Value ($) | |
| BONDS – continued | | | | | | | | |
| Metals & Mining – 1.6% | | | | | | | | |
| Barrick Gold Corp., 3.85%, 4/01/2022 | | $ | 297,000 | | | $ | 301,348 | |
Barrick North America Finance LLC,
4.4%, 5/30/2021 | | | 93,000 | | | | 96,209 | |
Glencore Funding LLC,
4.125%, 5/30/2023 (n) | | | 863,000 | | | | 861,110 | |
| Glencore Funding LLC, 4%, 4/16/2025 (n) | | | 536,000 | | | | 515,766 | |
| Glencore Funding LLC, 4%, 3/27/2027 (n) | | | 1,389,000 | | | | 1,311,112 | |
Glencore Funding LLC,
3.875%, 10/27/2027 (n) | | | 559,000 | | | | 516,555 | |
| Kinross Gold Corp., 5.95%, 3/15/2024 | | | 195,000 | | | | 199,875 | |
| | | | | | | | |
| | | | | | $ | 3,801,975 | |
| | | | | | | | |
| Midstream – 3.4% | | | | | | | | |
| APT Pipelines Ltd., 5%, 3/23/2035 (n) | | $ | 1,375,000 | | | $ | 1,424,727 | |
Dominion Gas Holdings LLC,
2.8%, 11/15/2020 | | | 975,000 | | | | 963,325 | |
| Enbridge, Inc., 5.5%, 12/01/2046 | | | 271,000 | | | | 289,300 | |
Kinder Morgan Energy Partners LP,
6.85%, 2/15/2020 | | | 370,000 | | | | 389,599 | |
Kinder Morgan Energy Partners LP,
7.4%, 3/15/2031 | | | 581,000 | | | | 678,075 | |
| MPLX LP, 4.5%, 4/15/2038 | | | 744,000 | | | | 687,194 | |
Sabine Pass Liquefaction LLC,
5.625%, 4/15/2023 | | | 1,467,000 | | | | 1,556,447 | |
Sabine Pass Liquefaction LLC,
5.625%, 3/01/2025 | | | 133,000 | | | | 141,468 | |
Sabine Pass Liquefaction LLC, 5.875%, 6/30/2026 | | | 289,000 | | | | 309,951 | |
Sabine Pass Liquefaction LLC,
5%, 3/15/2027 | | | 542,000 | | | | 550,773 | |
Sabine Pass Liquefaction LLC,
4.2%, 3/15/2028 | | | 1,021,000 | | | | 988,439 | |
| | | | | | | | |
| | | | | | $ | 7,979,298 | |
| | | | | | | | |
| Mortgage-Backed – 0.5% | | | | | | | | |
| Freddie Mac, 3.136%, 10/25/2024 | | $ | 807,000 | | | $ | 804,414 | |
| Freddie Mac, 3.244%, 8/25/2027 | | | 69,000 | | | | 68,072 | |
| Freddie Mac, 3.286%, 11/25/2027 | | | 397,000 | | | | 391,832 | |
| | | | | | | | |
| | | | | | $ | 1,264,318 | |
| | | | | | | | |
| Natural Gas – Distribution – 1.9% | | | | | | | | |
| NiSource Finance Corp., 3.85%, 2/15/2023 | | $ | 1,106,000 | | | $ | 1,113,301 | |
| NiSource Finance Corp., 4.8%, 2/15/2044 | | | 761,000 | | | | 790,113 | |
| Sempra Energy, 3.25%, 6/15/2027 | | | 2,779,000 | | | | 2,589,317 | |
| | | | | | | | |
| | | | | | $ | 4,492,731 | |
| | | | | | | | |
| Network & Telecom – 1.0% | | | | | | | | |
| AT&T, Inc., 2.45%, 6/30/2020 | | $ | 619,000 | | | $ | 609,638 | |
| AT&T, Inc., 4.75%, 5/15/2046 | | | 1,136,000 | | | | 1,014,763 | |
| AT&T, Inc., 5.15%, 11/15/2046 (n) | | | 445,000 | | | | 419,229 | |
| AT&T, Inc., 5.65%, 2/15/2047 | | | 452,000 | | | | 455,163 | |
| | | | | | | | |
| | | | | | $ | 2,498,793 | |
| | | | | | | | |
| Oils – 2.7% | | | | | | | | |
| Andeavor, 4.5%, 4/01/2048 | | $ | 1,142,000 | | | $ | 1,040,741 | |
Marathon Petroleum Corp.,
3.4%, 12/15/2020 | | | 1,105,000 | | | | 1,107,214 | |
| | | | | | | | |
| Issuer | | Shares/Par | | | Value ($) | |
| BONDS – continued | | | | | |
| Oils – continued | | | | | |
| Marathon Petroleum Corp., 4.75%, 9/15/2044 | | $ | 910,000 | | | $ | 865,788 | |
| Valero Energy Corp., 3.4%, 9/15/2026 | | | 1,601,000 | | | | 1,515,880 | |
| Valero Energy Corp., 4.9%, 3/15/2045 | | | 1,783,000 | | | | 1,804,026 | |
| | | | | | | | |
| | | | | | $ | 6,333,649 | |
| | | | | | | | |
| Other Banks & Diversified Financials – 3.3% | | | | | |
| BPCE S.A., 4.5%, 3/15/2025 (n) | | $ | 760,000 | | | $ | 740,915 | |
Capital One Financial Corp.,
3.75%, 4/24/2024 | | | 796,000 | | | | 780,748 | |
| Citigroup, Inc., 4.4%, 6/10/2025 | | | 646,000 | | | | 642,471 | |
| Citigroup, Inc., 3.2%, 10/21/2026 | | | 1,714,000 | | | | 1,593,899 | |
Citigroup, Inc., 3.52% to 10/27/2027,
FLR to 10/27/2028 | | | 2,233,000 | | | | 2,097,992 | |
| Discover Bank, 7%, 4/15/2020 | | | 1,097,000 | | | | 1,158,469 | |
| ING Groep N.V., 3.95%, 3/29/2027 | | | 313,000 | | | | 305,480 | |
| Macquarie Bank Ltd., 6.125% to 3/08/2027, FLR to 12/31/2165 (n) | | | 444,000 | | | | 398,490 | |
| SunTrust Banks, Inc., 3.3%, 5/15/2026 | | | 200,000 | | | | 188,809 | |
| | | | | | | | |
| | | | | | $ | 7,907,273 | |
| | | | | | | | |
| Pharmaceuticals – 0.3% | | | | | | | | |
| Bayer U.S. Finance LLC, 3.875%, 12/15/2023 (z) | | $ | 701,000 | | | $ | 701,029 | |
| | | | | | | | |
| Pollution Control – 1.0% | | | | | |
| Republic Services, Inc., 5.25%, 11/15/2021 | | $ | 1,160,000 | | | $ | 1,223,608 | |
| Republic Services, Inc., 3.95%, 5/15/2028 | | | 1,100,000 | | | | 1,085,117 | |
| | | | | | | | |
| | | | | | $ | 2,308,725 | |
| | | | | | | | |
| Precious Metals & Minerals – 0.4% | | | | | |
| Teck Resources Ltd., 6%, 8/15/2040 | | $ | 222,000 | | | $ | 215,895 | |
| Teck Resources Ltd., 6.25%, 7/15/2041 | | | 667,000 | | | | 663,665 | |
| | | | | | | | |
| | | | | | $ | 879,560 | |
| | | | | | | | |
| Railroad & Shipping – 0.4% | | | | | |
Canadian Pacific Railway Co.,
7.25%, 5/15/2019 | | $ | 424,000 | | | $ | 439,532 | |
Canadian Pacific Railway Co.,
4.5%, 1/15/2022 | | | 400,000 | | | | 413,370 | |
| | | | | | | | |
| | | | | | $ | 852,902 | |
| | | | | | | | |
| Retailers – 1.3% | | | | | |
| Best Buy Co., Inc., 5%, 8/01/2018 | | $ | 935,000 | | | $ | 936,494 | |
| Best Buy Co., Inc., 5.5%, 3/15/2021 | | | 31,000 | | | | 32,497 | |
| Dollar Tree, Inc., 4%, 5/15/2025 | | | 874,000 | | | | 854,163 | |
| Home Depot, Inc., 4.875%, 2/15/2044 | | | 1,260,000 | | | | 1,381,179 | |
| | | | | | | | |
| | | | | | $ | 3,204,333 | |
| | | | | | | | |
| Specialty Chemicals – 0.3% | | | | | |
| Ecolab, Inc., 4.35%, 12/08/2021 | | $ | 656,000 | | | $ | 677,093 | |
| | | | | | | | |
| Telecommunications – Wireless – 4.0% | | | | | |
American Tower Corp., REIT,
3.5%, 1/31/2023 | | $ | 371,000 | | | $ | 364,948 | |
| American Tower Corp., REIT, 3%, 6/15/2023 | | | 1,049,000 | | | | 1,005,865 | |
| American Tower Corp., REIT, 4%, 6/01/2025 | | | 1,000,000 | | | | 980,494 | |
7
MFS Corporate Bond Portfolio
Portfolio of Investments (unaudited) – continued
| | | | | | | | |
| Issuer | | Shares/Par | | | Value ($) | |
| BONDS – continued | | | | | |
| Telecommunications – Wireless – continued | |
American Tower Corp., REIT,
3.6%, 1/15/2028 | | $ | 1,133,000 | | | $ | 1,049,800 | |
Crown Castle International Corp.,
5.25%, 1/15/2023 | | | 470,000 | | | | 492,484 | |
Crown Castle International Corp.,
3.15%, 7/15/2023 | | | 878,000 | | | | 840,489 | |
Crown Castle International Corp.,
4.45%, 2/15/2026 | | | 338,000 | | | | 334,583 | |
Crown Castle International Corp.,
3.7%, 6/15/2026 | | | 533,000 | | | | 502,576 | |
| Crown Castle Towers LLC, 4.883%, 8/15/2020 (n) | | | 612,000 | | | | 627,656 | |
| SBA Tower Trust, 2.898%, 10/15/2019 (n) | | | 1,081,000 | | | | 1,074,149 | |
| T-Mobile USA, Inc., 6%, 4/15/2024 | | | 1,640,000 | | | | 1,697,400 | |
| Vodafone Group PLC, 4.125%, 5/30/2025 | | | 590,000 | | | | 587,756 | |
| | | | | | | | |
| | | | | | $ | 9,558,200 | |
| | | | | | | | |
| Tobacco – 1.1% | | | | | |
| B.A.T. Capital Corp., 3.557%, 8/15/2027 (n) | | $ | 1,407,000 | | | $ | 1,309,075 | |
| Reynolds American, Inc., 8.125%, 6/23/2019 | | | 733,000 | | | | 768,331 | |
| Reynolds American, Inc., 3.25%, 6/12/2020 | | | 165,000 | | | | 164,831 | |
| Reynolds American, Inc., 4.45%, 6/12/2025 | | | 418,000 | | | | 420,676 | |
| | | | | | | | |
| | | | | | $ | 2,662,913 | |
| | | | | | | | |
| Transportation – Services – 0.4% | | | | | |
| ERAC USA Finance LLC, 3.85%, 11/15/2024 (n) | | $ | 272,000 | | | $ | 270,613 | |
| ERAC USA Finance LLC, 7%, 10/15/2037 (n) | | | 421,000 | | | | 526,124 | |
| ERAC USA Finance LLC, 4.5%, 2/15/2045 (n) | | | 201,000 | | | | 189,476 | |
| | | | | | | | |
| | | | | | $ | 986,213 | |
| | | | | | | | |
| U.S. Treasury Obligations – 2.7% | | | | | |
| U.S. Treasury Bonds, 3.5%, 2/15/2039 | | $ | 5,791,000 | | | $ | 6,309,023 | |
| | | | | | | | |
| | | | | | | | |
| Issuer | | Shares/Par | | | Value ($) | |
| BONDS – continued | | | | | |
| Utilities – Electric Power – 5.8% | | | | | |
Berkshire Hathaway Energy,
4.5%, 2/01/2045 | | $ | 597,000 | | | $ | 610,774 | |
| CMS Energy Corp., 6.25%, 2/01/2020 | | | 1,010,000 | | | | 1,055,843 | |
| Duke Energy Corp., 3.75%, 9/01/2046 | | | 1,059,000 | | | | 932,776 | |
| EDP Finance B.V., 5.25%, 1/14/2021 (n) | | | 728,000 | | | | 750,227 | |
| Emera U.S. Finance LP, 2.7%, 6/15/2021 | | | 330,000 | | | | 321,193 | |
| Emera U.S. Finance LP, 3.55%, 6/15/2026 | | | 378,000 | | | | 355,910 | |
| Enel Finance International N.V., 2.75%, 4/06/2023 (n) | | | 1,974,000 | | | | 1,836,997 | |
| Enel Finance International N.V., 4.75%, 5/25/2047 (n) | | | 1,665,000 | | | | 1,574,337 | |
| Eversource Energy, 2.9%, 10/01/2024 | | | 991,000 | | | | 940,637 | |
| Exelon Corp., 3.497%, 6/01/2022 | | | 1,163,000 | | | | 1,149,545 | |
| FirstEnergy Corp., 3.9%, 7/15/2027 | | | 707,000 | | | | 685,867 | |
| PPL Capital Funding, Inc., 5%, 3/15/2044 | | | 590,000 | | | | 613,466 | |
| PPL WEM Holdings PLC, 5.375%, 5/01/2021 (n) | | | 1,057,000 | | | | 1,099,515 | |
| Public Service Enterprise Group, 2%, 11/15/2021 | | | 1,555,000 | | | | 1,478,847 | |
| Southern Co., 2.95%, 7/01/2023 | | | 440,000 | | | | 424,428 | |
| | | | | | | | |
| | | | | | $ | 13,830,362 | |
| | | | | | | | |
Total Bonds
(Identified Cost, $234,730,653) | | | | | | $ | 230,653,390 | |
| | | | | | | | |
| INVESTMENT COMPANIES (h) – 1.7% | |
| Money Market Funds – 1.7% | | | | | | | | |
| MFS Institutional Money Market Portfolio, 1.9% (v) (Identified Cost, $3,948,927) | | | 3,949,576 | | | $ | 3,949,576 | |
| | | | | | | | |
OTHER ASSETS, LESS
LIABILITIES – 1.1% | | | | | | | 2,698,167 | |
| | | | | | | | |
| NET ASSETS – 100.0% | | | | | | $ | 237,301,133 | |
| | | | | | | | |
| (h) | | An affiliated issuer, which may be considered one in which the fund owns 5% or more of the outstanding voting securities, or a company which is under common control. At period end, the aggregate values of the fund’s investments in affiliated issuers and in unaffiliated issuers were $3,949,576 and $230,653,390, respectively. |
| (i) | | Interest only security for which the fund receives interest on notional principal (Par amount). Par amount shown is the notional principal and does not reflect the cost of the security. |
| (n) | | Securities exempt from registration under Rule 144A of the Securities Act of 1933. These securities may be sold in the ordinary course of business in transactions exempt from registration, normally to qualified institutional buyers. At period end, the aggregate value of these securities was $38,436,249, representing 16.2% of net assets. |
| (q) | | Interest received was less than stated coupon rate. |
| (v) | | Affiliated issuer that is available only to investment companies managed by MFS. The rate quoted for the MFS Institutional Money Market Portfolio is the annualized seven-day yield of the fund at period end. |
| (z) | | Restricted securities are not registered under the Securities Act of 1933 and are subject to legal restrictions on resale. These securities generally may be resold in transactions exempt from registration or to the public if the securities are subsequently registered. Disposal of these securities may involve time-consuming negotiations and prompt sale at an acceptable price may be difficult. The fund holds the following restricted securities: |
| | | | | | | | | | |
| Restricted Securities | | Acquisition
Date | | Cost | | | Value | |
| Bayer U.S. Finance LLC, 3.875%, 12/15/2023 | | 6/18/18 | | | $698,721 | | | | $701,029 | |
| Bayview Financial Revolving Mortgage Loan Trust, FLR, 3.702% (LIBOR-1mo. + 1.6%), 12/28/2040 | | 3/01/06 | | | 164,721 | | | | 150,452 | |
| Total Restricted Securities | | | | | | | | | $851,481 | |
| % of Net assets | | | | | | | | | 0.4% | |
8
MFS Corporate Bond Portfolio
Portfolio of Investments (unaudited) – continued
The following abbreviations are used in this report and are defined:
| FLR | | Floating Rate. Interest rate resets periodically based on the parenthetically disclosed reference rate plus a spread (if any). The period-end rate reported may not be the current rate. |
| PLC | | Public Limited Company |
| REIT | | Real Estate Investment Trust |
See Notes to Financial Statements
9
MFS Corporate Bond Portfolio
FINANCIAL STATEMENTS | STATEMENT OF ASSETS AND LIABILITIES (unaudited)
This statement represents your fund’s balance sheet, which details the assets and liabilities comprising the total value of the fund.
| | | | |
At 6/30/18 | | | | |
Assets | | | | |
Investments in unaffiliated issuers, at value (identified cost, $234,730,653) | | | $230,653,390 | |
Investments in affiliated issuers, at value (identified cost, $3,948,927) | | | 3,949,576 | |
Receivables for | | | | |
Investments sold | | | 634,965 | |
Fund shares sold | | | 1,043 | |
Interest | | | 2,736,574 | |
Other assets | | | 1,025 | |
Total assets | | | $237,976,573 | |
Liabilities | | | | |
Payables for | | | | |
Investments purchased | | | $293,966 | |
Fund shares reacquired | | | 308,493 | |
Payable to affiliates | | | | |
Investment adviser | | | 3,122 | |
Shareholder servicing costs | | | 47 | |
Distribution and/or service fees | | | 3,627 | |
Payable for independent Trustees’ compensation | | | 100 | |
Accrued expenses and other liabilities | | | 66,085 | |
Total liabilities | | | $675,440 | |
Net assets | | | $237,301,133 | |
Net assets consist of | | | | |
Paid-in capital | | | $228,649,432 | |
Unrealized appreciation (depreciation) | | | (4,076,614 | ) |
Accumulated net realized gain (loss) | | | 130,853 | |
Undistributed net investment income | | | 12,597,462 | |
Net assets | | | $237,301,133 | |
Shares of beneficial interest outstanding | | | 21,362,483 | |
| | | | | | | | | | | | |
| | | Net assets | | | Shares
outstanding | | | Net asset value
per share | |
Initial Class | | | $60,918,870 | | | | 5,426,344 | | | | $11.23 | |
Service Class | | | 176,382,263 | | | | 15,936,139 | | | | 11.07 | |
See Notes to Financial Statements
10
MFS Corporate Bond Portfolio
FINANCIAL STATEMENTS | STATEMENT OF OPERATIONS (unaudited)
This statement describes how much your fund earned in investment income and accrued in expenses. It also describes any gains and/or losses
generated by fund operations.
| | | | |
Six months ended 6/30/18 | | | | |
Net investment income (loss) | | | | |
Income | | | | |
Interest | | | $4,884,038 | |
Dividends from affiliated issuers | | | 66,712 | |
Other | | | 7,432 | |
Total investment income | | | $4,958,182 | |
Expenses | | | | |
Management fee | | | $735,902 | |
Distribution and/or service fees | | | 229,162 | |
Shareholder servicing costs | | | 3,953 | |
Administrative services fee | | | 23,356 | |
Independent Trustees’ compensation | | | 4,170 | |
Custodian fee | | | 7,987 | |
Shareholder communications | | | 9,247 | |
Audit and tax fees | | | 36,714 | |
Legal fees | | | 1,507 | |
Miscellaneous | | | 10,077 | |
Total expenses | | | $1,062,075 | |
Reduction of expenses by investment adviser | | | (59,448 | ) |
Net expenses | | | $1,002,627 | |
Net investment income (loss) | | | $3,955,555 | |
Realized and unrealized gain (loss) | | | | |
Realized gain (loss) (identified cost basis) | | | | |
Unaffiliated issuers | | | $143,924 | |
Affiliated issuers | | | (570 | ) |
Net realized gain (loss) | | | $143,354 | |
Change in unrealized appreciation or depreciation | | | | |
Unaffiliated issuers | | | $(13,449,746 | ) |
Affiliated issuers | | | 649 | |
Net unrealized gain (loss) | | | $(13,449,097 | ) |
Net realized and unrealized gain (loss) | | | $(13,305,743 | ) |
Change in net assets from operations | | | $(9,350,188 | ) |
See Notes to Financial Statements
11
MFS Corporate Bond Portfolio
FINANCIAL STATEMENTS | STATEMENTS OF CHANGES IN NET ASSETS
These statements describe the increases and/or decreases in net assets resulting from operations, any distributions, and any shareholder transactions.
| | | | | | | | |
| | | Six months ended
6/30/18 | | | Year ended
12/31/17 | |
| | | (unaudited) | | | | |
Change in net assets | | | | | | | | |
From operations | | | | | | | | |
Net investment income (loss) | | | $3,955,555 | | | | $8,250,457 | |
Net realized gain (loss) | | | 143,354 | | | | 2,604,444 | |
Net unrealized gain (loss) | | | (13,449,097 | ) | | | 4,667,028 | |
Change in net assets from operations | | | $(9,350,188 | ) | | | $15,521,929 | |
Distributions declared to shareholders | | | | | | | | |
From net investment income | | | $— | | | | $(9,218,117 | ) |
Change in net assets from fund share transactions | | | $(13,130,288 | ) | | | $(1,820,793 | ) |
Total change in net assets | | | $(22,480,476 | ) | | | $4,483,019 | |
Net assets | | | | | | | | |
At beginning of period | | | 259,781,609 | | | | 255,298,590 | |
At end of period (including undistributed net investment income of $12,597,462 and
$8,641,907, respectively) | | | $237,301,133 | | | | $259,781,609 | |
See Notes to Financial Statements
12
MFS Corporate Bond Portfolio
FINANCIAL STATEMENTS | FINANCIAL HIGHLIGHTS
The financial highlights table is intended to help you understand the fund’s financial performance for the semiannual period and the past 5 fiscal years. Certain information reflects financial results for a single fund share. The total returns in the table represent the rate that an investor would have earned (or lost) on an investment in the fund share class (assuming reinvestment of all distributions) held for the entire period.
| | | | | | | | | | | | | | | | | | | | | | | | |
| Initial Class | | Six months ended 6/30/18 | | | Year ended | |
| | | | 12/31/17 | | | 12/31/16 | | | 12/31/15 | | | 12/31/14 | | | 12/31/13 | |
| | | (unaudited) | | | | | | | | | | | | | | | | |
Net asset value, beginning of period | | | $11.64 | | | | $11.36 | | | | $11.16 | | | | $11.76 | | | | $11.58 | | | | $12.36 | |
| Income (loss) from investment operations | | | | | | | | | | | | | | | | | | | | | | | | |
Net investment income (loss) (d) | | | $0.19 | | | | $0.39 | | | | $0.41 | (c) | | | $0.42 | | | | $0.43 | | | | $0.43 | |
Net realized and unrealized gain (loss) | | | (0.60 | ) | | | 0.33 | | | | 0.31 | | | | (0.46 | ) | | | 0.24 | | | | (0.48 | ) |
Total from investment operations | | | $(0.41 | ) | | | $0.72 | | | | $0.72 | | | | $(0.04 | ) | | | $0.67 | | | | $(0.05 | ) |
| Less distributions declared to shareholders | | | | | | | | | | | | | | | | | | | | | | | | |
From net investment income | | | $— | | | | $(0.44 | ) | | | $(0.50 | ) | | | $(0.48 | ) | | | $(0.46 | ) | | | $(0.52 | ) |
From net realized gain | | | — | | | | — | | | | (0.02 | ) | | | (0.08 | ) | | | (0.03 | ) | | | (0.21 | ) |
Total distributions declared to shareholders | | | $— | | | | $(0.44 | ) | | | $(0.52 | ) | | | $(0.56 | ) | | | $(0.49 | ) | | | $(0.73 | ) |
Net asset value, end of period (x) | | | $11.23 | | | | $11.64 | | | | $11.36 | | | | $11.16 | | | | $11.76 | | | | $11.58 | |
Total return (%) (k)(r)(s)(x) | | | (3.52 | )(n) | | | 6.39 | | | | 6.28 | (c) | | | (0.31 | ) | | | 5.78 | | | | (0.27 | ) |
Ratios (%) (to average net assets)
and Supplemental data: | | | | | | | | | | | | | | | | | | | | | | | | |
Expenses before expense reductions (f) | | | 0.68 | (a) | | | 0.68 | | | | 0.65 | (c) | | | 0.68 | | | | 0.67 | | | | 0.67 | |
Expenses after expense reductions (f) | | | 0.63 | (a) | | | 0.63 | | | | 0.60 | (c) | | | 0.63 | | | | 0.65 | | | | 0.67 | |
Net investment income (loss) | | | 3.41 | (a) | | | 3.37 | | | | 3.52 | (c) | | | 3.64 | | | | 3.59 | | | | 3.54 | |
Portfolio turnover | | | 17 | (n) | | | 36 | | | | 31 | | | | 26 | | | | 36 | | | | 38 | |
Net assets at end of period (000 omitted) | | | $60,919 | | | | $65,445 | | | | $66,858 | | | | $70,980 | | | | $79,042 | | | | $81,921 | |
| | |
| Service Class | | Six months ended 6/30/18 | | | Year ended | |
| | | | 12/31/17 | | | 12/31/16 | | | 12/31/15 | | | 12/31/14 | | | 12/31/13 | |
| | | (unaudited) | | | | | | | | | | | | | | | | |
Net asset value, beginning of period | | | $11.49 | | | | $11.22 | | | | $11.03 | | | | $11.63 | | | | $11.45 | | | | $12.23 | |
| Income (loss) from investment operations | | | | | | | | | | | | | | | | | | | | | | | | |
Net investment income (loss) (d) | | | $0.18 | | | | $0.36 | | | | $0.37 | (c) | | | $0.39 | | | | $0.39 | | | | $0.39 | |
Net realized and unrealized gain (loss) | | | (0.60 | ) | | | 0.32 | | | | 0.30 | | | | (0.46 | ) | | | 0.25 | | | | (0.47 | ) |
Total from investment operations | | | $(0.42 | ) | | | $0.68 | | | | $0.67 | | | | $(0.07 | ) | | | $0.64 | | | | $(0.08 | ) |
| Less distributions declared to shareholders | | | | | | | | | | | | | | | | | | | | | | | | |
From net investment income | | | $— | | | | $(0.41 | ) | | | $(0.46 | ) | | | $(0.45 | ) | | | $(0.43 | ) | | | $(0.49 | ) |
From net realized gain | | | — | | | | — | | | | (0.02 | ) | | | (0.08 | ) | | | (0.03 | ) | | | (0.21 | ) |
Total distributions declared to shareholders | | | $— | | | | $(0.41 | ) | | | $(0.48 | ) | | | $(0.53 | ) | | | $(0.46 | ) | | | $(0.70 | ) |
Net asset value, end of period (x) | | | $11.07 | | | | $11.49 | | | | $11.22 | | | | $11.03 | | | | $11.63 | | | | $11.45 | |
Total return (%) (k)(r)(s)(x) | | | (3.66 | )(n) | | | 6.11 | | | | 5.98 | (c) | | | (0.58 | ) | | | 5.59 | | | | (0.51 | ) |
Ratios (%) (to average net assets)
and Supplemental data: | | | | | | | | | | | | | | | | | | | | | | | | |
Expenses before expense reductions (f) | | | 0.93 | (a) | | | 0.93 | | | | 0.90 | (c) | | | 0.93 | | | | 0.92 | | | | 0.92 | |
Expenses after expense reductions (f) | | | 0.88 | (a) | | | 0.88 | | | | 0.85 | (c) | | | 0.88 | | | | 0.90 | | | | 0.92 | |
Net investment income (loss) | | | 3.16 | (a) | | | 3.12 | | | | 3.27 | (c) | | | 3.39 | | | | 3.34 | | | | 3.29 | |
Portfolio turnover | | | 17 | (n) | | | 36 | | | | 31 | | | | 26 | | | | 36 | | | | 38 | |
Net assets at end of period (000 omitted) | | | $176,382 | | | | $194,337 | | | | $188,440 | | | | $189,946 | | | | $211,332 | | | | $211,303 | |
See Notes to Financial Statements
13
MFS Corporate Bond Portfolio
Financial Highlights – continued
| (c) | Amount reflects a one-time reimbursement of expenses by the custodian (or former custodian) without which net investment income and performance would be lower and expenses would be higher. |
| (d) | Per share data is based on average shares outstanding. |
| (f) | Ratios do not reflect reductions from fees paid indirectly, if applicable. |
| (k) | The total return does not reflect expenses that apply to separate accounts. Inclusion of these charges would reduce the total return figures for all periods shown. |
| (r) | Certain expenses have been reduced without which performance would have been lower. |
| (s) | From time to time the fund may receive proceeds from litigation settlements, without which performance would be lower. |
| (x) | The net asset values and total returns have been calculated on net assets which include adjustments made in accordance with U.S. generally accepted accounting principles required at period end for financial reporting purposes. |
See Notes to Financial Statements
14
MFS Corporate Bond Portfolio
NOTES TO FINANCIAL STATEMENTS (unaudited)
| (1) | | Business and Organization |
MFS Corporate Bond Portfolio (the fund) is a diversified series of MFS Variable Insurance Trust II (the trust). The trust is organized as a Massachusetts business trust and is registered under the Investment Company Act of 1940, as amended, as an open-end management investment company. The shareholders of each series of the trust are separate accounts of insurance companies, which offer variable annuity and/or life insurance products, and qualified retirement and pension plans.
The fund is an investment company and accordingly follows the investment company accounting and reporting guidance of the Financial Accounting Standards Board (FASB) Accounting Standards Codification Topic 946 Financial Services – Investment Companies.
(2) Significant Accounting Policies
General – The preparation of financial statements in conformity with U.S. generally accepted accounting principles requires management to make estimates and assumptions that affect the reported amounts of assets and liabilities, and disclosure of contingent assets and liabilities at the date of the financial statements and the reported amounts of increases and decreases in net assets from operations during the reporting period. Actual results could differ from those estimates. In the preparation of these financial statements, management has evaluated subsequent events occurring after the date of the fund’s Statement of Assets and Liabilities through the date that the financial statements were issued. The fund invests in foreign securities. Investments in foreign securities are vulnerable to the effects of changes in the relative values of the local currency and the U.S. dollar and to the effects of changes in each country’s market, economic, industrial, political, regulatory, geopolitical, and other conditions.
In March 2017, the FASB issued Accounting Standards Update 2017-08, Receivables – Nonrefundable Fees and Other Costs (Subtopic 310-20) – Premium Amortization on Purchased Callable Debt Securities (“ASU 2017-08”). For entities that hold callable debt securities at a premium, ASU 2017-08 requires that the premium be amortized to the earliest call date. ASU 2017-08 will be effective for fiscal years beginning after December 15, 2018, and interim periods within those fiscal years. Management has evaluated the potential impacts of ASU 2017-08 and believes that adoption of ASU 2017-08 will not have a material effect on the fund’s overall financial position or its overall results of operations.
Balance Sheet Offsetting – The fund’s accounting policy with respect to balance sheet offsetting is that, absent an event of default by the counterparty or a termination of the agreement, the International Swaps and Derivatives Association (ISDA) Master Agreement, or similar agreement, does not result in an offset of reported amounts of financial assets and financial liabilities in the Statement of Assets and Liabilities across transactions between the fund and the applicable counterparty. The fund’s right to setoff may be restricted or prohibited by the bankruptcy or insolvency laws of the particular jurisdiction to which a specific master netting agreement counterparty is subject. Balance sheet offsetting disclosures, to the extent applicable to the fund, have been included in the fund’s Significant Accounting Policies note under the captions for each of the fund’s in-scope financial instruments and transactions.
Investment Valuations – Debt instruments and floating rate loans, including restricted debt instruments, are generally valued at an evaluated or composite bid as provided by a third-party pricing service. Short-term instruments with a maturity at issuance of 60 days or less may be valued at amortized cost, which approximates market value. Open-end investment companies are generally valued at net asset value per share. Securities and other assets generally valued on the basis of information from a third-party pricing service may also be valued at a broker/dealer bid quotation. In determining values, third-party pricing services can utilize both transaction data and market information such as yield, quality, coupon rate, maturity, type of issue, trading characteristics, and other market data. The values of foreign securities and other assets and liabilities expressed in foreign currencies are converted to U.S. dollars using the mean of bid and asked prices for rates provided by a third-party pricing service.
The Board of Trustees has delegated primary responsibility for determining or causing to be determined the value of the fund’s investments (including any fair valuation) to the adviser pursuant to valuation policies and procedures approved by the Board. If the adviser determines that reliable market quotations are not readily available, investments are valued at fair value as determined in good faith by the adviser in accordance with such procedures under the oversight of the Board of Trustees. Under the fund’s valuation policies and procedures, market quotations are not considered to be readily available for most types of debt instruments and floating rate loans and many types of derivatives. These investments are generally valued at fair value based on information from third-party pricing services. In addition, investments may be valued at fair value if the adviser determines that an investment’s value has been materially affected by events occurring after the close of the exchange or market on which the investment is principally traded (such as foreign exchange or market) and prior to the determination of the fund’s net asset value, or after the halting of trading of a specific security where trading does not resume prior to the close of the exchange or market on which the security is principally traded. The adviser generally relies on third-party pricing services or other information (such as the correlation with price movements of similar securities in the same or other markets; the type, cost and investment characteristics of the security; the business and financial condition of the issuer; and trading and other market data) to assist in determining whether to fair value and at what value to fair value an investment. The value of an investment for purposes of calculating the fund’s net asset value can differ
15
MFS Corporate Bond Portfolio
Notes to Financial Statements (unaudited) – continued
depending on the source and method used to determine value. When fair valuation is used, the value of an investment used to determine the fund’s net asset value may differ from quoted or published prices for the same investment. There can be no assurance that the fund could obtain the fair value assigned to an investment if it were to sell the investment at the same time at which the fund determines its net asset value per share.
Various inputs are used in determining the value of the fund’s assets or liabilities. These inputs are categorized into three broad levels. In certain cases, the inputs used to measure fair value may fall into different levels of the fair value hierarchy. In such cases, an investment’s level within the fair value hierarchy is based on the lowest level of input that is significant to the fair value measurement. The fund’s assessment of the significance of a particular input to the fair value measurement in its entirety requires judgment, and considers factors specific to the investment. Level 1 includes unadjusted quoted prices in active markets for identical assets or liabilities. Level 2 includes other significant observable market-based inputs (including quoted prices for similar securities, interest rates, prepayment speed, and credit risk). Level 3 includes unobservable inputs, which may include the adviser’s own assumptions in determining the fair value of investments. The following is a summary of the levels used as of June 30, 2018 in valuing the fund’s assets or liabilities:
| | | | | | | | | | | | | | | | |
| Financial Instruments | | Level 1 | | | Level 2 | | | Level 3 | | | Total | |
| U.S. Treasury Bonds & U.S. Government | | | | | | | | | | | | | | | | |
| Agency & Equivalents | | | $— | | | | $6,309,023 | | | | $— | | | | $6,309,023 | |
| Non-U.S. Sovereign Debt | | | — | | | | 607,500 | | | | — | | | | 607,500 | |
| U.S. Corporate Bonds | | | — | | | | 186,825,687 | | | | — | | | | 186,825,687 | |
| Residential Mortgage-Backed Securities | | | — | | | | 1,264,318 | | | | — | | | | 1,264,318 | |
| Commercial Mortgage-Backed Securities | | | — | | | | 251,741 | | | | — | | | | 251,741 | |
| Asset-Backed Securities (including CDOs) | | | — | | | | 150,452 | | | | — | | | | 150,452 | |
| Foreign Bonds | | | — | | | | 35,244,669 | | | | — | | | | 35,244,669 | |
| Mutual Funds | | | 3,949,576 | | | | — | | | | — | | | | 3,949,576 | |
| Total | | | $3,949,576 | | | | $230,653,390 | | | | $— | | | | $234,602,966 | |
For further information regarding security characteristics, see the Portfolio of Investments.
Indemnifications – Under the fund’s organizational documents, its officers and Trustees may be indemnified against certain liabilities and expenses arising out of the performance of their duties to the fund. Additionally, in the normal course of business, the fund enters into agreements with service providers that may contain indemnification clauses. The fund’s maximum exposure under these agreements is unknown as this would involve future claims that may be made against the fund that have not yet occurred.
Investment Transactions and Income – Investment transactions are recorded on the trade date. Interest income is recorded on the accrual basis. All premium and discount is amortized or accreted for financial statement purposes in accordance with U.S. generally accepted accounting principles. Interest payments received in additional securities are recorded on the ex-interest date in an amount equal to the value of the security on such date.
The fund may receive proceeds from litigation settlements. Any proceeds received from litigation involving portfolio holdings are reflected in the Statement of Operations in realized gain/loss if the security has been disposed of by the fund or in unrealized gain/loss if the security is still held by the fund. Any other proceeds from litigation not related to portfolio holdings are reflected as other income in the Statement of Operations.
Tax Matters and Distributions – The fund intends to qualify as a regulated investment company, as defined under Subchapter M of the Internal Revenue Code, and to distribute all of its taxable income, including realized capital gains. As a result, no provision for federal income tax is required. The fund’s federal tax returns, when filed, will remain subject to examination by the Internal Revenue Service for a three year period. Management has analyzed the fund’s tax positions taken on federal and state tax returns for all open tax years and does not believe that there are any uncertain tax positions that require recognition of a tax liability. Foreign taxes, if any, have been accrued by the fund in the accompanying financial statements in accordance with the applicable foreign tax law. Foreign income taxes may be withheld by certain countries in which the fund invests. Additionally, capital gains realized by the fund on securities issued in or by certain foreign countries may be subject to capital gains tax imposed by those countries.
Distributions to shareholders are recorded on the ex-dividend date. Income and capital gain distributions are determined in accordance with income tax regulations, which may differ from U.S. generally accepted accounting principles. Certain capital accounts in the financial statements are periodically adjusted for permanent differences in order to reflect their tax character. These adjustments have no impact on net assets or net asset value per share. Temporary differences which arise from recognizing certain items of income, expense, gain or loss in different periods for financial statement and tax purposes will reverse at some time in the future. Distributions in excess of net investment income or net realized gains are temporary overdistributions for financial statement purposes resulting from differences in the recognition or classification of income or distributions for financial statement and tax purposes.
Book/tax differences primarily relate to amortization and accretion of debt securities.
16
MFS Corporate Bond Portfolio
Notes to Financial Statements (unaudited) – continued
The tax character of distributions declared to shareholders for the last fiscal year is as follows:
| | | | |
| | | Year ended
12/31/17 | |
| Ordinary income (including any short-term capital gains) | | | $9,218,117 | |
The federal tax cost and the tax basis components of distributable earnings were as follows:
| | | | |
| As of 6/30/18 | | | | |
| Cost of investments | | | $239,789,556 | |
| Gross appreciation | | | 1,923,438 | |
| Gross depreciation | | | (7,110,028 | ) |
| Net unrealized appreciation (depreciation) | | | $(5,186,590 | ) |
| |
| As of 12/31/17 | | | | |
| Undistributed ordinary income | | | 9,316,056 | |
| Undistributed long-term capital gain | | | 319,216 | |
| Net unrealized appreciation (depreciation) | | | 8,366,617 | |
The aggregate cost above includes prior fiscal year end tax adjustments, if applicable.
Multiple Classes of Shares of Beneficial Interest – The fund offers multiple classes of shares, which differ in their respective distribution and/or service fees. The fund’s income, realized and unrealized gain (loss), and common expenses are allocated to shareholders based on the daily net assets of each class. Dividends are declared separately for each class. Differences in per share dividend rates are generally due to differences in separate class expenses. The fund’s distributions declared to shareholders as reported in the Statements of Changes in Net Assets are presented by class as follows:
| | | | | | | | |
| | | From net investment
income | |
| | | Six months ended
6/30/18 | | | Year ended
12/31/17 | |
| Initial Class | | | $— | | | | $2,456,713 | |
| Service Class | | | — | | | | 6,761,404 | |
| Total | | | $— | | | | $9,218,117 | |
| (3) | | Transactions with Affiliates |
Investment Adviser – The fund has an investment advisory agreement with MFS to provide overall investment management and related administrative services and facilities to the fund. The management fee is computed daily and paid monthly at the following annual rates based on the fund’s average daily net assets:
| | | | |
| Up to $1 billion | | | 0.60% | |
| In excess of $1 billion | | | 0.50% | |
MFS has agreed in writing to reduce its management fee by a specified amount if certain MFS mutual fund assets exceed thresholds agreed to by MFS and the fund’s Board of Trustees. For the six months ended June 30, 2018, this management fee reduction amounted to $11,313, which is included in the reduction of total expenses in the Statement of Operations. The management fee incurred for the six months ended June 30, 2018 was equivalent to an annual effective rate of 0.59% of the fund’s average daily net assets.
The investment adviser has agreed in writing to pay a portion of the fund’s total annual operating expenses, excluding interest, taxes, extraordinary expenses, brokerage and transaction costs, and investment-related expenses, such that total annual operating expenses do not exceed 0.63% of average daily net assets for the Initial Class shares and 0.88% of average daily net assets for the Service Class shares. This written agreement will continue until modified by the fund’s Board of Trustees, but such agreement will continue at least until April 30, 2020. For the six months ended June 30, 2018, this reduction amounted to $48,135, which is included in the reduction of total expenses in the Statement of Operations.
Distributor – MFS Fund Distributors, Inc. (MFD), a wholly-owned subsidiary of MFS, is the distributor of shares of the fund. The Trustees have adopted a distribution plan for the Service Class shares pursuant to Rule 12b-1 under the Investment Company Act of 1940.
The fund’s distribution plan provides that the fund will pay MFD distribution and/or service fees equal to 0.25% per annum of its average daily net assets attributable to Service Class shares as partial consideration for services performed and expenses incurred by MFD and financial intermediaries (including participating insurance companies that invest in the fund to fund variable annuity and variable life insurance contracts, sponsors of qualified retirement and pension plans that invest in the fund, and affiliates of these participating insurance companies and plan sponsors) in connection with the sale and distribution of the Service Class shares. MFD may subsequently pay all, or a portion, of the distribution and/or service fees to financial intermediaries.
17
MFS Corporate Bond Portfolio
Notes to Financial Statements (unaudited) – continued
Shareholder Servicing Agent – MFS Service Center, Inc. (MFSC), a wholly-owned subsidiary of MFS, receives a fee from the fund for its services as shareholder servicing agent. For the six months ended June 30, 2018, the fee was $3,883, which equated to 0.0032% annually of the fund’s average daily net assets. MFSC also receives payment from the fund for out-of-pocket expenses paid by MFSC on behalf of the fund. For the six months ended June 30, 2018, these costs amounted to $70.
Administrator – MFS provides certain financial, legal, shareholder communications, compliance, and other administrative services to the fund. Under an administrative services agreement, the fund reimburses MFS the costs incurred to provide these services. The fund is charged an annual fixed amount of $17,500 plus a fee based on average daily net assets. The administrative services fee incurred for the six months ended June 30, 2018 was equivalent to an annual effective rate of 0.0190% of the fund’s average daily net assets.
Trustees’ and Officers’ Compensation – The fund pays compensation to independent Trustees in the form of a retainer, attendance fees, and additional compensation to Board and Committee chairpersons. The fund does not pay compensation directly to Trustees or officers of the fund who are also officers of the investment adviser, all of whom receive remuneration for their services to the fund from MFS. Certain officers and Trustees of the fund are officers or directors of MFS, MFD, and MFSC.
Other – This fund and certain other funds managed by MFS (the funds) have entered into a service agreement (the ISO Agreement) which provides for payment of fees solely by the funds to Tarantino LLC in return for the provision of services of an Independent Senior Officer (ISO) for the funds. Frank L. Tarantino serves as the ISO and is an officer of the funds and the sole member of Tarantino LLC. The funds can terminate the ISO Agreement with Tarantino LLC at any time under the terms of the ISO Agreement. For the six months ended June 30, 2018, the fee paid by the fund under this agreement was $215 and is included in “Miscellaneous” expense in the Statement of Operations. MFS has agreed to bear all expenses associated with office space, other administrative support, and supplies provided to the ISO.
The fund invests in the MFS Institutional Money Market Portfolio which is managed by MFS and seeks current income consistent with preservation of capital and liquidity. This money market fund does not pay a management fee to MFS.
For the six months ended June 30, 2018, purchases and sales of investments, other than short-term obligations, were as follows:
| | | | | | | | |
| | | Purchases | | | Sales | |
| U.S. Government securities | | | $2,703,428 | | | | $786,209 | |
| Non-U.S. Government securities | | | $38,171,287 | | | | $41,986,474 | |
| (5) | | Shares of Beneficial Interest |
The fund’s Declaration of Trust permits the Trustees to issue an unlimited number of full and fractional shares of beneficial interest. Transactions in fund shares were as follows:
| | | | | | | | | | | | | | | | |
| | | Six months ended 6/30/18 | | | Year ended 12/31/17 | |
| | | Shares | | | Amount | | | Shares | | | Amount | |
| Shares sold | | | | | | | | | | | | | | | | |
Initial Class | | | 98,249 | | | | $1,113,751 | | | | 282,268 | | | | $3,276,802 | |
Service Class | | | 702,267 | | | | 7,832,676 | | | | 1,975,574 | | | | 22,523,964 | |
| | | 800,516 | | | | $8,946,427 | | | | 2,257,842 | | | | $25,800,766 | |
| Shares issued to shareholders in reinvestment of distributions | | | | | | | | | | | | | | | | |
Initial Class | | | — | | | | $— | | | | 213,071 | | | | $2,456,713 | |
Service Class | | | — | | | | — | | | | 593,626 | | | | 6,761,404 | |
| | | — | | | | $— | | | | 806,697 | | | | $9,218,117 | |
| Shares reacquired | | | | | | | | | | | | | | | | |
Initial Class | | | (294,426 | ) | | | $(3,340,563 | ) | | | (756,051 | ) | | | $(8,767,249 | ) |
Service Class | | | (1,680,181 | ) | | | (18,736,152 | ) | | | (2,445,256 | ) | | | (28,072,427 | ) |
| | | (1,974,607 | ) | | | $(22,076,715 | ) | | | (3,201,307 | ) | | | $(36,839,676 | ) |
| Net change | | | | | | | | | | | | | | | | |
Initial Class | | | (196,177 | ) | | | $(2,226,812 | ) | | | (260,712 | ) | | | $(3,033,734 | ) |
Service Class | | | (977,914 | ) | | | (10,903,476 | ) | | | 123,944 | | | | 1,212,941 | |
| | | (1,174,091 | ) | | | $(13,130,288 | ) | | | (136,768 | ) | | | $(1,820,793 | ) |
The fund and certain other funds managed by MFS participate in a $1.25 billion unsecured committed line of credit, subject to a $1 billion sublimit, provided by a syndication of banks under a credit agreement. Borrowings may be made for temporary financing needs. Interest is charged to each fund, based on its borrowings, generally at a rate equal to the higher of the Overnight Bank
18
MFS Corporate Bond Portfolio
Notes to Financial Statements (unaudited) – continued
Funding rate or daily one month LIBOR plus an agreed upon spread. A commitment fee, based on the average daily, unused portion of the committed line of credit, is allocated among the participating funds. In addition, the fund and other funds managed by MFS have established unsecured uncommitted borrowing arrangements with certain banks for temporary financing needs. Interest is charged to each fund, based on its borrowings, at a rate equal to the Overnight Bank Funding rate plus an agreed upon spread. For the six months ended June 30, 2018, the fund’s commitment fee and interest expense were $861 and $0, respectively, and are included in “Miscellaneous” expense in the Statement of Operations.
| (7) | | Investments in Affiliated Issuers |
An affiliated issuer may be considered one in which the fund owns 5% or more of the outstanding voting securities, or a company which is under common control. For the purposes of this report, the fund assumes the following to be affiliated issuers:
| | | | | | | | | | | | | | | | | | |
| Affiliated Issuers | | | | Beginning
Shares/Par
Amount | | | Acquisitions
Shares/Par
Amount | | | Dispositions
Shares/Par
Amount | | | Ending
Shares/Par
Amount | |
| MFS Institutional Money Market Portfolio | | | | | 11,301,365 | | | | 34,158,530 | | | | (41,510,319 | ) | | | 3,949,576 | |
| | | | | |
| Affiliated Issuers | | Realized
Gain (Loss) | | Change in
Unrealized
Appreciation/
Depreciation | | | Capital Gain
Distributions | | | Dividend
Income | | | Ending
Value | |
| MFS Institutional Money Market Portfolio | | $(570) | | | $649 | | | | $— | | | | $66,712 | | | | $3,949,576 | |
19
MFS Corporate Bond Portfolio
PROXY VOTING POLICIES AND INFORMATION
MFS votes proxies on behalf of the fund pursuant to proxy voting policies and procedures that are available without charge, upon request, by calling 1-800-225-2606, by visiting mfs.com/proxyvoting, or by visiting the SEC’s Web site at http://www.sec.gov.
Information regarding how the fund voted proxies relating to portfolio securities during the most recent twelve-month period ended June 30 is available by August 31 of each year without charge by visiting mfs.com/proxyvoting, or by visiting the SEC’s Web site at http://www.sec.gov.
QUARTERLY PORTFOLIO DISCLOSURE
The fund will file a complete schedule of portfolio holdings with the Securities and Exchange Commission (the Commission) for the first and third quarters of each fiscal year on Form N-Q. The fund’s Form N-Q is available on the EDGAR database on the Commission’s Internet Web site at http://www.sec.gov, and may be reviewed and copied at the:
Public Reference Room
Securities and Exchange Commission
100 F Street, NE, Room 1580
Washington, D.C. 20549
Information on the operation of the Public Reference Room may be obtained by calling the Commission at 1-800-SEC-0330. Copies of the fund’s Form N-Q also may be obtained, upon payment of a duplicating fee, by electronic request at the following e-mail address: publicinfo@sec.gov or by writing the Public Reference Section at the above address.
FURTHER INFORMATION
From time to time, MFS may post important information about the fund or the MFS funds on the MFS web site (mfs.com). This information is available at https://www.mfs.com/en-us/what-we-do/announcements.html or at mfs.com/vit2 by choosing the fund’s name.
INFORMATION ABOUT FUND CONTRACTS AND LEGAL CLAIMS
The fund has entered into contractual arrangements with an investment adviser, administrator, distributor, shareholder servicing agent, 529 program manager (if applicable), and custodian who each provide services to the fund. Unless expressly stated otherwise, shareholders are not parties to, or intended beneficiaries of these contractual arrangements, and these contractual arrangements are not intended to create any shareholder right to enforce them against the service providers or to seek any remedy under them against the service providers, either directly or on behalf of the fund.
Under the Trust’s By-Laws and Declaration of Trust, any claims asserted against or on behalf of the MFS Funds, including claims against Trustees and Officers, must be brought in state and federal courts located within the Commonwealth of Massachusetts.
20
Semiannual Report
June 30, 2018

MFS® Core Equity Portfolio

MFS® Variable Insurance Trust II
RGS-SEM
MFS® Core Equity Portfolio
CONTENTS
The report is prepared for the general information of contract owners. It is authorized for distribution to prospective investors only when preceded or accompanied by a current prospectus.
NOT FDIC INSURED • MAY LOSE VALUE • NO BANK OR CREDIT UNION GUARANTEE • NOT A DEPOSIT • NOT INSURED BY ANY FEDERAL GOVERNMENT AGENCY OR NCUA/NCUSIF
MFS Core Equity Portfolio
LETTER FROM THE EXECUTIVE CHAIRMAN

Dear Contract Owners:
Rising bond yields, international trade friction and geopolitical uncertainty have contributed to a measurable uptick in market volatility — a departure from the low-volatility environment that prevailed for much of 2017. In recent months, against this more challenging backdrop, global markets have given back some of the strong gains recorded during 2017 and early 2018. But global economic growth remains healthy, notwithstanding signs of a modest slowdown over the past few months, particularly in Europe and China.
Although the U.S. Federal Reserve continues to gradually raise interest rates and shrink its balance sheet, monetary policy remains accommodative around the world, with many central banks taking only tentative steps toward tighter policies. Newly enacted U.S. tax reforms have been welcomed by equity markets, while emerging market economies have recently had to contend with tighter financial conditions as a result of firmer U.S. Treasury yields and a stronger dollar. Around the world, inflation remains largely subdued, but tight labor markets and solid global demand have investors on the lookout for its potential resurgence. Increased U.S. protectionism is also a growing concern, as investors fear that trade disputes could dampen business sentiment, leading to slower global growth.
As a global investment manager, MFS® strives to create long-term value for clients through an active approach and an investment platform built on nearly a century of expertise. To make that long-term value meaningful for clients, we work to align with you on our beliefs, your needs and the time it takes to deliver on your desired outcomes.
Respectfully,

Robert J. Manning
Executive Chairman
MFS Investment Management
August 16, 2018
The opinions expressed in this letter are subject to change and may not be relied upon for investment advice. No forecasts can be guaranteed.
1
MFS Core Equity Portfolio
PORTFOLIO COMPOSITION
Portfolio structure
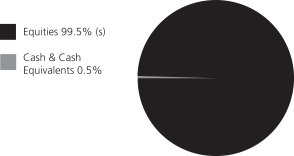
| | | | |
| Top ten holdings | | | | |
| Amazon.com, Inc. | | | 3.0% | |
| Alphabet, Inc., “A” | | | 2.6% | |
| Facebook, Inc., “A” | | | 2.3% | |
| Bank of America Corp. | | | 2.1% | |
| Chevron Corp. | | | 2.1% | |
| Analog Devices, Inc. | | | 2.0% | |
| American Tower Corp., REIT | | | 1.9% | |
| Microsoft Corp. | | | 1.9% | |
| Citigroup, Inc. | | | 1.9% | |
| Pfizer, Inc. | | | 1.8% | |
| | | | |
| Equity sectors | | | | |
| Technology | | | 20.9% | |
| Financial Services | | | 18.4% | |
| Health Care | | | 13.4% | |
| Industrial Goods & Services | | | 8.2% | |
| Retailing | | | 7.7% | |
| Utilities & Communications (s) | | | 5.7% | |
| Energy | | | 5.4% | |
| Consumer Staples | | | 5.2% | |
| Special Products & Services | | | 4.7% | |
| Leisure | | | 4.2% | |
| Basic Materials | | | 3.3% | |
| Transportation | | | 1.3% | |
| Autos & Housing | | | 1.1% | |
| (s) | Includes securities sold short. |
Cash & Cash Equivalents includes any cash, investments in money market funds, short-term securities, and other assets less liabilities. Please see the Statement of Assets and Liabilities for additional information related to the fund’s cash position and other assets and liabilities.
Percentages are based on net assets as of June 30, 2018.
The portfolio is actively managed and current holdings may be different.
2
MFS Core Equity Portfolio
EXPENSE TABLE
Fund Expenses Borne by the Contract Holders during the Period,
January 1, 2018 through June 30, 2018
As a contract holder of the fund, you incur ongoing costs, including management fees; distribution and/or service (12b-1) fees; and other fund expenses. This example is intended to help you understand your ongoing costs (in dollars) of investing in the fund and to compare these costs with the ongoing costs of investing in other mutual funds.
The example is based on an investment of $1,000 invested at the beginning of the period and held for the entire period January 1, 2018 through June 30, 2018.
Actual Expenses
The first line for each share class in the following table provides information about actual account values and actual expenses. You may use the information in this line, together with the amount you invested, to estimate the expenses that you paid over the period. Simply divide your account value by $1,000 (for example, an $8,600 account value divided by $1,000 = 8.6), then multiply the result by the number in the first line under the heading entitled “Expenses Paid During Period” to estimate the expenses you paid on your account during this period.
Hypothetical Example for Comparison Purposes
The second line for each share class in the following table provides information about hypothetical account values and hypothetical expenses based on the fund’s actual expense ratio and an assumed rate of return of 5% per year before expenses, which is not the fund’s actual return. The hypothetical account values and expenses may not be used to estimate the actual ending account balance or expenses you paid for the period. You may use this information to compare the ongoing costs of investing in the fund and other funds. To do so, compare this 5% hypothetical example with the 5% hypothetical examples that appear in the shareholder reports of the other funds.
Please note that the expenses shown in the table are meant to highlight the fund’s ongoing costs only and do not take into account the fees and expenses imposed under the variable contracts through which your investment in the fund is made. Therefore, the second line for each share class in the table is useful in comparing ongoing costs associated with an investment in vehicles (such as the fund) which fund benefits under variable annuity and variable life insurance contracts and to qualified pension and retirement plans only, and will not help you determine the relative total costs of investing in the fund through variable annuity and variable life insurance contracts. If the fees and expenses imposed under the variable contracts were included, your costs would have been higher.
| | | | | | | | | | | | | | | | | | |
| Share Class | | | | Annualized
Expense Ratio | | | Beginning
Account Value
1/01/18 | | | Ending
Account Value
6/30/18 | | | Expenses Paid
During Period (p)
1/01/18-6/30/18 | |
| Initial Class | | Actual | | | 0.85% | | | | $1,000.00 | | | | $1,040.86 | | | | $4.30 | |
| | Hypothetical (h) | | | 0.85% | | | | $1,000.00 | | | | $1,020.58 | | | | $4.26 | |
| Service Class | | Actual | | | 1.10% | | | | $1,000.00 | | | | $1,039.66 | | | | $5.56 | |
| | Hypothetical (h) | | | 1.10% | | | | $1,000.00 | | | | $1,019.34 | | | | $5.51 | |
| (h) | 5% class return per year before expenses. |
| (p) | “Expenses Paid During Period” are equal to each class’s annualized expense ratio, as shown above, multiplied by the average account value over the period, multiplied by 181/365 (to reflect the one-half year period). |
Notes to Expense Table
Expense ratios include 0.02% of investment related expenses from short sales (See Note 2 of the Notes to Financial Statements) that are outside of the expense limitation arrangement (See Note 3 of the Notes to Financial Statements).
3
MFS Core Equity Portfolio
PORTFOLIO OF INVESTMENTS – 6/30/18 (unaudited)
The Portfolio of Investments is a complete list of all securities owned by your fund. It is categorized by broad-based asset classes.
| | | | | | | | |
| Issuer | | Shares/Par | | | Value ($) | |
| | | | | | | | |
| COMMON STOCKS – 99.7% | | | | | | | | |
| Aerospace – 3.7% | | | | | |
| Boeing Co. | | | 4,360 | | | $ | 1,462,824 | |
| CACI International, Inc., “A” (a) | | | 3,364 | | | | 567,002 | |
| Curtiss-Wright Corp. | | | 3,542 | | | | 421,569 | |
| FLIR Systems, Inc. | | | 8,837 | | | | 459,259 | |
| Honeywell International, Inc. | | | 13,039 | | | | 1,878,268 | |
| Northrop Grumman Corp. | | | 4,093 | | | | 1,259,416 | |
| Textron, Inc. | | | 8,276 | | | | 545,471 | |
| United Technologies Corp. | | | 10,402 | | | | 1,300,562 | |
| | | | | | | | |
| | | | | | $ | 7,894,371 | |
| | | | | | | | |
| Alcoholic Beverages – 0.4% | | | | | |
| Constellation Brands, Inc., “A” | | | 3,478 | | | $ | 761,230 | |
| | | | | | | | |
| Apparel Manufacturers – 1.7% | | | | | |
| Hanesbrands, Inc. | | | 32,325 | | | $ | 711,796 | |
| NIKE, Inc., “B” | | | 35,920 | | | | 2,862,106 | |
| | | | | | | | |
| | | | | | $ | 3,573,902 | |
| | | | | | | | |
| Automotive – 0.6% | | | | | |
| CoPart, Inc. (a) | | | 11,719 | | | $ | 662,827 | |
| Lear Corp. | | | 2,767 | | | | 514,136 | |
| | | | | | | | |
| | | | | | $ | 1,176,963 | |
| | | | | | | | |
| Biotechnology – 1.1% | | | | | |
| Biogen, Inc. (a) | | | 7,952 | | | $ | 2,307,988 | |
| | | | | | | | |
| Brokerage & Asset Managers – 2.0% | | | | | |
| Blackstone Group LP | | | 40,295 | | | $ | 1,296,290 | |
| Invesco Ltd. | | | 15,766 | | | | 418,745 | |
| TD Ameritrade Holding Corp. | | | 28,949 | | | | 1,585,537 | |
| TMX Group Ltd. | | | 15,257 | | | | 1,000,151 | |
| | | | | | | | |
| | | | | | $ | 4,300,723 | |
| | | | | | | | |
| Business Services – 3.1% | | | | | |
| Amdocs Ltd. | | | 6,106 | | | $ | 404,156 | |
| Cognizant Technology Solutions Corp., “A” | | | 13,510 | | | | 1,067,155 | |
| DXC Technology Co. | | | 10,803 | | | | 870,830 | |
| Fidelity National Information Services, Inc. | | | 11,230 | | | | 1,190,717 | |
| First Data Corp. (a) | | | 10,964 | | | | 229,477 | |
| Global Payments, Inc. | | | 8,211 | | | | 915,444 | |
| Grand Canyon Education, Inc. (a) | | | 1,612 | | | | 179,915 | |
| Total System Services, Inc. | | | 4,551 | | | | 384,651 | |
| Verisk Analytics, Inc., “A” (a) | | | 8,401 | | | | 904,284 | |
| Zendesk, Inc. (a) | | | 6,717 | | | | 366,009 | |
| | | | | | | | |
| | | | | | $ | 6,512,638 | |
| | | | | | | | |
| Cable TV – 0.8% | | | | | |
| Altice USA, Inc. | | | 11,918 | | | $ | 203,321 | |
| Comcast Corp., “A” | | | 45,370 | | | | 1,488,590 | |
| | | | | | | | |
| | | | | | $ | 1,691,911 | |
| | | | | | | | |
| Chemicals – 2.2% | | | | | |
| Celanese Corp. | | | 4,598 | | | $ | 510,654 | |
| CF Industries Holdings, Inc. | | | 15,940 | | | | 707,736 | |
| DowDuPont, Inc. | | | 23,167 | | | | 1,527,169 | |
| | | | | | | | |
| Issuer | | Shares/Par | | | Value ($) | |
| | | | | | | | |
| COMMON STOCKS – continued | | | | | |
| Chemicals – continued | | | | | |
| Ingevity Corp. (a) | | | 6,689 | | | $ | 540,872 | |
| PPG Industries, Inc. | | | 13,711 | | | | 1,422,242 | |
| | | | | | | | |
| | | | | | $ | 4,708,673 | |
| | | | | | | | |
| Computer Software – 5.5% | | | | | |
| 8x8, Inc. (a) | | | 33,037 | | | $ | 662,392 | |
| Adobe Systems, Inc. (a) | | | 11,673 | | | | 2,845,994 | |
| Autodesk, Inc. (a) | | | 3,787 | | | | 496,438 | |
| Microsoft Corp. | | | 40,917 | | | | 4,034,825 | |
| Salesforce.com, Inc. (a) | | | 25,792 | | | | 3,518,029 | |
| | | | | | | | |
| | | | | | $ | 11,557,678 | |
| | | | | | | | |
| Computer Software – Systems – 1.7% | | | | | |
| Apple, Inc. | | | 10,927 | | | $ | 2,022,697 | |
| Pluralsight, Inc., “A” (a) | | | 6,093 | | | | 148,974 | |
| Rapid7, Inc. (a) | | | 25,760 | | | | 726,947 | |
| SS&C Technologies Holdings, Inc. | | | 8,283 | | | | 429,888 | |
| Xerox Corp. | | | 8,600 | | | | 206,400 | |
| | | | | | | | |
| | | | | | $ | 3,534,906 | |
| | | | | | | | |
| Construction – 0.5% | | | | | |
| Sherwin-Williams Co. | | | 2,598 | | | $ | 1,058,867 | |
| | | | | | | | |
| Consumer Products – 1.6% | | | | | |
| Coty, Inc., “A” | | | 42,928 | | | $ | 605,285 | |
| e.l.f. Beauty, Inc. (a) | | | 13,161 | | | | 200,573 | |
| Kimberly-Clark Corp. | | | 6,629 | | | | 698,299 | |
| Newell Brands, Inc. | | | 25,882 | | | | 667,497 | |
| Procter & Gamble Co. | | | 16,346 | | | | 1,275,969 | |
| | | | | | | | |
| | | | | | $ | 3,447,623 | |
| | | | | | | | |
| Consumer Services – 1.6% | | | | | |
| Bookings Holdings, Inc. (a) | | | 1,109 | | | $ | 2,248,043 | |
| Bright Horizons Family Solutions, Inc. (a) | | | 6,100 | | | | 625,372 | |
| ServiceMaster Global Holdings, Inc. (a) | | | 9,662 | | | | 574,599 | |
| | | | | | | | |
| | | | | | $ | 3,448,014 | |
| | | | | | | | |
| Containers – 0.5% | | | | | |
| Berry Global Group, Inc. (a) | | | 15,274 | | | $ | 701,688 | |
| Sealed Air Corp. | | | 10,374 | | | | 440,376 | |
| | | | | | | | |
| | | | | | $ | 1,142,064 | |
| | | | | | | | |
| Electrical Equipment – 2.4% | | | | | |
| AMETEK, Inc. | | | 17,780 | | | $ | 1,283,005 | |
| AZZ, Inc. | | | 9,551 | | | | 414,991 | |
| HD Supply Holdings, Inc. (a) | | | 17,819 | | | | 764,257 | |
| Johnson Controls International PLC | | | 25,212 | | | | 843,341 | |
| Sensata Technologies Holding PLC (a) | | | 16,881 | | | | 803,198 | |
| TE Connectivity Ltd. | | | 7,609 | | | | 685,266 | |
| WESCO International, Inc. (a) | | | 5,527 | | | | 315,592 | |
| | | | | | | | |
| | | | | | $ | 5,109,650 | |
| | | | | | | | |
| Electronics – 6.7% | | | | | |
| Analog Devices, Inc. | | | 43,801 | | | $ | 4,201,392 | |
| Applied Materials, Inc. | | | 9,482 | | | | 437,973 | |
4
MFS Core Equity Portfolio
Portfolio of Investments (unaudited) – continued
| | | | | | | | |
| Issuer | | Shares/Par | | | Value ($) | |
| | | | | | | | |
| COMMON STOCKS – continued | | | | | |
| Electronics – continued | | | | | |
| Inphi Corp. (a)(l) | | | 26,342 | | | $ | 859,013 | |
| IPG Photonics Corp. (a) | | | 1,338 | | | | 295,203 | |
| Marvell Technology Group Ltd. | | | 75,752 | | | | 1,624,123 | |
| Mellanox Technologies Ltd. (a) | | | 6,480 | | | | 546,264 | |
| NVIDIA Corp. | | | 11,591 | | | | 2,745,908 | |
| Texas Instruments, Inc. | | | 31,795 | | | | 3,505,399 | |
| | | | | | | | |
| | | | | | $ | 14,215,275 | |
| | | | | | | | |
| Energy – Independent – 2.5% | | | | | |
| Concho Resources, Inc. (a) | | | 4,999 | | | $ | 691,612 | |
| Energen Corp. (a) | | | 3,017 | | | | 219,698 | |
| EOG Resources, Inc. | | | 14,408 | | | | 1,792,787 | |
| EQT Corp. | | | 3,058 | | | | 168,740 | |
| Hess Corp. | | | 13,458 | | | | 900,206 | |
| Marathon Petroleum Corp. | | | 16,055 | | | | 1,126,419 | |
| Parsley Energy, Inc., “A” (a) | | | 8,820 | | | | 267,070 | |
| | | | | | | | |
| | | | | | $ | 5,166,532 | |
| | | | | | | | |
| Energy – Integrated – 2.1% | | | | | |
| Chevron Corp. (s) | | | 34,629 | | | $ | 4,378,144 | |
| | | | | | | | |
| Engineering – Construction – 0.2% | | | | | |
| KBR, Inc. | | | 25,567 | | | $ | 458,161 | |
| | | | | | | | |
| Entertainment – 0.6% | | | | | |
| Six Flags Entertainment Corp. | | | 9,720 | | | $ | 680,886 | |
| Twenty-First Century Fox, Inc. | | | 12,834 | | | | 637,721 | |
| | | | | | | | |
| | | | | | $ | 1,318,607 | |
| | | | | | | | |
| Food & Beverages – 2.5% | | | | | |
| Archer Daniels Midland Co. | | | 16,104 | | | $ | 738,046 | |
| J.M. Smucker Co. | | | 3,810 | | | | 409,499 | |
| Mondelez International, Inc. | | | 28,740 | | | | 1,178,340 | |
| Monster Worldwide, Inc. (a) | | | 15,070 | | | | 863,511 | |
| PepsiCo, Inc. | | | 18,056 | | | | 1,965,757 | |
| | | | | | | | |
| | | | | | $ | 5,155,153 | |
| | | | | | | | |
| Gaming & Lodging – 0.6% | | | | | |
| Hilton Worldwide Holdings, Inc. | | | 10,577 | | | $ | 837,275 | |
| Marriott International, Inc., “A” | | | 3,066 | | | | 388,156 | |
| | | | | | | | |
| | | | | | $ | 1,225,431 | |
| | | | | | | | |
| General Merchandise – 0.3% | | | | | |
| Dollar Tree, Inc. (a) | | | 7,473 | | | $ | 635,205 | |
| | | | | | | | |
| Health Maintenance Organizations – 1.6% | | | | | |
| Cigna Corp. | | | 10,833 | | | $ | 1,841,068 | |
| Humana Inc. | | | 5,204 | | | | 1,548,867 | |
| | | | | | | | |
| | | | | | $ | 3,389,935 | |
| | | | | | | | |
| Insurance – 3.0% | | | | | |
| Aon PLC | | | 22,124 | | | $ | 3,034,749 | |
| Athene Holding Ltd. (a) | | | 9,647 | | | | 422,924 | |
| Chubb Ltd. | | | 11,074 | | | | 1,406,620 | |
| Hartford Financial Services Group, Inc. | | | 29,424 | | | | 1,504,449 | |
| | | | | | | | |
| | | | | | $ | 6,368,742 | |
| | | | | | | | |
| Internet – 5.7% | | | | | |
| Alphabet, Inc., “A” (a)(s) | | | 4,836 | | | $ | 5,460,763 | |
| Facebook, Inc., “A” (a) | | | 25,486 | | | | 4,952,440 | |
| | | | | | | | |
| Issuer | | Shares/Par | | | Value ($) | |
| | | | | | | | |
| COMMON STOCKS – continued | | | | | |
| Internet – continued | | | | | |
| LogMeIn, Inc. | | | 9,881 | | | $ | 1,020,213 | |
| MINDBODY, Inc., “A” (a) | | | 14,524 | | | | 560,626 | |
| | | | | | | | |
| | | | | | $ | 11,994,042 | |
| | | | | | | | |
| Leisure & Toys – 0.8% | | | | | |
| Electronic Arts, Inc. (a) | | | 8,845 | | | $ | 1,247,322 | |
| Take-Two Interactive Software, Inc. (a) | | | 2,932 | | | | 347,031 | |
| | | | | | | | |
| | | | | | $ | 1,594,353 | |
| | | | | | | | |
| Machinery & Tools – 1.3% | | | | | |
| Flowserve Corp. | | | 12,189 | | | $ | 492,436 | |
| Illinois Tool Works, Inc. | | | 4,223 | | | | 585,054 | |
| ITT, Inc. | | | 10,434 | | | | 545,385 | |
| Roper Technologies, Inc. | | | 4,136 | | | | 1,141,164 | |
| | | | | | | | |
| | | | | | $ | 2,764,039 | |
| | | | | | | | |
| Major Banks – 2.9% | | | | | |
| Bank of America Corp. | | | 159,085 | | | $ | 4,484,606 | |
| PNC Financial Services Group, Inc. | | | 11,812 | | | | 1,595,801 | |
| | | | | | | | |
| | | | | | $ | 6,080,407 | |
| | | | | | | | |
| Medical & Health Technology & Services – 1.3% | | | | | |
| HCA Healthcare, Inc. | | | 7,824 | | | $ | 802,742 | |
| ICON PLC (a) | | | 4,123 | | | | 546,421 | |
| McKesson Corp. | | | 6,647 | | | | 886,710 | |
| Walgreens Boots Alliance, Inc. | | | 8,718 | | | | 523,211 | |
| | | | | | | | |
| | | | | | $ | 2,759,084 | |
| | | | | | | | |
| Medical Equipment – 3.6% | | | | | |
| Abiomed, Inc. (a) | | | 1,294 | | | $ | 529,311 | |
| Align Technology, Inc. (a) | | | 1,551 | | | | 530,659 | |
| Danaher Corp. | | | 6,764 | | | | 667,471 | |
| Edwards Lifesciences Corp. (a) | | | 11,346 | | | | 1,651,637 | |
| Medtronic PLC | | | 25,975 | | | | 2,223,720 | |
| PerkinElmer, Inc. | | | 11,071 | | | | 810,729 | |
| Steris PLC | | | 10,579 | | | | 1,110,901 | |
| West Pharmaceutical Services, Inc. | | | 1,064 | | | | 105,645 | |
| | | | | | | | |
| | | | | | $ | 7,630,073 | |
| | | | | | | | |
| Metals & Mining – 0.3% | | | | | |
| First Quantum Minerals Ltd. | | | 15,627 | | | $ | 230,247 | |
| Teck Resources Ltd., “B” | | | 14,475 | | | | 368,389 | |
| | | | | | | | |
| | | | | | $ | 598,636 | |
| | | | | | | | |
| Natural Gas – Distribution – 0.1% | | | | | |
| NiSource, Inc. | | | 8,090 | | | $ | 212,605 | |
| | | | | | | | |
| Natural Gas – Pipeline – 0.6% | | | | | |
| Cheniere Energy, Inc. (a) | | | 15,790 | | | $ | 1,029,350 | |
| Enterprise Products Partners LP | | | 6,554 | | | | 181,349 | |
| | | | | | | | |
| | | | | | $ | 1,210,699 | |
| | | | | | | | |
| Network & Telecom – 1.3% | | | | | |
| Cisco Systems, Inc. | | | 62,493 | | | $ | 2,689,074 | |
| Switch, Inc. (l) | | | 4,673 | | | | 56,870 | |
| | | | | | | | |
| | | | | | $ | 2,745,944 | |
| | | | | | | | |
5
MFS Core Equity Portfolio
Portfolio of Investments (unaudited) – continued
| | | | | | | | |
| Issuer | | Shares/Par | | | Value ($) | |
| | | | | | | | |
| COMMON STOCKS – continued | | | | | |
| Oil Services – 0.9% | | | | | |
| Apergy Corp. (a) | | | 5,898 | | | $ | 246,241 | |
| Liberty Oilfield Services, Inc. (a)(l) | | | 17,466 | | | | 326,964 | |
| Patterson-UTI Energy, Inc. | | | 44,746 | | | | 805,428 | |
| Schlumberger Ltd. | | | 7,015 | | | | 470,215 | |
| | | | | | | | |
| | | | | | $ | 1,848,848 | |
| | | | | | | | |
| Other Banks & Diversified Financials – 7.1% | | | | | |
| Bank of the Ozarks, Inc. | | | 17,567 | | | $ | 791,218 | |
| Citigroup, Inc. (s) | | | 59,788 | | | | 4,001,013 | |
| Discover Financial Services | | | 12,960 | | | | 912,514 | |
| EuroDekania Ltd. (u) | | | 151,350 | | | | 22,535 | |
| Mastercard, Inc., “A” | | | 17,134 | | | | 3,367,174 | |
| Northern Trust Corp. | | | 8,152 | | | | 838,759 | |
| Prosperity Bancshares, Inc. | | | 3,654 | | | | 249,787 | |
| U.S. Bancorp | | | 52,782 | | | | 2,640,156 | |
| Wintrust Financial Corp. | | | 14,612 | | | | 1,271,974 | |
| Zions Bancorporation | | | 15,127 | | | | 797,042 | |
| | | | | | | | |
| | | | | | $ | 14,892,172 | |
| | | | | | | | |
| Pharmaceuticals – 5.8% | | | | | |
| Bristol-Myers Squibb Co. | | | 35,876 | | | $ | 1,985,378 | |
| Eli Lilly & Co. | | | 16,576 | | | | 1,414,430 | |
| Johnson & Johnson | | | 23,098 | | | | 2,802,711 | |
| Pfizer, Inc. | | | 105,137 | | | | 3,814,371 | |
| Zoetis, Inc. | | | 25,174 | | | | 2,144,573 | |
| | | | | | | | |
| | | | | | $ | 12,161,463 | |
| | | | | | | | |
| Pollution Control – 0.6% | | | | | |
| Evoqua Water TechnologiesLLC (a) | | | 26,981 | | | $ | 553,110 | |
| Waste Connections, Inc. | | | 8,299 | | | | 624,749 | |
| | | | | | | | |
| | | | | | $ | 1,177,859 | |
| | | | | | | | |
| Railroad & Shipping – 1.3% | | | | | |
| Canadian Pacific Railway Ltd. | | | 7,535 | | | $ | 1,379,056 | |
| Kansas City Southern Co. | | | 8,324 | | | | 882,011 | |
| Union Pacific Corp. | | | 3,185 | | | | 451,251 | |
| | | | | | | | |
| | | | | | $ | 2,712,318 | |
| | | | | | | | |
| Real Estate – 3.4% | | | | | |
| Industrial Logistics Properties Trust, REIT | | | 31,202 | | | $ | 697,365 | |
| Life Storage, Inc., REIT | | | 14,801 | | | | 1,440,285 | |
| Medical Properties Trust, Inc., REIT | | | 165,354 | | | | 2,321,570 | |
| Store Capital Corp., REIT | | | 53,809 | | | | 1,474,367 | |
| Sun Communities, Inc., REIT | | | 5,692 | | | | 557,133 | |
| W.P. Carey, Inc., REIT | | | 11,563 | | | | 767,205 | |
| | | | | | | | |
| | | | | | $ | 7,257,925 | |
| | | | | | | | |
| Restaurants – 1.4% | | | | | |
| Aramark | | | 16,998 | | | $ | 630,626 | |
| Dave & Buster’s, Inc. (a) | | | 5,354 | | | | 254,850 | |
| Starbucks Corp. | | | 30,637 | | | | 1,496,617 | |
| U.S. Foods Holding Corp. (a) | | | 16,714 | | | | 632,124 | |
| | | | | | | | |
| | | | | | $ | 3,014,217 | |
| | | | | | | | |
| Specialty Chemicals – 0.2% | | | | | |
| Univar, Inc. (a) | | | 19,000 | | | $ | 498,560 | |
| | | | | | | | |
| | | | | | | | |
| Issuer | | Shares/Par | | | Value ($) | |
| | | | | | | | |
| COMMON STOCKS – continued | | | | | |
| Specialty Stores – 5.7% | | | | | |
| Amazon.com, Inc. (a) | | | 3,696 | | | $ | 6,282,461 | |
| Costco Wholesale Corp. | | | 6,897 | | | | 1,441,335 | |
| L Brands, Inc. | | | 15,516 | | | | 572,230 | |
| Michaels Co., Inc. (a) | | | 23,167 | | | | 444,111 | |
| TJX Cos., Inc. | | | 14,433 | | | | 1,373,733 | |
| Tractor Supply Co. | | | 12,550 | | | | 959,950 | |
| Urban Outfitters, Inc. (a) | | | 19,298 | | | | 859,726 | |
| | | | | | | | |
| | | | | | $ | 11,933,546 | |
| | | | | | | | |
| Telecommunications – Wireless – 1.9% | | | | | |
| American Tower Corp., REIT | | | 28,259 | | | $ | 4,074,100 | |
| | | | | | | | |
| Telephone Services – 0.5% | | | | | |
| Verizon Communications, Inc. | | | 22,771 | | | $ | 1,145,609 | |
| | | | | | | | |
| Tobacco – 0.7% | | | | | |
| Philip Morris International, Inc. | | | 18,680 | | | $ | 1,508,223 | |
| | | | | | | | |
| Utilities – Electric Power – 2.8% | | | | | |
| American Electric Power Co., Inc. | | | 11,745 | | | $ | 813,341 | |
| Avangrid, Inc. | | | 8,957 | | | | 474,094 | |
| CenterPoint Energy, Inc. | | | 10,549 | | | | 292,313 | |
| CMS Energy Corp. | | | 15,304 | | | | 723,573 | |
| Evergy, Inc. | | | 11,790 | | | | 662,009 | |
| Exelon Corp. | | | 22,559 | | | | 961,013 | |
| NextEra Energy, Inc. | | | 7,108 | | | | 1,187,249 | |
| Xcel Energy, Inc. | | | 15,487 | | | | 707,446 | |
| | | | | | | | |
| | | | | | $ | 5,821,038 | |
| | | | | | | | |
Total Common Stocks
(Identified Cost, $160,254,402) | | | $ | 210,174,146 | |
| | | | | | | | |
|
| CONVERTABLE PREFERRED STOCKS – 0.2% | |
| Natural Gas – Distribution – 0.2% | | | | | |
| South Jersey Industries, Inc., 7.25% | | | | | | | | |
| (Identified Cost, $306,500) | | | 6,130 | | | $ | 341,992 | |
| | | | | | | | |
| |
| INVESTMENT COMPANIES (h) – 0.7% | | | | | |
| Money Market Funds – 0.7% | | | | | |
| MFS Institutional Money Market | | | | | | | | |
Portfolio, 1.9% (v)
(Identified Cost, $1,472,996) | | | 1,473,151 | | | $ | 1,473,151 | |
| | | | | | | | |
|
| COLLATERAL FOR SECURITIES LOANED – 0.1% | |
| State Street Navigator Securities Lending Government Money Market Portfolio, 1.9% (j) (Identified Cost, $241,381) | | | 241,381 | | | $ | 241,381 | |
| | | | | | | | |
| |
| SECURITIES SOLD SHORT – (0.4)% | | | | | |
| Telecommunications – Wireless – (0.4)% | | | | | |
| Crown Castle International Corp., REIT | | | | | | | | |
| (Proceeds Received, $578,273) | | | (6,970 | ) | | $ | (751,505 | ) |
| | | | | | | | |
OTHER ASSETS, LESS
LIABILITIES – (0.3)% | | | | | | | (699,439 | ) |
| | | | | | | | |
| NET ASSETS – 100.0% | | | | | | $ | 210,779,726 | |
| | | | | | | | |
6
MFS Core Equity Portfolio
Portfolio of Investments (unaudited) – continued
| (a) | | Non-income producing security. |
| (h) | | An affiliated issuer, which may be considered one in which the fund owns 5% or more of the outstanding voting securities, or a company which is under common control. At period end, the aggregate values of the fund’s investments in affiliated issuers and in unaffiliated issuers were $1,473,151 and $210,757,519, respectively. |
| (j) | | The rate quoted is the annualized seven-day yield of the fund at period end. |
| (l) | | A portion of this security is on loan. |
| (s) | | Security or a portion of the security was pledged to cover collateral requirements for securities sold short. |
| (u) | | The security was valued using significant unobservable inputs and is considered level 3 under the fair value hierarchy. For further information about the fund’s level 3 holdings, please see Note 2 in the Notes to Financial Statements. |
| (v) | | Affiliated issuer that is available only to investment companies managed by MFS. The rate quoted for the MFS Institutional Money Market Portfolio is the annualized seven-day yield of the fund at period end. |
The following abbreviations are used in this report and are defined:
| PLC | | Public Limited Company |
| REIT | | Real Estate Investment Trust |
At June 30, 2018, the fund had cash collateral of $5,253 and other liquid securities with an aggregate value of $1,391,116 to cover any collateral or margin obligations for securities sold short. Restricted cash and/or deposits with brokers in the Statement of Assets and Liabilities are comprised of cash collateral.
See Notes to Financial Statements
7
MFS Core Equity Portfolio
FINANCIAL STATEMENTS | STATEMENT OF ASSETS AND LIABILITIES (unaudited)
This statement represents your fund’s balance sheet, which details the assets and liabilities comprising the total value of the fund.
| | | | |
At 6/30/18 | | | | |
Assets | | | | |
Investments in unaffiliated issuers, at value, including $258,377 of securities on loan (identified cost, $160,802,283) | | | $210,757,519 | |
Investments in affiliated issuers, at value (identified cost, $1,472,996) | | | 1,473,151 | |
Deposits with brokers for | | | | |
Securities sold short | | | 5,253 | |
Receivables for | | | | |
Investments sold | | | 368,247 | |
Fund shares sold | | | 7,067 | |
Interest and dividends | | | 229,300 | |
Other assets | | | 841 | |
Total assets | | | $212,841,378 | |
Liabilities | | | | |
Payables for | | | | |
Securities sold short, at value (proceeds received, $578,273) | | | $751,505 | |
Investments purchased | | | 879,321 | |
Fund shares reacquired | | | 114,854 | |
Collateral for securities loaned, at value (c) | | | 241,381 | |
Payable to affiliates | | | | |
Investment adviser | | | 13,114 | |
Shareholder servicing costs | | | 87 | |
Distribution and/or service fees | | | 900 | |
Payable for independent Trustees’ compensation | | | 100 | |
Accrued expenses and other liabilities | | | 60,390 | |
Total liabilities | | | $2,061,652 | |
Net assets | | | $210,779,726 | |
Net assets consist of | | | | |
Paid-in capital | | | $119,451,548 | |
Unrealized appreciation (depreciation) | | | 49,782,187 | |
Accumulated net realized gain (loss) | | | 39,376,824 | |
Undistributed net investment income | | | 2,169,167 | |
Net assets | | | $210,779,726 | |
Shares of beneficial interest outstanding | | | 8,050,940 | |
| | | | | | | | | | | | |
| | | Net assets | | | Shares
outstanding | | | Net asset value
per share | |
Initial Class | | | $166,826,509 | | | | 6,357,377 | | | | $26.24 | |
Service Class | | | 43,953,217 | | | | 1,693,563 | | | | 25.95 | |
| (c) | Non-cash collateral is not included. |
See Notes to Financial Statements
8
MFS Core Equity Portfolio
FINANCIAL STATEMENTS | STATEMENT OF OPERATIONS (unaudited)
This statement describes how much your fund earned in investment income and accrued in expenses. It also describes any gains and/or losses generated by fund operations.
| | | | |
Six months ended 6/30/18 | | | | |
Net investment income (loss) | | | | |
Income | | | | |
Dividends | | | $1,733,398 | |
Dividends from affiliated issuers | | | 11,963 | |
Other | | | 10,035 | |
Income on securities loaned | | | 2,787 | |
Foreign taxes withheld | | | (3,515 | ) |
Total investment income | | | $1,754,668 | |
Expenses | | | | |
Management fee | | | $800,500 | |
Distribution and/or service fees | | | 56,912 | |
Shareholder servicing costs | | | 7,774 | |
Administrative services fee | | | 20,962 | |
Independent Trustees’ compensation | | | 4,133 | |
Custodian fee | | | 6,415 | |
Shareholder communications | | | 17,468 | |
Audit and tax fees | | | 27,701 | |
Legal fees | | | 1,209 | |
Dividend and interest expense on securities sold short | | | 23,442 | |
Miscellaneous | | | 10,146 | |
Total expenses | | | $976,662 | |
Reduction of expenses by investment adviser | | | (9,843 | ) |
Net expenses | | | $966,819 | |
Net investment income (loss) | | | $787,849 | |
Realized and unrealized gain (loss) | | | | |
Realized gain (loss) (identified cost basis) | | | | |
Unaffiliated issuers | | | $17,657,062 | |
Affiliated issuers | | | (109 | ) |
Foreign currency | | | 25 | |
Net realized gain (loss) | | | $17,656,978 | |
Change in unrealized appreciation or depreciation | | | | |
Unaffiliated issuers | | | $(9,792,545 | ) |
Affiliated issuers | | | 155 | |
Securities sold short | | | 22,235 | |
Translation of assets and liabilities in foreign currencies | | | 23 | |
Net unrealized gain (loss) | | | $(9,770,132 | ) |
Net realized and unrealized gain (loss) | | | $7,886,846 | |
Change in net assets from operations | | | $8,674,695 | |
See Notes to Financial Statements
9
MFS Core Equity Portfolio
FINANCIAL STATEMENTS | STATEMENTS OF CHANGES IN NET ASSETS
These statements describe the increases and/or decreases in net assets resulting from operations, any distributions, and any shareholder transactions.
| | | | | | | | |
| | | Six months ended
6/30/18 | | | Year ended
12/31/17 | |
| | | (unaudited) | | | | |
Change in net assets | | | | | | | | |
From operations | | | | | | | | |
Net investment income (loss) | | | $787,849 | | | | $1,381,451 | |
Net realized gain (loss) | | | 17,656,978 | | | | 22,187,860 | |
Net unrealized gain (loss) | | | (9,770,132 | ) | | | 22,538,765 | |
Change in net assets from operations | | | $8,674,695 | | | | $46,108,076 | |
Distributions declared to shareholders | | | | | | | | |
From net investment income | | | $— | | | | $(1,852,020 | ) |
From net realized gain | | | — | | | | (12,091,064 | ) |
Total distributions declared to shareholders | | | $— | | | | $(13,943,084 | ) |
Change in net assets from fund share transactions | | | $(15,385,680 | ) | | | $(13,597,982 | ) |
Total change in net assets | | | $(6,710,985 | ) | | | $18,567,010 | |
Net assets | | | | | | | | |
At beginning of period | | | 217,490,711 | | | | 198,923,701 | |
At end of period (including undistributed net investment income of $2,169,167 and
$1,381,318, respectively) | | | $210,779,726 | | | | $217,490,711 | |
See Notes to Financial Statements
10
MFS Core Equity Portfolio
FINANCIAL STATEMENTS | FINANCIAL HIGHLIGHTS
The financial highlights table is intended to help you understand the fund’s financial performance for the semiannual period and the past 5 fiscal years. Certain information reflects financial results for a single fund share. The total returns in the table represent the rate that an investor would have earned (or lost) on an investment in the fund share class (assuming reinvestment of all distributions) held for the entire period.
| | | | | | | | | | | | | | | | | | | | | | | | |
| Initial Class | | Six months ended
6/30/18 | | | Year ended | |
| | | 12/31/17 | | | 12/31/16 | | | 12/31/15 | | | 12/31/14 | | | 12/31/13 | |
| | | (unaudited) | | | | | | | | | | | | | | | | |
Net asset value, beginning of period | | | $25.21 | | | | $21.67 | | | | $21.28 | | | | $23.40 | | | | $21.49 | | | | $16.12 | |
| Income (loss) from investment operations | | | | | | | | | | | | | | | | | | | | | | | | |
Net investment income (loss) (d) | | | $0.10 | | | | $0.17 | | | | $0.21 | (c) | | | $0.17 | | | | $0.16 | | | | $0.16 | |
Net realized and unrealized gain (loss) | | | 0.93 | | | | 5.04 | | | | 2.16 | | | | (0.35 | ) | | | 2.27 | | | | 5.40 | |
Total from investment operations | | | $1.03 | | | | $5.21 | | | | $2.37 | | | | $(0.18 | ) | | | $2.43 | | | | $5.56 | |
| Less distributions declared to shareholders | | | | | | | | | | | | | | | | | | | | | | | | |
From net investment income | | | $— | | | | $(0.23 | ) | | | $(0.17 | ) | | | $(0.13 | ) | | | $(0.18 | ) | | | $(0.19 | ) |
From net realized gain | | | — | | | | (1.44 | ) | | | (1.81 | ) | | | (1.81 | ) | | | (0.34 | ) | | | — | |
Total distributions declared to shareholders | | | $— | | | | $(1.67 | ) | | | $(1.98 | ) | | | $(1.94 | ) | | | $(0.52 | ) | | | $(0.19 | ) |
Net asset value, end of period (x) | | | $26.24 | | | | $25.21 | | | | $21.67 | | | | $21.28 | | | | $23.40 | | | | $21.49 | |
Total return (%) (k)(r)(s)(x) | | | 4.09 | (n) | | | 24.82 | | | | 11.38 | (c) | | | (0.21 | ) | | | 11.38 | | | | 34.62 | |
Ratios (%) (to average net assets)
and Supplemental data: | | | | | | | | | | | | | | | | | | | | | | | | |
Expenses before expense reductions (f) | | | 0.86 | (a) | | | 0.87 | | | | 0.84 | (c) | | | 0.86 | | | | 0.85 | | | | 0.85 | |
Expenses after expense reductions (f) | | | 0.85 | (a) | | | 0.86 | | | | 0.82 | (c) | | | 0.85 | | | | 0.84 | | | | 0.85 | |
Net investment income (loss) | | | 0.79 | (a) | | | 0.72 | | | | 1.00 | (c) | | | 0.75 | | | | 0.74 | | | | 0.85 | |
Portfolio turnover | | | 22 | (n) | | | 39 | | | | 60 | | | | 50 | | | | 48 | | | | 55 | |
Net assets at end of period (000 omitted) | | | $166,827 | | | | $171,038 | | | | $156,040 | | | | $156,450 | | | | $115,826 | | | | $117,044 | |
| Supplemental Ratios (%): | | | | | | | | | | | | | | | | | | | | | | | | |
Ratio of expenses to average net assets after expense reductions excluding short sale expenses (f) | | | 0.83 | (a) | | | 0.84 | | | | 0.80 | (c) | | | 0.84 | | | | 0.84 | | | | 0.84 | |
See Notes to Financial Statements
11
MFS Core Equity Portfolio
Financial Highlights – continued
| | | | | | | | | | | | | | | | | | | | | | | | |
| Service Class | | Six months
ended 6/30/18 | | | Year ended | |
| | | 12/31/17 | | | 12/31/16 | | | 12/31/15 | | | 12/31/14 | | | 12/31/13 | |
| | | (unaudited) | | | | | | | | | | | | | | | | |
Net asset value, beginning of period | | | $24.96 | | | | $21.47 | | | | $21.10 | | | | $23.20 | | | | $21.32 | | | | $16.00 | |
| Income (loss) from investment operations | | | | | | | | | | | | | | | | | | | | | | | | |
Net investment income (loss) (d) | | | $0.07 | | | | $0.11 | | | | $0.16 | (c) | | | $0.11 | | | | $0.11 | | | | $0.11 | |
Net realized and unrealized gain (loss) | | | 0.92 | | | | 4.99 | | | | 2.13 | | | | (0.33 | ) | | | 2.24 | | | | 5.36 | |
Total from investment operations | | | $0.99 | | | | $5.10 | | | | $2.29 | | | | $(0.22 | ) | | | $2.35 | | | | $5.47 | |
| Less distributions declared to shareholders | | | | | | | | | | | | | | | | | | | | | | | | |
From net investment income | | | $— | | | | $(0.17 | ) | | | $(0.11 | ) | | | $(0.07 | ) | | | $(0.13 | ) | | | $(0.15 | ) |
From net realized gain | | | — | | | | (1.44 | ) | | | (1.81 | ) | | | (1.81 | ) | | | (0.34 | ) | | | — | |
Total distributions declared to shareholders | | | $— | | | | $(1.61 | ) | | | $(1.92 | ) | | | $(1.88 | ) | | | $(0.47 | ) | | | $(0.15 | ) |
Net asset value, end of period (x) | | | $25.95 | | | | $24.96 | | | | $21.47 | | | | $21.10 | | | | $23.20 | | | | $21.32 | |
Total return (%) (k)(r)(s)(x) | | | 3.97 | (n) | | | 24.50 | | | | 11.07 | (c) | | | (0.40 | ) | | | 11.07 | | | | 34.28 | |
Ratios (%) (to average net assets)
and Supplemental data: | | | | | | | | | | | | | | | | | | | | | | | | |
Expenses before expense reductions (f) | | | 1.11 | (a) | | | 1.12 | | | | 1.09 | (c) | | | 1.11 | | | | 1.10 | | | | 1.10 | |
Expenses after expense reductions (f) | | | 1.10 | (a) | | | 1.11 | | | | 1.07 | (c) | | | 1.10 | | | | 1.09 | | | | 1.10 | |
Net investment income (loss) | | | 0.54 | (a) | | | 0.47 | | | | 0.75 | (c) | | | 0.50 | | | | 0.49 | | | | 0.60 | |
Portfolio turnover | | | 22 | (n) | | | 39 | | | | 60 | | | | 50 | | | | 48 | | | | 55 | |
Net assets at end of period (000 omitted) | | | $43,953 | | | | $46,453 | | | | $42,883 | | | | $47,083 | | | | $48,813 | | | | $50,394 | |
| Supplemental Ratios (%): | | | | | | | | | | | | | | | | | | | | | | | | |
Ratio of expenses to average net assets after expense reductions excluding short sale expenses (f) | | | 1.08 | (a) | | | 1.09 | | | | 1.06 | (c) | | | 1.09 | | | | 1.09 | | | | 1.09 | |
| (c) | Amount reflects a one-time reimbursement of expenses by the custodian (or former custodian) without which net investment income and performance would be lower and expenses would be higher. |
| (d) | Per share data is based on average shares outstanding. |
| (f) | Ratios do not reflect reductions from fees paid indirectly, if applicable. |
| (k) | The total return does not reflect expenses that apply to separate accounts. Inclusion of these charges would reduce the total return figures for all periods shown. |
| (r) | Certain expenses have been reduced without which performance would have been lower. |
| (s) | From time to time the fund may receive proceeds from litigation settlements, without which performance would be lower. Excluding the effect of the proceeds received from a non-recurring litigation settlement against Household International, Inc., the total return for the year ended December 31, 2017 would have been lower by approximately 0.78%. |
| (x) | The net asset values and total returns have been calculated on net assets which include adjustments made in accordance with U.S. generally accepted accounting principles required at period end for financial reporting purposes. |
See Notes to Financial Statements
12
MFS Core Equity Portfolio
NOTES TO FINANCIAL STATEMENTS (unaudited)
| (1) | | Business and Organization |
MFS Core Equity Portfolio (the fund) is a diversified series of MFS Variable Insurance Trust II (the trust). The trust is organized as a Massachusetts business trust and is registered under the Investment Company Act of 1940, as amended, as an open-end management investment company. The shareholders of each series of the trust are separate accounts of insurance companies, which offer variable annuity and/or life insurance products, and qualified retirement and pension plans.
The fund is an investment company and accordingly follows the investment company accounting and reporting guidance of the Financial Accounting Standards Board (FASB) Accounting Standards Codification Topic 946 Financial Services – Investment Companies.
| (2) | | Significant Accounting Policies |
General – The preparation of financial statements in conformity with U.S. generally accepted accounting principles requires management to make estimates and assumptions that affect the reported amounts of assets and liabilities, and disclosure of contingent assets and liabilities at the date of the financial statements and the reported amounts of increases and decreases in net assets from operations during the reporting period. Actual results could differ from those estimates. In the preparation of these financial statements, management has evaluated subsequent events occurring after the date of the fund’s Statement of Assets and Liabilities through the date that the financial statements were issued.
Balance Sheet Offsetting – The fund’s accounting policy with respect to balance sheet offsetting is that, absent an event of default by the counterparty or a termination of the agreement, the International Swaps and Derivatives Association (ISDA) Master Agreement, or similar agreement, does not result in an offset of reported amounts of financial assets and financial liabilities in the Statement of Assets and Liabilities across transactions between the fund and the applicable counterparty. The fund’s right to setoff may be restricted or prohibited by the bankruptcy or insolvency laws of the particular jurisdiction to which a specific master netting agreement counterparty is subject. Balance sheet offsetting disclosures, to the extent applicable to the fund, have been included in the fund’s Significant Accounting Policies note under the captions for each of the fund’s in-scope financial instruments and transactions.
Investment Valuations – Equity securities, including restricted equity securities and equity securities held short, are generally valued at the last sale or official closing price on their primary market or exchange as provided by a third-party pricing service. Equity securities, for which there were no sales reported that day, are generally valued at the last quoted daily bid quotation on their primary market or exchange as provided by a third-party pricing service. Equity securities held short, for which there were no sales reported for that day, are generally valued at the last quoted daily ask quotation on their primary market or exchange as provided by a third-party pricing service. Short-term instruments with a maturity at issuance of 60 days or less may be valued at amortized cost, which approximates market value. Exchange-traded options are generally valued at the last sale or official closing price on their primary exchange as provided by a third-party pricing service. Exchange-traded options for which there were no sales reported that day are generally valued at the last daily bid quotation on their primary exchange as provided by a third-party pricing service. Options not traded on an exchange are generally valued at a broker/dealer bid quotation. Foreign currency options are generally valued at valuations provided by a third-party pricing service. Open-end investment companies are generally valued at net asset value per share. Securities and other assets generally valued on the basis of information from a third-party pricing service may also be valued at a broker/dealer bid quotation. In determining values, third-party pricing services can utilize both transaction data and market information such as yield, quality, coupon rate, maturity, type of issue, trading characteristics, and other market data. The values of foreign securities and other assets and liabilities expressed in foreign currencies are converted to U.S. dollars using the mean of bid and asked prices for rates provided by a third-party pricing service.
The Board of Trustees has delegated primary responsibility for determining or causing to be determined the value of the fund’s investments (including any fair valuation) to the adviser pursuant to valuation policies and procedures approved by the Board. If the adviser determines that reliable market quotations are not readily available, investments are valued at fair value as determined in good faith by the adviser in accordance with such procedures under the oversight of the Board of Trustees. Under the fund’s valuation policies and procedures, market quotations are not considered to be readily available for most types of debt instruments and floating rate loans and many types of derivatives. These investments are generally valued at fair value based on information from third-party pricing services. In addition, investments may be valued at fair value if the adviser determines that an investment’s value has been materially affected by events occurring after the close of the exchange or market on which the investment is principally traded (such as foreign exchange or market) and prior to the determination of the fund’s net asset value, or after the halting of trading of a specific security where trading does not resume prior to the close of the exchange or market on which the security is principally traded. Events that occur on a frequent basis after foreign markets close (such as developments in foreign markets and significant movements in the U.S. markets) and prior to the determination of the fund’s net asset value may be deemed to have a material effect on the value of securities traded in foreign markets. Accordingly, the fund’s foreign equity securities may often be valued at fair value. The adviser generally relies on third-party pricing services or other information (such as the correlation with price movements of similar securities in the same or other markets; the type, cost and investment characteristics of the security; the
13
MFS Core Equity Portfolio
Notes to Financial Statements (unaudited) – continued
business and financial condition of the issuer; and trading and other market data) to assist in determining whether to fair value and at what value to fair value an investment. The value of an investment for purposes of calculating the fund’s net asset value can differ depending on the source and method used to determine value. When fair valuation is used, the value of an investment used to determine the fund’s net asset value may differ from quoted or published prices for the same investment. There can be no assurance that the fund could obtain the fair value assigned to an investment if it were to sell the investment at the same time at which the fund determines its net asset value per share.
Various inputs are used in determining the value of the fund’s assets or liabilities. These inputs are categorized into three broad levels. In certain cases, the inputs used to measure fair value may fall into different levels of the fair value hierarchy. In such cases, an investment’s level within the fair value hierarchy is based on the lowest level of input that is significant to the fair value measurement. The fund’s assessment of the significance of a particular input to the fair value measurement in its entirety requires judgment, and considers factors specific to the investment. Level 1 includes unadjusted quoted prices in active markets for identical assets or liabilities. Level 2 includes other significant observable market-based inputs (including quoted prices for similar securities, interest rates, prepayment speed, and credit risk). Level 3 includes unobservable inputs, which may include the adviser’s own assumptions in determining the fair value of investments. The following is a summary of the levels used as of June 30, 2018 in valuing the fund’s assets or liabilities:
| | | | | | | | | | | | | | | | |
| Financial Instruments | | Level 1 | | | Level 2 | | | Level 3 | | | Total | |
| Equity Securities: | | | | | | | | | | | | | | | | |
United States | | | $206,549,018 | | | | $341,993 | | | | $— | | | | $206,891,011 | |
Canada | | | 3,602,592 | | | | — | | | | — | | | | 3,602,592 | |
Cayman Islands | | | — | | | | — | | | | 22,535 | | | | 22,535 | |
| Mutual Funds | | | 1,714,532 | | | | — | | | | — | | | | 1,714,532 | |
| Total | | | $211,866,142 | | | | $341,993 | | | | $22,535 | | | | $212,230,670 | |
| Short Sales | | | $(751,505 | ) | | | $— | | | | $— | | | | $(751,505 | ) |
For further information regarding security characteristics, see the Portfolio of Investments.
The following is a reconciliation of level 3 assets for which significant unobservable inputs were used to determine fair value. The fund’s policy is to recognize transfers between the levels as of the end of the period. The table presents the activity of level 3 securities held at the beginning and the end of the period.
| | | | |
| | | Equity Securities | |
| Balance as of 12/31/17 | | | $17,706 | |
Change in unrealized appreciation or depreciation | | | 4,829 | |
| Balance as of 6/30/18 | | | $22,535 | |
The net change in unrealized appreciation or depreciation from investments held as level 3 at June 30, 2018 is $4,829. At June 30, 2018, the fund held one level 3 security.
Foreign Currency Translation – Purchases and sales of foreign investments, income, and expenses are converted into U.S. dollars based upon currency exchange rates prevailing on the respective dates of such transactions or on the reporting date for foreign denominated receivables and payables. Gains and losses attributable to foreign currency exchange rates on sales of securities are recorded for financial statement purposes as net realized gains and losses on investments. Gains and losses attributable to foreign exchange rate movements on receivables, payables, income and expenses are recorded for financial statement purposes as foreign currency transaction gains and losses. That portion of both realized and unrealized gains and losses on investments that results from fluctuations in foreign currency exchange rates is not separately disclosed.
Derivatives – The fund uses derivatives primarily to increase or decrease exposure to a particular market or segment of the market, or security, to increase or decrease interest rate or currency exposure, or as alternatives to direct investments. Derivatives are used for hedging or non-hedging purposes. While hedging can reduce or eliminate losses, it can also reduce or eliminate gains. When the fund uses derivatives as an investment to increase market exposure, or for hedging purposes, gains and losses from derivative instruments may be substantially greater than the derivative’s original cost.
The derivative instruments used by the fund during the period were purchased options. Depending on the type of derivative, the fund may exit a derivative position by entering into an offsetting transaction with a counterparty or exchange, negotiating an agreement with the derivative counterparty, or novating the position to a third party. At June 30, 2018, the fund did not have any outstanding derivative instruments.
14
MFS Core Equity Portfolio
Notes to Financial Statements (unaudited) – continued
The following table presents, by major type of derivative contract, the realized gain (loss) on derivatives held by the fund for the six months ended June 30, 2018 as reported in the Statement of Operations:
| | | | |
| Risk | | Unaffiliated Issuers
(Purchased Options) | |
| Equity | | | $(89,406 | ) |
The following table presents, by major type of derivative contract, the change in unrealized appreciation or depreciation on derivatives held by the fund for the six months ended June 30, 2018 as reported in the Statement of Operations:
| | | | |
| Risk | | Unaffiliated Issuers
(Purchased Options) | |
| Equity | | | $88,673 | |
Derivative counterparty credit risk is managed through formal evaluation of the creditworthiness of all potential counterparties. On certain, but not all, uncleared derivatives, the fund attempts to reduce its exposure to counterparty credit risk whenever possible by entering into an ISDA Master Agreement on a bilateral basis. The ISDA Master Agreement gives each party to the agreement the right to terminate all transactions traded under such agreement if there is a specified deterioration in the credit quality of the other party. Upon an event of default or a termination of the ISDA Master Agreement, the non-defaulting party has the right to close out all transactions traded under such agreement and to net amounts owed under each agreement to one net amount payable by one party to the other. This right to close out and net payments across all transactions traded under the ISDA Master Agreement could result in a reduction of the fund’s credit risk to such counterparty equal to any amounts payable by the fund under the applicable transactions, if any.
Collateral and margin requirements differ by type of derivative. For cleared derivatives (e.g., futures contracts, cleared swaps, and exchange-traded options), margin requirements are set by the clearing broker and the clearing house and collateral, in the form of cash or securities, is posted by the fund directly with the clearing broker. Collateral terms are counterparty agreement specific for uncleared derivatives (e.g., forward foreign currency exchange contracts, uncleared swap agreements, and uncleared options) and collateral, in the form of cash and securities, is held in segregated accounts with the fund’s custodian in connection with these agreements. For derivatives traded under an ISDA Master Agreement, which contains a collateral support annex, the collateral requirements are netted across all transactions traded under such counterparty-specific agreement and one amount is posted from one party to the other to collateralize such obligations. Cash that has been segregated or delivered to cover the fund’s collateral or margin obligations under derivative contracts, if any, will be reported separately in the Statement of Assets and Liabilities as restricted cash for uncleared derivatives and/or deposits with brokers for cleared derivatives. Securities pledged as collateral or margin for the same purpose, if any, are noted in the Portfolio of Investments. The fund may be required to make payments of interest on uncovered collateral or margin obligations with the broker. Any such payments are included in “Miscellaneous” expense in the Statement of Operations.
Purchased Options – The fund purchased call options for a premium. Purchased call options entitle the holder to buy a specified number of shares or units of a particular security, currency or index at a specified price at a specified date or within a specified period of time. Purchasing call options may hedge against an anticipated increase in the dollar cost of securities or currency to be acquired or increase the fund’s exposure to an underlying instrument.
The premium paid is initially recorded as an investment in the Statement of Assets and Liabilities. That investment is subsequently marked-to-market daily with the difference between the premium paid and the market value of the purchased option being recorded as unrealized appreciation or depreciation. Premiums paid for purchased call options which have expired are treated as realized losses on investments in the Statement of Operations. Upon the exercise or closing of a purchased call option, the premium paid is added to the cost of the security or financial instrument purchased.
Whether or not the option is exercised, the fund’s maximum risk of loss from purchasing an option is the amount of premium paid. All option contracts involve credit risk if the counterparty to the option contract fails to perform. For uncleared options, this risk is mitigated in cases where there is an ISDA Master Agreement between the fund and the counterparty providing for netting as described above and, where applicable, by the posting of collateral by the counterparty to the fund to cover the fund’s exposure to the counterparty under such ISDA Master Agreement.
Short Sales – The fund entered into short sales whereby it sells a security it does not own in anticipation of a decline in the value of that security. The fund will realize a gain if the security price decreases and a loss if the security price increases between the date of the short sale and the date on which the fund replaces the borrowed security. Losses from short sales can exceed the proceeds of the security sold; and they can also exceed the potential loss from an ordinary buy and sell transaction. The amount of any premium, dividends, or interest the fund may be required to pay in connection with a short sale will be recognized as a fund expense. During
15
MFS Core Equity Portfolio
Notes to Financial Statements (unaudited) – continued
the six months ended June 30, 2018, this expense amounted to $23,442. The fund segregates cash or marketable securities in an amount that, when combined with the amount of proceeds from the short sale deposited with the broker, at least equals the current market value of the security sold short.
Security Loans – Under its Securities Lending Agency Agreement with the fund, State Street Bank and Trust Company (“State Street”), as lending agent, loans the securities of the fund to certain qualified institutions (the “Borrowers”) approved by the fund. Security loans can be terminated at the discretion of either the lending agent or the fund and the related securities must be returned within the earlier of the standard trade settlement period for such securities or within three business days. The loans are collateralized by cash and/or U.S. Treasury and federal agency obligations in an amount typically at least equal to the market value of the securities loaned. On loans collateralized by cash, the cash collateral is invested in a money market fund. The market value of the loaned securities is determined at the close of business of the fund and any additional required collateral is delivered to the fund on the next business day. State Street provides the fund with indemnification against Borrower default. In the event of Borrower default, State Street will, for the benefit of the fund, either purchase securities identical to those loaned or, when such purchase is commercially impracticable, pay the fund the market value of the loaned securities. In return, State Street assumes the fund’s rights to the related collateral. If the collateral value is less than the cost to purchase identical securities, State Street is responsible for the shortfall, but only to the extent that such shortfall is not due to a decline in collateral value resulting from collateral reinvestment for which the fund bears the risk of loss. At period end, the fund had investment securities on loan, all of which were classified as equity securities in the fund’s Portfolio of Investments, with a fair value of $258,377. The fair value of the fund’s investment securities on loan and a related liability of $241,381 for cash collateral received on securities loaned are both presented gross in the Statement of Assets and Liabilities. Additionally, these loans were collateralized by U.S. Treasury Obligations of $24,266. The collateral on securities loaned exceeded the value of securities on loan at period end. The liability for cash collateral for securities loaned is carried at fair value, which is categorized as level 2 within the fair value hierarchy. A portion of the income generated upon investment of the collateral is remitted to the Borrowers, and the remainder is allocated between the fund and the lending agent. On loans collateralized by U.S. Treasury and/or federal agency obligations, a fee is received from the Borrower, and is allocated between the fund and the lending agent. Income from securities lending is separately reported in the Statement of Operations. The dividend and interest income earned on the securities loaned is accounted for in the same manner as other dividend and interest income.
Indemnifications – Under the fund’s organizational documents, its officers and Trustees may be indemnified against certain liabilities and expenses arising out of the performance of their duties to the fund. Additionally, in the normal course of business, the fund enters into agreements with service providers that may contain indemnification clauses. The fund’s maximum exposure under these agreements is unknown as this would involve future claims that may be made against the fund that have not yet occurred.
Investment Transactions and Income – Investment transactions are recorded on the trade date. Dividends received in cash are recorded on the ex-dividend date. Certain dividends from foreign securities will be recorded when the fund is informed of the dividend if such information is obtained subsequent to the ex-dividend date. Dividend payments received in additional securities are recorded on the ex-dividend date in an amount equal to the value of the security on such date.
The fund may receive proceeds from litigation settlements. Any proceeds received from litigation involving portfolio holdings are reflected in the Statement of Operations in realized gain/loss if the security has been disposed of by the fund or in unrealized gain/loss if the security is still held by the fund. Any other proceeds from litigation not related to portfolio holdings are reflected as other income in the Statement of Operations.
Tax Matters and Distributions – The fund intends to qualify as a regulated investment company, as defined under Subchapter M of the Internal Revenue Code, and to distribute all of its taxable income, including realized capital gains. As a result, no provision for federal income tax is required. The fund’s federal tax returns, when filed, will remain subject to examination by the Internal Revenue Service for a three year period. Management has analyzed the fund’s tax positions taken on federal and state tax returns for all open tax years and does not believe that there are any uncertain tax positions that require recognition of a tax liability. Foreign taxes, if any, have been accrued by the fund in the accompanying financial statements in accordance with the applicable foreign tax law. Foreign income taxes may be withheld by certain countries in which the fund invests. Additionally, capital gains realized by the fund on securities issued in or by certain foreign countries may be subject to capital gains tax imposed by those countries.
Distributions to shareholders are recorded on the ex-dividend date. Income and capital gain distributions are determined in accordance with income tax regulations, which may differ from U.S. generally accepted accounting principles. Certain capital accounts in the financial statements are periodically adjusted for permanent differences in order to reflect their tax character. These adjustments have no impact on net assets or net asset value per share. Temporary differences which arise from recognizing certain items of income, expense, gain or loss in different periods for financial statement and tax purposes will reverse at some time in the future. Distributions in excess of net investment income or net realized gains are temporary overdistributions for financial statement purposes resulting from differences in the recognition or classification of income or distributions for financial statement and tax purposes.
Book/tax differences primarily relate to wash sale loss deferrals.
16
MFS Core Equity Portfolio
Notes to Financial Statements (unaudited) – continued
The tax character of distributions declared to shareholders for the last fiscal year is as follows:
| | | | |
| | | Year ended
12/31/17 | |
| Ordinary income (including any short-term capital gains) | | | $1,852,020 | |
| Long-term capital gains | | | 12,091,064 | |
| Total distributions | | | $13,943,084 | |
The federal tax cost and the tax basis components of distributable earnings were as follows:
| | | | |
| As of 6/30/18 | | | | |
| Cost of investments | | | $162,716,121 | |
| Gross appreciation | | | 55,565,328 | |
| Gross depreciation | | | (6,050,779 | ) |
| Net unrealized appreciation (depreciation) | | | $49,514,549 | |
| |
| As of 12/31/17 | | | | |
| Undistributed ordinary income | | | 6,723,244 | |
| Undistributed long-term capital gain | | | 16,746,511 | |
| Other temporary differences | | | 72,256 | |
| Net unrealized appreciation (depreciation) | | | 59,111,472 | |
The aggregate cost above includes prior fiscal year end tax adjustments, if applicable.
Multiple Classes of Shares of Beneficial Interest – The fund offers multiple classes of shares, which differ in their respective distribution and/or service fees. The fund’s income, realized and unrealized gain (loss), and common expenses are allocated to shareholders based on the daily net assets of each class. Dividends are declared separately for each class. Differences in per share dividend rates are generally due to differences in separate class expenses. The fund’s distributions declared to shareholders as reported in the Statements of Changes in Net Assets are presented by class as follows:
| | | | | | | | | | | | | | | | |
| | | From net investment
income | | | From net realized
gain | |
| | | Six months ended
6/30/18 | | | Year ended
12/31/17 | | | Six months ended
6/30/18 | | | Year ended
12/31/17 | |
| Initial Class | | | $— | | | | $1,539,604 | | | | $— | | | | $9,485,664 | |
| Service Class | | | — | | | | 312,416 | | | | — | | | | 2,605,400 | |
| Total | | | $— | | | | $1,852,020 | | | | $— | | | | $12,091,064 | |
| (3) | | Transactions with Affiliates |
Investment Adviser – The fund has an investment advisory agreement with MFS to provide overall investment management and related administrative services and facilities to the fund. The management fee is computed daily and paid monthly at the following annual rates based on the fund’s average daily net assets:
| | | | |
| Up to $1 billion | | | 0.75% | |
| In excess of $1 billion and up to $2.5 billion | | | 0.65% | |
| In excess of $2.5 billion | | | 0.60% | |
MFS has also agreed in writing to reduce its management fee by a specified amount if certain MFS mutual fund assets exceed thresholds agreed to by MFS and the fund’s Board of Trustees. For the six months ended June 30, 2018, this management fee reduction amounted to $9,843, which is included in the reduction of total expenses in the Statement of Operations. The management fee incurred for the six months ended June 30, 2018 was equivalent to an annual effective rate of 0.74% of the fund’s average daily net assets.
The investment adviser has agreed in writing to pay a portion of the fund’s total annual operating expenses, excluding interest, taxes, extraordinary expenses, brokerage and transaction costs, and investment-related expenses (such as short sale dividend and interest expenses incurred in connection with the fund’s investment activity), such that total annual operating expenses do not exceed 0.84% of average daily net assets for the Initial Class shares and 1.09% of average daily net assets for the Service Class shares. This written agreement will continue until modified by the fund’s Board of Trustees, but such agreement will continue at least until April 30, 2020. For the six months ended June 30, 2018, the fund’s actual operating expenses did not exceed the limit and therefore, the investment adviser did not pay any portion of the fund’s expenses related to this agreement.
Distributor – MFS Fund Distributors, Inc. (MFD), a wholly-owned subsidiary of MFS, is the distributor of shares of the fund. The Trustees have adopted a distribution plan for the Service Class shares pursuant to Rule 12b-1 under the Investment Company Act of 1940.
17
MFS Core Equity Portfolio
Notes to Financial Statements (unaudited) – continued
The fund’s distribution plan provides that the fund will pay MFD distribution and/or service fees equal to 0.25% per annum of its average daily net assets attributable to Service Class shares as partial consideration for services performed and expenses incurred by MFD and financial intermediaries (including participating insurance companies that invest in the fund to fund variable annuity and variable life insurance contracts, sponsors of qualified retirement and pension plans that invest in the fund, and affiliates of these participating insurance companies and plan sponsors) in connection with the sale and distribution of the Service Class shares. MFD may subsequently pay all, or a portion, of the distribution and/or service fees to financial intermediaries.
Shareholder Servicing Agent – MFS Service Center, Inc. (MFSC), a wholly-owned subsidiary of MFS, receives a fee from the fund for its services as shareholder servicing agent. For the six months ended June 30, 2018, the fee was $7,647, which equated to 0.0072% annually of the fund’s average daily net assets. MFSC also receives payment from the fund for out-of-pocket expenses paid by MFSC on behalf of the fund. For the six months ended June 30, 2018, these costs amounted to $127.
Administrator – MFS provides certain financial, legal, shareholder communications, compliance, and other administrative services to the fund. Under an administrative services agreement, the fund reimburses MFS the costs incurred to provide these services. The fund is charged an annual fixed amount of $17,500 plus a fee based on average daily net assets. The administrative services fee incurred for the six months ended June 30, 2018 was equivalent to an annual effective rate of 0.0196% of the fund’s average daily net assets.
Trustees’ and Officers’ Compensation – The fund pays compensation to independent Trustees in the form of a retainer, attendance fees, and additional compensation to Board and Committee chairpersons. The fund does not pay compensation directly to Trustees or officers of the fund who are also officers of the investment adviser, all of whom receive remuneration for their services to the fund from MFS. Certain officers and Trustees of the fund are officers or directors of MFS, MFD, and MFSC.
Other – This fund and certain other funds managed by MFS (the funds) have entered into a service agreement (the ISO Agreement) which provides for payment of fees solely by the funds to Tarantino LLC in return for the provision of services of an Independent Senior Officer (ISO) for the funds. Frank L. Tarantino serves as the ISO and is an officer of the funds and the sole member of Tarantino LLC. The funds can terminate the ISO Agreement with Tarantino LLC at any time under the terms of the ISO Agreement. For the six months ended June 30, 2018, the fee paid by the fund under this agreement was $177 and is included in “Miscellaneous” expense in the Statement of Operations. MFS has agreed to bear all expenses associated with office space, other administrative support, and supplies provided to the ISO.
The fund invests in the MFS Institutional Money Market Portfolio which is managed by MFS and seeks current income consistent with preservation of capital and liquidity. This money market fund does not pay a management fee to MFS.
The fund is permitted to engage in purchase and sale transactions with funds and accounts for which MFS serves as investment adviser or sub-adviser (“cross-trades”) pursuant to a policy adopted by the Board of Trustees. This policy has been designed to ensure that cross-trades conducted by the fund comply with Rule 17a-7 under the Investment Company Act of 1940. During the six months ended June 30, 2018, the fund engaged in sale transactions pursuant to this policy, which amounted to $488,404. The sales transactions resulted in net realized gains (losses) of $332,270.
Effective January 2, 2018, the adviser has voluntarily undertaken to reimburse the fund from its own resources on a quarterly basis for the cost of investment research embedded in the cost of the fund’s securities trades. This agreement may be rescinded at any time. For the period January 2, 2018 to June 30, 2018, this reimbursement amounted to $5,283, which is included in “Other” income in the Statement of Operations.
For the six months ended June 30, 2018, purchases and sales of investments, other than purchased option transactions, short sales, and short-term obligations, aggregated $47,020,281 and $61,142,173, respectively.
| (5) | | Shares of Beneficial Interest |
The fund’s Declaration of Trust permits the Trustees to issue an unlimited number of full and fractional shares of beneficial interest. Transactions in fund shares were as follows:
| | | | | | | | | | | | | | | | |
| | | Six months ended 6/30/18 | | | Year ended 12/31/17 | |
| | | Shares | | | Amount | | | Shares | | | Amount | |
| Shares sold | | | | | | | | | | | | | | | | |
Initial Class | | | 65,580 | | | | $1,703,550 | | | | 186,500 | | | | $4,399,901 | |
Service Class | | | 83,041 | | | | 2,135,387 | | | | 170,109 | | | | 3,967,561 | |
| | | 148,621 | | | | $3,838,937 | | | | 356,609 | | | | $8,367,462 | |
| Shares issued to shareholders in reinvestment of distributions | | | | | | | | | | | | | | | | |
Initial Class | | | — | | | | $— | | | | 481,874 | | | | $11,025,268 | |
Service Class | | | — | | | | — | | | | 128,708 | | | | 2,917,816 | |
| | | — | | | | $— | | | | 610,582 | | | | $13,943,084 | |
18
MFS Core Equity Portfolio
Notes to Financial Statements (unaudited) – continued
| | | | | | | | | | | | | | | | |
| | | Six months ended 6/30/18 | | | Year ended 12/31/17 | |
| | | Shares | | | Amount | | | Shares | | | Amount | |
| Shares reacquired | | | | | | | | | | | | | | | | |
Initial Class | | | (493,702 | ) | | | $(12,791,983 | ) | | | (1,084,690 | ) | | | $(25,642,366 | ) |
Service Class | | | (250,526 | ) | | | (6,432,634 | ) | | | (435,248 | ) | | | (10,266,162 | ) |
| | | (744,228 | ) | | | $(19,224,617 | ) | | | (1,519,938 | ) | | | $(35,908,528 | ) |
| Net change | | | | | | | | | | | | | | | | |
Initial Class | | | (428,122 | ) | | | $(11,088,433 | ) | | | (416,316 | ) | | | $(10,217,197 | ) |
Service Class | | | (167,485 | ) | | | (4,297,247 | ) | | | (136,431 | ) | | | (3,380,785 | ) |
| | | (595,607 | ) | | | $(15,385,680 | ) | | | (552,747 | ) | | | $(13,597,982 | ) |
The fund and certain other funds managed by MFS participate in a $1.25 billion unsecured committed line of credit, subject to a $1 billion sublimit, provided by a syndication of banks under a credit agreement. Borrowings may be made for temporary financing needs. Interest is charged to each fund, based on its borrowings, generally at a rate equal to the higher of the Overnight Bank Funding rate or daily one month LIBOR plus an agreed upon spread. A commitment fee, based on the average daily, unused portion of the committed line of credit, is allocated among the participating funds. In addition, the fund and other funds managed by MFS have established unsecured uncommitted borrowing arrangements with certain banks for temporary financing needs. Interest is charged to each fund, based on its borrowings, at a rate equal to the Overnight Bank Funding rate plus an agreed upon spread. For the six months ended June 30, 2018, the fund’s commitment fee and interest expense were $693 and $0, respectively, and are included in “Miscellaneous” expense in the Statement of Operations.
| (7) | | Investments in Affiliated Issuers |
An affiliated issuer may be considered one in which the fund owns 5% or more of the outstanding voting securities, or a company which is under common control. For the purposes of this report, the fund assumes the following to be affiliated issuers:
| | | | | | | | | | | | | | | | | | |
| Affiliated Issuers | | | | Beginning
Shares/Par
Amount | | | Acquisitions
Shares/Par
Amount | | | Dispositions
Shares/Par
Amount | | | Ending
Shares/Par
Amount | |
| MFS Institutional Money Market Portfolio | | | | | 1,613,843 | | | | 19,948,496 | | | | (20,089,188 | ) | | | 1,473,151 | |
| | | | | |
| Affiliated Issuers | | Realized
Gain (Loss) | | Change in
Unrealized
Appreciation/
Depreciation | | | Capital Gain
Distributions | | | Dividend
Income | | | Ending
Value | |
| MFS Institutional Money Market Portfolio | | $(109) | | | $155 | | | | $— | | | | $11,963 | | | | $1,473,151 | |
19
MFS Core Equity Portfolio
PROXY VOTING POLICIES AND INFORMATION
MFS votes proxies on behalf of the fund pursuant to proxy voting policies and procedures that are available without charge, upon request, by calling 1-800-225-2606, by visiting mfs.com/proxyvoting, or by visiting the SEC’s Web site at http://www.sec.gov.
Information regarding how the fund voted proxies relating to portfolio securities during the most recent twelve-month period ended June 30 is available by August 31 of each year without charge by visiting mfs.com/proxyvoting, or by visiting the SEC’s Web site at http://www.sec.gov.
QUARTERLY PORTFOLIO DISCLOSURE
The fund will file a complete schedule of portfolio holdings with the Securities and Exchange Commission (the Commission) for the first and third quarters of each fiscal year on Form N-Q. The fund’s Form N-Q is available on the EDGAR database on the Commission’s Internet Web site at http://www.sec.gov, and may be reviewed and copied at the:
Public Reference Room
Securities and Exchange Commission
100 F Street, NE, Room 1580
Washington, D.C. 20549
Information on the operation of the Public Reference Room may be obtained by calling the Commission at 1-800-SEC-0330. Copies of the fund’s Form N-Q also may be obtained, upon payment of a duplicating fee, by electronic request at the following e-mail address: publicinfo@sec.gov or by writing the Public Reference Section at the above address.
FURTHER INFORMATION
From time to time, MFS may post important information about the fund or the MFS funds on the MFS web site (mfs.com). This information is available at https://www.mfs.com/en-us/what-we-do/announcements.html or at mfs.com/vit2 by choosing the fund’s name.
INFORMATION ABOUT FUND CONTRACTS AND LEGAL CLAIMS
The fund has entered into contractual arrangements with an investment adviser, administrator, distributor, shareholder servicing agent, 529 program manager (if applicable), and custodian who each provide services to the fund. Unless expressly stated otherwise, shareholders are not parties to, or intended beneficiaries of these contractual arrangements, and these contractual arrangements are not intended to create any shareholder right to enforce them against the service providers or to seek any remedy under them against the service providers, either directly or on behalf of the fund.
Under the Trust’s By-Laws and Declaration of Trust, any claims asserted against or on behalf of the MFS Funds, including claims against Trustees and Officers, must be brought in state and federal courts located within the Commonwealth of Massachusetts.
20
Semiannual Report
June 30, 2018

MFS® Emerging Markets Equity Portfolio

MFS® Variable Insurance Trust II
FCE-SEM
MFS® Emerging Markets Equity Portfolio
CONTENTS
The report is prepared for the general information of contract owners. It is authorized for distribution to prospective investors only when preceded or accompanied by a current prospectus.
NOT FDIC INSURED • MAY LOSE VALUE • NO BANK OR CREDIT UNION GUARANTEE • NOT A DEPOSIT • NOT INSURED BY ANY FEDERAL GOVERNMENT AGENCY OR NCUA/NCUSIF
MFS Emerging Markets Equity Portfolio
LETTER FROM THE EXECUTIVE CHAIRMAN

Dear Contract Owners:
Rising bond yields, international trade friction and geopolitical uncertainty have contributed to a measurable uptick in market volatility — a departure from the low-volatility environment that prevailed for much of 2017. In recent months, against this more challenging backdrop, global markets have given back some of the strong gains recorded during 2017 and early 2018. But global economic growth remains healthy, notwithstanding signs of a modest slowdown over the past few months, particularly in Europe and China.
Although the U.S. Federal Reserve continues to gradually raise interest rates and shrink its balance sheet, monetary policy remains accommodative around the world, with many central banks taking only tentative steps toward tighter policies. Newly enacted U.S. tax reforms have been welcomed by equity markets, while emerging market economies have recently had to contend with tighter financial conditions as a result of firmer U.S. Treasury yields and a stronger dollar. Around the world, inflation remains largely subdued, but tight labor markets and solid global demand have investors on the lookout for its potential resurgence. Increased U.S. protectionism is also a growing concern, as investors fear that trade disputes could dampen business sentiment, leading to slower global growth.
As a global investment manager, MFS® strives to create long-term value for clients through an active approach and an investment platform built on nearly a century of expertise. To make that long-term value meaningful for clients, we work to align with you on our beliefs, your needs and the time it takes to deliver on your desired outcomes.
Respectfully,

Robert J. Manning
Executive Chairman
MFS Investment Management
August 16, 2018
The opinions expressed in this letter are subject to change and may not be relied upon for investment advice. No forecasts can be guaranteed.
1
MFS Emerging Markets Equity Portfolio
PORTFOLIO COMPOSITION
Portfolio structure
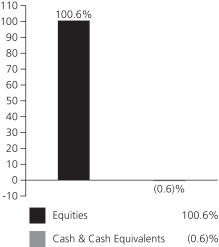
| | | | |
| Top ten holdings | | | | |
| Alibaba Group Holding Ltd., ADR | | | 5.3% | |
| Samsung Electronics Co. Ltd. | | | 4.6% | |
| Taiwan Semiconductor Manufacturing Co. Ltd. | | | 4.6% | |
| Tencent Holdings Ltd. | | | 3.7% | |
| Baidu, Inc., ADR | | | 3.3% | |
| Housing Development Finance Corp. Ltd. | | | 3.0% | |
| Yum China Holdings, Inc. | | | 2.8% | |
| China Construction Bank | | | 2.3% | |
| China Resources Beer Holdings Co. Ltd. | | | 2.2% | |
| AIA Group Ltd. | | | 2.1% | |
| | | | |
| Equity sectors | | | | |
| Technology | | | 27.9% | |
| Financial Services | | | 24.3% | |
| Consumer Staples | | | 9.8% | |
| Special Products & Services | | | 7.9% | |
| Leisure | | | 6.4% | |
| Autos & Housing | | | 5.6% | |
| Energy | | | 4.2% | |
| Basic Materials | | | 4.2% | |
| Retailing | | | 3.5% | |
| Industrial Goods & Services | | | 2.3% | |
| Utilities & Communications | | | 2.1% | |
| Transportation | | | 1.9% | |
| Health Care | | | 0.5% | |
| |
| Issuer country weightings (x) | | | | |
| China | | | 26.5% | |
| South Korea | | | 12.1% | |
| India | | | 9.2% | |
| Taiwan | | | 7.4% | |
| Brazil | | | 7.3% | |
| Hong Kong | | | 6.5% | |
| South Africa | | | 4.4% | |
| Mexico | | | 3.8% | |
| Indonesia | | | 3.6% | |
| Other Countries | | | 19.2% | |
| |
| Currency exposure weightings (y) | | | | |
| Hong Kong Dollar | | | 17.0% | |
| Chinese Renminbi | | | 12.3% | |
| South Korean Won | | | 12.1% | |
| United States Dollar | | | 8.4% | |
| Indian Rupee | | | 7.9% | |
| Taiwan Dollar | | | 7.4% | |
| Brazilian Real | | | 7.3% | |
| Mexican Peso | | | 3.8% | |
| Indonesian Rupiah | | | 3.6% | |
| Other Currencies | | | 20.2% | |
| (x) | Represents the portfolio’s exposure to issuer countries as a percentage of a portfolio’s net assets. |
| (y) | Represents the portfolio’s exposure to a particular currency as a percentage of a portfolio’s net assets. For purposes of this presentation, United States Dollar includes Cash & Cash Equivalents. |
Cash & Cash Equivalents includes any cash, investments in money market funds, short-term securities, and other assets less liabilities. Please see the Statement of Assets and Liabilities for additional information related to the fund’s cash position and other assets and liabilities.
From time to time Cash & Cash Equivalents may be negative due to timing of cash receipts and disbursements.
Percentages are based on net assets as of June 30, 2018.
The portfolio is actively managed and current holdings may be different.
2
MFS Emerging Markets Equity Portfolio
EXPENSE TABLE
Fund Expenses Borne by the Contract Holders during the Period,
January 1, 2018 through June 30, 2018
As a contract holder of the fund, you incur ongoing costs, including management fees; distribution and/or service (12b-1) fees; and other fund expenses. This example is intended to help you understand your ongoing costs (in dollars) of investing in the fund and to compare these costs with the ongoing costs of investing in other mutual funds.
The example is based on an investment of $1,000 invested at the beginning of the period and held for the entire period January 1, 2018 through June 30, 2018.
Actual Expenses
The first line for each share class in the following table provides information about actual account values and actual expenses. You may use the information in this line, together with the amount you invested, to estimate the expenses that you paid over the period. Simply divide your account value by $1,000 (for example, an $8,600 account value divided by $1,000 = 8.6), then multiply the result by the number in the first line under the heading entitled “Expenses Paid During Period” to estimate the expenses you paid on your account during this period.
Hypothetical Example for Comparison Purposes
The second line for each share class in the following table provides information about hypothetical account values and hypothetical expenses based on the fund’s actual expense ratio and an assumed rate of return of 5% per year before expenses, which is not the fund’s actual return. The hypothetical account values and expenses may not be used to estimate the actual ending account balance or expenses you paid for the period. You may use this information to compare the ongoing costs of investing in the fund and other funds. To do so, compare this 5% hypothetical example with the 5% hypothetical examples that appear in the shareholder reports of the other funds.
Please note that the expenses shown in the table are meant to highlight the fund’s ongoing costs only and do not take into account the fees and expenses imposed under the variable contracts through which your investment in the fund is made. Therefore, the second line for each share class in the table is useful in comparing ongoing costs associated with an investment in vehicles (such as the fund) which fund benefits under variable annuity and variable life insurance contracts and to qualified pension and retirement plans only, and will not help you determine the relative total costs of investing in the fund through variable annuity and variable life insurance contracts. If the fees and expenses imposed under the variable contracts were included, your costs would have been higher.
| | | | | | | | | | | | | | | | | | |
| Share Class | | | | Annualized
Expense Ratio | | | Beginning
Account Value
1/01/18 | | | Ending
Account Value
6/30/18 | | | Expenses Paid
During Period (p)
1/01/18-6/30/18 | |
| Initial Class | | Actual | | | 1.40% | | | | $1,000.00 | | | | $968.61 | | | | $6.83 | |
| | Hypothetical (h) | | | 1.40% | | | | $1,000.00 | | | | $1,017.85 | | | | $7.00 | |
| Service Class | | Actual | | | 1.65% | | | | $1,000.00 | | | | $967.53 | | | | $8.05 | |
| | Hypothetical (h) | | | 1.65% | | | | $1,000.00 | | | | $1,016.61 | | | | $8.25 | |
| (h) | 5% class return per year before expenses. |
| (p) | “Expenses Paid During Period” are equal to each class’s annualized expense ratio, as shown above, multiplied by the average account value over the period, multiplied by 181/365 (to reflect the one-half year period). |
Notes to Expense Table
Changes to the fund’s fee arrangements will occur during the fund’s current fiscal year. Had these fee changes been in effect during the six month period, the annualized expense ratios, the actual expenses paid during the period, and the hypothetical expenses paid during the period would have been approximately 1.33%, $6.49, and $6.66 for Initial Class and 1.58%, $7.71, and $7.90 for Service Class, respectively. For further information about the fund’s fee arrangements and changes to those fee arrangements, please see Note 3 in the Notes to Financial Statements.
3
MFS Emerging Markets Equity Portfolio
PORTFOLIO OF INVESTMENTS – 6/30/18 (unaudited)
The Portfolio of Investments is a complete list of all securities owned by your fund. It is categorized by broad-based asset classes.
| | | | | | | | |
| Issuer | | Shares/Par | | | Value ($) | |
| COMMON STOCKS – 100.6% | | | | | | | | |
| Airlines – 0.9% | | | | | | | | |
| Grupo Aeroportuario del Sureste S.A. de C.V., ADR | | | 3,165 | | | $ | 503,741 | |
| | | | | | | | |
| Alcoholic Beverages – 3.0% | | | | | | | | |
| AmBev S.A., ADR | | | 93,048 | | | $ | 430,812 | |
| China Resources Beer Holdings Co. Ltd. | | | 240,000 | | | | 1,165,494 | |
| | | | | | | | |
| | | | | | $ | 1,596,306 | |
| | | | | | | | |
| Apparel Manufacturers – 0.5% | | | | | | | | |
| Stella International Holdings | | | 228,000 | | | $ | 282,472 | |
| | | | | | | | |
| Automotive – 2.5% | | | | | | | | |
| Kia Motors Corp. | | | 9,556 | | | $ | 264,516 | |
| Mahindra & Mahindra Ltd. | | | 53,509 | | | | 701,088 | |
| PT Astra International Tbk | | | 810,000 | | | | 373,063 | |
| | | | | | | | |
| | | | | | $ | 1,338,667 | |
| | | | | | | | |
| Business Services – 1.8% | | | | | | | | |
| Cognizant Technology Solutions Corp., “A” | | | 12,206 | | | $ | 964,152 | |
| | | | | | | | |
| Cable TV – 1.9% | | | | | | | | |
| Naspers Ltd. | | | 3,975 | | | $ | 1,009,869 | |
| | | | | | | | |
| Computer Software – Systems – 2.1% | | | | | | | | |
| Globant S.A. (a) | | | 4,587 | | | $ | 260,496 | |
| Linx S.A. | | | 67,800 | | | | 309,633 | |
| Luxoft Holding, Inc. (a) | | | 15,381 | | | | 566,790 | |
| | | | | | | | |
| | | | | | $ | 1,136,919 | |
| | | | | | | | |
| Construction – 1.6% | | | | | | | | |
| PT Indocement Tunggal Prakarsa Tbk | | | 433,600 | | | $ | 413,024 | |
| Techtronic Industries Co. Ltd. | | | 81,500 | | | | 454,475 | |
| | | | | | | | |
| | | | | | $ | 867,499 | |
| | | | | | | | |
| Consumer Products – 1.0% | | | | | | | | |
| Dabur India Ltd. | | | 95,151 | | | $ | 543,631 | |
| | | | | | | | |
| Consumer Services – 6.1% | | | | | | | | |
| 51job, Inc., ADR (a) | | | 6,422 | | | $ | 627,044 | |
| Ctrip.com International Ltd., ADR (a) | | | 22,571 | | | | 1,075,057 | |
| Kroton Educacional S.A. | | | 159,800 | | | | 384,270 | |
| MakeMyTrip Ltd. (a)(l) | | | 19,254 | | | | 696,032 | |
| SEEK Ltd. | | | 31,611 | | | | 510,217 | |
| | | | | | | | |
| | | | | | $ | 3,292,620 | |
| | | | | | | | |
| Containers – 0.5% | | | | | | | | |
| Lock & Lock Co. Ltd. | | | 13,365 | | | $ | 266,221 | |
| | | | | | | | |
| Electrical Equipment – 2.3% | | | | | | | | |
| Bharat Heavy Electricals Ltd. | | | 397,360 | | | $ | 416,122 | |
| LS Industrial Systems Co. Ltd. | | | 12,790 | | | | 809,058 | |
| | | | | | | | |
| | | | | | $ | 1,225,180 | |
| | | | | | | | |
| | | | | | | | |
| Issuer | | Shares/Par | | | Value ($) | |
| COMMON STOCKS – continued | |
| Electronics – 10.8% | | | | | | | | |
| Samsung Electronics Co. Ltd. | | | 59,320 | | | $ | 2,482,977 | |
| Silicon Motion Technology Corp., ADR | | | 15,500 | | | | 819,795 | |
| Taiwan Semiconductor Manufacturing Co. Ltd. | | | 348,258 | | | | 2,472,993 | |
| | | | | | | | |
| | | | | | $ | 5,775,765 | |
| | | | | | | | |
| Energy – Independent – 1.3% | | | | | | | | |
| Gran Tierra Energy, Inc. (a) | | | 147,104 | | | $ | 509,126 | |
| Ultrapar Participacoes S.A. | | | 17,003 | | | | 201,584 | |
| | | | | | | | |
| | | | | | $ | 710,710 | |
| | | | | | | | |
| Energy – Integrated – 2.3% | | | | | | | | |
| LUKOIL PJSC, ADR | | | 15,951 | | | $ | 1,088,690 | |
| Petroleo Brasileiro S.A., ADR | | | 14,209 | | | | 142,516 | |
| | | | | | | | |
| | | | | | $ | 1,231,206 | |
| | | | | | | | |
| Food & Beverages – 5.3% | | | | | | | | |
| AVI Ltd. | | | 97,856 | | | $ | 771,862 | |
| BRF S.A. (a) | | | 43,754 | | | | 203,205 | |
| Orion Corp. | | | 6,341 | | | | 847,743 | |
| Tingyi (Cayman Islands) Holding Corp. | | | 438,000 | | | | 1,016,060 | |
| | | | | | | | |
| | | | | | $ | 2,838,870 | |
| | | | | | | | |
| Food & Drug Stores – 0.9% | | | | | | | | |
| Dairy Farm International Holdings Ltd. | | | 54,100 | | | $ | 475,539 | |
| | | | | | | | |
| Forest & Paper Products – 1.2% | | | | | | | | |
| Fibria Celulose S.A. | | | 13,336 | | | $ | 249,705 | |
| Suzano Papel e Celulose | | | 31,900 | | | | 370,133 | |
| | | | | | | | |
| | | | | | $ | 619,838 | |
| | | | | | | | |
| Furniture & Appliances – 1.4% | | | | | | | | |
| Coway Co. Ltd. | | | 9,959 | | | $ | 773,844 | |
| | | | | | | | |
| Gaming & Lodging – 1.3% | | | | | | | | |
| Genting Berhad | | | 330,700 | | | $ | 688,498 | |
| | | | | | | | |
| General Merchandise – 0.4% | | | | | | | | |
| S.A.C.I. Falabella | | | 25,522 | | | $ | 234,121 | |
| | | | | | | | |
| Insurance – 2.5% | | | | | | | | |
| AIA Group Ltd. | | | 126,000 | | | $ | 1,101,713 | |
| Samsung Fire & Marine Insurance Co. Ltd. | | | 1,037 | | | | 245,642 | |
| | | | | | | | |
| | | | | | $ | 1,347,355 | |
| | | | | | | | |
| Internet – 13.8% | | | | | | | | |
| Alibaba Group Holding Ltd., ADR (a) | | | 15,348 | | | $ | 2,847,515 | |
| Baidu, Inc., ADR (a) | | | 7,216 | | | | 1,753,488 | |
| NAVER Corp. | | | 1,193 | | | | 816,742 | |
| Tencent Holdings Ltd. | | | 39,900 | | | | 2,002,730 | |
| | | | | | | | |
| | | | | | $ | 7,420,475 | |
| | | | | | | | |
| Major Banks – 5.9% | | | | | | | | |
| Banco Bradesco S.A., ADR | | | 125,008 | | | $ | 857,555 | |
| Barclays Africa Group Ltd. | | | 34,259 | | | | 399,570 | |
4
MFS Emerging Markets Equity Portfolio
Portfolio of Investments (unaudited) – continued
| | | | | | | | |
| Issuer | | Shares/Par | | | Value ($) | |
| COMMON STOCKS – continued | |
| Major Banks – continued | | | | | | | | |
| China Construction Bank | | | 1,315,670 | | | $ | 1,215,791 | |
| Industrial & Commercial Bank of China, “H” | | | 913,000 | | | | 683,097 | |
| | | | | | | | |
| | | | | | $ | 3,156,013 | |
| | | | | | | | |
| Metals & Mining – 1.4% | | | | | | | | |
| Vale S.A., ADR | | | 58,748 | | | $ | 753,149 | |
| | | | | | | | |
| Network & Telecom – 1.2% | | | | | | | | |
| VTech Holdings Ltd. | | | 55,500 | | | $ | 640,553 | |
| | | | | | | | |
| Oil Services – 0.6% | | | | | | | | |
| Lamprell PLC (a) | | | 262,440 | | | $ | 326,959 | |
| | | | | | | | |
| Other Banks & Diversified Financials – 14.3% | | | | | |
| Credicorp Ltd. | | | 1,504 | | | $ | 338,580 | |
| E.Sun Financial Holding Co. Ltd. | | | 943,045 | | | | 657,287 | |
| Grupo Financiero Banorte S.A. de C.V. | | | 67,298 | | | | 396,701 | |
| Grupo Financiero Inbursa S.A. de C.V. | | | 313,748 | | | | 439,178 | |
| Housing Development Finance Corp. Ltd. | | | 57,163 | | | | 1,591,954 | |
| Kasikornbank Co. Ltd. | | | 111,600 | | | | 673,710 | |
| Komercni Banka A.S. | | | 14,847 | | | | 624,759 | |
| Metropolitan Bank & Trust Co. | | | 481,726 | | | | 662,551 | |
| PT Bank Central Asia Tbk | | | 212,300 | | | | 318,154 | |
| Public Bank Berhad | | | 97,400 | | | | 563,254 | |
| Sberbank of Russia | | | 151,355 | | | | 525,394 | |
| Shriram Transport Finance Co. Ltd. | | | 33,188 | | | | 629,441 | |
| Union National Bank | | | 262,695 | | | | 266,046 | |
| | | | | | | | |
| | | | | | $ | 7,687,009 | |
| | | | | | | | |
| Pharmaceuticals – 0.6% | | | | | | | | |
| Genomma Lab Internacional S.A., “B” (a) | | | 349,579 | | | $ | 292,016 | |
| | | | | | | | |
| Railroad & Shipping – 0.6% | | | | | | | | |
| GMexico Transportes S.A.B. de C.V | | | 224,100 | | | $ | 327,119 | |
| | | | | | | | |
| Real Estate – 1.6% | | | | | | | | |
| Aldar Properties PJSC | | | 385,202 | | | $ | 211,837 | |
| Concentradora Fibra Hotelera Mexicana S.A. de C.V., REIT | | | 178,881 | | | | 103,850 | |
| Hang Lung Properties Ltd. | | | 260,000 | | | | 536,199 | |
| | | | | | | | |
| | | | | | $ | 851,886 | |
| | | | | | | | |
| Restaurants – 3.3% | | | | | | | | |
| Jollibee Foods Corp. | | | 46,800 | | | $ | 230,635 | |
| Yum China Holdings, Inc. | | | 39,678 | | | | 1,526,016 | |
| | | | | | | | |
| | | | | | $ | 1,756,651 | |
| | | | | | | | |
| Specialty Chemicals – 1.1% | | | | | | | | |
| Astra Argo Lestari | | | 280,200 | | | $ | 218,998 | |
| PTT Global Chemical PLC | | | 176,600 | | | | 383,797 | |
| | | | | | | | |
| | | | | | $ | 602,795 | |
| | | | | | | | |
| Specialty Stores – 1.6% | | | | | | | | |
| Dufry AG | | | 4,517 | | | $ | 575,757 | |
| JD.com, Inc., ADR (a) | | | 7,626 | | | | 297,033 | |
| | | | | | | | |
| | | | | | $ | 872,790 | |
| | | | | | | | |
| | | | | | | | |
| Issuer | | Shares/Par | | | Value ($) | |
| COMMON STOCKS – continued | |
| Telecommunications – Wireless – 0.4% | | | | | |
| Mobile TeleSystems PJSC, ADR | | | 21,828 | | | $ | 192,741 | |
| | | | | | | | |
| Telephone Services – 1.0% | | | | | | | | |
Hellenic Telecommunications
Organization S.A. | | | 18,374 | | | $ | 227,446 | |
| PT XL Axiata Tbk (a) | | | 1,891,800 | | | | 332,682 | |
| | | | | | | | |
| | | | | | $ | 560,128 | |
| | | | | | | | |
| Tobacco – 0.5% | | | | | | | | |
| PT Hanjaya Mandala Sampoerna Tbk | | | 1,098,550 | | | $ | 274,446 | |
| | | | | | | | |
| Trucking – 0.4% | | | | | | | | |
| Emergent Capital, Inc. | | | 13,002 | | | $ | 185,672 | |
| | | | | | | | |
| Utilities – Electric Power – 0.7% | | | | | | | | |
| CESC Ltd. | | | 28,136 | | | $ | 374,537 | |
| | | | | | | | |
Total Common Stocks
(Identified Cost, $38,984,226) | | | | | | $ | 53,997,962 | |
| | | | | | | | |
| |
| INVESTMENT COMPANIES (h) – 0.0% | | | | | |
| Money Market Funds – 0.0% | | | | | | | | |
| MFS Institutional Money Market Portfolio, 1.9% (v) (Identified Cost, $931) | | | 931 | | | $ | 931 | |
| | | | | | | | |
OTHER ASSETS, LESS
LIABILITIES – (0.6)% | | | | | | | (336,527 | ) |
| | | | | | | | |
| NET ASSETS – 100.0% | | | | | | $ | 53,662,366 | |
| | | | | | | | |
| (a) | | Non-income producing security. |
| (h) | | An affiliated issuer, which may be considered one in which the fund owns 5% or more of the outstanding voting securities, or a company which is under common control. At period end, the aggregate values of the fund’s investments in affiliated issuers and in unaffiliated issuers were $931 and $53,997,962, respectively. |
| (l) | | A portion of this security is on loan. |
| (v) | | Affiliated issuer that is available only to investment companies managed by MFS. The rate quoted for the MFS Institutional Money Market Portfolio is the annualized seven-day yield of the fund at period end. |
The following abbreviations are used in this report and are defined:
| ADR | | American Depositary Receipt |
| PJSC | | Public Joint Stock Company |
| PLC | | Public Limited Company |
| REIT | | Real Estate Investment Trust |
See Notes to Financial Statements
5
MFS Emerging Markets Equity Portfolio
FINANCIAL STATEMENTS | STATEMENT OF ASSETS AND LIABILITIES (unaudited)
This statement represents your fund’s balance sheet, which details the assets and liabilities comprising the total value of the fund.
| | | | |
At 6/30/18 | | | | |
Assets | | | | |
Investments in unaffiliated issuers, at value, including $54,225 of securities on loan (identified cost, $38,984,226) | | | $53,997,962 | |
Investments in affiliated issuers, at value (identified cost, $931) | | | 931 | |
Receivables for | | | | |
Investments sold | | | 82,087 | |
Fund shares sold | | | 983 | |
Interest and dividends | | | 134,588 | |
Other assets | | | 38,180 | |
Total assets | | | $54,254,731 | |
Liabilities | | | | |
Payable to custodian | | | $147,572 | |
Payables for | | | | |
Investments purchased | | | 33,052 | |
Fund shares reacquired | | | 246,587 | |
Payable to affiliates | | | | |
Investment adviser | | | 4,542 | |
Shareholder servicing costs | | | 33 | |
Distribution and/or service fees | | | 572 | |
Payable for independent Trustees’ compensation | | | 100 | |
Deferred country tax expense payable | | | 59,642 | |
Accrued expenses and other liabilities | | | 100,265 | |
Total liabilities | | | $592,365 | |
Net assets | | | $53,662,366 | |
Net assets consist of | | | | |
Paid-in capital | | | $38,094,720 | |
Unrealized appreciation (depreciation) (net of $39,085 deferred country tax) | | | 14,974,151 | |
Accumulated net realized gain (loss) | | | 344,072 | |
Undistributed net investment income | | | 249,423 | |
Net assets | | | $53,662,366 | |
Shares of beneficial interest outstanding | | | 3,250,491 | |
| | | | | | | | | | | | |
| | | Net assets | | | Shares
outstanding | | | Net asset value
per share | |
Initial Class | | | $25,446,032 | | | | 1,528,088 | | | | $16.65 | |
Service Class | | | 28,216,334 | | | | 1,722,403 | | | | 16.38 | |
See Notes to Financial Statements
6
MFS Emerging Markets Equity Portfolio
FINANCIAL STATEMENTS | STATEMENT OF OPERATIONS (unaudited)
This statement describes how much your fund earned in investment income and accrued in expenses. It also describes any gains and/or losses generated by fund operations.
| | | | |
| Six months ended 6/30/18 | | | | |
Net investment income (loss) | | | | |
Income | | | | |
Dividends | | | $642,062 | |
Dividends from affiliated issuers | | | 6,131 | |
Other | | | 2,505 | |
Income on securities loaned | | | 526 | |
Foreign taxes withheld | | | (74,926 | ) |
Total investment income | | | $576,298 | |
Expenses | | | | |
Management fee | | | $301,512 | |
Distribution and/or service fees | | | 37,315 | |
Shareholder servicing costs | | | 3,317 | |
Administrative services fee | | | 9,264 | |
Independent Trustees’ compensation | | | 1,291 | |
Custodian fee | | | 44,537 | |
Shareholder communications | | | 6,038 | |
Audit and tax fees | | | 38,012 | |
Legal fees | | | 312 | |
Miscellaneous | | | 6,286 | |
Total expenses | | | $447,884 | |
Reduction of expenses by investment adviser | | | (8,455 | ) |
Net expenses | | | $439,429 | |
Net investment income (loss) | | | $136,869 | |
Realized and unrealized gain (loss) | | | | |
Realized gain (loss) (identified cost basis) | | | | |
Unaffiliated issuers (net of $2,430 country tax) | | | $2,419,330 | |
Affiliated issuers | | | 14 | |
Foreign currency | | | (13,830 | ) |
Net realized gain (loss) | | | $2,405,514 | |
Change in unrealized appreciation or depreciation | | | | |
Unaffiliated issuers (net of $42,177 decrease in deferred country tax) | | | $(4,237,979 | ) |
Translation of assets and liabilities in foreign currencies | | | (425 | ) |
Net unrealized gain (loss) | | | $(4,238,404 | ) |
Net realized and unrealized gain (loss) | | | $(1,832,890 | ) |
Change in net assets from operations | | | $(1,696,021 | ) |
See Notes to Financial Statements
7
MFS Emerging Markets Equity Portfolio
FINANCIAL STATEMENTS | STATEMENTS OF CHANGES IN NET ASSETS
These statements describe the increases and/or decreases in net assets resulting from operations, any distributions, and any shareholder transactions.
| | | | | | | | |
| | | Six months ended
6/30/18 | | | Year ended
12/31/17 | |
| | | (unaudited) | | | | |
Change in net assets | | | | | | | | |
From operations | | | | | | | | |
Net investment income (loss) | | | $136,869 | | | | $150,338 | |
Net realized gain (loss) | | | 2,405,514 | | | | 2,939,088 | |
Net unrealized gain (loss) | | | (4,238,404 | ) | | | 13,593,419 | |
Change in net assets from operations | | | $(1,696,021 | ) | | | $16,682,845 | |
Distributions declared to shareholders | | | | | | | | |
From net investment income | | | $— | | | | $(514,014 | ) |
Change in net assets from fund share transactions | | | $(2,332,777 | ) | | | $(5,389,683 | ) |
Total change in net assets | | | $(4,028,798 | ) | | | $10,779,148 | |
Net assets | | | | | | | | |
At beginning of period | | | 57,691,164 | | | | 46,912,016 | |
At end of period (including undistributed net investment income of $249,423 and
$112,554, respectively) | | | $53,662,366 | | | | $57,691,164 | |
See Notes to Financial Statements
8
MFS Emerging Markets Equity Portfolio
FINANCIAL STATEMENTS | FINANCIAL HIGHLIGHTS
The financial highlights table is intended to help you understand the fund’s financial performance for the semiannual period and the past 5 fiscal years. Certain information reflects financial results for a single fund share. The total returns in the table represent the rate that an investor would have earned (or lost) on an investment in the fund share class (assuming reinvestment of all distributions) held for the entire period.
| | | | | | | | | | | | | | | | | | | | | | | | |
| Initial Class | | Six months
ended 6/30/18 | | | Year ended | |
| | | 12/31/17 | | | 12/31/16 | | | 12/31/15 | | | 12/31/14 | | | 12/31/13 | |
| | | (unaudited) | | | | | | | | | | | | | | | | |
Net asset value, beginning of period | | | $17.19 | | | | $12.59 | | | | $11.59 | | | | $13.46 | | | | $14.51 | | | | $15.56 | |
| Income (loss) from investment operations | | | | | | | | | | | | | | | | | | | | | | | | |
Net investment income (loss) (d) | | | $0.05 | | | | $0.06 | | | | $0.15 | (c) | | | $0.10 | | | | $0.13 | | | | $0.12 | |
Net realized and unrealized gain (loss) | | | (0.59 | ) | | | 4.71 | | | | 0.93 | | | | (1.84 | ) | | | (1.08 | ) | | | (0.93 | ) |
Total from investment operations | | | $(0.54 | ) | | | $4.77 | | | | $1.08 | | | | $(1.74 | ) | | | $(0.95 | ) | | | $(0.81 | ) |
| Less distributions declared to shareholders | | | | | | | | | | | | | | | | | | | | | | | | |
From net investment income | | | $— | | | | $(0.17 | ) | | | $(0.08 | ) | | | $(0.13 | ) | | | $(0.10 | ) | | | $(0.24 | ) |
Net asset value, end of period (x) | | | $16.65 | | | | $17.19 | | | | $12.59 | | | | $11.59 | | | | $13.46 | | | | $14.51 | |
Total return (%) (k)(r)(s)(x) | | | (3.14 | )(n) | | | 37.98 | | | | 9.28 | (c) | | | (12.89 | ) | | | (6.66 | ) | | | (5.09 | ) |
Ratios (%) (to average net assets)
and Supplemental data: | | | | | | | | | | | | | | | | | | | | | | | | |
Expenses before expense reductions (f) | | | 1.43 | (a) | | | 1.53 | | | | 1.34 | (c) | | | 1.65 | | | | 1.48 | | | | 1.46 | |
Expenses after expense reductions (f) | | | 1.40 | (a) | | | 1.40 | | | | 1.13 | (c) | | | 1.40 | | | | 1.40 | | | | 1.40 | |
Net investment income (loss) | | | 0.61 | (a) | | | 0.41 | | | | 1.29 | (c) | | | 0.74 | | | | 0.89 | | | | 0.78 | |
Portfolio turnover | | | 15 | (n) | | | 27 | | | | 47 | | | | 51 | | | | 49 | | | | 36 | |
Net assets at end of period (000 omitted) | | | $25,446 | | | | $28,026 | | | | $22,605 | | | | $25,665 | | | | $33,752 | | | | $45,293 | |
| | |
| Service Class | | Six months
ended 6/30/18 | | | Year ended | |
| | | 12/31/17 | | | 12/31/16 | | | 12/31/15 | | | 12/31/14 | | | 12/31/13 | |
| | | (unaudited) | | | | | | | | | | | | | | | | |
Net asset value, beginning of period | | | $16.94 | | | | $12.41 | | | | $11.42 | | | | $13.24 | | | | $14.29 | | | | $15.32 | |
| Income (loss) from investment operations | | | | | | | | | | | | | | | | | | | | | | | | |
Net investment income (loss) (d) | | | $0.03 | | | | $0.02 | | | | $0.12 | (c) | | | $0.06 | | | | $0.10 | | | | $0.08 | |
Net realized and unrealized gain (loss) | | | (0.59 | ) | | | 4.64 | | | | 0.91 | | | | (1.80 | ) | | | (1.09 | ) | | | (0.90 | ) |
Total from investment operations | | | $(0.56 | ) | | | $4.66 | | | | $1.03 | | | | $(1.74 | ) | | | $(0.99 | ) | | | $(0.82 | ) |
| Less distributions declared to shareholders | | | | | | | | | | | | | | | | | | | | | | | | |
From net investment income | | | $— | | | | $(0.13 | ) | | | $(0.04 | ) | | | $(0.08 | ) | | | $(0.06 | ) | | | $(0.21 | ) |
Net asset value, end of period (x) | | | $16.38 | | | | $16.94 | | | | $12.41 | | | | $11.42 | | | | $13.24 | | | | $14.29 | |
Total return (%) (k)(r)(s)(x) | | | (3.31 | )(n) | | | 37.66 | | | | 9.04 | (c) | | | (13.08 | ) | | | (6.99 | ) | | | (5.28 | ) |
Ratios (%) (to average net assets)
and Supplemental data: | | | | | | | | | | | | | | | | | | | | | | | | |
Expenses before expense reductions (f) | | | 1.68 | (a) | | | 1.78 | | | | 1.58 | (c) | | | 1.90 | | | | 1.73 | | | | 1.71 | |
Expenses after expense reductions (f) | | | 1.65 | (a) | | | 1.65 | | | | 1.37 | (c) | | | 1.65 | | | | 1.65 | | | | 1.65 | |
Net investment income (loss) | | | 0.36 | (a) | | | 0.16 | | | | 1.02 | (c) | | | 0.46 | | | | 0.70 | | | | 0.56 | |
Portfolio turnover | | | 15 | (n) | | | 27 | | | | 47 | | | | 51 | | | | 49 | | | | 36 | |
Net assets at end of period (000 omitted) | | | $28,216 | | | | $29,665 | | | | $24,307 | | | | $25,678 | | | | $31,419 | | | | $39,617 | |
See Notes to Financial Statements
9
MFS Emerging Markets Equity Portfolio
Financial Highlights – continued
| (c) | Amount reflects a one-time reimbursement of expenses by the custodian (or former custodian) without which net investment income and performance would be lower and expenses would be higher. |
| (d) | Per share data is based on average shares outstanding. |
| (f) | Ratios do not reflect reductions from fees paid indirectly, if applicable. |
| (k) | The total return does not reflect expenses that apply to separate accounts. Inclusion of these charges would reduce the total return figures for all periods shown. |
| (r) | Certain expenses have been reduced without which performance would have been lower. |
| (s) | From time to time the fund may receive proceeds from litigation settlements, without which performance would be lower. |
| (x) | The net asset values and total returns have been calculated on net assets which include adjustments made in accordance with U.S. generally accepted accounting principles required at period end for financial reporting purposes. |
See Notes to Financial Statements
10
MFS Emerging Markets Equity Portfolio
NOTES TO FINANCIAL STATEMENTS (unaudited)
| (1) | | Business and Organization |
MFS Emerging Markets Equity Portfolio (the fund) is a diversified series of MFS Variable Insurance Trust II (the trust). The trust is organized as a Massachusetts business trust and is registered under the Investment Company Act of 1940, as amended, as an open-end management investment company. The shareholders of each series of the trust are separate accounts of insurance companies, which offer variable annuity and/or life insurance products, and qualified retirement and pension plans.
The fund is an investment company and accordingly follows the investment company accounting and reporting guidance of the Financial Accounting Standards Board (FASB) Accounting Standards Codification Topic 946 Financial Services – Investment Companies.
| (2) | | Significant Accounting Policies |
General – The preparation of financial statements in conformity with U.S. generally accepted accounting principles requires management to make estimates and assumptions that affect the reported amounts of assets and liabilities, and disclosure of contingent assets and liabilities at the date of the financial statements and the reported amounts of increases and decreases in net assets from operations during the reporting period. Actual results could differ from those estimates. In the preparation of these financial statements, management has evaluated subsequent events occurring after the date of the fund’s Statement of Assets and Liabilities through the date that the financial statements were issued. The fund invests in foreign securities, including securities of emerging market issuers. Investments in foreign securities are vulnerable to the effects of changes in the relative values of the local currency and the U.S. dollar and to the effects of changes in each country’s market, economic, industrial, political, regulatory, geopolitical, and other conditions. Investments in emerging markets can involve additional and greater risks than the risks associated with investments in developed foreign markets. Emerging markets can have less developed markets, greater custody and operational risk, less developed legal, regulatory, and accounting systems, and greater political, social, and economic instability than developed markets.
Balance Sheet Offsetting – The fund’s accounting policy with respect to balance sheet offsetting is that, absent an event of default by the counterparty or a termination of the agreement, the International Swaps and Derivatives Association (ISDA) Master Agreement, or similar agreement, does not result in an offset of reported amounts of financial assets and financial liabilities in the Statement of Assets and Liabilities across transactions between the fund and the applicable counterparty. The fund’s right to setoff may be restricted or prohibited by the bankruptcy or insolvency laws of the particular jurisdiction to which a specific master netting agreement counterparty is subject. Balance sheet offsetting disclosures, to the extent applicable to the fund, have been included in the fund’s Significant Accounting Policies note under the captions for each of the fund’s in-scope financial instruments and transactions.
Investment Valuations – Equity securities, including restricted equity securities, are generally valued at the last sale or official closing price on their primary market or exchange as provided by a third-party pricing service. Equity securities, for which there were no sales reported that day, are generally valued at the last quoted daily bid quotation on their primary market or exchange as provided by a third-party pricing service. Short-term instruments with a maturity at issuance of 60 days or less may be valued at amortized cost, which approximates market value. Open-end investment companies are generally valued at net asset value per share. Securities and other assets generally valued on the basis of information from a third-party pricing service may also be valued at a broker/dealer bid quotation. In determining values, third-party pricing services can utilize both transaction data and market information such as yield, quality, coupon rate, maturity, type of issue, trading characteristics, and other market data. The values of foreign securities and other assets and liabilities expressed in foreign currencies are converted to U.S. dollars using the mean of bid and asked prices for rates provided by a third-party pricing service.
The Board of Trustees has delegated primary responsibility for determining or causing to be determined the value of the fund’s investments (including any fair valuation) to the adviser pursuant to valuation policies and procedures approved by the Board. If the adviser determines that reliable market quotations are not readily available, investments are valued at fair value as determined in good faith by the adviser in accordance with such procedures under the oversight of the Board of Trustees. Under the fund’s valuation policies and procedures, market quotations are not considered to be readily available for most types of debt instruments and floating rate loans and many types of derivatives. These investments are generally valued at fair value based on information from third-party pricing services. In addition, investments may be valued at fair value if the adviser determines that an investment’s value has been materially affected by events occurring after the close of the exchange or market on which the investment is principally traded (such as foreign exchange or market) and prior to the determination of the fund’s net asset value, or after the halting of trading of a specific security where trading does not resume prior to the close of the exchange or market on which the security is principally traded. Events that occur on a frequent basis after foreign markets close (such as developments in foreign markets and significant movements in the U.S. markets) and prior to the determination of the fund’s net asset value may be deemed to have a material effect on the value of securities traded in foreign markets. Accordingly, the fund’s foreign equity securities may often be valued at fair value. The adviser generally relies on third-party pricing services or other information (such as the correlation with price movements of similar securities in the same or other markets; the type, cost and investment characteristics of the security; the
11
MFS Emerging Markets Equity Portfolio
Notes to Financial Statements (unaudited) – continued
business and financial condition of the issuer; and trading and other market data) to assist in determining whether to fair value and at what value to fair value an investment. The value of an investment for purposes of calculating the fund’s net asset value can differ depending on the source and method used to determine value. When fair valuation is used, the value of an investment used to determine the fund’s net asset value may differ from quoted or published prices for the same investment. There can be no assurance that the fund could obtain the fair value assigned to an investment if it were to sell the investment at the same time at which the fund determines its net asset value per share.
Various inputs are used in determining the value of the fund’s assets or liabilities. These inputs are categorized into three broad levels. In certain cases, the inputs used to measure fair value may fall into different levels of the fair value hierarchy. In such cases, an investment’s level within the fair value hierarchy is based on the lowest level of input that is significant to the fair value measurement. The fund’s assessment of the significance of a particular input to the fair value measurement in its entirety requires judgment, and considers factors specific to the investment. Level 1 includes unadjusted quoted prices in active markets for identical assets or liabilities. Level 2 includes other significant observable market-based inputs (including quoted prices for similar securities, interest rates, prepayment speed, and credit risk). Level 3 includes unobservable inputs, which may include the adviser’s own assumptions in determining the fair value of investments. The following is a summary of the levels used as of June 30, 2018 in valuing the fund’s assets or liabilities:
| | | | | | | | | | | | | | | | |
| Financial Instruments | | Level 1 | | | Level 2 | | | Level 3 | | | Total | |
| Equity Securities: | | | | | | | | | | | | | | | | |
China | | | $14,209,324 | | | | $— | | | | $— | | | | $14,209,324 | |
South Korea | | | 6,506,742 | | | | — | | | | — | | | | 6,506,742 | |
India | | | 4,952,805 | | | | — | | | | — | | | | 4,952,805 | |
Taiwan | | | 3,950,076 | | | | — | | | | — | | | | 3,950,076 | |
Brazil | | | 3,902,563 | | | | — | | | | — | | | | 3,902,563 | |
Hond Kong | | | 3,490,950 | | | | — | | | | — | | | | 3,490,950 | |
South Africa | | | 2,366,973 | | | | — | | | | — | | | | 2,366,973 | |
Mexico | | | 2,062,606 | | | | — | | | | — | | | | 2,062,606 | |
United States | | | 2,040,068 | | | | — | | | | — | | | | 2,040,068 | |
Other Countries | | | 8,326,014 | | | | 2,189,841 | | | | — | | | | 10,515,855 | |
| Mutual Funds | | | 931 | | | | — | | | | — | | | | 931 | |
| Total | | | $51,809,052 | | | | $2,189,841 | | | | $— | | | | $53,998,893 | |
For further information regarding security characteristics, see the Portfolio of Investments.
Of the level 2 investments presented above, equity investments amounting to $1,664,447 would have been considered level 1 investments at the beginning of the period. Of the level 1 investments presented above, equity investments amounting to $710,757 would have been considered level 2 investments at the beginning of the period. The primary reason for changes in the classifications between levels 1 and 2 occurs when foreign equity securities are fair valued using other observable market-based inputs in place of the closing exchange price due to events occurring after the close of the exchange or market on which the investment is principally traded. The fund’s foreign equity securities may often be valued using other observable market-based inputs. The fund’s policy is to recognize transfers between the levels as of the end of the period.
Foreign Currency Translation – Purchases and sales of foreign investments, income, and expenses are converted into U.S. dollars based upon currency exchange rates prevailing on the respective dates of such transactions or on the reporting date for foreign denominated receivables and payables. Gains and losses attributable to foreign currency exchange rates on sales of securities are recorded for financial statement purposes as net realized gains and losses on investments. Gains and losses attributable to foreign exchange rate movements on receivables, payables, income and expenses are recorded for financial statement purposes as foreign currency transaction gains and losses. That portion of both realized and unrealized gains and losses on investments that results from fluctuations in foreign currency exchange rates is not separately disclosed.
Security Loans – Under its Securities Lending Agency Agreement with the fund, State Street Bank and Trust Company (“State Street”), as lending agent, loans the securities of the fund to certain qualified institutions (the “Borrowers”) approved by the fund. Security loans can be terminated at the discretion of either the lending agent or the fund and the related securities must be returned within the earlier of the standard trade settlement period for such securities or within three business days. The loans are collateralized by cash and/or U.S. Treasury and federal agency obligations in an amount typically at least equal to the market value of the securities loaned. On loans collateralized by cash, the cash collateral is invested in a money market fund. The market value of the loaned securities is determined at the close of business of the fund and any additional required collateral is delivered to the fund on the next business day. State Street provides the fund with indemnification against Borrower default. In the event of Borrower default, State Street will, for the benefit of the fund, either purchase securities identical to those loaned or, when such purchase is commercially impracticable, pay the fund the market value of the loaned securities. In return, State Street assumes the fund’s rights
12
MFS Emerging Markets Equity Portfolio
Notes to Financial Statements (unaudited) – continued
to the related collateral. If the collateral value is less than the cost to purchase identical securities, State Street is responsible for the shortfall, but only to the extent that such shortfall is not due to a decline in collateral value resulting from collateral reinvestment for which the fund bears the risk of loss. At period end, the fund had investment securities on loan, all of which were classified as equity securities in the fund’s Portfolio of Investments, with a fair value of $54,225. The fair value of the fund’s investment securities on loan is presented gross in the Statement of Assets and Liabilities. These loans were collateralized by U.S. Treasury Obligations of $53,488. The value of the fund’s securities on loan net of the related collateral is $737 at period end. A portion of the income generated upon investment of the collateral is remitted to the Borrowers, and the remainder is allocated between the fund and the lending agent. On loans collateralized by U.S. Treasury and/or federal agency obligations, a fee is received from the Borrower, and is allocated between the fund and the lending agent. Income from securities lending is separately reported in the Statement of Operations. The dividend and interest income earned on the securities loaned is accounted for in the same manner as other dividend and interest income.
Indemnifications – Under the fund’s organizational documents, its officers and Trustees may be indemnified against certain liabilities and expenses arising out of the performance of their duties to the fund. Additionally, in the normal course of business, the fund enters into agreements with service providers that may contain indemnification clauses. The fund’s maximum exposure under these agreements is unknown as this would involve future claims that may be made against the fund that have not yet occurred.
Investment Transactions and Income – Investment transactions are recorded on the trade date. Interest income is recorded on the accrual basis. Dividends received in cash are recorded on the ex-dividend date. Certain dividends from foreign securities will be recorded when the fund is informed of the dividend if such information is obtained subsequent to the ex-dividend date. Dividend payments received in additional securities are recorded on the ex-dividend date in an amount equal to the value of the security on such date.
The fund may receive proceeds from litigation settlements. Any proceeds received from litigation involving portfolio holdings are reflected in the Statement of Operations in realized gain/loss if the security has been disposed of by the fund or in unrealized gain/loss if the security is still held by the fund. Any other proceeds from litigation not related to portfolio holdings are reflected as other income in the Statement of Operations.
Tax Matters and Distributions – The fund intends to qualify as a regulated investment company, as defined under Subchapter M of the Internal Revenue Code, and to distribute all of its taxable income, including realized capital gains. As a result, no provision for federal income tax is required. The fund’s federal tax returns, when filed, will remain subject to examination by the Internal Revenue Service for a three year period. Management has analyzed the fund’s tax positions taken on federal and state tax returns for all open tax years and does not believe that there are any uncertain tax positions that require recognition of a tax liability. Foreign taxes, if any, have been accrued by the fund in the accompanying financial statements in accordance with the applicable foreign tax law. Foreign income taxes may be withheld by certain countries in which the fund invests. Additionally, capital gains realized by the fund on securities issued in or by certain foreign countries may be subject to capital gains tax imposed by those countries.
Distributions to shareholders are recorded on the ex-dividend date. Income and capital gain distributions are determined in accordance with income tax regulations, which may differ from U.S. generally accepted accounting principles. Certain capital accounts in the financial statements are periodically adjusted for permanent differences in order to reflect their tax character. These adjustments have no impact on net assets or net asset value per share. Temporary differences which arise from recognizing certain items of income, expense, gain or loss in different periods for financial statement and tax purposes will reverse at some time in the future. Distributions in excess of net investment income or net realized gains are temporary overdistributions for financial statement purposes resulting from differences in the recognition or classification of income or distributions for financial statement and tax purposes.
Book/tax differences primarily relate to wash sale loss deferrals.
The tax character of distributions declared to shareholders for the last fiscal year is as follows:
| | | | |
| | | Year ended
12/31/17 | |
| Ordinary income (including any short-term capital gains) | | | $514,014 | |
13
MFS Emerging Markets Equity Portfolio
Notes to Financial Statements (unaudited) – continued
The federal tax cost and the tax basis components of distributable earnings were as follows:
| | | | |
| As of 6/30/18 | | | | |
| Cost of investments | | | $39,923,948 | |
| Gross appreciation | | | 16,546,508 | |
| Gross depreciation | | | (2,471,563 | ) |
| Net unrealized appreciation (depreciation) | | | $14,074,945 | |
| |
| As of 12/31/17 | | | | |
| Undistributed ordinary income | | | 117,221 | |
| Capital loss carryforwards | | | (1,183,356 | ) |
| Other temporary differences | | | (25,300 | ) |
| Net unrealized appreciation (depreciation) | | | 18,355,102 | |
The aggregate cost above includes prior fiscal year end tax adjustments, if applicable.
As of December 31, 2017, the fund had capital loss carryforwards available to offset future realized gains. These net capital losses may be carried forward indefinitely and their character is retained as short-term and/or long-term losses. Such losses are characterized as follows:
| | | | |
| Short-Term | | | $(291,211 | ) |
| Long-Term | | | (892,145 | ) |
| Total | | | $(1,183,356 | ) |
Multiple Classes of Shares of Beneficial Interest – The fund offers multiple classes of shares, which differ in their respective distribution and/or service fees. The fund’s income, realized and unrealized gain (loss), and common expenses are allocated to shareholders based on the daily net assets of each class. Dividends are declared separately for each class. Differences in per share dividend rates are generally due to differences in separate class expenses. The fund’s distributions declared to shareholders as reported in the Statements of Changes in Net Assets are presented by class as follows:
| | | | | | | | |
| | | From net investment
income | |
| | | Six months ended
6/30/18 | | | Year ended
12/31/17 | |
| Initial Class | | | $— | | | | $275,094 | |
| Service Class | | | — | | | | 238,920 | |
| Total | | | $— | | | | $514,014 | |
| (3) | | Transactions with Affiliates |
Investment Adviser – The fund has an investment advisory agreement with MFS to provide overall investment management and related administrative services and facilities to the fund. The management fee is computed daily and paid monthly at the following annual rates based on the fund’s average daily net assets:
| | | | |
| Up to $500 million | | | 1.05% | |
| In excess of $500 million | | | 1.00% | |
MFS has agreed in writing to reduce its management fee by a specified amount if certain MFS mutual fund assets exceed thresholds agreed to by MFS and the fund’s Board of Trustees. For the six months ended June 30, 2018, this management fee reduction amounted to $2,645, which is included in the reduction of total expenses in the Statement of Operations. The management fee incurred for the six months ended June 30, 2018 was equivalent to an annual effective rate of 1.04% of the fund’s average daily net assets.
The investment adviser has agreed in writing to pay a portion of the fund’s total annual operating expenses, excluding interest, taxes, extraordinary expenses, brokerage and transaction costs, and investment-related expenses, such that total annual operating expenses do not exceed 1.40% of average daily net assets for the Initial Class shares and 1.65% of average daily net assets for the Service Class shares. This written agreement will terminate on July 31, 2018. For the six months ended June 30, 2018, this reduction amounted to $5,810, which is included in the reduction of total expenses in the Statement of Operations.
Effective August 1, 2018, the investment adviser has agreed in writing to pay a portion of the fund’s total annual operating expenses, excluding interest, taxes, extraordinary expenses, brokerage and transaction costs, and investment-related expenses, such that total annual operating expenses do not exceed 1.33% of average daily net assets for the Initial Class shares and 1.58% of average daily net assets for the Service Class shares. This written agreement will continue until modified by the fund’s Board of Trustees, but such agreement will continue at least until April 30, 2020.
14
MFS Emerging Markets Equity Portfolio
Notes to Financial Statements (unaudited) – continued
Distributor – MFS Fund Distributors, Inc. (MFD), a wholly-owned subsidiary of MFS, is the distributor of shares of the fund. The Trustees have adopted a distribution plan for the Service Class shares pursuant to Rule 12b-1 under the Investment Company Act of 1940.
The fund’s distribution plan provides that the fund will pay MFD distribution and/or service fees equal to 0.25% per annum of its average daily net assets attributable to Service Class shares as partial consideration for services performed and expenses incurred by MFD and financial intermediaries (including participating insurance companies that invest in the fund to fund variable annuity and variable life insurance contracts, sponsors of qualified retirement and pension plans that invest in the fund, and affiliates of these participating insurance companies and plan sponsors) in connection with the sale and distribution of the Service Class shares. MFD may subsequently pay all, or a portion, of the distribution and/or service fees to financial intermediaries.
Shareholder Servicing Agent – MFS Service Center, Inc. (MFSC), a wholly-owned subsidiary of MFS, receives a fee from the fund for its services as shareholder servicing agent. For the six months ended June 30, 2018, the fee was $3,253, which equated to 0.0113% annually of the fund’s average daily net assets. MFSC also receives payment from the fund for out-of-pocket expenses paid by MFSC on behalf of the fund. For the six months ended June 30, 2018, these costs amounted to $64.
Administrator – MFS provides certain financial, legal, shareholder communications, compliance, and other administrative services to the fund. Under an administrative services agreement, the fund reimburses MFS the costs incurred to provide these services. The fund is charged an annual fixed amount of $17,500 plus a fee based on average daily net assets. The administrative services fee incurred for the six months ended June 30, 2018 was equivalent to an annual effective rate of 0.0323% of the fund’s average daily net assets.
Trustees’ and Officers’ Compensation – The fund pays compensation to independent Trustees in the form of a retainer, attendance fees, and additional compensation to Board and Committee chairpersons. The fund does not pay compensation directly to Trustees or officers of the fund who are also officers of the investment adviser, all of whom receive remuneration for their services to the fund from MFS. Certain officers and Trustees of the fund are officers or directors of MFS, MFD, and MFSC.
Other – This fund and certain other funds managed by MFS (the funds) have entered into a service agreement (the ISO Agreement) which provides for payment of fees solely by the funds to Tarantino LLC in return for the provision of services of an Independent Senior Officer (ISO) for the funds. Frank L. Tarantino serves as the ISO and is an officer of the funds and the sole member of Tarantino LLC. The funds can terminate the ISO Agreement with Tarantino LLC at any time under the terms of the ISO Agreement. For the six months ended June 30, 2018, the fee paid by the fund under this agreement was $47 and is included in “Miscellaneous” expense in the Statement of Operations. MFS has agreed to bear all expenses associated with office space, other administrative support, and supplies provided to the ISO.
The fund invests in the MFS Institutional Money Market Portfolio which is managed by MFS and seeks current income consistent with preservation of capital and liquidity. This money market fund does not pay a management fee to MFS.
The fund is permitted to engage in purchase and sale transactions with funds and accounts for which MFS serves as investment adviser or sub-adviser (“cross-trades”) pursuant to a policy adopted by the Board of Trustees. This policy has been designed to ensure that cross-trades conducted by the fund comply with Rule 17a-7 under the Investment Company Act of 1940. During the six months ended June 30, 2018, the fund engaged in purchase and sale transactions pursuant to this policy, which amounted to $2,981 and $20,278, respectively. The sales transactions resulted in net realized gains (losses) of $1,213.
Effective January 2, 2018, the adviser has voluntarily undertaken to reimburse the fund from its own resources on a quarterly basis for the cost of investment research embedded in the cost of the fund’s securities trades. This agreement may be rescinded at any time. For the period January 2, 2018 to June 30, 2018, this reimbursement amounted to $2,485, which is included in “Other” income in the Statement of Operations.
For the six months ended June 30, 2018, purchases and sales of investments, other than short-term obligations, aggregated $8,398,132 and $9,957,848, respectively.
15
MFS Emerging Markets Equity Portfolio
Notes to Financial Statements (unaudited) – continued
| (5) | | Shares of Beneficial Interest |
The fund’s Declaration of Trust permits the Trustees to issue an unlimited number of full and fractional shares of beneficial interest. Transactions in fund shares were as follows:
| | | | | | | | | | | | | | | | |
| | | Six months ended 6/30/18 | | | Year ended 12/31/17 | |
| | | Shares | | | Amount | | | Shares | | | Amount | |
| Shares sold | | | | | | | | | | | | | | | | |
Initial Class | | | 33,649 | | | | $599,170 | | | | 143,495 | | | | $2,218,204 | |
Service Class | | | 188,049 | | | | 3,254,818 | | | | 310,949 | | | | 4,666,469 | |
| | | 221,698 | | | | $3,853,988 | | | | 454,444 | | | | $6,884,673 | |
| Shares issued to shareholders in reinvestment of distributions | | | | | | | | | | | | | | | | |
Initial Class | | | — | | | | $— | | | | 17,302 | | | | $275,094 | |
Service Class | | | — | | | | — | | | | 15,237 | | | | 238,920 | |
| | | — | | | | $— | | | | 32,539 | | | | $514,014 | |
| Shares reacquired | | | | | | | | | | | | | | | | |
Initial Class | | | (135,599 | ) | | | $(2,388,634 | ) | | | (325,734 | ) | | | $(4,881,282 | ) |
Service Class | | | (217,304 | ) | | | (3,798,131 | ) | | | (533,229 | ) | | | (7,907,088 | ) |
| | | (352,903 | ) | | | $(6,186,765 | ) | | | (858,963 | ) | | | $(12,788,370 | ) |
| Net change | | | | | | | | | | | | | | | | |
Initial Class | | | (101,950 | ) | | | $(1,789,464 | ) | | | (164,937 | ) | | | $(2,387,984 | ) |
Service Class | | | (29,255 | ) | | | (543,313 | ) | | | (207,043 | ) | | | (3,001,699 | ) |
| | | (131,205 | ) | | | $(2,332,777 | ) | | | (371,980 | ) | | | $(5,389,683 | ) |
The fund is one of several mutual funds in which certain MFS funds may invest. The MFS funds do not invest in the underlying funds for the purpose of exercising management or control. At the end of the period, the MFS Growth Allocation Portfolio was the owner of record of approximately 7% of the value of outstanding voting shares of the fund.
The fund and certain other funds managed by MFS participate in a $1.25 billion unsecured committed line of credit, subject to a $1 billion sublimit, provided by a syndication of banks under a credit agreement. Borrowings may be made for temporary financing needs. Interest is charged to each fund, based on its borrowings, generally at a rate equal to the higher of the Overnight Bank Funding rate or daily one month LIBOR plus an agreed upon spread. A commitment fee, based on the average daily, unused portion of the committed line of credit, is allocated among the participating funds. In addition, the fund and other funds managed by MFS have established unsecured uncommitted borrowing arrangements with certain banks for temporary financing needs. Interest is charged to each fund, based on its borrowings, at a rate equal to the Overnight Bank Funding rate plus an agreed upon spread. For the six months ended June 30, 2018, the fund’s commitment fee and interest expense were $179 and $0, respectively, and are included in “Miscellaneous” expense in the Statement of Operations.
| (7) | | Investments in Affiliated Issuers |
An affiliated issuer may be considered one in which the fund owns 5% or more of the outstanding voting securities, or a company which is under common control. For the purposes of this report, the fund assumes the following to be affiliated issuers:
| | | | | | | | | | | | | | | | | | |
| Affiliated Issuers | | | | Beginning
Shares/Par
Amount | | | Acquisitions
Shares/Par
Amount | | | Dispositions
Shares/Par
Amount | | | Ending
Shares/Par
Amount | |
| MFS Institutional Money Market Portfolio | | | | | 439,940 | | | | 7,122,616 | | | | (7,561,625 | ) | | | 931 | |
| | | | | |
| Affiliated Issuers | | Realized
Gain (Loss) | | Change in
Unrealized
Appreciation/
Depreciation | | | Capital Gain
Distributions | | | Dividend
Income | | | Ending
Value | |
| MFS Institutional Money Market Portfolio | | $14 | | | $— | | | | $— | | | | $6,131 | | | | $931 | |
16
MFS Emerging Markets Equity Portfolio
PROXY VOTING POLICIES AND INFORMATION
MFS votes proxies on behalf of the fund pursuant to proxy voting policies and procedures that are available without charge, upon request, by calling 1-800-225-2606, by visiting mfs.com/proxyvoting, or by visiting the SEC’s Web site at http://www.sec.gov.
Information regarding how the fund voted proxies relating to portfolio securities during the most recent twelve-month period ended June 30 is available by August 31 of each year without charge by visiting mfs.com/proxyvoting, or by visiting the SEC’s Web site at http://www.sec.gov.
QUARTERLY PORTFOLIO DISCLOSURE
The fund will file a complete schedule of portfolio holdings with the Securities and Exchange Commission (the Commission) for the first and third quarters of each fiscal year on Form N-Q. The fund’s Form N-Q is available on the EDGAR database on the Commission’s Internet Web site at http://www.sec.gov, and may be reviewed and copied at the:
Public Reference Room
Securities and Exchange Commission
100 F Street, NE, Room 1580
Washington, D.C. 20549
Information on the operation of the Public Reference Room may be obtained by calling the Commission at 1-800-SEC-0330. Copies of the fund’s Form N-Q also may be obtained, upon payment of a duplicating fee, by electronic request at the following e-mail address: publicinfo@sec.gov or by writing the Public Reference Section at the above address.
FURTHER INFORMATION
From time to time, MFS may post important information about the fund or the MFS funds on the MFS web site (mfs.com). This information is available at https://www.mfs.com/en-us/what-we-do/announcements.html or at mfs.com/vit2 by choosing the fund’s name.
INFORMATION ABOUT FUND CONTRACTS AND LEGAL CLAIMS
The fund has entered into contractual arrangements with an investment adviser, administrator, distributor, shareholder servicing agent, 529 program manager (if applicable), and custodian who each provide services to the fund. Unless expressly stated otherwise, shareholders are not parties to, or intended beneficiaries of these contractual arrangements, and these contractual arrangements are not intended to create any shareholder right to enforce them against the service providers or to seek any remedy under them against the service providers, either directly or on behalf of the fund.
Under the Trust’s By-Laws and Declaration of Trust, any claims asserted against or on behalf of the MFS Funds, including claims against Trustees and Officers, must be brought in state and federal courts located within the Commonwealth of Massachusetts.
17
Semiannual Report
June 30, 2018

MFS® Global Governments Portfolio

MFS® Variable Insurance Trust II
WGS-SEM
MFS® Global Governments Portfolio
CONTENTS
The report is prepared for the general information of contract owners. It is authorized for distribution to prospective investors only when preceded or accompanied by a current prospectus.
NOT FDIC INSURED • MAY LOSE VALUE • NO BANK OR CREDIT UNION GUARANTEE • NOT A DEPOSIT • NOT INSURED BY ANY FEDERAL GOVERNMENT AGENCY OR NCUA/NCUSIF
MFS Global Governments Portfolio
LETTER FROM THE EXECUTIVE CHAIRMAN

Dear Contract Owners:
Rising bond yields, international trade friction and geopolitical uncertainty have contributed to a measurable uptick in market volatility — a departure from the low-volatility environment that prevailed for much of 2017. In recent months, against this more challenging backdrop, global markets have given back some of the strong gains recorded during 2017 and early 2018. But global economic growth remains healthy, notwithstanding signs of a modest slowdown over the past few months, particularly in Europe and China.
Although the U.S. Federal Reserve continues to gradually raise interest rates and shrink its balance sheet, monetary policy remains accommodative around the world, with many central banks taking only tentative steps toward tighter policies. Newly enacted U.S. tax reforms have been welcomed by equity markets, while emerging market economies have recently had to contend with tighter financial conditions as a result of firmer U.S. Treasury yields and a stronger dollar. Around the world, inflation remains largely subdued, but tight labor markets and solid global demand have investors on the lookout for its potential resurgence. Increased U.S. protectionism is also a growing concern, as investors fear that trade disputes could dampen business sentiment, leading to slower global growth.
As a global investment manager, MFS® strives to create long-term value for clients through an active approach and an investment platform built on nearly a century of expertise. To make that long-term value meaningful for clients, we work to align with you on our beliefs, your needs and the time it takes to deliver on your desired outcomes.
Respectfully,

Robert J. Manning
Executive Chairman
MFS Investment Management
August 16, 2018
The opinions expressed in this letter are subject to change and may not be relied upon for investment advice. No forecasts can be guaranteed.
1
MFS Global Governments Portfolio
PORTFOLIO COMPOSITION
Portfolio structure (i)
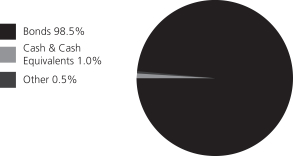
| | | | |
| Fixed income sectors (i) | | | | |
| Non-U.S. Government Bonds | | | 57.4% | |
| U.S. Treasury Securities | | | 38.9% | |
| Emerging Markets Bonds | | | 1.2% | |
| Mortgage-Backed Securities | | | 0.5% | |
| U.S. Government Agencies | | | 0.5% | |
| Commercial Mortgage-Backed Securities (o) | | | 0.0% | |
|
| Composition including fixed income credit quality (a)(i) | |
| AAA | | | 5.2% | |
| AA | | | 16.9% | |
| A | | | 13.9% | |
| BBB | | | 12.4% | |
| BB | | | 8.3% | |
| B | | | 1.2% | |
| C (o) | | | 0.0% | |
| U.S. Government | | | 40.1% | |
| Federal Agencies | | | 1.0% | |
| Not Rated | | | (0.5)% | |
| Cash & Cash Equivalents | | | 1.0% | |
| Other | | | 0.5% | |
| | | | |
| Portfolio facts (i) | | | | |
| Average Duration (d) | | | 8.1 | |
| Average Effective Maturity (m) | | | 10.7 yrs. | |
| |
| Issuer country weightings (i)(x) | | | | |
| United States | | | 45.4% | |
| Japan | | | 13.0% | |
| Portugal | | | 8.3% | |
| Italy | | | 7.3% | |
| France | | | 6.4% | |
| United Kingdom | | | 5.6% | |
| Spain | | | 5.1% | |
| New Zealand | | | 3.0% | |
| Germany | | | (2.4)% | |
| Other Countries | | | 8.3% | |
| |
| Currency exposure weightings (i)(y) | | | | |
| United States Dollar | | | 42.1% | |
| Euro | | | 29.9% | |
| Japanese Yen | | | 20.8% | |
| British Pound Sterling | | | 6.3% | |
| Australian Dollar | | | 0.7% | |
| Danish Krone | | | 0.5% | |
| Canadian Dollar | | | 0.4% | |
| Swedish Krona | | | 0.3% | |
| New Zealand Dollar | | | (1.0)% | |
| (a) | | For all securities other than those specifically described below, ratings are assigned to underlying securities utilizing ratings from Moody’s, Fitch, and Standard & Poor’s rating agencies and applying the following hierarchy: If all three agencies provide a rating, the middle rating (after dropping the highest and lowest ratings) is assigned; if two of the three agencies rate a security, the lower of the two is assigned. Ratings are shown in the S&P and Fitch scale (e.g., AAA). Securities rated BBB or higher are considered investment grade. All ratings are subject to change. U.S. Government includes securities issued by the U.S. Department of the Treasury. Federal Agencies includes rated and unrated U.S. Agency fixed-income securities, U.S. Agency mortgage-backed securities, and collateralized mortgage obligations of U.S. Agency mortgage-backed securities. Not Rated includes fixed income securities and fixed income derivatives, which have not been rated by any rating agency. The fund may or may not have held all of these instruments on this date. The fund is not rated by these agencies. |
| (d) | | Duration is a measure of how much a bond’s price is likely to fluctuate with general changes in interest rates, e.g., if rates rise 1.00%, a bond with a 5-year duration is likely to lose about 5.00% of its value due to the interest rate move. |
| (i) | | For purposes of this presentation, the components include the value of securities, and reflect the impact of the equivalent exposure of derivative positions, if any. These amounts may be negative from time to time. Equivalent exposure is a calculated amount that translates the derivative position into a reasonable approximation of the amount of the underlying asset that the portfolio would have to hold at a given point in time to have the same price sensitivity that results from the portfolio’s ownership of the derivative contract. When dealing with derivatives, equivalent exposure is a more representative measure of the potential impact of a position on portfolio performance than value. The bond component will include any accrued interest amounts. |
| (m) | | In determining each instrument’s effective maturity for purposes of calculating the fund’s dollar-weighted average effective maturity, MFS uses the instrument’s stated maturity or, if applicable, an earlier date on which MFS believes it is probable that a maturity-shortening device (such as a put, pre-refunding or prepayment) will cause the instrument to be repaid. Such an earlier date can be substantially shorter than the instrument’s stated maturity. |
2
MFS Global Governments Portfolio
Portfolio Composition – continued
| (x) | | Represents the portfolio’s exposure to issuer countries as a percentage of a portfolio’s net assets. For purposes of this presentation, United States includes Cash & Cash Equivalents and Other. |
| (y) | | Represents the portfolio’s exposure to a particular currency as a percentage of a portfolio’s net assets. For purposes of this presentation, United States Dollar includes Cash & Cash Equivalents and Other. |
Where the fund holds convertible bonds, they are treated as part of the equity portion of the portfolio.
Cash & Cash Equivalents includes any cash, investments in money market funds, short-term securities, and other assets less liabilities. Please see the Statement of Assets and Liabilities for additional information related to the fund’s cash position and other assets and liabilities.
Other includes equivalent exposure from currency derivatives and/or any offsets to derivative positions.
Percentages are based on net assets as of June 30, 2018.
The portfolio is actively managed and current holdings may be different.
3
MFS Global Governments Portfolio
EXPENSE TABLE
Fund Expenses Borne by the Contract Holders during the Period,
January 1, 2018 through June 30, 2018
As a contract holder of the fund, you incur ongoing costs, including management fees; distribution and/or service (12b-1) fees; and other fund expenses. This example is intended to help you understand your ongoing costs (in dollars) of investing in the fund and to compare these costs with the ongoing costs of investing in other mutual funds.
The example is based on an investment of $1,000 invested at the beginning of the period and held for the entire period January 1, 2018 through June 30, 2018.
Actual Expenses
The first line for each share class in the following table provides information about actual account values and actual expenses. You may use the information in this line, together with the amount you invested, to estimate the expenses that you paid over the period. Simply divide your account value by $1,000 (for example, an $8,600 account value divided by $1,000 = 8.6), then multiply the result by the number in the first line under the heading entitled “Expenses Paid During Period” to estimate the expenses you paid on your account during this period.
Hypothetical Example for Comparison Purposes
The second line for each share class in the following table provides information about hypothetical account values and hypothetical expenses based on the fund’s actual expense ratio and an assumed rate of return of 5% per year before expenses, which is not the fund’s actual return. The hypothetical account values and expenses may not be used to estimate the actual ending account balance or expenses you paid for the period. You may use this information to compare the ongoing costs of investing in the fund and other funds. To do so, compare this 5% hypothetical example with the 5% hypothetical examples that appear in the shareholder reports of the other funds.
Please note that the expenses shown in the table are meant to highlight the fund’s ongoing costs only and do not take into account the fees and expenses imposed under the variable contracts through which your investment in the fund is made. Therefore, the second line for each share class in the table is useful in comparing ongoing costs associated with an investment in vehicles (such as the fund) which fund benefits under variable annuity and variable life insurance contracts and to qualified pension and retirement plans only, and will not help you determine the relative total costs of investing in the fund through variable annuity and variable life insurance contracts. If the fees and expenses imposed under the variable contracts were included, your costs would have been higher.
| | | | | | | | | | | | | | | | | | |
| Share Class | | | | Annualized
Expense Ratio | | | Beginning
Account Value
1/01/18 | | | Ending
Account Value
6/30/18 | | | Expenses Paid
During Period (p)
1/01/18-6/30/18 | |
| Initial Class | | Actual | | | 0.85% | | | | $1,000.00 | | | | $987.69 | | | | $4.19 | |
| | Hypothetical (h) | | | 0.85% | | | | $1,000.00 | | | | $1,020.58 | | | | $4.26 | |
| Service Class | | Actual | | | 1.10% | | | | $1,000.00 | | | | $986.46 | | | | $5.42 | |
| | Hypothetical (h) | | | 1.10% | | | | $1,000.00 | | | | $1,019.34 | | | | $5.51 | |
| (h) | 5% class return per year before expenses. |
| (p) | “Expenses Paid During Period” are equal to each class’s annualized expense ratio, as shown above, multiplied by the average account value over the period, multiplied by 181/365 (to reflect the one-half year period). |
4
MFS Global Governments Portfolio
PORTFOLIO OF INVESTMENTS – 6/30/18 (unaudited)
The Portfolio of Investments is a complete list of all securities owned by your fund. It is categorized by broad-based asset classes.
| | | | | | | | |
| Issuer | | Shares/Par | | | Value ($) | |
| BONDS – 98.1% | | | | | | | | |
| Foreign Bonds – 57.3% | | | | | |
| Australia – 2.1% | | | | | |
| Commonwealth of Australia, 5.5%, 4/21/2023 | | AUD | 1,493,000 | | | $ | 1,266,051 | |
| Commonwealth of Australia, 4.25%, 4/21/2026 | | | 620,000 | | | | 513,718 | |
| Commonwealth of Australia, 3.25%, 4/21/2029 | | | 1,300,000 | | | | 1,016,107 | |
| Commonwealth of Australia, 4.5%, 4/21/2033 | | | 160,000 | | | | 142,538 | |
| Commonwealth of Australia, 3%, 3/21/2047 | | | 250,000 | | | | 181,292 | |
| | | | | | | | |
| | | | | | $ | 3,119,706 | |
| | | | | | | | |
| Belgium – 1.9% | | | | | |
| Kingdom of Belgium, 4.5%, 3/28/2026 | | EUR | 700,000 | | | $ | 1,078,668 | |
| Kingdom of Belgium, 5.5%, 3/28/2028 | | | 1,000,000 | | | | 1,714,143 | |
| | | | | | | | |
| | | | | | $ | 2,792,811 | |
| | | | | | | | |
| Canada – 1.9% | | | | | |
Government of Canada,
2.5%, 6/01/2024 | | CAD | 2,663,000 | | | $ | 2,068,091 | |
Government of Canada,
1.5%, 6/01/2026 | | | 310,000 | | | | 224,832 | |
Government of Canada,
4%, 6/01/2041 | | | 500,000 | | | | 500,970 | |
| Government of Canada, 2.75%, 12/01/2048 | | | 50,000 | | | | 42,616 | |
| | | | | | | | |
| | | | | | $ | 2,836,509 | |
| | | | | | | | |
| Denmark – 0.3% | | | | | |
Kingdom of Denmark,
4.5%, 11/15/2039 | | DKK | 1,500,000 | | | $ | 407,305 | |
| | | | | | | | |
| France – 6.3% | | | | | |
| Republic of France, 2.5%, 10/25/2020 | | EUR | 2,035,000 | | | $ | 2,544,014 | |
| Republic of France, 2.75%, 10/25/2027 | | | 2,530,000 | | | | 3,562,477 | |
| Republic of France, 4.5%, 4/25/2041 | | | 969,000 | | | | 1,846,678 | |
| Republic of France, 3.25%, 5/25/2045 | | | 505,000 | | | | 827,746 | |
| Republic of France, 4%, 4/25/2055 | | | 210,000 | | | | 405,715 | |
| Republic of France, 1.75%, 5/25/2066 | | | 150,000 | | | | 176,551 | |
| | | | | | | | |
| | | | | | $ | 9,363,181 | |
| | | | | | | | |
| Germany – 0.9% | | | | | |
| Federal Republic of Germany, 0.5%, 2/15/2026 | | EUR | 800,000 | | | $ | 965,621 | |
| Federal Republic of Germany, 2.5%, 7/04/2044 | | | 135,000 | | | | 213,968 | |
| Federal Republic of Germany, 2.5%, 8/15/2046 | | | 65,000 | | | | 104,230 | |
| | | | | | | | |
| | | | | | $ | 1,283,819 | |
| | | | | | | | |
| Greece – 1.2% | | | | | |
| Hellenic Republic, 4.375%, 8/01/2022 | | EUR | 1,157,000 | | | $ | 1,423,431 | |
| Hellenic Republic, 3.375%, 2/15/2025 | | | 300,000 | | | | 347,057 | |
| | | | | | | | |
| | | | | | $ | 1,770,488 | |
| | | | | | | | |
| | | | | | | | |
| Issuer | | Shares/Par | | | Value ($) | |
| BONDS – continued | | | | | |
| Foreign Bonds – continued | | | | | |
| Ireland – 0.9% | | | | | |
| Republic of Ireland, 5.4%, 3/13/2025 | | EUR | 800,000 | | | $ | 1,248,294 | |
| | | | | | | | |
| Italy – 7.2% | | | | | |
| Buoni del Tesoro Poliennali, 3.25%, 9/01/2046 | | EUR | 500,000 | | | $ | 576,074 | |
| Republic of Italy, 3.75%, 3/01/2021 | | | 3,299,000 | | | | 4,127,268 | |
| Republic of Italy, 5.5%, 9/01/2022 | | | 2,195,000 | | | | 2,960,103 | |
| Republic of Italy, 2.5%, 12/01/2024 | | | 860,000 | | | | 1,024,595 | |
| Republic of Italy, 1.65%, 3/01/2032 | | | 1,400,000 | | | | 1,414,317 | |
| Republic of Italy, 5%, 9/01/2040 | | | 368,000 | | | | 535,495 | |
| | | | | | | | |
| | | | | | $ | 10,637,852 | |
| | | | | | | | |
| Japan – 13.0% | | | | | |
| Government of Japan, 1.7%, 9/20/2032 | | JPY | 720,000,000 | | | $ | 7,831,719 | |
| Government of Japan, 1.5%, 3/20/2034 | | | 591,000,000 | | | | 6,315,851 | |
| Government of Japan, 2.4%, 3/20/2037 | | | 327,600,000 | | | | 3,990,320 | |
| Government of Japan, 1.8%, 3/20/2043 | | | 63,000,000 | | | | 721,511 | |
| Government of Japan, 2%, 3/20/2052 | | | 28,900,000 | | | | 354,999 | |
| | | | | | | | |
| | | | | | $ | 19,214,400 | |
| | | | | | | | |
| New Zealand – 3.0% | | | | | |
| Government of New Zealand, 2.75%, 4/15/2025 | | NZD | 3,700,000 | | | $ | 2,551,112 | |
| Government of New Zealand, 4.5%, 4/15/2027 | | | 2,440,000 | | | | 1,890,051 | |
| | | | | | | | |
| | | | | | $ | 4,441,163 | |
| | | | | | | | |
| Portugal – 8.1% | | | | | |
| Republic of Portugal, 4.95%, 10/25/2023 | | EUR | 4,880,000 | | | $ | 6,977,404 | |
| Republic of Portugal, 2.875%, 10/15/2025 | | | 1,100,000 | | | | 1,428,805 | |
| Republic of Portugal, 4.125%, 4/14/2027 | | | 2,300,000 | | | | 3,233,114 | |
| Republic of Portugal, 4.1%, 4/15/2037 | | | 250,000 | | | | 359,043 | |
| | | | | | | | |
| | | | | | $ | 11,998,366 | |
| | | | | | | | |
| Spain – 5.0% | | | | | |
| Bonos y Obligaciones del Estado, 5.75%, 7/30/2032 | | EUR | 415,000 | | | $ | 729,450 | |
| Bonos y Obligaciones del Estado, 5.15%, 10/31/2044 | | | 300,000 | | | | 539,835 | |
| Kingdom of Spain, 5.4%, 1/31/2023 | | | 1,192,000 | | | | 1,716,692 | |
| Kingdom of Spain, 2.75%, 10/31/2024 | | | 1,800,000 | | | | 2,372,194 | |
| Kingdom of Spain, 5.15%, 10/31/2028 | | | 400,000 | | | | 635,211 | |
| Kingdom of Spain, 4.7%, 7/30/2041 | | | 870,000 | | | | 1,462,003 | |
| | | | | | | | |
| | | | | | $ | 7,455,385 | |
| | | | | | | | |
5
MFS Global Governments Portfolio
Portfolio of Investments (unaudited) – continued
| | | | | | | | |
| Issuer | | Shares/Par | | | Value ($) | |
| BONDS – continued | | | | | | | | |
| Foreign Bonds – continued | | | | | |
| United Kingdom – 5.5% | | | | | | | | |
| United Kingdom Treasury, 4.25%, 12/07/2027 | | GBP | 883,000 | | | $ | 1,471,619 | |
| United Kingdom Treasury, 4.25%, 6/07/2032 | | | 71,000 | | | | 125,041 | |
| United Kingdom Treasury, 4.25%, 3/07/2036 | | | 438,000 | | | | 806,003 | |
| United Kingdom Treasury, 4.25%, 12/07/2040 | | | 627,000 | | | | 1,213,028 | |
| United Kingdom Treasury, 3.25%, 1/22/2044 | | | 1,080,000 | | | | 1,858,973 | |
| United Kingdom Treasury, 3.75%, 7/22/2052 | | | 714,000 | | | | 1,448,408 | |
United Kingdom Treasury,
4%, 1/22/2060 | | | 405,000 | | | | 922,648 | |
| United Kingdom Treasury, 3.5%, 7/22/2068 | | | 150,000 | | | | 329,158 | |
| | | | | | | | |
| | | | | | $ | 8,174,878 | |
| | | | | | | | |
| Total Foreign Bonds | | | | | | $ | 84,744,157 | |
| | | | | | | | |
| U.S. Bonds – 40.8% | | | | | | | | |
| Asset-Backed & Securitized – 0.0% | | | | | |
| Commercial Mortgage Asset Trust, 1.413%, 1/17/2032 (i)(z) | | $ | 14,998 | | | $ | 4 | |
| | | | | | | | |
| Mortgage-Backed – 0.5% | | | | | | | | |
| Fannie Mae, 5.18%, 3/01/2019 | | $ | 56,195 | | | $ | 56,554 | |
| Freddie Mac, 5.085%, 3/25/2019 | | | 43,000 | | | | 43,426 | |
| Freddie Mac, 3.32%, 2/25/2023 | | | 5,000 | | | | 5,051 | |
| Freddie Mac, 3.243%, 4/25/2027 | | | 400,000 | | | | 395,454 | |
| Freddie Mac, 3.117%, 6/25/2027 | | | 322,320 | | | | 315,032 | |
| | | | | | | | |
| | | | | | $ | 815,517 | |
| | | | | | | | |
| U.S. Government Agencies and Equivalents – 0.5% | |
| Small Business Administration, 4.57%, 6/01/2025 | | $ | 5,122 | | | $ | 5,226 | |
| Small Business Administration, 5.09%, 10/01/2025 | | | 4,475 | | | | 4,604 | |
| Small Business Administration, 5.21%, 1/01/2026 | | | 67,524 | | | | 69,710 | |
| Small Business Administration, 2.22%, 3/01/2033 | | | 623,251 | | | | 605,374 | |
| | | | | | | | |
| | | | | | $ | 684,914 | |
| | | | | | | | |
| | | | | | | | |
| Issuer | | Shares/Par | | | Value ($) | |
| BONDS – continued | | | | | |
| U.S. Bonds – continued | | | | | |
| U.S. Treasury Obligations – 39.8% | | | | | |
U.S. Treasury Bonds,
2.25%, 2/15/2027 | | $ | 2,137,000 | | | $ | 2,039,249 | |
| U.S. Treasury Bonds, 4.5%, 8/15/2039 | | | 3,668,400 | | | | 4,574,180 | |
U.S. Treasury Bonds,
2.75%, 11/15/2042 | | | 723,000 | | | | 695,492 | |
U.S. Treasury Bonds,
3.625%, 2/15/2044 | | | 4,974,000 | | | | 5,548,924 | |
| U.S. Treasury Bonds, 3%, 5/15/2047 | | | 2,430,000 | | | | 2,437,119 | |
U.S. Treasury Notes,
0.875%, 5/15/2019 | | | 6,100,000 | | | | 6,023,274 | |
U.S. Treasury Notes,
3.5%, 5/15/2020 (f) | | | 13,355,000 | | | | 13,589,756 | |
U.S. Treasury Notes,
1.375%, 5/31/2021 | | | 6,180,400 | | | | 5,964,327 | |
U.S. Treasury Notes,
1.75%, 5/15/2022 | | | 7,753,000 | | | | 7,485,582 | |
U.S. Treasury Notes,
1.375%, 8/31/2023 | | | 1,689,000 | | | | 1,577,500 | |
U.S. Treasury Notes,
2.75%, 2/15/2024 | | | 5,755,000 | | | | 5,747,357 | |
U.S. Treasury Notes,
2.25%, 11/15/2025 | | | 3,417,000 | | | | 3,286,326 | |
| | | | | | | | |
| | | | | | $ | 58,969,086 | |
| | | | | | | | |
| Total U.S. Bonds | | | | | | $ | 60,469,521 | |
| | | | | | | | |
Total Bonds
(Identified Cost, $142,558,719) | | | | | | $ | 145,213,678 | |
| | | | | | | | |
| |
| INVESTMENT COMPANIES (h) – 1.1% | | | | | |
| Money Market Funds – 1.1% | | | | | | | | |
MFS Institutional Money Market Portfolio, 1.9% (v)
(Identified Cost, $1,609,060) | | | 1,609,273 | | | $ | 1,609,273 | |
| | | | | | | | |
OTHER ASSETS, LESS
LIABILITIES – 0.8% | | | | | | | 1,130,729 | |
| | | | | | | | |
| NET ASSETS – 100.0% | | | | | | $ | 147,953,680 | |
| | | | | | | | |
| (f) | | All or a portion of the security has been segregated as collateral for open futures contracts. |
| (h) | | An affiliated issuer, which may be considered one in which the fund owns 5% or more of the outstanding voting securities, or a company which is under common control. At period end, the aggregate values of the fund’s investments in affiliated issuers and in unaffiliated issuers were $1,609,273 and $145,213,678, respectively. |
| (i) | | Interest only security for which the fund receives interest on notional principal (Par amount). Par amount shown is the notional principal and does not reflect the cost of the security. |
| (v) | | Affiliated issuer that is available only to investment companies managed by MFS. The rate quoted for the MFS Institutional Money Market Portfolio is the annualized seven-day yield of the fund at period end. |
6
MFS Global Governments Portfolio
Portfolio of Investments (unaudited) – continued
| (z) | | Restricted securities are not registered under the Securities Act of 1933 and are subject to legal restrictions on resale. These securities generally may be resold in transactions exempt from registration or to the public if the securities are subsequently registered. Disposal of these securities may involve time-consuming negotiations and prompt sale at an acceptable price may be difficult. The fund holds the following restricted securities: |
| | | | | | | | | | |
| Restricted Securities | | Acquisition
Date | | Cost | | | Value | |
| Commercial Mortgage Asset Trust, 1.413%, 1/17/2032 | | 4/09/12 | | | $5 | | | | $4 | |
| % of Net assets | | | | | | | | | 0.0% | |
The following abbreviations are used in this report and are defined:
| PLC | | Public Limited Company |
Abbreviations indicate amounts shown in currencies other than the U.S. dollar. All amounts are stated in U.S. dollars unless otherwise indicated. A list of abbreviations is shown below:
Derivative Contracts at 6/30/18
Forward Foreign Currency Exchange Contracts
| | | | | | | | | | | | | | | | | | | | |
| Currency Purchased | | Currency Sold | | Counterparty | | Settlement Date | | | Unrealized
Appreciation
(Depreciation) | |
| Asset Derivatives | | | | | | | | | | | | |
| USD | | | 735,524 | | | | | AUD | | 976,000 | | Brown Brothers Harriman | | | 7/27/2018 | | | | $13,183 | |
| USD | | | 734,085 | | | | | AUD | | 974,000 | | Deutsche Bank AG | | | 7/27/2018 | | | | 13,224 | |
| USD | | | 706,724 | | | | | AUD | | 931,000 | | Goldman Sachs International | | | 7/27/2018 | | | | 17,687 | |
| USD | | | 326,127 | | | | | AUD | | 432,291 | | HSBC Bank | | | 7/27/2018 | | | | 6,187 | |
| USD | | | 1,030,529 | | | | | AUD | | 1,383,456 | | Morgan Stanley Capital Services, Inc. | | | 7/27/2018 | | | | 6,628 | |
| USD | | | 2,844,996 | | | | | CAD | | 3,628,434 | | Barclays Bank PLC | | | 7/27/2018 | | | | 83,823 | |
| USD | | | 739,102 | | | | | CAD | | 959,000 | | Brown Brothers Harriman | | | 7/27/2018 | | | | 9,320 | |
| USD | | | 5,061 | | | | | CHF | | 5,000 | | JPMorgan Chase Bank N.A. | | | 7/27/2018 | | | | 1 | |
| USD | | | 1,263,839 | | | | | EUR | | 1,074,635 | | Brown Brothers Harriman | | | 7/27/2018 | | | | 6,709 | |
| USD | | | 970,058 | | | | | EUR | | 827,527 | | Deutsche Bank AG | | | 7/27/2018 | | | | 2,000 | |
| USD | | | 736,314 | | | | | EUR | | 626,000 | | HSBC Bank | | | 7/27/2018 | | | | 4,006 | |
| USD | | | 5,841,225 | | | | | EUR | | 4,940,649 | | JPMorgan Chase Bank N.A. | | | 7/27/2018 | | | | 61,548 | |
| USD | | | 843,997 | | | | | EUR | | 676,811 | | Morgan Stanley Capital Services, Inc. | | | 7/18/2018 | | | | 52,769 | |
| USD | | | 1,263,123 | | | | | EUR | | 1,078,169 | | Morgan Stanley Capital Services, Inc. | | | 7/27/2018 | | | | 1,857 | |
| USD | | | 448,530 | | | | | EUR | | 383,000 | | State Street Bank and Trust Company | | | 7/27/2018 | | | | 489 | |
| USD | | | 147,623 | | | | | GBP | | 110,000 | | Deutsche Bank AG | | | 7/27/2018 | | | | 2,292 | |
| USD | | | 735,111 | | | | | GBP | | 549,000 | | HSBC Bank | | | 7/27/2018 | | | | 9,781 | |
| USD | | | 846,407 | | | | | GBP | | 631,085 | | State Street Bank and Trust Company | | | 7/27/2018 | | | | 12,627 | |
| USD | | | 99,570 | | | | | JPY | | 11,000,000 | | Brown Brothers Harriman | | | 7/27/2018 | | | | 58 | |
| USD | | | 2,000,005 | | | | | JPY | | 218,469,000 | | Goldman Sachs International | | | 7/27/2018 | | | | 23,612 | |
| USD | | | 1,585,428 | | | | | JPY | | 173,910,000 | | Royal Bank of Scotland Group PLC | | | 7/27/2018 | | | | 12,140 | |
| USD | | | 1,498,474 | | | | | NOK | | 12,187,000 | | Goldman Sachs International | | | 7/27/2018 | | | | 671 | |
| USD | | | 1,417,690 | | | | | NZD | | 2,045,207 | | Deutsche Bank AG | | | 7/27/2018 | | | | 32,449 | |
| USD | | | 6,031,019 | | | | | NZD | | 8,744,777 | | JPMorgan Chase Bank N.A. | | | 7/27/2018 | | | | 108,085 | |
| USD | | | 730,699 | | | | | SEK | | 6,518,000 | | Citibank N.A. | | | 7/27/2018 | | | | 1,691 | |
| USD | | | 1,460,661 | | | | | SEK | | 12,972,000 | | Goldman Sachs International | | | 7/27/2018 | | | | 9,804 | |
7
MFS Global Governments Portfolio
Portfolio of Investments (unaudited) – continued
Forward Foreign Currency Exchange Contracts - continued
| | | | | | | | | | | | | | | | | | | | |
| Currency Purchased | | Currency Sold | | Counterparty | | Settlement Date | | | Unrealized
Appreciation
(Depreciation) | |
| Asset Derivatives - continued | | | | | | | | | | | | |
| USD | | | 20,842 | | | | | ZAR | | 267,347 | | Goldman Sachs International | | | 7/27/2018 | | | | $1,412 | |
| EUR | | | 738,223 | | | | | USD | | 861,796 | | Brown Brothers Harriman | | | 7/27/2018 | | | | 1,794 | |
| EUR | | | 1,274,000 | | | | | USD | | 1,490,064 | | State Street Bank and Trust Company | | | 7/27/2018 | | | | 288 | |
| MXN | | | 74,144 | | | | | USD | | 3,712 | | Barclays Bank PLC | | | 7/27/2018 | | | | 7 | |
| NOK | | | 6,028,000 | | | | | USD | | 740,166 | | Citibank N.A. | | | 7/27/2018 | | | | 685 | |
| | | | | | | | | | | | | | | | | | | | |
| | | | | | | | | | | | | | | | | | | $496,827 | |
| | | | | | | | | | | | | | | | | | | | |
| Liability Derivatives | | | | | | | | | | | | |
| AUD | | | 1,957,000 | | | | | USD | | 1,498,959 | | Citibank N.A. | | | 7/27/2018 | | | | $(50,576 | ) |
| AUD | | | 974,000 | | | | | USD | | 745,981 | | Deutsche Bank AG | | | 7/27/2018 | | | | (25,120 | ) |
| AUD | | | 993,000 | | | | | USD | | 750,080 | | Goldman Sachs International | | | 7/27/2018 | | | | (15,157 | ) |
| AUD | | | 891,440 | | | | | USD | | 683,485 | | Morgan Stanley Capital Services, Inc. | | | 7/27/2018 | | | | (23,727 | ) |
| CAD | | | 2,535,000 | | | | | USD | | 1,955,055 | | Deutsche Bank AG | | | 7/27/2018 | | | | (25,965 | ) |
| DKK | | | 2,102,556 | | | | | USD | | 332,182 | | Barclays Bank PLC | | | 7/27/2018 | | | | (2,021 | ) |
| EUR | | | 2,385,860 | | | | | USD | | 2,822,586 | | Barclays Bank PLC | | | 7/27/2018 | | | | (31,557 | ) |
| EUR | | | 414,580 | | | | | USD | | 485,638 | | Deutsche Bank AG | | | 7/27/2018 | | | | (653 | ) |
| EUR | | | 1,926,000 | | | | | USD | | 2,268,913 | | Goldman Sachs International | | | 7/27/2018 | | | | (15,837 | ) |
| EUR | | | 1,843,000 | | | | | USD | | 2,168,614 | | Royal Bank of Scotland Group PLC | | | 7/27/2018 | | | | (12,633 | ) |
| GBP | | | 1,966,981 | | | | | USD | | 2,651,865 | | Merrill Lynch International | | | 7/27/2018 | | | | (53,120 | ) |
| GBP | | | 243,000 | | | | | USD | | 323,827 | | State Street Bank and Trust Company | | | 7/27/2018 | | | | (2,779 | ) |
| JPY | | | 162,631,000 | | | | | USD | | 1,496,035 | | Brown Brothers Harriman | | | 7/27/2018 | | | | (24,784 | ) |
| JPY | | | 81,441,000 | | | | | USD | | 739,511 | | Citibank N.A. | | | 7/27/2018 | | | | (2,750 | ) |
| JPY | | | 162,220,000 | | | | | USD | | 1,495,425 | | Deutsche Bank AG | | | 7/27/2018 | | | | (27,892 | ) |
| JPY | | | 1,178,843,545 | | | | | USD | | 10,671,503 | | JPMorgan Chase Bank N.A. | | | 7/27/2018 | | | | (7,024 | ) |
| JPY | | | 81,677,000 | | | | | USD | | 745,064 | | Morgan Stanley Capital Services, Inc. | | | 7/27/2018 | | | | (6,169 | ) |
| NOK | | | 12,187,184 | | | | | USD | | 1,504,791 | | Goldman Sachs International | | | 7/27/2018 | | | | (6,966 | ) |
| NZD | | | 4,204,000 | | | | | USD | | 2,907,858 | | Goldman Sachs International | | | 7/27/2018 | | | | (60,442 | ) |
| PLN | | | 24,636 | | | | | USD | | 6,700 | | Barclays Bank PLC | | | 7/27/2018 | | | | (121 | ) |
| SEK | | | 23,666,193 | | | | | USD | | 2,706,206 | | Goldman Sachs International | | | 7/27/2018 | | | | (59,253 | ) |
| USD | | | 2,254,841 | | | | | AUD | | 3,059,410 | | Citibank N.A. | | | 7/27/2018 | | | | (9,441 | ) |
| USD | | | 737,951 | | | | | CAD | | 982,000 | | Morgan Stanley Capital Services, Inc. | | | 7/27/2018 | | | | (9,333 | ) |
| USD | | | 1,817,537 | | | | | EUR | | 1,562,189 | | State Street Bank and Trust Company | | | 7/27/2018 | | | | (9,945 | ) |
| USD | | | 52,738 | | | | | GBP | | 40,000 | | Goldman Sachs International | | | 7/27/2018 | | | | (109 | ) |
| USD | | | 737,818 | | | | | NOK | | 6,028,000 | | Deutsche Bank AG | | | 7/27/2018 | | | | (3,033 | ) |
| USD | | | 1,465,900 | | | | | NZD | | 2,172,000 | | Citibank N.A. | | | 7/27/2018 | | | | (5,219 | ) |
| | | | | | | | | | | | | | | | | | | | |
| | | | | | | | | | | | | | | | | | | $(491,626 | ) |
| | | | | | | | | | | | | | | | | | | | |
Futures Contracts
| | | | | | | | | | | | | | | | | | | | | | |
| Description | | Long/
Short | | | Currency | | | Contracts | | | Notional
Amount | | | Expiration
Date | | Value/Unrealized
Appreciation
(Depreciation) | |
| Asset Derivatives | | | | | | | | | | | | | | | | | | | |
| Interest Rate Futures | | | | | | | | | | | | | | | | | | | |
| U.S. Treasury Ultra Note 10 yr | | | Short | | | | USD | | | | 14 | | | | $1,795,281 | | | September - 2018 | | | $267 | |
| | | | | | | | | | | | | | | | | | | | | | |
| | | | | |
| Liability Derivatives | | | | | | | | | | | | | | | | | | | |
| Interest Rate Futures | | | | | | | | | | | | | | | | | | | |
| German Euro-Bobl 5 yr | | | Short | | | | EUR | | | | 22 | | | | $3,395,659 | | | September - 2018 | | | $(11,356 | ) |
| German Euro-Bund 10 yr | | | Short | | | | EUR | | | | 8 | | | | 1,518,607 | | | September - 2018 | | | (11,147 | ) |
| | | | | | | | | | | | | | | | | | | | | | |
| | | | | | | | | | | | | | | | | | | | | $(22,503 | ) |
| | | | | | | | | | | | | | | | | | | | | | |
8
MFS Global Governments Portfolio
Portfolio of Investments (unaudited) – continued
Uncleared Swap Agreements
| | | | | | | | | | | | | | | | | | | | | | | | |
Maturity
Date | | Notional
Amount | | | Counterparty | | Cash Flows
to Receive/
Frequency | | Cash Flows to Pay/
Frequency | | | Unrealized
Appreciation/
(Depreciation) | | | Net
Unamortized
Upfront
Payments/
(Receipts) | | | Value | |
| Liability Derivatives | | | | | | | | | | | | | | | | |
| Inflation Swaps | | | | | | | | | | | | | | | | |
| 5/24/23 | | | USD 5,903,000 | | | Merrill Lynch Capital Services | | U.S.A-CPI-U-Index /
At maturity | | | 2.339% / At maturity | | | | $(5,073) | | | | $— | | | | $(5,073 | ) |
| | | | | | | | | | | | | | | | | | | | | | | | |
At June 30, 2018, the fund had cash collateral of $50,000 and other liquid securities with an aggregate value of $72,248 to cover any collateral or margin obligations for certain derivative contracts. Restricted cash and/or deposits with brokers in the Statement of Assets and Liabilities are comprised of cash collateral.
See Notes to Financial Statements
9
MFS Global Governments Portfolio
FINANCIAL STATEMENTS | STATEMENT OF ASSETS AND LIABILITIES (unaudited)
This statement represents your fund’s balance sheet, which details the assets and liabilities comprising the total value of the fund.
| | | | |
At 6/30/18 | | | | |
Assets | | | | |
Investments in unaffiliated issuers, at value (identified cost, $142,558,719) | | | $145,213,678 | |
Investments in affiliated issuers, at value (identified cost, $1,609,060) | | | 1,609,273 | |
Restricted cash for | | | | |
Forward foreign currency exchange contracts | | | 50,000 | |
Receivables for | | | | |
Forward foreign currency exchange contracts | | | 496,827 | |
Interest | | | 1,291,063 | |
Other assets | | | 710 | |
Total assets | | | $148,661,551 | |
Liabilities | | | | |
Payables for | | | | |
Forward foreign currency exchange contracts | | | $491,626 | |
Daily variation margin on open futures contracts | | | 3 | |
Fund shares reacquired | | | 142,900 | |
Uncleared swaps, at value | | | 5,073 | |
Payable to affiliates | | | | |
Investment adviser | | | 9,230 | |
Shareholder servicing costs | | | 6 | |
Distribution and/or service fees | | | 18 | |
Payable for independent Trustees’ compensation | | | 100 | |
Accrued expenses and other liabilities | | | 58,915 | |
Total liabilities | | | $707,871 | |
Net assets | | | $147,953,680 | |
Net assets consist of | | | | |
Paid-in capital | | | $150,371,463 | |
Unrealized appreciation (depreciation) | | | 2,607,764 | |
Accumulated net realized gain (loss) | | | (7,009,871 | ) |
Undistributed net investment income | | | 1,984,324 | |
Net assets | | | $147,953,680 | |
Shares of beneficial interest outstanding | | | 14,187,512 | |
| | | | | | | | | | | | |
| | | Net assets | | | Shares outstanding | | | Net asset value
per share | |
Initial Class | | | $147,070,210 | | | | 14,100,915 | | | | $10.43 | |
Service Class | | | 883,470 | | | | 86,597 | | | | 10.20 | |
See Notes to Financial Statements
10
MFS Global Governments Portfolio
FINANCIAL STATEMENTS | STATEMENT OF OPERATIONS (unaudited)
This statement describes how much your fund earned in investment income and accrued in expenses. It also describes any gains and/or losses generated by fund operations.
| | | | |
Six months ended 6/30/18 | | | | |
Net investment income (loss) | | | | |
Income | | | | |
Interest | | | $1,366,582 | |
Dividends from affiliated issuers | | | 37,450 | |
Other | | | 622 | |
Total investment income | | | $1,404,654 | |
Expenses | | | | |
Management fee | | | $574,348 | |
Distribution and/or service fees | | | 1,220 | |
Shareholder servicing costs | | | 1,033 | |
Administrative services fee | | | 16,445 | |
Independent Trustees’ compensation | | | 2,165 | |
Custodian fee | | | 14,674 | |
Shareholder communications | | | 4,234 | |
Audit and tax fees | | | 35,676 | |
Legal fees | | | 958 | |
Miscellaneous | | | 9,856 | |
Total expenses | | | $660,609 | |
Reduction of expenses by investment adviser | | | (7,058 | ) |
Net expenses | | | $653,551 | |
Net investment income (loss) | | | $751,103 | |
Realized and unrealized gain (loss) | | | | |
Realized gain (loss) (identified cost basis) | | | | |
Unaffiliated issuers | | | $1,159,446 | |
Affiliated issuers | | | (532 | ) |
Futures contracts | | | (102,064 | ) |
Forward foreign currency exchange contracts | | | (43,703 | ) |
Foreign currency | | | 26,203 | |
Net realized gain (loss) | | | $1,039,350 | |
Change in unrealized appreciation or depreciation | | | | |
Unaffiliated issuers | | | $(3,595,939 | ) |
Affiliated issuers | | | 694 | |
Futures contracts | | | (22,236 | ) |
Swap agreements | | | (5,073 | ) |
Forward foreign currency exchange contracts | | | 221,211 | |
Translation of assets and liabilities in foreign currencies | | | (44,866 | ) |
Net unrealized gain (loss) | | | $(3,446,209 | ) |
Net realized and unrealized gain (loss) | | | $(2,406,859 | ) |
Change in net assets from operations | | | $(1,655,756 | ) |
See Notes to Financial Statements
11
MFS Global Governments Portfolio
FINANCIAL STATEMENTS | STATEMENTS OF CHANGES IN NET ASSETS
These statements describe the increases and/or decreases in net assets resulting from operations, any distributions, and any shareholder transactions.
| | | | | | | | |
| | | Six months ended
6/30/18 | | | Year ended
12/31/17 | |
| | | (unaudited) | | | | |
Change in net assets | | | | | | | | |
From operations | | | | | | | | |
Net investment income (loss) | | | $751,103 | | | | $1,256,274 | |
Net realized gain (loss) | | | 1,039,350 | | | | (1,355,824 | ) |
Net unrealized gain (loss) | | | (3,446,209 | ) | | | 11,272,878 | |
Change in net assets from operations | | | $(1,655,756 | ) | | | $11,173,328 | |
Change in net assets from fund share transactions | | | $(11,076,684 | ) | | | $(14,270,685 | ) |
Total change in net assets | | | $(12,732,440 | ) | | | $(3,097,357 | ) |
Net assets | | | | | | | | |
At beginning of period | | | 160,686,120 | | | | 163,783,477 | |
At end of period (including undistributed net investment income of $1,984,324 and
$1,233,221, respectively) | | | $147,953,680 | | | | $160,686,120 | |
See Notes to Financial Statements
12
MFS Global Governments Portfolio
FINANCIAL STATEMENTS | FINANCIAL HIGHLIGHTS
The financial highlights table is intended to help you understand the fund’s financial performance for the semiannual period and the past 5 fiscal years. Certain information reflects financial results for a single fund share. The total returns in the table represent the rate that an investor would have earned (or lost) on an investment in the fund share class (assuming reinvestment of all distributions) held for the entire period.
| | | | | | | | | | | | | | | | | | | | | | | | |
| Initial Class | | Six months ended 6/30/18 | | | Year ended | |
| | | | 12/31/17 | | | 12/31/16 | | | 12/31/15 | | | 12/31/14 | | | 12/31/13 | |
| | | (unaudited) | | | | | | | | | | | | | | | | |
Net asset value, beginning of period | | | $10.56 | | | | $9.87 | | | | $9.84 | | | | $10.47 | | | | $10.45 | | | | $11.03 | |
| Income (loss) from investment operations | | | | | | | | | | | | | | | | | | | | | |
Net investment income (loss) (d) | | | $0.05 | | | | $0.08 | | | | $0.07 | (c) | | | $0.09 | | | | $0.11 | | | | $0.10 | |
Net realized and unrealized gain (loss) | | | (0.18 | ) | | | 0.61 | | | | (0.04 | )(g) | | | (0.47 | ) | | | (0.03 | ) | | | (0.68 | ) |
Total from investment operations | | | $(0.13 | ) | | | $0.69 | | | | $0.03 | | | | $(0.38 | ) | | | $0.08 | | | | $(0.58 | ) |
| Less distributions declared to shareholders | | | | | | | | | | | | | | | | | | | | | |
From net investment income | | | $— | | | | $— | | | | $— | | | | $(0.25 | ) | | | $(0.06 | ) | | | $— | |
Net asset value, end of period (x) | | | $10.43 | | | | $10.56 | | | | $9.87 | | | | $9.84 | | | | $10.47 | | | | $10.45 | |
Total return (%) (k)(r)(s)(x) | | | (1.23 | )(n) | | | 6.99 | | | | 0.30 | (c) | | | (3.66 | ) | | | 0.73 | | | | (5.26 | ) |
| Ratios (%) (to average net assets) and Supplemental data: | | | | | | | | | | | | | | | | | | | | | | | | |
Expenses before expense reductions (f) | | | 0.86 | (a) | | | 0.86 | | | | 0.83 | (c) | | | 0.85 | | | | 0.84 | | | | 0.84 | |
Expenses after expense reductions (f) | | | 0.85 | (a) | | | 0.85 | | | | 0.82 | (c) | | | 0.84 | | | | 0.83 | | | | 0.84 | |
Net investment income (loss) | | | 0.98 | (a) | | | 0.77 | | | | 0.66 | (c) | | | 0.92 | | | | 1.07 | | | | 0.94 | |
Portfolio turnover | | | 44 | (n) | | | 67 | | | | 75 | | | | 94 | | | | 31 | | | | 56 | |
Net assets at end of period (000 omitted) | | | $147,070 | | | | $159,652 | | | | $162,211 | | | | $182,978 | | | | $209,945 | | | | $228,029 | |
| | |
| Service Class | | Six months
ended 6/30/18 | | | Year ended | |
| | | | 12/31/17 | | | 12/31/16 | | | 12/31/15 | | | 12/31/14 | | | 12/31/13 | |
| | | (unaudited) | | | | | | | | | | | | | | | | |
Net asset value, beginning of period | | | $10.34 | | | | $9.69 | | | | $9.69 | | | | $10.31 | | | | $10.28 | | | | $10.87 | |
| Income (loss) from investment operations | | | | | | | | | | | | | | | | | | | | | |
Net investment income (loss) (d) | | | $0.04 | | | | $0.05 | | | | $0.04 | (c) | | | $0.07 | | | | $0.09 | | | | $0.07 | |
Net realized and unrealized gain (loss) | | | (0.18 | ) | | | 0.60 | | | | (0.04 | )(g) | | | (0.46 | ) | | | (0.04 | ) | | | (0.66 | ) |
Total from investment operations | | | $(0.14 | ) | | | $0.65 | | | | $0.00 | (w) | | | $(0.39 | ) | | | $0.05 | | | | $(0.59 | ) |
| Less distributions declared to shareholders | | | | | | | | | | | | | | | | | | | | | |
From net investment income | | | $— | | | | $— | | | | $— | | | | $(0.23 | ) | | | $(0.02 | ) | | | $— | |
Net asset value, end of period (x) | | | $10.20 | | | | $10.34 | | | | $9.69 | | | | $9.69 | | | | $10.31 | | | | $10.28 | |
Total return (%) (k)(r)(s)(x) | | | (1.35 | )(n) | | | 6.71 | | | | 0.00 | (c)(w) | | | (3.86 | ) | | | 0.49 | | | | (5.43 | ) |
| Ratios (%) (to average net assets) and Supplemental data: | | | | | | | | | | | | | | | | | | | | | | | | |
| Expenses before expense reductions (f) | | | 1.11 | (a) | | | 1.11 | | | | 1.08 | (c) | | | 1.10 | | | | 1.09 | | | | 1.09 | |
| Expenses after expense reductions (f) | | | 1.10 | (a) | | | 1.10 | | | | 1.07 | (c) | | | 1.09 | | | | 1.08 | | | | 1.09 | |
| Net investment income (loss) | | | 0.73 | (a) | | | 0.52 | | | | 0.41 | (c) | | | 0.67 | | | | 0.81 | | | | 0.69 | |
| Portfolio turnover | | | 44 | (n) | | | 67 | | | | 75 | | | | 94 | | | | 31 | | | | 56 | |
Net assets at end of period (000 omitted) | | | $883 | | | | $1,034 | | | | $1,572 | | | | $1,586 | | | | $1,809 | | | | $2,553 | |
See Notes to Financial Statements
13
MFS Global Governments Portfolio
Financial Highlights – continued
| (c) | | Amount reflects a one-time reimbursement of expenses by the custodian (or former custodian) without which net investment income and performance would be lower and expenses would be higher. |
| (d) | | Per share data is based on average shares outstanding. |
| (f) | | Ratios do not reflect reductions from fees paid indirectly, if applicable. |
| (g) | | The per share amount varies from the net realized and unrealized gain/loss for the period because of the timing of sales of fund shares and the per share amount of realized and unrealized gains and losses at such time. |
| (k) | | The total return does not reflect expenses that apply to separate accounts. Inclusion of these charges would reduce the total return figures for all periods shown. |
| (r) | | Certain expenses have been reduced without which performance would have been lower. |
| (s) | | From time to time the fund may receive proceeds from litigation settlements, without which performance would be lower. |
| (w) | | Per share amount was less than $0.01 and total return or ratio was less than 0.01%, as applicable. |
| (x) | | The net asset values and total returns have been calculated on net assets which include adjustments made in accordance with U.S. generally accepted accounting principles required at period end for financial reporting purposes. |
See Notes to Financial Statements
14
MFS Global Governments Portfolio
NOTES TO FINANCIAL STATEMENTS (unaudited)
| (1) | | Business and Organization |
MFS Global Governments Portfolio (the fund) is a non-diversified series of MFS Variable Insurance Trust II (the trust). The trust is organized as a Massachusetts business trust and is registered under the Investment Company Act of 1940, as amended, as an open-end management investment company. The shareholders of each series of the trust are separate accounts of insurance companies, which offer variable annuity and/or life insurance products, and qualified retirement and pension plans.
The fund is an investment company and accordingly follows the investment company accounting and reporting guidance of the Financial Accounting Standards Board (FASB) Accounting Standards Codification Topic 946 Financial Services – Investment Companies.
| (2) | | Significant Accounting Policies |
General – The preparation of financial statements in conformity with U.S. generally accepted accounting principles requires management to make estimates and assumptions that affect the reported amounts of assets and liabilities, and disclosure of contingent assets and liabilities at the date of the financial statements and the reported amounts of increases and decreases in net assets from operations during the reporting period. Actual results could differ from those estimates. In the preparation of these financial statements, management has evaluated subsequent events occurring after the date of the fund’s Statement of Assets and Liabilities through the date that the financial statements were issued. The fund invests in foreign securities. Investments in foreign securities are vulnerable to the effects of changes in the relative values of the local currency and the U.S. dollar and to the effects of changes in each country’s market, economic, industrial, political, regulatory, geopolitical, and other conditions.
In March 2017, the FASB issued Accounting Standards Update 2017-08, Receivables – Nonrefundable Fees and Other Costs (Subtopic 310-20) – Premium Amortization on Purchased Callable Debt Securities (“ASU 2017-08”). For entities that hold callable debt securities at a premium, ASU 2017-08 requires that the premium be amortized to the earliest call date. ASU 2017-08 will be effective for fiscal years beginning after December 15, 2018, and interim periods within those fiscal years. Management has evaluated the potential impacts of ASU 2017-08 and believes that adoption of ASU 2017-08 will not have a material effect on the fund’s overall financial position or its overall results of operations.
Balance Sheet Offsetting – The fund’s accounting policy with respect to balance sheet offsetting is that, absent an event of default by the counterparty or a termination of the agreement, the International Swaps and Derivatives Association (ISDA) Master Agreement, or similar agreement, does not result in an offset of reported amounts of financial assets and financial liabilities in the Statement of Assets and Liabilities across transactions between the fund and the applicable counterparty. The fund’s right to setoff may be restricted or prohibited by the bankruptcy or insolvency laws of the particular jurisdiction to which a specific master netting agreement counterparty is subject. Balance sheet offsetting disclosures, to the extent applicable to the fund, have been included in the fund’s Significant Accounting Policies note under the captions for each of the fund’s in-scope financial instruments and transactions.
Investment Valuations – Debt instruments and floating rate loans, including restricted debt instruments, are generally valued at an evaluated or composite bid as provided by a third-party pricing service. Short-term instruments with a maturity at issuance of 60 days or less may be valued at amortized cost, which approximates market value. Futures contracts are generally valued at last posted settlement price on their primary exchange as provided by a third-party pricing service. Futures contracts for which there were no trades that day for a particular position are generally valued at the closing bid quotation on their primary exchange as provided by a third-party pricing service. Forward foreign currency exchange contracts are generally valued at the mean of bid and asked prices for the time period interpolated from rates provided by a third-party pricing service for proximate time periods. Swap agreements are generally valued at valuations provided by a third-party pricing service, which for cleared swaps includes an evaluation of any trading activity at the clearinghouses. Open-end investment companies are generally valued at net asset value per share. Securities and other assets generally valued on the basis of information from a third-party pricing service may also be valued at a broker/dealer bid quotation. In determining values, third-party pricing services can utilize both transaction data and market information such as yield, quality, coupon rate, maturity, type of issue, trading characteristics, and other market data. The values of foreign securities and other assets and liabilities expressed in foreign currencies are converted to U.S. dollars using the mean of bid and asked prices for rates provided by a third-party pricing service.
The Board of Trustees has delegated primary responsibility for determining or causing to be determined the value of the fund’s investments (including any fair valuation) to the adviser pursuant to valuation policies and procedures approved by the Board. If the adviser determines that reliable market quotations are not readily available, investments are valued at fair value as determined in good faith by the adviser in accordance with such procedures under the oversight of the Board of Trustees. Under the fund’s valuation policies and procedures, market quotations are not considered to be readily available for most types of debt instruments and floating rate loans and many types of derivatives. These investments are generally valued at fair value based on information from third-party pricing services. In addition, investments may be valued at fair value if the adviser determines that an investment’s value has been materially affected by events occurring after the close of the exchange or market on which the investment is principally
15
MFS Global Governments Portfolio
Notes to Financial Statements (unaudited) – continued
traded (such as foreign exchange or market) and prior to the determination of the fund’s net asset value, or after the halting of trading of a specific security where trading does not resume prior to the close of the exchange or market on which the security is principally traded. The adviser generally relies on third-party pricing services or other information (such as the correlation with price movements of similar securities in the same or other markets; the type, cost and investment characteristics of the security; the business and financial condition of the issuer; and trading and other market data) to assist in determining whether to fair value and at what value to fair value an investment. The value of an investment for purposes of calculating the fund’s net asset value can differ depending on the source and method used to determine value. When fair valuation is used, the value of an investment used to determine the fund’s net asset value may differ from quoted or published prices for the same investment. There can be no assurance that the fund could obtain the fair value assigned to an investment if it were to sell the investment at the same time at which the fund determines its net asset value per share.
Various inputs are used in determining the value of the fund’s assets or liabilities. These inputs are categorized into three broad levels. In certain cases, the inputs used to measure fair value may fall into different levels of the fair value hierarchy. In such cases, an investment’s level within the fair value hierarchy is based on the lowest level of input that is significant to the fair value measurement. The fund’s assessment of the significance of a particular input to the fair value measurement in its entirety requires judgment, and considers factors specific to the investment. Level 1 includes unadjusted quoted prices in active markets for identical assets or liabilities. Level 2 includes other significant observable market-based inputs (including quoted prices for similar securities, interest rates, prepayment speed, and credit risk). Level 3 includes unobservable inputs, which may include the adviser’s own assumptions in determining the fair value of investments. Other financial instruments are derivative instruments, such as futures contracts, forward foreign currency exchange contracts, and swap agreements. The following is a summary of the levels used as of June 30, 2018 in valuing the fund’s assets or liabilities:
| | | | | | | | | | | | | | | | |
| Financial Instruments | | Level 1 | | | Level 2 | | | Level 3 | | | Total | |
| U.S. Treasury Bonds & U.S. Government | | | | | | | | | | | | | | | | |
| Agency & Equivalents | | | $— | | | | $59,654,000 | | | | $— | | | | $59,654,000 | |
| Non-U.S. Sovereign Debt | | | — | | | | 84,744,157 | | | | — | | | | 84,744,157 | |
| Residential Mortgage-Backed Securities | | | — | | | | 815,517 | | | | — | | | | 815,517 | |
| Commercial Mortgage-Backed Securities | | | — | | | | 4 | | | | — | | | | 4 | |
| Mutual Funds | | | 1,609,273 | | | | — | | | | — | | | | 1,609,273 | |
| Total | | | $1,609,273 | | | | $145,213,678 | | | | $— | | | | $146,822,951 | |
| | | | |
| Other Financial Instruments | | | | | | | | | | | | |
| Futures Contracts – Assets | | | $267 | | | | $— | | | | $— | | | | $267 | |
| Futures Contracts – Liabilities | | | (22,503 | ) | | | — | | | | — | | | | (22,503 | ) |
| Forward Foreign Currency Exchange Contracts – Assets | | | — | | | | 496,827 | | | | — | | | | 496,827 | |
| Forward Foreign Currency Exchange Contracts – Liabilities | | | — | | | | (491,626 | ) | | | — | | | | (491,626 | ) |
| Swap Agreements – Liabilities | | | — | | | | (5,073 | ) | | | — | | | | (5,073 | ) |
For further information regarding security characteristics, see the Portfolio of Investments.
Foreign Currency Translation – Purchases and sales of foreign investments, income, and expenses are converted into U.S. dollars based upon currency exchange rates prevailing on the respective dates of such transactions or on the reporting date for foreign denominated receivables and payables. Gains and losses attributable to foreign currency exchange rates on sales of securities are recorded for financial statement purposes as net realized gains and losses on investments. Gains and losses attributable to foreign exchange rate movements on receivables, payables, income and expenses are recorded for financial statement purposes as foreign currency transaction gains and losses. That portion of both realized and unrealized gains and losses on investments that results from fluctuations in foreign currency exchange rates is not separately disclosed.
Derivatives – The fund uses derivatives primarily to increase or decrease exposure to a particular market or segment of the market, or security, to increase or decrease interest rate or currency exposure, or as alternatives to direct investments. Derivatives are used for hedging or non-hedging purposes. While hedging can reduce or eliminate losses, it can also reduce or eliminate gains. When the fund uses derivatives as an investment to increase market exposure, or for hedging purposes, gains and losses from derivative instruments may be substantially greater than the derivative’s original cost.
The derivative instruments used by the fund during the period were futures contracts, forward foreign currency exchange contracts, and swap agreements. Depending on the type of derivative, the fund may exit a derivative position by entering into an offsetting transaction with a counterparty or exchange, negotiating an agreement with the derivative counterparty, or novating the position to a third party. The fund’s period end derivatives, as presented in the Portfolio of Investments and the associated Derivative Contract tables, generally are indicative of the volume of its derivative activity during the period.
16
MFS Global Governments Portfolio
Notes to Financial Statements (unaudited) – continued
The following table presents, by major type of derivative contract, the fair value, on a gross basis, of the asset and liability components of derivatives held by the fund at June 30, 2018 as reported in the Statement of Assets and Liabilities:
| | | | | | | | | | |
| | | | | Fair Value (a) | |
| Risk | | Derivative Contracts | | Asset Derivatives | | | Liability Derivatives | |
| Interest Rate | | Interest Rate Futures | | | $267 | | | | $(22,503 | ) |
| Foreign Exchange | | Forward Foreign Currency Exchange | | | 496,827 | | | | (491,626 | ) |
| Interest rate | | Inflation Swaps | | | — | | | | (5,073 | ) |
| Total | | | | | $497,094 | | | | $(519,202 | ) |
| (a) | Values presented in this table for futures contracts correspond to the values reported in the fund’s Portfolio of Investments. Only the current day net variation margin for futures contracts is separately reported within the fund’s Statement of Assets and Liabilities. |
The following table presents, by major type of derivative contract, the realized gain (loss) on derivatives held by the fund for the six months ended June 30, 2018 as reported in the Statement of Operations:
| | | | | | | | |
| Risk | | Futures Contracts | | | Forward Foreign
Currency
Exchange
Contracts | |
| Interest Rate | | | $(102,064 | ) | | | $— | |
| Foreign Exchange | | | — | | | | (43,703 | ) |
| Total | | | $(102,064 | ) | | | $(43,703 | ) |
The following table presents, by major type of derivative contract, the change in unrealized appreciation or depreciation on derivatives held by the fund for the six months ended June 30, 2018 as reported in the Statement of Operations:
| | | | | | | | | | | | |
| Risk | | Futures
Contracts | | | Swap
Agreements | | | Forward Foreign
Currency
Exchange
Contracts | |
| Interest Rate | | | $(22,236 | ) | | | $(5,073 | ) | | | $— | |
| Foreign Exchange | | | — | | | | — | | | | 221,211 | |
| Total | | | $(22,236 | ) | | | $(5,073 | ) | | | $221,211 | |
Derivative counterparty credit risk is managed through formal evaluation of the creditworthiness of all potential counterparties. On certain, but not all, uncleared derivatives, the fund attempts to reduce its exposure to counterparty credit risk whenever possible by entering into an ISDA Master Agreement on a bilateral basis. The ISDA Master Agreement gives each party to the agreement the right to terminate all transactions traded under such agreement if there is a specified deterioration in the credit quality of the other party. Upon an event of default or a termination of the ISDA Master Agreement, the non-defaulting party has the right to close out all transactions traded under such agreement and to net amounts owed under each agreement to one net amount payable by one party to the other. This right to close out and net payments across all transactions traded under the ISDA Master Agreement could result in a reduction of the fund’s credit risk to such counterparty equal to any amounts payable by the fund under the applicable transactions, if any.
Collateral and margin requirements differ by type of derivative. For cleared derivatives (e.g., futures contracts, cleared swaps, and exchange-traded options), margin requirements are set by the clearing broker and the clearing house and collateral, in the form of cash or securities, is posted by the fund directly with the clearing broker. Collateral terms are counterparty agreement specific for uncleared derivatives (e.g., forward foreign currency exchange contracts, uncleared swap agreements, and uncleared options) and collateral, in the form of cash and securities, is held in segregated accounts with the fund’s custodian in connection with these agreements. For derivatives traded under an ISDA Master Agreement, which contains a collateral support annex, the collateral requirements are netted across all transactions traded under such counterparty-specific agreement and one amount is posted from one party to the other to collateralize such obligations. Cash that has been segregated or delivered to cover the fund’s collateral or margin obligations under derivative contracts, if any, will be reported separately in the Statement of Assets and Liabilities as restricted cash for uncleared derivatives and/or deposits with brokers for cleared derivatives. Securities pledged as collateral or margin for the same purpose, if any, are noted in the Portfolio of Investments. The fund may be required to make payments of interest on uncovered collateral or margin obligations with the broker. Any such payments are included in “Miscellaneous” expense in the Statement of Operations.
Futures Contracts – The fund entered into futures contracts which may be used to hedge against or obtain broad market exposure, interest rate exposure, currency exposure, or to manage duration. A futures contract represents a commitment for the future purchase or sale of an asset at a specified price on a specified date.
17
MFS Global Governments Portfolio
Notes to Financial Statements (unaudited) – continued
Upon entering into a futures contract, the fund is required to deposit with the broker, either in cash or securities, an initial margin in an amount equal to a specified percentage of the notional amount of the contract. Subsequent payments (variation margin) are made or received by the fund each day, depending on the daily fluctuations in the value of the contract, and are recorded for financial statement purposes as unrealized gain or loss by the fund until the contract is closed or expires at which point the gain or loss on futures contracts is realized.
The fund bears the risk of interest rates, exchange rates or securities prices moving unexpectedly, in which case, the fund may not achieve the anticipated benefits of the futures contracts and may realize a loss. While futures contracts may present less counterparty risk to the fund since the contracts are exchange traded and the exchange’s clearinghouse guarantees payments to the broker, there is still counterparty credit risk due to the insolvency of the broker. The fund’s maximum risk of loss due to counterparty credit risk is equal to the margin posted by the fund to the broker plus any gains or minus any losses on the outstanding futures contracts.
Forward Foreign Currency Exchange Contracts – The fund entered into forward foreign currency exchange contracts for the purchase or sale of a specific foreign currency at a fixed price on a future date. These contracts may be used to hedge the fund’s currency risk or for non-hedging purposes. For hedging purposes, the fund may enter into contracts to deliver or receive foreign currency that the fund will receive from or use in its normal investment activities. The fund may also use contracts to hedge against declines in the value of foreign currency denominated securities due to unfavorable exchange rate movements. For non-hedging purposes, the fund may enter into contracts with the intent of changing the relative exposure of the fund’s portfolio of securities to different currencies to take advantage of anticipated exchange rate changes.
Forward foreign currency exchange contracts are adjusted by the daily exchange rate of the underlying currency and any unrealized gains or losses are recorded as a receivable or payable for forward foreign currency exchange contracts until the contract settlement date. On contract settlement date, any gain or loss on the contract is recorded as realized gains or losses on forward foreign currency exchange contracts.
Risks may arise upon entering into these contracts from unanticipated movements in the value of the contract and from the potential inability of counterparties to meet the terms of their contracts. Generally, the fund’s maximum risk due to counterparty credit risk is the unrealized gain on the contract due to the use of Continuous Linked Settlement, a multicurrency cash settlement system for the centralized settlement of foreign transactions. This risk is mitigated in cases where there is an ISDA Master Agreement between the fund and the counterparty providing for netting as described above and, where applicable, by the posting of collateral by the counterparty to the fund to cover the fund’s exposure to the counterparty under such ISDA Master Agreement.
Swap Agreements – During the period the fund entered into swap agreements. Swap agreements generally involve a periodic exchange of cash payments on a net basis, at specified intervals or upon the occurrence of specified events, between the fund and a counterparty. Certain swap agreements may be entered into as a bilateral contract (“uncleared swaps”) while others are required to be centrally cleared (“cleared swaps”). In a cleared swap transaction, the ultimate counterparty to the transaction is a clearinghouse (the “clearinghouse”). The contract is transferred and accepted by the clearinghouse immediately following execution of the swap contract with an executing broker. Thereafter, throughout the term of the cleared swap, the fund interfaces indirectly with the clearinghouse through a clearing broker and has counterparty risk to the clearing broker as well.
Amounts paid or received at the inception of uncleared swap agreements are presented parenthetically as premiums paid or received and reflected in the value of the uncleared swap in the Statement of Assets and Liabilities. Those premiums are amortized using the effective interest method over the term of the agreement as realized gain or loss on swap agreements in the Statement of Operations. The value of the uncleared swap agreements, which is adjusted daily and includes any related interest accruals to be paid or received by the fund, is recorded in the Statement of Assets and Liabilities as “Uncleared swaps, at value”. The daily change in the value of uncleared swaps, including any related interest accruals to be paid or received, is recorded as unrealized appreciation or depreciation on swap agreements in the Statement of Operations. For cleared swaps, the daily change in valuation is recorded as a receivable or payable for variation margin in the Statement of Assets and Liabilities and reflected in unrealized appreciation or depreciation on swap agreements in the Statement of Operations. The periodic exchange of net cash payments, at specified intervals or upon the occurrence of specified events as stipulated by the agreement, is recorded as realized gain or loss on swap agreements in the Statement of Operations. A liquidation payment received or made upon early termination is recorded as a realized gain or loss on swap agreements in the Statement of Operations.
Risks related to swap agreements include the possible lack of a liquid market, unfavorable market and interest rate movements of the underlying instrument and the failure of the counterparty to perform under the terms of the agreements. The fund’s maximum risk of loss from counterparty credit risk is the discounted net value of the cash flows to be received from/paid to the counterparty over the contract’s remaining life, to the extent that the amount is positive. To address counterparty risk, uncleared swap agreements are limited to only highly-rated counterparties. Risk is further reduced by having an ISDA Master Agreement between the fund and the counterparty providing for netting as described above and, where applicable, by the posting of collateral by the
18
MFS Global Governments Portfolio
Notes to Financial Statements (unaudited) – continued
counterparty to the fund to cover the fund’s exposure to the counterparty under such ISDA Master Agreement. The fund’s counterparty risk due to cleared swaps is mitigated by the fact that the clearinghouse is the true counterparty to the transaction and the regulatory requirement safeguards in the event of a clearing broker bankruptcy.
The fund entered into inflation swap agreements in order to manage its exposure to inflation risk. Inflation swap agreements involve the periodic exchange of cash flows, between the fund and a counterparty, based on the difference between two rates applied to a notional principal amount. The two rates exchanged are generally a fixed rate and a floating rate based on an inflation index.
Indemnifications – Under the fund’s organizational documents, its officers and Trustees may be indemnified against certain liabilities and expenses arising out of the performance of their duties to the fund. Additionally, in the normal course of business, the fund enters into agreements with service providers that may contain indemnification clauses. The fund’s maximum exposure under these agreements is unknown as this would involve future claims that may be made against the fund that have not yet occurred.
Investment Transactions and Income – Investment transactions are recorded on the trade date. Interest income is recorded on the accrual basis. All premium and discount is amortized or accreted for financial statement purposes in accordance with U.S. generally accepted accounting principles. Interest payments received in additional securities are recorded on the ex-interest date in an amount equal to the value of the security on such date.
The fund may receive proceeds from litigation settlements. Any proceeds received from litigation involving portfolio holdings are reflected in the Statement of Operations in realized gain/loss if the security has been disposed of by the fund or in unrealized gain/loss if the security is still held by the fund. Any other proceeds from litigation not related to portfolio holdings are reflected as other income in the Statement of Operations.
Tax Matters and Distributions – The fund intends to qualify as a regulated investment company, as defined under Subchapter M of the Internal Revenue Code, and to distribute all of its taxable income, including realized capital gains. As a result, no provision for federal income tax is required. The fund’s federal tax returns, when filed, will remain subject to examination by the Internal Revenue Service for a three year period. Management has analyzed the fund’s tax positions taken on federal and state tax returns for all open tax years and does not believe that there are any uncertain tax positions that require recognition of a tax liability. Foreign taxes, if any, have been accrued by the fund in the accompanying financial statements in accordance with the applicable foreign tax law. Foreign income taxes may be withheld by certain countries in which the fund invests. Additionally, capital gains realized by the fund on securities issued in or by certain foreign countries may be subject to capital gains tax imposed by those countries.
Distributions to shareholders are recorded on the ex-dividend date. Income and capital gain distributions are determined in accordance with income tax regulations, which may differ from U.S. generally accepted accounting principles. Certain capital accounts in the financial statements are periodically adjusted for permanent differences in order to reflect their tax character. These adjustments have no impact on net assets or net asset value per share. Temporary differences which arise from recognizing certain items of income, expense, gain or loss in different periods for financial statement and tax purposes will reverse at some time in the future. Distributions in excess of net investment income or net realized gains are temporary overdistributions for financial statement purposes resulting from differences in the recognition or classification of income or distributions for financial statement and tax purposes.
Book/tax differences primarily relate to amortization and accretion of debt securities, wash sale loss deferrals, straddle loss deferrals, and derivative transactions.
The fund declared no distributions for the current period or for the year ended December 31, 2017.
The federal tax cost and the tax basis components of distributable earnings were as follows:
| | | | |
| As of 6/30/18 | | | | |
| Cost of investments | | | $148,106,263 | |
| Gross appreciation | | | 330,156 | |
| Gross depreciation | | | (1,613,468 | ) |
| Net unrealized appreciation (depreciation) | | | $(1,283,312 | ) |
| |
| As of 12/31/17 | | | | |
| Undistributed ordinary income | | | 1,439,566 | |
| Capital loss carryforwards | | | (6,036,209 | ) |
| Other temporary differences | | | 19,566 | |
| Net unrealized appreciation (depreciation) | | | 3,815,050 | |
19
MFS Global Governments Portfolio
Notes to Financial Statements (unaudited) – continued
As of December 31, 2017, the fund had capital loss carryforwards available to offset future realized gains. These net capital losses may be carried forward indefinitely and their character is retained as short-term and/or long-term losses. Such losses are characterized as follows:
| | | | |
| Short-Term | | | $(3,386,902 | ) |
| Long-Term | | | (2,649,307 | ) |
| Total | | | $(6,036,209 | ) |
Multiple Classes of Shares of Beneficial Interest – The fund offers multiple classes of shares, which differ in their respective distribution and/or service fees. The fund’s income, realized and unrealized gain (loss), and common expenses are allocated to shareholders based on the daily net assets of each class. Dividends are declared separately for each class. Differences in per share dividend rates are generally due to differences in separate class expenses.
| (3) | | Transactions with Affiliates |
Investment Adviser – The fund has an investment advisory agreement with MFS to provide overall investment management and related administrative services and facilities to the fund. The management fee is computed daily and paid monthly at the following annual rates based on the fund’s average daily net assets:
| | | | |
| Up to $300 million | | | 0.75% | |
| In excess of $300 million and up to $1 billion | | | 0.675% | |
| In excess of $1 billion | | | 0.625% | |
MFS has also agreed in writing to reduce its management fee by a specified amount if certain MFS mutual fund assets exceed thresholds agreed to by MFS and the fund’s Board of Trustees. For the six months ended June 30, 2018, this management fee reduction amounted to $7,058, which is included in the reduction of total expenses in the Statement of Operations. The management fee incurred for the six months ended June 30, 2018 was equivalent to an annual effective rate of 0.74% of the fund’s average daily net assets.
The investment adviser has agreed in writing to pay a portion of the fund’s total annual operating expenses, excluding interest, taxes, extraordinary expenses, brokerage and transaction costs, and investment-related expenses, such that total annual operating expenses do not exceed 1.00% of average daily net assets for the Initial Class shares and 1.25% of average daily net assets for the Service Class shares. This written agreement will continue until modified by the fund’s Board of Trustees, but such agreement will continue at least until April 30, 2020. For the six months ended June 30, 2018, the fund’s actual operating expenses did not exceed the limit and therefore, the investment adviser did not pay any portion of the fund’s expenses related to this agreement.
Distributor – MFS Fund Distributors, Inc. (MFD), a wholly-owned subsidiary of MFS, is the distributor of shares of the fund. The Trustees have adopted a distribution plan for the Service Class shares pursuant to Rule 12b-1 under the Investment Company Act of 1940.
The fund’s distribution plan provides that the fund will pay MFD distribution and/or service fees equal to 0.25% per annum of its average daily net assets attributable to Service Class shares as partial consideration for services performed and expenses incurred by MFD and financial intermediaries (including participating insurance companies that invest in the fund to fund variable annuity and variable life insurance contracts, sponsors of qualified retirement and pension plans that invest in the fund, and affiliates of these participating insurance companies and plan sponsors) in connection with the sale and distribution of the Service Class shares. MFD may subsequently pay all, or a portion, of the distribution and/or service fees to financial intermediaries.
Shareholder Servicing Agent – MFS Service Center, Inc. (MFSC), a wholly-owned subsidiary of MFS, receives a fee from the fund for its services as shareholder servicing agent. For the six months ended June 30, 2018, the fee was $995, which equated to 0.0013% annually of the fund’s average daily net assets. MFSC also receives payment from the fund for out-of-pocket expenses paid by MFSC on behalf of the fund. For the six months ended June 30, 2018, these costs amounted to $38.
Administrator – MFS provides certain financial, legal, shareholder communications, compliance, and other administrative services to the fund. Under an administrative services agreement, the fund reimburses MFS the costs incurred to provide these services. The fund is charged an annual fixed amount of $17,500 plus a fee based on average daily net assets. The administrative services fee incurred for the six months ended June 30, 2018 was equivalent to an annual effective rate of 0.0215% of the fund’s average daily net assets.
Trustees’ and Officers’ Compensation – The fund pays compensation to independent Trustees in the form of a retainer, attendance fees, and additional compensation to Board and Committee chairpersons. The fund does not pay compensation directly to Trustees or officers of the fund who are also officers of the investment adviser, all of whom receive remuneration for their services to the fund from MFS. Certain officers and Trustees of the fund are officers or directors of MFS, MFD, and MFSC.
20
MFS Global Governments Portfolio
Notes to Financial Statements (unaudited) – continued
Other – This fund and certain other funds managed by MFS (the funds) have entered into a service agreement (the ISO Agreement) which provides for payment of fees solely by the funds to Tarantino LLC in return for the provision of services of an Independent Senior Officer (ISO) for the funds. Frank L. Tarantino serves as the ISO and is an officer of the funds and the sole member of Tarantino LLC. The funds can terminate the ISO Agreement with Tarantino LLC at any time under the terms of the ISO Agreement. For the six months ended June 30, 2018, the fee paid by the fund under this agreement was $134 and is included in “Miscellaneous” expense in the Statement of Operations. MFS has agreed to bear all expenses associated with office space, other administrative support, and supplies provided to the ISO.
The fund invests in the MFS Institutional Money Market Portfolio which is managed by MFS and seeks current income consistent with preservation of capital and liquidity. This money market fund does not pay a management fee to MFS.
For the six months ended June 30, 2018, purchases and sales of investments, other than short-term obligations, were as follows:
| | | | | | | | |
| | | Purchases | | | Sales | |
| U.S. Government securities | | | $25,039,527 | | | | $19,170,138 | |
| Non-U.S. Government securities | | | $41,386,835 | | | | $46,517,826 | |
| (5) | | Shares of Beneficial Interest |
The fund’s Declaration of Trust permits the Trustees to issue an unlimited number of full and fractional shares of beneficial interest. Transactions in fund shares were as follows:
| | | | | | | | | | | | | | | | |
| | | Six months ended 6/30/18 | | | Year ended 12/31/17 | |
| | | Shares | | | Amount | | | Shares | | | Amount | |
| Shares sold | | | | | | | | | | | | | | | | |
Initial Class | | | 44,779 | | | | $473,026 | | | | 218,274 | | | | $2,232,217 | |
Service Class | | | 11,871 | | | | 124,261 | | | | 16,354 | | | | 161,407 | |
| | | 56,650 | | | | $597,287 | | | | 234,628 | | | | $2,393,624 | |
| Shares reacquired | | | | | | | | | | | | | | | | |
Initial Class | | | (1,065,324 | ) | | | $(11,411,844 | ) | | | (1,530,744 | ) | | | $(15,870,105 | ) |
Service Class | | | (25,236 | ) | | | (262,127 | ) | | | (78,628 | ) | | | (794,204 | ) |
| | | (1,090,560 | ) | | | $(11,673,971 | ) | | | (1,609,372 | ) | | | $(16,664,309 | ) |
| Net change | | | | | | | | | | | | | | | | |
Initial Class | | | (1,020,545 | ) | | | $(10,938,818 | ) | | | (1,312,470 | ) | | | $(13,637,888 | ) |
Service Class | | | (13,365 | ) | | | (137,866 | ) | | | (62,274 | ) | | | (632,797 | ) |
| | | (1,033,910 | ) | | | $(11,076,684 | ) | | | (1,374,744 | ) | | | $(14,270,685 | ) |
The fund is one of several mutual funds in which certain MFS funds may invest. The MFS funds do not invest in the underlying funds for the purpose of exercising management or control. At the end of the period, the MFS Moderate Allocation Portfolio, the MFS Conservative Allocation Portfolio, and the MFS Growth Allocation Portfolio were the owners of record of approximately 52%, 28%, and 10%, respectively, of the value of outstanding voting shares of the fund.
The fund and certain other funds managed by MFS participate in a $1.25 billion unsecured committed line of credit, subject to a $1 billion sublimit, provided by a syndication of banks under a credit agreement. Borrowings may be made for temporary financing needs. Interest is charged to each fund, based on its borrowings, generally at a rate equal to the higher of the Overnight Bank Funding rate or daily one month LIBOR plus an agreed upon spread. A commitment fee, based on the average daily, unused portion of the committed line of credit, is allocated among the participating funds. In addition, the fund and other funds managed by MFS have established unsecured uncommitted borrowing arrangements with certain banks for temporary financing needs. Interest is charged to each fund, based on its borrowings, at a rate equal to the Overnight Bank Funding rate plus an agreed upon spread. For the six months ended June 30, 2018, the fund’s commitment fee and interest expense were $547 and $0, respectively, and are included in “Miscellaneous” expense in the Statement of Operations.
21
MFS Global Governments Portfolio
Notes to Financial Statements (unaudited) – continued
| (7) | | Investments in Affiliated Issuers |
An affiliated issuer may be considered one in which the fund owns 5% or more of the outstanding voting securities, or a company which is under common control. For the purposes of this report, the fund assumes the following to be affiliated issuers:
| | | | | | | | | | | | | | | | | | |
| Affiliated Issuers | | | | Beginning
Shares/Par
Amount | | | Acquisitions
Shares/Par
Amount | | | Dispositions
Shares/Par
Amount | | | Ending
Shares/Par
Amount | |
| MFS Institutional Money Market Portfolio | | | | | 11,035,474 | | | | 41,926,117 | | | | (51,352,318 | ) | | | 1,609,273 | |
| | | | | |
| Affiliated Issuers | | Realized
Gain (Loss) | | Change in
Unrealized
Appreciation/
Depreciation | | | Capital Gain
Distributions | | | Dividend
Income | | | Ending
Value | |
| MFS Institutional Money Market Portfolio | | $(532) | | | $694 | | | | $— | | | | $37,450 | | | | $1,609,273 | |
22
MFS Global Governments Portfolio
PROXY VOTING POLICIES AND INFORMATION
MFS votes proxies on behalf of the fund pursuant to proxy voting policies and procedures that are available without charge, upon request, by calling 1-800-225-2606, by visiting mfs.com/proxyvoting, or by visiting the SEC’s Web site at http://www.sec.gov.
Information regarding how the fund voted proxies relating to portfolio securities during the most recent twelve-month period ended June 30 is available by August 31 of each year without charge by visiting mfs.com/proxyvoting, or by visiting the SEC’s Web site at http://www.sec.gov.
QUARTERLY PORTFOLIO DISCLOSURE
The fund will file a complete schedule of portfolio holdings with the Securities and Exchange Commission (the Commission) for the first and third quarters of each fiscal year on Form N-Q. The fund’s Form N-Q is available on the EDGAR database on the Commission’s Internet Web site at http://www.sec.gov, and may be reviewed and copied at the:
Public Reference Room
Securities and Exchange Commission
100 F Street, NE, Room 1580
Washington, D.C. 20549
Information on the operation of the Public Reference Room may be obtained by calling the Commission at 1-800-SEC-0330. Copies of the fund’s Form N-Q also may be obtained, upon payment of a duplicating fee, by electronic request at the following e-mail address: publicinfo@sec.gov or by writing the Public Reference Section at the above address.
FURTHER INFORMATION
From time to time, MFS may post important information about the fund or the MFS funds on the MFS web site (mfs.com). This information is available at https://www.mfs.com/en-us/what-we-do/announcements.html or at mfs.com/vit2 by choosing the fund’s name.
INFORMATION ABOUT FUND CONTRACTS AND LEGAL CLAIMS
The fund has entered into contractual arrangements with an investment adviser, administrator, distributor, shareholder servicing agent, 529 program manager (if applicable), and custodian who each provide services to the fund. Unless expressly stated otherwise, shareholders are not parties to, or intended beneficiaries of these contractual arrangements, and these contractual arrangements are not intended to create any shareholder right to enforce them against the service providers or to seek any remedy under them against the service providers, either directly or on behalf of the fund.
Under the Trust’s By-Laws and Declaration of Trust, any claims asserted against or on behalf of the MFS Funds, including claims against Trustees and Officers, must be brought in state and federal courts located within the Commonwealth of Massachusetts.
23
Semiannual Report
June 30, 2018

MFS® Global Growth Portfolio

MFS® Variable Insurance Trust II
WGO-SEM
MFS® Global Growth Portfolio
CONTENTS
The report is prepared for the general information of contract owners. It is authorized for distribution to prospective investors only when preceded or accompanied by a current prospectus.
NOT FDIC INSURED • MAY LOSE VALUE • NO BANK OR CREDIT UNION GUARANTEE • NOT A DEPOSIT • NOT INSURED BY ANY FEDERAL GOVERNMENT AGENCY OR NCUA/NCUSIF
MFS Global Growth Portfolio
LETTER FROM THE EXECUTIVE CHAIRMAN

Dear Contract Owners:
Rising bond yields, international trade friction and geopolitical uncertainty have contributed to a measurable uptick in market volatility — a departure from the low-volatility environment that prevailed for much of 2017. In recent months, against this more challenging backdrop, global markets have given back some of the strong gains recorded during 2017 and early 2018. But global economic growth remains healthy, notwithstanding signs of a modest slowdown over the past few months, particularly in Europe and China.
Although the U.S. Federal Reserve continues to gradually raise interest rates and shrink its balance sheet, monetary policy remains accommodative around the world, with many central banks taking only tentative steps toward tighter policies. Newly enacted U.S. tax reforms have been welcomed by equity markets, while emerging market economies have recently had to contend with tighter financial conditions as a result of firmer U.S. Treasury yields and a stronger dollar. Around the world, inflation remains largely subdued, but tight labor markets and solid global demand have investors on the lookout for its potential resurgence. Increased U.S. protectionism is also a growing concern, as investors fear that trade disputes could dampen business sentiment, leading to slower global growth.
As a global investment manager, MFS® strives to create long-term value for clients through an active approach and an investment platform built on nearly a century of expertise. To make that long-term value meaningful for clients, we work to align with you on our beliefs, your needs and the time it takes to deliver on your desired outcomes.
Respectfully,

Robert J. Manning
Executive Chairman
MFS Investment Management
August 16, 2018
The opinions expressed in this letter are subject to change and may not be relied upon for investment advice. No forecasts can be guaranteed.
1
MFS Global Growth Portfolio
PORTFOLIO COMPOSITION
Portfolio structure

| | | | |
| Top ten holdings | | | | |
| Alphabet, Inc., “A” | | | 3.7% | |
| Microsoft Corp. | | | 2.6% | |
| Accenture PLC, “A” | | | 2.3% | |
| Taiwan Semiconductor Manufacturing Co. Ltd., ADR | | | 2.1% | |
| Bayer AG | | | 2.0% | |
| Reckitt Benckiser Group PLC | | | 2.0% | |
| NIKE, Inc., “B” | | | 1.9% | |
| Verisk Analytics, Inc., “A” | | | 1.8% | |
| Experian Group Ltd. | | | 1.8% | |
| Nestle S.A. | | | 1.8% | |
| |
| Equity sectors | | | | |
| Technology | | | 17.5% | |
| Consumer Staples | | | 13.9% | |
| Special Products & Services | | | 12.7% | |
| Retailing | | | 10.2% | |
| Health Care | | | 9.6% | |
| Financial Services | | | 9.5% | |
| Industrial Goods & Services | | | 8.3% | |
| Leisure | | | 8.1% | |
| Basic Materials | | | 4.4% | |
| Transportation | | | 2.6% | |
| Autos & Housing | | | 1.5% | |
| Energy | | | 0.7% | |
| | | | |
| Issuer country weightings (x) | | | | |
| United States | | | 59.1% | |
| United Kingdom | | | 8.8% | |
| Switzerland | | | 6.0% | |
| France | | | 5.5% | |
| Japan | | | 3.4% | |
| Germany | | | 3.2% | |
| China | | | 2.8% | |
| Taiwan | | | 2.1% | |
| India | | | 1.8% | |
| Other Countries | | | 7.3% | |
| |
| Currency exposure weightings (y) | | | | |
| United States Dollar | | | 60.0% | |
| British Pound Sterling | | | 10.5% | |
| Euro | | | 9.5% | |
| Swiss Franc | | | 6.0% | |
| Japanese Yen | | | 3.4% | |
| Chinese Renminbi | | | 2.8% | |
| Taiwan Dollar | | | 2.1% | |
| Indian Rupee | | | 1.8% | |
| Brazilian Real | | | 1.5% | |
| Other Currencies | | | 2.4% | |
| (x) | Represents the portfolio’s exposure to issuer countries as a percentage of a portfolio’s net assets. For purposes of this presentation, United States includes Cash & Cash Equivalents. |
| (y) | Represents the portfolio’s exposure to a particular currency as a percentage of a portfolio’s net assets. For purposes of this presentation, United States Dollar includes Cash & Cash Equivalents. |
Cash & Cash Equivalents includes any cash, investments in money market funds, short-term securities, and other assets less liabilities. Please see the Statement of Assets and Liabilities for additional information related to the fund’s cash position and other assets and liabilities.
Percentages are based on net assets as of June 30, 2018.
The portfolio is actively managed and current holdings may be different.
2
MFS Global Growth Portfolio
EXPENSE TABLE
Fund Expenses Borne by the Contract Holders during the Period,
January 1, 2018 through June 30, 2018
As a contract holder of the fund, you incur ongoing costs, including management fees; distribution and/or service (12b-1) fees; and other fund expenses. This example is intended to help you understand your ongoing costs (in dollars) of investing in the fund and to compare these costs with the ongoing costs of investing in other mutual funds.
The example is based on an investment of $1,000 invested at the beginning of the period and held for the entire period January 1, 2018 through June 30, 2018.
Actual Expenses
The first line for each share class in the following table provides information about actual account values and actual expenses. You may use the information in this line, together with the amount you invested, to estimate the expenses that you paid over the period. Simply divide your account value by $1,000 (for example, an $8,600 account value divided by $1,000 = 8.6), then multiply the result by the number in the first line under the heading entitled “Expenses Paid During Period” to estimate the expenses you paid on your account during this period.
Hypothetical Example for Comparison Purposes
The second line for each share class in the following table provides information about hypothetical account values and hypothetical expenses based on the fund’s actual expense ratio and an assumed rate of return of 5% per year before expenses, which is not the fund’s actual return. The hypothetical account values and expenses may not be used to estimate the actual ending account balance or expenses you paid for the period. You may use this information to compare the ongoing costs of investing in the fund and other funds. To do so, compare this 5% hypothetical example with the 5% hypothetical examples that appear in the shareholder reports of the other funds.
Please note that the expenses shown in the table are meant to highlight the fund’s ongoing costs only and do not take into account the fees and expenses imposed under the variable contracts through which your investment in the fund is made. Therefore, the second line for each share class in the table is useful in comparing ongoing costs associated with an investment in vehicles (such as the fund) which fund benefits under variable annuity and variable life insurance contracts and to qualified pension and retirement plans only, and will not help you determine the relative total costs of investing in the fund through variable annuity and variable life insurance contracts. If the fees and expenses imposed under the variable contracts were included, your costs would have been higher.
| | | | | | | | | | | | | | | | | | |
| Share Class | | | | Annualized
Expense Ratio | | | Beginning
Account Value
1/01/18 | | | Ending
Account Value
6/30/18 | | | Expenses Paid
During Period (p)
1/01/18-6/30/18 | |
| Initial Class | | Actual | | | 1.00% | | | | $1,000.00 | | | | $1,031.66 | | | | $5.04 | |
| | Hypothetical (h) | | | 1.00% | | | | $1,000.00 | | | | $1,019.84 | | | | $5.01 | |
| Service Class | | Actual | | | 1.25% | | | | $1,000.00 | | | | $1,030.26 | | | | $6.29 | |
| | Hypothetical (h) | | | 1.25% | | | | $1,000.00 | | | | $1,018.60 | | | | $6.26 | |
| (h) | 5% class return per year before expenses. |
| (p) | “Expenses Paid During Period” are equal to each class’s annualized expense ratio, as shown above, multiplied by the average account value over the period, multiplied by 181/365 (to reflect the one-half year period). |
3
MFS Global Growth Portfolio
PORTFOLIO OF INVESTMENTS – 6/30/18 (unaudited)
The Portfolio of Investments is a complete list of all securities owned by your fund. It is categorized by broad-based asset classes.
| | | | | | | | |
| Issuer | | Shares/Par | | | Value ($) | |
| COMMON STOCKS – 99.0% | | | | | | | | |
| Aerospace – 1.9% | | | | | |
| Rolls-Royce Holdings PLC | | | 34,238 | | | $ | 446,524 | |
| United Technologies Corp. | | | 4,753 | | | | 594,268 | |
| | | | | | | | |
| | | | | | $ | 1,040,792 | |
| | | | | | | | |
| Airlines – 0.8% | | | | | |
| Aena S.A. | | | 2,457 | | | $ | 446,174 | |
| | | | | | | | |
| Alcoholic Beverages – 3.0% | | | | | |
| AmBev S.A., ADR | | | 77,971 | | | $ | 361,006 | |
| Diageo PLC | | | 15,022 | | | | 539,225 | |
| Pernod Ricard S.A. | | | 4,678 | | | | 763,519 | |
| | | | | | | | |
| | | | | | $ | 1,663,750 | |
| | | | | | | | |
| Apparel Manufacturers – 5.8% | | | | | |
| Burberry Group PLC | | | 16,293 | | | $ | 464,458 | |
| Compagnie Financiere Richemont S.A. | | | 2,491 | | | | 211,030 | |
| LVMH Moet Hennessy Louis Vuitton SE | | | 2,644 | | | | 878,915 | |
| NIKE, Inc., “B” | | | 12,758 | | | | 1,016,557 | |
| VF Corp. | | | 7,128 | | | | 581,075 | |
| | | | | | | | |
| | | | | | $ | 3,152,035 | |
| | | | | | | | |
| Broadcasting – 0.3% | | | | | |
| Walt Disney Co. | | | 1,793 | | | $ | 187,924 | |
| | | | | | | | |
| Brokerage & Asset Managers – 1.7% | | | | | |
| Blackstone Group LP | | | 22,466 | | | $ | 722,731 | |
| Charles Schwab Corp. | | | 4,235 | | | | 216,409 | |
| | | | | | | | |
| | | | | | $ | 939,140 | |
| | | | | | | | |
| Business Services – 12.7% | | | | | |
| Accenture PLC, “A” | | | 7,713 | | | $ | 1,261,770 | |
| Brenntag AG | | | 7,612 | | | | 424,197 | |
| Cognizant Technology Solutions Corp., “A” | | | 9,947 | | | | 785,714 | |
| Compass Group PLC | | | 20,705 | | | | 441,104 | |
| Experian Group Ltd. | | | 39,811 | | | | 984,873 | |
| Fidelity National Information Services, Inc. | | | 7,742 | | | | 820,884 | |
| Fiserv, Inc. (a) | | | 12,810 | | | | 949,093 | |
| Intertek Group PLC | | | 4,022 | | | | 303,407 | |
| Verisk Analytics, Inc., “A” (a) | | | 9,174 | | | | 987,489 | |
| | | | | | | | |
| | | | | | $ | 6,958,531 | |
| | | | | | | | |
| Cable TV – 1.7% | | | | | |
| Comcast Corp., “A” | | | 28,589 | | | $ | 938,005 | |
| | | | | | | | |
| Chemicals – 0.8% | | | | | |
| PPG Industries, Inc. | | | 4,262 | | | $ | 442,097 | |
| | | | | | | | |
| Computer Software – 3.0% | | | | | |
| Dassault Systems S.A. | | | 1,600 | | | $ | 223,896 | |
| Microsoft Corp. | | | 14,408 | | | | 1,420,773 | |
| | | | | | | | |
| | | | | | $ | 1,644,669 | |
| | | | | | | | |
| Computer Software – Systems – 1.3% | | | | | |
| Apple, Inc. | | | 3,959 | | | $ | 732,851 | |
| | | | | | | | |
| Construction – 1.5% | | | | | |
| Sherwin-Williams Co. | | | 1,998 | | | $ | 814,325 | |
| | | | | | | | |
| | | | | | | | |
| Issuer | | Shares/Par | | | Value ($) | |
| COMMON STOCKS – continued | |
| Consumer Products – 7.4% | | | | | |
| Colgate-Palmolive Co. | | | 9,734 | | | $ | 630,861 | |
| Coty, Inc., “A” | | | 32,782 | | | | 462,226 | |
| Estee Lauder Cos., Inc., “A” | | | 4,709 | | | | 671,927 | |
| KOSE Corp. | | | 2,200 | | | | 474,317 | |
| L’Oréal | | | 2,844 | | | | 701,688 | |
| Reckitt Benckiser Group PLC | | | 13,356 | | | | 1,099,723 | |
| | | | | | | | |
| | | | | | $ | 4,040,742 | |
| | | | | | | | |
| Electrical Equipment – 2.8% | | | | | |
| Amphenol Corp., “A” | | | 6,574 | | | $ | 572,924 | |
| Fortive Corp. | | | 6,929 | | | | 534,295 | |
| Mettler-Toledo International, Inc. (a) | | | 705 | | | | 407,934 | |
| | | | | | | | |
| | | | | | $ | 1,515,153 | |
| | | | | | | | |
| Electronics – 5.9% | | | | | |
| Analog Devices, Inc. | | | 7,968 | | | $ | 764,291 | |
| Samsung Electronics Co. Ltd. | | | 8,681 | | | | 363,363 | |
| Taiwan Semiconductor Manufacturing Co. Ltd., ADR | | | 31,882 | | | | 1,165,606 | |
| Texas Instruments, Inc. | | | 8,641 | | | | 952,670 | |
| | | | | | | | |
| | | | | | $ | 3,245,930 | |
| | | | | | | | |
| Food & Beverages – 3.5% | | | | | |
| Chr. Hansen Holding A.S. | | | 2,068 | | | $ | 191,048 | |
| Danone S.A. | | | 5,706 | | | | 418,289 | |
| Nestle S.A. | | | 12,576 | | | | 973,593 | |
| PepsiCo, Inc. | | | 2,795 | | | | 304,292 | |
| | | | | | | | |
| | | | | | $ | 1,887,222 | |
| | | | | | | | |
| Food & Drug Stores – 1.1% | | | | | |
| Sundrug Co. Ltd. | | | 15,300 | | | $ | 620,485 | |
| | | | | | | | |
| Gaming & Lodging – 1.7% | | | | | |
| Paddy Power Betfair PLC | | | 8,641 | | | $ | 946,529 | |
| | | | | | | | |
| General Merchandise – 1.5% | | | | | |
| Dollarama, Inc. | | | 9,482 | | | $ | 367,553 | |
| Lojas Renner S.A. | | | 58,569 | | | | 443,829 | |
| | | | | | | | |
| | | | | | $ | 811,382 | |
| | | | | | | | |
| Insurance – 1.7% | | | | | |
| Aon PLC | | | 6,836 | | | $ | 937,694 | |
| | | | | | | | |
| Internet – 7.2% | | | | | |
| Alibaba Group Holding Ltd., ADR (a) | | | 4,213 | | | $ | 781,638 | |
| Alphabet, Inc., “A” (a) | | | 1,810 | | | | 2,043,834 | |
| Baidu, Inc., ADR (a) | | | 3,017 | | | | 733,131 | |
| NAVER Corp. | | | 582 | | | | 398,444 | |
| | | | | | | | |
| | | | | | $ | 3,957,047 | |
| | | | | | | | |
| Leisure & Toys – 1.2% | | | | | |
| Electronic Arts, Inc. (a) | | | 4,625 | | | $ | 652,218 | |
| | | | | | | | |
| Machinery & Tools – 3.7% | | | | | |
| Colfax Corp. (a) | | | 6,899 | | | $ | 211,454 | |
| Daikin Industries Ltd. | | | 6,100 | | | | 731,130 | |
4
MFS Global Growth Portfolio
Portfolio of Investments (unaudited) – continued
| | | | | | | | |
| Issuer | | Shares/Par | | | Value ($) | |
| COMMON STOCKS – continued | |
| Machinery & Tools – continued | | | | | |
| Nordson Corp. | | | 6,017 | | | $ | 772,643 | |
| Schindler Holding AG | | | 1,331 | | | | 286,663 | |
| | | | | | | | |
| | | | | | $ | 2,001,890 | |
| | | | | | | | |
| Medical & Health Technology & Services – 0.8% | |
| CVS Health Corp. | | | 4,931 | | | $ | 317,310 | |
| Express Scripts Holding Co. (a) | | | 1,813 | | | | 139,982 | |
| | | | | | | | |
| | | | | | $ | 457,292 | |
| | | | | | | | |
| Medical Equipment – 5.1% | | | | | |
| Abbott Laboratories | | | 11,213 | | | $ | 683,881 | |
| Cooper Cos., Inc. | | | 1,073 | | | | 252,638 | |
| Danaher Corp. | | | 4,156 | | | | 410,114 | |
| Sonova Holding AG | | | 1,324 | | | | 237,519 | |
| Thermo Fisher Scientific, Inc. | | | 4,339 | | | | 898,780 | |
| Waters Corp. (a) | | | 1,695 | | | | 328,135 | |
| | | | | | | | |
| | | | | | $ | 2,811,067 | |
| | | | | | | | |
| Oil Services – 0.7% | | | | | |
| Schlumberger Ltd. | | | 5,853 | | | $ | 392,327 | |
| | | | | | | | |
| Other Banks & Diversified Financials – 6.0% | | | | | |
| Credicorp Ltd. | | | 2,105 | | | $ | 473,878 | |
| HDFC Bank Ltd. | | | 26,312 | | | | 821,830 | |
| Julius Baer Group Ltd. | | | 8,992 | | | | 528,254 | |
| Mastercard, Inc., “A” | | | 3,355 | | | | 659,325 | |
| Visa, Inc., “A” | | | 6,223 | | | | 824,236 | |
| | | | | | | | |
| | | | | | $ | 3,307,523 | |
| | | | | | | | |
| Pharmaceuticals – 3.7% | | | | | |
| Bayer AG | | | 10,022 | | | $ | 1,104,243 | |
| Roche Holding AG | | | 2,566 | | | | 570,974 | |
| Zoetis, Inc. | | | 3,895 | | | | 331,815 | |
| | | | | | | | |
| | | | | | $ | 2,007,032 | |
| | | | | | | | |
| | | | | | | | |
| Issuer | | Shares/Par | | | Value ($) | |
| COMMON STOCKS – continued | | | | | | | | |
| Printing & Publishing – 1.5% | | | | | |
| Moody’s Corp. | | | 4,683 | | | $ | 798,732 | |
| | | | | | | | |
| Railroad & Shipping – 1.8% | | | | | |
| Adani Ports and Special Economic Zone Ltd. | | | 33,067 | | | $ | 180,091 | |
| Union Pacific Corp. | | | 5,468 | | | | 774,707 | |
| | | | | | | | |
| | | | | | $ | 954,798 | |
| | | | | | | | |
| Restaurants – 1.7% | | | | | |
| Starbucks Corp. | | | 19,038 | | | $ | 930,006 | |
| | | | | | | | |
| Specialty Chemicals – 3.6% | | | | | |
| Croda International PLC | | | 8,444 | | | $ | 535,134 | |
| Ecolab, Inc. | | | 4,922 | | | | 690,704 | |
| Sika AG | | | 3,578 | | | | 493,072 | |
| Symrise AG | | | 2,683 | | | | 235,304 | |
| | | | | | | | |
| | | | | | $ | 1,954,214 | |
| | | | | | | | |
| Specialty Stores – 1.9% | | | | | |
| AutoZone, Inc. (a) | | | 300 | | | $ | 201,279 | |
| TJX Cos., Inc. | | | 8,682 | | | | 826,353 | |
| | | | | | | | |
| | | | | | $ | 1,027,632 | |
| | | | | | | | |
Total Common Stocks
(Identified Cost, $35,142,830) | | | | | | $ | 54,217,208 | |
| | | | | | | | |
| |
| INVESTMENT COMPANIES (h) – 1.0% | | | | | |
| Money Market Funds – 1.0% | | | | | |
MFS Institutional Money Market Portfolio,
1.9% (v) (Identified Cost, $532,358) | | | 532,367 | | | $ | 532,367 | |
| | | | | | | | |
OTHER ASSETS, LESS
LIABILITIES – (0.0)% | | | | | | | (9,783 | ) |
| | | | | | | | |
| NET ASSETS – 100.0% | | | | | | $ | 54,739,792 | |
| | | | | | | | |
| (a) | | Non-income producing security. |
| (h) | | An affiliated issuer, which may be considered one in which the fund owns 5% or more of the outstanding voting securities, or a company which is under common control. At period end, the aggregate values of the fund’s investments in affiliated issuers and in unaffiliated issuers were $532,367 and $54,217,208, respectively. |
| (v) | | Affiliated issuer that is available only to investment companies managed by MFS. The rate quoted for the MFS Institutional Money Market Portfolio is the annualized seven-day yield of the fund at period end. |
The following abbreviations are used in this report and are defined:
| ADR | | American Depositary Receipt |
| PLC | | Public Limited Company |
See Notes to Financial Statements
5
MFS Global Growth Portfolio
FINANCIAL STATEMENTS | STATEMENT OF ASSETS AND LIABILITIES (unaudited)
This statement represents your fund’s balance sheet, which details the assets and liabilities comprising the total value of the fund.
| | | | |
At 6/30/18 | | | | |
Assets | | | | |
Investments in unaffiliated issuers, at value (identified cost, $35,142,830) | | | $54,217,208 | |
Investments in affiliated issuers, at value (identified cost, $532,358) | | | 532,367 | |
Foreign currency, at value (identified cost, $5,556) | | | 5,547 | |
Receivables for | | | | |
Investments sold | | | 16,275 | |
Interest and dividends | | | 157,946 | |
Receivable from investment adviser | | | 3,313 | |
Other assets | | | 351 | |
Total assets | | | $54,933,007 | |
Liabilities | | | | |
Payables for | | | | |
Fund shares reacquired | | | $133,912 | |
Payable to affiliates | | | | |
Shareholder servicing costs | | | 6 | |
Distribution and/or service fees | | | 49 | |
Payable for independent Trustees’ compensation | | | 100 | |
Deferred country tax expense payable | | | 3,139 | |
Accrued expenses and other liabilities | | | 56,009 | |
Total liabilities | | | $193,215 | |
Net assets | | | $54,739,792 | |
Net assets consist of | | | | |
Paid-in capital | | | $29,033,450 | |
Unrealized appreciation (depreciation) (net of $3,139 deferred country tax) | | | 19,070,250 | |
Accumulated net realized gain (loss) | | | 6,080,661 | |
Undistributed net investment income | | | 555,431 | |
Net assets | | | $54,739,792 | |
Shares of beneficial interest outstanding | | | 2,000,745 | |
| | | | | | | | | | | | |
| | | Net assets | | | Shares
outstanding | | | Net asset value
per share | |
Initial Class | | | $52,328,972 | | | | 1,912,252 | | | | $27.37 | |
Service Class | | | 2,410,820 | | | | 88,493 | | | | 27.24 | |
See Notes to Financial Statements
6
MFS Global Growth Portfolio
FINANCIAL STATEMENTS | STATEMENT OF OPERATIONS (unaudited)
This statement describes how much your fund earned in investment income and accrued in expenses. It also describes any gains and/or losses generated by fund operations.
| | | | |
Six months ended 6/30/18 | | | | |
Net investment income (loss) | | | | |
Income | | | | |
Dividends | | | $585,916 | |
Dividends from affiliated issuers | | | 3,454 | |
Other | | | 727 | |
Income on securities loaned | | | 4 | |
Foreign taxes withheld | | | (39,001 | ) |
Total investment income | | | $551,100 | |
Expenses | | | | |
Management fee | | | $252,878 | |
Distribution and/or service fees | | | 3,126 | |
Shareholder servicing costs | | | 912 | |
Administrative services fee | | | 9,171 | |
Independent Trustees’ compensation | | | 1,290 | |
Custodian fee | | | 13,253 | |
Shareholder communications | | | 4,398 | |
Audit and tax fees | | | 36,381 | |
Legal fees | | | 317 | |
Miscellaneous | | | 6,040 | |
Total expenses | | | $327,766 | |
Reduction of expenses by investment adviser | | | (43,372 | ) |
Net expenses | | | $284,394 | |
Net investment income (loss) | | | $266,706 | |
Realized and unrealized gain (loss) | | | | |
Realized gain (loss) (identified cost basis) | | | | |
Unaffiliated issuers (net of $252 country tax) | | | $3,178,877 | |
Affiliated issuers | | | (2 | ) |
Foreign currency | | | (2,801 | ) |
Net realized gain (loss) | | | $3,176,074 | |
Change in unrealized appreciation or depreciation | | | | |
Unaffiliated issuers (net of $5,494 decrease in deferred country tax) | | | $(1,671,170 | ) |
Affiliated issuers | | | 9 | |
Translation of assets and liabilities in foreign currencies | | | (1,625 | ) |
Net unrealized gain (loss) | | | $(1,672,786 | ) |
Net realized and unrealized gain (loss) | | | $1,503,288 | |
Change in net assets from operations | | | $1,769,994 | |
See Notes to Financial Statements
7
MFS Global Growth Portfolio
FINANCIAL STATEMENTS | STATEMENTS OF CHANGES IN NET ASSETS
These statements describe the increases and/or decreases in net assets resulting from operations, any distributions, and any shareholder transactions.
| | | | | | | | |
| | | Six months ended
6/30/18 | | | Year ended
12/31/17 | |
| | | (unaudited) | | | | |
Change in net assets | | | | | | | | |
From operations | | | | | | | | |
Net investment income (loss) | | | $266,706 | | | | $291,982 | |
Net realized gain (loss) | | | 3,176,074 | | | | 3,022,903 | |
Net unrealized gain (loss) | | | (1,672,786 | ) | | | 11,530,112 | |
Change in net assets from operations | | | $1,769,994 | | | | $14,844,997 | |
Distributions declared to shareholders | | | | | | | | |
From net investment income | | | $— | | | | $(575,035 | ) |
From net realized gain | | | — | | | | (1,825,036 | ) |
Total distributions declared to shareholders | | | $— | | | | $(2,400,071 | ) |
Change in net assets from fund share transactions | | | $(4,446,679 | ) | | | $(3,564,898 | ) |
Total change in net assets | | | $(2,676,685 | ) | | | $8,880,028 | |
Net assets | | | | | | | | |
| At beginning of period | | | 57,416,477 | | | | 48,536,449 | |
At end of period (including undistributed net investment income of $555,431 and
$288,725, respectively) | | | $54,739,792 | | | | $57,416,477 | |
See Notes to Financial Statements
8
MFS Global Growth Portfolio
FINANCIAL STATEMENTS | FINANCIAL HIGHLIGHTS
The financial highlights table is intended to help you understand the fund’s financial performance for the semiannual period and the past 5 fiscal years. Certain information reflects financial results for a single fund share. The total returns in the table represent the rate that an investor would have earned (or lost) on an investment in the fund share class (assuming reinvestment of all distributions) held for the entire period.
| | | | | | | | | | | | | | | | | | | | | | | | |
| Initial Class | | Six months ended 6/30/18 | | | Year ended | |
| | | 12/31/17 | | | 12/31/16 | | | 12/31/15 | | | 12/31/14 | | | 12/31/13 | |
| | | (unaudited) | | | | | | | | | | | | | | | | |
Net asset value, beginning of period | | | $26.53 | | | | $21.00 | | | | $20.88 | | | | $22.45 | | | | $21.63 | | | | $17.96 | |
| Income (loss) from investment operations | | | | | | | | | | | | | | | | | | | | | |
Net investment income (loss) (d) | | | $0.13 | | | | $0.13 | | | | $0.25 | (c) | | | $0.12 | | | | $0.20 | | | | $0.10 | |
Net realized and unrealized gain (loss) | | | 0.71 | | | | 6.51 | | | | 1.08 | | | | (0.53 | ) | | | 0.73 | | | | 3.70 | |
Total from investment operations | | | $0.84 | | | | $6.64 | | | | $1.33 | | | | $(0.41 | ) | | | $0.93 | | | | $3.80 | |
| Less distributions declared to shareholders | | | | | | | | | | | | | | | | | | | | | |
| From net investment income | | | $— | | | | $(0.27 | ) | | | $(0.13 | ) | | | $(0.22 | ) | | | $(0.11 | ) | | | $(0.13 | ) |
From net realized gain | | | — | | | | (0.84 | ) | | | (1.08 | ) | | | (0.94 | ) | | | — | | | | — | |
Total distributions declared to shareholders | | | $— | | | | $(1.11 | ) | | | $(1.21 | ) | | | $(1.16 | ) | | | $(0.11 | ) | | | $(0.13 | ) |
Net asset value, end of period (x) | | | $27.37 | | | | $26.53 | | | | $21.00 | | | | $20.88 | | | | $22.45 | | | | $21.63 | |
Total return (%) (k)(r)(s)(x) | | | 3.17 | (n) | | | 32.14 | | | | 6.07 | (c) | | | (1.54 | ) | | | 4.32 | | | | 21.26 | |
Ratios (%) (to average net assets)
and Supplemental data: | | | | | | | | | | | | | | | | | | | | | | | | |
Expenses before expense reductions (f) | | | 1.15 | (a) | | | 1.17 | | | | 0.72 | (c) | | | 1.17 | | | | 1.20 | | | | 1.17 | |
Expenses after expense reductions (f) | | | 1.00 | (a) | | | 1.00 | | | | 0.55 | (c) | | | 1.01 | | | | 1.12 | | | | 1.17 | |
Net investment income (loss) | | | 0.96 | (a) | | | 0.55 | | | | 1.18 | (c) | | | 0.52 | | | | 0.91 | | | | 0.49 | |
Portfolio turnover | | | 11 | (n) | | | 21 | | | | 25 | | | | 26 | | | | 25 | | | | 33 | |
Net assets at end of period (000 omitted) | | | $52,329 | | | | $54,886 | | | | $46,182 | | | | $48,932 | | | | $55,050 | | | | $60,188 | |
| | |
| Service Class | | Six months ended 6/30/18 | | | Year ended | |
| | | 12/31/17 | | | 12/31/16 | | | 12/31/15 | | | 12/31/14 | | | 12/31/13 | |
| | | (unaudited) | | | | | | | | | | | | | | | | |
Net asset value, beginning of period | | | $26.44 | | | | $20.94 | | | | $20.82 | | | | $22.38 | | | | $21.55 | | | | $17.89 | |
| Income (loss) from investment operations | | | | | | | | | | | | | | | | | | | | | |
Net investment income (loss) (d) | | | $0.10 | | | | $0.07 | | | | $0.20 | (c) | | | $0.06 | | | | $0.14 | | | | $0.05 | |
Net realized and unrealized gain (loss) | | | 0.70 | | | | 6.48 | | | | 1.08 | | | | (0.53 | ) | | | 0.73 | | | | 3.69 | |
Total from investment operations | | | $0.80 | | | | $6.55 | | | | $1.28 | | | | $(0.47 | ) | | | $0.87 | | | | $3.74 | |
| Less distributions declared to shareholders | | | | | | | | | | | | | | | | | | | | | |
From net investment income | | | $— | | | | $(0.21 | ) | | | $(0.08 | ) | | | $(0.15 | ) | | | $(0.04 | ) | | | $(0.08 | ) |
From net realized gain | | | — | | | | (0.84 | ) | | | (1.08 | ) | | | (0.94 | ) | | | — | | | | — | |
Total distributions declared to shareholders | | | $— | | | | $(1.05 | ) | | | $(1.16 | ) | | | $(1.09 | ) | | | $(0.04 | ) | | | $(0.08 | ) |
Net asset value, end of period (x) | | | $27.24 | | | | $26.44 | | | | $20.94 | | | | $20.82 | | | | $22.38 | | | | $21.55 | |
Total return (%) (k)(r)(s)(x) | | | 3.03 | (n) | | | 31.77 | | | | 5.85 | (c) | | | (1.82 | ) | | | 4.05 | | | | 20.94 | |
Ratios (%) (to average net assets)
and Supplemental data: | | | | | | | | | | | | | | | | | | | | | | | | |
Expenses before expense reductions (f) | | | 1.40 | (a) | | | 1.42 | | | | 0.94 | (c) | | | 1.42 | | | | 1.45 | | | | 1.42 | |
Expenses after expense reductions (f) | | | 1.25 | (a) | | | 1.25 | | | | 0.77 | (c) | | | 1.26 | | | | 1.37 | | | | 1.42 | |
Net investment income (loss) | | | 0.71 | (a) | | | 0.31 | | | | 0.94 | (c) | | | 0.27 | | | | 0.63 | | | | 0.23 | |
Portfolio turnover | | | 11 | (n) | | | 21 | | | | 25 | | | | 26 | | | | 25 | | | | 33 | |
Net assets at end of period (000 omitted) | | | $2,411 | | | | $2,530 | | | | $2,355 | | | | $2,031 | | | | $2,372 | | | | $3,614 | |
See Notes to Financial Statements
9
MFS Global Growth Portfolio
Financial Highlights – continued
| (c) | Amount reflects a one-time reimbursement of expenses by the custodian (or former custodian) without which net investment income and performance would be lower and expenses would be higher. Excluding the effect of the reimbursement of expenses, the total return for the year ended December 31, 2016 would have been approximately 0.55% lower. |
| (d) | Per share data is based on average shares outstanding. |
| (f) | Ratios do not reflect reductions from fees paid indirectly, if applicable. |
| (k) | The total return does not reflect expenses that apply to separate accounts. Inclusion of these charges would reduce the total return figures for all periods shown. |
| (r) | Certain expenses have been reduced without which performance would have been lower. |
| (s) | From time to time the fund may receive proceeds from litigation settlements, without which performance would be lower. |
| (x) | The net asset values and total returns have been calculated on net assets which include adjustments made in accordance with U.S. generally accepted accounting principles required at period end for financial reporting purposes. |
See Notes to Financial Statements
10
MFS Global Growth Portfolio
NOTES TO FINANCIAL STATEMENTS (unaudited)
| (1) | | Business and Organization |
MFS Global Growth Portfolio (the fund) is a diversified series of MFS Variable Insurance Trust II (the trust). The trust is organized as a Massachusetts business trust and is registered under the Investment Company Act of 1940, as amended, as an open-end management investment company. The shareholders of each series of the trust are separate accounts of insurance companies, which offer variable annuity and/or life insurance products, and qualified retirement and pension plans.
The fund is an investment company and accordingly follows the investment company accounting and reporting guidance of the Financial Accounting Standards Board (FASB) Accounting Standards Codification Topic 946 Financial Services – Investment Companies.
| (2) | | Significant Accounting Policies |
General – The preparation of financial statements in conformity with U.S. generally accepted accounting principles requires management to make estimates and assumptions that affect the reported amounts of assets and liabilities, and disclosure of contingent assets and liabilities at the date of the financial statements and the reported amounts of increases and decreases in net assets from operations during the reporting period. Actual results could differ from those estimates. In the preparation of these financial statements, management has evaluated subsequent events occurring after the date of the fund’s Statement of Assets and Liabilities through the date that the financial statements were issued. The fund invests in foreign securities, including securities of emerging market issuers. Investments in foreign securities are vulnerable to the effects of changes in the relative values of the local currency and the U.S. dollar and to the effects of changes in each country’s market, economic, industrial, political, regulatory, geopolitical, and other conditions. Investments in emerging markets can involve additional and greater risks than the risks associated with investments in developed foreign markets. Emerging markets can have less developed markets, greater custody and operational risk, less developed legal, regulatory, and accounting systems, and greater political, social, and economic instability than developed markets.
Balance Sheet Offsetting – The fund’s accounting policy with respect to balance sheet offsetting is that, absent an event of default by the counterparty or a termination of the agreement, the International Swaps and Derivatives Association (ISDA) Master Agreement, or similar agreement, does not result in an offset of reported amounts of financial assets and financial liabilities in the Statement of Assets and Liabilities across transactions between the fund and the applicable counterparty. The fund’s right to setoff may be restricted or prohibited by the bankruptcy or insolvency laws of the particular jurisdiction to which a specific master netting agreement counterparty is subject. Balance sheet offsetting disclosures, to the extent applicable to the fund, have been included in the fund’s Significant Accounting Policies note under the captions for each of the fund’s in-scope financial instruments and transactions.
Investment Valuations – Equity securities, including restricted equity securities, are generally valued at the last sale or official closing price on their primary market or exchange as provided by a third-party pricing service. Equity securities, for which there were no sales reported that day, are generally valued at the last quoted daily bid quotation on their primary market or exchange as provided by a third-party pricing service. Short-term instruments with a maturity at issuance of 60 days or less may be valued at amortized cost, which approximates market value. Open-end investment companies are generally valued at net asset value per share. Securities and other assets generally valued on the basis of information from a third-party pricing service may also be valued at a broker/dealer bid quotation. In determining values, third-party pricing services can utilize both transaction data and market information such as yield, quality, coupon rate, maturity, type of issue, trading characteristics, and other market data. The values of foreign securities and other assets and liabilities expressed in foreign currencies are converted to U.S. dollars using the mean of bid and asked prices for rates provided by a third-party pricing service.
The Board of Trustees has delegated primary responsibility for determining or causing to be determined the value of the fund’s investments (including any fair valuation) to the adviser pursuant to valuation policies and procedures approved by the Board. If the adviser determines that reliable market quotations are not readily available, investments are valued at fair value as determined in good faith by the adviser in accordance with such procedures under the oversight of the Board of Trustees. Under the fund’s valuation policies and procedures, market quotations are not considered to be readily available for most types of debt instruments and floating rate loans and many types of derivatives. These investments are generally valued at fair value based on information from third-party pricing services. In addition, investments may be valued at fair value if the adviser determines that an investment’s value has been materially affected by events occurring after the close of the exchange or market on which the investment is principally traded (such as foreign exchange or market) and prior to the determination of the fund’s net asset value, or after the halting of trading of a specific security where trading does not resume prior to the close of the exchange or market on which the security is principally traded. Events that occur on a frequent basis after foreign markets close (such as developments in foreign markets and significant movements in the U.S. markets) and prior to the determination of the fund’s net asset value may be deemed to have a material effect on the value of securities traded in foreign markets. Accordingly, the fund’s foreign equity securities may often be valued at fair value. The adviser generally relies on third-party pricing services or other information (such as the correlation with price
11
MFS Global Growth Portfolio
Notes to Financial Statements (unaudited) – continued
movements of similar securities in the same or other markets; the type, cost and investment characteristics of the security; the business and financial condition of the issuer; and trading and other market data) to assist in determining whether to fair value and at what value to fair value an investment. The value of an investment for purposes of calculating the fund’s net asset value can differ depending on the source and method used to determine value. When fair valuation is used, the value of an investment used to determine the fund’s net asset value may differ from quoted or published prices for the same investment. There can be no assurance that the fund could obtain the fair value assigned to an investment if it were to sell the investment at the same time at which the fund determines its net asset value per share.
Various inputs are used in determining the value of the fund’s assets or liabilities. These inputs are categorized into three broad levels. In certain cases, the inputs used to measure fair value may fall into different levels of the fair value hierarchy. In such cases, an investment’s level within the fair value hierarchy is based on the lowest level of input that is significant to the fair value measurement. The fund’s assessment of the significance of a particular input to the fair value measurement in its entirety requires judgment, and considers factors specific to the investment. Level 1 includes unadjusted quoted prices in active markets for identical assets or liabilities. Level 2 includes other significant observable market-based inputs (including quoted prices for similar securities, interest rates, prepayment speed, and credit risk). Level 3 includes unobservable inputs, which may include the adviser’s own assumptions in determining the fair value of investments. The following is a summary of the levels used as of June 30, 2018 in valuing the fund’s assets or liabilities:
| | | | | | | | | | | | | | | | |
| Financial Instruments | | Level 1 | | | Level 2 | | | Level 3 | | | Total | |
| Equity Securities: | | | | | | | | | | | | | | | | |
United States | | | $31,851,550 | | | | $— | | | | $— | | | | $31,851,550 | |
United Kingdom | | | 3,834,119 | | | | 980,329 | | | | — | | | | 4,814,448 | |
Switzerland | | | — | | | | 3,301,105 | | | | — | | | | 3,301,105 | |
France | | | — | | | | 2,986,308 | | | | — | | | | 2,986,308 | |
Japan | | | 1,825,931 | | | | — | | | | — | | | | 1,825,931 | |
Germany | | | 1,763,744 | | | | — | | | | — | | | | 1,763,744 | |
China | | | 1,514,769 | | | | — | | | | — | | | | 1,514,769 | |
Taiwan | | | 1,165,606 | | | | — | | | | — | | | | 1,165,606 | |
India | | | 1,001,921 | | | | — | | | | — | | | | 1,001,921 | |
Other Countries | | | 3,991,826 | | | | — | | | | — | | | | 3,991,826 | |
| Mutual Funds | | | 532,367 | | | | — | | | | — | | | | 532,367 | |
| Total | | | $47,481,833 | | | | $7,267,742 | | | | $— | | | | $54,749,575 | |
For further information regarding security characteristics, see the Portfolio of Investments.
Of the level 2 investments presented above, equity investments amounting to $6,287,413 would have been considered level 1 investments at the beginning of the period. Of the level 1 investments presented above, equity investments amounting to $3,195,142 would have been considered level 2 investments at the beginning of the period. The primary reason for changes in the classifications between levels 1 and 2 occurs when foreign equity securities are fair valued using other observable market-based inputs in place of the closing exchange price due to events occurring after the close of the exchange or market on which the investment is principally traded. The fund’s foreign equity securities may often be valued using other observable market-based inputs. The fund’s policy is to recognize transfers between the levels as of the end of the period.
Foreign Currency Translation – Purchases and sales of foreign investments, income, and expenses are converted into U.S. dollars based upon currency exchange rates prevailing on the respective dates of such transactions or on the reporting date for foreign denominated receivables and payables. Gains and losses attributable to foreign currency exchange rates on sales of securities are recorded for financial statement purposes as net realized gains and losses on investments. Gains and losses attributable to foreign exchange rate movements on receivables, payables, income and expenses are recorded for financial statement purposes as foreign currency transaction gains and losses. That portion of both realized and unrealized gains and losses on investments that results from fluctuations in foreign currency exchange rates is not separately disclosed.
Security Loans – Under its Securities Lending Agency Agreement with the fund, State Street Bank and Trust Company (“State Street”), as lending agent, loans the securities of the fund to certain qualified institutions (the “Borrowers”) approved by the fund. Security loans can be terminated at the discretion of either the lending agent or the fund and the related securities must be returned within the earlier of the standard trade settlement period for such securities or within three business days. The loans are collateralized by cash and/or U.S. Treasury and federal agency obligations in an amount typically at least equal to the market value of the securities loaned. On loans collateralized by cash, the cash collateral is invested in a money market fund. The market value of the loaned securities is determined at the close of business of the fund and any additional required collateral is delivered to the fund on the next business day. State Street provides the fund with indemnification against Borrower default. In the event of Borrower default, State Street will, for the benefit of the fund, either purchase securities identical to those loaned or, when such purchase is
12
MFS Global Growth Portfolio
Notes to Financial Statements (unaudited) – continued
commercially impracticable, pay the fund the market value of the loaned securities. In return, State Street assumes the fund’s rights to the related collateral. If the collateral value is less than the cost to purchase identical securities, State Street is responsible for the shortfall, but only to the extent that such shortfall is not due to a decline in collateral value resulting from collateral reinvestment for which the fund bears the risk of loss. A portion of the income generated upon investment of the collateral is remitted to the Borrowers, and the remainder is allocated between the fund and the lending agent. On loans collateralized by U.S. Treasury and/or federal agency obligations, a fee is received from the Borrower, and is allocated between the fund and the lending agent. Income from securities lending is separately reported in the Statement of Operations. The dividend and interest income earned on the securities loaned is accounted for in the same manner as other dividend and interest income. At June 30, 2018, there were no securities on loan or collateral outstanding.
Indemnifications – Under the fund’s organizational documents, its officers and Trustees may be indemnified against certain liabilities and expenses arising out of the performance of their duties to the fund. Additionally, in the normal course of business, the fund enters into agreements with service providers that may contain indemnification clauses. The fund’s maximum exposure under these agreements is unknown as this would involve future claims that may be made against the fund that have not yet occurred.
Investment Transactions and Income – Investment transactions are recorded on the trade date. Interest income is recorded on the accrual basis. Dividends received in cash are recorded on the ex-dividend date. Certain dividends from foreign securities will be recorded when the fund is informed of the dividend if such information is obtained subsequent to the ex-dividend date. Dividend payments received in additional securities are recorded on the ex-dividend date in an amount equal to the value of the security on such date.
The fund may receive proceeds from litigation settlements. Any proceeds received from litigation involving portfolio holdings are reflected in the Statement of Operations in realized gain/loss if the security has been disposed of by the fund or in unrealized gain/loss if the security is still held by the fund. Any other proceeds from litigation not related to portfolio holdings are reflected as other income in the Statement of Operations.
Tax Matters and Distributions – The fund intends to qualify as a regulated investment company, as defined under Subchapter M of the Internal Revenue Code, and to distribute all of its taxable income, including realized capital gains. As a result, no provision for federal income tax is required. The fund’s federal tax returns, when filed, will remain subject to examination by the Internal Revenue Service for a three year period. Management has analyzed the fund’s tax positions taken on federal and state tax returns for all open tax years and does not believe that there are any uncertain tax positions that require recognition of a tax liability. Foreign taxes, if any, have been accrued by the fund in the accompanying financial statements in accordance with the applicable foreign tax law. Foreign income taxes may be withheld by certain countries in which the fund invests. Additionally, capital gains realized by the fund on securities issued in or by certain foreign countries may be subject to capital gains tax imposed by those countries.
Distributions to shareholders are recorded on the ex-dividend date. Income and capital gain distributions are determined in accordance with income tax regulations, which may differ from U.S. generally accepted accounting principles. Certain capital accounts in the financial statements are periodically adjusted for permanent differences in order to reflect their tax character. These adjustments have no impact on net assets or net asset value per share. Temporary differences which arise from recognizing certain items of income, expense, gain or loss in different periods for financial statement and tax purposes will reverse at some time in the future. Distributions in excess of net investment income or net realized gains are temporary overdistributions for financial statement purposes resulting from differences in the recognition or classification of income or distributions for financial statement and tax purposes.
Book/tax differences primarily relate to wash sale loss deferrals.
The tax character of distributions declared to shareholders for the last fiscal year is as follows:
| | | | |
| | | Year ended
12/31/17 | |
| Ordinary income (including any short-term capital gains) | | | $717,053 | |
| Long-term capital gains | | | 1,683,018 | |
| Total distributions | | | $2,400,071 | |
13
MFS Global Growth Portfolio
Notes to Financial Statements (unaudited) – continued
The federal tax cost and the tax basis components of distributable earnings were as follows:
| | | | |
| As of 6/30/18 | | | | |
| Cost of investments | | | $35,812,600 | |
| Gross appreciation | | | 19,879,989 | |
| Gross depreciation | | | (943,014 | ) |
| Net unrealized appreciation (depreciation) | | | $18,936,975 | |
| |
| As of 12/31/17 | | | | |
| Undistributed ordinary income | | | 725,271 | |
| Undistributed long-term capital gain | | | 2,596,820 | |
| Other temporary differences | | | 627 | |
| Net unrealized appreciation (depreciation) | | | 20,613,630 | |
The aggregate cost above includes prior fiscal year end tax adjustments, if applicable.
Multiple Classes of Shares of Beneficial Interest – The fund offers multiple classes of shares, which differ in their respective distribution and/or service fees. The fund’s income, realized and unrealized gain (loss), and common expenses are allocated to shareholders based on the daily net assets of each class. Dividends are declared separately for each class. Differences in per share dividend rates are generally due to differences in separate class expenses. The fund’s distributions declared to shareholders as reported in the Statements of Changes in Net Assets are presented by class as follows:
| | | | | | | | | | | | | | | | |
| | | From net investment
income | | | From net realized
gain | |
| | | Six months ended
6/30/18 | | | Year ended
12/31/17 | | | Six months ended
6/30/18 | | | Year ended
12/31/17 | |
| Initial Class | | | $— | | | | $554,963 | | | | $— | | | | $1,744,112 | |
| Service Class | | | — | | | | 20,072 | | | | — | | | | 80,924 | |
| Total | | | $— | | | | $575,035 | | | | $— | | | | $1,825,036 | |
| (3) | | Transactions with Affiliates |
Investment Adviser – The fund has an investment advisory agreement with MFS to provide overall investment management and related administrative services and facilities to the fund. The management fee is computed daily and paid monthly at the following annual rates based on the fund’s average daily net assets:
| | | | |
| Up to $1 billion | | | 0.90% | |
| In excess of $1 billion and up to $2 billion | | | 0.75% | |
| In excess of $2 billion | | | 0.65% | |
MFS has agreed in writing to reduce its management fee by a specified amount if certain MFS mutual fund assets exceed thresholds agreed to by MFS and the fund’s Board of Trustees. For the six months ended June 30, 2018, this management fee reduction amounted to $2,590, which is included in the reduction of total expenses in the Statement of Operations. The management fee incurred for the six months ended June 30, 2018 was equivalent to an annual effective rate of 0.89% of the fund’s average daily net assets.
The investment adviser has agreed in writing to pay a portion of the fund’s total annual operating expenses, excluding interest, taxes, extraordinary expenses, brokerage and transaction costs, and investment-related expenses, such that total annual operating expenses do not exceed 1.00% of average daily net assets for the Initial Class shares and 1.25% of average daily net assets for the Service Class shares. This written agreement will continue until modified by the fund’s Board of Trustees, but such agreement will continue at least until April 30, 2020. For the six months ended June 30, 2018, this reduction amounted to $40,782, which is included in the reduction of total expenses in the Statement of Operations.
Distributor – MFS Fund Distributors, Inc. (MFD), a wholly-owned subsidiary of MFS, is the distributor of shares of the fund. The Trustees have adopted a distribution plan for the Service Class shares pursuant to Rule 12b-1 under the Investment Company Act of 1940.
The fund’s distribution plan provides that the fund will pay MFD distribution and/or service fees equal to 0.25% per annum of its average daily net assets attributable to Service Class shares as partial consideration for services performed and expenses incurred by MFD and financial intermediaries (including participating insurance companies that invest in the fund to fund variable annuity and variable life insurance contracts, sponsors of qualified retirement and pension plans that invest in the fund, and affiliates of these participating insurance companies and plan sponsors) in connection with the sale and distribution of the Service Class shares. MFD may subsequently pay all, or a portion, of the distribution and/or service fees to financial intermediaries.
14
MFS Global Growth Portfolio
Notes to Financial Statements (unaudited) – continued
Shareholder Servicing Agent – MFS Service Center, Inc. (MFSC), a wholly-owned subsidiary of MFS, receives a fee from the fund for its services as shareholder servicing agent. For the six months ended June 30, 2018, the fee was $880, which equated to 0.0031% annually of the fund’s average daily net assets. MFSC also receives payment from the fund for out-of-pocket expenses paid by MFSC on behalf of the fund. For the six months ended June 30, 2018, these costs amounted to $32.
Administrator – MFS provides certain financial, legal, shareholder communications, compliance, and other administrative services to the fund. Under an administrative services agreement, the fund reimburses MFS the costs incurred to provide these services. The fund is charged an annual fixed amount of $17,500 plus a fee based on average daily net assets. The administrative services fee incurred for the six months ended June 30, 2018 was equivalent to an annual effective rate of 0.0326% of the fund’s average daily net assets.
Trustees’ and Officers’ Compensation – The fund pays compensation to independent Trustees in the form of a retainer, attendance fees, and additional compensation to Board and Committee chairpersons. The fund does not pay compensation directly to Trustees or officers of the fund who are also officers of the investment adviser, all of whom receive remuneration for their services to the fund from MFS. Certain officers and Trustees of the fund are officers or directors of MFS, MFD, and MFSC.
Other – This fund and certain other funds managed by MFS (the funds) have entered into a service agreement (the ISO Agreement) which provides for payment of fees solely by the funds to Tarantino LLC in return for the provision of services of an Independent Senior Officer (ISO) for the funds. Frank L. Tarantino serves as the ISO and is an officer of the funds and the sole member of Tarantino LLC. The funds can terminate the ISO Agreement with Tarantino LLC at any time under the terms of the ISO Agreement. For the six months ended June 30, 2018, the fee paid by the fund under this agreement was $47 and is included in “Miscellaneous” expense in the Statement of Operations. MFS has agreed to bear all expenses associated with office space, other administrative support, and supplies provided to the ISO.
The fund invests in the MFS Institutional Money Market Portfolio which is managed by MFS and seeks current income consistent with preservation of capital and liquidity. This money market fund does not pay a management fee to MFS.
Effective January 2, 2018, the adviser has voluntarily undertaken to reimburse the fund from its own resources on a quarterly basis for the cost of investment research embedded in the cost of the fund’s securities trades. This agreement may be rescinded at any time. For the period January 2, 2018 to June 30, 2018, this reimbursement amounted to $707, which is included in “Other” income in the Statement of Operations.
For the six months ended June 30, 2018, purchases and sales of investments, other than short-term obligations, aggregated $6,255,373 and $10,592,946, respectively.
| (5) | | Shares of Beneficial Interest |
The fund’s Declaration of Trust permits the Trustees to issue an unlimited number of full and fractional shares of beneficial interest. Transactions in fund shares were as follows:
| | | | | | | | | | | | | | | | |
| | | Six months ended 6/30/18 | | | Year ended 12/31/17 | |
| | | Shares | | | Amount | | | Shares | | | Amount | |
| Shares sold | | | | | | | | | | | | | | | | |
Initial Class | | | 15,637 | | | | $429,689 | | | | 97,291 | | | | $2,411,672 | |
Service Class | | | 5,348 | | | | 143,662 | | | | 4,256 | | | | 102,294 | |
| | | 20,985 | | | | $573,351 | | | | 101,547 | | | | $2,513,966 | |
| Shares issued to shareholders in reinvestment of distributions | | | | | | | | | | | | | | | | |
Initial Class | �� | | — | | | | $— | | | | 95,003 | | | | $2,299,075 | |
Service Class | | | — | | | | — | | | | 4,184 | | | | 100,996 | |
| | | — | | | | $— | | | | 99,187 | | | | $2,400,071 | |
| Shares reacquired | | | | | | | | | | | | | | | | |
Initial Class | | | (172,397 | ) | | | $(4,680,454 | ) | | | (322,462 | ) | | | $(7,873,956 | ) |
Service Class | | | (12,535 | ) | | | (339,576 | ) | | | (25,227 | ) | | | (604,979 | ) |
| | | (184,932 | ) | | | $(5,020,030 | ) | | | (347,689 | ) | | | $(8,478,935 | ) |
| Net change | | | | | | | | | | | | | | | | |
Initial Class | | | (156,760 | ) | | | $(4,250,765 | ) | | | (130,168 | ) | | | $(3,163,209 | ) |
Service Class | | | (7,187 | ) | | | (195,914 | ) | | | (16,787 | ) | | | (401,689 | ) |
| | | (163,947 | ) | | | $(4,446,679 | ) | | | (146,955 | ) | | | $(3,564,898 | ) |
15
MFS Global Growth Portfolio
Notes to Financial Statements (unaudited) – continued
The fund and certain other funds managed by MFS participate in a $1.25 billion unsecured committed line of credit, subject to a $1 billion sublimit, provided by a syndication of banks under a credit agreement. Borrowings may be made for temporary financing needs. Interest is charged to each fund, based on its borrowings, generally at a rate equal to the higher of the Overnight Bank Funding rate or daily one month LIBOR plus an agreed upon spread. A commitment fee, based on the average daily, unused portion of the committed line of credit, is allocated among the participating funds. In addition, the fund and other funds managed by MFS have established unsecured uncommitted borrowing arrangements with certain banks for temporary financing needs. Interest is charged to each fund, based on its borrowings, at a rate equal to the Overnight Bank Funding rate plus an agreed upon spread. For the six months ended June 30, 2018, the fund’s commitment fee and interest expense were $180 and $0, respectively, and are included in “Miscellaneous” expense in the Statement of Operations.
| (7) | | Investments in Affiliated Issuers |
An affiliated issuer may be considered one in which the fund owns 5% or more of the outstanding voting securities, or a company which is under common control. For the purposes of this report, the fund assumes the following to be affiliated issuers:
| | | | | | | | | | | | | | | | | | |
| Affiliated Issuers | | | | Beginning
Shares/Par
Amount | | | Acquisitions
Shares/Par
Amount | | | Dispositions
Shares/Par
Amount | | | Ending
Shares/Par
Amount | |
| MFS Institutional Money Market Portfolio | | | | | 480,970 | | | | 5,898,018 | | | | (5,846,621 | ) | | | 532,367 | |
| | | | | |
| Affiliated Issuers | | Realized
Gain (Loss) | | Change in
Unrealized
Appreciation/
Depreciation | | | Capital Gain
Distributions | | | Dividend
Income | | | Ending
Value | |
| MFS Institutional Money Market Portfolio | | $(2) | | | $9 | | | | $— | | | | $3,454 | | | | $532,367 | |
16
MFS Global Growth Portfolio
PROXY VOTING POLICIES AND INFORMATION
MFS votes proxies on behalf of the fund pursuant to proxy voting policies and procedures that are available without charge, upon request, by calling 1-800-225-2606, by visiting mfs.com/proxyvoting, or by visiting the SEC’s Web site at http://www.sec.gov.
Information regarding how the fund voted proxies relating to portfolio securities during the most recent twelve-month period ended June 30 is available by August 31 of each year without charge by visiting mfs.com/proxyvoting, or by visiting the SEC’s Web site at http://www.sec.gov.
QUARTERLY PORTFOLIO DISCLOSURE
The fund will file a complete schedule of portfolio holdings with the Securities and Exchange Commission (the Commission) for the first and third quarters of each fiscal year on Form N-Q. The fund’s Form N-Q is available on the EDGAR database on the Commission’s Internet Web site at http://www.sec.gov, and may be reviewed and copied at the:
Public Reference Room
Securities and Exchange Commission
100 F Street, NE, Room 1580
Washington, D.C. 20549
Information on the operation of the Public Reference Room may be obtained by calling the Commission at 1-800-SEC-0330. Copies of the fund’s Form N-Q also may be obtained, upon payment of a duplicating fee, by electronic request at the following e-mail address: publicinfo@sec.gov or by writing the Public Reference Section at the above address.
FURTHER INFORMATION
From time to time, MFS may post important information about the fund or the MFS funds on the MFS web site (mfs.com). This information is available at https://www.mfs.com/en-us/what-we-do/announcements.html or at mfs.com/vit2 by choosing the fund’s name.
INFORMATION ABOUT FUND CONTRACTS AND LEGAL CLAIMS
The fund has entered into contractual arrangements with an investment adviser, administrator, distributor, shareholder servicing agent, 529 program manager (if applicable), and custodian who each provide services to the fund. Unless expressly stated otherwise, shareholders are not parties to, or intended beneficiaries of these contractual arrangements, and these contractual arrangements are not intended to create any shareholder right to enforce them against the service providers or to seek any remedy under them against the service providers, either directly or on behalf of the fund.
Under the Trust’s By-Laws and Declaration of Trust, any claims asserted against or on behalf of the MFS Funds, including claims against Trustees and Officers, must be brought in state and federal courts located within the Commonwealth of Massachusetts.
17
Semiannual Report
June 30, 2018

MFS® Global Research Portfolio

MFS® Variable Insurance Trust II
RES-SEM
MFS® Global Research Portfolio
CONTENTS
The report is prepared for the general information of contract owners. It is authorized for distribution to prospective investors only when preceded or accompanied by a current prospectus.
NOT FDIC INSURED • MAY LOSE VALUE • NO BANK OR CREDIT UNION GUARANTEE • NOT A DEPOSIT • NOT INSURED BY ANY FEDERAL GOVERNMENT AGENCY OR NCUA/NCUSIF
MFS Global Research Portfolio
LETTER FROM THE EXECUTIVE CHAIRMAN

Dear Contract Owners:
Rising bond yields, international trade friction and geopolitical uncertainty have contributed to a measurable uptick in market volatility — a departure from the low-volatility environment that prevailed for much of 2017. In recent months, against this more challenging backdrop, global markets have given back some of the strong gains recorded during 2017 and early 2018. But global economic growth remains healthy, notwithstanding signs of a modest slowdown over the past few months, particularly in Europe and China.
Although the U.S. Federal Reserve continues to gradually raise interest rates and shrink its balance sheet, monetary policy remains accommodative around the world, with many central banks taking only tentative steps toward tighter policies. Newly enacted U.S. tax reforms have been welcomed by equity markets, while emerging market economies have recently had to contend with tighter financial conditions as a result of firmer U.S. Treasury yields and a stronger dollar. Around the world, inflation remains largely subdued, but tight labor markets and solid global demand have investors on the lookout for its potential resurgence. Increased U.S. protectionism is also a growing concern, as investors fear that trade disputes could dampen business sentiment, leading to slower global growth.
As a global investment manager, MFS® strives to create long-term value for clients through an active approach and an investment platform built on nearly a century of expertise. To make that long-term value meaningful for clients, we work to align with you on our beliefs, your needs and the time it takes to deliver on your desired outcomes.
Respectfully,

Robert J. Manning
Executive Chairman
MFS Investment Management
August 16, 2018
The opinions expressed in this letter are subject to change and may not be relied upon for investment advice. No forecasts can be guaranteed.
1
MFS Global Research Portfolio
PORTFOLIO COMPOSITION
Portfolio structure
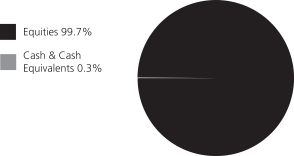
| | | | |
| Top ten holdings | | | | |
| Amazon.com, Inc. | | | 2.1% | |
| Alphabet, Inc., “A” | | | 1.9% | |
| Facebook, Inc., “A” | | | 1.9% | |
| Microsoft Corp. | | | 1.5% | |
| Citigroup, Inc | | | 1.4% | |
| Johnson & Johnson | | | 1.4% | |
| Adobe Systems, Inc. | | | 1.4% | |
| AIA Group Ltd. | | | 1.3% | |
| Salesforce.com, Inc. | | | 1.3% | |
| Medtronic PLC | | | 1.3% | |
| |
| Global equity sectors | | | | |
| Financial Services | | | 20.2% | |
| Technology | | | 19.6% | |
| Capital Goods | | | 17.3% | |
| Consumer Cyclicals | | | 11.2% | |
| Health Care | | | 11.2% | |
| Energy | | | 9.6% | |
| Consumer Staples | | | 6.6% | |
| Telecommunications/Cable Television | | | 4.0% | |
| | | | |
| Issuer country weightings (x) | | | | |
| United States | | | 58.9% | |
| Switzerland | | | 4.9% | |
| Japan | | | 4.7% | |
| France | | | 4.3% | |
| United Kingdom | | | 4.1% | |
| Canada | | | 3.5% | |
| Germany | | | 3.2% | |
| China | | | 2.9% | |
| Hong Kong | | | 2.4% | |
| Other Countries | | | 11.1% | |
| |
| Currency exposure weightings (y) | | | | |
| United States Dollar | | | 61.6% | |
| Euro | | | 12.1% | |
| Swiss Franc | | | 4.9% | |
| Japanese Yen | | | 4.7% | |
| British Pound Sterling | | | 4.5% | |
| Hong Kong Dollar | | | 3.7% | |
| Canadian Dollar | | | 3.0% | |
| Taiwan Dollar | | | 1.2% | |
| Indian Rupee | | | 1.1% | |
| Other Currencies | | | 3.2% | |
| (x) | Represents the portfolio’s exposure to issuer countries as a percentage of a portfolio’s net assets. For purposes of this presentation, United States includes Cash & Cash Equivalents. |
| (y) | Represents the portfolio’s exposure to a particular currency as a percentage of a portfolio’s net assets. For purposes of this presentation, United States Dollar includes Cash & Cash Equivalents. |
Cash & Cash Equivalents includes any cash, investments in money market funds, short-term securities, and other assets less liabilities. Please see the Statement of Assets and Liabilities for additional information related to the fund’s cash position and other assets and liabilities.
Percentages are based on net assets as of June 30, 2018.
The portfolio is actively managed and current holdings may be different.
2
MFS Global Research Portfolio
EXPENSE TABLE
Fund Expenses Borne by the Contract Holders during the Period,
January 1, 2018 through June 30, 2018
As a contract holder of the fund, you incur ongoing costs, including management fees; distribution and/or service (12b-1) fees; and other fund expenses. This example is intended to help you understand your ongoing costs (in dollars) of investing in the fund and to compare these costs with the ongoing costs of investing in other mutual funds.
The example is based on an investment of $1,000 invested at the beginning of the period and held for the entire period January 1, 2018 through June 30, 2018.
Actual Expenses
The first line for each share class in the following table provides information about actual account values and actual expenses. You may use the information in this line, together with the amount you invested, to estimate the expenses that you paid over the period. Simply divide your account value by $1,000 (for example, an $8,600 account value divided by $1,000 = 8.6), then multiply the result by the number in the first line under the heading entitled “Expenses Paid During Period” to estimate the expenses you paid on your account during this period.
Hypothetical Example for Comparison Purposes
The second line for each share class in the following table provides information about hypothetical account values and hypothetical expenses based on the fund’s actual expense ratio and an assumed rate of return of 5% per year before expenses, which is not the fund’s actual return. The hypothetical account values and expenses may not be used to estimate the actual ending account balance or expenses you paid for the period. You may use this information to compare the ongoing costs of investing in the fund and other funds. To do so, compare this 5% hypothetical example with the 5% hypothetical examples that appear in the shareholder reports of the other funds.
Please note that the expenses shown in the table are meant to highlight the fund’s ongoing costs only and do not take into account the fees and expenses imposed under the variable contracts through which your investment in the fund is made. Therefore, the second line for each share class in the table is useful in comparing ongoing costs associated with an investment in vehicles (such as the fund) which fund benefits under variable annuity and variable life insurance contracts and to qualified pension and retirement plans only, and will not help you determine the relative total costs of investing in the fund through variable annuity and variable life insurance contracts. If the fees and expenses imposed under the variable contracts were included, your costs would have been higher.
| | | | | | | | | | | | | | | | | | |
| Share Class | | | | Annualized
Expense Ratio | | | Beginning
Account Value
1/01/18 | | | Ending
Account Value
6/30/18 | | | Expenses Paid
During Period (p)
1/01/18-6/30/18 | |
| Initial Class | | Actual | | | 0.90% | | | | $1,000.00 | | | | $1,014.18 | | | | $4.49 | |
| | Hypothetical (h) | | | 0.90% | | | | $1,000.00 | | | | $1,020.33 | | | | $4.51 | |
| Service Class | | Actual | | | 1.15% | | | | $1,000.00 | | | | $1,012.97 | | | | $5.74 | |
| | Hypothetical (h) | | | 1.15% | | | | $1,000.00 | | | | $1,019.09 | | | | $5.76 | |
| (h) | 5% class return per year before expenses. |
| (p) | “Expenses Paid During Period” are equal to each class’s annualized expense ratio, as shown above, multiplied by the average account value over the period, multiplied by 181/365 (to reflect the one-half year period). |
Notes to Expense Table
Changes to the fund’s fee arrangements will occur during the fund’s current fiscal year. Had these fee changes been in effect during the six month period, the annualized expense ratios, the actual expenses paid during the period, and the hypothetical expenses paid during the period would have been approximately 0.85%, $4.24, and $4.26 for Initial Class and 1.10%, $5.49, and $5.51 for Service Class, respectively. For further information about the fund’s fee arrangements and changes to those fee arrangements, please see Note 3 in the Notes to Financial Statements.
3
MFS Global Research Portfolio
PORTFOLIO OF INVESTMENTS – 6/30/18 (unaudited)
The Portfolio of Investments is a complete list of all securities owned by your fund. It is categorized by broad-based asset classes.
| | | | | | | | |
| Issuer | | Shares/Par | | | Value ($) | |
| COMMON STOCKS – 99.7% | | | | | | | | |
| Aerospace – 3.0% | | | | | |
| Honeywell International, Inc. | | | 8,697 | | | $ | 1,252,803 | |
| Northrop Grumman Corp. | | | 3,109 | | | | 956,639 | |
| United Technologies Corp. | | | 5,912 | | | | 739,178 | |
| | | | | | | | |
| | | | | | $ | 2,948,620 | |
| | | | | | | | |
| Alcoholic Beverages – 1.7% | | | | | |
| AmBev S.A., ADR | | | 65,226 | | | $ | 301,996 | |
| China Resources Beer Holdings Co. Ltd. | | | 126,000 | | | | 611,884 | |
| Constellation Brands, Inc., “A” | | | 2,334 | | | | 510,843 | |
| Thai Beverage PLC | | | 512,500 | | | | 270,826 | |
| | | | | | | | |
| | | | | | $ | 1,695,549 | |
| | | | | | | | |
| Apparel Manufacturers – 2.0% | | | | | |
| LVMH Moet Hennessy Louis Vuitton SE | | | 2,570 | | | $ | 854,316 | |
| NIKE, Inc., “B” | | | 13,888 | | | | 1,106,596 | |
| | | | | | | | |
| | | | | | $ | 1,960,912 | |
| | | | | | | | |
| Automotive – 0.5% | | | | | |
| USS Co. Ltd. | | | 25,600 | | | $ | 487,421 | |
| | | | | | | | |
| Biotechnology – 0.7% | | | | | |
| Biogen, Inc. (a) | | | 2,499 | | | $ | 725,310 | |
| | | | | | | | |
| Brokerage & Asset Managers – 2.7% | | | | | |
| Blackstone Group LP | | | 22,089 | | | $ | 710,603 | |
| NASDAQ, Inc. | | | 8,914 | | | | 813,581 | |
| TD Ameritrade Holding Corp. | | | 8,330 | | | | 456,234 | |
| TMX Group Ltd. | | | 9,753 | | | | 639,344 | |
| | | | | | | | |
| | | | | | $ | 2,619,762 | |
| | | | | | | | |
| Business Services – 5.4% | | | | | |
| Accenture PLC, “A” | | | 4,307 | | | $ | 704,582 | |
| Cognizant Technology Solutions Corp., “A” | | | 10,065 | | | | 795,034 | |
| DXC Technology Co. | | | 13,105 | | | | 1,056,394 | |
| Fidelity National Information Services, Inc. | | | 10,225 | | | | 1,084,157 | |
| Fiserv, Inc. (a) | | | 9,828 | | | | 728,157 | |
| Global Payments, Inc. | | | 8,518 | | | | 949,672 | |
| | | | | | | | |
| | | | | | $ | 5,317,996 | |
| | | | | | | | |
| Cable TV – 0.7% | | | | | |
| Comcast Corp., “A” | | | 21,549 | | | $ | 707,023 | |
| | | | | | | | |
| Chemicals – 2.2% | | | | | |
| Celanese Corp. | | | 2,235 | | | $ | 248,219 | |
| DowDuPont, Inc. | | | 15,969 | | | | 1,052,677 | |
| PPG Industries, Inc. | | | 8,115 | | | | 841,769 | |
| | | | | | | | |
| | | | | | $ | 2,142,665 | |
| | | | | | | | |
| Computer Software – 4.1% | | | | | |
| Adobe Systems, Inc. (a) | | | 5,543 | | | $ | 1,351,439 | |
| Microsoft Corp. | | | 14,634 | | | | 1,443,059 | |
| Salesforce.com, Inc. (a) | | | 9,463 | | | | 1,290,753 | |
| | | | | | | | |
| | | | | | $ | 4,085,251 | |
| | | | | | | | |
| | | | | | | | |
| Issuer | | Shares/Par | | | Value ($) | |
| COMMON STOCKS – continued | | | | | |
| Computer Software – Systems – 1.2% | | | | | |
| Constellation Software, Inc. | | | 911 | | | $ | 706,507 | |
| SS&C Technologies Holdings, Inc. | | | 8,472 | | | | 439,697 | |
| | | | | | | | |
| | | | | | $ | 1,146,204 | |
| | | | | | | | |
| Construction – 1.3% | | | | | |
| Sherwin-Williams Co. | | | 2,149 | | | $ | 875,868 | |
| Techtronic Industries Co. Ltd. | | | 75,500 | | | | 421,016 | |
| | | | | | | | |
| | | | | | $ | 1,296,884 | |
| | | | | | | | |
| Consumer Products – 1.5% | | | | | |
| Coty, Inc., “A” | | | 20,211 | | | $ | 284,975 | |
| L’Oréal | | | 1,618 | | | | 399,202 | |
| Newell Brands, Inc. | | | 12,245 | | | | 315,799 | |
| Reckitt Benckiser Group PLC | | | 5,666 | | | | 466,534 | |
| | | | | | | | |
| | | | | | $ | 1,466,510 | |
| | | | | | | | |
| Consumer Services – 1.4% | | | | | |
| Bookings Holdings, Inc. (a) | | | 432 | | | $ | 875,703 | |
| Ctrip.com International Ltd., ADR (a) | | | 10,467 | | | | 498,543 | |
| | | | | | | | |
| | | | | | $ | 1,374,246 | |
| | | | | | | | |
| Containers – 0.4% | | | | | |
| Berry Global Group, Inc. (a) | | | 8,067 | | | $ | 370,598 | |
| | | | | | | | |
| Electrical Equipment – 3.0% | | | | | |
| HD Supply Holdings, Inc. (a) | | | 15,968 | | | $ | 684,868 | |
| Johnson Controls International PLC | | | 21,431 | | | | 716,867 | |
| Schneider Electric S.A. | | �� | 12,249 | | | | 1,018,854 | |
| TE Connectivity Ltd. | | | 5,919 | | | | 533,065 | |
| | | | | | | | |
| | | | | | $ | 2,953,654 | |
| | | | | | | | |
| Electronics – 2.8% | | | | | |
| Analog Devices, Inc. | | | 9,014 | | | $ | 864,623 | |
| NVIDIA Corp. | | | 2,809 | | | | 665,452 | |
Taiwan Semiconductor Manufacturing Co. Ltd. | | | 127,000 | | | | 901,832 | |
| Taiwan Semiconductor Manufacturing Co. Ltd., ADR | | | 8,078 | | | | 295,331 | |
| | | | | | | | |
| | | | | | $ | 2,727,238 | |
| | | | | | | | |
| Energy – Independent – 2.2% | | | | | |
| EOG Resources, Inc. | | | 8,991 | | | $ | 1,118,750 | |
| Marathon Petroleum Corp. | | | 6,252 | | | | 438,640 | |
| Oil Search Ltd. | | | 98,447 | | | | 648,416 | |
| | | | | | | | |
| | | | | | $ | 2,205,806 | |
| | | | | | | | |
| Energy – Integrated – 2.2% | | | | | |
| BP PLC | | | 146,163 | | | $ | 1,112,917 | |
| Suncor Energy, Inc. | | | 26,684 | | | | 1,085,912 | |
| | | | | | | | |
| | | | | | $ | 2,198,829 | |
| | | | | | | | |
| Food & Beverages – 2.8% | | | | | |
| Danone S.A. | | | 6,323 | | | $ | 463,519 | |
| Mondelez International, Inc. | | | 16,290 | | | | 667,890 | |
4
MFS Global Research Portfolio
Portfolio of Investments (unaudited) – continued
| | | | | | | | |
| Issuer | | Shares/Par | | | Value ($) | |
| COMMON STOCKS – continued | | | | | |
| Food & Beverages – continued | | | | | |
| Nestle S.A. | | | 11,774 | | | $ | 911,505 | |
| PepsiCo, Inc. | | | 6,628 | | | | 721,591 | |
| | | | | | | | |
| | | | | | $ | 2,764,505 | |
| | | | | | | | |
| Food & Drug Stores – 1.0% | | | | | |
| Sundrug Co. Ltd. | | | 11,700 | | | $ | 474,488 | |
| Tesco PLC | | | 157,601 | | | | 533,921 | |
| | | | | | | | |
| | | | | | $ | 1,008,409 | |
| | | | | | | | |
| Gaming & Lodging – 0.4% | | | | | |
| Paddy Power Betfair PLC | | | 4,010 | | | $ | 439,253 | |
| | | | | | | | |
| Health Maintenance Organizations – 0.4% | | | | | |
| Cigna Corp. | | | 2,588 | | | $ | 439,831 | |
| | | | | | | | |
| Insurance – 3.2% | | | | | |
| AIA Group Ltd. | | | 149,000 | | | $ | 1,302,819 | |
| Aon PLC | | | 7,641 | | | | 1,048,116 | |
| Chubb Ltd. | | | 6,124 | | | | 777,871 | |
| | | | | | | | |
| | | | | | $ | 3,128,806 | |
| | | | | | | | |
| Internet – 5.0% | | | | | |
| Alphabet, Inc., “A” (a)(s) | | | 1,625 | | | $ | 1,834,933 | |
| Alphabet, Inc., “C” (a) | | | 223 | | | | 248,790 | |
| Baidu, Inc., ADR (a) | | | 2,205 | | | | 535,815 | |
| Facebook, Inc., “A” (a)(s) | | | 9,397 | | | | 1,826,025 | |
| LogMeIn, Inc. | | | 5,067 | | | | 523,168 | |
| | | | | | | | |
| | | | | | $ | 4,968,731 | |
| | | | | | | | |
| Leisure & Toys – 0.7% | | | | | |
| Electronic Arts, Inc. (a) | | | 5,175 | | | $ | 729,778 | |
| | | | | | | | |
| Machinery & Tools – 2.8% | | | | | |
| Flowserve Corp. | | | 4,701 | | | $ | 189,920 | |
| GEA Group AG | | | 13,637 | | | | 460,082 | |
| Kubota Corp. | | | 33,600 | | | | 528,969 | |
| Roper Technologies, Inc. | | | 3,066 | | | | 845,940 | |
| Schindler Holding AG | | | 2,056 | | | | 442,809 | |
| SPX FLOW, Inc. (a) | | | 5,546 | | | | 242,749 | |
| | | | | | | | |
| | | | | | $ | 2,710,469 | |
| | | | | | | | |
| Major Banks – 3.6% | | | | | |
| Barclays PLC | | | 247,674 | | | $ | 617,780 | |
| BNP Paribas | | | 14,305 | | | | 886,689 | |
| Erste Group Bank AG | | | 12,058 | | | | 503,407 | |
| Mitsubishi UFJ Financial Group, Inc. | | | 108,900 | | | | 620,754 | |
| UBS AG | | | 58,762 | | | | 904,058 | |
| | | | | | | | |
| | | | | | $ | 3,532,688 | |
| | | | | | | | |
| Medical & Health Technology & Services – 1.2% | |
| ICON PLC (a) | | | 5,410 | | | $ | 716,987 | |
| McKesson Corp. | | | 3,510 | | | | 468,234 | |
| | | | | | | | |
| | | | | | $ | 1,185,221 | |
| | | | | | | | |
| Medical Equipment – 3.5% | | | | | |
| Danaher Corp. | | | 7,588 | | | $ | 748,784 | |
| Essilor International S.A. | | | 4,564 | | | | 644,378 | |
| Medtronic PLC | | | 14,731 | | | | 1,261,121 | |
| | | | | | | | |
| Issuer | | Shares/Par | | | Value ($) | |
| COMMON STOCKS – continued | | | | | |
| Medical Equipment – continued | | | | | |
| PerkinElmer, Inc. | | | 10,785 | | | $ | 789,785 | |
| | | | | | | | |
| | | | | | $ | 3,444,068 | |
| | | | | | | | |
| Metals & Mining – 0.8% | | | | | |
| Rio Tinto Ltd. | | | 14,360 | | | $ | 791,995 | |
| | | | | | | | |
| Natural Gas – Distribution – 0.7% | | | | | |
| China Resources Gas Group Ltd. | | | 152,000 | | | $ | 658,713 | |
| | | | | | | | |
| Natural Gas – Pipeline – 1.0% | | | | | |
| Enbridge, Inc. | | | 13,846 | | | $ | 495,008 | |
| Enterprise Products Partners LP | | | 19,186 | | | | 530,876 | |
| | | | | | | | |
| | | | | | $ | 1,025,884 | |
| | | | | | | | |
| Network & Telecom – 1.1% | | | | | |
| Cisco Systems, Inc. | | | 25,345 | | | $ | 1,090,595 | |
| | | | | | | | |
| Oil Services – 0.7% | | | | | |
| Schlumberger Ltd. | | | 9,591 | | | $ | 642,885 | |
| | | | | | | | |
| Other Banks & Diversified Financials – 9.1% | | | | | |
| Aeon Credit Service Co. Ltd. | | | 33,000 | | | $ | 704,620 | |
| Citigroup, Inc. (s) | | | 21,219 | | | | 1,419,975 | |
| Credicorp Ltd. | | | 4,492 | | | | 1,011,239 | |
| HDFC Bank Ltd. | | | 34,380 | | | | 1,073,826 | |
| Intesa Sanpaolo S.p.A. | | | 242,574 | | | | 702,135 | |
| Julius Baer Group Ltd. | | | 13,330 | | | | 783,100 | |
| KBC Groep N.V. | | | 12,853 | | | | 990,769 | |
| Mastercard, Inc., “A” | | | 5,736 | | | | 1,127,239 | |
| U.S. Bancorp | | | 23,443 | | | | 1,172,619 | |
| | | | | | | | |
| | | | | | $ | 8,985,522 | |
| | | | | | | | |
| Pharmaceuticals – 5.3% | | | | | |
| Bayer AG | | | 9,114 | | | $ | 1,004,198 | |
| Genomma Lab Internacional S.A., “B” (a) | | | 284,257 | | | | 237,450 | |
| Johnson & Johnson | | | 11,472 | | | | 1,392,012 | |
| Roche Holding AG | | | 4,161 | | | | 925,886 | |
| Santen Pharmaceutical Co. Ltd. | | | 52,300 | | | | 912,174 | |
| Zoetis, Inc. | | | 8,815 | | | | 750,950 | |
| | | | | | | | |
| | | | | | $ | 5,222,670 | |
| | | | | | | | |
| Printing & Publishing – 0.6% | | | | | |
| RELX N.V. | | | 25,749 | | | $ | 548,120 | |
| | | | | | | | |
| Railroad & Shipping – 1.1% | | | | | |
| Canadian Pacific Railway Ltd. | | | 2,704 | | | $ | 494,886 | |
| DP World Ltd. | | | 24,539 | | | | 564,397 | |
| | | | | | | | |
| | | | | | $ | 1,059,283 | |
| | | | | | | | |
| Real Estate – 1.7% | | | | | |
| LEG Immobilien AG | | | 8,572 | | | $ | 931,766 | |
| Store Capital Corp., REIT | | | 27,827 | | | | 762,460 | |
| | | | | | | | |
| | | | | | $ | 1,694,226 | |
| | | | | | | | |
| Restaurants – 1.8% | | | | | |
| Aramark | | | 10,129 | | | $ | 375,786 | |
| Starbucks Corp. | | | 17,248 | | | | 842,565 | |
| Yum China Holdings, Inc. | | | 15,627 | | | | 601,014 | |
| | | | | | | | |
| | | | | | $ | 1,819,365 | |
| | | | | | | | |
5
MFS Global Research Portfolio
Portfolio of Investments (unaudited) – continued
| | | | | | | | |
| Issuer | | Shares/Par | | | Value ($) | |
| COMMON STOCKS – continued | | | | | |
| Specialty Chemicals – 2.4% | | | | | |
| Akzo Nobel N.V. | | | 6,477 | | | $ | 551,909 | |
| Croda International PLC | | | 8,077 | | | | 511,875 | |
| Linde AG | | | 3,228 | | | | 770,518 | |
| Sika AG | | | 3,622 | | | | 499,136 | |
| | | | | | | | |
| | | | | | $ | 2,333,438 | |
| | | | | | | | |
| Specialty Stores – 3.2% | | | | | |
| Amazon.com, Inc. (a) | | | 1,218 | | | $ | 2,070,356 | |
| Costco Wholesale Corp. | | | 3,659 | | | | 764,658 | |
| Dufry AG | | | 2,771 | | | | 353,204 | |
| | | | | | | | |
| | | | | | $ | 3,188,218 | |
| | | | | | | | |
| Telecommunications – Wireless – 3.0% | | | | | |
| Advanced Info Service PLC | | | 87,700 | | | $ | 489,722 | |
| American Tower Corp., REIT | | | 6,650 | | | | 958,731 | |
| Cellnex Telecom S.A.U. | | | 25,663 | | | | 645,780 | |
| KDDI Corp. | | | 32,200 | | | | 881,526 | |
| | | | | | | | |
| | | | | | $ | 2,975,759 | |
| | | | | | | | |
| Telephone Services – 0.2% | | | | | |
| Com Hem Holding AB | | | 12,849 | | | $ | 208,872 | |
| | | | | | | | |
| Tobacco – 0.6% | | | | | |
| Philip Morris International, Inc. | | | 6,825 | | | $ | 551,051 | |
| | | | | | | | |
| Utilities – Electric Power – 2.8% | | | | | |
| CLP Holdings Ltd. | | | 59,000 | | | $ | 635,452 | |
| CMS Energy Corp. | | | 19,466 | | | | 920,353 | |
| Iberdrola S.A. | | | 67,483 | | | | 521,258 | |
| NextEra Energy, Inc. | | | 3,903 | | | | 651,918 | |
| | | | | | | | |
| | | | | | $ | 2,728,981 | |
| | | | | | | | |
Total Common Stocks
(Identified Cost, $80,872,570) | | | | | | $ | 98,307,814 | |
| | | | | | | | |
| | | | | | | | | | | | | | | | |
| | | Strike
Price | | | First
Exercise | | | | | | | |
| RIGHTS – 0.0% | | | | | | | | | | | | | |
| Other Banks & Diversified Financials – 0.0% | | | | | |
| Intesa Sanpaolo S.p.A. (1 share for 1 right) (a) (Identified Cost, $0) | | | EUR 2.74 | | | | 7/31/18 | | | | 245,087 | | | $ | 0 | |
| | | | | | | | | | | | | | | | |
| | | | | | | | |
| Issuer | | Shares/Par | | | Value ($) | |
| INVESTMENT COMPANIES (h) – 0.0% | | | | | |
| Money Market Funds – 0.0% | | | | | | | | |
| MFS Institutional Money Market Portfolio, 1.9% (v) (Identified Cost, $610) | | | 610 | | | $ | 610 | |
| | | | | | | | |
OTHER ASSETS, LESS
LIABILITIES – 0.3% | | | | | | | 287,441 | |
| | | | | | | | |
| NET ASSETS – 100.0% | | | | | | $ | 98,595,865 | |
| | | | | | | | |
| (a) | | Non-income producing security. |
| (h) | | An affiliated issuer, which may be considered one in which the fund owns 5% or more of the outstanding voting securities, or a company which is under common control. At period end, the aggregate values of the fund’s investments in affiliated issuers and in unaffiliated issuers were $610 and $98,307,814, respectively. |
| (s) | | Security or a portion of the security was pledged to cover collateral requirements for certain derivative transactions. |
| (v) | | Affiliated issuer that is available only to investment companies managed by MFS. The rate quoted for the MFS Institutional Money Market Portfolio is the annualized seven-day yield of the fund at period end. |
The following abbreviations are used in this report and are defined:
| ADR | | American Depositary Receipt |
| PLC | | Public Limited Company |
| REIT | | Real Estate Investment Trust |
Abbreviations indicate amounts shown in currencies other than the U.S. dollar. All amounts are stated in U.S. dollars unless otherwise indicated. A list of abbreviations is shown below:
At June 30, 2018, the fund had cash collateral of $2,514 and other liquid securities with an aggregate value of $549,588 to cover any collateral or margin obligations for certain derivative contracts. Restricted cash and deposits with brokers in the Statement of Assets and Liabilities are comprised of cash collateral.
See Notes to Financial Statements
6
MFS Global Research Portfolio
FINANCIAL STATEMENTS | STATEMENT OF ASSETS AND LIABILITIES (unaudited)
This statement represents your fund’s balance sheet, which details the assets and liabilities comprising the total value of the fund.
| | | | |
At 6/30/18 | | | | |
Assets | | | | |
Investments in unaffiliated issuers, at value (identified cost, $80,872,570) | | | $98,307,814 | |
Investments in affiliated issuers, at value (identified cost, $610) | | | 610 | |
Foreign currency, at value (identified cost, $9,248) | | | 9,229 | |
Deposits with brokers for | | | | |
Cleared options | | | 2,514 | |
Receivables for | | | | |
Investments sold | | | 2,454,355 | |
Fund shares sold | | | 728 | |
Interest and dividends | | | 182,036 | |
Other assets | | | 538 | |
Total assets | | | $100,957,824 | |
Liabilities | | | | |
Payable to custodian | | | $28,604 | |
Payables for | | | | |
Investments purchased | | | 2,229,607 | |
Fund shares reacquired | | | 28,702 | |
Payable to affiliates | | | | |
Investment adviser | | | 6,148 | |
Shareholder servicing costs | | | 11 | |
Distribution and/or service fees | | | 135 | |
Payable for independent Trustees’ compensation | | | 100 | |
Deferred country tax expense payable | | | 10,305 | |
Accrued expenses and other liabilities | | | 58,347 | |
Total liabilities | | | $2,361,959 | |
Net assets | | | $98,595,865 | |
Net assets consist of | | | | |
Paid-in capital | | | $67,938,241 | |
Unrealized appreciation (depreciation) (net of $10,305 deferred country tax) | | | 17,422,761 | |
Accumulated net realized gain (loss) | | | 11,501,006 | |
Undistributed net investment income | | | 1,733,857 | |
Net assets | | | $98,595,865 | |
Shares of beneficial interest outstanding | | | 3,064,359 | |
| | | | | | | | | | | | |
| | | Net assets | | | Shares
outstanding | | | Net asset value
per share | |
Initial Class | | | $91,989,374 | | | | 2,858,018 | | | | $32.19 | |
Service Class | | | 6,606,491 | | | | 206,341 | | | | 32.02 | |
See Notes to Financial Statements
7
MFS Global Research Portfolio
FINANCIAL STATEMENTS | STATEMENT OF OPERATIONS (unaudited)
This statement describes how much your fund earned in investment income and accrued in expenses. It also describes any gains and/or losses generated by fund operations.
| | | | |
Six months ended 6/30/18 | | | | |
Net investment income (loss) | | | | |
Income | | | | |
Dividends | | | $1,279,836 | |
Dividends from affiliated issuers | | | 4,685 | |
Income on securities loaned | | | 1,588 | |
Other | | | 363 | |
Foreign taxes withheld | | | (77,735 | ) |
Total investment income | | | $1,208,737 | |
Expenses | | | | |
Management fee | | | $384,180 | |
Distribution and/or service fees | | | 8,821 | |
Shareholder servicing costs | | | 1,255 | |
Administrative services fee | | | 12,641 | |
Independent Trustees’ compensation | | | 2,113 | |
Custodian fee | | | 19,415 | |
Shareholder communications | | | 7,354 | |
Audit and tax fees | | | 29,391 | |
Legal fees | | | 609 | |
Miscellaneous | | | 9,205 | |
Total expenses | | | $474,984 | |
Reduction of expenses by investment adviser | | | (4,722 | ) |
Net expenses | | | $470,262 | |
Net investment income (loss) | | | $738,475 | |
Realized and unrealized gain (loss) | | | | |
Realized gain (loss) (identified cost basis) | | | | |
Unaffiliated issuers (net of $1,067 country tax) | | | $5,817,054 | |
Affiliated issuers | | | (55 | ) |
Foreign currency | | | (6,318 | ) |
Net realized gain (loss) | | | $5,810,681 | |
Change in unrealized appreciation or depreciation | | | | |
Unaffiliated issuers (net of $198 increase in deferred country tax) | | | $(5,006,430 | ) |
Affiliated issuers | | | 33 | |
Translation of assets and liabilities in foreign currencies | | | (1,731 | ) |
Net unrealized gain (loss) | | | $(5,008,128 | ) |
Net realized and unrealized gain (loss) | | | $802,553 | |
Change in net assets from operations | | | $1,541,028 | |
See Notes to Financial Statements
8
MFS Global Research Portfolio
FINANCIAL STATEMENTS | STATEMENTS OF CHANGES IN NET ASSETS
These statements describe the increases and/or decreases in net assets resulting from operations, any distributions, and any shareholder transactions.
| | | | | | | | |
| | | Six months ended 6/30/18 | | | Year ended
12/31/17 | |
| | | (unaudited) | | | | |
Change in net assets | | | | | | | | |
From operations | | | | | | | | |
Net investment income (loss) | | | $738,475 | | | | $993,059 | |
Net realized gain (loss) | | | 5,810,681 | | | | 8,681,235 | |
Net unrealized gain (loss) | | | (5,008,128 | ) | | | 13,816,166 | |
Change in net assets from operations | | | $1,541,028 | | | | $23,490,460 | |
Distributions declared to shareholders | | | | | | | | |
From net investment income | | | $— | | | | $(1,601,030 | ) |
Change in net assets from fund share transactions | | | $(8,690,807 | ) | | | $(14,840,181 | ) |
Total change in net assets | | | $(7,149,779 | ) | | | $7,049,249 | |
Net assets | | | | | | | | |
At beginning of period | | | 105,745,644 | | | | 98,696,395 | |
At end of period (including undistributed net investment income of $1,733,857 and
$995,382, respectively) | | | $98,595,865 | | | | $105,745,644 | |
See Notes to Financial Statements
9
MFS Global Research Portfolio
FINANCIAL STATEMENTS | FINANCIAL HIGHLIGHTS
The financial highlights table is intended to help you understand the fund’s financial performance for the semiannual period and the past 5 fiscal years. Certain information reflects financial results for a single fund share. The total returns in the table represent the rate that an investor would have earned (or lost) on an investment in the fund share class (assuming reinvestment of all distributions) held for the entire period.
| | | | | | | | | | | | | | | | | | | | | | | | |
| Initial Class | | Six months ended
6/30/18 | | | Year ended | |
| | | | 12/31/17 | | | 12/31/16 | | | 12/31/15 | | | 12/31/14 | | | 12/31/13 | |
| | | (unaudited) | | | | | | | | | | | | | | | | |
Net asset value, beginning of period | | | $31.74 | | | | $25.69 | | | | $24.63 | | | | $25.18 | | | | $24.85 | | | | $20.36 | |
| Income (loss) from investment operations | | | | | | | | | | | | | | | | | | | | | | | | |
Net investment income (loss) (d) | | | $0.23 | | | | $0.28 | | | | $0.41 | (c) | | | $0.25 | | | | $0.29 | | | | $0.24 | |
Net realized and unrealized gain (loss) | | | 0.22 | | | | 6.24 | | | | 0.93 | | | | (0.47 | ) | | | 0.31 | | | | 4.61 | |
Total from investment operations | | | $0.45 | | | | $6.52 | | | | $1.34 | | | | $(0.22 | ) | | | $0.60 | | | | $4.85 | |
| Less distributions declared to shareholders | | | | | | | | | | | | | | | | | | | | | |
From net investment income | | | $— | | | | $(0.47 | ) | | | $(0.28 | ) | | | $(0.33 | ) | | | $(0.27 | ) | | | $(0.36 | ) |
Net asset value, end of period (x) | | | $32.19 | | | | $31.74 | | | | $25.69 | | | | $24.63 | | | | $25.18 | | | | $24.85 | |
Total return (%) (k)(r)(s)(x) | | | 1.42 | (n) | | | 25.51 | | | | 5.44 | (c) | | | (0.81 | ) | | | 2.40 | | | | 24.00 | |
Ratios (%) (to average net assets)
and Supplemental data: | | | | | | | | | | | | | | | | | | | | | |
Expenses before expense reductions (f) | | | 0.91 | (a) | | | 0.92 | | | | 0.78 | (c) | | | 0.92 | | | | 0.92 | | | | 0.92 | |
Expenses after expense reductions (f) | | | 0.90 | (a) | | | 0.92 | | | | 0.77 | (c) | | | 0.91 | | | | 0.91 | | | | 0.92 | |
Net investment income (loss) | | | 1.46 | (a) | | | 0.97 | | | | 1.64 | (c) | | | 0.98 | | | | 1.15 | | | | 1.08 | |
Portfolio turnover | | | 13 | (n) | | | 33 | | | | 40 | | | | 40 | | | | 37 | | | | 41 | |
Net assets at end of period (000 omitted) | | | $91,989 | | | | $98,434 | | | | $91,281 | | | | $98,321 | | | | $113,018 | | | | $126,707 | |
Ratio of expenses to average net assets after expense
reductions excluding short sale expenses (f) | | | N/A | | | | N/A | | | | N/A | | | | N/A | | | | 0.91 | | | | 0.91 | |
| | |
| Service Class | | Six months ended
6/30/18 | | | Year ended | |
| | | | 12/31/17 | | | 12/31/16 | | | 12/31/15 | | | 12/31/14 | | | 12/31/13 | |
| | | (unaudited) | | | | | | | | | | | | | | | | |
Net asset value, beginning of period | | | $31.61 | | | | $25.59 | | | | $24.52 | | | | $25.06 | | | | $24.72 | | | | $20.25 | |
| Income (loss) from investment operations | | | | | | | | | | | | | | | | | | | | | | | | |
Net investment income (loss) (d) | | | $0.19 | | | | $0.21 | | | | $0.34 | (c) | | | $0.19 | | | | $0.23 | | | | $0.19 | |
Net realized and unrealized gain (loss) | | | 0.22 | | | | 6.20 | | | | 0.94 | | | | (0.47 | ) | | | 0.31 | | | | 4.57 | |
Total from investment operations | | | $0.41 | | | | $6.41 | | | | $1.28 | | | | $(0.28 | ) | | | $0.54 | | | | $4.76 | |
| Less distributions declared to shareholders | | | | | | | | | | | | | | | | | | | | | | | | |
From net investment income | | | $— | | | | $(0.39 | ) | | | $(0.21 | ) | | | $(0.26 | ) | | | $(0.20 | ) | | | $(0.29 | ) |
Net asset value, end of period (x) | | | $32.02 | | | | $31.61 | | | | $25.59 | | | | $24.52 | | | | $25.06 | | | | $24.72 | |
Total return (%) (k)(r)(s)(x) | | | 1.30 | (n) | | | 25.17 | | | | 5.21 | (c) | | | (1.09 | ) | | | 2.15 | | | | 23.68 | |
Ratios (%) (to average net assets)
and Supplemental data: | | | | | | | | | | | | | | | | | | | | | | | | |
Expenses before expense reductions (f) | | | 1.16 | (a) | | | 1.17 | | | | 1.03 | (c) | | | 1.17 | | | | 1.17 | | | | 1.17 | |
Expenses after expense reductions (f) | | | 1.15 | (a) | | | 1.17 | | | | 1.02 | (c) | | | 1.16 | | | | 1.16 | | | | 1.17 | |
Net investment income (loss) | | | 1.20 | (a) | | | 0.73 | | | | 1.39 | (c) | | | 0.74 | | | | 0.90 | | | | 0.86 | |
Portfolio turnover | | | 13 | (n) | | | 33 | | | | 40 | | | | 40 | | | | 37 | | | | 41 | |
Net assets at end of period (000 omitted) | | | $6,606 | | | | $7,312 | | | | $7,415 | | | | $8,151 | | | | $9,551 | | | | $11,013 | |
Ratio of expenses to average net assets after expense
reductions excluding short sale expenses (f) | | | N/A | | | | N/A | | | | N/A | | | | N/A | | �� | | 1.16 | | | | 1.16 | |
See Notes to Financial Statements
10
MFS Global Research Portfolio
Financial Highlights – continued
| (c) | Amount reflects a one-time reimbursement of expenses by the custodian (or former custodian) without which net investment income and performance would be lower and expenses would be higher. |
| (d) | Per share data is based on average shares outstanding. |
| (f) | Ratios do not reflect reductions from fees paid indirectly, if applicable. |
| (k) | The total return does not reflect expenses that apply to separate accounts. Inclusion of these charges would reduce the total return figures for all periods shown. |
| (r) | Certain expenses have been reduced without which performance would have been lower. |
| (s) | From time to time the fund may receive proceeds from litigation settlements, without which performance would be lower. |
| (x) | The net asset values and total returns have been calculated on net assets which include adjustments made in accordance with U.S. generally accepted accounting principles required at period end for financial reporting purposes. |
See Notes to Financial Statements
11
MFS Global Research Portfolio
NOTES TO FINANCIAL STATEMENTS (unaudited)
| (1) | | Business and Organization |
MFS Global Research Portfolio (the fund) is a diversified series of MFS Variable Insurance Trust II (the trust). The trust is organized as a Massachusetts business trust and is registered under the Investment Company Act of 1940, as amended, as an open-end management investment company. The shareholders of each series of the trust are separate accounts of insurance companies, which offer variable annuity and/or life insurance products, and qualified retirement and pension plans.
The fund is an investment company and accordingly follows the investment company accounting and reporting guidance of the Financial Accounting Standards Board (FASB) Accounting Standards Codification Topic 946 Financial Services – Investment Companies.
| (2) | | Significant Accounting Policies |
General – The preparation of financial statements in conformity with U.S. generally accepted accounting principles requires management to make estimates and assumptions that affect the reported amounts of assets and liabilities, and disclosure of contingent assets and liabilities at the date of the financial statements and the reported amounts of increases and decreases in net assets from operations during the reporting period. Actual results could differ from those estimates. In the preparation of these financial statements, management has evaluated subsequent events occurring after the date of the fund’s Statement of Assets and Liabilities through the date that the financial statements were issued. The fund invests in foreign securities. Investments in foreign securities are vulnerable to the effects of changes in the relative values of the local currency and the U.S. dollar and to the effects of changes in each country’s market, economic, industrial, political, regulatory, geopolitical, and other conditions.
Balance Sheet Offsetting – The fund’s accounting policy with respect to balance sheet offsetting is that, absent an event of default by the counterparty or a termination of the agreement, the International Swaps and Derivatives Association (ISDA) Master Agreement, or similar agreement, does not result in an offset of reported amounts of financial assets and financial liabilities in the Statement of Assets and Liabilities across transactions between the fund and the applicable counterparty. The fund’s right to setoff may be restricted or prohibited by the bankruptcy or insolvency laws of the particular jurisdiction to which a specific master netting agreement counterparty is subject. Balance sheet offsetting disclosures, to the extent applicable to the fund, have been included in the fund’s Significant Accounting Policies note under the captions for each of the fund’s in-scope financial instruments and transactions.
Investment Valuations – Equity securities, including restricted equity securities, are generally valued at the last sale or official closing price on their primary market or exchange as provided by a third-party pricing service. Equity securities, for which there were no sales reported that day, are generally valued at the last quoted daily bid quotation on their primary market or exchange as provided by a third-party pricing service. Short-term instruments with a maturity at issuance of 60 days or less may be valued at amortized cost, which approximates market value. Open-end investment companies are generally valued at net asset value per share. Securities and other assets generally valued on the basis of information from a third-party pricing service may also be valued at a broker/dealer bid quotation. In determining values, third-party pricing services can utilize both transaction data and market information such as yield, quality, coupon rate, maturity, type of issue, trading characteristics, and other market data. The values of foreign securities and other assets and liabilities expressed in foreign currencies are converted to U.S. dollars using the mean of bid and asked prices for rates provided by a third-party pricing service.
The Board of Trustees has delegated primary responsibility for determining or causing to be determined the value of the fund’s investments (including any fair valuation) to the adviser pursuant to valuation policies and procedures approved by the Board. If the adviser determines that reliable market quotations are not readily available, investments are valued at fair value as determined in good faith by the adviser in accordance with such procedures under the oversight of the Board of Trustees. Under the fund’s valuation policies and procedures, market quotations are not considered to be readily available for most types of debt instruments and floating rate loans and many types of derivatives. These investments are generally valued at fair value based on information from third-party pricing services. In addition, investments may be valued at fair value if the adviser determines that an investment’s value has been materially affected by events occurring after the close of the exchange or market on which the investment is principally traded (such as foreign exchange or market) and prior to the determination of the fund’s net asset value, or after the halting of trading of a specific security where trading does not resume prior to the close of the exchange or market on which the security is principally traded. Events that occur on a frequent basis after foreign markets close (such as developments in foreign markets and significant movements in the U.S. markets) and prior to the determination of the fund’s net asset value may be deemed to have a material effect on the value of securities traded in foreign markets. Accordingly, the fund’s foreign equity securities may often be valued at fair value. The adviser generally relies on third-party pricing services or other information (such as the correlation with price movements of similar securities in the same or other markets; the type, cost and investment characteristics of the security; the business and financial condition of the issuer; and trading and other market data) to assist in determining whether to fair value and at what value to fair value an investment. The value of an investment for purposes of calculating the fund’s net asset value can differ depending on the source and method used to determine value. When fair valuation is used, the value of an investment used to
12
MFS Global Research Portfolio
Notes to Financial Statements (unaudited) – continued
determine the fund’s net asset value may differ from quoted or published prices for the same investment. There can be no assurance that the fund could obtain the fair value assigned to an investment if it were to sell the investment at the same time at which the fund determines its net asset value per share.
Various inputs are used in determining the value of the fund’s assets or liabilities. These inputs are categorized into three broad levels. In certain cases, the inputs used to measure fair value may fall into different levels of the fair value hierarchy. In such cases, an investment’s level within the fair value hierarchy is based on the lowest level of input that is significant to the fair value measurement. The fund’s assessment of the significance of a particular input to the fair value measurement in its entirety requires judgment, and considers factors specific to the investment. Level 1 includes unadjusted quoted prices in active markets for identical assets or liabilities. Level 2 includes other significant observable market-based inputs (including quoted prices for similar securities, interest rates, prepayment speed, and credit risk). Level 3 includes unobservable inputs, which may include the adviser’s own assumptions in determining the fair value of investments. The following is a summary of the levels used as of June 30, 2018 in valuing the fund’s assets or liabilities:
| | | | | | | | | | | | | | | | |
| Financial Instruments | | Level 1 | | | Level 2 | | | Level 3 | | | Total | |
| Equity Securities: | | | | | | | | | | | | | | | | |
United States | | | $57,816,165 | | | | $— | | | | $— | | | | $57,816,165 | |
Switzerland | | | — | | | | 4,819,697 | | | | — | | | | 4,819,697 | |
Japan | | | 4,609,952 | | | | — | | | | — | | | | 4,609,952 | |
France | | | 644,378 | | | | 3,622,581 | | | | — | | | | 4,266,959 | |
United Kingdom | | | 2,130,111 | | | | 1,904,913 | | | | — | | | | 4,035,024 | |
Canada | | | 3,421,657 | | | | — | | | | — | | | | 3,421,657 | |
Germany | | | 3,166,564 | | | | — | | | | — | | | | 3,166,564 | |
China | | | 2,905,970 | | | | — | | | | — | | | | 2,905,970 | |
Hong Kong | | | 2,359,287 | | | | — | | | | — | | | | 2,359,287 | |
Other Countries | | | 6,456,846 | | | | 4,449,693 | | | | — | | | | 10,906,539 | |
| Mutual Funds | | | 610 | | | | — | | | | — | | | | 610 | |
| Total | | | $83,511,540 | | | | $14,796,884 | | | | $— | | | | $98,308,424 | |
For further information regarding security characteristics, see the Portfolio of Investments.
Of the level 2 investments presented above, equity investments amounting to $13,161,962 would have been considered level 1 investments at the beginning of the period. Of the level 1 investments presented above, equity investments amounting to $3,013,826 would have been considered level 2 investments at the beginning of the period. The primary reason for changes in the classifications between levels 1 and 2 occurs when foreign equity securities are fair valued using other observable market-based inputs in place of the closing exchange price due to events occurring after the close of the exchange or market on which the investment is principally traded. The fund’s foreign equity securities may often be valued using other observable market-based inputs. The fund’s policy is to recognize transfers between the levels as of the end of the period.
Foreign Currency Translation – Purchases and sales of foreign investments, income, and expenses are converted into U.S. dollars based upon currency exchange rates prevailing on the respective dates of such transactions or on the reporting date for foreign denominated receivables and payables. Gains and losses attributable to foreign currency exchange rates on sales of securities are recorded for financial statement purposes as net realized gains and losses on investments. Gains and losses attributable to foreign exchange rate movements on receivables, payables, income and expenses are recorded for financial statement purposes as foreign currency transaction gains and losses. That portion of both realized and unrealized gains and losses on investments that results from fluctuations in foreign currency exchange rates is not separately disclosed.
Security Loans – Under its Securities Lending Agency Agreement with the fund, State Street Bank and Trust Company (“State Street”), as lending agent, loans the securities of the fund to certain qualified institutions (the “Borrowers”) approved by the fund. Security loans can be terminated at the discretion of either the lending agent or the fund and the related securities must be returned within the earlier of the standard trade settlement period for such securities or within three business days. The loans are collateralized by cash and/or U.S. Treasury and federal agency obligations in an amount typically at least equal to the market value of the securities loaned. On loans collateralized by cash, the cash collateral is invested in a money market fund. The market value of the loaned securities is determined at the close of business of the fund and any additional required collateral is delivered to the fund on the next business day. State Street provides the fund with indemnification against Borrower default. In the event of Borrower default, State Street will, for the benefit of the fund, either purchase securities identical to those loaned or, when such purchase is commercially impracticable, pay the fund the market value of the loaned securities. In return, State Street assumes the fund’s rights to the related collateral. If the collateral value is less than the cost to purchase identical securities, State Street is responsible for the shortfall, but only to the extent that such shortfall is not due to a decline in collateral value resulting from collateral reinvestment for which the fund bears the risk of loss. A portion of the income generated upon investment of the collateral is remitted to the
13
MFS Global Research Portfolio
Notes to Financial Statements (unaudited) – continued
Borrowers, and the remainder is allocated between the fund and the lending agent. On loans collateralized by U.S. Treasury and/or federal agency obligations, a fee is received from the Borrower, and is allocated between the fund and the lending agent. Income from securities lending is separately reported in the Statement of Operations. The dividend and interest income earned on the securities loaned is accounted for in the same manner as other dividend and interest income. At June 30, 2018, there were no securities on loan or collateral outstanding.
Indemnifications – Under the fund’s organizational documents, its officers and Trustees may be indemnified against certain liabilities and expenses arising out of the performance of their duties to the fund. Additionally, in the normal course of business, the fund enters into agreements with service providers that may contain indemnification clauses. The fund’s maximum exposure under these agreements is unknown as this would involve future claims that may be made against the fund that have not yet occurred.
Investment Transactions and Income – Investment transactions are recorded on the trade date. Interest income is recorded on the accrual basis. Dividends received in cash are recorded on the ex-dividend date. Certain dividends from foreign securities will be recorded when the fund is informed of the dividend if such information is obtained subsequent to the ex-dividend date. Dividend payments received in additional securities are recorded on the ex-dividend date in an amount equal to the value of the security on such date.
The fund may receive proceeds from litigation settlements. Any proceeds received from litigation involving portfolio holdings are reflected in the Statement of Operations in realized gain/loss if the security has been disposed of by the fund or in unrealized gain/loss if the security is still held by the fund. Any other proceeds from litigation not related to portfolio holdings are reflected as other income in the Statement of Operations.
Tax Matters and Distributions – The fund intends to qualify as a regulated investment company, as defined under Subchapter M of the Internal Revenue Code, and to distribute all of its taxable income, including realized capital gains. As a result, no provision for federal income tax is required. The fund’s federal tax returns, when filed, will remain subject to examination by the Internal Revenue Service for a three year period. Management has analyzed the fund’s tax positions taken on federal and state tax returns for all open tax years and does not believe that there are any uncertain tax positions that require recognition of a tax liability. Foreign taxes, if any, have been accrued by the fund in the accompanying financial statements in accordance with the applicable foreign tax law. Foreign income taxes may be withheld by certain countries in which the fund invests. Additionally, capital gains realized by the fund on securities issued in or by certain foreign countries may be subject to capital gains tax imposed by those countries.
Distributions to shareholders are recorded on the ex-dividend date. Income and capital gain distributions are determined in accordance with income tax regulations, which may differ from U.S. generally accepted accounting principles. Certain capital accounts in the financial statements are periodically adjusted for permanent differences in order to reflect their tax character. These adjustments have no impact on net assets or net asset value per share. Temporary differences which arise from recognizing certain items of income, expense, gain or loss in different periods for financial statement and tax purposes will reverse at some time in the future. Distributions in excess of net investment income or net realized gains are temporary overdistributions for financial statement purposes resulting from differences in the recognition or classification of income or distributions for financial statement and tax purposes.
Book/tax differences primarily relate to partnership adjustments.
The tax character of distributions declared to shareholders for the last fiscal year is as follows:
| | | | |
| | | Year ended
12/31/17 | |
| Ordinary income (including any short-term capital gains) | | | $1,601,030 | |
The federal tax cost and the tax basis components of distributable earnings were as follows:
| | | | |
| As of 6/30/18 | | | | |
| Cost of investments | | | $80,933,717 | |
| Gross appreciation | | | 21,291,744 | |
| Gross depreciation | | | (3,917,037 | ) |
| Net unrealized appreciation (depreciation) | | | $17,374,707 | |
| |
| As of 12/31/17 | | | | |
| Undistributed ordinary income | | | 995,382 | |
| Undistributed long-term capital gain | | | 5,671,095 | |
| Other temporary differences | | | 68,015 | |
| Net unrealized appreciation (depreciation) | | | 22,382,104 | |
The aggregate cost above includes prior fiscal year end tax adjustments, if applicable.
14
MFS Global Research Portfolio
Notes to Financial Statements (unaudited) – continued
Multiple Classes of Shares of Beneficial Interest – The fund offers multiple classes of shares, which differ in their respective distribution and/or service fees. The fund’s income, realized and unrealized gain (loss), and common expenses are allocated to shareholders based on the daily net assets of each class. Dividends are declared separately for each class. Differences in per share dividend rates are generally due to differences in separate class expenses. The fund’s distributions declared to shareholders as reported in the Statements of Changes in Net Assets are presented by class as follows:
| | | | | | | | |
| | | From net investment
income | |
| | | Six months ended
6/30/18 | | | Year ended
12/31/17 | |
| Initial Class | | | $— | | | | $1,502,165 | |
| Service Class | | | — | | | | 98,865 | |
| Total | | | $— | | | | $1,601,030 | |
| (3) | | Transactions with Affiliates |
Investment Adviser – The fund has an investment advisory agreement with MFS to provide overall investment management and related administrative services and facilities to the fund. The management fee is computed daily and paid monthly at the following annual rates based on the fund’s average daily net assets:
| | | | |
| Up to $300 million | | | 0.75% | |
| In excess of $300 million | | | 0.675% | |
MFS has agreed in writing to reduce its management fee by a specified amount if certain MFS mutual fund assets exceed thresholds agreed to by MFS and the fund’s Board of Trustees. For the six months ended June 30, 2018, this management fee reduction amounted to $4,722, which is included in the reduction of total expenses in the Statement of Operations. The management fee incurred for the six months ended June 30, 2018 was equivalent to an annual effective rate of 0.74% of the fund’s average daily net assets.
Effective August 1, 2018, the investment adviser has agreed in writing to pay a portion of the fund’s total annual operating expenses, excluding interest, taxes, extraordinary expenses, brokerage and transaction costs, and investment-related expenses, such that total annual operating expenses do not exceed 0.85% of average daily net assets for the Initial Class shares and 1.10% of average daily net assets for the Service Class shares. This written agreement will continue until modified by the fund’s Board of Trustees, but such agreement will continue at least until April 30, 2020.
Distributor – MFS Fund Distributors, Inc. (MFD), a wholly-owned subsidiary of MFS, is the distributor of shares of the fund. The Trustees have adopted a distribution plan for the Service Class shares pursuant to Rule 12b-1 under the Investment Company Act of 1940.
The fund’s distribution plan provides that the fund will pay MFD distribution and/or service fees equal to 0.25% per annum of its average daily net assets attributable to Service Class shares as partial consideration for services performed and expenses incurred by MFD and financial intermediaries (including participating insurance companies that invest in the fund to fund variable annuity and variable life insurance contracts, sponsors of qualified retirement and pension plans that invest in the fund, and affiliates of these participating insurance companies and plan sponsors) in connection with the sale and distribution of the Service Class shares. MFD may subsequently pay all, or a portion, of the distribution and/or service fees to financial intermediaries.
Shareholder Servicing Agent – MFS Service Center, Inc. (MFSC), a wholly-owned subsidiary of MFS, receives a fee from the fund for its services as shareholder servicing agent. For the six months ended June 30, 2018, the fee was $1,229, which equated to 0.0024% annually of the fund’s average daily net assets. MFSC also receives payment from the fund for out-of-pocket expenses paid by MFSC on behalf of the fund. For the six months ended June 30, 2018, these costs amounted to $26.
Administrator – MFS provides certain financial, legal, shareholder communications, compliance, and other administrative services to the fund. Under an administrative services agreement, the fund reimburses MFS the costs incurred to provide these services. The fund is charged an annual fixed amount of $17,500 plus a fee based on average daily net assets. The administrative services fee incurred for the six months ended June 30, 2018 was equivalent to an annual effective rate of 0.0247% of the fund’s average daily net assets.
Trustees’ and Officers’ Compensation – The fund pays compensation to independent Trustees in the form of a retainer, attendance fees, and additional compensation to Board and Committee chairpersons. The fund does not pay compensation directly to Trustees or officers of the fund who are also officers of the investment adviser, all of whom receive remuneration for their services to the fund from MFS. Certain officers and Trustees of the fund are officers or directors of MFS, MFD, and MFSC.
Other – This fund and certain other funds managed by MFS (the funds) have entered into a service agreement (the ISO Agreement) which provides for payment of fees solely by the funds to Tarantino LLC in return for the provision of services of an Independent Senior Officer (ISO) for the funds. Frank L. Tarantino serves as the ISO and is an officer of the funds and the sole member of
15
MFS Global Research Portfolio
Notes to Financial Statements (unaudited) – continued
Tarantino LLC. The funds can terminate the ISO Agreement with Tarantino LLC at any time under the terms of the ISO Agreement. For the six months ended June 30, 2018, the fee paid by the fund under this agreement was $89 and is included in “Miscellaneous” expense in the Statement of Operations. MFS has agreed to bear all expenses associated with office space, other administrative support, and supplies provided to the ISO.
The fund invests in the MFS Institutional Money Market Portfolio which is managed by MFS and seeks current income consistent with preservation of capital and liquidity. This money market fund does not pay a management fee to MFS.
The fund is permitted to engage in purchase and sale transactions with funds and accounts for which MFS serves as investment adviser or sub-adviser (“cross-trades”) pursuant to a policy adopted by the Board of Trustees. This policy has been designed to ensure that cross-trades conducted by the fund comply with Rule 17a-7 under the Investment Company Act of 1940. During the six months ended June 30, 2018, the fund engaged in purchase and sale transactions pursuant to this policy, which amounted to $124,156 and $481,633, respectively. The sales transactions resulted in net realized gains (losses) of $148,685.
For the six months ended June 30, 2018, purchases and sales of investments, other than short-term obligations, aggregated $13,532,119 and $21,091,864, respectively.
| (5) | | Shares of Beneficial Interest |
The fund’s Declaration of Trust permits the Trustees to issue an unlimited number of full and fractional shares of beneficial interest. Transactions in fund shares were as follows:
| | | | | | | | | | | | | | | | |
| | | Six months ended 6/30/18 | | | Year ended 12/31/17 | |
| | | Shares | | | Amount | | | Shares | | | Amount | |
| Shares sold | | | | | | | | | | | | | | | | |
Initial Class | | | 8,742 | | | | $284,790 | | | | 26,267 | | | | $775,526 | |
Service Class | | | 8,594 | | | | 276,349 | | | | 7,463 | | | | 214,891 | |
| | | 17,336 | | | | $561,139 | | | | 33,730 | | | | $990,417 | |
| Shares issued to shareholders in reinvestment of distributions | | | | | | | | | | | | | | | | |
Initial Class | | | — | | | | $— | | | | 51,146 | | | | $1,502,165 | |
Service Class | | | — | | | | — | | | | 3,377 | | | | 98,865 | |
| | | — | | | | $— | | | | 54,523 | | | | $1,601,030 | |
| Shares reacquired | | | | | | | | | | | | | | | | |
Initial Class | | | (252,428 | ) | | | $(8,166,167 | ) | | | (528,496 | ) | | | $(15,420,190 | ) |
Service Class | | | (33,575 | ) | | | (1,085,779 | ) | | | (69,314 | ) | | | (2,011,438 | ) |
| | | (286,003 | ) | | | $(9,251,946 | ) | | | (597,810 | ) | | | $(17,431,628 | ) |
| Net change | | | | | | | | | | | | | | | | |
Initial Class | | | (243,686 | ) | | | $(7,881,377 | ) | | | (451,083 | ) | | | $(13,142,499 | ) |
Service Class | | | (24,981 | ) | | | (809,430 | ) | | | (58,474 | ) | | | (1,697,682 | ) |
| | | (268,667 | ) | | | $(8,690,807 | ) | | | (509,557 | ) | | | $(14,840,181 | ) |
The fund and certain other funds managed by MFS participate in a $1.25 billion unsecured committed line of credit, subject to a $1 billion sublimit, provided by a syndication of banks under a credit agreement. Borrowings may be made for temporary financing needs. Interest is charged to each fund, based on its borrowings, generally at a rate equal to the higher of the Overnight Bank Funding rate or daily one month LIBOR plus an agreed upon spread. A commitment fee, based on the average daily, unused portion of the committed line of credit, is allocated among the participating funds. In addition, the fund and other funds managed by MFS have established unsecured uncommitted borrowing arrangements with certain banks for temporary financing needs. Interest is charged to each fund, based on its borrowings, at a rate equal to the Overnight Bank Funding rate plus an agreed upon spread. For the six months ended June 30, 2018, the fund’s commitment fee and interest expense were $349 and $0, respectively, and are included in “Miscellaneous” expense in the Statement of Operations.
16
MFS Global Research Portfolio
Notes to Financial Statements (unaudited) – continued
| (7) | | Investments in Affiliated Issuers |
An affiliated issuer may be considered one in which the fund owns 5% or more of the outstanding voting securities, or a company which is under common control. For the purposes of this report, the fund assumes the following to be affiliated issuers:
| | | | | | | | | | | | | | | | | | |
| Affiliated Issuers | | | | Beginning
Shares/Par
Amount | | | Acquisitions
Shares/Par
Amount | | | Dispositions
Shares/Par
Amount | | | Ending
Shares/Par
Amount | |
| MFS Institutional Money Market Portfolio | | | | | 477,596 | | | | 8,414,182 | | | | (8,891,168 | ) | | | 610 | |
| | | | | |
| Affiliated Issuers | | Realized
Gain (Loss) | | Change in
Unrealized
Appreciation/
Depreciation | | | Capital Gain
Distributions | | | Dividend
Income | | | Ending
Value | |
| MFS Institutional Money Market Portfolio | | $(55) | | | $33 | | | | $— | | | | $4,685 | | | | $610 | |
17
MFS Global Research Portfolio
PROXY VOTING POLICIES AND INFORMATION
MFS votes proxies on behalf of the fund pursuant to proxy voting policies and procedures that are available without charge, upon request, by calling 1-800-225-2606, by visiting mfs.com/proxyvoting, or by visiting the SEC’s Web site at http://www.sec.gov.
Information regarding how the fund voted proxies relating to portfolio securities during the most recent twelve-month period ended June 30 is available by August 31 of each year without charge by visiting mfs.com/proxyvoting, or by visiting the SEC’s Web site at http://www.sec.gov.
QUARTERLY PORTFOLIO DISCLOSURE
The fund will file a complete schedule of portfolio holdings with the Securities and Exchange Commission (the Commission) for the first and third quarters of each fiscal year on Form N-Q. The fund’s Form N-Q is available on the EDGAR database on the Commission’s Internet Web site at http://www.sec.gov, and may be reviewed and copied at the:
Public Reference Room
Securities and Exchange Commission
100 F Street, NE, Room 1580
Washington, D.C. 20549
Information on the operation of the Public Reference Room may be obtained by calling the Commission at 1-800-SEC-0330. Copies of the fund’s Form N-Q also may be obtained, upon payment of a duplicating fee, by electronic request at the following e-mail address: publicinfo@sec.gov or by writing the Public Reference Section at the above address.
FURTHER INFORMATION
From time to time, MFS may post important information about the fund or the MFS funds on the MFS web site (mfs.com). This information is available at https://www.mfs.com/en-us/what-we-do/announcements.html or at mfs.com/vit2 by choosing the fund’s name.
INFORMATION ABOUT FUND CONTRACTS AND LEGAL CLAIMS
The fund has entered into contractual arrangements with an investment adviser, administrator, distributor, shareholder servicing agent, 529 program manager (if applicable), and custodian who each provide services to the fund. Unless expressly stated otherwise, shareholders are not parties to, or intended beneficiaries of these contractual arrangements, and these contractual arrangements are not intended to create any shareholder right to enforce them against the service providers or to seek any remedy under them against the service providers, either directly or on behalf of the fund.
Under the Trust’s By-Laws and Declaration of Trust, any claims asserted against or on behalf of the MFS Funds, including claims against Trustees and Officers, must be brought in state and federal courts located within the Commonwealth of Massachusetts.
18
Semiannual Report
June 30, 2018

MFS® Global Tactical Allocation Portfolio

MFS® Variable Insurance Trust II
WTS-SEM
MFS® Global Tactical Allocation Portfolio
CONTENTS
The report is prepared for the general information of contract owners. It is authorized for distribution to prospective investors only when preceded or accompanied by a current prospectus.
NOT FDIC INSURED • MAY LOSE VALUE • NO BANK OR CREDIT UNION GUARANTEE • NOT A DEPOSIT • NOT INSURED BY ANY FEDERAL GOVERNMENT AGENCY OR NCUA/NCUSIF
MFS Global Tactical Allocation Portfolio
LETTER FROM THE EXECUTIVE CHAIRMAN

Dear Contract Owners:
Rising bond yields, international trade friction and geopolitical uncertainty have contributed to a measurable uptick in market volatility — a departure from the low-volatility environment that prevailed for much of 2017. In recent months, against this more challenging backdrop, global markets have given back some of the strong gains recorded during 2017 and early 2018. But global economic growth remains healthy, notwithstanding signs of a modest slowdown over the past few months, particularly in Europe and China.
Although the U.S. Federal Reserve continues to gradually raise interest rates and shrink its balance sheet, monetary policy remains accommodative around the world, with many central banks taking only tentative steps toward tighter policies. Newly enacted U.S. tax reforms have been welcomed by equity markets, while emerging market economies have recently had to contend with tighter financial conditions as a result of firmer U.S. Treasury yields and a stronger dollar. Around the world, inflation remains largely subdued, but tight labor markets and solid global demand have investors on the lookout for its potential resurgence. Increased U.S. protectionism is also a growing concern, as investors fear that trade disputes could dampen business sentiment, leading to slower global growth.
As a global investment manager, MFS® strives to create long-term value for clients through an active approach and an investment platform built on nearly a century of expertise. To make that long-term value meaningful for clients, we work to align with you on our beliefs, your needs and the time it takes to deliver on your desired outcomes.
Respectfully,

Robert J. Manning
Executive Chairman
MFS Investment Management
August 16, 2018
The opinions expressed in this letter are subject to change and may not be relied upon for investment advice. No forecasts can be guaranteed.
1
MFS Global Tactical Allocation Portfolio
PORTFOLIO COMPOSITION
Portfolio Structure
| | | | | | | | | | | | | | | | | | |
| | | | | | | | Tactical Overlay (b) | | | | |
| | | | | Active Security Selection (a) | | | Long | | | Short | | | Net Market
Exposure (c) | |
| Fixed Income | | U.S. | | | 25.3% | | | | 0.0% | | | | (1.5)% | | | | 23.8% | |
| | Europe ex-U.K. | | | 14.2% | | | | 0.0% | | | | (1.4)% | | | | 12.8% | |
| | Asia/Pacific ex-Japan | | | 2.8% | | | | 5.8% | | | | 0.0% | | | | 8.6% | |
| | Japan | | | 6.5% | | | | 0.0% | | | | (1.2)% | | | | 5.3% | |
| | Emerging Markets | | | 3.7% | | | | 0.0% | | | | 0.0% | | | | 3.7% | |
| | United Kingdom | | | 3.2% | | | | 0.0% | | | | (0.5)% | | | | 2.7% | |
| | Supranational | | | 0.1% | | | | 0.0% | | | | 0.0% | | | | 0.1% | |
| | North America ex-U.S. | | | 2.8% | | | | 0.0% | | | | (3.7)% | | | | (0.9)% | |
| | | Total | | | 58.6% | | | | 5.8% | | | | (8.3)% | | | | 56.1% | |
| Equity | | U.S. Large Cap | | | 17.3% | | | | 0.0% | | | | (1.5)% | | | | 15.8% | |
| | Asia/Pacific ex-Japan | | | 0.5% | | | | 5.9% | | | | 0.0% | | | | 6.4% | |
| | Europe ex-U.K. | | | 6.9% | | | | 4.3% | | | | (5.8)% | | | | 5.4% | |
| | United Kingdom | | | 2.4% | | | | 2.3% | | | | 0.0% | | | | 4.7% | |
| | Emerging Markets | | | 1.6% | | | | 6.0% | | | | (5.8)% | | | | 1.8% | |
| | Japan | | | 2.6% | | | | 0.0% | | | | (1.0)% | | | | 1.6% | |
| | North America ex-U.S. | | | 1.2% | | | | 0.0% | | | | (0.7)% | | | | 0.5% | |
| | U.S. Small/Mid Cap | | | 0.5% | | | | 0.0% | | | | (1.9)% | | | | (1.4)% | |
| | | Total | | | 33.0% | | | | 18.5% | | | | (16.7)% | | | | 34.8% | |
| Real Estate-related | | Non-U.S. | | | 0.9% | | | | 0.0% | | | | 0.0% | | | | 0.9% | |
| | U.S. | | | 0.4% | | | | 0.0% | | | | 0.0% | | | | 0.4% | |
| | | Total | | | 1.3% | | | | 0.0% | | | | 0.0% | | | | 1.3% | |
| Cash | | Cash & Cash Equivalents (d) | | | | | | | | | | | | | | | 2.6% | |
| | Other (e) | | | | | | | | | | | | | | | 5.2% | |
| | | Total | | | | | | | | | | | | | | | 7.8% | |
| | Total Net Exposure Summary | | | | | | | | | | | | | | | 100.0% | |
| | | | | | | | |
| Strategic Allocation Targets & Net Exposure Ranges | |
| Asset Class | | | Target (w) | | | | Ranges (z) | |
| Equities | | | 35% | | | | 0 to 70% | |
| Fixed Income, Cash and Cash Equivalents | | | 65% | | | | 30 to 100% | |
| | | | |
| Top ten holdings (c) | | | | |
| Australian Treasury Bond 10 yr Future – SEP 2018 | | | 5.8% | |
| U.S. Treasury Note 2 yr Future – SEP 2018 | | | 5.0% | |
| Hang Seng Index Future – JUL 2018 | | | 3.4% | |
| BIST 30 Index Future – AUG 2018 | | | 2.8% | |
Government of Japan, 1.7%, 9/20/2032 | | | 2.8% | |
| U.S. Treasury Ultra Note 10 yr Future – SEP 2018 | | | (3.2)% | |
| FTSE/JSE Index Future – SEP 2018 | | | (3.2)% | |
| Canadian Treasury Bond 10 yr Future – SEP 2018 | | | (3.4)% | |
| AEX 25 Index Future – JUL 2018 | | | (3.4)% | |
| U.S. Treasury Note 10 yr Future – SEP 2018 | | | (4.3)% | |
2
MFS Global Tactical Allocation Portfolio
Portfolio Composition – continued
| (a) | | Represents the actively managed portion of the portfolio and for purposes of this presentation, components include the value of securities, less any securities sold short. The bond component will include any accrued interest amounts. This also reflects the equivalent exposure of certain derivative positions. These amounts may be negative from time to time. |
| (b) | | Represents the tactical overlay portion of the portfolio which is how the fund manages its exposure to markets and currencies through the use of derivative positions. Percentages reflect the equivalent exposure of those derivative positions. |
| (c) | | For purposes of this presentation, the components include the value of securities, less any securities sold short, and reflect the impact of the equivalent exposure of all derivative positions. These amounts may be negative from time to time. The bond component will include any accrued interest amounts. |
| (d) | | Cash & Cash Equivalents includes any cash, investments in money market funds, short term securities, and other assets less liabilities. Please see the Statement of Assets and Liabilities for additional information related to the fund’s cash position and other assets and liabilities. |
| (e) | | Other includes currency derivatives and/or the offsetting of the leverage produced by the fund’s derivative positions, including payables and/or receivables of the finance leg of interest rate swaps and the unrealized gain or loss in connection with forward currency exchange contracts. |
| (w) | | The strategic asset class allocations have been selected for investment over longer time periods. The actual strategic asset class weightings can deviate due to market movements and cash flows. |
| (z) | | The fund’s net exposures to the asset classes referenced will normally fall within these ranges after taking into account the tactical overlay. |
Equivalent exposure is a calculated amount that translates the derivative position into a reasonable approximation of the amount of the underlying asset that the portfolio would have to hold at a given point in time to have the same price sensitivity that results from the portfolio’s ownership of the derivative contract. When dealing with derivatives, equivalent exposure is a more representative measure of the potential impact of a position on portfolio performance than value. The value of derivatives may be different.
Where the fund holds convertible bonds, they are treated as part of the equity portion of the portfolio.
Percentages are based on net assets as of June 30, 2018.
The portfolio is actively managed and current holdings may be different.
3
MFS Global Tactical Allocation Portfolio
EXPENSE TABLE
Fund Expenses Borne by the Contract Holders during the Period,
January 1, 2018 through June 30, 2018
As a contract holder of the fund, you incur ongoing costs, including management fees; distribution and/or service (12b-1) fees; and other fund expenses. This example is intended to help you understand your ongoing costs (in dollars) of investing in the fund and to compare these costs with the ongoing costs of investing in other mutual funds.
The example is based on an investment of $1,000 invested at the beginning of the period and held for the entire period January 1, 2018 through June 30, 2018.
Actual Expenses
The first line for each share class in the following table provides information about actual account values and actual expenses. You may use the information in this line, together with the amount you invested, to estimate the expenses that you paid over the period. Simply divide your account value by $1,000 (for example, an $8,600 account value divided by $1,000 = 8.6), then multiply the result by the number in the first line under the heading entitled “Expenses Paid During Period” to estimate the expenses you paid on your account during this period.
Hypothetical Example for Comparison Purposes
The second line for each share class in the following table provides information about hypothetical account values and hypothetical expenses based on the fund’s actual expense ratio and an assumed rate of return of 5% per year before expenses, which is not the fund’s actual return. The hypothetical account values and expenses may not be used to estimate the actual ending account balance or expenses you paid for the period. You may use this information to compare the ongoing costs of investing in the fund and other funds. To do so, compare this 5% hypothetical example with the 5% hypothetical examples that appear in the shareholder reports of the other funds.
Please note that the expenses shown in the table are meant to highlight the fund’s ongoing costs only and do not take into account the fees and expenses imposed under the variable contracts through which your investment in the fund is made. Therefore, the second line for each share class in the table is useful in comparing ongoing costs associated with an investment in vehicles (such as the fund) which fund benefits under variable annuity and variable life insurance contracts and to qualified pension and retirement plans only, and will not help you determine the relative total costs of investing in the fund through variable annuity and variable life insurance contracts. If the fees and expenses imposed under the variable contracts were included, your costs would have been higher.
| | | | | | | | | | | | | | | | | | |
| Share Class | | | | Annualized
Expense Ratio | | | Beginning
Account Value
1/01/18 | | | Ending
Account Value
6/30/18 | | | Expenses Paid During Period (p) 1/01/18-6/30/18 | |
| Initial Class | | Actual | | | 0.80% | | | | $1,000.00 | | | | $973.31 | | | | $3.91 | |
| | Hypothetical (h) | | | 0.80% | | | | $1,000.00 | | | | $1,020.83 | | | | $4.01 | |
| Service Class | | Actual | | | 1.05% | | | | $1,000.00 | | | | $971.59 | | | | $5.13 | |
| | Hypothetical (h) | | | 1.05% | | | | $1,000.00 | | �� | | $1,019.59 | | | | $5.26 | |
| (h) | 5% class return per year before expenses. |
| (p) | “Expenses Paid During Period” are equal to each class’s annualized expense ratio, as shown above, multiplied by the average account value over the period, multiplied by 181/365 (to reflect the one-half year period). |
Notes to Expense Table
Expense ratios include 0.04% of interest expense on uncovered collateral or margin obligations with the broker (See Note 2 of the Notes to Financial Statements) that are outside of the expense limitation arrangement (See Note 3 of the Notes to Financial Statements).
4
MFS Global Tactical Allocation Portfolio
PORTFOLIO OF INVESTMENTS – 6/30/18 (unaudited)
The Portfolio of Investments is a complete list of all securities owned by your fund. It is categorized by broad-based asset classes.
| | | | | | | | |
| Issuer | | Shares/Par | | | Value ($) | |
| BONDS – 62.8% | | | | | |
| Aerospace – 0.3% | | | | | |
| Huntington Ingalls Industries, Inc., 3.483%, 12/01/2027 | | $ | 370,000 | | | $ | 347,726 | |
| L3 Technologies, Inc., 3.85%, 6/15/2023 | | | 555,000 | | | | 553,846 | |
| Lockheed Martin Corp., 3.55%, 1/15/2026 | | | 749,000 | | | | 736,100 | |
| Rolls-Royce Holdings PLC, 0.875%, 5/09/2024 | | EUR | 400,000 | | | | 462,605 | |
| | | | | | | | |
| | | | | | $ | 2,100,277 | |
| | | | | | | | |
| Apparel Manufacturers – 0.1% | | | | | |
| Coach, Inc., 4.125%, 7/15/2027 | | $ | 985,000 | | | $ | 939,291 | |
| | | | | | | | |
| Asset-Backed & Securitized – 2.5% | | | | | |
Cent CLO LP, 2014-21A, “A1”, FLR, 3.576% (LIBOR-3mo. +
1.21%), 7/27/2026 (n) | | $ | 1,378,270 | | | $ | 1,378,471 | |
| Chesapeake Funding II LLC, 2016-1A, “A2”, FLR, 3.223% (LIBOR-1mo. + 1.15%), 3/15/2028 (n) | | | 788,664 | | | | 791,614 | |
| Chesapeake Funding II LLC, 2016-2A, “A2”, FLR, 3.073% (LIBOR-1mo. + 1%), 6/15/2028 (z) | | | 721,214 | | | | 723,345 | |
| CPS Auto Trust, 2016-D, “B”, 2.11%, 3/15/2021 (n) | | | 858,000 | | | | 852,414 | |
| Dryden Senior Loan Fund, 2013-26A, “AR”, CLO, FLR, 3.248% (LIBOR-3mo. + 0.9%), 4/15/2029 (z) | | | 1,292,000 | | | | 1,288,182 | |
| Dryden Senior Loan Fund, 2018-55A, “A1”, CLO, FLR, 3.061% (LIBOR-3mo. + 1.02%), 4/15/2031 (n) | | | 2,040,000 | | | | 2,031,279 | |
| Flatiron CLO Ltd., 2013-1A, “A2R”, FLR, 4.002% (LIBOR-3mo. + 1.65%), 1/17/2026 (n) | | | 1,991,841 | | | | 1,990,447 | |
| JPMBB Commercial Mortgage Securities Trust, 2014-C26, 3.494%, 1/15/2048 | | | 2,570,000 | | | | 2,559,455 | |
| Morgan Stanley Capital I Trust, 2017-H1, “A5”, 3.53%, 6/15/2050 | | | 659,762 | | | | 649,901 | |
| Octagon Investment Partners XVII Ltd., 2013-1A, “BR2”, FLR, 3.384% (LIBOR-3mo. + 1.4%), 1/25/2031 (n) | | | 2,275,000 | | | | 2,268,216 | |
| Wells Fargo Commercial Mortgage Trust, 2015-C28, “A4”, 3.54%, 5/15/2048 | | | 2,271,943 | | | | 2,265,292 | |
| | | | | | | | |
| | | | | | $ | 16,798,616 | |
| | | | | | | | |
| Automotive – 0.8% | | | | | |
| Ferrari N.V., 1.5%, 3/16/2023 | | EUR | 1,100,000 | | | $ | 1,294,214 | |
| General Motors Co., 6.75%, 4/01/2046 | | $ | 312,000 | | | | 345,646 | |
| General Motors Financial Co., Inc., 4.35%, 1/17/2027 | | | 1,000,000 | | | | 967,616 | |
| Lear Corp., 3.8%, 9/15/2027 | | | 608,000 | | | | 570,871 | |
| | | | | | | | |
| Issuer | | Shares/Par | | | Value ($) | |
| BONDS – continued | | | | | |
| Automotive – continued | | | | | |
| Volkswagen Bank GmbH, 0.75%, 6/15/2023 | | EUR | 550,000 | | | $ | 631,770 | |
| Volkswagen Financial Services AG, 0.875%, 4/12/2023 | | | 500,000 | | | | 578,020 | |
| Volkswagen International Finance N.V., 2.7%, 12/31/2099 | | | 400,000 | | | | 455,442 | |
| Volkswagen Leasing GmbH, 1.375%, 1/20/2025 | | | 610,000 | | | | 703,958 | |
| | | | | | | | |
| | | | | | $ | 5,547,537 | |
| | | | | | | | |
| Banks & Diversified Financials (Covered Bonds) – 0.1% | |
| CaixaBank S.A., 1.125%, 1/12/2023 | | EUR | 500,000 | | | $ | 574,275 | |
| | | | | | | | |
| Broadcasting – 0.3% | | | | | |
| ProSiebenSat.1 Media AG, 2.625%, 4/15/2021 | | EUR | 795,000 | | | $ | 970,220 | |
| RELX Finance B.V., 1%, 3/22/2024 | | | 350,000 | | | | 411,924 | |
| SES S.A., 1.625%, 3/22/2026 | | | 500,000 | | | | 583,011 | |
| WPP Finance 2016 Co., 1.375%, 3/20/2025 | | | 330,000 | | | | 384,642 | |
| | | | | | | | |
| | | | | | $ | 2,349,797 | |
| | | | | | | | |
| Brokerage & Asset Managers – 0.5% | | | | | |
| Charles Schwab Corp., 3.85%, 5/21/2025 | | $ | 596,000 | | | $ | 602,649 | |
| E*TRADE Financial Corp., 2.95%, 8/24/2022 | | | 499,000 | | | | 483,371 | |
| Intercontinental Exchange, Inc., 2.75%, 12/01/2020 | | | 506,000 | | | | 501,096 | |
| Intercontinental Exchange, Inc., 3.75%, 12/01/2025 | | | 831,000 | | | | 824,768 | |
| TD Ameritrade Holding Corp., 2.95%, 4/01/2022 | | | 676,000 | | | | 664,186 | |
| | | | | | | | |
| | | | | | $ | 3,076,070 | |
| | | | | | | | |
| Building – 0.3% | | | | | |
| Imerys S.A., 1.5%, 1/15/2027 | | EUR | 400,000 | | | $ | 465,740 | |
| Martin Marietta Materials, Inc., 4.25%, 7/02/2024 | | $ | 367,000 | | | | 370,326 | |
| Martin Marietta Materials, Inc., 3.45%, 6/01/2027 | | | 339,000 | | | | 315,373 | |
| Martin Marietta Materials, Inc., 3.5%, 12/15/2027 | | | 446,000 | | | | 413,845 | |
| Owens Corning, 4.4%, 1/30/2048 | | | 443,000 | | | | 369,876 | |
| | | | | | | | |
| | | | | | $ | 1,935,160 | |
| | | | | | | | |
| Business Services – 0.4% | | | | | |
| Cisco Systems, Inc., 2.2%, 2/28/2021 | | $ | 953,000 | | | $ | 934,988 | |
| Fidelity National Information Services, Inc., 3.875%, 6/05/2024 | | | 179,000 | | | | 178,458 | |
| Fidelity National Information Services, Inc., 5%, 10/15/2025 | | | 108,000 | | | | 113,553 | |
| Fidelity National Information Services, Inc., 3%, 8/15/2026 | | | 758,000 | | | | 694,391 | |
5
MFS Global Tactical Allocation Portfolio
Portfolio of Investments (unaudited) – continued
| | | | | | | | |
| Issuer | | Shares/Par | | | Value ($) | |
| BONDS – continued | | | | | | | | |
| Business Services – continued | | | | | |
| Tencent Holdings Ltd., 2.985%, 1/19/2023 (n) | | $ | 968,000 | | | $ | 941,177 | |
| | | | | | | | |
| | | | | | $ | 2,862,567 | |
| | | | | | | | |
| Cable TV – 0.5% | | | | | | | | |
| Charter Communications Operating LLC, 6.384%, 10/23/2035 | | $ | 540,000 | | | $ | 564,304 | |
| Cox Communications, Inc., 3.25%, 12/15/2022 (n) | | | 498,000 | | | | 483,735 | |
| NBCUniversal Enterprise, Inc., 1.974%, 4/15/2019 (n) | | | 886,000 | | | | 879,386 | |
| Shaw Communications, Inc., 5.65%, 10/01/2019 | | CAD | 674,000 | | | | 532,279 | |
| Sky PLC, 2.5%, 9/15/2026 | | EUR | 550,000 | | | | 691,963 | |
| | | | | | | | |
| | | | | | $ | 3,151,667 | |
| | | | | | | | |
| Chemicals – 0.2% | | | | | | | | |
| Air Liquide Finance Co., 2.25%, 9/27/2023 (n) | | $ | 727,000 | | | $ | 682,767 | |
| LyondellBasell Industries N.V., 5%, 4/15/2019 | | | 440,000 | | | | 444,350 | |
| | | | | | | | |
| | | | | | $ | 1,127,117 | |
| | | | | | | | |
| Computer Software – 0.2% | | | | | | | | |
| Microsoft Corp., 4.1%, 2/06/2037 | | $ | 824,000 | | | $ | 858,505 | |
| Ubisoft Entertainment S.A., 1.289%, 1/30/2023 | | EUR | 300,000 | | | | 350,784 | |
| | | | | | | | |
| | | | | | $ | 1,209,289 | |
| | | | | | | | |
| Computer Software – Systems – 0.2% | | | | | |
| Apple, Inc., 4.5%, 2/23/2036 | | $ | 900,000 | | | $ | 965,791 | |
| Apple, Inc., 3.6%, 7/31/2042 | | GBP | 300,000 | | | | 462,019 | |
| Apple, Inc., 4.25%, 2/09/2047 | | $ | 225,000 | | | | 228,206 | |
| | | | | | | | |
| | | | | | $ | 1,656,016 | |
| | | | | | | | |
| Conglomerates – 0.1% | | | | | | | | |
| General Electric Co., 4.5%, 3/11/2044 | | $ | 392,000 | | | $ | 384,322 | |
| Smiths Group PLC, 2%, 2/23/2027 | | EUR | 500,000 | | | | 592,542 | |
| | | | | | | | |
| | | | | | $ | 976,864 | |
| | | | | | | | |
| Consumer Products – 0.2% | | | | | | | | |
| JAB Holdings B.V., 2%, 5/18/2028 | | EUR | 600,000 | | | $ | 692,236 | |
| Reckitt Benckiser Treasury Services PLC, 3.625%, 9/21/2023 (n) | | $ | 577,000 | | | | 575,690 | |
| Reckitt Benckiser Treasury Services PLC, 3%, 6/26/2027 (n) | | | 425,000 | | | | 395,138 | |
| | | | | | | | |
| | | | | | $ | 1,663,064 | |
| | | | | | | | |
| Consumer Services – 0.5% | | | | | | | | |
| Alibaba Group Holding Ltd., 4%, 12/06/2037 | | $ | 200,000 | | | $ | 185,170 | |
| G4S International Finance PLC, 1.5%, 1/09/2023 | | EUR | 600,000 | | | | 713,769 | |
| Priceline Group, Inc., 1.8%, 3/03/2027 | | | 800,000 | | | | 951,329 | |
| Priceline Group, Inc., 3.55%, 3/15/2028 | | $ | 356,000 | | | | 338,852 | |
| | | | | | | | |
| Issuer | | Shares/Par | | | Value ($) | |
| BONDS – continued | | | | | | | | |
| Consumer Services – continued | | | | | |
| Visa, Inc., 4.15%, 12/14/2035 | | $ | 585,000 | | | $ | 606,164 | |
| Visa, Inc., 3.65%, 9/15/2047 | | | 390,000 | | | | 364,463 | |
| | | | | | | | |
| | | | | | $ | 3,159,747 | |
| | | | | | | | |
| Containers – 0.1% | | | | | | | | |
| DS Smith PLC, 1.375%, 7/26/2024 | | EUR | 800,000 | | | $ | 922,375 | |
| | | | | | | | |
| Electronics – 0.2% | | | | | | | | |
| ASML Holding N.V., 1.375%, 7/07/2026 | | EUR | 600,000 | | | $ | 713,612 | |
| Broadcom Corp./Broadcom Cayman Finance Ltd., 3.875%, 1/15/2027 | | $ | 471,000 | | | | 445,496 | |
| | | | | | | | |
| | | | | | $ | 1,159,108 | |
| | | | | | | | |
| Emerging Market Quasi-Sovereign – 1.3% | | | | | |
| BPRL International Singapore Private Ltd., 4.375%, 1/18/2027 | | $ | 2,116,000 | | | $ | 2,009,584 | |
| CNPC General Capital Ltd., 3.4%, 4/16/2023 (n) | | | 2,183,000 | | | | 2,151,216 | |
| Office Cherifien des Phosphates, 6.875%, 4/25/2044 (n) | | | 1,570,000 | | | | 1,648,108 | |
| Pertamina, 6%, 5/03/2042 (n) | | | 2,084,000 | | | | 2,070,781 | |
| State Grid Overseas Investment (2016) Ltd., 2.75%, 5/04/2022 (n) | | | 1,024,000 | | | | 993,331 | |
| | | | | | | | |
| | | | | | $ | 8,873,020 | |
| | | | | | | | |
| Emerging Market Sovereign – 0.9% | | | | | |
| Government of India, 7.17%, 1/08/2028 | | INR | 80,000,000 | | | $ | 1,111,114 | |
| Government of Malaysia, 3.58%, 9/28/2018 | | MYR | 5,339,000 | | | | 1,322,329 | |
| Republic of Hungary, 5.375%, 2/21/2023 | | $ | 1,972,000 | | | | 2,087,678 | |
| Republic of Indonesia, 2.875%, 7/08/2021 (z) | | EUR | 500,000 | | | | 619,507 | |
| Republic of Indonesia, 2.15%, 7/18/2024 (z) | | | 339,000 | | | | 398,616 | |
| United Mexican States, 4.6%, 2/10/2048 | | $ | 829,000 | | | | 762,680 | |
| | | | | | | | |
| | | | | | $ | 6,301,924 | |
| | | | | | | | |
| Energy – Independent – 0.3% | | | | | | | | |
| Tengizchevroil Finance Co. International Ltd., 4%, 8/15/2026 (n) | | $ | 2,260,000 | | | $ | 2,113,100 | |
| | | | | | | | |
| Financial Institutions – 0.3% | | | | | | | | |
| AerCap Ireland Capital Ltd., 3.65%, 7/21/2027 | | $ | 973,000 | | | $ | 885,831 | |
| EXOR N.V., 1.75%, 1/18/2028 | | EUR | 450,000 | | | | 506,101 | |
| International Lease Finance Corp., 7.125%, 9/01/2018 (n) | | $ | 859,000 | | | | 864,604 | |
| | | | | | | | |
| | | | | | $ | 2,256,536 | |
| | | | | | | | |
| Food & Beverages – 0.7% | | | | | | | | |
| Anheuser-Busch InBev N.V., 1.5%, 4/18/2030 | | EUR | 400,000 | | | $ | 457,021 | |
| Anheuser-Busch InBev Worldwide, Inc., 3.75%, 1/15/2022 | | $ | 342,000 | | | | 346,645 | |
6
MFS Global Tactical Allocation Portfolio
Portfolio of Investments (unaudited) – continued
| | | | | | | | |
| Issuer | | Shares/Par | | | Value ($) | |
| BONDS – continued | | | | | | | | |
| Food & Beverages – continued | | | | | |
| Anheuser-Busch InBev Worldwide, Inc., 3.3%, 2/01/2023 | | $ | 1,130,000 | | | $ | 1,120,552 | |
| Anheuser-Busch InBev Worldwide, Inc., 4.7%, 2/01/2036 | | | 849,000 | | | | 860,501 | |
| Asahi Group Holdings Ltd., 1.151%, 9/19/2025 | | EUR | 300,000 | | | | 349,744 | |
| Coca-Cola Enterprises, Inc., 1.875%, 3/18/2030 | | | 600,000 | | | | 722,743 | |
| Kraft Heinz Foods Co., 5.2%, 7/15/2045 | | $ | 77,000 | | | | 74,908 | |
| Kraft Heinz Foods Co., 4.375%, 6/01/2046 | | | 230,000 | | | | 198,974 | |
| Wm. Wrigley Jr. Co., 2.9%, 10/21/2019 (n) | | | 409,000 | | | | 407,962 | |
| | | | | | | | |
| | | | | | $ | 4,539,050 | |
| | | | | | | | |
| Gaming & Lodging – 0.1% | | | | | | | | |
| InterContinental Hotels Group PLC, 3.75%, 8/14/2025 | | GBP | 510,000 | | | $ | 716,243 | |
| | | | | | | | |
| Industrial – 0.1% | | | | | | | | |
| Grainger PLC, 3.375%, 4/24/2028 | | GBP | 280,000 | | | $ | 369,363 | |
| | | | | | | | |
| Insurance – 0.1% | | | | | | | | |
| American International Group, Inc., 1.875%, 6/21/2027 | | EUR | 270,000 | | | $ | 312,036 | |
| NN Group N.V., 4.625%, 4/08/2044 | | | 500,000 | | | | 627,052 | |
| | | | | | | | |
| | | | | | $ | 939,088 | |
| | | | | | | | |
| Insurance – Health – 0.1% | | | | | | | | |
| Aetna, Inc., 2.8%, 6/15/2023 | | $ | 850,000 | | | $ | 809,904 | |
| | | | | | | | |
| Insurance – Property & Casualty – 0.8% | | | | | |
| Berkshire Hathaway, Inc., 2.75%, 3/15/2023 | | $ | 636,000 | | | $ | 622,398 | |
| Berkshire Hathaway, Inc., 4.5%, 2/11/2043 | | | 400,000 | | | | 415,479 | |
| Chubb INA Holdings, Inc., 2.3%, 11/03/2020 | | | 267,000 | | | | 262,249 | |
| Chubb INA Holdings, Inc., 2.5%, 3/15/2038 | | EUR | 320,000 | | | | 376,065 | |
| Hiscox Ltd., 6.125%, 11/24/2045 | | GBP | 300,000 | | | | 434,133 | |
| Liberty Mutual Group, Inc., 4.25%, 6/15/2023 | | $ | 839,000 | | | | 847,480 | |
| Liberty Mutual Group, Inc., 2.75%, 5/04/2026 (z) | | EUR | 200,000 | | | | 248,988 | |
| Liberty Mutual Group, Inc., 2.75%, 5/04/2026 | | | 200,000 | | | | 248,989 | |
| Marsh & McLennan Cos., Inc., 2.55%, 10/15/2018 | | $ | 505,000 | | | | 504,778 | |
| Marsh & McLennan Cos., Inc., 4.35%, 1/30/2047 | | | 359,000 | | | | 357,104 | |
| QBE Capital Funding III Ltd., 7.5%, 5/24/2041 | | GBP | 400,000 | | | | 576,623 | |
| XLIT Ltd., 3.25%, 6/29/2047 | | EUR | 610,000 | | | | 689,981 | |
| | | | | | | | |
| | | | | | $ | 5,584,267 | |
| | | | | | | | |
| | | | | | | | |
| Issuer | | Shares/Par | | | Value ($) | |
| BONDS – continued | | | | | | | | |
| International Market Quasi-Sovereign – 0.8% | |
| Bank of Iceland, 1.75%, 9/07/2020 | | EUR | 600,000 | | | $ | 720,379 | |
| Landsbanki Islands HF, 1.125% to 1/19/2023, FLR to 1/19/2024 | | | 350,000 | | | | 405,219 | |
| Statoil A.S.A., 4.25%, 11/23/2041 | | $ | 1,260,000 | | | | 1,250,244 | |
| Temasek Financial I Ltd., 2.375%, 1/23/2023 (n) | | | 2,880,000 | | | | 2,767,502 | |
| | | | | | | | |
| | | | | | $ | 5,143,344 | |
| | | | | | | | |
| International Market Sovereign – 22.5% | | | | | |
| Commonwealth of Australia, 5.75%, 5/15/2021 | | AUD | 4,891,000 | | | $ | 3,988,743 | |
| Commonwealth of Australia, 5.5%, 4/21/2023 | | | 899,000 | | | | 762,344 | |
| Commonwealth of Australia, 2.75%, 11/21/2027 | | | 2,175,000 | | | | 1,626,165 | |
| Commonwealth of Australia, 3.75%, 4/21/2037 | | | 4,110,000 | | | | 3,399,280 | |
| Federal Republic of Germany, 1.75%, 2/15/2024 | | EUR | 7,079,000 | | | | 9,176,897 | |
| Federal Republic of Germany, 2.5%, 7/04/2044 | | | 309,000 | | | | 489,749 | |
| Federal Republic of Germany, 2.5%, 8/15/2046 | | | 2,668,000 | | | | 4,278,229 | |
| Government of Canada, 1.5%, 6/01/2023 | | CAD | 10,351,000 | | | | 7,660,519 | |
| Government of Canada, 5.75%, 6/01/2033 | | | 2,402,000 | | | | 2,646,137 | |
| Government of Canada, 4%, 6/01/2041 | | | 1,864,000 | | | | 1,867,616 | |
| Government of Japan, 1.7%, 9/20/2032 | | JPY | 1,723,800,000 | | | | 18,750,441 | |
| Government of Japan, 1.5%, 3/20/2034 | | | 1,496,850,000 | | | | 15,996,414 | |
| Government of Japan, 2.4%, 3/20/2037 | | | 680,350,000 | | | | 8,286,978 | |
| Government of New Zealand, 4.5%, 4/15/2027 | | NZD | 6,362,000 | | | | 4,928,074 | |
| Kingdom of Belgium, 0.2%, 10/22/2023 | | EUR | 1,423,000 | | | | 1,683,795 | |
| Kingdom of Belgium, 5.5%, 3/28/2028 | | | 1,586,000 | | | | 2,718,632 | |
| Kingdom of Spain, 5.4%, 1/31/2023 | | | 1,285,000 | | | | 1,850,628 | |
| Kingdom of Spain, 2.75%, 10/31/2024 | | | 2,870,000 | | | | 3,782,332 | |
| Kingdom of Spain, 5.15%, 10/31/2028 | | | 3,061,000 | | | | 4,860,954 | |
| Kingdom of Spain, 4.7%, 7/30/2041 | | | 876,000 | | | | 1,472,086 | |
| Republic of France, 1.75%, 5/25/2023 | | | 2,014,634 | | | | 2,573,711 | |
| Republic of France, 0.75%, 5/25/2028 | | | 376,000 | | | | 444,981 | |
| Republic of France, 4.75%, 4/25/2035 | | | 1,986,000 | | | | 3,650,761 | |
| Republic of France, 4.5%, 4/25/2041 | | | 895,000 | | | | 1,705,652 | |
| Republic of France, 4%, 4/25/2055 | | | 969,000 | | | | 1,872,082 | |
7
MFS Global Tactical Allocation Portfolio
Portfolio of Investments (unaudited) – continued
| | | | | | | | |
| Issuer | | Shares/Par | | | Value ($) | |
| BONDS – continued | | | | | | | | |
| International Market Quasi-Sovereign – continued | |
| Republic of Ireland, 0.9%, 5/15/2028 | | EUR | 2,025,000 | | | $ | 2,383,477 | |
| Republic of Italy, 3.75%, 3/01/2021 | | | 6,685,000 | | | | 8,363,380 | |
| Republic of Italy, 5.5%, 9/01/2022 | | | 3,777,000 | | | | 5,093,534 | |
| Republic of Italy, 2.5%, 12/01/2024 | | | 3,533,000 | | | | 4,209,179 | |
| Republic of Portugal, 4.95%, 10/25/2023 | | | 3,612,000 | | | | 5,164,423 | |
| Republic of Portugal, 4.125%, 4/14/2027 | | | 5,558,000 | | | | 7,812,891 | |
| United Kingdom Treasury, 4.25%, 3/07/2036 | | GBP | 1,913,000 | | | | 3,520,281 | |
| United Kingdom Treasury, 3.25%, 1/22/2044 | | | 2,497,000 | | | | 4,298,015 | |
| United Kingdom Treasury, 3.75%, 7/22/2052 | | | 799,000 | | | | 1,620,838 | |
| United Kingdom Treasury, 4%, 1/22/2060 | | | 344,000 | | | | 783,681 | |
| | | | | | | | |
| | | | | | $ | 153,722,899 | |
| | | | | | | | |
| Local Authorities – 0.2% | | | | | | | | |
| Province of Alberta, 4.5%, 12/01/2040 | | CAD | 665,000 | | | $ | 628,590 | |
| Province of British Columbia, 2.3%, 6/18/2026 | | | 965,000 | | | | 716,096 | |
| | | | | | | | |
| | | | | | $ | 1,344,686 | |
| | | | | | | | |
| Major Banks – 2.9% | | | | | | | | |
| Bank of America Corp., 2.625%, 4/19/2021 | | $ | 972,000 | | | $ | 954,871 | |
| Bank of America Corp., 3.004%, 12/20/2023 | | | 745,000 | | | | 722,305 | |
| Bank of America Corp., 3.5%, 4/19/2026 | | | 1,274,000 | | | | 1,232,300 | |
| Bank of America Corp., 3.248%, 10/21/2027 | | | 1,280,000 | | | | 1,192,922 | |
| Bank of New York Mellon Corp., 2.95%, 1/29/2023 | | | 1,051,000 | | | | 1,027,192 | |
| Barclays Bank PLC, 6%, 1/14/2021 | | EUR | 548,000 | | | | 715,632 | |
| Credit Agricole S.A., 7.375%, 12/18/2023 | | GBP | 300,000 | | | | 490,623 | |
| Credit Suisse Group AG, 6.5%, 8/08/2023 (n) | | $ | 1,265,000 | | | | 1,345,537 | |
| Credit Suisse Group AG, 1.25%, 7/17/2025 | | EUR | 400,000 | | | | 460,756 | |
| Goldman Sachs Group, Inc., 2.625%, 4/25/2021 | | $ | 530,000 | | | | 518,302 | |
| Goldman Sachs Group, Inc., 5.75%, 1/24/2022 | | | 1,486,000 | | | | 1,590,265 | |
| HSBC Holdings PLC, 4.375%, 11/23/2026 | | | 743,000 | | | | 730,365 | |
| JPMorgan Chase & Co., 2.95%, 10/01/2026 | | | 1,647,000 | | | | 1,529,889 | |
| JPMorgan Chase & Co., 3.54% to 5/01/2027, FLR to 5/01/2028 | | | 745,000 | | | | 713,257 | |
| Morgan Stanley, 2.5%, 4/21/2021 | | | 650,000 | | | | 634,847 | |
| Morgan Stanley, 5.5%, 7/28/2021 | | | 850,000 | | | | 899,456 | |
| | | | | | | | |
| Issuer | | Shares/Par | | | Value ($) | |
| BONDS – continued | | | | | | | | |
| Major Banks – continued | | | | | |
| Morgan Stanley, 2.625%, 3/09/2027 | | GBP | 350,000 | | | $ | 454,438 | |
| Morgan Stanley, 3.95%, 4/23/2027 | | $ | 636,000 | | | | 606,293 | |
| PNC Bank N.A., 2.6%, 7/21/2020 | | | 873,000 | | | | 862,456 | |
| Sumitomo Mitsui Financial Group, Inc., 3.544%, 1/17/2028 | | | 1,096,000 | | | | 1,062,302 | |
| UBS Group Funding (Jersey) Ltd., 1.5%, 11/30/2024 | | EUR | 500,000 | | | | 592,648 | |
| UBS Group Funding (Switzerland) | | | | | | | | |
| AG, 2.859% to 8/15/2022, FLR to 8/15/2023 (n) | | $ | 1,179,000 | | | | 1,128,439 | |
| | | | | | | | |
| | | | | | $ | 19,465,095 | |
| | | | | | | | |
| Medical & Health Technology & Services – 0.9% | | | | | |
| Becton, Dickinson and Co., 1.401%, 5/24/2023 | | EUR | 700,000 | | | $ | 824,236 | |
| Becton, Dickinson and Co., 3.734%, 12/15/2024 | | $ | 619,000 | | | | 604,299 | |
| CVS Health Corp., 5.05%, 3/25/2048 | | | 408,000 | | | | 415,220 | |
| Laboratory Corp. of America Holdings, 3.2%, 2/01/2022 | | | 1,025,000 | | | | 1,013,965 | |
| Laboratory Corp. of America Holdings, 4.7%, 2/01/2045 | | | 141,000 | | | | 137,951 | |
| Life Technologies Corp., 6%, 3/01/2020 | | | 411,000 | | | | 428,404 | |
| Northwell Healthcare, Inc., 3.979%, 11/01/2046 | | | 101,000 | | | | 92,747 | |
| Northwell Healthcare, Inc., 4.26%, 11/01/2047 | | | 754,000 | | | | 723,109 | |
| Thermo Fisher Scientific, Inc., 3%, 4/15/2023 | | | 910,000 | | | | 884,791 | |
| Thermo Fisher Scientific, Inc., 2.95%, 9/19/2026 | | | 394,000 | | | | 363,985 | |
| Thermo Fisher Scientific, Inc., 3.2%, 8/15/2027 | | | 800,000 | | | | 747,902 | |
| | | | | | | | |
| | | | | | $ | 6,236,609 | |
| | | | | | | | |
| Metals & Mining – 0.2% | | | | | | | | |
| Cameco Corp., 5.67%, 9/02/2019 | | CAD | 679,000 | | | $ | 531,781 | |
| Glencore Finance (Europe) S.A., 1.25%, 3/17/2021 | | EUR | 760,000 | | | | 904,365 | |
| | | | | | | | |
| | | | | | $ | 1,436,146 | |
| | | | | | | | |
| Midstream – 0.5% | | | | | | | | |
| APT Pipelines Ltd., 5%, 3/23/2035 (n) | | $ | 705,000 | | | $ | 730,496 | |
| Enbridge, Inc., 5.5%, 12/01/2046 | | | 153,000 | | | | 163,331 | |
| MPLX LP, 4.5%, 4/15/2038 | | | 449,000 | | | | 414,718 | |
| ONEOK, Inc., 4.95%, 7/13/2047 | | | 1,191,000 | | | | 1,159,604 | |
| Sabine Pass Liquefaction LLC, 4.2%, 3/15/2028 | | | 890,000 | | | | 861,617 | |
| | | | | | | | |
| | | | | | $ | 3,329,766 | |
| | | | | | | | |
| Mortgage-Backed – 6.9% | | | | | | | | |
| Fannie Mae, 4.57%, 5/01/2019 | | $ | 212,502 | | | $ | 213,699 | |
| Fannie Mae, 4.6%, 9/01/2019 | | | 565,788 | | | | 576,277 | |
| Fannie Mae, 4.45%, 10/01/2019 | | | 392,210 | | | | 399,679 | |
| Fannie Mae, 5%, 12/01/2020 - 8/01/2040 | | | 2,518,510 | | | | 2,701,860 | |
8
MFS Global Tactical Allocation Portfolio
Portfolio of Investments (unaudited) – continued
| | | | | | | | |
| Issuer | | Shares/Par | | | Value ($) | |
| BONDS – continued | | | | | | | | |
| Mortgage-Backed – continued | | | | | |
| Fannie Mae, 4.5%, 7/01/2023 -2/01/2046 | | $ | 8,570,761 | | | $ | 9,005,573 | |
| Fannie Mae, 4%, 3/01/2025 - 2/01/2041 | | | 4,435,631 | | | | 4,556,455 | |
| Fannie Mae, 5.5%, 11/01/2036 - 4/01/2037 | | | 193,882 | | | | 210,172 | |
| Fannie Mae, 6%, 9/01/2037 - 6/01/2038 | | | 337,577 | | | | 371,914 | |
| Fannie Mae, 3.5%, 5/01/2043 - 1/01/2047 | | | 3,998,736 | | | | 4,004,459 | |
| Freddie Mac, 2.323%, 10/25/2018 | | | 420,807 | | | | 419,795 | |
| Freddie Mac, 5.085%, 3/25/2019 | | | 30,000 | | | | 30,297 | |
| Freddie Mac, 4.186%, 8/25/2019 | | | 650,000 | | | | 658,928 | |
| Freddie Mac, 2.757%, 5/25/2020 | | | 22,311 | | | | 22,307 | |
| Freddie Mac, 3.32%, 7/25/2020 | | | 113,713 | | | | 113,930 | |
| Freddie Mac, 3.064%, 8/25/2024 | | | 2,767,003 | | | | 2,750,689 | |
| Freddie Mac, 4%, 7/01/2025 | | | 152,976 | | | | 157,407 | |
| Freddie Mac, 2.67%, 3/25/2026 | | | 2,800,000 | | | | 2,684,777 | |
| Freddie Mac, 3.243%, 4/25/2027 | | | 2,270,000 | | | | 2,244,200 | |
| Freddie Mac, 3.117%, 6/25/2027 | | | 1,036,027 | | | | 1,012,603 | |
| Freddie Mac, 3.194%, 7/25/2027 | | | 2,520,000 | | | | 2,478,664 | |
| Freddie Mac, 3.244%, 8/25/2027 | | | 2,367,000 | | | | 2,335,160 | |
| Freddie Mac, 3.187%, 9/25/2027 | | | 1,222,000 | | | | 1,196,950 | |
| Freddie Mac, 3.286%, 11/25/2027 | | | 1,303,000 | | | | 1,286,039 | |
| Freddie Mac, 3.35%, 1/25/2028 | | | 2,001,000 | | | | 1,984,771 | |
| Freddie Mac, 5.5%, 5/01/2034 - 7/01/2037 | | | 56,921 | | | | 61,658 | |
| Freddie Mac, 5%, 10/01/2036 - 7/01/2041 | | | 933,625 | | | | 999,830 | |
| Freddie Mac, 4.5%, 12/01/2039 - 5/01/2042 | | | 1,605,015 | | | | 1,687,924 | |
| Freddie Mac, 3.5%, 1/01/2047 | | | 1,589,462 | | | | 1,583,638 | |
| Ginnie Mae, 5%, 5/15/2040 | | | 145,624 | | | | 153,179 | |
| Ginnie Mae, 3.5%, 6/20/2043 | | | 1,324,296 | | | | 1,340,065 | |
| | | | | | | | |
| | | | | | $ | 47,242,899 | |
| | | | | | | | |
| Municipals – 0.1% | | | | | | | | |
| Commonwealth of Puerto Rico, Public Improvement, “C-7”, NATL, 6%, 7/01/2027 | | $ | 55,000 | | | $ | 56,246 | |
| Oklahoma Development Finance Authority, Health System Rev. (OU Medicine Project), “C”, 4.65%, 8/15/2030 | | | 572,000 | | | | 604,684 | |
| Puerto Rico Electric Power Authority Rev., “PP”, NATL, 5%, 7/01/2022 | | | 245,000 | | | | 246,563 | |
| | | | | | | | |
| | | | | | $ | 907,493 | |
| | | | | | | | |
| Natural Gas – Distribution – 0.2% | | | | | |
| GNL Quintero S.A., 4.634%, 7/31/2029 (n) | | $ | 1,420,000 | | | $ | 1,389,825 | |
| | | | | | | | |
| Network & Telecom – 0.6% | | | | | |
| AT&T, Inc., 4.25%, 6/01/2043 | | GBP | 300,000 | | | $ | 415,329 | |
| AT&T, Inc., 4.75%, 5/15/2046 | | $ | 602,000 | | | | 537,753 | |
| British Telecommunications PLC, 3.125%, 11/21/2031 | | GBP | 350,000 | | | | 446,273 | |
| | | | | | | | |
| Issuer | | Shares/Par | | | Value ($) | |
| BONDS – continued | | | | | | | | |
| Network & Telecom – continued | | | | | |
| Deutsche Telekom International Finance B.V., 1.5%, 4/03/2028 | | EUR | 500,000 | | | $ | 581,922 | |
| Empresa Nacional de Telecomunicaciones S.A., 4.75%, 8/01/2026 (n) | | $ | 2,129,000 | | | | 2,031,241 | |
| | | | | | | | |
| | | | | | $ | 4,012,518 | |
| | | | | | | | |
| Oil Services – 0.1% | | | | | | | | |
| Schlumberger Ltd., 2.65%, 11/20/2022 (n) | | $ | 780,000 | | | $ | 756,350 | |
| | | | | | | | |
| Oils – 0.3% | | | | | | | | |
| Marathon Petroleum Corp., 3.4%, 12/15/2020 | | $ | 452,000 | | | $ | 452,906 | |
| Marathon Petroleum Corp., 3.625%, 9/15/2024 | | | 500,000 | | | | 488,319 | |
| Neste Oyj, 1.5%, 6/07/2024 | | EUR | 400,000 | | | | 475,405 | |
| Phillips 66, 4.875%, 11/15/2044 | | $ | 795,000 | | | | 821,230 | |
| | | | | | | | |
| | | | | | $ | 2,237,860 | |
| | | | | | | | |
| Other Banks & Diversified Financials – 0.6% | | | | | |
| Belfius Bank S.A., 3.125%, 5/11/2026 | | EUR | 300,000 | | | $ | 363,767 | |
| BPCE S.A., 4.5%, 3/15/2025 (n) | | $ | 384,000 | | | | 374,357 | |
| BPCE S.A., 5.25%, 4/16/2029 | | GBP | 400,000 | | | | 596,150 | |
| Citizens Bank N.A., 2.55%, 5/13/2021 | | $ | 471,000 | | | | 459,343 | |
| Deutsche Bank AG, 1.875%, 2/28/2020 | | GBP | 200,000 | | | | 260,636 | |
| ING Groep N.V., 3.95%, 3/29/2027 | | $ | 216,000 | | | | 210,811 | |
| Intesa Sanpaolo S.p.A., 5.25%, 1/28/2022 | | GBP | 450,000 | | | | 645,443 | |
| UniCredit S.p.A., 1%, 1/18/2023 | | EUR | 800,000 | | | | 888,181 | |
| | | | | | | | |
| | | | | | $ | 3,798,688 | |
| | | | | | | | |
| Pharmaceuticals – 0.3% | | | | | | | | |
| Celgene Corp., 2.875%, 8/15/2020 | | $ | 1,479,000 | | | $ | 1,467,676 | |
| Gilead Sciences, Inc., 2.35%, 2/01/2020 | | | 448,000 | | | | 443,615 | |
| | | | | | | | |
| | | | | | $ | 1,911,291 | |
| | | | | | | | |
| Pollution Control – 0.1% | | | | | | | | |
| Republic Services, Inc., 3.95%, 5/15/2028 | | $ | 637,000 | | | $ | 628,381 | |
| | | | | | | | |
| Real Estate – Apartment – 0.1% | | | | | |
| Grand City Properties S.A., 1.375%, 8/03/2026 | | EUR | 700,000 | | | $ | 788,233 | |
| | | | | | | | |
| Real Estate – Office – 0.2% | | | | | | | | |
| Merlin Properties SOCIMI S.A., REIT, 2.225%, 4/25/2023 | | EUR | 1,050,000 | | | $ | 1,281,480 | |
| Merlin Properties SOCIMI S.A., REIT, 1.875%, 11/02/2026 | | | 350,000 | | | | 399,240 | |
| | | | | | | | |
| | | | | | $ | 1,680,720 | |
| | | | | | | | |
9
MFS Global Tactical Allocation Portfolio
Portfolio of Investments (unaudited) – continued
| | | | | | | | |
| Issuer | | Shares/Par | | | Value ($) | |
| BONDS – continued | | | | | | | | |
| Retailers – 0.4% | | | | | | | | |
| Best Buy Co., Inc., 5.5%, 3/15/2021 | | $ | 1,107,000 | | | $ | 1,160,448 | |
| Home Depot, Inc., 2.625%, 6/01/2022 | | | 695,000 | | | | 681,647 | |
| Home Depot, Inc., 3%, 4/01/2026 | | | 830,000 | | | | 793,079 | |
| | | | | | | | |
| | | | | | $ | 2,635,174 | |
| | | | | | | | |
| Specialty Stores – 0.1% | | | | | | | | |
| Richemont International S.A., 1.5%, 3/26/2030 | | EUR | 500,000 | | | $ | 588,857 | |
| | | | | | | | |
| Supermarkets – 0.2% | | | | | | | | |
| Esselunga S.p.A., 0.875%, 10/25/2023 | | EUR | 350,000 | | | $ | 405,635 | |
| Esselunga S.p.A., 1.875%, 10/25/2027 | | | 350,000 | | | | 401,579 | |
| Loblaw Cos. Ltd., 4.86%, 9/12/2023 | | CAD | 680,000 | | | | 555,426 | |
| | | | | | | | |
| | | | | | $ | 1,362,640 | |
| | | | | | | | |
| Supranational – 0.1% | | | | | | | | |
| International Bank for Reconstruction and Development, 2.8%, 1/13/2021 | | AUD | 420,000 | | | $ | 313,901 | |
| International Bank for Reconstruction and Development, 4.25%, 6/24/2025 | | | 465,000 | | | | 372,699 | |
| | | | | | | | |
| | | | | | $ | 686,600 | |
| | | | | | | | |
| Telecommunications – Wireless – 0.5% | | | | | |
| American Tower Corp., REIT, 4.7%, 3/15/2022 | | $ | 327,000 | | | $ | 337,086 | |
| American Tower Corp., REIT, 3.5%, 1/31/2023 | | | 812,000 | | | | 798,753 | |
| American Tower Corp., REIT, 1.95%, 5/22/2026 | | EUR | 310,000 | | | | 365,649 | |
| Crown Castle International Corp., 2.25%, 9/01/2021 | | $ | 1,072,000 | | | | 1,027,628 | |
| Crown Castle International Corp., 3.7%, 6/15/2026 | | | 425,000 | | | | 400,741 | |
| SBA Tower Trust, 2.898%, 10/15/2044 (n) | | | 349,000 | | | | 346,788 | |
| Vodafone Group PLC, 4.125%, 5/30/2025 | | | 317,000 | | | | 315,795 | |
| | | | | | | | |
| | | | | | $ | 3,592,440 | |
| | | | | | | | |
| Telephone Services – 0.1% | | | | | |
| TELUS Corp., 5.05%, 7/23/2020 | | CAD | 687,000 | | | $ | 547,646 | |
| | | | | | | | |
| Tobacco – 0.2% | | | | | | | | |
| B.A.T. International Finance PLC, 0.875%, 10/13/2023 | | EUR | 500,000 | | | $ | 582,669 | |
| Imperial Brands Finance PLC, 1.375%, 1/27/2025 | | | 300,000 | | | | 348,765 | |
| Reynolds American, Inc., 8.125%, 6/23/2019 | | $ | 327,000 | | | | 342,761 | |
| Reynolds American, Inc., 4.45%, 6/12/2025 | | | 258,000 | | | | 259,652 | |
| | | | | | | | |
| | | | | | $ | 1,533,847 | |
| | | | | | | | |
| | | | | | | | |
| Issuer | | Shares/Par | | | Value ($) | |
| BONDS – continued | | | | | | | | |
| Transportation – Services – 0.4% | | | | | |
| Autostrade per L’Italia S.p.A., 1.75%, 6/26/2026 | | EUR | 250,000 | | | $ | 287,380 | |
| Compagnie Financial et Indus Unternehmensanleihe, 0.75%, 9/09/2028 | | | 500,000 | | | | 548,572 | |
| ERAC USA Finance LLC, 7%, 10/15/2037 (n) | | $ | 574,000 | | | | 717,328 | |
| Heathrow Funding Ltd., 1.875%, 7/12/2032 | | EUR | 300,000 | | | | 347,221 | |
| Heathrow Funding Ltd., 4.625%, 10/31/2046 | | GBP | 225,000 | | | | 364,832 | |
| Transurban Finance Co., 1.75%, 3/29/2028 | | EUR | 400,000 | | | | 464,492 | |
| | | | | | | | |
| | | | | | $ | 2,729,825 | |
| | | | | | | | |
| U.S. Government Agencies and Equivalents – 0.2% | |
| Small Business Administration, 5.09%, 10/01/2025 | | $ | 5,787 | | | $ | 5,953 | |
| Small Business Administration, 5.21%, 1/01/2026 | | | 211,013 | | | | 217,845 | |
| Small Business Administration, 5.31%, 5/01/2027 | | | 63,746 | | | | 66,536 | |
| Small Business Administration, 2.22%, 3/01/2033 | | | 1,380,573 | | | | 1,340,974 | |
| | | | | | | | |
| | | | | | $ | 1,631,308 | |
| | | | | | | | |
| U.S. Treasury Obligations – 9.1% | | | | | |
| U.S. Treasury Bonds, 4.5%, 2/15/2036 | | $ | 448,000 | | | $ | 547,785 | |
| U.S. Treasury Bonds, 4.5%, 8/15/2039 | | | 2,370,000 | | | | 2,955,186 | |
| U.S. Treasury Bonds, 3.625%, 2/15/2044 (f) | | | 8,118,000 | | | | 9,056,327 | |
| U.S. Treasury Bonds, 3%, 5/15/2047 | | | 2,087,000 | | | | 2,093,114 | |
| U.S. Treasury Notes, 2%, 1/31/2020 | | | 2,967,000 | | | | 2,944,632 | |
| U.S. Treasury Notes, 1.375%, 4/30/2020 (f) | | | 16,018,000 | | | | 15,690,131 | |
| U.S. Treasury Notes, 1.75%, 5/15/2022 | | | 2,264,000 | | | | 2,185,910 | |
| U.S. Treasury Notes, 2%, 11/30/2022 | | | 5,041,000 | | | | 4,892,527 | |
| U.S. Treasury Notes, 2.125%, 12/31/2022 (f) | | | 5,114,000 | | | | 4,985,551 | |
| U.S. Treasury Notes, 2.75%, 5/31/2023 | | | 1,440,500 | | | | 1,442,301 | |
| U.S. Treasury Notes, 2.375%, 8/15/2024 | | | 1,751,300 | | | | 1,709,638 | |
| U.S. Treasury Notes, 2.875%, 5/31/2025 | | | 3,559,000 | | | | 3,572,624 | |
| U.S. Treasury Notes, 1.5%, 8/15/2026 | | | 2,663,000 | | | | 2,405,022 | |
| U.S. Treasury Notes, 2.75%, 2/15/2028 (f) | | | 7,593,000 | | | | 7,528,044 | |
| | | | | | | | |
| | | | | | $ | 62,008,792 | |
| | | | | | | | |
10
MFS Global Tactical Allocation Portfolio
Portfolio of Investments (unaudited) – continued
| | | | | | | | |
| Issuer | | Shares/Par | | | Value ($) | |
| BONDS – continued | | | | | | | | |
| Utilities – Electric Power – 1.8% | | | | | |
| Duke Energy Corp., 2.65%, 9/01/2026 | | $ | 995,000 | | | $ | 896,169 | |
| Duke Energy Florida LLC, 3.2%, 1/15/2027 | | | 842,000 | | | | 810,057 | |
| EDP Finance B.V., 2%, 4/22/2025 | | EUR | 300,000 | | | | 358,501 | |
| Emera U.S. Finance LP, 2.7%, 6/15/2021 | | $ | 376,000 | | | | 365,965 | |
| Emera U.S. Finance LP, 3.55%, 6/15/2026 | | | 430,000 | | | | 404,872 | |
| Enel Finance International N.V., 5.625%, 8/14/2024 | | GBP | 200,000 | | | | 306,702 | |
| Enel Finance International N.V., 1.125%, 9/16/2026 | | EUR | 300,000 | | | | 331,262 | |
| Enel Finance International N.V., 4.75%, 5/25/2047 (n) | | $ | 1,116,000 | | | | 1,055,231 | |
| Enersis Americas S.A., 4%, 10/25/2026 | | | 1,891,000 | | | | 1,796,639 | |
| Engie Energia Chile S.A., 4.5%, 1/29/2025 (n) | | | 1,180,000 | | | | 1,170,832 | |
| Exelon Corp., 3.497%, 6/01/2022 | | | 406,000 | | | | 401,303 | |
| Innogy Finance B.V., 4.75%, 1/31/2034 | | GBP | 300,000 | | | | 465,765 | |
| NextEra Energy Capital Holdings, Inc., 3.55%, 5/01/2027 | | $ | 992,000 | | | | 953,536 | |
| PPL Capital Funding, Inc., 5%, 3/15/2044 | | | 473,000 | | | | 491,813 | |
| PPL WEM Holdings PLC, 5.375%, 5/01/2021 (n) | | | 280,000 | | | | 291,262 | |
| Public Service Enterprise Group, 2%, 11/15/2021 | | | 1,215,000 | | | | 1,155,498 | |
| Virginia Electric & Power Co., 3.5%, 3/15/2027 | | | 1,200,000 | | | | 1,178,208 | |
| | | | | | | | |
| | | | | | $ | 12,433,615 | |
| | | | | | | | |
Total Bonds
(Identified Cost, $430,564,429) | | | $ | 429,494,879 | |
| | | | | | | | |
| |
| COMMON STOCKS – 33.3% | | | | | |
| Aerospace – 1.3% | | | | | |
| Boeing Co. | | | 3,780 | | | $ | 1,268,228 | |
| Honeywell International, Inc. | | | 19,148 | | | | 2,758,269 | |
| Lockheed Martin Corp. | | | 12,197 | | | | 3,603,360 | |
| United Technologies Corp. | | | 9,286 | | | | 1,161,028 | |
| | | | | | | | |
| | | | | | $ | 8,790,885 | |
| | | | | | | | |
| Airlines – 0.2% | | | | | |
| Aena S.A. | | | 2,694 | | | $ | 489,211 | |
| Air Canada (a) | | | 69,843 | | | | 1,128,942 | |
| | | | | | | | |
| | | | | | $ | 1,618,153 | |
| | | | | | | | |
| Alcoholic Beverages – 0.7% | | | | | |
| Heineken N.V. | | | 20,595 | | | $ | 2,064,877 | |
| Pernod Ricard S.A. | | | 14,485 | | | | 2,364,169 | |
| | | | | | | | |
| | | | | | $ | 4,429,046 | |
| | | | | | | | |
| | | | | | | | |
| Issuer | | Shares/Par | | | Value ($) | |
| COMMON STOCKS – continued | | | | | |
| Apparel Manufacturers – 0.1% | | | | | |
| Compagnie Financiere Richemont S.A. | | | 9,292 | | | $ | 787,189 | |
| | | | | | | | |
| Automotive – 0.5% | | | | | |
| Aptiv PLC | | | 8,992 | | | $ | 823,937 | |
| General Motors Co. | | | 13,593 | | | | 535,564 | |
| Magna International, Inc. | | | 30,354 | | | | 1,765,388 | |
| USS Co. Ltd. | | | 27,900 | | | | 531,212 | |
| | | | | | | | |
| | | | | | $ | 3,656,101 | |
| | | | | | | | |
| Biotechnology – 0.1% | | | | | |
| Biogen, Inc. (a) | | | 2,807 | | | $ | 814,704 | |
| | | | | | | | |
| Broadcasting – 0.6% | | | | | |
| Omnicom Group, Inc. | | | 25,012 | | | $ | 1,907,665 | |
| Publicis Groupe S.A. (l) | | | 12,828 | | | | 881,517 | |
| WPP PLC | | | 60,750 | | | | 956,486 | |
| | | | | | | | |
| | | | | | $ | 3,745,668 | |
| | | | | | | | |
| Brokerage & Asset Managers – 0.4% | | | | | |
| Apollo Global Management LLC, “A” | | | 12,983 | | | $ | 413,768 | |
| BlackRock, Inc. | | | 3,493 | | | | 1,743,147 | |
| TMX Group Ltd. | | | 9,167 | | | | 600,929 | |
| | | | | | | | |
| | | | | | $ | 2,757,844 | |
| | | | | | | | |
| Business Services – 2.4% | | | | | | | | |
| Accenture PLC, “A” | | | 24,901 | | | $ | 4,073,555 | |
| Bunzl PLC | | | 28,096 | | | | 850,979 | |
| CGI Group, Inc., “A” (a) | | | 11,053 | | | | 700,434 | |
| Cognizant Technology Solutions Corp., “A” | | | 7,255 | | | | 573,072 | |
| Compass Group PLC | | | 104,027 | | | | 2,216,214 | |
| DXC Technology Co. | | | 18,779 | | | | 1,513,775 | |
| Equifax, Inc. | | | 4,231 | | | | 529,340 | |
| Experian Group Ltd. | | | 42,653 | | | | 1,055,181 | |
| Fidelity National Information Services, Inc. | | | 9,269 | | | | 982,792 | |
| Fiserv, Inc. (a) | | | 12,642 | | | | 936,646 | |
| Nomura Research Institute Ltd. | | | 23,500 | | | | 1,139,819 | |
| Secom Co. Ltd. | | | 17,200 | | | | 1,321,595 | |
| SGS S.A. | | | 264 | | | | 703,321 | |
| | | | | | | | |
| | | | | | $ | 16,596,723 | |
| | | | | | | | |
| Cable TV – 0.4% | | | | | | | | |
| Comcast Corp., “A” | | | 84,308 | | | $ | 2,766,145 | |
| | | | | | | | |
| Chemicals – 1.1% | | | | | | | | |
| 3M Co. (s) | | | 10,910 | | | $ | 2,146,215 | |
| CF Industries Holdings, Inc. | | | 7,080 | | | | 314,352 | |
| Givaudan S.A. | | | 849 | | | | 1,924,326 | |
| LyondellBasell Industries N.V., “A” | | | 3,111 | | | | 341,743 | |
| Orica Ltd. | | | 14,713 | | �� | | 193,268 | |
| PPG Industries, Inc. | | | 21,553 | | | | 2,235,693 | |
| | | | | | | | |
| | | | | | $ | 7,155,597 | |
| | | | | | | | |
| Computer Software – 0.1% | | | | | | | | |
| Cadence Design Systems, Inc. (a) | | | 18,337 | | | $ | 794,175 | |
| | | | | | | | |
11
MFS Global Tactical Allocation Portfolio
Portfolio of Investments (unaudited) – continued
| | | | | | | | |
| Issuer | | Shares/Par | | | Value ($) | |
| COMMON STOCKS – continued | | | | | |
| Computer Software – Systems – 0.4% | | | | | |
| Amadeus IT Group S.A. | | | 20,354 | | | $ | 1,603,720 | |
| Hitachi Ltd. | | | 169,000 | | | | 1,193,067 | |
| | | | | | | | |
| | | | | | $ | 2,796,787 | |
| | | | | | | | |
| Construction – 0.4% | | | | | | | | |
| Geberit AG | | | 702 | | | $ | 301,582 | |
| Persimmon PLC | | | 17,405 | | | | 581,837 | |
| Sherwin-Williams Co. | | | 3,218 | | | | 1,311,560 | |
| Stanley Black & Decker, Inc. | | | 5,592 | | | | 742,674 | |
| | | | | | | | |
| | | | | | $ | 2,937,653 | |
| | | | | | | | |
| Consumer Products – 1.1% | | | | | | | | |
| Colgate-Palmolive Co. | | | 12,857 | | | $ | 833,262 | |
| Coty, Inc., “A” | | | 22,182 | | | | 312,766 | |
| Kao Corp. | | | 26,500 | | | | 2,022,535 | |
| Kimberly-Clark Corp. | | | 15,944 | | | | 1,679,541 | |
| Procter & Gamble Co. | | | 8,097 | | | | 632,052 | |
| Reckitt Benckiser Group PLC | | | 25,507 | | | | 2,100,227 | |
| | | | | | | | |
| | | | | | $ | 7,580,383 | |
| | | | | | | | |
| Containers – 0.1% | | | | | | | | |
| Amcor Ltd. | | | 27,787 | | | $ | 296,324 | |
| Brambles Ltd. | | | 105,177 | | | | 691,186 | |
| | | | | | | | |
| | | | | | $ | 987,510 | |
| | | | | | | | |
| Electrical Equipment – 1.2% | | | | | | | | |
| IMI PLC | | | 3,072 | | | $ | 45,894 | |
| Johnson Controls International PLC | | | 46,271 | | | | 1,547,765 | |
| Legrand S.A. | | | 14,146 | | | | 1,036,111 | |
| OMRON Corp. | | | 17,300 | | | | 807,849 | |
| Schneider Electric S.A. | | | 49,975 | | | | 4,156,850 | |
| Spectris PLC | | | 16,808 | | | | 577,873 | |
| | | | | | | | |
| | | | | | $ | 8,172,342 | |
| | | | | | | | |
| Electronics – 1.8% | | | | | | | | |
| Analog Devices, Inc. | | | 11,930 | | | $ | 1,144,326 | |
| Halma PLC | | | 47,438 | | | | 856,577 | |
| Hirose Electric Co. Ltd. | | | 5,500 | | | | 682,067 | |
| Hoya Corp. | | | 13,300 | | | | 756,688 | |
| Kyocera Corp. | | | 9,600 | | | | 541,672 | |
| Samsung Electronics Co. Ltd. | | | 15,090 | | | | 631,627 | |
| Taiwan Semiconductor | | | | | | | | |
| Manufacturing Co. Ltd., ADR | | | 131,554 | | | | 4,809,614 | |
| Texas Instruments, Inc. | | | 27,913 | | | | 3,077,408 | |
| | | | | | | | |
| | | | | | $ | 12,499,979 | |
| | | | | | | | |
| Energy – Independent – 0.7% | | | | | | | | |
| Marathon Petroleum Corp. | | | 31,107 | | | $ | 2,182,467 | |
| Occidental Petroleum Corp. | | | 10,047 | | | | 840,733 | |
| Phillips 66 | | | 14,624 | | | | 1,642,422 | |
| | | | | | | | |
| | | | | | $ | 4,665,622 | |
| | | | | | | | |
| Energy – Integrated – 1.1% | | | | | | | | |
| BP PLC | | | 98,257 | | | $ | 748,150 | |
| Chevron Corp. | | | 7,916 | | | | 1,000,820 | |
| China Petroleum & Chemical Corp. | | | 702,000 | | | | 627,233 | |
| Exxon Mobil Corp. | | | 26,015 | | | | 2,152,221 | |
| | | | | | | | |
| Issuer | | Shares/Par | | | Value ($) | |
| COMMON STOCKS – continued | | | | | |
| Energy – Integrated – continued | | | | | | | | |
| Galp Energia SGPS S.A., “B” | | | 48,362 | | | $ | 919,603 | |
| LUKOIL PJSC, ADR | | | 13,527 | | | | 923,247 | |
| Suncor Energy, Inc. | | | 26,191 | | | | 1,065,849 | |
| | | | | | | | |
| | | | | | $ | 7,437,123 | |
| | | | | | | | |
| Engineering – Construction – 0.1% | | | | | |
| Bouygues S.A. | | | 14,731 | | | $ | 634,154 | |
| | | | | | | | |
| Food & Beverages – 1.5% | | | | | | | | |
| Danone S.A. | | | 16,292 | | | $ | 1,194,315 | |
| General Mills, Inc. | | | 42,198 | | | | 1,867,683 | |
| J.M. Smucker Co. | | | 4,574 | | | | 491,614 | |
| Marine Harvest | | | 61,806 | | | | 1,230,906 | |
| Nestle S.A. | | | 51,706 | | | | 4,002,912 | |
| Tyson Foods, Inc., “A” | | | 18,059 | | | | 1,243,362 | |
| | | | | | | | |
| | | | | | $ | 10,030,792 | |
| | | | | | | | |
| Food & Drug Stores – 0.1% | | | | | | | | |
| Wesfarmers Ltd. | | | 21,015 | | | $ | 767,654 | |
| | | | | | | | |
| Gaming & Lodging – 0.1% | | | | | | | | |
| Sands China Ltd. | | | 127,600 | | | $ | 682,270 | |
| | | | | | | | |
| Health Maintenance Organizations – 0.2% | | | | | |
| Cigna Corp. | | | 7,349 | | | $ | 1,248,963 | |
| | | | | | | | |
| Insurance – 2.0% | | | | | | | | |
| Aon PLC | | | 21,806 | | | $ | 2,991,129 | |
| AXA | | | 32,142 | | | | 787,454 | |
| Chubb Ltd. | | | 11,753 | | | | 1,492,866 | |
| Hiscox Ltd. | | | 34,294 | | | | 690,208 | |
| Manulife Financial Corp. | | | 21,852 | | | | 392,610 | |
| MetLife, Inc. | | | 47,887 | | | | 2,087,873 | |
| Prudential Financial, Inc. | | | 8,133 | | | | 760,517 | |
| Samsung Fire & Marine Insurance Co. Ltd. | | | 913 | | | | 216,269 | |
| Travelers Cos., Inc. | | | 16,791 | | | | 2,054,211 | |
| Zurich Insurance Group AG | | | 7,693 | | | | 2,281,970 | |
| | | | | | | | |
| | | | | | $ | 13,755,107 | |
| | | | | | | | |
| Machinery & Tools – 0.4% | | | | | | | | |
| Eaton Corp. PLC | | | 19,056 | | | $ | 1,424,245 | |
| Illinois Tool Works, Inc. | | | 7,331 | | | | 1,015,637 | |
| | | | | | | | |
| | | | | | $ | 2,439,882 | |
| | | | | | | | |
| Major Banks – 2.8% | | | | | | | | |
| Bank of New York Mellon Corp. | | | 30,235 | | | $ | 1,630,574 | |
| Barclays Africa Group Ltd. | | | 46,306 | | | | 540,076 | |
| China Construction Bank | | | 1,735,000 | | | | 1,603,287 | |
| Goldman Sachs Group, Inc. | | | 6,242 | | | | 1,376,798 | |
| JPMorgan Chase & Co. | | | 39,223 | | | | 4,087,037 | |
| Mitsubishi UFJ Financial Group, Inc. | | | 110,300 | | | | 628,734 | |
| PNC Financial Services Group, Inc. | | | 7,242 | | | | 978,394 | |
| Royal Bank of Canada | | | 11,220 | | | | 844,866 | |
| State Street Corp. | | | 14,466 | | | | 1,346,640 | |
| Svenska Handelsbanken AB, “A” | | | 99,061 | | | | 1,099,564 | |
| UBS AG | | | 134,969 | | | | 2,076,508 | |
| Wells Fargo & Co. | | | 55,941 | | | | 3,101,369 | |
| | | | | | | | |
| | | | | | $ | 19,313,847 | |
| | | | | | | | |
12
MFS Global Tactical Allocation Portfolio
Portfolio of Investments (unaudited) – continued
| | | | | | | | |
| Issuer | | Shares/Par | | | Value ($) | |
| COMMON STOCKS – continued | | | | | |
| Medical & Health Technology & Services – 0.4% | | | | | |
| McKesson Corp. | | | 11,422 | | | $ | 1,523,695 | |
| Sonic Healthcare Ltd. | | | 29,984 | | | | 544,312 | |
| Walgreens Boots Alliance, Inc. | | | 9,703 | | | | 582,326 | |
| | | | | | | | |
| | | | | | $ | 2,650,333 | |
| | | | | | | | |
| Medical Equipment – 0.9% | | | | | | | | |
| Abbott Laboratories | | | 31,708 | | | $ | 1,933,871 | |
| Danaher Corp. | | | 13,297 | | | | 1,312,148 | |
| Medtronic PLC | | | 25,898 | | | | 2,217,128 | |
| Thermo Fisher Scientific, Inc. | | | 3,623 | | | | 750,468 | |
| | | | | | | | |
| | | | | | $ | 6,213,615 | |
| | | | | | | | |
| Metals & Mining – 0.1% | | | | | | | | |
| Rio Tinto Ltd. | | | 13,606 | | | $ | 750,410 | |
| | | | | | | | |
| Natural Gas – Distribution – 0.1% | | | | | | | | |
| ENGIE | | | 54,675 | | | $ | 836,740 | |
| | | | | | | | |
| Network & Telecom – 0.2% | | | | | | | | |
| Cisco Systems, Inc. | | | 24,067 | | | $ | 1,035,603 | |
| | | | | | | | |
| Oil Services – 0.2% | | | | | | | | |
| Schlumberger Ltd. | | | 23,689 | | | $ | 1,587,874 | |
| | | | | | | | |
| Other Banks & Diversified Financials – 1.0% | | | | | |
| Agricultural Bank of China Ltd., “H” | | | 521,000 | | | $ | 243,712 | |
| American Express Co. | | | 8,965 | | | | 878,570 | |
| Citigroup, Inc. | | | 23,978 | | | | 1,604,608 | |
| DBS Group Holdings Ltd. | | | 16,500 | | | | 322,250 | |
| ING Groep N.V. | | | 68,501 | | | | 982,943 | |
| KBC Groep N.V. | | | 12,739 | | | | 981,982 | |
| U.S. Bancorp | | | 36,861 | | | | 1,843,787 | |
| | | | | | | | |
| | | | | | $ | 6,857,852 | |
| | | | | | | | |
| Pharmaceuticals – 2.7% | | | | | | | | |
| Bayer AG | | | 25,175 | | | $ | 2,773,830 | |
| Eli Lilly & Co. | | | 21,174 | | | | 1,806,777 | |
| Johnson & Johnson (s) | | | 30,547 | | | | 3,706,573 | |
| Novartis AG | | | 36,286 | | | | 2,748,467 | |
| Pfizer, Inc. | | | 91,384 | | | | 3,315,412 | |
| Roche Holding AG | | | 13,176 | | | | 2,931,860 | |
| Santen Pharmaceutical Co. Ltd. | | | 69,000 | | | | 1,203,441 | |
| | | | | | | | |
| | | | | | $ | 18,486,360 | |
| | | | | | | | |
| Printing & Publishing – 0.5% | | | | | | | | |
| Moody’s Corp. | | | 8,772 | | | $ | 1,496,152 | |
| RELX N.V. | | | 53,831 | | | | 1,145,903 | |
| Thomson Reuters Corp. | | | 21,921 | | | | 883,855 | |
| | | | | | | | |
| | | | | | $ | 3,525,910 | |
| | | | | | | | |
| Railroad & Shipping – 0.2% | | | | | | | | |
| Canadian National Railway Co. | | | 5,769 | | | $ | 471,616 | |
| Union Pacific Corp. | | | 4,077 | | | | 577,629 | |
| | | | | | | | |
| | | | | | $ | 1,049,245 | |
| | | | | | | | |
| Real Estate – 0.7% | | | | | | | | |
| CK Asset Holdings Ltd. | | | 130,000 | | | $ | 1,032,298 | |
| Deutsche Wohnen SE | | | 41,429 | | | | 2,000,910 | |
| Grand City Properties S.A. | | | 20,918 | | | | 543,280 | |
| | | | | | | | |
| Issuer | | Shares/Par | | | Value ($) | |
| COMMON STOCKS – continued | | | | | |
| Real Estate – continued | | | | | | | | |
| Medical Properties Trust, Inc., REIT | | | 60,612 | | | $ | 850,992 | |
| Public Storage, Inc., REIT | | | 1,755 | | | | 398,139 | |
| | | | | | | | |
| | | | | | $ | 4,825,619 | |
| | | | | | | | |
| Restaurants – 0.1% | | | | | | | | |
| Greggs PLC | | | 22,120 | | | $ | 290,615 | |
| U.S. Foods Holding Corp. (a) | | | 12,285 | | | | 464,619 | |
| | | | | | | | |
| | | | | | $ | 755,234 | |
| | | | | | | | |
| Specialty Chemicals – 0.3% | | | | | | | | |
| Akzo Nobel N.V. | | | 10,635 | | | $ | 906,214 | |
| PTT Global Chemical PLC | | | 478,500 | | | | 1,039,904 | |
| | | | | | | | |
| | | | | | $ | 1,946,118 | |
| | | | | | | | |
| Specialty Stores – 0.1% | | | | | | | | |
| Dufry AG | | | 4,862 | | | $ | 619,732 | |
| | | | | | | | |
| Telecommunications – Wireless – 0.9% | | | | | |
| KDDI Corp. | | | 147,300 | | | $ | 4,032,573 | |
| SK Telecom Co. Ltd. | | | 1,838 | | | | 384,257 | |
| Vodafone Group PLC | | | 794,552 | | | | 1,927,555 | |
| | | | | | | | |
| | | | | | $ | 6,344,385 | |
| | | | | | | | |
| Telephone Services – 0.3% | | | | | | | | |
| Telenor A.S.A. | | | 13,941 | | | $ | 286,117 | |
| Telus Corp. | | | 19,387 | | | | 688,680 | |
| Verizon Communications, Inc. | | | 16,047 | | | | 807,325 | |
| | | | | | | | |
| | | | | | $ | 1,782,122 | |
| | | | | | | | |
| Tobacco – 1.6% | | | | | | | | |
| Altria Group, Inc. | | | 36,481 | | | $ | 2,071,756 | |
| British American Tobacco PLC | | | 18,400 | | | | 930,054 | |
| Japan Tobacco, Inc. | | | 92,700 | | | | 2,591,397 | |
| Philip Morris International, Inc. (s) | | | 64,501 | | | | 5,207,811 | |
| | | | | | | | |
| | | | | | $ | 10,801,018 | |
| | | | | | | | |
| Trucking – 0.1% | | | | | | | | |
| United Parcel Service, Inc., “B” | | | 8,438 | | | $ | 896,369 | |
| | | | | | | | |
| Utilities – Electric Power – 1.0% | | | | | | | | |
| American Electric Power Co., Inc. | | | 13,020 | | | $ | 901,635 | |
| Duke Energy Corp. | | | 18,479 | | | | 1,461,319 | |
| Exelon Corp. | | | 44,609 | | | | 1,900,344 | |
| SSE PLC | | | 117,213 | | | | 2,094,153 | |
| Xcel Energy, Inc. | | | 12,690 | | | | 579,679 | |
| | | | | | | | |
| | | | | | $ | 6,937,130 | |
| | | | | | | | |
Total Common Stocks
(Identified Cost, $155,925,958) | | | | | | $ | 227,763,967 | |
| | | | | | | | |
| |
| PREFERRED STOCKS – 0.3% | | | | | |
| Consumer Products – 0.3% | | | | | | | | |
Henkel AG & Co. KGaA
(Identified Cost, $987,011) | | | 17,103 | | | $ | 2,188,726 | |
| | | | | | | | |
13
MFS Global Tactical Allocation Portfolio
Portfolio of Investments (unaudited) – continued
| | | | | | | | |
| Issuer | | Shares/Par | | | Value ($) | |
| CONVERTIBLE PREFERRED STOCKS – 0.1% | | | | | |
| Utilities – Electric Power – 0.1% | | | | | |
| NextEra Energy, Inc., 6.123% | | | 3,325 | | | $ | 189,857 | |
| NextEra Energy, Inc., 6.371% | | | 4,136 | | | | 307,057 | |
| | | | | | | | |
Total Convertible Preferred Stocks
(Identified Cost, $466,689) | | | | | | $ | 496,914 | |
| | | | | | | | |
| |
| INVESTMENT COMPANIES (h) – 1.6% | | | | | |
| Money Market Funds – 1.6% | | | | | | | | |
MFS Institutional Money Market Portfolio, 1.9% (v)
(Identified Cost, $11,172,018) | | | 11,173,384 | | | $ | 11,173,384 | |
| | | | | | | | |
| | | | | | | | | | | | | | | | | | |
Underlying/
Expiration
Date/
Exercise Price | | Put/
Call | | | Counter-
party | | Notional
Amount | | | Par
Amount/
Number of
Contracts | | | | |
| PURCHASED OPTIONS – 0.1% | | | | | | | | | |
| Market Index Securities – 0.1% | | | | | | | | | |
| Markit CDX North America Investment Grade Index – July 2018 @ $80 | | | Put | | | Goldman
Sachs
International | | $ | 50,463,056 | | | $ | 49,700,000 | | | $ | 13,076 | |
| Russell 2000 Index – December 2018 @ $1,340 | | | Put | | | Goldman
Sachs
International | | | 36,969,059 | | | | 225 | | | | 234,000 | |
| | | | | | | | | | | | | | | | | | |
Total Purchased Options
(Premiums Paid, $527,410) | | | | | | | $ | 247,076 | |
| | | | | | | | | | | | | | | | | | |
| | | | | | | | |
| Issuer | | Shares/Par | | | Value ($) | |
| COLLATERAL FOR SECURITIES LOANED – 0.0% | |
| State Street Navigator Securities Lending Government Money Market Portfolio, 1.9% (j) (Identified Cost, $14,217) | | | 14,217 | | | $ | 14,217 | |
| | | | | | | | |
OTHER ASSETS, LESS
LIABILITIES – 1.8% | | | | 12,333,006 | |
| | | | | | | | |
| NET ASSETS – 100.0% | | | | | | $ | 683,712,169 | |
| | | | | | | | |
| (a) | | Non-income producing security. |
| (f) | | All or a portion of the security has been segregated as collateral for open futures contracts. |
| (h) | | An affiliated issuer, which may be considered one in which the fund owns 5% or more of the outstanding voting securities, or a company which is under common control. At period end, the aggregate values of the fund’s investments in affiliated issuers and in unaffiliated issuers were $11,173,384 and $660,205,779, respectively. |
| (j) | | The rate quoted is the annualized seven-day yield of the fund at period end. |
| (l) | | A portion of this security is on loan. |
| (n) | | Securities exempt from registration under Rule 144A of the Securities Act of 1933. These securities may be sold in the ordinary course of business in transactions exempt from registration, normally to qualified institutional buyers. At period end, the aggregate value of these securities was $37,624,624, representing 5.5% of net assets. |
| (s) | | Security or a portion of the security was pledged to cover collateral requirements for certain derivative transactions. |
| (v) | | Affiliated issuer that is available only to investment companies managed by MFS. The rate quoted for the MFS Institutional Money Market Portfolio is the annualized seven-day yield of the fund at period end. |
| (z) | | Restricted securities are not registered under the Securities Act of 1933 and are subject to legal restrictions on resale. These securities generally may be resold in transactions exempt from registration or to the public if the securities are subsequently registered. Disposal of these securities may involve time-consuming negotiations and prompt sale at an acceptable price may be difficult. The fund holds the following restricted securities: |
| | | | | | | | | | |
| Restricted Securities | | Acquisition
Date | | Cost | | | Value | |
| Chesapeake Funding II LLC, 2016-2A, “A2”, FLR, 3.073% (LIBOR-1mo. + 1%), 6/15/2028 | | 6/14/16 | | | $721,215 | | | | $723,345 | |
| Dryden Senior Loan Fund, 2013-26A, “AR”, CLO, FLR, 3.248% (LIBOR-3mo. + 0.9%), 4/15/2029 | | 4/09/18 | | | 1,292,000 | | | | 1,288,182 | |
| Liberty Mutual Group, Inc., 2.75%, 5/04/2026 | | 4/26/16 | | | 224,436 | | | | 248,988 | |
| Republic of Indonesia, 2.875%, 7/08/2021 | | 7/02/14 | | | 680,388 | | | | 619,507 | |
| Republic of Indonesia, 2.15%, 7/18/2024 | | 7/11/17 | | | 387,989 | | | | 398,616 | |
| Total Restricted Securities | | | | | | | | | $3,278,638 | |
| % of Net assets | | | | | | | | | 0.5% | |
14
MFS Global Tactical Allocation Portfolio
Portfolio of Investments (unaudited) – continued
The following abbreviations are used in this report and are defined:
| ADR | | American Depositary Receipt |
| CLO | | Collateralized Loan Obligation |
| FLR | | Floating Rate. Interest rate resets periodically based on the parenthetically disclosed reference rate plus a spread (if any). The period-end rate reported may not be the current rate. |
| NATL | | National Public Finance Guarantee Corp. |
| PJSC | | Public Joint Stock Company |
| PLC | | Public Limited Company |
| REIT | | Real Estate Investment Trust |
Abbreviations indicate amounts shown in currencies other than the U.S. dollar. All amounts are stated in U.S. dollars unless otherwise indicated. A list of abbreviations is shown below:
Derivative Contracts at 6/30/18
Forward Foreign Currency Exchange Contracts
| | | | | | | | | | | | | | | | | | | | |
| Currency Purchased | | Currency Sold | | Counterparty | | Settlement Date | | | Unrealized
Appreciation
(Depreciation) | |
| Asset Derivatives | | | | | | | | | | | | |
| AUD | | | 692,077 | | | | | USD | | 511,667 | | Goldman Sachs International | | | 7/27/2018 | | | | $542 | |
| CAD | | | 6,119,867 | | | | | USD | | 4,601,670 | | Goldman Sachs International | | | 7/27/2018 | | | | 55,438 | |
| CHF | | | 503,871 | | | | | USD | | 509,000 | | JPMorgan Chase Bank N.A. | | | 9/14/2018 | | | | 2,979 | |
| EUR | | | 3,798,000 | | | | | USD | | 4,442,678 | | Barclays Bank PLC | | | 7/27/2018 | | | | 304 | |
| EUR | | | 566,000 | | | | | USD | | 657,976 | | Deutsche Bank AG | | | 7/27/2018 | | | | 4,143 | |
| EUR | | | 1,079,439 | | | | | USD | | 1,261,596 | | Goldman Sachs International | | | 7/27/2018 | | | | 1,155 | |
| EUR | | | 2,597,775 | | | | | USD | | 3,027,000 | | Goldman Sachs International | | | 9/14/2018 | | | | 23,176 | |
| EUR | | | 4,908 | | | | | USD | | 5,700 | | Royal Bank of Scotland Group PLC | | | 7/27/2018 | | | | 42 | |
| GBP | | | 164,368 | | | | | USD | | 217,025 | | Goldman Sachs International | | | 7/27/2018 | | | | 134 | |
| MXN | | | 23,672,081 | | | | | USD | | 1,185,253 | | Barclays Bank PLC | | | 7/27/2018 | | | | 2,210 | |
| USD | | | 118,314 | | | | | AUD | | 156,000 | | Deutsche Bank AG | | | 7/27/2018 | | | | 2,857 | |
| USD | | | 1,015,770 | | | | | AUD | | 1,357,000 | | Goldman Sachs International | | | 7/27/2018 | | | | 11,449 | |
| USD | | | 2,178,993 | | | | | AUD | | 2,888,321 | | HSBC Bank | | | 7/27/2018 | | | | 41,335 | |
15
MFS Global Tactical Allocation Portfolio
Portfolio of Investments (unaudited) – continued
Forward Foreign Currency Exchange Contracts – continued
| | | | | | | | | | | | | | | | | | | | |
Currency Purchased | | Currency Sold | | Counterparty | | Settlement Date | | | Unrealized
Appreciation
(Depreciation) | |
| Asset Derivatives – continued | | | | | | | | |
| USD | | | 2,544,169 | | | | | AUD | | 3,363,057 | | JPMorgan Chase Bank N.A. | | | 7/27/2018 | | | | $55,157 | |
| USD | | | 12,592,615 | | | | | AUD | | 16,551,894 | | JPMorgan Chase Bank N.A. | | | 9/14/2018 | | | | 340,617 | |
| USD | | | 1,151,256 | | | | | AUD | | 1,538,000 | | Merrill Lynch International | | | 7/27/2018 | | | | 12,977 | |
| USD | | | 20,096,589 | | | | | CAD | | 25,630,667 | | Barclays Bank PLC | | | 7/27/2018 | | | | 592,115 | |
| USD | | | 812,374 | | | | | CAD | | 1,055,000 | | Goldman Sachs International | | | 7/27/2018 | | | | 9,538 | |
| USD | | | 4,410,000 | | | | | CAD | | 5,717,764 | | JPMorgan Chase Bank N.A. | | | 9/14/2018 | | | | 55,376 | |
| USD | | | 6,196,082 | | | | | CAD | | 8,024,476 | | Royal Bank of Scotland Group PLC | | | 7/27/2018 | | | | 89,601 | |
| USD | | | 34,786,296 | | | | | CHF | | 33,962,556 | | JPMorgan Chase Bank N.A. | | | 9/14/2018 | | | | 277,235 | |
| USD | | | 1,183,374 | | | | | DKK | | 7,422,872 | | JPMorgan Chase Bank N.A. | | | 9/14/2018 | | | | 13,245 | |
| USD | | | 1,677,069 | | | | | EUR | | 1,422,692 | | Deutsche Bank AG | | | 7/27/2018 | | | | 12,774 | |
| USD | | | 3,659,405 | | | | | EUR | | 3,122,383 | | Goldman Sachs International | | | 7/27/2018 | | | | 6,775 | |
| USD | | | 85,025,042 | | | | | EUR | | 71,608,780 | | Goldman Sachs International | | | 9/14/2018 | | | | 945,619 | |
| USD | | | 2,686,529 | | | | | EUR | | 2,284,358 | | JPMorgan Chase Bank N.A. | | | 7/27/2018 | | | | 14,238 | |
| USD | | | 42,470,938 | | | | | EUR | | 35,782,326 | | JPMorgan Chase Bank N.A. | | | 9/14/2018 | | | | 457,132 | |
| USD | | | 117,414 | | | | | EUR | | 100,000 | | Royal Bank of Scotland Group PLC | | | 7/27/2018 | | | | 432 | |
| USD | | | 238,827 | | | | | EUR | | 203,893 | | UBS AG | | | 7/27/2018 | | | | 309 | |
| USD | | | 376,722 | | | | | GBP | | 284,020 | | Deutsche Bank AG | | | 7/27/2018 | | | | 1,480 | |
| USD | | | 5,608,036 | | | | | GBP | | 4,175,949 | | JPMorgan Chase Bank N.A. | | | 9/14/2018 | | | | 79,067 | |
| USD | | | 296,506 | | | | | ILS | | 1,061,000 | | Goldman Sachs International | | | 7/20/2018 | | | | 6,130 | |
| USD | | | 707,055 | | | | | ILS | | 2,517,156 | | JPMorgan Chase Bank N.A. | | | 9/14/2018 | | | | 15,446 | |
| USD | | | 1,150,030 | | | | | INR | | 77,213,000 | | JPMorgan Chase Bank N.A. | | | 7/10/2018 | | | | 23,983 | |
| USD | | | 804,855 | | | | | JPY | | 87,118,000 | | State Street Bank and Trust Company | | | 7/27/2018 | | | | 16,737 | |
| USD | | | 49,705 | | | | | JPY | | 5,464,000 | | Brown Brothers Harriman | | | 7/27/2018 | | | | 275 | |
| USD | | | 12,777,308 | | | | | JPY | | 1,406,319,046 | | Goldman Sachs International | | | 7/27/2018 | | | | 54,958 | |
| USD | | | 3,293,236 | | | | | JPY | | 360,000,000 | | JPMorgan Chase Bank N.A. | | | 7/27/2018 | | | | 36,474 | |
| USD | | | 64,406,010 | | | | | JPY | | 7,050,448,648 | | JPMorgan Chase Bank N.A. | | | 9/14/2018 | | | | 405,739 | |
| USD | | | 4,729,223 | | | | | KRW | | 5,109,216,330 | | JPMorgan Chase Bank N.A. | | | 8/20/2018 | | | | 138,893 | |
| USD | | | 491,103 | | | | | NOK | | 3,918,517 | | Goldman Sachs International | | | 9/14/2018 | | | | 8,585 | |
| USD | | | 6,865,601 | | | | | NOK | | 54,794,962 | | JPMorgan Chase Bank N.A. | | | 9/14/2018 | | | | 118,257 | |
| USD | | | 175,143 | | | | | NZD | | 250,000 | | Deutsche Bank AG | | | 7/27/2018 | | | | 5,815 | |
| USD | | | 24,948,716 | | | | | NZD | | 35,434,308 | | Goldman Sachs International | | | 9/14/2018 | | | | 947,513 | |
| USD | | | 5,809,691 | | | | | NZD | | 8,423,859 | | JPMorgan Chase Bank N.A. | | | 7/27/2018 | | | | 104,118 | |
| USD | | | 2,259,105 | | | | | SEK | | 20,098,000 | | Barclays Bank PLC | | | 7/27/2018 | | | | 11,237 | |
| USD | | | 4,261,844 | | | | | SEK | | 37,990,000 | | Deutsche Bank AG | | | 7/27/2018 | | | | 12,840 | |
| USD | | | 18,672,061 | | | | | SEK | | 159,760,115 | | Goldman Sachs International | | | 9/14/2018 | | | | 736,819 | |
| USD | | | 2,286,174 | | | | | SEK | | 20,373,000 | | JPMorgan Chase Bank N.A. | | | 7/27/2018 | | | | 7,548 | |
| USD | | | 929,503 | | | | | SGD | | 1,238,213 | | JPMorgan Chase Bank N.A. | | | 9/14/2018 | | | | 19,326 | |
| USD | | | 141,174 | | | | | ZAR | | 1,810,865 | | Goldman Sachs International | | | 7/27/2018 | | | | 9,564 | |
| | | | | | | | | | | | | | | | | | | | |
| | | | | | | | | | | | | | | | | | | $5,789,708 | |
| | | | | | | | | | | | | | | | | | | | |
| Liability Derivatives | | | | | | | | | | | | | | |
| AUD | | | 6,124,953 | | | | | USD | | 4,659,325 | | JPMorgan Chase Bank N.A. | | | 9/14/2018 | | | | $(125,529 | ) |
| AUD | | | 3,369,066 | | | | | USD | | 2,583,841 | | Royal Bank of Scotland Group PLC | | | 7/27/2018 | | | | (90,383 | ) |
| CAD | | | 5,000,000 | | | | | USD | | 3,870,799 | | Deutsche Bank AG | | | 7/27/2018 | | | | (65,889 | ) |
| CAD | | | 13,768,877 | | | | | USD | | 10,653,700 | | Goldman Sachs International | | | 7/27/2018 | | | | (175,833 | ) |
| CAD | | | 2,913,000 | | | | | USD | | 2,217,278 | | JPMorgan Chase Bank N.A. | | | 7/27/2018 | | | | (538 | ) |
| CAD | | | 19,843,727 | | | | | USD | | 15,325,353 | | JPMorgan Chase Bank N.A. | | | 9/14/2018 | | | | (212,457 | ) |
| CHF | | | 2,631,000 | | | | | USD | | 2,662,915 | | JPMorgan Chase Bank N.A. | | | 7/27/2018 | | | | (812 | ) |
| CHF | | | 6,163,328 | | | | | USD | | 6,309,152 | | JPMorgan Chase Bank N.A. | | | 9/14/2018 | | | | (46,647 | ) |
| CZK | | | 9,851,000 | | | | | USD | | 485,962 | | Deutsche Bank AG | | | 9/05/2018 | | | | (41,535 | ) |
| DKK | | | 8,011,079 | | | | | USD | | 1,265,666 | | Barclays Bank PLC | | | 7/27/2018 | | | | (7,700 | ) |
| EUR | | | 3,879,846 | | | | | USD | | 4,557,434 | | Deutsche Bank AG | | | 7/27/2018 | | | | (18,707 | ) |
| EUR | | | 296,796 | | | | | USD | | 347,925 | | Goldman Sachs International | | | 7/27/2018 | | | | (726 | ) |
| EUR | | | 763,190 | | | | | USD | | 893,343 | | JPMorgan Chase Bank N.A. | | | 7/27/2018 | | | | (548 | ) |
| EUR | | | 6,001,208 | | | | | USD | | 7,483,627 | | Morgan Stanley Capital Services, Inc. | | | 7/18/2018 | | | | (467,899 | ) |
| GBP | | | 10,684,792 | | | | | USD | | 14,400,620 | | JPMorgan Chase Bank N.A. | | | 9/14/2018 | | | | (253,923 | ) |
| GBP | | | 780,904 | | | | | USD | | 1,052,807 | | Merrill Lynch International | | | 7/27/2018 | | | | (21,089 | ) |
16
MFS Global Tactical Allocation Portfolio
Portfolio of Investments (unaudited) – continued
Forward Foreign Currency Exchange Contracts – continued
| | | | | | | | | | | | | | | | | | | | |
Currency Purchased | | | | | Currency Sold | | Counterparty | | Settlement Date | | | Unrealized
Appreciation
(Depreciation) | |
| Liability Derivatives – continued | | | | | | | | | | |
| IDR | | | 32,629,614,000 | | | | | USD | | 2,324,709 | | Barclays Bank PLC | | | 9/07/2018 | | | | $(68,193 | ) |
| ILS | | | 2,860,000 | | | | | USD | | 805,925 | | JPMorgan Chase Bank N.A. | | | 7/27/2018 | | | | (22,812 | ) |
| JPY | | | 972,681,332 | | | | | USD | | 8,837,432 | | Goldman Sachs International | | | 7/27/2018 | | | | (38,012 | ) |
| JPY | | | 4,590,936,337 | | | | | USD | | 41,559,535 | | JPMorgan Chase Bank N.A. | | | 7/27/2018 | | | | (27,353 | ) |
| JPY | | | 3,469,169,692 | | | | | USD | | 31,594,000 | | JPMorgan Chase Bank N.A. | | | 9/14/2018 | | | | (102,699 | ) |
| JPY | | | 195,000,000 | | | | | USD | | 1,791,616 | | Royal Bank of Scotland Group PLC | | | 7/27/2018 | | | | (27,536 | ) |
| KRW | | | 6,289,505,000 | | | | | USD | | 5,821,729 | | JPMorgan Chase Bank N.A. | | | 8/20/2018 | | | | (170,979 | ) |
| NOK | | | 40,705,284 | | | | | USD | | 5,026,014 | | Goldman Sachs International | | | 7/27/2018 | | | | (23,266 | ) |
| NOK | | | 194,373,441 | | | | | USD | | 24,342,932 | | Goldman Sachs International | | | 9/14/2018 | | | | (408,168 | ) |
| NOK | | | 54,923,363 | | | | | USD | | 6,877,145 | | JPMorgan Chase Bank N.A. | | | 9/14/2018 | | | | (113,990 | ) |
| NZD | | | 12,356,335 | | | | | USD | | 8,403,000 | | Goldman Sachs International | | | 9/14/2018 | | | | (33,515 | ) |
| NZD | | | 3,729,000 | | | | | USD | | 2,583,443 | | JPMorgan Chase Bank N.A. | | | 7/27/2018 | | | | (57,750 | ) |
| PLN | | | 3,697,930 | | | | | USD | | 1,005,774 | | Barclays Bank PLC | | | 7/27/2018 | | | | (18,201 | ) |
| RUB | | | 31,226,000 | | | | | USD | | 497,977 | | JPMorgan Chase Bank N.A. | | | 7/11/2018 | | | | (1,174 | ) |
| SEK | | | 38,904,000 | | | | | USD | | 4,469,958 | | Barclays Bank PLC | | | 7/27/2018 | | | | (118,727 | ) |
| SEK | | | 56,829,522 | | | | | USD | | 6,511,183 | | Goldman Sachs International | | | 7/27/2018 | | | | (155,066 | ) |
| SEK | | | 14,654,781 | | | | | USD | | 1,665,522 | | Goldman Sachs International | | | 9/14/2018 | | | | (20,324 | ) |
| SGD | | | 1,350,000 | | | | | USD | | 1,010,767 | | JPMorgan Chase Bank N.A. | | | 7/27/2018 | | | | (19,496 | ) |
| THB | | | 42,550,650 | | | | | USD | | 1,339,545 | | JPMorgan Chase Bank N.A. | | | 7/13/2018 | | | | (51,188 | ) |
| ZAR | | | 881,000 | | | | | USD | | 68,897 | | JPMorgan Chase Bank N.A. | | | 7/27/2018 | | | | (4,868 | ) |
| USD | | | 3,086,073 | | | | | AUD | | 4,184,896 | | Goldman Sachs International | | | 7/27/2018 | | | | (11,185 | ) |
| USD | | | 5,117,000 | | | | | AUD | | 6,943,389 | | JPMorgan Chase Bank N.A. | | | 9/14/2018 | | | | (22,617 | ) |
| USD | | | 3,486,786 | | | | | CAD | | 4,598,000 | | HSBC Bank | | | 7/27/2018 | | | | (12,209 | ) |
| USD | | | 11,340,000 | | | | | CAD | | 15,067,322 | | JPMorgan Chase Bank N.A. | | | 9/14/2018 | | | | (135,207 | ) |
| USD | | | 692,249 | | | | | EUR | | 594,392 | | State Street Bank and Trust Company | | | 7/27/2018 | | | | (3,083 | ) |
| USD | | | 189,748 | | | | | EUR | | 162,619 | | Brown Brothers Harriman | | | 7/27/2018 | | | | (487 | ) |
| USD | | | 2,113,179 | | | | | EUR | | 1,824,002 | | Citibank N.A. | | | 7/27/2018 | | | | (20,577 | ) |
| USD | | | 4,688,004 | | | | | EUR | | 4,031,407 | | Goldman Sachs International | | | 7/27/2018 | | | | (28,022 | ) |
| USD | | | 3,692,000 | | | | | GBP | | 2,800,878 | | JPMorgan Chase Bank N.A. | | | 9/14/2018 | | | | (16,371 | ) |
| USD | | | 4,416,083 | | | | | NOK | | 35,974,000 | | Deutsche Bank AG | | | 7/27/2018 | | | | (5,182 | ) |
| USD | | | 22,727,000 | | | | | NOK | | 184,831,623 | | Goldman Sachs International | | | 9/14/2018 | | | | (32,803 | ) |
| USD | | | 1,313,767 | | | | | NZD | | 1,944,562 | | Deutsche Bank AG | | | 7/27/2018 | | | | (3,306 | ) |
| USD | | | 2,200,290 | | | | | NZD | | 3,251,000 | | Goldman Sachs International | | | 7/27/2018 | | | | (1,648 | ) |
| | | | | | | | | | | | | | | | | | | | |
| | | | | | | | | | | | | | | | | | | $(3,306,229 | ) |
| | | | | | | | | | | | | | | | | | | | |
Futures Contracts
| | | | | | | | | | | | | | | | | | | | | | |
| Description | | Long/
Short | | | Currency | | | Contracts | | Notional
Amount | | | Expiration
Date | | | Value/Unrealized
Appreciation
(Depreciation) | |
| Asset Derivatives | | | | | | | | | | | | | | | | | | | | | | |
| Equity Futures | | | | | | | | | | | | | | | | | | | | | | |
| AEX 25 Index | | | Short | | | | EUR | | | 179 | | | $22,985,004 | | | | July - 2018 | | | | $627,078 | |
| DAX Index | | | Short | | | | EUR | | | 33 | | | 11,846,700 | | | | September - 2018 | | | | 289,916 | |
| Hang Seng China Enterprises Index | | | Long | | | | HKD | | | 3 | | | 207,804 | | | | July - 2018 | | | | 2,734 | |
| KOSPI 200 Index | | | Short | | | | KRW | | | 22 | | | 1,480,484 | | | | September - 2018 | | | | 70,188 | |
| Mexican Bolsa Index | | | Long | | | | MXN | | | 167 | | | 4,056,804 | | | | September - 2018 | | | | 117,428 | |
| MSCI Singapore Index | | | Long | | | | SGD | | | 480 | | | 12,893,945 | | | | July - 2018 | | | | 25,133 | |
| MSCI Taiwan Index | | | Long | | | | USD | | | 216 | | | 8,372,160 | | | | July - 2018 | | | | 63,720 | |
| Nifty Index | | | Short | | | | USD | | | 759 | | | 16,230,456 | | | | July - 2018 | | | | 150,876 | |
| OMX Index | | | Long | | | | SEK | | | 520 | | | 9,028,768 | | | | July - 2018 | | | | 140,516 | |
| Russell 2000 Index | | | Short | | | | USD | | | 109 | | | 8,978,875 | | | | September - 2018 | | | | 193,185 | |
| S&P 500 Index | | | Short | | | | USD | | | 75 | | | 10,206,000 | | | | September - 2018 | | | | 203,793 | |
| S&P/ASX 200 Index | | | Long | | | | AUD | | | 34 | | | 3,867,354 | | | | September - 2018 | | | | 3,674 | |
| | | | | | | | | | | | | | | | | | | | | | |
| | | | | | | | | | | | | | | | | | | | | $1,888,241 | |
| | | | | | | | | | | | | | | | | | | | | | |
17
MFS Global Tactical Allocation Portfolio
Portfolio of Investments (unaudited) – continued
Futures Contracts – continued
| | | | | | | | | | | | | | | | | | | | | | |
| Description | | Long/
Short | | | Currency | | | Contracts | | Notional
Amount | | | Expiration
Date | | | Value/Unrealized
Appreciation
(Depreciation) | |
| Asset Derivatives – continued | | | | | | | | | | | | | | | | | | | | | | |
| Interest Rate Futures | | | | | | | | | | | | | | | | | | | | | | |
| Australian Treasury Bond 10 yr | | | Long | | | | AUD | | | 411 | | | $39,346,719 | | | | September - 2018 | | | | $567,538 | |
| German Euro Buxl 30 yr | | | Long | | | | EUR | | | 3 | | | 622,554 | | | | September - 2018 | | | | 9,732 | |
| U.S. Treasury Note 2 yr | | | Long | | | | USD | | | 162 | | | 34,316,156 | | | | September - 2018 | | | | 2,741 | |
| U.S. Treasury Note 10 yr | | | Short | | | | USD | | | 247 | | | 29,686,313 | | | | September - 2018 | | | | 33,402 | |
| U.S. Treasury Ultra Note 10 yr | | | Long | | | | USD | | | 21 | | | 3,350,813 | | | | September - 2018 | | | | 26,329 | |
| U.S. Treasury Ultra Note 10 yr | | | Short | | | | USD | | | 171 | | | 21,928,078 | | | | September - 2018 | | | | 3,265 | |
| | | | | | | | | | | | | | | | | | | | | | |
| | | | | | | | | | | | | | | | | | | | | $643,007 | |
| | | | | | | | | | | | | | | | | | | | | | |
| | | | | | | | | | | | | | | | | | | | | $2,531,248 | |
| | | | | | | | | | | | | | | | | | | | | | |
| Liability Derivatives | | | | | | | | | | | | | | | | | | | | | | |
| Equity Futures | | | | | | | | | | | | | | | | | | | | | | |
| BIST 30 Index | | | Long | | | | TRY | | | 7,268 | | | $19,171,281 | | | | August - 2018 | | | | $(2,817 | ) |
| CAC 40 Index | | | Long | | | | EUR | | | 144 | | | 8,924,451 | | | | July - 2018 | | | | (275,287 | ) |
| FTSE 100 Index | | | Long | | | | GBP | | | 159 | | | 15,887,017 | | | | September - 2018 | | | | (135,656 | ) |
| FTSE/JSE Index | | | Short | | | | ZAR | | | 585 | | | 22,048,095 | | | | September - 2018 | | | | (118,501 | ) |
| FTSE/MIB Index | | | Long | | | | EUR | | | 90 | | | 11,300,685 | | | | September - 2018 | | | | (226,719 | ) |
| Hang Seng Index | | | Long | | | | HKD | | | 128 | | | 23,433,058 | | | | July - 2018 | | | | (310,389 | ) |
| IBEX Index | | | Short | | | | EUR | | | 46 | | | 5,140,584 | | | | July - 2018 | | | | (5,422 | ) |
| IBOV Index | | | Long | | | | BRL | | | 485 | | | 9,155,278 | | | | August - 2018 | | | | (55,531 | ) |
| S&P/TSX 60 Index | | | Short | | | | CAD | | | 32 | | | 4,689,552 | | | | September - 2018 | | | | (55,302 | ) |
| Topix Index | | | Short | | | | JPY | | | 42 | | | 6,564,693 | | | | September - 2018 | | | | (20,921 | ) |
| | | | | | | | | | | | | | | | | | | | | | |
| | | | | | | | | | | | | | | | | | | | | $(1,206,545 | ) |
| | | | | | | | | | | | | | | | | | | | | | |
| Interest Rate Futures | | | | | | | | | | | | | | | | | | | | | | |
| Canadian Treasury Bond 10 yr | | | Short | | | | CAD | | | 221 | | | $22,981,714 | | | | September - 2018 | | | | $(181,036 | ) |
| German Euro-Bund 10 yr | | | Short | | | | EUR | | | 81 | | | 15,375,897 | | | | September - 2018 | | | | (93,339 | ) |
| Japan Government Bond 10 yr | | | Short | | | | JPY | | | 6 | | | 8,174,502 | | | | September - 2018 | | | | (9,294 | ) |
| Long Gilt 10 yr | | | Short | | | | GBP | | | 22 | | | 3,572,987 | | | | September - 2018 | | | | (17,495 | ) |
| U.S. Treasury Bond 30 yr | | | Short | | | | USD | | | 10 | | | 1,450,000 | | | | September - 2018 | | | | (5,739 | ) |
| U.S. Treasury Note 5 yr | | | Short | | | | USD | | | 113 | | | 12,838,742 | | | | September - 2018 | | | | (11,876 | ) |
| | | | | | | | | | | | | | | | | | | | | | |
| | | | | | | | | | | | | | | | | | | | | $(318,779 | ) |
| | | | | | | | | | | | | | | | | | | | | | |
| | | | | | | | | | | | | | | | | | | | | $(1,525,324 | ) |
| | | | | | | | | | | | | | | | | | | | | | |
At June 30, 2018, the fund had cash collateral of $2,065,131 and other liquid securities with an aggregate value of $16,175,945 to cover any collateral or margin obligations for certain derivative contracts. Restricted cash and/or deposits with brokers in the Statement of Assets and Liabilities are comprised of cash collateral.
See Notes to Financial Statements
18
MFS Global Tactical Allocation Portfolio
FINANCIAL STATEMENTS | STATEMENT OF ASSETS AND LIABILITIES (unaudited)
This statement represents your fund’s balance sheet, which details the assets and liabilities comprising the total value of the fund.
| | | | |
At 6/30/18 | | | | |
Assets | | | | |
Investments in unaffiliated issuers, at value, including $13,542 of securities on loan (identified cost, $588,485,714) | | | $660,205,779 | |
Investments in affiliated issuers, at value (identified cost, $11,172,018) | | | 11,173,384 | |
Cash | | | 10,587,939 | |
Foreign currency, at value (identified cost, $53,279) | | | 53,685 | |
Restricted cash for | | | | |
Forward foreign currency exchange contracts | | | 580,000 | |
Deposits with brokers for | | | | |
Futures contracts | | | 1,485,131 | |
Receivables for | | | | |
Forward foreign currency exchange contracts | | | 5,789,708 | |
Investments sold | | | 12,739,123 | |
Fund shares sold | | | 866 | |
Interest and dividends | | | 4,604,269 | |
Other assets | | | 2,402 | |
Total assets | | | $707,222,286 | |
Liabilities | | | | |
Payables for | | | | |
Forward foreign currency exchange contracts | | | $3,306,229 | |
Daily variation margin on open futures contracts | | | 236,162 | |
Investments purchased | | | 18,492,372 | |
Fund shares reacquired | | | 1,204,992 | |
Collateral for securities loaned, at value | | | 14,217 | |
Payable to affiliates | | | | |
Investment adviser | | | 40,110 | |
Shareholder servicing costs | | | 101 | |
Distribution and/or service fees | | | 12,980 | |
Payable for independent Trustees’ compensation | | | 100 | |
Deferred country tax expense payable | | | 28,908 | |
Accrued expenses and other liabilities | | | 173,946 | |
Total liabilities | | | $23,510,117 | |
Net assets | | | $683,712,169 | |
Net assets consist of | | | | |
Paid-in capital | | | $568,567,368 | |
Unrealized appreciation (depreciation) (net of $28,908 deferred country tax) | | | 74,943,084 | |
Accumulated net realized gain (loss) | | | 33,217,066 | |
Undistributed net investment income | | | 6,984,651 | |
Net assets | | | $683,712,169 | |
Shares of beneficial interest outstanding | | | 44,355,016 | |
| | | | | | | | | | | | |
| | | Net assets | | | Shares
outstanding | | | Net asset value
per share | |
Initial Class | | | $51,429,329 | | | | 3,280,077 | | | | $15.68 | |
Service Class | | | 632,282,840 | | | | 41,074,939 | | | | 15.39 | |
See Notes to Financial Statements
19
MFS Global Tactical Allocation Portfolio
FINANCIAL STATEMENTS | STATEMENT OF OPERATIONS (unaudited)
This statement describes how much your fund earned in investment income and accrued in expenses. It also describes any gains and/or losses generated by fund operations.
| | | | |
Six months ended 6/30/18 | | | | |
Net investment income (loss) | | | | |
Income | | | | |
Interest | | | $5,641,808 | |
Dividends | | | 4,437,830 | |
Dividends from affiliated issuers | | | 212,977 | |
Income on securities loaned | | | 11,334 | |
Other | | | 1,718 | |
Foreign taxes withheld | | | (295,051 | ) |
Total investment income | | | $10,010,616 | |
Expenses | | | | |
Management fee | | | $2,550,611 | |
Distribution and/or service fees | | | 836,021 | |
Shareholder servicing costs | | | 7,646 | |
Administrative services fee | | | 59,156 | |
Independent Trustees’ compensation | | | 7,324 | |
Custodian fee | | | 53,860 | |
Shareholder communications | | | 22,692 | |
Audit and tax fees | | | 41,574 | |
Legal fees | | | 4,538 | |
Miscellaneous | | | 178,774 | |
Total expenses | | | $3,762,196 | |
Reduction of expenses by investment adviser | | | (33,304 | ) |
Net expenses | | | $3,728,892 | |
Net investment income (loss) | | | $6,281,724 | |
Realized and unrealized gain (loss) | | | | |
Realized gain (loss) (identified cost basis) | | | | |
Unaffiliated issuers (net of $19,505 country tax) | | | $19,042,658 | |
Affiliated issuers | | | 309 | |
Futures contracts | | | (5,896,504 | ) |
Forward foreign currency exchange contracts | | | (3,513,396 | ) |
Foreign currency | | | (121,988 | ) |
Net realized gain (loss) | | | $9,511,079 | |
Change in unrealized appreciation or depreciation | | | | |
Unaffiliated issuers (net of $42,774 decrease in deferred country tax) | | | $(44,409,825 | ) |
Affiliated issuers | | | 1,366 | |
Futures contracts | | | 638,146 | |
Forward foreign currency exchange contracts | | | 8,298,176 | |
Translation of assets and liabilities in foreign currencies | | | (316,541 | ) |
Net unrealized gain (loss) | | | $(35,788,678 | ) |
Net realized and unrealized gain (loss) | | | $(26,277,599 | ) |
Change in net assets from operations | | | $(19,995,875 | ) |
See Notes to Financial Statements
20
MFS Global Tactical Allocation Portfolio
FINANCIAL STATEMENTS | STATEMENTS OF CHANGES IN NET ASSETS
These statements describe the increases and/or decreases in net assets resulting from operations, any distributions, and any shareholder transactions.
| | | | | | | | |
| | | Six months ended
6/30/18 | | | Year ended
12/31/17 | |
| | | (unaudited) | | | | |
Change in net assets | | | | | | | | |
From operations | | | | | | | | |
Net investment income (loss) | | | $6,281,724 | | | | $11,049,781 | |
Net realized gain (loss) | | | 9,511,079 | | | | 24,717,280 | |
Net unrealized gain (loss) | | | (35,788,678 | ) | | | 43,454,716 | |
Change in net assets from operations | | | $(19,995,875 | ) | | | $79,221,777 | |
Distributions declared to shareholders | | | | | | | | |
From net investment income | | | $— | | | | $(22,895,168 | ) |
From net realized gain | | | — | | | | (1,880,256 | ) |
Total distributions declared to shareholders | | | $— | | | | $(24,775,424 | ) |
Change in net assets from fund share transactions | | | $(58,843,579 | ) | | | $(83,723,186 | ) |
Total change in net assets | | | $(78,839,454 | ) | | | $(29,276,833 | ) |
Net assets | | | | | | | | |
At beginning of period | | | 762,551,623 | | | | 791,828,456 | |
At end of period (including undistributed net investment income of $6,984,651 and
$702,927, respectively) | | | $683,712,169 | | | | $762,551,623 | |
See Notes to Financial Statements
21
MFS Global Tactical Allocation Portfolio
FINANCIAL STATEMENTS | FINANCIAL HIGHLIGHTS
The financial highlights table is intended to help you understand the fund’s financial performance for the semiannual period and the past 5 fiscal years. Certain information reflects financial results for a single fund share. The total returns in the table represent the rate that an investor would have earned (or lost) on an investment in the fund share class (assuming reinvestment of all distributions) held for the entire period.
| | | | | | | | | | | | | | | | | | | | | | | | |
| Initial Class | | Six months
ended 6/30/18 | | | Year ended | |
| | | 12/31/17 | | | 12/31/16 | | | 12/31/15 | | | 12/31/14 | | | 12/31/13 | |
| | | (unaudited) | | | | | | | | | | | | | | | | |
Net asset value, beginning of period | | | $16.11 | | | | $15.04 | | | | $14.92 | | | | $16.43 | | | | $16.20 | | | | $15.27 | |
| Income (loss) from investment operations | | | | | | | | | | | | | | | | | | | | | | | | |
Net investment income (loss) (d) | | | $0.16 | | | | $0.26 | | | | $0.29 | (c) | | | $0.29 | | | | $0.37 | | | | $0.32 | |
Net realized and unrealized gain (loss) | | | (0.59 | ) | | | 1.36 | | | | 0.67 | | | | (0.66 | ) | | | 0.36 | | | | 1.02 | |
Total from investment operations | | | $(0.43 | ) | | | $1.62 | | | | $0.96 | | | | $(0.37 | ) | | | $0.73 | | | | $1.34 | |
| Less distributions declared to shareholders | | | | | | | | | | | | | | | | | | | | | | | | |
From net investment income | | | $— | | | | $(0.51 | ) | | | $— | | | | $(0.87 | ) | | | $(0.48 | ) | | | $(0.41 | ) |
From net realized gain | | | — | | | | (0.04 | ) | | | (0.84 | ) | | | (0.27 | ) | | | (0.02 | ) | | | — | |
Total distributions declared to shareholders | | | $— | | | | $(0.55 | ) | | | $(0.84 | ) | | | $(1.14 | ) | | | $(0.50 | ) | | | $(0.41 | ) |
Net asset value, end of period (x) | | | $15.68 | | | | $16.11 | | | | $15.04 | | | | $14.92 | | | | $16.43 | | | | $16.20 | |
Total return (%) (k)(r)(s)(x) | | | (2.67 | )(n) | | | 10.83 | | | | 6.24 | (c) | | | (2.23 | ) | | | 4.46 | | | | 8.91 | |
Ratios (%) (to average net assets)
and Supplemental data: | | | | | | | | | | | | | | | | | | | | | | | | |
Expenses before expense reductions (f) | | | 0.81 | (a) | | | 0.81 | | | | 0.79 | (c) | | | 0.76 | | | | 0.76 | | | | 0.75 | |
Expenses after expense reductions (f) | | | 0.80 | (a) | | | 0.80 | | | | 0.78 | (c) | | | 0.75 | | | | 0.75 | | | | 0.75 | |
Net investment income (loss) | | | 1.97 | (a) | | | 1.64 | | | | 1.88 | (c) | | | 1.80 | | | | 2.23 | | | | 2.04 | |
Portfolio turnover | | | 42 | (n) | | | 35 | | | | 38 | | | | 57 | | | | 32 | | | | 65 | |
Net assets at end of period (000 omitted) | | | $51,429 | | | | $56,096 | | | | $58,053 | | | | $63,253 | | | | $76,670 | | | | $75,559 | |
See Notes to Financial Statements
22
MFS Global Tactical Allocation Portfolio
Financial Highlights – continued
| | | | | | | | | | | | | | | | | | | | | | | | |
| Service Class | | Six months
ended 6/30/18 | | | Year ended | |
| | | 12/31/17 | | | 12/31/16 | | | 12/31/15 | | | 12/31/14 | | | 12/31/13 | |
| | | (unaudited) | | | | | | | | | | | | | | | | |
Net asset value, beginning of period | | | $15.84 | | | | $14.79 | | | | $14.72 | | | | $16.22 | | | | $15.99 | | | | $15.09 | |
| Income (loss) from investment operations | | | | | | | | | | | | | | | | | | | | | | | | |
Net investment income (loss) (d) | | | $0.13 | | | | $0.22 | | | | $0.25 | (c) | | | $0.25 | | | | $0.33 | | | | $0.28 | |
Net realized and unrealized gain (loss) | | | (0.58 | ) | | | 1.34 | | | | 0.66 | | | | (0.66 | ) | | | 0.35 | | | | 0.99 | |
Total from investment operations | | | $(0.45 | ) | | | $1.56 | | | | $0.91 | | | | $(0.41 | ) | | | $0.68 | | | | $1.27 | |
| Less distributions declared to shareholders | | | | | | | | | | | | | | | | | | | | | | | | |
From net investment income | | | $— | | | | $(0.47 | ) | | | $— | | | | $(0.82 | ) | | | $(0.43 | ) | | | $(0.37 | ) |
From net realized gain | | | — | | | | (0.04 | ) | | | (0.84 | ) | | | (0.27 | ) | | | (0.02 | ) | | | — | |
Total distributions declared to shareholders | | | $— | | | | $(0.51 | ) | | | $(0.84 | ) | | | $(1.09 | ) | | | $(0.45 | ) | | | $(0.37 | ) |
Net asset value, end of period (x) | | | $15.39 | | | | $15.84 | | | | $14.79 | | | | $14.72 | | | | $16.22 | | | | $15.99 | |
Total return (%) (k)(r)(s)(x) | | | (2.84 | )(n) | | | 10.58 | | | | 5.98 | (c) | | | (2.49 | ) | | | 4.25 | | | | 8.54 | |
Ratios (%) (to average net assets)
and Supplemental data: | | | | | | | | | | | | | | | | | | | | | | | | |
Expenses before expense reductions (f) | | | 1.06 | (a) | | | 1.06 | | | | 1.04 | (c) | | | 1.01 | | | | 1.01 | | | | 1.00 | |
Expenses after expense reductions (f) | | | 1.05 | (a) | | | 1.05 | | | | 1.03 | (c) | | | 1.00 | | | | 1.00 | | | | 1.00 | |
Net investment income (loss) | | | 1.72 | (a) | | | 1.39 | | | | 1.63 | (c) | | | 1.55 | | | | 2.00 | | | | 1.79 | |
Portfolio turnover | | | 42 | (n) | | | 35 | | | | 38 | | | | 57 | | | | 32 | | | | 65 | |
Net assets at end of period (000 omitted) | | | $632,283 | | | | $706,456 | | | | $733,775 | | | | $773,721 | | | | $912,616 | | | | $995,404 | |
| (c) | Amount reflects a one-time reimbursement of expenses by the custodian (or former custodian) without which net investment income and performance would be lower and expenses would be higher. |
| (d) | Per share data is based on average shares outstanding. |
| (f) | Ratios do not reflect reductions from fees paid indirectly, if applicable. |
| (k) | The total return does not reflect expenses that apply to separate accounts. Inclusion of these charges would reduce the total return figures for all periods shown. |
| (r) | Certain expenses have been reduced without which performance would have been lower. |
| (s) | From time to time the fund may receive proceeds from litigation settlements, without which performance would be lower. |
| (x) | The net asset values and total returns have been calculated on net assets which include adjustments made in accordance with U.S. generally accepted accounting principles required at period end for financial reporting purposes. |
See Notes to Financial Statements
23
MFS Global Tactical Allocation Portfolio
NOTES TO FINANCIAL STATEMENTS (unaudited)
| (1) | | Business and Organization |
MFS Global Tactical Allocation Portfolio (the fund) is a diversified series of MFS Variable Insurance Trust II (the trust). The trust is organized as a Massachusetts business trust and is registered under the Investment Company Act of 1940, as amended, as an open-end management investment company. The shareholders of each series of the trust are separate accounts of insurance companies, which offer variable annuity and/or life insurance products, and qualified retirement and pension plans.
The fund is an investment company and accordingly follows the investment company accounting and reporting guidance of the Financial Accounting Standards Board (FASB) Accounting Standards Codification Topic 946 Financial Services – Investment Companies.
| (2) | | Significant Accounting Policies |
General – The preparation of financial statements in conformity with U.S. generally accepted accounting principles requires management to make estimates and assumptions that affect the reported amounts of assets and liabilities, and disclosure of contingent assets and liabilities at the date of the financial statements and the reported amounts of increases and decreases in net assets from operations during the reporting period. Actual results could differ from those estimates. In the preparation of these financial statements, management has evaluated subsequent events occurring after the date of the fund’s Statement of Assets and Liabilities through the date that the financial statements were issued. The fund invests in derivatives as part of its principal investment strategy. Derivatives can be highly volatile and involve risks in addition to the risks of the underlying indicators on which the derivative is based. Derivatives can involve leverage. The fund invests in foreign securities. Investments in foreign securities are vulnerable to the effects of changes in the relative values of the local currency and the U.S. dollar and to the effects of changes in each country’s market, economic, industrial, political, regulatory, geopolitical, and other conditions.
In March 2017, the FASB issued Accounting Standards Update 2017-08, Receivables – Nonrefundable Fees and Other Costs (Subtopic 310-20) – Premium Amortization on Purchased Callable Debt Securities (“ASU 2017-08”). For entities that hold callable debt securities at a premium, ASU 2017-08 requires that the premium be amortized to the earliest call date. ASU 2017-08 will be effective for fiscal years beginning after December 15, 2018, and interim periods within those fiscal years. Management has evaluated the potential impacts of ASU 2017-08 and believes that adoption of ASU 2017-08 will not have a material effect on the fund’s overall financial position or its overall results of operations.
Balance Sheet Offsetting – The fund’s accounting policy with respect to balance sheet offsetting is that, absent an event of default by the counterparty or a termination of the agreement, the International Swaps and Derivatives Association (ISDA) Master Agreement, or similar agreement, does not result in an offset of reported amounts of financial assets and financial liabilities in the Statement of Assets and Liabilities across transactions between the fund and the applicable counterparty. The fund’s right to setoff may be restricted or prohibited by the bankruptcy or insolvency laws of the particular jurisdiction to which a specific master netting agreement counterparty is subject. Balance sheet offsetting disclosures, to the extent applicable to the fund, have been included in the fund’s Significant Accounting Policies note under the captions for each of the fund’s in-scope financial instruments and transactions.
Investment Valuations – Equity securities, including restricted equity securities, are generally valued at the last sale or official closing price on their primary market or exchange as provided by a third-party pricing service. Equity securities, for which there were no sales reported that day, are generally valued at the last quoted daily bid quotation on their primary market or exchange as provided by a third-party pricing service. Debt instruments and floating rate loans, including restricted debt instruments, are generally valued at an evaluated or composite bid as provided by a third-party pricing service. Short-term instruments with a maturity at issuance of 60 days or less may be valued at amortized cost, which approximates market value. Exchange-traded options are generally valued at the last sale or official closing price on their primary exchange as provided by a third-party pricing service. Exchange-traded options for which there were no sales reported that day are generally valued at the last daily bid quotation on their primary exchange as provided by a third-party pricing service. Options not traded on an exchange are generally valued at a broker/dealer bid quotation. Foreign currency options are generally valued at valuations provided by a third-party pricing service. Futures contracts are generally valued at last posted settlement price on their primary exchange as provided by a third-party pricing service. Futures contracts for which there were no trades that day for a particular position are generally valued at the closing bid quotation on their primary exchange as provided by a third-party pricing service. Forward foreign currency exchange contracts are generally valued at the mean of bid and asked prices for the time period interpolated from rates provided by a third-party pricing service for proximate time periods. Open-end investment companies are generally valued at net asset value per share. Securities and other assets generally valued on the basis of information from a third-party pricing service may also be valued at a broker/dealer bid quotation. In determining values, third-party pricing services can utilize both transaction data and market information such as yield, quality, coupon rate, maturity, type of issue, trading characteristics, and other market data. The values of foreign securities and other assets and liabilities expressed in foreign currencies are converted to U.S. dollars using the mean of bid and asked prices for rates provided by a third-party pricing service.
24
MFS Global Tactical Allocation Portfolio
Notes to Financial Statements (unaudited) – continued
The Board of Trustees has delegated primary responsibility for determining or causing to be determined the value of the fund’s investments (including any fair valuation) to the adviser pursuant to valuation policies and procedures approved by the Board. If the adviser determines that reliable market quotations are not readily available, investments are valued at fair value as determined in good faith by the adviser in accordance with such procedures under the oversight of the Board of Trustees. Under the fund’s valuation policies and procedures, market quotations are not considered to be readily available for most types of debt instruments and floating rate loans and many types of derivatives. These investments are generally valued at fair value based on information from third-party pricing services. In addition, investments may be valued at fair value if the adviser determines that an investment’s value has been materially affected by events occurring after the close of the exchange or market on which the investment is principally traded (such as foreign exchange or market) and prior to the determination of the fund’s net asset value, or after the halting of trading of a specific security where trading does not resume prior to the close of the exchange or market on which the security is principally traded. Events that occur on a frequent basis after foreign markets close (such as developments in foreign markets and significant movements in the U.S. markets) and prior to the determination of the fund’s net asset value may be deemed to have a material effect on the value of securities traded in foreign markets. Accordingly, the fund’s foreign equity securities may often be valued at fair value. The adviser generally relies on third-party pricing services or other information (such as the correlation with price movements of similar securities in the same or other markets; the type, cost and investment characteristics of the security; the business and financial condition of the issuer; and trading and other market data) to assist in determining whether to fair value and at what value to fair value an investment. The value of an investment for purposes of calculating the fund’s net asset value can differ depending on the source and method used to determine value. When fair valuation is used, the value of an investment used to determine the fund’s net asset value may differ from quoted or published prices for the same investment. There can be no assurance that the fund could obtain the fair value assigned to an investment if it were to sell the investment at the same time at which the fund determines its net asset value per share.
Various inputs are used in determining the value of the fund’s assets or liabilities. These inputs are categorized into three broad levels. In certain cases, the inputs used to measure fair value may fall into different levels of the fair value hierarchy. In such cases, an investment’s level within the fair value hierarchy is based on the lowest level of input that is significant to the fair value measurement. The fund’s assessment of the significance of a particular input to the fair value measurement in its entirety requires judgment, and considers factors specific to the investment. Level 1 includes unadjusted quoted prices in active markets for identical assets or liabilities. Level 2 includes other significant observable market-based inputs (including quoted prices for similar securities, interest rates, prepayment speed, and credit risk). Level 3 includes unobservable inputs, which may include the adviser’s own
25
MFS Global Tactical Allocation Portfolio
Notes to Financial Statements (unaudited) – continued
assumptions in determining the fair value of investments. Other financial instruments are derivative instruments, such as futures contracts and forward foreign currency exchange contracts. The following is a summary of the levels used as of June 30, 2018 in valuing the fund’s assets or liabilities:
| | | | | | | | | | | | | | | | |
| Financial Instruments | | Level 1 | | | Level 2 | | | Level 3 | | | Total | |
| Equity Securities: | | | | | | | | | | | | | | | | |
United States | | | $122,438,568 | | | | $541,057 | | | | $— | | | | $122,979,625 | |
Switzerland | | | — | | | | 18,377,867 | | | | — | | | | 18,377,867 | |
Japan | | | 17,452,649 | | | | — | | | | — | | | | 17,452,649 | |
United Kingdom | | | 9,429,037 | | | | 7,243,377 | | | | — | | | | 16,672,414 | |
France | | | — | | | | 11,891,310 | | | | — | | | | 11,891,310 | |
Canada | | | 8,543,168 | | | | — | | | | — | | | | 8,543,168 | |
Germany | | | 3,317,110 | | | | 4,189,635 | | | | — | | | | 7,506,745 | |
Netherlands | | | — | | | | 5,099,937 | | | | — | | | | 5,099,937 | |
Taiwan | | | 4,809,614 | | | | — | | | | — | | | | 4,809,614 | |
Other Countries | | | 11,822,163 | | | | 5,528,115 | | | | — | | | | 17,350,278 | |
| U.S. Treasury Bonds & U.S. Government | | | | | | | | | | | | | | | | |
| Agency & Equivalents | | | — | | | | 63,640,099 | | | | — | | | | 63,640,099 | |
| Non-U.S. Sovereign Debt | | | — | | | | 174,727,786 | | | | — | | | | 174,727,786 | |
| Municipal Bonds | | | — | | | | 907,493 | | | | — | | | | 907,493 | |
| U.S. Corporate Bonds | | | — | | | | 69,979,224 | | | | — | | | | 69,979,224 | |
| Residential Mortgage-Backed Securities | | | — | | | | 47,242,899 | | | | — | | | | 47,242,899 | |
| Commercial Mortgage-Backed Securities | | | — | | | | 5,474,648 | | | | — | | | | 5,474,648 | |
| Asset-Backed Securities (including CDOs) | | | — | | | | 11,323,968 | | | | — | | | | 11,323,968 | |
| Foreign Bonds | | | — | | | | 56,211,838 | | | | — | | | | 56,211,838 | |
| Mutual Funds | | | 11,187,601 | | | | — | | | | — | | | | 11,187,601 | |
| Total | | | $188,999,910 | | | | $482,379,253 | | | | $— | | | | $671,379,163 | |
| | | | |
| Other Financial Instruments | | | | | | | | | | | | |
| Futures Contracts – Assets | | | $2,531,248 | | | | $— | | | | $— | | | | $2,531,248 | |
| Futures Contracts – Liabilities | | | (1,525,324 | ) | | | — | | | | — | | | | (1,525,324 | ) |
| Forward Foreign Currency Exchange Contracts – Assets | | | — | | | | 5,789,708 | | | | — | | | | 5,789,708 | |
| Forward Foreign Currency Exchange Contracts – Liabilities | | | — | | | | (3,306,229 | ) | | | — | | | | (3,306,229 | ) |
For further information regarding security characteristics, see the Portfolio of Investments.
Of the level 2 investments presented above, equity investments amounting to $41,757,886 would have been considered level 1 investments at the beginning of the period. Of the level 1 investments presented above, equity investments amounting to $10,834,843 would have been considered level 2 investments at the beginning of the period. The primary reason for changes in the classifications between levels 1 and 2 occurs when foreign equity securities are fair valued using other observable market-based inputs in place of the closing exchange price due to events occurring after the close of the exchange or market on which the investment is principally traded. The fund’s foreign equity securities may often be valued using other observable market-based inputs. The fund’s policy is to recognize transfers between the levels as of the end of the period.
Foreign Currency Translation – Purchases and sales of foreign investments, income, and expenses are converted into U.S. dollars based upon currency exchange rates prevailing on the respective dates of such transactions or on the reporting date for foreign denominated receivables and payables. Gains and losses attributable to foreign currency exchange rates on sales of securities are recorded for financial statement purposes as net realized gains and losses on investments. Gains and losses attributable to foreign exchange rate movements on receivables, payables, income and expenses are recorded for financial statement purposes as foreign currency transaction gains and losses. That portion of both realized and unrealized gains and losses on investments that results from fluctuations in foreign currency exchange rates is not separately disclosed.
Derivatives – The fund uses derivatives in an attempt to adjust exposure to markets, asset classes, and currencies based on the adviser’s assessment of the relative attractiveness of such markets, asset classes, and currencies. Derivatives are used to increase or decrease the fund’s exposure to markets, asset classes, or currencies resulting from the fund’s individual security selections, and to expose the fund to markets, asset classes, or currencies in which the fund’s individual security selection has resulted in little or no exposure. Derivatives are used for hedging or non-hedging purposes. While hedging can reduce or eliminate losses, it can also reduce or eliminate gains. When the fund uses derivatives as an investment to increase or decrease market exposure, or for hedging purposes, gains and losses from derivative instruments may be substantially greater than the derivative’s original cost.
26
MFS Global Tactical Allocation Portfolio
Notes to Financial Statements (unaudited) – continued
The derivative instruments used by the fund during the period were purchased options, futures contracts, and forward foreign currency exchange contracts. Depending on the type of derivative, the fund may exit a derivative position by entering into an offsetting transaction with a counterparty or exchange, negotiating an agreement with the derivative counterparty, or novating the position to a third party. The fund’s period end derivatives, as presented in the Portfolio of Investments and the associated Derivative Contract tables, generally are indicative of the volume of its derivative activity during the period.
The following table presents, by major type of derivative contract, the fair value, on a gross basis, of the asset and liability components of derivatives held by the fund at June 30, 2018 as reported in the Statement of Assets and Liabilities:
| | | | | | | | | | |
| | | | | Fair Value (a) | |
| Risk | | Derivative Contracts | | Asset Derivatives | | | Liability Derivatives | |
| Interest Rate | | Interest Rate Futures | | | $643,007 | | | | $(318,779 | ) |
| Foreign Exchange | | Forward Foreign Currency Exchange | | | 5,789,708 | | | | (3,306,229 | ) |
| Equity | | Equity Futures | | | 1,888,241 | | | | (1,206,545 | ) |
| Equity | | Purchased Equity Options | | | 247,076 | | | | — | |
| Total | | | | | $8,568,032 | | | | $(4,831,553 | ) |
| (a) | The value of purchased options outstanding is included in investments in unaffiliated issuers, at value, within the fund’s Statement of Assets and Liabilities. Values presented in this table for futures contracts correspond to the values reported in the fund’s Portfolio of Investments. Only the current day net variation margin for futures contracts is separately reported within the fund’s Statement of Assets and Liabilities. |
The following table presents, by major type of derivative contract, the realized gain (loss) on derivatives held by the fund for the six months ended June 30, 2018 as reported in the Statement of Operations:
| | | | | | | | | | | | |
| Risk | | Futures
Contracts | | | Forward Foreign
Currency
Exchange
Contracts | | | Unaffiliated Issuers
(Purchased
Options) | |
| Interest Rate | | | $2,594,235 | | | | $— | | | | $— | |
| Foreign Exchange | | | — | | | | (3,513,396 | ) | | | — | |
| Equity | | | (8,490,739 | ) | | | — | | | | (52,963 | ) |
| Total | | | $(5,896,504 | ) | | | $(3,513,396 | ) | | | $(52,963 | ) |
The following table presents, by major type of derivative contract, the change in unrealized appreciation or depreciation on derivatives held by the fund for the six months ended June 30, 2018 as reported in the Statement of Operations:
| | | | | | | | | | | | |
| Risk | | Futures
Contracts | | | Forward Foreign
Currency
Exchange
Contracts | | | Unaffiliated Issuers
(Purchased
Options) | |
| Interest Rate | | | $(16,691 | ) | | | $— | | | | $(49,048 | ) |
| Foreign Exchange | | | — | | | | 8,298,176 | | | | — | |
| Equity | | | 654,837 | | | | — | | | | (222,763 | ) |
| Total | | | $638,146 | | | | $8,298,176 | | | | $(271,811 | ) |
Derivative counterparty credit risk is managed through formal evaluation of the creditworthiness of all potential counterparties. On certain, but not all, uncleared derivatives, the fund attempts to reduce its exposure to counterparty credit risk whenever possible by entering into an ISDA Master Agreement on a bilateral basis. The ISDA Master Agreement gives each party to the agreement the right to terminate all transactions traded under such agreement if there is a specified deterioration in the credit quality of the other party. Upon an event of default or a termination of the ISDA Master Agreement, the non-defaulting party has the right to close out all transactions traded under such agreement and to net amounts owed under each agreement to one net amount payable by one party to the other. This right to close out and net payments across all transactions traded under the ISDA Master Agreement could result in a reduction of the fund’s credit risk to such counterparty equal to any amounts payable by the fund under the applicable transactions, if any.
Collateral and margin requirements differ by type of derivative. For cleared derivatives (e.g., futures contracts, cleared swaps, and exchange-traded options), margin requirements are set by the clearing broker and the clearing house and collateral, in the form of cash or securities, is posted by the fund directly with the clearing broker. Collateral terms are counterparty agreement specific for uncleared derivatives (e.g., forward foreign currency exchange contracts, uncleared swap agreements, and uncleared options) and collateral, in the form of cash and securities, is held in segregated accounts with the fund’s custodian in connection with these agreements. For derivatives traded under an ISDA Master Agreement, which contains a collateral support annex, the collateral
27
MFS Global Tactical Allocation Portfolio
Notes to Financial Statements (unaudited) – continued
requirements are netted across all transactions traded under such counterparty-specific agreement and one amount is posted from one party to the other to collateralize such obligations. Cash that has been segregated or delivered to cover the fund’s collateral or margin obligations under derivative contracts, if any, will be reported separately in the Statement of Assets and Liabilities as restricted cash for uncleared derivatives and/or deposits with brokers for cleared derivatives. Securities pledged as collateral or margin for the same purpose, if any, are noted in the Portfolio of Investments. The fund may be required to make payments of interest on uncovered collateral or margin obligations with the broker. Any such payments are included in “Miscellaneous” expense in the Statement of Operations.
The following table presents the fund’s derivative assets and liabilities (by type) on a gross basis as of June 30, 2018:
| | | | | | | | |
| Gross Amounts of: | | Derivative Assets | | | Derivative Liabilities | |
| Future Contracts (a) | | | $— | | | | $(236,162 | ) |
| Forward Foreign Currency Exchange Contracts | | | 5,789,708 | | | | (3,306,229 | ) |
| Purchased Options | | | 247,076 | | | | — | |
| Total Gross Amount of Derivative Assets and Liabilities Presented in the Statement of Assets and Liabilities | | | $6,036,784 | | | | $(3,542,391 | ) |
Less: Derivatives Assets and Liabilities Not Subject to a Master Netting Agreement or Similar Arrangement | | | 395,532 | | | | (369,374 | ) |
| Total Gross Amount of Derivative Assets and Liabilities Subject to a Master Netting Agreement or Similar Arrangement | | | $5,641,252 | | | | $(3,173,017 | ) |
| (a) | The amount presented here represents the fund’s current day net variation margin for futures contracts. This amount, which is recognized within the fund’s Statement of Assets and Liabilities, differs from the fair value of the futures contracts which is presented in the tables that follow the fund’s Portfolio of Investments. |
The following table presents (by counterparty) the fund’s derivative assets net of amounts available for offset under Master Netting Agreements (or similar arrangements) and net of the related collateral held by the fund at June 30, 2018:
| | | | | | | | | | | | | | | | | | | | |
| | | | | | Amounts Not Offset in the
Statement of Assets & Liabilities | | | | |
| | | Gross Amount of
Derivative Assets Subject
to a Master Netting
Agreement (or Similar
Arrangement) by
Counterparty | | | Financial
Instruments
Available
for Offset | | | Financial
Instruments
Collateral
Received (b) | | | Cash Collateral
Received (b) | | | Net Amount of
Derivative Assets by
Counterparty | |
| Barclays Bank PLC | | | $605,866 | | | | $(212,821 | ) | | | $— | | | | $(393,045 | ) | | | $— | |
| Brown Brothers Harriman | | | 275 | | | | (275 | ) | | | — | | | | — | | | | — | |
| Deutsche Bank AG | | | 39,909 | | | | (39,909 | ) | | | — | | | | — | | | | — | |
| Goldman Sachs International | | | 2,817,394 | | | | (928,567 | ) | | | — | | | | (1,888,827 | ) | | | — | |
| JPMorgan Chase Bank N.A. | | | 2,164,831 | | | | (1,386,958 | ) | | | (777,873 | ) | | | — | | | | — | |
| Merrill Lynch International | | | 12,977 | | | | (12,977 | ) | | | — | | | | — | | | | — | |
| Total | | | $5,641,252 | | | | $(2,581,507 | ) | | | $(777,873 | ) | | | $(2,281,872 | ) | | | $— | |
The following table presents (by counterparty) the fund’s derivative liabilities net of amounts available for offset under Master Netting Agreements (or similar arrangements) and net of the related collateral pledged by the fund at June 30, 2018:
| | | | | | | | | | | | | | | | | | | | |
| | | | | | Amounts Not Offset in the
Statement of Assets & Liabilities | | | | |
| | | Gross Amounts of
Derivative Liabilities Subject
to a Master Netting
Agreement (or Similar
Arrangement) by
Counterparty | | | Financial
Instruments
Available
for Offset | | | Financial
Instruments
Collateral
Pledged (b) | | | Cash Collateral
Pledged (b) | | | Net Amount of
Derivative Liabilities by
Counterparty | |
| Barclays Bank PLC | | | $(212,821 | ) | | | $212,821 | | | | $— | | | | $— | | | | $— | |
| Brown Brothers Harriman | | | (487 | ) | | | 275 | | | | — | | | | — | | | | (212 | ) |
| Citibank N.A. | | | (20,577 | ) | | | — | | | | — | | | | — | | | | (20,577 | ) |
| Deutsche Bank AG | | | (134,619 | ) | | | 39,909 | | | | — | | | | 50,000 | | | | (44,710 | ) |
| Goldman Sachs International | | | (928,567 | ) | | | 928,567 | | | | — | | | | — | | | | — | |
| JPMorgan Chase Bank N.A. | | | (1,386,958 | ) | | | 1,386,958 | | | | — | | | | — | | | | — | |
| Merrill Lynch International | | | (21,089 | ) | | | 12,977 | | | | — | | | | — | | | | (8,112 | ) |
| Morgan Stanley Capital Services, Inc. | | | (467,899 | ) | | | — | | | | — | | | | 467,899 | | | | — | |
| Total | | | $(3,173,017 | ) | | | $2,581,507 | | | | $— | | | | $517,899 | | | | $(73,611 | ) |
| (b) | The amount presented here may be less than the total amount of collateral (received)/pledged as the excess collateral (received)/pledged is not shown for purposes of this presentation. |
28
MFS Global Tactical Allocation Portfolio
Notes to Financial Statements (unaudited) – continued
Purchased Options – The fund purchased put options for a premium. Purchased put options entitle the holder to sell a specified number of shares or units of a particular security, currency or index at a specified price at a specified date or within a specified period of time. Purchasing put options may hedge against an anticipated decline in the value of portfolio securities or currency or decrease the fund’s exposure to an underlying instrument.
The premium paid is initially recorded as an investment in the Statement of Assets and Liabilities. That investment is subsequently marked-to-market daily with the difference between the premium paid and the market value of the purchased option being recorded as unrealized appreciation or depreciation. Premiums paid for purchased put options which have expired are treated as realized losses on investments in the Statement of Operations. Upon the exercise or closing of a purchased put option, the premium paid is offset against the proceeds on the sale of the underlying security or financial instrument in order to determine the realized gain or loss on investments.
Whether or not the option is exercised, the fund’s maximum risk of loss from purchasing an option is the amount of premium paid. All option contracts involve credit risk if the counterparty to the option contract fails to perform. For uncleared options, this risk is mitigated in cases where there is an ISDA Master Agreement between the fund and the counterparty providing for netting as described above and, where applicable, by the posting of collateral by the counterparty to the fund to cover the fund’s exposure to the counterparty under such ISDA Master Agreement.
Futures Contracts – The fund entered into futures contracts which may be used to hedge against or obtain broad market exposure, interest rate exposure, currency exposure, or to manage duration. A futures contract represents a commitment for the future purchase or sale of an asset at a specified price on a specified date.
Upon entering into a futures contract, the fund is required to deposit with the broker, either in cash or securities, an initial margin in an amount equal to a specified percentage of the notional amount of the contract. Subsequent payments (variation margin) are made or received by the fund each day, depending on the daily fluctuations in the value of the contract, and are recorded for financial statement purposes as unrealized gain or loss by the fund until the contract is closed or expires at which point the gain or loss on futures contracts is realized.
The fund bears the risk of interest rates, exchange rates or securities prices moving unexpectedly, in which case, the fund may not achieve the anticipated benefits of the futures contracts and may realize a loss. While futures contracts may present less counterparty risk to the fund since the contracts are exchange traded and the exchange’s clearinghouse guarantees payments to the broker, there is still counterparty credit risk due to the insolvency of the broker. The fund’s maximum risk of loss due to counterparty credit risk is equal to the margin posted by the fund to the broker plus any gains or minus any losses on the outstanding futures contracts.
Forward Foreign Currency Exchange Contracts – The fund entered into forward foreign currency exchange contracts for the purchase or sale of a specific foreign currency at a fixed price on a future date. These contracts may be used to hedge the fund’s currency risk or for non-hedging purposes. For hedging purposes, the fund may enter into contracts to deliver or receive foreign currency that the fund will receive from or use in its normal investment activities. The fund may also use contracts to hedge against declines in the value of foreign currency denominated securities due to unfavorable exchange rate movements. For non-hedging purposes, the fund may enter into contracts with the intent of changing the relative exposure of the fund’s portfolio of securities to different currencies to take advantage of anticipated exchange rate changes.
Forward foreign currency exchange contracts are adjusted by the daily exchange rate of the underlying currency and any unrealized gains or losses are recorded as a receivable or payable for forward foreign currency exchange contracts until the contract settlement date. On contract settlement date, any gain or loss on the contract is recorded as realized gains or losses on forward foreign currency exchange contracts.
Risks may arise upon entering into these contracts from unanticipated movements in the value of the contract and from the potential inability of counterparties to meet the terms of their contracts. Generally, the fund’s maximum risk due to counterparty credit risk is the unrealized gain on the contract due to the use of Continuous Linked Settlement, a multicurrency cash settlement system for the centralized settlement of foreign transactions. This risk is mitigated in cases where there is an ISDA Master Agreement between the fund and the counterparty providing for netting as described above and, where applicable, by the posting of collateral by the counterparty to the fund to cover the fund’s exposure to the counterparty under such ISDA Master Agreement.
Security Loans – Under its Securities Lending Agency Agreement with the fund, State Street Bank and Trust Company (“State Street”), as lending agent, loans the securities of the fund to certain qualified institutions (the “Borrowers”) approved by the fund. Security loans can be terminated at the discretion of either the lending agent or the fund and the related securities must be returned within the earlier of the standard trade settlement period for such securities or within three business days. The loans are collateralized by cash and/or U.S. Treasury and federal agency obligations in an amount typically at least equal to the market value of the securities loaned. On loans collateralized by cash, the cash collateral is invested in a money market fund. The market value of the loaned securities is determined at the close of business of the fund and any additional required collateral is delivered to the fund on
29
MFS Global Tactical Allocation Portfolio
Notes to Financial Statements (unaudited) – continued
the next business day. State Street provides the fund with indemnification against Borrower default. In the event of Borrower default, State Street will, for the benefit of the fund, either purchase securities identical to those loaned or, when such purchase is commercially impracticable, pay the fund the market value of the loaned securities. In return, State Street assumes the fund’s rights to the related collateral. If the collateral value is less than the cost to purchase identical securities, State Street is responsible for the shortfall, but only to the extent that such shortfall is not due to a decline in collateral value resulting from collateral reinvestment for which the fund bears the risk of loss. At period end, the fund had investment securities on loan, all of which were classified as equity securities in the fund’s Portfolio of Investments, with a fair value of $13,542. The fair value of the fund’s investment securities on loan and a related liability of $14,217 for cash collateral received on securities loaned are both presented gross in the Statement of Assets and Liabilities. The collateral on securities loaned exceeded the value of securities on loan at period end. The liability for cash collateral for securities loaned is carried at fair value, which is categorized as level 2 within the fair value hierarchy. A portion of the income generated upon investment of the collateral is remitted to the Borrowers, and the remainder is allocated between the fund and the lending agent. On loans collateralized by U.S. Treasury and/or federal agency obligations, a fee is received from the Borrower, and is allocated between the fund and the lending agent. Income from securities lending is separately reported in the Statement of Operations. The dividend and interest income earned on the securities loaned is accounted for in the same manner as other dividend and interest income.
Indemnifications – Under the fund’s organizational documents, its officers and Trustees may be indemnified against certain liabilities and expenses arising out of the performance of their duties to the fund. Additionally, in the normal course of business, the fund enters into agreements with service providers that may contain indemnification clauses. The fund’s maximum exposure under these agreements is unknown as this would involve future claims that may be made against the fund that have not yet occurred.
Investment Transactions and Income – Investment transactions are recorded on the trade date. Interest income is recorded on the accrual basis. All premium and discount is amortized or accreted for financial statement purposes in accordance with U.S. generally accepted accounting principles. Dividends received in cash are recorded on the ex-dividend date. Certain dividends from foreign securities will be recorded when the fund is informed of the dividend if such information is obtained subsequent to the ex-dividend date. Dividend and interest payments received in additional securities are recorded on the ex-dividend or ex-interest date in an amount equal to the value of the security on such date.
The fund may receive proceeds from litigation settlements. Any proceeds received from litigation involving portfolio holdings are reflected in the Statement of Operations in realized gain/loss if the security has been disposed of by the fund or in unrealized gain/loss if the security is still held by the fund. Any other proceeds from litigation not related to portfolio holdings are reflected as other income in the Statement of Operations.
The fund invests a significant portion of its assets in asset-backed and/or mortgage-backed securities. For these securities, the value of the debt instrument also depends on the credit quality and adequacy of the underlying assets or collateral as well as whether there is a security interest in the underlying assets or collateral. Enforcing rights, if any, against the underlying assets or collateral may be difficult. U.S. Government securities not supported as to the payment of principal or interest by the U.S. Treasury, such as those issued by Fannie Mae, Freddie Mac, and the Federal Home Loan Banks, are subject to greater credit risk than are U.S. Government securities supported by the U.S. Treasury, such as those issued by Ginnie Mae.
The fund purchased or sold debt securities on a when-issued or delayed delivery basis, or in a “To Be Announced” (TBA) or “forward commitment” transaction with delivery or payment to occur at a later date beyond the normal settlement period. At the time a fund enters into a commitment to purchase or sell a security, the transaction is recorded and the value of the security acquired is reflected in the fund’s net asset value. The price of such security and the date that the security will be delivered and paid for are fixed at the time the transaction is negotiated. The value of the security may vary with market fluctuations. No interest accrues to the fund until payment takes place. At the time that a fund enters into this type of transaction, the fund is required to have sufficient cash and/or liquid securities to cover its commitments. Losses may arise due to changes in the value of the underlying securities or if the counterparty does not perform under the contract’s terms, or if the issuer does not issue the securities due to political, economic or other factors. Additionally, losses may arise due to declines in the value of the securities prior to settlement date.
To mitigate this risk of loss on TBA securities and other types of forward settling mortgage-backed securities, the fund whenever possible enters into a Master Securities Forward Transaction Agreement (“MSFTA”) on a bilateral basis with each of the counterparties with whom it undertakes a significant volume of transactions. The MSFTA gives each party to the agreement the right to terminate all transactions traded under such agreement if there is a specified deterioration in the credit quality of the other party. Upon an event of default or a termination of the MSFTA, the non-defaulting party has the right to close out all transactions traded under such agreement and to net amounts owed under each transaction to one net amount payable by one party to the other. This right to close out and net payments across all transactions traded under the MSFTA could result in a reduction of the fund’s credit risk to such counterparty equal to any amounts payable by the fund under the applicable transactions, if any.
30
MFS Global Tactical Allocation Portfolio
Notes to Financial Statements (unaudited) – continued
For mortgage-backed securities traded under a MSFTA, the collateral and margining requirements are contract specific. Collateral amounts across all transactions traded under such agreement are netted and one amount is posted from one party to the other to collateralize such obligations. Cash that has been pledged to cover the fund’s collateral or margin obligations under a MSFTA, if any, will be reported separately on the Statement of Assets and Liabilities as restricted cash. Securities pledged as collateral or margin for the same purpose, if any, are noted in the Portfolio of Investments.
Tax Matters and Distributions – The fund intends to qualify as a regulated investment company, as defined under Subchapter M of the Internal Revenue Code, and to distribute all of its taxable income, including realized capital gains. As a result, no provision for federal income tax is required. The fund’s federal tax returns, when filed, will remain subject to examination by the Internal Revenue Service for a three year period. Management has analyzed the fund’s tax positions taken on federal and state tax returns for all open tax years and does not believe that there are any uncertain tax positions that require recognition of a tax liability. Foreign taxes, if any, have been accrued by the fund in the accompanying financial statements in accordance with the applicable foreign tax law. Foreign income taxes may be withheld by certain countries in which the fund invests. Additionally, capital gains realized by the fund on securities issued in or by certain foreign countries may be subject to capital gains tax imposed by those countries.
Distributions to shareholders are recorded on the ex-dividend date. Income and capital gain distributions are determined in accordance with income tax regulations, which may differ from U.S. generally accepted accounting principles. Certain capital accounts in the financial statements are periodically adjusted for permanent differences in order to reflect their tax character. These adjustments have no impact on net assets or net asset value per share. Temporary differences which arise from recognizing certain items of income, expense, gain or loss in different periods for financial statement and tax purposes will reverse at some time in the future. Distributions in excess of net investment income or net realized gains are temporary overdistributions for financial statement purposes resulting from differences in the recognition or classification of income or distributions for financial statement and tax purposes.
Book/tax differences primarily relate to amortization and accretion of debt securities, passive foreign investment companies, wash sale loss deferrals, straddle loss deferrals, and derivative transactions.
The tax character of distributions declared to shareholders for the last fiscal year is as follows:
| | | | |
| | | Year ended 12/31/17 | |
| Ordinary income (including any short-term capital gains) | | | $22,895,168 | |
| Long-term capital gains | | | 1,880,256 | |
| Total distributions | | | $24,775,424 | |
The federal tax cost and the tax basis components of distributable earnings were as follows:
| | | | |
| As of 6/30/18 | | | | |
| Cost of investments | | | $612,299,061 | |
| Gross appreciation | | | 64,493,853 | |
| Gross depreciation | | | (5,413,751 | ) |
| Net unrealized appreciation (depreciation) | | | $59,080,102 | |
| |
| As of 12/31/17 | | | | |
| Undistributed ordinary income | | | 16,032,244 | |
| Undistributed long-term capital gain | | | 17,918,874 | |
| Other temporary differences | | | 6,017 | |
| Net unrealized appreciation (depreciation) | | | 101,183,541 | |
The aggregate cost above includes prior fiscal year end tax adjustments, if applicable.
Multiple Classes of Shares of Beneficial Interest – The fund offers multiple classes of shares, which differ in their respective distribution and/or service fees. The fund’s income, realized and unrealized gain (loss), and common expenses are allocated to shareholders based on the daily net assets of each class. Dividends are declared separately for each class. Differences in per share dividend rates are generally due to differences in separate class expenses. The fund’s distributions declared to shareholders as reported in the Statements of Changes in Net Assets are presented by class as follows:
| | | | | | | | | | | | | | | | |
| | | From net investment
income | | | From net realized
gain | |
| | | Six months ended
6/30/18 | | | Year ended
12/31/17 | | | Six months ended
6/30/18 | | | Year ended
12/31/17 | |
| Initial Class | | | $— | | | | $1,774,948 | | | | $— | | | | $134,500 | |
| Service Class | | | — | | | | 21,120,220 | | | | — | | | | 1,745,756 | |
| Total | | | $— | | | | $22,895,168 | | | | $— | | | | $1,880,256 | |
31
MFS Global Tactical Allocation Portfolio
Notes to Financial Statements (unaudited) – continued
| (3) | | Transactions with Affiliates |
Investment Adviser – The fund has an investment advisory agreement with MFS to provide overall investment management and related administrative services and facilities to the fund. The management fee is computed daily and paid monthly at the following annual rates based on the fund’s average daily net assets:
| | | | |
| Up to $300 million | | | 0.75% | |
| In excess of $300 million and up to $2.5 billion | | | 0.675% | |
| In excess of $2.5 billion | | | 0.65% | |
MFS has agreed in writing to reduce its management fee by a specified amount if certain MFS mutual fund assets exceed thresholds agreed to by MFS and the fund’s Board of Trustees. For the six months ended June 30, 2018, this management fee reduction amounted to $33,304, which is included in the reduction of total expenses in the Statement of Operations. The management fee incurred for the six months ended June 30, 2018 was equivalent to an annual effective rate of 0.70% of the fund’s average daily net assets.
The investment adviser has agreed in writing to pay a portion of the fund’s total annual operating expenses, excluding interest, taxes, extraordinary expenses, brokerage and transaction costs, and investment-related expenses, such that total annual operating expenses do not exceed 0.90% of average daily net assets for the Initial Class shares and 1.15% of average daily net assets for the Service Class shares. This written agreement will continue until modified by the fund’s Board of Trustees, but such agreement will continue at least until April 30, 2020. For the six months ended June 30, 2018, the fund’s actual operating expenses did not exceed the limit and therefore, the investment adviser did not pay any portion of the fund’s expenses related to this agreement.
Distributor – MFS Fund Distributors, Inc. (MFD), a wholly-owned subsidiary of MFS, is the distributor of shares of the fund. The Trustees have adopted a distribution plan for the Service Class shares pursuant to Rule 12b-1 under the Investment Company Act of 1940.
The fund’s distribution plan provides that the fund will pay MFD distribution and/or service fees equal to 0.25% per annum of its average daily net assets attributable to Service Class shares as partial consideration for services performed and expenses incurred by MFD and financial intermediaries (including participating insurance companies that invest in the fund to fund variable annuity and variable life insurance contracts, sponsors of qualified retirement and pension plans that invest in the fund, and affiliates of these participating insurance companies and plan sponsors) in connection with the sale and distribution of the Service Class shares. MFD may subsequently pay all, or a portion, of the distribution and/or service fees to financial intermediaries.
Shareholder Servicing Agent – MFS Service Center, Inc. (MFSC), a wholly-owned subsidiary of MFS, receives a fee from the fund for its services as shareholder servicing agent. For the six months ended June 30, 2018, the fee was $7,589, which equated to 0.0021% annually of the fund’s average daily net assets. MFSC also receives payment from the fund for out-of-pocket expenses paid by MFSC on behalf of the fund. For the six months ended June 30, 2018, these costs amounted to $57.
Administrator – MFS provides certain financial, legal, shareholder communications, compliance, and other administrative services to the fund. Under an administrative services agreement, the fund reimburses MFS the costs incurred to provide these services. The fund is charged an annual fixed amount of $17,500 plus a fee based on average daily net assets. The administrative services fee incurred for the six months ended June 30, 2018 was equivalent to an annual effective rate of 0.0164% of the fund’s average daily net assets.
Trustees’ and Officers’ Compensation – The fund pays compensation to independent Trustees in the form of a retainer, attendance fees, and additional compensation to Board and Committee chairpersons. The fund does not pay compensation directly to Trustees or officers of the fund who are also officers of the investment adviser, all of whom receive remuneration for their services to the fund from MFS. Certain officers and Trustees of the fund are officers or directors of MFS, MFD, and MFSC.
Other – This fund and certain other funds managed by MFS (the funds) have entered into a service agreement (the ISO Agreement) which provides for payment of fees solely by the funds to Tarantino LLC in return for the provision of services of an Independent Senior Officer (ISO) for the funds. Frank L. Tarantino serves as the ISO and is an officer of the funds and the sole member of Tarantino LLC. The funds can terminate the ISO Agreement with Tarantino LLC at any time under the terms of the ISO Agreement. For the six months ended June 30, 2018, the fee paid by the fund under this agreement was $644 and is included in “Miscellaneous” expense in the Statement of Operations. MFS has agreed to bear all expenses associated with office space, other administrative support, and supplies provided to the ISO.
The fund invests in the MFS Institutional Money Market Portfolio which is managed by MFS and seeks current income consistent with preservation of capital and liquidity. This money market fund does not pay a management fee to MFS.
The fund is permitted to engage in purchase and sale transactions with funds and accounts for which MFS serves as investment adviser or sub-adviser (“cross-trades”) pursuant to a policy adopted by the Board of Trustees. This policy has been designed to ensure that cross-trades conducted by the fund comply with Rule 17a-7 under the Investment Company Act of 1940. During the
32
MFS Global Tactical Allocation Portfolio
Notes to Financial Statements (unaudited) – continued
six months ended June 30, 2018, the fund engaged in sale transactions pursuant to this policy, which amounted to $216,312. The sales transactions resulted in net realized gains (losses) of $49,547.
For the six months ended June 30, 2018, purchases and sales of investments, other than purchased option transactions and short-term obligations, were as follows:
| | | | | | | | |
| | | Purchases | | | Sales | |
| U.S. Government securities | | | $96,268,121 | | | | $62,757,736 | |
| Non-U.S. Government securities | | | $190,825,528 | | | | $224,402,675 | |
| (5) | | Shares of Beneficial Interest |
The fund’s Declaration of Trust permits the Trustees to issue an unlimited number of full and fractional shares of beneficial interest. Transactions in fund shares were as follows:
| | | | | | | | | | | | | | | | |
| | | Six months ended 6/30/18 | | | Year ended 12/31/17 | |
| | | Shares | | | Amount | | | Shares | | | Amount | |
| Shares sold | | | | | | | | | | | | | | | | |
Initial Class | | | 47,332 | | | | $762,442 | | | | 284,704 | | | | $4,549,890 | |
Service Class | | | 411,294 | | | | 6,364,560 | | | | 760,671 | | | | 11,756,151 | |
| | | 458,626 | | | | $7,127,002 | | | | 1,045,375 | | | | $16,306,041 | |
| Shares issued to shareholders in reinvestment of distributions | | | | | | | | | | | | | | | | |
Initial Class | | | — | | | | $— | | | | 120,394 | | | | $1,909,448 | |
Service Class | | | — | | | | — | | | | 1,465,768 | | | | 22,865,976 | |
| | | — | | | | $— | | | | 1,586,162 | | | | $24,775,424 | |
| Shares reacquired | | | | | | | | | | | | | | | | |
Initial Class | | | (248,674 | ) | | | $(3,985,712 | ) | | | (782,642 | ) | | | $(12,462,762 | ) |
Service Class | | | (3,939,030 | ) | | | (61,984,869 | ) | | | (7,223,234 | ) | | | (112,341,889 | ) |
| | | (4,187,704 | ) | | | $(65,970,581 | ) | | | (8,005,876 | ) | | | $(124,804,651 | ) |
| Net change | | | | | | | | | | | | | | | | |
Initial Class | | | (201,342 | ) | | | $(3,223,270 | ) | | | (377,544 | ) | | | $(6,003,424 | ) |
Service Class | | | (3,527,736 | ) | | | (55,620,309 | ) | | | (4,996,795 | ) | | | (77,719,762 | ) |
| | | (3,729,078 | ) | | | $(58,843,579 | ) | | | (5,374,339 | ) | | | $(83,723,186 | ) |
The fund and certain other funds managed by MFS participate in a $1.25 billion unsecured committed line of credit, subject to a $1 billion sublimit, provided by a syndication of banks under a credit agreement. Borrowings may be made for temporary financing needs. Interest is charged to each fund, based on its borrowings, generally at a rate equal to the higher of the Overnight Bank Funding rate or daily one month LIBOR plus an agreed upon spread. A commitment fee, based on the average daily, unused portion of the committed line of credit, is allocated among the participating funds. In addition, the fund and other funds managed by MFS have established unsecured uncommitted borrowing arrangements with certain banks for temporary financing needs. Interest is charged to each fund, based on its borrowings, at a rate equal to the Overnight Bank Funding rate plus an agreed upon spread. For the six months ended June 30, 2018, the fund’s commitment fee and interest expense were $2,569 and $0, respectively, and are included in “Miscellaneous” expense in the Statement of Operations.
| (7) | | Investments in Affiliated Issuers |
An affiliated issuer may be considered one in which the fund owns 5% or more of the outstanding voting securities, or a company which is under common control. For the purposes of this report, the fund assumes the following to be affiliated issuers:
| | | | | | | | | | | | | | | | | | |
| Affiliated Issuers | | | | Beginning
Shares/Par
Amount | | | Acquisitions
Shares/Par
Amount | | | Dispositions
Shares/Par
Amount | | | Ending
Shares/Par
Amount | |
| MFS Institutional Money Market Portfolio | | | | | 71,788,272 | | | | 135,600,590 | | | | (196,215,478 | ) | | | 11,173,384 | |
| | | | | |
| Affiliated Issuers | | Realized Gain (Loss) | | Change in
Unrealized
Appreciation/
Depreciation | | | Capital Gain
Distributions | | | Dividend
Income | | | Ending
Value | |
| MFS Institutional Money Market Portfolio | | $309 | | | $1,366 | | | | $— | | | | $212,977 | | | | $11,173,384 | |
33
MFS Global Tactical Allocation Portfolio
PROXY VOTING POLICIES AND INFORMATION
MFS votes proxies on behalf of the fund pursuant to proxy voting policies and procedures that are available without charge, upon request, by calling 1-800-225-2606, by visiting mfs.com/proxyvoting, or by visiting the SEC’s Web site at http://www.sec.gov.
Information regarding how the fund voted proxies relating to portfolio securities during the most recent twelve-month period ended June 30 is available by August 31 of each year without charge by visiting mfs.com/proxyvoting, or by visiting the SEC’s Web site at http://www.sec.gov.
QUARTERLY PORTFOLIO DISCLOSURE
The fund will file a complete schedule of portfolio holdings with the Securities and Exchange Commission (the Commission) for the first and third quarters of each fiscal year on Form N-Q. The fund’s Form N-Q is available on the EDGAR database on the Commission’s Internet Web site at http://www.sec.gov, and may be reviewed and copied at the:
Public Reference Room
Securities and Exchange Commission
100 F Street, NE, Room 1580
Washington, D.C. 20549
Information on the operation of the Public Reference Room may be obtained by calling the Commission at 1-800-SEC-0330. Copies of the fund’s Form N-Q also may be obtained, upon payment of a duplicating fee, by electronic request at the following e-mail address: publicinfo@sec.gov or by writing the Public Reference Section at the above address.
FURTHER INFORMATION
From time to time, MFS may post important information about the fund or the MFS funds on the MFS web site (mfs.com). This information is available at https://www.mfs.com/en-us/what-we-do/announcements.html or at mfs.com/vit2 by choosing the fund’s name.
INFORMATION ABOUT FUND CONTRACTS AND LEGAL CLAIMS
The fund has entered into contractual arrangements with an investment adviser, administrator, distributor, shareholder servicing agent, 529 program manager (if applicable), and custodian who each provide services to the fund. Unless expressly stated otherwise, shareholders are not parties to, or intended beneficiaries of these contractual arrangements, and these contractual arrangements are not intended to create any shareholder right to enforce them against the service providers or to seek any remedy under them against the service providers, either directly or on behalf of the fund.
Under the Trust’s By-Laws and Declaration of Trust, any claims asserted against or on behalf of the MFS Funds, including claims against Trustees and Officers, must be brought in state and federal courts located within the Commonwealth of Massachusetts.
34
Semiannual Report
June 30, 2018

MFS® Government Securities Portfolio

MFS® Variable Insurance Trust II
GSS-SEM
MFS® Government Securities Portfolio
CONTENTS
The report is prepared for the general information of contract owners. It is authorized for distribution to prospective investors only when preceded or accompanied by a current prospectus.
NOT FDIC INSURED • MAY LOSE VALUE • NO BANK OR CREDIT UNION GUARANTEE • NOT A DEPOSIT • NOT INSURED BY ANY FEDERAL GOVERNMENT AGENCY OR NCUA/NCUSIF
MFS Government Securities Portfolio
LETTER FROM THE EXECUTIVE CHAIRMAN

Dear Contract Owners:
Rising bond yields, international trade friction and geopolitical uncertainty have contributed to a measurable uptick in market volatility — a departure from the low-volatility environment that prevailed for much of 2017. In recent months, against this more challenging backdrop, global markets have given back some of the strong gains recorded during 2017 and early 2018. But global economic growth remains healthy, notwithstanding signs of a modest slowdown over the past few months, particularly in Europe and China.
Although the U.S. Federal Reserve continues to gradually raise interest rates and shrink its balance sheet, monetary policy remains accommodative around the world, with many central banks taking only tentative steps toward tighter policies. Newly enacted U.S. tax reforms have been welcomed by equity markets, while emerging market economies have recently had to contend with tighter financial conditions as a result of firmer U.S. Treasury yields and a stronger dollar. Around the world, inflation remains largely subdued, but tight labor markets and solid global demand have investors on the lookout for its potential resurgence. Increased U.S. protectionism is also a growing concern, as investors fear that trade disputes could dampen business sentiment, leading to slower global growth.
As a global investment manager, MFS® strives to create long-term value for clients through an active approach and an investment platform built on nearly a century of expertise. To make that long-term value meaningful for clients, we work to align with you on our beliefs, your needs and the time it takes to deliver on your desired outcomes.
Respectfully,

Robert J. Manning
Executive Chairman
MFS Investment Management
August 16, 2018
The opinions expressed in this letter are subject to change and may not be relied upon for investment advice. No forecasts can be guaranteed.
1
MFS Government Securities Portfolio
PORTFOLIO COMPOSITION
Portfolio structure (i)
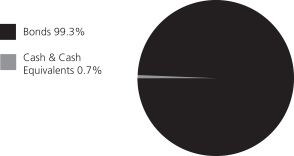
| | | | |
| Fixed income sectors (i) | | | | |
| Mortgage-Backed Securities | | | 50.7% | |
| U.S. Treasury Securities | | | 31.1% | |
| U.S. Government Agencies | | | 6.4% | |
| Investment Grade Corporates | | | 4.1% | |
| Collateralized Debt Obligations | | | 3.1% | |
| Municipal Bonds | | | 1.7% | |
| Commercial Mortgage-Backed Securities | | | 1.7% | |
| Non-U.S. Government Bonds | | | 0.3% | |
| Asset-Backed Securities | | | 0.2% | |
| Emerging Markets Bonds (o) | | | 0.0% | |
| | | | |
| Composition including fixed income credit quality (a)(i) | |
| AAA | | | 4.6% | |
| AA | | | 2.0% | |
| A | | | 3.1% | |
| BBB | | | 1.4% | |
| U.S. Government | | | 31.1% | |
| Federal Agencies | | | 57.1% | |
| Cash & Cash Equivalents | | | 0.7% | |
| |
| Portfolio facts (i) | | | | |
| Average Duration (d) | | | 5.6 | |
| Average Effective Maturity (m) | | | 7.7 yrs. | |
| (a) | | For all securities other than those specifically described below, ratings are assigned to underlying securities utilizing ratings from Moody’s, Fitch, and Standard & Poor’s rating agencies and applying the following hierarchy: If all three agencies provide a rating, the middle rating (after dropping the highest and lowest ratings) is assigned; if two of the three agencies rate a security, the lower of the two is assigned. Ratings are shown in the S&P and Fitch scale (e.g., AAA). Securities rated BBB or higher are considered investment grade. All ratings are subject to change. U.S. Government includes securities issued by the U.S. Department of the Treasury. Federal Agencies includes rated and unrated U.S. Agency fixed-income securities, U.S. Agency mortgage-backed securities, and collateralized mortgage obligations of U.S. Agency mortgage-backed securities. The fund may or may not have held all of these instruments on this date. The fund is not rated by these agencies. |
| (d) | | Duration is a measure of how much a bond’s price is likely to fluctuate with general changes in interest rates, e.g., if rates rise 1.00%, a bond with a 5-year duration is likely to lose about 5.00% of its value due to the interest rate move. |
| (i) | | For purposes of this presentation, the components include the value of securities, and reflect the impact of the equivalent exposure of derivative positions, if any. These amounts may be negative from time to time. Equivalent exposure is a calculated amount that translates the derivative position into a reasonable approximation of the amount of the underlying asset that the portfolio would have to hold at a given point in time to have the same price sensitivity that results from the portfolio’s ownership of the derivative contract. When dealing with derivatives, equivalent exposure is a more representative measure of the potential impact of a position on portfolio performance than value. The bond component will include any accrued interest amounts. |
| (m) | | In determining each instrument’s effective maturity for purposes of calculating the fund’s dollar-weighted average effective maturity, MFS uses the instrument’s stated maturity or, if applicable, an earlier date on which MFS believes it is probable that a maturity-shortening device (such as a put, pre-refunding or prepayment) will cause the instrument to be repaid. Such an earlier date can be substantially shorter than the instrument’s stated maturity. |
Where the fund holds convertible bonds, they are treated as part of the equity portion of the portfolio.
Cash & Cash Equivalents includes any cash, investments in money market funds, short-term securities, and other assets less liabilities. Please see the Statement of Assets and Liabilities for additional information related to the fund’s cash position and other assets and liabilities.
Percentages are based on net assets as of June 30, 2018.
The portfolio is actively managed and current holdings may be different.
2
MFS Government Securities Portfolio
EXPENSE TABLE
Fund Expenses Borne by the Contract Holders during the Period,
January 1, 2018 through June 30, 2018
As a contract holder of the fund, you incur ongoing costs, including management fees; distribution and/or service (12b-1) fees; and other fund expenses. This example is intended to help you understand your ongoing costs (in dollars) of investing in the fund and to compare these costs with the ongoing costs of investing in other mutual funds.
The example is based on an investment of $1,000 invested at the beginning of the period and held for the entire period January 1, 2018 through June 30, 2018.
Actual Expenses
The first line for each share class in the following table provides information about actual account values and actual expenses. You may use the information in this line, together with the amount you invested, to estimate the expenses that you paid over the period. Simply divide your account value by $1,000 (for example, an $8,600 account value divided by $1,000 = 8.6), then multiply the result by the number in the first line under the heading entitled “Expenses Paid During Period” to estimate the expenses you paid on your account during this period.
Hypothetical Example for Comparison Purposes
The second line for each share class in the following table provides information about hypothetical account values and hypothetical expenses based on the fund’s actual expense ratio and an assumed rate of return of 5% per year before expenses, which is not the fund’s actual return. The hypothetical account values and expenses may not be used to estimate the actual ending account balance or expenses you paid for the period. You may use this information to compare the ongoing costs of investing in the fund and other funds. To do so, compare this 5% hypothetical example with the 5% hypothetical examples that appear in the shareholder reports of the other funds.
Please note that the expenses shown in the table are meant to highlight the fund’s ongoing costs only and do not take into account the fees and expenses imposed under the variable contracts through which your investment in the fund is made. Therefore, the second line for each share class in the table is useful in comparing ongoing costs associated with an investment in vehicles (such as the fund) which fund benefits under variable annuity and variable life insurance contracts and to qualified pension and retirement plans only, and will not help you determine the relative total costs of investing in the fund through variable annuity and variable life insurance contracts. If the fees and expenses imposed under the variable contracts were included, your costs would have been higher.
| | | | | | | | | | | | | | | | | | |
| Share Class | | | | Annualized
Expense Ratio | | | Beginning
Account Value
1/01/18 | | | Ending
Account Value
6/30/18 | | | Expenses Paid
During Period (p)
1/01/18-6/30/18 | |
| Initial Class | | Actual | | | 0.59% | | | | $1,000.00 | | | | $988.70 | | | | $2.91 | |
| | Hypothetical (h) | | | 0.59% | | | | $1,000.00 | | | | $1,021.87 | | | | $2.96 | |
| Service Class | | Actual | | | 0.84% | | | | $1,000.00 | | | | $987.82 | | | | $4.14 | |
| | Hypothetical (h) | | | 0.84% | | | | $1,000.00 | | | | $1,020.63 | | | | $4.21 | |
| (h) | 5% class return per year before expenses. |
| (p) | “Expenses Paid During Period” are equal to each class’s annualized expense ratio, as shown above, multiplied by the average account value over the period, multiplied by 181/365 (to reflect the one-half year period). |
Notes to Expense Table
Changes to the fund’s fee arrangements will occur during the fund’s current fiscal year. Had these fee changes been in effect during the six month period, the annualized expense ratios, the actual expenses paid during the period, and the hypothetical expenses paid during the period would have been approximately 0.58%, $2.86, and $2.91 for Initial Class and 0.83%, $4.09, and $4.16 for Service Class, respectively. For further information about the fund’s fee arrangements and changes to those fee arrangements, please see Note 3 in the Notes to Financial Statements.
3
MFS Government Securities Portfolio
PORTFOLIO OF INVESTMENTS – 6/30/18 (unaudited)
The Portfolio of Investments is a complete list of all securities owned by your fund. It is categorized by broad-based asset classes.
| | | | | | | | |
| Issuer | | Shares/Par | | | Value ($) | |
| BONDS – 98.8% | | | | | | | | |
| Agency – Other – 0.8% | | | | | | | | |
| Financing Corp., 10.35%, 8/03/2018 | | $ | 3,915,000 | | | $ | 3,946,625 | |
| | | | | | | | |
| Asset-Backed & Securitized – 5.0% | | | | | | | | |
| A Voce CLO Ltd., 2014-1A, “A1R”, FLR, 3.507% (LIBOR-3mo. + 1.16%), 7/15/2026 (n) | | $ | 2,277,000 | | | $ | 2,276,187 | |
| Atrium CDO Corp., 2011-A, “A1R”, FLR, 3.501% (LIBOR-3mo. + 1.14%), 10/23/2025 (n) | | | 2,306,000 | | | | 2,305,253 | |
| Cent CLO LP, 2014-21A, “A1”, FLR, 3.576% (LIBOR-3mo. + 1.21%), 7/27/2026 (n) | | | 2,454,095 | | | | 2,454,453 | |
| Commercial Mortgage Trust, 2015-DC1, “A5”, 3.35%, 2/10/2048 | | | 1,536,000 | | | | 1,518,363 | |
| Commercial Mortgage Trust, 2017-COR2, “A3”, 3.51%, 9/10/2050 | | | 1,414,455 | | | | 1,380,974 | |
| CSAIL Commercial Mortgage Trust, 2015-C2, “A4”, 3.504%, 6/15/2057 | | | 144,366 | | | | 143,048 | |
| Dryden Senior Loan Fund, 2018-55A, | | | | | | | | |
| “A1”, CLO, FLR, 3.061% (LIBOR-3mo. + 1.02%), 4/15/2031 (n) | | | 1,537,212 | | | | 1,530,640 | |
| Ford Credit Floorplan Master Owner | | | | | | | | |
| Trust, 2015-4, “A2”, FLR, 2.673% (LIBOR-1mo. + 0.6%), 8/15/2020 | | | 960,000 | | | | 960,442 | |
| GS Mortgage Securities Trust, 2015-GC30, “A4”, 3.382%, 5/10/2050 | | | 1,965,000 | | | | 1,938,078 | |
Loomis, Sayles & Co., CLO, “A2”, FLR, 3.752% (LIBOR-3mo. +
1.4%), 4/15/2028 (n) | | | 1,489,774 | | | | 1,478,811 | |
| Madison Park Funding Ltd., 2014-13A, | | | | | | | | |
“BR2”, FLR, 3.855% (LIBOR-3mo. +
1.5%), 4/19/2030 (n) | | | 1,572,067 | | | | 1,574,724 | |
| Morgan Stanley Bank of America | | | | | | | | |
| Merrill Lynch Trust, 2017-C34, “A4”, 3.536%, 11/15/2052 | | | 415,862 | | | | 407,928 | |
| Symphony CLO Ltd., 2016-17A, “BR”, | | | | | | | | |
| FLR, 3.547% (LIBOR-3mo. + 1.2%), 4/15/2028 (n) | | | 1,332,260 | | | | 1,332,243 | |
| TICP CLO Ltd., FLR, 3.198% (LIBOR-3mo. + 0.84%), 4/20/2028 (n) | | | 2,261,352 | | | | 2,252,962 | |
| UBS Commercial Mortgage Trust 2017-C1, “A4”, 3.544%, 11/15/2050 | | | 968,000 | | | | 948,260 | |
| Wells Fargo Commercial Mortgage Trust, 2015-C28, “A4”, 3.54%, 5/15/2048 | | | 1,937,516 | | | | 1,931,844 | |
| Wells Fargo Commercial Mortgage Trust, 2015-NXS1, “A5”, 3.148%, 5/15/2048 | | | 918,829 | | | | 895,188 | |
| West CLO Ltd. 2013-1A, “A1AR”, FLR, 3.523% (LIBOR-3mo. + 1.16%), 11/07/2025 (n) | | | 1,319,055 | | | | 1,318,680 | |
| | | | | | | | |
| | | | | | $ | 26,648,078 | |
| | | | | | | | |
| Automotive – 0.2% | | | | | | | | |
| Ford Motor Credit Co. LLC, 2.551%, 10/05/2018 | | $ | 1,014,000 | | | $ | 1,013,364 | |
| | | | | | | | |
| Issuer | | Shares/Par | | | Value ($) | |
| BONDS – continued | | | | | | | | |
| Automotive – continued | | | | | | | | |
| Hyundai Capital America, 2.4%, 10/30/2018 (n) | | $ | 222,000 | | | $ | 221,673 | |
| | | | | | | | |
| | | | | | $ | 1,235,037 | |
| | | | | | | | |
| Business Services – 0.2% | | | | | | | | |
| Cisco Systems, Inc., 2.6%, 2/28/2023 | | $ | 1,271,000 | | | $ | 1,236,278 | |
| | | | | | | | |
| Chemicals – 0.3% | | | | | | | | |
| Sherwin Williams Co., 2.75%, 6/01/2022 | | $ | 1,673,000 | | | $ | 1,621,129 | |
| | | | | | | | |
| Computer Software – 0.1% | | | | | | | | |
| Microsoft Corp., 3.125%, 11/03/2025 | | $ | 541,000 | | | $ | 531,481 | |
| | | | | | | | |
| Computer Software – Systems – 0.3% | | | | | |
| Apple, Inc., 3.25%, 2/23/2026 | | $ | 1,696,000 | | | $ | 1,655,459 | |
| | | | | | | | |
| Consumer Products – 0.5% | | | | | | | | |
| Newell Rubbermaid, Inc., 3.15%, 4/01/2021 | | $ | 1,293,000 | | | $ | 1,281,001 | |
| Reckitt Benckiser Treasury Services PLC, 2.75%, 6/26/2024 (n) | | | 1,311,000 | | | | 1,238,555 | |
| | | | | | | | |
| | | | | | $ | 2,519,556 | |
| | | | | | | | |
| Food & Beverages – 0.4% | | | | | | | | |
| Anheuser-Busch InBev Finance, Inc., 2.65%, 2/01/2021 | | $ | 2,000,000 | | | $ | 1,972,435 | |
| | | | | | | | |
| Local Authorities – 0.5% | | | | | | | | |
| Philadelphia PA, School District Rev., “A”, AGM, 5.995%, 9/01/2030 | | $ | 960,000 | | | $ | 1,121,846 | |
| University of California Rev. (Build America Bonds), 5.77%, 5/15/2043 | | | 1,345,000 | | | | 1,659,421 | |
| | | | | | | | |
| | | | | | $ | 2,781,267 | |
| | | | | | | | |
| Major Banks – 0.8% | | | | | | | | |
| JPMorgan Chase & Co., 2.295%, 8/15/2021 | | $ | 1,567,000 | | | $ | 1,513,897 | |
| Sumitomo Mitsui Banking Corp., 2.45%, 1/16/2020 | | | 2,387,000 | | | | 2,359,802 | |
| UBS Group Funding (Switzerland) AG, 3.491%, 5/23/2023 (n) | | | 565,000 | | | | 552,352 | |
| | | | | | | | |
| | | | | | $ | 4,426,051 | |
| | | | | | | | |
| Mortgage-Backed – 50.5% | | | | | | | | |
| Fannie Mae, 5.6%, 1/01/2019 | | $ | 352,415 | | | $ | 356,283 | |
| Fannie Mae, 5%, 4/01/2019 – 3/01/2041 | | | 5,930,600 | | | | 6,340,147 | |
| Fannie Mae, 5.5%, 5/01/2019 – 3/01/2038 | | | 8,093,162 | | | | 8,774,731 | |
| Fannie Mae, 4.5%, 6/01/2019 – 6/01/2044 | | | 17,047,661 | | | | 17,901,913 | |
| Fannie Mae, 4.783%, 8/01/2019 | | | 1,355,434 | | | | 1,381,564 | |
| Fannie Mae, 5.05%, 8/01/2019 | | | 292,402 | | | | 297,890 | |
| Fannie Mae, 4.67%, 9/01/2019 | | | 499,230 | | | | 509,505 | |
| Fannie Mae, 1.99%, 10/01/2019 | | | 927,649 | | | | 926,016 | |
| Fannie Mae, 4.14%, 8/01/2020 | | | 416,743 | | | | 426,393 | |
| Fannie Mae, 6%, 2/01/2021 – 7/01/2037 | | | 1,000,794 | | | | 1,100,152 | |
| Fannie Mae, 2.56%, 10/01/2021 | | | 229,284 | | | | 225,466 | |
| Fannie Mae, 2.67%, 3/01/2022 | | | 441,202 | | | | 433,942 | |
| Fannie Mae, 2.152%, 1/25/2023 | | | 1,600,000 | | | | 1,538,557 | |
| Fannie Mae, 2.73%, 4/01/2023 | | | 498,326 | | | | 489,298 | |
4
MFS Government Securities Portfolio
Portfolio of Investments (unaudited) – continued
| | | | | | | | |
| Issuer | | Shares/Par | | | Value ($) | |
| BONDS – continued | | | | | | | | |
| Mortgage-Backed – continued | | | | | | | | |
| Fannie Mae, 2.41%, 5/01/2023 | | $ | 628,883 | | | $ | 611,333 | |
| Fannie Mae, 2.55%, 5/01/2023 | | | 541,264 | | | | 529,416 | |
| Fannie Mae, 2.59%, 5/01/2023 | | | 344,988 | | | | 338,009 | |
| Fannie Mae, 2.28%, 11/01/2026 | | | 264,472 | | | | 245,811 | |
| Fannie Mae, 2.683%, 12/25/2026 | | | 1,032,000 | | | | 971,049 | |
| Fannie Mae, 3.144%, 3/25/2028 | | | 1,276,000 | | | | 1,237,647 | |
| Fannie Mae, 6.5%, 9/01/2031 – 10/01/2037 | | | 833,414 | | | | 927,467 | |
| Fannie Mae, 3%, 12/01/2031 – 11/01/2046 | | | 13,226,487 | | | | 12,975,156 | |
| Fannie Mae, 4%, 9/01/2040 – 2/01/2045 | | | 37,495,704 | | | | 38,503,834 | |
| Fannie Mae, 3.5%, 1/01/2042 – 1/01/2047 | | | 25,643,739 | | | | 25,625,879 | |
| Fannie Mae, 2%, 5/25/2044 | | | 851,153 | | | | 812,455 | |
| Freddie Mac, 5%, 9/01/2018 – 6/01/2040 | | | 1,128,869 | | | | 1,197,938 | |
| Freddie Mac, 2.22%, 12/25/2018 | | | 1,500,000 | | | | 1,496,742 | |
| Freddie Mac, 2.086%, 3/25/2019 | | | 1,800,000 | | | | 1,791,713 | |
| Freddie Mac, 1.883%, 5/25/2019 | | | 3,727,532 | | | | 3,705,645 | |
| Freddie Mac, 6%, 8/01/2019 – 10/01/2038 | | | 2,679,431 | | | | 2,938,375 | |
| Freddie Mac, 2.456%, 8/25/2019 | | | 1,862,000 | | | | 1,856,764 | |
| Freddie Mac, 4.186%, 8/25/2019 | | | 814,000 | | | | 825,181 | |
| Freddie Mac, 1.869%, 11/25/2019 | | | 2,860,763 | | | | 2,826,227 | |
| Freddie Mac, 4.251%, 1/25/2020 | | | 1,449,000 | | | | 1,471,012 | |
| Freddie Mac, 2.313%, 3/25/2020 | | | 1,489,761 | | | | 1,477,973 | |
| Freddie Mac, 4.224%, 3/25/2020 | | | 1,894,746 | | | | 1,932,686 | |
| Freddie Mac, 3.808%, 8/25/2020 | | | 999,000 | | | | 1,016,148 | |
| Freddie Mac, 3.034%, 10/25/2020 | | | 1,327,000 | | | | 1,327,416 | |
| Freddie Mac, 2.455%, 3/25/2022 | | | 1,093,020 | | | | 1,075,755 | |
| Freddie Mac, 5.5%, 5/01/2022 – 6/01/2041 | | | 1,925,461 | | | | 2,082,605 | |
| Freddie Mac, 2.716%, 6/25/2022 | | | 1,616,064 | | | | 1,596,812 | |
| Freddie Mac, 4.5%, 11/01/2022 – 5/01/2042 | | | 2,981,514 | | | | 3,127,471 | |
| Freddie Mac, 2.51%, 11/25/2022 | | | 2,326,000 | | | | 2,275,592 | |
| Freddie Mac, 3.32%, 2/25/2023 | | | 1,993,000 | | | | 2,013,329 | |
| Freddie Mac, 3.25%, 4/25/2023 | | | 3,500,000 | | | | 3,524,319 | |
| Freddie Mac, 3.3%, 4/25/2023 – 10/25/2026 | | | 4,406,044 | | | | 4,415,847 | |
| Freddie Mac, 3.06%, 7/25/2023 | | | 1,286,000 | | | | 1,283,370 | |
| Freddie Mac, 2.454%, 8/25/2023 | | | 1,469,000 | | | | 1,424,495 | |
| Freddie Mac, 1.018%, 4/25/2024 (i) | | | 16,700,606 | | | | 701,873 | |
| Freddie Mac, 0.747%, 7/25/2024 (i) | | | 17,870,826 | | | | 555,082 | |
| Freddie Mac, 3.064%, 8/25/2024 | | | 1,703,107 | | | | 1,693,066 | |
| Freddie Mac, 2.67%, 12/25/2024 | | | 3,924,000 | | | | 3,813,450 | |
| Freddie Mac, 2.811%, 1/25/2025 | | | 3,025,000 | | | | 2,959,323 | |
| Freddie Mac, 3.329%, 5/25/2025 | | | 3,082,000 | | | | 3,102,984 | |
| Freddie Mac, 4%, 7/01/2025 – 4/01/2044 | | | 2,589,729 | | | | 2,656,431 | |
| Freddie Mac, 3.01%, 7/25/2025 | | | 904,000 | | | | 891,882 | |
| Freddie Mac, 2.745%, 1/25/2026 | | | 2,656,000 | | | | 2,565,146 | |
| Freddie Mac, 3.224%, 3/25/2027 (i) | | | 2,380,000 | | | | 2,353,762 | |
| Freddie Mac, 3.243%, 4/25/2027 | | | 2,062,000 | | | | 2,038,564 | |
| Freddie Mac, 3.117%, 6/25/2027 | | | 1,490,000 | | | | 1,456,312 | |
| Freddie Mac, 0.714%, 7/25/2027 (i) | | | 30,044,135 | | | | 1,356,114 | |
| Freddie Mac, 3.194%, 7/25/2027 | | | 2,152,000 | | | | 2,116,700 | |
| Freddie Mac, 0.569%, 8/25/2027 (i) | | | 25,198,260 | | | | 864,968 | |
| Freddie Mac, 3.187%, 9/25/2027 | | | 1,557,000 | | | | 1,525,083 | |
| Freddie Mac, 3.286%, 11/25/2027 | | | 2,115,000 | | | | 2,087,469 | |
| Freddie Mac, 3.444%, 12/25/2027 | | | 722,000 | | | | 722,194 | |
| Freddie Mac, 0.426%, 1/25/2028 (i) | | | 42,845,649 | | | | 1,131,189 | |
| Freddie Mac, 0.434%, 1/25/2028 (i) | | | 17,641,340 | | | | 480,229 | |
| Freddie Mac, 0.27%, 2/25/2028 (i) | | | 49,904,335 | | | | 711,282 | |
| Freddie Mac, 0.263%, 4/25/2028 (i) | | | 32,081,672 | | | | 428,695 | |
| Freddie Mac, 3.85%, 5/25/2028 | | | 1,423,000 | | | | 1,470,871 | |
| | | | | | | | |
| Issuer | | Shares/Par | | | Value ($) | |
| BONDS – continued | | | | | | | | |
| Mortgage-Backed – continued | | | | | | | | |
| Freddie Mac, 6.5%, 8/01/2032 – 5/01/2037 | | $ | 510,793 | | | $ | 572,348 | |
| Freddie Mac, 3.5%, 12/01/2041 – 1/01/2047 | | | 29,991,233 | | | | 29,998,959 | |
| Freddie Mac, 3%, 4/01/2043 – 11/01/2046 | | | 16,531,552 | | | | 16,100,180 | |
| Ginnie Mae, 5.5%, 7/15/2033 – 1/20/2042 | | | 1,820,269 | | | | 1,981,788 | |
| Ginnie Mae, 4.5%, 8/15/2039 – 9/20/2041 | | | 4,217,376 | | | | 4,449,012 | |
| Ginnie Mae, 4%, 10/15/2039 – 4/20/2041 | | | 865,920 | | | | 893,098 | |
| Ginnie Mae, 3.5%, 12/15/2041 – 6/20/2043 | | | 5,846,839 | | | | 5,908,842 | |
| Ginnie Mae, 6.158%, 4/20/2058 | | | 37,266 | | | | 39,404 | |
| Ginnie Mae, 0.658%, 2/16/2059 (i) | | | 2,336,646 | | | | 143,983 | |
| | | | | | | | |
| | | | | | $ | 267,933,611 | |
| | | | | | | | |
| Municipals – 1.2% | | | | | | | | |
| New Jersey Economic Development Authority State Pension Funding Rev., | | | | | | | | |
| Capital Appreciation, “B”, AGM, 0%, 2/15/2023 | | $ | 4,114,000 | | | $ | 3,469,377 | |
| State of California (Build America Bonds), 7.6%, 11/01/2040 | | | 1,935,000 | | | | 2,910,182 | |
| | | | | | | | |
| | | | | | $ | 6,379,559 | |
| | | | | | | | |
| Other Banks & Diversified Financials – 0.6% | | | | | |
| Banque Federative du Credit Mutuel | | | | | | | | |
| S.A., 2.5%, 4/13/2021 (n) | | $ | 1,492,000 | | | $ | 1,453,428 | |
| ING Groep N.V., 3.15%, 3/29/2022 | | | 1,606,000 | | | | 1,575,862 | |
| | | | | | | | |
| | | | | | $ | 3,029,290 | |
| | | | | | | | |
| Restaurants – 0.1% | | | | | | | | |
| McDonald’s Corp., 2.75%, 12/09/2020 | | $ | 604,000 | | | $ | 599,917 | |
| | | | | | | | |
| Supranational – 0.3% | | | | | | | | |
| Inter-American Development Bank, 4.375%, 1/24/2044 | | $ | 1,093,000 | | | $ | 1,306,657 | |
| | | | | | | | |
| Tobacco – 0.2% | | | | | | | | |
| BAT Capital Corp., 2.764%, 8/15/2022 (n) | | $ | 1,283,000 | | | $ | 1,230,263 | |
| | | | | | | | |
| U.S. Government Agencies and Equivalents – 5.6% | |
| AID-Tunisia, 2.452%, 7/24/2021 | | $ | 1,444,000 | | | $ | 1,431,558 | |
| AID-Ukraine, 1.844%, 5/16/2019 | | | 2,527,000 | | | | 2,513,061 | |
| AID-Ukraine, 1.847%, 5/29/2020 | | | 1,135,000 | | | | 1,118,558 | |
| Federal Home Loan Bank, 2.375%, 3/30/2020 | | | 5,500,000 | | | | 5,483,247 | |
| Federal Home Loan Bank, 2.625%, 12/10/2021 | | | 4,800,000 | | | | 4,782,768 | |
| Hashemite Kingdom of Jordan, 1.945%, 6/23/2019 | | | 2,205,000 | | | | 2,193,494 | |
| Private Export Funding Corp., 1.875%, 7/15/2018 | | | 2,300,000 | | | | 2,299,975 | |
| Private Export Funding Corp., 2.25%, 3/15/2020 | | | 594,000 | | | | 589,872 | |
| Private Export Funding Corp., 2.3%, 9/15/2020 | | | 770,000 | | | | 760,685 | |
| Small Business Administration, 6.35%, 4/01/2021 | | | 41,161 | | | | 42,269 | |
| Small Business Administration, 6.34%, 5/01/2021 | | | 54,615 | | | | 55,920 | |
| Small Business Administration, 6.44%, 6/01/2021 | | | 98,207 | | | | 101,275 | |
5
MFS Government Securities Portfolio
Portfolio of Investments (unaudited) – continued
| | | | | | | | |
| Issuer | | Shares/Par | | | Value ($) | |
| BONDS – continued | | | | | | | | |
| U.S. Government Agencies and Equivalents – continued | |
| Small Business Administration, 6.625%, 7/01/2021 | | $ | 130,993 | | | $ | 134,488 | |
| Small Business Administration, 6.07%, 3/01/2022 | | | 91,246 | | | | 93,889 | |
| Small Business Administration, 4.98%, 11/01/2023 | | | 130,175 | | | | 134,667 | |
| Small Business Administration, 4.77%, 4/01/2024 | | | 312,681 | | | | 320,679 | |
| Small Business Administration, 5.52%, 6/01/2024 | | | 133,204 | | | | 138,116 | |
| Small Business Administration, 4.99%, 9/01/2024 | | | 24,194 | | | | 24,964 | |
| Small Business Administration, 5.11%, 4/01/2025 | | | 199,492 | | | | 205,612 | |
| Small Business Administration, 2.21%, 2/01/2033 | | | 903,415 | | | | 876,237 | |
| Small Business Administration, 2.22%, 3/01/2033 | | | 1,573,225 | | | | 1,528,100 | |
| Small Business Administration, 3.15%, 7/01/2033 | | | 1,466,314 | | | | 1,476,397 | |
| Small Business Administration, 3.16%, 8/01/2033 | | | 801,830 | | | | 808,066 | |
| Small Business Administration, 3.62%, 9/01/2033 | | | 527,419 | | | | 538,032 | |
| Tennessee Valley Authority, 1.75%, 10/15/2018 | | | 1,889,000 | | | | 1,886,926 | |
| | | | | | | | |
| | | | | | $ | 29,538,855 | |
| | | | | | | | |
| U.S. Treasury Obligations – 30.9% | | | | | | | | |
| U.S. Treasury Bonds, 7.875%, 2/15/2021 | | $ | 177,000 | | | $ | 200,535 | |
| U.S. Treasury Bonds, 6.25%, 8/15/2023 | | | 2,891,000 | | | | 3,373,549 | |
| U.S. Treasury Bonds, 6%, 2/15/2026 | | | 2,699,000 | | | | 3,286,771 | |
| U.S. Treasury Bonds, 6.75%, 8/15/2026 | | | 1,862,000 | | | | 2,393,106 | |
| U.S. Treasury Bonds, 6.375%, 8/15/2027 | | | 326,000 | | | | 418,452 | |
| U.S. Treasury Bonds, 4.5%, 8/15/2039 | | | 1,287,500 | | | | 1,605,402 | |
| U.S. Treasury Bonds, 3.125%, 2/15/2043 | | | 8,176,700 | | | | 8,394,213 | |
| U.S. Treasury Bonds, 2.875%, 5/15/2043 | | | 13,519,500 | | | | 13,283,965 | |
| U.S. Treasury Bonds, 2.5%, 2/15/2045 | | | 21,059,000 | | | | 19,200,708 | |
| U.S. Treasury Bonds, 2.875%, 11/15/2046 | | | 5,178,000 | | | | 5,069,788 | |
| U.S. Treasury Notes, 1.375%, 9/30/2019 | | | 22,635,000 | | | | 22,340,568 | |
| U.S. Treasury Notes, 2.625%, 8/15/2020 | | | 8,002,000 | | | | 8,012,315 | |
| U.S. Treasury Notes, 2%, 11/30/2020 | | | 4,541,000 | | | | 4,478,916 | |
| U.S. Treasury Notes, 3.125%, 5/15/2021 | | | 1,901,000 | | | | 1,927,213 | |
| U.S. Treasury Notes, 1.75%, 11/30/2021 | | | 11,000,000 | | | | 10,675,156 | |
| U.S. Treasury Notes, 1.75%, 5/15/2022 | | | 6,594,000 | | | | 6,366,558 | |
| U.S. Treasury Notes, 2.5%, 8/15/2023 | | | 28,069,000 | | | | 27,738,970 | |
| U.S. Treasury Notes, 2.5%, 5/15/2024 | | | 14,369,000 | | | | 14,143,362 | |
| U.S. Treasury Notes, 2%, 8/15/2025 | | | 438,000 | | | | 414,902 | |
| U.S. Treasury Notes, 2%, 11/15/2026 | | | 4,554,000 | | | | 4,267,774 | |
| U.S. Treasury Notes, 2.75%, 2/15/2028 | | | 6,284,000 | | | | 6,230,242 | |
| | | | | | | | |
| | | | | | $ | 163,822,465 | |
| | | | | | | | |
| | | | | | | | |
| Issuer | | Shares/Par | | | Value ($) | |
| BONDS – continued | | | | | | | | |
| Utilities – Electric Power – 0.3% | |
| Enel Finance International N.V., 2.875%, 5/25/2022 (n) | | $ | 1,518,000 | | | $ | 1,446,391 | |
| | | | | | | | |
Total Bonds
(Identified Cost, $530,738,374) | | | $ | 523,860,404 | |
| | | | | | | | |
| |
| INVESTMENT COMPANIES (h) – 0.1% | | | | | |
| Money Market Funds – 0.1% | | | | | | | | |
| MFS Institutional Money Market Portfolio, 1.9% (v) (Identified Cost, $700,850) | | | 700,920 | | | $ | 700,920 | |
| | | | | | | | |
OTHER ASSETS, LESS
LIABILITIES – 1.1% | | | | | | | 5,791,870 | |
| | | | | | | | |
| NET ASSETS – 100.0% | | | | | | $ | 530,353,194 | |
| | | | | | | | |
| (h) | An affiliated issuer, which may be considered one in which the fund owns 5% or more of the outstanding voting securities, or a company which is under common control. At period end, the aggregate values of the fund’s investments in affiliated issuers and in unaffiliated issuers were $700,920 and $523,860,404, respectively. |
| (i) | Interest only security for which the fund receives interest on notional principal (Par amount). Par amount shown is the notional principal and does not reflect the cost of the security. |
| (n) | Securities exempt from registration under Rule 144A of the Securities Act of 1933. These securities may be sold in the ordinary course of business in transactions exempt from registration, normally to qualified institutional buyers. At period end, the aggregate value of these securities was $22,666,615, representing 4.3% of net assets. |
| (v) | Affiliated issuer that is available only to investment companies managed by MFS. The rate quoted for the MFS Institutional Money Market Portfolio is the annualized seven-day yield of the fund at period end. |
The following abbreviations are used in this report and are defined:
| AGM | | Assured Guaranty Municipal |
| CDO | | Collateralized Debt Obligation |
| CLO | | Collateralized Loan Obligation |
| FLR | | Floating Rate. Interest rate resets periodically based on the parenthetically disclosed reference rate plus a spread (if any). The period-end rate reported may not be the current rate. |
| PLC | | Public Limited Company |
See Notes to Financial Statements
6
MFS Government Securities Portfolio
FINANCIAL STATEMENTS | STATEMENT OF ASSETS AND LIABILITIES (unaudited)
This statement represents your fund’s balance sheet, which details the assets and liabilities comprising the total value of the fund.
| | | | |
At 6/30/18 | | | | |
Assets | | | | |
Investments in unaffiliated issuers, at value (identified cost, $530,738,374) | | | $523,860,404 | |
Investments in affiliated issuers, at value (identified cost, $700,850) | | | 700,920 | |
Receivables for | | | | |
Investments sold | | | 4,474,428 | |
Interest | | | 2,762,643 | |
Other assets | | | 1,883 | |
Total assets | | | $531,800,278 | |
Liabilities | | | | |
Payables for | | | | |
Fund shares reacquired | | | $1,324,043 | |
Payable to affiliates | | | | |
Investment adviser | | | 24,309 | |
Shareholder servicing costs | | | 43 | |
Distribution and/or service fees | | | 3,998 | |
Payable for independent Trustees’ compensation | | | 100 | |
Accrued expenses and other liabilities | | | 94,591 | |
Total liabilities | | | $1,447,084 | |
Net assets | | | $530,353,194 | |
Net assets consist of | | | | |
Paid-in capital | | | $541,035,995 | |
Unrealized appreciation (depreciation) | | | (6,877,900 | ) |
Accumulated net realized gain (loss) | | | (26,854,809 | ) |
Undistributed net investment income | | | 23,049,908 | |
Net assets | | | $530,353,194 | |
Shares of beneficial interest outstanding | | | 43,420,854 | |
| | | | | | | | | | | | |
| | | Net assets | | | Shares
outstanding | | | Net asset value
per share | |
Initial Class | | | $335,918,578 | | | | 27,426,014 | | | | $12.25 | |
Service Class | | | 194,434,616 | | | | 15,994,840 | | | | 12.16 | |
See Notes to Financial Statements
7
MFS Government Securities Portfolio
FINANCIAL STATEMENTS | STATEMENT OF OPERATIONS (unaudited)
This statement describes how much your fund earned in investment income and accrued in expenses. It also describes any gains and/or losses generated by fund operations.
| | | | |
Six months ended 6/30/18 | | | | |
Net investment income (loss) | | | | |
Income | | | | |
Interest | | | $8,298,186 | |
Dividends from affiliated issuers | | | 86,707 | |
Total investment income | | | $8,384,893 | |
Expenses | | | | |
Management fee | | | $1,504,543 | |
Distribution and/or service fees | | | 251,001 | |
Shareholder servicing costs | | | 4,377 | |
Administrative services fee | | | 45,989 | |
Independent Trustees’ compensation | | | 7,144 | |
Custodian fee | | | 16,573 | |
Shareholder communications | | | 18,006 | |
Audit and tax fees | | | 30,914 | |
Legal fees | | | 3,455 | |
Miscellaneous | | | 17,324 | |
Total expenses | | | $1,899,326 | |
Reduction of expenses by investment adviser | | | (25,230 | ) |
Net expenses | | | $1,874,096 | |
Net investment income (loss) | | | $6,510,797 | |
Realized and unrealized gain (loss) | | | | |
Realized gain (loss) (identified cost basis) | | | | |
Unaffiliated issuers | | | $(358,668 | ) |
Affiliated issuers | | | (727 | ) |
Futures contracts | | | (122,985 | ) |
Net realized gain (loss) | | | $(482,380 | ) |
Change in unrealized appreciation or depreciation | | | | |
Unaffiliated issuers | | | $(12,832,789 | ) |
Affiliated issuers | | | 397 | |
Futures contracts | | | 44,004 | |
Net unrealized gain (loss) | | | $(12,788,388 | ) |
Net realized and unrealized gain (loss) | | | $(13,270,768 | ) |
Change in net assets from operations | | | $(6,759,971 | ) |
See Notes to Financial Statements
8
MFS Government Securities Portfolio
FINANCIAL STATEMENTS | STATEMENTS OF CHANGES IN NET ASSETS
These statements describe the increases and/or decreases in net assets resulting from operations, any distributions, and any shareholder transactions.
| | | | | | | | |
| | | Six months ended
6/30/18 | | | Year ended
12/31/17 | |
| | | (unaudited) | | | | |
Change in net assets | | | | | | | | |
From operations | | | | | | | | |
Net investment income (loss) | | | $6,510,797 | | | | $14,129,796 | |
Net realized gain (loss) | | | (482,380 | ) | | | (673,000 | ) |
Net unrealized gain (loss) | | | (12,788,388 | ) | | | (599,914 | ) |
Change in net assets from operations | | | $(6,759,971 | ) | | | $12,856,882 | |
Distributions declared to shareholders | | | | | | | | |
From net investment income | | | $— | | | | $(17,852,246 | ) |
Change in net assets from fund share transactions | | | $(39,382,458 | ) | | | $(43,797,662 | ) |
Total change in net assets | | | $(46,142,429 | ) | | | $(48,793,026 | ) |
Net assets | | | | | | | | |
At beginning of period | | | 576,495,623 | | | | 625,288,649 | |
At end of period (including undistributed net investment income of $23,049,908 and
$16,539,111, respectively) | | | $530,353,194 | | | | $576,495,623 | |
See Notes to Financial Statements
9
MFS Government Securities Portfolio
FINANCIAL STATEMENTS | FINANCIAL HIGHLIGHTS
The financial highlights table is intended to help you understand the fund’s financial performance for the semiannual period and the past 5 fiscal years. Certain information reflects financial results for a single fund share. The total returns in the table represent the rate that an investor would have earned (or lost) on an investment in the fund share class (assuming reinvestment of all distributions) held for the entire period.
| | | | | | | | | | | | | | | | | | | | | | | | |
| Initial Class | | Six months
ended 6/30/18 | | | Year ended | |
| | | 12/31/17 | | | 12/31/16 | | | 12/31/15 | | | 12/31/14 | | | 12/31/13 | |
| | | (unaudited) | | | | | | | | | | | | | | | | |
Net asset value, beginning of period | | | $12.39 | | | | $12.51 | | | | $12.72 | | | | $13.02 | | | | $12.73 | | | | $13.49 | |
| Income (loss) from investment operations | | | | | | | | | |
Net investment income (loss) (d) | | | $0.15 | | | | $0.31 | | | | $0.31 | (c) | | | $0.27 | | | | $0.26 | | | | $0.25 | |
Net realized and unrealized gain (loss) | | | (0.29 | ) | | | (0.03 | ) | | | (0.17 | ) | | | (0.21 | ) | | | 0.35 | | | | (0.60 | ) |
Total from investment operations | | | $(0.14 | ) | | | $0.28 | | | | $0.14 | | | | $0.06 | | | | $0.61 | | | | $(0.35 | ) |
| Less distributions declared to shareholders | | | | | | | | | |
From net investment income | | | $— | | | | $(0.40 | ) | | | $(0.35 | ) | | | $(0.36 | ) | | | $(0.32 | ) | | | $(0.30 | ) |
From net realized gain | | | — | | | | — | | | | — | | | | — | | | | — | | | | (0.11 | ) |
Total distributions declared to shareholders | | | $— | | | | $(0.40 | ) | | | $(0.35 | ) | | | $(0.36 | ) | | | $(0.32 | ) | | | $(0.41 | ) |
Net asset value, end of period (x) | | | $12.25 | | | | $12.39 | | | | $12.51 | | | | $12.72 | | | | $13.02 | | | | $12.73 | |
Total return (%) (k)(r)(s)(x) | | | (1.13 | )(n) | | | 2.22 | | | | 1.04 | (c) | | | 0.47 | | | | 4.86 | | | | (2.59 | ) |
Ratios (%) (to average net assets)
and Supplemental data: | | | | | | | | | |
Expenses before expense reductions (f) | | | 0.60 | (a) | | | 0.60 | | | | 0.57 | (c) | | | 0.60 | | | | 0.60 | | | | 0.60 | |
Expenses after expense reductions (f) | | | 0.59 | (a) | | | 0.60 | | | | 0.56 | (c) | | | 0.59 | | | | 0.59 | | | | 0.59 | |
Net investment income (loss) | | | 2.47 | (a) | | | 2.45 | | | | 2.40 | (c) | | | 2.09 | | | | 2.04 | | | | 1.89 | |
Portfolio turnover | | | 13 | (n) | | | 24 | | | | 48 | | | | 81 | | | | 61 | | | | 130 | |
Net assets at end of period (000 omitted) | | | $335,919 | | | | $364,445 | | | | $388,457 | | | | $424,025 | | | | $484,573 | | | | $510,317 | |
| | |
| Service Class | | Six months
ended 6/30/18 | | | Year ended | |
| | | 12/31/17 | | | 12/31/16 | | | 12/31/15 | | | 12/31/14 | | | 12/31/13 | |
| | | (unaudited) | | | | | | | | | | | | | | | | |
Net asset value, beginning of period | | | $12.31 | | | | $12.42 | | | | $12.64 | | | | $12.93 | | | | $12.63 | | | | $13.39 | |
| Income (loss) from investment operations | | | | | | | | | |
Net investment income (loss) (d) | | | $0.13 | | | | $0.27 | | | | $0.28 | (c) | | | $0.24 | | | | $0.23 | | | | $0.21 | |
Net realized and unrealized gain (loss) | | | (0.28 | ) | | | (0.02 | ) | | | (0.18 | ) | | | (0.21 | ) | | | 0.36 | | | | (0.60 | ) |
Total from investment operations | | | $(0.15 | ) | | | $0.25 | | | | $0.10 | | | | $0.03 | | | | $0.59 | | | | $(0.39 | ) |
| Less distributions declared to shareholders | | | | | | | | | |
From net investment income | | | $— | | | | $(0.36 | ) | | | $(0.32 | ) | | | $(0.32 | ) | | | $(0.29 | ) | | | $(0.26 | ) |
From net realized gain | | | — | | | | — | | | | — | | | | — | | | | — | | | | (0.11 | ) |
Total distributions declared to shareholders | | | $— | | | | $(0.36 | ) | | | $(0.32 | ) | | | $(0.32 | ) | | | $(0.29 | ) | | | $(0.37 | ) |
Net asset value, end of period (x) | | | $12.16 | | | | $12.31 | | | | $12.42 | | | | $12.64 | | | | $12.93 | | | | $12.63 | |
Total return (%) (k)(r)(s)(x) | | | (1.22 | )(n) | | | 2.03 | | | | 0.68 | (c) | | | 0.26 | | | | 4.67 | | | | (2.90 | ) |
Ratios (%) (to average net assets)
and Supplemental data: | | | | | | | | | |
Expenses before expense reductions (f) | | | 0.85 | (a) | | | 0.85 | | | | 0.82 | (c) | | | 0.85 | | | | 0.85 | | | | 0.85 | |
Expenses after expense reductions (f) | | | 0.84 | (a) | | | 0.85 | | | | 0.81 | (c) | | | 0.84 | | | | 0.84 | | | | 0.84 | |
Net investment income (loss) | | | 2.22 | (a) | | | 2.20 | | | | 2.15 | (c) | | | 1.84 | | | | 1.79 | | | | 1.63 | |
Portfolio turnover | | | 13 | (n) | | | 24 | | | | 48 | | | | 81 | | | | 61 | | | | 130 | |
Net assets at end of period (000 omitted) | | | $194,435 | | | | $212,050 | | | | $236,831 | | | | $256,958 | | | | $299,520 | | | | $348,419 | |
See Notes to Financial Statements
10
MFS Government Securities Portfolio
Financial Highlights – continued
| (c) | Amount reflects a one-time reimbursement of expenses by the custodian (or former custodian) without which net investment income and performance would be lower and expenses would be higher. |
| (d) | Per share data is based on average shares outstanding. |
| (f) | Ratios do not reflect reductions from fees paid indirectly, if applicable. |
| (k) | The total return does not reflect expenses that apply to separate accounts. Inclusion of these charges would reduce the total return figures for all periods shown. |
| (r) | Certain expenses have been reduced without which performance would have been lower. |
| (s) | From time to time the fund may receive proceeds from litigation settlements, without which performance would be lower. |
| (x) | The net asset values and total returns have been calculated on net assets which include adjustments made in accordance with U.S. generally accepted accounting principles required at period end for financial reporting purposes. |
See Notes to Financial Statements
11
MFS Government Securities Portfolio
NOTES TO FINANCIAL STATEMENTS (unaudited)
| (1) | | Business and Organization |
MFS Government Securities Portfolio (the fund) is a diversified series of MFS Variable Insurance Trust II (the trust). The trust is organized as a Massachusetts business trust and is registered under the Investment Company Act of 1940, as amended, as an open-end management investment company. The shareholders of each series of the trust are separate accounts of insurance companies, which offer variable annuity and/or life insurance products, and qualified retirement and pension plans.
The fund is an investment company and accordingly follows the investment company accounting and reporting guidance of the Financial Accounting Standards Board (FASB) Accounting Standards Codification Topic 946 Financial Services – Investment Companies.
| (2) | | Significant Accounting Policies |
General – The preparation of financial statements in conformity with U.S. generally accepted accounting principles requires management to make estimates and assumptions that affect the reported amounts of assets and liabilities, and disclosure of contingent assets and liabilities at the date of the financial statements and the reported amounts of increases and decreases in net assets from operations during the reporting period. Actual results could differ from those estimates. In the preparation of these financial statements, management has evaluated subsequent events occurring after the date of the fund’s Statement of Assets and Liabilities through the date that the financial statements were issued.
In March 2017, the FASB issued Accounting Standards Update 2017-08, Receivables – Nonrefundable Fees and Other Costs (Subtopic 310-20) – Premium Amortization on Purchased Callable Debt Securities (“ASU 2017-08”). For entities that hold callable debt securities at a premium, ASU 2017-08 requires that the premium be amortized to the earliest call date. ASU 2017-08 will be effective for fiscal years beginning after December 15, 2018, and interim periods within those fiscal years. Management has evaluated the potential impacts of ASU 2017-08 and believes that adoption of ASU 2017-08 will not have a material effect on the fund’s overall financial position or its overall results of operations.
Balance Sheet Offsetting – The fund’s accounting policy with respect to balance sheet offsetting is that, absent an event of default by the counterparty or a termination of the agreement, the International Swaps and Derivatives Association (ISDA) Master Agreement, or similar agreement, does not result in an offset of reported amounts of financial assets and financial liabilities in the Statement of Assets and Liabilities across transactions between the fund and the applicable counterparty. The fund’s right to setoff may be restricted or prohibited by the bankruptcy or insolvency laws of the particular jurisdiction to which a specific master netting agreement counterparty is subject. Balance sheet offsetting disclosures, to the extent applicable to the fund, have been included in the fund’s Significant Accounting Policies note under the captions for each of the fund’s in-scope financial instruments and transactions.
Investment Valuations – Debt instruments and floating rate loans, including restricted debt instruments, are generally valued at an evaluated or composite bid as provided by a third-party pricing service. Short-term instruments with a maturity at issuance of 60 days or less may be valued at amortized cost, which approximates market value. Futures contracts are generally valued at last posted settlement price on their primary exchange as provided by a third-party pricing service. Futures contracts for which there were no trades that day for a particular position are generally valued at the closing bid quotation on their primary exchange as provided by a third-party pricing service. Open-end investment companies are generally valued at net asset value per share. Securities and other assets generally valued on the basis of information from a third-party pricing service may also be valued at a broker/dealer bid quotation. In determining values, third-party pricing services can utilize both transaction data and market information such as yield, quality, coupon rate, maturity, type of issue, trading characteristics, and other market data.
The Board of Trustees has delegated primary responsibility for determining or causing to be determined the value of the fund’s investments (including any fair valuation) to the adviser pursuant to valuation policies and procedures approved by the Board. If the adviser determines that reliable market quotations are not readily available, investments are valued at fair value as determined in good faith by the adviser in accordance with such procedures under the oversight of the Board of Trustees. Under the fund’s valuation policies and procedures, market quotations are not considered to be readily available for most types of debt instruments and floating rate loans and many types of derivatives. These investments are generally valued at fair value based on information from third-party pricing services. In addition, investments may be valued at fair value if the adviser determines that an investment’s value has been materially affected by events occurring after the close of the exchange or market on which the investment is principally traded (such as foreign exchange or market) and prior to the determination of the fund’s net asset value, or after the halting of trading of a specific security where trading does not resume prior to the close of the exchange or market on which the security is principally traded. The adviser generally relies on third-party pricing services or other information (such as the correlation with price movements of similar securities in the same or other markets; the type, cost and investment characteristics of the security; the business and financial condition of the issuer; and trading and other market data) to assist in determining whether to fair value and at what value to fair value an investment. The value of an investment for purposes of calculating the fund’s net asset value can differ depending on the source and method used to determine value. When fair valuation is used, the value of an investment used to
12
MFS Government Securities Portfolio
Notes to Financial Statements (unaudited) – continued
determine the fund’s net asset value may differ from quoted or published prices for the same investment. There can be no assurance that the fund could obtain the fair value assigned to an investment if it were to sell the investment at the same time at which the fund determines its net asset value per share.
Various inputs are used in determining the value of the fund’s assets or liabilities. These inputs are categorized into three broad levels. In certain cases, the inputs used to measure fair value may fall into different levels of the fair value hierarchy. In such cases, an investment’s level within the fair value hierarchy is based on the lowest level of input that is significant to the fair value measurement. The fund’s assessment of the significance of a particular input to the fair value measurement in its entirety requires judgment, and considers factors specific to the investment. Level 1 includes unadjusted quoted prices in active markets for identical assets or liabilities. Level 2 includes other significant observable market-based inputs (including quoted prices for similar securities, interest rates, prepayment speed, and credit risk). Level 3 includes unobservable inputs, which may include the adviser’s own assumptions in determining the fair value of investments. The following is a summary of the levels used as of June 30, 2018 in valuing the fund’s assets or liabilities:
| | | | | | | | | | | | | | | | |
| Financial Instruments | | Level 1 | | | Level 2 | | | Level 3 | | | Total | |
| U.S. Treasury Bonds & U.S. Government | | | | | | | | | | | | | | | | |
| Agency & Equivalents | | | $— | | | | $197,307,945 | | | | $— | | | | $197,307,945 | |
| Non-U.S. Sovereign Debt | | | — | | | | 1,306,657 | | | | — | | | | 1,306,657 | |
| Municipal Bonds | | | — | | | | 9,160,826 | | | | — | | | | 9,160,826 | |
| U.S. Corporate Bonds | | | — | | | | 11,424,961 | | | | — | | | | 11,424,961 | |
| Residential Mortgage-Backed Securities | | | — | | | | 267,933,611 | | | | — | | | | 267,933,611 | |
| Commercial Mortgage-Backed Securities | | | — | | | | 9,163,683 | | | | — | | | | 9,163,683 | |
| Asset-Backed Securities (including CDOs) | | | — | | | | 17,484,395 | | | | — | | | | 17,484,395 | |
| Foreign Bonds | | | — | | | | 10,078,326 | | | | — | | | | 10,078,326 | |
| Mutual Funds | | | 700,920 | | | | — | | | | — | | | | 700,920 | |
| Total | | | $700,920 | | | | $523,860,404 | | | | $— | | | | $524,561,324 | |
For further information regarding security characteristics, see the Portfolio of Investments.
Derivatives – The fund uses derivatives primarily to increase or decrease exposure to a particular market or segment of the market, or security, to increase or decrease interest rate or currency exposure, or as alternatives to direct investments. Derivatives are used for hedging or non-hedging purposes. While hedging can reduce or eliminate losses, it can also reduce or eliminate gains. When the fund uses derivatives as an investment to increase market exposure, or for hedging purposes, gains and losses from derivative instruments may be substantially greater than the derivative’s original cost.
The derivative instruments used by the fund during the period were futures contracts. Depending on the type of derivative, the fund may exit a derivative position by entering into an offsetting transaction with a counterparty or exchange, negotiating an agreement with the derivative counterparty, or novating the position to a third party. The fund may be unable to promptly close out a futures position in instances where the daily fluctuation in the price for that type of future exceeds the daily limit set by the exchange. The fund’s period end derivatives, as presented in the Portfolio of Investments and the associated Derivative Contract tables, generally are indicative of the volume of its derivative activity during the period.
At June 30, 2018, the fund did not have any outstanding derivative instruments.
The following table presents, by major type of derivative contract, the realized gain (loss) on derivatives held by the fund for the six months ended June 30, 2018 as reported in the Statement of Operations:
| | | | |
| Risk | | Futures
Contracts | |
| Interest Rate | | | $(122,985 | ) |
The following table presents, by major type of derivative contract, the change in unrealized appreciation or depreciation on derivatives held by the fund for the six months ended June 30, 2018 as reported in the Statement of Operations:
| | | | |
| Risk | | Futures
Contracts | |
| Interest Rate | | | $44,004 | |
Derivative counterparty credit risk is managed through formal evaluation of the creditworthiness of all potential counterparties. On certain, but not all, uncleared derivatives, the fund attempts to reduce its exposure to counterparty credit risk whenever possible by entering into an ISDA Master Agreement on a bilateral basis. The ISDA Master Agreement gives each party to the agreement the right to terminate all transactions traded under such agreement if there is a specified deterioration in the credit quality of the other
13
MFS Government Securities Portfolio
Notes to Financial Statements (unaudited) – continued
party. Upon an event of default or a termination of the ISDA Master Agreement, the non-defaulting party has the right to close out all transactions traded under such agreement and to net amounts owed under each agreement to one net amount payable by one party to the other. This right to close out and net payments across all transactions traded under the ISDA Master Agreement could result in a reduction of the fund’s credit risk to such counterparty equal to any amounts payable by the fund under the applicable transactions, if any.
Collateral and margin requirements differ by type of derivative. For cleared derivatives (e.g., futures contracts, cleared swaps, and exchange-traded options), margin requirements are set by the clearing broker and the clearing house and collateral, in the form of cash or securities, is posted by the fund directly with the clearing broker. Collateral terms are counterparty agreement specific for uncleared derivatives (e.g., forward foreign currency exchange contracts, uncleared swap agreements, and uncleared options) and collateral, in the form of cash and securities, is held in segregated accounts with the fund’s custodian in connection with these agreements. For derivatives traded under an ISDA Master Agreement, which contains a collateral support annex, the collateral requirements are netted across all transactions traded under such counterparty-specific agreement and one amount is posted from one party to the other to collateralize such obligations. Cash that has been segregated or delivered to cover the fund’s collateral or margin obligations under derivative contracts, if any, will be reported separately in the Statement of Assets and Liabilities as restricted cash for uncleared derivatives and/or deposits with brokers for cleared derivatives. Securities pledged as collateral or margin for the same purpose, if any, are noted in the Portfolio of Investments. The fund may be required to make payments of interest on uncovered collateral or margin obligations with the broker. Any such payments are included in “Miscellaneous” expense in the Statement of Operations.
Futures Contracts – The fund entered into futures contracts which may be used to hedge against or obtain broad market exposure, interest rate exposure or to manage duration. A futures contract represents a commitment for the future purchase or sale of an asset at a specified price on a specified date.
Upon entering into a futures contract, the fund is required to deposit with the broker, either in cash or securities, an initial margin in an amount equal to a specified percentage of the notional amount of the contract. Subsequent payments (variation margin) are made or received by the fund each day, depending on the daily fluctuations in the value of the contract, and are recorded for financial statement purposes as unrealized gain or loss by the fund until the contract is closed or expires at which point the gain or loss on futures contracts is realized.
The fund bears the risk of interest rates or securities prices moving unexpectedly, in which case, the fund may not achieve the anticipated benefits of the futures contracts and may realize a loss. While futures contracts may present less counterparty risk to the fund since the contracts are exchange traded and the exchange’s clearinghouse guarantees payments to the broker, there is still counterparty credit risk due to the insolvency of the broker. The fund’s maximum risk of loss due to counterparty credit risk is equal to the margin posted by the fund to the broker plus any gains or minus any losses on the outstanding futures contracts.
Dollar Roll Transactions – The fund enters into dollar roll transactions, with respect to mortgage-backed securities issued by Ginnie Mae, Fannie Mae, and Freddie Mac, in which the fund sells mortgage-backed securities to financial institutions and simultaneously agrees to purchase similar (same issuer, type and coupon) securities at a later date at an agreed-upon price. During the period between the sale and repurchase in a dollar roll transaction the fund will not be entitled to receive interest and principal payments on the securities sold but is compensated by interest earned on the proceeds of the initial sale and by a lower purchase price on the securities to be repurchased which enhances the fund’s total return. The fund accounts for dollar roll transactions as purchases and sales and realizes gains and losses on these transactions.
Indemnifications – Under the fund’s organizational documents, its officers and Trustees may be indemnified against certain liabilities and expenses arising out of the performance of their duties to the fund. Additionally, in the normal course of business, the fund enters into agreements with service providers that may contain indemnification clauses. The fund’s maximum exposure under these agreements is unknown as this would involve future claims that may be made against the fund that have not yet occurred.
Investment Transactions and Income – Investment transactions are recorded on the trade date. Interest income is recorded on the accrual basis. All premium and discount is amortized or accreted for financial statement purposes in accordance with U.S. generally accepted accounting principles. Interest payments received in additional securities are recorded on the ex-interest date in an amount equal to the value of the security on such date.
The fund may receive proceeds from litigation settlements. Any proceeds received from litigation involving portfolio holdings are reflected in the Statement of Operations in realized gain/loss if the security has been disposed of by the fund or in unrealized gain/loss if the security is still held by the fund. Any other proceeds from litigation not related to portfolio holdings are reflected as other income in the Statement of Operations.
The fund invests a significant portion of its assets in asset-backed and/or mortgage-backed securities. For these securities, the value of the debt instrument also depends on the credit quality and adequacy of the underlying assets or collateral as well as whether there is a security interest in the underlying assets or collateral. Enforcing rights, if any, against the underlying assets or collateral may
14
MFS Government Securities Portfolio
Notes to Financial Statements (unaudited) – continued
be difficult. U.S. Government securities not supported as to the payment of principal or interest by the U.S. Treasury, such as those issued by Fannie Mae, Freddie Mac, and the Federal Home Loan Banks, are subject to greater credit risk than are U.S. Government securities supported by the U.S. Treasury, such as those issued by Ginnie Mae.
The fund purchased or sold debt securities on a when-issued or delayed delivery basis, or in a “To Be Announced” (TBA) or “forward commitment” transaction with delivery or payment to occur at a later date beyond the normal settlement period. At the time a fund enters into a commitment to purchase or sell a security, the transaction is recorded and the value of the security acquired is reflected in the fund’s net asset value. The price of such security and the date that the security will be delivered and paid for are fixed at the time the transaction is negotiated. The value of the security may vary with market fluctuations. No interest accrues to the fund until payment takes place. At the time that a fund enters into this type of transaction, the fund is required to have sufficient cash and/or liquid securities to cover its commitments. Losses may arise due to changes in the value of the underlying securities or if the counterparty does not perform under the contract’s terms, or if the issuer does not issue the securities due to political, economic or other factors. Additionally, losses may arise due to declines in the value of the securities prior to settlement date.
To mitigate this risk of loss on TBA securities and other types of forward settling mortgage-backed securities, the fund whenever possible enters into a Master Securities Forward Transaction Agreement (“MSFTA”) on a bilateral basis with each of the counterparties with whom it undertakes a significant volume of transactions. The MSFTA gives each party to the agreement the right to terminate all transactions traded under such agreement if there is a specified deterioration in the credit quality of the other party. Upon an event of default or a termination of the MSFTA, the non-defaulting party has the right to close out all transactions traded under such agreement and to net amounts owed under each transaction to one net amount payable by one party to the other. This right to close out and net payments across all transactions traded under the MSFTA could result in a reduction of the fund’s credit risk to such counterparty equal to any amounts payable by the fund under the applicable transactions, if any.
For mortgage-backed securities traded under a MSFTA, the collateral and margining requirements are contract specific. Collateral amounts across all transactions traded under such agreement are netted and one amount is posted from one party to the other to collateralize such obligations. Cash that has been pledged to cover the fund’s collateral or margin obligations under a MSFTA, if any, will be reported separately on the Statement of Assets and Liabilities as restricted cash. Securities pledged as collateral or margin for the same purpose, if any, are noted in the Portfolio of Investments.
Tax Matters and Distributions – The fund intends to qualify as a regulated investment company, as defined under Subchapter M of the Internal Revenue Code, and to distribute all of its taxable income, including realized capital gains. As a result, no provision for federal income tax is required. The fund’s federal tax returns, when filed, will remain subject to examination by the Internal Revenue Service for a three year period. Management has analyzed the fund’s tax positions taken on federal and state tax returns for all open tax years and does not believe that there are any uncertain tax positions that require recognition of a tax liability. Foreign taxes, if any, have been accrued by the fund in the accompanying financial statements in accordance with the applicable foreign tax law. Foreign income taxes may be withheld by certain countries in which the fund invests. Additionally, capital gains realized by the fund on securities issued in or by certain foreign countries may be subject to capital gains tax imposed by those countries.
Distributions to shareholders are recorded on the ex-dividend date. Income and capital gain distributions are determined in accordance with income tax regulations, which may differ from U.S. generally accepted accounting principles. Certain capital accounts in the financial statements are periodically adjusted for permanent differences in order to reflect their tax character. These adjustments have no impact on net assets or net asset value per share. Temporary differences which arise from recognizing certain items of income, expense, gain or loss in different periods for financial statement and tax purposes will reverse at some time in the future. Distributions in excess of net investment income or net realized gains are temporary overdistributions for financial statement purposes resulting from differences in the recognition or classification of income or distributions for financial statement and tax purposes.
Book/tax differences primarily relate to amortization and accretion of debt securities and wash sale loss deferrals.
The tax character of distributions declared to shareholders for the last fiscal year is as follows:
| | | | |
| | | Year ended
12/31/17 | |
| Ordinary income (including any short-term capital gains) | | | $17,852,246 | |
15
MFS Government Securities Portfolio
Notes to Financial Statements (unaudited) – continued
The federal tax cost and the tax basis components of distributable earnings were as follows:
| | | | |
| As of 6/30/18 | | | | |
| Cost of investments | | | $547,987,800 | |
| Gross appreciation | | | $0 | |
| Gross depreciation | | | (23,426,476 | ) |
| Net unrealized appreciation (depreciation) | | | $(23,426,476 | ) |
| |
| As of 12/31/17 | | | | |
| Undistributed ordinary income | | | 16,539,111 | |
| Capital loss carryforwards | | | (15,440,020 | ) |
| Net unrealized appreciation (depreciation) | | | (5,021,921 | ) |
The aggregate cost above includes prior fiscal year end tax adjustments, if applicable.
As of December 31, 2017, the fund had capital loss carryforwards available to offset future realized gains. These net capital losses may be carried forward indefinitely and their character is retained as short-term and/or long-term losses. Such losses are characterized as follows:
| | | | |
| Short-Term | | | $(6,064,787 | ) |
| Long-Term | | | (9,375,233 | ) |
| Total | | | $(15,440,020 | ) |
Multiple Classes of Shares of Beneficial Interest – The fund offers multiple classes of shares, which differ in their respective distribution and/or service fees. The fund’s income, realized and unrealized gain (loss), and common expenses are allocated to shareholders based on the daily net assets of each class. Dividends are declared separately for each class. Differences in per share dividend rates are generally due to differences in separate class expenses.
| | | | | | | | |
| | | From net investment
income | |
| | | Six months ended
6/30/18 | | | Year ended
12/31/17 | |
| Initial Class | | | $— | | | | $11,609,362 | |
| Service Class | | | — | | | | 6,242,884 | |
| Total | | | $— | | | | $17,852,246 | |
| (3) | | Transactions with Affiliates |
Investment Adviser – The fund has an investment advisory agreement with MFS to provide overall investment management and related administrative services and facilities to the fund. The management fee is computed daily and paid monthly at the following annual rates based on the fund’s average daily net assets:
| | | | |
| Up to $1 billion | | | 0.55% | |
| In excess of $1 billion | | | 0.50% | |
MFS has agreed in writing to reduce its management fee by a specified amount if certain MFS mutual fund assets exceed thresholds agreed to by MFS and the fund’s Board of Trustees. For the six months ended June 30, 2018, this management fee reduction amounted to $25,230, which is included in the reduction of total expenses in the Statement of Operations. The management fee incurred for the six months ended June 30, 2018 was equivalent to an annual effective rate of 0.54% of the fund’s average daily net assets.
The investment adviser has agreed in writing to pay a portion of the fund’s total annual operating expenses, excluding interest, taxes, extraordinary expenses, brokerage and transaction costs, and investment-related expenses, such that total annual operating expenses do not exceed 0.61% of average daily net assets for the Initial Class shares and 0.86% of average daily net assets for the Service Class shares. This written agreement will terminate on July 31, 2018. For the six months ended June 30, 2018, the fund’s actual operating expenses did not exceed the limit and therefore, the investment adviser did not pay any portion of the fund’s expenses related to this agreement.
Effective August 1, 2018, the investment adviser has agreed in writing to pay a portion of the fund’s total annual operating expenses, excluding interest, taxes, extraordinary expenses, brokerage and transaction costs, and investment-related expenses, such that total annual operating expenses do not exceed 0.58% of average daily net assets for the Initial Class shares and 0.83% of average daily net assets for the Service Class shares. This written agreement will continue until modified by the fund’s Board of Trustees, but such agreement will continue at least until April 30, 2020.
16
MFS Government Securities Portfolio
Notes to Financial Statements (unaudited) – continued
Distributor – MFS Fund Distributors, Inc. (MFD), a wholly-owned subsidiary of MFS, is the distributor of shares of the fund. The Trustees have adopted a distribution plan for the Service Class shares pursuant to Rule 12b-1 under the Investment Company Act of 1940.
The fund’s distribution plan provides that the fund will pay MFD distribution and/or service fees equal to 0.25% per annum of its average daily net assets attributable to Service Class shares as partial consideration for services performed and expenses incurred by MFD and financial intermediaries (including participating insurance companies that invest in the fund to fund variable annuity and variable life insurance contracts, sponsors of qualified retirement and pension plans that invest in the fund, and affiliates of these participating insurance companies and plan sponsors) in connection with the sale and distribution of the Service Class shares. MFD may subsequently pay all, or a portion, of the distribution and/or service fees to financial intermediaries.
Shareholder Servicing Agent – MFS Service Center, Inc. (MFSC), a wholly-owned subsidiary of MFS, receives a fee from the fund for its services as shareholder servicing agent. For the six months ended June 30, 2018, the fee was $4,285, which equated to 0.0016% annually of the fund’s average daily net assets. MFSC also receives payment from the fund for out-of-pocket expenses paid by MFSC on behalf of the fund. For the six months ended June 30, 2018, these costs amounted to $92.
Administrator – MFS provides certain financial, legal, shareholder communications, compliance, and other administrative services to the fund. Under an administrative services agreement, the fund reimburses MFS the costs incurred to provide these services. The fund is charged an annual fixed amount of $17,500 plus a fee based on average daily net assets. The administrative services fee incurred for the six months ended June 30, 2018 was equivalent to an annual effective rate of 0.0168% of the fund’s average daily net assets.
Trustees’ and Officers’ Compensation – The fund pays compensation to independent Trustees in the form of a retainer, attendance fees, and additional compensation to Board and Committee chairpersons. The fund does not pay compensation directly to Trustees or officers of the fund who are also officers of the investment adviser, all of whom receive remuneration for their services to the fund from MFS. Certain officers and Trustees of the fund are officers or directors of MFS, MFD, and MFSC.
Other – This fund and certain other funds managed by MFS (the funds) have entered into a service agreement (the ISO Agreement) which provides for payment of fees solely by the funds to Tarantino LLC in return for the provision of services of an Independent Senior Officer (ISO) for the funds. Frank L. Tarantino serves as the ISO and is an officer of the funds and the sole member of Tarantino LLC. The funds can terminate the ISO Agreement with Tarantino LLC at any time under the terms of the ISO Agreement. For the six months ended June 30, 2018, the fee paid by the fund under this agreement was $483 and is included in “Miscellaneous” expense in the Statement of Operations. MFS has agreed to bear all expenses associated with office space, other administrative support, and supplies provided to the ISO.
The fund invests in the MFS Institutional Money Market Portfolio which is managed by MFS and seeks current income consistent with preservation of capital and liquidity. This money market fund does not pay a management fee to MFS.
For the six months ended June 30, 2018, purchases and sales of investments, other than short-term obligations, were as follows:
| | | | | | | | |
| | | Purchases | | | Sales | |
| U.S. Government securities | | | $47,394,134 | | | | $46,827,515 | |
| Non-U.S. Government securities | | | $24,384,691 | | | | $24,254,139 | |
| (5) | | Shares of Beneficial Interest |
The fund’s Declaration of Trust permits the Trustees to issue an unlimited number of full and fractional shares of beneficial interest. Transactions in fund shares were as follows:
| | | | | | | | | | | | | | | | |
| | | Six months ended 6/30/18 | | | Year ended 12/31/17 | |
| | | Shares | | | Amount | | | Shares | | | Amount | |
| Shares sold | | | | | | | | | | | | | | | | |
Initial Class | | | 241,360 | | | | $2,940,742 | | | | 808,666 | | | | $10,123,347 | |
Service Class | | | 483,245 | | | | 5,836,154 | | | | 1,401,695 | | | | 17,378,499 | |
| | | 724,605 | | | | $8,776,896 | | | | 2,210,361 | | | | $27,501,846 | |
| Shares issued to shareholders in reinvestment of distributions | | | | | | | | | | | | | | | | |
Initial Class | | | — | | | | $— | | | | 933,228 | | | | $11,609,362 | |
Service Class | | | — | | | | — | | | | 504,679 | | | | 6,242,884 | |
| | | — | | | | $— | | | | 1,437,907 | | | | $17,852,246 | |
| Shares reacquired | | | | | | | | | | | | | | | | |
Initial Class | | | (2,240,894 | ) | | | $(27,344,863 | ) | | | (3,378,602 | ) | | | $(42,475,081 | ) |
Service Class | | | (1,717,821 | ) | | | (20,814,491 | ) | | | (3,738,170 | ) | | | (46,676,673 | ) |
| | | (3,958,715 | ) | | | $(48,159,354 | ) | | | (7,116,772 | ) | | | $(89,151,754 | ) |
17
MFS Government Securities Portfolio
Notes to Financial Statements (unaudited) – continued
| | | | | | | | | | | | | | | | |
| | | Six months ended 6/30/18 | | | Year ended 12/31/17 | |
| | | Shares | | | Amount | | | Shares | | | Amount | |
| Net change | | | | | | | | | | | | | | | | |
Initial Class | | | (1,999,534 | ) | | | $(24,404,121 | ) | | | (1,636,708 | ) | | | $(20,742,372 | ) |
Service Class | | | (1,234,576 | ) | | | (14,978,337 | ) | | | (1,831,796 | ) | | | (23,055,290 | ) |
| | | (3,234,110 | ) | | | $(39,382,458 | ) | | | (3,468,504 | ) | | | $(43,797,662 | ) |
The fund is one of several mutual funds in which certain MFS funds may invest. The MFS funds do not invest in the underlying funds for the purpose of exercising management or control. At the end of the period, the MFS Moderate Allocation Portfolio and the MFS Conservative Allocation Portfolio were the owners of record of approximately 29% and 10%, respectively, of the value of outstanding voting shares of the fund.
The fund and certain other funds managed by MFS participate in a $1.25 billion unsecured committed line of credit, subject to a $1 billion sublimit, provided by a syndication of banks under a credit agreement. Borrowings may be made for temporary financing needs. Interest is charged to each fund, based on its borrowings, generally at a rate equal to the higher of the Overnight Bank Funding rate or daily one month LIBOR plus an agreed upon spread. A commitment fee, based on the average daily, unused portion of the committed line of credit, is allocated among the participating funds. In addition, the fund and other funds managed by MFS have established unsecured uncommitted borrowing arrangements with certain banks for temporary financing needs. Interest is charged to each fund, based on its borrowings, at a rate equal to the Overnight Bank Funding rate plus an agreed upon spread. For the six months ended June 30, 2018, the fund’s commitment fee and interest expense were $1,969 and $0, respectively, and are included in “Miscellaneous” expense in the Statement of Operations.
| (7) | | Investments in Affiliated Issuers |
An affiliated issuer may be considered one in which the fund owns 5% or more of the outstanding voting securities, or a company which is under common control. For the purposes of this report, the fund assumes the following to be affiliated issuers:
| | | | | | | | | | | | | | | | | | |
| Affiliated Issuers | | | | Beginning
Shares/Par
Amount | | | Acquisitions
Shares/Par
Amount | | | Dispositions
Shares/Par
Amount | | | Ending
Shares/Par
Amount | |
| MFS Institutional Money Market Portfolio | | | | | 36,877,651 | | | | 60,989,074 | | | | (97,165,805 | ) | | | 700,920 | |
| | | | | |
| Affiliated Issuers | | Realized
Gain (Loss) | | Change in
Unrealized
Appreciation/
Depreciation | | | Capital Gain
Distributions | | | Dividend
Income | | | Ending
Value | |
| MFS Institutional Money Market Portfolio | | $(727) | | | $397 | | | | $— | | | | $86,707 | | | | $700,920 | |
18
MFS Government Securities Portfolio
PROXY VOTING POLICIES AND INFORMATION
MFS votes proxies on behalf of the fund pursuant to proxy voting policies and procedures that are available without charge, upon request, by calling 1-800-225-2606, by visiting mfs.com/proxyvoting, or by visiting the SEC’s Web site at http://www.sec.gov.
Information regarding how the fund voted proxies relating to portfolio securities during the most recent twelve-month period ended June 30 is available by August 31 of each year without charge by visiting mfs.com/proxyvoting, or by visiting the SEC’s Web site at http://www.sec.gov.
QUARTERLY PORTFOLIO DISCLOSURE
The fund will file a complete schedule of portfolio holdings with the Securities and Exchange Commission (the Commission) for the first and third quarters of each fiscal year on Form N-Q. The fund’s Form N-Q is available on the EDGAR database on the Commission’s Internet Web site at http://www.sec.gov, and may be reviewed and copied at the:
Public Reference Room
Securities and Exchange Commission
100 F Street, NE, Room 1580
Washington, D.C. 20549
Information on the operation of the Public Reference Room may be obtained by calling the Commission at 1-800-SEC-0330. Copies of the fund’s Form N-Q also may be obtained, upon payment of a duplicating fee, by electronic request at the following e-mail address: publicinfo@sec.gov or by writing the Public Reference Section at the above address.
FURTHER INFORMATION
From time to time, MFS may post important information about the fund or the MFS funds on the MFS web site (mfs.com). This information is available at https://www.mfs.com/en-us/what-we-do/announcements.html or at mfs.com/vit2 by choosing the fund’s name.
INFORMATION ABOUT FUND CONTRACTS AND LEGAL CLAIMS
The fund has entered into contractual arrangements with an investment adviser, administrator, distributor, shareholder servicing agent, 529 program manager (if applicable), and custodian who each provide services to the fund. Unless expressly stated otherwise, shareholders are not parties to, or intended beneficiaries of these contractual arrangements, and these contractual arrangements are not intended to create any shareholder right to enforce them against the service providers or to seek any remedy under them against the service providers, either directly or on behalf of the fund.
Under the Trust’s By-Laws and Declaration of Trust, any claims asserted against or on behalf of the MFS Funds, including claims against Trustees and Officers, must be brought in state and federal courts located within the Commonwealth of Massachusetts.
19
Semiannual Report
June 30, 2018

MFS® High Yield Portfolio

MFS® Variable Insurance Trust II
HYS-SEM
MFS® High Yield Portfolio
CONTENTS
The report is prepared for the general information of contract owners. It is authorized for distribution to prospective investors only when preceded or accompanied by a current prospectus.
NOT FDIC INSURED • MAY LOSE VALUE • NO BANK OR CREDIT UNION GUARANTEE • NOT A DEPOSIT • NOT INSURED BY ANY FEDERAL GOVERNMENT AGENCY OR NCUA/NCUSIF
MFS High Yield Portfolio
LETTER FROM THE EXECUTIVE CHAIRMAN

Dear Contract Owners:
Rising bond yields, international trade friction and geopolitical uncertainty have contributed to a measurable uptick in market volatility — a departure from the low-volatility environment that prevailed for much of 2017. In recent months, against this more challenging backdrop, global markets have given back some of the strong gains recorded during 2017 and early 2018. But global economic growth remains healthy, notwithstanding signs of a modest slowdown over the past few months, particularly in Europe and China.
Although the U.S. Federal Reserve continues to gradually raise interest rates and shrink its balance sheet, monetary policy remains accommodative around the world, with many central banks taking only tentative steps toward tighter policies. Newly enacted U.S. tax reforms have been welcomed by equity markets, while emerging market economies have recently had to contend with tighter financial conditions as a result of firmer U.S. Treasury yields and a stronger dollar. Around the world, inflation remains largely subdued, but tight labor markets and solid global demand have investors on the lookout for its potential resurgence. Increased U.S. protectionism is also a growing concern, as investors fear that trade disputes could dampen business sentiment, leading to slower global growth.
As a global investment manager, MFS® strives to create long-term value for clients through an active approach and an investment platform built on nearly a century of expertise. To make that long-term value meaningful for clients, we work to align with you on our beliefs, your needs and the time it takes to deliver on your desired outcomes.
Respectfully,

Robert J. Manning
Executive Chairman
MFS Investment Management
August 16, 2018
The opinions expressed in this letter are subject to change and may not be relied upon for investment advice. No forecasts can be guaranteed.
1
MFS High Yield Portfolio
PORTFOLIO COMPOSITION
Portfolio structure (i)
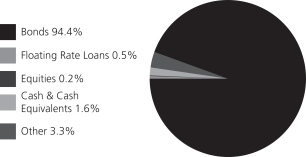
| | | | |
| Top five industries (i) | | | | |
| Cable TV | | | 8.0% | |
| Energy-Independent | | | 6.2% | |
| Medical & Health Technology & Services | | | 6.0% | |
| Metals & Mining | | | 5.0% | |
| Midstream | | | 5.0% | |
| | | | |
| Composition including fixed income credit quality (a)(i) | |
| BBB | | | 1.3% | |
| BB | | | 47.3% | |
| B | | | 39.9% | |
| CCC | | | 8.8% | |
| CC | | | 0.3% | |
| C (o) | | | 0.0% | |
| Not Rated | | | (2.7)% | �� |
| Non-Fixed Income | | | 0.2% | |
| Cash & Cash Equivalents | | | 1.6% | |
| Other | | | 3.3% | |
| |
| Portfolio facts (i) | | | | |
| Average Duration (d) | | | 4.2 | |
| Average Effective Maturity (m) | | | 6.8 yrs. | |
| (a) | | For all securities other than those specifically described below, ratings are assigned to underlying securities utilizing ratings from Moody’s, Fitch, and Standard & Poor’s rating agencies and applying the following hierarchy: If all three agencies provide a rating, the middle rating (after dropping the highest and lowest ratings) is assigned; if two of the three agencies rate a security, the lower of the two is assigned. Ratings are shown in the S&P and Fitch scale (e.g., AAA). Securities rated BBB or higher are considered investment grade. All ratings are subject to change. Not Rated includes fixed income securities and fixed income derivatives, which have not been rated by any rating agency. Non-Fixed Income includes any equity securities (including convertible bonds and equity derivatives) and/or commodity-linked derivatives. The fund may or may not have held all of these instruments on this date. The fund is not rated by these agencies. |
| (d) | | Duration is a measure of how much a bond’s price is likely to fluctuate with general changes in interest rates, e.g., if rates rise 1.00%, a bond with a 5-year duration is likely to lose about 5.00% of its value due to the interest rate move. |
| (i) | | For purposes of this presentation, the components include the value of securities, and reflect the impact of the equivalent exposure of derivative positions, if any. These amounts may be negative from time to time. Equivalent exposure is a calculated amount that translates the derivative position into a reasonable approximation of the amount of the underlying asset that the portfolio would have to hold at a given point in time to have the same price sensitivity that results from the portfolio’s ownership of the derivative contract. When dealing with derivatives, equivalent exposure is a more representative measure of the potential impact of a position on portfolio performance than value. The bond component will include any accrued interest amounts. |
| (m) | | In determining each instrument’s effective maturity for purposes of calculating the fund’s dollar-weighted average effective maturity, MFS uses the instrument’s stated maturity or, if applicable, an earlier date on which MFS believes it is probable that a maturity-shortening device (such as a put, pre-refunding or prepayment) will cause the instrument to be repaid. Such an earlier date can be substantially shorter than the instrument’s stated maturity. |
Where the fund holds convertible bonds, they are treated as part of the equity portion of the portfolio.
Cash & Cash Equivalents includes any cash, investments in money market funds, short-term securities, and other assets less liabilities. Please see the Statement of Assets and Liabilities for additional information related to the fund’s cash position and other assets and liabilities.
Other includes equivalent exposure from currency derivatives and/or any offsets to derivative positions.
Percentages are based on net assets as of June 30, 2018.
The portfolio is actively managed and current holdings may be different.
2
MFS High Yield Portfolio
EXPENSE TABLE
Fund Expenses Borne by the Contract Holders during the Period,
January 1, 2018 through June 30, 2018
As a contract holder of the fund, you incur ongoing costs, including management fees; distribution and/or service (12b-1) fees; and other fund expenses. This example is intended to help you understand your ongoing costs (in dollars) of investing in the fund and to compare these costs with the ongoing costs of investing in other mutual funds.
The example is based on an investment of $1,000 invested at the beginning of the period and held for the entire period January 1, 2018 through June 30, 2018.
Actual Expenses
The first line for each share class in the following table provides information about actual account values and actual expenses. You may use the information in this line, together with the amount you invested, to estimate the expenses that you paid over the period. Simply divide your account value by $1,000 (for example, an $8,600 account value divided by $1,000 = 8.6), then multiply the result by the number in the first line under the heading entitled “Expenses Paid During Period” to estimate the expenses you paid on your account during this period.
Hypothetical Example for Comparison Purposes
The second line for each share class in the following table provides information about hypothetical account values and hypothetical expenses based on the fund’s actual expense ratio and an assumed rate of return of 5% per year before expenses, which is not the fund’s actual return. The hypothetical account values and expenses may not be used to estimate the actual ending account balance or expenses you paid for the period. You may use this information to compare the ongoing costs of investing in the fund and other funds. To do so, compare this 5% hypothetical example with the 5% hypothetical examples that appear in the shareholder reports of the other funds.
Please note that the expenses shown in the table are meant to highlight the fund’s ongoing costs only and do not take into account the fees and expenses imposed under the variable contracts through which your investment in the fund is made. Therefore, the second line for each share class in the table is useful in comparing ongoing costs associated with an investment in vehicles (such as the fund) which fund benefits under variable annuity and variable life insurance contracts and to qualified pension and retirement plans only, and will not help you determine the relative total costs of investing in the fund through variable annuity and variable life insurance contracts. If the fees and expenses imposed under the variable contracts were included, your costs would have been higher.
| | | | | | | | | | | | | | | | | | |
| Share Class | | | | Annualized
Expense Ratio | | | Beginning
Account Value
1/01/18 | | | Ending Account Value
6/30/18 | | | Expenses Paid
During Period (p)
1/01/18-6/30/18 | |
| Initial Class | | Actual | | | 0.72% | | | | $1,000.00 | | | | $987.87 | | | | $3.55 | |
| | Hypothetical (h) | | | 0.72% | | | | $1,000.00 | | | | $1,021.22 | | | | $3.61 | |
| Service Class | | Actual | | | 0.97% | | | | $1,000.00 | | | | $987.72 | | | | $4.78 | |
| | Hypothetical (h) | | | 0.97% | | | | $1,000.00 | | | | $1,019.98 | | | | $4.86 | |
| (h) | 5% class return per year before expenses. |
| (p) | “Expenses Paid During Period” are equal to each class’s annualized expense ratio, as shown above, multiplied by the average account value over the period, multiplied by 181/365 (to reflect the one-half year period). |
3
MFS High Yield Portfolio
PORTFOLIO OF INVESTMENTS – 6/30/18 (unaudited)
The Portfolio of Investments is a complete list of all securities owned by your fund. It is categorized by broad-based asset classes.
| | | | | | | | |
| Issuer | | Shares/Par | | | Value ($) | |
| BONDS – 96.2% | | | | | | | | |
| Aerospace – 1.8% | |
| Dae Funding LLC, 5%, 8/01/2024 (n) | | $ | 2,415,000 | | | $ | 2,319,607 | |
| KLX, Inc., 5.875%, 12/01/2022 (n) | | | 2,140,000 | | | | 2,222,925 | |
| Transdigm Holdings UK PLC, 6.875%, 5/15/2026 (n) | | | 440,000 | | | | 446,050 | |
| TransDigm, Inc., 6.5%, 7/15/2024 | | | 1,155,000 | | | | 1,175,213 | |
| TransDigm, Inc., 6.375%, 6/15/2026 | | | 1,160,000 | | | | 1,151,300 | |
| | | | | | | | |
| | | | | | $ | 7,315,095 | |
| | | | | | | | |
| Asset-Backed & Securitized – 0.0% | | | | | |
| CWCapital Cobalt Ltd., CDO, “F”, FLR, 3.66%, (0% cash or 3.66% PIK), (LIBOR - 3 mo. + 1.3%), 4/26/2050 (a)(p)(z) | | $ | 1,168,400 | | | $ | 117 | |
| | | | | | | | |
| Automotive – 1.3% | |
| Allison Transmission, Inc., 5%, 10/01/2024 (n) | | $ | 3,009,000 | | | $ | 2,960,104 | |
IHO Verwaltungs GmbH, 4.75%, (4.75% cash or
5.5% PIK) 9/15/2026 (n) | | | 1,945,000 | | | | 1,830,731 | |
| Jaguar Land Rover PLC, 4.5%, 10/01/2027 (n) | | | 575,000 | | | | 513,187 | |
| | | | | | | | |
| | | | | | $ | 5,304,022 | |
| | | | | | | | |
| Broadcasting – 3.1% | |
| Liberty Media Corp. - Liberty Formula One, 8.5%, 7/15/2029 | | $ | 1,535,000 | | | $ | 1,650,125 | |
| Liberty Media Corp. - Liberty Formula One, 8.25%, 2/01/2030 | | | 530,000 | | | | 562,145 | |
| Match Group, Inc., 6.375%, 6/01/2024 | | | 1,825,000 | | | | 1,920,813 | |
| Meredith Corp., 6.875%, 2/01/2026 (n) | | | 1,225,000 | | | | 1,208,156 | |
| Netflix, Inc., 5.875%, 2/15/2025 | | | 1,475,000 | | | | 1,513,040 | |
| Netflix, Inc., 3.625%, 5/15/2027 | | EUR | 800,000 | | | | 915,555 | |
| Netflix, Inc., 4.875%, 4/15/2028 (n) | | $ | 450,000 | | | | 428,927 | |
| Netflix, Inc., 5.875%, 11/15/2028 (n) | | | 1,975,000 | | | | 1,994,157 | |
| WMG Acquisition Corp., 5%, 8/01/2023 (n) | | | 525,000 | | | | 522,375 | |
| WMG Acquisition Corp., 4.875%, 11/01/2024 (n) | | | 1,595,000 | | | | 1,555,125 | |
| WMG Acquisition Corp., 5.5%, 4/15/2026 (n) | | | 300,000 | | | | 297,375 | |
| | | | | | | | |
| | | | | | $ | 12,567,793 | |
| | | | | | | | |
| Building – 4.3% | |
| ABC Supply Co., Inc., 5.75%, 12/15/2023 (n) | | $ | 2,080,000 | | | $ | 2,132,000 | |
| ABC Supply Co., Inc., 5.875%, 5/15/2026 (n) | | | 1,500,000 | | | | 1,475,625 | |
| Beacon Escrow Corp., 4.875%, 11/01/2025 (n) | | | 1,410,000 | | | | 1,296,354 | |
| Beacon Roofing Supply, Inc., 6.375%, 10/01/2023 | | | 485,000 | | | | 500,763 | |
| Gibraltar Industries, Inc., 6.25%, 2/01/2021 | | | 1,515,000 | | | | 1,522,575 | |
| | | | | | | | |
| Issuer | | Shares/Par | | | Value ($) | |
| BONDS – continued | | | | | | | | |
| Building – continued | | | | | | | | |
| James Hardie International Finance | | | | | | | | |
| Ltd., 4.75%, 1/15/2025 (n) | | $ | 310,000 | | | $ | 302,250 | |
| James Hardie International Finance Ltd., 5%, 1/15/2028 (n) | | | 1,420,000 | | | | 1,341,900 | |
| New Enterprise Stone & Lime Co, Inc., 10.125%, 4/01/2022 (n) | | | 1,710,000 | | | | 1,816,875 | |
| New Enterprise Stone & Lime Co., Inc., 6.25%, 3/15/2026 (n) | | | 997,000 | | | | 1,006,970 | |
| PriSo Acquisition Corp., 9%, 5/15/2023 (n) | | | 1,375,000 | | | | 1,433,437 | |
Standard Industries, Inc.,
5.375%, 11/15/2024 (n) | | | 1,730,000 | | | | 1,708,375 | |
Standard Industries, Inc.,
6%, 10/15/2025 (n) | | | 1,265,000 | | | | 1,268,162 | |
| Summit Materials LLC/Summit Materials Finance Co., 6.125%, 7/15/2023 | | | 1,840,000 | | | | 1,867,600 | |
| | | | | | | | |
| | | | | | $ | 17,672,886 | |
| | | | | | | | |
| Business Services – 4.2% | |
Alliance Data Systems Corp.,
5.875%, 11/01/2021 (n) | | $ | 1,540,000 | | | $ | 1,570,800 | |
Alliance Data Systems Corp.,
5.375%, 8/01/2022 (n) | | | 765,000 | | | | 768,729 | |
Ascend Learning LLC,
6.875%, 8/01/2025 (n) | | | 1,270,000 | | | | 1,281,113 | |
| CDK Global, Inc., 4.875%, 6/01/2027 | | | 2,585,000 | | | | 2,478,369 | |
| Equinix, Inc., 5.375%, 4/01/2023 | | | 1,145,000 | | | | 1,172,051 | |
| Equinix, Inc., 5.75%, 1/01/2025 | | | 1,000,000 | | | | 1,007,200 | |
| Equinix, Inc., 5.875%, 1/15/2026 | | | 1,045,000 | | | | 1,058,585 | |
| First Data Corp., 5%, 1/15/2024 (n) | | | 3,085,000 | | | | 3,061,862 | |
| MSCI, Inc., 4.75%, 8/01/2026 (n) | | | 1,615,000 | | | | 1,562,513 | |
Travelport Worldwide Ltd.,
6%, 3/15/2026 (n) | | | 1,605,000 | | | | 1,617,037 | |
Vantiv LLC/Vantiv Issuer Corp,
4.375%, 11/15/2025 (n) | | | 1,695,000 | | | | 1,617,403 | |
| | | | | | | | |
| | | | | | $ | 17,195,662 | |
| | | | | | | | |
| Cable TV – 7.8% | |
Altice Financing S.A.,
6.625%, 2/15/2023 (n) | | $ | 1,695,000 | | | $ | 1,670,422 | |
| Altice Financing S.A., 7.5%, 5/15/2026 (n) | | | 640,000 | | | | 619,008 | |
Altice U.S. Finance I Corp.,
5.5%, 5/15/2026 (n) | | | 1,340,000 | | | | 1,293,100 | |
| CCO Holdings LLC/CCO Holdings Capital Corp., 5.75%, 1/15/2024 | | | 2,750,000 | | | | 2,756,875 | |
| CCO Holdings LLC/CCO Holdings Capital Corp., 5.375%, 5/01/2025 (n) | | | 815,000 | | | | 788,513 | |
| CCO Holdings LLC/CCO Holdings Capital Corp., 5.75%, 2/15/2026 (n) | | | 3,185,000 | | | | 3,129,262 | |
| CCO Holdings LLC/CCO Holdings Capital Corp., 5.875%, 5/01/2027 (n) | | | 1,150,000 | | | | 1,122,687 | |
| Cequel Communications Holdings I LLC/ Cequel Capital Corp., 7.5%, 4/01/2028 (z) | | | 875,000 | | | | 885,675 | |
| CSC Holdings LLC, 5.5%, 4/15/2027 (n) | | | 2,585,000 | | | | 2,468,675 | |
| DISH DBS Corp., 5%, 3/15/2023 | | | 560,000 | | | | 485,800 | |
4
MFS High Yield Portfolio
Portfolio of Investments (unaudited) – continued
| | | | | | | | |
| Issuer | | Shares/Par | | | Value ($) | |
| | | | | | | | |
| BONDS – continued | | | | | | | | |
| Cable TV – continued | |
| DISH DBS Corp., 5.875%, 11/15/2024 | | $ | 750,000 | | | $ | 634,688 | |
Intelsat Jackson Holdings S.A.,
5.5%, 8/01/2023 | | | 1,605,000 | | | | 1,440,006 | |
| Lynx II Corp., 6.375%, 4/15/2023 (n) | | | 735,000 | | | | 735,000 | |
Sirius XM Radio, Inc.,
4.625%, 5/15/2023 (n) | | | 770,000 | | | | 750,750 | |
Sirius XM Radio, Inc.,
6%, 7/15/2024 (n) | | | 1,605,000 | | | | 1,635,094 | |
Sirius XM Radio, Inc.,
5.375%, 4/15/2025 (n) | | | 950,000 | | | | 936,938 | |
Telenet Finance Luxembourg S.A.,
5.5%, 3/01/2028 (n) | | | 2,200,000 | | | | 2,002,000 | |
| Unitymedia KabelBW GmbH, 6.125%, 1/15/2025 (n) | | | 1,865,000 | | | | 1,920,950 | |
| Videotron Ltd., 5.375%, 6/15/2024 (n) | | | 455,000 | | | | 465,806 | |
| Videotron Ltd., 5.125%, 4/15/2027 (n) | | | 2,660,000 | | | | 2,580,732 | |
Virgin Media Finance PLC,
5.75%, 1/15/2025 (n) | | | 200,000 | | | | 187,500 | |
Virgin Media Secured Finance PLC,
5.25%, 1/15/2026 (n) | | | 1,655,000 | | | | 1,530,875 | |
Ziggo Bond Finance B.V.,
5.875%, 1/15/2025 (n) | | | 2,080,000 | | | | 1,943,531 | |
| | | | | | | | |
| | | | | | $ | 31,983,887 | |
| | | | | | | | |
| Chemicals – 2.3% | | | | | |
Axalta Coating Systems Co.,
4.875%, 8/15/2024 (n) | | $ | 2,225,000 | | | $ | 2,208,312 | |
| Consolidated Energy Finance S.A., 6.875%, 6/15/2025 (n) | | | 1,385,000 | | | | 1,421,356 | |
| OCI N.V., 6.625%, 4/15/2023 (n) | | | 2,065,000 | | | | 2,097,421 | |
| PolyOne Corp., 5.25%, 3/15/2023 | | | 1,565,000 | | | | 1,592,388 | |
| SPCM S.A., 4.875%, 9/15/2025 (n) | | | 2,060,000 | | | | 1,967,300 | |
| | | | | | | | |
| | | | | | $ | 9,286,777 | |
| | | | | | | | |
| Computer Software – 1.0% | | | | | |
| Diamond 1 Finance Corp./Diamond 2 Finance Corp., 5.875%, 6/15/2021 (n) | | $ | 1,485,000 | | | $ | 1,505,229 | |
| Diamond 1 Finance Corp./Diamond 2 | | | | | | | | |
| Finance Corp., 6.02%, 6/15/2026 (n) | | | 935,000 | | | | 982,116 | |
| VeriSign, Inc., 4.625%, 5/01/2023 | | | 745,000 | | | | 749,656 | |
| VeriSign, Inc., 5.25%, 4/01/2025 | | | 525,000 | | | | 531,405 | |
| VeriSign, Inc., 4.75%, 7/15/2027 | | | 502,000 | | | | 479,260 | |
| | | | | | | | |
| | | | | | $ | 4,247,666 | |
| | | | | | | | |
| Computer Software – Systems – 1.6% | | | | | |
CDW LLC/CDW Finance Corp.,
5.5%, 12/01/2024 | | $ | 815,000 | | | $ | 831,300 | |
CDW LLC/CDW Finance Corp.,
5%, 9/01/2025 | | | 510,000 | | | | 501,075 | |
| Fair Isaac Corp., 5.25%, 5/15/2026 (n) | | | 1,730,000 | | | | 1,736,487 | |
JDA Software Group, Inc.,
7.375%, 10/15/2024 (n) | | | 1,415,000 | | | | 1,457,026 | |
| Sabre GLBL, Inc., 5.375%, 4/15/2023 (n) | | | 1,990,000 | | | | 2,009,900 | |
| | | | | | | | |
| | | | | | $ | 6,535,788 | |
| | | | | | | | |
| | | | | | | | |
| Issuer | | Shares/Par | | | Value ($) | |
| BONDS – continued | | | | | | | | |
| Conglomerates – 4.2% | | | | | |
| Amsted Industries Co., 5%, 3/15/2022 (n) | | $ | 2,500,000 | | | $ | 2,503,125 | |
| Apex Tool Group LLC, 9%, 2/15/2023 (n) | | | 1,255,000 | | | | 1,214,213 | |
BWX Technologies, Inc.,
5.375%, 7/15/2026 (n) | | | 1,760,000 | | | | 1,782,000 | |
| EnerSys, 5%, 4/30/2023 (n) | | | 3,100,000 | | | | 3,084,500 | |
| Enpro Industries, Inc., 5.875%, 9/15/2022 | | | 2,035,000 | | | | 2,075,700 | |
| Entegris, Inc., 4.625%, 2/10/2026 (n) | | | 1,890,000 | | | | 1,800,225 | |
| Gates Global LLC, 6%, 7/15/2022 (n) | | | 872,000 | | | | 882,900 | |
| SPX FLOW, Inc., 5.625%, 8/15/2024 (n) | | | 1,945,000 | | | | 1,930,412 | |
| TriMas Corp., 4.875%, 10/15/2025 (n) | | | 2,020,000 | | | | 1,919,000 | |
| | | | | | | | |
| | | | | | $ | 17,192,075 | |
| | | | | | | | |
| Construction – 1.1% | | | | | |
Empresas ICA S.A.B. de C.V.,
8.9%, 2/04/2021 (a)(d) | | $ | 930,000 | | | $ | 127,410 | |
Empresas ICA S.A.B. de C.V.,
8.875%, 5/29/2024 (a)(d)(n) | | | 807,000 | | | | 122,059 | |
Mattamy Group Corp.,
6.5%, 10/01/2025 (n) | | | 1,940,000 | | | | 1,902,286 | |
Toll Brothers Finance Corp.,
4.875%, 11/15/2025 | | | 590,000 | | | | 567,875 | |
Toll Brothers Finance Corp.,
4.35%, 2/15/2028 | | | 1,810,000 | | | | 1,617,688 | |
| | | | | | | | |
| | | | | | $ | 4,337,318 | |
| | | | | | | | |
| Consumer Products – 1.4% | | | | | |
| Coty, Inc., 6.5%, 4/15/2026 (n) | | $ | 1,995,000 | | | $ | 1,913,953 | |
| Energizer Gamma Acquisition, Inc., 6.375%, 7/15/2026 (n) | | | 765,000 | | | | 777,909 | |
| Prestige Brands, Inc., 6.375%, 3/01/2024 (n) | | | 1,240,000 | | | | 1,227,600 | |
| Spectrum Brands, Inc., 5.75%, 7/15/2025 | | | 1,905,000 | | | | 1,881,188 | |
| | | | | | | | |
| | | | | | $ | 5,800,650 | |
| | | | | | | | |
| Consumer Services – 1.9% | | | | | |
Interval Acquisition Corp.,
5.625%, 4/15/2023 | | $ | 1,225,000 | | | $ | 1,234,947 | |
Matthews International Corp.,
5.25%, 12/01/2025 (n) | | | 1,515,000 | | | | 1,450,612 | |
| NVA Holdings, Inc., 6.875%, 4/01/2026 (n) | | | 970,000 | | | | 963,938 | |
Service Corp. International,
4.625%, 12/15/2027 | | | 1,290,000 | | | | 1,218,534 | |
ServiceMaster Co. LLC,
5.125%, 11/15/2024 (n) | | | 1,845,000 | | | | 1,789,650 | |
| West Corp., 8.5%, 10/15/2025 (n) | | | 1,195,000 | | | | 1,090,437 | |
| | | | | | | | |
| | | | | | $ | 7,748,118 | |
| | | | | | | | |
| Containers – 4.4% | | | | | |
| Berry Global Group, Inc., 5.5%, 5/15/2022 | | $ | 2,200,000 | | | $ | 2,219,580 | |
| Berry Global Group, Inc., 6%, 10/15/2022 | | | 500,000 | | | | 514,625 | |
| Crown American LLC, 4.5%, 1/15/2023 | | | 1,477,000 | | | | 1,447,460 | |
| Crown Americas LLC/Crown Americas Capital Corp., 4.75%, 2/01/2026 (n) | | | 775,000 | | | | 736,250 | |
| Crown Americas LLC/Crown Americas Capital Corp. V, 4.25%, 9/30/2026 | | | 1,080,000 | | | | 988,200 | |
| Flex Acquisition Co., Inc., 6.875%, 1/15/2025 (n) | | | 1,475,000 | | | | 1,419,687 | |
5
MFS High Yield Portfolio
Portfolio of Investments (unaudited) – continued
| | | | | | | | |
| Issuer | | Shares/Par | | | Value ($) | |
| BONDS – continued | | | | | �� | | | |
| Containers – continued | | | | | |
| Multi-Color Corp., 6.125%, 12/01/2022 (n) | | $ | 2,124,000 | | | $ | 2,171,790 | |
| Reynolds Group, 5.75%, 10/15/2020 | | | 741,368 | | | | 744,148 | |
| Reynolds Group, 5.125%, 7/15/2023 (n) | | | 1,260,000 | | | | 1,244,250 | |
| Reynolds Group, 7%, 7/15/2024 (n) | | | 1,265,000 | | | | 1,291,881 | |
| Sealed Air Corp., 4.875%, 12/01/2022 (n) | | | 1,950,000 | | | | 1,969,500 | |
| Sealed Air Corp., 5.125%, 12/01/2024 (n) | | | 365,000 | | | | 367,738 | |
| Sealed Air Corp., 5.5%, 9/15/2025 (n) | | | 420,000 | | | | 431,550 | |
| Silgan Holdings, Inc., 4.75%, 3/15/2025 | | | 1,385,000 | | | | 1,315,750 | |
W/S Packaging Group, Inc.,
9%, 4/15/2023 (n) | | | 1,230,000 | | | | 1,245,375 | |
| | | | | | | | |
| | | | | | $ | 18,107,784 | |
| | | | | | | | |
| Electrical Equipment – 0.7% | | | | | |
| CommScope Tech LLC, 5%, 3/15/2027 (n) | | $ | 2,910,000 | | | $ | 2,739,037 | |
| | | | | | | | |
| Electronics – 0.7% | | | | | |
Sensata Technologies B.V.,
5.625%, 11/01/2024 (n) | | $ | 835,000 | | | $ | 866,312 | |
Sensata Technologies B.V.,
5%, 10/01/2025 (n) | | | 2,080,000 | | | | 2,095,600 | |
| | | | | | | | |
| | | | | | $ | 2,961,912 | |
| | | | | | | | |
| Energy – Independent – 6.1% | | | | | |
| Alta Mesa Holdings LP/Alta Mesa Finance Services Corp., 7.875%, 12/15/2024 | | $ | 2,350,000 | | | $ | 2,488,062 | |
| CrownRock LP/CrownRock Finance, Inc., 5.625%, 10/15/2025 (n) | | | 2,035,000 | | | | 1,963,775 | |
Diamondback Energy, Inc.,
5.375%, 5/31/2025 | | | 2,645,000 | | | | 2,645,000 | |
Diamondback Energy, Inc.,
5.375%, 5/31/2025 (n) | | | 775,000 | | | | 773,063 | |
| Gulfport Energy Corp., 6%, 10/15/2024 | | | 1,445,000 | | | | 1,390,813 | |
| Gulfport Energy Corp., 6.375%, 5/15/2025 | | | 730,000 | | | | 709,925 | |
Indigo Natural Resources LLC,
6.875%, 2/15/2026 (n) | | | 1,580,000 | | | | 1,524,700 | |
| Parsley Energy LLC/Parsley Finance Corp., 5.25%, 8/15/2025 (z) | | | 430,000 | | | | 422,475 | |
| Parsley Energy LLC/Parsley Finance Corp., 5.625%, 10/15/2027 (n) | | | 2,560,000 | | | | 2,540,800 | |
| PDC Energy, Inc., 6.125%, 9/15/2024 | | | 2,475,000 | | | | 2,524,500 | |
| QEP Resources, Inc., 5.25%, 5/01/2023 | | | 2,325,000 | | | | 2,272,687 | |
| QEP Resources, Inc., 5.625%, 3/01/2026 | | | 975,000 | | | | 933,563 | |
| Sanchez Energy Corp., 6.125%, 1/15/2023 | | | 1,180,000 | | | | 802,400 | |
Seven Generations Energy,
6.75%, 5/01/2023 (n) | | | 1,230,000 | | | | 1,273,050 | |
| Seven Generations Energy, 5.375%, 9/30/2025 (n) | | | 565,000 | | | | 543,106 | |
| SM Energy Co., 6.75%, 9/15/2026 | | | 2,390,000 | | | | 2,395,975 | |
| | | | | | | | |
| | | | | | $ | 25,203,894 | |
| | | | | | | | |
| Entertainment – 1.9% | | | | | |
| Cedar Fair LP, 5.375%, 6/01/2024 | | $ | 515,000 | | | $ | 520,150 | |
| Cinemark USA, Inc., 5.125%, 12/15/2022 | | | 1,205,000 | | | | 1,215,544 | |
| Cinemark USA, Inc., 4.875%, 6/01/2023 | | | 1,450,000 | | | | 1,420,819 | |
Live Nation Entertainment, Inc.,
5.625%, 3/15/2026 (n) | | | 1,250,000 | | | | 1,240,625 | |
| | | | | | | | |
| Issuer | | Shares/Par | | | Value ($) | |
| BONDS – continued | | | | | | | | |
| Entertainment – continued | | | | | |
Six Flags Entertainment Corp.,
4.875%, 7/31/2024 (n) | | $ | 3,375,000 | | | $ | 3,286,406 | |
| | | | | | | | |
| | | | | | $ | 7,683,544 | |
| | | | | | | | |
| Financial Institutions – 1.3% | | | | | |
| Navient Corp., 7.25%, 1/25/2022 | | $ | 1,065,000 | | | $ | 1,114,256 | |
| Navient Corp., 7.25%, 9/25/2023 | | | 1,560,000 | | | | 1,634,100 | |
Park Aerospace Holdings Ltd.,
5.5%, 2/15/2024 (n) | �� | | 2,710,000 | | | | 2,675,556 | |
| | | | | | | | |
| | | | | | $ | 5,423,912 | |
| | | | | | | | |
| Food & Beverages – 3.5% | | | | | |
| Aramark Services, Inc., 4.75%, 6/01/2026 | | $ | 1,620,000 | | | $ | 1,565,325 | |
| Aramark Services, Inc., 5%, 2/01/2028 (n) | | | 1,135,000 | | | | 1,083,925 | |
| Cott Holdings, Inc., 5.5%, 4/01/2025 (n) | | | 2,185,000 | | | | 2,124,912 | |
| JBS USA LLC/JBS USA Finance, Inc., 6.75%, 2/15/2028 (n) | | | 530,000 | | | | 500,691 | |
| JBS USA Lux S.A./JBS USA Finance, Inc., 5.875%, 7/15/2024 (n) | | | 1,835,000 | | | | 1,752,443 | |
Lamb Weston Holdings, Inc.,
4.625%, 11/01/2024 (n) | | | 1,175,000 | | | | 1,142,688 | |
Lamb Weston Holdings, Inc.,
4.875%, 11/01/2026 (n) | | | 750,000 | | | | 729,375 | |
Pilgrim’s Pride Corp.,
5.875%, 9/30/2027 (n) | | | 2,060,000 | | | | 1,910,650 | |
| Pinnacle Foods Finance LLC/Pinnacle Foods Finance Corp., 5.875%, 1/15/2024 | | | 1,290,000 | | | | 1,359,338 | |
U.S. Foods Holding Corp.,
5.875%, 6/15/2024 (n) | | | 2,055,000 | | | | 2,090,962 | |
| | | | | | | | |
| | | | | | $ | 14,260,309 | |
| | | | | | | | |
| Forest & Paper Products – 0.0% | | | | | | | | |
| Appvion, Inc., 9%, 6/01/2020 (d)(n) | | $ | 687,000 | | | $ | 3,864 | |
| | | | | | | | |
| Gaming & Lodging – 3.6% | | | | | | | | |
| CCM Merger, Inc., 6%, 3/15/2022 (n) | | $ | 1,600,000 | | | $ | 1,628,480 | |
| GLP Capital LP/GLP Financing II, Inc., 5.375%, 11/01/2023 | | | 925,000 | | | | 944,656 | |
| GLP Capital LP/GLP Financing II, Inc., 5.25%, 6/01/2025 | | | 1,665,000 | | | | 1,665,000 | |
| GLP Capital LP/GLP Financing II, Inc., 5.375%, 4/15/2026 | | | 260,000 | | | | 257,400 | |
| Hilton Domestic Operating Co., Inc., 5.125%, 5/01/2026 (n) | | | 1,595,000 | | | | 1,567,087 | |
Hilton Worldwide Finance LLC,
4.625%, 4/01/2025 | | | 1,995,000 | | | | 1,945,125 | |
MGM Resorts International,
6.625%, 12/15/2021 | | | 1,475,000 | | | | 1,554,281 | |
MGM Resorts International,
5.75%, 6/15/2025 | | | 1,055,000 | | | | 1,053,365 | |
| Ryman Hospitality Properties, Inc., REIT, 5%, 4/15/2021 | | | 1,940,000 | | | | 1,944,850 | |
| Ryman Hospitality Properties, Inc., REIT, 5%, 4/15/2023 | | | 920,000 | | | | 913,100 | |
Wyndham Hotels Group, LLC,
5.375%, 4/15/2026 (n) | | | 1,505,000 | | | | 1,493,713 | |
| | | | | | | | |
| | | | | | $ | 14,967,057 | |
| | | | | | | | |
6
MFS High Yield Portfolio
Portfolio of Investments (unaudited) – continued
| | | | | | | | |
| Issuer | | Shares/Par | | | Value ($) | |
| BONDS – continued | | | | | | | | |
| Industrial – 0.9% | | | | | | | | |
Cleaver Brooks, Inc.,
7.875%, 3/01/2023 (n) | | $ | 1,420,000 | | | $ | 1,462,600 | |
KAR Auction Services, Inc.,
5.125%, 6/01/2025 (n) | | | 2,215,000 | | | | 2,115,325 | |
| | | | | | | | |
| | | | | | $ | 3,577,925 | |
| | | | | | | | |
| Insurance – 0.3% | | | | | | | | |
| AssuredPartners Inc., 7%, 8/15/2025 (n) | | $ | 1,330,000 | | | $ | 1,280,125 | |
| | | | | | | | |
| Insurance – Health – 0.8% | | | | | | | | |
| Centene Corp., 6.125%, 2/15/2024 | | $ | 1,240,000 | | | $ | 1,306,650 | |
| Centene Corp., 5.375%, 6/01/2026 (n) | | | 2,130,000 | | | | 2,157,967 | |
| | | | | | | | |
| | | | | | $ | 3,464,617 | |
| | | | | | | | |
| Insurance – Property & Casualty – 0.6% | |
| Hub International Ltd., 7%, 5/01/2026 (n) | | $ | 1,385,000 | | | $ | 1,367,688 | |
Wand Merger Corp.,
8.125%, 7/15/2023 (z) | | | 950,000 | | | | 964,250 | |
| | | | | | | | |
| | | | | | $ | 2,331,938 | |
| | | | | | | | |
| Machinery & Tools – 0.4% | | | | | | | | |
Ashtead Capital, Inc.,
5.625%, 10/01/2024 (n) | | $ | 1,730,000 | | | $ | 1,770,569 | |
| | | | | | | | |
| Major Banks – 0.9% | | | | | | | | |
| Bank of America Corp., 5.875% to 3/15/2028, FLR to 12/31/2059 | | $ | 1,555,000 | | | $ | 1,520,013 | |
| UBS Group AG, 6.875%, 12/29/2049 | | | 2,245,000 | | | | 2,222,752 | |
| | | | | | | | |
| | | | | | $ | 3,742,765 | |
| | | | | | | | |
| Medical & Health Technology & Services – 5.7% | |
| DaVita, Inc., 5.125%, 7/15/2024 | | $ | 620,000 | | | $ | 601,400 | |
| DaVita, Inc., 5%, 5/01/2025 | | | 1,740,000 | | | | 1,637,775 | |
| HCA, Inc., 7.5%, 2/15/2022 | | | 2,030,000 | | | | 2,207,625 | |
| HCA, Inc., 5%, 3/15/2024 | | | 1,430,000 | | | | 1,430,000 | |
| HCA, Inc., 5.375%, 2/01/2025 | | | 2,060,000 | | | | 2,028,482 | |
| HCA, Inc., 5.875%, 2/15/2026 | | | 1,495,000 | | | | 1,508,081 | |
| HealthSouth Corp., 5.125%, 3/15/2023 | | | 1,735,000 | | | | 1,735,000 | |
| HealthSouth Corp., 5.75%, 11/01/2024 | | | 500,000 | | | | 500,290 | |
| Heartland Dental, LLC, 8.5%, 5/01/2026 (n) | | | 1,310,000 | | | | 1,273,975 | |
| Polaris, 8.5%, 12/01/2022 (n) | | | 1,455,000 | | | | 1,500,469 | |
Quintiles IMS Holdings, Inc.,
5%, 10/15/2026 (n) | | | 1,745,000 | | | | 1,699,194 | |
Quorum Health Corp.,
11.625%, 4/15/2023 | | | 1,055,000 | | | | 1,055,000 | |
Tenet Healthcare Corp.,
8.125%, 4/01/2022 | | | 1,355,000 | | | | 1,416,680 | |
| Tenet Healthcare Corp., 6.75%, 6/15/2023 | | | 1,610,000 | | | | 1,601,950 | |
Universal Health Services, Inc.,
7.625%, 8/15/2020 | | | 1,685,000 | | | | 1,680,787 | |
West Street Merger Sub, Inc.,
6.375%, 9/01/2025 (n) | | | 1,405,000 | | | | 1,341,775 | |
| | | | | | | | |
| | | | | | $ | 23,218,483 | |
| | | | | | | | |
| Medical Equipment – 0.8% | | | | | | | | |
| Teleflex, Inc., 5.25%, 6/15/2024 | | $ | 1,360,000 | | | $ | 1,390,600 | |
| Teleflex, Inc., 4.875%, 6/01/2026 | | | 855,000 | | | | 837,900 | |
| | | | | | | | |
| Issuer | | Shares/Par | | | Value ($) | |
| BONDS – continued | | | | | | | | |
| Medical Equipment – continued | | | | | | | | |
| Teleflex, Inc., 4.625%, 11/15/2027 | | $ | 925,000 | | | $ | 874,125 | |
| | | | | | | | |
| | | | | | $ | 3,102,625 | |
| | | | | | | | |
| Metals & Mining – 4.9% | | | | | | | | |
| Baffinland Iron Mines | | | | | | | | |
Corp./Baffinland Iron Mines LP,
8.75%, 7/15/2026 (n) | | $ | 1,360,000 | | | $ | 1,361,768 | |
First Quantum Minerals Ltd.,
7%, 2/15/2021 (n) | | | 1,155,000 | | | | 1,166,550 | |
First Quantum Minerals Ltd.,
7.25%, 4/01/2023 (n) | | | 720,000 | | | | 720,000 | |
| Freeport-McMoRan Copper & Gold, Inc., 3.875%, 3/15/2023 | | | 835,000 | | | | 789,075 | |
| Freeport-McMoRan Copper & Gold, Inc., 5.4%, 11/14/2034 | | | 1,135,000 | | | | 1,030,013 | |
Freeport-McMoRan, Inc.,
6.875%, 2/15/2023 | | | 2,954,000 | | | | 3,112,630 | |
Kaiser Aluminum Corp.,
5.875%, 5/15/2024 | | | 1,820,000 | | | | 1,856,400 | |
| Kinross Gold Corp., 5.95%, 3/15/2024 | | | 295,000 | | | | 302,375 | |
| Kinross Gold Corp., 4.5%, 7/15/2027 (n) | | | 202,000 | | | | 185,335 | |
Lundin Mining Corp.,
7.875%, 11/01/2022 (n) | | | 840,000 | | | | 879,480 | |
| Northwest Acquisitions | | | | | | | | |
ULC/Dominion Finco, Inc.,
7.125%, 11/01/2022 (n) | | | 2,040,000 | | | | 2,034,900 | |
| Novelis Corp., 5.875%, 9/30/2026 (n) | | | 2,545,000 | | | | 2,436,837 | |
Petra Diamonds U.S. Treasury PLC,
7.25%, 5/01/2022 (n) | | | 1,520,000 | | | | 1,464,900 | |
| Steel Dynamics, Inc., 5.25%, 4/15/2023 | | | 465,000 | | | | 469,069 | |
| Steel Dynamics, Inc., 5.5%, 10/01/2024 | | | 1,110,000 | | | | 1,130,812 | |
TMS International Corp.,
7.25%, 8/15/2025 (n) | | | 1,250,000 | | | | 1,278,125 | |
| | | | | | | | |
| | | | | | $ | 20,218,269 | |
| | | | | | | | |
| Midstream – 4.9% | | | | | | | | |
| Blue Racer Midstream LLC/Blue | | | | | | | | |
| Racer Finance Corp., 6.125%, 11/15/2022 (n) | | $ | 1,055,000 | | | $ | 1,065,550 | |
| Blue Racer Midstream LLC/Blue Racer Finance Corp., 6.625%, 7/15/2026 (n) | | | 1,095,000 | | | | 1,083,722 | |
| Cheniere Energy, Inc., 5.875%, 3/31/2025 | | | 1,285,000 | | | | 1,336,400 | |
| DCP Midstream LP, 4.95%, 4/01/2022 | | | 772,000 | | | | 780,685 | |
| DCP Midstream LP, 3.875%, 3/15/2023 | | | 1,480,000 | | | | 1,430,050 | |
| DCP Midstream LP, 5.6%, 4/01/2044 | | | 815,000 | | | | 769,156 | |
Energy Transfer Equity LP,
5.875%, 1/15/2024 | | | 2,025,000 | | | | 2,075,625 | |
Energy Transfer Equity LP,
5.5%, 6/01/2027 | | | 1,000,000 | | | | 1,000,000 | |
EnLink Midstream Partners LP,
4.4%, 4/01/2024 | | | 1,005,000 | | | | 966,776 | |
| Tallgrass Energy GP, LP, 5.5%, 1/15/2028 (n) | | | 3,950,000 | | | | 3,880,875 | |
Targa Resources Partners LP/Targa Resources Finance Corp,
5.375%, 2/01/2027 | | | 3,515,000 | | | | 3,409,550 | |
7
MFS High Yield Portfolio
Portfolio of Investments (unaudited) – continued
| | | | | | | | |
| Issuer | | Shares/Par | | | Value ($) | |
| BONDS – continued | | | | | | | | |
| Midstream – continued | | | | | | | | |
Targa Resources Partners LP/Targa Resources Finance Corp.,
5.25%, 5/01/2023 | | $ | 1,445,000 | | | $ | 1,445,000 | |
| Targa Resources Partners LP/Targa Resources Finance Corp., 5.125%, 2/01/2025 (n) | | | 745,000 | | | | 735,688 | |
| | | | | | | | |
| | | | | | $ | 19,979,077 | |
| | | | | | | | |
| Network & Telecom – 0.7% | | | | | | | | |
| Zayo Group LLC/Zayo Capital, Inc., 6.375%, 5/15/2025 | | $ | 1,060,000 | | | $ | 1,079,875 | |
Zayo Group LLC/Zayo Capital, Inc.,
5.75%, 1/15/2027 (n) | | | 2,035,000 | | | | 1,999,387 | |
| | | | | | | | |
| | | | | | $ | 3,079,262 | |
| | | | | | | | |
| Oil Services – 2.0% | | | | | | | | |
| Apergy Corp, 6.375%, 5/01/2026 (n) | | $ | 1,085,000 | | | $ | 1,102,631 | |
| Bristow Group, Inc., 6.25%, 10/15/2022 | | | 1,659,000 | | | | 1,289,872 | |
Diamond Offshore Drill Co.,
7.875%, 8/15/2025 | | | 830,000 | | | | 860,088 | |
Diamond Offshore Drill Co.,
5.7%, 10/15/2039 | | | 1,815,000 | | | | 1,452,000 | |
| Ensco PLC, 7.75%, 2/01/2026 | | | 1,520,000 | | | | 1,435,944 | |
Trinidad Drilling Ltd.,
6.625%, 2/15/2025 (n) | | | 2,080,000 | | | | 2,002,000 | |
| | | | | | | | |
| | | | | | $ | 8,142,535 | |
| | | | | | | | |
| Oils – 0.5% | | | | | | | | |
| Parkland Fuel Corp., 6%, 4/01/2026 (n) | | $ | 2,105,000 | | | $ | 2,073,425 | |
| | | | | | | | |
| Pharmaceuticals – 0.9% | | | | | | | | |
| Mallinckrodt International Finance S.A., 5.75%, 8/01/2022 (n) | | $ | 805,000 | | | $ | 724,500 | |
| Mallinckrodt International Finance S.A., 5.625%, 10/15/2023 (n) | | | 505,000 | | | | 420,917 | |
| Valeant Pharmaceuticals International, Inc., 5.5%, 3/01/2023 (n) | | | 1,605,000 | | | | 1,492,650 | |
| Valeant Pharmaceuticals International, Inc., 6.125%, 4/15/2025 (n) | | | 1,335,000 | | | | 1,229,869 | |
| | | | | | | | |
| | | | | | $ | 3,867,936 | |
| | | | | | | | |
| Precious Metals & Minerals – 0.4% | | | | | | | | |
| Teck Resources Ltd., 6%, 8/15/2040 | | $ | 225,000 | | | $ | 218,813 | |
| Teck Resources Ltd., 6.25%, 7/15/2041 | | | 1,365,000 | | | | 1,358,175 | |
| | | | | | | | |
| | | | | | $ | 1,576,988 | |
| | | | | | | | |
| Printing & Publishing – 0.2% | | | | | | | | |
| Nielsen Finance LLC, 5%, 4/15/2022 (n) | | $ | 855,000 | | | $ | 840,123 | |
| | | | | | | | |
| Real Estate – Healthcare – 0.9% | | | | | | | | |
| MPT Operating Partnership LP/MPT Financial Co., REIT, 5.25%, 8/01/2026 | | $ | 1,815,000 | | | $ | 1,778,700 | |
| MPT Operating Partnership LP/MPT Financial Co., REIT, 5%, 10/15/2027 | | | 2,215,000 | | | | 2,115,325 | |
| | | | | | | | |
| | | | | | $ | 3,894,025 | |
| | | | | | | | |
| | | | | | | | |
| Issuer | | Shares/Par | | | Value ($) | |
| BONDS – continued | | | | | | | | |
| Real Estate – Other – 0.8% | | | | | | | | |
| CyrusOne LP/CyrusOne Finance Corp., REIT, 5%, 3/15/2024 | | $ | 2,285,000 | | | $ | 2,285,000 | |
| CyrusOne LP/CyrusOne Finance Corp., REIT, 5.375%, 3/15/2027 | | | 1,090,000 | | | | 1,081,825 | |
| | | | | | | | |
| | | | | | $ | 3,366,825 | |
| | | | | | | | |
| Restaurants – 1.1% | | | | | | | | |
Golden Nugget, Inc.,
6.75%, 10/15/2024 (n) | | $ | 1,215,000 | | | $ | 1,215,219 | |
| IRB Holding Corp., 6.75%, 2/15/2026 (n) | | | 1,285,000 | | | | 1,227,175 | |
| KFC Holding Co./Pizza Hut Holdings LLC/Taco Bell of America LLC, 5.25%, 6/01/2026 (n) | | | 2,020,000 | | | | 1,989,700 | |
| | | | | | | | |
| | | | | | $ | 4,432,094 | |
| | | | | | | | |
| Retailers – 0.7% | | | | | | | | |
| DriveTime Automotive Group, Inc./DT | | | | | | | | |
| Acceptance Corp., 8%, 6/01/2021 (n) | | $ | 660,000 | | | $ | 666,600 | |
| Hanesbrands, Inc., 4.625%, 5/15/2024 (n) | | | 440,000 | | | | 429,000 | |
| Hanesbrands, Inc., 4.875%, 5/15/2026 (n) | | | 1,685,000 | | | | 1,626,025 | |
| | | | | | | | |
| | | | | | $ | 2,721,625 | |
| | | | | | | | |
| Specialty Chemicals – 1.1% | | | | | | | | |
| A Schulman, Inc., 6.875%, 6/01/2023 | | $ | 1,625,000 | | | $ | 1,711,125 | |
| Univar USA, Inc., 6.75%, 7/15/2023 (n) | | | 2,585,000 | | | | 2,665,781 | |
| | | | | | | | |
| | | | | | $ | 4,376,906 | |
| | | | | | | | |
| Specialty Stores – 0.3% | | | | | | | | |
| Group 1 Automotive, Inc., 5%, 6/01/2022 | | $ | 1,415,000 | | | $ | 1,404,388 | |
| | | | | | | | |
| Supermarkets – 0.4% | | | | | | | | |
Albertsons Cos. LLC/Safeway Co.,
6.625%, 6/15/2024 | | $ | 1,570,000 | | | $ | 1,482,237 | |
| | | | | | | | |
| Telecommunications – Wireless – 4.1% | |
| Altice Luxembourg S.A., 7.75%, 5/15/2022 (n) | | $ | 750,000 | | | $ | 725,625 | |
Altice Luxembourg S.A.,
7.625%, 2/15/2025 (n) | | | 1,450,000 | | | | 1,334,000 | |
| Digicel Group Ltd., 6.75%, 3/01/2023 (n) | | | 2,206,000 | | | | 1,830,980 | |
SBA Communications Corp.,
4%, 10/01/2022 (n) | | | 2,125,000 | | | | 2,032,031 | |
SBA Communications Corp.,
4.875%, 9/01/2024 | | | 865,000 | | | | 827,407 | |
| Sprint Corp., 7.875%, 9/15/2023 | | | 925,000 | | | | 959,109 | |
| Sprint Corp., 7.125%, 6/15/2024 | | | 2,700,000 | | | | 2,725,893 | |
| Sprint Nextel Corp., 6%, 11/15/2022 | | | 2,080,000 | | | | 2,061,800 | |
| T-Mobile USA, Inc., 6.5%, 1/15/2024 | | | 695,000 | | | | 726,275 | |
| T-Mobile USA, Inc., 5.125%, 4/15/2025 | | | 1,190,000 | | | | 1,195,950 | |
| T-Mobile USA, Inc., 6.5%, 1/15/2026 | | | 1,380,000 | | | | 1,423,125 | |
| T-Mobile USA, Inc., 5.375%, 4/15/2027 | | | 1,015,000 | | | | 987,088 | |
| | | | | | | | |
| | | | | | $ | 16,829,283 | |
| | | | | | | | |
| Telephone Services – 0.6% | | | | | | | | |
| Level 3 Financing, Inc., 5.375%, 1/15/2024 | | $ | 715,000 | | | $ | 700,342 | |
| Level 3 Financing, Inc., 5.375%, 5/01/2025 | | | 1,840,000 | | | | 1,771,000 | |
| | | | | | | | |
| | | | | | $ | 2,471,342 | |
| | | | | | | | |
8
MFS High Yield Portfolio
Portfolio of Investments (unaudited) – continued
| | | | | | | | |
| Issuer | | Shares/Par | | | Value ($) | |
| BONDS – continued | | | | | | | | |
| Transportation – Services – 0.5% | |
| Navios Maritime Holding, Inc., 7.375%, 1/15/2022 (n) | | $ | 1,035,000 | | | $ | 785,953 | |
| Navios South American Logistics, Inc./Navios Logistics Finance (U.S.), Inc., 7.25%, 5/01/2022 | | | 395,000 | | | | 382,163 | |
| Syncreon Group BV/Syncre, 8.625%, 11/01/2021 (n) | | | 1,005,000 | | | | 864,300 | |
| | | | | | | | |
| | | | | | $ | 2,032,416 | |
| | | | | | | | |
| Utilities – Electric Power – 2.6% | | | | | | | | |
| Calpine Corp., 5.5%, 2/01/2024 | | $ | 1,050,000 | | | $ | 964,687 | |
| Calpine Corp., 5.75%, 1/15/2025 | | | 595,000 | | | | 544,053 | |
| Calpine Corp., 5.25%, 6/01/2026 (n) | | | 1,035,000 | | | | 974,841 | |
| Covanta Holding Corp., 6.375%, 10/01/2022 | | | 400,000 | | | | 408,500 | |
| Covanta Holding Corp., 5.875%, 3/01/2024 | | | 1,305,000 | | | | 1,285,425 | |
| Covanta Holding Corp., 5.875%, 7/01/2025 | | | 995,000 | | | | 960,175 | |
| Drax Finco PLC, 6.625%, 11/01/2025 (z) | | | 1,480,000 | | | | 1,472,600 | |
| NextEra Energy Operating Co., 4.25%, 9/15/2024 (n) | | | 1,960,000 | | | | 1,886,500 | |
| Pattern Energy Group, Inc., 5.875%, 2/01/2024 (n) | | | 2,100,000 | | | | 2,100,000 | |
| | | | | | | | |
| | | | | | $ | 10,596,781 | |
| | | | | | | | |
Total Bonds
(Identified Cost, $407,751,539) | | | $ | 394,413,751 | |
| | | | | | | | |
| | | | | | | | |
| Issuer | | Shares/Par | | | Value ($) | |
| FLOATING RATE LOANS (g)(r) – 0.5% | | | | | |
| Conglomerates – 0.1% | | | | | | | | |
| Entegris, Inc., Term Loan B, 4.375%, 4/30/2021 | | $ | 407,046 | | | $ | 408,064 | |
| | | | | | | | |
| Consumer Products – 0.1% | | | | | | | | |
| Spectrum Brands, Inc., Term Loan B, 3.885%, 6/23/2022 | | $ | 472,723 | | | $ | 470,655 | |
| | | | | | | | |
| Medical & Health Technology & Services – 0.3% | |
| DaVita HealthCare Partners, Inc., Term Loan B, 5.042%, 6/24/2021 | | $ | 970,996 | | | $ | 972,210 | |
| | | | | | | | |
Total Floating Rate Loans
(Identified Cost, $1,849,021) | | | $ | 1,850,929 | |
| | | | | | | | |
| | |
| COMMON STOCKS – 0.2% | | | | | | | | |
| Oil Services – 0.2% | | | | | | | | |
LTRI Holdings LP (a)(u)
(Identified Cost, $401,400) | | | 1,115 | | | $ | 991,703 | |
| | | | | | | | |
|
| INVESTMENT COMPANIES (h) – 2.2% | |
| Money Market Funds – 2.2% | | | | | | | | |
| MFS Institutional Money Market Portfolio, 1.9% (v) (Identified Cost, $8,913,480) | | | 8,913,873 | | | $ | 8,913,873 | |
| | | | | | | | |
OTHER ASSETS, LESS
LIABILITIES – 0.9% | | | | | | | 3,902,122 | |
| | | | | | | | |
| NET ASSETS – 100.0% | | | | | | $ | 410,072,378 | |
| | | | | | | | |
| (a) | | Non-income producing security. |
| (g) | | The rate shown represents a weighted average coupon rate on settled positions at period end, unless otherwise indicated. |
| (h) | | An affiliated issuer, which may be considered one in which the fund owns 5% or more of the outstanding voting securities, or a company which is under common control. At period end, the aggregate values of the fund’s investments in affiliated issuers and in unaffiliated issuers were $8,913,873 and $397,256,383, respectively. |
| (n) | | Securities exempt from registration under Rule 144A of the Securities Act of 1933. These securities may be sold in the ordinary course of business in transactions exempt from registration, normally to qualified institutional buyers. At period end, the aggregate value of these securities was $226,012,423, representing 55.1% of net assets. |
| (p) | | Payment-in-kind security for which interest income may be received in additional securities and/or cash. |
| (r) | | Remaining maturities of floating rate loans may be less than stated maturities shown as a result of contractual or optional prepayments by the borrower. Such prepayments cannot be predicted with certainty. These loans may be subject to restrictions on resale. Floating rate loans generally have rates of interest which are determined periodically by reference to a base lending rate plus a premium. |
| (u) | | The security was valued using significant unobservable inputs and is considered level 3 under the fair value hierarchy. For further information about the fund’s level 3 holdings, please see Note 2 in the Notes to Financial Statements. |
| (v) | | Affiliated issuer that is available only to investment companies managed by MFS. The rate quoted for the MFS Institutional Money Market Portfolio is the annualized seven-day yield of the fund at period end. |
| (z) | | Restricted securities are not registered under the Securities Act of 1933 and are subject to legal restrictions on resale. These securities generally may be resold in transactions exempt from registration or to the public if the securities are subsequently registered. Disposal of these securities may involve time-consuming negotiations and prompt sale at an acceptable price may be difficult. The fund holds the following restricted securities: |
| | | | | | | | | | |
| Restricted Securities | | Acquisition Date | | Cost | | | Value | |
| Cequel Communications Holdings I LLC/ Cequel Capital Corp., 7.5%, 4/01/2028 | | 6/07/18-6/11/18 | | | $891,215 | | | | $885,675 | |
CWCapital Cobalt Ltd., CDO, “F”, FLR,
3.66%, (0% cash or 3.66% PIK), (LIBOR - 3 mo. + 1.3%), 4/26/2050 | | 4/12/06 | | | 1,080,058 | | | | 117 | |
| Drax Finco PLC, 6.625%, 11/01/2025 | | 4/12/18 | | | 1,487,989 | | | | 1,472,600 | |
| Parsley Energy LLC/Parsley Finance Corp., 5.25%, 8/15/2025 | | 6/06/18-6/07/18 | | | 424,662 | | | | 422,475 | |
9
MFS High Yield Portfolio
Portfolio of Investments (unaudited) – continued
| | | | | | | | | | |
| Restricted Securities – continued | | Acquisition Date | | Cost | | | Value | |
| Wand Merger Corp., 8.125%, 7/15/2023 | | 6/28/18 | | | $958,938 | | | | $964,250 | |
| Total Restricted Securities | | | | | | | | | $3,745,117 | |
| % of Net assets | | | | | | | | | 0.9% | |
The following abbreviations are used in this report and are defined:
| CDO | | Collateralized Debt Obligation |
| FLR | | Floating Rate. Interest rate resets periodically based on the parenthetically disclosed reference rate plus a spread (if any). The period-end rate reported may not be the current rate. |
| PLC | | Public Limited Company |
| REIT | | Real Estate Investment Trust |
Abbreviations indicate amounts shown in currencies other than the U.S. dollar. All amounts are stated in U.S. dollars unless otherwise indicated. A list of abbreviations is shown below:
Derivative Contracts at 6/30/18
Forward Foreign Currency Exchange Contracts
| | | | | | | | | | | | | | | | | | | | |
| Currency Purchased | | Currency Sold | | Counterparty | | Settlement Date | | | Unrealized
Appreciation
(Depreciation) | |
| Asset Derivatives | | | | | | | | | | | | |
| USD | | | 971,624 | | | | | EUR | | 821,329 | | JPMorgan Chase Bank N.A. | | | 7/27/2018 | | | | $10,817 | |
| | | | | | | | | | | | | | | | | | | | |
Futures Contracts
| | | | | | | | | | | | | | | | | | | | | | |
| Description | | Long/
Short | | | Currency | | | Contracts | | Notional
Amount | | | Expiration
Date | | | Value/
Unrealized
Appreciation
(Depreciation) | |
| Asset Derivatives | | | | | | | | | | | | | | | | | | | | | | |
| Interest Rate Futures | | | | | | | | | | | | | | | | | | | | | | |
| U.S. Treasury Note 10 yr | | | Short | | | | USD | | | 106 | | | $12,739,875 | | | | September - 2018 | | | | $24,461 | |
| | | | | | | | | | | | | | | | | | | | | | |
| | | | | | | | | | | | | | | | | | | | | | |
| | | | | | | | | | | | | | | | | | | | | | |
| Liability Derivatives | | | | | | | | | | | | | | | | | | | | | | |
| Interest Rate Futures | | | | | | | | | | | | | | | | | | | | | | |
| German Euro-Bund 10 yr | | | Short | | | | EUR | | | 5 | | | $949,129 | | | | September - 2018 | | | | $(6,967 | ) |
| | | | | | | | | | | | | | | | | | | | | | |
At June 30, 2018, the fund had cash collateral of $125,555 to cover any collateral or margin obligations for certain derivative contracts. Restricted cash and/or deposits with brokers in the Statement of Assets and Liabilities are comprised of cash collateral.
See Notes to Financial Statements
10
MFS High Yield Portfolio
FINANCIAL STATEMENTS | STATEMENT OF ASSETS AND LIABILITIES (unaudited)
This statement represents your fund’s balance sheet, which details the assets and liabilities comprising the total value of the fund.
| | | | |
At 6/30/18 | | | | |
Assets | | | | |
Investments in unaffiliated issuers, at value (identified cost, $410,001,960) | | | $397,256,383 | |
Investments in affiliated issuers, at value (identified cost, $8,913,480) | | | 8,913,873 | |
Cash | | | 32,409 | |
Deposits with brokers for | | | | |
Futures contracts | | | 125,555 | |
Receivables for | | | | |
Forward foreign currency exchange contracts | | | 10,817 | |
Investments sold | | | 152,179 | |
Fund shares sold | | | 15,563 | |
Interest | | | 6,307,836 | |
Other assets | | | 1,494 | |
Total assets | | | $412,816,109 | |
Liabilities | | | | |
Payables for | | | | |
Daily variation margin on open futures contracts | | | $566 | |
Investments purchased | | | 2,363,305 | |
Fund shares reacquired | | | 253,942 | |
Payable to affiliates | | | | |
Investment adviser | | | 7,182 | |
Shareholder servicing costs | | | 58 | |
Distribution and/or service fees | | | 1,099 | |
Payable for independent Trustees’ compensation | | | 100 | |
Accrued expenses and other liabilities | | | 117,479 | |
Total liabilities | | | $2,743,731 | |
Net assets | | | $410,072,378 | |
Net assets consist of | | | | |
Paid-in capital | | | $425,527,027 | |
Unrealized appreciation (depreciation) | | | (12,716,923 | ) |
Accumulated net realized gain (loss) | | | (35,229,267 | ) |
Undistributed net investment income | | | 32,491,541 | |
Net assets | | | $410,072,378 | |
Shares of beneficial interest outstanding | | | 72,015,265 | |
| | | | | | | | | | | | |
| | | Net assets | | | Shares
outstanding | | | Net asset value
per share | |
Initial Class | | | $356,592,904 | | | | 62,515,247 | | | | $5.70 | |
Service Class | | | 53,479,474 | | | | 9,500,018 | | | | 5.63 | |
See Notes to Financial Statements
11
MFS High Yield Portfolio
FINANCIAL STATEMENTS | STATEMENT OF OPERATIONS (unaudited)
This statement describes how much your fund earned in investment income and accrued in expenses. It also describes any gains and/or losses generated by fund operations.
| | | | |
Six months ended 6/30/18 | | | | |
Net investment income (loss) | | | | |
Income | | | | |
Interest | | | $11,527,833 | |
Dividends from affiliated issuers | | | 83,526 | |
Other | | | 41,902 | |
Total investment income | | | $11,653,261 | |
Expenses | | | | |
Management fee | | | $1,478,605 | |
Distribution and/or service fees | | | 69,240 | |
Shareholder servicing costs | | | 7,229 | |
Administrative services fee | | | 36,640 | |
Independent Trustees’ compensation | | | 4,344 | |
Custodian fee | | | 14,579 | |
Shareholder communications | | | 26,815 | |
Audit and tax fees | | | 38,832 | |
Legal fees | | | 8,468 | |
Miscellaneous | | | 19,572 | |
Total expenses | | | $1,704,324 | |
Reduction of expenses by investment adviser | | | (112,587 | ) |
Net expenses | | | $1,591,737 | |
Net investment income (loss) | | | $10,061,524 | |
Realized and unrealized gain (loss) | | | | |
Realized gain (loss) (identified cost basis) | | | | |
Unaffiliated issuers | | | $(1,344,419 | ) |
Affiliated issuers | | | (943 | ) |
Futures contracts | | | 352,795 | |
Forward foreign currency exchange contracts | | | 59,083 | |
Foreign currency | | | 125 | |
Net realized gain (loss) | | | $(933,359 | ) |
Change in unrealized appreciation or depreciation | | | | |
Unaffiliated issuers | | | $(13,912,153 | ) |
Affiliated issuers | | | 1,298 | |
Futures contracts | | | (49,740 | ) |
Forward foreign currency exchange contracts | | | 10,817 | |
Translation of assets and liabilities in foreign currencies | | | (50 | ) |
Net unrealized gain (loss) | | | $(13,949,828 | ) |
Net realized and unrealized gain (loss) | | | $(14,883,187 | ) |
Change in net assets from operations | | | $(4,821,663 | ) |
See Notes to Financial Statements
12
MFS High Yield Portfolio
FINANCIAL STATEMENTS | STATEMENTS OF CHANGES IN NET ASSETS
These statements describe the increases and/or decreases in net assets resulting from operations, any distributions, and any shareholder transactions.
| | | | | | | | |
| | | Six months ended
6/30/18 | | | Year ended
12/31/17 | |
| | | (unaudited) | | | | |
Change in net assets | | | | | | | | |
From operations | | | | | | | | |
| Net investment income (loss) | | | $10,061,524 | | | | $21,876,775 | |
Net realized gain (loss) | | | (933,359 | ) | | | 812,597 | |
Net unrealized gain (loss) | | | (13,949,828 | ) | | | 6,671,003 | |
Change in net assets from operations | | | $(4,821,663 | ) | | | $29,360,375 | |
Distributions declared to shareholders | | | | | | | | |
From net investment income | | | $— | | | | $(29,244,080 | ) |
Change in net assets from fund share transactions | | | $(27,998,571 | ) | | | $(30,530,978 | ) |
Total change in net assets | | | $(32,820,234 | ) | | | $(30,414,683 | ) |
Net assets | | | | | | | | |
At beginning of period | | | 442,892,612 | | | | 473,307,295 | |
At end of period (including undistributed net investment income of $32,491,541 and
$22,430,017, respectively) | | | $410,072,378 | | | | $442,892,612 | |
See Notes to Financial Statements
13
MFS High Yield Portfolio
FINANCIAL STATEMENTS | FINANCIAL HIGHLIGHTS
The financial highlights table is intended to help you understand the fund’s financial performance for the semiannual period and the past 5 fiscal years. Certain information reflects financial results for a single fund share. The total returns in the table represent the rate that an investor would have earned (or lost) on an investment in the fund share class (assuming reinvestment of all distributions) held for the entire period.
| | | | | | | | | | | | | | | | | | | | | | | | |
| Initial Class | | Six months
ended 6/30/18 | | | Year ended | |
| | | 12/31/17 | | | 12/31/16 | | | 12/31/15 | | | 12/31/14 | | | 12/31/13 | |
| | | (unaudited) | | | | | | | | | | | | | | | | |
Net asset value, beginning of period | | | $5.77 | | | | $5.78 | | | | $5.43 | | | | $6.11 | | | | $6.28 | | | | $6.05 | |
| Income (loss) from investment operations | | | | | | | | | | | | | | | | | | | | | |
Net investment income (loss) (d) | | | $0.14 | | | | $0.28 | | | | $0.32 | (c) | | | $0.33 | | | | $0.35 | | | | $0.36 | |
Net realized and unrealized gain (loss) | | | (0.21 | ) | | | 0.10 | | | | 0.42 | | | | (0.57 | ) | | | (0.17 | ) | | | 0.02 | |
Total from investment operations | | | $(0.07 | ) | | | $0.38 | | | | $0.74 | | | | $(0.24 | ) | | | $0.18 | | | | $0.38 | |
| Less distributions declared to shareholders | | | | | | | | | | | | | | | | | | | | | |
From net investment income | | | $— | | | | $(0.39 | ) | | | $(0.39 | ) | | | $(0.44 | ) | | | $(0.35 | ) | | | $(0.15 | ) |
Net asset value, end of period (x) | | | $5.70 | | | | $5.77 | | | | $5.78 | | | | $5.43 | | | | $6.11 | | | | $6.28 | |
Total return (%) (k)(r)(s)(x) | | | (1.21 | )(n) | | | 6.69 | | | | 13.82 | (c) | | | (4.22 | ) | | | 2.81 | | | | 6.42 | |
Ratios (%) (to average net assets)
and Supplemental data: | | | | | | | | | | | | | | | | | | | | | |
Expenses before expense reductions (f) | | | 0.77 | (a) | | | 0.78 | | | | 0.76 | (c) | | | 0.77 | | | | 0.77 | | | | 0.76 | |
Expenses after expense reductions (f) | | | 0.72 | (a) | | | 0.72 | | | | 0.70 | (c) | | | 0.72 | | | | 0.74 | | | | 0.75 | |
Net investment income (loss) | | | 4.80 | (a) | | | 4.78 | | | | 5.60 | (c) | | | 5.43 | | | | 5.44 | | | | 5.79 | |
Portfolio turnover | | | 23 | (n) | | | 49 | | | | 41 | | | | 33 | | | | 43 | | | | 52 | |
Net assets at end of period (000 omitted) | | | $356,593 | | | | $384,393 | | | | $404,118 | | | | $419,474 | | | | $514,089 | | | | $600,994 | |
| | |
| Service Class | | Six months
ended 6/30/18 | | | Year ended | |
| | | 12/31/17 | | | 12/31/16 | | | 12/31/15 | | | 12/31/14 | | | 12/31/13 | |
| | | (unaudited) | | | | | | | | | | | | | | | | |
Net asset value, beginning of period | | | $5.70 | | | | $5.72 | | | | $5.37 | | | | $6.04 | | | | $6.21 | | | | $5.99 | |
| Income (loss) from investment operations | | | | | | | | | | | | | | | | | | | | | |
Net investment income (loss) (d) | | | $0.13 | | | | $0.26 | | | | $0.30 | (c) | | | $0.31 | | | | $0.33 | | | | $0.34 | |
Net realized and unrealized gain (loss) | | | (0.20 | ) | | | 0.10 | | | | 0.43 | | | | (0.56 | ) | | | (0.16 | ) | | | 0.02 | |
Total from investment operations | | | $(0.07 | ) | | | $0.36 | | | | $0.73 | | | | $(0.25 | ) | | | $0.17 | | | | $0.36 | |
| Less distributions declared to shareholders | | | | | | | | | | | | | | | | | | | | | |
From net investment income | | | $— | | | | $(0.38 | ) | | | $(0.38 | ) | | | $(0.42 | ) | | | $(0.34 | ) | | | $(0.14 | ) |
Net asset value, end of period (x) | | | $5.63 | | | | $5.70 | | | | $5.72 | | | | $5.37 | | | | $6.04 | | | | $6.21 | |
Total return (%) (k)(r)(s)(x) | | | (1.23 | )(n) | | | 6.31 | | | | 13.64 | (c) | | | (4.42 | ) | | | 2.53 | | | | 6.10 | |
Ratios (%) (to average net assets)
and Supplemental data: | | | | | | | | | | | | | | | | | | | | | |
Expenses before expense reductions (f) | | | 1.02 | (a) | | | 1.03 | | | | 1.02 | (c) | | | 1.02 | | | | 1.02 | | | | 1.01 | |
Expenses after expense reductions (f) | | | 0.97 | (a) | | | 0.97 | | | | 0.95 | (c) | | | 0.97 | | | | 0.99 | | | | 1.00 | |
Net investment income (loss) | | | 4.55 | (a) | | | 4.54 | | | | 5.36 | (c) | | | 5.18 | | | | 5.19 | | | | 5.56 | |
Portfolio turnover | | | 23 | (n) | | | 49 | | | | 41 | | | | 33 | | | | 43 | | | | 52 | |
Net assets at end of period (000 omitted) | | | $53,479 | | | | $58,499 | | | | $69,189 | | | | $71,421 | | | | $84,272 | | | | $102,616 | |
See Notes to Financial Statements
14
MFS High Yield Portfolio
Financial Highlights – continued
| (c) | Amount reflects a one-time reimbursement of expenses by the custodian (or former custodian) without which net investment income and performance would be lower and expenses would be higher. |
| (d) | Per share data is based on average shares outstanding. |
| (f) | Ratios do not reflect reductions from fees paid indirectly, if applicable. |
| (k) | The total return does not reflect expenses that apply to separate accounts. Inclusion of these charges would reduce the total return figures for all periods shown. |
| (r) | Certain expenses have been reduced without which performance would have been lower. |
| (s) | From time to time the fund may receive proceeds from litigation settlements, without which performance would be lower. |
| (x) | The net asset values and total returns have been calculated on net assets which include adjustments made in accordance with U.S. generally accepted accounting principles required at period end for financial reporting purposes. |
See Notes to Financial Statements
15
MFS High Yield Portfolio
NOTES TO FINANCIAL STATEMENTS (unaudited)
| (1) | | Business and Organization |
MFS High Yield Portfolio (the fund) is a diversified series of MFS Variable Insurance Trust II (the trust). The trust is organized as a Massachusetts business trust and is registered under the Investment Company Act of 1940, as amended, as an open-end management investment company. The shareholders of each series of the trust are separate accounts of insurance companies, which offer variable annuity and/or life insurance products, and qualified retirement and pension plans.
The fund is an investment company and accordingly follows the investment company accounting and reporting guidance of the Financial Accounting Standards Board (FASB) Accounting Standards Codification Topic 946 Financial Services – Investment Companies.
| (2) | | Significant Accounting Policies |
General – The preparation of financial statements in conformity with U.S. generally accepted accounting principles requires management to make estimates and assumptions that affect the reported amounts of assets and liabilities, and disclosure of contingent assets and liabilities at the date of the financial statements and the reported amounts of increases and decreases in net assets from operations during the reporting period. Actual results could differ from those estimates. In the preparation of these financial statements, management has evaluated subsequent events occurring after the date of the fund’s Statement of Assets and Liabilities through the date that the financial statements were issued. The fund invests in high-yield securities rated below investment grade. Investments in below investment grade quality securities can involve a substantially greater risk of default or can already be in default, and their values can decline significantly. Below investment grade quality securities tend to be more sensitive to adverse news about the issuer, or the market or economy in general, than higher quality debt instruments. The fund invests in foreign securities. Investments in foreign securities are vulnerable to the effects of changes in the relative values of the local currency and the U.S. dollar and to the effects of changes in each country’s market, economic, industrial, political, regulatory, geopolitical, and other conditions.
In March 2017, the FASB issued Accounting Standards Update 2017-08, Receivables – Nonrefundable Fees and Other Costs (Subtopic 310-20) – Premium Amortization on Purchased Callable Debt Securities (“ASU 2017-08”). For entities that hold callable debt securities at a premium, ASU 2017-08 requires that the premium be amortized to the earliest call date. ASU 2017-08 will be effective for fiscal years beginning after December 15, 2018, and interim periods within those fiscal years. Management has evaluated the potential impacts of ASU 2017-08 and believes that adoption of ASU 2017-08 will not have a material effect on the fund’s overall financial position or its overall results of operations.
Balance Sheet Offsetting – The fund’s accounting policy with respect to balance sheet offsetting is that, absent an event of default by the counterparty or a termination of the agreement, the International Swaps and Derivatives Association (ISDA) Master Agreement, or similar agreement, does not result in an offset of reported amounts of financial assets and financial liabilities in the Statement of Assets and Liabilities across transactions between the fund and the applicable counterparty. The fund’s right to setoff may be restricted or prohibited by the bankruptcy or insolvency laws of the particular jurisdiction to which a specific master netting agreement counterparty is subject. Balance sheet offsetting disclosures, to the extent applicable to the fund, have been included in the fund’s Significant Accounting Policies note under the captions for each of the fund’s in-scope financial instruments and transactions.
Investment Valuations – Equity securities, including restricted equity securities, are generally valued at the last sale or official closing price on their primary market or exchange as provided by a third-party pricing service. Equity securities, for which there were no sales reported that day, are generally valued at the last quoted daily bid quotation on their primary market or exchange as provided by a third-party pricing service. Debt instruments and floating rate loans, including restricted debt instruments, are generally valued at an evaluated or composite bid as provided by a third-party pricing service. Short-term instruments with a maturity at issuance of 60 days or less may be valued at amortized cost, which approximates market value. Futures contracts are generally valued at last posted settlement price on their primary exchange as provided by a third-party pricing service. Futures contracts for which there were no trades that day for a particular position are generally valued at the closing bid quotation on their primary exchange as provided by a third-party pricing service. Forward foreign currency exchange contracts are generally valued at the mean of bid and asked prices for the time period interpolated from rates provided by a third-party pricing service for proximate time periods. Open-end investment companies are generally valued at net asset value per share. Securities and other assets generally valued on the basis of information from a third-party pricing service may also be valued at a broker/dealer bid quotation. In determining values, third-party pricing services can utilize both transaction data and market information such as yield, quality, coupon rate, maturity, type of issue, trading characteristics, and other market data. The values of foreign securities and other assets and liabilities expressed in foreign currencies are converted to U.S. dollars using the mean of bid and asked prices for rates provided by a third-party pricing service.
The Board of Trustees has delegated primary responsibility for determining or causing to be determined the value of the fund’s investments (including any fair valuation) to the adviser pursuant to valuation policies and procedures approved by the Board. If the
16
MFS High Yield Portfolio
Notes to Financial Statements (unaudited) – continued
adviser determines that reliable market quotations are not readily available, investments are valued at fair value as determined in good faith by the adviser in accordance with such procedures under the oversight of the Board of Trustees. Under the fund’s valuation policies and procedures, market quotations are not considered to be readily available for most types of debt instruments and floating rate loans and many types of derivatives. These investments are generally valued at fair value based on information from third-party pricing services. In addition, investments may be valued at fair value if the adviser determines that an investment’s value has been materially affected by events occurring after the close of the exchange or market on which the investment is principally traded (such as foreign exchange or market) and prior to the determination of the fund’s net asset value, or after the halting of trading of a specific security where trading does not resume prior to the close of the exchange or market on which the security is principally traded. The adviser generally relies on third-party pricing services or other information (such as the correlation with price movements of similar securities in the same or other markets; the type, cost and investment characteristics of the security; the business and financial condition of the issuer; and trading and other market data) to assist in determining whether to fair value and at what value to fair value an investment. The value of an investment for purposes of calculating the fund’s net asset value can differ depending on the source and method used to determine value. When fair valuation is used, the value of an investment used to determine the fund’s net asset value may differ from quoted or published prices for the same investment. There can be no assurance that the fund could obtain the fair value assigned to an investment if it were to sell the investment at the same time at which the fund determines its net asset value per share.
Various inputs are used in determining the value of the fund’s assets or liabilities. These inputs are categorized into three broad levels. In certain cases, the inputs used to measure fair value may fall into different levels of the fair value hierarchy. In such cases, an investment’s level within the fair value hierarchy is based on the lowest level of input that is significant to the fair value measurement. The fund’s assessment of the significance of a particular input to the fair value measurement in its entirety requires judgment, and considers factors specific to the investment. Level 1 includes unadjusted quoted prices in active markets for identical assets or liabilities. Level 2 includes other significant observable market-based inputs (including quoted prices for similar securities, interest rates, prepayment speed, and credit risk). Level 3 includes unobservable inputs, which may include the adviser’s own assumptions in determining the fair value of investments. Other financial instruments are derivative instruments, such as futures contracts and forward foreign currency exchange contracts. The following is a summary of the levels used as of June 30, 2018 in valuing the fund’s assets or liabilities:
| | | | | | | | | | | | | | | | |
| Financial Instruments | | Level 1 | | | Level 2 | | | Level 3 | | | Total | |
| Equity Securities | | | $— | | | | $— | | | | $991,703 | | | | $991,703 | |
| U.S. Corporate Bonds | | | — | | | | 329,973,654 | | | | — | | | | 329,973,654 | |
| Asset-Backed Securities (including CDOs) | | | — | | | | 117 | | | | — | | | | 117 | |
| Foreign Bonds | | | — | | | | 64,439,980 | | | | — | | | | 64,439,980 | |
| Floating Rate Loans | | | — | | | | 1,850,929 | | | | — | | | | 1,850,929 | |
| Mutual Funds | | | 8,913,873 | | | | — | | | | — | | | | 8,913,873 | |
| Total | | | $8,913,873 | | | | $396,264,680 | | | | $991,703 | | | | $406,170,256 | |
| | | | |
| Other Financial Instruments | | | | | | | | | | | | |
| Futures Contracts – Assets | | | $24,461 | | | | $— | | | | $— | | | | $24,461 | |
| Futures Contracts – Liabilities | | | (6,967 | ) | | | — | | | | — | | | | (6,967 | ) |
| Forward Foreign Currency Exchange | | | | | | | | | | | | | | | | |
| Contracts – Assets | | | — | | | | 10,817 | | | | — | | | | 10,817 | |
For further information regarding security characteristics, see the Portfolio of Investments.
The following is a reconciliation of level 3 assets for which significant unobservable inputs were used to determine fair value. The fund’s policy is to recognize transfers between the levels as of the end of the period. The table presents the activity of level 3 securities held at the beginning and the end of the period.
| | | | |
| | | Equity Securities | |
| Balance as of 12/31/17 | | | $991,703 | |
Change in unrealized appreciation or depreciation | | | 0 | |
| Balance as of 6/30/18 | | | $991,703 | |
The net change in unrealized appreciation or depreciation from investments held as level 3 at June 30, 2018 is $0. At June 30, 2018, the fund held one level 3 security.
Foreign Currency Translation – Purchases and sales of foreign investments, income, and expenses are converted into U.S. dollars based upon currency exchange rates prevailing on the respective dates of such transactions or on the reporting date for foreign denominated receivables and payables. Gains and losses attributable to foreign currency exchange rates on sales of securities are recorded for financial statement purposes as net realized gains and losses on investments. Gains and losses attributable to foreign
17
MFS High Yield Portfolio
Notes to Financial Statements (unaudited) – continued
exchange rate movements on receivables, payables, income and expenses are recorded for financial statement purposes as foreign currency transaction gains and losses. That portion of both realized and unrealized gains and losses on investments that results from fluctuations in foreign currency exchange rates is not separately disclosed.
Derivatives – The fund uses derivatives primarily to increase or decrease exposure to a particular market or segment of the market, or security, to increase or decrease interest rate or currency exposure, or as alternatives to direct investments. Derivatives are used for hedging or non-hedging purposes. While hedging can reduce or eliminate losses, it can also reduce or eliminate gains. When the fund uses derivatives as an investment to increase market exposure, or for hedging purposes, gains and losses from derivative instruments may be substantially greater than the derivative’s original cost.
The derivative instruments used by the fund during the period were futures contracts and forward foreign currency exchange contracts. Depending on the type of derivative, the fund may exit a derivative position by entering into an offsetting transaction with a counterparty or exchange, negotiating an agreement with the derivative counterparty, or novating the position to a third party. The fund may be unable to promptly close out a futures position in instances where the daily fluctuation in the price for that type of future exceeds the daily limit set by the exchange. The fund’s period end derivatives, as presented in the Portfolio of Investments and the associated Derivative Contract tables, generally are indicative of the volume of its derivative activity during the period.
The following table presents, by major type of derivative contract, the fair value, on a gross basis, of the asset and liability components of derivatives held by the fund at June 30, 2018 as reported in the Statement of Assets and Liabilities:
| | | | | | | | | | |
| | | | | Fair Value (a) | |
| Risk | | Derivative Contracts | | Asset Derivatives | | | Liability Derivatives | |
| Interest Rate | | Interest Rate Futures | | | $24,461 | | | | $(6,967 | ) |
| Foreign Exchange | | Forward Foreign Currency Exchange | | | 10,817 | | | | — | |
| Total | | | | | $35,278 | | | | $(6,967 | ) |
| (a) | Values presented in this table for futures contracts correspond to the values reported in the fund’s Portfolio of Investments. Only the current day net variation margin for futures contracts is separately reported within the fund’s Statement of Assets and Liabilities. |
The following table presents, by major type of derivative contract, the realized gain (loss) on derivatives held by the fund for the six months ended June 30, 2018 as reported in the Statement of Operations:
| | | | | | | | |
| Risk | | Futures
Contracts | | | Forward Foreign
Currency
Exchange
Contracts | |
| Interest Rate | | | $352,795 | | | | $— | |
| Foreign Exchange | | | — | | | | 59,083 | |
| Total | | | $352,795 | | | | $59,083 | |
The following table presents, by major type of derivative contract, the change in unrealized appreciation or depreciation on derivatives held by the fund for the six months ended June 30, 2018 as reported in the Statement of Operations:
| | | | | | | | |
| Risk | | Futures
Contracts | | | Forward Foreign
Currency
Exchange
Contracts | |
| Interest Rate | | | $(49,740 | ) | | | $— | |
| Foreign Exchange | | | — | | | | 10,817 | |
| Total | | | $(49,740 | ) | | | $10,817 | |
Derivative counterparty credit risk is managed through formal evaluation of the creditworthiness of all potential counterparties. On certain, but not all, uncleared derivatives, the fund attempts to reduce its exposure to counterparty credit risk whenever possible by entering into an ISDA Master Agreement on a bilateral basis. The ISDA Master Agreement gives each party to the agreement the right to terminate all transactions traded under such agreement if there is a specified deterioration in the credit quality of the other party. Upon an event of default or a termination of the ISDA Master Agreement, the non-defaulting party has the right to close out all transactions traded under such agreement and to net amounts owed under each agreement to one net amount payable by one party to the other. This right to close out and net payments across all transactions traded under the ISDA Master Agreement could result in a reduction of the fund’s credit risk to such counterparty equal to any amounts payable by the fund under the applicable transactions, if any.
18
MFS High Yield Portfolio
Notes to Financial Statements (unaudited) – continued
Collateral and margin requirements differ by type of derivative. For cleared derivatives (e.g., futures contracts, cleared swaps, and exchange-traded options), margin requirements are set by the clearing broker and the clearing house and collateral, in the form of cash or securities, is posted by the fund directly with the clearing broker. Collateral terms are counterparty agreement specific for uncleared derivatives (e.g., forward foreign currency exchange contracts, uncleared swap agreements, and uncleared options) and collateral, in the form of cash and securities, is held in segregated accounts with the fund’s custodian in connection with these agreements. For derivatives traded under an ISDA Master Agreement, which contains a collateral support annex, the collateral requirements are netted across all transactions traded under such counterparty-specific agreement and one amount is posted from one party to the other to collateralize such obligations. Cash that has been segregated or delivered to cover the fund’s collateral or margin obligations under derivative contracts, if any, will be reported separately in the Statement of Assets and Liabilities as restricted cash for uncleared derivatives and/or deposits with brokers for cleared derivatives. Securities pledged as collateral or margin for the same purpose, if any, are noted in the Portfolio of Investments. The fund may be required to make payments of interest on uncovered collateral or margin obligations with the broker. Any such payments are included in “Miscellaneous” expense in the Statement of Operations.
Futures Contracts – The fund entered into futures contracts which may be used to hedge against or obtain broad market exposure, interest rate exposure, currency exposure, or to manage duration. A futures contract represents a commitment for the future purchase or sale of an asset at a specified price on a specified date.
Upon entering into a futures contract, the fund is required to deposit with the broker, either in cash or securities, an initial margin in an amount equal to a specified percentage of the notional amount of the contract. Subsequent payments (variation margin) are made or received by the fund each day, depending on the daily fluctuations in the value of the contract, and are recorded for financial statement purposes as unrealized gain or loss by the fund until the contract is closed or expires at which point the gain or loss on futures contracts is realized.
The fund bears the risk of interest rates, exchange rates or securities prices moving unexpectedly, in which case, the fund may not achieve the anticipated benefits of the futures contracts and may realize a loss. While futures contracts may present less counterparty risk to the fund since the contracts are exchange traded and the exchange’s clearinghouse guarantees payments to the broker, there is still counterparty credit risk due to the insolvency of the broker. The fund’s maximum risk of loss due to counterparty credit risk is equal to the margin posted by the fund to the broker plus any gains or minus any losses on the outstanding futures contracts.
Forward Foreign Currency Exchange Contracts – The fund entered into forward foreign currency exchange contracts for the purchase or sale of a specific foreign currency at a fixed price on a future date. These contracts may be used to hedge the fund’s currency risk or for non-hedging purposes. For hedging purposes, the fund may enter into contracts to deliver or receive foreign currency that the fund will receive from or use in its normal investment activities. The fund may also use contracts to hedge against declines in the value of foreign currency denominated securities due to unfavorable exchange rate movements. For non-hedging purposes, the fund may enter into contracts with the intent of changing the relative exposure of the fund’s portfolio of securities to different currencies to take advantage of anticipated exchange rate changes.
Forward foreign currency exchange contracts are adjusted by the daily exchange rate of the underlying currency and any unrealized gains or losses are recorded as a receivable or payable for forward foreign currency exchange contracts until the contract settlement date. On contract settlement date, any gain or loss on the contract is recorded as realized gains or losses on forward foreign currency exchange contracts.
Risks may arise upon entering into these contracts from unanticipated movements in the value of the contract and from the potential inability of counterparties to meet the terms of their contracts. Generally, the fund’s maximum risk due to counterparty credit risk is the unrealized gain on the contract due to the use of Continuous Linked Settlement, a multicurrency cash settlement system for the centralized settlement of foreign transactions. This risk is mitigated in cases where there is an ISDA Master Agreement between the fund and the counterparty providing for netting as described above and, where applicable, by the posting of collateral by the counterparty to the fund to cover the fund’s exposure to the counterparty under such ISDA Master Agreement.
Loans and Other Direct Debt Instruments – The fund invests in loans and loan participations or other receivables. These investments may include standby financing commitments, including revolving credit facilities, which contractually obligate the fund to supply additional cash to the borrower on demand. The fund generally provides this financial support in order to preserve its existing investment or to obtain a more senior secured interest in the assets of the borrower. Loan participations involve a risk of insolvency of the lending bank or other financial intermediary.
Indemnifications – Under the fund’s organizational documents, its officers and Trustees may be indemnified against certain liabilities and expenses arising out of the performance of their duties to the fund. Additionally, in the normal course of business, the fund enters into agreements with service providers that may contain indemnification clauses. The fund’s maximum exposure under these agreements is unknown as this would involve future claims that may be made against the fund that have not yet occurred.
19
MFS High Yield Portfolio
Notes to Financial Statements (unaudited) – continued
Investment Transactions and Income – Investment transactions are recorded on the trade date. Interest income is recorded on the accrual basis. All premium and discount is amortized or accreted for financial statement purposes in accordance with U.S. generally accepted accounting principles. The fund earns certain fees in connection with its floating rate loan purchasing activities. These fees are in addition to interest payments earned and may include amendment fees, commitment fees, facility fees, consent fees, and prepayment fees. Commitment fees are recorded on an accrual basis as income in the accompanying financial statements. Dividends received in cash are recorded on the ex-dividend date. Certain dividends from foreign securities will be recorded when the fund is informed of the dividend if such information is obtained subsequent to the ex-dividend date. Dividend and interest payments received in additional securities are recorded on the ex-dividend or ex-interest date in an amount equal to the value of the security on such date. Debt obligations may be placed on non-accrual status or set to accrue at a rate of interest less than the contractual coupon when the collection of all or a portion of interest has become doubtful. Interest income for those debt obligations may be further reduced by the write-off of the related interest receivables when deemed uncollectible.
The fund may receive proceeds from litigation settlements. Any proceeds received from litigation involving portfolio holdings are reflected in the Statement of Operations in realized gain/loss if the security has been disposed of by the fund or in unrealized gain/loss if the security is still held by the fund. Any other proceeds from litigation not related to portfolio holdings are reflected as other income in the Statement of Operations.
Legal fees and other related expenses incurred to preserve and protect the value of a security owned are added to the cost of the security; other legal fees are expensed. Capital infusions made directly to the security issuer, which are generally non-recurring, incurred to protect or enhance the value of high-yield debt securities, are reported as additions to the cost basis of the security. Costs that are incurred to negotiate the terms or conditions of capital infusions or that are expected to result in a plan of reorganization are reported as realized losses. Ongoing costs incurred to protect or enhance an investment, or costs incurred to pursue other claims or legal actions, are expensed.
Tax Matters and Distributions – The fund intends to qualify as a regulated investment company, as defined under Subchapter M of the Internal Revenue Code, and to distribute all of its taxable income, including realized capital gains. As a result, no provision for federal income tax is required. The fund’s federal tax returns, when filed, will remain subject to examination by the Internal Revenue Service for a three year period. Management has analyzed the fund’s tax positions taken on federal and state tax returns for all open tax years and does not believe that there are any uncertain tax positions that require recognition of a tax liability. Foreign taxes, if any, have been accrued by the fund in the accompanying financial statements in accordance with the applicable foreign tax law. Foreign income taxes may be withheld by certain countries in which the fund invests. Additionally, capital gains realized by the fund on securities issued in or by certain foreign countries may be subject to capital gains tax imposed by those countries.
Distributions to shareholders are recorded on the ex-dividend date. Income and capital gain distributions are determined in accordance with income tax regulations, which may differ from U.S. generally accepted accounting principles. Certain capital accounts in the financial statements are periodically adjusted for permanent differences in order to reflect their tax character. These adjustments have no impact on net assets or net asset value per share. Temporary differences which arise from recognizing certain items of income, expense, gain or loss in different periods for financial statement and tax purposes will reverse at some time in the future. Distributions in excess of net investment income or net realized gains are temporary overdistributions for financial statement purposes resulting from differences in the recognition or classification of income or distributions for financial statement and tax purposes.
Book/tax differences primarily relate to defaulted bonds, expiration of capital loss carryforwards, and amortization and accretion of debt securities.
The tax character of distributions declared to shareholders for the last fiscal year is as follows:
| | | | |
| | | Year ended | |
| | | 12/31/17 | |
| Ordinary income (including any short-term capital gains) | | | $29,244,080 | |
The federal tax cost and the tax basis components of distributable earnings were as follows:
| | | | |
| As of 6/30/18 | | | | |
| Cost of investments | | | $422,933,166 | |
| Gross depreciation | | | (16,762,910 | ) |
| Net unrealized appreciation (depreciation) | | | $(16,762,910 | ) |
| |
| As of 12/31/17 | | | | |
| Undistributed ordinary income | | | 22,862,321 | |
| Capital loss carryforwards | | | (32,124,248 | ) |
| Net unrealized appreciation (depreciation) | | | (1,371,059 | ) |
The aggregate cost above includes prior fiscal year end tax adjustments, if applicable.
20
MFS High Yield Portfolio
Notes to Financial Statements (unaudited) – continued
As of December 31, 2017, the fund had capital loss carryforwards available to offset future realized gains. These net capital losses may be carried forward indefinitely and their character is retained as short-term and/or long-term losses. Such losses are characterized as follows:
Multiple Classes of Shares of Beneficial Interest – The fund offers multiple classes of shares, which differ in their respective distribution and/or service fees. The fund’s income, realized and unrealized gain (loss), and common expenses are allocated to shareholders based on the daily net assets of each class. Dividends are declared separately for each class. Differences in per share dividend rates are generally due to differences in separate class expenses. The fund’s distributions declared to shareholders as reported in the Statements of Changes in Net Assets are presented by class as follows:
| | | | | | | | |
| | | From net investment
income | |
| | | Six months ended
6/30/18 | | | Year ended
12/31/17 | |
| Initial Class | | | $— | | | | $25,150,910 | |
| Service Class | | | — | | | | 4,093,170 | |
| Total | | | $— | | | | $29,244,080 | |
| (3) | | Transactions with Affiliates |
Investment Adviser – The fund has an investment advisory agreement with MFS to provide overall investment management and related administrative services and facilities to the fund. The management fee is computed daily and paid monthly at the following annual rates based on the fund’s average daily net assets:
| | | | |
| Up to $1 billion | | | 0.70% | |
| In excess of $1 billion | | | 0.65% | |
MFS has agreed in writing to reduce its management fee by a specified amount if certain MFS mutual fund assets exceed thresholds agreed to by MFS and the fund’s Board of Trustees. For the six months ended June 30, 2018, this management fee reduction amounted to $19,481, which is included in the reduction of total expenses in the Statement of Operations. The management fee incurred for the six months ended June 30, 2018 was equivalent to an annual effective rate of 0.69% of the fund’s average daily net assets.
The investment adviser has agreed in writing to pay a portion of the fund’s total annual operating expenses, excluding interest, taxes, extraordinary expenses, brokerage and transaction costs, and investment-related expenses, such that total annual operating expenses do not exceed 0.72% of average daily net assets for the Initial Class shares and 0.97% of average daily net assets for the Service Class shares. This written agreement will continue until modified by the fund’s Board of Trustees, but such agreement will continue at least until April 30, 2020. For the six months ended June 30, 2018, this reduction amounted to $93,106, which is included in the reduction of total expenses in the Statement of Operations.
Distributor – MFS Fund Distributors, Inc. (MFD), a wholly-owned subsidiary of MFS, is the distributor of shares of the fund. The Trustees have adopted a distribution plan for the Service Class shares pursuant to Rule 12b-1 under the Investment Company Act of 1940.
The fund’s distribution plan provides that the fund will pay MFD distribution and/or service fees equal to 0.25% per annum of its average daily net assets attributable to Service Class shares as partial consideration for services performed and expenses incurred by MFD and financial intermediaries (including participating insurance companies that invest in the fund to fund variable annuity and variable life insurance contracts, sponsors of qualified retirement and pension plans that invest in the fund, and affiliates of these participating insurance companies and plan sponsors) in connection with the sale and distribution of the Service Class shares. MFD may subsequently pay all, or a portion, of the distribution and/or service fees to financial intermediaries.
Shareholder Servicing Agent – MFS Service Center, Inc. (MFSC), a wholly-owned subsidiary of MFS, receives a fee from the fund for its services as shareholder servicing agent. For the six months ended June 30, 2018, the fee was $7,040, which equated to 0.0033% annually of the fund’s average daily net assets. MFSC also receives payment from the fund for out-of-pocket expenses paid by MFSC on behalf of the fund. For the six months ended June 30, 2018, these costs amounted to $189.
Administrator – MFS provides certain financial, legal, shareholder communications, compliance, and other administrative services to the fund. Under an administrative services agreement, the fund reimburses MFS the costs incurred to provide these services. The fund is charged an annual fixed amount of $17,500 plus a fee based on average daily net assets. The administrative services fee incurred for the six months ended June 30, 2018 was equivalent to an annual effective rate of 0.0173% of the fund’s average daily net assets.
21
MFS High Yield Portfolio
Notes to Financial Statements (unaudited) – continued
Trustees’ and Officers’ Compensation – The fund pays compensation to independent Trustees in the form of a retainer, attendance fees, and additional compensation to Board and Committee chairpersons. The fund does not pay compensation directly to Trustees or officers of the fund who are also officers of the investment adviser, all of whom receive remuneration for their services to the fund from MFS. Certain officers and Trustees of the fund are officers or directors of MFS, MFD, and MFSC.
Other – This fund and certain other funds managed by MFS (the funds) have entered into a service agreement (the ISO Agreement) which provides for payment of fees solely by the funds to Tarantino LLC in return for the provision of services of an Independent Senior Officer (ISO) for the funds. Frank L. Tarantino serves as the ISO and is an officer of the funds and the sole member of Tarantino LLC. The funds can terminate the ISO Agreement with Tarantino LLC at any time under the terms of the ISO Agreement. For the six months ended June 30, 2018, the fee paid by the fund under this agreement was $378 and is included in “Miscellaneous” expense in the Statement of Operations. MFS has agreed to bear all expenses associated with office space, other administrative support, and supplies provided to the ISO.
The fund invests in the MFS Institutional Money Market Portfolio which is managed by MFS and seeks current income consistent with preservation of capital and liquidity. This money market fund does not pay a management fee to MFS.
For the six months ended June 30, 2018, purchases and sales of investments, other than short-term obligations, aggregated $102,694,290 and $116,187,652, respectively.
| (5) | | Shares of Beneficial Interest |
The fund’s Declaration of Trust permits the Trustees to issue an unlimited number of full and fractional shares of beneficial interest. Transactions in fund shares were as follows:
| | | | | | | | | | | | | | | | |
| | | Six months ended 6/30/18 | | | Year ended 12/31/17 | |
| | | Shares | | | Amount | | | Shares | | | Amount | |
| Shares sold | | | | | | | | | | | | | | | | |
Initial Class | | | 1,277,625 | | | | $7,329,441 | | | | 3,789,799 | | | | $22,219,006 | |
Service Class | | | 295,943 | | | | 1,670,924 | | | | 1,361,172 | | | | 8,035,087 | |
| | | 1,573,568 | | | | $9,000,365 | | | | 5,150,971 | | | | $30,254,093 | |
| Shares issued to shareholders in reinvestment of distributions | | | | | | | | | | | | | | | | |
Initial Class | | | — | | | | $— | | | | 4,412,440 | | | | $25,150,910 | |
Service Class | | | — | | | | — | | | | 727,028 | | | | 4,093,170 | |
| | | — | | | | $— | | | | 5,139,468 | | | | $29,244,080 | |
| Shares reacquired | | | | | | | | | | | | | | | | |
Initial Class | | | (5,418,414 | ) | | | $(30,999,734 | ) | | | (11,406,776 | ) | | | $(67,327,394 | ) |
Service Class | | | (1,061,889 | ) | | | (5,999,202 | ) | | | (3,919,122 | ) | | | (22,701,757 | ) |
| | | (6,480,303 | ) | | | $(36,998,936 | ) | | | (15,325,898 | ) | | | $(90,029,151 | ) |
| Net change | | | | | | | | | | | | | | | | |
Initial Class | | | (4,140,789 | ) | | | $(23,670,293 | ) | | | (3,204,537 | ) | | | $(19,957,478 | ) |
Service Class | | | (765,946 | ) | | | (4,328,278 | ) | | | (1,830,922 | ) | | | (10,573,500 | ) |
| | | (4,906,735 | ) | | | $(27,998,571 | ) | | | (5,035,459 | ) | | | $(30,530,978 | ) |
The fund is one of several mutual funds in which certain MFS funds may invest. The MFS funds do not invest in the underlying funds for the purpose of exercising management or control. At the end of the period, the MFS Moderate Allocation Portfolio, the MFS Conservative Allocation Portfolio, and the MFS Growth Allocation Portfolio were the owners of record of approximately 19%, 6%, and 5%, respectively, of the value of outstanding voting shares of the fund.
The fund and certain other funds managed by MFS participate in a $1.25 billion unsecured committed line of credit, subject to a $1 billion sublimit, provided by a syndication of banks under a credit agreement. Borrowings may be made for temporary financing needs. Interest is charged to each fund, based on its borrowings, generally at a rate equal to the higher of the Overnight Bank Funding rate or daily one month LIBOR plus an agreed upon spread. A commitment fee, based on the average daily, unused portion of the committed line of credit, is allocated among the participating funds. In addition, the fund and other funds managed by MFS have established unsecured uncommitted borrowing arrangements with certain banks for temporary financing needs. Interest is charged to each fund, based on its borrowings, at a rate equal to the Overnight Bank Funding rate plus an agreed upon spread. For the six months ended June 30, 2018, the fund’s commitment fee and interest expense were $1,516 and $0, respectively, and are included in “Miscellaneous” expense in the Statement of Operations.
22
MFS High Yield Portfolio
Notes to Financial Statements (unaudited) – continued
| (7) | | Investments in Affiliated Issuers |
An affiliated issuer may be considered one in which the fund owns 5% or more of the outstanding voting securities, or a company which is under common control. For the purposes of this report, the fund assumes the following to be affiliated issuers:
| | | | | | | | | | | | | | | | | | |
| Affiliated Issuers | | | | Beginning
Shares/Par
Amount | | | Acquisitions
Shares/Par
Amount | | | Dispositions
Shares/Par
Amount | | | Ending
Shares/Par
Amount | |
| MFS Institutional Money Market Portfolio | | | | | 10,426,974 | | | | 57,418,120 | | | | (58,931,221 | ) | | | 8,913,873 | |
| | | | | |
| Affiliated Issuers | | Realized
Gain (Loss) | | Change in
Unrealized
Appreciation/
Depreciation | | | Capital Gain
Distributions | | | Dividend
Income | | | Ending
Value | |
| MFS Institutional Money Market Portfolio | | $(943) | | | $1,298 | | | | $— | | | | $83,526 | | | | $8,913,873 | |
In May 2015, the Motors Liquidation Company Avoidance Action Trust (hereafter, “AAT”) served upon the fund a complaint in an adversary proceeding in the U.S. Bankruptcy Court for the Southern District of New York, captioned Motors Liquidation Company Avoidance Action Trust v. JPMorgan Chase Bank, N.A., et al. (No. 09-00504 (REG)). The complaint, which was originally filed in 2009 but not served on the fund until 2015, names as defendants over 500 entities (including the fund) that held an interest in a $1.5 billion General Motors (GM) term loan in 2009, when GM filed for bankruptcy. The AAT alleges that the fund and the other term loan lenders were improperly treated as secured lenders with respect to the term loan shortly before and immediately after GM’s bankruptcy, receiving full principal and interest payments under the loan. The AAT alleges that the fund and other term loan lenders should have been treated as unsecured (or partially unsecured) creditors because the main lien securing the collateral was allegedly not perfected at the time of GM’s bankruptcy due to an erroneous filing in October 2008 that terminated the financing statement perfecting the lien. The AAT seeks to claw back payments made to the fund and the other term loan lenders after, and during the 90 days before, GM’s June 2009 bankruptcy petition. During that time period, the fund received term loan payments of approximately $3,720,000. The fund cannot predict the outcome of this proceeding. Among other things, it is unclear whether the AAT’s claims will succeed; what the fund would be entitled to as an unsecured (or partially unsecured) creditor, given the existence of other collateral not impacted by the erroneous October 2008 filing; whether third parties responsible for the erroneous October 2008 filing would bear some or all of any liability; and the degree to which the fund may be entitled to indemnification from a third party for any amount required to be disgorged. The fund has and will continue to incur legal expenses associated with the defense of this action and in related claims against third parties.
23
MFS High Yield Portfolio
PROXY VOTING POLICIES AND INFORMATION
MFS votes proxies on behalf of the fund pursuant to proxy voting policies and procedures that are available without charge, upon request, by calling 1-800-225-2606, by visiting mfs.com/proxyvoting, or by visiting the SEC’s Web site at http://www.sec.gov.
Information regarding how the fund voted proxies relating to portfolio securities during the most recent twelve-month period ended June 30 is available by August 31 of each year without charge by visiting mfs.com/proxyvoting, or by visiting the SEC’s Web site at http://www.sec.gov.
QUARTERLY PORTFOLIO DISCLOSURE
The fund will file a complete schedule of portfolio holdings with the Securities and Exchange Commission (the Commission) for the first and third quarters of each fiscal year on Form N-Q. The fund’s Form N-Q is available on the EDGAR database on the Commission’s Internet Web site at http://www.sec.gov, and may be reviewed and copied at the:
Public Reference Room
Securities and Exchange Commission
100 F Street, NE, Room 1580
Washington, D.C. 20549
Information on the operation of the Public Reference Room may be obtained by calling the Commission at 1-800-SEC-0330. Copies of the fund’s Form N-Q also may be obtained, upon payment of a duplicating fee, by electronic request at the following e-mail address: publicinfo@sec.gov or by writing the Public Reference Section at the above address.
FURTHER INFORMATION
From time to time, MFS may post important information about the fund or the MFS funds on the MFS web site (mfs.com). This information is available at https://www.mfs.com/en-us/what-we-do/announcements.html or at mfs.com/vit2 by choosing the fund’s name.
INFORMATION ABOUT FUND CONTRACTS AND LEGAL CLAIMS
The fund has entered into contractual arrangements with an investment adviser, administrator, distributor, shareholder servicing agent, 529 program manager (if applicable), and custodian who each provide services to the fund. Unless expressly stated otherwise, shareholders are not parties to, or intended beneficiaries of these contractual arrangements, and these contractual arrangements are not intended to create any shareholder right to enforce them against the service providers or to seek any remedy under them against the service providers, either directly or on behalf of the fund.
Under the Trust’s By-Laws and Declaration of Trust, any claims asserted against or on behalf of the MFS Funds, including claims against Trustees and Officers, must be brought in state and federal courts located within the Commonwealth of Massachusetts.
24
Semiannual Report
June 30, 2018

MFS® International Growth Portfolio

MFS® Variable Insurance Trust II
FCI-SEM
MFS® International Growth Portfolio
CONTENTS
The report is prepared for the general information of contract owners. It is authorized for distribution to prospective investors only when preceded or accompanied by a current prospectus.
NOT FDIC INSURED • MAY LOSE VALUE • NO BANK OR CREDIT UNION GUARANTEE • NOT A DEPOSIT • NOT INSURED BY ANY FEDERAL GOVERNMENT AGENCY OR NCUA/NCUSIF
MFS International Growth Portfolio
LETTER FROM THE EXECUTIVE CHAIRMAN

Dear Contract Owners:
Rising bond yields, international trade friction and geopolitical uncertainty have contributed to a measurable uptick in market volatility — a departure from the low-volatility environment that prevailed for much of 2017. In recent months, against this more challenging backdrop, global markets have given back some of the strong gains recorded during 2017 and early 2018. But global economic growth remains healthy, notwithstanding signs of a modest slowdown over the past few months, particularly in Europe and China.
Although the U.S. Federal Reserve continues to gradually raise interest rates and shrink its balance sheet, monetary policy remains accommodative around the world, with many central banks taking only tentative steps toward tighter policies. Newly enacted U.S. tax reforms have been welcomed by equity markets, while emerging market economies have recently had to contend with tighter financial conditions as a result of firmer U.S. Treasury yields and a stronger dollar. Around the world, inflation remains largely subdued, but tight labor markets and solid global demand have investors on the lookout for its potential resurgence. Increased U.S. protectionism is also a growing concern, as investors fear that trade disputes could dampen business sentiment, leading to slower global growth.
As a global investment manager, MFS® strives to create long-term value for clients through an active approach and an investment platform built on nearly a century of expertise. To make that long-term value meaningful for clients, we work to align with you on our beliefs, your needs and the time it takes to deliver on your desired outcomes.
Respectfully,

Robert J. Manning
Executive Chairman
MFS Investment Management
August 16, 2018
The opinions expressed in this letter are subject to change and may not be relied upon for investment advice. No forecasts can be guaranteed.
1
MFS International Growth Portfolio
PORTFOLIO COMPOSITION
Portfolio structure
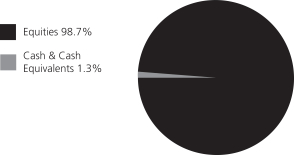
| | | | |
| Top ten holdings | | | | |
| Nestle S.A. | | | 3.7% | |
| SAP AG | | | 3.2% | |
| AIA Group Ltd. | | | 3.0% | |
| Roche Holding AG | | | 3.0% | |
| Accenture PLC, “A” | | | 3.0% | |
| Taiwan Semiconductor Manufacturing Co. Ltd., ADR | | | 2.8% | |
| L’Oréal | | | 2.7% | |
| LVMH Moet Hennessy Louis Vuitton SE | | | 2.3% | |
| Canadian National Railway Co. | | | 2.3% | |
| Pernod Ricard S.A. | | | 2.2% | |
| |
| Equity sectors | | | | |
| Consumer Staples | | | 18.3% | |
| Technology | | | 17.4% | |
| Health Care | | | 13.0% | |
| Financial Services | | | 11.7% | |
| Basic Materials | | | 7.9% | |
| Industrial Goods & Services | | | 6.8% | |
| Special Products & Services | | | 6.7% | |
| Retailing | | | 6.0% | |
| Leisure | | | 3.9% | |
| Transportation | | | 2.4% | |
| Energy | | | 2.1% | |
| Utilities & Communications | | | 1.7% | |
| Autos & Housing | | | 0.8% | |
| | | | |
| Issuer country weightings (x) | | | | |
| France | | | 18.1% | |
| Germany | | | 11.6% | |
| Switzerland | | | 11.5% | |
| United Kingdom | | | 10.9% | |
| Japan | | | 9.2% | |
| China | | | 6.4% | |
| United States | | | 5.7% | |
| Canada | | | 4.0% | |
| Taiwan | | | 3.3% | |
| Other Countries | | | 19.3% | |
| |
| Currency exposure weightings (y) | | | | |
| Euro | | | 33.6% | |
| British Pound Sterling | | | 11.7% | |
| Swiss Franc | | | 11.5% | |
| United States Dollar | | | 9.5% | |
| Japanese Yen | | | 9.2% | |
| Hong Kong Dollar | | | 4.4% | |
| Chinese Renminbi | | | 4.2% | |
| Taiwan Dollar | | | 3.3% | |
| Indian Rupee | | | 3.0% | |
| Other Currencies | | | 9.6% | |
| (x) | Represents the portfolio’s exposure to issuer countries as a percentage of a portfolio’s net assets. For purposes of this presentation, United States includes Cash & Cash Equivalents. |
| (y) | Represents the portfolio’s exposure to a particular currency as a percentage of a portfolio’s net assets. For purposes of this presentation, United States Dollar includes Cash & Cash Equivalents. |
Cash & Cash Equivalents includes any cash, investments in money market funds, short-term securities, and other assets less liabilities. Please see the Statement of Assets and Liabilities for additional information related to the fund’s cash position and other assets and liabilities.
Percentages are based on net assets as of June 30, 2018.
The portfolio is actively managed and current holdings may be different.
2
MFS International Growth Portfolio
EXPENSE TABLE
Fund Expenses Borne by the Contract Holders during the Period,
January 1, 2018 through June 30, 2018
As a contract holder of the fund, you incur ongoing costs, including management fees; distribution and/or service (12b-1) fees; and other fund expenses. This example is intended to help you understand your ongoing costs (in dollars) of investing in the fund and to compare these costs with the ongoing costs of investing in other mutual funds.
The example is based on an investment of $1,000 invested at the beginning of the period and held for the entire period January 1, 2018 through June 30, 2018.
Actual Expenses
The first line for each share class in the following table provides information about actual account values and actual expenses. You may use the information in this line, together with the amount you invested, to estimate the expenses that you paid over the period. Simply divide your account value by $1,000 (for example, an $8,600 account value divided by $1,000 = 8.6), then multiply the result by the number in the first line under the heading entitled “Expenses Paid During Period” to estimate the expenses you paid on your account during this period.
Hypothetical Example for Comparison Purposes
The second line for each share class in the following table provides information about hypothetical account values and hypothetical expenses based on the fund’s actual expense ratio and an assumed rate of return of 5% per year before expenses, which is not the fund’s actual return. The hypothetical account values and expenses may not be used to estimate the actual ending account balance or expenses you paid for the period. You may use this information to compare the ongoing costs of investing in the fund and other funds. To do so, compare this 5% hypothetical example with the 5% hypothetical examples that appear in the shareholder reports of the other funds.
Please note that the expenses shown in the table are meant to highlight the fund’s ongoing costs only and do not take into account the fees and expenses imposed under the variable contracts through which your investment in the fund is made. Therefore, the second line for each share class in the table is useful in comparing ongoing costs associated with an investment in vehicles (such as the fund) which fund benefits under variable annuity and variable life insurance contracts and to qualified pension and retirement plans only, and will not help you determine the relative total costs of investing in the fund through variable annuity and variable life insurance contracts. If the fees and expenses imposed under the variable contracts were included, your costs would have been higher.
| | | | | | | | | | | | | | | | | | |
| Share Class | | | | Annualized
Expense Ratio | | | Beginning
Account Value
1/01/18 | | | Ending
Account Value
6/30/18 | | | Expenses Paid
During Period (p)
1/01/18-6/30/18 | |
| Initial Class | | Actual | | | 1.03% | | | | $1,000.00 | | | | $1,010.97 | | | | $5.14 | |
| | Hypothetical (h) | | | 1.03% | | | | $1,000.00 | | | | $1,019.69 | | | | $5.16 | |
| Service Class | | Actual | | | 1.28% | | | | $1,000.00 | | | | $1,009.11 | | | | $6.38 | |
| | Hypothetical (h) | | | 1.28% | | | | $1,000.00 | | | | $1,018.45 | | | | $6.41 | |
| (h) | 5% class return per year before expenses. |
| (p) | “Expenses Paid During Period” are equal to each class’s annualized expense ratio, as shown above, multiplied by the average account value over the period, multiplied by 181/365 (to reflect the one-half year period). |
Notes to Expense Table
Changes to the fund’s fee arrangements will occur during the fund’s current fiscal year. Had these fee changes been in effect during the six month period, the annualized expense ratios, the actual expenses paid during the period, and the hypothetical expenses paid during the period would have been approximately 0.88%, $4.39, and $4.41 for Initial Class and 1.13%, $5.63, and $5.66 for Service Class, respectively. For further information about the fund’s fee arrangements and changes to those fee arrangements, please see Note 3 in the Notes to Financial Statements.
3
MFS International Growth Portfolio
PORTFOLIO OF INVESTMENTS – 6/30/18 (unaudited)
The Portfolio of Investments is a complete list of all securities owned by your fund. It is categorized by broad-based asset classes.
| | | | | | | | |
| Issuer | | Shares/Par | | | Value ($) | |
| COMMON STOCKS – 98.7% | | | | | | | | |
| Aerospace – 1.4% | | | | | |
| Rolls-Royce Holdings PLC | | | 161,065 | | | $ | 2,100,573 | |
| | | | | | | | |
| Alcoholic Beverages – 5.3% | | | | | |
| AmBev S.A., ADR | | | 124,799 | | | $ | 577,819 | |
| China Resources Beer Holdings Co. Ltd. | | | 230,000 | | | | 1,116,932 | |
| Diageo PLC | | | 81,135 | | | | 2,912,397 | |
| Pernod Ricard S.A. | | | 20,387 | | | | 3,327,463 | |
| | | | | | | | |
| | | | | | $ | 7,934,611 | |
| | | | | | | | |
| Apparel Manufacturers – 5.0% | | | | | |
| Burberry Group PLC | | | 51,555 | | | $ | 1,469,658 | |
| Kering S.A. | | | 4,539 | | | | 2,563,392 | |
| LVMH Moet Hennessy Louis Vuitton SE | | | 10,432 | | | | 3,467,792 | |
| | | | | | | | |
| | | | | | $ | 7,500,842 | |
| | | | | | | | |
| Broadcasting – 1.6% | | | | | |
| Publicis Groupe S.A. (l) | | | 15,550 | | | $ | 1,068,568 | |
| WPP PLC | | | 89,318 | | | | 1,406,278 | |
| | | | | | | | |
| | | | | | $ | 2,474,846 | |
| | | | | | | | |
| Business Services – 6.7% | | | | | |
| Accenture PLC, “A” | | | 27,203 | | | $ | 4,450,139 | |
| Brenntag AG | | | 21,434 | | | | 1,194,461 | |
| Compass Group PLC | | | 75,800 | | | | 1,614,860 | |
| Experian Group Ltd. | | | 77,186 | | | | 1,909,483 | |
| Intertek Group PLC | | | 12,754 | | | | 962,123 | |
| | | | | | | | |
| | | | | | $ | 10,131,066 | |
| | | | | | | | |
| Computer Software – 4.8% | | | | | |
| Dassault Systems S.A. | | | 9,141 | | | $ | 1,279,146 | |
| OBIC Co. Ltd. | | | 14,000 | | | | 1,159,554 | |
| SAP AG | | | 41,409 | | | | 4,784,968 | |
| | | | | | | | |
| | | | | | $ | 7,223,668 | |
| | | | | | | | |
| Computer Software – Systems – 3.9% | | | | | |
| Amadeus IT Group S.A. | | | 30,185 | | | $ | 2,378,318 | |
| Hitachi Ltd. | | | 205,000 | | | | 1,447,211 | |
| Luxoft Holding, Inc. (a) | | | 3,480 | | | | 128,238 | |
| NICE Systems Ltd., ADR (a) | | | 18,031 | | | | 1,871,077 | |
| | | | | | | | |
| | | | | | $ | 5,824,844 | |
| | | | | | | | |
| Construction – 0.9% | | | | | |
| Toto Ltd. | | | 27,600 | | | $ | 1,281,344 | |
| | | | | | | | |
| Consumer Products – 5.5% | | | | | |
| Kao Corp. | | | 20,200 | | | $ | 1,541,706 | |
| L’Oréal | | | 16,488 | | | | 4,068,017 | |
| Reckitt Benckiser Group PLC | | | 31,992 | | | | 2,634,197 | |
| | | | | | | | |
| | | | | | $ | 8,243,920 | |
| | | | | | | | |
| Containers – 0.7% | | | | | |
| Brambles Ltd. | | | 163,998 | | | $ | 1,077,736 | |
| | | | | | | | |
| Electrical Equipment – 3.9% | | | | | |
| Legrand S.A. | | | 10,766 | | | $ | 788,546 | |
| Mettler-Toledo International, Inc. (a) | | | 2,661 | | | | 1,539,734 | |
| | | | | | | | |
| Issuer | | Shares/Par | | | Value ($) | |
| COMMON STOCKS – continued | | | | | |
| Electrical Equipment – continued | | | | | |
| Prysmian S.p.A. | | | 40,546 | | | $ | 1,007,451 | |
| Schneider Electric S.A. | | | 31,124 | | | | 2,588,850 | |
| | | | | | | | |
| | | | | | $ | 5,924,581 | |
| | | | | | | | |
| Electronics – 3.7% | | | | | |
| MediaTek, Inc. | | | 85,000 | | | $ | 836,381 | |
| Mellanox Technologies Ltd. (a) | | | 7,057 | | | | 594,905 | |
| Taiwan Semiconductor Manufacturing Co. | | | | | | | | |
| Ltd., ADR | | | 113,372 | | | | 4,144,880 | |
| | | | | | | | |
| | | | | | $ | 5,576,166 | |
| | | | | | | | |
| Energy – Independent – 1.4% | | | | | |
| Caltex Australia Ltd. | | | 28,854 | | | $ | 694,840 | |
| Oil Search Ltd. | | | 217,136 | | | | 1,430,154 | |
| | | | | | | | |
| | | | | | $ | 2,124,994 | |
| | | | | | | | |
| Energy – Integrated – 0.7% | | | | | |
| Suncor Energy, Inc. | | | 25,120 | | | $ | 1,022,264 | |
| | | | | | | | |
| Food & Beverages – 5.7% | | | | | |
| Danone S.A. | | | 41,227 | | | $ | 3,022,220 | |
| Nestle S.A. | | | 71,063 | | | | 5,501,469 | |
| | | | | | | | |
| | | | | | $ | 8,523,689 | |
| | | | | | | | |
| Food & Drug Stores – 1.0% | | | | | |
| Sundrug Co. Ltd. | | | 35,800 | | | $ | 1,451,854 | |
| | | | | | | | |
| Gaming & Lodging – 0.9% | | | | | |
| Paddy Power Betfair PLC | | | 11,956 | | | $ | 1,309,652 | |
| | | | | | | | |
| Insurance – 3.0% | | | | | |
| AIA Group Ltd. | | | 522,200 | | | $ | 4,565,989 | |
| | | | | | | | |
| Internet – 5.0% | | | | | |
| Alibaba Group Holding Ltd., ADR (a) | | | 15,867 | | | $ | 2,943,804 | |
| Baidu, Inc., ADR (a) | | | 13,610 | | | | 3,307,230 | |
| NAVER Corp. | | | 1,825 | | | | 1,249,417 | |
| | | | | | | | |
| | | | | | $ | 7,500,451 | |
| | | | | | | | |
| Leisure & Toys – 0.4% | | | | | |
| BANDAI NAMCO Holdings, Inc. | | | 16,300 | | | $ | 672,818 | |
| | | | | | | | |
| Machinery & Tools – 1.5% | | | | | |
| GEA Group AG | | | 29,352 | | | $ | 990,270 | |
| Ritchie Bros. Auctioneers, Inc. | | | 35,284 | | | | 1,203,465 | |
| | | | | | | | |
| | | | | | $ | 2,193,735 | |
| | | | | | | | |
| Major Banks – 1.5% | | | | | |
| UBS AG | | | 144,447 | | | $ | 2,222,328 | |
| | | | | | | | |
| Medical & Health Technology & Services – 1.4% | | | | | |
| Fresenius Medical Care AG & Co. KGaA | | | 20,123 | | | $ | 2,029,899 | |
| | | | | | | | |
| Medical Equipment – 4.1% | | | | | |
| Essilor International S.A. | | | 20,492 | | | $ | 2,893,205 | |
| QIAGEN N.V. (a) | | | 42,143 | | | | 1,535,495 | |
| Terumo Corp. | | | 29,700 | | | | 1,703,428 | |
| | | | | | | | |
| | | | | | $ | 6,132,128 | |
| | | | | | | | |
4
MFS International Growth Portfolio
Portfolio of Investments (unaudited) – continued
| | | | | | | | |
| Issuer | | Shares/Par | | | Value ($) | |
| COMMON STOCKS – continued | |
| Natural Gas – Distribution – 0.6% | | | | | | | | |
| China Resources Gas Group Ltd. | | | 222,000 | | | $ | 962,068 | |
| | | | | | | | |
| Other Banks & Diversified Financials – 7.2% | | | | | |
| Aeon Credit Service Co. Ltd. | | | 61,200 | | | $ | 1,306,750 | |
| Credicorp Ltd. | | | 4,200 | | | | 945,504 | |
| DBS Group Holdings Ltd. | | | 91,900 | | | | 1,794,832 | |
| Element Fleet Management Corp. | | | 72,344 | | | | 340,080 | |
| Grupo Financiero Banorte S.A. de C.V. | | | 233,242 | | | | 1,374,889 | |
| Grupo Financiero Inbursa S.A. de C.V. | | | 188,066 | | | | 263,251 | |
| HDFC Bank Ltd. | | | 94,067 | | | | 2,938,092 | |
| Julius Baer Group Ltd. | | | 25,264 | | | | 1,484,188 | |
| Komercni Banka A.S. | | | 10,325 | | | | 434,475 | |
| | | | | | | | |
| | | | | | $ | 10,882,061 | |
| | | | | | | | |
| Pharmaceuticals – 7.5% | | | | | | | | |
| Bayer AG | | | 27,525 | | | $ | 3,032,758 | |
| Novartis AG | | | 34,379 | | | | 2,604,022 | |
| Novo Nordisk A.S., “B” | | | 25,105 | | | | 1,159,580 | |
| Roche Holding AG | | | 20,348 | | | | 4,527,739 | |
| | | | | | | | |
| | | | | | $ | 11,324,099 | |
| | | | | | | | |
| Railroad & Shipping – 2.4% | | | | | | | | |
| Adani Ports and Special Economic Zone Ltd. | | | 51,113 | | | $ | 278,375 | |
| Canadian National Railway Co. | | | 41,587 | | | | 3,399,737 | |
| | | | | | | | |
| | | | | | $ | 3,678,112 | |
| | | | | | | | |
| Restaurants – 0.9% | | | | | | | | |
| Yum China Holdings, Inc. | | | 34,785 | | | $ | 1,337,831 | |
| | | | | | | | |
| Specialty Chemicals – 7.1% | | | | | | | | |
| Akzo Nobel N.V. | | | 28,707 | | | $ | 2,446,140 | |
| Croda International PLC | | | 21,126 | | | | 1,338,848 | |
| L’Air Liquide S.A. | | | 17,023 | | | | 2,137,836 | |
| Linde AG | | | 11,033 | | | | 2,633,559 | |
| Sika AG | | | 6,449 | | | | 888,715 | |
| Symrise AG | | | 14,780 | | | | 1,296,232 | |
| | | | | | | | |
| | | | | | $ | 10,741,330 | |
| | | | | | | | |
| Telecommunications – Wireless – 1.1% | | | | | |
| SoftBank Corp. | | | 21,900 | | | $ | 1,577,101 | |
| | | | | | | | |
| | | | | | | | |
| Issuer | | Shares/Par | | | Value ($) | |
| COMMON STOCKS – continued | |
| Tobacco – 1.9% | | | | | | | | |
| ITC Ltd. | | | 313,003 | | | $ | 1,216,104 | |
| Japan Tobacco, Inc. | | | 59,900 | | | | 1,674,484 | |
| | | | | | | | |
| | | | | | $ | 2,890,588 | |
| | | | | | | | |
Total Common Stocks
(Identified Cost, $92,947,283) | | | | | | $ | 148,437,188 | |
| | | | | | | | |
| |
| INVESTMENT COMPANIES (h) – 0.7% | | | | | |
| Money Market Funds – 0.7% | | | | | | | | |
MFS Institutional Money Market Portfolio, 1.9% (v) (Identified Cost, $970,909) | | | 970,976 | | | $ | 970,977 | |
| | | | | | | | |
|
| COLLATERAL FOR SECURITIES LOANED – 0.0% | |
State Street Navigator Securities Lending Government Money Market Portfolio, 1.9% (j) (Identified Cost, $33,688) | | | 33,688 | | | $ | 33,688 | |
| | | | | | | | |
OTHER ASSETS, LESS
LIABILITIES – 0.6% | | | | | | | 904,988 | |
| | | | | | | | |
| NET ASSETS – 100.0% | | | | | | $ | 150,346,841 | |
| | | | | | | | |
| (a) | | Non-income producing security. |
| (h) | | An affiliated issuer, which may be considered one in which the fund owns 5% or more of the outstanding voting securities, or a company which is under common control. At period end, the aggregate values of the fund’s investments in affiliated issuers and in unaffiliated issuers were $970,977 and $148,470,876, respectively. |
| (j) | | The rate quoted is the annualized seven-day yield of the fund at period end. |
| (l) | | A portion of this security is on loan. |
| (v) | | Affiliated issuer that is available only to investment companies managed by MFS. The rate quoted for the MFS Institutional Money Market Portfolio is the annualized seven-day yield of the fund at period end. |
The following abbreviations are used in this report and are defined:
| ADR | | American Depositary Receipt |
| PLC | | Public Limited Company |
See Notes to Financial Statements
5
MFS International Growth Portfolio
FINANCIAL STATEMENTS | STATEMENT OF ASSETS AND LIABILITIES (unaudited)
This statement represents your fund’s balance sheet, which details the assets and liabilities comprising the total value of the fund.
| | | | |
At 6/30/18 | | | | |
Assets | | | | |
Investments in unaffiliated issuers, at value, including $32,088 of securities on loan (identified cost, $92,980,971) | | | $148,470,876 | |
Investments in affiliated issuers, at value (identified cost, $970,909) | | | 970,977 | |
Cash | | | 12,274 | |
Foreign currency, at value (identified cost, $29,534) | | | 29,706 | |
Receivables for | | | | |
Investments sold | | | 512,449 | |
Interest and dividends | | | 854,000 | |
Other assets | | | 709 | |
Total assets | | | $150,850,991 | |
Liabilities | | | | |
Payables for | | | | |
Investments purchased | | | $123,570 | |
Fund shares reacquired | | | 257,117 | |
Collateral for securities loaned, at value | | | 33,688 | |
Payable to affiliates | | | | |
Investment adviser | | | 11,119 | |
Shareholder servicing costs | | | 22 | |
Distribution and/or service fees | | | 571 | |
Payable for independent Trustees’ compensation | | | 100 | |
Accrued expenses and other liabilities | | | 77,963 | |
Total liabilities | | | $504,150 | |
Net assets | | | $150,346,841 | |
Net assets consist of | | | | |
Paid-in capital | | | $71,357,575 | |
Unrealized appreciation (depreciation) | | | 55,486,452 | |
Accumulated net realized gain (loss) | | | 20,343,061 | |
Undistributed net investment income | | | 3,159,753 | |
Net assets | | | $150,346,841 | |
Shares of beneficial interest outstanding | | | 9,614,469 | |
| | | | | | | | | | | | |
| | | Net assets | | | Shares
outstanding | | | Net asset value
per share | |
Initial Class | | | $122,210,319 | | | | 7,801,014 | | | | $15.67 | |
Service Class | | | 28,136,522 | | | | 1,813,455 | | | | 15.52 | |
See Notes to Financial Statements
6
MFS International Growth Portfolio
FINANCIAL STATEMENTS | STATEMENT OF OPERATIONS (unaudited)
This statement describes how much your fund earned in investment income and accrued in expenses. It also describes any gains and/or losses generated by fund operations.
| | | | |
Six months ended 6/30/18 | | | | |
Net investment income (loss) | | | | |
Income | | | | |
Dividends | | | $2,592,748 | |
Non-cash dividends | | | 244,770 | |
Dividends from affiliated issuers | | | 5,783 | |
Income on securities loaned | | | 5,220 | |
Other | | | 39 | |
Foreign taxes withheld | | | (302,611 | ) |
Total investment income | | | $2,545,949 | |
Expenses | | | | |
Management fee | | | $697,293 | |
Distribution and/or service fees | | | 36,233 | |
Shareholder servicing costs | | | 2,448 | |
Administrative services fee | | | 16,575 | |
Independent Trustees’ compensation | | | 2,169 | |
Custodian fee | | | 38,388 | |
Shareholder communications | | | 5,323 | |
Audit and tax fees | | | 34,056 | |
Legal fees | | | 915 | |
Miscellaneous | | | 7,740 | |
Total expenses | | | $841,140 | |
Reduction of expenses by investment adviser | | | (7,144 | ) |
Net expenses | | | $833,996 | |
Net investment income (loss) | | | $1,711,953 | |
Realized and unrealized gain (loss) | | | | |
Realized gain (loss) (identified cost basis) | | | | |
Unaffiliated issuers | | | $8,873,229 | |
Affiliated issuers | | | (79 | ) |
Foreign currency | | | (16,623 | ) |
Net realized gain (loss) | | | $8,856,527 | |
Change in unrealized appreciation or depreciation | | | | |
Unaffiliated issuers (net of $9,410 decrease in deferred country tax) | | | $(8,823,073 | ) |
Affiliated issuers | | | 68 | |
Translation of assets and liabilities in foreign currencies | | | (3,456 | ) |
Net unrealized gain (loss) | | | $(8,826,461 | ) |
Net realized and unrealized gain (loss) | | | $30,066 | |
Change in net assets from operations | | | $1,742,019 | |
See Notes to Financial Statements
7
MFS International Growth Portfolio
FINANCIAL STATEMENTS | STATEMENTS OF CHANGES IN NET ASSETS
These statements describe the increases and/or decreases in net assets resulting from operations, any distributions, and any shareholder transactions.
| | | | | | | | |
| | | Six months ended
6/30/18 | | | Year ended
12/31/17 | |
| | | (unaudited) | | | | |
Change in net assets | | | | | | | | |
From operations | | | | | | | | |
Net investment income (loss) | | | $1,711,953 | | | | $1,451,186 | |
Net realized gain (loss) | | | 8,856,527 | | | | 13,256,650 | |
Net unrealized gain (loss) | | | (8,826,461 | ) | | | 29,774,389 | |
Change in net assets from operations | | | $1,742,019 | | | | $44,482,225 | |
Distributions declared to shareholders | | | | | | | | |
From net investment income | | | $— | | | | $(2,027,014 | ) |
From net realized gain | | | — | | | | (3,658,187 | ) |
Total distributions declared to shareholders | | | $— | | | | $(5,685,201 | ) |
Change in net assets from fund share transactions | | | $(11,529,948 | ) | | | $(30,606,861 | ) |
Total change in net assets | | | $(9,787,929 | ) | | | $8,190,163 | |
Net assets | | | | | | | | |
At beginning of period | | | 160,134,770 | | | | 151,944,607 | |
At end of period (including undistributed net investment income of $3,159,753 and
$1,447,800, respectively) | | | $150,346,841 | | | | $160,134,770 | |
See Notes to Financial Statements
8
MFS International Growth Portfolio
FINANCIAL STATEMENTS | FINANCIAL HIGHLIGHTS
The financial highlights table is intended to help you understand the fund’s financial performance for the semiannual period and the past 5 fiscal years. Certain information reflects financial results for a single fund share. The total returns in the table represent the rate that an investor would have earned (or lost) on an investment in the fund share class (assuming reinvestment of all distributions) held for the entire period.
| | | | | | | | | | | | | | | | | | | | | | | | |
| Initial Class | | Six months ended 6/30/18 | | | Year ended | |
| | | 12/31/17 | | | 12/31/16 | | | 12/31/15 | | | 12/31/14 | | | 12/31/13 | |
| | | (unaudited) | | | | | | | | | | | | | | | | |
Net asset value, beginning of period | | | $15.50 | | | | $12.13 | | | | $12.57 | | | | $13.29 | | | | $14.77 | | | | $13.13 | |
| Income (loss) from investment operations | | | | | | | | | | | | | |
Net investment income (loss) (d) | | | $0.18 | | | | $0.14 | | | | $0.17 | (c) | | | $0.13 | | | | $0.21 | | | | $0.14 | |
Net realized and unrealized gain (loss) | | | (0.01 | ) | | | 3.77 | | | | 0.19 | | | | (0.11 | )(g) | | | (0.90 | ) | | | 1.70 | |
Total from investment operations | | | $0.17 | | | | $3.91 | | | | $0.36 | | | | $0.02 | | | | $(0.69 | ) | | | $1.84 | |
| Less distributions declared to shareholders | | | | | | | | | | | | | |
From net investment income | | | $— | | | | $(0.20 | ) | | | $(0.15 | ) | | | $(0.22 | ) | | | $(0.13 | ) | | | $(0.19 | ) |
From net realized gain | | | — | | | | (0.34 | ) | | | (0.65 | ) | | | (0.52 | ) | | | (0.66 | ) | | | (0.01 | ) |
Total distributions declared to shareholders | | | $— | | | | $(0.54 | ) | | | $(0.80 | ) | | | $(0.74 | ) | | | $(0.79 | ) | | | $(0.20 | ) |
Net asset value, end of period (x) | | | $15.67 | | | | $15.50 | | | | $12.13 | | | | $12.57 | | | | $13.29 | | | | $14.77 | |
Total return (%) (k)(r)(s)(x) | | | 1.10 | (n) | | | 32.64 | | | | 2.49 | (c) | | | 0.32 | | | | (4.98 | ) | | | 14.09 | |
Ratios (%) (to average net assets)
and Supplemental data: | | | | | | | | | | | | | |
Expenses before expense reductions (f) | | | 1.04 | (a) | | | 1.05 | | | | 0.91 | (c) | | | 1.03 | | | | 1.02 | | | | 1.03 | |
Expenses after expense reductions (f) | | | 1.03 | (a) | | | 1.05 | | | | 0.91 | (c) | | | 1.03 | | | | 1.01 | | | | 1.03 | |
Net investment income (loss) | | | 2.25 | (a) | | | 0.96 | | | | 1.33 | (c) | | | 0.99 | | | | 1.44 | | | | 0.98 | |
Portfolio turnover | | | 9 | (n) | | | 10 | | | | 15 | | | | 22 | | | | 22 | | | | 26 | |
Net assets at end of period (000 omitted) | | | $122,210 | | | | $130,591 | | | | $126,668 | | | | $138,482 | | | | $164,724 | | | | $186,566 | |
| | |
| Service Class | | Six months
ended 6/30/18 | | | Year ended | |
| | | 12/31/17 | | | 12/31/16 | | | 12/31/15 | | | 12/31/14 | | | 12/31/13 | |
| | | (unaudited) | | | | | | | | | | | | | | | | |
Net asset value, beginning of period | | | $15.37 | | | | $12.03 | | | | $12.48 | | | | $13.19 | | | | $14.66 | | | | $13.04 | |
| Income (loss) from investment operations | | | | | | | | | | | | | | | | | |
Net investment income (loss) (d) | | | $0.15 | | | | $0.10 | | | | $0.13 | (c) | | | $0.10 | | | | $0.17 | | | | $0.10 | |
Net realized and unrealized gain (loss) | | | 0.00 | (w) | | | 3.74 | | | | 0.18 | | | | (0.11 | )(g) | | | (0.88 | ) | | | 1.68 | |
Total from investment operations | | | $0.15 | | | | $3.84 | | | | $0.31 | | | | $(0.01 | ) | | | $(0.71 | ) | | | $1.78 | |
| Less distributions declared to shareholders | | | | | | | | | | | | | | | | | |
From net investment income | | | $— | | | | $(0.16 | ) | | | $(0.11 | ) | | | $(0.18 | ) | | | $(0.10 | ) | | | $(0.15 | ) |
From net realized gain | | | — | | | | (0.34 | ) | | | (0.65 | ) | | | (0.52 | ) | | | (0.66 | ) | | | (0.01 | ) |
Total distributions declared to shareholders | | | $— | | | | $(0.50 | ) | | | $(0.76 | ) | | | $(0.70 | ) | | | $(0.76 | ) | | | $(0.16 | ) |
Net asset value, end of period (x) | | | $15.52 | | | | $15.37 | | | | $12.03 | | | | $12.48 | | | | $13.19 | | | | $14.66 | |
Total return (%) (k)(r)(s)(x) | | | 0.98 | (n) | | | 32.35 | | | | 2.15 | (c) | | | 0.10 | | | | (5.19 | ) | | | 13.76 | |
Ratios (%) (to average net assets)
and Supplemental data: | | | | | | | | | | | | | | | | | |
Expenses before expense reductions (f) | | | 1.29 | (a) | | | 1.30 | | | | 1.16 | (c) | | | 1.28 | | | | 1.27 | | | | 1.28 | |
Expenses after expense reductions (f) | | | 1.28 | (a) | | | 1.30 | | | | 1.16 | (c) | | | 1.28 | | | | 1.26 | | | | 1.28 | |
Net investment income (loss) | | | 2.01 | (a) | | | 0.70 | | | | 1.08 | (c) | | | 0.72 | | | | 1.19 | | | | 0.72 | |
Portfolio turnover | | | 9 | (n) | | | 10 | | | | 15 | | | | 22 | | | | 22 | | | | 26 | |
Net assets at end of period (000 omitted) | | | $28,137 | | | | $29,544 | | | | $25,277 | | | | $26,144 | | | | $30,365 | | | | $33,065 | |
See Notes to Financial Statements
9
MFS International Growth Portfolio
Financial Highlights – continued
| (c) | Amount reflects a one-time reimbursement of expenses by the custodian (or former custodian) without which net investment income and performance would be lower and expenses would be higher. |
| (d) | Per share data is based on average shares outstanding. |
| (f) | Ratios do not reflect reductions from fees paid indirectly, if applicable. |
| (g) | The per share amount varies from the net realized and unrealized gain/loss for the period because of the timing of sales of fund shares and the per share amount of realized and unrealized gains and losses at such time. |
| (k) | The total return does not reflect expenses that apply to separate accounts. Inclusion of these charges would reduce the total return figures for all periods shown. |
| (r) | Certain expenses have been reduced without which performance would have been lower. |
| (s) | From time to time the fund may receive proceeds from litigation settlements, without which performance would be lower. |
| (x) | The net asset values and total returns have been calculated on net assets which include adjustments made in accordance with U.S. generally accepted accounting principles required at period end for financial reporting purposes. |
See Notes to Financial Statements
10
MFS International Growth Portfolio
NOTES TO FINANCIAL STATEMENTS (unaudited)
| (1) | | Business and Organization |
MFS International Growth Portfolio (the fund) is a diversified series of MFS Variable Insurance Trust II (the trust). The trust is organized as a Massachusetts business trust and is registered under the Investment Company Act of 1940, as amended, as an open-end management investment company. The shareholders of each series of the trust are separate accounts of insurance companies, which offer variable annuity and/or life insurance products, and qualified retirement and pension plans.
The fund is an investment company and accordingly follows the investment company accounting and reporting guidance of the Financial Accounting Standards Board (FASB) Accounting Standards Codification Topic 946 Financial Services – Investment Companies.
| (2) | | Significant Accounting Policies |
General – The preparation of financial statements in conformity with U.S. generally accepted accounting principles requires management to make estimates and assumptions that affect the reported amounts of assets and liabilities, and disclosure of contingent assets and liabilities at the date of the financial statements and the reported amounts of increases and decreases in net assets from operations during the reporting period. Actual results could differ from those estimates. In the preparation of these financial statements, management has evaluated subsequent events occurring after the date of the fund’s Statement of Assets and Liabilities through the date that the financial statements were issued. The fund invests in foreign securities, including securities of emerging market issuers. Investments in foreign securities are vulnerable to the effects of changes in the relative values of the local currency and the U.S. dollar and to the effects of changes in each country’s market, economic, industrial, political, regulatory, geopolitical, and other conditions. Investments in emerging markets can involve additional and greater risks than the risks associated with investments in developed foreign markets. Emerging markets can have less developed markets, greater custody and operational risk, less developed legal, regulatory, and accounting systems, and greater political, social, and economic instability than developed markets.
Balance Sheet Offsetting – The fund’s accounting policy with respect to balance sheet offsetting is that, absent an event of default by the counterparty or a termination of the agreement, the International Swaps and Derivatives Association (ISDA) Master Agreement, or similar agreement, does not result in an offset of reported amounts of financial assets and financial liabilities in the Statement of Assets and Liabilities across transactions between the fund and the applicable counterparty. The fund’s right to setoff may be restricted or prohibited by the bankruptcy or insolvency laws of the particular jurisdiction to which a specific master netting agreement counterparty is subject. Balance sheet offsetting disclosures, to the extent applicable to the fund, have been included in the fund’s Significant Accounting Policies note under the captions for each of the fund’s in-scope financial instruments and transactions.
Investment Valuations – Equity securities, including restricted equity securities, are generally valued at the last sale or official closing price on their primary market or exchange as provided by a third-party pricing service. Equity securities, for which there were no sales reported that day, are generally valued at the last quoted daily bid quotation on their primary market or exchange as provided by a third-party pricing service. Short-term instruments with a maturity at issuance of 60 days or less may be valued at amortized cost, which approximates market value. Open-end investment companies are generally valued at net asset value per share. Securities and other assets generally valued on the basis of information from a third-party pricing service may also be valued at a broker/dealer bid quotation. In determining values, third-party pricing services can utilize both transaction data and market information such as yield, quality, coupon rate, maturity, type of issue, trading characteristics, and other market data. The values of foreign securities and other assets and liabilities expressed in foreign currencies are converted to U.S. dollars using the mean of bid and asked prices for rates provided by a third-party pricing service.
The Board of Trustees has delegated primary responsibility for determining or causing to be determined the value of the fund’s investments (including any fair valuation) to the adviser pursuant to valuation policies and procedures approved by the Board. If the adviser determines that reliable market quotations are not readily available, investments are valued at fair value as determined in good faith by the adviser in accordance with such procedures under the oversight of the Board of Trustees. Under the fund’s valuation policies and procedures, market quotations are not considered to be readily available for most types of debt instruments and floating rate loans and many types of derivatives. These investments are generally valued at fair value based on information from third-party pricing services. In addition, investments may be valued at fair value if the adviser determines that an investment’s value has been materially affected by events occurring after the close of the exchange or market on which the investment is principally traded (such as foreign exchange or market) and prior to the determination of the fund’s net asset value, or after the halting of trading of a specific security where trading does not resume prior to the close of the exchange or market on which the security is principally traded. Events that occur on a frequent basis after foreign markets close (such as developments in foreign markets and significant movements in the U.S. markets) and prior to the determination of the fund’s net asset value may be deemed to have a material effect on the value of securities traded in foreign markets. Accordingly, the fund’s foreign equity securities may often be valued at fair value. The adviser generally relies on third-party pricing services or other information (such as the correlation with price movements of similar securities in the same or other markets; the type, cost and investment characteristics of the security; the
11
MFS International Growth Portfolio
Notes to Financial Statements (unaudited) – continued
business and financial condition of the issuer; and trading and other market data) to assist in determining whether to fair value and at what value to fair value an investment. The value of an investment for purposes of calculating the fund’s net asset value can differ depending on the source and method used to determine value. When fair valuation is used, the value of an investment used to determine the fund’s net asset value may differ from quoted or published prices for the same investment. There can be no assurance that the fund could obtain the fair value assigned to an investment if it were to sell the investment at the same time at which the fund determines its net asset value per share.
Various inputs are used in determining the value of the fund’s assets or liabilities. These inputs are categorized into three broad levels. In certain cases, the inputs used to measure fair value may fall into different levels of the fair value hierarchy. In such cases, an investment’s level within the fair value hierarchy is based on the lowest level of input that is significant to the fair value measurement. The fund’s assessment of the significance of a particular input to the fair value measurement in its entirety requires judgment, and considers factors specific to the investment. Level 1 includes unadjusted quoted prices in active markets for identical assets or liabilities. Level 2 includes other significant observable market-based inputs (including quoted prices for similar securities, interest rates, prepayment speed, and credit risk). Level 3 includes unobservable inputs, which may include the adviser’s own assumptions in determining the fair value of investments. The following is a summary of the levels used as of June 30, 2018 in valuing the fund’s assets or liabilities:
| | | | | | | | | | | | | | | | |
| Financial Instruments | | Level 1 | | | Level 2 | | | Level 3 | | | Total | |
| Equity Securities: | | | | | | | | | | | | | | | | |
France | | | $5,456,596 | | | | $21,748,440 | | | | $— | | | | $27,205,036 | |
Germany | | | 17,497,642 | | | | — | | | | — | | | | 17,497,642 | |
Switzerland | | | — | | | | 17,228,461 | | | | — | | | | 17,228,461 | |
United Kingdom | | | 11,821,160 | | | | 4,527,257 | | | | — | | | | 16,348,417 | |
Japan | | | 13,816,249 | | | | — | | | | — | | | | 13,816,249 | |
China | | | 9,667,865 | | | | — | | | | — | | | | 9,667,865 | |
United States | | | 6,713,016 | | | | — | | | | — | | | | 6,713,016 | |
Canada | | | 5,965,546 | | | | — | | | | — | | | | 5,965,546 | |
Taiwan | | | 4,981,261 | | | | — | | | | — | | | | 4,981,261 | |
Other Countries | | | 22,022,206 | | | | 6,991,489 | | | | — | | | | 29,013,695 | |
| Mutual Funds | | | 1,004,665 | | | | — | | | | — | | | | 1,004,665 | |
| Total | | | $98,946,206 | | | | $50,495,647 | | | | $— | | | | $149,441,853 | |
For further information regarding security characteristics, see the Portfolio of Investments.
Of the level 2 investments presented above, equity investments amounting to $45,968,389 would have been considered level 1 investments at the beginning of the period. Of the level 1 investments presented above, equity investments amounting to $13,465,552 would have been considered level 2 investments at the beginning of the period. The primary reason for changes in the classifications between levels 1 and 2 occurs when foreign equity securities are fair valued using other observable market-based inputs in place of the closing exchange price due to events occurring after the close of the exchange or market on which the investment is principally traded. The fund’s foreign equity securities may often be valued using other observable market-based inputs. The fund’s policy is to recognize transfers between the levels as of the end of the period.
Foreign Currency Translation – Purchases and sales of foreign investments, income, and expenses are converted into U.S. dollars based upon currency exchange rates prevailing on the respective dates of such transactions or on the reporting date for foreign denominated receivables and payables. Gains and losses attributable to foreign currency exchange rates on sales of securities are recorded for financial statement purposes as net realized gains and losses on investments. Gains and losses attributable to foreign exchange rate movements on receivables, payables, income and expenses are recorded for financial statement purposes as foreign currency transaction gains and losses. That portion of both realized and unrealized gains and losses on investments that results from fluctuations in foreign currency exchange rates is not separately disclosed.
Security Loans – Under its Securities Lending Agency Agreement with the fund, State Street Bank and Trust Company (“State Street”), as lending agent, loans the securities of the fund to certain qualified institutions (the “Borrowers”) approved by the fund. Security loans can be terminated at the discretion of either the lending agent or the fund and the related securities must be returned within the earlier of the standard trade settlement period for such securities or within three business days. The loans are collateralized by cash and/or U.S. Treasury and federal agency obligations in an amount typically at least equal to the market value of the securities loaned. On loans collateralized by cash, the cash collateral is invested in a money market fund. The market value of the loaned securities is determined at the close of business of the fund and any additional required collateral is delivered to the fund on the next business day. State Street provides the fund with indemnification against Borrower default. In the event of Borrower default, State Street will, for the benefit of the fund, either purchase securities identical to those loaned or, when such purchase is commercially impracticable, pay the fund the market value of the loaned securities. In return, State Street assumes the fund’s rights
12
MFS International Growth Portfolio
Notes to Financial Statements (unaudited) – continued
to the related collateral. If the collateral value is less than the cost to purchase identical securities, State Street is responsible for the shortfall, but only to the extent that such shortfall is not due to a decline in collateral value resulting from collateral reinvestment for which the fund bears the risk of loss. At period end, the fund had investment securities on loan, all of which were classified as equity securities in the fund’s Portfolio of Investments, with a fair value of $32,088. The fair value of the fund’s investment securities on loan and a related liability of $33,688 for cash collateral received on securities loaned are both presented gross in the Statement of Assets and Liabilities. The collateral on securities loaned exceeded the value of securities on loan at period end. The liability for cash collateral for securities loaned is carried at fair value, which is categorized as level 2 within the fair value hierarchy. A portion of the income generated upon investment of the collateral is remitted to the Borrowers, and the remainder is allocated between the fund and the lending agent. On loans collateralized by U.S. Treasury and/or federal agency obligations, a fee is received from the Borrower, and is allocated between the fund and the lending agent. Income from securities lending is separately reported in the Statement of Operations. The dividend and interest income earned on the securities loaned is accounted for in the same manner as other dividend and interest income.
Indemnifications – Under the fund’s organizational documents, its officers and Trustees may be indemnified against certain liabilities and expenses arising out of the performance of their duties to the fund. Additionally, in the normal course of business, the fund enters into agreements with service providers that may contain indemnification clauses. The fund’s maximum exposure under these agreements is unknown as this would involve future claims that may be made against the fund that have not yet occurred.
Investment Transactions and Income – Investment transactions are recorded on the trade date. Dividends received in cash are recorded on the ex-dividend date. Certain dividends from foreign securities will be recorded when the fund is informed of the dividend if such information is obtained subsequent to the ex-dividend date. Dividend payments received in additional securities are recorded on the ex-dividend date in an amount equal to the value of the security on such date.
The fund may receive proceeds from litigation settlements. Any proceeds received from litigation involving portfolio holdings are reflected in the Statement of Operations in realized gain/loss if the security has been disposed of by the fund or in unrealized gain/loss if the security is still held by the fund. Any other proceeds from litigation not related to portfolio holdings are reflected as other income in the Statement of Operations.
Tax Matters and Distributions – The fund intends to qualify as a regulated investment company, as defined under Subchapter M of the Internal Revenue Code, and to distribute all of its taxable income, including realized capital gains. As a result, no provision for federal income tax is required. The fund’s federal tax returns, when filed, will remain subject to examination by the Internal Revenue Service for a three year period. Management has analyzed the fund’s tax positions taken on federal and state tax returns for all open tax years and does not believe that there are any uncertain tax positions that require recognition of a tax liability. Foreign taxes, if any, have been accrued by the fund in the accompanying financial statements in accordance with the applicable foreign tax law. Foreign income taxes may be withheld by certain countries in which the fund invests. Additionally, capital gains realized by the fund on securities issued in or by certain foreign countries may be subject to capital gains tax imposed by those countries.
Distributions to shareholders are recorded on the ex-dividend date. Income and capital gain distributions are determined in accordance with income tax regulations, which may differ from U.S. generally accepted accounting principles. Certain capital accounts in the financial statements are periodically adjusted for permanent differences in order to reflect their tax character. These adjustments have no impact on net assets or net asset value per share. Temporary differences which arise from recognizing certain items of income, expense, gain or loss in different periods for financial statement and tax purposes will reverse at some time in the future. Distributions in excess of net investment income or net realized gains are temporary overdistributions for financial statement purposes resulting from differences in the recognition or classification of income or distributions for financial statement and tax purposes.
Book/tax differences primarily relate to wash sale loss deferrals.
The tax character of distributions declared to shareholders for the last fiscal year is as follows:
| | | | |
| | | Year ended | |
| | | 12/31/17 | |
| Ordinary income (including any short-term capital gains) | | | $2,624,100 | |
| Long-term capital gains | | | 3,061,101 | |
| Total distributions | | | $5,685,201 | |
13
MFS International Growth Portfolio
Notes to Financial Statements (unaudited) – continued
The federal tax cost and the tax basis components of distributable earnings were as follows:
| | | | |
| As of 6/30/18 | | | | |
| Cost of investments | | | $95,587,383 | |
| Gross appreciation | | | 57,049,896 | |
| Gross depreciation | | | (3,195,426 | ) |
| Net unrealized appreciation (depreciation) | | | $53,854,470 | |
| |
| As of 12/31/17 | | | | |
| Undistributed ordinary income | | | 2,191,663 | |
| Undistributed long-term capital gain | | | 12,374,709 | |
| Other temporary differences | | | (6,010 | ) |
| Net unrealized appreciation (depreciation) | | | 62,686,885 | |
The aggregate cost above includes prior fiscal year end tax adjustments, if applicable.
Multiple Classes of Shares of Beneficial Interest – The fund offers multiple classes of shares, which differ in their respective distribution and/or service fees. The fund’s income, realized and unrealized gain (loss), and common expenses are allocated to shareholders based on the daily net assets of each class. Dividends are declared separately for each class. Differences in per share dividend rates are generally due to differences in separate class expenses. The fund’s distributions declared to shareholders as reported in the Statements of Changes in Net Assets are presented by class as follows:
| | | | | | | | | | | | | | | | |
| | | From net investment
income | | | From net realized
gain | |
| | | Six months ended
6/30/18 | | | Year ended
12/31/17 | | | Six months ended
6/30/18 | | | Year ended
12/31/17 | |
| Initial Class | | | $— | | | | $1,717,623 | | | | $— | | | | $3,003,332 | |
| Service Class | | | — | | | | 309,391 | | | | — | | | | 654,855 | |
| Total | | | $— | | | | $2,027,014 | | | | $— | | | | $3,658,187 | |
| (3) | | Transactions with Affiliates |
Investment Adviser – The fund has an investment advisory agreement with MFS to provide overall investment management and related administrative services and facilities to the fund. The management fee is computed daily and paid monthly at the following annual rates based on the fund’s average daily net assets:
| | | | |
| Up to $1 billion | | | 0.90% | |
| In excess of $1 billion and up to $2 billion | | | 0.80% | |
| In excess of $2 billion | | | 0.70% | |
MFS has agreed in writing to reduce its management fee by a specified amount if certain MFS mutual fund assets exceed thresholds agreed to by MFS and the fund’s Board of Trustees. For the six months ended June 30, 2018, this management fee reduction amounted to $7,144, which is included in the reduction of total expenses in the Statement of Operations. The management fee incurred for the six months ended June 30, 2018 was equivalent to an annual effective rate of 0.89% of the fund’s average daily net assets.
Effective August 1, 2018, the investment adviser has agreed in writing to pay a portion of the fund’s total annual operating expenses, excluding interest, taxes, extraordinary expenses, brokerage and transaction costs, and investment-related expenses such that total annual operating expenses do not exceed 0.88% of average daily net assets for the Initial Class shares and 1.13% of average daily net assets for the Service Class shares. This written agreement will continue until modified by the fund’s Board of Trustees, but such agreement will continue at least until April 30, 2020.
Distributor – MFS Fund Distributors, Inc. (MFD), a wholly-owned subsidiary of MFS, is the distributor of shares of the fund. The Trustees have adopted a distribution plan for the Service Class shares pursuant to Rule 12b-1 under the Investment Company Act of 1940.
The fund’s distribution plan provides that the fund will pay MFD distribution and/or service fees equal to 0.25% per annum of its average daily net assets attributable to Service Class shares as partial consideration for services performed and expenses incurred by MFD and financial intermediaries (including participating insurance companies that invest in the fund to fund variable annuity and variable life insurance contracts, sponsors of qualified retirement and pension plans that invest in the fund, and affiliates of these participating insurance companies and plan sponsors) in connection with the sale and distribution of the Service Class shares. MFD may subsequently pay all, or a portion, of the distribution and/or service fees to financial intermediaries.
14
MFS International Growth Portfolio
Notes to Financial Statements (unaudited) – continued
Shareholder Servicing Agent – MFS Service Center, Inc. (MFSC), a wholly-owned subsidiary of MFS, receives a fee from the fund for its services as shareholder servicing agent. For the six months ended June 30, 2018, the fee was $2,375, which equated to 0.0031% annually of the fund’s average daily net assets. MFSC also receives payment from the fund for out-of-pocket expenses paid by MFSC on behalf of the fund. For the six months ended June 30, 2018, these costs amounted to $73.
Administrator – MFS provides certain financial, legal, shareholder communications, compliance, and other administrative services to the fund. Under an administrative services agreement, the fund reimburses MFS the costs incurred to provide these services. The fund is charged an annual fixed amount of $17,500 plus a fee based on average daily net assets. The administrative services fee incurred for the six months ended June 30, 2018 was equivalent to an annual effective rate of 0.0214% of the fund’s average daily net assets.
Trustees’ and Officers’ Compensation – The fund pays compensation to independent Trustees in the form of a retainer, attendance fees, and additional compensation to Board and Committee chairpersons. The fund does not pay compensation directly to Trustees or officers of the fund who are also officers of the investment adviser, all of whom receive remuneration for their services to the fund from MFS. Certain officers and Trustees of the fund are officers or directors of MFS, MFD, and MFSC.
Other – This fund and certain other funds managed by MFS (the funds) have entered into a service agreement (the ISO Agreement) which provides for payment of fees solely by the funds to Tarantino LLC in return for the provision of services of an Independent Senior Officer (ISO) for the funds. Frank L. Tarantino serves as the ISO and is an officer of the funds and the sole member of Tarantino LLC. The funds can terminate the ISO Agreement with Tarantino LLC at any time under the terms of the ISO Agreement. For the six months ended June 30, 2018, the fee paid by the fund under this agreement was $134 and is included in “Miscellaneous” expense in the Statement of Operations. MFS has agreed to bear all expenses associated with office space, other administrative support, and supplies provided to the ISO.
The fund invests in the MFS Institutional Money Market Portfolio which is managed by MFS and seeks current income consistent with preservation of capital and liquidity. This money market fund does not pay a management fee to MFS.
The fund is permitted to engage in purchase and sale transactions with funds and accounts for which MFS serves as investment adviser or sub-adviser (“cross-trades”) pursuant to a policy adopted by the Board of Trustees. This policy has been designed to ensure that cross-trades conducted by the fund comply with Rule 17a-7 under the Investment Company Act of 1940. During the six months ended June 30, 2018, the fund engaged in purchase and sale transactions pursuant to this policy, which amounted to $245,896 and $36,737, respectively. The sales transactions resulted in net realized gains (losses) of $16,170.
For the six months ended June 30, 2018, purchases and sales of investments, other than short-term obligations, aggregated $13,200,057 and $24,129,355, respectively.
| (5) | | Shares of Beneficial Interest |
The fund’s Declaration of Trust permits the Trustees to issue an unlimited number of full and fractional shares of beneficial interest. Transactions in fund shares were as follows:
| | | | | | | | | | | | | | | | |
| | | Six months ended 6/30/18 | | | Year ended 12/31/17 | |
| | | Shares | | | Amount | | | Shares | | | Amount | |
| Shares sold | | | | | | | | | | | | | | | | |
Initial Class | | | 77,719 | | | | $1,207,365 | | | | 139,977 | | | | $1,972,502 | |
Service Class | | | 68,369 | | | | 1,064,435 | | | | 227,489 | | | | 3,210,047 | |
| | | 146,088 | | | | $2,271,800 | | | | 367,466 | | | | $5,182,549 | |
| Shares issued to shareholders in reinvestment of distributions | | | | | | | | | | | | | | | | |
Initial Class | | | — | | | | $— | | | | 331,528 | | | | $4,720,955 | |
Service Class | | | — | | | | — | | | | 68,241 | | | | 964,246 | |
| | | — | | | | $— | | | | 399,769 | | | | $5,685,201 | |
| Shares reacquired | | | | | | | | | | | | | | | | |
Initial Class | | | (702,859 | ) | | | $(11,053,675 | ) | | | (2,487,693 | ) | | | $(34,870,112 | ) |
Service Class | | | (177,324 | ) | | | (2,748,073 | ) | | | (473,779 | ) | | | (6,604,499 | ) |
| | | (880,183 | ) | | | $(13,801,748 | ) | | | (2,961,472 | ) | | | $(41,474,611 | ) |
| Net change | | | | | | | | | | | | | | | | |
Initial Class | | | (625,140 | ) | | | $(9,846,310 | ) | | | (2,016,188 | ) | | | $(28,176,655 | ) |
Service Class | | | (108,955 | ) | | | (1,683,638 | ) | | | (178,049 | ) | | | (2,430,206 | ) |
| | | (734,095 | ) | | | $(11,529,948 | ) | | | (2,194,237 | ) | | | $(30,606,861 | ) |
15
MFS International Growth Portfolio
Notes to Financial Statements (unaudited) – continued
The fund is one of several mutual funds in which certain MFS funds may invest. The MFS funds do not invest in the underlying funds for the purpose of exercising management or control. At the end of the period, the MFS Moderate Allocation Portfolio, the MFS Growth Allocation Portfolio, and the MFS Conservative Allocation Portfolio were the owners of record of approximately 31%, 13%, and 7%, respectively, of the value of outstanding voting shares of the fund.
The fund and certain other funds managed by MFS participate in a $1.25 billion unsecured committed line of credit, subject to a $1 billion sublimit, provided by a syndication of banks under a credit agreement. Borrowings may be made for temporary financing needs. Interest is charged to each fund, based on its borrowings, generally at a rate equal to the higher of the Overnight Bank Funding rate or daily one month LIBOR plus an agreed upon spread. A commitment fee, based on the average daily, unused portion of the committed line of credit, is allocated among the participating funds. In addition, the fund and other funds managed by MFS have established unsecured uncommitted borrowing arrangements with certain banks for temporary financing needs. Interest is charged to each fund, based on its borrowings, at a rate equal to the Overnight Bank Funding rate plus an agreed upon spread. For the six months ended June 30, 2018, the fund’s commitment fee and interest expense were $521 and $0, respectively, and are included in “Miscellaneous” expense in the Statement of Operations.
| (7) | | Investments in Affiliated Issuers |
An affiliated issuer may be considered one in which the fund owns 5% or more of the outstanding voting securities, or a company which is under common control. For the purposes of this report, the fund assumes the following to be affiliated issuers:
| | | | | | | | | | | | | | | | |
| Affiliated Issuers | | | | Beginning
Shares/Par
Amount | | Acquisitions
Shares/Par
Amount | | | Dispositions
Shares/Par
Amount | | | Ending
Shares/Par
Amount | |
| MFS Institutional Money Market Portfolio | | | | 956,706 | | | 10,494,471 | | | | (10,480,201 | ) | | | 970,976 | |
| | | | | |
| Affiliated Issuers | | Realized
Gain (Loss) | | Change in
Unrealized
Appreciation/
Depreciation | | Capital Gain
Distributions | | | Dividend
Income | | | Ending
Value | |
| MFS Institutional Money Market Portfolio | | $(79) | | $68 | | | $— | | | | $5,783 | | | | $970,977 | |
16
MFS International Growth Portfolio
PROXY VOTING POLICIES AND INFORMATION
MFS votes proxies on behalf of the fund pursuant to proxy voting policies and procedures that are available without charge, upon request, by calling 1-800-225-2606, by visiting mfs.com/proxyvoting, or by visiting the SEC’s Web site at http://www.sec.gov.
Information regarding how the fund voted proxies relating to portfolio securities during the most recent twelve-month period ended June 30 is available by August 31 of each year without charge by visiting mfs.com/proxyvoting, or by visiting the SEC’s Web site at http://www.sec.gov.
QUARTERLY PORTFOLIO DISCLOSURE
The fund will file a complete schedule of portfolio holdings with the Securities and Exchange Commission (the Commission) for the first and third quarters of each fiscal year on Form N-Q. The fund’s Form N-Q is available on the EDGAR database on the Commission’s Internet Web site at http://www.sec.gov, and may be reviewed and copied at the:
Public Reference Room
Securities and Exchange Commission
100 F Street, NE, Room 1580
Washington, D.C. 20549
Information on the operation of the Public Reference Room may be obtained by calling the Commission at 1-800-SEC-0330. Copies of the fund’s Form N-Q also may be obtained, upon payment of a duplicating fee, by electronic request at the following e-mail address: publicinfo@sec.gov or by writing the Public Reference Section at the above address.
FURTHER INFORMATION
From time to time, MFS may post important information about the fund or the MFS funds on the MFS web site (mfs.com). This information is available at https://www.mfs.com/en-us/what-we-do/announcements.html or at mfs.com/vit2 by choosing the fund’s name.
INFORMATION ABOUT FUND CONTRACTS AND LEGAL CLAIMS
The fund has entered into contractual arrangements with an investment adviser, administrator, distributor, shareholder servicing agent, 529 program manager (if applicable), and custodian who each provide services to the fund. Unless expressly stated otherwise, shareholders are not parties to, or intended beneficiaries of these contractual arrangements, and these contractual arrangements are not intended to create any shareholder right to enforce them against the service providers or to seek any remedy under them against the service providers, either directly or on behalf of the fund.
Under the Trust’s By-Laws and Declaration of Trust, any claims asserted against or on behalf of the MFS Funds, including claims against Trustees and Officers, must be brought in state and federal courts located within the Commonwealth of Massachusetts.
17
Semiannual Report
June 30, 2018

MFS® International Value Portfolio

MFS® Variable Insurance Trust II
FCG-SEM
MFS® International Value Portfolio
CONTENTS
The report is prepared for the general information of contract owners. It is authorized for distribution to prospective investors only when preceded or accompanied by a current prospectus.
NOT FDIC INSURED • MAY LOSE VALUE • NO BANK OR CREDIT UNION GUARANTEE • NOT A DEPOSIT • NOT INSURED BY ANY FEDERAL GOVERNMENT AGENCY OR NCUA/NCUSIF
MFS International Value Portfolio
LETTER FROM THE EXECUTIVE CHAIRMAN

Dear Contract Owners:
Rising bond yields, international trade friction and geopolitical uncertainty have contributed to a measurable uptick in market volatility — a departure from the low-volatility environment that prevailed for much of 2017. In recent months, against this more challenging backdrop, global markets have given back some of the strong gains recorded during 2017 and early 2018. But global economic growth remains healthy, notwithstanding signs of a modest slowdown over the past few months, particularly in Europe and China.
Although the U.S. Federal Reserve continues to gradually raise interest rates and shrink its balance sheet, monetary policy remains accommodative around the world, with many central banks taking only tentative steps toward tighter policies. Newly enacted U.S. tax reforms have been welcomed by equity markets, while emerging market economies have recently had to contend with tighter financial conditions as a result of firmer U.S. Treasury yields and a stronger dollar. Around the world, inflation remains largely subdued, but tight labor markets and solid global demand have investors on the lookout for its potential resurgence. Increased U.S. protectionism is also a growing concern, as investors fear that trade disputes could dampen business sentiment, leading to slower global growth.
As a global investment manager, MFS® strives to create long-term value for clients through an active approach and an investment platform built on nearly a century of expertise. To make that long-term value meaningful for clients, we work to align with you on our beliefs, your needs and the time it takes to deliver on your desired outcomes.
Respectfully,

Robert J. Manning
Executive Chairman
MFS Investment Management
August 16, 2018
The opinions expressed in this letter are subject to change and may not be relied upon for investment advice. No forecasts can be guaranteed.
1
MFS International Value Portfolio
PORTFOLIO COMPOSITION
Portfolio structure
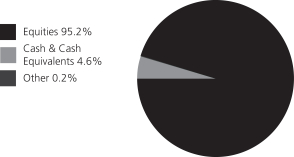
| | | | |
| Top ten holdings | | | | |
| Nestle S.A. | | | 3.9% | |
| Givaudan S.A. | | | 2.8% | |
| Henkel AG & Co. KGaA | | | 2.8% | |
| Pernod Ricard S.A. | | | 2.5% | |
| Amadeus IT Holding S.A. | | | 2.4% | |
| Reckitt Benckiser Group PLC | | | 2.3% | |
| Cadence Design Systems, Inc. | | | 2.2% | |
| Diageo PLC | | | 2.2% | |
| Taiwan Semiconductor Manufacturing Co. Ltd., ADR | | | 2.2% | |
| Kao Corp. | | | 2.1% | |
| |
| Equity sectors | | | | |
| Consumer Staples | | | 29.8% | |
| Technology | | | 18.2% | |
| Financial Services | | | 11.7% | |
| Industrial Goods & Services | | | 10.6% | |
| Special Products & Services | | | 9.0% | |
| Basic Materials | | | 5.8% | |
| Health Care | | | 4.4% | |
| Utilities & Communications | | | 1.4% | |
| Leisure | | | 1.3% | |
| Retailing | | | 1.1% | |
| Transportation | | | 0.7% | |
| Autos & Housing | | | 0.6% | |
| Energy | | | 0.6% | |
| | | | |
| Issuer country weightings (x) | | | | |
| Japan | | | 20.3% | |
| United States | | | 15.3% | |
| United Kingdom | | | 14.3% | |
| Germany | | | 13.1% | |
| Switzerland | | | 11.7% | |
| France | | | 11.1% | |
| Spain | | | 2.4% | |
| Netherlands | | | 2.4% | |
| Taiwan | | | 2.2% | |
| Other Countries | | | 7.2% | |
| |
| Currency exposure weightings (y) | | | | |
| Euro | | | 30.8% | |
| United States Dollar | | | 19.6% | |
| Japanese Yen | | | 16.5% | |
| British Pound Sterling | | | 14.3% | |
| Swiss Franc | | | 11.7% | |
| Taiwan Dollar | | | 2.2% | |
| Canadian Dollar | | | 1.6% | |
| Swedish Krona | | | 0.9% | |
| Australian Dollar | | | 0.9% | |
| Other Currencies | | | 1.5% | |
| (x) | Represents the portfolio’s exposure to issuer countries as a percentage of a portfolio’s net assets. For purposes of this presentation, United States includes Cash & Cash Equivalents and Other. |
| (y) | Represents the portfolio’s exposure to a particular currency as a percentage of a portfolio’s net assets. For purposes of this presentation, United States Dollar includes Cash & Cash Equivalents and Other. |
Cash & Cash Equivalents includes any cash, investments in money market funds, short-term securities, and other assets less liabilities. Please see the Statement of Assets and Liabilities for additional information related to the fund’s cash position and other assets and liabilities.
Other includes equivalent exposure from currency derivatives and/or any offsets to derivative positions.
Percentages are based on net assets as of June 30, 2018.
The portfolio is actively managed and current holdings may be different.
2
MFS International Value Portfolio
EXPENSE TABLE
Fund Expenses Borne by the Contract Holders during the Period,
January 1, 2018 through June 30, 2018
As a contract holder of the fund, you incur ongoing costs, including management fees; distribution and/or service (12b-1) fees; and other fund expenses. This example is intended to help you understand your ongoing costs (in dollars) of investing in the fund and to compare these costs with the ongoing costs of investing in other mutual funds.
The example is based on an investment of $1,000 invested at the beginning of the period and held for the entire period January 1, 2018 through June 30, 2018.
Actual Expenses
The first line for each share class in the following table provides information about actual account values and actual expenses. You may use the information in this line, together with the amount you invested, to estimate the expenses that you paid over the period. Simply divide your account value by $1,000 (for example, an $8,600 account value divided by $1,000 = 8.6), then multiply the result by the number in the first line under the heading entitled “Expenses Paid During Period” to estimate the expenses you paid on your account during this period.
Hypothetical Example for Comparison Purposes
The second line for each share class in the following table provides information about hypothetical account values and hypothetical expenses based on the fund’s actual expense ratio and an assumed rate of return of 5% per year before expenses, which is not the fund’s actual return. The hypothetical account values and expenses may not be used to estimate the actual ending account balance or expenses you paid for the period. You may use this information to compare the ongoing costs of investing in the fund and other funds. To do so, compare this 5% hypothetical example with the 5% hypothetical examples that appear in the shareholder reports of the other funds.
Please note that the expenses shown in the table are meant to highlight the fund’s ongoing costs only and do not take into account the fees and expenses imposed under the variable contracts through which your investment in the fund is made. Therefore, the second line for each share class in the table is useful in comparing ongoing costs associated with an investment in vehicles (such as the fund) which fund benefits under variable annuity and variable life insurance contracts and to qualified pension and retirement plans only, and will not help you determine the relative total costs of investing in the fund through variable annuity and variable life insurance contracts. If the fees and expenses imposed under the variable contracts were included, your costs would have been higher.
| | | | | | | | | | | | | | | | | | |
| Share Class | | | | Annualized
Expense Ratio | | | Beginning
Account Value
1/01/18 | | | Ending Account Value
6/30/18 | | | Expenses Paid
During Period (p)
1/01/18-6/30/18 | |
| Initial Class | | Actual | | | 0.88% | | | | $1,000.00 | | | | $994.34 | | | | $4.35 | |
| | Hypothetical (h) | | | 0.88% | | | | $1,000.00 | | | | $1,020.43 | | | | $4.41 | |
| Service Class | | Actual | | | 1.13% | | | | $1,000.00 | | | | $992.81 | | | | $5.58 | |
| | Hypothetical (h) | | | 1.13% | | | | $1,000.00 | | | | $1,019.19 | | | | $5.66 | |
| (h) | 5% class return per year before expenses. |
| (p) | “Expenses Paid During Period” are equal to each class’s annualized expense ratio, as shown above, multiplied by the average account value over the period, multiplied by 181/365 (to reflect the one-half year period). |
3
MFS International Value Portfolio
PORTFOLIO OF INVESTMENTS – 6/30/18 (unaudited)
The Portfolio of Investments is a complete list of all securities owned by your fund. It is categorized by broad-based asset classes.
| | | | | | | | |
| Issuer | | Shares/Par | | | Value ($) | |
| COMMON STOCKS – 92.4% | | | | | | | | |
| Airlines – 0.5% | | | | | | | | |
| Ryanair Holdings PLC (a) | | | 97,552 | | | $ | 11,143,365 | |
| | | | | | | | |
| Alcoholic Beverages – 6.2% | | | | | | | | |
| Diageo PLC | | | 1,261,125 | | | $ | 45,268,958 | |
| Heineken N.V. | | | 329,711 | | | | 33,057,183 | |
| Pernod Ricard S.A. | | | 311,128 | | | | 50,780,741 | |
| | | | | | | | |
| | | | | | $ | 129,106,882 | |
| | | | | | | | |
| Apparel Manufacturers – 1.0% | | | | | | | | |
| Compagnie Financiere Richemont S.A. | | | 174,963 | | | $ | 14,822,308 | |
| LVMH Moet Hennessy Louis Vuitton SE | | | 17,748 | | | | 5,899,768 | |
| | | | | | | | |
| | | | | | $ | 20,722,076 | |
| | | | | | | | |
| Automotive – 0.3% | | | | | | | | |
| USS Co. Ltd. | | | 286,000 | | | $ | 5,445,405 | |
| | | | | | | | |
| Brokerage & Asset Managers – 0.5% | | | | | |
| Daiwa Securities Group, Inc. | | | 772,000 | | | $ | 4,485,640 | |
| IG Group Holdings PLC | | | 472,275 | | | | 5,366,485 | |
| | | | | | | | |
| | | | | | $ | 9,852,125 | |
| | | | | | | | |
| Business Services – 8.9% | | | | | | | | |
| Brenntag AG | | | 234,447 | | | $ | 13,065,126 | |
| Bunzl PLC | | | 230,634 | | | | 6,985,505 | |
| Compass Group PLC | | | 1,815,163 | | | | 38,670,629 | |
| Experian Group Ltd. | | | 630,404 | | | | 15,595,389 | |
| Intertek Group PLC | | | 294,649 | | | | 22,227,418 | |
| Nomura Research Institute Ltd. | | | 502,400 | | | | 24,367,863 | |
| Rentokil Initial PLC | | | 980,280 | | | | 4,538,387 | |
| Secom Co. Ltd. | | | 297,500 | | | | 22,858,985 | |
| SGS S.A. | | | 11,205 | | | | 29,851,189 | |
| Sohgo Security Services Co. Ltd. | | | 150,800 | | | | 7,109,931 | |
| | | | | | | | |
| | | | | | $ | 185,270,422 | |
| | | | | | | | |
| Chemicals – 3.0% | | | | | | | | |
| Givaudan S.A. | | | 25,565 | | | $ | 57,945,092 | |
| Orica Ltd. | | | 332,081 | | | | 4,362,179 | |
| | | | | | | | |
| | | | | | $ | 62,307,271 | |
| | | | | | | | |
| Computer Software – 7.0% | | | | | | | | |
| ANSYS, Inc. (a) | | | 155,544 | | | $ | 27,092,654 | |
| Cadence Design Systems, Inc. (a) | | | 1,052,561 | | | | 45,586,417 | |
| Check Point Software Technologies Ltd. (a) | | | 104,584 | | | | 10,215,765 | |
| Dassault Systems S.A. | | | 215,772 | | | | 30,194,065 | |
| OBIC Co. Ltd. | | | 231,100 | | | | 19,140,920 | |
| SAP AG | | | 101,103 | | | | 11,682,837 | |
| | | | | | | | |
| | | | | | $ | 143,912,658 | |
| | | | | | | | |
| Computer Software – Systems – 2.4% | | | | | |
| Amadeus IT Group S.A. | | | 627,474 | | | $ | 49,439,552 | |
| Descartes Systems Group, Inc. (a) | | | 20,483 | | | | 667,316 | |
| | | | | | | | |
| | | | | | $ | 50,106,868 | |
| | | | | | | | |
| | | | | | | | |
| Issuer | | Shares/Par | | | Value ($) | |
| COMMON STOCKS – continued | |
| Construction – 0.3% | | | | | | | | |
| Geberit AG | | | 16,487 | | | $ | 7,082,892 | |
| | | | | | | | |
| Consumer Products – 10.5% | | | | | | | | |
| Colgate-Palmolive Co. | | | 643,844 | | | $ | 41,727,530 | |
| Kao Corp. | | | 583,200 | | | | 44,511,042 | |
| Kobayashi Pharmaceutical Co. Ltd. | | | 324,500 | | | | 28,049,180 | |
| KOSE Corp. | | | 36,000 | | | | 7,761,550 | |
| L’Oréal | | | 135,375 | | | | 33,400,521 | |
| Reckitt Benckiser Group PLC | | | 580,541 | | | | 47,801,300 | |
| ROHTO Pharmaceutical Co. Ltd. | | | 416,200 | | | | 13,363,961 | |
| | | | | | | | |
| | | | | | $ | 216,615,084 | |
| | | | | | | | |
| Containers – 0.7% | | | | | | | | |
| Brambles Ltd. | | | 2,149,278 | | | $ | 14,124,290 | |
| | | | | | | | |
| Electrical Equipment – 6.2% | | | | | | | | |
| IMI PLC | | | 1,398,026 | | | $ | 20,885,915 | |
| Legrand S.A. | | | 464,780 | | | | 34,042,393 | |
| OMRON Corp. | | | 323,900 | | | | 15,124,987 | |
| Schneider Electric S.A. | | | 436,059 | | | | 36,270,770 | |
| Spectris PLC | | | 434,358 | | | | 14,933,575 | |
| Yokogawa Electric Corp. | | | 410,600 | | | | 7,313,401 | |
| | | | | | | | |
| | | | | | $ | 128,571,041 | |
| | | | | | | | |
| Electronics – 8.8% | | | | | | | | |
| Analog Devices, Inc. | | | 364,180 | | | $ | 34,932,146 | |
| Halma PLC | | | 1,130,159 | | | | 20,407,020 | |
| Hirose Electric Co. Ltd. | | | 146,600 | | | | 18,180,174 | |
| Infineon Technologies AG | | | 1,096,910 | | | | 27,963,608 | |
| NVIDIA Corp. | | | 14,804 | | | | 3,507,068 | |
| Samsung Electronics Co. Ltd. | | | 228,939 | | | | 9,582,776 | |
| Taiwan Semiconductor Manufacturing Co. Ltd., ADR | | | 1,231,327 | | | | 45,017,315 | |
| Texas Instruments, Inc. | | | 210,844 | | | | 23,245,551 | |
| | | | | | | | |
| | | | | | $ | 182,835,658 | |
| | | | | | | | |
| Engineering – Construction – 0.2% | | | | | |
| Wartsila Corp. | | | 216,483 | | | $ | 4,254,773 | |
| | | | | | | | |
| Food & Beverages – 9.4% | | | | | | | | |
| Chocoladefabriken Lindt & Sprungli AG | | | 273 | | | $ | 1,770,581 | |
| Danone S.A. | | | 540,351 | | | | 39,611,411 | |
| ITO EN Ltd. | | | 527,600 | | | | 24,446,444 | |
| Kerry Group PLC | | | 220,754 | | | | 23,098,569 | |
| Nestle S.A. | | | 1,037,440 | | | | 80,315,267 | |
| Nissan Foods Holdings Co. Ltd. | | | 80,600 | | | | 5,831,242 | |
| Toyo Suisan Kaisha Ltd. | | | 552,400 | | | | 19,683,132 | |
| | | | | | | | |
| | | | | | $ | 194,756,646 | |
| | | | | | | | |
| Insurance – 1.9% | | | | | | | | |
| Fairfax Financial Holdings Ltd. | | | 32,808 | | | $ | 18,383,860 | |
| Hiscox Ltd. | | | 602,261 | | | | 12,121,222 | |
| Jardine Lloyd Thompson Group PLC | | | 499,077 | | | | 8,430,811 | |
| | | | | | | | |
| | | | | | $ | 38,935,893 | |
| | | | | | | | |
4
MFS International Value Portfolio
Portfolio of Investments (unaudited) – continued
| | | | | | | | |
| Issuer | | Shares/Par | | | Value ($) | |
| COMMON STOCKS – continued | |
| Machinery & Tools – 4.1% | | | | | | | | |
| GEA Group AG | | | 484,142 | | | $ | 16,333,858 | |
| Misumi Group, Inc. | | | 339,300 | | | | 9,898,740 | |
| Nordson Corp. | | | 145,943 | | | | 18,740,541 | |
| Schindler Holding AG | | | 37,836 | | | | 8,148,893 | |
| SMC Corp. | | | 29,900 | | | | 10,972,651 | |
| Spirax Sarco Engineering PLC | | | 251,648 | | | | 21,621,778 | |
| | | | | | | | |
| | | | | | $ | 85,716,461 | |
| | | | | | | | |
| Major Banks – 2.2% | | | | | | | | |
| Sumitomo Mitsui Financial Group, Inc. | | | 171,900 | | | $ | 6,685,647 | |
| Svenska Handelsbanken AB, “A” | | | 1,680,981 | | | | 18,658,664 | |
| UBS AG | | | 1,292,298 | | | | 19,882,100 | |
| | | | | | | | |
| | | | | | $ | 45,226,411 | |
| | | | | | | | |
| Medical Equipment – 2.3% | | | | | | | | |
| Dentsply Sirona, Inc. | | | 229,728 | | | $ | 10,055,195 | |
| Nihon Kohden Corp. | | | 602,000 | | | | 16,774,330 | |
| Terumo Corp. | | | 344,800 | | | | 19,775,821 | |
| | | | | | | | |
| | | | | | $ | 46,605,346 | |
| | | | | | | | |
| Oil Services – 0.6% | | | | | | | | |
| Core Laboratories N.V. | | | 98,661 | | | $ | 12,452,005 | |
| | | | | | | | |
| Other Banks & Diversified Financials – 2.2% | |
| Chiba Bank Ltd. | | | 847,000 | | | $ | 5,990,164 | |
| DnB NOR A.S.A. | | | 463,030 | | | | 9,031,663 | |
| Hachijuni Bank Ltd. | | | 831,100 | | | | 3,558,157 | |
| ING Groep N.V. | | | 103,548 | | | | 1,485,844 | |
| Julius Baer Group Ltd. | | | 117,676 | | | | 6,913,131 | |
| Jyske Bank A.S. | | | 105,293 | | | | 5,772,073 | |
| Mebuki Financial Group, Inc. | | | 1,395,600 | | | | 4,689,186 | |
| North Pacific Bank Ltd. | | | 1,243,300 | | | | 4,166,231 | |
| Sydbank A.S. | | | 139,614 | | | | 4,796,882 | |
| | | | | | | | |
| | | | | | $ | 46,403,331 | |
| | | | | | | | |
| Pharmaceuticals – 2.2% | | | | | | | | |
| Bayer AG | | | 114,660 | | | $ | 12,633,460 | |
| Roche Holding AG | | | 37,173 | | | | 8,271,558 | |
| Santen Pharmaceutical Co. Ltd. | | | 1,407,700 | | | | 24,551,946 | |
| | | | | | | | |
| | | | | | $ | 45,456,964 | |
| | | | | | | | |
| Printing & Publishing – 1.3% | | | | | | | | |
| RELX N.V. | | | 685,095 | | | $ | 14,583,642 | |
| Thomson Reuters Corp. | | | 324,565 | | | | 13,097,154 | |
| | | | | | | | |
| | | | | | $ | 27,680,796 | |
| | | | | | | | |
| | | | | | | | |
| Issuer | | Shares/Par | | | Value ($) | |
| COMMON STOCKS – continued | |
| Real Estate – 5.0% | | | | | | | | |
| Deutsche Wohnen SE | | | 902,756 | | | $ | 43,600,693 | |
| LEG Immobilien AG | | | 122,557 | | | | 13,321,802 | |
| TAG Immobilien AG | | | 468,823 | | | | 10,309,265 | |
| Vonovia SE | | | 746,266 | | | | 35,521,910 | |
| | | | | | | | |
| | | | | | $ | 102,753,670 | |
| | | | | | | | |
| Specialty Chemicals – 2.1% | | | | | | | | |
| Croda International PLC | | | 76,667 | | | $ | 4,858,727 | |
| Kansai Paint Co. Ltd. | | | 100,400 | | | | 2,087,529 | |
| Sika AG | | | 51,060 | | | | 7,036,408 | |
| Symrise AG | | | 330,106 | | | | 28,950,884 | |
| | | | | | | | |
| | | | | | $ | 42,933,548 | |
| | | | | | | | |
| Specialty Stores – 0.1% | | | | | | | | |
| Esprit Holdings Ltd. (a) | | | 6,649,958 | | | $ | 2,068,153 | |
| | | | | | | | |
| Telecommunications – Wireless – 1.4% | | | | | |
| KDDI Corp. | | | 1,058,200 | | | $ | 28,969,916 | |
| | | | | | | | |
| Tobacco – 0.9% | | | | | | | | |
| British American Tobacco PLC | | | 139,775 | | | $ | 7,065,129 | |
| Japan Tobacco, Inc. | | | 415,300 | | | | 11,609,570 | |
| | | | | | | | |
| | | | | | $ | 18,674,699 | |
| | | | | | | | |
| Trucking – 0.2% | | | | | | | | |
| Yamato Holdings Co. Ltd. | | | 124,000 | | | $ | 3,655,656 | |
| | | | | | | | |
Total Common Stocks
(Identified Cost, $1,357,982,053) | | | | | | $ | 1,913,640,305 | |
| | | | | | | | |
| | |
| PREFERRED STOCKS – 2.8% | | | | | | | | |
| Consumer Products – 2.8% | | | | | | | | |
Henkel AG & Co. KGaA
(Identified Cost, $43,516,762) | | | 451,250 | | | $ | 57,747,909 | |
| | | | | | | | |
| |
| INVESTMENT COMPANIES (h) – 3.9% | | | | | |
| Money Market Funds – 3.9% | | | | | | | | |
MFS Institutional Money Market Portfolio, 1.9% (v)
(Identified Cost, $81,758,873) | | | 81,770,780 | | | $ | 81,770,780 | |
| | | | | | | | |
OTHER ASSETS, LESS
LIABILITIES – 0.9% | | | | | | | 18,030,688 | |
| | | | | | | | |
| NET ASSETS – 100.0% | | | | | | $ | 2,071,189,682 | |
| | | | | | | | |
| (a) | | Non-income producing security. |
| (h) | | An affiliated issuer, which may be considered one in which the fund owns 5% or more of the outstanding voting securities, or a company which is under common control. At period end, the aggregate values of the fund’s investments in affiliated issuers and in unaffiliated issuers were $81,770,780 and $1,971,388,214, respectively. |
| (v) | | Affiliated issuer that is available only to investment companies managed by MFS. The rate quoted for the MFS Institutional Money Market Portfolio is the annualized seven-day yield of the fund at period end. |
The following abbreviations are used in this report and are defined:
| ADR | | American Depositary Receipt |
| PLC | | Public Limited Company |
5
MFS International Value Portfolio
Portfolio of Investments (unaudited) – continued
Abbreviations indicate amounts shown in currencies other than the U.S. dollar. All amounts are stated in U.S. dollars unless otherwise indicated. A list of abbreviations is shown below:
Derivative Contracts at 6/30/18
Forward Foreign Currency Exchange Contracts
| | | | | | | | | | | | | | | | | | | | |
| Currency Purchased | | Currency Sold | | Counterparty | | Settlement Date | | | Unrealized
Appreciation
(Depreciation) | |
| Asset Derivatives | | | | | | | | | | | | |
| USD | | | 39,063,859 | | | | | JPY | | 4,135,866,500 | | State Street Bank and Trust Company | | | 8/23/2018 | | | | $1,579,892 | |
| USD | | | 39,032,743 | | | | | JPY | | 4,135,866,500 | | Deutsche Bank AG | | | 8/23/2018 | | | | 1,548,777 | |
| USD | | | 3,717,673 | | | | | JPY | | 390,183 | | Morgan Stanley Capital Services, Inc. | | | 8/22/2018 | | | | 181,629 | |
| | | | | | | | | | | | | | | | | | | | |
| | | | | | | | | | | | | | | | | | | $3,310,298 | |
| | | | | | | | | | | | | | | | | | | | |
See Notes to Financial Statements
6
MFS International Value Portfolio
FINANCIAL STATEMENTS | STATEMENT OF ASSETS AND LIABILITIES (unaudited)
This statement represents your fund’s balance sheet, which details the assets and liabilities comprising the total value of the fund.
| | | | |
At 6/30/18 | | | | |
Assets | | | | |
Investments in unaffiliated issuers, at value (identified cost, $1,401,498,815) | | | $1,971,388,214 | |
Investments in affiliated issuers, at value (identified cost, $81,758,873) | | | 81,770,780 | |
Foreign currency, at value (identified cost, $1,095,642) | | | 1,098,805 | |
Receivables for | | | | |
Forward foreign currency exchange contracts | | | 3,310,298 | |
Investments sold | | | 12,664,855 | |
Fund shares sold | | | 774,158 | |
Interest and dividends | | | 6,492,265 | |
Other assets | | | 5,559 | |
Total assets | | | $2,077,504,934 | |
Liabilities | | | | |
Payables for | | | | |
Investments purchased | | | $3,646,983 | |
Fund shares reacquired | | | 2,231,866 | |
Payable to affiliates | | | | |
Investment adviser | | | 143,668 | |
Shareholder servicing costs | | | 313 | |
Distribution and/or service fees | | | 35,943 | |
Payable for independent Trustees’ compensation | | | 100 | |
Accrued expenses and other liabilities | | | 256,379 | |
Total liabilities | | | $6,315,252 | |
Net assets | | | $2,071,189,682 | |
Net assets consist of | | | | |
Paid-in capital | | | $1,419,422,279 | |
Unrealized appreciation (depreciation) | | | 573,176,021 | |
Accumulated net realized gain (loss) | | | 43,185,564 | |
Undistributed net investment income | | | 35,405,818 | |
Net assets | | | $2,071,189,682 | |
Shares of beneficial interest outstanding | | | 74,845,120 | |
| | | | | | | | | | | | |
| | | Net assets | | | Shares
outstanding | | | Net asset value
per share | |
Initial Class | | | $305,453,843 | | | | 10,875,618 | | | | $28.09 | |
Service Class | | | 1,765,735,839 | | | | 63,969,502 | | | | 27.60 | |
See Notes to Financial Statements
7
MFS International Value Portfolio
FINANCIAL STATEMENTS | STATEMENT OF OPERATIONS (unaudited)
This statement describes how much your fund earned in investment income and accrued in expenses. It also describes any gains and/or losses generated by fund operations.
| | | | |
Six months ended 6/30/18 | | | | |
Net investment income (loss) | | | | |
Income | | | | |
Dividends | | | $31,447,807 | |
Non-cash dividends | | | 1,535,562 | |
Dividends from affiliated issuers | | | 533,337 | |
Income on securities loaned | | | 141,722 | |
Other | | | 296 | |
Foreign taxes withheld | | | (3,135,595 | ) |
Total investment income | | | $30,523,129 | |
Expenses | | | | |
Management fee | | | $8,670,829 | |
Distribution and/or service fees | | | 2,176,845 | |
Shareholder servicing costs | | | 25,947 | |
Administrative services fee | | | 158,796 | |
Independent Trustees’ compensation | | | 18,865 | |
Custodian fee | | | 140,155 | |
Shareholder communications | | | 44,023 | |
Audit and tax fees | | | 29,206 | |
Legal fees | | | 10,558 | |
Miscellaneous | | | 27,179 | |
Total expenses | | | $11,302,403 | |
Reduction of expenses by investment adviser | | | (94,717 | ) |
Net expenses | | | $11,207,686 | |
Net investment income (loss) | | | $19,315,443 | |
Realized and unrealized gain (loss) | | | | |
Realized gain (loss) (identified cost basis) | | | | |
Unaffiliated issuers | | | $32,322,972 | |
Affiliated issuers | | | (1,614 | ) |
Forward foreign currency exchange contracts | | | 275,364 | |
Foreign currency | | | (147,619 | ) |
Net realized gain (loss) | | | $32,449,103 | |
Change in unrealized appreciation or depreciation | | | | |
Unaffiliated issuers | | | $(65,026,186 | ) |
Affiliated issuers | | | 11,907 | |
Forward foreign currency exchange contracts | | | (12,081 | ) |
Translation of assets and liabilities in foreign currencies | | | (90,671 | ) |
Net unrealized gain (loss) | | | $(65,117,031 | ) |
Net realized and unrealized gain (loss) | | | $(32,667,928 | ) |
Change in net assets from operations | | | $(13,352,485 | ) |
See Notes to Financial Statements
8
MFS International Value Portfolio
FINANCIAL STATEMENTS | STATEMENTS OF CHANGES IN NET ASSETS
These statements describe the increases and/or decreases in net assets resulting from operations, any distributions, and any shareholder transactions.
| | | | | | | | |
| | | Six months ended
6/30/18 | | | Year ended
12/31/17 | |
| | | (unaudited) | | | | |
Change in net assets | | | | | | | | |
From operations | | | | | | | | |
Net investment income (loss) | | | $19,315,443 | | | | $16,554,284 | |
Net realized gain (loss) | | | 32,449,103 | | | | 31,084,074 | |
Net unrealized gain (loss) | | | (65,117,031 | ) | | | 371,334,590 | |
Change in net assets from operations | | | $(13,352,485 | ) | | | $418,972,948 | |
Distributions declared to shareholders | | | | | | | | |
From net investment income | | | $— | | | | $(24,251,192 | ) |
From net realized gain | | | — | | | | (1,730,303 | ) |
Total distributions declared to shareholders | | | $— | | | | $(25,981,495 | ) |
Change in net assets from fund share transactions | | | $38,880,587 | | | | $140,743,630 | |
Total change in net assets | | | $25,528,102 | | | | $533,735,083 | |
Net assets | | | | | | | | |
At beginning of period | | | 2,045,661,580 | | | | 1,511,926,497 | |
At end of period (including undistributed net investment
income of $35,405,818 and $16,090,375, respectively) | | | $2,071,189,682 | | | | $2,045,661,580 | |
See Notes to Financial Statements
9
MFS International Value Portfolio
FINANCIAL STATEMENTS | FINANCIAL HIGHLIGHTS
The financial highlights table is intended to help you understand the fund’s financial performance for the semiannual period and the past 5 fiscal years. Certain information reflects financial results for a single fund share. The total returns in the table represent the rate that an investor would have earned (or lost) on an investment in the fund share class (assuming reinvestment of all distributions) held for the entire period.
| | | | | | | | | | | | | | | | | | | | | | | | |
| Initial Class | | Six months
ended 6/30/18 | | | Year ended | |
| | | 12/31/17 | | | 12/31/16 | | | 12/31/15 | | | 12/31/14 | | | 12/31/13 | |
| | | (unaudited) | | | | | | | | | | | | | | | | |
Net asset value, beginning of period | | | $28.25 | | | | $22.57 | | | | $22.46 | | | | $21.73 | | | | $21.86 | | | | $17.34 | |
| Income (loss) from investment operations | | | | | | | | | | | | | | | | | | | | | | | | |
Net investment income (loss) (d) | | | $0.29 | | | | $0.29 | | | | $0.32 | (c) | | | $0.30 | | | | $0.57 | | | | $0.40 | |
Net realized and unrealized gain (loss) | | | (0.45 | ) | | | 5.80 | | | | 0.64 | | | | 1.11 | | | | (0.27 | ) | | | 4.42 | |
Total from investment operations | | | $(0.16 | ) | | | $6.09 | | | | $0.96 | | | | $1.41 | | | | $0.30 | | | | $4.82 | |
| Less distributions declared to shareholders | | | | | | | | | | | | | | | | | | | | | | | | |
From net investment income | | | $— | | | | $(0.39 | ) | | | $(0.32 | ) | | | $(0.45 | ) | | | $(0.43 | ) | | | $(0.30 | ) |
From net realized gain | | | — | | | | (0.02 | ) | | | (0.53 | ) | | | (0.23 | ) | | | — | | | | — | |
Total distributions declared to shareholders | | | $— | | | | $(0.41 | ) | | | $(0.85 | ) | | | $(0.68 | ) | | | $(0.43 | ) | | | $(0.30 | ) |
Net asset value, end of period (x) | | | $28.09 | | | | $28.25 | | | | $22.57 | | | | $22.46 | | | | $21.73 | | | | $21.86 | |
Total return (%) (k)(r)(s)(x) | | | (0.57 | )(n) | | | 27.14 | | | | 4.05 | (c) | | | 6.65 | | | | 1.34 | | | | 27.98 | |
Ratios (%) (to average net assets)
and Supplemental data: | | | | | | | | | | | | | | | | | | | | | | | | |
Expenses before expense reductions (f) | | | 0.89 | (a) | | | 0.91 | | | | 0.91 | (c) | | | 0.93 | | | | 0.95 | | | | 0.96 | |
Expenses after expense reductions (f) | | | 0.88 | (a) | | | 0.90 | | | | 0.89 | (c) | | | 0.91 | | | | 0.94 | | | | 0.96 | |
Net investment income (loss) | | | 2.08 | (a) | | | 1.13 | | | | 1.41 | (c) | | | 1.33 | | | | 2.58 | | | | 2.00 | |
Portfolio turnover | | | 12 | (n) | | | 10 | | | | 17 | | | | 24 | | | | 22 | | | | 11 | |
Net assets at end of period (000 omitted) | | | $305,454 | | | | $317,415 | | | | $238,192 | | | | $230,349 | | | | $218,258 | | | | $223,444 | |
| | |
| Service Class | | Six months
ended 6/30/18 | | | Year ended | |
| | | 12/31/17 | | | 12/31/16 | | | 12/31/15 | | | 12/31/14 | | | 12/31/13 | |
| | | (unaudited) | | | | | | | | | | | | | | | | |
Net asset value, beginning of period | | | $27.80 | | | | $22.23 | | | | $22.13 | | | | $21.44 | | | | $21.58 | | | | $17.14 | |
| Income (loss) from investment operations | | | | | | | | | | | | | | | | | | | | | | | | |
Net investment income (loss) (d) | | | $0.25 | | | | $0.23 | | | | $0.26 | (c) | | | $0.25 | | | | $0.49 | | | | $0.33 | |
Net realized and unrealized gain (loss) | | | (0.45 | ) | | | 5.70 | | | | 0.63 | | | | 1.07 | | | | (0.24 | ) | | | 4.38 | |
Total from investment operations | | | $(0.20 | ) | | | $5.93 | | | | $0.89 | | | | $1.32 | | | | $0.25 | | | | $4.71 | |
| Less distributions declared to shareholders | | | | | | | | | | | | | | | | | | | | | | | | |
From net investment income | | | $— | | | | $(0.34 | ) | | | $(0.26 | ) | | | $(0.40 | ) | | | $(0.39 | ) | | | $(0.27 | ) |
From net realized gain | | | — | | | | (0.02 | ) | | | (0.53 | ) | | | (0.23 | ) | | | — | | | | — | |
Total distributions declared to shareholders | | | $— | | | | $(0.36 | ) | | | $(0.79 | ) | | | $(0.63 | ) | | | $(0.39 | ) | | | $(0.27 | ) |
Net asset value, end of period (x) | | | $27.60 | | | | $27.80 | | | | $22.23 | | | | $22.13 | | | | $21.44 | | | | $21.58 | |
Total return (%) (k)(r)(s)(x) | | | (0.72 | )(n) | | | 26.82 | | | | 3.84 | (c) | | | 6.32 | | | | 1.13 | | | | 27.63 | |
Ratios (%) (to average net assets)
and Supplemental data: | | | | | | | | | | | | | | | | | | | | | | | | |
Expenses before expense reductions (f) | | | 1.14 | (a) | | | 1.16 | | | | 1.16 | (c) | | | 1.18 | | | | 1.20 | | | | 1.21 | |
Expenses after expense reductions (f) | | | 1.13 | (a) | | | 1.15 | | | | 1.14 | (c) | | | 1.16 | | | | 1.19 | | | | 1.21 | |
Net investment income (loss) | | | 1.85 | (a) | | | 0.89 | | | | 1.17 | (c) | | | 1.10 | | | | 2.25 | | | | 1.68 | |
Portfolio turnover | | | 12 | (n) | | | 10 | | | | 17 | | | | 24 | | | | 22 | | | | 11 | |
Net assets at end of period (000 omitted) | | | $1,765,736 | | | | $1,728,247 | | | | $1,273,735 | | | | $1,124,133 | | | | $984,842 | | | | $876,862 | |
See Notes to Financial Statements
10
MFS International Value Portfolio
Financial Highlights – continued
| (c) | Amount reflects a one-time reimbursement of expenses by the custodian (or former custodian) without which net investment income and performance would be lower and expenses would be higher. |
| (d) | Per share data is based on average shares outstanding. |
| (f) | Ratios do not reflect reductions from fees paid indirectly, if applicable. |
| (k) | The total return does not reflect expenses that apply to separate accounts. Inclusion of these charges would reduce the total return figures for all periods shown. |
| (r) | Certain expenses have been reduced without which performance would have been lower. |
| (s) | From time to time the fund may receive proceeds from litigation settlements, without which performance would be lower. |
| (x) | The net asset values and total returns have been calculated on net assets which include adjustments made in accordance with U.S. generally accepted accounting principles required at period end for financial reporting purposes. |
See Notes to Financial Statements
11
MFS International Value Portfolio
NOTES TO FINANCIAL STATEMENTS (unaudited)
| (1) | | Business and Organization |
MFS International Value Portfolio (the fund) is a diversified series of MFS Variable Insurance Trust II (the trust). The trust is organized as a Massachusetts business trust and is registered under the Investment Company Act of 1940, as amended, as an open-end management investment company. The shareholders of each series of the trust are separate accounts of insurance companies, which offer variable annuity and/or life insurance products, and qualified retirement and pension plans.
The fund is an investment company and accordingly follows the investment company accounting and reporting guidance of the Financial Accounting Standards Board (FASB) Accounting Standards Codification Topic 946 Financial Services – Investment Companies.
| (2) | | Significant Accounting Policies |
General – The preparation of financial statements in conformity with U.S. generally accepted accounting principles requires management to make estimates and assumptions that affect the reported amounts of assets and liabilities, and disclosure of contingent assets and liabilities at the date of the financial statements and the reported amounts of increases and decreases in net assets from operations during the reporting period. Actual results could differ from those estimates. In the preparation of these financial statements, management has evaluated subsequent events occurring after the date of the fund’s Statement of Assets and Liabilities through the date that the financial statements were issued. The fund invests in foreign securities. Investments in foreign securities are vulnerable to the effects of changes in the relative values of the local currency and the U.S. dollar and to the effects of changes in each country’s market, economic, industrial, political, regulatory, geopolitical, and other conditions.
Balance Sheet Offsetting – The fund’s accounting policy with respect to balance sheet offsetting is that, absent an event of default by the counterparty or a termination of the agreement, the International Swaps and Derivatives Association (ISDA) Master Agreement, or similar agreement, does not result in an offset of reported amounts of financial assets and financial liabilities in the Statement of Assets and Liabilities across transactions between the fund and the applicable counterparty. The fund’s right to setoff may be restricted or prohibited by the bankruptcy or insolvency laws of the particular jurisdiction to which a specific master netting agreement counterparty is subject. Balance sheet offsetting disclosures, to the extent applicable to the fund, have been included in the fund’s Significant Accounting Policies note under the captions for each of the fund’s in-scope financial instruments and transactions.
Investment Valuations – Equity securities, including restricted equity securities, are generally valued at the last sale or official closing price on their primary market or exchange as provided by a third-party pricing service. Equity securities, for which there were no sales reported that day, are generally valued at the last quoted daily bid quotation on their primary market or exchange as provided by a third-party pricing service. Short-term instruments with a maturity at issuance of 60 days or less may be valued at amortized cost, which approximates market value. Forward foreign currency exchange contracts are generally valued at the mean of bid and asked prices for the time period interpolated from rates provided by a third-party pricing service for proximate time periods. Open-end investment companies are generally valued at net asset value per share. Securities and other assets generally valued on the basis of information from a third-party pricing service may also be valued at a broker/dealer bid quotation. In determining values, third-party pricing services can utilize both transaction data and market information such as yield, quality, coupon rate, maturity, type of issue, trading characteristics, and other market data. The values of foreign securities and other assets and liabilities expressed in foreign currencies are converted to U.S. dollars using the mean of bid and asked prices for rates provided by a third-party pricing service.
The Board of Trustees has delegated primary responsibility for determining or causing to be determined the value of the fund’s investments (including any fair valuation) to the adviser pursuant to valuation policies and procedures approved by the Board. If the adviser determines that reliable market quotations are not readily available, investments are valued at fair value as determined in good faith by the adviser in accordance with such procedures under the oversight of the Board of Trustees. Under the fund’s valuation policies and procedures, market quotations are not considered to be readily available for most types of debt instruments and floating rate loans and many types of derivatives. These investments are generally valued at fair value based on information from third-party pricing services. In addition, investments may be valued at fair value if the adviser determines that an investment’s value has been materially affected by events occurring after the close of the exchange or market on which the investment is principally traded (such as foreign exchange or market) and prior to the determination of the fund’s net asset value, or after the halting of trading of a specific security where trading does not resume prior to the close of the exchange or market on which the security is principally traded. Events that occur on a frequent basis after foreign markets close (such as developments in foreign markets and significant movements in the U.S. markets) and prior to the determination of the fund’s net asset value may be deemed to have a material effect on the value of securities traded in foreign markets. Accordingly, the fund’s foreign equity securities may often be valued at fair value. The adviser generally relies on third-party pricing services or other information (such as the correlation with price movements of similar securities in the same or other markets; the type, cost and investment characteristics of the security; the business and financial condition of the issuer; and trading and other market data) to assist in determining whether to fair value and
at what value to fair value an investment. The value of an investment for purposes of calculating the fund’s net asset value can differ
12
MFS International Value Portfolio
Notes to Financial Statements (unaudited) – continued
depending on the source and method used to determine value. When fair valuation is used, the value of an investment used to determine the fund’s net asset value may differ from quoted or published prices for the same investment. There can be no assurance that the fund could obtain the fair value assigned to an investment if it were to sell the investment at the same time at which the fund determines its net asset value per share.
Various inputs are used in determining the value of the fund’s assets or liabilities. These inputs are categorized into three broad levels. In certain cases, the inputs used to measure fair value may fall into different levels of the fair value hierarchy. In such cases, an investment’s level within the fair value hierarchy is based on the lowest level of input that is significant to the fair value measurement. The fund’s assessment of the significance of a particular input to the fair value measurement in its entirety requires judgment, and considers factors specific to the investment. Level 1 includes unadjusted quoted prices in active markets for identical assets or liabilities. Level 2 includes other significant observable market-based inputs (including quoted prices for similar securities, interest rates, prepayment speed, and credit risk). Level 3 includes unobservable inputs, which may include the adviser’s own assumptions in determining the fair value of investments. Other financial instruments are derivative instruments, such as forward foreign currency exchange contracts. The following is a summary of the levels used as of June 30, 2018 in valuing the fund’s assets or liabilities:
| | | | | | | | | | | | | | | | |
| Financial Instruments | | Level 1 | | | Level 2 | | | Level 3 | | | Total | |
| Equity Securities: | | | | | | | | | | | | | | | | |
Japan | | | $421,059,403 | | | | $— | | | | $— | | | | $421,059,403 | |
United Kingdom | | | 155,876,288 | | | | 140,901,960 | | | | — | | | | 296,778,248 | |
Germany | | | 169,782,750 | | | | 101,348,601 | | | | — | | | | 271,131,351 | |
Switzerland | | | — | | | | 242,039,419 | | | | — | | | | 242,039,419 | |
France | | | — | | | | 230,199,670 | | | | — | | | | 230,199,670 | |
United States | | | 217,339,105 | | | | — | | | | — | | | | 217,339,105 | |
Spain | | | — | | | | 49,439,551 | | | | — | | | | 49,439,551 | |
Netherlands | | | — | | | | 49,126,670 | | | | — | | | | 49,126,670 | |
Taiwan | | | 45,017,315 | | | | — | | | | — | | | | 45,017,315 | |
Other Countries | | | 110,998,200 | | | | 38,259,282 | | | | — | | | | 149,257,482 | |
| Mutual Funds | | | 81,770,780 | | | | — | | | | — | | | | 81,770,780 | |
| Total | | | $1,201,843,841 | | | | $851,315,153 | | | | $— | | | | $2,053,158,994 | |
| | | | |
| Other Financial Instruments | | | | | | | | | | | | |
Forward Foreign Currency Exchange Contracts – Assets | | | $— | | | | $3,310,298 | | | | $— | | | | $3,310,298 | |
For further information regarding security characteristics, see the Portfolio of Investments.
Of the level 2 investments presented above, equity investments amounting to $601,394,242 would have been considered level 1 investments at the beginning of the period. Of the level 1 investments presented above, equity investments amounting to $223,672,441 would have been considered level 2 investments at the beginning of the period. The primary reason for changes in the classifications between levels 1 and 2 occurs when foreign equity securities are fair valued using other observable market-based inputs in place of the closing exchange price due to events occurring after the close of the exchange or market on which the investment is principally traded. The fund’s foreign equity securities may often be valued using other observable market-based inputs. The fund’s policy is to recognize transfers between the levels as of the end of the period.
Foreign Currency Translation – Purchases and sales of foreign investments, income, and expenses are converted into U.S. dollars based upon currency exchange rates prevailing on the respective dates of such transactions or on the reporting date for foreign denominated receivables and payables. Gains and losses attributable to foreign currency exchange rates on sales of securities are recorded for financial statement purposes as net realized gains and losses on investments. Gains and losses attributable to foreign exchange rate movements on receivables, payables, income and expenses are recorded for financial statement purposes as foreign currency transaction gains and losses. That portion of both realized and unrealized gains and losses on investments that results from fluctuations in foreign currency exchange rates is not separately disclosed.
Derivatives – The fund uses derivatives primarily to increase or decrease exposure to a particular market or segment of the market, or security, to increase or decrease interest rate or currency exposure, or as alternatives to direct investments. Derivatives are used for hedging or non-hedging purposes. While hedging can reduce or eliminate losses, it can also reduce or eliminate gains. When the fund uses derivatives as an investment to increase market exposure, or for hedging purposes, gains and losses from derivative instruments may be substantially greater than the derivative’s original cost.
The derivative instruments used by the fund during the period were forward foreign currency exchange contracts. Depending on the type of derivative, the fund may exit a derivative position by entering into an offsetting transaction with a counterparty or exchange,
13
MFS International Value Portfolio
Notes to Financial Statements (unaudited) – continued
negotiating an agreement with the derivative counterparty, or novating the position to a third party. The fund’s period end derivatives, as presented in the Portfolio of Investments and the associated Derivative Contract tables, generally are indicative of the volume of its derivative activity during the period.
The following table presents, by major type of derivative contract, the fair value, on a gross basis, of the asset and liability components of derivatives held by the fund at June 30, 2018 as reported in the Statement of Assets and Liabilities:
| | | | | | |
| | | | | Fair Value | |
| Risk | | Derivative Contracts | | Asset Derivatives | |
| Foreign Exchange | | Forward Foreign Currency Exchange | | | $3,310,298 | |
The following table presents, by major type of derivative contract, the realized gain (loss) on derivatives held by the fund for the six months ended June 30, 2018 as reported in the Statement of Operations:
| | | | |
| Risk | | Forward Foreign
Currency
Exchange
Contracts | |
| Foreign Exchange | | | $275,364 | |
The following table presents, by major type of derivative contract, the change in unrealized appreciation or depreciation on derivatives held by the fund for the six months ended June 30, 2018 as reported in the Statement of Operations:
| | | | |
| Risk | | Forward Foreign
Currency
Exchange
Contracts | |
| Foreign Exchange | | | $(12,081 | ) |
Derivative counterparty credit risk is managed through formal evaluation of the creditworthiness of all potential counterparties. On certain, but not all, uncleared derivatives, the fund attempts to reduce its exposure to counterparty credit risk whenever possible by entering into an ISDA Master Agreement on a bilateral basis. The ISDA Master Agreement gives each party to the agreement the right to terminate all transactions traded under such agreement if there is a specified deterioration in the credit quality of the other party. Upon an event of default or a termination of the ISDA Master Agreement, the non-defaulting party has the right to close out all transactions traded under such agreement and to net amounts owed under each agreement to one net amount payable by one party to the other. This right to close out and net payments across all transactions traded under the ISDA Master Agreement could result in a reduction of the fund’s credit risk to such counterparty equal to any amounts payable by the fund under the applicable transactions, if any.
Collateral and margin requirements differ by type of derivative. For cleared derivatives (e.g., futures contracts, cleared swaps, and exchange-traded options), margin requirements are set by the clearing broker and the clearing house and collateral, in the form of cash or securities, is posted by the fund directly with the clearing broker. Collateral terms are counterparty agreement specific for uncleared derivatives (e.g., forward foreign currency exchange contracts, uncleared swap agreements, and uncleared options) and collateral, in the form of cash and securities, is held in segregated accounts with the fund’s custodian in connection with these agreements. For derivatives traded under an ISDA Master Agreement, which contains a collateral support annex, the collateral requirements are netted across all transactions traded under such counterparty-specific agreement and one amount is posted from one party to the other to collateralize such obligations. Cash that has been segregated or delivered to cover the fund’s collateral or margin obligations under derivative contracts, if any, will be reported separately in the Statement of Assets and Liabilities as restricted cash for uncleared derivatives and/or deposits with brokers for cleared derivatives. Securities pledged as collateral or margin for the same purpose, if any, are noted in the Portfolio of Investments. The fund may be required to make payments of interest on uncovered collateral or margin obligations with the broker. Any such payments are included in “Miscellaneous” expense in the Statement of Operations.
Forward Foreign Currency Exchange Contracts – The fund entered into forward foreign currency exchange contracts for the purchase or sale of a specific foreign currency at a fixed price on a future date. These contracts may be used to hedge the fund’s currency risk or for non-hedging purposes. For hedging purposes, the fund may enter into contracts to deliver or receive foreign currency that the fund will receive from or use in its normal investment activities. The fund may also use contracts to hedge against declines in the value of foreign currency denominated securities due to unfavorable exchange rate movements. For non-hedging purposes, the fund may enter into contracts with the intent of changing the relative exposure of the fund’s portfolio of securities to different currencies to take advantage of anticipated exchange rate changes.
14
MFS International Value Portfolio
Notes to Financial Statements (unaudited) – continued
Forward foreign currency exchange contracts are adjusted by the daily exchange rate of the underlying currency and any unrealized gains or losses are recorded as a receivable or payable for forward foreign currency exchange contracts until the contract settlement date. On contract settlement date, any gain or loss on the contract is recorded as realized gains or losses on forward foreign currency exchange contracts.
Risks may arise upon entering into these contracts from unanticipated movements in the value of the contract and from the potential inability of counterparties to meet the terms of their contracts. Generally, the fund’s maximum risk due to counterparty credit risk is the unrealized gain on the contract due to the use of Continuous Linked Settlement, a multicurrency cash settlement system for the centralized settlement of foreign transactions. This risk is mitigated in cases where there is an ISDA Master Agreement between the fund and the counterparty providing for netting as described above and, where applicable, by the posting of collateral by the counterparty to the fund to cover the fund’s exposure to the counterparty under such ISDA Master Agreement.
Security Loans – Under its Securities Lending Agency Agreement with the fund, State Street Bank and Trust Company (“State Street”), as lending agent, loans the securities of the fund to certain qualified institutions (the “Borrowers”) approved by the fund. Security loans can be terminated at the discretion of either the lending agent or the fund and the related securities must be returned within the earlier of the standard trade settlement period for such securities or within three business days. The loans are collateralized by cash and/or U.S. Treasury and federal agency obligations in an amount typically at least equal to the market value of the securities loaned. On loans collateralized by cash, the cash collateral is invested in a money market fund. The market value of the loaned securities is determined at the close of business of the fund and any additional required collateral is delivered to the fund on the next business day. State Street provides the fund with indemnification against Borrower default. In the event of Borrower default, State Street will, for the benefit of the fund, either purchase securities identical to those loaned or, when such purchase is commercially impracticable, pay the fund the market value of the loaned securities. In return, State Street assumes the fund’s rights to the related collateral. If the collateral value is less than the cost to purchase identical securities, State Street is responsible for the shortfall, but only to the extent that such shortfall is not due to a decline in collateral value resulting from collateral reinvestment for which the fund bears the risk of loss. A portion of the income generated upon investment of the collateral is remitted to the Borrowers, and the remainder is allocated between the fund and the lending agent. On loans collateralized by U.S. Treasury and/or federal agency obligations, a fee is received from the Borrower, and is allocated between the fund and the lending agent. Income from securities lending is separately reported in the Statement of Operations. The dividend and interest income earned on the securities loaned is accounted for in the same manner as other dividend and interest income. At June 30, 2018, there were no securities on loan or collateral outstanding.
Indemnifications – Under the fund’s organizational documents, its officers and Trustees may be indemnified against certain liabilities and expenses arising out of the performance of their duties to the fund. Additionally, in the normal course of business, the fund enters into agreements with service providers that may contain indemnification clauses. The fund’s maximum exposure under these agreements is unknown as this would involve future claims that may be made against the fund that have not yet occurred.
Investment Transactions and Income – Investment transactions are recorded on the trade date. Interest income is recorded on the accrual basis. Dividends received in cash are recorded on the ex-dividend date. Certain dividends from foreign securities will be recorded when the fund is informed of the dividend if such information is obtained subsequent to the ex-dividend date. Dividend payments received in additional securities are recorded on the ex-dividend date in an amount equal to the value of the security on such date.
The fund may receive proceeds from litigation settlements. Any proceeds received from litigation involving portfolio holdings are reflected in the Statement of Operations in realized gain/loss if the security has been disposed of by the fund or in unrealized gain/loss if the security is still held by the fund. Any other proceeds from litigation not related to portfolio holdings are reflected as other income in the Statement of Operations.
Tax Matters and Distributions – The fund intends to qualify as a regulated investment company, as defined under Subchapter M of the Internal Revenue Code, and to distribute all of its taxable income, including realized capital gains. As a result, no provision for federal income tax is required. The fund’s federal tax returns, when filed, will remain subject to examination by the Internal Revenue Service for a three year period. Management has analyzed the fund’s tax positions taken on federal and state tax returns for all open tax years and does not believe that there are any uncertain tax positions that require recognition of a tax liability. Foreign taxes, if any, have been accrued by the fund in the accompanying financial statements in accordance with the applicable foreign tax law. Foreign income taxes may be withheld by certain countries in which the fund invests. Additionally, capital gains realized by the fund on securities issued in or by certain foreign countries may be subject to capital gains tax imposed by those countries.
Distributions to shareholders are recorded on the ex-dividend date. Income and capital gain distributions are determined in accordance with income tax regulations, which may differ from U.S. generally accepted accounting principles. Certain capital accounts in the financial statements are periodically adjusted for permanent differences in order to reflect their tax character. These adjustments have no impact on net assets or net asset value per share. Temporary differences which arise from recognizing certain items of income, expense, gain or loss in different periods for financial statement and tax purposes will reverse at some time in the
15
MFS International Value Portfolio
Notes to Financial Statements (unaudited) – continued
future. Distributions in excess of net investment income or net realized gains are temporary overdistributions for financial statement purposes resulting from differences in the recognition or classification of income or distributions for financial statement and tax purposes.
Book/tax differences primarily relate to passive foreign investment companies, wash sale loss deferrals, and derivative transactions.
The tax character of distributions declared to shareholders for the last fiscal year is as follows:
| | | | |
| | | Year ended | |
| | | 12/31/17 | |
| Ordinary income (including any short-term capital gains) | | | $25,981,495 | |
The federal tax cost and the tax basis components of distributable earnings were as follows:
| | | | |
| As of 6/30/18 | | | | |
| Cost of investments | | | $1,499,307,312 | |
| Gross appreciation | | | 582,598,065 | |
| Gross depreciation | | | (28,746,383 | ) |
| Net unrealized appreciation (depreciation) | | | $553,851,682 | |
| |
| As of 12/31/17 | | | | |
| Undistributed ordinary income | | | 19,510,403 | |
| Undistributed long-term capital gain | | | 23,464,378 | |
| Other temporary differences | | | (43,233 | ) |
| Net unrealized appreciation (depreciation) | | | 622,188,340 | |
The aggregate cost above includes prior fiscal year end tax adjustments, if applicable.
Multiple Classes of Shares of Beneficial Interest – The fund offers multiple classes of shares, which differ in their respective distribution and/or service fees. The fund’s income, realized and unrealized gain (loss), and common expenses are allocated to shareholders based on the daily net assets of each class. Dividends are declared separately for each class. Differences in per share dividend rates are generally due to differences in separate class expenses. The fund’s distributions declared to shareholders as reported in the Statements of Changes in Net Assets are presented by class as follows:
| | | | | | | | | | | | | | | | |
| | | From net investment
income | | | From net realized
gain | |
| | | Six months ended
6/30/18 | | | Year ended
12/31/17 | | | Six months ended
6/30/18 | | | Year ended
12/31/17 | |
| Initial Class | | | $— | | | | $4,007,935 | | | | $— | | | | $254,388 | |
| Service Class | | | — | | | | 20,243,257 | | | | — | | | | 1,475,915 | |
| Total | | | $— | | | | $24,251,192 | | | | $— | | | | $1,730,303 | |
| (3) | | Transactions with Affiliates |
Investment Adviser – The fund has an investment advisory agreement with MFS to provide overall investment management and related administrative services and facilities to the fund. The management fee is computed daily and paid monthly at the following annual rates based on the fund’s average daily net assets:
| | | | |
| Up to $1 billion | | | 0.90% | |
| In excess of $1 billion and up to $2 billion | | | 0.80% | |
| In excess of $2 billion | | | 0.70% | |
MFS has agreed in writing to reduce its management fee by a specified amount if certain MFS mutual fund assets exceed thresholds agreed to by MFS and the fund’s Board of Trustees. For the six months ended June 30, 2018, this management fee reduction amounted to $94,717, which is included in the reduction of total expenses in the Statement of Operations. The management fee incurred for the six months ended June 30, 2018 was equivalent to an annual effective rate of 0.84% of the fund’s average daily net assets.
The investment adviser has agreed in writing to pay a portion of the fund’s total annual operating expenses, excluding interest, taxes, extraordinary expenses, brokerage and transaction costs, and investment-related expenses, such that total annual operating expenses do not exceed 0.90% of average daily net assets for the Initial Class shares and 1.15% of average daily net assets for the Service Class shares. This written agreement will continue until modified by the fund’s Board of Trustees, but such agreement will continue at least until April 30, 2020. For the six months ended June 30, 2018, the fund’s actual operating expenses did not exceed the limit and therefore, the investment adviser did not pay any portion of the fund’s expenses related to this agreement.
16
MFS International Value Portfolio
Notes to Financial Statements (unaudited) – continued
Distributor – MFS Fund Distributors, Inc. (MFD), a wholly-owned subsidiary of MFS, is the distributor of shares of the fund. The Trustees have adopted a distribution plan for the Service Class shares pursuant to Rule 12b-1 under the Investment Company Act of 1940.
The fund’s distribution plan provides that the fund will pay MFD distribution and/or service fees equal to 0.25% per annum of its average daily net assets attributable to Service Class shares as partial consideration for services performed and expenses incurred by MFD and financial intermediaries (including participating insurance companies that invest in the fund to fund variable annuity and variable life insurance contracts, sponsors of qualified retirement and pension plans that invest in the fund, and affiliates of these participating insurance companies and plan sponsors) in connection with the sale and distribution of the Service Class shares. MFD may subsequently pay all, or a portion, of the distribution and/or service fees to financial intermediaries.
Shareholder Servicing Agent – MFS Service Center, Inc. (MFSC), a wholly-owned subsidiary of MFS, receives a fee from the fund for its services as shareholder servicing agent. For the six months ended June 30, 2018, the fee was $25,633, which equated to 0.0025% annually of the fund’s average daily net assets. MFSC also receives payment from the fund for out-of-pocket expenses paid by MFSC on behalf of the fund. For the six months ended June 30, 2018, these costs amounted to $314.
Administrator – MFS provides certain financial, legal, shareholder communications, compliance, and other administrative services to the fund. Under an administrative services agreement, the fund reimburses MFS the costs incurred to provide these services. The fund is charged an annual fixed amount of $17,500 plus a fee based on average daily net assets. The administrative services fee incurred for the six months ended June 30, 2018 was equivalent to an annual effective rate of 0.0155% of the fund’s average daily net assets.
Trustees’ and Officers’ Compensation – The fund pays compensation to independent Trustees in the form of a retainer, attendance fees, and additional compensation to Board and Committee chairpersons. The fund does not pay compensation directly to Trustees or officers of the fund who are also officers of the investment adviser, all of whom receive remuneration for their services to the fund from MFS. Certain officers and Trustees of the fund are officers or directors of MFS, MFD, and MFSC.
Other – This fund and certain other funds managed by MFS (the funds) have entered into a service agreement (the ISO Agreement) which provides for payment of fees solely by the funds to Tarantino LLC in return for the provision of services of an Independent Senior Officer (ISO) for the funds. Frank L. Tarantino serves as the ISO and is an officer of the funds and the sole member of Tarantino LLC. The funds can terminate the ISO Agreement with Tarantino LLC at any time under the terms of the ISO Agreement. For the six months ended June 30, 2018, the fee paid by the fund under this agreement was $1,642 and is included in “Miscellaneous” expense in the Statement of Operations. MFS has agreed to bear all expenses associated with office space, other administrative support, and supplies provided to the ISO.
The fund invests in the MFS Institutional Money Market Portfolio which is managed by MFS and seeks current income consistent with preservation of capital and liquidity. This money market fund does not pay a management fee to MFS.
The fund is permitted to engage in purchase and sale transactions with funds and accounts for which MFS serves as investment adviser or sub-adviser (“cross-trades”) pursuant to a policy adopted by the Board of Trustees. This policy has been designed to ensure that cross-trades conducted by the fund comply with Rule 17a-7 under the Investment Company Act of 1940. During the six months ended June 30, 2018, the fund engaged in purchase and sale transactions pursuant to this policy, which amounted to $226,292 and $2,342,032, respectively. The sales transactions resulted in net realized gains (losses) of $33,037.
For the six months ended June 30, 2018, purchases and sales of investments, other than short-term obligations, aggregated $252,100,102 and $231,635,951, respectively.
| (5) | | Shares of Beneficial Interest |
The fund’s Declaration of Trust permits the Trustees to issue an unlimited number of full and fractional shares of beneficial interest. Transactions in fund shares were as follows:
| | | | | | | | | | | | | | | | |
| | | Six months ended 6/30/18 | | | Year ended 12/31/17 | |
| | | Shares | | | Amount | | | Shares | | | Amount | |
| Shares sold | | | | | | | | | | | | | | | | |
Initial Class | | | 738,108 | | | | $20,847,900 | | | | 2,886,969 | | | | $74,370,699 | |
Service Class | | | 4,774,608 | | | | 132,445,044 | | | | 10,119,707 | | | | 254,467,286 | |
| | | 5,512,716 | | | | $153,292,944 | | | | 13,006,676 | | | | $328,837,985 | |
| Shares issued to shareholders in reinvestment of distributions | | | | | | | | | | | | | | | | |
Initial Class | | | — | | | | $— | | | | 156,248 | | | | $4,262,323 | |
Service Class | | | — | | | | — | | | | 845,762 | | | | 21,719,172 | |
| | | — | | | | $— | | | | 1,002,010 | | | | $25,981,495 | |
17
MFS International Value Portfolio
Notes to Financial Statements (unaudited) – continued
| | | | | | | | | | | | | | | | |
| | | Six months ended 6/30/18 | | | Year ended 12/31/17 | |
| | | Shares | | | Amount | | | Shares | | | Amount | |
| Shares reacquired | | | | | | | | | | | | | | | | |
Initial Class | | | (1,098,118 | ) | | | $(31,222,974 | ) | | | (2,360,709 | ) | | | $(60,630,463 | ) |
Service Class | | | (2,974,272 | ) | | | (83,189,383 | ) | | | (6,099,396 | ) | | | (153,445,387 | ) |
| | | (4,072,390 | ) | | | $(114,412,357 | ) | | | (8,460,105 | ) | | | $(214,075,850 | ) |
| Net change | | | | | | | | | | | | | | | | |
Initial Class | | | (360,010 | ) | | | $(10,375,074 | ) | | | 682,508 | | | | $18,002,559 | |
Service Class | | | 1,800,336 | | | | 49,255,661 | | | | 4,866,073 | | | | 122,741,071 | |
| | | 1,440,326 | | | | $38,880,587 | | | | 5,548,581 | | | | $140,743,630 | |
The fund is one of several mutual funds in which certain MFS funds may invest. The MFS funds do not invest in the underlying funds for the purpose of exercising management or control. At the end of the period, the MFS Moderate Allocation Portfolio, the MFS Growth Allocation Portfolio, and the MFS Conservative Allocation Portfolio were the owners of record of approximately 2%, 1%, and 1%, respectively, of the value of outstanding voting shares of the fund.
Effective at the close of business on October 16, 2017, the fund is closed to new investors subject to certain exceptions. Please see the fund’s prospectus for details.
The fund and certain other funds managed by MFS participate in a $1.25 billion unsecured committed line of credit, subject to a $1 billion sublimit, provided by a syndication of banks under a credit agreement. Borrowings may be made for temporary financing needs. Interest is charged to each fund, based on its borrowings, generally at a rate equal to the higher of the Overnight Bank Funding rate or daily one month LIBOR plus an agreed upon spread. A commitment fee, based on the average daily, unused portion of the committed line of credit, is allocated among the participating funds. In addition, the fund and other funds managed by MFS have established unsecured uncommitted borrowing arrangements with certain banks for temporary financing needs. Interest is charged to each fund, based on its borrowings, at a rate equal to the Overnight Bank Funding rate plus an agreed upon spread. For the six months ended June 30, 2018, the fund’s commitment fee and interest expense were $6,095 and $0, respectively, and are included in “Miscellaneous” expense in the Statement of Operations.
| (7) | | Investments in Affiliated Issuers |
An affiliated issuer may be considered one in which the fund owns 5% or more of the outstanding voting securities, or a company which is under common control. For the purposes of this report, the fund assumes the following to be affiliated issuers:
| | | | | | | | | | | | | | | | | | |
| Affiliated Issuers | | | | Beginning
Shares/Par
Amount | | | Acquisitions
Shares/Par
Amount | | | Dispositions
Shares/Par
Amount | | | Ending
Shares/Par
Amount | |
| MFS Institutional Money Market Portfolio | | | | | 57,389,567 | | | | 143,869,444 | | | | (119,488,231 | ) | | | 81,770,780 | |
| | | | | |
| Affiliated Issuers | | Realized
Gain (Loss) | | Change in
Unrealized
Appreciation/
Depreciation | | | Capital Gain
Distributions | | | Dividend
Income | | | Ending
Value | |
| MFS Institutional Money Market Portfolio | | $(1,614) | | | $11,907 | | | | $— | | | | $533,337 | | | | $81,770,780 | |
18
MFS International Value Portfolio
PROXY VOTING POLICIES AND INFORMATION
MFS votes proxies on behalf of the fund pursuant to proxy voting policies and procedures that are available without charge, upon request, by calling 1-800-225-2606, by visiting mfs.com/proxyvoting, or by visiting the SEC’s Web site at http://www.sec.gov.
Information regarding how the fund voted proxies relating to portfolio securities during the most recent twelve-month period ended June 30 is available by August 31 of each year without charge by visiting mfs.com/proxyvoting, or by visiting the SEC’s Web site at http://www.sec.gov.
QUARTERLY PORTFOLIO DISCLOSURE
The fund will file a complete schedule of portfolio holdings with the Securities and Exchange Commission (the Commission) for the first and third quarters of each fiscal year on Form N-Q. The fund’s Form N-Q is available on the EDGAR database on the Commission’s Internet Web site at http://www.sec.gov, and may be reviewed and copied at the:
Public Reference Room
Securities and Exchange Commission
100 F Street, NE, Room 1580
Washington, D.C. 20549
Information on the operation of the Public Reference Room may be obtained by calling the Commission at 1-800-SEC-0330. Copies of the fund’s Form N-Q also may be obtained, upon payment of a duplicating fee, by electronic request at the following e-mail address: publicinfo@sec.gov or by writing the Public Reference Section at the above address.
FURTHER INFORMATION
From time to time, MFS may post important information about the fund or the MFS funds on the MFS web site (mfs.com). This information is available at https://www.mfs.com/en-us/what-we-do/announcements.html or at mfs.com/vit2 by choosing the fund’s name.
INFORMATION ABOUT FUND CONTRACTS AND LEGAL CLAIMS
The fund has entered into contractual arrangements with an investment adviser, administrator, distributor, shareholder servicing agent, 529 program manager (if applicable), and custodian who each provide services to the fund. Unless expressly stated otherwise, shareholders are not parties to, or intended beneficiaries of these contractual arrangements, and these contractual arrangements are not intended to create any shareholder right to enforce them against the service providers or to seek any remedy under them against the service providers, either directly or on behalf of the fund.
Under the Trust’s By-Laws and Declaration of Trust, any claims asserted against or on behalf of the MFS Funds, including claims against Trustees and Officers, must be brought in state and federal courts located within the Commonwealth of Massachusetts.
19
Semiannual Report
June 30, 2018

MFS® Massachusetts Investors
Growth Stock Portfolio

MFS® Variable Insurance Trust II
MIS-SEM
MFS® Massachusetts Investors Growth Stock Portfolio
CONTENTS
The report is prepared for the general information of contract owners. It is authorized for distribution to prospective investors only when preceded or accompanied by a current prospectus.
NOT FDIC INSURED • MAY LOSE VALUE • NO BANK OR CREDIT UNION GUARANTEE • NOT A DEPOSIT • NOT INSURED BY ANY FEDERAL GOVERNMENT AGENCY OR NCUA/NCUSIF
MFS Massachusetts Investors Growth Stock Portfolio
LETTER FROM THE EXECUTIVE CHAIRMAN

Dear Contract Owners:
Rising bond yields, international trade friction and geopolitical uncertainty have contributed to a measurable uptick in market volatility — a departure from the low-volatility environment that prevailed for much of 2017. In recent months, against this more challenging backdrop, global markets have given back some of the strong gains recorded during 2017 and early 2018. But global economic growth remains healthy, notwithstanding signs of a modest slowdown over the past few months, particularly in Europe and China.
Although the U.S. Federal Reserve continues to gradually raise interest rates and shrink its balance sheet, monetary policy remains accommodative around the world, with many central banks taking only tentative steps toward tighter policies. Newly enacted U.S. tax reforms have been welcomed by equity markets, while emerging market economies have recently had to contend with tighter financial conditions as a result of firmer U.S. Treasury yields and a stronger dollar. Around the world, inflation remains largely subdued, but tight labor markets and solid global demand have investors on the lookout for its potential resurgence. Increased U.S. protectionism is also a growing concern, as investors fear that trade disputes could dampen business sentiment, leading to slower global growth.
As a global investment manager, MFS® strives to create long-term value for clients through an active approach and an investment platform built on nearly a century of expertise. To make that long-term value meaningful for clients, we work to align with you on our beliefs, your needs and the time it takes to deliver on your desired outcomes.
Respectfully,

Robert J. Manning
Executive Chairman
MFS Investment Management
August 16, 2018
The opinions expressed in this letter are subject to change and may not be relied upon for investment advice. No forecasts can be guaranteed.
1
MFS Massachusetts Investors Growth Stock Portfolio
PORTFOLIO COMPOSITION
Portfolio structure
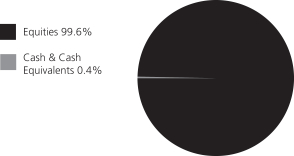
| | | | |
| Top ten holdings | | | | |
| Alphabet, Inc., “A” | | | 6.6% | |
| Microsoft Corp. | | | 4.3% | |
| Accenture PLC, “A” | | | 4.0% | |
| Visa, Inc., “A” | | | 3.1% | |
| Texas Instruments, Inc. | | | 2.9% | |
| Apple, Inc. | | | 2.8% | |
| NIKE, Inc., “B” | | | 2.6% | |
| Thermo Fisher Scientific, Inc. | | | 2.6% | |
| Verisk Analytics, Inc., “A” | | | 2.5% | |
| Colgate-Palmolive Co. | | | 2.3% | |
| | | | |
| Equity sectors | | | | |
| Technology | | | 20.6% | |
| Special Products & Services | | | 14.3% | |
| Health Care | | | 10.9% | |
| Financial Services | | | 10.4% | |
| Consumer Staples | | | 10.3% | |
| Leisure | | | 9.4% | |
| Retailing | | | 8.4% | |
| Industrial Goods & Services | | | 7.5% | |
| Basic Materials | | | 3.5% | |
| Autos & Housing | | | 1.9% | |
| Transportation | | | 1.7% | |
| Energy | | | 0.7% | |
Cash & Cash Equivalents includes any cash, investments in money market funds, short-term securities, and other assets less liabilities. Please see the Statement of Assets and Liabilities for additional information related to the fund’s cash position and other assets and liabilities.
Percentages are based on net assets as of June 30, 2018.
The portfolio is actively managed and current holdings may be different.
2
MFS Massachusetts Investors Growth Stock Portfolio
EXPENSE TABLE
Fund Expenses Borne by the Contract Holders during the Period,
January 1, 2018 through June 30, 2018
As a contract holder of the fund, you incur ongoing costs, including management fees; distribution and/or service (12b-1) fees; and other fund expenses. This example is intended to help you understand your ongoing costs (in dollars) of investing in the fund and to compare these costs with the ongoing costs of investing in other mutual funds.
The example is based on an investment of $1,000 invested at the beginning of the period and held for the entire period January 1, 2018 through June 30, 2018.
Actual Expenses
The first line for each share class in the following table provides information about actual account values and actual expenses. You may use the information in this line, together with the amount you invested, to estimate the expenses that you paid over the period. Simply divide your account value by $1,000 (for example, an $8,600 account value divided by $1,000 = 8.6), then multiply the result by the number in the first line under the heading entitled “Expenses Paid During Period” to estimate the expenses you paid on your account during this period.
Hypothetical Example for Comparison Purposes
The second line for each share class in the following table provides information about hypothetical account values and hypothetical expenses based on the fund’s actual expense ratio and an assumed rate of return of 5% per year before expenses, which is not the fund’s actual return. The hypothetical account values and expenses may not be used to estimate the actual ending account balance or expenses you paid for the period. You may use this information to compare the ongoing costs of investing in the fund and other funds. To do so, compare this 5% hypothetical example with the 5% hypothetical examples that appear in the shareholder reports of the other funds.
Please note that the expenses shown in the table are meant to highlight the fund’s ongoing costs only and do not take into account the fees and expenses imposed under the variable contracts through which your investment in the fund is made. Therefore, the second line for each share class in the table is useful in comparing ongoing costs associated with an investment in vehicles (such as the fund) which fund benefits under variable annuity and variable life insurance contracts and to qualified pension and retirement plans only, and will not help you determine the relative total costs of investing in the fund through variable annuity and variable life insurance contracts. If the fees and expenses imposed under the variable contracts were included, your costs would have been higher.
| | | | | | | | | | | | | | | | | | |
| Share Class | | | | Annualized
Expense Ratio | | | Beginning
Account Value
1/01/18 | | | Ending Account Value 6/30/18 | | | Expenses Paid
During Period (p)
1/01/18-6/30/18 | |
| Initial Class | | Actual | | | 0.79% | | | | $1,000.00 | | | | $1,055.38 | | | | $4.03 | |
| | Hypothetical (h) | | | 0.79% | | | | $1,000.00 | | | | $1,020.88 | | | | $3.96 | |
| Service Class | | Actual | | | 1.04% | | | | $1,000.00 | | | | $1,054.41 | | | | $5.30 | |
| | Hypothetical (h) | | | 1.04% | | | | $1,000.00 | | | | $1,019.64 | | | | $5.21 | |
| (h) | 5% class return per year before expenses. |
| (p) | “Expenses Paid During Period” are equal to each class’s annualized expense ratio, as shown above, multiplied by the average account value over the period, multiplied by 181/365 (to reflect the one-half year period). |
3
MFS Massachusetts Investors Growth Stock Portfolio
PORTFOLIO OF INVESTMENTS – 6/30/18 (unaudited)
The Portfolio of Investments is a complete list of all securities owned by your fund. It is categorized by broad-based asset classes.
| | | | | | | | |
| Issuer | | Shares/Par | | | Value ($) | |
| COMMON STOCKS – 99.6% | | | | | | | | |
| Aerospace – 1.5% | | | | | |
| United Technologies Corp. | | | 106,395 | | | $ | 13,302,567 | |
| | | | | | | | |
| Alcoholic Beverages – 0.9% | | | | | | | | |
| Pernod Ricard S.A. | | | 49,158 | | | $ | 8,023,320 | |
| | | | | | | | |
| Apparel Manufacturers – 5.7% | | | | | | | | |
| LVMH Moet Hennessy Louis Vuitton SE | | | 40,329 | | | $ | 13,406,116 | |
| NIKE, Inc., “B” | | | 303,087 | | | | 24,149,972 | |
| VF Corp. | | | 175,746 | | | | 14,326,814 | |
| | | | | | | | |
| | | | | | $ | 51,882,902 | |
| | | | | | | | |
| Broadcasting – 0.4% | | | | | | | | |
| Walt Disney Co. | | | 33,805 | | | $ | 3,543,102 | |
| | | | | | | | |
| Brokerage & Asset Managers – 3.1% | | | | | | | | |
| Blackstone Group LP | | | 517,261 | | | $ | 16,640,286 | |
| Charles Schwab Corp. | | | 114,527 | | | | 5,852,330 | |
| CME Group, Inc. | | | 35,680 | | | | 5,848,666 | |
| | | | | | | | |
| | | | | | $ | 28,341,282 | |
| | | | | | | | |
| Business Services – 14.3% | | | | | | | | |
| Accenture PLC, “A” | | | 221,406 | | | $ | 36,219,807 | |
| Cognizant Technology Solutions Corp., “A” | | | 221,699 | | | | 17,512,004 | |
| Equifax, Inc. | | | 37,115 | | | | 4,643,458 | |
| Experian Group Ltd. | | | 444,276 | | | | 10,990,821 | |
| Fidelity National Information Services, Inc. | | | 184,508 | | | | 19,563,383 | |
| Fiserv, Inc. (a) | | | 257,819 | | | | 19,101,810 | |
| Verisk Analytics, Inc., “A” (a) | | | 211,156 | | | | 22,728,832 | |
| | | | | | | | |
| | | | | | $ | 130,760,115 | |
| | | | | | | | |
| Cable TV – 2.1% | | | | | | | | |
| Comcast Corp., “A” | | | 575,890 | | | $ | 18,894,951 | |
| | | | | | | | |
| Chemicals – 1.6% | | | | | | | | |
| LyondellBasell Industries N.V., “A” | | | 30,083 | | | $ | 3,304,618 | |
| PPG Industries, Inc. | | | 113,387 | | | | 11,761,633 | |
| | | | | | | | |
| | | | | | $ | 15,066,251 | |
| | | | | | | | |
| Computer Software – 4.3% | | | | | | | | |
| Microsoft Corp. | | | 399,186 | | | $ | 39,363,731 | |
| | | | | | | | |
| Computer Software – Systems – 2.8% | |
| Apple, Inc. | | | 137,662 | | | $ | 25,482,613 | |
| | | | | | | | |
| Construction – 1.9% | | | | | | | | |
| Sherwin-Williams Co. | | | 42,230 | | | $ | 17,211,681 | |
| | | | | | | | |
| Consumer Products – 8.2% | | | | | | | | |
| Church & Dwight Co., Inc. | | | 114,027 | | | $ | 6,061,675 | |
| Colgate-Palmolive Co. | | | 328,544 | | | | 21,292,937 | |
| Coty, Inc., “A” | | | 676,841 | | | | 9,543,458 | |
| Estee Lauder Cos., Inc., “A” | | | 114,410 | | | | 16,325,163 | |
| L’Oréal | | | 32,199 | | | | 7,944,328 | |
| Reckitt Benckiser Group PLC | | | 167,765 | | | | 13,813,641 | |
| | | | | | | | |
| | | | | | $ | 74,981,202 | |
| | | | | | | | |
| | | | | | | | |
| Issuer | | Shares/Par | | | Value ($) | |
| COMMON STOCKS – continued | | | | | |
| Electrical Equipment – 3.8% | | | | | |
| Amphenol Corp., “A” | | | 160,551 | | | $ | 13,992,019 | |
| Fortive Corp. | | | 147,108 | | | | 11,343,498 | |
| Mettler-Toledo International, Inc. (a) | | | 16,155 | | | | 9,347,768 | |
| | | | | | | | |
| | | | | | $ | 34,683,285 | |
| | | | | | | | |
| Electronics – 5.9% | | | | | | | | |
| Analog Devices, Inc. | | | 152,046 | | | $ | 14,584,252 | |
| Taiwan Semiconductor Manufacturing Co. Ltd., ADR | | | 362,028 | | | | 13,235,744 | |
| Texas Instruments, Inc. | | | 239,528 | | | | 26,407,962 | |
| | | | | | | | |
| | | | | | $ | 54,227,958 | |
| | | | | | | | |
| Entertainment – 0.5% | | | | | | | | |
| Twenty-First Century Fox, Inc. | | | 88,126 | | | $ | 4,378,981 | |
| | | | | | | | |
| Food & Beverages – 1.2% | | | | | | | | |
| PepsiCo, Inc. | | | 97,607 | | | $ | 10,626,474 | |
| | | | | | | | |
| Gaming & Lodging – 1.0% | | | | | | | | |
| Paddy Power Betfair PLC | | | 83,523 | | | $ | 9,149,050 | |
| | | | | | | | |
| Insurance – 2.1% | | | | | | | | |
| Aon PLC | | | 138,024 | | | $ | 18,932,752 | |
| | | | | | | | |
| Internet – 7.6% | | | | | | | | |
| Alibaba Group Holding Ltd., ADR (a) | | | 46,837 | | | $ | 8,689,668 | |
| Alphabet, Inc., “A” (a) | | | 53,462 | | | | 60,368,756 | |
| | | | | | | | |
| | | | | | $ | 69,058,424 | |
| | | | | | | | |
| Leisure & Toys – 1.6% | | | | | | | | |
| Electronic Arts, Inc. (a) | | | 105,647 | | | $ | 14,898,340 | |
| | | | | | | | |
| Machinery & Tools – 2.2% | | | | | | | | |
| Colfax Corp. (a) | | | 148,778 | | | $ | 4,560,046 | |
| Nordson Corp. | | | 123,422 | | | | 15,848,619 | |
| | | | | | | | |
| | | | | | $ | 20,408,665 | |
| | | | | | | | |
| Medical & Health Technology & Services – 1.5% | | | | | |
| CVS Health Corp. | | | 119,566 | | | $ | 7,694,072 | |
| Express Scripts Holding Co. (a) | | | 81,035 | | | | 6,256,712 | |
| | | | | | | | |
| | | | | | $ | 13,950,784 | |
| | | | | | | | |
| Medical Equipment – 7.9% | | | | | | | | |
| Abbott Laboratories | | | 277,810 | | | $ | 16,943,632 | |
| Cooper Cos., Inc. | | | 26,580 | | | | 6,258,261 | |
| Danaher Corp. | | | 137,150 | | | | 13,533,962 | |
| Dentsply Sirona, Inc. | | | 42,143 | | | | 1,844,599 | |
| Thermo Fisher Scientific, Inc. | | | 115,206 | | | | 23,863,771 | |
| Waters Corp. (a) | | | 48,853 | | | | 9,457,452 | |
| | | | | | | | |
| | | | | | $ | 71,901,677 | |
| | | | | | | | |
| Oil Services – 0.7% | | | | | | | | |
| Schlumberger Ltd. | | | 98,067 | | | $ | 6,573,431 | |
| | | | | | | | |
4
MFS Massachusetts Investors Growth Stock Portfolio
Portfolio of Investments (unaudited) – continued
| | | | | | | | |
| Issuer | | Shares/Par | | | Value ($) | |
| COMMON STOCKS – continued | |
| Other Banks & Diversified Financials – 5.2% | |
| Mastercard, Inc., “A” | | | 101,776 | | | $ | 20,001,019 | |
| Visa, Inc., “A” | | | 210,999 | | | | 27,946,818 | |
| | | | | | | | |
| | | | | | $ | 47,947,837 | |
| | | | | | | | |
| Pharmaceuticals – 1.5% | | | | | | | | |
| Eli Lilly & Co. | | | 51,681 | | | $ | 4,409,940 | |
| Zoetis, Inc. | | | 113,731 | | | | 9,688,744 | |
| | | | | | | | |
| | | | | | $ | 14,098,684 | |
| | | | | | | | |
| Printing & Publishing – 1.7% | | | | | | | | |
| Moody’s Corp. | | | 89,962 | | | $ | 15,343,919 | |
| | | | | | | | |
| Railroad & Shipping – 1.7% | | | | | | | | |
| Union Pacific Corp. | | | 109,918 | | | $ | 15,573,182 | |
| | | | | | | | |
| Restaurants – 2.2% | | | | | | | | |
| Starbucks Corp. | | | 411,122 | | | $ | 20,083,310 | |
| | | | | | | | |
| Specialty Chemicals – 1.8% | | | | | | | | |
| Ecolab, Inc. | | | 118,475 | | | $ | 16,625,597 | |
| | | | | | | | |
| Specialty Stores – 2.7% | | | | | | | | |
| AutoZone, Inc. (a) | | | 8,590 | | | $ | 5,763,289 | |
| TJX Cos., Inc. | | | 198,601 | | | | 18,902,843 | |
| | | | | | | | |
| | | | | | $ | 24,666,132 | |
| | | | | | | | |
Total Common Stocks
(Identified Cost, $562,261,146) | | | | | | $ | 909,982,199 | |
| | | | | | | | |
| | | | | | | | |
| Issuer | | Shares/Par | | | Value ($) | |
| INVESTMENT COMPANIES (h) – 0.4% | | | | | |
| Money Market Funds – 0.4% | | | | | |
| MFS Institutional Money Market Portfolio, 1.9% (v) (Identified Cost, $3,990,015) | | | 3,990,421 | | | $ | 3,990,421 | |
| | | | | | | | |
OTHER ASSETS, LESS
LIABILITIES – 0.0% | | | | | | | 8,346 | |
| | | | | | | | |
| NET ASSETS – 100.0% | | | | | | $ | 913,980,966 | |
| | | | | | | | |
| (a) | | Non-income producing security. |
| (h) | | An affiliated issuer, which may be considered one in which the fund owns 5% or more of the outstanding voting securities, or a company which is under common control. At period end, the aggregate values of the fund’s investments in affiliated issuers and in unaffiliated issuers were $3,990,421 and $909,982,199, respectively. |
| (v) | | Affiliated issuer that is available only to investment companies managed by MFS. The rate quoted for the MFS Institutional Money Market Portfolio is the annualized seven-day yield of the fund at period end. |
The following abbreviations are used in this report and are defined:
| ADR | | American Depositary Receipt |
| PLC | | Public Limited Company |
See Notes to Financial Statements
5
MFS Massachusetts Investors Growth Stock Portfolio
FINANCIAL STATEMENTS | STATEMENT OF ASSETS AND LIABILITIES (unaudited)
This statement represents your fund’s balance sheet, which details the assets and liabilities comprising the total value of the fund.
| | | | |
At 6/30/18 | | | | |
Assets | | | | |
Investments in unaffiliated issuers, at value (identified cost, $562,261,146) | | | $909,982,199 | |
Investments in affiliated issuers, at value (identified cost, $3,990,015) | | | 3,990,421 | |
Receivables for | | | | |
Fund shares sold | | | 11,464 | |
Dividends | | | 952,326 | |
Other assets | | | 2,737 | |
Total assets | | | $914,939,147 | |
Liabilities | | | | |
Payables for | | | | |
Fund shares reacquired | | | $760,500 | |
Payable to affiliates | | | | |
Investment adviser | | | 56,368 | |
Shareholder servicing costs | | | 170 | |
Distribution and/or service fees | | | 7,335 | |
Payable for independent Trustees’ compensation | | | 100 | |
Accrued expenses and other liabilities | | | 133,708 | |
Total liabilities | | | $958,181 | |
Net assets | | | $913,980,966 | |
Net assets consist of | | | | |
Paid-in capital | | | $467,219,627 | |
Unrealized appreciation (depreciation) | | | 347,720,736 | |
Accumulated net realized gain (loss) | | | 90,894,681 | |
Undistributed net investment income | | | 8,145,922 | |
Net assets | | | $913,980,966 | |
Shares of beneficial interest outstanding | | | 46,790,961 | |
| | | | | | | | | | | | |
| | | Net assets | | | Shares
outstanding | | | Net asset value
per share | |
Initial Class | | | $554,379,886 | | | | 28,235,424 | | | | $19.63 | |
Service Class | | | 359,601,080 | | | | 18,555,537 | | | | 19.38 | |
See Notes to Financial Statements
6
MFS Massachusetts Investors Growth Stock Portfolio
FINANCIAL STATEMENTS | STATEMENT OF OPERATIONS (unaudited)
This statement describes how much your fund earned in investment income and accrued in expenses. It also describes any gains and/or losses
generated by fund operations.
| | | | |
Six months ended 6/30/18 | | | | |
Net investment income (loss) | | | | |
Income | | | | |
Dividends | | | $7,352,152 | |
Dividends from affiliated issuers | | | 50,154 | |
Other | | | 11,175 | |
Income on securities loaned | | | 6,876 | |
Foreign taxes withheld | | | (211,873 | ) |
Total investment income | | | $7,208,484 | |
Expenses | | | | |
Management fee | | | $3,467,242 | |
Distribution and/or service fees | | | 456,432 | |
Shareholder servicing costs | | | 16,144 | |
Administrative services fee | | | 74,242 | |
Independent Trustees’ compensation | | | 7,533 | |
Custodian fee | | | 26,474 | |
Shareholder communications | | | 39,210 | |
Audit and tax fees | | | 28,473 | |
Legal fees | | | 5,175 | |
Miscellaneous | | | 15,922 | |
Total expenses | | | $4,136,847 | |
Reduction of expenses by investment adviser | | | (42,614 | ) |
Net expenses | | | $4,094,233 | |
Net investment income (loss) | | | $3,114,251 | |
Realized and unrealized gain (loss) | | | | |
Realized gain (loss) (identified cost basis) | | | | |
Unaffiliated issuers | | | $39,567,070 | |
Affiliated issuers | | | 1,128 | |
Foreign currency | | | (15,727 | ) |
Net realized gain (loss) | | | $39,552,471 | |
Change in unrealized appreciation or depreciation | | | | |
Unaffiliated issuers | | | $7,499,135 | |
Affiliated issuers | | | 406 | |
Translation of assets and liabilities in foreign currencies | | | (6,363 | ) |
Net unrealized gain (loss) | | | $7,493,178 | |
Net realized and unrealized gain (loss) | | | $47,045,649 | |
Change in net assets from operations | | | $50,159,900 | |
See Notes to Financial Statements
7
MFS Massachusetts Investors Growth Stock Portfolio
FINANCIAL STATEMENTS | STATEMENTS OF CHANGES IN NET ASSETS
These statements describe the increases and/or decreases in net assets resulting from operations, any distributions, and any shareholder transactions.
| | | | | | | | |
| | | Six months ended
6/30/18 | | | Year ended
12/31/17 | |
| | | (unaudited) | | | | |
Change in net assets | | | | | | | | |
From operations | | | | | | | | |
Net investment income (loss) | | | $3,114,251 | | | | $5,035,640 | |
Net realized gain (loss) | | | 39,552,471 | | | | 52,197,235 | |
Net unrealized gain (loss) | | | 7,493,178 | | | | 163,752,913 | |
Change in net assets from operations | | | $50,159,900 | | | | $220,985,788 | |
Distributions declared to shareholders | | | | | | | | |
From net investment income | | | $— | | | | $(4,930,035 | ) |
From net realized gain | | | — | | | | (45,956,397 | ) |
Total distributions declared to shareholders | | | $— | | | | $(50,886,432 | ) |
Change in net assets from fund share transactions | | | $(68,600,261 | ) | | | $(67,274,706 | ) |
Total change in net assets | | | $(18,440,361 | ) | | | $102,824,650 | |
Net assets | | | | | | | | |
At beginning of period | | | 932,421,327 | | | | 829,596,677 | |
At end of period (including undistributed net investment income of $8,145,922 and
$5,031,671, respectively) | | | $913,980,966 | | | | $932,421,327 | |
See Notes to Financial Statements
8
MFS Massachusetts Investors Growth Stock Portfolio
FINANCIAL STATEMENTS | FINANCIAL HIGHLIGHTS
The financial highlights table is intended to help you understand the fund’s financial performance for the semiannual period and the past 5 fiscal years. Certain information reflects financial results for a single fund share. The total returns in the table represent the rate that an investor would have earned (or lost) on an investment in the fund share class (assuming reinvestment of all distributions) held for the entire period.
| | | | | | | | | | | | | | | | | | | | | | | | |
| Initial Class | | Six months
ended 6/30/18 | | | Year ended | |
| | | 12/31/17 | | | 12/31/16 | | | 12/31/15 | | | 12/31/14 | | | 12/31/13 | |
| | | (unaudited) | | | | | | | | | | | | | | | | |
Net asset value, beginning of period | | | $18.60 | | | | $15.38 | | | | $16.38 | | | | $17.61 | | | | $17.31 | | | | $13.37 | |
| Income (loss) from investment operations | | | | | | | | | | | | | | | | | | | | | | | | |
Net investment income (loss) (d) | | | $0.07 | | | | $0.11 | | | | $0.11 | (c) | | | $0.10 | | | | $0.14 | | | | $0.08 | |
Net realized and unrealized gain (loss) | | | 0.96 | | | | 4.16 | | | | 0.95 | | | | (0.21 | ) | | | 1.77 | | | | 3.97 | |
Total from investment operations | | | $1.03 | | | | $4.27 | | | | $1.06 | | | | $(0.11 | ) | | | $1.91 | | | | $4.05 | |
| Less distributions declared to shareholders | | | | | | | | | | | | | | | | | | | | | | | | |
From net investment income | | | $— | | | | $(0.12 | ) | | | $(0.10 | ) | | | $(0.09 | ) | | | $(0.10 | ) | | | $(0.11 | ) |
From net realized gain | | | — | | | | (0.93 | ) | | | (1.96 | ) | | | (1.03 | ) | | | (1.51 | ) | | | — | |
Total distributions declared to shareholders | | | $— | | | | $(1.05 | ) | | | $(2.06 | ) | | | $(1.12 | ) | | | $(1.61 | ) | | | $(0.11 | ) |
Net asset value, end of period (x) | | | $19.63 | | | | $18.60 | | | | $15.38 | | | | $16.38 | | | | $17.61 | | | | $17.31 | |
Total return (%) (k)(r)(s)(x) | | | 5.54 | (n) | | | 28.42 | | | | 6.08 | (c) | | | (0.12 | ) | | | 11.51 | | | | 30.39 | |
Ratios (%) (to average net assets)
and Supplemental data: | | | | | | | | | | | | | | | | | | | | | | | | |
Expenses before expense reductions (f) | | | 0.80 | (a) | | | 0.81 | | | | 0.78 | (c) | | | 0.79 | | | | 0.80 | | | | 0.80 | |
Expenses after expense reductions (f) | | | 0.79 | (a) | | | 0.80 | | | | 0.77 | (c) | | | 0.79 | | | | 0.80 | | | | 0.80 | |
Net investment income (loss) | | | 0.77 | (a) | | | 0.66 | | | | 0.70 | (c) | | | 0.56 | | | | 0.81 | | | | 0.55 | |
Portfolio turnover | | | 10 | (n) | | | 21 | | | | 24 | | | | 27 | | | | 23 | | | | 26 | |
Net assets at end of period (000 omitted) | | | $554,380 | | | | $562,471 | | | | $500,924 | | | | $537,645 | | | | $542,830 | | | | $561,066 | |
| | |
| Service Class | | Six months
ended 6/30/18 | | | Year ended | |
| | | 12/31/17 | | | 12/31/16 | | | 12/31/15 | | | 12/31/14 | | | 12/31/13 | |
| | | (unaudited) | | | | | | | | | | | | | | | | |
Net asset value, beginning of period | | | $18.38 | | | | $15.21 | | | | $16.22 | | | | $17.48 | | | | $17.19 | | | | $13.27 | |
| Income (loss) from investment operations | | | | | | | | | | | | | | | | | | | | | | | | |
Net investment income (loss) (d) | | | $0.05 | | | | $0.07 | | | | $0.07 | (c) | | | $0.06 | | | | $0.10 | | | | $0.05 | |
Net realized and unrealized gain (loss) | | | 0.95 | | | | 4.10 | | | | 0.94 | | | | (0.21 | ) | | | 1.75 | | | | 3.94 | |
Total from investment operations | | | $1.00 | | | | $4.17 | | | | $1.01 | | | | $(0.15 | ) | | | $1.85 | | | | $3.99 | |
| Less distributions declared to shareholders | | | | | | | | | | | | | | | | | | | | | | | | |
From net investment income | | | $— | | | | $(0.07 | ) | | | $(0.06 | ) | | | $(0.08 | ) | | | $(0.05 | ) | | | $(0.07 | ) |
From net realized gain | | | — | | | | (0.93 | ) | | | (1.96 | ) | | | (1.03 | ) | | | (1.51 | ) | | | — | |
Total distributions declared to shareholders | | | $— | | | | $(1.00 | ) | | | $(2.02 | ) | | | $(1.11 | ) | | | $(1.56 | ) | | | $(0.07 | ) |
Net asset value, end of period (x) | | | $19.38 | | | | $18.38 | | | | $15.21 | | | | $16.22 | | | | $17.48 | | | | $17.19 | |
Total return (%) (k)(r)(s)(x) | | | 5.44 | (n) | | | 28.10 | | | | 5.84 | (c) | | | (0.33 | ) | | | 11.23 | | | | 30.13 | |
Ratios (%) (to average net assets)
and Supplemental data: | | | | | | | | | | | | | | | | | | | | | | | | |
Expenses before expense reductions (f) | | | 1.05 | (a) | | | 1.06 | | | | 1.03 | (c) | | | 1.04 | | | | 1.05 | | | | 1.05 | |
Expenses after expense reductions (f) | | | 1.04 | (a) | | | 1.05 | | | | 1.02 | (c) | | | 1.03 | | | | 1.05 | | | | 1.05 | |
Net investment income (loss) | | | 0.52 | (a) | | | 0.41 | | | | 0.45 | (c) | | | 0.35 | | | | 0.55 | | | | 0.30 | |
Portfolio turnover | | | 10 | (n) | | | 21 | | | | 24 | | | | 27 | | | | 23 | | | | 26 | |
Net assets at end of period (000 omitted) | | | $359,601 | | | | $369,950 | | | | $328,673 | | | | $337,742 | | | | $50,731 | | | | $56,699 | |
See Notes to Financial Statements
9
MFS Massachusetts Investors Growth Stock Portfolio
Financial Highlights – continued
| (c) | Amount reflects a one-time reimbursement of expenses by the custodian (or former custodian) without which net investment income and performance would be lower and expenses would be higher. |
| (d) | Per share data is based on average shares outstanding. |
| (f) | Ratios do not reflect reductions from fees paid indirectly, if applicable. |
| (k) | The total return does not reflect expenses that apply to separate accounts. Inclusion of these charges would reduce the total return figures for all periods shown. |
| (r) | Certain expenses have been reduced without which performance would have been lower. |
| (s) | From time to time the fund may receive proceeds from litigation settlements, without which performance would be lower. |
| (x) | The net asset values and total returns have been calculated on net assets which include adjustments made in accordance with U.S. generally accepted accounting principles required at period end for financial reporting purposes. |
See Notes to Financial Statements
10
MFS Massachusetts Investors Growth Stock Portfolio
NOTES TO FINANCIAL STATEMENTS (unaudited)
| (1) | | Business and Organization |
MFS Massachusetts Investors Growth Stock Portfolio (the fund) is a diversified series of MFS Variable Insurance Trust II (the trust). The trust is organized as a Massachusetts business trust and is registered under the Investment Company Act of 1940, as amended, as an open-end management investment company. The shareholders of each series of the trust are separate accounts of insurance companies, which offer variable annuity and/or life insurance products, and qualified retirement and pension plans.
The fund is an investment company and accordingly follows the investment company accounting and reporting guidance of the Financial Accounting Standards Board (FASB) Accounting Standards Codification Topic 946 Financial Services – Investment Companies.
| (2) | | Significant Accounting Policies |
General – The preparation of financial statements in conformity with U.S. generally accepted accounting principles requires management to make estimates and assumptions that affect the reported amounts of assets and liabilities, and disclosure of contingent assets and liabilities at the date of the financial statements and the reported amounts of increases and decreases in net assets from operations during the reporting period. Actual results could differ from those estimates. In the preparation of these financial statements, management has evaluated subsequent events occurring after the date of the fund’s Statement of Assets and Liabilities through the date that the financial statements were issued.
Balance Sheet Offsetting – The fund’s accounting policy with respect to balance sheet offsetting is that, absent an event of default by the counterparty or a termination of the agreement, the International Swaps and Derivatives Association (ISDA) Master Agreement, or similar agreement, does not result in an offset of reported amounts of financial assets and financial liabilities in the Statement of Assets and Liabilities across transactions between the fund and the applicable counterparty. The fund’s right to setoff may be restricted or prohibited by the bankruptcy or insolvency laws of the particular jurisdiction to which a specific master netting agreement counterparty is subject. Balance sheet offsetting disclosures, to the extent applicable to the fund, have been included in the fund’s Significant Accounting Policies note under the captions for each of the fund’s in-scope financial instruments and transactions.
Investment Valuations – Equity securities, including restricted equity securities, are generally valued at the last sale or official closing price on their primary market or exchange as provided by a third-party pricing service. Equity securities, for which there were no sales reported that day, are generally valued at the last quoted daily bid quotation on their primary market or exchange as provided by a third-party pricing service. Short-term instruments with a maturity at issuance of 60 days or less may be valued at amortized cost, which approximates market value. Open-end investment companies are generally valued at net asset value per share. Securities and other assets generally valued on the basis of information from a third-party pricing service may also be valued at a broker/dealer bid quotation. In determining values, third-party pricing services can utilize both transaction data and market information such as yield, quality, coupon rate, maturity, type of issue, trading characteristics, and other market data. The values of foreign securities and other assets and liabilities expressed in foreign currencies are converted to U.S. dollars using the mean of bid and asked prices for rates provided by a third-party pricing service.
The Board of Trustees has delegated primary responsibility for determining or causing to be determined the value of the fund’s investments (including any fair valuation) to the adviser pursuant to valuation policies and procedures approved by the Board. If the adviser determines that reliable market quotations are not readily available, investments are valued at fair value as determined in good faith by the adviser in accordance with such procedures under the oversight of the Board of Trustees. Under the fund’s valuation policies and procedures, market quotations are not considered to be readily available for most types of debt instruments and floating rate loans and many types of derivatives. These investments are generally valued at fair value based on information from third-party pricing services. In addition, investments may be valued at fair value if the adviser determines that an investment’s value has been materially affected by events occurring after the close of the exchange or market on which the investment is principally traded (such as foreign exchange or market) and prior to the determination of the fund’s net asset value, or after the halting of trading of a specific security where trading does not resume prior to the close of the exchange or market on which the security is principally traded. Events that occur on a frequent basis after foreign markets close (such as developments in foreign markets and significant movements in the U.S. markets) and prior to the determination of the fund’s net asset value may be deemed to have a material effect on the value of securities traded in foreign markets. Accordingly, the fund’s foreign equity securities may often be valued at fair value. The adviser generally relies on third-party pricing services or other information (such as the correlation with price movements of similar securities in the same or other markets; the type, cost and investment characteristics of the security; the business and financial condition of the issuer; and trading and other market data) to assist in determining whether to fair value and at what value to fair value an investment. The value of an investment for purposes of calculating the fund’s net asset value can differ depending on the source and method used to determine value. When fair valuation is used, the value of an investment used to determine the fund’s net asset value may differ from quoted or published prices for the same investment. There can be no assurance that the fund could obtain the fair value assigned to an investment if it were to sell the investment at the same time at which the fund determines its net asset value per share.
11
MFS Massachusetts Investors Growth Stock Portfolio
Notes to Financial Statements (unaudited) – continued
Various inputs are used in determining the value of the fund’s assets or liabilities. These inputs are categorized into three broad levels. In certain cases, the inputs used to measure fair value may fall into different levels of the fair value hierarchy. In such cases, an investment’s level within the fair value hierarchy is based on the lowest level of input that is significant to the fair value measurement. The fund’s assessment of the significance of a particular input to the fair value measurement in its entirety requires judgment, and considers factors specific to the investment. Level 1 includes unadjusted quoted prices in active markets for identical assets or liabilities. Level 2 includes other significant observable market-based inputs (including quoted prices for similar securities, interest rates, prepayment speed, and credit risk). Level 3 includes unobservable inputs, which may include the adviser’s own assumptions in determining the fair value of investments. The following is a summary of the levels used as of June 30, 2018 in valuing the fund’s assets or liabilities:
| | | | | | | | | | | | | | | | |
| Financial Instruments | | Level 1 | | | Level 2 | | | Level 3 | | | Total | |
| Equity Securities: | | | | | | | | | | | | | | | | |
United States | | | $824,729,509 | | | | $— | | | | $— | | | | $824,729,509 | |
France | | | — | | | | 29,373,765 | | | | — | | | | 29,373,765 | |
United Kingdom | | | 24,804,462 | | | | — | | | | — | | | | 24,804,462 | |
Taiwan | | | 13,235,744 | | | | — | | | | — | | | | 13,235,744 | |
Ireland | | | 9,149,050 | | | | — | | | | — | | | | 9,149,050 | |
China | | | 8,689,669 | | | | — | | | | — | | | | 8,689,669 | |
| Mutual Funds | | | 3,990,421 | | | | — | | | | — | | | | 3,990,421 | |
| Total | | | $884,598,855 | | | | $29,373,765 | | | | $— | | | | $913,972,620 | |
For further information regarding security characteristics, see the Portfolio of Investments.
Of the level 2 investments presented above, equity investments amounting to $29,373,765 would have been considered level 1 investments at the beginning of the period. The primary reason for changes in the classifications between levels 1 and 2 occurs when foreign equity securities are fair valued using other observable market-based inputs in place of the closing exchange price due to events occurring after the close of the exchange or market on which the investment is principally traded. The fund’s foreign equity securities may often be valued using other observable market-based inputs. The fund’s policy is to recognize transfers between the levels as of the end of the period.
Foreign Currency Translation – Purchases and sales of foreign investments, income, and expenses are converted into U.S. dollars based upon currency exchange rates prevailing on the respective dates of such transactions or on the reporting date for foreign denominated receivables and payables. Gains and losses attributable to foreign currency exchange rates on sales of securities are recorded for financial statement purposes as net realized gains and losses on investments. Gains and losses attributable to foreign exchange rate movements on receivables, payables, income and expenses are recorded for financial statement purposes as foreign currency transaction gains and losses. That portion of both realized and unrealized gains and losses on investments that results from fluctuations in foreign currency exchange rates is not separately disclosed.
Security Loans – Under its Securities Lending Agency Agreement with the fund, State Street Bank and Trust Company (“State Street”), as lending agent, loans the securities of the fund to certain qualified institutions (the “Borrowers”) approved by the fund. Security loans can be terminated at the discretion of either the lending agent or the fund and the related securities must be returned within the earlier of the standard trade settlement period for such securities or within three business days. The loans are collateralized by cash and/or U.S. Treasury and federal agency obligations in an amount typically at least equal to the market value of the securities loaned. On loans collateralized by cash, the cash collateral is invested in a money market fund. The market value of the loaned securities is determined at the close of business of the fund and any additional required collateral is delivered to the fund on the next business day. State Street provides the fund with indemnification against Borrower default. In the event of Borrower default, State Street will, for the benefit of the fund, either purchase securities identical to those loaned or, when such purchase is commercially impracticable, pay the fund the market value of the loaned securities. In return, State Street assumes the fund’s rights to the related collateral. If the collateral value is less than the cost to purchase identical securities, State Street is responsible for the shortfall, but only to the extent that such shortfall is not due to a decline in collateral value resulting from collateral reinvestment for which the fund bears the risk of loss. A portion of the income generated upon investment of the collateral is remitted to the Borrowers, and the remainder is allocated between the fund and the lending agent. On loans collateralized by U.S. Treasury and/or federal agency obligations, a fee is received from the Borrower, and is allocated between the fund and the lending agent. Income from securities lending is separately reported in the Statement of Operations. The dividend and interest income earned on the securities loaned is accounted for in the same manner as other dividend and interest income. At June 30, 2018, there were no securities on loan or collateral outstanding.
Indemnifications – Under the fund’s organizational documents, its officers and Trustees may be indemnified against certain liabilities and expenses arising out of the performance of their duties to the fund. Additionally, in the normal course of business, the fund enters into agreements with service providers that may contain indemnification clauses. The fund’s maximum exposure under these agreements is unknown as this would involve future claims that may be made against the fund that have not yet occurred.
12
MFS Massachusetts Investors Growth Stock Portfolio
Notes to Financial Statements (unaudited) – continued
Investment Transactions and Income – Investment transactions are recorded on the trade date. Interest income is recorded on the accrual basis. Dividends received in cash are recorded on the ex-dividend date. Certain dividends from foreign securities will be recorded when the fund is informed of the dividend if such information is obtained subsequent to the ex-dividend date. Dividend payments received in additional securities are recorded on the ex-dividend date in an amount equal to the value of the security on such date.
The fund may receive proceeds from litigation settlements. Any proceeds received from litigation involving portfolio holdings are reflected in the Statement of Operations in realized gain/loss if the security has been disposed of by the fund or in unrealized gain/loss if the security is still held by the fund. Any other proceeds from litigation not related to portfolio holdings are reflected as other income in the Statement of Operations.
Tax Matters and Distributions – The fund intends to qualify as a regulated investment company, as defined under Subchapter M of the Internal Revenue Code, and to distribute all of its taxable income, including realized capital gains. As a result, no provision for federal income tax is required. The fund’s federal tax returns, when filed, will remain subject to examination by the Internal Revenue Service for a three year period. Management has analyzed the fund’s tax positions taken on federal and state tax returns for all open tax years and does not believe that there are any uncertain tax positions that require recognition of a tax liability. Foreign taxes, if any, have been accrued by the fund in the accompanying financial statements in accordance with the applicable foreign tax law. Foreign income taxes may be withheld by certain countries in which the fund invests. Additionally, capital gains realized by the fund on securities issued in or by certain foreign countries may be subject to capital gains tax imposed by those countries.
Distributions to shareholders are recorded on the ex-dividend date. Income and capital gain distributions are determined in accordance with income tax regulations, which may differ from U.S. generally accepted accounting principles. Certain capital accounts in the financial statements are periodically adjusted for permanent differences in order to reflect their tax character. These adjustments have no impact on net assets or net asset value per share. Temporary differences which arise from recognizing certain items of income, expense, gain or loss in different periods for financial statement and tax purposes will reverse at some time in the future. Distributions in excess of net investment income or net realized gains are temporary overdistributions for financial statement purposes resulting from differences in the recognition or classification of income or distributions for financial statement and tax purposes.
Book/tax differences primarily relate to wash sale loss deferrals.
The tax character of distributions declared to shareholders for the last fiscal year is as follows:
| | | | |
| | | Year ended | |
| | | 12/31/17 | |
| Ordinary income (including any short-term capital gains) | | | $7,501,279 | |
| Long-term capital gains | | | 43,385,153 | |
| Total distributions | | | $50,886,432 | |
The federal tax cost and the tax basis components of distributable earnings were as follows:
| | | | |
| As of 6/30/18 | | | | |
| Cost of investments | | | $567,516,420 | |
| Gross appreciation | | | 362,998,649 | |
| Gross depreciation | | | (16,542,449 | ) |
| Net unrealized appreciation (depreciation) | | | $346,456,200 | |
| |
| As of 12/31/17 | | | | |
| Undistributed ordinary income | | | 10,248,910 | |
| Undistributed long-term capital gain | | | 47,390,230 | |
| Other temporary differences | | | 5,640 | |
| Net unrealized appreciation (depreciation) | | | 338,956,659 | |
The aggregate cost above includes prior fiscal year end tax adjustments, if applicable.
Multiple Classes of Shares of Beneficial Interest – The fund offers multiple classes of shares, which differ in their respective distribution and/or service fees. The fund’s income, realized and unrealized gain (loss), and common expenses are allocated to
13
MFS Massachusetts Investors Growth Stock Portfolio
Notes to Financial Statements (unaudited) – continued
shareholders based on the daily net assets of each class. Dividends are declared separately for each class. Differences in per share dividend rates are generally due to differences in separate class expenses. The fund’s distributions declared to shareholders as reported in the Statements of Changes in Net Assets are presented by class as follows:
| | | | | | | | | | | | | | | | |
| | | From net investment
income | | | From net realized
gain | |
| | | Six months ended
6/30/18 | | | Year ended
12/31/17 | | | Six months ended
6/30/18 | | | Year ended
12/31/17 | |
| Initial Class | | | $— | | | | $3,459,849 | | | | $— | | | | $27,586,603 | |
| Service Class | | | — | | | | 1,470,186 | | | | — | | | | 18,369,794 | |
| Total | | | $— | | | | $4,930,035 | | | | $— | | | | $45,956,397 | |
| (3) | | Transactions with Affiliates |
Investment Adviser – The fund has an investment advisory agreement with MFS to provide overall investment management and related administrative services and facilities to the fund. The management fee is computed daily and paid monthly at the following annual rates based on the fund’s average daily net assets:
| | | | |
| Up to $1 billion | | | 0.75% | |
| In excess of $1 billion | | | 0.65% | |
MFS has agreed in writing to reduce its management fee by a specified amount if certain MFS mutual fund assets exceed thresholds agreed to by MFS and the fund’s Board of Trustees. For the six months ended June 30, 2018, this management fee reduction amounted to $42,614, which is included in the reduction of total expenses in the Statement of Operations. The management fee incurred for the six months ended June 30, 2018 was equivalent to an annual effective rate of 0.74% of the fund’s average daily net assets.
The investment adviser has agreed in writing to pay a portion of the fund’s total annual operating expenses, excluding interest, taxes, extraordinary expenses, brokerage and transaction costs, and investment-related expenses, such that total annual operating expenses do not exceed 0.82% of average daily net assets for the Initial Class shares and 1.07% of average daily net assets for the Service Class shares. This written agreement will continue until modified by the fund’s Board of Trustees, but such agreement will continue at least until April 30, 2020. For the six months ended June 30, 2018, the fund’s actual operating expenses did not exceed the limit and therefore, the investment adviser did not pay any portion of the fund’s expenses related to this agreement.
Distributor – MFS Fund Distributors, Inc. (MFD), a wholly-owned subsidiary of MFS, is the distributor of shares of the fund. The Trustees have adopted a distribution plan for the Service Class shares pursuant to Rule 12b-1 under the Investment Company Act of 1940.
The fund’s distribution plan provides that the fund will pay MFD distribution and/or service fees equal to 0.25% per annum of its average daily net assets attributable to Service Class shares as partial consideration for services performed and expenses incurred by MFD and financial intermediaries (including participating insurance companies that invest in the fund to fund variable annuity and variable life insurance contracts, sponsors of qualified retirement and pension plans that invest in the fund, and affiliates of these participating insurance companies and plan sponsors) in connection with the sale and distribution of the Service Class shares. MFD may subsequently pay all, or a portion, of the distribution and/or service fees to financial intermediaries.
Shareholder Servicing Agent – MFS Service Center, Inc. (MFSC), a wholly-owned subsidiary of MFS, receives a fee from the fund for its services as shareholder servicing agent. For the six months ended June 30, 2018, the fee was $15,862, which equated to 0.0034% annually of the fund’s average daily net assets. MFSC also receives payment from the fund for out-of-pocket expenses paid by MFSC on behalf of the fund. For the six months ended June 30, 2018, these costs amounted to $282.
Administrator – MFS provides certain financial, legal, shareholder communications, compliance, and other administrative services to the fund. Under an administrative services agreement, the fund reimburses MFS the costs incurred to provide these services. The fund is charged an annual fixed amount of $17,500 plus a fee based on average daily net assets. The administrative services fee incurred for the six months ended June 30, 2018 was equivalent to an annual effective rate of 0.0160% of the fund’s average daily net assets.
Trustees’ and Officers’ Compensation – The fund pays compensation to independent Trustees in the form of a retainer, attendance fees, and additional compensation to Board and Committee chairpersons. The fund does not pay compensation directly to Trustees or officers of the fund who are also officers of the investment adviser, all of whom receive remuneration for their services to the fund from MFS. Certain officers and Trustees of the fund are officers or directors of MFS, MFD, and MFSC.
Other – This fund and certain other funds managed by MFS (the funds) have entered into a service agreement (the ISO Agreement) which provides for payment of fees solely by the funds to Tarantino LLC in return for the provision of services of an Independent Senior Officer (ISO) for the funds. Frank L. Tarantino serves as the ISO and is an officer of the funds and the sole member of
14
MFS Massachusetts Investors Growth Stock Portfolio
Notes to Financial Statements (unaudited) – continued
Tarantino LLC. The funds can terminate the ISO Agreement with Tarantino LLC at any time under the terms of the ISO Agreement. For the six months ended June 30, 2018, the fee paid by the fund under this agreement was $760 and is included in “Miscellaneous” expense in the Statement of Operations. MFS has agreed to bear all expenses associated with office space, other administrative support, and supplies provided to the ISO.
The fund invests in the MFS Institutional Money Market Portfolio which is managed by MFS and seeks current income consistent with preservation of capital and liquidity. This money market fund does not pay a management fee to MFS.
The fund is permitted to engage in purchase and sale transactions with funds and accounts for which MFS serves as investment adviser or sub-adviser (“cross-trades”) pursuant to a policy adopted by the Board of Trustees. This policy has been designed to ensure that cross-trades conducted by the fund comply with Rule 17a-7 under the Investment Company Act of 1940. During the six months ended June 30, 2018, the fund engaged in sale transactions pursuant to this policy, which amounted to $69,744. The sales transactions resulted in net realized gains (losses) of $51,868.
Effective January 2, 2018, the adviser has voluntarily undertaken to reimburse the fund from its own resources on a quarterly basis for the cost of investment research embedded in the cost of the fund’s securities trades. This agreement may be rescinded at any time. For the period January 2, 2018 to June 30, 2018, this reimbursement amounted to $11,029, which is included in “Other” income in the Statement of Operations. This reimbursement, if any, will be determined in arrears on a quarterly basis beginning with the quarter ending March 31, 2018.
For the six months ended June 30, 2018, purchases and sales of investments, other than short-term obligations, aggregated $93,152,373 and $155,733,359, respectively.
| (5) | | Shares of Beneficial Interest |
The fund’s Declaration of Trust permits the Trustees to issue an unlimited number of full and fractional shares of beneficial interest. Transactions in fund shares were as follows:
| | | | | | | | | | | | | | | | |
| | | Six months ended 6/30/18 | | | Year ended 12/31/17 | |
| | | Shares | | | Amount | | | Shares | | | Amount | |
| Shares sold | | | | | | | | | | | | | | | | |
Initial Class | | | 229,884 | | | | $4,431,264 | | | | 318,747 | | | | $5,421,181 | |
Service Class | | | 372,133 | | | | 7,089,453 | | | | 798,916 | | | | 13,593,897 | |
| | | 602,017 | | | | $11,520,717 | | | | 1,117,663 | | | | $19,015,078 | |
| Shares issued to shareholders in reinvestment of distributions | | | | | | | | | | | | | | | | |
Initial Class | | | — | | | | $— | | | | 1,841,427 | | | | $31,046,452 | |
Service Class | | | — | | | | — | | | | 1,189,447 | | | | 19,839,980 | |
| | | — | | | | $— | | | | 3,030,874 | | | | $50,886,432 | |
| Shares reacquired | | | | | | | | | | | | | | | | |
Initial Class | | | (2,235,111 | ) | | | $(43,057,063 | ) | | | (4,487,162 | ) | | | $(77,760,647 | ) |
Service Class | | | (1,942,814 | ) | | | (37,063,915 | ) | | | (3,468,379 | ) | | | (59,415,569 | ) |
| | | (4,177,925 | ) | | | $(80,120,978 | ) | | | (7,955,541 | ) | | | $(137,176,216 | ) |
| Net change | | | | | | | | | | | | | | | | |
Initial Class | | | (2,005,227 | ) | | | $(38,625,799 | ) | | | (2,326,988 | ) | | | $(41,293,014 | ) |
Service Class | | | (1,570,681 | ) | | | (29,974,462 | ) | | | (1,480,016 | ) | | | (25,981,692 | ) |
| | | (3,575,908 | ) | | | $(68,600,261 | ) | | | (3,807,004 | ) | | | $(67,274,706 | ) |
The fund and certain other funds managed by MFS participate in a $1.25 billion unsecured committed line of credit, subject to a $1 billion sublimit, provided by a syndication of banks under a credit agreement. Borrowings may be made for temporary financing needs. Interest is charged to each fund, based on its borrowings, generally at a rate equal to the higher of the Overnight Bank Funding rate or daily one month LIBOR plus an agreed upon spread. A commitment fee, based on the average daily, unused portion of the committed line of credit, is allocated among the participating funds. In addition, the fund and other funds managed by MFS have established unsecured uncommitted borrowing arrangements with certain banks for temporary financing needs. Interest is charged to each fund, based on its borrowings, at a rate equal to the Overnight Bank Funding rate plus an agreed upon spread. For the six months ended June 30, 2018, the fund’s commitment fee and interest expense were $2,963 and $0, respectively, and are included in “Miscellaneous” expense in the Statement of Operations.
15
MFS Massachusetts Investors Growth Stock Portfolio
Notes to Financial Statements (unaudited) – continued
| (7) | | Investments in Affiliated Issuers |
An affiliated issuer may be considered one in which the fund owns 5% or more of the outstanding voting securities, or a company which is under common control. For the purposes of this report, the fund assumes the following to be affiliated issuers:
| | | | | | | | | | | | | | | | | | |
| Affiliated Issuers | | | | Beginning
Shares/Par
Amount | | | Acquisitions
Shares/Par
Amount | | | Dispositions
Shares/Par
Amount | | | Ending
Shares/Par
Amount | |
| MFS Institutional Money Market Portfolio | | | | | 7,006,794 | | | | 82,462,654 | | | | (85,479,027 | ) | | | 3,990,421 | |
| | | | | |
| Affiliated Issuers | | Realized
Gain (Loss) | | Change in
Unrealized
Appreciation/
Depreciation | | | Capital Gain
Distributions | | | Dividend
Income | | | Ending
Value | |
| MFS Institutional Money Market Portfolio | | $1,128 | | | $406 | | | | $— | | | | $50,154 | | | | $3,990,421 | |
16
MFS Massachusetts Investors Growth Stock Portfolio
PROXY VOTING POLICIES AND INFORMATION
MFS votes proxies on behalf of the fund pursuant to proxy voting policies and procedures that are available without charge, upon request, by calling 1-800-225-2606, by visiting mfs.com/proxyvoting, or by visiting the SEC’s Web site at http://www.sec.gov.
Information regarding how the fund voted proxies relating to portfolio securities during the most recent twelve-month period ended June 30 is available by August 31 of each year without charge by visiting mfs.com/proxyvoting, or by visiting the SEC’s Web site at http://www.sec.gov.
QUARTERLY PORTFOLIO DISCLOSURE
The fund will file a complete schedule of portfolio holdings with the Securities and Exchange Commission (the Commission) for the first and third quarters of each fiscal year on Form N-Q. The fund’s Form N-Q is available on the EDGAR database on the Commission’s Internet Web site at http://www.sec.gov, and may be reviewed and copied at the:
Public Reference Room
Securities and Exchange Commission
100 F Street, NE, Room 1580
Washington, D.C. 20549
Information on the operation of the Public Reference Room may be obtained by calling the Commission at 1-800-SEC-0330. Copies of the fund’s Form N-Q also may be obtained, upon payment of a duplicating fee, by electronic request at the following e-mail address: publicinfo@sec.gov or by writing the Public Reference Section at the above address.
FURTHER INFORMATION
From time to time, MFS may post important information about the fund or the MFS funds on the MFS web site (mfs.com). This information is available at https://www.mfs.com/en-us/what-we-do/announcements.html or at mfs.com/vit2 by choosing the fund’s name.
INFORMATION ABOUT FUND CONTRACTS AND LEGAL CLAIMS
The fund has entered into contractual arrangements with an investment adviser, administrator, distributor, shareholder servicing agent, 529 program manager (if applicable), and custodian who each provide services to the fund. Unless expressly stated otherwise, shareholders are not parties to, or intended beneficiaries of these contractual arrangements, and these contractual arrangements are not intended to create any shareholder right to enforce them against the service providers or to seek any remedy under them against the service providers, either directly or on behalf of the fund.
Under the Trust’s By-Laws and Declaration of Trust, any claims asserted against or on behalf of the MFS Funds, including claims against Trustees and Officers, must be brought in state and federal courts located within the Commonwealth of Massachusetts.
17
Semiannual Report
June 30, 2018

MFS® Research International Portfolio

MFS® Variable Insurance Trust II
RSS-SEM
MFS® Research International Portfolio
CONTENTS
The report is prepared for the general information of contract owners. It is authorized for distribution to prospective investors only when preceded or accompanied by a current prospectus.
NOT FDIC INSURED • MAY LOSE VALUE • NO BANK OR CREDIT UNION GUARANTEE • NOT A DEPOSIT • NOT INSURED BY ANY FEDERAL GOVERNMENT AGENCY OR NCUA/NCUSIF
MFS Research International Portfolio
LETTER FROM THE EXECUTIVE CHAIRMAN

Dear Contract Owners:
Rising bond yields, international trade friction and geopolitical uncertainty have contributed to a measurable uptick in market volatility — a departure from the low-volatility environment that prevailed for much of 2017. In recent months, against this more challenging backdrop, global markets have given back some of the strong gains recorded during 2017 and early 2018. But global economic growth remains healthy, notwithstanding signs of a modest slowdown over the past few months, particularly in Europe and China.
Although the U.S. Federal Reserve continues to gradually raise interest rates and shrink its balance sheet, monetary policy remains accommodative around the world, with many central banks taking only tentative steps toward tighter policies. Newly enacted U.S. tax reforms have been welcomed by equity markets, while emerging market economies have recently had to contend with tighter financial conditions as a result of firmer U.S. Treasury yields and a stronger dollar. Around the world, inflation remains largely subdued, but tight labor markets and solid global demand have investors on the lookout for its potential resurgence. Increased U.S. protectionism is also a growing concern, as investors fear that trade disputes could dampen business sentiment, leading to slower global growth.
As a global investment manager, MFS® strives to create long-term value for clients through an active approach and an investment platform built on nearly a century of expertise. To make that long-term value meaningful for clients, we work to align with you on our beliefs, your needs and the time it takes to deliver on your desired outcomes.
Respectfully,

Robert J. Manning
Executive Chairman
MFS Investment Management
August 16, 2018
The opinions expressed in this letter are subject to change and may not be relied upon for investment advice. No forecasts can be guaranteed.
1
MFS Research International Portfolio
PORTFOLIO COMPOSITION
Portfolio structure
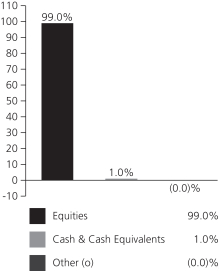
| | | | |
| Top ten holdings | | | | |
| Nestle S.A. | | | 2.6% | |
| Roche Holding AG | | | 2.2% | |
| Bayer AG | | | 2.1% | |
| Linde AG | | | 2.0% | |
| Schneider Electric S.A. | | | 2.0% | |
| UBS AG | | | 1.8% | |
| AIA Group Ltd. | | | 1.7% | |
| Novo Nordisk A.S., “B” | | | 1.7% | |
| Reckitt Benckiser Group PLC | | | 1.6% | |
| BP PLC | | | 1.6% | |
| | | | |
| Global equity sectors | | | | |
| Capital Goods | | | 23.6% | |
| Financial Services | | | 23.1% | |
| Technology | | | 10.5% | |
| Health Care | | | 9.9% | |
| Consumer Staples | | | 9.6% | |
| Energy | | | 9.5% | |
| Consumer Cyclicals | | | 8.9% | |
| Telecommunications/Cable Television | | | 3.9% | |
| |
| Issuer country weightings (x) | | | | |
| Japan | | | 18.3% | |
| United Kingdom | | | 12.8% | |
| Switzerland | | | 11.9% | |
| Germany | | | 9.7% | |
| France | | | 8.9% | |
| United States | | | 6.0% | |
| Australia | | | 3.4% | |
| Spain | | | 3.4% | |
| Hong Kong | | | 3.2% | |
| Other Countries | | | 22.4% | |
| |
| Currency exposure weightings (y) | | | | |
| Euro | | | 30.3% | |
| Japanese Yen | | | 18.3% | |
| British Pound Sterling | | | 13.3% | |
| Swiss Franc | | | 11.9% | |
| United States Dollar | | | 7.5% | |
| Hong Kong Dollar | | | 3.9% | |
| Australian Dollar | | | 3.4% | |
| Danish Krone | | | 2.2% | |
| Canadian Dollar | | | 2.1% | |
| Other Currencies | | | 7.1% | |
| (x) | Represents the portfolio’s exposure to issuer countries as a percentage of a portfolio’s net assets. For purposes of this presentation, United States includes Cash & Cash Equivalents and Other. |
| (y) | Represents the portfolio’s exposure to a particular currency as a percentage of a portfolio’s net assets. For purposes of this presentation, United States Dollar includes Cash & Cash Equivalents and Other. |
Cash & Cash Equivalents includes any cash, investments in money market funds, short-term securities, and other assets less liabilities. Please see the Statement of Assets and Liabilities for additional information related to the fund’s cash position and other assets and liabilities.
Other includes equivalent exposure from currency derivatives and/or any offsets to derivative positions and may be negative.
Percentages are based on net assets as of June 30, 2018.
The portfolio is actively managed and current holdings may be different.
2
MFS Research International Portfolio
EXPENSE TABLE
Fund Expenses Borne by the Contract Holders during the Period,
January 1, 2018 through June 30, 2018
As a contract holder of the fund, you incur ongoing costs, including management fees; distribution and/or service (12b-1) fees; and other fund expenses. This example is intended to help you understand your ongoing costs (in dollars) of investing in the fund and to compare these costs with the ongoing costs of investing in other mutual funds.
The example is based on an investment of $1,000 invested at the beginning of the period and held for the entire period January 1, 2018 through June 30, 2018.
Actual Expenses
The first line for each share class in the following table provides information about actual account values and actual expenses. You may use the information in this line, together with the amount you invested, to estimate the expenses that you paid over the period. Simply divide your account value by $1,000 (for example, an $8,600 account value divided by $1,000 = 8.6), then multiply the result by the number in the first line under the heading entitled “Expenses Paid During Period” to estimate the expenses you paid on your account during this period.
Hypothetical Example for Comparison Purposes
The second line for each share class in the following table provides information about hypothetical account values and hypothetical expenses based on the fund’s actual expense ratio and an assumed rate of return of 5% per year before expenses, which is not the fund’s actual return. The hypothetical account values and expenses may not be used to estimate the actual ending account balance or expenses you paid for the period. You may use this information to compare the ongoing costs of investing in the fund and other funds. To do so, compare this 5% hypothetical example with the 5% hypothetical examples that appear in the shareholder reports of the other funds.
Please note that the expenses shown in the table are meant to highlight the fund’s ongoing costs only and do not take into account the fees and expenses imposed under the variable contracts through which your investment in the fund is made. Therefore, the second line for each share class in the table is useful in comparing ongoing costs associated with an investment in vehicles (such as the fund) which fund benefits under variable annuity and variable life insurance contracts and to qualified pension and retirement plans only, and will not help you determine the relative total costs of investing in the fund through variable annuity and variable life insurance contracts. If the fees and expenses imposed under the variable contracts were included, your costs would have been higher.
| | | | | | | | | | | | | | | | | | |
| Share Class | | | | Annualized
Expense Ratio | | | Beginning
Account Value
1/01/18 | | | Ending
Account Value
6/30/18 | | | Expenses Paid
During Period (p)
1/01/18-6/30/18 | |
| Initial Class | | Actual | | | 0.97% | | | | $1,000.00 | | | | $983.58 | | | | $4.77 | |
| | Hypothetical (h) | | | 0.97% | | | | $1,000.00 | | | | $1,019.98 | | | | $4.86 | |
| Service Class | | Actual | | | 1.22% | | | | $1,000.00 | | | | $982.78 | | | | $6.00 | |
| | Hypothetical (h) | | | 1.22% | | | | $1,000.00 | | | | $1,018.74 | | | | $6.11 | |
| (h) | 5% class return per year before expenses. |
| (p) | “Expenses Paid During Period” are equal to each class’s annualized expense ratio, as shown above, multiplied by the average account value over the period, multiplied by 181/365 (to reflect the one-half year period). |
Notes to Expense Table
Changes to the fund’s fee arrangements will occur during the fund’s current fiscal year. Had these fee changes been in effect during the six month period, the annualized expense ratios, the actual expenses paid during the period, and the hypothetical expenses paid during the period would have been approximately 0.96%, $4.72, and $4.81 for Initial Class and 1.21%, $5.95, and $6.06 for Service Class, respectively. For further information about the fund’s fee arrangements and changes to those fee arrangements, please see Note 3 in the Notes to Financial Statements.
3
MFS Research International Portfolio
PORTFOLIO OF INVESTMENTS – 6/30/18 (unaudited)
The Portfolio of Investments is a complete list of all securities owned by your fund. It is categorized by broad-based asset classes.
| | | | | | | | |
| Issuer | | Shares/Par | | | Value ($) | |
| COMMON STOCKS – 99.0% | | | | | | | | |
| Airlines – 1.0% | | | | | |
| Aena S.A. | | | 13,160 | | | $ | 2,389,763 | |
| Malaysia Airports Holdings Berhad | | | 791,100 | | | | 1,723,401 | |
| | | | | | | | |
| | | | | | $ | 4,113,164 | |
| | | | | | | | |
| Alcoholic Beverages – 0.4% | | | | | | | | |
| AmBev S.A., ADR | | | 348,816 | | | $ | 1,615,018 | |
| | | | | | | | |
| Apparel Manufacturers – 1.4% | | | | | | | | |
| LVMH Moet Hennessy Louis Vuitton SE | | | 17,608 | | | $ | 5,853,230 | |
| | | | | | | | |
| Automotive – 2.2% | | | | | | | | |
| Koito Manufacturing Co. Ltd. | | | 69,800 | | | $ | 4,614,876 | |
| USS Co. Ltd. | | | 230,000 | | | | 4,379,172 | |
| | | | | | | | |
| | | | | | $ | 8,994,048 | |
| | | | | | | | |
| Broadcasting – 0.8% | | | | | | | | |
| WPP PLC | | | 218,529 | | | $ | 3,440,657 | |
| | | | | | | | |
| Brokerage & Asset Managers – 0.8% | | | | | |
| TMX Group Ltd. | | | 51,550 | | | $ | 3,379,286 | |
| | | | | | | | |
| Business Services – 2.4% | | | | | | | | |
| Cerved Information Solutions S.p.A. | | | 95,420 | | | $ | 1,022,639 | |
| Cognizant Technology Solutions Corp., “A” | | | 71,868 | | | | 5,676,853 | |
| Nomura Research Institute Ltd. | | | 62,500 | | | | 3,031,432 | |
| | | | | | | | |
| | | | | | $ | 9,730,924 | |
| | | | | | | | |
| Chemicals – 0.0% | | | | | | | | |
| Orica Ltd. | | | 192 | | | $ | 2,522 | |
| | | | | | | | |
| Computer Software – 0.6% | | | | | | | | |
| Check Point Software Technologies Ltd. (a) | | | 26,374 | | | $ | 2,576,212 | |
| | | | | | | | |
| Computer Software – Systems – 2.5% | | | | | |
| Amadeus IT Group S.A. | | | 58,013 | | | $ | 4,570,925 | |
| EPAM Systems, Inc. (a) | | | 28,892 | | | | 3,592,142 | |
| Hitachi Ltd. | | | 283,000 | | | | 1,997,858 | |
| | | | | | | | |
| | | | | | $ | 10,160,925 | |
| | | | | | | | |
| Conglomerates – 0.7% | | | | | | | | |
| Melrose Industries PLC | | | 1,065,453 | | | $ | 2,990,843 | |
| | | | | | | | |
| Construction – 2.0% | | | | | | | | |
| Techtronic Industries Co. Ltd. | | | 615,500 | | | $ | 3,432,258 | |
| Toto Ltd. | | | 99,400 | | | | 4,614,696 | |
| | | | | | | | |
| | | | | | $ | 8,046,954 | |
| | | | | | | | |
| Consumer Products – 2.9% | | | | | | | | |
| L’Oréal | | | 20,555 | | | $ | 5,071,451 | |
| Reckitt Benckiser Group PLC | | | 79,171 | | | | 6,518,880 | |
| | | | | | | | |
| | | | | | $ | 11,590,331 | |
| | | | | | | | |
| Consumer Services – 0.4% | | | | | | | | |
| Ctrip.com International Ltd., ADR (a) | | | 34,677 | | | $ | 1,651,665 | |
| | | | | | | | |
| Containers – 0.9% | | | | | | | | |
| Brambles Ltd. | | | 583,316 | | | $ | 3,833,345 | |
| | | | | | | | |
| | | | | | | | |
| Issuer | | Shares/Par | | | Value ($) | |
| COMMON STOCKS – continued | |
| Electrical Equipment – 2.8% | | | | | | | | |
| Legrand S.A. | | | 44,676 | | | $ | 3,272,253 | |
| Schneider Electric S.A. | | | 95,686 | | | | 7,959,026 | |
| | | | | | | | |
| | | | | | $ | 11,231,279 | |
| | | | | | | | |
| Electronics – 2.8% | | | | | | | | |
| Mellanox Technologies Ltd. (a) | | | 28,076 | | | $ | 2,366,807 | |
| NVIDIA Corp. | | | 7,805 | | | | 1,849,004 | |
| Samsung Electronics Co. Ltd. | | | 30,219 | | | | 1,264,887 | |
| Silicon Motion Technology Corp., ADR | | | 26,500 | | | | 1,401,585 | |
| Taiwan Semiconductor Manufacturing Co. Ltd. | | | 620,804 | | | | 4,408,353 | |
| | | | | | | | |
| | | | | | $ | 11,290,636 | |
| | | | | | | | |
| Energy – Independent – 2.0% | | | | | | | | |
| Cairn Energy PLC (a) | | | 743,531 | | | $ | 2,453,188 | |
| Caltex Australia Ltd. | | | 113,223 | | | | 2,726,549 | |
| Oil Search Ltd. | | | 439,140 | | | | 2,892,372 | |
| | | | | | | | |
| | | | | | $ | 8,072,109 | |
| | | | | | | | |
| Energy – Integrated – 3.3% | | | | | | | | |
| BP PLC | | | 846,458 | | | $ | 6,445,117 | |
| Eni S.p.A. | | | 206,533 | | | | 3,836,356 | |
| Galp Energia SGPS S.A., “B” | | | 156,109 | | | | 2,968,411 | |
| | | | | | | | |
| | | | | | $ | 13,249,884 | |
| | | | | | | | |
| Food & Beverages – 3.7% | | | | | | | | |
| Danone S.A. | | | 55,801 | | | $ | 4,090,594 | |
| Nestle S.A. | | | 138,574 | | | | 10,727,953 | |
| | | | | | | | |
| | | | | | $ | 14,818,547 | |
| | | | | | | | |
| Food & Drug Stores – 1.7% | | | | | | | | |
| Sundrug Co. Ltd. | | | 84,900 | | | $ | 3,443,084 | |
| Tesco PLC | | | 971,281 | | | | 3,290,505 | |
| | | | | | | | |
| | | | | | $ | 6,733,589 | |
| | | | | | | | |
| Gaming & Lodging – 0.5% | | | | | | | | |
| Paddy Power Betfair PLC | | | 19,385 | | | $ | 2,123,419 | |
| | | | | | | | |
| Insurance – 5.1% | | | | | | | | |
| AIA Group Ltd. | | | 785,600 | | | $ | 6,869,093 | |
| Aon PLC | | | 30,109 | | | | 4,130,051 | |
| Hiscox Ltd. | | | 173,689 | | | | 3,495,699 | |
| Swiss Re Ltd. | | | 26,276 | | | | 2,270,461 | |
| Zurich Insurance Group AG | | | 12,476 | | | | 3,700,748 | |
| | | | | | | | |
| | | | | | $ | 20,466,052 | |
| | | | | | | | |
| Internet – 1.6% | | | | | | | | |
| Alibaba Group Holding Ltd., ADR (a) | | | 4,710 | | | $ | 873,846 | |
| Baidu, Inc., ADR (a) | | | 4,116 | | | | 1,000,188 | |
| NAVER Corp. | | | 4,232 | | | | 2,897,278 | |
| Scout24 AG | | | 29,676 | | | | 1,574,752 | |
| | | | | | | | |
| | | | | | $ | 6,346,064 | |
| | | | | | | | |
| Machinery & Tools – 5.5% | | | | | | | | |
| Daikin Industries Ltd. | | | 49,600 | | | $ | 5,944,922 | |
| GEA Group AG | | | 92,977 | | | | 3,136,834 | |
4
MFS Research International Portfolio
Portfolio of Investments (unaudited) – continued
| | | | | | | | |
| Issuer | | Shares/Par | | | Value ($) | |
| COMMON STOCKS – continued | |
| Machinery & Tools – continued | | | | | |
| Hoshizaki Corp. | | | 22,300 | | | $ | 2,257,896 | |
| Kubota Corp. | | | 311,800 | | | | 4,908,706 | |
| Ritchie Bros. Auctioneers, Inc. | | | 60,831 | | | | 2,074,820 | |
| Schindler Holding AG | | | 18,606 | | | | 4,007,250 | |
| | | | | | | | |
| | | | | | $ | 22,330,428 | |
| | | | | | | | |
| Major Banks – 6.7% | | | | | |
| Barclays PLC | | | 1,727,745 | | | $ | 4,309,563 | |
| BNP Paribas | | | 95,233 | | | | 5,902,973 | |
| Erste Group Bank AG | | | 95,187 | | | | 3,973,948 | |
| Mitsubishi UFJ Financial Group, Inc. | | | 1,015,700 | | | | 5,789,715 | |
| UBS AG | | | 467,314 | | | | 7,189,660 | |
| | | | | | | | |
| | | | | | $ | 27,165,859 | |
| | | | | | | | |
| Medical & Health Technology & Services – 0.4% | |
| Sonic Healthcare Ltd. | | | 97,454 | | | $ | 1,769,124 | |
| | | | | | | | |
| Medical Equipment – 2.2% | | | | | |
| Essilor International S.A. | | | 26,677 | | | $ | 3,766,446 | |
| Terumo Corp. | | | 91,700 | | | | 5,259,405 | |
| | | | | | | | |
| | | | | | $ | 9,025,851 | |
| | | | | | | | |
| Metals & Mining – 1.3% | | | | | |
| Rio Tinto Ltd. | | | 92,762 | | | $ | 5,116,090 | |
| | | | | | | | |
| Natural Gas – Distribution – 0.7% | | | | | |
| China Resources Gas Group Ltd. | | | 640,000 | | | $ | 2,773,529 | |
| | | | | | | | |
| Natural Gas – Pipeline – 1.4% | | | | | |
| APA Group | | | 364,059 | | | $ | 2,653,806 | |
| Enbridge, Inc. | | | 80,765 | | | | 2,887,426 | |
| | | | | | | | |
| | | | | | $ | 5,541,232 | |
| | | | | | | | |
| Network & Telecom – 0.6% | | | | | |
| LM Ericsson Telephone Co., “B” | | | 319,959 | | | $ | 2,462,620 | |
| | | | | | | | |
| Other Banks & Diversified Financials – 7.7% | | | | | |
| Aeon Credit Service Co. Ltd. | | | 172,800 | | | $ | 3,689,646 | |
| AIB Group PLC | | | 558,100 | | | | 3,030,634 | |
| DnB NOR A.S.A. | | | 92,127 | | | | 1,796,990 | |
| HDFC Bank Ltd. | | | 123,237 | | | | 3,849,189 | |
| Intesa Sanpaolo S.p.A. | | | 1,500,752 | | | | 4,343,954 | |
| Julius Baer Group Ltd. | | | 89,316 | | | | 5,247,061 | |
| Jyske Bank A.S. | | | 37,948 | | | | 2,080,277 | |
| KBC Groep N.V. | | | 58,821 | | | | 4,534,198 | |
| Mastercard, Inc., “A” | | | 13,619 | | | | 2,676,406 | |
| | | | | | | | |
| | | | | | $ | 31,248,355 | |
| | | | | | | | |
| Pharmaceuticals – 7.3% | | | | | |
| Bayer AG | | | 77,354 | | | $ | 8,523,013 | |
| Novo Nordisk A.S., “B” | | | 145,926 | | | | 6,740,207 | |
| Roche Holding AG | | | 39,362 | | | | 8,758,643 | |
| Santen Pharmaceutical Co. Ltd. | | | 314,700 | | | | 5,488,739 | |
| | | | | | | | |
| | | | | | $ | 29,510,602 | |
| | | | | | | | |
| Printing & Publishing – 1.0% | | | | | |
| RELX N.V. | | | 195,639 | | | $ | 4,164,575 | |
| | | | | | | | |
| | | | | | | | |
| Issuer | | Shares/Par | | | Value ($) | |
| COMMON STOCKS – continued | | | | | |
| Real Estate – 2.8% | | | | | |
| Grand City Properties S.A. | | | 201,799 | | | $ | 5,241,098 | |
| LEG Immobilien AG | | | 55,644 | | | | 6,048,437 | |
| | | | | | | | |
| | | | | | $ | 11,289,535 | |
| | | | | | | | |
| Restaurants – 0.9% | | | | | |
| Yum China Holdings, Inc. | | | 89,927 | | | $ | 3,458,592 | |
| | | | | | | | |
| Specialty Chemicals – 7.5% | | | | | |
| Akzo Nobel N.V. | | | 71,247 | | | $ | 6,070,997 | |
| Croda International PLC | | | 81,731 | | | | 5,179,654 | |
| Linde AG | | | 33,854 | | | | 8,080,893 | |
| Nitto Denko Corp. | | | 36,600 | | | | 2,771,240 | |
| Sika AG | | | 29,942 | | | | 4,126,207 | |
| Symrise AG | | | 47,921 | | | �� | 4,202,757 | |
| | | | | | | | |
| | | | | | $ | 30,431,748 | |
| | | | | | | | |
| Specialty Stores – 1.1% | | | | | |
| Dufry AG | | | 16,885 | | | $ | 2,152,238 | |
| Just Eat PLC (a) | | | 225,501 | | | | 2,318,343 | |
| | | | | | | | |
| | | | | | $ | 4,470,581 | |
| | | | | | | | |
| Telecommunications – Wireless – 3.4% | | | | | |
| Advanced Info Service PLC | | | 404,200 | | | $ | 2,257,078 | |
| Cellnex Telecom S.A.U. | | | 119,018 | | | | 2,994,950 | |
| KDDI Corp. | | | 174,800 | | | | 4,785,429 | |
| SoftBank Corp. | | | 54,300 | | | | 3,910,346 | |
| | | | | | | | |
| | | | | | $ | 13,947,803 | |
| | | | | | | | |
| Telephone Services – 0.4% | | | | | |
| Com Hem Holding AB | | | 102,970 | | | $ | 1,673,870 | |
| | | | | | | | |
| Tobacco – 2.7% | | | | | |
| British American Tobacco PLC | | | 123,705 | | | $ | 6,252,848 | |
| Japan Tobacco, Inc. | | | 160,800 | | | | 4,495,109 | |
| | | | | | | | |
| | | | | | $ | 10,747,957 | |
| | | | | | | | |
| Trucking – 0.7% | | | | | |
| Yamato Holdings Co. Ltd. | | | 94,200 | | | $ | 2,777,120 | |
| | | | | | | | |
| Utilities – Electric Power – 2.2% | | | | | |
| CLP Holdings Ltd. | | | 249,500 | | | $ | 2,687,207 | |
| E.ON AG | | | 246,726 | | | | 2,637,511 | |
| Iberdrola S.A. | | | 466,866 | | | | 3,606,209 | |
| | | | | | | | |
| | | | | | $ | 8,930,927 | |
| | | | | | | | |
Total Common Stocks
(Identified Cost, $353,629,413) | | | | | | $ | 401,147,101 | |
| | | | | | | | |
| | | | | | | | | | | | | | | | |
| | | Strike
Price | | | First Exercise | | | | | | | |
| RIGHTS – 0.0% | | | | | | | | | |
| Other Banks & Diversified Financials – 0.0% | | | | | |
| Intesa Sanpaolo S.p.A. (1 share for 1 right) (a) (Identified Cost, $0) | | | EUR 2.74 | | | | 7/31/18 | | | | 1,492,465 | | | $ | 0 | |
| | | | | | | | | | | | | | | | |
5
MFS Research International Portfolio
Portfolio of Investments (unaudited) – continued
| | | | | | | | |
| Issuer | | Shares/Par | | | Value ($) | |
| INVESTMENT COMPANIES (h) – 0.9% | | | | | |
| Money Market Funds – 0.9% | | | | | |
| MFS Institutional Money Market Portfolio, 1.9% (v) (Identified Cost, $3,471,781) | | | 3,472,114 | | | $ | 3,472,114 | |
| | | | | | | | |
OTHER ASSETS, LESS
LIABILITIES – 0.1% | | | | | | | 417,625 | |
| | | | | | | | |
| NET ASSETS – 100.0% | | | | | | $ | 405,036,840 | |
| | | | | | | | |
| (a) | | Non-income producing security. |
| (h) | | An affiliated issuer, which may be considered one in which the fund owns 5% or more of the outstanding voting securities, or a company which is under common control. At period end, the aggregate values of the fund’s investments in affiliated issuers and in unaffiliated issuers were $3,472,114 and $401,147,101, respectively. |
| (v) | | Affiliated issuer that is available only to investment companies managed by MFS. The rate quoted for the MFS Institutional Money Market Portfolio is the annualized seven-day yield of the fund at period end. |
The following abbreviations are used in this report and are defined:
| ADR | | American Depositary Receipt |
| PLC | | Public Limited Company |
Abbreviations indicate amounts shown in currencies other than the U.S. dollar. All amounts are stated in U.S. dollars unless otherwise indicated. A list of abbreviations is shown below:
See Notes to Financial Statements
6
MFS Research International Portfolio
FINANCIAL STATEMENTS | STATEMENT OF ASSETS AND LIABILITIES (unaudited)
This statement represents your fund’s balance sheet, which details the assets and liabilities comprising the total value of the fund.
| | | | |
At 6/30/18 | | | | |
Assets | | | | |
Investments in unaffiliated issuers, at value (identified cost, $353,629,413) | | | $401,147,101 | |
Investments in affiliated issuers, at value (identified cost, $3,471,781) | | | 3,472,114 | |
Foreign currency, at value (identified cost, $204,498) | | | 204,628 | |
Receivables for | | | | |
Investments sold | | | 3,538,262 | |
Fund shares sold | | | 272,517 | |
Interest and dividends | | | 1,547,481 | |
Other assets | | | 1,408 | |
Total assets | | | $410,183,511 | |
Liabilities | | | | |
Payables for | | | | |
Investments purchased | | | $4,606,881 | |
Fund shares reacquired | | | 297,651 | |
Payable to affiliates | | | | |
Investment adviser | | | 29,859 | |
Shareholder servicing costs | | | 41 | |
Distribution and/or service fees | | | 1,464 | |
Payable for independent Trustees’ compensation | | | 100 | |
Deferred country tax expense payable | | | 75,567 | |
Accrued expenses and other liabilities | | | 135,108 | |
Total liabilities | | | $5,146,671 | |
Net assets | | | $405,036,840 | |
Net assets consist of | | | | |
Paid-in capital | | | $323,146,718 | |
Unrealized appreciation (depreciation) (net of $75,567 deferred country tax) | | | 47,439,108 | |
Accumulated net realized gain (loss) | | | 23,295,105 | |
Undistributed net investment income | | | 11,155,909 | |
Net assets | | | $405,036,840 | |
Shares of beneficial interest outstanding | | | 24,208,768 | |
| | | | | | | | | | | | |
| | | Net assets | | | Shares
outstanding | | | Net asset value
per share | |
Initial Class | | | $333,056,233 | | | | 19,858,796 | | | | $16.77 | |
Service Class | | | 71,980,607 | | | | 4,349,972 | | | | 16.55 | |
See Notes to Financial Statements
7
MFS Research International Portfolio
FINANCIAL STATEMENTS | STATEMENT OF OPERATIONS (unaudited)
This statement describes how much your fund earned in investment income and accrued in expenses. It also describes any gains and/or losses
generated by fund operations.
| | | | |
Six months ended 6/30/18 | | | | |
Net investment income (loss) | | | | |
Income | | | | |
Dividends | | | $8,211,007 | |
Dividends from affiliated issuers | | | 29,134 | |
Income on securities loaned | | | 27,755 | |
Other | | | 2,315 | |
Foreign taxes withheld | | | (794,868 | ) |
Total investment income | | | $7,475,343 | |
Expenses | | | | |
Management fee | | | $1,862,418 | |
Distribution and/or service fees | | | 96,684 | |
Shareholder servicing costs | | | 7,097 | |
Administrative services fee | | | 35,983 | |
Independent Trustees’ compensation | | | 4,340 | |
Custodian fee | | | 61,635 | |
Shareholder communications | | | 18,420 | |
Audit and tax fees | | | 28,817 | |
Legal fees | | | 2,403 | |
Miscellaneous | | | 12,093 | |
Total expenses | | | $2,129,890 | |
Reduction of expenses by investment adviser | | | (19,084 | ) |
Net expenses | | | $2,110,806 | |
Net investment income (loss) | | | $5,364,537 | |
Realized and unrealized gain (loss) | | | | |
Realized gain (loss) (identified cost basis) | | | | |
Unaffiliated issuers (net of $7,791 country tax) | | | $14,276,454 | |
Affiliated issuers | | | 304 | |
Foreign currency | | | (27,359 | ) |
Net realized gain (loss) | | | $14,249,399 | |
Change in unrealized appreciation or depreciation | | | | |
Unaffiliated issuers (net of $28,596 increase in deferred country tax) | | | $(26,073,380 | ) |
Affiliated issuers | | | 333 | |
Translation of assets and liabilities in foreign currencies | | | (17,396 | ) |
Net unrealized gain (loss) | | | $(26,090,443 | ) |
Net realized and unrealized gain (loss) | | | $(11,841,044 | ) |
Change in net assets from operations | | | $(6,476,507 | ) |
See Notes to Financial Statements
8
MFS Research International Portfolio
FINANCIAL STATEMENTS | STATEMENTS OF CHANGES IN NET ASSETS
These statements describe the increases and/or decreases in net assets resulting from operations, any distributions, and any shareholder transactions.
| | | | | | | | |
| | | Six months ended
6/30/18 | | | Year ended
12/31/17 | |
| | | (unaudited) | | | | |
Change in net assets | | | | | | | | |
From operations | | | | | | | | |
Net investment income (loss) | | | $5,364,537 | | | | $5,853,114 | |
Net realized gain (loss) | | | 14,249,399 | | | | 26,063,324 | |
Net unrealized gain (loss) | | | (26,090,443 | ) | | | 71,473,238 | |
Change in net assets from operations | | | $(6,476,507 | ) | | | $103,389,676 | |
Distributions declared to shareholders | | | | | | | | |
From net investment income | | | $— | | | | $(7,282,212 | ) |
Change in net assets from fund share transactions | | | $(10,733,387 | ) | | | $(75,751,483 | ) |
Total change in net assets | | | $(17,209,894 | ) | | | $20,355,981 | |
Net assets | | | | | | | | |
At beginning of period | | | 422,246,734 | | | | 401,890,753 | |
At end of period (including undistributed net investment income of $11,155,909 and
$5,791,372, respectively) | | | $405,036,840 | | | | $422,246,734 | |
See Notes to Financial Statements
9
MFS Research International Portfolio
FINANCIAL STATEMENTS | FINANCIAL HIGHLIGHTS
The financial highlights table is intended to help you understand the fund’s financial performance for the semiannual period and the past 5 fiscal years. Certain information reflects financial results for a single fund share. The total returns in the table represent the rate that an investor would have earned (or lost) on an investment in the fund share class (assuming reinvestment of all distributions) held for the entire period.
| | | | | | | | | | | | | | | | | | | | | | | | |
| Initial Class | | Six months ended 6/30/18 | | | Year ended | |
| | | | 12/31/17 | | | 12/31/16 | | | 12/31/15 | | | 12/31/14 | | | 12/31/13 | |
| | | (unaudited) | | | | | | | | | | | | | | | | |
Net asset value, beginning of period | | | $17.05 | | | | $13.54 | | | | $13.85 | | | | $14.56 | | | | $16.09 | | | | $13.62 | |
| Income (loss) from investment operations | | | | | | | | | | | | | | | | | | | | | | | | |
Net investment income (loss) (d) | | | $0.23 | | | | $0.22 | | | | $0.25 | (c) | | | $0.24 | | | | $0.39 | | | | $0.25 | |
Net realized and unrealized gain (loss) | | | (0.51 | ) | | | 3.59 | | | | (0.34 | ) | | | (0.52 | ) | | | (1.46 | ) | | | 2.33 | |
Total from investment operations | | | $(0.28 | ) | | | $3.81 | | | | $(0.09 | ) | | | $(0.28 | ) | | | $(1.07 | ) | | | $2.58 | |
| Less distributions declared to shareholders | | | | | | | | | | | | | | | | | | | | | | | | |
From net investment income | | | $— | | | | $(0.30 | ) | | | $(0.22 | ) | | | $(0.30 | ) | | | $(0.30 | ) | | | $(0.11 | ) |
From net realized gain | | | — | | | | — | | | | — | | | | (0.13 | ) | | | (0.16 | ) | | | — | |
Total distributions declared to shareholders | | | $— | | | | $(0.30 | ) | | | $(0.22 | ) | | | $(0.43 | ) | | | $(0.46 | ) | | | $(0.11 | ) |
Net asset value, end of period (x) | | | $16.77 | | | | $17.05 | | | | $13.54 | | | | $13.85 | | | | $14.56 | | | | $16.09 | |
Total return (%) (k)(r)(s)(x) | | | (1.64 | )(n) | | | 28.29 | | | | (0.70 | )(c) | | | (1.96 | ) | | | (6.88 | ) | | | 19.01 | |
Ratios (%) (to average net assets)
and Supplemental data: | | | | | | | | | | | | | | | | | | | | | | | | |
Expenses before expense reductions (f) | | | 0.98 | (a) | | | 1.00 | | | | 0.95 | (c) | | | 1.00 | | | | 1.00 | | | | 1.00 | |
Expenses after expense reductions (f) | | | 0.97 | (a) | | | 0.99 | | | | 0.94 | (c) | | | 1.00 | | | | 0.99 | | | | 0.99 | |
Net investment income (loss) | | | 2.65 | (a) | | | 1.44 | | | | 1.87 | (c) | | | 1.61 | | | | 2.49 | | | | 1.68 | |
Portfolio turnover | | | 13 | (n) | | | 27 | | | | 41 | | | | 38 | | | | 27 | | | | 35 | |
Net assets at end of period (000 omitted) | | | $333,056 | | | | $341,613 | | | | $318,753 | | | | $305,502 | | | | $253,001 | | | | $286,763 | |
| | |
| Service Class | | Six months ended 6/30/18 | | | Year ended | |
| | | | 12/31/17 | | | 12/31/16 | | | 12/31/15 | | | 12/31/14 | | | 12/31/13 | |
| | | (unaudited) | | | | | | | | | | | | | | | | |
Net asset value, beginning of period | | | $16.84 | | | | $13.38 | | | | $13.68 | | | | $14.39 | | | | $15.91 | | | | $13.46 | |
| Income (loss) from investment operations | | | | | | | | | | | | | | | | | | | | | | | | |
Net investment income (loss) (d) | | | $0.20 | | | | $0.19 | | | | $0.21 | (c) | | | $0.20 | | | | $0.36 | | | | $0.21 | |
Net realized and unrealized gain (loss) | | | (0.49 | ) | | | 3.52 | | | | (0.33 | ) | | | (0.51 | ) | | | (1.47 | ) | | | 2.31 | |
Total from investment operations | | | $(0.29 | ) | | | $3.71 | | | | $(0.12 | ) | | | $(0.31 | ) | | | $(1.11 | ) | | | $2.52 | |
| Less distributions declared to shareholders | | | | | | | | | | | | | | | | | | | | | | | | |
From net investment income | | | $— | | | | $(0.25 | ) | | | $(0.18 | ) | | | $(0.27 | ) | | | $(0.25 | ) | | | $(0.07 | ) |
From net realized gain | | | — | | | | — | | | | — | | | | (0.13 | ) | | | (0.16 | ) | | | — | |
Total distributions declared to shareholders | | | $— | | | | $(0.25 | ) | | | $(0.18 | ) | | | $(0.40 | ) | | | $(0.41 | ) | | | $(0.07 | ) |
Net asset value, end of period (x) | | | $16.55 | | | | $16.84 | | | | $13.38 | | | | $13.68 | | | | $14.39 | | | | $15.91 | |
Total return (%) (k)(r)(s)(x) | | | (1.72 | )(n) | | | 27.90 | | | | (0.91 | )(c) | | | (2.20 | ) | | | (7.16 | ) | | | 18.77 | |
Ratios (%) (to average net assets)
and Supplemental data: | | | | | | | | | | | | | | | | | | | | | | | | |
Expenses before expense reductions (f) | | | 1.23 | (a) | | | 1.25 | | | | 1.20 | (c) | | | 1.25 | | | | 1.25 | | | | 1.25 | |
Expenses after expense reductions (f) | | | 1.22 | (a) | | | 1.24 | | | | 1.19 | (c) | | | 1.25 | | | | 1.24 | | | | 1.24 | |
Net investment income (loss) | | | 2.36 | (a) | | | 1.26 | | | | 1.58 | (c) | | | 1.36 | | | | 2.30 | | | | 1.45 | |
Portfolio turnover | | | 13 | (n) | | | 27 | | | | 41 | | | | 38 | | | | 27 | | | | 35 | |
Net assets at end of period (000 omitted) | | | $71,981 | | | | $80,634 | | | | $83,138 | | | | $97,958 | | | | $74,383 | | | | $92,773 | |
See Notes to Financial Statements
10
MFS Research International Portfolio
Financial Highlights – continued
| (c) | Amount reflects a one-time reimbursement of expenses by the custodian (or former custodian) without which net investment income and performance would be lower and expenses would be higher. |
| (d) | Per share data is based on average shares outstanding. |
| (f) | Ratios do not reflect reductions from fees paid indirectly, if applicable. |
| (k) | The total return does not reflect expenses that apply to separate accounts. Inclusion of these charges would reduce the total return figures for all periods shown. |
| (r) | Certain expenses have been reduced without which performance would have been lower. |
| (s) | From time to time the fund may receive proceeds from litigation settlements, without which performance would be lower. |
| (x) | The net asset values and total returns have been calculated on net assets which include adjustments made in accordance with U.S. generally accepted accounting principles required at period end for financial reporting purposes. |
See Notes to Financial Statements
11
MFS Research International Portfolio
NOTES TO FINANCIAL STATEMENTS (unaudited)
| (1) | | Business and Organization |
MFS Research International Portfolio (the fund) is a diversified series of MFS Variable Insurance Trust II (the trust). The trust is organized as a Massachusetts business trust and is registered under the Investment Company Act of 1940, as amended, as an open-end management investment company. The shareholders of each series of the trust are separate accounts of insurance companies, which offer variable annuity and/or life insurance products, and qualified retirement and pension plans.
The fund is an investment company and accordingly follows the investment company accounting and reporting guidance of the Financial Accounting Standards Board (FASB) Accounting Standards Codification Topic 946 Financial Services – Investment Companies.
| (2) | | Significant Accounting Policies |
General – The preparation of financial statements in conformity with U.S. generally accepted accounting principles requires management to make estimates and assumptions that affect the reported amounts of assets and liabilities, and disclosure of contingent assets and liabilities at the date of the financial statements and the reported amounts of increases and decreases in net assets from operations during the reporting period. Actual results could differ from those estimates. In the preparation of these financial statements, management has evaluated subsequent events occurring after the date of the fund’s Statement of Assets and Liabilities through the date that the financial statements were issued. The fund invests in foreign securities. Investments in foreign securities are vulnerable to the effects of changes in the relative values of the local currency and the U.S. dollar and to the effects of changes in each country’s market, economic, industrial, political, regulatory, geopolitical, and other conditions.
Balance Sheet Offsetting – The fund’s accounting policy with respect to balance sheet offsetting is that, absent an event of default by the counterparty or a termination of the agreement, the International Swaps and Derivatives Association (ISDA) Master Agreement, or similar agreement, does not result in an offset of reported amounts of financial assets and financial liabilities in the Statement of Assets and Liabilities across transactions between the fund and the applicable counterparty. The fund’s right to setoff may be restricted or prohibited by the bankruptcy or insolvency laws of the particular jurisdiction to which a specific master netting agreement counterparty is subject. Balance sheet offsetting disclosures, to the extent applicable to the fund, have been included in the fund’s Significant Accounting Policies note under the captions for each of the fund’s in-scope financial instruments and transactions.
Investment Valuations – Equity securities, including restricted equity securities, are generally valued at the last sale or official closing price on their primary market or exchange as provided by a third-party pricing service. Equity securities, for which there were no sales reported that day, are generally valued at the last quoted daily bid quotation on their primary market or exchange as provided by a third-party pricing service. Short-term instruments with a maturity at issuance of 60 days or less may be valued at amortized cost, which approximates market value. Open-end investment companies are generally valued at net asset value per share. Securities and other assets generally valued on the basis of information from a third-party pricing service may also be valued at a broker/dealer bid quotation. In determining values, third-party pricing services can utilize both transaction data and market information such as yield, quality, coupon rate, maturity, type of issue, trading characteristics, and other market data. The values of foreign securities and other assets and liabilities expressed in foreign currencies are converted to U.S. dollars using the mean of bid and asked prices for rates provided by a third-party pricing service.
The Board of Trustees has delegated primary responsibility for determining or causing to be determined the value of the fund’s investments (including any fair valuation) to the adviser pursuant to valuation policies and procedures approved by the Board. If the adviser determines that reliable market quotations are not readily available, investments are valued at fair value as determined in good faith by the adviser in accordance with such procedures under the oversight of the Board of Trustees. Under the fund’s valuation policies and procedures, market quotations are not considered to be readily available for most types of debt instruments and floating rate loans and many types of derivatives. These investments are generally valued at fair value based on information from third-party pricing services. In addition, investments may be valued at fair value if the adviser determines that an investment’s value has been materially affected by events occurring after the close of the exchange or market on which the investment is principally traded (such as foreign exchange or market) and prior to the determination of the fund’s net asset value, or after the halting of trading of a specific security where trading does not resume prior to the close of the exchange or market on which the security is principally traded. Events that occur on a frequent basis after foreign markets close (such as developments in foreign markets and significant movements in the U.S. markets) and prior to the determination of the fund’s net asset value may be deemed to have a material effect on the value of securities traded in foreign markets. Accordingly, the fund’s foreign equity securities may often be valued at fair value. The adviser generally relies on third-party pricing services or other information (such as the correlation with price movements of similar securities in the same or other markets; the type, cost and investment characteristics of the security; the business and financial condition of the issuer; and trading and other market data) to assist in determining whether to fair value and at what value to fair value an investment. The value of an investment for purposes of calculating the fund’s net asset value can differ depending on the source and method used to determine value. When fair valuation is used, the value of an investment used to
12
MFS Research International Portfolio
Notes to Financial Statements (unaudited) – continued
determine the fund’s net asset value may differ from quoted or published prices for the same investment. There can be no assurance that the fund could obtain the fair value assigned to an investment if it were to sell the investment at the same time at which the fund determines its net asset value per share.
Various inputs are used in determining the value of the fund’s assets or liabilities. These inputs are categorized into three broad levels. In certain cases, the inputs used to measure fair value may fall into different levels of the fair value hierarchy. In such cases, an investment’s level within the fair value hierarchy is based on the lowest level of input that is significant to the fair value measurement. The fund’s assessment of the significance of a particular input to the fair value measurement in its entirety requires judgment, and considers factors specific to the investment. Level 1 includes unadjusted quoted prices in active markets for identical assets or liabilities. Level 2 includes other significant observable market-based inputs (including quoted prices for similar securities, interest rates, prepayment speed, and credit risk). Level 3 includes unobservable inputs, which may include the adviser’s own assumptions in determining the fair value of investments. The following is a summary of the levels used as of June 30, 2018 in valuing the fund’s assets or liabilities:
| | | | | | | | | | | | | | | | |
| Financial Instruments | | Level 1 | | | Level 2 | | | Level 3 | | | Total | |
| Equity Securities: | | | | | | | | | | | | | | | | |
Japan | | | $74,159,388 | | | | $— | | | | $— | | | | $74,159,388 | |
United Kingdom | | | 40,250,180 | | | | 11,561,207 | | | | — | | | | 51,811,387 | |
Switzerland | | | — | | | | 48,180,222 | | | | — | | | | 48,180,222 | |
Germany | | | 39,445,296 | | | | — | | | | — | | | | 39,445,296 | |
France | | | 3,766,446 | | | | 32,149,527 | | | | — | | | | 35,915,973 | |
United States | | | 20,291,264 | | | | — | | | | — | | | | 20,291,264 | |
Australia | | | 13,877,717 | | | | — | | | | — | | | | 13,877,717 | |
Spain | | | 2,389,762 | | | | 11,172,084 | | | | — | | | | 13,561,846 | |
Hong Kong | | | 12,988,559 | | | | — | | | | — | | | | 12,988,559 | |
Other Countries | | | 52,473,504 | | | | 38,441,945 | | | | — | | | | 90,915,449 | |
| Mutual Funds | | | 3,472,114 | | | | — | | | | — | | | | 3,472,114 | |
| Total | | | $263,114,230 | | | | $141,504,985 | | | | $— | | | | $404,619,215 | |
For further information regarding security characteristics, see the Portfolio of Investments.
Of the level 2 investments presented above, equity investments amounting to $131,979,579 would have been considered level 1 investments at the beginning of the period. Of the level 1 investments presented above, equity investments amounting to $47,143,538 would have been considered level 2 investments at the beginning of the period. The primary reason for changes in the classifications between levels 1 and 2 occurs when foreign equity securities are fair valued using other observable market-based inputs in place of the closing exchange price due to events occurring after the close of the exchange or market on which the investment is principally traded. The fund’s foreign equity securities may often be valued using other observable market-based inputs. The fund’s policy is to recognize transfers between the levels as of the end of the period.
Foreign Currency Translation – Purchases and sales of foreign investments, income, and expenses are converted into U.S. dollars based upon currency exchange rates prevailing on the respective dates of such transactions or on the reporting date for foreign denominated receivables and payables. Gains and losses attributable to foreign currency exchange rates on sales of securities are recorded for financial statement purposes as net realized gains and losses on investments. Gains and losses attributable to foreign exchange rate movements on receivables, payables, income and expenses are recorded for financial statement purposes as foreign currency transaction gains and losses. That portion of both realized and unrealized gains and losses on investments that results from fluctuations in foreign currency exchange rates is not separately disclosed.
Security Loans – Under its Securities Lending Agency Agreement with the fund, State Street Bank and Trust Company (“State Street”), as lending agent, loans the securities of the fund to certain qualified institutions (the “Borrowers”) approved by the fund. Security loans can be terminated at the discretion of either the lending agent or the fund and the related securities must be returned within the earlier of the standard trade settlement period for such securities or within three business days. The loans are collateralized by cash and/or U.S. Treasury and federal agency obligations in an amount typically at least equal to the market value of the securities loaned. On loans collateralized by cash, the cash collateral is invested in a money market fund. The market value of the loaned securities is determined at the close of business of the fund and any additional required collateral is delivered to the fund on the next business day. State Street provides the fund with indemnification against Borrower default. In the event of Borrower default, State Street will, for the benefit of the fund, either purchase securities identical to those loaned or, when such purchase is commercially impracticable, pay the fund the market value of the loaned securities. In return, State Street assumes the fund’s rights to the related collateral. If the collateral value is less than the cost to purchase identical securities, State Street is responsible for the shortfall, but only to the extent that such shortfall is not due to a decline in collateral value resulting from collateral reinvestment for which the fund bears the risk of loss. A portion of the income generated upon investment of the collateral is remitted to the
13
MFS Research International Portfolio
Notes to Financial Statements (unaudited) – continued
Borrowers, and the remainder is allocated between the fund and the lending agent. On loans collateralized by U.S. Treasury and/or federal agency obligations, a fee is received from the Borrower, and is allocated between the fund and the lending agent. Income from securities lending is separately reported in the Statement of Operations. The dividend and interest income earned on the securities loaned is accounted for in the same manner as other dividend and interest income. At June 30, 2018, there were no securities on loan or collateral outstanding.
Indemnifications – Under the fund’s organizational documents, its officers and Trustees may be indemnified against certain liabilities and expenses arising out of the performance of their duties to the fund. Additionally, in the normal course of business, the fund enters into agreements with service providers that may contain indemnification clauses. The fund’s maximum exposure under these agreements is unknown as this would involve future claims that may be made against the fund that have not yet occurred.
Investment Transactions and Income – Investment transactions are recorded on the trade date. Interest income is recorded on the accrual basis. Dividends received in cash are recorded on the ex-dividend date. Certain dividends from foreign securities will be recorded when the fund is informed of the dividend if such information is obtained subsequent to the ex-dividend date. Dividend payments received in additional securities are recorded on the ex-dividend date in an amount equal to the value of the security on such date.
The fund may receive proceeds from litigation settlements. Any proceeds received from litigation involving portfolio holdings are reflected in the Statement of Operations in realized gain/loss if the security has been disposed of by the fund or in unrealized gain/loss if the security is still held by the fund. Any other proceeds from litigation not related to portfolio holdings are reflected as other income in the Statement of Operations.
Tax Matters and Distributions – The fund intends to qualify as a regulated investment company, as defined under Subchapter M of the Internal Revenue Code, and to distribute all of its taxable income, including realized capital gains. As a result, no provision for federal income tax is required. The fund’s federal tax returns, when filed, will remain subject to examination by the Internal Revenue Service for a three year period. Management has analyzed the fund’s tax positions taken on federal and state tax returns for all open tax years and does not believe that there are any uncertain tax positions that require recognition of a tax liability. Foreign taxes, if any, have been accrued by the fund in the accompanying financial statements in accordance with the applicable foreign tax law. Foreign income taxes may be withheld by certain countries in which the fund invests. Additionally, capital gains realized by the fund on securities issued in or by certain foreign countries may be subject to capital gains tax imposed by those countries.
Distributions to shareholders are recorded on the ex-dividend date. Income and capital gain distributions are determined in accordance with income tax regulations, which may differ from U.S. generally accepted accounting principles. Certain capital accounts in the financial statements are periodically adjusted for permanent differences in order to reflect their tax character. These adjustments have no impact on net assets or net asset value per share. Temporary differences which arise from recognizing certain items of income, expense, gain or loss in different periods for financial statement and tax purposes will reverse at some time in the future. Distributions in excess of net investment income or net realized gains are temporary overdistributions for financial statement purposes resulting from differences in the recognition or classification of income or distributions for financial statement and tax purposes.
Book/tax differences primarily relate to wash sale loss deferrals.
The tax character of distributions declared to shareholders for the last fiscal year is as follows:
| | | | |
| | | Year ended
12/31/17 | |
| Ordinary income (including any short-term capital gains) | | | $7,282,212 | |
The federal tax cost and the tax basis components of distributable earnings were as follows:
| | | | |
| As of 6/30/18 | | | | |
| Cost of investments | | | $358,334,463 | |
| Gross appreciation | | | 64,299,758 | |
| Gross depreciation | | | (18,015,006 | ) |
| Net unrealized appreciation (depreciation) | | | $46,284,752 | |
| |
| As of 12/31/17 | | | | |
| Undistributed ordinary income | | | 10,713,027 | |
| Undistributed long-term capital gain | | | 5,354,975 | |
| Other temporary differences | | | (30,576 | ) |
| Net unrealized appreciation (depreciation) | | | 72,329,203 | |
The aggregate cost above includes prior fiscal year end tax adjustments, if applicable.
14
MFS Research International Portfolio
Notes to Financial Statements (unaudited) – continued
Multiple Classes of Shares of Beneficial Interest – The fund offers multiple classes of shares, which differ in their respective distribution and/or service fees. The fund’s income, realized and unrealized gain (loss), and common expenses are allocated to shareholders based on the daily net assets of each class. Dividends are declared separately for each class. Differences in per share dividend rates are generally due to differences in separate class expenses. The fund’s distributions declared to shareholders as reported in the Statements of Changes in Net Assets are presented by class as follows:
| | | | | | | | |
| | | From net investment
income | |
| | | Six months ended
6/30/18 | | | Year ended
12/31/17 | |
| Initial Class | | | $— | | | | $6,031,816 | |
| Service Class | | | — | | | | 1,250,396 | |
| Total | | | $— | | | | $7,282,212 | |
| (3) | | Transactions with Affiliates |
Investment Adviser – The fund has an investment advisory agreement with MFS to provide overall investment management and related administrative services and facilities to the fund. The management fee is computed daily and paid monthly at the following annual rates based on the fund’s average daily net assets:
| | | | |
| Up to $1 billion | | | 0.90% | |
| In excess of $1 billion and up to $2 billion | | | 0.80% | |
| In excess of $2 billion | | | 0.70% | |
MFS has agreed in writing to reduce its management fee by a specified amount if certain MFS mutual fund assets exceed thresholds agreed to by MFS and the fund’s Board of Trustees. For the six months ended June 30, 2018, this management fee reduction amounted to $19,084, which is included in the reduction of total expenses in the Statement of Operations. The management fee incurred for the six months ended June 30, 2018 was equivalent to an annual effective rate of 0.89% of the fund’s average daily net assets.
The investment adviser has agreed in writing to pay a portion of the fund’s total annual operating expenses, excluding interest, taxes, extraordinary expenses, brokerage and transaction costs, and investment-related expenses, such that total annual operating expenses do not exceed 1.00% of average daily net assets for the Initial Class shares and 1.25% of average daily net assets for the Service Class shares. This written agreement will terminate on July 31, 2018. For the six months ended June 30, 2018, the fund’s actual operating expenses did not exceed the limit and therefore, the investment adviser did not pay any portion of the fund’s expenses related to this agreement.
Effective August 1, 2018, the investment adviser has agreed in writing to pay a portion of the fund’s total annual operating expenses, excluding interest, taxes, extraordinary expenses, brokerage and transaction costs, and investment-related expenses, such that total annual operating expenses do not exceed 0.96% of average daily net assets for the Initial Class shares and 1.21% of average daily net assets for the Service Class shares. This written agreement will continue until modified by the fund’s Board of Trustees, but such agreement will continue at least until April 30, 2020.
Distributor – MFS Fund Distributors, Inc. (MFD), a wholly-owned subsidiary of MFS, is the distributor of shares of the fund. The Trustees have adopted a distribution plan for the Service Class shares pursuant to Rule 12b-1 under the Investment Company Act of 1940.
The fund’s distribution plan provides that the fund will pay MFD distribution and/or service fees equal to 0.25% per annum of its average daily net assets attributable to Service Class shares as partial consideration for services performed and expenses incurred by MFD and financial intermediaries (including participating insurance companies that invest in the fund to fund variable annuity and variable life insurance contracts, sponsors of qualified retirement and pension plans that invest in the fund, and affiliates of these participating insurance companies and plan sponsors) in connection with the sale and distribution of the Service Class shares. MFD may subsequently pay all, or a portion, of the distribution and/or service fees to financial intermediaries.
Shareholder Servicing Agent – MFS Service Center, Inc. (MFSC), a wholly-owned subsidiary of MFS, receives a fee from the fund for its services as shareholder servicing agent. For the six months ended June 30, 2018, the fee was $6,895, which equated to
0.0033% annually of the fund’s average daily net assets. MFSC also receives payment from the fund for out-of-pocket expenses paid by MFSC on behalf of the fund. For the six months ended June 30, 2018, these costs amounted to $202.
Administrator – MFS provides certain financial, legal, shareholder communications, compliance, and other administrative services to the fund. Under an administrative services agreement, the fund reimburses MFS the costs incurred to provide these services. The fund is charged an annual fixed amount of $17,500 plus a fee based on average daily net assets. The administrative services fee incurred for the six months ended June 30, 2018 was equivalent to an annual effective rate of 0.0174% of the fund’s average daily net assets.
15
MFS Research International Portfolio
Notes to Financial Statements (unaudited) – continued
Trustees’ and Officers’ Compensation – The fund pays compensation to independent Trustees in the form of a retainer, attendance fees, and additional compensation to Board and Committee chairpersons. The fund does not pay compensation directly to Trustees or officers of the fund who are also officers of the investment adviser, all of whom receive remuneration for their services to the fund from MFS. Certain officers and Trustees of the fund are officers or directors of MFS, MFD, and MFSC.
Other – This fund and certain other funds managed by MFS (the funds) have entered into a service agreement (the ISO Agreement) which provides for payment of fees solely by the funds to Tarantino LLC in return for the provision of services of an Independent Senior Officer (ISO) for the funds. Frank L. Tarantino serves as the ISO and is an officer of the funds and the sole member of Tarantino LLC. The funds can terminate the ISO Agreement with Tarantino LLC at any time under the terms of the ISO Agreement. For the six months ended June 30, 2018, the fee paid by the fund under this agreement was $348 and is included in “Miscellaneous” expense in the Statement of Operations. MFS has agreed to bear all expenses associated with office space, other administrative support, and supplies provided to the ISO.
The fund invests in the MFS Institutional Money Market Portfolio which is managed by MFS and seeks current income consistent with preservation of capital and liquidity. This money market fund does not pay a management fee to MFS.
The fund is permitted to engage in purchase and sale transactions with funds and accounts for which MFS serves as investment adviser or sub-adviser (“cross-trades”) pursuant to a policy adopted by the Board of Trustees. This policy has been designed to ensure that cross-trades conducted by the fund comply with Rule 17a-7 under the Investment Company Act of 1940. During the six months ended June 30, 2018, the fund engaged in purchase and sale transactions pursuant to this policy, which amounted to $59,308 and $984,278, respectively. The sales transactions resulted in net realized gains (losses) of $298,819.
(4) Portfolio Securities
For the six months ended June 30, 2018, purchases and sales of investments, other than short-term obligations, aggregated $54,722,078 and $62,514,916, respectively.
(5) Shares of Beneficial Interest
The fund’s Declaration of Trust permits the Trustees to issue an unlimited number of full and fractional shares of beneficial interest. Transactions in fund shares were as follows:
| | | | | | | | | | | | | | | | |
| | | Six months ended 6/30/18 | | | Year ended 12/31/17 | |
| | | Shares | | | Amount | | | Shares | | | Amount | |
| Shares sold | | | | | | | | | | | | | | | | |
Initial Class | | | 1,092,438 | | | | $18,743,139 | | | | 996,797 | | | | $15,780,051 | |
Service Class | | | 203,868 | | | | 3,454,877 | | | | 667,310 | | | | 10,100,721 | |
| | | 1,296,306 | | | | $22,198,016 | | | | 1,664,107 | | | | $25,880,772 | |
| Shares issued to shareholders in reinvestment of distributions | | | | | | | | | | | | | | | | |
Initial Class | | | — | | | | $— | | | | 383,216 | | | | $6,031,816 | |
Service Class | | | — | | | | — | | | | 80,308 | | | | 1,250,396 | |
| | | — | | | | $— | | | | 463,524 | | | | $7,282,212 | |
| Shares reacquired | | | | | | | | | | | | | | | | |
Initial Class | | | (1,273,938 | ) | | | $(22,065,751 | ) | | | (4,873,959 | ) | | | $(75,287,115 | ) |
Service Class | | | (642,196 | ) | | | (10,865,652 | ) | | | (2,173,107 | ) | | | (33,627,352 | ) |
| | | (1,916,134 | ) | | | $(32,931,403 | ) | | | (7,047,066 | ) | | | $(108,914,467 | ) |
| Net change | | | | | | | | | | | | | | | | |
Initial Class | | | (181,500 | ) | | | $(3,322,612 | ) | | | (3,493,946 | ) | | | $(53,475,248 | ) |
Service Class | | | (438,328 | ) | | | (7,410,775 | ) | | | (1,425,489 | ) | | | (22,276,235 | ) |
| | | (619,828 | ) | | | $(10,733,387 | ) | | | (4,919,435 | ) | | | $(75,751,483 | ) |
The fund is one of several mutual funds in which certain MFS funds may invest. The MFS funds do not invest in the underlying funds for the purpose of exercising management or control. At the end of the period, the MFS Moderate Allocation Portfolio, the MFS Growth Allocation Portfolio, and the MFS Conservative Allocation Portfolio were the owners of record of approximately 27%, 9%, and 5% respectively, of the value of outstanding voting shares of the fund.
16
MFS Research International Portfolio
Notes to Financial Statements (unaudited) – continued
(6) Line of Credit
The fund and certain other funds managed by MFS participate in a $1.25 billion unsecured committed line of credit, subject to a $1 billion sublimit, provided by a syndication of banks under a credit agreement. Borrowings may be made for temporary financing needs. Interest is charged to each fund, based on its borrowings, generally at a rate equal to the higher of the Overnight Bank Funding rate or daily one month LIBOR plus an agreed upon spread. A commitment fee, based on the average daily, unused portion of the committed line of credit, is allocated among the participating funds. In addition, the fund and other funds managed by MFS have established unsecured uncommitted borrowing arrangements with certain banks for temporary financing needs. Interest is charged to each fund, based on its borrowings, at a rate equal to the Overnight Bank Funding rate plus an agreed upon spread. For the six months ended June 30, 2018, the fund’s commitment fee and interest expense were $1,368 and $0, respectively, and are included in “Miscellaneous” expense in the Statement of Operations.
(7) Investments in Affiliated Issuers
An affiliated issuer may be considered one in which the fund owns 5% or more of the outstanding voting securities, or a company which is under common control. For the purposes of this report, the fund assumes the following to be affiliated issuers:
| | | | | | | | | | | | | | | | | | |
| Affiliated Issuers | | | | Beginning
Shares/Par
Amount | | | Acquisitions
Shares/Par
Amount | | | Dispositions
Shares/Par
Amount | | | Ending
Shares/Par
Amount | |
| MFS Institutional Money Market Portfolio | | | | | 710,680 | | | | 29,246,028 | | | | (26,484,594 | ) | | | 3,472,114 | |
| | | | | |
| Affiliated Issuers | | Realized
Gain (Loss) | | Change in
Unrealized
Appreciation/
Depreciation | | | Capital Gain
Distributions | | | Dividend
Income | | | Ending
Value | |
| MFS Institutional Money Market Portfolio | | $304 | | | $333 | | | | $— | | | | $29,134 | | | | $3,472,114 | |
17
MFS Research International Portfolio
PROXY VOTING POLICIES AND INFORMATION
MFS votes proxies on behalf of the fund pursuant to proxy voting policies and procedures that are available without charge, upon request, by calling 1-800-225-2606, by visiting mfs.com/proxyvoting, or by visiting the SEC’s Web site at http://www.sec.gov.
Information regarding how the fund voted proxies relating to portfolio securities during the most recent twelve-month period ended June 30 is available by August 31 of each year without charge by visiting mfs.com/proxyvoting, or by visiting the SEC’s Web site at http://www.sec.gov.
QUARTERLY PORTFOLIO DISCLOSURE
The fund will file a complete schedule of portfolio holdings with the Securities and Exchange Commission (the Commission) for the first and third quarters of each fiscal year on Form N-Q. The fund’s Form N-Q is available on the EDGAR database on the Commission’s Internet Web site at http://www.sec.gov, and may be reviewed and copied at the:
Public Reference Room
Securities and Exchange Commission
100 F Street, NE, Room 1580
Washington, D.C. 20549
Information on the operation of the Public Reference Room may be obtained by calling the Commission at 1-800-SEC-0330. Copies of the fund’s Form N-Q also may be obtained, upon payment of a duplicating fee, by electronic request at the following e-mail address: publicinfo@sec.gov or by writing the Public Reference Section at the above address.
FURTHER INFORMATION
From time to time, MFS may post important information about the fund or the MFS funds on the MFS web site (mfs.com). This information is available at https://www.mfs.com/en-us/what-we-do/announcements.html or at mfs.com/vit2 by choosing the fund’s name.
INFORMATION ABOUT FUND CONTRACTS AND LEGAL CLAIMS
The fund has entered into contractual arrangements with an investment adviser, administrator, distributor, shareholder servicing agent, 529 program manager (if applicable), and custodian who each provide services to the fund. Unless expressly stated otherwise, shareholders are not parties to, or intended beneficiaries of these contractual arrangements, and these contractual arrangements are not intended to create any shareholder right to enforce them against the service providers or to seek any remedy under them against the service providers, either directly or on behalf of the fund.
Under the Trust’s By-Laws and Declaration of Trust, any claims asserted against or on behalf of the MFS Funds, including claims against Trustees and Officers, must be brought in state and federal courts located within the Commonwealth of Massachusetts.
18
Semiannual Report
June 30, 2018

MFS® Strategic Income Portfolio

MFS® Variable Insurance Trust II
SIS-SEM
MFS® Strategic Income Portfolio
CONTENTS
The report is prepared for the general information of contract owners. It is authorized for distribution to prospective investors only when preceded or accompanied by a current prospectus.
NOT FDIC INSURED • MAY LOSE VALUE • NO BANK OR CREDIT UNION GUARANTEE • NOT A DEPOSIT • NOT INSURED BY ANY FEDERAL GOVERNMENT AGENCY OR NCUA/NCUSIF
MFS Strategic Income Portfolio
LETTER FROM THE EXECUTIVE CHAIRMAN

Dear Contract Owners:
Rising bond yields, international trade friction and geopolitical uncertainty have contributed to a measurable uptick in market volatility — a departure from the low-volatility environment that prevailed for much of 2017. In recent months, against this more challenging backdrop, global markets have given back some of the strong gains recorded during 2017 and early 2018. But global economic growth remains healthy, notwithstanding signs of a modest slowdown over the past few months, particularly in Europe and China.
Although the U.S. Federal Reserve continues to gradually raise interest rates and shrink its balance sheet, monetary policy remains accommodative around the world, with many central banks taking only tentative steps toward tighter policies. Newly enacted U.S. tax reforms have been welcomed by equity markets, while emerging market economies have recently had to contend with tighter financial conditions as a result of firmer U.S. Treasury yields and a stronger dollar. Around the world, inflation remains largely subdued, but tight labor markets and solid global demand have investors on the lookout for its potential resurgence. Increased U.S. protectionism is also a growing concern, as investors fear that trade disputes could dampen business sentiment, leading to slower global growth.
As a global investment manager, MFS® strives to create long-term value for clients through an active approach and an investment platform built on nearly a century of expertise. To make that long-term value meaningful for clients, we work to align with you on our beliefs, your needs and the time it takes to deliver on your desired outcomes.
Respectfully,

Robert J. Manning
Executive Chairman
MFS Investment Management
August 16, 2018
The opinions expressed in this letter are subject to change and may not be relied upon for investment advice. No forecasts can be guaranteed.
1
MFS Strategic Income Portfolio
PORTFOLIO COMPOSITION
Portfolio structure (i)
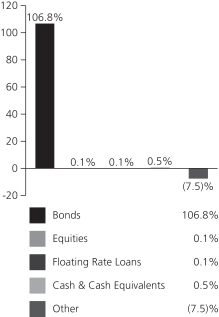
| | | | |
| Fixed income sectors (i) | | | | |
| Investment Grade Corporates | | | 31.3% | |
| U.S. Treasury Securities | | | 19.4% | |
| High Yield Corporates | | | 19.3% | |
| Commercial Mortgage-Backed Securities | | | 11.2% | |
| Collateralized Debt Obligations | | | 10.4% | |
| Emerging Markets Bonds | | | 8.4% | |
| Asset-Backed Securities | | | 4.4% | |
| Municipal Bonds | | | 0.6% | |
| Mortgage-Backed Securities | | | 0.6% | |
| Non-U.S. Government Bonds | | | 0.5% | |
| Residential Mortgage-Backed Securities | | | 0.3% | |
| U.S. Government Agencies | | | 0.3% | |
| Floating Rate Loans | | | 0.1% | |
| | | | |
| Composition including fixed income credit quality (a)(i) | |
| AAA | | | 12.0% | |
| AA | | | 3.4% | |
| A | | | 21.5% | |
| BBB | | | 21.6% | |
| BB | | | 12.8% | |
| B | | | 10.9% | |
| CCC | | | 1.8% | |
| CC | | | 0.4% | |
| C | | | 0.2% | |
| U.S. Government | | | 11.9% | |
| Federal Agencies | | | 0.9% | |
| Not Rated | | | 9.5% | |
| Non-Fixed Income | | | 0.1% | |
| Cash & Cash Equivalents | | | 0.5% | |
| Other | | | (7.5)% | |
| |
| Portfolio facts (i) | | | | |
| Average Duration (d) | | | 5.7 | |
| Average Effective Maturity (m) | | | 8.7 yrs. | |
| (a) | | For all securities other than those specifically described below, ratings are assigned to underlying securities utilizing ratings from Moody’s, Fitch, and Standard & Poor’s rating agencies and applying the following hierarchy: If all three agencies provide a rating, the middle rating (after dropping the highest and lowest ratings) is assigned; if two of the three agencies rate a security, the lower of the two is assigned. Ratings are shown in the S&P and Fitch scale (e.g., AAA). Securities rated BBB or higher are considered investment grade. All ratings are subject to change. U.S. Government includes securities issued by the U.S. Department of the Treasury. Federal Agencies includes rated and unrated U.S. Agency fixed-income securities, U.S. Agency mortgage-backed securities, and collateralized mortgage obligations of U.S. Agency mortgage-backed securities. Not Rated includes fixed income securities and fixed income derivatives, which have not been rated by any rating agency. Non-Fixed Income includes any equity securities (including convertible bonds and equity derivatives) and/or commodity-linked derivatives. The fund may or may not have held all of these instruments on this date. The fund is not rated by these agencies. |
| (d) | | Duration is a measure of how much a bond’s price is likely to fluctuate with general changes in interest rates, e.g., if rates rise 1.00%, a bond with a 5-year duration is likely to lose about 5.00% of its value due to the interest rate move. |
| (i) | | For purposes of this presentation, the components include the value of securities, and reflect the impact of the equivalent exposure of derivative positions, if any. These amounts may be negative from time to time. Equivalent exposure is a calculated amount that translates the derivative position into a reasonable approximation of the amount of the underlying asset that the portfolio would have to hold at a given point in time to have the same price sensitivity that results from the portfolio’s ownership of the derivative contract. When dealing with derivatives, equivalent exposure is a more representative measure of the potential impact of a position on portfolio performance than value. The bond component will include any accrued interest amounts. |
2
MFS Strategic Income Portfolio
Portfolio Composition – continued
| (m) | | In determining each instrument’s effective maturity for purposes of calculating the fund’s dollar-weighted average effective maturity, MFS uses the instrument’s stated maturity or, if applicable, an earlier date on which MFS believes it is probable that a maturity-shortening device (such as a put, pre-refunding or prepayment) will cause the instrument to be repaid. Such an earlier date can be substantially shorter than the instrument’s stated maturity. |
Where the fund holds convertible bonds, they are treated as part of the equity portion of the portfolio.
The fund invests a portion of its assets in the MFS High Yield Pooled Portfolio. Percentages reflect exposure to the underlying holdings, including Cash & Cash Equivalents and Other, of the MFS High Yield Pooled Portfolio and not to the exposure from investing directly in the MFS High Yield Pooled Portfolio itself.
Cash & Cash Equivalents includes any cash, investments in money market funds, short-term securities, and other assets less liabilities. Please see the Statement of Assets and Liabilities for additional information related to the fund’s cash position and other assets and liabilities.
Other includes equivalent exposure from currency derivatives and/or any offsets to derivative positions and may be negative.
Percentages are based on net assets as of June 30, 2018.
The portfolio is actively managed and current holdings may be different.
3
MFS Strategic Income Portfolio
EXPENSE TABLE
Fund Expenses Borne by the Contract Holders during the Period,
January 1, 2018 through June 30, 2018
As a contract holder of the fund, you incur ongoing costs, including management fees; distribution and/or service (12b-1) fees; and other fund expenses. This example is intended to help you understand your ongoing costs (in dollars) of investing in the fund and to compare these costs with the ongoing costs of investing in other mutual funds.
In addition to the fees and expenses which the fund bears directly, the fund indirectly bears a pro rata share of the fees and expenses of the underlying MFS Pooled Portfolio in which the fund invests. MFS Pooled Portfolios are mutual funds advised by MFS that do not pay management fees to MFS but do incur investment and operating costs. If these transactional and indirect costs were included, your costs would have been higher.
The example is based on an investment of $1,000 invested at the beginning of the period and held for the entire period January 1, 2018 through June 30, 2018.
Actual Expenses
The first line for each share class in the following table provides information about actual account values and actual expenses. You may use the information in this line, together with the amount you invested, to estimate the expenses that you paid over the period. Simply divide your account value by $1,000 (for example, an $8,600 account value divided by $1,000 = 8.6), then multiply the result by the number in the first line under the heading entitled “Expenses Paid During Period” to estimate the expenses you paid on your account during this period.
Hypothetical Example for Comparison Purposes
The second line for each share class in the following table provides information about hypothetical account values and hypothetical expenses based on the fund’s actual expense ratio and an assumed rate of return of 5% per year before expenses, which is not the fund’s actual return. The hypothetical account values and expenses may not be used to estimate the actual ending account balance or expenses you paid for the period. You may use this information to compare the ongoing costs of investing in the fund and other funds. To do so, compare this 5% hypothetical example with the 5% hypothetical examples that appear in the shareholder reports of the other funds.
Please note that the expenses shown in the table are meant to highlight the fund’s ongoing costs only and do not take into account the fees and expenses imposed under the variable contracts through which your investment in the fund is made. Therefore, the second line for each share class in the table is useful in comparing ongoing costs associated with an investment in vehicles (such as the fund) which fund benefits under variable annuity and variable life insurance contracts and to qualified pension and retirement plans only, and will not help you determine the relative total costs of investing in the fund through variable annuity and variable life insurance contracts. If the fees and expenses imposed under the variable contracts were included, your costs would have been higher.
| | | | | | | | | | | | | | | | | | |
| Share Class | | | | Annualized
Expense Ratio | | | Beginning
Account Value
1/01/18 | | | Ending
Account Value
6/30/18 | | | Expenses Paid
During Period (p)
1/01/18-6/30/18 | |
| Initial Class | | Actual | | | 0.80% | | | | $1,000.00 | | | | $974.59 | | | | $3.92 | |
| | Hypothetical (h) | | | 0.80% | | | | $1,000.00 | | | | $1,020.83 | | | | $4.01 | |
| Service Class | | Actual | | | 1.05% | | | | $1,000.00 | | | | $974.36 | | | | $5.14 | |
| | Hypothetical (h) | | | 1.05% | | | | $1,000.00 | | | | $1,019.59 | | | | $5.26 | |
| (h) | 5% class return per year before expenses. |
| (p) | “Expenses Paid During Period” are equal to each class’s annualized expense ratio, as shown above, multiplied by the average account value over the period, multiplied by 181/365 (to reflect the one-half year period). In addition to the fees and expenses which the fund bears directly, the fund indirectly bears a pro rata share of the fees and expenses of the underlying funds in which the fund invests. If these indirect costs were included, your costs would have been higher. |
4
MFS Strategic Income Portfolio
PORTFOLIO OF INVESTMENTS – 6/30/18 (unaudited)
The Portfolio of Investments is a complete list of all securities owned by your fund. It is categorized by broad-based asset classes.
| | | | | | | | |
| Issuer | | Shares/Par | | | Value ($) | |
| BONDS – 79.3% | | | | | | | | |
| Asset-Backed & Securitized – 26.2% | | | | | |
A Voce CLO Ltd., 2014-1A, “BR”, FLR, 4.497% (LIBOR-3mo. +
2.15%), 7/15/2026 (n) | | $ | 290,000 | | | $ | 289,499 | |
| ALM Loan Funding CLO, 2015-16A, “BR2”, 0%, 7/15/2027 (z) | | | 260,000 | | | | 260,000 | |
| Arbor Realty CLO Ltd., 2018-A, “FL-1”, FLR, 3.059% (LIBOR-1mo. + 1.15%), 6/15/2028 (z) | | | 260,000 | | | | 260,017 | |
ARI Fleet Lease Trust, 2016-A, “A2”,
1.82%, 7/15/2024 (n) | | | 15,262 | | | | 15,242 | |
Babson CLO Ltd., 2013-IIA, “BR”, FLR, 3.608% (LIBOR-3mo. +
1.25%), 1/20/2028 (n) | | | 250,000 | | | | 249,970 | |
Babson CLO Ltd., 2014-IIA, “CR”, FLR, 4.552% (LIBOR-3mo. +
2.2%), 10/17/2026 (n) | | | 290,000 | | | | 289,506 | |
| Bancorp Commercial Mortgage Trust, 2018-CR3, “D”, FLR, 4.773% (LIBOR-1mo. + 2.7%), 1/15/2033 (z) | | | 248,157 | | | | 248,824 | |
Bayview Financial Revolving Mortgage Loan Trust, FLR, 3.702% (LIBOR-1mo. +
1.6%), 12/28/2040 (z) | | | 175,236 | | | | 160,055 | |
| Benchmark Mortgage Trust, “2018-B1”, 3.666%, 1/15/2051 | | | 251,384 | | | | 250,594 | |
| Business Jet Securities LLC, 2018-1, “C”, 7.748%, 2/15/2033 (z) | | | 107,696 | | | | 110,704 | |
| Cent CLO LP, 2014-21A, “A2AR”, FLR, 4.065% (LIBOR-3mo. + 1.7%), 7/27/2026 (n) | | | 250,000 | | | | 249,819 | |
| Cent CLO LP, 2014-21A, “BR”, FLR, 4.765% (LIBOR-3mo. + 2.4%), 7/27/2026 (n) | | | 350,000 | | | | 349,499 | |
| Chesapeake Funding II LLC, 2017-2A, | | | | | | | | |
| “C”, 3.01%, 5/15/2029 (n) | | | 215,000 | | | | 213,171 | |
| Citigroup Commercial Mortgage Trust, 2017-C4, 3.471%, 10/12/2050 | | | 173,669 | | | | 170,064 | |
Commercial Mortgage Pass-Through Certificates, “2017-BNK8”, “A3”, 3.229%, 11/15/2050 | | | 250,000 | | | | 240,598 | |
Commercial Mortgage Pass-Through Certificates, “2018-BNK10”, “A5”,
3.688%, 2/15/2061 | | | 250,000 | | | | 248,637 | |
| Commercial Mortgage Trust, 2015-PC1, “A5”, 3.902%, 7/10/2050 | | | 346,107 | | | | 349,688 | |
| Commercial Mortgage Trust, 2017-CD4, “A4”, 3.514%, 5/10/2050 | | | 112,627 | | | | 110,826 | |
| Commercial Mortgage Trust, 2017-COR2, “A3”, 3.51%, 9/10/2050 | | | 250,000 | | | | 244,082 | |
CPS Auto Trust, 2016-D, “B”,
2.11%, 3/15/2021 (n) | | | 215,000 | | | | 213,600 | |
Crest Ltd., CDO, 7%, (0.001% cash or
7% PIK) 1/28/2040 (a)(p) | | | 709,081 | | | | 74,808 | |
| Drive Auto Receivables Trust, 2017-1, “C”, 2.84%, 4/15/2022 | | | 98,000 | | | | 97,851 | |
| | | | | | | | |
| Issuer | | Shares/Par | | | Value ($) | |
| BONDS – continued | | | | | | | | |
| Asset-Backed & Securitized – continued | | | | | |
DT Auto Owner Trust, 2017-2A, “C”,
3.03%, 1/17/2023 (n) | | $ | 215,000 | | | $ | 214,498 | |
DT Auto Owner Trust, 2018-2A, “C”,
3.67%, 3/15/2024 (n) | | | 82,000 | | | | 81,944 | |
Eaton Vance CLO Ltd., 2014-1A, “CR”, FLR, 4.597% (LIBOR-3mo. +
2.25%), 7/15/2026 (n) | | | 300,000 | | | | 299,461 | |
Exantas Capital Corp CLO Ltd., 2018-RS06, “B”, FLR, 3.111% (LIBOR-1mo. +
1.15%), 6/15/2035 (z) | | | 260,000 | | | | 260,000 | |
Falcon Franchise Loan LLC,
7.766%, 1/05/2023 (i)(z) | | | 8,298 | | | | 327 | |
Figueroa CLO Ltd., 2014-1A, “DR”,
0%, 1/15/2027 (w)(z) | | | 250,000 | | | | 250,000 | |
| Flatiron CLO Ltd., 2015-1A, “CR”, FLR, 4.247% (LIBOR-3mo. + 1.9%), 4/15/2027 (n) | | | 260,000 | | | | 259,977 | |
| GMF Floorplan Owner Revolving Trust, 2017-2, “C”, 2.63%, 7/15/2022 (z) | | | 260,000 | | | | 255,702 | |
| GS Mortgage Securities Trust, 2017-GS6, “A3”, 3.433%, 5/10/2050 | | | 177,406 | | | | 173,462 | |
| GS Mortgage Securities Trust, 2017-GS7, “A4”, 3.43%, 8/10/2050 | | | 251,247 | | | | 245,088 | |
| Invitation Homes Trust, 2018-SFR1, “C”, FLR, 3.335% (LIBOR-1mo. + 1.25%), 3/17/2037 (z) | | | 130,000 | | | | 130,158 | |
| JPMorgan Chase Commercial Mortgage Securities Corp., 3.454%, 9/15/2050 | | | 134,136 | | | | 131,309 | |
| JPMorgan Chase Commercial Mortgage Trust, 2007-LD11, “AM”, 6.087%, 6/15/2049 | | | 49,122 | | | | 49,880 | |
| Lehman Brothers Commercial Conduit Mortgage Trust, 1.12%, 2/18/2030 (i) | | | 6,507 | | | | 0 | |
| LoanCore Ltd., 2018-CRE1, “C”, FLR, 4.89% (LIBOR-1mo. + 2.55%), 5/15/2028 (z) | | | 260,000 | | | | 260,322 | |
Morgan Stanley Bank of America Merrill Lynch Trust, 2017-C34, “A4”,
3.536%, 11/15/2052 | | | 250,000 | | | | 245,231 | |
| Morgan Stanley Capital I Trust, 2017-H1, “A5”, 3.53%, 6/15/2050 | | | 187,518 | | | | 184,715 | |
Morgan Stanley Capital I, Inc.,
1.493%, 4/28/2039 (i)(z) | | | 218,363 | | | | 175 | |
Neuberger Berman CLO Ltd., 2016-21A, “CR”, FLR, 3.958% (LIBOR-3mo. +
1.6%), 4/20/2027 (n) | | | 250,000 | | | | 249,794 | |
| NextGear Floorplan Master Owner Trust, 2017-2A, “B”, 3.02%, 10/17/2022 (n) | | | 212,000 | | | | 209,816 | |
| NextGear Floorplan Master Owner Trust, 2018-1A, “B”, 3.57%, 2/15/2023 (z) | | | 200,000 | | | | 199,127 | |
Oaktree CLO Ltd., 2014-2A, “BR”, FLR, 4.908% (LIBOR-3mo. +
2.55%), 10/20/2026 (n) | | | 300,000 | | | | 299,564 | |
| Parallel Ltd., 2015-1A, “DR”, FLR, 4.908% (LIBOR-3mo. + 2.55%, 7/20/2027 (n) | | | 250,000 | | | | 247,654 | |
5
MFS Strategic Income Portfolio
Portfolio of Investments (unaudited) – continued
| | | | | | | | |
| Issuer | | Shares/Par | | | Value ($) | |
| BONDS – continued | | | | | | | | |
| Asset-Backed & Securitized – continued | | | | | |
| Race Point CLO Ltd., 2013-8A, “CR”, FLR, 4.831% (LIBOR-3mo. + 2.5%), 2/20/2030 (n) | | $ | 300,000 | | | $ | 300,360 | |
| Santander Drive Auto Receivables Trust, 2017-2, “C”, 2.79%, 8/15/2022 | | | 214,000 | | | | 212,969 | |
Shackleton CLO Ltd., 2014-6A, “CR”, FLR, 4.602% (LIBOR-3mo. +
2.25%), 7/17/2026 (n) | | | 290,000 | | | | 289,517 | |
| Sierra Receivables Funding Co. LLC, 2015-1A, “A”, 2.4%, 3/22/2032 (n) | | | 41,352 | | | | 41,026 | |
| Silver Spring CLO Ltd., FLR, 5.097% (LIBOR-3mo. + 2.75%), 10/15/2026 (n) | | | 280,000 | | | | 279,938 | |
| UBS Commercial Mortgage Trust 2017-C1, “A4”, 3.544%, 11/15/2050 | | | 251,247 | | | | 246,124 | |
| UBS Commercial Mortgage Trust 2017-C6, “A5”, 3.579%, 12/15/2050 | | | 250,000 | | | | 245,784 | |
| UBS Commercial Mortgage Trust 2017-C7, “A4”, 3.679%, 12/15/2050 | | | 250,000 | | | | 247,315 | |
| UBS Commercial Mortgage Trust 2017-C8, “A4”, 3.983%, 2/15/2051 | | | 250,000 | | | | 253,317 | |
| Voya CLO Ltd., 2013-3A, “BR”, FLR, 4.505% (LIBOR-3mo. + 2.15%), 1/18/2026 (n) | | | 290,000 | | | | 291,355 | |
| Wells Fargo Commercial Mortgage Trust, 2017-C42, “A5”, 3.589%, 12/15/2050 | | | 250,000 | | | | 246,907 | |
| Wells Fargo Commercial Mortgage Trust, 2017-RB1, “A4”, 3.374%, 3/15/2050 | | | 280,000 | | | | 273,211 | |
| West CLO Ltd., 2014-1A, “CR”, FLR, 5.355% (LIBOR-3mo. + 3%), 7/18/2026 (n) | | | 260,000 | | | | 259,990 | |
| | | | | | | | |
| | | | | | $ | 12,133,071 | |
| | | | | | | | |
| Automotive – 0.3% | | | | | |
| General Motors Co., 4.2%, 10/01/2027 | | $ | 134,000 | | | $ | 128,357 | |
| | | | | | | | |
| Broadcasting – 0.3% | | | | | |
| Time Warner, Inc., 3.8%, 2/15/2027 | | $ | 125,000 | | | $ | 118,047 | |
| | | | | | | | |
| Brokerage & Asset Managers – 1.3% | | | | | |
| Charles Schwab Corp., 3.2%, 1/25/2028 | | $ | 228,000 | | | $ | 218,357 | |
| E*TRADE Financial Corp., 4.5%, 6/20/2028 | | | 292,000 | | | | 293,030 | |
Raymond James Financial, Inc.,
4.95%, 7/15/2046 | | | 75,000 | | | | 76,423 | |
| | | | | | | | |
| | | | | | $ | 587,810 | |
| | | | | | | | |
| Building – 0.7% | | | | | |
Martin Marietta Materials, Inc.,
4.25%, 7/02/2024 | | $ | 215,000 | | | $ | 216,948 | |
Martin Marietta Materials, Inc.,
3.5%, 12/15/2027 | | | 115,000 | | | | 106,709 | |
| | | | | | | | |
| | | | | | $ | 323,657 | |
| | | | | | | | |
| Cable TV – 1.1% | | | | | |
Cox Communications, Inc.,
3.5%, 8/15/2027 (n) | | $ | 200,000 | | | $ | 186,052 | |
| Time Warner Cable, Inc., 8.25%, 4/01/2019 | | | 150,000 | | | | 155,585 | |
| Time Warner Cable, Inc., 4.5%, 9/15/2042 | | | 183,000 | | | | 150,362 | |
| | | | | | | | |
| | | | | | $ | 491,999 | |
| | | | | | | | |
| | | | | | | | |
| Issuer | | Shares/Par | | | Value ($) | |
| BONDS – continued | | | | | | | | |
| Computer Software – 2.0% | | | | | |
| Microsoft Corp., 3.125%, 11/03/2025 | | $ | 314,000 | | | $ | 308,475 | |
| Microsoft Corp., 4.25%, 2/06/2047 | | | 295,000 | | | | 312,924 | |
| Oracle Corp., 3.25%, 11/15/2027 | | | 315,000 | | | | 301,195 | |
| | | | | | | | |
| | | | | | $ | 922,594 | |
| | | | | | | | |
| Computer Software – Systems – 0.5% | | | | | |
| Apple, Inc., 4.25%, 2/09/2047 | | $ | 250,000 | | | $ | 253,562 | |
| | | | | | | | |
| Conglomerates – 0.2% | | | | | |
United Technologies Corp.,
4.05%, 5/04/2047 | | $ | 120,000 | | | $ | 109,821 | |
| | | | | | | | |
| Consumer Products – 1.4% | | | | | |
| Reckitt Benckiser Treasury Services PLC, 3.625%, 9/21/2023 (n) | | $ | 259,000 | | | $ | 258,412 | |
| Reckitt Benckiser Treasury Services PLC, 2.75%, 6/26/2024 (n) | | | 401,000 | | | | 378,841 | |
| | | | | | | | |
| | | | | | $ | 637,253 | |
| | | | | | | | |
| Consumer Services – 0.8% | | | | | |
| Priceline Group, Inc., 3.55%, 3/15/2028 | | $ | 242,000 | | | $ | 230,343 | |
Toll Road Investors Partnership II LP,
0%, 2/15/2026 (n) | | | 46,000 | | | | 30,650 | |
Toll Road Investors Partnership II LP,
0%, 2/15/2029 (n) | | | 132,000 | | | | 72,470 | |
Toll Road Investors Partnership II LP,
0%, 2/15/2031 (n) | | | 46,000 | | | | 22,077 | |
| | | | | | | | |
| | | | | | $ | 355,540 | |
| | | | | | | | |
| Emerging Market Quasi-Sovereign – 1.8% | | | | | |
KazMunayGas National Co.,
5.375%, 4/24/2030 (n) | | $ | 200,000 | | | $ | 200,436 | |
| Petroleos del Peru S.A., 5.625%, 6/19/2047 | | | 200,000 | | | | 194,500 | |
PT Perusahaan Listrik Negara,
5.45%, 5/21/2028 (n) | | | 234,000 | | | | 237,693 | |
Southern Gas Corridor CJSC,
6.875%, 3/24/2026 | | | 200,000 | | | | 215,624 | |
| | | | | | | | |
| | | | | | $ | 848,253 | |
| | | | | | | | |
| Emerging Market Sovereign – 5.0% | | | | | |
Arab Republic of Egypt,
6.588%, 2/21/2028 (n) | | $ | 212,000 | | | $ | 194,875 | |
| Government of Ukraine, 7.75%, 9/01/2021 | | | 135,000 | | | | 132,975 | |
| Government of Ukraine, 7.75%, 9/01/2022 | | | 130,000 | | | | 126,915 | |
| Republic of Angola, 8.25%, 5/09/2028 (n) | | | 200,000 | | | | 200,070 | |
| Republic of Argentina, 5.875%, 1/11/2028 | | | 95,000 | | | | 77,188 | |
| Republic of Argentina, 7.125%, 7/06/2036 | | | 150,000 | | | | 120,375 | |
Republic of Cote d’Ivoire,
5.25%, 3/22/2030 (n) | | EUR | 100,000 | | | | 111,492 | |
| Republic of Kenya, 6.875%, 6/24/2024 | | $ | 200,000 | | | | 197,292 | |
| Republic of Paraguay, 5.6%, 3/13/2048 (n) | | | 200,000 | | | | 194,000 | |
Republic of South Africa,
4.875%, 4/14/2026 | | | 212,000 | | | | 203,943 | |
Republic of South Africa,
10.5%, 12/21/2026 | | ZAR | 1,093,000 | | | | 87,272 | |
Republic of South Africa,
5.875%, 6/22/2030 | | $ | 200,000 | | | | 198,278 | |
6
MFS Strategic Income Portfolio
Portfolio of Investments (unaudited) – continued
| | | | | | | | |
| Issuer | | Shares/Par | | | Value ($) | |
| BONDS – continued | | | | | | | | |
| Emerging Market Sovereign – continued | | | | | |
| Republic of South Africa, 7%, 2/28/2031 | | ZAR | 960,000 | | | $ | 58,060 | |
Republic of Sri Lanka,
5.75%, 4/18/2023 (n) | | $ | 200,000 | | | | 191,482 | |
| Republic of Turkey, 7.375%, 2/05/2025 | | | 218,000 | | | | 225,412 | |
| | | | | | | | |
| | | | | | $ | 2,319,629 | |
| | | | | | | | |
| Energy – Independent – 0.5% | | | | | | | | |
Canadian Oil Sands Co.,
7.75%, 5/15/2019 (z) | | $ | 126,000 | | | $ | 129,768 | |
Canadian Oil Sands Co.,
4.5%, 4/01/2022 (z) | | | 118,000 | | | | 120,123 | |
| | | | | | | | |
| | | | | | $ | 249,891 | |
| | | | | | | | |
| Energy – Integrated – 0.5% | | | | | | | | |
Shell International Finance B.V.,
2.875%, 5/10/2026 | | $ | 225,000 | | | $ | 213,813 | |
| | | | | | | | |
| Food & Beverages – 2.4% | | | | | | | | |
| Anheuser Busch InBev Worldwide, Inc., 4.439%, 10/06/2048 | | $ | 125,491 | | | $ | 120,763 | |
| Anheuser-Busch InBev Worldwide, Inc., 3.75%, 1/15/2022 | | | 205,000 | | | | 207,784 | |
| Anheuser-Busch InBev Worldwide, Inc., 3.3%, 2/01/2023 | | | 154,000 | | | | 152,712 | |
| General Mills, Inc., 4.55%, 4/17/2038 | | | 311,000 | | | | 296,774 | |
| Kraft Foods Group, Inc., 5%, 6/04/2042 | | | 269,000 | | | | 256,817 | |
Wm. Wrigley Jr. Co.,
3.375%, 10/21/2020 (n) | | | 81,000 | | | | 81,223 | |
| | | | | | | | |
| | | | | | $ | 1,116,073 | |
| | | | | | | | |
| Insurance – 1.2% | | | | | | | | |
American International Group, Inc.,
3.75%, 7/10/2025 | | $ | 168,000 | | | $ | 162,276 | |
American International Group, Inc.,
3.9%, 4/01/2026 | | | 294,000 | | | | 284,527 | |
American International Group, Inc.,
4.7%, 7/10/2035 | | | 59,000 | | | | 57,397 | |
American International Group, Inc.,
4.5%, 7/16/2044 | | | 53,000 | | | | 49,355 | |
| | | | | | | | |
| | | | | | $ | 553,555 | |
| | | | | | | | |
| Insurance – Health – 0.4% | | | | | | | | |
UnitedHealth Group, Inc.,
3.75%, 10/15/2047 | | $ | 220,000 | | | $ | 202,209 | |
| | | | | | | | |
| Insurance – Property & Casualty – 0.6% | | | | | |
| Allied World Assurance Co. Holdings Ltd., 4.35%, 10/29/2025 | | $ | 310,000 | | | $ | 301,591 | |
| | | | | | | | |
| International Market Quasi-Sovereign – 0.6% | | | | | |
Dexia Credit Local S.A.,
2.25%, 2/18/2020 (n) | | $ | 270,000 | | | $ | 267,280 | |
| | | | | | | | |
| Machinery & Tools – 0.3% | | | | | | | | |
CNH Industrial Capital LLC,
3.85%, 11/15/2027 | | $ | 145,000 | | | $ | 135,223 | |
| | | | | | | | |
| | | | | | | | |
| Issuer | | Shares/Par | | | Value ($) | |
| BONDS – continued | | | | | | | | |
| Major Banks – 7.6% | | | | | | | | |
| Bank of America Corp., 2.151%, 11/09/2020 | | $ | 100,000 | | | $ | 97,696 | |
| Bank of America Corp., 4.125%, 1/22/2024 | | | 75,000 | | | | 76,234 | |
| Bank of America Corp., 3.248%, 10/21/2027 | | | 656,000 | | | | 611,373 | |
| Bank of New York Mellon Corp., 3.5%, 4/28/2023 | | | 329,000 | | | | 329,144 | |
| Barclays PLC, 3.25%, 1/12/2021 | | | 224,000 | | | | 220,791 | |
| Credit Suisse Group AG, 3.574%, 1/09/2023 (n) | | | 250,000 | | | | 244,883 | |
| Credit Suisse Group AG, 3.869%, 1/12/2029 (n) | | | 250,000 | | | | 235,082 | |
| ING Bank N.V., 5.8%, 9/25/2023 (n) | | | 322,000 | | | | 341,202 | |
| JPMorgan Chase & Co., 3.125%, 1/23/2025 | | | 120,000 | | | | 114,757 | |
| JPMorgan Chase & Co., 3.882% to 7/24/2037, FLR to 7/24/2038 | | | 269,000 | | | | 248,447 | |
| Morgan Stanley, 3.7%, 10/23/2024 | | | 277,000 | | | | 273,467 | |
| Morgan Stanley, 3.625%, 1/20/2027 | | | 317,000 | | | | 304,392 | |
| Royal Bank of Scotland Group, PLC, FLR, 4.892% (LIBOR-3mo. + 1.754%), 5/18/2029 | | | 233,000 | | | | 231,963 | |
| UBS Group Funding (Switzerland) AG, 4.253%, 3/23/2028 (n) | | | 215,000 | | | | 213,619 | |
| | | | | | | | |
| | | | | | $ | 3,543,050 | |
| | | | | | | | |
| Medical & Health Technology & Services – 0.7% | | | | | |
| Becton, Dickinson and Co., 3.734%, 12/15/2024 | | $ | 318,000 | | | $ | 310,448 | |
| | | | | | | | |
| Metals & Mining – 0.9% | | | | | | | | |
| Glencore Funding LLC, 4.125%, 5/30/2023 (n) | | $ | 164,000 | | | $ | 163,641 | |
| Glencore Funding LLC, 4%, 4/16/2025 (n) | | | 84,000 | | | | 80,829 | |
| Glencore Funding LLC, 3.875%, 10/27/2027 (n) | | | 167,000 | | | | 154,319 | |
| | | | | | | | |
| | | | | | $ | 398,789 | |
| | | | | | | | |
| Midstream – 1.4% | | | | | | | | |
| Kinder Morgan Energy Partners LP, 6.375%, 3/01/2041 | | $ | 320,000 | | | $ | 343,396 | |
| MPLX LP, 4%, 3/15/2028 | | | 315,000 | | | | 299,589 | |
| | | | | | | | |
| | | | | | $ | 642,985 | |
| | | | | | | | |
| Mortgage-Backed – 0.6% | | | | | | | | |
| Fannie Mae, 5.5%, 3/01/2020 -9/01/2034 | | $ | 15,834 | | | $ | 16,864 | |
| Fannie Mae, 6.5%, 4/01/2032 | | | 21,459 | | | | 23,778 | |
| Freddie Mac, 4.224%, 3/25/2020 | | | 239,193 | | | | 243,982 | |
| | | | | | | | |
| | | | | | $ | 284,624 | |
| | | | | | | | |
| Municipals – 0.6% | | | | | | | | |
| New Jersey Economic Development | | | | | | | | |
| Authority State Pension Funding Rev., | | | | | | | | |
| Capital Appreciation, “B”, AGM, 0%, 2/15/2023 | | $ | 350,000 | | | $ | 295,158 | |
| | | | | | | | |
| Network & Telecom – 0.8% | | | | | | | | |
| AT&T, Inc., 5.45%, 3/01/2047 | | $ | 361,000 | | | $ | 354,353 | |
| | | | | | | | |
| Oils – 0.7% | | | | | | | | |
| Andeavor, 3.8%, 4/01/2028 | | $ | 67,000 | | | $ | 63,280 | |
| Phillips 66, 4.875%, 11/15/2044 | | | 277,000 | | | | 286,139 | |
| | | | | | | | |
| | | | | | $ | 349,419 | |
| | | | | | | | |
7
MFS Strategic Income Portfolio
Portfolio of Investments (unaudited) – continued
| | | | | | | | |
| Issuer | | Shares/Par | | | Value ($) | |
| BONDS – continued | | | | | | | | |
| Other Banks & Diversified Financials – 0.7% | | | | | |
| Compass Bank, 2.875%, 6/29/2022 | | $ | 250,000 | | | $ | 241,343 | |
| JSC Kazkommertsbank, 5.5%, 12/21/2022 | | | 99,000 | | | | 98,713 | |
| | | | | | | | |
| | | | | | $ | 340,056 | |
| | | | | | | | |
| Pharmaceuticals – 1.5% | | | | | | | | |
| Actavis Funding SCS, 3.8%, 3/15/2025 | | $ | 179,000 | | | $ | 173,817 | |
| Gilead Sciences, Inc., 3.65%, 3/01/2026 | | | 209,000 | | | | 206,343 | |
| Johnson & Johnson, 2.9%, 1/15/2028 | | | 314,000 | | | | 299,703 | |
| | | | | | | | |
| | | | | | $ | 679,863 | |
| | | | | | | | |
| Supranational – 0.8% | | | | | | | | |
| Corporacion Andina de Fomento, 4.375%, 6/15/2022 | | $ | 340,000 | | | $ | 351,727 | |
| | | | | | | | |
| Telecommunications – Wireless – 1.5% | | | | | |
| American Tower Corp., REIT, 3.55%, 7/15/2027 | | $ | 358,000 | | | $ | 332,962 | |
| American Tower Corp., REIT, 3.6%, 1/15/2028 | | | 125,000 | | | | 115,821 | |
| Vodafone Group PLC, 5.25%, 5/30/2048 | | | 259,000 | | | | 258,283 | |
| | | | | | | | |
| | | | | | $ | 707,066 | |
| | | | | | | | |
| Tobacco – 0.8% | | | | | | | | |
| B.A.T. Capital Corp., 3.557%, 8/15/2027 (n) | | $ | 384,000 | | | $ | 357,274 | |
| | | | | | | | |
| U.S. Government Agencies and Equivalents – 0.3% | |
| Small Business Administration, 6.35%, 4/01/2021 | | $ | 2,058 | | | $ | 2,114 | |
| Small Business Administration, 4.77%, 4/01/2024 | | | 23,998 | | | | 24,612 | |
| Small Business Administration, 4.99%, 9/01/2024 | | | 17,848 | | | | 18,416 | |
| Small Business Administration, 4.86%, 1/01/2025 | | | 24,036 | | | | 24,684 | |
| Small Business Administration, 4.625%, 2/01/2025 | | | 31,233 | | | | 31,925 | |
| Small Business Administration, 5.11%, 8/01/2025 | | | 25,210 | | | | 25,970 | |
| | | | | | | | |
| | | | | | $ | 127,721 | |
| | | | | | | | |
| U.S. Treasury Obligations – 11.8% | | | | | | | | |
| U.S. Treasury Bonds, 4.75%, 2/15/2037 | | $ | 54,000 | | | $ | 68,439 | |
| U.S. Treasury Bonds, 2.5%, 2/15/2045 (f) | | | 748,000 | | | | 681,995 | |
| U.S. Treasury Notes, 1.625%, 3/15/2020 | | | 3,450,000 | | | | 3,398,789 | |
| U.S. Treasury Notes, 1.75%, 11/30/2021 | | | 530,000 | | | | 514,348 | |
| | | | | | | | |
| Issuer | | Shares/Par | | | Value ($) | |
| BONDS – continued | | | | | | | | |
| U.S. Treasury Obligations – continued | | | | | |
| U.S. Treasury Notes, 1.75%, 2/28/2022 | | $ | 843,000 | | | $ | 815,701 | |
| | | | | | | | |
| | | | | | $ | 5,479,272 | |
| | | | | | | | |
| Utilities – Electric Power – 0.5% | | | | | | | | |
| Enel Finance International N.V., 3.625%, 5/25/2027 (n) | | $ | 280,000 | | | $ | 256,120 | |
| | | | | | | | |
Total Bonds
(Identified Cost, $37,898,802) | | | | | | $ | 36,747,153 | |
| | | | | | | | |
|
| COMMON STOCKS – 0.0% | |
| Energy – Independent – 0.0% | |
Frontera Energy Corp. (a)(l)
(Identified Cost, $106,984) | | | 1,188 | | | $ | 17,256 | |
| | | | | | | | |
|
| INVESTMENT COMPANIES (h) – 20.1% | |
| Bond Funds – 19.8% | |
| MFS High Yield Pooled Portfolio (v) | | | 1,019,907 | | | $ | 9,168,959 | |
| | | | | | | | |
| Money Market Funds – 0.3% | |
| MFS Institutional Money Market Portfolio, 1.9% (v) | | | 141,608 | | | $ | 141,608 | |
| | | | | | | | |
Total Investment Companies
(Identified Cost, $10,563,869) | | | | | | $ | 9,310,567 | |
| | | | | | | | |
| | | | | | | | | | | | | | | | | | | | |
Underlying/
Expiration
Date/
Exercise
Price | | Put/
Call | | | Counter-
party | | | Notional
Amount | | | Par
Amount/
Number of
Contracts | | | | |
| PURCHASED OPTIONS – 0.0% | | | | | |
| U.S. Treasury Obligations – 0.0% | | | | | |
| U.S. Treasury Note 10 yr Future – August 2018 @ $117 (Premiums Paid, $24,610) | | | Put | | |
| Merrill Lynch
International |
| | $ | 9,374,625 | | | | 78 | | | $ | 3,656 | |
| | | | | | | | | | | | | | | | | | | | |
| | | | | | | | |
| Issuer | | Shares/Par | | | | |
| COLLATERAL FOR SECURITIES LOANED – 0.0% | |
| State Street Navigator Securities Lending Government Money Market Portfolio, 1.9% (j) (Identified Cost, $28) | | | 28 | | | $ | 28 | |
| | | | | | | | |
OTHER ASSETS, LESS
LIABILITIES – 0.6% | | | | | | | 277,295 | |
| | | | | | | | |
| NET ASSETS – 100.0% | | | | | | $ | 46,355,955 | |
| | | | | | | | |
| (a) | | Non-income producing security. |
| (f) | | All or a portion of the security has been segregated as collateral for open futures contracts. |
| (h) | | An affiliated issuer, which may be considered one in which the fund owns 5% or more of the outstanding voting securities, or a company which is under common control. At period end, the aggregate values of the fund’s investments in affiliated issuers and in unaffiliated issuers were $9,310,567 and $36,768,093, respectively. |
| (i) | | Interest only security for which the fund receives interest on notional principal (Par amount). Par amount shown is the notional principal and does not reflect the cost of the security. |
| (j) | | The rate quoted is the annualized seven-day yield of the fund at period end. |
| (l) | | A portion of this security is on loan. |
| (n) | | Securities exempt from registration under Rule 144A of the Securities Act of 1933. These securities may be sold in the ordinary course of business in transactions exempt from registration, normally to qualified institutional buyers. At period end, the aggregate value of these securities was $9,869,222, representing 21.3% of net assets. |
8
MFS Strategic Income Portfolio
Portfolio of Investments (unaudited) – continued
| (p) | | Payment-in-kind security for which interest income may be received in additional securities and/or cash. |
| (v) | | Affiliated issuer that is available only to investment companies managed by MFS. The rate quoted for the MFS Institutional Money Market Portfolio is the annualized seven-day yield of the fund at period end. |
| (w) | | When-issued security. At June 30, 2018, the fund had sufficient cash and/or securities at least equal to the value of the when-issued security. |
| (z) | | Restricted securities are not registered under the Securities Act of 1933 and are subject to legal restrictions on resale. These securities generally may be resold in transactions exempt from registration or to the public if the securities are subsequently registered. Disposal of these securities may involve time-consuming negotiations and prompt sale at an acceptable price may be difficult. The fund holds the following restricted securities: |
| | | | | | | | | | |
| Restricted Securities | | Acquisition
Date | | Cost | | | Value | |
| ALM Loan Funding CLO, 2015-16A, “BR2”, 0%, 7/15/2027 | | 6/20/18 | | | $260,000 | | | | $260,000 | |
| Arbor Realty CLO Ltd., 2018-A, “FL-1”, FLR, 3.059% (LIBOR-1mo. + 1.15%), 6/15/2028 | | 5/23/18 | | | 260,000 | | | | 260,017 | |
| Bancorp Commercial Mortgage Trust, 2018-CR3, “D”, FLR, 4.773% (LIBOR-1mo. + 2.7%), 1/15/2033 | | 3/13/18 | | | 248,157 | | | | 248,824 | |
| Bayview Financial Revolving Mortgage Loan Trust, FLR, 3.702% (LIBOR-1mo. + 1.6%), 12/28/2040 | | 3/01/06 | | | 175,235 | | | | 160,055 | |
| Business Jet Securities LLC, 2018-1, “C”, 7.748%, 2/15/2033 | | 2/21/18 | | | 107,694 | | | | 110,704 | |
| Canadian Oil Sands Co., 7.75%, 5/15/2019 | | 9/29/17 | | | 131,525 | | | | 129,768 | |
| Canadian Oil Sands Co., 4.5%, 4/01/2022 | | 10/26/17 | | | 122,555 | | | | 120,123 | |
| Exantas Capital Corp CLO Ltd., 2018-RS06, “B”, FLR, 3.111% (LIBOR-1mo. + 1.15%), 6/15/2035 | | 6/07/18 | | | 260,000 | | | | 260,000 | |
| Falcon Franchise Loan LLC, 7.766%, 1/05/2023 | | 1/18/02 | | | 327 | | | | 327 | |
| Figueroa CLO Ltd., 2014-1A, “DR”, 0%, 1/15/2027 | | 6/28/18 | | | 250,000 | | | | 250,000 | |
| GMF Floorplan Owner Revolving Trust, 2017-2, “C”, 2.63%, 7/15/2022 | | 8/15/17 | | | 259,949 | | | | 255,702 | |
| Invitation Homes Trust, 2018-SFR1, “C”, FLR, 3.335% (LIBOR-1mo. + 1.25%), 3/17/2037 | | 2/26/18 | | | 130,000 | | | | 130,158 | |
| LoanCore Ltd., 2018-CRE1, “C”, FLR, 4.89% (LIBOR-1mo. + 2.55%), 5/15/2028 | | 5/18/18 | | | 260,015 | | | | 260,322 | |
| Morgan Stanley Capital I, Inc., 1.493%, 4/28/2039 | | 7/20/04 | | | 175 | | | | 175 | |
| NextGear Floorplan Master Owner Trust, 2018-1A, “B”, 3.57%, 2/15/2023 | | 3/06/18 | | | 199,983 | | | | 199,127 | |
| Total Restricted Securities | | | | | | | | | $2,645,302 | |
| % of Net assets | | | | | | | | | 5.7% | |
The following abbreviations are used in this report and are defined:
| AGM | | Assured Guaranty Municipal |
| CDO | | Collateralized Debt Obligation |
| CJSC | | Closed Joint Stock Company |
| CLO | | Collateralized Loan Obligation |
| FLR | | Floating Rate. Interest rate resets periodically based on the parenthetically disclosed reference rate plus a spread (if any). The period-end rate reported may not be the current rate. |
| PLC | | Public Limited Company |
| REIT | | Real Estate Investment Trust |
Abbreviations indicate amounts shown in currencies other than the U.S. dollar. All amounts are stated in U.S. dollars unless otherwise indicated. A list of abbreviations is shown below:
9
MFS Strategic Income Portfolio
Portfolio of Investments (unaudited) – continued
Derivative Contracts at 6/30/18
Forward Foreign Currency Exchange Contracts
| | | | | | | | | | | | | | | | | | | | |
| Currency Purchased | | Currency Sold | | Counterparty | | Settlement Date | | | Unrealized
Appreciation
(Depreciation) | |
| Asset Derivatives | | | | | | | | | | | | |
| MXN | | | 21 | | | | | USD | | 1 | | Barclays Bank PLC | | | 7/27/2018 | | | | $0 | |
| USD | | | 118,299 | | | | | EUR | | 100,000 | | JPMorgan Chase Bank N.A. | | | 7/27/2018 | | | | 1,317 | |
| | | | | | | | | | | | | | | | | | | | |
| | | | | | | | | | | | | | | | | | | $1,317 | |
| | | | | | | | | | | | | | | | | | | | |
| Liability Derivatives | | | | | | | | | | | | |
| ZAR | | | 101,680 | | | | | USD | | 7,952 | | JPMorgan Chase Bank N.A. | | | 7/27/2018 | | | | $(562 | ) |
| | | | | | | | | | | | | | | | | | | | |
Futures Contracts
| | | | | | | | | | | | | | | | | | | | | | |
| Description | | Long/
Short | | | Currency | | | Contracts | | Notional
Amount | | | Expiration
Date | | | Value/Unrealized
Appreciation
(Depreciation) | |
| Asset Derivatives | | | | | | | | | | | | | | | | | | | | | | |
| Interest Rate Futures | | | | | | | | | | | | | | | | | | | | | | |
| U.S. Treasury Bond 30 yr | | | Long | | | | USD | | | 15 | | | $2,175,000 | | | | September - 2018 | | | | $7,445 | |
| U.S. Treasury Ultra 10 yr | | | Long | | | | USD | | | 6 | | | 957,375 | | | | September - 2018 | | | | 7,522 | |
| U.S. Treasury Ultra 10 yr | | | Short | | | | USD | | | 39 | | | 5,001,141 | | | | September - 2018 | | | | 745 | |
| | | | | | | | | | | | | | | | | | | | | | |
| | | | | | | | | | | | | | | | | | | | | $15,712 | |
| | | | | | | | | | | | | | | | | | | | | | |
| Liability Derivatives | | | | | | | | | | | | | | | | | | | | | | |
| Interest Rate Futures | | | | | | | | | | | | | | | | | | | | | | |
| U.S. Treasury Note 2 yr | | | Long | | | | USD | | | 21 | | | $4,448,391 | | | | September - 2018 | | | | $(11,652 | ) |
| U.S. Treasury Note 5 yr | | | Long | | | | USD | | | 15 | | | 1,704,258 | | | | September - 2018 | | | | (4,041 | ) |
| | | | | | | | | | | | | | | | | | | | | | |
| | | | | | | | | | | | | | | | | | | | | $(15,693 | ) |
| | | | | | | | | | | | | | | | | | | | | | |
At June 30, 2018, the fund had liquid securities with an aggregate value of $40,117 to cover any collateral or margin obligations for certain derivative contracts.
See Notes to Financial Statements
10
MFS Strategic Income Portfolio
FINANCIAL STATEMENTS | STATEMENT OF ASSETS AND LIABILITIES (unaudited)
This statement represents your fund’s balance sheet, which details the assets and liabilities comprising the total value of the fund.
| | | | |
At 6/30/18 | | | | |
Assets | | | | |
Investments in unaffiliated issuers, at value, including $29 of securities on loan (identified cost, $38,030,424) | | | $36,768,093 | |
Investments in affiliated issuers, at value (identified cost, $10,563,869) | | | 9,310,567 | |
Receivables for | | | | |
Forward foreign currency exchange contracts | | | 1,317 | |
Investments sold | | | 294,203 | |
Fund shares sold | | | 3,238 | |
Interest | | | 305,053 | |
Receivable from investment adviser | | | 6,018 | |
Other assets | | | 335 | |
Total assets | | | $46,688,824 | |
Liabilities | | | | |
Payables for | | | | |
Forward foreign currency exchange contracts | | | $562 | |
Daily variation margin on open futures contracts | | | 908 | |
Investments purchased | | | 37 | |
When-issued investments purchased | | | 250,000 | |
Fund shares reacquired | | | 26,476 | |
Collateral for securities loaned, at value | | | 28 | |
Payable to affiliates | | | | |
Shareholder servicing costs | | | 51 | |
Distribution and/or service fees | | | 136 | |
Payable for independent Trustees’ compensation | | | 111 | |
Accrued expenses and other liabilities | | | 54,560 | |
Total liabilities | | | $332,869 | |
Net assets | | | $46,355,955 | |
Net assets consist of | | | | |
Paid-in capital | | | $46,813,925 | |
Unrealized appreciation (depreciation) | | | (2,515,083 | ) |
Accumulated net realized gain (loss) | | | (475,001 | ) |
Undistributed net investment income | | | 2,532,114 | |
Net assets | | | $46,355,955 | |
Shares of beneficial interest outstanding | | | 4,838,093 | |
| | | | | | | | | | | | |
| | | Net assets | | | Shares
outstanding | | | Net asset value
per share | |
Initial Class | | | $39,744,041 | | | | 4,142,326 | | | | $9.59 | |
Service Class | | | 6,611,914 | | | | 695,767 | | | | 9.50 | |
See Notes to Financial Statements
11
MFS Strategic Income Portfolio
FINANCIAL STATEMENTS | STATEMENT OF OPERATIONS (unaudited)
This statement describes how much your fund earned in investment income and accrued in expenses. It also describes any gains and/or losses generated by fund operations.
| | | | |
Six months ended 6/30/18 | | | | |
Net investment income (loss) | | | | |
Income | | | | |
Interest | | | $652,067 | |
Dividends from affiliated issuers | | | 283,427 | |
Other | | | 168 | |
Income on securities loaned | | | 1 | |
Foreign taxes withheld | | | (881 | ) |
Total investment income | | | $934,782 | |
Expenses | | | | |
Management fee | | | $165,427 | |
Distribution and/or service fees | | | 8,560 | |
Shareholder servicing costs | | | 5,852 | |
Administrative services fee | | | 8,679 | |
Independent Trustees’ compensation | | | 632 | |
Custodian fee | | | 5,029 | |
Shareholder communications | | | 6,484 | |
Audit and tax fees | | | 38,648 | |
Legal fees | | | 612 | |
Miscellaneous | | | 8,742 | |
Total expenses | | | $248,665 | |
Reduction of expenses by investment adviser | | | (50,860 | ) |
Net expenses | | | $197,805 | |
Net investment income (loss) | | | $736,977 | |
Realized and unrealized gain (loss) | | | | |
Realized gain (loss) (identified cost basis) | | | | |
Unaffiliated issuers | | | $(125,562 | ) |
Affiliated issuers | | | (87,350 | ) |
Futures contracts | | | 22,099 | |
Forward foreign currency exchange contracts | | | 772 | |
Foreign currency | | | (458 | ) |
Net realized gain (loss) | | | $(190,499 | ) |
Change in unrealized appreciation or depreciation | | | | |
Unaffiliated issuers | | | $(1,490,034 | ) |
Affiliated issuers | | | (270,929 | ) |
Futures contracts | | | (1,118 | ) |
Forward foreign currency exchange contracts | | | 1,308 | |
Translation of assets and liabilities in foreign currencies | | | (257 | ) |
Net unrealized gain (loss) | | | $(1,761,030 | ) |
Net realized and unrealized gain (loss) | | | $(1,951,529 | ) |
Change in net assets from operations | | | $(1,214,552 | ) |
See Notes to Financial Statements
12
MFS Strategic Income Portfolio
FINANCIAL STATEMENTS | STATEMENTS OF CHANGES IN NET ASSETS
These statements describe the increases and/or decreases in net assets resulting from operations, any distributions, and any shareholder transactions.
| | | | | | | | |
| | | Six months ended
6/30/18
(unaudited) | | | Year ended
12/31/17 | |
Change in net assets | | | | | | | | |
From operations | | | | | | | | |
Net investment income (loss) | | | $736,977 | | | | $1,730,642 | |
Net realized gain (loss) | | | (190,499 | ) | | | 620,201 | |
Net unrealized gain (loss) | | | (1,761,030 | ) | | | 746,622 | |
Change in net assets from operations | | | $(1,214,552 | ) | | | $3,097,465 | |
Distributions declared to shareholders | | | | | | | | |
From net investment income | | | $— | | | | $(2,356,097 | ) |
Change in net assets from fund share transactions | | | $(2,126,180 | ) | | | $(4,011,928 | ) |
Total change in net assets | | | $(3,340,732 | ) | | | $(3,270,560 | ) |
Net assets | | | | | | | | |
At beginning of period | | | 49,696,687 | | | | 52,967,247 | |
At end of period (including undistributed net investment income of $2,532,114 and
$1,795,137, respectively) | | | $46,355,955 | | | | $49,696,687 | |
See Notes to Financial Statements
13
MFS Strategic Income Portfolio
FINANCIAL STATEMENTS | FINANCIAL HIGHLIGHTS
The financial highlights table is intended to help you understand the fund’s financial performance for the semiannual period and the past 5 fiscal years. Certain information reflects financial results for a single fund share. The total returns in the table represent the rate that an investor would have earned (or lost) on an investment in the fund share class (assuming reinvestment of all distributions) held for the entire period.
| | | | | | | | | | | | | | | | | | | | | | | | |
| Initial Class | | Six months ended
6/30/18 | | | Year ended | |
| | | | 12/31/17 | | | 12/31/16 | | | 12/31/15 | | | 12/31/14 | | | 12/31/13 | |
| | | (unaudited) | | | | | | | | | | | | | | | | |
Net asset value, beginning of period | | | $9.84 | | | | $9.71 | | | | $9.25 | | | | $10.01 | | | | $10.01 | | | | $10.19 | |
| Income (loss) from investment operations | | | | | | | | | | | | | | | | | | | | | |
Net investment income (loss) (d) | | | $0.15 | | | | $0.34 | | | | $0.40 | (c) | | | $0.37 | | | | $0.41 | | | | $0.42 | |
Net realized and unrealized gain (loss) | | | (0.40 | ) | | | 0.26 | | | | 0.37 | | | | (0.55 | ) | | | (0.08 | ) | | | (0.28 | ) |
Total from investment operations | | | $(0.25 | ) | | | $0.60 | | | | $0.77 | | | | $(0.18 | ) | | | $0.33 | | | | $0.14 | |
| Less distributions declared to shareholders | | | | | | | | | | | | | | | | | | | | | |
From net investment income | | | $— | | | | $(0.47 | ) | | | $(0.31 | ) | | | $(0.58 | ) | | | $(0.33 | ) | | | $(0.32 | ) |
Net asset value, end of period (x) | | | $9.59 | | | | $9.84 | | | | $9.71 | | | | $9.25 | | | | $10.01 | | | | $10.01 | |
Total return (%) (k)(r)(s)(x) | | | (2.54 | )(n) | | | 6.24 | | | | 8.24 | (c) | | | (1.85 | ) | | | 3.27 | | | | 1.46 | |
Ratios (%) (to average net assets)
and Supplemental data: | | | | | | | | | | | | | | | | | | | | | | | | |
Expenses before expense reductions (f)(h) | | | 1.02 | (a) | | | 1.02 | | | | 0.89 | (c) | | | 0.96 | | | | 0.94 | | | | 1.00 | |
Expenses after expense reductions (f)(h) | | | 0.80 | (a) | | | 0.80 | | | | 0.71 | (c) | | | 0.80 | | | | 0.80 | | | | 0.85 | |
Net investment income (loss) | | | 3.16 | (a) | | | 3.39 | | | | 4.09 | (c) | | | 3.74 | | | | 4.05 | | | | 4.18 | |
Portfolio turnover | | | 30 | (n) | | | 72 | | | | 21 | | | | 31 | | | | 21 | | | | 28 | |
Net assets at end of period (000 omitted) | | | $39,744 | | | | $42,409 | | | | $44,191 | | | | $47,422 | | | | $59,824 | | | | $63,319 | |
| | |
| Service Class | | Six months
ended 6/30/18 | | | Year ended | |
| | | | 12/31/17 | | | 12/31/16 | | | 12/31/15 | | | 12/31/14 | | | 12/31/13 | |
| | | (unaudited) | | | | | | | | | | | | | | | | |
Net asset value, beginning of period | | | $9.75 | | | | $9.63 | | | | $9.17 | | | | $9.92 | | | | $9.93 | | | | $10.12 | |
| Income (loss) from investment operations | | | | | | | | | | | | | | | | | | | | | |
Net investment income (loss) (d) | | | $0.14 | | | | $0.31 | | | | $0.37 | (c) | | | $0.34 | | | | $0.39 | | | | $0.39 | |
Net realized and unrealized gain (loss) | | | (0.39 | ) | | | 0.25 | | | | 0.37 | | | | (0.54 | ) | | | (0.09 | ) | | | (0.28 | ) |
Total from investment operations | | | $(0.25 | ) | | | $0.56 | | | | $0.74 | | | | $(0.20 | ) | | | $0.30 | | | | $0.11 | |
| Less distributions declared to shareholders | | | | | | | | | | | | | | | | | | | | | |
From net investment income | | | $— | | | | $(0.44 | ) | | | $(0.28 | ) | | | $(0.55 | ) | | | $(0.31 | ) | | | $(0.30 | ) |
Net asset value, end of period (x) | | | $9.50 | | | | $9.75 | | | | $9.63 | | | | $9.17 | | | | $9.92 | | | | $9.93 | |
Total return (%) (k)(r)(s)(x) | | | (2.56 | )(n) | | | 5.88 | | | | 8.00 | (c) | | | (2.06 | ) | | | 2.99 | | | | 1.18 | |
Ratios (%) (to average net assets)
and Supplemental data: | | | | | | | | | | | | | | | | | | | | | | | | |
Expenses before expense reductions (f)(h) | | | 1.27 | (a) | | | 1.27 | | | | 1.14 | (c) | | | 1.21 | | | | 1.19 | | | | 1.25 | |
Expenses after expense reductions (f)(h) | | | 1.05 | (a) | | | 1.05 | | | | 0.97 | (c) | | | 1.05 | | | | 1.05 | | | | 1.10 | |
Net investment income (loss) | | | 2.90 | (a) | | | 3.16 | | | | 3.83 | (c) | | | 3.49 | | | | 3.80 | | | | 3.93 | |
Portfolio turnover | | | 30 | (n) | | | 72 | | | | 21 | | | | 31 | | | | 21 | | | | 28 | |
Net assets at end of period (000 omitted) | | | $6,612 | | | | $7,287 | | | | $8,776 | | | | $9,548 | | | | $10,719 | | | | $11,829 | |
See Notes to Financial Statements
14
MFS Strategic Income Portfolio
Financial Highlights – continued
| (c) | Amount reflects a one-time reimbursement of expenses by the custodian (or former custodian) without which net investment income and performance would be lower and expenses would be higher. |
| (d) | Per share data is based on average shares outstanding. |
| (f) | Ratios do not reflect reductions from fees paid indirectly, if applicable. |
| (h) | In addition to the fees and expenses which the fund bears directly, the fund indirectly bears a pro rata share of the fees and expenses of the underlying affiliated funds in which the fund invests. Accordingly, the expense ratio for the fund reflects only those fees and expenses borne directly by the fund. Because the underlying affiliated funds have varied expense and fee levels and the fund may own different proportions of the underlying affiliated funds at different times, the amount of fees and expenses incurred indirectly by the fund will vary. |
| (k) | The total return does not reflect expenses that apply to separate accounts. Inclusion of these charges would reduce the total return figures for all periods shown. |
| (r) | Certain expenses have been reduced without which performance would have been lower. |
| (s) | From time to time the fund may receive proceeds from litigation settlements, without which performance would be lower. |
| (x) | The net asset values and total returns have been calculated on net assets which include adjustments made in accordance with U.S. generally accepted accounting principles required at period end for financial reporting purposes. |
See Notes to Financial Statements
15
MFS Strategic Income Portfolio
NOTES TO FINANCIAL STATEMENTS (unaudited)
| (1) | | Business and Organization |
MFS Strategic Income Portfolio (the fund) is a diversified series of MFS Variable Insurance Trust II (the trust). The trust is organized as a Massachusetts business trust and is registered under the Investment Company Act of 1940, as amended, as an open-end management investment company. The shareholders of each series of the trust are separate accounts of insurance companies, which offer variable annuity and/or life insurance products, and qualified retirement and pension plans.
The fund is an investment company and accordingly follows the investment company accounting and reporting guidance of the Financial Accounting Standards Board (FASB) Accounting Standards Codification Topic 946 Financial Services – Investment Companies.
| (2) | | Significant Accounting Policies |
General – The preparation of financial statements in conformity with U.S. generally accepted accounting principles requires management to make estimates and assumptions that affect the reported amounts of assets and liabilities, and disclosure of contingent assets and liabilities at the date of the financial statements and the reported amounts of increases and decreases in net assets from operations during the reporting period. Actual results could differ from those estimates. In the preparation of these financial statements, management has evaluated subsequent events occurring after the date of the fund’s Statement of Assets and Liabilities through the date that the financial statements were issued. The fund invests in the MFS High Yield Pooled Portfolio (“High Yield Pooled Portfolio”). MFS does not receive a management fee from the High Yield Pooled Portfolio. The High Yield Pooled Portfolio’s investment objective is to seek total return with an emphasis on high current income, but also considering capital appreciation. The accounting policies of the High Yield Pooled Portfolio are outlined in its shareholder report, which is available without charge by calling 1-800-225-2606 and on the Securities and Exchange Commission (SEC) web site at http://www.sec.gov or at the SEC’s public reference room in Washington, D.C. The accounting policies detailed in the Significant Accounting Policies note cover both the fund and the High Yield Pooled Portfolio. For purposes of this policy disclosure, “fund” refers to both the fund and the High Yield Pooled Portfolio in which the fund invests. The High Yield Pooled Portfolio’s shareholder report is not covered by this report. The fund and the High Yield Pooled Portfolio invest in high-yield securities rated below investment grade. Investments in below investment grade quality securities can involve a substantially greater risk of default or can already be in default, and their values can decline significantly. Below investment grade quality securities tend to be more sensitive to adverse news about the issuer, or the market or economy in general, than higher quality debt instruments. The fund and the High Yield Pooled Portfolio invest in foreign securities. Investments in foreign securities are vulnerable to the effects of changes in the relative values of the local currency and the U.S. dollar and to the effects of changes in each country’s market, economic, industrial, political, regulatory, geopolitical, and other conditions.
In March 2017, the FASB issued Accounting Standards Update 2017-08, Receivables – Nonrefundable Fees and Other Costs (Subtopic 310-20) – Premium Amortization on Purchased Callable Debt Securities (“ASU 2017-08”). For entities that hold callable debt securities at a premium, ASU 2017-08 requires that the premium be amortized to the earliest call date. ASU 2017-08 will be effective for fiscal years beginning after December 15, 2018, and interim periods within those fiscal years. Management has evaluated the potential impacts of ASU 2017-08 and believes that adoption of ASU 2017-08 will not have a material effect on the fund’s overall financial position or its overall results of operations.
Balance Sheet Offsetting – The fund’s accounting policy with respect to balance sheet offsetting is that, absent an event of default by the counterparty or a termination of the agreement, the International Swaps and Derivatives Association (ISDA) Master Agreement, or similar agreement, does not result in an offset of reported amounts of financial assets and financial liabilities in the Statement of Assets and Liabilities across transactions between the fund and the applicable counterparty. The fund’s right to setoff may be restricted or prohibited by the bankruptcy or insolvency laws of the particular jurisdiction to which a specific master netting agreement counterparty is subject. Balance sheet offsetting disclosures, to the extent applicable to the fund, have been included in the fund’s Significant Accounting Policies note under the captions for each of the fund’s in-scope financial instruments and transactions.
Investment Valuations – The investments of the fund and the MFS High Yield Pooled Portfolio are valued as described below.
Equity securities, including restricted equity securities, are generally valued at the last sale or official closing price on their primary market or exchange as provided by a third-party pricing service. Equity securities, for which there were no sales reported that day, are generally valued at the last quoted daily bid quotation on their primary market or exchange as provided by a third-party pricing service. Debt instruments and floating rate loans, including restricted debt instruments, are generally valued at an evaluated or composite bid as provided by a third-party pricing service. Short-term instruments with a maturity at issuance of 60 days or less may be valued at amortized cost, which approximates market value. Exchange-traded options are generally valued at the last sale or official closing price on their primary exchange as provided by a third-party pricing service. Exchange-traded options for which there were no sales reported that day are generally valued at the last daily bid quotation on their primary exchange as provided by a third-party pricing service. Options not traded on an exchange are generally valued at a broker/dealer bid quotation. Foreign currency
16
MFS Strategic Income Portfolio
Notes to Financial Statements (unaudited) – continued
options are generally valued at valuations provided by a third-party pricing service. Futures contracts are generally valued at last posted settlement price on their primary exchange as provided by a third-party pricing service. Futures contracts for which there were no trades that day for a particular position are generally valued at the closing bid quotation on their primary exchange as provided by a third-party pricing service. Forward foreign currency exchange contracts are generally valued at the mean of bid and asked prices for the time period interpolated from rates provided by a third-party pricing service for proximate time periods. Open-end investment companies are generally valued at net asset value per share. Securities and other assets generally valued on the basis of information from a third-party pricing service may also be valued at a broker/dealer bid quotation. In determining values, third-party pricing services can utilize both transaction data and market information such as yield, quality, coupon rate, maturity, type of issue, trading characteristics, and other market data. The values of foreign securities and other assets and liabilities expressed in foreign currencies are converted to U.S. dollars using the mean of bid and asked prices for rates provided by a third-party pricing service.
The Board of Trustees has delegated primary responsibility for determining or causing to be determined the value of the fund’s investments (including any fair valuation) to the adviser pursuant to valuation policies and procedures approved by the Board. If the adviser determines that reliable market quotations are not readily available, investments are valued at fair value as determined in good faith by the adviser in accordance with such procedures under the oversight of the Board of Trustees. Under the fund’s valuation policies and procedures, market quotations are not considered to be readily available for most types of debt instruments and floating rate loans and many types of derivatives. These investments are generally valued at fair value based on information from third-party pricing services. In addition, investments may be valued at fair value if the adviser determines that an investment’s value has been materially affected by events occurring after the close of the exchange or market on which the investment is principally traded (such as foreign exchange or market) and prior to the determination of the fund’s net asset value, or after the halting of trading of a specific security where trading does not resume prior to the close of the exchange or market on which the security is principally traded. The adviser generally relies on third-party pricing services or other information (such as the correlation with price movements of similar securities in the same or other markets; the type, cost and investment characteristics of the security; the business and financial condition of the issuer; and trading and other market data) to assist in determining whether to fair value and at what value to fair value an investment. The value of an investment for purposes of calculating the fund’s net asset value can differ depending on the source and method used to determine value. When fair valuation is used, the value of an investment used to determine the fund’s net asset value may differ from quoted or published prices for the same investment. There can be no assurance that the fund could obtain the fair value assigned to an investment if it were to sell the investment at the same time at which the fund determines its net asset value per share.
Various inputs are used in determining the value of the fund’s assets or liabilities. These inputs are categorized into three broad levels. In certain cases, the inputs used to measure fair value may fall into different levels of the fair value hierarchy. In such cases, an investment’s level within the fair value hierarchy is based on the lowest level of input that is significant to the fair value measurement. The fund’s assessment of the significance of a particular input to the fair value measurement in its entirety requires judgment, and considers factors specific to the investment. Level 1 includes unadjusted quoted prices in active markets for identical assets or liabilities. Level 2 includes other significant observable market-based inputs (including quoted prices for similar securities, interest rates, prepayment speed, and credit risk). Level 3 includes unobservable inputs, which may include the adviser’s own assumptions in determining the fair value of investments. Other financial instruments are derivative instruments, such as futures contracts and forward foreign currency exchange contracts. The following is a summary of the levels used as of June 30, 2018 in valuing the fund’s assets or liabilities:
| | | | | | | | | | | | | | | | |
| Financial Instruments | | Level 1 | | | Level 2 | | | Level 3 | | | Total | |
| Equity Securities | | | $20,912 | | | | $— | | | | $— | | | | $20,912 | |
| U.S. Treasury Bonds & U.S. Government | | | | | | | | | | | | | | | | |
| Agency & Equivalents | | | — | | | | 5,606,993 | | | | — | | | | 5,606,993 | |
| Non-U.S. Sovereign Debt | | | — | | | | 3,786,889 | | | | — | | | | 3,786,889 | |
| Municipal Bonds | | | — | | | | 295,158 | | | | — | | | | 295,158 | |
| U.S. Corporate Bonds | | | — | | | | 10,245,928 | | | | — | | | | 10,245,928 | |
| Residential Mortgage-Backed Securities | | | — | | | | 414,782 | | | | — | | | | 414,782 | |
| Commercial Mortgage-Backed Securities | | | — | | | | 5,186,497 | | | | — | | | | 5,186,497 | |
| Asset-Backed Securities (including CDOs) | | | — | | | | 6,816,416 | | | | — | | | | 6,816,416 | |
| Foreign Bonds | | | — | | | | 4,394,490 | | | | — | | | | 4,394,490 | |
| Mutual Funds | | | 9,310,595 | | | | — | | | | — | | | | 9,310,595 | |
| Total | | | $9,331,507 | | | | $36,747,153 | | | | $— | | | | $46,078,660 | |
| | | | |
| Other Financial Instruments | | | | | | | | | | | | |
| Futures Contracts – Assets | | | $15,712 | | | | $— | | | | $— | | | | $15,712 | |
| Futures Contracts – Liabilities | | | (15,693 | ) | | | — | | | | — | | | | (15,693 | ) |
| Forward Foreign Currency Exchange Contracts – Assets | | | — | | | | 1,317 | | | | — | | | | 1,317 | |
| Forward Foreign Currency Exchange Contracts – Liabilities | | | — | | | | (562 | ) | | | — | | | | (562 | ) |
17
MFS Strategic Income Portfolio
Notes to Financial Statements (unaudited) – continued
For further information regarding security characteristics, see the Portfolio of Investments. Please refer to the High Yield Pooled Portfolio’s shareholder report for further information regarding the levels used in valuing its assets or liabilities.
Of the level 1 investments presented above, equity investments amounting to $17,256 would have been considered level 2 investments at the beginning of the period. The primary reason for changes in the classifications between levels 1 and 2 occurs when foreign equity securities are fair valued using other observable market-based inputs in place of the closing exchange price due to events occurring after the close of the exchange or market on which the investment is principally traded. The fund’s foreign equity securities may often be valued using other observable market-based inputs. The fund’s policy is to recognize transfers between the levels as of the end of the period.
Foreign Currency Translation – Purchases and sales of foreign investments, income, and expenses are converted into U.S. dollars based upon currency exchange rates prevailing on the respective dates of such transactions or on the reporting date for foreign denominated receivables and payables. Gains and losses attributable to foreign currency exchange rates on sales of securities are recorded for financial statement purposes as net realized gains and losses on investments. Gains and losses attributable to foreign exchange rate movements on receivables, payables, income and expenses are recorded for financial statement purposes as foreign currency transaction gains and losses. That portion of both realized and unrealized gains and losses on investments that results from fluctuations in foreign currency exchange rates is not separately disclosed.
Derivatives – The fund uses derivatives primarily to increase or decrease exposure to a particular market or segment of the market, or security, to increase or decrease interest rate or currency exposure, or as alternatives to direct investments. Derivatives are used for hedging or non-hedging purposes. While hedging can reduce or eliminate losses, it can also reduce or eliminate gains. When the fund uses derivatives as an investment to increase market exposure, or for hedging purposes, gains and losses from derivative instruments may be substantially greater than the derivative’s original cost.
The derivative instruments used by the fund during the period were purchased options, futures contracts, and forward foreign currency exchange contracts. Depending on the type of derivative, the fund may exit a derivative position by entering into an offsetting transaction with a counterparty or exchange, negotiating an agreement with the derivative counterparty, or novating the position to a third party. The fund may be unable to promptly close out a futures position in instances where the daily fluctuation in the price for that type of future exceeds the daily limit set by the exchange. The fund’s period end derivatives, as presented in the Portfolio of Investments and the associated Derivative Contract tables, generally are indicative of the volume of its derivative activity during the period.
The following table presents, by major type of derivative contract, the fair value, on a gross basis, of the asset and liability components of derivatives held by the fund at June 30, 2018 as reported in the Statement of Assets and Liabilities:
| | | | | | | | | | |
| | | | | Fair Value (a) | |
| Risk | | Derivative Contracts | | Asset Derivatives | | | Liability Derivatives | |
| Interest Rate | | Interest Rate Futures | | | $15,712 | | | | $(15,693 | ) |
| Interest Rate | | Purchased Interest Rate Options | | | 3,656 | | | | — | |
| Foreign Exchange | | Forward Foreign Currency Exchange | | | 1,317 | | | | (562 | ) |
| Total | | | | | $20,685 | | | | $(16,255 | ) |
| (a) | The value of purchased options outstanding is included in investments in unaffiliated issuers, at value, within the fund’s Statement of Assets and Liabilities. Values presented in this table for futures contracts correspond to the values reported in the fund’s Portfolio of Investments. Only the current day net variation margin for futures contracts and is separately reported within the fund’s Statement of Assets and Liabilities. |
The following table presents, by major type of derivative contract, the realized gain (loss) on derivatives held by the fund for the six months ended June 30, 2018 as reported in the Statement of Operations:
| | | | | | | | |
| Risk | | Futures Contracts | | | Forward Foreign Currency
Exchange Contracts | |
| Interest Rate | | | $22,099 | | | | $— | |
| Foreign Exchange | | | — | | | | 772 | |
| Total | | | $22,099 | | | | $772 | |
The following table presents, by major type of derivative contract, the change in unrealized appreciation or depreciation on derivatives held by the fund for the six months ended June 30, 2018 as reported in the Statement of Operations:
| | | | | | | | | | | | |
| Risk | | Futures Contracts | | | Forward Foreign Currency
Exchange Contracts | | | Unaffiliated Issuers
(Purchased
Options) | |
| Interest Rate | | | $(1,118 | ) | | | $— | | | | $(20,954 | ) |
| Foreign Exchange | | | — | | | | 1,308 | | | | — | |
| Total | | | $(1,118 | ) | | | $1,308 | | | | $(20,954 | ) |
18
MFS Strategic Income Portfolio
Notes to Financial Statements (unaudited) – continued
Derivative counterparty credit risk is managed through formal evaluation of the creditworthiness of all potential counterparties. On certain, but not all, uncleared derivatives, the fund attempts to reduce its exposure to counterparty credit risk whenever possible by entering into an ISDA Master Agreement on a bilateral basis. The ISDA Master Agreement gives each party to the agreement the right to terminate all transactions traded under such agreement if there is a specified deterioration in the credit quality of the other party. Upon an event of default or a termination of the ISDA Master Agreement, the non-defaulting party has the right to close out all transactions traded under such agreement and to net amounts owed under each agreement to one net amount payable by one party to the other. This right to close out and net payments across all transactions traded under the ISDA Master Agreement could result in a reduction of the fund’s credit risk to such counterparty equal to any amounts payable by the fund under the applicable transactions, if any.
Collateral and margin requirements differ by type of derivative. For cleared derivatives (e.g., futures contracts, cleared swaps, and exchange-traded options), margin requirements are set by the clearing broker and the clearing house and collateral, in the form of cash or securities, is posted by the fund directly with the clearing broker. Collateral terms are counterparty agreement specific for uncleared derivatives (e.g., forward foreign currency exchange contracts, uncleared swap agreements, and uncleared options) and collateral, in the form of cash and securities, is held in segregated accounts with the fund’s custodian in connection with these agreements. For derivatives traded under an ISDA Master Agreement, which contains a collateral support annex, the collateral requirements are netted across all transactions traded under such counterparty-specific agreement and one amount is posted from one party to the other to collateralize such obligations. Cash that has been segregated or delivered to cover the fund’s collateral or margin obligations under derivative contracts, if any, will be reported separately in the Statement of Assets and Liabilities as restricted cash for uncleared derivatives and/or deposits with brokers for cleared derivatives. Securities pledged as collateral or margin for the same purpose, if any, are noted in the Portfolio of Investments. The fund may be required to make payments of interest on uncovered collateral or margin obligations with the broker. Any such payments are included in “Miscellaneous” expense in the Statement of Operations.
Purchased Options – The fund purchased put options for a premium. Purchased put options entitle the holder to sell a specified number of shares or units of a particular security, currency or index at a specified price at a specified date or within a specified period of time. Purchasing put options may hedge against an anticipated decline in the value of portfolio securities or currency or decrease the fund’s exposure to an underlying instrument.
The premium paid is initially recorded as an investment in the Statement of Assets and Liabilities. That investment is subsequently marked-to-market daily with the difference between the premium paid and the market value of the purchased option being recorded as unrealized appreciation or depreciation. Premiums paid for purchased put options which have expired are treated as realized losses on investments in the Statement of Operations. Upon the exercise or closing of a purchased put option, the premium paid is offset against the proceeds on the sale of the underlying security or financial instrument in order to determine the realized gain or loss on investments.
Whether or not the option is exercised, the fund’s maximum risk of loss from purchasing an option is the amount of premium paid. All option contracts involve credit risk if the counterparty to the option contract fails to perform. For uncleared options, this risk is mitigated in cases where there is an ISDA Master Agreement between the fund and the counterparty providing for netting as described above and, where applicable, by the posting of collateral by the counterparty to the fund to cover the fund’s exposure to the counterparty under such ISDA Master Agreement.
Futures Contracts – The fund entered into futures contracts which may be used to hedge against or obtain broad market exposure, interest rate exposure, currency exposure, or to manage duration. A futures contract represents a commitment for the future purchase or sale of an asset at a specified price on a specified date.
Upon entering into a futures contract, the fund is required to deposit with the broker, either in cash or securities, an initial margin in an amount equal to a specified percentage of the notional amount of the contract. Subsequent payments (variation margin) are made or received by the fund each day, depending on the daily fluctuations in the value of the contract, and are recorded for financial statement purposes as unrealized gain or loss by the fund until the contract is closed or expires at which point the gain or loss on futures contracts is realized.
The fund bears the risk of interest rates, exchange rates or securities prices moving unexpectedly, in which case, the fund may not achieve the anticipated benefits of the futures contracts and may realize a loss. While futures contracts may present less counterparty risk to the fund since the contracts are exchange traded and the exchange’s clearinghouse guarantees payments to the broker, there is still counterparty credit risk due to the insolvency of the broker. The fund’s maximum risk of loss due to counterparty credit risk is equal to the margin posted by the fund to the broker plus any gains or minus any losses on the outstanding futures contracts.
Forward Foreign Currency Exchange Contracts – The fund entered into forward foreign currency exchange contracts for the purchase or sale of a specific foreign currency at a fixed price on a future date. These contracts may be used to hedge the fund’s currency risk or for non-hedging purposes. For hedging purposes, the fund may enter into contracts to deliver or receive foreign
19
MFS Strategic Income Portfolio
Notes to Financial Statements (unaudited) – continued
currency that the fund will receive from or use in its normal investment activities. The fund may also use contracts to hedge against declines in the value of foreign currency denominated securities due to unfavorable exchange rate movements. For non-hedging purposes, the fund may enter into contracts with the intent of changing the relative exposure of the fund’s portfolio of securities to different currencies to take advantage of anticipated exchange rate changes.
Forward foreign currency exchange contracts are adjusted by the daily exchange rate of the underlying currency and any unrealized gains or losses are recorded as a receivable or payable for forward foreign currency exchange contracts until the contract settlement date. On contract settlement date, any gain or loss on the contract is recorded as realized gains or losses on forward foreign currency exchange contracts.
Risks may arise upon entering into these contracts from unanticipated movements in the value of the contract and from the potential inability of counterparties to meet the terms of their contracts. Generally, the fund’s maximum risk due to counterparty credit risk is the unrealized gain on the contract due to the use of Continuous Linked Settlement, a multicurrency cash settlement system for the centralized settlement of foreign transactions. This risk is mitigated in cases where there is an ISDA Master Agreement between the fund and the counterparty providing for netting as described above and, where applicable, by the posting of collateral by the counterparty to the fund to cover the fund’s exposure to the counterparty under such ISDA Master Agreement.
Security Loans – Under its Securities Lending Agency Agreement with the fund, State Street Bank and Trust Company (“State Street”), as lending agent, loans the securities of the fund to certain qualified institutions (the “Borrowers”) approved by the fund. Security loans can be terminated at the discretion of either the lending agent or the fund and the related securities must be returned within the earlier of the standard trade settlement period for such securities or within three business days. The loans are collateralized by cash and/or U.S. Treasury and federal agency obligations in an amount typically at least equal to the market value of the securities loaned. On loans collateralized by cash, the cash collateral is invested in a money market fund. The market value of the loaned securities is determined at the close of business of the fund and any additional required collateral is delivered to the fund on the next business day. State Street provides the fund with indemnification against Borrower default. In the event of Borrower default, State Street will, for the benefit of the fund, either purchase securities identical to those loaned or, when such purchase is commercially impracticable, pay the fund the market value of the loaned securities. In return, State Street assumes the fund’s rights to the related collateral. If the collateral value is less than the cost to purchase identical securities, State Street is responsible for the shortfall, but only to the extent that such shortfall is not due to a decline in collateral value resulting from collateral reinvestment for which the fund bears the risk of loss. At period end, the fund had investment securities on loan, all of which were classified as equity securities in the fund’s Portfolio of Investments, with a fair value of $29. The fair value of the fund’s investment securities on loan and a related liability of $28 for cash collateral received on securities loaned are both presented gross in the Statement of Assets and Liabilities. The value of the fund’s securities on loan net of the related collateral is $1 at period end. The liability for cash collateral for securities loaned is carried at fair value, which is categorized as level 2 within the fair value hierarchy. A portion of the income generated upon investment of the collateral is remitted to the Borrowers, and the remainder is allocated between the fund and the lending agent. On loans collateralized by U.S. Treasury and/or federal agency obligations, a fee is received from the Borrower, and is allocated between the fund and the lending agent. Income from securities lending is separately reported in the Statement of Operations. The dividend and interest income earned on the securities loaned is accounted for in the same manner as other dividend and interest income.
Loans and Other Direct Debt Instruments – The fund invests in loans and loan participations or other receivables. These investments may include standby financing commitments, including revolving credit facilities, which contractually obligate the fund to supply additional cash to the borrower on demand. The fund generally provides this financial support in order to preserve its existing investment or to obtain a more senior secured interest in the assets of the borrower. Loan participations involve a risk of insolvency of the lending bank or other financial intermediary.
Indemnifications – Under the fund’s organizational documents, its officers and Trustees may be indemnified against certain liabilities and expenses arising out of the performance of their duties to the fund. Additionally, in the normal course of business, the fund enters into agreements with service providers that may contain indemnification clauses. The fund’s maximum exposure under these agreements is unknown as this would involve future claims that may be made against the fund that have not yet occurred.
Investment Transactions and Income – Investment transactions are recorded on the trade date. Interest income is recorded on the accrual basis. All premium and discount is amortized or accreted for financial statement purposes in accordance with U.S. generally accepted accounting principles. Some securities may be purchased on a “when-issued” or “forward delivery” basis, which means that the securities will be delivered to the fund at a future date, usually beyond customary settlement time. Dividends received in cash are recorded on the ex-dividend date. Certain dividends from foreign securities will be recorded when the fund is informed of the dividend if such information is obtained subsequent to the ex-dividend date. Dividend and interest payments received in additional securities are recorded on the ex-dividend or ex-interest date in an amount equal to the value of the security on such date.
20
MFS Strategic Income Portfolio
Notes to Financial Statements (unaudited) – continued
The fund may receive proceeds from litigation settlements. Any proceeds received from litigation involving portfolio holdings are reflected in the Statement of Operations in realized gain/loss if the security has been disposed of by the fund or in unrealized gain/loss if the security is still held by the fund. Any other proceeds from litigation not related to portfolio holdings are reflected as other income in the Statement of Operations.
The fund purchased or sold debt securities on a when-issued or delayed delivery basis, or in a “To Be Announced” (TBA) or “forward commitment” transaction with delivery or payment to occur at a later date beyond the normal settlement period. At the time a fund enters into a commitment to purchase or sell a security, the transaction is recorded and the value of the security acquired is reflected in the fund’s net asset value. The price of such security and the date that the security will be delivered and paid for are fixed at the time the transaction is negotiated. The value of the security may vary with market fluctuations. When-issued investments purchased are held at carrying amount, which approximates fair value and are categorized as level 2 within the fair value hierarchy. No interest accrues to the fund until payment takes place. At the time that a fund enters into this type of transaction, the fund is required to have sufficient cash and/or liquid securities to cover its commitments. Losses may arise due to changes in the value of the underlying securities or if the counterparty does not perform under the contract’s terms, or if the issuer does not issue the securities due to political, economic or other factors. Additionally, losses may arise due to declines in the value of the securities prior to settlement date.
To mitigate this risk of loss on TBA securities and other types of forward settling mortgage-backed securities, the fund whenever possible enters into a Master Securities Forward Transaction Agreement (“MSFTA”) on a bilateral basis with each of the counterparties with whom it undertakes a significant volume of transactions. The MSFTA gives each party to the agreement the right to terminate all transactions traded under such agreement if there is a specified deterioration in the credit quality of the other party. Upon an event of default or a termination of the MSFTA, the non-defaulting party has the right to close out all transactions traded under such agreement and to net amounts owed under each transaction to one net amount payable by one party to the other. This right to close out and net payments across all transactions traded under the MSFTA could result in a reduction of the fund’s credit risk to such counterparty equal to any amounts payable by the fund under the applicable transactions, if any.
For mortgage-backed securities traded under a MSFTA, the collateral and margining requirements are contract specific. Collateral amounts across all transactions traded under such agreement are netted and one amount is posted from one party to the other to collateralize such obligations. Cash that has been pledged to cover the fund’s collateral or margin obligations under a MSFTA, if any, will be reported separately on the Statement of Assets and Liabilities as restricted cash. Securities pledged as collateral or margin for the same purpose, if any, are noted in the Portfolio of Investments.
Tax Matters and Distributions – The fund intends to qualify as a regulated investment company, as defined under Subchapter M of the Internal Revenue Code, and to distribute all of its taxable income, including realized capital gains. As a result, no provision for federal income tax is required. The fund’s federal tax returns, when filed, will remain subject to examination by the Internal Revenue Service for a three year period. Management has analyzed the fund’s tax positions taken on federal and state tax returns for all open tax years and does not believe that there are any uncertain tax positions that require recognition of a tax liability. Foreign taxes, if any, have been accrued by the fund in the accompanying financial statements in accordance with the applicable foreign tax law. Foreign income taxes may be withheld by certain countries in which the fund invests. Additionally, capital gains realized by the fund on securities issued in or by certain foreign countries may be subject to capital gains tax imposed by those countries.
Distributions to shareholders are recorded on the ex-dividend date. Income and capital gain distributions are determined in accordance with income tax regulations, which may differ from U.S. generally accepted accounting principles. Certain capital accounts in the financial statements are periodically adjusted for permanent differences in order to reflect their tax character. These adjustments have no impact on net assets or net asset value per share. Temporary differences which arise from recognizing certain items of income, expense, gain or loss in different periods for financial statement and tax purposes will reverse at some time in the future. Distributions in excess of net investment income or net realized gains are temporary overdistributions for financial statement purposes resulting from differences in the recognition or classification of income or distributions for financial statement and tax purposes.
Book/tax differences primarily relate to defaulted bonds, amortization and accretion of debt securities, and expiration of capital loss carryforwards.
The tax character of distributions declared to shareholders for the last fiscal year is as follows:
| | | | |
| | | Year ended
12/31/17 | |
| Ordinary income (including any short-term capital gains) | | | $2,356,097 | |
21
MFS Strategic Income Portfolio
Notes to Financial Statements (unaudited) – continued
The federal tax cost and the tax basis components of distributable earnings were as follows:
| | | | |
| As of 6/30/18 | | | | |
| Cost of investments | | | $48,921,755 | |
| Gross appreciation | | | 108,540 | |
| Gross depreciation | | | (2,951,635 | ) |
| Net unrealized appreciation (depreciation) | | | $(2,843,095 | ) |
| |
| As of 12/31/17 | | | | |
| Undistributed ordinary income | | | 1,827,687 | |
| Other temporary differences | | | 33 | |
| Net unrealized appreciation (depreciation) | | | (1,071,138 | ) |
The aggregate cost above includes prior fiscal year end tax adjustments, if applicable.
Multiple Classes of Shares of Beneficial Interest – The fund offers multiple classes of shares, which differ in their respective distribution and/or service fees. The fund’s income, realized and unrealized gain (loss), and common expenses are allocated to shareholders based on the daily net assets of each class. Dividends are declared separately for each class. Differences in per share dividend rates are generally due to differences in separate class expenses. The fund’s distributions declared to shareholders as reported in the Statements of Changes in Net Assets are presented by class as follows:
| | | | | | | | |
| | | From net investment
income | |
| | | Six months ended
6/30/18 | | | Year ended
12/31/17 | |
| Initial Class | | | $— | | | | $1,994,249 | |
| Service Class | | | — | | | | 361,848 | |
| Total | | | $— | | | | $2,356,097 | |
| (3) | | Transactions with Affiliates |
Investment Adviser – The fund has an investment advisory agreement with MFS to provide overall investment management and related administrative services and facilities to the fund. The management fee is computed daily and paid monthly at the following annual rates based on the fund’s average daily net assets:
| | | | |
| Up to $1 billion | | | 0.70% | |
| In excess of $1 billion | | | 0.65% | |
MFS has agreed in writing to reduce its management fee by a specified amount if certain MFS mutual fund assets exceed thresholds agreed to by MFS and the fund’s Board of Trustees. For the six months ended June 30, 2018, this management fee reduction amounted to $2,180, which is included in the reduction of total expenses in the Statement of Operations. The management fee incurred for the six months ended June 30, 2018 was equivalent to an annual effective rate of 0.69% of the fund’s average daily net assets.
The investment adviser has agreed in writing to pay a portion of the fund’s total annual operating expenses, excluding interest, taxes, extraordinary expenses, brokerage and transaction costs, and investment-related expenses (such as fees and expenses associated with investments in investment companies and other similar investment vehicles), such that total annual operating expenses do not exceed 0.80% of average daily net assets for the Initial Class shares and 1.05% of average daily net assets for the Service Class shares. This written agreement will continue until modified by the fund’s Board of Trustees, but such agreement will continue at least until April 30, 2020. For the six months ended June 30, 2018, this reduction amounted to $48,680, which is included in the reduction of total expenses in the Statement of Operations.
Distributor – MFS Fund Distributors, Inc. (MFD), a wholly-owned subsidiary of MFS, is the distributor of shares of the fund. The Trustees have adopted a distribution plan for the Service Class shares pursuant to Rule 12b-1 under the Investment Company Act of 1940.
The fund’s distribution plan provides that the fund will pay MFD distribution and/or service fees equal to 0.25% per annum of its average daily net assets attributable to Service Class shares as partial consideration for services performed and expenses incurred by MFD and financial intermediaries (including participating insurance companies that invest in the fund to fund variable annuity and variable life insurance contracts, sponsors of qualified retirement and pension plans that invest in the fund, and affiliates of these participating insurance companies and plan sponsors) in connection with the sale and distribution of the Service Class shares. MFD may subsequently pay all, or a portion, of the distribution and/or service fees to financial intermediaries.
Shareholder Servicing Agent – MFS Service Center, Inc. (MFSC), a wholly-owned subsidiary of MFS, receives a fee from the fund for its services as shareholder servicing agent. For the six months ended June 30, 2018, the fee was $5,719, which equated to
22
MFS Strategic Income Portfolio
Notes to Financial Statements (unaudited) – continued
0.0242% annually of the fund’s average daily net assets. MFSC also receives payment from the fund for out-of-pocket expenses paid by MFSC on behalf of the fund. For the six months ended June 30, 2018, these costs amounted to $133.
Administrator – MFS provides certain financial, legal, shareholder communications, compliance, and other administrative services to the fund. Under an administrative services agreement, the fund reimburses MFS the costs incurred to provide these services. The fund is charged an annual fixed amount of $17,500 plus a fee based on average daily net assets. The administrative services fee incurred for the six months ended June 30, 2018 was equivalent to an annual effective rate of 0.0367% of the fund’s average daily net assets.
Trustees’ and Officers’ Compensation – The fund pays compensation to independent Trustees in the form of a retainer, attendance fees, and additional compensation to Board and Committee chairpersons. The fund does not pay compensation directly to Trustees or officers of the fund who are also officers of the investment adviser, all of whom receive remuneration for their services to the fund from MFS. Certain officers and Trustees of the fund are officers or directors of MFS, MFD, and MFSC.
Other – This fund and certain other funds managed by MFS (the funds) have entered into a service agreement (the ISO Agreement) which provides for payment of fees solely by the funds to Tarantino LLC in return for the provision of services of an Independent Senior Officer (ISO) for the funds. Frank L. Tarantino serves as the ISO and is an officer of the funds and the sole member of Tarantino LLC. The funds can terminate the ISO Agreement with Tarantino LLC at any time under the terms of the ISO Agreement. For the six months ended June 30, 2018, the fee paid by the fund under this agreement was $42 and is included in “Miscellaneous” expense in the Statement of Operations. MFS has agreed to bear all expenses associated with office space, other administrative support, and supplies provided to the ISO.
The fund invests in the MFS Institutional Money Market Portfolio which is managed by MFS and seeks current income consistent with preservation of capital and liquidity. This money market fund does not pay a management fee to MFS.
The fund invests in the High Yield Pooled Portfolio, which is a mutual fund advised by MFS that does not pay management fees to MFS but does incur investment and operating costs. The fund invests in the High Yield Pooled Portfolio to gain exposure to high income debt instruments, rather than investing in high income debt instruments directly. The High Yield Pooled Portfolio does not pay a management fee to MFS or distribution and/or service fee to MFD.
For the six months ended June 30, 2018, purchases and sales of investments, other than purchased option transactions and short-term obligations, were as follows:
| | | | | | | | |
| | | Purchases | | | Sales | |
| U.S. Government securities | | | $516,441 | | | | $3,445,251 | |
| Non-U.S. Government securities | | | $13,696,675 | | | | $10,903,851 | |
| (5) | | Shares of Beneficial Interest |
The fund’s Declaration of Trust permits the Trustees to issue an unlimited number of full and fractional shares of beneficial interest. Transactions in fund shares were as follows:
| | | | | | | | | | | | | | | | |
| | | Six months ended 6/30/18 | | | Year ended 12/31/17 | |
| | | Shares | | | Amount | | | Shares | | | Amount | |
| Shares sold | | | | | | | | | | | | | | | | |
Initial Class | | | 132,703 | | | | $1,283,841 | | | | 288,818 | | | | $2,862,544 | |
Service Class | | | 31,675 | | | | 304,077 | | | | 92,548 | | | | 906,325 | |
| | | 164,378 | | | | $1,587,918 | | | | 381,366 | | | | $3,768,869 | |
| Shares issued to shareholders in reinvestment of distributions | | | | | | | | | | | | | | | | |
Initial Class | | | — | | | | $— | | | | 204,329 | | | | $1,994,249 | |
Service Class | | | — | | | | — | | | | 37,342 | | | | 361,848 | |
| | | — | | | | $— | | | | 241,671 | | | | $2,356,097 | |
| Shares reacquired | | | | | | | | | | | | | | | | |
Initial Class | | | (302,285 | ) | | | $(2,918,555 | ) | | | (730,440 | ) | | | $(7,253,077 | ) |
Service Class | | | (83,052 | ) | | | (795,543 | ) | | | (293,752 | ) | | | (2,883,817 | ) |
| | | (385,337 | ) | | | $(3,714,098 | ) | | | (1,024,192 | ) | | | $(10,136,894 | ) |
| Net change | | | | | | | | | | | | | | | | |
Initial Class | | | (169,582 | ) | | | $(1,634,714 | ) | | | (237,293 | ) | | | $(2,396,284 | ) |
Service Class | | | (51,377 | ) | | | (491,466 | ) | | | (161,862 | ) | | | (1,615,644 | ) |
| | | (220,959 | ) | | | $(2,126,180 | ) | | | (401,155 | ) | | | $(4,011,928 | ) |
23
MFS Strategic Income Portfolio
Notes to Financial Statements (unaudited) – continued
The fund and certain other funds managed by MFS participate in a $1.25 billion unsecured committed line of credit, subject to a $1 billion sublimit, provided by a syndication of banks under a credit agreement. Borrowings may be made for temporary financing needs. Interest is charged to each fund, based on its borrowings, generally at a rate equal to the higher of the Overnight Bank Funding rate or daily one month LIBOR plus an agreed upon spread. A commitment fee, based on the average daily, unused portion of the committed line of credit, is allocated among the participating funds. In addition, the fund and other funds managed by MFS have established unsecured uncommitted borrowing arrangements with certain banks for temporary financing needs. Interest is charged to each fund, based on its borrowings, at a rate equal to the Overnight Bank Funding rate plus an agreed upon spread. For the six months ended June 30, 2018, the fund’s commitment fee and interest expense were $170 and $0, respectively, and are included in “Miscellaneous” expense in the Statement of Operations.
| (7) | | Investments in Affiliated Issuers |
An affiliated issuer may be considered one in which the fund owns 5% or more of the outstanding voting securities, or a company which is under common control. For the purposes of this report, the fund assumes the following to be affiliated issuers:
| | | | | | | | | | | | | | | | | | | | |
| Affiliated Issuers | | | | | Beginning
Shares/Par
Amount | | | Acquisitions
Shares/Par
Amount | | | Dispositions
Shares/Par
Amount | | | Ending
Shares/Par
Amount | |
| MFS High Yield Pooled Portfolio | | | | | | | 1,144,373 | | | | 51,906 | | | | (176,372 | ) | | | 1,019,907 | |
| MFS Institutional Money Market Portfolio | | | | | | | 1,509,122 | | | | 8,400,828 | | | | (9,768,342 | ) | | | 141,608 | |
| | | | | |
| Affiliated Issuers | | Realized
Gain (Loss) | | | Change in
Unrealized
Appreciation/
Depreciation | | | Capital Gain
Distributions | | | Dividend
Income | | | Ending
Value | |
| MFS High Yield Pooled Portfolio | | | $(87,206 | ) | | | $(271,083 | ) | | | $— | | | | $276,919 | | | | $9,168,959 | |
| MFS Institutional Money Market Portfolio | | | (144 | ) | | | 154 | | | | — | | | | 6,508 | | | | 141,608 | |
| | | | | | | | | | | | | | | | | | | | |
| | | $(87,350 | ) | | | $(270,929 | ) | | | $— | | | | $283,427 | | | | $9,310,567 | |
| | | | | | | | | | | | | | | | | | | | |
In May 2015, the Motors Liquidation Company Avoidance Action Trust (hereafter, “AAT”) served upon the fund a complaint in an adversary proceeding in the U.S. Bankruptcy Court for the Southern District of New York, captioned Motors Liquidation Company Avoidance Action Trust v. JPMorgan Chase Bank, N.A., et al. (No. 09-00504 (REG)). The complaint, which was originally filed in 2009 but not served on the fund until 2015, names as defendants over 500 entities (including the fund) that held an interest in a $1.5 billion General Motors (GM) term loan in 2009, when GM filed for bankruptcy. The AAT alleges that the fund and the other term loan lenders were improperly treated as secured lenders with respect to the term loan shortly before and immediately after GM’s bankruptcy, receiving full principal and interest payments under the loan. The AAT alleges that the fund and other term loan lenders should have been treated as unsecured (or partially unsecured) creditors because the main lien securing the collateral was allegedly not perfected at the time of GM’s bankruptcy due to an erroneous filing in October 2008 that terminated the financing statement perfecting the lien. The AAT seeks to claw back payments made to the fund and the other term loan lenders after, and during the 90 days before, GM’s June 2009 bankruptcy petition. During that time period, the fund received term loan payments of approximately $190,000. The fund cannot predict the outcome of this proceeding. Among other things, it is unclear whether the AAT’s claims will succeed; what the fund would be entitled to as an unsecured (or partially unsecured) creditor, given the existence of other collateral not impacted by the erroneous October 2008 filing; whether third parties responsible for the erroneous October 2008 filing would bear some or all of any liability; and the degree to which the fund may be entitled to indemnification from a third party for any amount required to be disgorged. The fund has and will continue to incur legal expenses associated with the defense of this action and in related claims against third parties.
24
MFS Strategic Income Portfolio
PROXY VOTING POLICIES AND INFORMATION
MFS votes proxies on behalf of the fund pursuant to proxy voting policies and procedures that are available without charge, upon request, by calling 1-800-225-2606, by visiting mfs.com/proxyvoting, or by visiting the SEC’s Web site at http://www.sec.gov.
Information regarding how the fund voted proxies relating to portfolio securities during the most recent twelve-month period ended June 30 is available by August 31 of each year without charge by visiting mfs.com/proxyvoting, or by visiting the SEC’s Web site at http://www.sec.gov.
QUARTERLY PORTFOLIO DISCLOSURE
The fund will file a complete schedule of portfolio holdings with the Securities and Exchange Commission (the Commission) for the first and third quarters of each fiscal year on Form N-Q. The fund’s Form N-Q is available on the EDGAR database on the Commission’s Internet Web site at http://www.sec.gov, and may be reviewed and copied at the:
Public Reference Room
Securities and Exchange Commission
100 F Street, NE, Room 1580
Washington, D.C. 20549
Information on the operation of the Public Reference Room may be obtained by calling the Commission at 1-800-SEC-0330. Copies of the fund’s Form N-Q also may be obtained, upon payment of a duplicating fee, by electronic request at the following e-mail address: publicinfo@sec.gov or by writing the Public Reference Section at the above address.
FURTHER INFORMATION
From time to time, MFS may post important information about the fund or the MFS funds on the MFS web site (mfs.com). This information is available at https://www.mfs.com/en-us/what-we-do/announcements.html or at mfs.com/vit2 by choosing the fund’s name.
INFORMATION ABOUT FUND CONTRACTS AND LEGAL CLAIMS
The fund has entered into contractual arrangements with an investment adviser, administrator, distributor, shareholder servicing agent, 529 program manager (if applicable), and custodian who each provide services to the fund. Unless expressly stated otherwise, shareholders are not parties to, or intended beneficiaries of these contractual arrangements, and these contractual arrangements are not intended to create any shareholder right to enforce them against the service providers or to seek any remedy under them against the service providers, either directly or on behalf of the fund.
Under the Trust’s By-Laws and Declaration of Trust, any claims asserted against or on behalf of the MFS Funds, including claims against Trustees and Officers, must be brought in state and federal courts located within the Commonwealth of Massachusetts.
25
Semiannual Report
June 30, 2018

MFS® Technology Portfolio

MFS® Variable Insurance Trust II
TKS-SEM
MFS® Technology Portfolio
CONTENTS
The report is prepared for the general information of contract owners. It is authorized for distribution to prospective investors only when preceded or accompanied by a current prospectus.
NOT FDIC INSURED • MAY LOSE VALUE • NO BANK OR CREDIT UNION GUARANTEE • NOT A DEPOSIT • NOT INSURED BY ANY FEDERAL GOVERNMENT AGENCY OR NCUA/NCUSIF
MFS Technology Portfolio
LETTER FROM THE EXECUTIVE CHAIRMAN

Dear Contract Owners:
Rising bond yields, international trade friction and geopolitical uncertainty have contributed to a measurable uptick in market volatility — a departure from the low-volatility environment that prevailed for much of 2017. In recent months, against this more challenging backdrop, global markets have given back some of the strong gains recorded during 2017 and early 2018. But global economic growth remains healthy, notwithstanding signs of a modest slowdown over the past few months, particularly in Europe and China.
Although the U.S. Federal Reserve continues to gradually raise interest rates and shrink its balance sheet, monetary policy remains accommodative around the world, with many central banks taking only tentative steps toward tighter policies. Newly enacted U.S. tax reforms have been welcomed by equity markets, while emerging market economies have recently had to contend with tighter financial conditions as a result of firmer U.S. Treasury yields and a stronger dollar. Around the world, inflation remains largely subdued, but tight labor markets and solid global demand have investors on the lookout for its potential resurgence. Increased U.S. protectionism is also a growing concern, as investors fear that trade disputes could dampen business sentiment, leading to slower global growth.
As a global investment manager, MFS® strives to create long-term value for clients through an active approach and an investment platform built on nearly a century of expertise. To make that long-term value meaningful for clients, we work to align with you on our beliefs, your needs and the time it takes to deliver on your desired outcomes.
Respectfully,

Robert J. Manning
Executive Chairman
MFS Investment Management
August 16, 2018
The opinions expressed in this letter are subject to change and may not be relied upon for investment advice. No forecasts can be guaranteed.
1
MFS Technology Portfolio
PORTFOLIO COMPOSITION
Portfolio structure (i)
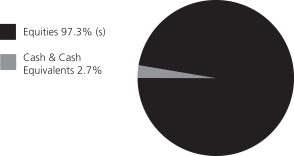
| | | | |
| Top ten holdings (i) | | | | |
| Alphabet, Inc., “A” | | | 9.2% | |
| Facebook, Inc., “A” | | | 8.0% | |
| Amazon.com, Inc. | | | 6.6% | |
| Microsoft Corp. | | | 6.0% | |
| Salesforce.com, Inc. | | | 4.4% | |
| Adobe Systems, Inc. | | | 4.1% | |
| Visa, Inc., “A” | | | 3.5% | |
| Mastercard, Inc., “A” | | | 3.3% | |
| Netflix, Inc. | | | 3.1% | |
| DXC Technology Co. | | | 2.9% | |
| | | | |
| Top five industries (i) | | | | |
| Internet | | | 21.1% | |
| Business Services | | | 18.0% | |
| Computer Software (s) | | | 15.7% | |
| Computer Software – Systems | | | 6.9% | |
| Other Banks & Diversified Financials | | | 6.8% | |
| (i) | For purposes of this presentation, the components include the value of securities, less any securities sold short, and reflect the impact of the equivalent exposure of derivative positions. These amounts may be negative from time to time. Equivalent exposure is a calculated amount that translates the derivative position into a reasonable approximation of the amount of the underlying asset that the portfolio would have to hold at a given point in time to have the same price sensitivity that results from the portfolio’s ownership of the derivative contract. When dealing with derivatives, equivalent exposure is a more representative measure of the potential impact of a position on portfolio performance than value. |
| (s) | Includes securities sold short. |
Cash & Cash Equivalents includes any cash, investments in money market funds, short-term securities, and other assets less liabilities. Please see the Statement of Assets and Liabilities for additional information related to the fund’s cash position and other assets and liabilities.
Percentages are based on net assets as of June 30, 2018.
The portfolio is actively managed and current holdings may be different.
2
MFS Technology Portfolio
EXPENSE TABLE
Fund Expenses Borne by the Contract Holders during the Period,
January 1, 2018 through June 30, 2018
As a contract holder of the fund, you incur ongoing costs, including management fees; distribution and/or service (12b-1) fees; and other fund expenses. This example is intended to help you understand your ongoing costs (in dollars) of investing in the fund and to compare these costs with the ongoing costs of investing in other mutual funds.
The example is based on an investment of $1,000 invested at the beginning of the period and held for the entire period January 1, 2018 through June 30, 2018.
Actual Expenses
The first line for each share class in the following table provides information about actual account values and actual expenses. You may use the information in this line, together with the amount you invested, to estimate the expenses that you paid over the period. Simply divide your account value by $1,000 (for example, an $8,600 account value divided by $1,000 = 8.6), then multiply the result by the number in the first line under the heading entitled “Expenses Paid During Period” to estimate the expenses you paid on your account during this period.
Hypothetical Example for Comparison Purposes
The second line for each share class in the following table provides information about hypothetical account values and hypothetical expenses based on the fund’s actual expense ratio and an assumed rate of return of 5% per year before expenses, which is not the fund’s actual return. The hypothetical account values and expenses may not be used to estimate the actual ending account balance or expenses you paid for the period. You may use this information to compare the ongoing costs of investing in the fund and other funds. To do so, compare this 5% hypothetical example with the 5% hypothetical examples that appear in the shareholder reports of the other funds.
Please note that the expenses shown in the table are meant to highlight the fund’s ongoing costs only and do not take into account the fees and expenses imposed under the variable contracts through which your investment in the fund is made. Therefore, the second line for each share class in the table is useful in comparing ongoing costs associated with an investment in vehicles (such as the fund) which fund benefits under variable annuity and variable life insurance contracts and to qualified pension and retirement plans only, and will not help you determine the relative total costs of investing in the fund through variable annuity and variable life insurance contracts. If the fees and expenses imposed under the variable contracts were included, your costs would have been higher.
| | | | | | | | | | | | | | | | | | |
| Share Class | | | | Annualized
Expense Ratio | | | Beginning
Account Value
1/01/18 | | | Ending
Account Value
6/30/18 | | | Expenses Paid
During Period (p)
1/01/18-6/30/18 | |
| Initial Class | | Actual | | | 0.88% | | | | $1,000.00 | | | | $1,166.48 | | | | $4.73 | |
| | Hypothetical (h) | | | 0.88% | | | | $1,000.00 | | | | $1,020.43 | | | | $4.41 | |
| Service Class | | Actual | | | 1.13% | | | | $1,000.00 | | | | $1,165.40 | | | | $6.07 | |
| | Hypothetical (h) | | | 1.13% | | | | $1,000.00 | | | | $1,019.19 | | | | $5.66 | |
| (h) | 5% class return per year before expenses. |
| (p) | “Expenses Paid During Period” are equal to each class’s annualized expense ratio, as shown above, multiplied by the average account value over the period, multiplied by 181/365 (to reflect the one-half year period). |
Notes to Expense Table
Expense ratios include 0.07% of investment related expenses from short sales (See Note 2 of the Notes to Financial Statements) that are outside of the expense limitation arrangement (See Note 3 of the Notes to Financial Statements).
3
MFS Technology Portfolio
PORTFOLIO OF INVESTMENTS – 6/30/18 (unaudited)
The Portfolio of Investments is a complete list of all securities owned by your fund. It is categorized by broad-based asset classes.
| | | | | | | | |
| Issuer | | Shares/Par | | | Value ($) | |
| COMMON STOCKS – 99.3% | |
| Aerospace – 3.2% | | | | | |
| CACI International, Inc., “A” (a) | | | 13,183 | | | $ | 2,221,995 | |
| FLIR Systems, Inc. | | | 37,367 | | | | 1,941,963 | |
| Harris Corp. | | | 17,357 | | | | 2,508,781 | |
| Northrop Grumman Corp. | | | 7,382 | | | | 2,271,441 | |
| | | | | | | | |
| | | | | | $ | 8,944,180 | |
| | | | | | | | |
| Biotechnology – 0.6% | | | | | |
| Bio-Techne Corp. | | | 10,881 | | | $ | 1,609,844 | |
| | | | | | | | |
| Broadcasting – 3.1% | | | | | |
| Netflix, Inc. (a) | | | 22,555 | | | $ | 8,828,703 | |
| | | | | | | | |
| Brokerage & Asset Managers – 1.6% | | | | | |
| NASDAQ, Inc. | | | 30,293 | | | $ | 2,764,842 | |
| TD Ameritrade Holding Corp. | | | 33,156 | | | | 1,815,954 | |
| | | | | | | | |
| | | | | | $ | 4,580,796 | |
| | | | | | | | |
| Business Services – 18.0% | | | | | |
| Adyen N.V. (a) | | | 3 | | | $ | 1,653 | |
| Cognizant Technology Solutions Corp., “A” | | | 63,986 | | | | 5,054,254 | |
| Dropbox, Inc. (a) | | | 46,428 | | | | 1,505,196 | |
| DXC Technology Co. | | | 101,555 | | | | 8,186,348 | |
| EVO Payments, Inc., “A” (a) | | | 41,255 | | | | 849,028 | |
| Fidelity National Information Services, Inc. | | | 42,413 | | | | 4,497,050 | |
| First Data Corp. (a) | | | 87,504 | | | | 1,831,459 | |
| Fiserv, Inc. (a) | | | 54,288 | | | | 4,022,198 | |
| FleetCor Technologies, Inc. (a) | | | 13,887 | | | | 2,925,296 | |
| Global Payments, Inc. | | | 42,923 | | | | 4,785,485 | |
| Grand Canyon Education, Inc. (a) | | | 20,861 | | | | 2,328,296 | |
| PagSeguro Digital Ltd. (a) | | | 47,368 | | | | 1,314,462 | |
| PayPal Holdings, Inc. (a) | | | 61,122 | | | | 5,089,629 | |
| Total System Services, Inc. | | | 41,034 | | | | 3,468,194 | |
| TransUnion | | | 30,350 | | | | 2,174,274 | |
| Verisk Analytics, Inc., “A” (a) | | | 15,894 | | | | 1,710,830 | |
| Zendesk, Inc. (a) | | | 23,995 | | | | 1,307,488 | |
| | | | | | | | |
| | | | | | $ | 51,051,140 | |
| | | | | | | | |
| Cable TV – 0.7% | | | | | |
| Comcast Corp., “A” | | | 61,498 | | | $ | 2,017,749 | |
| | | | | | | | |
| Computer Software – 17.7% | | | | | |
| Adobe Systems, Inc. (a) | | | 47,193 | | | $ | 11,506,125 | |
| Autodesk, Inc. (a) | | | 26,144 | | | | 3,427,217 | |
| DocuSign, Inc. (a) | | | 3,108 | | | | 164,569 | |
| Microsoft Corp. | | | 171,197 | | | | 16,881,736 | |
| PTC, Inc. (a) | | | 25,655 | | | | 2,406,696 | |
| Red Hat, Inc. (a) | | | 15,486 | | | | 2,080,854 | |
| RingCentral, Inc. (a) | | | 18,690 | | | | 1,314,841 | |
| Salesforce.com, Inc. (a) | | | 90,332 | | | | 12,321,285 | |
| | | | | | | | |
| | | | | | $ | 50,103,323 | |
| | | | | | | | |
| Computer Software – Systems – 6.9% | | | | | |
| Apple, Inc. | | | 35,172 | | | $ | 6,510,689 | |
| Constellation Software, Inc. | | | 3,493 | | | | 2,708,925 | |
| | | | | | | | |
| Issuer | | Shares/Par | | | Value ($) | |
| COMMON STOCKS – continued | |
| Computer Software – Systems – continued | | | | | |
| EPAM Systems, Inc. (a) | | | 16,978 | | | $ | 2,110,875 | |
| New Relic, Inc. (a) | | | 13,303 | | | | 1,338,149 | |
| Pluralsight, Inc., “A” (a) | | | 17,023 | | | | 416,212 | |
| Presidio, Inc. (a) | | | 188,491 | | | | 2,469,232 | |
| Rapid7, Inc. (a) | | | 49,675 | | | | 1,401,828 | |
| ServiceNow, Inc. (a) | | | 15,174 | | | | 2,617,060 | |
| | | | | | | | |
| | | | | | $ | 19,572,970 | |
| | | | | | | | |
| Consumer Services – 0.3% | | | | | |
| Bookings Holdings, Inc. (a) | | | 348 | | | $ | 705,427 | |
| | | | | | | | |
| Electrical Equipment – 2.0% | | | | | |
| Amphenol Corp., “A” | | | 31,840 | | | $ | 2,774,856 | |
| TE Connectivity Ltd. | | | 32,661 | | | | 2,941,450 | |
| | | | | | | | |
| | | | | | $ | 5,716,306 | |
| | | | | | | | |
| Electronics – 6.2% | | | | | |
| Applied Materials, Inc. | | | 71,914 | | | $ | 3,321,708 | |
| Broadcom, Inc. | | | 19,033 | | | | 4,618,167 | |
| Microchip Technology, Inc. | | | 69,662 | | | | 6,335,759 | |
| NVIDIA Corp. | | | 7,262 | | | | 1,720,368 | |
| Silicon Laboratories, Inc. (a) | | | 16,599 | | | | 1,653,260 | |
| | | | | | | | |
| | | | | | $ | 17,649,262 | |
| | | | | | | | |
| Internet – 21.1% | | | | | |
| Alibaba Group Holding Ltd., ADR (a) | | | 31,945 | | | $ | 5,926,756 | |
| Alphabet, Inc., “A” (a)(s) | | | 23,087 | | | | 26,069,610 | |
| Facebook, Inc., “A” (a)(s) | | | 115,986 | | | | 22,538,399 | |
| Godaddy, Inc. (a) | | | 39,083 | | | | 2,759,260 | |
| iQiyi, Inc., ADR (a) | | | 75,380 | | | | 2,434,774 | |
| | | | | | | | |
| | | | | | $ | 59,728,799 | |
| | | | | | | | |
| Leisure & Toys – 3.7% | | | | | |
| Activision Blizzard, Inc. | | | 53,429 | | | $ | 4,077,702 | |
| Electronic Arts, Inc. (a) | | | 28,762 | | | | 4,056,017 | |
| Take-Two Interactive Software, Inc. (a) | | | 19,723 | | | | 2,334,414 | |
| | | | | | | | |
| | | | | | $ | 10,468,133 | |
| | | | | | | | |
| Other Banks & Diversified Financials – 6.9% | | | | | |
| Mastercard, Inc., “A” | | | 47,961 | | | $ | 9,425,296 | |
| Visa, Inc., “A” | | | 75,058 | | | | 9,941,432 | |
| | | | | | | | |
| | | | | | $ | 19,366,728 | |
| | | | | | | | |
| Printing & Publishing – 0.7% | | | | | |
| IHS Markit Ltd. (a) | | | 39,298 | | | $ | 2,027,384 | |
| | | | | | | | |
| Specialty Stores – 6.6% | | | | | |
| Amazon.com, Inc. (a)(s) | | | 10,945 | | | $ | 18,604,311 | |
| | | | | | | | |
Total Common Stocks
(Identified Cost, $160,235,012) | | | | | | $ | 280,975,055 | |
| | | | | | | | |
| |
| INVESTMENT COMPANIES (h) – 0.6% | | | | | |
| Money Market Funds – 0.6% | | | | | |
| MFS Institutional Money Market Portfolio, 1.9% (v) (Identified Cost, $1,676,398) | | | 1,676,566 | | | $ | 1,676,566 | |
| | | | | | | | |
4
MFS Technology Portfolio
Portfolio of Investments (unaudited) – continued
| | | | | | | | |
| Issuer | | Shares/Par | | | Value ($) | |
| SECURITIES SOLD SHORT – (2.0)% | �� |
| Computer Software – (2.0)% | | | | | | | | |
| CA, Inc. | | | (98,513 | ) | | $ | (3,511,988 | ) |
| SAP SE, ADR | | | (18,286 | ) | | | (2,114,959 | ) |
| | | | | | | | |
| Total Securities Sold Short (Proceeds Received, $5,393,182) | | | | | | $ | (5,626,947 | ) |
| | | | | | | | |
OTHER ASSETS, LESS
LIABILITIES – 2.1% | | | | | | | 6,026,146 | |
| | | | | | | | |
| NET ASSETS – 100.0% | | | | | | $ | 283,050,820 | |
| | | | | | | | |
| (a) | | Non-income producing security. |
| (h) | | An affiliated issuer, which may be considered one in which the fund owns 5% or more of the outstanding voting securities, or a company which is under common control. At period end, the aggregate values of the fund’s investments in affiliated issuers and in unaffiliated issuers were $1,676,566 and $280,975,055, respectively. |
| (s) | | Security or a portion of the security was pledged to cover collateral requirements for securities sold short. |
| (v) | | Affiliated issuer that is available only to investment companies managed by MFS. The rate quoted for the MFS Institutional Money Market Portfolio is the annualized seven-day yield of the fund at period end. |
The following abbreviations are used in this report and are defined:
| ADR | | American Depositary Receipt |
At June 30, 2018, the fund had cash collateral of $4,203,746 and other liquid securities with an aggregate value of $8,301,987 to cover any collateral or margin obligations for securities sold short. Restricted cash and deposits with brokers in the Statement of Assets and Liabilities are comprised of cash collateral.
See Notes to Financial Statements
5
MFS Technology Portfolio
FINANCIAL STATEMENTS | STATEMENT OF ASSETS AND LIABILITIES (unaudited)
This statement represents your fund’s balance sheet, which details the assets and liabilities comprising the total value of the fund.
| | | | |
At 6/30/18 | | | | |
Assets | | | | |
Investments in unaffiliated issuers, at value (identified cost, $160,235,012) | | | $280,975,055 | |
Investments in affiliated issuers, at value (identified cost, $1,676,398) | | | 1,676,566 | |
Cash | | | 502,687 | |
Deposits with brokers for | | | | |
Securities sold short | | | 4,203,746 | |
Receivables for | | | | |
Investments sold | | | 1,448,282 | |
Fund shares sold | | | 796,920 | |
Interest and dividends | | | 34,246 | |
Other assets | | | 864 | |
Total assets | | | $289,638,366 | |
Liabilities | | | | |
Payables for | | | | |
Securities sold short, at value (proceeds received, $5,393,182) | | | $5,626,947 | |
Investments purchased | | | 502,687 | |
Fund shares reacquired | | | 371,371 | |
Payable to affiliates | | | | |
Investment adviser | | | 17,558 | |
Shareholder servicing costs | | | 81 | |
Distribution and/or service fees | | | 5,140 | |
Payable for independent Trustees’ compensation | | | 100 | |
Accrued expenses and other liabilities | | | 63,662 | |
Total liabilities | | | $6,587,546 | |
Net assets | | | $283,050,820 | |
Net assets consist of | | | | |
Paid-in capital | | | $147,571,341 | |
Unrealized appreciation (depreciation) | | | 120,506,446 | |
Accumulated net realized gain (loss) | | | 15,668,208 | |
Accumulated net investment loss | | | (695,175 | ) |
Net assets | | | $283,050,820 | |
Shares of beneficial interest outstanding | | | 14,119,621 | |
| | | | | | | | | | | | |
| | | Net assets | | | Shares
outstanding | | | Net asset value
per share | |
Initial Class | | | $31,632,300 | | | | 1,509,963 | | | | $20.95 | |
Service Class | | | 251,418,520 | | | | 12,609,658 | | | | 19.94 | |
See Notes to Financial Statements
6
MFS Technology Portfolio
FINANCIAL STATEMENTS | STATEMENT OF OPERATIONS (unaudited)
This statement describes how much your fund earned in investment income and accrued in expenses. It also describes any gains and/or losses generated by fund operations.
| | | | |
Six months ended 6/30/18 | | | | |
Net investment income (loss) | | | | |
Income | | | | |
Dividends | | | $665,552 | |
Other | | | 33,029 | |
Dividends from affiliated issuers | | | 28,360 | |
Income on securities loaned | | | 12,557 | |
Foreign taxes withheld | | | (1,049 | ) |
Total investment income | | | $738,449 | |
Expenses | | | | |
Management fee | | | $975,182 | |
Distribution and/or service fees | | | 287,318 | |
Shareholder servicing costs | | | 5,854 | |
Administrative services fee | | | 24,442 | |
Independent Trustees’ compensation | | | 4,189 | |
Custodian fee | | | 7,576 | |
Shareholder communications | | | 11,805 | |
Audit and tax fees | | | 27,444 | |
Legal fees | | | 1,136 | |
Dividend and interest expense on securities sold short | | | 90,758 | |
Miscellaneous | | | 9,937 | |
Total expenses | | | $1,445,641 | |
Reduction of expenses by investment adviser | | | (12,017 | ) |
Net expenses | | | $1,433,624 | |
Net investment income (loss) | | | $(695,175 | ) |
Realized and unrealized gain (loss) | | | | |
Realized gain (loss) (identified cost basis) | | | | |
Unaffiliated issuers | | | $7,247,442 | |
Affiliated issuers | | | (199 | ) |
Securities sold short | | | (348,234 | ) |
Foreign currency | | | (7 | ) |
Net realized gain (loss) | | | $6,899,002 | |
Change in unrealized appreciation or depreciation | | | | |
Unaffiliated issuers | | | $32,733,815 | |
Affiliated issuers | | | 168 | |
Securities sold short | | | (245,419 | ) |
Net unrealized gain (loss) | | | $32,488,564 | |
Net realized and unrealized gain (loss) | | | $39,387,566 | |
Change in net assets from operations | | | $38,692,391 | |
See Notes to Financial Statements
7
MFS Technology Portfolio
FINANCIAL STATEMENTS | STATEMENTS OF CHANGES IN NET ASSETS
These statements describe the increases and/or decreases in net assets resulting from operations, any distributions, and any shareholder transactions.
| | | | | | | | |
| | | Six months ended
6/30/18 | | | Year ended
12/31/17 | |
| | | (unaudited) | | | | |
Change in net assets | | | | | | | | |
From operations | | | | | | | | |
Net investment income (loss) | | | $(695,175 | ) | | | $(967,974 | ) |
Net realized gain (loss) | | | 6,899,002 | | | | 11,114,663 | |
Net unrealized gain (loss) | | | 32,488,564 | | | | 48,774,621 | |
Change in net assets from operations | | | $38,692,391 | | | | $58,921,310 | |
Distributions declared to shareholders | | | | | | | | |
From net realized gain | | | $— | | | | $(4,319,221 | ) |
Change in net assets from fund share transactions | | | $13,089,879 | | | | $34,910,824 | |
Total change in net assets | | | $51,782,270 | | | | $89,512,913 | |
Net assets | | | | | | | | |
At beginning of period | | | 231,268,550 | | | | 141,755,637 | |
At end of period (including accumulated net investment loss of $695,175 and
$0, respectively) | | | $283,050,820 | | | | $231,268,550 | |
See Notes to Financial Statements
8
MFS Technology Portfolio
FINANCIAL STATEMENTS | FINANCIAL HIGHLIGHTS
The financial highlights table is intended to help you understand the fund’s financial performance for the semiannual period and the past 5 fiscal years. Certain information reflects financial results for a single fund share. The total returns in the table represent the rate that an investor would have earned (or lost) on an investment in the fund share class (assuming reinvestment of all distributions) held for the entire period.
| | | | | | | | | | | | | | | | | | | | | | | | |
| Initial Class | | Six months ended 6/30/18 | | | Year ended | |
| | | | 12/31/17 | | | 12/31/16 | | | 12/31/15 | | | 12/31/14 | | | 12/31/13 | |
| | | (unaudited) | | | | | | | | | | | | | | | | |
Net asset value, beginning of period | | | $17.96 | | | | $13.19 | | | | $12.45 | | | | $11.63 | | | | $10.71 | | | | $7.93 | |
| Income (loss) from investment operations | | | | | | | | | | | | | | | | | |
Net investment income (loss) (d) | | | $(0.03 | ) | | | $(0.05 | ) | | | $(0.01 | )(c) | | | $(0.03 | ) | | | $(0.02 | ) | | | $(0.02 | ) |
Net realized and unrealized gain (loss) | | | 3.02 | | | | 5.16 | | | | 1.10 | | | | 1.22 | | | | 1.16 | | | | 2.81 | |
Total from investment operations | | | $2.99 | | | | $5.11 | | | | $1.09 | | | | $1.19 | | | | $1.14 | | | | $2.79 | |
| Less distributions declared to shareholders | | | | | | | | | | | | | | | | | |
From net realized gain | | | $— | | | | $(0.34 | ) | | | $(0.35 | ) | | | $(0.37 | ) | | | $(0.22 | ) | | | $(0.01 | ) |
Net asset value, end of period (x) | | | $20.95 | | | | $17.96 | | | | $13.19 | | | | $12.45 | | | | $11.63 | | | | $10.71 | |
Total return (%) (k)(r)(s)(x) | | | 16.65 | (n) | | | 39.00 | | | | 8.69 | (c) | | | 10.75 | | | | 10.71 | | | | 35.18 | |
Ratios (%) (to average net assets)
and Supplemental data: | | | | | | | | | | | | | |
Expenses before expense reductions (f) | | | 0.89 | (a) | | | 0.88 | | | | 0.85 | (c) | | | 0.91 | | | | 0.94 | | | | 1.05 | |
Expenses after expense reductions (f) | | | 0.88 | (a) | | | 0.88 | | | | 0.85 | (c) | | | 0.91 | | | | 0.93 | | | | 1.05 | |
Net investment income (loss) | | | (0.31 | )(a) | | | (0.29 | ) | | | (0.10 | )(c) | | | (0.22 | ) | | | (0.20 | ) | | | (0.27 | ) |
Portfolio turnover | | | 15 | (n) | | | 31 | | | | 36 | | | | 45 | | | | 35 | | | | 48 | |
Net assets at end of period (000 omitted) | | | $31,632 | | | | $27,659 | | | | $15,195 | | | | $15,588 | | | | $16,062 | | | | $15,428 | |
| Supplemental Ratios (%): | | | | | | | | | | | | | | | | | | | | | | | | |
Ratio of expenses to average net assets after expense reductions
excluding short sale expenses (f) | | | 0.81 | | | | 0.85 | | | | 0.82 | (c) | | | 0.89 | | | | 0.91 | | | | 0.95 | |
| | |
| Service Class | | Six months ended
6/30/18 | | | Year ended | |
| | | | 12/31/17 | | | 12/31/16 | | | 12/31/15 | | | 12/31/14 | | | 12/31/13 | |
| | | (unaudited) | | | | | | | | | | | | | | | | |
Net asset value, beginning of period | | | $17.11 | | | | $12.61 | | | | $11.95 | | | | $11.20 | | | | $10.35 | | | | $7.69 | |
| Income (loss) from investment operations | | | | | | | | | | | | | |
Net investment income (loss) (d) | | | $(0.05 | ) | | | $(0.08 | ) | | | $(0.04 | )(c) | | | $(0.05 | ) | | | $(0.05 | ) | | | $(0.05 | ) |
Net realized and unrealized gain (loss) | | | 2.88 | | | | 4.92 | | | | 1.05 | | | | 1.17 | | | | 1.12 | | | | 2.72 | |
Total from investment operations | | | $2.83 | | | | $4.84 | | | | $1.01 | | | | $1.12 | | | | $1.07 | | | | $2.67 | |
| Less distributions declared to shareholders | | | | | | | | | | | | | |
From net realized gain | | | $— | | | | $(0.34 | ) | | | $(0.35 | ) | | | $(0.37 | ) | | | $(0.22 | ) | | | $(0.01 | ) |
Net asset value, end of period (x) | | | $19.94 | | | | $17.11 | | | | $12.61 | | | | $11.95 | | | | $11.20 | | | | $10.35 | |
Total return (%) (k)(r)(s)(x) | | | 16.54 | (n) | | | 38.65 | | | | 8.39 | (c) | | | 10.53 | | | | 10.40 | | | | 34.72 | |
Ratios (%) (to average net assets)
and Supplemental data: | | | | | | | | | | | | | | | | | | | | | | | | |
Expenses before expense reductions (f) | | | 1.14 | (a) | | | 1.14 | | | | 1.10 | (c) | | | 1.16 | | | | 1.19 | | | | 1.30 | |
Expenses after expense reductions (f) | | | 1.13 | (a) | | | 1.13 | | | | 1.10 | (c) | | | 1.16 | | | | 1.18 | | | | 1.30 | |
Net investment income (loss) | | | (0.56 | )(a) | | | (0.53 | ) | | | (0.35 | )(c) | | | (0.47 | ) | | | (0.45 | ) | | | (0.52 | ) |
Portfolio turnover | | | 15 | (n) | | | 31 | | | | 36 | | | | 45 | | | | 35 | | | | 48 | |
Net assets at end of period (000 omitted) | | | $251,419 | | | | $203,610 | | | | $126,561 | | | | $106,002 | | | | $81,693 | | | | $58,379 | |
| Supplemental Ratios (%): | | | | | | | | | | | | | | | | | | | | | | | | |
Ratio of expenses to average net assets after expense reductions
excluding short sale expenses (f) | | | 1.06 | | | | 1.10 | | | | 1.06 | (c) | | | 1.14 | | | | 1.16 | | | | 1.20 | |
See Notes to Financial Statements
9
MFS Technology Portfolio
Financial Highlights – continued
| (c) | Amount reflects a one-time reimbursement of expenses by the custodian (or former custodian) without which net investment income and performance would be lower and expenses would be higher. |
| (d) | Per share data is based on average shares outstanding. |
| (f) | Ratios do not reflect reductions from fees paid indirectly, if applicable. |
| (k) | The total return does not reflect expenses that apply to separate accounts. Inclusion of these charges would reduce the total return figures for all periods shown. |
| (r) | Certain expenses have been reduced without which performance would have been lower. |
| (s) | From time to time the fund may receive proceeds from litigation settlements, without which performance would be lower. |
| (x) | The net asset values and total returns have been calculated on net assets which include adjustments made in accordance with U.S. generally accepted accounting principles required at period end for financial reporting purposes. |
See Notes to Financial Statements
10
MFS Technology Portfolio
NOTES TO FINANCIAL STATEMENTS (unaudited)
| (1) | | Business and Organization |
MFS Technology Portfolio (the fund) is a non-diversified series of MFS Variable Insurance Trust II (the trust). The trust is organized as a Massachusetts business trust and is registered under the Investment Company Act of 1940, as amended, as an open-end management investment company. The shareholders of each series of the trust are separate accounts of insurance companies, which offer variable annuity and/or life insurance products, and qualified retirement and pension plans.
The fund is an investment company and accordingly follows the investment company accounting and reporting guidance of the Financial Accounting Standards Board (FASB) Accounting Standards Codification Topic 946 Financial Services – Investment Companies.
| (2) | | Significant Accounting Policies |
General – The preparation of financial statements in conformity with U.S. generally accepted accounting principles requires management to make estimates and assumptions that affect the reported amounts of assets and liabilities, and disclosure of contingent assets and liabilities at the date of the financial statements and the reported amounts of increases and decreases in net assets from operations during the reporting period. Actual results could differ from those estimates. In the preparation of these financial statements, management has evaluated subsequent events occurring after the date of the fund’s Statement of Assets and Liabilities through the date that the financial statements were issued. The fund invests primarily in securities of issuers in the technology industry. Issuers in a single industry can react similarly to market, currency, political, economic, regulatory, geopolitical, and other conditions. The value of stocks in the technology sector can be very volatile due to the rapid pace of product change, technological developments, and other factors.
Balance Sheet Offsetting – The fund’s accounting policy with respect to balance sheet offsetting is that, absent an event of default by the counterparty or a termination of the agreement, the International Swaps and Derivatives Association (ISDA) Master Agreement, or similar agreement, does not result in an offset of reported amounts of financial assets and financial liabilities in the Statement of Assets and Liabilities across transactions between the fund and the applicable counterparty. The fund’s right to setoff may be restricted or prohibited by the bankruptcy or insolvency laws of the particular jurisdiction to which a specific master netting agreement counterparty is subject. Balance sheet offsetting disclosures, to the extent applicable to the fund, have been included in the fund’s Significant Accounting Policies note under the captions for each of the fund’s in-scope financial instruments and transactions.
Investment Valuations – Equity securities, including restricted equity securities and equity securities held short, are generally valued at the last sale or official closing price on their primary market or exchange as provided by a third-party pricing service. Equity securities, for which there were no sales reported that day, are generally valued at the last quoted daily bid quotation on their primary market or exchange as provided by a third-party pricing service. Equity securities held short, for which there were no sales reported for that day, are generally valued at the last quoted daily ask quotation on their primary market or exchange as provided by a third-party pricing service. Short-term instruments with a maturity at issuance of 60 days or less may be valued at amortized cost, which approximates market value. Open-end investment companies are generally valued at net asset value per share. Securities and other assets generally valued on the basis of information from a third-party pricing service may also be valued at a broker/dealer bid quotation. In determining values, third-party pricing services can utilize both transaction data and market information such as yield, quality, coupon rate, maturity, type of issue, trading characteristics, and other market data. The values of foreign securities and other assets and liabilities expressed in foreign currencies are converted to U.S. dollars using the mean of bid and asked prices for rates provided by a third-party pricing service.
The Board of Trustees has delegated primary responsibility for determining or causing to be determined the value of the fund’s investments (including any fair valuation) to the adviser pursuant to valuation policies and procedures approved by the Board. If the adviser determines that reliable market quotations are not readily available, investments are valued at fair value as determined in good faith by the adviser in accordance with such procedures under the oversight of the Board of Trustees. Under the fund’s valuation policies and procedures, market quotations are not considered to be readily available for most types of debt instruments and floating rate loans and many types of derivatives. These investments are generally valued at fair value based on information from third-party pricing services. In addition, investments may be valued at fair value if the adviser determines that an investment’s value has been materially affected by events occurring after the close of the exchange or market on which the investment is principally traded (such as foreign exchange or market) and prior to the determination of the fund’s net asset value, or after the halting of trading of a specific security where trading does not resume prior to the close of the exchange or market on which the security is principally traded. Events that occur on a frequent basis after foreign markets close (such as developments in foreign markets and significant movements in the U.S. markets) and prior to the determination of the fund’s net asset value may be deemed to have a material effect on the value of securities traded in foreign markets. Accordingly, the fund’s foreign equity securities may often be valued at fair value. The adviser generally relies on third-party pricing services or other information (such as the correlation with price movements of similar securities in the same or other markets; the type, cost and investment characteristics of the security; the
11
MFS Technology Portfolio
Notes to Financial Statements (unaudited) – continued
business and financial condition of the issuer; and trading and other market data) to assist in determining whether to fair value and at what value to fair value an investment. The value of an investment for purposes of calculating the fund’s net asset value can differ depending on the source and method used to determine value. When fair valuation is used, the value of an investment used to determine the fund’s net asset value may differ from quoted or published prices for the same investment. There can be no assurance that the fund could obtain the fair value assigned to an investment if it were to sell the investment at the same time at which the fund determines its net asset value per share.
Various inputs are used in determining the value of the fund’s assets or liabilities. These inputs are categorized into three broad levels. In certain cases, the inputs used to measure fair value may fall into different levels of the fair value hierarchy. In such cases, an investment’s level within the fair value hierarchy is based on the lowest level of input that is significant to the fair value measurement. The fund’s assessment of the significance of a particular input to the fair value measurement in its entirety requires judgment, and considers factors specific to the investment. Level 1 includes unadjusted quoted prices in active markets for identical assets or liabilities. Level 2 includes other significant observable market-based inputs (including quoted prices for similar securities, interest rates, prepayment speed, and credit risk). Level 3 includes unobservable inputs, which may include the adviser’s own assumptions in determining the fair value of investments. The following is a summary of the levels used as of June 30, 2018 in valuing the fund’s assets or liabilities:
| | | | | | | | | | | | | | | | |
| Financial Instruments | | Level 1 | | | Level 2 | | | Level 3 | | | Total | |
| Equity Securities | | | $280,975,055 | | | | $— | | | | $— | | | | $280,975,055 | |
| Mutual Funds | | | 1,676,566 | | | | — | | | | — | | | | 1,676,566 | |
| Total | | | $282,651,621 | | | | $— | | | | $— | | | | $282,651,621 | |
| Securities Sold Short | | | $(5,626,947 | ) | | | $— | | | | $— | | | | $(5,626,947 | ) |
For further information regarding security characteristics, see the Portfolio of Investments.
Foreign Currency Translation – Purchases and sales of foreign investments, income, and expenses are converted into U.S. dollars based upon currency exchange rates prevailing on the respective dates of such transactions or on the reporting date for foreign denominated receivables and payables. Gains and losses attributable to foreign currency exchange rates on sales of securities are recorded for financial statement purposes as net realized gains and losses on investments. Gains and losses attributable to foreign exchange rate movements on receivables, payables, income and expenses are recorded for financial statement purposes as foreign currency transaction gains and losses. That portion of both realized and unrealized gains and losses on investments that results from fluctuations in foreign currency exchange rates is not separately disclosed.
Short Sales – The fund entered into short sales whereby it sells a security it does not own in anticipation of a decline in the value of that security. The fund will realize a gain if the security price decreases and a loss if the security price increases between the date of the short sale and the date on which the fund replaces the borrowed security. Losses from short sales can exceed the proceeds of the security sold; and they can also exceed the potential loss from an ordinary buy and sell transaction. The amount of any premium, dividends, or interest the fund may be required to pay in connection with a short sale will be recognized as a fund expense. During the six months ended June 30, 2018, this expense amounted to $90,758. The fund segregates cash or marketable securities in an amount that, when combined with the amount of proceeds from the short sale deposited with the broker, at least equals the current market value of the security sold short.
Security Loans – Under its Securities Lending Agency Agreement with the fund, State Street Bank and Trust Company (“State Street”), as lending agent, loans the securities of the fund to certain qualified institutions (the “Borrowers”) approved by the fund. Security loans can be terminated at the discretion of either the lending agent or the fund and the related securities must be returned within the earlier of the standard trade settlement period for such securities or within three business days. The loans are collateralized by cash and/or U.S. Treasury and federal agency obligations in an amount typically at least equal to the market value of the securities loaned. On loans collateralized by cash, the cash collateral is invested in a money market fund. The market value of the loaned securities is determined at the close of business of the fund and any additional required collateral is delivered to the fund on the next business day. State Street provides the fund with indemnification against Borrower default. In the event of Borrower default, State Street will, for the benefit of the fund, either purchase securities identical to those loaned or, when such purchase is commercially impracticable, pay the fund the market value of the loaned securities. In return, State Street assumes the fund’s rights to the related collateral. If the collateral value is less than the cost to purchase identical securities, State Street is responsible for the shortfall, but only to the extent that such shortfall is not due to a decline in collateral value resulting from collateral reinvestment for which the fund bears the risk of loss. A portion of the income generated upon investment of the collateral is remitted to the Borrowers, and the remainder is allocated between the fund and the lending agent. On loans collateralized by U.S. Treasury and/or federal agency obligations, a fee is received from the Borrower, and is allocated between the fund and the lending agent. Income from securities lending is separately reported in the Statement of Operations. The dividend and interest income earned on the securities loaned is accounted for in the same manner as other dividend and interest income. At June 30, 2018, there were no securities on loan or collateral outstanding.
12
MFS Technology Portfolio
Notes to Financial Statements (unaudited) – continued
Indemnifications – Under the fund’s organizational documents, its officers and Trustees may be indemnified against certain liabilities and expenses arising out of the performance of their duties to the fund. Additionally, in the normal course of business, the fund enters into agreements with service providers that may contain indemnification clauses. The fund’s maximum exposure under these agreements is unknown as this would involve future claims that may be made against the fund that have not yet occurred.
Investment Transactions and Income – Investment transactions are recorded on the trade date. Interest income is recorded on the accrual basis. Dividends received in cash are recorded on the ex-dividend date. Certain dividends from foreign securities will be recorded when the fund is informed of the dividend if such information is obtained subsequent to the ex-dividend date. Dividend and interest payments received in additional securities are recorded on the ex-dividend or ex-interest date in an amount equal to the value of the security on such date.
The fund may receive proceeds from litigation settlements. Any proceeds received from litigation involving portfolio holdings are reflected in the Statement of Operations in realized gain/loss if the security has been disposed of by the fund or in unrealized gain/loss if the security is still held by the fund. Any other proceeds from litigation not related to portfolio holdings are reflected as other income in the Statement of Operations.
Tax Matters and Distributions – The fund intends to qualify as a regulated investment company, as defined under Subchapter M of the Internal Revenue Code, and to distribute all of its taxable income, including realized capital gains. As a result, no provision for federal income tax is required. The fund’s federal tax returns, when filed, will remain subject to examination by the Internal Revenue Service for a three year period. Management has analyzed the fund’s tax positions taken on federal and state tax returns for all open tax years and does not believe that there are any uncertain tax positions that require recognition of a tax liability. Foreign taxes, if any, have been accrued by the fund in the accompanying financial statements in accordance with the applicable foreign tax law. Foreign income taxes may be withheld by certain countries in which the fund invests. Additionally, capital gains realized by the fund on securities issued in or by certain foreign countries may be subject to capital gains tax imposed by those countries.
Distributions to shareholders are recorded on the ex-dividend date. Income and capital gain distributions are determined in accordance with income tax regulations, which may differ from U.S. generally accepted accounting principles. Certain capital accounts in the financial statements are periodically adjusted for permanent differences in order to reflect their tax character. These adjustments have no impact on net assets or net asset value per share. Temporary differences which arise from recognizing certain items of income, expense, gain or loss in different periods for financial statement and tax purposes will reverse at some time in the future. Distributions in excess of net investment income or net realized gains are temporary overdistributions for financial statement purposes resulting from differences in the recognition or classification of income or distributions for financial statement and tax purposes.
Book/tax differences primarily relate to wash sale loss deferral and straddle loss deferrals.
The tax character of distributions made during the current period will be determined at fiscal year end. The tax character of distributions declared to shareholders for the last fiscal year is as follows:
| | | | |
| | | Year ended
12/31/17 | |
| Ordinary income (including any short-term capital gains) | | | $829,123 | |
| Long-term capital gains | | | 3,490,098 | |
| Total distributions | | | $4,319,221 | |
The federal tax cost and the tax basis components of distributable earnings were as follows:
| | | | |
| As of 6/30/18 | | | | |
| Cost of investments | | | $163,219,116 | |
| Gross appreciation | | | 120,491,792 | |
| Gross depreciation | | | (1,059,287 | ) |
| Net unrealized appreciation (depreciation) | | | $119,432,505 | |
| |
| As of 12/31/17 | | | | |
| Undistributed ordinary income | | | 2,704,259 | |
| Undistributed long-term capital gain | | | 7,359,605 | |
| Net unrealized appreciation (depreciation) | | | 86,723,224 | |
The aggregate cost above includes prior fiscal year end tax adjustments, if applicable.
13
MFS Technology Portfolio
Notes to Financial Statements (unaudited) – continued
Multiple Classes of Shares of Beneficial Interest – The fund offers multiple classes of shares, which differ in their respective distribution and/or service fees. The fund’s income, realized and unrealized gain (loss), and common expenses are allocated to shareholders based on the daily net assets of each class. Dividends are declared separately for each class. Differences in per share dividend rates are generally due to differences in separate class expenses.
| | | | | | | | |
| | | From net realized gain | |
| | | Six months ended
6/30/18 | | | Year ended
12/31/17 | |
| Initial Class | | | $— | | | | $498,246 | |
| Service Class | | | — | | | | 3,820,975 | |
| Total | | | $— | | | | $4,319,221 | |
| (3) | | Transactions with Affiliates |
Investment Adviser – The fund has an investment advisory agreement with MFS to provide overall investment management and related administrative services and facilities to the fund. The management fee is computed daily and paid monthly at the following annual rates based on the fund’s average daily net assets:
| | | | |
| Up to $1 billion | | | 0.75% | |
| In excess of $1 billion | | | 0.70% | |
MFS has agreed in writing to reduce its management fee by a specified amount if certain MFS mutual fund assets exceed thresholds agreed to by MFS and the fund’s Board of Trustees. For the six months ended June 30, 2018, this management fee reduction amounted to $12,017, which is included in the reduction of total expenses in the Statement of Operations. The management fee incurred for the six months ended June 30, 2018 was equivalent to an annual effective rate of 0.74% of the fund’s average daily net assets.
The investment adviser has agreed in writing to pay a portion of the fund’s total annual operating expenses, excluding interest, taxes, extraordinary expenses, brokerage and transaction costs, and investment-related expenses (such as short sale dividend and interest expenses incurred in connection with the fund’s investment activity), such that total annual operating expenses do not exceed 1.00% of average daily net assets for the Initial Class shares and 1.25% of average daily net assets for the Service Class shares. This written agreement will continue until modified by the fund’s Board of Trustees, but such agreement will continue at least until April 30, 2020. For the six months ended June 30, 2018, the fund’s actual operating expenses did not exceed the limit and therefore, the investment advisor did not pay any portion of the fund’s expenses related to this agreement.
Distributor – MFS Fund Distributors, Inc. (MFD), a wholly-owned subsidiary of MFS, is the distributor of shares of the fund. The Trustees have adopted a distribution plan for the Service Class shares pursuant to Rule 12b-1 under the Investment Company Act of 1940.
The fund’s distribution plan provides that the fund will pay MFD distribution and/or service fees equal to 0.25% per annum of its average daily net assets attributable to Service Class shares as partial consideration for services performed and expenses incurred by MFD and financial intermediaries (including participating insurance companies that invest in the fund to fund variable annuity and variable life insurance contracts, sponsors of qualified retirement and pension plans that invest in the fund, and affiliates of these participating insurance companies and plan sponsors) in connection with the sale and distribution of the Service Class shares. MFD may subsequently pay all, or a portion, of the distribution and/or service fees to financial intermediaries.
Shareholder Servicing Agent – MFS Service Center, Inc. (MFSC), a wholly-owned subsidiary of MFS, receives a fee from the fund for its services as shareholder servicing agent. For the six months ended June 30, 2018, the fee was $5,789, which equated to 0.0044% annually of the fund’s average daily net assets. MFSC also receives payment from the fund for out-of-pocket expenses paid by MFSC on behalf of the fund. For the six months ended June 30, 2018, these costs amounted to $65.
Administrator – MFS provides certain financial, legal, shareholder communications, compliance, and other administrative services to the fund. Under an administrative services agreement, the fund reimburses MFS the costs incurred to provide these services. The fund is charged an annual fixed amount of $17,500 plus a fee based on average daily net assets. The administrative services fee incurred for the six months ended June 30, 2018 was equivalent to an annual effective rate of 0.0188% of the fund’s average daily net assets.
Trustees’ and Officers’ Compensation – The fund pays compensation to independent Trustees in the form of a retainer, attendance fees, and additional compensation to Board and Committee chairpersons. The fund does not pay compensation directly to Trustees or officers of the fund who are also officers of the investment adviser, all of whom receive remuneration for their services to the fund from MFS. Certain officers and Trustees of the fund are officers or directors of MFS, MFD, and MFSC.
Other – This fund and certain other funds managed by MFS (the funds) have entered into a service agreement (the ISO Agreement) which provides for payment of fees solely by the funds to Tarantino LLC in return for the provision of services of an Independent
14
MFS Technology Portfolio
Notes to Financial Statements (unaudited) – continued
Senior Officer (ISO) for the funds. Frank L. Tarantino serves as the ISO and is an officer of the funds and the sole member of Tarantino LLC. The funds can terminate the ISO Agreement with Tarantino LLC at any time under the terms of the ISO Agreement. For the six months ended June 30, 2018, the fee paid by the fund under this agreement was $188 and is included in “Miscellaneous” expense in the Statement of Operations. MFS has agreed to bear all expenses associated with office space, other administrative support, and supplies provided to the ISO.
The fund invests in the MFS Institutional Money Market Portfolio which is managed by MFS and seeks current income consistent with preservation of capital and liquidity. This money market fund does not pay a management fee to MFS.
Effective January 2, 2018, the adviser has voluntarily undertaken to reimburse the fund from its own resources on a quarterly basis for the cost of investment research embedded in the cost of the fund’s securities trades. This agreement may be rescinded at any time. For the period January 2, 2018 to June 30, 2018, this reimbursement amounted to $8,406, which is included in “Other” income in the Statement of Operations.
For the six months ended June 30, 2018, purchases and sales of investments, other than short sales, and short-term obligations, aggregated $53,803,286 and $37,989,203, respectively.
| (5) | | Shares of Beneficial Interest |
The fund’s Declaration of Trust permits the Trustees to issue an unlimited number of full and fractional shares of beneficial interest. Transactions in fund shares were as follows:
| | | | | | | | | | | | | | | | |
| | | Six months ended 6/30/18 | | | Year ended 12/31/17 | |
| | | Shares | | | Amount | | | Shares | | | Amount | |
| Shares sold | | | | | | | | | | | | | | | | |
Initial Class | | | 44,177 | | | | $902,857 | | | | 570,136 | | | | $9,085,607 | |
Service Class | | | 1,464,438 | | | | 27,727,806 | | | | 3,158,826 | | | | 49,001,289 | |
| | | 1,508,615 | | | | $28,630,663 | | | | 3,728,962 | | | | $58,086,896 | |
| Shares issued to shareholders in reinvestment of distributions | | | | | | | | | | | | | | | | |
Initial Class | | | — | | | | $— | | | | 30,178 | | | | $498,246 | |
Service Class | | | — | | | | — | | | | 242,602 | | | | 3,820,974 | |
| | | — | | | | $— | | | | 272,780 | | | | $4,319,220 | |
| Shares reacquired | | | | | | | | | | | | | | | | |
Initial Class | | | (74,479 | ) | | | $(1,483,927 | ) | | | (212,150 | ) | | | $(3,419,215 | ) |
Service Class | | | (753,353 | ) | | | (14,056,857 | ) | | | (1,538,347 | ) | | | (24,076,077 | ) |
| | | (827,832 | ) | | | $(15,540,784 | ) | | | (1,750,497 | ) | | | $(27,495,292 | ) |
| Net change | | | | | | | | | | | | | | | | |
Initial Class | | | (30,302 | ) | | | $(581,070 | ) | | | 388,164 | | | | $6,164,638 | |
Service Class | | | 711,085 | | | | 13,670,949 | | | | 1,863,081 | | | | 28,746,186 | |
| | | 680,783 | | | | $13,089,879 | | | | 2,251,245 | | | | $34,910,824 | |
The fund and certain other funds managed by MFS participate in a $1.25 billion unsecured committed line of credit, subject to a $1 billion sublimit, provided by a syndication of banks under a credit agreement. Borrowings may be made for temporary financing needs. Interest is charged to each fund, based on its borrowings, generally at a rate equal to the higher of the Overnight Bank Funding rate or daily one month LIBOR plus an agreed upon spread. A commitment fee, based on the average daily, unused portion of the committed line of credit, is allocated among the participating funds. In addition, the fund and other funds managed by MFS have established unsecured uncommitted borrowing arrangements with certain banks for temporary financing needs. Interest is charged to each fund, based on its borrowings, at a rate equal to the Overnight Bank Funding rate plus an agreed upon spread. For the six months ended June 30, 2018, the fund’s commitment fee and interest expense were $666 and $0, respectively, and are included in “Miscellaneous” expense in the Statement of Operations.
15
MFS Technology Portfolio
Notes to Financial Statements (unaudited) – continued
| (7) | | Investments in Affiliated Issuers |
An affiliated issuer may be considered one in which the fund owns 5% or more of the outstanding voting securities, or a company which is under common control. For the purposes of this report, the fund assumes the following to be affiliated issuers:
| | | | | | | | | | | | | | | | | | |
| Affiliated Issuers | | | | Beginning
Shares/Par
Amount | | | Acquisitions
Shares/Par
Amount | | | Dispositions
Shares/Par
Amount | | | Ending
Shares/Par
Amount | |
| MFS Institutional Money Market Portfolio | | | | | 6,212,316 | | | | 27,674,503 | | | | (32,210,253 | ) | | | 1,676,566 | |
| | | | | |
| Affiliated Issuers | | Realized
Gain (Loss) | | Change in
Unrealized
Appreciation/
Depreciation | | | Capital Gain
Distributions | | | Dividend
Income | | | Ending
Value | |
| MFS Institutional Money Market Portfolio | | $(199) | | | $168 | | | | $— | | | | $28,360 | | | | $1,676,566 | |
16
MFS Technology Portfolio
PROXY VOTING POLICIES AND INFORMATION
MFS votes proxies on behalf of the fund pursuant to proxy voting policies and procedures that are available without charge, upon request, by calling 1-800-225-2606, by visiting mfs.com/proxyvoting, or by visiting the SEC’s Web site at http://www.sec.gov.
Information regarding how the fund voted proxies relating to portfolio securities during the most recent twelve-month period ended June 30 is available by August 31 of each year without charge by visiting mfs.com/proxyvoting, or by visiting the SEC’s Web site at http://www.sec.gov.
QUARTERLY PORTFOLIO DISCLOSURE
The fund will file a complete schedule of portfolio holdings with the Securities and Exchange Commission (the Commission) for the first and third quarters of each fiscal year on Form N-Q. The fund’s Form N-Q is available on the EDGAR database on the Commission’s Internet Web site at http://www.sec.gov, and may be reviewed and copied at the:
Public Reference Room
Securities and Exchange Commission
100 F Street, NE, Room 1580
Washington, D.C. 20549
Information on the operation of the Public Reference Room may be obtained by calling the Commission at 1-800-SEC-0330. Copies of the fund’s Form N-Q also may be obtained, upon payment of a duplicating fee, by electronic request at the following e-mail address: publicinfo@sec.gov or by writing the Public Reference Section at the above address.
FURTHER INFORMATION
From time to time, MFS may post important information about the fund or the MFS funds on the MFS web site (mfs.com). This information is available at https://www.mfs.com/en-us/what-we-do/announcements.html or at mfs.com/vit2 by choosing the fund’s name.
INFORMATION ABOUT FUND CONTRACTS AND LEGAL CLAIMS
The fund has entered into contractual arrangements with an investment adviser, administrator, distributor, shareholder servicing agent, 529 program manager (if applicable), and custodian who each provide services to the fund. Unless expressly stated otherwise, shareholders are not parties to, or intended beneficiaries of these contractual arrangements, and these contractual arrangements are not intended to create any shareholder right to enforce them against the service providers or to seek any remedy under them against the service providers, either directly or on behalf of the fund.
Under the Trust’s By-Laws and Declaration of Trust, any claims asserted against or on behalf of the MFS Funds, including claims against Trustees and Officers, must be brought in state and federal courts located within the Commonwealth of Massachusetts.
17
Semiannual Report
June 30, 2018

MFS® U.S. Government Money Market Portfolio

MFS® Variable Insurance Trust II
MKS-SEM
MFS® U.S. Government Money Market Portfolio
CONTENTS
The report is prepared for the general information of contract owners. It is authorized for distribution to prospective investors only when preceded or accompanied by a current prospectus.
NOT FDIC INSURED • MAY LOSE VALUE • NO BANK OR CREDIT UNION GUARANTEE • NOT A DEPOSIT • NOT INSURED BY ANY FEDERAL GOVERNMENT AGENCY OR NCUA/NCUSIF
MFS U.S. Government Money Market Portfolio
LETTER FROM THE EXECUTIVE CHAIRMAN

Dear Contract Owners:
Rising bond yields, international trade friction and geopolitical uncertainty have contributed to a measurable uptick in market volatility — a departure from the low-volatility environment that prevailed for much of 2017. In recent months, against this more challenging backdrop, global markets have given back some of the strong gains recorded during 2017 and early 2018. But global economic growth remains healthy, notwithstanding signs of a modest slowdown over the past few months, particularly in Europe and China.
Although the U.S. Federal Reserve continues to gradually raise interest rates and shrink its balance sheet, monetary policy remains accommodative around the world, with many central banks taking only tentative steps toward tighter policies. Newly enacted U.S. tax reforms have been welcomed by equity markets, while emerging market economies have recently had to contend with tighter financial conditions as a result of firmer U.S. Treasury yields and a stronger dollar. Around the world, inflation remains largely subdued, but tight labor markets and solid global demand have investors on the lookout for its potential resurgence. Increased U.S. protectionism is also a growing concern, as investors fear that trade disputes could dampen business sentiment, leading to slower global growth.
As a global investment manager, MFS® strives to create long-term value for clients through an active approach and an investment platform built on nearly a century of expertise. To make that long-term value meaningful for clients, we work to align with you on our beliefs, your needs and the time it takes to deliver on your desired outcomes.
Respectfully,

Robert J. Manning
Executive Chairman
MFS Investment Management
August 16, 2018
The opinions expressed in this letter are subject to change and may not be relied upon for investment advice. No forecasts can be guaranteed.
1
MFS U.S. Government Money Market Portfolio
PORTFOLIO COMPOSITION
Portfolio structure (u)
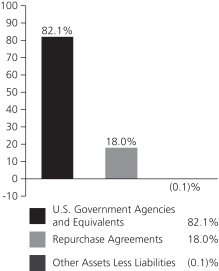
| | | | |
| Composition including fixed income credit quality (a)(u) | |
| A-1+ | | | 9.2% | |
| A-1 | | | 72.9% | |
| A-2 | | | 18.0% | |
| Other Assets Less Liabilities | | | (0.1)% | |
| | | | |
| Maturity breakdown (u) | | | | |
| 0 - 7 days | | | 39.8% | |
| 8 - 29 days | | | 43.3% | |
| 30 - 59 days | | | 13.4% | |
| 60 - 89 days | | | 1.2% | |
| 90 - 365 days | | | 2.4% | |
| Other Assets Less Liabilities | | | (0.1)% | |
| (a) | Ratings are assigned to portfolio securities utilizing ratings from Moody’s, Fitch, and Standard & Poor’s rating agencies and applying the following hierarchy: If all three agencies provide a rating, the middle rating (after dropping the highest and lowest ratings) is assigned; if two of the three agencies rate a security, the lower of the two is assigned. Ratings are shown in the S&P scale. All ratings are subject to change. The fund is not rated by these agencies. |
| (u) | For purposes of this presentation, accrued interest, where applicable, is included. |
Percentages are based on net assets as of June 30, 2018.
The portfolio is actively managed and current holdings may be different.
2
MFS U.S. Government Money Market Portfolio
EXPENSE TABLE
Fund Expenses Borne by the Contract Holders during the Period,
January 1, 2018 through June 30, 2018
As a contract holder of the fund, you incur ongoing costs, including management fees; distribution and/or service (12b-1) fees; and other fund expenses. This example is intended to help you understand your ongoing costs (in dollars) of investing in the fund and to compare these costs with the ongoing costs of investing in other mutual funds.
The example is based on an investment of $1,000 invested at the beginning of the period and held for the entire period January 1, 2018 through June 30, 2018.
Actual Expenses
The first line for each share class in the following table provides information about actual account values and actual expenses. You may use the information in this line, together with the amount you invested, to estimate the expenses that you paid over the period. Simply divide your account value by $1,000 (for example, an $8,600 account value divided by $1,000 = 8.6), then multiply the result by the number in the first line under the heading entitled “Expenses Paid During Period” to estimate the expenses you paid on your account during this period.
Hypothetical Example for Comparison Purposes
The second line for each share class in the following table provides information about hypothetical account values and hypothetical expenses based on the fund’s actual expense ratio and an assumed rate of return of 5% per year before expenses, which is not the fund’s actual return. The hypothetical account values and expenses may not be used to estimate the actual ending account balance or expenses you paid for the period. You may use this information to compare the ongoing costs of investing in the fund and other funds. To do so, compare this 5% hypothetical example with the 5% hypothetical examples that appear in the shareholder reports of the other funds.
Please note that the expenses shown in the table are meant to highlight the fund’s ongoing costs only and do not take into account the fees and expenses imposed under the variable contracts through which your investment in the fund is made. Therefore, the second line for each share class in the table is useful in comparing ongoing costs associated with an investment in vehicles (such as the fund) which fund benefits under variable annuity and variable life insurance contracts and to qualified pension and retirement plans only, and will not help you determine the relative total costs of investing in the fund through variable annuity and variable life insurance contracts. If the fees and expenses imposed under the variable contracts were included, your costs would have been higher.
| | | | | | | | | | | | | | | | | | |
| Share Class | | | | Annualized Expense Ratio | | | Beginning Account Value 1/01/18 | | | Ending Account Value 6/30/18 | | | Expenses Paid During Period (p) 1/01/18-6/30/18 | |
| Initial Class | | Actual | | | 0.55% | | | | $1,000.00 | | | | $1,004.88 | | | | $2.73 | |
| | Hypothetical (h) | | | 0.55% | | | | $1,000.00 | | | | $1,022.07 | | | | $2.76 | |
| Service Class | | Actual | | | 0.55% | | | | $1,000.00 | | | | $1,004.88 | | | | $2.73 | |
| | Hypothetical (h) | | | 0.55% | | | | $1,000.00 | | | | $1,022.07 | | | | $2.76 | |
| (h) | 5% class return per year before expenses. |
| (p) | “Expenses Paid During Period” are equal to each class’s annualized expense ratio, as shown above, multiplied by the average account value over the period, multiplied by 181/365 (to reflect the one-half year period). |
3
MFS U.S. Government Money Market Portfolio
PORTFOLIO OF INVESTMENTS – 6/30/18 (unaudited)
The Portfolio of Investments is a complete list of all securities owned by your fund. It is categorized by broad-based asset classes.
| | | | | | | | |
| Issuer | | Shares/Par | | | Value ($) | |
| | | | | | | | |
| U.S. GOVERNMENT AGENCIES AND EQUIVALENTS (y) – 82.1% | |
| Fannie Mae, 1.828%, due 7/05/2018 | | $ | 1,966,000 | | | $ | 1,965,607 | |
| Fannie Mae, 1.848%, due 7/05/2018 | | | 5,600,000 | | | | 5,598,867 | |
| Fannie Mae, 1.798%, due 7/09/2018 | | | 11,700,000 | | | | 11,695,398 | |
| Fannie Mae, 1.837%, due 7/11/2018 | | | 9,000,000 | | | | 8,995,475 | |
| Fannie Mae, 1.848%, due 7/11/2018 | | | 12,000,000 | | | | 11,993,933 | |
| Fannie Mae, 1.829%, due 7/16/2018 | | | 5,677,000 | | | | 5,672,742 | |
| Fannie Mae, 1.878%, due 7/18/2018 | | | 17,590,000 | | | | 17,574,633 | |
| Federal Farm Credit Bank, 1.759%, due 7/02/2018 | | | 7,000,000 | | | | 6,999,664 | |
| Federal Farm Credit Bank, 1.791%, due 7/09/2018 | | | 6,000,000 | | | | 5,997,653 | |
| Federal Farm Credit Bank, 1.76%, due 7/12/2018 | | | 7,000,000 | | | | 6,996,300 | |
| Federal Home Loan Bank, 1.838%, due 7/03/2018 | | | 11,600,000 | | | | 11,598,833 | |
| Federal Home Loan Bank, 1.857%, due 7/06/2018 | | | 11,600,000 | | | | 11,597,053 | |
| Federal Home Loan Bank, 1.857%, due 7/06/2018 | | | 3,001,000 | | | | 3,000,238 | |
| Federal Home Loan Bank, 1.884%, due 7/27/2018 | | | 8,200,000 | | | | 8,189,014 | |
| Federal Home Loan Bank, 1.92%, due 8/06/2018 | | | 11,600,000 | | | | 11,578,076 | |
| Federal Home Loan Bank, 1.9%, due 8/07/2018 | | | 11,600,000 | | | | 11,577,705 | |
| Federal Home Loan Bank, 1.869%, due 8/08/2018 | | | 15,252,000 | | | | 15,222,377 | |
| Freddie Mac, 1.76%, due 7/05/2018 | | | 10,000,000 | | | | 9,998,078 | |
| Freddie Mac, 1.76%, due 7/06/2018 | | | 11,800,000 | | | | 11,797,165 | |
| Freddie Mac, 1.75%, due 7/09/2018 | | | 11,800,000 | | | | 11,795,490 | |
| Freddie Mac, 1.847%, due 7/09/2018 | | | 19,361,000 | | | | 19,353,169 | |
| U.S. Treasury Bill, 1.594%, due 7/12/2018 | | | 16,000,000 | | | | 15,992,374 | |
| U.S. Treasury Bill, 1.909%, due 9/06/2018 | | | 2,000,000 | | | | 1,993,021 | |
| U.S. Treasury Bill, 1.918%, due 9/20/2018 | | | 1,500,000 | | | | 1,493,647 | |
| U.S. Treasury Bill, 1.785%, due 1/03/2019 | | | 7,000,000 | | | | 6,937,432 | |
| | | | | | | | |
Total U.S. Government Agencies and Equivalents, at Amortized
Cost and Value | | | | | | $ | 235,613,944 | |
| | | | | | | | |
| | | | | | | | |
| Issuer | | Shares/Par | | | Value ($) | |
| REPURCHASE AGREEMENTS – 18.0% | | | | | |
| Goldman Sachs Repurchase Agreement, 2.05%, dated 6/29/2018, due 7/02/2018, total to be received $14,884,542 (secured by U.S. Treasury and Federal Agency obligations valued at $15,179,694 in a jointly traded account) | | $ | 14,882,000 | | | $ | 14,882,000 | |
| JPMorgan Chase & Co. Repurchase Agreement, 2.09%, dated 6/29/2018, due 7/02/2018, total to be received $36,708,392 (secured by U.S. Treasury and Federal Agency obligations valued at $37,440,623 in a jointly traded account) | | | 36,702,000 | | | | 36,702,000 | |
| | | | | | | | |
Total Repurchase Agreements, at
Cost and Value | | | | | | $ | 51,584,000 | |
| | | | | | | | |
OTHER ASSETS, LESS
LIABILITIES – (0.1)% | | | | | | | (116,842 | ) |
| | | | | | | | |
| NET ASSETS – 100.0% | | | | | | $ | 287,081,102 | |
| | | | | | | | |
| (y) | | The rate shown represents an annualized yield at time of purchase. |
See Notes to Financial Statements
4
MFS U.S. Government Money Market Portfolio
FINANCIAL STATEMENTS | STATEMENT OF ASSETS AND LIABILITIES (unaudited)
This statement represents your fund’s balance sheet, which details the assets and liabilities comprising the total value of the fund.
| | | | |
At 6/30/18 | | | | |
Assets | | | | |
Investments in unaffiliated issuers, at cost and value | | | $235,613,944 | |
Investments in repurchase agreements, at cost and value | | | 51,584,000 | |
Cash | | | 992 | |
Receivables for | | | | |
Fund shares sold | | | 163,870 | |
Interest | | | 5,956 | |
Other assets | | | 1,227 | |
Total assets | | | $287,369,989 | |
Liabilities | | | | |
Payables for | | | | |
Fund shares reacquired | | | $216,313 | |
Payable to affiliates | | | | |
Investment adviser | | | 11,988 | |
Shareholder servicing costs | | | 30 | |
Payable for independent Trustees’ compensation | | | 100 | |
Accrued expenses and other liabilities | | | 60,456 | |
Total liabilities | | | $288,887 | |
Net assets | | | $287,081,102 | |
Net assets consist of | | | | |
Paid-in capital | | | $287,081,102 | |
Net assets | | | $287,081,102 | |
Shares of beneficial interest outstanding | | | 287,301,148 | |
| | | | | | | | | | | | |
| | | Net assets | | | Shares
outstanding | | | Net asset value
per share | |
Initial Class | | | $150,298,564 | | | | 150,413,706 | | | | $1.00 | |
Service Class | | | 136,782,538 | | | | 136,887,442 | | | | 1.00 | |
See Notes to Financial Statements
5
MFS U.S. Government Money Market Portfolio
FINANCIAL STATEMENTS | STATEMENT OF OPERATIONS (unaudited)
This statement describes how much your fund earned in investment income and accrued in expenses. It also describes any gains and/or losses generated by fund operations.
| | | | |
| Six months ended 6/30/18 | | | | |
| Net investment income (loss) | | | | |
Income | | | | |
Interest | | | $2,273,401 | |
Other | | | 64 | |
Total investment income | | | $2,273,465 | |
Expenses | | | | |
Management fee | | | $742,872 | |
Distribution and/or service fees | | | 176,936 | |
Shareholder servicing costs | | | 3,171 | |
Administrative services fee | | | 27,244 | |
Independent Trustees’ compensation | | | 4,215 | |
Custodian fee | | | 8,120 | |
Shareholder communications | | | 12,239 | |
Audit and tax fees | | | 17,886 | |
Legal fees | | | 1,887 | |
Miscellaneous | | | 16,658 | |
Total expenses | | | $1,011,228 | |
Reduction of expenses by investment adviser and distributor | | | (190,633 | ) |
Net expenses | | | $820,595 | |
Net investment income (loss) | | | $1,452,870 | |
Change in net assets from operations | | | $1,452,870 | |
See Notes to Financial Statements
6
MFS U.S. Government Money Market Portfolio
FINANCIAL STATEMENTS | STATEMENTS OF CHANGES IN NET ASSETS
These statements describe the increases and/or decreases in net assets resulting from operations, any distributions, and any shareholder transactions.
| | | | | | | | |
| | | Six months ended
6/30/18 | | | Year ended
12/31/17 | |
| | | (unaudited) | | | | |
Change in net assets | | | | | | | | |
From operations | | | | | | | | |
Net investment income (loss) | | | $1,452,870 | | | | $938,474 | |
Net realized gain (loss) | | | — | | | | 13 | |
Change in net assets from operations | | | $1,452,870 | | | | $938,487 | |
Distributions declared to shareholders | | | | | | | | |
From net investment income | | | $(1,452,870 | ) | | | $(938,722 | ) |
Change in net assets from fund share transactions | | | $(27,453,397 | ) | | | $(47,858,372 | ) |
Total change in net assets | | | $(27,453,397 | ) | | | $(47,858,607 | ) |
Net assets | | | | | | | | |
At beginning of period | | | 314,534,499 | | | | 362,393,106 | |
At end of period | | | $287,081,102 | | | | $314,534,499 | |
See Notes to Financial Statements
7
MFS U.S. Government Money Market Portfolio
FINANCIAL STATEMENTS | FINANCIAL HIGHLIGHTS
The financial highlights table is intended to help you understand the fund’s financial performance for the semiannual period and the past 5 fiscal
years. Certain information reflects financial results for a single fund share. The total returns in the table represent the rate that an investor would
have earned (or lost) on an investment in the fund share class (assuming reinvestment of all distributions) held for the entire period.
| | | | | | | | | | | | | | | | | | | | | | | | |
| Initial Class | | Six months
ended 6/30/18 | | | Year ended | |
| | | 12/31/17 | | | 12/31/16 | | | 12/31/15 | | | 12/31/14 | | | 12/31/13 | |
| | | (unaudited) | | | | | | | | | | | | | | | | |
Net asset value, beginning of period | | | $1.00 | | | | $1.00 | | | | $1.00 | | | | $1.00 | | | | $1.00 | | | | $1.00 | |
| Income (loss) from investment operations | |
Net investment income (loss) (d) | | | $0.00 | (w) | | | $0.00 | (w) | | | $0.00 | (c)(w) | | | $0.00 | | | | $0.00 | | | | $0.00 | |
Net realized and unrealized gain (loss) | | | — | | | | 0.00 | (w) | | | 0.00 | (w) | | | 0.00 | (w) | | | 0.00 | (w) | | | 0.00 | (w) |
Total from investment operations | | | $0.00 | (w) | | | $0.00 | (w) | | | $0.00 | (w) | | | $0.00 | (w) | | | $0.00 | (w) | | | $0.00 | (w) |
| Less distributions declared to shareholders | |
From net investment income | | | $(0.00 | )(w) | | | $(0.00 | )(w) | | | $(0.00 | )(w) | | | $— | | | | $— | | | | $— | |
Net asset value, end of period | | | $1.00 | | | | $1.00 | | | | $1.00 | | | | $1.00 | | | | $1.00 | | | | $1.00 | |
Total return (%) (k)(r) | | | 0.49 | (n) | | | 0.30 | | | | 0.01 | (c) | | | 0.00 | | | | 0.00 | | | | 0.00 | |
Ratios (%) (to average net assets)
and Supplemental data: | |
Expenses before expense reductions (f) | | | 0.56 | (a) | | | 0.56 | | | | 0.53 | (c) | | | 0.57 | | | | 0.55 | | | | 0.55 | |
Expenses after expense reductions (f) | | | 0.55 | (a) | | | 0.54 | | | | 0.30 | (c) | | | 0.13 | | | | 0.10 | | | | 0.12 | |
Net investment income (loss) | | | 0.98 | (a) | | | 0.29 | | | | 0.01 | (c) | | | 0.00 | | | | 0.00 | | | | 0.00 | |
Net assets at end of period (000 omitted) | | | $150,299 | | | | $168,107 | | | | $179,458 | | | | $190,761 | | | | $214,019 | | | | $228,673 | |
| | |
| Service Class | | Six months
ended 6/30/18 | | | Year ended | |
| | | 12/31/17 | | | 12/31/16 | | | 12/31/15 | | | 12/31/14 | | | 12/31/13 | |
| | | (unaudited) | | | | | | | | | | | | | | | | |
Net asset value, beginning of period | | | $1.00 | | | | $1.00 | | | | $1.00 | | | | $1.00 | | | | $1.00 | | | | $1.00 | |
| Income (loss) from investment operations | |
Net investment income (loss) (d) | | | $0.00 | (w) | | | $0.00 | (w) | | | $0.00 | (c)(w) | | | $0.00 | | | | $0.00 | | | | $0.00 | |
Net realized and unrealized gain (loss) | | | — | | | | 0.00 | (w) | | | 0.00 | (w) | | | 0.00 | (w) | | | 0.00 | (w) | | | 0.00 | (w) |
Total from investment operations | | | $0.00 | (w) | | | $0.00 | (w) | | | $0.00 | (w) | | | $0.00 | (w) | | | $0.00 | (w) | | | $0.00 | (w) |
| Less distributions declared to shareholders | |
From net investment income | | | $(0.00 | )(w) | | | $(0.00 | )(w) | | | $(0.00 | )(w) | | | $— | | | | $— | | | | $— | |
Net asset value, end of period | | | $1.00 | | | | $1.00 | | | | $1.00 | | | | $1.00 | | | | $1.00 | | | | $1.00 | |
Total return (%) (k)(r) | | | 0.49 | (n) | | | 0.29 | | | | 0.01 | (c) | | | 0.00 | | | | 0.00 | | | | 0.00 | |
Ratios (%) (to average net assets)
and Supplemental data: | |
Expenses before expense reductions (f) | | | 0.81 | (a) | | | 0.81 | | | | 0.79 | (c) | | | 0.82 | | | | 0.80 | | | | 0.80 | |
Expenses after expense reductions (f) | | | 0.55 | (a) | | | 0.55 | | | | 0.30 | (c) | | | 0.13 | | | | 0.10 | | | | 0.12 | |
Net investment income (loss) | | | 0.98 | (a) | | | 0.27 | | | | 0.01 | (c) | | | 0.00 | | | | 0.00 | | | | 0.00 | |
Net assets at end of period (000 omitted) | | | $136,783 | | | | $146,428 | | | | $182,935 | | | | $182,097 | | | | $205,550 | | | | $246,964 | |
See Notes to Financial Statements
8
MFS U.S. Government Money Market Portfolio
Financial Highlights – continued
| (c) | Amount reflects a one-time reimbursement of expenses by the custodian (or former custodian) without which net investment income and performance would be lower and expenses would be higher. |
| (d) | Per share data is based on average shares outstanding. |
| (f) | Ratios do not reflect reductions from fees paid indirectly, if applicable. |
| (k) | The total return does not reflect expenses that apply to separate accounts. Inclusion of these charges would reduce the total return figures for all periods shown. |
| (r) | Certain expenses have been reduced without which performance would have been lower. |
| (w) | Per share amount was less than $0.01. |
See Notes to Financial Statements
9
MFS U.S. Government Money Market Portfolio
NOTES TO FINANCIAL STATEMENTS (unaudited)
| (1) | | Business and Organization |
MFS U.S. Government Money Market Portfolio (the fund) is a diversified series of MFS Variable Insurance Trust II (the trust). The trust is organized as a Massachusetts business trust and is registered under the Investment Company Act of 1940, as amended, as an open-end management investment company. The shareholders of each series of the trust are separate accounts of insurance companies, which offer variable annuity and/or life insurance products, and qualified retirement and pension plans.
The fund is an investment company and accordingly follows the investment company accounting and reporting guidance of the Financial Accounting Standards Board (FASB) Accounting Standards Codification Topic 946 Financial Services – Investment Companies.
| (2) | | Significant Accounting Policies |
General – The preparation of financial statements in conformity with U.S. generally accepted accounting principles requires management to make estimates and assumptions that affect the reported amounts of assets and liabilities, and disclosure of contingent assets and liabilities at the date of the financial statements and the reported amounts of increases and decreases in net assets from operations during the reporting period. Actual results could differ from those estimates. In the preparation of these financial statements, management has evaluated subsequent events occurring after the date of the fund’s Statement of Assets and Liabilities through the date that the financial statements were issued.
Balance Sheet Offsetting – The fund’s accounting policy with respect to balance sheet offsetting is that, absent an event of default by the counterparty or a termination of the agreement, the International Swaps and Derivatives Association (ISDA) Master Agreement, or similar agreement, does not result in an offset of reported amounts of financial assets and financial liabilities in the Statement of Assets and Liabilities across transactions between the fund and the applicable counterparty. The fund’s right to setoff may be restricted or prohibited by the bankruptcy or insolvency laws of the particular jurisdiction to which a specific master netting agreement counterparty is subject. Balance sheet offsetting disclosures, to the extent applicable to the fund, have been included in the fund’s Significant Accounting Policies note under the captions for each of the fund’s in-scope financial instruments and transactions.
Investment Valuations – Pursuant to procedures approved by the Board of Trustees, investments held by the fund are generally valued at amortized cost, which approximates market value. Amortized cost involves valuing an instrument at its cost as adjusted for amortization of premium or accretion of discount rather than its current market value. The amortized cost value of an instrument can be different from the market value of an instrument.
Various inputs are used in determining the value of the fund’s assets or liabilities. These inputs are categorized into three broad levels. In certain cases, the inputs used to measure fair value may fall into different levels of the fair value hierarchy. In such cases, an investment’s level within the fair value hierarchy is based on the lowest level of input that is significant to the fair value measurement. The fund’s assessment of the significance of a particular input to the fair value measurement in its entirety requires judgment, and considers factors specific to the investment. Level 1 includes unadjusted quoted prices in active markets for identical assets or liabilities. Level 2 includes other significant observable market-based inputs (including quoted prices for similar securities, interest rates, prepayment speed, and credit risk). Level 3 includes unobservable inputs, which may include the adviser’s own assumptions in determining the fair value of investments. The following is a summary of the levels used as of June 30, 2018 in valuing the fund’s assets or liabilities:
| | | | | | | | | | | | | | | | |
| Financial Instruments | | Level 1 | | | Level 2 | | | Level 3 | | | Total | |
| Short-Term Securities | | | $— | | | | $287,197,944 | | | | $— | | | | $287,197,944 | |
For further information regarding security characteristics, see the Portfolio of Investments.
Repurchase Agreements – The fund enters into repurchase agreements under the terms of Master Repurchase Agreements with approved counterparties. Each repurchase agreement is recorded at cost. The fund requires that the securities collateral in a repurchase transaction be transferred to a custodian. The fund monitors, on a daily basis, the value of the collateral to ensure that its value, including accrued interest, is greater than amounts owed to the fund under each such repurchase agreement. Upon an event of default under a Master Repurchase Agreement, the non-defaulting party may close out all transactions traded under such agreement and net amounts owed under each transaction to one net amount payable by one party to the other. Absent an event of default, the Master Repurchase Agreement does not result in an offset of reported amounts of assets and liabilities in the Statement of Assets and Liabilities across transactions between the fund and the applicable counterparty. The fund and other funds managed by MFS may utilize a joint trading account for the purpose of entering into one or more repurchase agreements. At June 30, 2018, the fund had investments in repurchase agreements with a gross value of $51,584,000 in the Statement of Assets and Liabilities. The value of the related collateral exceeded the value of the repurchase agreements at period end.
Indemnifications – Under the fund’s organizational documents, its officers and Trustees may be indemnified against certain liabilities and expenses arising out of the performance of their duties to the fund. Additionally, in the normal course of business, the
10
MFS U.S. Government Money Market Portfolio
Notes to Financial Statements (unaudited) – continued
fund enters into agreements with service providers that may contain indemnification clauses. The fund’s maximum exposure under these agreements is unknown as this would involve future claims that may be made against the fund that have not yet occurred.
Investment Transactions and Income – Investment transactions are recorded on the trade date. Interest income is recorded on the accrual basis. All premium and discount is amortized or accreted for financial statement purposes in accordance with U.S. generally accepted accounting principles.
Tax Matters and Distributions – The fund intends to qualify as a regulated investment company, as defined under Subchapter M of the Internal Revenue Code, and to distribute all of its taxable income, including realized capital gains. As a result, no provision for federal income tax is required. The fund’s federal tax returns, when filed, will remain subject to examination by the Internal Revenue Service for a three year period. Management has analyzed the fund’s tax positions taken on federal and state tax returns for all open tax years and does not believe that there are any uncertain tax positions that require recognition of a tax liability.
Distributions to shareholders are recorded on the ex-dividend date. Income and capital gain distributions are determined in accordance with income tax regulations, which may differ from U.S. generally accepted accounting principles. Certain capital accounts in the financial statements are periodically adjusted for permanent differences in order to reflect their tax character. These adjustments have no impact on net assets or net asset value per share. Temporary differences which arise from recognizing certain items of income, expense, gain or loss in different periods for financial statement and tax purposes will reverse at some time in the future. Distributions in excess of net investment income or net realized gains are temporary overdistributions for financial statement purposes resulting from differences in the recognition or classification of income or distributions for financial statement and tax purposes.
During the year ended December 31, 2017, there were no significant adjustments due to differences between book and tax accounting.
The tax character of distributions made during the current period will be determined at fiscal year end. The tax character of distributions declared to shareholders for the last fiscal year is as follows:
| | | | |
| | | Year ended
12/31/17 | |
| Ordinary income (including any short-term capital gains) | | | $938,722 | |
The federal tax cost and the tax basis components of distributable earnings were as follows:
| | | | |
| As of 6/30/18 | | | | |
| Cost of investments | | | $287,197,944 | |
The aggregate cost above includes prior fiscal year end tax adjustments, if applicable.
Multiple Classes of Shares of Beneficial Interest – The fund offers multiple classes of shares, which differ in their respective distribution and/or service fees. The fund’s income and common expenses are allocated to shareholders based on the value of settled shares outstanding of each class. The fund’s realized and unrealized gain (loss) are allocated to shareholders based on the daily net assets of each class. Dividends are declared separately for each class. Differences in per share dividend rates are generally due to differences in separate class expenses. The fund’s distributions declared to shareholders as reported in the Statements of Changes in Net Assets are presented by class as follows:
| | | | | | | | |
| | | From net investment
income | |
| | | Six months ended
6/30/18 | | | Year ended
12/31/17 | |
| Initial Class | | | $759,665 | | | | $495,709 | |
| Service Class | | | 693,205 | | | | 443,013 | |
| Total | | | $1,452,870 | | | | $938,722 | |
| (3) | | Transactions with Affiliates |
Investment Adviser – The fund has an investment advisory agreement with MFS to provide overall investment management and related administrative services and facilities to the fund. The management fee is computed daily and paid monthly at the following annual rates based on the fund’s average daily net assets:
| | | | |
| Up to $500 million | | | 0.50% | |
| In excess of $500 million | | | 0.45% | |
MFS has agreed in writing to reduce its management fee by a specified amount if certain MFS mutual fund assets exceed thresholds agreed to by MFS and the fund’s Board of Trustees. For the six months ended June 30, 2018, this management fee reduction amounted to $13,697, which is included in the reduction of total expenses in the Statement of Operations. The management fee incurred for the six months ended June 30, 2018 was equivalent to an annual effective rate of 0.49% of the fund’s average daily net assets.
11
MFS U.S. Government Money Market Portfolio
Notes to Financial Statements (unaudited) – continued
The investment adviser has agreed in writing to pay a portion of the fund’s total annual operating expenses, excluding interest, taxes, extraordinary expenses, brokerage and transaction costs, and investment-related expenses, such that total annual operating expenses do not exceed 0.57% of average daily net assets for each of the Initial Class and Service Class shares. This written agreement will continue until modified by the fund’s Board of Trustees, but such agreement will continue at least until April 30, 2020. For the six months ended June 30, 2018, the fund’s actual operating expenses did not exceed the limits described above and therefore, the investment adviser did not pay any portion of the fund’s expenses related to this agreement.
Distributor – MFS Fund Distributors, Inc. (MFD), a wholly-owned subsidiary of MFS, is the distributor of shares of the fund. The Trustees have adopted a distribution plan for the Service Class shares pursuant to Rule 12b-1 under the Investment Company Act of 1940.
The fund’s distribution plan provides that the fund will pay MFD distribution and/or service fees equal to 0.25% per annum of its average daily net assets attributable to Service Class shares as partial consideration for services performed and expenses incurred by MFD and financial intermediaries (including participating insurance companies that invest in the fund to fund variable annuity and variable life insurance contracts, sponsors of qualified retirement and pension plans that invest in the fund, and affiliates of these participating insurance companies and plan sponsors) in connection with the sale and distribution of the Service Class shares. MFD may subsequently pay all, or a portion, of the distribution and/or service fees to financial intermediaries. MFD has agreed in writing to waive the entire 0.25% distribution and/or service fee. This written agreement will continue until modified by the fund’s Board of Trustees, but such agreement will continue at least until April 30, 2020. For the six months ended June 30, 2018, this waiver amounted to $176,936, which is included in the reduction of total expenses in the Statement of Operations. The distribution and/or service fees incurred for the six months ended June 30, 2018 were equivalent to an annual effective rate of 0.00% of the average daily net assets attributable to Service Class shares.
Shareholder Servicing Agent – MFS Service Center, Inc. (MFSC), a wholly-owned subsidiary of MFS, receives a fee from the fund for its services as shareholder servicing agent. For the six months ended June 30, 2018, the fee was $3,070, which equated to 0.0021% annually of the fund’s average daily net assets. MFSC also receives payment from the fund for out-of-pocket expenses paid by MFSC on behalf of the fund. For the six months ended June 30, 2018, these costs amounted to $101.
Administrator – MFS provides certain financial, legal, shareholder communications, compliance, and other administrative services to the fund. Under an administrative services agreement, the fund reimburses MFS the costs incurred to provide these services. The fund is charged an annual fixed amount of $17,500 plus a fee based on average daily net assets. The administrative services fee incurred for the six months ended June 30, 2018 was equivalent to an annual effective rate of 0.0183% of the fund’s average daily net assets.
Trustees’ and Officers’ Compensation – The fund pays compensation to independent Trustees in the form of a retainer, attendance fees, and additional compensation to Board and Committee chairpersons. The fund does not pay compensation directly to Trustees or officers of the fund who are also officers of the investment adviser, all of whom receive remuneration for their services to the fund from MFS. Certain officers and Trustees of the fund are officers or directors of MFS, MFD, and MFSC.
Other – This fund and certain other funds managed by MFS (the funds) have entered into a service agreement (the ISO Agreement) which provides for payment of fees solely by the funds to Tarantino LLC in return for the provision of services of an Independent Senior Officer (ISO) for the funds. Frank L. Tarantino serves as the ISO and is an officer of the funds and the sole member of Tarantino LLC. The funds can terminate the ISO Agreement with Tarantino LLC at any time under the terms of the ISO Agreement. For the six months ended June 30, 2018, the fee paid by the fund under this agreement was $264 and is included in “Miscellaneous” expense in the Statement of Operations. MFS has agreed to bear all expenses associated with office space, other administrative support, and supplies provided to the ISO.
| (4) | | Shares of Beneficial Interest |
The fund’s Declaration of Trust permits the Trustees to issue an unlimited number of full and fractional shares of beneficial interest. The number of shares sold, reinvested and reacquired corresponds to the net proceeds from the sale of shares, reinvestment of distributions and cost of shares reacquired, respectively, since shares are sold and reacquired at $1.00 per share. Transactions in fund shares were as follows:
| | | | | | | | |
| | | Six months ended
6/30/18 | | | Year ended
12/31/17 | |
| Shares sold | | | | | | | | |
Initial Class | | | 13,090,985 | | | | 35,332,001 | |
Service Class | | | 15,014,400 | | | | 50,562,527 | |
| | | 28,105,385 | | | | 85,894,528 | |
| Shares issued to shareholders in reinvestment of distributions | | | | | | | | |
Initial Class | | | 759,665 | | | | 495,709 | |
Service Class | | | 693,205 | | | | 443,013 | |
| | | 1,452,870 | | | | 938,722 | |
12
MFS U.S. Government Money Market Portfolio
Notes to Financial Statements (unaudited) – continued
| | | | | | | | |
| | | Six months ended
6/30/18 | | | Year ended
12/31/17 | |
| Shares reacquired | | | | | | | | |
Initial Class | | | (31,653,454 | ) | | | (47,177,273 | ) |
Service Class | | | (25,358,198 | ) | | | (87,514,349 | ) |
| | | (57,011,652 | ) | | | (134,691,622 | ) |
| Net change | | | | | | | | |
Initial Class | | | (17,802,804 | ) | | | (11,349,563 | ) |
Service Class | | | (9,650,593 | ) | | | (36,508,809 | ) |
| | | (27,453,397 | ) | | | (47,858,372 | ) |
The fund and certain other funds managed by MFS participate in a $1.25 billion unsecured committed line of credit, subject to a $1 billion sublimit, provided by a syndication of banks under a credit agreement. Borrowings may be made for temporary financing needs. Interest is charged to each fund, based on its borrowings, generally at a rate equal to the higher of the Overnight Bank Funding rate or daily one month LIBOR plus an agreed upon spread. A commitment fee, based on the average daily, unused portion of the committed line of credit, is allocated among the participating funds. In addition, the fund and other funds managed by MFS have established unsecured uncommitted borrowing arrangements with certain banks for temporary financing needs. Interest is charged to each fund, based on its borrowings, at a rate equal to the Overnight Bank Funding rate plus an agreed upon spread. For the six months ended June 30, 2018, the fund’s commitment fee and interest expense were $1,086 and $0, respectively, and are included in “Miscellaneous” expense in the Statement of Operations.
13
MFS U.S. Government Money Market Portfolio
PROXY VOTING POLICIES AND INFORMATION
MFS votes proxies on behalf of the fund pursuant to proxy voting policies and procedures that are available without charge, upon request, by calling 1-800-225-2606, by visiting mfs.com/proxyvoting, or by visiting the SEC’s Web site at http://www.sec.gov.
Information regarding how the fund voted proxies relating to portfolio securities during the most recent twelve-month period ended June 30 is available by August 31 of each year without charge by visiting mfs.com/proxyvoting, or by visiting the SEC’s Web site at http://www.sec.gov.
QUARTERLY PORTFOLIO DISCLOSURE
The fund will file a complete schedule of portfolio holdings with the Securities and Exchange Commission (the Commission) for the first and third quarters of each fiscal year on Form N-Q. The fund’s Form N-Q is available on the EDGAR database on the Commission’s Internet Web site at http://www.sec.gov, and may be reviewed and copied at the:
Public Reference Room
Securities and Exchange Commission
100 F Street, NE, Room 1580
Washington, D.C. 20549
Information on the operation of the Public Reference Room may be obtained by calling the Commission at 1-800-SEC-0330. Copies of the fund’s Form N-Q also may be obtained, upon payment of a duplicating fee, by electronic request at the following e-mail address: publicinfo@sec.gov or by writing the Public Reference Section at the above address.
FURTHER INFORMATION
From time to time, MFS may post important information about the fund or the MFS funds on the MFS web site (mfs.com). This information is available at https://www.mfs.com/en-us/what-we-do/announcements.html or at mfs.com/vit2 by choosing the fund’s name.
INFORMATION ABOUT FUND CONTRACTS AND LEGAL CLAIMS
The fund has entered into contractual arrangements with an investment adviser, administrator, distributor, shareholder servicing agent, 529 program manager (if applicable), and custodian who each provide services to the fund. Unless expressly stated otherwise, shareholders are not parties to, or intended beneficiaries of these contractual arrangements, and these contractual arrangements are not intended to create any shareholder right to enforce them against the service providers or to seek any remedy under them against the service providers, either directly or on behalf of the fund.
Under the Trust’s By-Laws and Declaration of Trust, any claims asserted against or on behalf of the MFS Funds, including claims against Trustees and Officers, must be brought in state and federal courts located within the Commonwealth of Massachusetts.
14
During the period covered by this report, the Registrant has not amended any provision in its Code of Ethics (the “Code”) that relates to an element of the Code’s definitions enumerated in paragraph (b) of Item 2 of this Form N-CSR. During the period covered by this report, the Registrant did not grant a waiver, including an implicit waiver, from any provision of the Code.
| ITEM 3. | AUDIT COMMITTEE FINANCIAL EXPERT. |
Not applicable for semi-annual reports.
| ITEM 4. | PRINCIPAL ACCOUNTANT FEES AND SERVICES. |
Not applicable for semi-annual reports.
| ITEM 5. | AUDIT COMMITTEE OF LISTED REGISTRANTS. |
Not applicable to the Registrant.
A schedule of investments for each series of the Registrant is included as part of the report to shareholders of such series under Item 1 of this Form N-CSR.
| ITEM 7. | DISCLOSURE OF PROXY VOTING POLICIES AND PROCEDURES FOR CLOSED-END MANAGEMENT INVESTMENT COMPANIES. |
Not applicable to the Registrant.
| ITEM 8. | PORTFOLIO MANAGERS OF CLOSED-END MANAGEMENT INVESTMENT COMPANIES. |
Not applicable to the Registrant.
| ITEM 9. | PURCHASES OF EQUITY SECURITIES BY CLOSED-END MANAGEMENT INVESTMENT COMPANY AND AFFILIATED PURCHASERS. |
Not applicable to the Registrant.
| ITEM 10. | SUBMISSION OF MATTERS TO A VOTE OF SECURITY HOLDERS. |
There were no material changes to the procedures by which shareholders may send recommendations to the Board for nominees to the Registrant’s Board since the Registrant last provided disclosure as to such procedures in response to the requirements of Item 407 (c)(2)(iv) of Regulation S-K or this Item.
| ITEM 11. | CONTROLS AND PROCEDURES. |
| (a) | Based upon their evaluation of the effectiveness of the registrant’s disclosure controls and procedures (as defined in Rule 30a-3(c) under the Investment Company Act of 1940 (the “Act”)) as conducted within 90 days of the filing date of this report on Form N-CSR, the registrant’s principal financial officer and principal executive officer have concluded that those disclosure controls and procedures provide reasonable assurance that the material information required to be disclosed by the registrant on this report is recorded, processed, summarized and reported within the time periods specified in the Securities and Exchange Commission’s rules and forms. |
| (b) | There were no changes in the registrant’s internal controls over financial reporting (as defined in Rule 30a-3(d) under the Act) that occurred during the second fiscal quarter of the period covered by the report that have materially affected, or are reasonably likely to materially affect, the registrant’s internal control over financial reporting. |
| ITEM 12. | DISCLOSURE OF SECURITIES LENDING ACTIVITIES FOR CLOSED-END MANAGEMENT INVESTMENT COMPANIES. |
Not applicable to the Registrant.
| (a) (1) | Any code of ethics, or amendment thereto, that is the subject of the disclosure required by Item 2, to the extent that the registrant intends to satisfy the Item 2 requirements through filing of an exhibit. Not applicable. |
| | (2) | A separate certification for each principal executive officer and principal financial officer of the registrant as required by Rule 30a-2(a) under the Act (17 CFR 270.30a-2): Attached hereto as EX-99.302CERT. |
| | (3) | Any written solicitation to purchase securities under Rule 23c-1 under the Act (17 CFR 270.23c-1) sent or given during the period covered by the report by or on behalf of the registrant to 10 or more persons. Not applicable. |
| | (4) | Change in the registrant’s independent public accountant. Not applicable. |
| (b) | If the report is filed under Section 13(a) or 15(d) of the Exchange Act, provide the certifications required by Rule 30a-2(b) under the Act (17 CFR 270.30a-2(b)), Rule 13a-14(b) or Rule 15d-14(b) under the Exchange Act (17 CFR 240.13a-14(b) or 240.15d-14(b)) and Section 1350 of Chapter 63 of Title 18 of the United States Code (18 U.S.C. 1350) as an exhibit. A certification furnished pursuant to this paragraph will not be deemed “filed” for the purposes of Section 18 of the Exchange Act (15 U.S.C. 78r), or otherwise subject to the liability of that section. Such certification will not be deemed to be incorporated by reference into any filing under the Securities Act of 1933 or the Exchange Act, except to the extent that the registrant specifically incorporates it by reference. Attached hereto as EX-99.906CERT. |
Notice
A copy of the Amended and Restated Declaration of Trust, as amended, of the Registrant is on file with the Secretary of State of The Commonwealth of Massachusetts and notice is hereby given that this instrument is executed on behalf of the Registrant by an officer of the Registrant as an officer and not individually and the obligations of or arising out of this instrument are not binding upon any of the Trustees or shareholders individually, but are binding only upon the assets and property of the respective constituent series of the Registrant.
SIGNATURES
Pursuant to the requirements of the Securities Exchange Act of 1934 and the Investment Company Act of 1940, the registrant has duly caused this report to be signed on its behalf by the undersigned, thereunto duly authorized.
(Registrant) MFS VARIABLE INSURANCE TRUST II
| | |
| By (Signature and Title)* | | DAVID L. DILORENZO |
| | David L. DiLorenzo, President |
Date: August 16, 2018
Pursuant to the requirements of the Securities Exchange Act of 1934 and the Investment Company Act of 1940, this report has been signed below by the following persons on behalf of the registrant and in the capacities and on the dates indicated.
| | |
| By (Signature and Title)* | | DAVID L. DILORENZO |
| | David L. DiLorenzo, President (Principal Executive Officer) |
Date: August 16, 2018
| | |
| By (Signature and Title)* | | JAMES O. YOST |
| | James O. Yost, Treasurer (Principal Financial Officer and Accounting Officer) |
Date: August 16, 2018
| * | Print name and title of each signing officer under his or her signature. |