Table of Contents
UNITED STATES
SECURITIES AND EXCHANGE COMMISSION
Washington, D.C. 20549
FORMN-CSR
CERTIFIED SHAREHOLDER REPORT OF
REGISTERED MANAGEMENT INVESTMENT COMPANIES
Investment Company Act file number811-3732
MFS VARIABLE INSURANCE TRUST II
(Exact name of registrant as specified in charter)
111 Huntington Avenue, Boston, Massachusetts 02199
(Address of principal executive offices) (Zip code)
Christopher R. Bohane
Massachusetts Financial Services Company
111 Huntington Avenue
Boston, Massachusetts 02199
(Name and address of agents for service)
Registrant’s telephone number, including area code: (617)954-5000
Date of fiscal year end: December 31
Date of reporting period: June 30, 2019
Effective June 1, 2019, MFS International Value Portfolio, a series of the Registrant, was redesignated MFS International Intrinsic Value Portfolio.
Table of Contents
| ITEM 1. | REPORTS TO STOCKHOLDERS. |
Table of Contents
Semiannual Report
June 30, 2019

MFS® Blended Research® Core Equity Portfolio

MFS® Variable Insurance Trust II
Beginning on January 1, 2021, as permitted by regulations adopted by the U.S. Securities and Exchange Commission, the insurance company that offers your contract may determine that it will no longer send you paper copies of the fund’s annual and semiannual shareholder reports unless you specifically request paper copies from the insurance company or from your financial intermediary. Instead, the shareholder reports will be made available on a Web site (insurancefunds.mfs.com or other Web site of which you will be notified), and the insurance company will notify you by mail each time a report is posted and provide you with a Web site link to access the report. Instructions for requesting paper copies will be provided by your insurance company or financial intermediary.
If you already elected to receive shareholder reports by email, you will not be affected by this change and you need not take any action. If your insurance company or financial intermediary offers electronic delivery, you may elect to receive shareholder reports and other communications from the insurance company or financial intermediary by email by following the instructions provided by the insurance company or financial intermediary.
Beginning on January 1, 2019, you may elect to receive all future reports in paper free of charge from the insurance company or financial intermediary. You can inform the insurance company or financial intermediary that you wish to continue receiving paper copies of your shareholder reports by contacting your insurance company or financial intermediary. Your election to receive reports in paper will apply to all funds held in your account with your insurance company or financial intermediary.
CGS-SEM
Table of Contents
MFS® Blended Research® Core Equity Portfolio
The report is prepared for the general information of contract owners. It is authorized for distribution to prospective investors only when preceded or accompanied by a current prospectus.
NOT FDIC INSURED• MAY LOSE VALUE• NO BANK OR CREDIT UNION GUARANTEE• NOT A DEPOSIT• NOT INSURED BY ANY FEDERAL GOVERNMENT AGENCY OR NCUA/NCUSIF
Table of Contents
MFS Blended Research Core Equity Portfolio
LETTER FROM THE EXECUTIVE CHAIRMAN

Dear Contract Owners:
Slowing global growth, low inflation, and increasing trade friction between the United States and China have been hallmarks of the past 12 months. After experiencing an uptick in market volatility in late 2018, markets steadied during the first half of 2019, thanks in large measure to the adoption of a dovish policy stance on the part of global central banks, who have largely abandoned efforts to normalize interest rates and have instead focused on supporting economic growth. Trade tensions remain high as the U.S. has ratcheted up tariffs on Chinese imports and China has retaliated. A truce of sorts was reached midyear, but significant challenges continue to confront negotiators, and it is not known whether a comprehensive agreement can be reached.
With Boris Johnson replacing Theresa May as Britain’s prime minister, uncertainty over Brexit remains high. Johnson has adopted a more combative stance than his predecessor toward the European Union, increasing concerns that there will be a “hard” Brexit.
Markets expect that the longest economic expansion in U.S. history will continue for the time being, albeit at a slower pace. Nevertheless, slower growth and low inflation have spurred the U.S. Federal Reserve to take a more accommodative policy stance, prompting investors to anticipate several interest rate cuts in the coming year. The European Central Bank has adopted a similar position. The more accommodative environment has helped fuel a continued rise in global equities and has been broadly supportive of risk assets.
Since launching the first U.S.open-end mutual fund in 1924, MFS® has been committed to a single purpose: to create value by allocating capital responsibly for clients. Through our powerful global investment platform, we combine collective expertise, thoughtful risk management, and long-term discipline to uncover what we believe are the best investment opportunities in the market.
Respectfully,

Robert J. Manning
Executive Chairman
MFS Investment Management
August 16, 2019
The opinions expressed in this letter are subject to change and may not be relied upon for investment advice. No forecasts can be guaranteed.
1
Table of Contents
MFS Blended Research Core Equity Portfolio
Portfolio structure

| Top ten holdings | ||||
| Microsoft Corp. | 5.8% | |||
| Amazon.com, Inc. | 4.0% | |||
| Apple, Inc. | 3.5% | |||
| Johnson & Johnson | 2.9% | |||
| Cisco Systems, Inc. | 2.6% | |||
| Comcast Corp., “A” | 2.2% | |||
| Intel Corp. | 2.1% | |||
| Bank of America Corp. | 2.1% | |||
| Citigroup, Inc. | 2.0% | |||
| Union Pacific Corp. | 2.0% |
| Equity sectors (k) | ||||
| Technology | 26.8% | |||
| Financial Services | 18.7% | |||
| Health Care | 11.5% | |||
| Consumer Staples | 6.8% | |||
| Retailing | 6.0% | |||
| Leisure | 5.3% | |||
| Industrial Goods & Services | 4.5% | |||
| Energy | 4.1% | |||
| Utilities | 4.1% | |||
| Special Products & Services | 3.4% | |||
| Transportation | 3.1% | |||
| Basic Materials | 2.4% | |||
| Autos & Housing | 2.0% | |||
| Communications | 0.9% |
| (k) | The sectors set forth above and the associated portfolio composition are based on MFS’ own custom sector classification methodology. |
Cash & Cash Equivalents includes any cash, investments in money market funds, short-term securities, and other assets less liabilities. Please see the Statement of Assets and Liabilities for additional information related to the fund’s cash position and other assets and liabilities.
Percentages are based on net assets as of June 30, 2019.
The portfolio is actively managed and current holdings may be different.
2
Table of Contents
MFS Blended Research Core Equity Portfolio
Fund Expenses Borne by the Contract Holders during the Period,
January 1, 2019 through June 30, 2019
As a contract holder of the fund, you incur ongoing costs, including management fees; distribution and/or service(12b-1) fees; and other fund expenses. This example is intended to help you understand your ongoing costs (in dollars) of investing in the fund and to compare these costs with the ongoing costs of investing in other mutual funds.
The example is based on an investment of $1,000 invested at the beginning of the period and held for the entire period January 1, 2019 through June 30, 2019.
Actual Expenses
The first line for each share class in the following table provides information about actual account values and actual expenses. You may use the information in this line, together with the amount you invested, to estimate the expenses that you paid over the period. Simply divide your account value by $1,000 (for example, an $8,600 account value divided by $1,000 = 8.6), then multiply the result by the number in the first line under the heading entitled “Expenses Paid During Period” to estimate the expenses you paid on your account during this period.
Hypothetical Example for Comparison Purposes
The second line for each share class in the following table provides information about hypothetical account values and hypothetical expenses based on the fund’s actual expense ratio and an assumed rate of return of 5% per year before expenses, which is not the fund’s actual return. The hypothetical account values and expenses may not be used to estimate the actual ending account balance or expenses you paid for the period. You may use this information to compare the ongoing costs of investing in the fund and other funds. To do so, compare this 5% hypothetical example with the 5% hypothetical examples that appear in the shareholder reports of the other funds.
Please note that the expenses shown in the table are meant to highlight the fund’s ongoing costs only and do not take into account the fees and expenses imposed under the variable contracts through which your investment in the fund is made. Therefore, the second line for each share class in the table is useful in comparing ongoing costs associated with an investment in vehicles (such as the fund) which fund benefits under variable annuity and variable life insurance contracts and to qualified pension and retirement plans only, and will not help you determine the relative total costs of investing in the fund through variable annuity and variable life insurance contracts. If the fees and expenses imposed under the variable contracts were included, your costs would have been higher.
| Share Class | Annualized Expense Ratio | Beginning Account Value 1/01/19 | Ending Account Value | Expenses Paid During Period (p) 1/01/19-6/30/19 | ||||||||||||||
| Initial Class | Actual | 0.44% | $1,000.00 | $1,157.65 | $2.35 | |||||||||||||
| Hypothetical (h) | 0.44% | $1,000.00 | $1,022.61 | $2.21 | ||||||||||||||
| Service Class | Actual | 0.69% | $1,000.00 | $1,156.45 | $3.69 | |||||||||||||
| Hypothetical (h) | 0.69% | $1,000.00 | $1,021.37 | $3.46 | ||||||||||||||
| (h) | 5% class return per year before expenses. |
| (p) | “Expenses Paid During Period” are equal to each class’s annualized expense ratio, as shown above, multiplied by the average account value over the period, multiplied by 181/365 (to reflect theone-half year period). |
3
Table of Contents
MFS Blended Research Core Equity Portfolio
PORTFOLIO OF INVESTMENTS – 6/30/19 (unaudited)
The Portfolio of Investments is a complete list of all securities owned by your fund. It is categorized by broad-based asset classes.
| Issuer | Shares/Par | Value ($) | ||||||
| COMMON STOCKS – 99.6% | ||||||||
| Aerospace – 3.2% | ||||||||
| Boeing Co. | 14,898 | $ | 5,423,021 | |||||
| Honeywell International, Inc. | 19,167 | 3,346,367 | ||||||
| Leidos Holdings, Inc. | 71,466 | 5,706,560 | ||||||
|
| |||||||
| $ | 14,475,948 | |||||||
|
| |||||||
| Airlines – 1.0% | ||||||||
| Delta Air Lines, Inc. | 77,244 | $ | 4,383,597 | |||||
|
| |||||||
| Alcoholic Beverages – 1.2% | ||||||||
| Molson Coors Brewing Co. | 92,993 | $ | 5,207,608 | |||||
|
| |||||||
| Apparel Manufacturers – 0.2% | ||||||||
| NIKE, Inc., “B” | 12,061 | $ | 1,012,521 | |||||
|
| |||||||
| Automotive – 1.2% | ||||||||
| Lear Corp. | 38,256 | $ | 5,327,913 | |||||
|
| |||||||
| Biotechnology – 1.3% | ||||||||
| Biogen, Inc. (a) | 22,788 | $ | 5,329,430 | |||||
| Incyte Corp. (a) | 8,346 | 709,076 | ||||||
|
| |||||||
| $ | 6,038,506 | |||||||
|
| |||||||
| Brokerage & Asset Managers – 0.1% | ||||||||
| Charles Schwab Corp. | 16,179 | $ | 650,234 | |||||
|
| |||||||
| Business Services – 2.8% | ||||||||
| DXC Technology Co. | 51,817 | $ | 2,857,708 | |||||
| Fidelity National Information Services, Inc. | 44,221 | 5,425,032 | ||||||
| FleetCor Technologies, Inc. (a) | 1,584 | 444,866 | ||||||
| Global Payments, Inc. | 23,976 | 3,839,277 | ||||||
|
| |||||||
| $ | 12,566,883 | |||||||
|
| |||||||
| Cable TV – 2.9% | ||||||||
| Charter Communications, Inc., “A” (a) | 7,512 | $ | 2,968,592 | |||||
| Comcast Corp., “A” | 237,786 | 10,053,592 | ||||||
|
| |||||||
| $ | 13,022,184 | |||||||
|
| |||||||
| Chemicals – 1.7% | ||||||||
| CF Industries Holdings, Inc. | 109,445 | $ | 5,112,176 | |||||
| Eastman Chemical Co. | 34,965 | 2,721,326 | ||||||
|
| |||||||
| $ | 7,833,502 | |||||||
|
| |||||||
| Computer Software – 6.2% | ||||||||
| Adobe Systems, Inc. (a) | 4,847 | $ | 1,428,169 | |||||
| Microsoft Corp. | 197,148 | 26,409,946 | ||||||
|
| |||||||
| $ | 27,838,115 | |||||||
|
| |||||||
| Computer Software – Systems – 4.2% | ||||||||
| Apple, Inc. | 79,649 | $ | 15,764,130 | |||||
| ServiceNow, Inc. (a) | 11,987 | 3,291,271 | ||||||
|
| |||||||
| $ | 19,055,401 | |||||||
|
| |||||||
| Construction – 0.5% | ||||||||
| Toll Brothers, Inc. | 64,654 | $ | 2,367,629 | |||||
|
| |||||||
| Issuer | Shares/Par | Value ($) | ||||||
| COMMON STOCKS – continued | ||||||||
| Consumer Products – 0.7% | ||||||||
| Kimberly-Clark Corp. | 19,742 | $ | 2,631,214 | |||||
| Procter & Gamble Co. | 3,184 | 349,125 | ||||||
|
| |||||||
| $ | 2,980,339 | |||||||
|
| |||||||
| Consumer Services – 0.2% | ||||||||
| Planet Fitness, Inc. (a) | 14,148 | $ | 1,024,881 | |||||
|
| |||||||
| Electrical Equipment – 0.1% | ||||||||
| HD Supply Holdings, Inc. (a) | 16,624 | $ | 669,615 | |||||
|
| |||||||
| Electronics – 3.7% | ||||||||
| Applied Materials, Inc. | 123,707 | $ | 5,555,681 | |||||
| Intel Corp. | 196,144 | 9,389,413 | ||||||
| Lam Research Corp. | 9,610 | 1,805,143 | ||||||
|
| |||||||
| $ | 16,750,237 | |||||||
|
| |||||||
| Energy – Independent – 3.2% | ||||||||
| EOG Resources, Inc. | 56,882 | $ | 5,299,127 | |||||
| Phillips 66 | 58,266 | 5,450,202 | ||||||
| Pioneer Natural Resources Co. | 4,363 | 671,291 | ||||||
| Valero Energy Corp. | 34,578 | 2,960,222 | ||||||
|
| |||||||
| $ | 14,380,842 | |||||||
|
| |||||||
| Energy – Integrated – 0.4% | ||||||||
| Exxon Mobil Corp. | 21,305 | $ | 1,632,602 | |||||
|
| |||||||
| Food & Beverages – 2.6% | ||||||||
| Ingredion, Inc. | 24,978 | $ | 2,060,435 | |||||
| PepsiCo, Inc. | 50,745 | 6,654,192 | ||||||
| Tyson Foods, Inc., “A” | 40,290 | 3,253,015 | ||||||
|
| |||||||
| $ | 11,967,642 | |||||||
|
| |||||||
| General Merchandise – 1.1% | ||||||||
| Dollar General Corp. | 37,522 | $ | 5,071,473 | |||||
|
| |||||||
| Health Maintenance Organizations – 0.2% |
| |||||||
| Cigna Corp. | 4,400 | $ | 693,220 | |||||
|
| |||||||
| Insurance – 4.0% | ||||||||
| Allstate Corp. | 20,975 | $ | 2,132,947 | |||||
| Berkshire Hathaway, Inc., “B” (a) | 14,646 | 3,122,088 | ||||||
| Hartford Financial Services Group, Inc. | 8,458 | 471,280 | ||||||
| MetLife, Inc. | 134,152 | 6,663,330 | ||||||
| Prudential Financial, Inc. | 54,712 | 5,525,912 | ||||||
|
| |||||||
| $ | 17,915,557 | |||||||
|
| |||||||
| Internet – 4.6% | ||||||||
| Alphabet, Inc., “A” (a) | 8,087 | $ | 8,756,604 | |||||
| Alphabet, Inc., “C” (a) | 7,753 | 8,380,295 | ||||||
| Facebook, Inc., “A” (a) | 19,464 | 3,756,552 | ||||||
|
| |||||||
| $ | 20,893,451 | |||||||
|
| |||||||
| Leisure & Toys – 0.4% | ||||||||
| Electronic Arts, Inc. (a) | 18,489 | $ | 1,872,196 | |||||
|
| |||||||
4
Table of Contents
MFS Blended Research Core Equity Portfolio
Portfolio of Investments (unaudited) – continued
| Issuer | Shares/Par | Value ($) | ||||||
| COMMON STOCKS – continued | ||||||||
| Machinery & Tools – 3.4% | ||||||||
| AGCO Corp. | 45,366 | $ | 3,519,041 | |||||
| Cummins, Inc. | 16,524 | 2,831,222 | ||||||
| Eaton Corp. PLC | 80,172 | 6,676,724 | ||||||
| Ingersoll-Rand Co. PLC, “A” | 18,427 | 2,334,148 | ||||||
|
| |||||||
| $ | 15,361,135 | |||||||
|
| |||||||
| Major Banks – 5.4% | ||||||||
| Bank of America Corp. | 320,309 | $ | 9,288,961 | |||||
| JPMorgan Chase & Co. | 19,932 | 2,228,398 | ||||||
| Morgan Stanley | 113,485 | 4,971,778 | ||||||
| Wells Fargo & Co. | 163,614 | 7,742,214 | ||||||
|
| |||||||
| $ | 24,231,351 | |||||||
|
| |||||||
| Medical & Health Technology & Services – 3.7% |
| |||||||
| HCA Healthcare, Inc. | 47,978 | $ | 6,485,186 | |||||
| McKesson Corp. | 34,782 | 4,674,353 | ||||||
| Walgreens Boots Alliance, Inc. | 101,067 | 5,525,333 | ||||||
|
| |||||||
| $ | 16,684,872 | |||||||
|
| |||||||
| Medical Equipment – 2.5% | ||||||||
| Boston Scientific Corp. (a) | 67,863 | $ | 2,916,752 | |||||
| Medtronic PLC | 87,326 | 8,504,679 | ||||||
|
| |||||||
| $ | 11,421,431 | |||||||
|
| |||||||
| Natural Gas – Pipeline – 1.0% | ||||||||
| Equitrans Midstream Corp. | 56,327 | $ | 1,110,205 | |||||
| Kinder Morgan, Inc. | 157,078 | 3,279,789 | ||||||
|
| |||||||
| $ | 4,389,994 | |||||||
|
| |||||||
| Network & Telecom – 2.6% | ||||||||
| Cisco Systems, Inc. | 214,290 | $ | 11,728,092 | |||||
|
| |||||||
| Other Banks & Diversified Financials – 4.8% |
| |||||||
| Citigroup, Inc. | 132,186 | $ | 9,256,986 | |||||
| Discover Financial Services | 36,357 | 2,820,940 | ||||||
| Mastercard, Inc., “A” | 15,133 | 4,003,132 | ||||||
| Synchrony Financial | 144,514 | 5,010,300 | ||||||
| Visa, Inc., “A” | 3,939 | 683,613 | ||||||
|
| |||||||
| $ | 21,774,971 | |||||||
|
| |||||||
| Pharmaceuticals – 5.8% | ||||||||
| Bristol-Myers Squibb Co. | 37,711 | $ | 1,710,194 | |||||
| Eli Lilly & Co. | 63,714 | 7,058,874 | ||||||
| Johnson & Johnson | 94,863 | 13,212,518 | ||||||
| Pfizer, Inc. | 103,496 | 4,483,447 | ||||||
|
| |||||||
| $ | 26,465,033 | |||||||
|
| |||||||
| Railroad & Shipping – 2.0% | ||||||||
| Union Pacific Corp. | 52,196 | $ | 8,826,866 | |||||
|
| |||||||
| Real Estate – 3.6% | ||||||||
| EPR Properties, REIT | 40,813 | $ | 3,044,242 | |||||
| Medical Properties Trust, Inc., REIT | 250,235 | 4,364,098 | ||||||
| Simon Property Group, Inc., REIT | 23,319 | 3,725,444 | ||||||
| STORE Capital Corp., REIT | 161,964 | 5,375,585 | ||||||
|
| |||||||
| $ | 16,509,369 | |||||||
|
| |||||||
| Issuer | Shares/Par | Value ($) | ||||||
| COMMON STOCKS – continued |
| |||||||
| Restaurants – 2.3% | ||||||||
| Chipotle Mexican Grill, Inc., “A” (a) | 2,756 | $ | 2,019,818 | |||||
| Starbucks Corp. | 100,969 | 8,464,231 | ||||||
|
| |||||||
| $ | 10,484,049 | |||||||
|
| |||||||
| Specialty Stores – 7.4% | ||||||||
| Amazon.com, Inc. (a) | 9,498 | $ | 17,985,698 | |||||
| AutoZone, Inc. (a) | 3,762 | 4,136,206 | ||||||
| Best Buy Co., Inc. | 31,613 | 2,204,374 | ||||||
| Costco Wholesale Corp. | 30,252 | 7,994,394 | ||||||
| Target Corp. | 13,192 | 1,142,559 | ||||||
|
| |||||||
| $ | 33,463,231 | |||||||
|
| |||||||
| Telecommunications – Wireless – 0.3% |
| |||||||
| American Tower Corp., REIT | 6,885 | $ | 1,407,638 | |||||
|
| |||||||
| Telephone Services – 0.9% | ||||||||
| Verizon Communications, Inc. | 70,781 | $ | 4,043,719 | |||||
|
| |||||||
| Tobacco – 1.8% | ||||||||
| Philip Morris International, Inc. | 100,893 | $ | 7,923,127 | |||||
|
| |||||||
| Utilities – Electric Power – 4.4% | ||||||||
| AES Corp. | 341,805 | $ | 5,728,652 | |||||
| CenterPoint Energy, Inc. | 15,208 | 435,405 | ||||||
| Edison International | 25,313 | 1,706,349 | ||||||
| Exelon Corp. | 160,543 | 7,696,431 | ||||||
| NRG Energy, Inc. | 125,790 | 4,417,745 | ||||||
|
| |||||||
| $ | 19,984,582 | |||||||
|
| |||||||
| Total Common Stocks (Identified Cost, $343,038,800) | $ | 450,331,556 | ||||||
|
| |||||||
| INVESTMENT COMPANIES (h) – 0.6% |
| |||||||
| Money Market Funds – 0.6% |
| |||||||
| MFS Institutional Money Market Portfolio, 2.42% (v) (Identified Cost, $2,790,845) | 2,790,919 | $ | 2,791,199 | |||||
|
| |||||||
| OTHER ASSETS, LESS LIABILITIES – (0.2)% | (699,689 | ) | ||||||
|
| |||||||
| NET ASSETS – 100.0% | $ | 452,423,066 | ||||||
|
| |||||||
| (a) | Non-income producing security. |
| (h) | An affiliated issuer, which may be considered one in which the fund owns 5% or more of the outstanding voting securities, or a company which is under common control. At period end, the aggregate values of the fund’s investments in affiliated issuers and in unaffiliated issuers were $2,791,199 and $450,331,556, respectively. |
| (v) | Affiliated issuer that is available only to investment companies managed by MFS. The rate quoted for the MFS Institutional Money Market Portfolio is the annualizedseven-day yield of the fund at period end. |
The following abbreviations are used in this report and are defined:
| REIT | Real Estate Investment Trust |
See Notes to Financial Statements
5
Table of Contents
MFS Blended Research Core Equity Portfolio
FINANCIAL STATEMENTS | STATEMENT OF ASSETS AND LIABILITIES (unaudited)
This statement represents your fund’s balance sheet, which details the assets and liabilities comprising the total value of the fund.
At 6/30/19 | ||||
Assets | ||||
Investments in unaffiliated issuers, at value (identified cost, $343,038,800) | $450,331,556 | |||
Investments in affiliated issuers, at value (identified cost, $2,790,845) | 2,791,199 | |||
Cash | 9,816 | |||
Receivables for | ||||
Fund shares sold | 4,943 | |||
Dividends | 358,204 | |||
Other assets | 1,474 | |||
Total assets | $453,497,192 | |||
Liabilities | ||||
Payables for | ||||
Investments purchased | $557,351 | |||
Fund shares reacquired | 399,625 | |||
Payable to affiliates | ||||
Investment adviser | 19,274 | |||
Administrative services fee | 775 | |||
Shareholder servicing costs | 64 | |||
Distribution and/or service fees | 4,796 | |||
Payable for independent Trustees’ compensation | 100 | |||
Accrued expenses and other liabilities | 92,141 | |||
Total liabilities | $1,074,126 | |||
Net assets | $452,423,066 | |||
Net assets consist of | ||||
Paid-in capital | $295,899,016 | |||
Total distributable earnings (loss) | 156,524,050 | |||
Net assets | $452,423,066 | |||
Shares of beneficial interest outstanding | 8,664,101 | |||
| Net assets | Shares outstanding | Net asset value per share | ||||||||||
Initial Class | $276,469,086 | 5,273,127 | $52.43 | |||||||||
Service Class | 175,953,980 | 3,390,974 | 51.89 | |||||||||
See Notes to Financial Statements
6
Table of Contents
MFS Blended Research Core Equity Portfolio
FINANCIAL STATEMENTS | STATEMENT OF OPERATIONS (unaudited)
This statement describes how much your fund earned in investment income and accrued in expenses. It also describes any gains and/or losses generated by fund operations.
Six months ended 6/30/19 | ||||
Net investment income (loss) | ||||
Income | ||||
Dividends | $4,756,630 | |||
Dividends from affiliated issuers | 32,485 | |||
Income on securities loaned | 16,360 | |||
Other | 11,972 | |||
Total investment income | $4,817,447 | |||
Expenses | ||||
Management fee | $888,547 | |||
Distribution and/or service fees | 213,757 | |||
Shareholder servicing costs | 5,319 | |||
Administrative services fee | 36,355 | |||
Independent Trustees’ compensation | 6,082 | |||
Custodian fee | 11,355 | |||
Shareholder communications | 16,252 | |||
Audit and tax fees | 27,108 | |||
Legal fees | 2,019 | |||
Miscellaneous | 15,698 | |||
Total expenses | $1,222,492 | |||
Reduction of expenses by investment adviser | (21,468 | ) | ||
Net expenses | $1,201,024 | |||
Net investment income (loss) | $3,616,423 | |||
Realized and unrealized gain (loss) | ||||
Realized gain (loss) (identified cost basis) | ||||
Unaffiliated issuers | $6,218,058 | |||
Affiliated issuers | 54 | |||
Net realized gain (loss) | $6,218,112 | |||
Change in unrealized appreciation or depreciation | ||||
Unaffiliated issuers | $54,292,906 | |||
Affiliated issuers | 354 | |||
Net unrealized gain (loss) | $54,293,260 | |||
Net realized and unrealized gain (loss) | $60,511,372 | |||
Change in net assets from operations | $64,127,795 | |||
See Notes to Financial Statements
7
Table of Contents
MFS Blended Research Core Equity Portfolio
FINANCIAL STATEMENTS | STATEMENTS OF CHANGES IN NET ASSETS
These statements describe the increases and/or decreases in net assets resulting from operations, any distributions, and any shareholder transactions.
| Six months ended 6/30/19 | Year ended 12/31/18 | |||||||
| (unaudited) | ||||||||
Change in net assets | ||||||||
From operations | ||||||||
Net investment income (loss) | $3,616,423 | $6,265,566 | ||||||
Net realized gain (loss) | 6,218,112 | 33,514,844 | ||||||
Net unrealized gain (loss) | 54,293,260 | (73,329,128 | ) | |||||
Change in net assets from operations | $64,127,795 | $(33,548,718 | ) | |||||
Total distributions to shareholders | $— | $(47,187,077 | ) | |||||
Change in net assets from fund share transactions | $(25,665,536 | ) | $(7,790,686 | ) | ||||
Total change in net assets | $38,462,259 | $(88,526,481 | ) | |||||
Net assets | ||||||||
At beginning of period | 413,960,807 | 502,487,288 | ||||||
At end of period | $452,423,066 | $413,960,807 | ||||||
See Notes to Financial Statements
8
Table of Contents
MFS Blended Research Core Equity Portfolio
FINANCIAL STATEMENTS | FINANCIAL HIGHLIGHTS
The financial highlights table is intended to help you understand the fund’s financial performance for the semiannual period and the past 5 fiscal years. Certain information reflects financial results for a single fund share. The total returns in the table represent the rate that an investor would have earned (or lost) on an investment in the fund share class (assuming reinvestment of all distributions) held for the entire period.
| Initial Class | Six months ended 6/30/19 | Year ended | ||||||||||||||||||||||
| 12/31/18 | 12/31/17 | 12/31/16 | 12/31/15 | 12/31/14 | ||||||||||||||||||||
| (unaudited) | ||||||||||||||||||||||||
Net asset value, beginning of period | $45.29 | $54.23 | $46.62 | $48.56 | $53.50 | $48.31 | ||||||||||||||||||
| Income (loss) from investment operations | ||||||||||||||||||||||||
Net investment income (loss) (d) | $0.43 | $0.74 | $0.68 | $0.74 | (c) | $0.76 | $0.77 | |||||||||||||||||
Net realized and unrealized gain (loss) | 6.71 | (4.12 | ) | 8.80 | 3.24 | (0.62 | ) | 5.28 | ||||||||||||||||
Total from investment operations | $7.14 | $(3.38 | ) | $9.48 | $3.98 | $0.14 | $6.05 | |||||||||||||||||
| Less distributions declared to shareholders | ||||||||||||||||||||||||
From net investment income | $— | $(0.77 | ) | $(0.78 | ) | $(0.72 | ) | $(0.87 | ) | $(0.86 | ) | |||||||||||||
From net realized gain | — | (4.79 | ) | (1.09 | ) | (5.20 | ) | (4.21 | ) | — | ||||||||||||||
Total distributions declared to shareholders | $— | $(5.56 | ) | $(1.87 | ) | $(5.92 | ) | $(5.08 | ) | $(0.86 | ) | |||||||||||||
Net asset value, end of period (x) | $52.43 | $45.29 | $54.23 | $46.62 | $48.56 | $53.50 | ||||||||||||||||||
Total return (%) (k)(r)(s)(x) | 15.77 | (n) | (7.74 | ) | 20.76 | 8.45 | (c) | 1.13 | 12.57 | |||||||||||||||
| Ratios (%) (to average net assets) and Supplemental data: | ||||||||||||||||||||||||
Expenses before expense reductions (f) | 0.45 | (a) | 0.45 | 0.46 | 0.49 | (c) | 0.60 | 0.60 | ||||||||||||||||
Expenses after expense reductions (f) | 0.44 | (a) | 0.44 | 0.45 | 0.44 | (c) | 0.45 | 0.45 | ||||||||||||||||
Net investment income (loss) | 1.72 | (a) | 1.39 | 1.35 | 1.56 | (c) | 1.45 | 1.53 | ||||||||||||||||
Portfolio turnover | 22 | (n) | 54 | 51 | 49 | 51 | 41 | |||||||||||||||||
Net assets at end of period (000 omitted) | $276,469 | $256,439 | $320,384 | $306,368 | $319,721 | $361,501 | ||||||||||||||||||
| Service Class | Six months ended 6/30/19 | Year ended | ||||||||||||||||||||||
| 12/31/18 | 12/31/17 | 12/31/16 | 12/31/15 | 12/31/14 | ||||||||||||||||||||
| (unaudited) | ||||||||||||||||||||||||
Net asset value, beginning of period | $44.87 | $53.79 | $46.26 | $48.26 | $53.18 | $48.02 | ||||||||||||||||||
| Income (loss) from investment operations | ||||||||||||||||||||||||
Net investment income (loss) (d) | $0.37 | $0.61 | $0.55 | $0.61 | (c) | $0.62 | $0.64 | |||||||||||||||||
Net realized and unrealized gain (loss) | 6.65 | (4.11 | ) | 8.73 | 3.22 | (0.61 | ) | 5.23 | ||||||||||||||||
Total from investment operations | $7.02 | $(3.50 | ) | $9.28 | $3.83 | $0.01 | $5.87 | |||||||||||||||||
| Less distributions declared to shareholders | ||||||||||||||||||||||||
From net investment income | $— | $(0.63 | ) | $(0.66 | ) | $(0.63 | ) | $(0.72 | ) | $(0.71 | ) | |||||||||||||
From net realized gain | — | (4.79 | ) | (1.09 | ) | (5.20 | ) | (4.21 | ) | — | ||||||||||||||
Total distributions declared to shareholders | $— | $(5.42 | ) | $(1.75 | ) | $(5.83 | ) | $(4.93 | ) | $(0.71 | ) | |||||||||||||
Net asset value, end of period (x) | $51.89 | $44.87 | $53.79 | $46.26 | $48.26 | $53.18 | ||||||||||||||||||
Total return (%) (k)(r)(s)(x) | 15.65 | (n) | (7.99 | ) | 20.47 | 8.17 | (c) | 0.87 | 12.28 | |||||||||||||||
| Ratios (%) (to average net assets) and Supplemental data: | ||||||||||||||||||||||||
Expenses before expense reductions (f) | 0.70 | (a) | 0.70 | 0.71 | 0.74 | (c) | 0.85 | 0.85 | ||||||||||||||||
Expenses after expense reductions (f) | 0.69 | (a) | 0.69 | 0.70 | 0.69 | (c) | 0.70 | 0.70 | ||||||||||||||||
Net investment income (loss) | 1.47 | (a) | 1.14 | 1.10 | 1.30 | (c) | 1.20 | 1.28 | ||||||||||||||||
Portfolio turnover | 22 | (n) | 54 | 51 | 49 | 51 | 41 | |||||||||||||||||
Net assets at end of period (000 omitted) | $175,954 | $157,522 | $182,103 | $169,622 | $143,427 | $116,301 | ||||||||||||||||||
See Notes to Financial Statements
9
Table of Contents
MFS Blended Research Core Equity Portfolio
Financial Highlights – continued
| (a) | Annualized. |
| (c) | Amount reflects aone-time reimbursement of expenses by the custodian (or former custodian) without which net investment income and performance would be lower and expenses would be higher. |
| (d) | Per share data is based on average shares outstanding. |
| (f) | Ratios do not reflect reductions from fees paid indirectly, if applicable. |
| (k) | The total return does not reflect expenses that apply to separate accounts. Inclusion of these charges would reduce the total return figures for all periods shown. |
| (n) | Not annualized. |
| (r) | Certain expenses have been reduced without which performance would have been lower. |
| (s) | From time to time the fund may receive proceeds from litigation settlements, without which performance would be lower. |
| (x) | The net asset values and total returns have been calculated on net assets which include adjustments made in accordance with U.S. generally accepted accounting principles required at period end for financial reporting purposes. |
See Notes to Financial Statements
10
Table of Contents
MFS Blended Research Core Equity Portfolio
NOTES TO FINANCIAL STATEMENTS (unaudited)
| (1) | Business and Organization |
MFS Blended Research Core Equity Portfolio (the fund) is a diversified series of MFS Variable Insurance Trust II (the trust). The trust is organized as a Massachusetts business trust and is registered under the Investment Company Act of 1940, as amended, as anopen-end management investment company. The shareholders of each series of the trust are separate accounts of insurance companies, which offer variable annuity and/or life insurance products, and qualified retirement and pension plans.
The fund is an investment company and accordingly follows the investment company accounting and reporting guidance of the Financial Accounting Standards Board (FASB) Accounting Standards Codification Topic 946 Financial Services – Investment Companies.
| (2) | Significant Accounting Policies |
General– The preparation of financial statements in conformity with U.S. generally accepted accounting principles requires management to make estimates and assumptions that affect the reported amounts of assets and liabilities, and disclosure of contingent assets and liabilities at the date of the financial statements and the reported amounts of increases and decreases in net assets from operations during the reporting period. Actual results could differ from those estimates. In the preparation of these financial statements, management has evaluated subsequent events occurring after the date of the fund’s Statement of Assets and Liabilities through the date that the financial statements were issued.
Balance Sheet Offsetting– The fund’s accounting policy with respect to balance sheet offsetting is that, absent an event of default by the counterparty or a termination of the agreement, the International Swaps and Derivatives Association (ISDA) Master Agreement, or similar agreement, does not result in an offset of reported amounts of financial assets and financial liabilities in the Statement of Assets and Liabilities across transactions between the fund and the applicable counterparty. The fund’s right to setoff may be restricted or prohibited by the bankruptcy or insolvency laws of the particular jurisdiction to which a specific master netting agreement counterparty is subject. Balance sheet offsetting disclosures, to the extent applicable to the fund, have been included in the fund’s Significant Accounting Policies note under the captions for each of the fund’sin-scope financial instruments and transactions.
Investment Valuations– Equity securities, including restricted equity securities, are generally valued at the last sale or official closing price on their primary market or exchange as provided by a third-party pricing service. Equity securities, for which there were no sales reported that day, are generally valued at the last quoted daily bid quotation on their primary market or exchange as provided by a third-party pricing service. Short-term instruments with a maturity at issuance of 60 days or less may be valued at amortized cost, which approximates market value.Open-end investment companies are generally valued at net asset value per share. Securities and other assets generally valued on the basis of information from a third-party pricing service may also be valued at a broker/dealer bid quotation. In determining values, third-party pricing services can utilize both transaction data and market information such as yield, quality, coupon rate, maturity, type of issue, trading characteristics, and other market data.
The Board of Trustees has delegated primary responsibility for determining or causing to be determined the value of the fund’s investments (including any fair valuation) to the adviser pursuant to valuation policies and procedures approved by the Board. If the adviser determines that reliable market quotations are not readily available, investments are valued at fair value as determined in good faith by the adviser in accordance with such procedures under the oversight of the Board of Trustees. Under the fund’s valuation policies and procedures, market quotations are not considered to be readily available for most types of debt instruments and floating rate loans and many types of derivatives. These investments are generally valued at fair value based on information from third-party pricing services. In addition, investments may be valued at fair value if the adviser determines that an investment’s value has been materially affected by events occurring after the close of the exchange or market on which the investment is principally traded (such as foreign exchange or market) and prior to the determination of the fund’s net asset value, or after the halt of trading of a specific security where trading does not resume prior to the close of the exchange or market on which the security is principally traded. Events that occur after foreign markets close (such as developments in foreign markets and significant movements in the U.S. markets) and prior to the determination of the fund’s net asset value may be deemed to have a material effect on the value of securities traded in foreign markets. Accordingly, the fund’s foreign equity securities may often be valued at fair value. The adviser generally relies on third-party pricing services or other information (such as the correlation with price movements of similar securities in the same or other markets; the type, cost and investment characteristics of the security; the business and financial condition of the issuer; and trading and other market data) to assist in determining whether to fair value and at what value to fair value an investment. The value of an investment for purposes of calculating the fund’s net asset value can differ depending on the source and method used to determine value. When fair valuation is used, the value of an investment used to determine the fund’s net asset value may differ from quoted or published prices for the same investment. There can be no assurance that the fund could obtain the fair value assigned to an investment if it were to sell the investment at the same time at which the fund determines its net asset value per share.
Various inputs are used in determining the value of the fund’s assets or liabilities. These inputs are categorized into three broad levels. In certain cases, the inputs used to measure fair value may fall into different levels of the fair value hierarchy. In such cases, an
11
Table of Contents
MFS Blended Research Core Equity Portfolio
Notes to Financial Statements (unaudited) – continued
investment’s level within the fair value hierarchy is based on the lowest level of input that is significant to the fair value measurement. The fund’s assessment of the significance of a particular input to the fair value measurement in its entirety requires judgment, and considers factors specific to the investment. Level 1 includes unadjusted quoted prices in active markets for identical assets or liabilities. Level 2 includes other significant observable market-based inputs (including quoted prices for similar securities, interest rates, prepayment speed, and credit risk). Level 3 includes unobservable inputs, which may include the adviser’s own assumptions in determining the fair value of investments. The following is a summary of the levels used as of June 30, 2019 in valuing the fund’s assets or liabilities:
| Financial Instruments | Level 1 | Level 2 | Level 3 | Total | ||||||||||||
| Equity Securities | $450,331,556 | $— | $— | $450,331,556 | ||||||||||||
| Mutual Funds | 2,791,199 | — | — | 2,791,199 | ||||||||||||
| Total | $453,122,755 | $— | $— | $453,122,755 | ||||||||||||
For further information regarding security characteristics, see the Portfolio of Investments.
Security Loans – Under its Securities Lending Agency Agreement with the fund, State Street Bank and Trust Company, as lending agent, loans the securities of the fund to certain qualified institutions (the “Borrowers”) approved by the fund. Security loans can be terminated at the discretion of either the lending agent or the fund and the related securities must be returned within the earlier of the standard trade settlement period for such securities or within three business days. The loans are collateralized by cash and/or U.S. Treasury and federal agency obligations in an amount typically at least equal to the market value of the securities loaned. On loans collateralized by cash, the cash collateral is invested in a money market fund. The market value of the loaned securities is determined at the close of business of the fund and any additional required collateral is delivered to the fund on the next business day. The lending agent provides the fund with indemnification against Borrower default. In the event of Borrower default, the lending agent will, for the benefit of the fund, either purchase securities identical to those loaned or, when such purchase is commercially impracticable, pay the fund the market value of the loaned securities. In return, the lending agent assumes the fund’s rights to the related collateral. If the collateral value is less than the cost to purchase identical securities, the lending agent is responsible for the shortfall, but only to the extent that such shortfall is not due to a decline in collateral value resulting from collateral reinvestment for which the fund bears the risk of loss. A portion of the income generated upon investment of the collateral is remitted to the Borrowers, and the remainder is allocated between the fund and the lending agent. On loans collateralized by U.S. Treasury and/or federal agency obligations, a fee is received from the Borrower, and is allocated between the fund and the lending agent. Income from securities lending is separately reported in the Statement of Operations. The dividend and interest income earned on the securities loaned is accounted for in the same manner as other dividend and interest income. At June 30, 2019, there were no securities on loan or collateral outstanding.
Indemnifications– Under the fund’s organizational documents, its officers and Trustees may be indemnified against certain liabilities and expenses arising out of the performance of their duties to the fund. Additionally, in the normal course of business, the fund enters into agreements with service providers that may contain indemnification clauses. The fund’s maximum exposure under these agreements is unknown as this would involve future claims that may be made against the fund that have not yet occurred.
Investment Transactions and Income– Investment transactions are recorded on the trade date. Dividends received in cash are recorded on theex-dividend date. Certain dividends from foreign securities will be recorded when the fund is informed of the dividend if such information is obtained subsequent to theex-dividend date. Dividend payments received in additional securities are recorded on theex-dividend date in an amount equal to the value of the security on such date.
The fund may receive proceeds from litigation settlements. Any proceeds received from litigation involving portfolio holdings are reflected in the Statement of Operations in realized gain/loss if the security has been disposed of by the fund or in unrealized gain/loss if the security is still held by the fund. Any other proceeds from litigation not related to portfolio holdings are reflected as other income in the Statement of Operations.
Tax Matters and Distributions– The fund intends to qualify as a regulated investment company, as defined under Subchapter M of the Internal Revenue Code, and to distribute all of its taxable income, including realized capital gains. As a result, no provision for federal income tax is required. The fund’s federal tax returns, when filed, will remain subject to examination by the Internal Revenue Service for a three year period. Management has analyzed the fund’s tax positions taken on federal and state tax returns for all open tax years and does not believe that there are any uncertain tax positions that require recognition of a tax liability. Foreign taxes, if any, have been accrued by the fund in the accompanying financial statements in accordance with the applicable foreign tax law. Foreign income taxes may be withheld by certain countries in which the fund invests. Additionally, capital gains realized by the fund on securities issued in or by certain foreign countries may be subject to capital gains tax imposed by those countries.
Distributions to shareholders are recorded on theex-dividend date. Income and capital gain distributions are determined in accordance with income tax regulations, which may differ from U.S. generally accepted accounting principles. Certain capital accounts in the financial statements are periodically adjusted for permanent differences in order to reflect their tax character. These
12
Table of Contents
MFS Blended Research Core Equity Portfolio
Notes to Financial Statements (unaudited) – continued
adjustments have no impact on net assets or net asset value per share. Temporary differences which arise from recognizing certain items of income, expense, gain or loss in different periods for financial statement and tax purposes will reverse at some time in the future. Distributions in excess of net investment income or net realized gains are temporary overdistributions for financial statement purposes resulting from differences in the recognition or classification of income or distributions for financial statement and tax purposes.
Book/tax differences primarily relate to wash sale loss deferrals.
The tax character of distributions declared to shareholders for the last fiscal year is as follows:
| Year ended 12/31/18 | ||||
| Ordinary income (including any short-term capital gains) | $6,509,038 | |||
| Long-term capital gains | 40,678,039 | |||
| Total distributions | $47,187,077 | |||
The federal tax cost and the tax basis components of distributable earnings were as follows:
| As of 6/30/19 | ||||
| Cost of investments | $346,791,083 | |||
| Gross appreciation | 113,766,610 | |||
| Gross depreciation | (7,434,938 | ) | ||
| Net unrealized appreciation (depreciation) | $106,331,672 | |||
| As of 12/31/18 | ||||
| Undistributed ordinary income | 6,264,931 | |||
| Undistributed long-term capital gain | 33,871,487 | |||
| Net unrealized appreciation (depreciation) | 52,259,837 | |||
The aggregate cost above includes prior fiscal year end tax adjustments, if applicable.
Multiple Classes of Shares of Beneficial Interest– The fund offers multiple classes of shares, which differ in their respective distribution and/or service fees. The fund’s income, realized and unrealized gain (loss), and common expenses are allocated to shareholders based on the daily net assets of each class. Dividends are declared separately for each class. Differences in per share dividend rates are generally due to differences in separate class expenses. The fund’s distributions declared to shareholders as reported in the Statements of Changes in Net Assets are presented by class as follows:
| From net investment income | From net realized gain | |||||||||||||||
| Six months ended 6/30/19 | Year ended 12/31/18 | Six months ended 6/30/19 | Year ended 12/31/18 | |||||||||||||
| Initial Class | $— | $4,125,022 | $— | $25,645,863 | ||||||||||||
| Service Class | — | 2,036,008 | — | 15,380,184 | ||||||||||||
| Total | $— | $6,161,030 | $— | $41,026,047 | ||||||||||||
| (3) | Transactions with Affiliates |
Investment Adviser– The fund has an investment advisory agreement with MFS to provide overall investment management and related administrative services and facilities to the fund. The management fee is computed daily and paid monthly at the following annual rates based on the fund’s average daily net assets:
| Up to $1 billion | 0.40% | |||
| In excess of $1 billion and up to $2.5 billion | 0.375% | |||
| In excess of $2.5 billion | 0.35% |
MFS has agreed in writing to reduce its management fee by a specified amount if certain MFS mutual fund assets exceed thresholds agreed to by MFS and the fund’s Board of Trustees. For the six months ended June 30, 2019, this management fee reduction amounted to $21,468, which is included in the reduction of total expenses in the Statement of Operations. The management fee incurred for the six months ended June 30, 2019 was equivalent to an annual effective rate of 0.39% of the fund’s average daily net assets.
Distributor– MFS Fund Distributors, Inc. (MFD), a wholly-owned subsidiary of MFS, is the distributor of shares of the fund. The Trustees have adopted a distribution plan for the Service Class shares pursuant to Rule12b-1 under the Investment Company Act of 1940.
The fund’s distribution plan provides that the fund will pay MFD distribution and/or service fees equal to 0.25% per annum of its average daily net assets attributable to Service Class shares as partial consideration for services performed and expenses incurred by
13
Table of Contents
MFS Blended Research Core Equity Portfolio
Notes to Financial Statements (unaudited) – continued
MFD and financial intermediaries (including participating insurance companies that invest in the fund to fund variable annuity and variable life insurance contracts, sponsors of qualified retirement and pension plans that invest in the fund, and affiliates of these participating insurance companies and plan sponsors) in connection with the sale and distribution of the Service Class shares. MFD may subsequently pay all, or a portion, of the distribution and/or service fees to financial intermediaries.
Shareholder Servicing Agent– MFS Service Center, Inc. (MFSC), a wholly-owned subsidiary of MFS, receives a fee from the fund for its services as shareholder servicing agent. For the six months ended June 30, 2019, the fee was $5,059, which equated to 0.0023% annually of the fund’s average daily net assets. MFSC also receives payment from the fund forout-of-pocket expenses paid by MFSC on behalf of the fund. For the six months ended June 30, 2019, these costs amounted to $260.
Administrator– MFS provides certain financial, legal, shareholder communications, compliance, and other administrative services to the fund. Under an administrative services agreement, the fund reimburses MFS the costs incurred to provide these services. The fund is charged an annual fixed amount of $17,500 plus a fee based on average daily net assets. The administrative services fee incurred for the six months ended June 30, 2019 was equivalent to an annual effective rate of 0.0163% of the fund’s average daily net assets.
Trustees’ and Officers’ Compensation– The fund pays compensation to independent Trustees in the form of a retainer, attendance fees, and additional compensation to Board and Committee chairpersons. The fund does not pay compensation directly to Trustees or officers of the fund who are also officers of the investment adviser, all of whom receive remuneration from MFS for their services to the fund. Certain officers and Trustees of the fund are officers or directors of MFS, MFD, and MFSC.
Other– This fund and certain other funds managed by MFS (the funds) had entered into a service agreement (the ISO Agreement) which provided for payment of fees solely by the funds to Tarantino LLC in return for the provision of services of an Independent Senior Officer (ISO) for the funds. Frank L. Tarantino served as the ISO and was an officer of the funds and the sole member of Tarantino LLC. Effective June 30, 2019, Mr. Tarantino retired from his position as ISO for the funds, and the ISO Agreement was terminated. For the six months ended June 30, 2019, the fee paid by the fund under this agreement was $521 and is included in “Miscellaneous” expense in the Statement of Operations. MFS had agreed to bear all expenses associated with office space, other administrative support, and supplies provided to the ISO.
The fund invests in the MFS Institutional Money Market Portfolio which is managed by MFS and seeks current income consistent with preservation of capital and liquidity. This money market fund does not pay a management fee to MFS.
The adviser has voluntarily undertaken to reimburse the fund from its own resources on a quarterly basis for the cost of investment research embedded in the cost of the fund’s securities trades. This agreement may be rescinded at any time. For the six months ended June 30, 2019, this reimbursement amounted to $11,889, which is included in “Other” income in the Statement of Operations.
| (4) | Portfolio Securities |
For the six months ended June 30, 2019, purchases and sales of investments, other than short-term obligations, aggregated $97,583,324 and $118,509,306, respectively.
| (5) | Shares of Beneficial Interest |
The fund’s Declaration of Trust permits the Trustees to issue an unlimited number of full and fractional shares of beneficial interest. Transactions in fund shares were as follows:
| Six months ended 6/30/19 | Year ended 12/31/18 | |||||||||||||||
| Shares | Amount | Shares | Amount | |||||||||||||
| Shares sold | ||||||||||||||||
Initial Class | 29,336 | $1,482,517 | 98,132 | $5,079,123 | ||||||||||||
Service Class | 66,013 | 3,274,739 | 253,350 | 13,012,309 | ||||||||||||
| 95,349 | $4,757,256 | 351,482 | $18,091,432 | |||||||||||||
| Shares issued to shareholders in reinvestment of distributions | ||||||||||||||||
Initial Class | — | $— | 552,893 | $29,330,972 | ||||||||||||
Service Class | — | — | 331,043 | 17,416,192 | ||||||||||||
| — | $— | 883,936 | $46,747,164 | |||||||||||||
| Shares reacquired | ||||||||||||||||
Initial Class | (418,949 | ) | $(21,189,233 | ) | (896,433 | ) | $(48,014,750 | ) | ||||||||
Service Class | (185,387 | ) | (9,233,559 | ) | (459,784 | ) | (24,614,532 | ) | ||||||||
| (604,336 | ) | $(30,422,792 | ) | (1,356,217 | ) | $(72,629,282 | ) | |||||||||
| Net change | ||||||||||||||||
Initial Class | (389,613 | ) | $(19,706,716 | ) | (245,408 | ) | $(13,604,655 | ) | ||||||||
Service Class | (119,374 | ) | (5,958,820 | ) | 124,609 | 5,813,969 | ||||||||||
| (508,987 | ) | $(25,665,536 | ) | (120,799 | ) | $(7,790,686 | ) | |||||||||
14
Table of Contents
MFS Blended Research Core Equity Portfolio
Notes to Financial Statements (unaudited) – continued
| (6) | Line of Credit |
The fund and certain other funds managed by MFS participate in a $1.25 billion unsecured committed line of credit, subject to a $1 billion sublimit, provided by a syndicate of banks under a credit agreement. Borrowings may be made for temporary financing needs. Interest is charged to each fund, based on its borrowings, generally at a rate equal to the highest of one month LIBOR, the Federal Funds Effective Rate and the Overnight Bank Funding Rate, plus an agreed upon spread. A commitment fee, based on the average daily, unused portion of the committed line of credit, is allocated among the participating funds. In addition, the fund and other funds managed by MFS have established unsecured uncommitted borrowing arrangements with certain banks for temporary financing needs. Interest is charged to each fund, based on its borrowings, at rates equal to customary reference rates plus an agreed upon spread. For the six months ended June 30, 2019, the fund’s commitment fee and interest expense were $1,322 and $0, respectively, and are included in “Miscellaneous” expense in the Statement of Operations.
| (7) | Investments in Affiliated Issuers |
An affiliated issuer may be considered one in which the fund owns 5% or more of the outstanding voting securities, or a company which is under common control. For the purposes of this report, the following were affiliated issuers:
| Affiliated Issuers | Beginning Value | Purchases | Sales Proceeds | Realized Gain (Loss) | Change in Unrealized Appreciation or Depreciation | Ending Value | ||||||||||||||||||
| MFS Institutional Money Market Portfolio | $3,121,333 | $21,646,063 | $21,976,605 | $54 | $354 | $2,791,199 | ||||||||||||||||||
| Affiliated Issuers | Dividend Income | Capital Gain Distributions | ||||||||||||||||||||||
| MFS Institutional Money Market Portfolio |
| $32,485 | $— | |||||||||||||||||||||
15
Table of Contents
MFS Blended Research Core Equity Portfolio
PROXY VOTING POLICIES AND INFORMATION
MFS votes proxies on behalf of the fund pursuant to proxy voting policies and procedures that are available without charge, upon request, by calling 1-800-225-2606, by visitingmfs.com/proxyvoting, or by visiting the SEC’s Web site athttp://www.sec.gov.
Information regarding how the fund voted proxies relating to portfolio securities during the most recent twelve-month period ended June 30 is available by August 31 of each year without charge by visitingmfs.com/proxyvoting, or by visiting the SEC’s Web site athttp://www.sec.gov.
QUARTERLY PORTFOLIO DISCLOSURE
The fund files a complete schedule of portfolio holdings with the SEC for the first and third quarters of each fiscal year on Form N-Q or as an exhibit to its reports on Form N-PORT (for first and third fiscal quarters ending March 31, 2019 or after). The fund’sForm N-Q or Form N-PORT reports are available on the SEC’s website athttp://www.sec.gov. A shareholder can obtain the portfolio holdings report for the first and third quarters of the fund’s fiscal year atmfs.com/vit2 by choosing the fund’s name and then selecting the “Resources” tab and clicking on “Prospectus and Reports”.
From time to time, MFS may post important information about the fund or the MFS funds on the MFS web site (mfs.com). This information is available athttps://www.mfs.com/en-us/what-we-do/announcements.htmlor atmfs.com/vit2 by choosing the fund’s name.
INFORMATION ABOUT FUND CONTRACTS AND LEGAL CLAIMS
The fund has entered into contractual arrangements with an investment adviser, administrator, distributor, shareholder servicing agent, 529 program manager (if applicable), and custodian who each provide services to the fund. Unless expressly stated otherwise, shareholders are not parties to, or intended beneficiaries of these contractual arrangements, and these contractual arrangements are not intended to create any shareholder right to enforce them against the service providers or to seek any remedy under them against the service providers, either directly or on behalf of the fund.
Under the Trust’s By-Laws and Declaration of Trust, any claims asserted against or on behalf of the MFS Funds, including claims against Trustees and Officers, must be brought in state and federal courts located within the Commonwealth of Massachusetts.
16
Table of Contents
Table of Contents
Semiannual Report
June 30, 2019

MFS® Corporate Bond Portfolio

MFS® Variable Insurance Trust II
Beginning on January 1, 2021, as permitted by regulations adopted by the U.S. Securities and Exchange Commission, the insurance company that offers your contract may determine that it will no longer send you paper copies of the fund’s annual and semiannual shareholder reports unless you specifically request paper copies from the insurance company or from your financial intermediary. Instead, the shareholder reports will be made available on a Web site (insurancefunds.mfs.com or other Web site of which you will be notified), and the insurance company will notify you by mail each time a report is posted and provide you with a Web site link to access the report. Instructions for requesting paper copies will be provided by your insurance company or financial intermediary.
If you already elected to receive shareholder reports by email, you will not be affected by this change and you need not take any action. If your insurance company or financial intermediary offers electronic delivery, you may elect to receive shareholder reports and other communications from the insurance company or financial intermediary by email by following the instructions provided by the insurance company or financial intermediary.
Beginning on January 1, 2019, you may elect to receive all future reports in paper free of charge from the insurance company or financial intermediary. You can inform the insurance company or financial intermediary that you wish to continue receiving paper copies of your shareholder reports by contacting your insurance company or financial intermediary. Your election to receive reports in paper will apply to all funds held in your account with your insurance company or financial intermediary.
BDS-SEM
Table of Contents
MFS® Corporate Bond Portfolio
The report is prepared for the general information of contract owners. It is authorized for distribution to prospective investors only when preceded or accompanied by a current prospectus.
NOT FDIC INSURED• MAY LOSE VALUE• NO BANK OR CREDIT UNION GUARANTEE• NOT A DEPOSIT• NOT INSURED BY ANY FEDERAL GOVERNMENT AGENCY OR NCUA/NCUSIF
Table of Contents
MFS Corporate Bond Portfolio
LETTER FROM THE EXECUTIVE CHAIRMAN

Dear Contract Owners:
Slowing global growth, low inflation, and increasing trade friction between the United States and China have been hallmarks of the past 12 months. After experiencing an uptick in market volatility in late 2018, markets steadied during the first half of 2019, thanks in large measure to the adoption of a dovish policy stance on the part of global central banks, who have largely abandoned efforts to normalize interest rates and have instead focused on supporting economic growth. Trade tensions remain high as the U.S. has ratcheted up tariffs on Chinese imports and China has retaliated. A truce of sorts was reached midyear, but significant challenges continue to confront negotiators, and it is not known whether a comprehensive agreement can be reached.
With Boris Johnson replacing Theresa May as Britain’s prime minister, uncertainty over Brexit remains high. Johnson has adopted a more combative stance than his predecessor toward the European Union, increasing concerns that there will be a “hard” Brexit.
Markets expect that the longest economic expansion in U.S. history will continue for the time being, albeit at a slower pace. Nevertheless, slower growth and low inflation have spurred the U.S. Federal Reserve to take a more accommodative policy stance, prompting investors to anticipate several interest rate cuts in the coming year. The European Central Bank has adopted a similar position. The more accommodative environment has helped fuel a continued rise in global equities and has been broadly supportive of risk assets.
Since launching the first U.S.open-end mutual fund in 1924, MFS® has been committed to a single purpose: to create value by allocating capital responsibly for clients. Through our powerful global investment platform, we combine collective expertise, thoughtful risk management, and long-term discipline to uncover what we believe are the best investment opportunities in the market.
Respectfully,

Robert J. Manning
Executive Chairman
MFS Investment Management
August 16, 2019
The opinions expressed in this letter are subject to change and may not be relied upon for investment advice. No forecasts can be guaranteed.
1
Table of Contents
MFS Corporate Bond Portfolio
Portfolio structure (i)
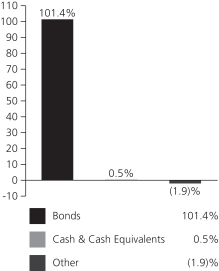
| Fixed income sectors (i) | ||||
| Investment Grade Corporates | 82.5% | |||
| High Yield Corporates | 10.3% | |||
| U.S. Treasury Securities | 7.5% | |||
| Emerging Markets Bonds | 0.9% | |||
| Commercial Mortgage-Backed Securities | 0.1% | |||
| Asset-Backed Securities | 0.1% | |||
| Mortgage-Backed Securities (o) | 0.0% |
| Composition including fixed income credit quality (a)(i) |
| |||
| AA | 2.3% | |||
| A | 20.2% | |||
| BBB | 60.2% | |||
| BB | 10.5% | |||
| B | 0.5% | |||
| CCC | 0.1% | |||
| D | 0.1% | |||
| U.S. Government | 5.6% | |||
| Federal Agencies (o) | 0.0% | |||
| Not Rated | 1.9% | |||
| Cash & Cash Equivalents | 0.5% | |||
| Other | (1.9)% | |||
| Portfolio facts (i) | ||||
| Average Duration (d) | 7.3 | |||
| Average Effective Maturity (m) | 10.4 yrs. | |||
| (a) | For all securities other than those specifically described below, ratings are assigned to underlying securities utilizing ratings from Moody’s, Fitch, and Standard & Poor’s rating agencies and applying the following hierarchy: If all three agencies provide a rating, the middle rating (after dropping the highest and lowest ratings) is assigned; if two of the three agencies rate a security, the lower of the two is assigned. Ratings are shown in the S&P and Fitch scale (e.g., AAA). Securities rated BBB or higher are considered investment grade. All ratings are subject to change. U.S. Government includes securities issued by the U.S. Department of the Treasury. Federal Agencies includes rated and unrated U.S. Agency fixed-income securities, U.S. Agency mortgage-backed securities, and collateralized mortgage obligations of U.S. Agency mortgage-backed securities. Not Rated includes fixed income securities and fixed income derivatives, which have not been rated by any rating agency. The fund may or may not have held all of these instruments on this date. The fund is not rated by these agencies. |
| (d) | Duration is a measure of how much a bond’s price is likely to fluctuate with general changes in interest rates, e.g., if rates rise 1.00%, a bond with a5-year duration is likely to lose about 5.00% of its value due to the interest rate move. |
| (i) | For purposes of this presentation, the components include the value of securities, and reflect the impact of the equivalent exposure of derivative positions, if any. These amounts may be negative from time to time. Equivalent exposure is a calculated amount that translates the derivative position into a reasonable approximation of the amount of the underlying asset that the portfolio would have to hold at a given point in time to have the same price sensitivity that results from the portfolio’s ownership of the derivative contract. When dealing with derivatives, equivalent exposure is a more representative measure of the potential impact of a position on portfolio performance than value. The bond component will include any accrued interest amounts. |
| (m) | In determining each instrument’s effective maturity for purposes of calculating the fund’s dollar-weighted average effective maturity, MFS uses the instrument’s stated maturity or, if applicable, an earlier date on which MFS believes it is probable that a maturity-shortening device (such as a put,pre-refunding or prepayment) will cause the instrument to be repaid. Such an earlier date can be substantially shorter than the instrument’s stated maturity. |
| (o) | Less than 0.1%. |
Where the fund holds convertible bonds, they are treated as part of the equity portion of the portfolio.
Cash & Cash Equivalents includes any cash, investments in money market funds, short-term securities, and other assets less liabilities. Please see the Statement of Assets and Liabilities for additional information related to the fund’s cash position and other assets and liabilities.
Other includes equivalent exposure from currency derivatives and/or any offsets to derivative positions and may be negative.
Percentages are based on net assets as of June 30, 2019.
The portfolio is actively managed and current holdings may be different.
2
Table of Contents
MFS Corporate Bond Portfolio
Fund Expenses Borne by the Contract Holders during the Period,
January 1, 2019 through June 30, 2019
As a contract holder of the fund, you incur ongoing costs, including management fees; distribution and/or service(12b-1) fees; and other fund expenses. This example is intended to help you understand your ongoing costs (in dollars) of investing in the fund and to compare these costs with the ongoing costs of investing in other mutual funds.
The example is based on an investment of $1,000 invested at the beginning of the period and held for the entire period January 1, 2019 through June 30, 2019.
Actual Expenses
The first line for each share class in the following table provides information about actual account values and actual expenses. You may use the information in this line, together with the amount you invested, to estimate the expenses that you paid over the period. Simply divide your account value by $1,000 (for example, an $8,600 account value divided by $1,000 = 8.6), then multiply the result by the number in the first line under the heading entitled “Expenses Paid During Period” to estimate the expenses you paid on your account during this period.
Hypothetical Example for Comparison Purposes
The second line for each share class in the following table provides information about hypothetical account values and hypothetical expenses based on the fund’s actual expense ratio and an assumed rate of return of 5% per year before expenses, which is not the fund’s actual return. The hypothetical account values and expenses may not be used to estimate the actual ending account balance or expenses you paid for the period. You may use this information to compare the ongoing costs of investing in the fund and other funds. To do so, compare this 5% hypothetical example with the 5% hypothetical examples that appear in the shareholder reports of the other funds.
Please note that the expenses shown in the table are meant to highlight the fund’s ongoing costs only and do not take into account the fees and expenses imposed under the variable contracts through which your investment in the fund is made. Therefore, the second line for each share class in the table is useful in comparing ongoing costs associated with an investment in vehicles (such as the fund) which fund benefits under variable annuity and variable life insurance contracts and to qualified pension and retirement plans only, and will not help you determine the relative total costs of investing in the fund through variable annuity and variable life insurance contracts. If the fees and expenses imposed under the variable contracts were included, your costs would have been higher.
| Share Class | Annualized Expense Ratio | Beginning Account Value 1/01/19 | Ending Account Value 6/30/19 | Expenses Paid During Period (p) 1/01/19-6/30/19 | ||||||||||||||
| Initial Class | Actual | 0.63% | $1,000.00 | $1,100.83 | $3.28 | |||||||||||||
| Hypothetical (h) | 0.63% | $1,000.00 | $1,021.67 | $3.16 | ||||||||||||||
| Service Class | Actual | 0.88% | $1,000.00 | $1,100.38 | $4.58 | |||||||||||||
| Hypothetical (h) | 0.88% | $1,000.00 | $1,020.43 | $4.41 | ||||||||||||||
| (h) | 5% class return per year before expenses. |
| (p) | “Expenses Paid During Period” are equal to each class’s annualized expense ratio, as shown above, multiplied by the average account value over the period, multiplied by 181/365 (to reflect theone-half year period). |
3
Table of Contents
MFS Corporate Bond Portfolio
PORTFOLIO OF INVESTMENTS – 6/30/19 (unaudited)
The Portfolio of Investments is a complete list of all securities owned by your fund. It is categorized by broad-based asset classes.
| Issuer | Shares/Par | Value ($) | ||||||
| BONDS – 98.4% | ||||||||
| Aerospace – 3.2% |
| |||||||
| Huntington Ingalls Industries, Inc., 3.483%, 12/01/2027 | $ | 630,000 | $ | 639,702 | ||||
| L3 Technologies, Inc., 3.85%, 6/15/2023 | 1,083,000 | 1,130,017 | ||||||
| Lockheed Martin Corp., 3.55%, 1/15/2026 | 964,000 | 1,024,546 | ||||||
| Northrop Grumman Corp., 2.55%, 10/15/2022 | 1,737,000 | 1,740,614 | ||||||
| Northrop Grumman Corp., 2.93%, 1/15/2025 | 1,488,000 | 1,515,523 | ||||||
| TransDigm, Inc., 6.25%, 3/15/2026 (n) | 1,109,000 | 1,167,222 | ||||||
|
| |||||||
| $ | 7,217,624 | |||||||
|
| |||||||
| Apparel Manufacturers – 0.7% | ||||||||
| Tapestry, Inc., 4.125%, 7/15/2027 | $ | 1,518,000 | $ | 1,526,497 | ||||
|
| |||||||
| Asset-Backed & Securitized – 0.2% | ||||||||
| Bayview Financial Revolving Mortgage Loan Trust, FLR, 4.002% (LIBOR – 1mo. + 1.6%), 12/28/2040 (z) | $ | 129,177 | $ | 124,477 | ||||
| Greenwich Capital Commercial Funding Corp., 5.83%, 7/10/2038 | 85,592 | 86,068 | ||||||
| JPMorgan Chase Commercial Mortgage Securities Corp., 5.943%, 7/15/2042 (n)(q) | 200,367 | 135,959 | ||||||
| Lehman Brothers Commercial Conduit Mortgage Trust, 1.116%, 2/18/2030 (i) | 25,292 | 2 | ||||||
|
| |||||||
| $ | 346,506 | |||||||
|
| |||||||
| Automotive – 2.6% | ||||||||
| Allison Transmission, Inc., 5.875%, 6/01/2029 (n) | $ | 717,000 | $ | 754,643 | ||||
| General Motors Co., 5.15%, 4/01/2038 | 606,000 | 597,329 | ||||||
| General Motors Co., 6.25%, 10/02/2043 | 1,257,000 | 1,338,090 | ||||||
| General Motors Financial Co., Inc., 4.35%, 1/17/2027 | 472,000 | 480,794 | ||||||
| Lear Corp., 3.8%, 9/15/2027 | 1,276,000 | 1,263,068 | ||||||
| ZF North America Capital, Inc., 4.75%, 4/29/2025 (n) | 1,426,000 | 1,473,678 | ||||||
|
| |||||||
| $ | 5,907,602 | |||||||
|
| |||||||
| Broadcasting – 1.1% | ||||||||
| Discovery, Inc., 4.125%, 5/15/2029 | $ | 373,000 | $ | 388,481 | ||||
| Fox Corp., 4.03%, 1/25/2024 (n) | 283,000 | 301,013 | ||||||
| Fox Corp., 5.476%, 1/25/2039 (n) | 708,000 | 835,482 | ||||||
| Netflix, Inc., 4.875%, 4/15/2028 | 894,000 | 921,938 | ||||||
|
| |||||||
| $ | 2,446,914 | |||||||
|
| |||||||
| Brokerage & Asset Managers – 2.1% | ||||||||
| Charles Schwab Corp., 3.85%, 5/21/2025 | $ | 1,140,000 | $ | 1,217,036 | ||||
| E*TRADE Financial Corp., 2.95%, 8/24/2022 | 625,000 | 631,177 | ||||||
| Intercontinental Exchange, Inc., 2.75%, 12/01/2020 | 652,000 | 656,220 | ||||||
| Intercontinental Exchange, Inc., 3.75%, 12/01/2025 | 1,070,000 | 1,142,876 | ||||||
| TD Ameritrade Holding Corp., 3.3%, 4/01/2027 | 1,080,000 | 1,114,306 | ||||||
|
| |||||||
| $ | 4,761,615 | |||||||
|
| |||||||
| Issuer | Shares/Par | Value ($) | ||||||
| BONDS – continued | ||||||||
| Building – 1.8% | ||||||||
| CRH America Finance, Inc., 4.5%, 4/04/2048 (n) | $ | 896,000 | $ | 883,610 | ||||
| Martin Marietta Materials, Inc., 4.25%, 7/02/2024 | 850,000 | 902,316 | ||||||
| Martin Marietta Materials, Inc., 3.45%, 6/01/2027 | 504,000 | 501,373 | ||||||
| Martin Marietta Materials, Inc., 3.5%, 12/15/2027 | 747,000 | 745,745 | ||||||
| Masco Corp., 4.45%, 4/01/2025 | 560,000 | 596,410 | ||||||
| Masco Corp., 4.375%, 4/01/2026 | 476,000 | 499,316 | ||||||
|
| |||||||
| $ | 4,128,770 | |||||||
|
| |||||||
| Business Services – 2.2% | ||||||||
| Equinix, Inc., 5.75%, 1/01/2025 | $ | 969,000 | $ | 1,008,729 | ||||
| Fidelity National Information Services, Inc., 3.5%, 4/15/2023 | 220,000 | 227,407 | ||||||
| Fidelity National Information Services, Inc., 5%, 10/15/2025 | 216,000 | 242,487 | ||||||
| Fidelity National Information Services, Inc., 3%, 8/15/2026 | 1,167,000 | 1,180,824 | ||||||
| Fiserv, Inc., 4.4%, 7/01/2049 | 711,000 | 748,022 | ||||||
| MSCI, Inc., 5.75%, 8/15/2025 (n) | 1,464,000 | 1,537,200 | ||||||
|
| |||||||
| $ | 4,944,669 | |||||||
|
| |||||||
| Cable TV – 2.7% | ||||||||
| Charter Communications Operating LLC/Charter Communications Operating Capital Corp., 6.384%, 10/23/2035 | $ | 505,000 | $ | 593,079 | ||||
| Cox Communications, Inc., 3.5%, 8/15/2027 (n) | 803,000 | 818,037 | ||||||
| Cox Communications, Inc., 4.6%, 8/15/2047 (n) | 332,000 | 336,385 | ||||||
| Sirius XM Radio, Inc., 5.375%, 4/15/2025 (n) | 170,000 | 175,312 | ||||||
| Sirius XM Radio, Inc., 5.375%, 7/15/2026 (n) | 353,000 | 365,796 | ||||||
| Sirius XM Radio, Inc., 5%, 8/01/2027 (n) | 594,000 | 604,336 | ||||||
| Time Warner Cable, Inc., 5%, 2/01/2020 | 354,000 | 358,654 | ||||||
| Time Warner Cable, Inc., 4.5%, 9/15/2042 | 955,000 | 892,359 | ||||||
| Time Warner Entertainment Co. LP, 8.375%, 7/15/2033 | 266,000 | 358,469 | ||||||
| Videotron Ltd., 5%, 7/15/2022 | 1,555,000 | 1,628,862 | ||||||
|
| |||||||
| $ | 6,131,289 | |||||||
|
| |||||||
| Chemicals – 0.8% | ||||||||
| LyondellBasell Industries N.V., 6%, 11/15/2021 | $ | 1,256,000 | $ | 1,346,712 | ||||
| Sherwin-Williams Co., 4.5%, 6/01/2047 | 500,000 | 533,298 | ||||||
|
| |||||||
| $ | 1,880,010 | |||||||
|
| |||||||
4
Table of Contents
MFS Corporate Bond Portfolio
Portfolio of Investments (unaudited) – continued
| Issuer | Shares/Par | Value ($) | ||||||
| BONDS – continued | ||||||||
| Computer Software – 1.0% | ||||||||
| Dell International LLC/EMC Corp., 4.9%, 10/01/2026 (n) | $ | 1,456,000 | $ | 1,519,124 | ||||
| VeriSign, Inc., 4.625%, 5/01/2023 | 763,000 | 775,437 | ||||||
|
| |||||||
| $ | 2,294,561 | |||||||
|
| |||||||
| Computer Software – Systems – 0.4% |
| |||||||
| Apple, Inc., 4.375%, 5/13/2045 | $ | 383,000 | $ | 436,520 | ||||
| Apple, Inc., 4.25%, 2/09/2047 | 319,000 | 358,611 | ||||||
|
| |||||||
| $ | 795,131 | |||||||
|
| |||||||
| Conglomerates – 1.0% | ||||||||
| Roper Technologies, Inc., 4.2%, 9/15/2028 | $ | 681,000 | $ | 729,178 | ||||
| United Technologies Corp., 4.125%, 11/16/2028 | 517,000 | 567,977 | ||||||
| Wabtec Corp., 4.95%, 9/15/2028 | 890,000 | 954,275 | ||||||
|
| |||||||
| $ | 2,251,430 | |||||||
|
| |||||||
| Consumer Products – 1.6% | ||||||||
| Reckitt Benckiser Treasury Services PLC, 3%, 6/26/2027 (n) | $ | 1,876,000 | $ | 1,891,492 | ||||
| Whirlpool Corp., 4.75%, 2/26/2029 | 1,482,000 | 1,596,054 | ||||||
|
| |||||||
| $ | 3,487,546 | |||||||
|
| |||||||
| Consumer Services – 2.7% | ||||||||
| IHS Markit Ltd., 3.625%, 5/01/2024 | $ | 310,000 | $ | 319,502 | ||||
| IHS Markit Ltd., 4.25%, 5/01/2029 | 465,000 | 488,129 | ||||||
| Priceline Group, Inc., 3.65%, 3/15/2025 | 283,000 | 299,107 | ||||||
| Priceline Group, Inc., 3.6%, 6/01/2026 | 1,761,000 | 1,856,920 | ||||||
| Priceline Group, Inc., 3.55%, 3/15/2028 | 486,000 | 506,548 | ||||||
| Service Corp. International, 5.125%, 6/01/2029 | 980,000 | 1,031,450 | ||||||
| Visa, Inc., 4.15%, 12/14/2035 | 1,413,000 | 1,623,850 | ||||||
|
| |||||||
| $ | 6,125,506 | |||||||
|
| |||||||
| Containers – 1.1% | ||||||||
| Ball Corp., 4%, 11/15/2023 | $ | 1,009,000 | $ | 1,043,054 | ||||
| Ball Corp., 5.25%, 7/01/2025 | 1,354,000 | 1,465,705 | ||||||
|
| |||||||
| $ | 2,508,759 | |||||||
|
| |||||||
| Electrical Equipment – 0.9% | ||||||||
| Arrow Electronics, Inc., 3.875%, 1/12/2028 | $ | 1,979,000 | $ | 1,962,373 | ||||
|
| |||||||
| Electronics – 2.2% | ||||||||
| Broadcom Corp./Broadcom Cayman Finance Ltd., 3.875%, 1/15/2027 | $ | 2,494,000 | $ | 2,443,874 | ||||
| Broadcom Corp./Broadcom Cayman Finance Ltd., 3.5%, 1/15/2028 | 976,000 | 926,551 | ||||||
| Broadcom, Inc., 4.25%, 4/15/2026 (n) | 1,267,000 | 1,285,847 | ||||||
| Tyco Electronics Group S.A., 3.5%, 2/03/2022 | 252,000 | 258,258 | ||||||
|
| |||||||
| $ | 4,914,530 | |||||||
|
| |||||||
| Emerging Market Quasi-Sovereign – 0.7% |
| |||||||
| Petrobras Global Finance B.V., 6.9%, 3/19/2049 | $ | 1,414,000 | $ | 1,505,910 | ||||
|
| |||||||
| Energy – Integrated – 1.3% | ||||||||
| Eni S.p.A., 4.75%, 9/12/2028 (n) | $ | 761,000 | $ | 832,648 | ||||
| Eni S.p.A., 4.25%, 5/09/2029 (n) | 650,000 | 680,277 | ||||||
| Issuer | Shares/Par | Value ($) | ||||||
| BONDS – continued | ||||||||
| Energy – Integrated – continued |
| |||||||
| Shell International Finance B.V., 3.75%, 9/12/2046 | $ | 1,300,000 | $ | 1,376,352 | ||||
|
| |||||||
| $ | 2,889,277 | |||||||
|
| |||||||
| Financial Institutions – 1.8% |
| |||||||
| AerCap Ireland Capital Ltd., 4.625%, 10/30/2020 | $ | 227,000 | $ | 232,767 | ||||
| AerCap Ireland Capital Ltd., 4.875%, 1/16/2024 | 434,000 | 466,031 | ||||||
| AerCap Ireland Capital Ltd., 3.65%, 7/21/2027 | 1,576,000 | 1,567,656 | ||||||
| Avolon Holdings Funding Ltd., 4.375%, 5/01/2026 (n) | 624,000 | 642,221 | ||||||
| International Lease Finance Corp., 5.875%, 8/15/2022 | 1,000,000 | 1,089,341 | ||||||
|
| |||||||
| $ | 3,998,016 | |||||||
|
| |||||||
| Food & Beverages – 2.9% | ||||||||
| Anheuser-Busch InBev Worldwide, Inc., 4.15%, 1/23/2025 | $ | 470,000 | $ | 509,115 | ||||
| Anheuser-Busch InBev Worldwide, Inc., 4.375%, 4/15/2038 | 527,000 | 556,308 | ||||||
| Anheuser-Busch InBev Worldwide, Inc., 5.55%, 1/23/2049 | 566,000 | 693,637 | ||||||
| Conagra Brands, Inc., 5.3%, 11/01/2038 | 213,000 | 231,048 | ||||||
| Conagra Brands, Inc., 5.4%, 11/01/2048 | 421,000 | 462,040 | ||||||
| Constellation Brands, Inc., 4.25%, 5/01/2023 | 1,605,000 | 1,707,762 | ||||||
| JBS USA LLC/JBS USA Finance, Inc., 6.75%, 2/15/2028 (n) | 938,000 | 1,018,903 | ||||||
| JBS USA Lux S.A./JBS USA Finance, Inc., 6.5%, 4/15/2029 (n) | 714,000 | 775,583 | ||||||
| Tyson Foods, Inc., 4.5%, 6/15/2022 | 598,000 | 630,792 | ||||||
|
| |||||||
| $ | 6,585,188 | |||||||
|
| |||||||
| Gaming & Lodging – 2.3% | ||||||||
| GLP Capital LP/GLP Financing II, Inc., 5.75%, 6/01/2028 | $ | 1,365,000 | $ | 1,504,189 | ||||
| GLP Capital LP/GLP Financing II, Inc., 5.3%, 1/15/2029 | 319,000 | 343,802 | ||||||
| Hilton Domestic Operating Co., Inc., 5.125%, 5/01/2026 | 474,000 | 494,737 | ||||||
| Hilton Domestic Operating Co., Inc., 4.875%, 1/15/2030 (z) | 922,000 | 949,660 | ||||||
| Marriott International, Inc., 4%, 4/15/2028 | 1,749,000 | 1,842,392 | ||||||
|
| |||||||
| $ | 5,134,780 | |||||||
|
| |||||||
| Health Maintenance Organizations – 0.5% |
| |||||||
| Halfmoon Parent, Inc., 4.125%, 11/15/2025 (n) | $ | 945,000 | $ | 1,006,370 | ||||
|
| |||||||
| Insurance – 1.0% | ||||||||
| American International Group, Inc., 4.7%, 7/10/2035 | $ | 1,010,000 | $ | 1,107,761 | ||||
| American International Group, Inc., 4.5%, 7/16/2044 | 367,000 | 387,949 | ||||||
5
Table of Contents
MFS Corporate Bond Portfolio
Portfolio of Investments (unaudited) – continued
| Issuer | Shares/Par | Value ($) | ||||||
| BONDS – continued | ||||||||
| Insurance – continued | ||||||||
| Unum Group, 4%, 3/15/2024 | $ | 637,000 | $ | 664,350 | ||||
|
| |||||||
| $ | 2,160,060 | |||||||
|
| |||||||
| Insurance – Health – 1.5% | ||||||||
| Centene Corp., 5.375%, 6/01/2026 (n) | $ | 1,249,000 | $ | 1,313,011 | ||||
| UnitedHealth Group, Inc., 4.625%, 7/15/2035 | 1,690,000 | 1,942,203 | ||||||
|
| |||||||
| $ | 3,255,214 | |||||||
|
| |||||||
| Insurance – Property & Casualty – 3.1% |
| |||||||
| Aon Corp., 3.75%, 5/02/2029 | $ | 1,376,000 | $ | 1,434,132 | ||||
| Berkshire Hathaway, Inc., 2.75%, 3/15/2023 | 828,000 | 841,377 | ||||||
| Chubb INA Holdings, Inc., 2.3%, 11/03/2020 | 343,000 | 343,147 | ||||||
| Liberty Mutual Group, Inc., 4.85%, 8/01/2044 (n) | 743,000 | 815,607 | ||||||
| Marsh & McLennan Cos., Inc., 4.8%, 7/15/2021 | 900,000 | 935,768 | ||||||
| Marsh & McLennan Cos., Inc., 3.5%, 6/03/2024 | 779,000 | 812,268 | ||||||
| Marsh & McLennan Cos., Inc., 4.75%, 3/15/2039 | 740,000 | 848,883 | ||||||
| Marsh & McLennan Cos., Inc., 4.35%, 1/30/2047 | 471,000 | 510,713 | ||||||
| Swiss Re Ltd., 4.25%, 12/06/2042 (n) | 468,000 | 507,435 | ||||||
|
| |||||||
| $ | 7,049,330 | |||||||
|
| |||||||
| Machinery & Tools – 0.6% | ||||||||
| CNH Industrial Capital LLC, 4.2%, 1/15/2024 | $ | 515,000 | $ | 535,934 | ||||
| CNH Industrial Capital LLC, 3.85%, 11/15/2027 | 905,000 | 903,722 | ||||||
|
| |||||||
| $ | 1,439,656 | |||||||
|
| |||||||
| Major Banks – 12.7% | ||||||||
| Bank of America Corp., 3.124% to 1/20/2022, FLR (LIBOR - 3mo. + 1.16%) to 1/20/2023 | $ | 1,232,000 | $ | 1,250,257 | ||||
| Bank of America Corp., 3.004%, 12/20/2023 | 739,000 | 752,557 | ||||||
| Bank of America Corp., 4.125%, 1/22/2024 | 1,917,000 | 2,050,290 | ||||||
| Bank of America Corp., 4.2%, 8/26/2024 | 1,434,000 | 1,524,344 | ||||||
| Bank of America Corp., 3.419% to 12/20/2027, FLR (LIBOR - 3mo. + 1.04%) to 12/20/2028 | 351,000 | 361,178 | ||||||
| Bank of America Corp., 6.1% to 3/17/2025, FLR (LIBOR - 3mo. + 3.898%) to 12/29/2049 | 1,420,000 | 1,533,600 | ||||||
| Bank of America Corp., 5.875% to 3/15/2028, FLR (LIBOR - 3mo. + 2.931%) to 12/31/2059 | 936,000 | 976,997 | ||||||
| Goldman Sachs Group, Inc., 3.85%, 1/26/2027 | 608,000 | 635,479 | ||||||
| HSBC Holdings PLC, 4.375%, 11/23/2026 | 941,000 | 993,742 | ||||||
| JPMorgan Chase & Co., 4.5%, 1/24/2022 | 790,000 | 832,449 | ||||||
| JPMorgan Chase & Co., 3.25%, 9/23/2022 | 2,397,000 | 2,462,511 | ||||||
| JPMorgan Chase & Co., 3.125%, 1/23/2025 | 688,000 | 707,486 | ||||||
| JPMorgan Chase & Co., 3.54%, 5/01/2028 | 1,709,000 | 1,778,897 | ||||||
| Issuer | Shares/Par | Value ($) | ||||||
| BONDS – continued | ||||||||
| Major Banks – continued | ||||||||
| JPMorgan Chase & Co., 3.964% to 11/15/2047, FLR (LIBOR - 3mo. + 1.38%) to 11/15/2048 | $ | 1,500,000 | $ | 1,591,486 | ||||
| JPMorgan Chase & Co., 3.897% to 1/23/2048, FLR (LIBOR - 3mo. + 1.22%) to 1/23/2049 | 1,111,000 | 1,164,656 | ||||||
| JPMorgan Chase & Co., 6.75% to 2/01/2024, FLR (LIBOR - 3mo. + 3.78%) to 1/29/2049 | 1,221,000 | 1,349,486 | ||||||
| Morgan Stanley, 5.5%, 7/28/2021 | 1,245,000 | 1,322,767 | ||||||
| Morgan Stanley, 4.431% to 1/23/2029, | ||||||||
| FLR (LIBOR - 3mo. + 1.63%) to 1/23/2030 | 439,000 | 485,648 | ||||||
| Sumitomo Mitsui Financial Group, Inc., 3.102%, 1/17/2023 | 1,861,000 | 1,894,207 | ||||||
| UBS Group Funding (Switzerland) AG, 3.491%, 5/23/2023 (n) | 1,293,000 | 1,325,554 | ||||||
| UBS Group Funding (Switzerland) AG, 4.253%, 3/23/2028 (n) | 414,000 | 446,233 | ||||||
| Wachovia Corp., 6.605%, 10/01/2025 | 1,270,000 | 1,525,354 | ||||||
| Wells Fargo & Co., 3.75%, 1/24/2024 | 1,037,000 | 1,090,261 | ||||||
| Wells Fargo & Co., 4.1%, 6/03/2026 | 476,000 | 504,809 | ||||||
|
| |||||||
| $ | 28,560,248 | |||||||
|
| |||||||
| Medical & Health Technology & Services – 5.0% |
| |||||||
| Becton, Dickinson and Co., 3.734%, 12/15/2024 | $ | 161,000 | $ | 168,880 | ||||
| Becton, Dickinson and Co., 4.685%, 12/15/2044 | 847,000 | 939,578 | ||||||
| Becton, Dickinson and Co., 4.669%, 6/06/2047 | 955,000 | 1,069,926 | ||||||
| HCA, Inc., 4.75%, 5/01/2023 | 910,000 | 974,065 | ||||||
| HCA, Inc., 5.25%, 6/15/2026 | 978,000 | 1,082,850 | ||||||
| HCA, Inc., 5.875%, 2/01/2029 | 472,000 | 517,430 | ||||||
| HCA, Inc., 5.125%, 6/15/2039 | 207,000 | 215,222 | ||||||
| Laboratory Corp. of America Holdings, 3.25%, 9/01/2024 | 917,000 | 934,862 | ||||||
| Laboratory Corp. of America Holdings, 4.7%, 2/01/2045 | 900,000 | 931,392 | ||||||
| Life Technologies Corp., 6%, 3/01/2020 | 2,172,000 | 2,217,897 | ||||||
| Thermo Fisher Scientific, Inc., 2.95%, 9/19/2026 | 555,000 | 558,163 | ||||||
| Thermo Fisher Scientific, Inc., 4.1%, 8/15/2047 | 1,544,000 | 1,651,838 | ||||||
|
| |||||||
| $ | 11,262,103 | |||||||
|
| |||||||
| Medical Equipment – 2.1% | ||||||||
| Abbott Laboratories, 2.9%, 11/30/2021 | $ | 2,291,000 | $ | 2,328,961 | ||||
| Abbott Laboratories, 4.75%, 11/30/2036 | 836,000 | 987,707 | ||||||
| Boston Scientific Corp., 3.75%, 3/01/2026 | 548,000 | 582,853 | ||||||
| Teleflex, Inc., 4.625%, 11/15/2027 | 125,000 | 128,594 | ||||||
| Zimmer Biomet Holdings, Inc., FLR, 3.168% (LIBOR - 3mo. + 0.75%), 3/19/2021 | 774,000 | 773,174 | ||||||
|
| |||||||
| $ | 4,801,289 | |||||||
|
| |||||||
6
Table of Contents
MFS Corporate Bond Portfolio
Portfolio of Investments (unaudited) – continued
| Issuer | Shares/Par | Value ($) | ||||||
| BONDS – continued | ||||||||
| Metals & Mining – 1.4% | ||||||||
| Glencore Funding LLC, 4.125%, 5/30/2023 (n) | $ | 863,000 | $ | 897,235 | ||||
| Glencore Funding LLC, 4%, 3/27/2027 (n) | 1,129,000 | 1,140,036 | ||||||
| Glencore Funding LLC, 3.875%, 10/27/2027 (n) | 559,000 | 557,558 | ||||||
| Vale Overseas Ltd., 6.875%, 11/21/2036 | 469,000 | 563,386 | ||||||
|
| |||||||
| $ | 3,158,215 | |||||||
|
| |||||||
| Midstream – 4.1% | ||||||||
| APT Pipelines Ltd., 5%, 3/23/2035 (n) | $ | 1,375,000 | $ | 1,466,794 | ||||
| Dominion Gas Holdings LLC, 2.8%, 11/15/2020 | 975,000 | 979,522 | ||||||
| Enterprise Products Operating LLC, 4.2%, 1/31/2050 | 724,000 | 740,314 | ||||||
| Kinder Morgan Energy Partners LP, 6.85%, 2/15/2020 | 370,000 | 379,414 | ||||||
| MPLX LP, 4.5%, 4/15/2038 | 744,000 | 751,148 | ||||||
| Sabine Pass Liquefaction LLC, 5.625%, 4/15/2023 | 1,467,000 | 1,597,813 | ||||||
| Sabine Pass Liquefaction LLC, 5.625%, 3/01/2025 | 133,000 | 148,970 | ||||||
| Sabine Pass Liquefaction LLC, 5.875%, 6/30/2026 | 289,000 | 330,250 | ||||||
| Sabine Pass Liquefaction LLC, 5%, 3/15/2027 | 542,000 | 594,279 | ||||||
| Sabine Pass Liquefaction LLC, 4.2%, 3/15/2028 | 1,021,000 | 1,074,824 | ||||||
| Tallgrass Energy LP, 4.75%, 10/01/2023 (n) | 1,184,000 | 1,200,304 | ||||||
|
| |||||||
| $ | 9,263,632 | |||||||
|
| |||||||
| Mortgage-Backed – 0.0% | ||||||||
| Freddie Mac, 3.244%, 8/25/2027 | $ | 69,000 | $ | 73,064 | ||||
|
| |||||||
| Natural Gas – Distribution – 2.4% | ||||||||
| NiSource Finance Corp., 3.85%, 2/15/2023 | $ | 1,106,000 | $ | 1,143,679 | ||||
| NiSource Finance Corp., 4.8%, 2/15/2044 | 761,000 | 848,590 | ||||||
| NiSource, Inc., 5.65%, 2/01/2045 | 475,000 | 576,988 | ||||||
| Sempra Energy, 3.25%, 6/15/2027 | 2,779,000 | 2,778,941 | ||||||
|
| |||||||
| $ | 5,348,198 | |||||||
|
| |||||||
| Network & Telecom – 1.3% | ||||||||
| AT&T, Inc., 5.35%, 12/15/2043 | $ | 685,000 | $ | 752,079 | ||||
| AT&T, Inc., 4.75%, 5/15/2046 | 1,136,000 | 1,199,632 | ||||||
| AT&T, Inc., 5.15%, 11/15/2046 | 445,000 | 492,057 | ||||||
| AT&T, Inc., 5.65%, 2/15/2047 | 452,000 | 530,340 | ||||||
|
| |||||||
| $ | 2,974,108 | |||||||
|
| |||||||
| Oils – 2.9% | ||||||||
| Marathon Petroleum Corp., 3.4%, 12/15/2020 | $ | 1,105,000 | $ | 1,116,465 | ||||
| Marathon Petroleum Corp., 4.75%, 9/15/2044 | 910,000 | 938,607 | ||||||
| Marathon Petroleum Corp., 4.5%, 4/01/2048 | 883,000 | 887,302 | ||||||
| Valero Energy Corp., 3.4%, 9/15/2026 | 1,601,000 | 1,632,593 | ||||||
| Valero Energy Corp., 4.9%, 3/15/2045 | 1,783,000 | 1,964,543 | ||||||
|
| |||||||
| $ | 6,539,510 | |||||||
|
| |||||||
| Issuer | Shares/Par | Value ($) | ||||||
| BONDS – continued | ||||||||
| Other Banks & Diversified Financials – 0.9% |
| |||||||
| Capital One Financial Corp., 3.75%, 4/24/2024 | $ | 796,000 | $ | 835,322 | ||||
| Groupe BPCE S.A., 4.5%, 3/15/2025 (n) | 760,000 | 801,016 | ||||||
| Macquarie Bank Ltd., 6.125% to 3/08/2027, FLR (Swap Rate - 5yr. + 3.703%) to 12/31/2165 (n) | 444,000 | 438,725 | ||||||
|
| |||||||
| $ | 2,075,063 | |||||||
|
| |||||||
| Pharmaceuticals – 0.8% | ||||||||
| Elanco Animal Health, Inc., 4.9%, 8/28/2028 | $ | 1,624,000 | $ | 1,813,707 | ||||
|
| |||||||
| Pollution Control – 1.1% | ||||||||
| Republic Services, Inc., 5.25%, 11/15/2021 | $ | 1,160,000 | $ | 1,236,023 | ||||
| Republic Services, Inc., 3.95%, 5/15/2028 | 1,100,000 | 1,186,626 | ||||||
|
| |||||||
| $ | 2,422,649 | |||||||
|
| |||||||
| Precious Metals & Minerals – 0.4% | ||||||||
| Teck Resources Ltd., 6%, 8/15/2040 | $ | 222,000 | $ | 241,538 | ||||
| Teck Resources Ltd., 6.25%, 7/15/2041 | 667,000 | 748,899 | ||||||
|
| |||||||
| $ | 990,437 | |||||||
|
| |||||||
| Railroad & Shipping – 0.2% | ||||||||
| Canadian Pacific Railway Co., 4.5%, 1/15/2022 | $ | 400,000 | $ | 420,031 | ||||
|
| |||||||
| Retailers – 1.5% | ||||||||
| Best Buy Co., Inc., 5.5%, 3/15/2021 | $ | 31,000 | $ | 32,303 | ||||
| Best Buy Co., Inc., 4.45%, 10/01/2028 | 973,000 | 1,026,829 | ||||||
| Dollar Tree, Inc., 4%, 5/15/2025 | 874,000 | 911,055 | ||||||
| Dollar Tree, Inc., 4.2%, 5/15/2028 | 368,000 | 381,107 | ||||||
| Home Depot, Inc., 4.875%, 2/15/2044 | 760,000 | 921,353 | ||||||
|
| |||||||
| $ | 3,272,647 | |||||||
|
| |||||||
| Specialty Chemicals – 0.3% | ||||||||
| Ecolab, Inc., 4.35%, 12/08/2021 | $ | 656,000 | $ | 688,908 | ||||
|
| |||||||
| Telecommunications – Wireless – 4.2% |
| |||||||
| American Tower Corp., REIT, 3.5%, 1/31/2023 | $ | 371,000 | $ | 382,997 | ||||
| American Tower Corp., REIT, 3%, 6/15/2023 | 1,049,000 | 1,059,175 | ||||||
| American Tower Corp., REIT, 4%, 6/01/2025 | 1,000,000 | 1,054,454 | ||||||
| American Tower Corp., REIT, 3.6%, 1/15/2028 | 1,133,000 | 1,153,336 | ||||||
| American Tower Corp., REIT, 3.8%, 8/15/2029 | 553,000 | 570,033 | ||||||
| Crown Castle International Corp., 5.25%, 1/15/2023 | 470,000 | 511,065 | ||||||
| Crown Castle International Corp., 3.15%, 7/15/2023 | 878,000 | 895,007 | ||||||
| Crown Castle International Corp., 4.45%, 2/15/2026 | 338,000 | 364,590 | ||||||
| Crown Castle International Corp., 3.7%, 6/15/2026 | 533,000 | 553,527 | ||||||
| SBA Tower Trust, 2.898%, 10/15/2044 (n) | 1,081,000 | 1,080,986 | ||||||
| T-Mobile USA, Inc., 6%, 4/15/2024 | 1,640,000 | 1,709,700 | ||||||
|
| |||||||
| $ | 9,334,870 | |||||||
|
| |||||||
7
Table of Contents
MFS Corporate Bond Portfolio
Portfolio of Investments (unaudited) – continued
| Issuer | Shares/Par | Value ($) | ||||||
| BONDS – continued | ||||||||
| Tobacco – 0.5% | ||||||||
| Altria Group, Inc., 4.8%, 2/14/2029 | $ | 945,000 | $ | 1,016,623 | ||||
| Reynolds American, Inc., 3.25%, 6/12/2020 | 165,000 | 166,120 | ||||||
|
| |||||||
| $ | 1,182,743 | |||||||
|
| |||||||
| Transportation – Services – 0.5% | ||||||||
| ERAC USA Finance LLC, 3.85%, 11/15/2024 (n) | $ | 272,000 | $ | 287,634 | ||||
| ERAC USA Finance LLC, 7%, 10/15/2037 (n) | 421,000 | 575,025 | ||||||
| ERAC USA Finance LLC, 4.5%, 2/15/2045 (n) | 201,000 | 212,334 | ||||||
|
| |||||||
| $ | 1,074,993 | |||||||
|
| |||||||
| U.S. Treasury Obligations – 5.5% | ||||||||
| U.S. Treasury Bonds, 3.5%, 2/15/2039 (f) | $ | 8,277,000 | $ | 9,831,847 | ||||
| U.S. Treasury Bonds, 3%, 2/15/2048 | 2,322,600 | 2,544,427 | ||||||
|
| |||||||
| $ | 12,376,274 | |||||||
|
| |||||||
| Utilities – Electric Power – 6.6% |
| |||||||
| Berkshire Hathaway Energy, 4.5%, 2/01/2045 | $ | 597,000 | $ | 672,631 | ||||
| Duke Energy Corp., 3.75%, 9/01/2046 | 1,059,000 | 1,032,481 | ||||||
| Duke Energy Progress LLC, 3.45%, 3/15/2029 | 582,000 | 613,614 | ||||||
| EDP Finance B.V., 5.25%, 1/14/2021 (n) | 728,000 | 754,563 | ||||||
| Emera U.S. Finance LP, 2.7%, 6/15/2021 | 330,000 | 331,128 | ||||||
| Emera U.S. Finance LP, 3.55%, 6/15/2026 | 378,000 | 386,237 | ||||||
| Enel Finance International N.V., 2.75%, 4/06/2023 (n) | 1,974,000 | 1,968,724 | ||||||
| Issuer | Shares/Par | Value ($) | ||||||
| BONDS – continued | ||||||||
| Utilities – Electric Power – continued |
| |||||||
| Enel Finance International N.V., 3.625%, 5/25/2027 (n) | $ | 471,000 | $ | 473,150 | ||||
| Enel Finance International N.V., 4.75%, 5/25/2047 (n) | 460,000 | 478,650 | ||||||
| Eversource Energy, 2.9%, 10/01/2024 | 991,000 | 1,007,336 | ||||||
| Exelon Corp., 3.497%, 6/01/2022 | 1,163,000 | 1,191,473 | ||||||
| FirstEnergy Corp., 3.9%, 7/15/2027 | 707,000 | 742,530 | ||||||
| NextEra Energy Capital Holdings, Inc., 3.15%, 4/01/2024 | 1,283,000 | 1,319,052 | ||||||
| PPL Capital Funding, Inc., 5%, 3/15/2044 | 590,000 | 655,821 | ||||||
| PPL WEM Holdings PLC, 5.375%, 5/01/2021 (n) | 1,057,000 | 1,094,143 | ||||||
| Public Service Enterprise Group, 2%, 11/15/2021 | 1,555,000 | 1,540,450 | ||||||
| Southern Co., 2.95%, 7/01/2023 | 440,000 | 446,590 | ||||||
|
| |||||||
| $ | 14,708,573 | |||||||
|
| |||||||
| Total Bonds (Identified Cost, $209,687,042) | $ | 220,996,395 | ||||||
|
| |||||||
| INVESTMENT COMPANIES (h) – 0.6% |
| |||||||
| Money Market Funds – 0.6% |
| |||||||
| MFS Institutional Money Market Portfolio, 2.42% (v) (Identified Cost, $1,258,991) | 1,259,125 | $ | 1,259,251 | |||||
|
| |||||||
| OTHER ASSETS, LESS LIABILITIES – 1.0% | 2,254,813 | |||||||
|
| |||||||
| NET ASSETS – 100.0% | $ | 224,510,459 | ||||||
|
| |||||||
| (f) | All or a portion of the security has been segregated as collateral for open futures contracts. |
| (h) | An affiliated issuer, which may be considered one in which the fund owns 5% or more of the outstanding voting securities, or a company which is under common control. At period end, the aggregate values of the fund’s investments in affiliated issuers and in unaffiliated issuers were $1,259,251 and $220,996,395, respectively. |
| (i) | Interest only security for which the fund receives interest on notional principal (Par amount). Par amount shown is the notional principal and does not reflect the cost of the security. |
| (n) | Securities exempt from registration under Rule 144A of the Securities Act of 1933. These securities may be sold in the ordinary course of business in transactions exempt from registration, normally to qualified institutional buyers. At period end, the aggregate value of these securities was $36,875,855, representing 16.4% of net assets. |
| (q) | Interest received was less than stated coupon rate. |
| (v) | Affiliated issuer that is available only to investment companies managed by MFS. The rate quoted for the MFS Institutional Money Market Portfolio is the annualizedseven-day yield of the fund at period end. |
| (z) | Restricted securities are not registered under the Securities Act of 1933 and are subject to legal restrictions on resale. These securities generally may be resold in transactions exempt from registration or to the public if the securities are subsequently registered. Disposal of these securities may involve time-consuming negotiations and prompt sale at an acceptable price may be difficult. The fund holds the following restricted securities: |
| Restricted Securities | Acquisition Date | Cost | Value | |||||||
| Bayview Financial Revolving Mortgage Loan Trust, FLR, 4.002% (LIBOR - 1mo. + 1.6%), 12/28/2040 | 3/01/06 | $129,177 | $124,477 | |||||||
| Hilton Domestic Operating Co., Inc., 4.875%, 1/15/2030 | 6/10/19 | 922,000 | 949,660 | |||||||
| Total Restricted Securities | $1,074,137 | |||||||||
| % of Net assets | 0.5% | |||||||||
The following abbreviations are used in this report and are defined:
| FLR | Floating Rate. Interest rate resets periodically based on the parenthetically disclosed reference rate plus a spread (if any). Theperiod-end rate reported may not be the current rate. All reference rates are USD unless otherwise noted. |
| LIBOR | London Interbank Offered Rate |
| REIT | Real Estate Investment Trust |
8
Table of Contents
MFS Corporate Bond Portfolio
Portfolio of Investments (unaudited) – continued
Derivative Contracts at 6/30/19
Futures Contracts
| Description | Long/ Short | Currency | Contracts | Notional Amount | Expiration Date | Value/Unrealized Appreciation (Depreciation) | ||||||||||||||||
| Asset Derivatives | ||||||||||||||||||||||
| Interest Rate Futures | ||||||||||||||||||||||
| U.S. Treasury Note 2 yr | Long | USD | 80 | $17,214,375 | September - 2019 | $112,843 | ||||||||||||||||
| U.S. Treasury Ultra Bond | Long | USD | 22 | 3,906,375 | September - 2019 | 155,980 | ||||||||||||||||
|
| |||||||||||||||||||||
| $268,823 | ||||||||||||||||||||||
|
| |||||||||||||||||||||
| Liability Derivatives | ||||||||||||||||||||||
| Interest Rate Futures | ||||||||||||||||||||||
| U.S. Treasury Note 10 yr | Short | USD | 100 | $12,796,875 | September - 2019 | $(278,488 | ) | |||||||||||||||
| U.S. Treasury Ultra Note 10 yr | Short | USD | 30 | 4,143,750 | September - 2019 | (111,202 | ) | |||||||||||||||
|
| |||||||||||||||||||||
| $(389,690 | ) | |||||||||||||||||||||
|
| |||||||||||||||||||||
At June 30, 2019, the fund had liquid securities with an aggregate value of $79,586 to cover any collateral or margin obligations for certain derivative contracts.
See Notes to Financial Statements
9
Table of Contents
MFS Corporate Bond Portfolio
FINANCIAL STATEMENTS | STATEMENT OF ASSETS AND LIABILITIES (unaudited)
This statement represents your fund’s balance sheet, which details the assets and liabilities comprising the total value of the fund.
At 6/30/19 | ||||
Assets | ||||
Investments in unaffiliated issuers, at value (identified cost, $209,687,042) | $220,996,395 | |||
Investments in affiliated issuers, at value (identified cost, $1,258,991) | 1,259,251 | |||
Receivables for | ||||
Investments sold | 403,050 | |||
Fund shares sold | 314,060 | |||
Interest | 2,425,519 | |||
Other assets | 851 | |||
Total assets | $225,399,126 | |||
Liabilities | ||||
Payable to custodian | $6,281 | |||
Payables for | ||||
Net daily variation margin on open futures contracts | 11,296 | |||
Investments purchased | 722,494 | |||
Fund shares reacquired | 63,364 | |||
Payable to affiliates | ||||
Investment adviser | 3,071 | |||
Administrative services fee | 445 | |||
Shareholder servicing costs | 34 | |||
Distribution and/or service fees | 4,525 | |||
Payable for independent Trustees’ compensation | 100 | |||
Accrued expenses and other liabilities | 77,057 | |||
Total liabilities | $888,667 | |||
Net assets | $224,510,459 | |||
Net assets consist of | ||||
Paid-in capital | $203,640,410 | |||
Total distributable earnings (loss) | 20,870,049 | |||
Net assets | $224,510,459 | |||
Shares of beneficial interest outstanding | 19,070,722 | |||
| Net assets | Shares outstanding | Net asset value per share | ||||||||||
Initial Class | $58,688,719 | 4,931,984 | $11.90 | |||||||||
Service Class | 165,821,740 | 14,138,738 | 11.73 | |||||||||
See Notes to Financial Statements
10
Table of Contents
MFS Corporate Bond Portfolio
FINANCIAL STATEMENTS | STATEMENT OF OPERATIONS (unaudited)
This statement describes how much your fund earned in investment income and accrued in expenses. It also describes any gains and/or losses generated by fund operations.
Six months ended 6/30/19 | ||||
Net investment income (loss) | ||||
Income | ||||
Interest | $4,437,577 | |||
Dividends from affiliated issuers | 51,596 | |||
Other | 49 | |||
Total investment income | $4,489,222 | |||
Expenses | ||||
Management fee | $648,851 | |||
Distribution and/or service fees | 199,408 | |||
Shareholder servicing costs | 2,748 | |||
Administrative services fee | 20,366 | |||
Independent Trustees’ compensation | 5,835 | |||
Custodian fee | 7,443 | |||
Shareholder communications | 9,287 | |||
Audit and tax fees | 37,542 | |||
Legal fees | 1,030 | |||
Miscellaneous | 15,381 | |||
Total expenses | $947,891 | |||
Reduction of expenses by investment adviser | (65,831 | ) | ||
Net expenses | $882,060 | |||
Net investment income (loss) | $3,607,162 | |||
Realized and unrealized gain (loss) | ||||
Realized gain (loss) (identified cost basis) | ||||
Unaffiliated issuers | $331,300 | |||
Affiliated issuers | 66 | |||
Net realized gain (loss) | $331,366 | |||
Change in unrealized appreciation or depreciation | ||||
Unaffiliated issuers | $17,006,773 | |||
Affiliated issuers | 161 | |||
Futures contracts | (120,867 | ) | ||
Net unrealized gain (loss) | $16,886,067 | |||
Net realized and unrealized gain (loss) | $17,217,433 | |||
Change in net assets from operations | $20,824,595 | |||
See Notes to Financial Statements
11
Table of Contents
MFS Corporate Bond Portfolio
FINANCIAL STATEMENTS | STATEMENTS OF CHANGES IN NET ASSETS
These statements describe the increases and/or decreases in net assets resulting from operations, any distributions, and any shareholder transactions.
| Six months ended 6/30/19 | Year ended 12/31/18 | |||||||
| (unaudited) | ||||||||
Change in net assets | ||||||||
From operations | ||||||||
Net investment income (loss) | $3,607,162 | $7,734,863 | ||||||
Net realized gain (loss) | 331,366 | (982,075 | ) | |||||
Net unrealized gain (loss) | 16,886,067 | (15,069,804 | ) | |||||
Change in net assets from operations | $20,824,595 | $(8,317,016 | ) | |||||
Total distributions to shareholders | $— | $(9,639,419 | ) | |||||
Change in net assets from fund share transactions | $(7,190,345 | ) | $(30,948,965 | ) | ||||
Total change in net assets | $13,634,250 | $(48,905,400 | ) | |||||
Net assets | ||||||||
At beginning of period | 210,876,209 | 259,781,609 | ||||||
At end of period | $224,510,459 | $210,876,209 | ||||||
See Notes to Financial Statements
12
Table of Contents
MFS Corporate Bond Portfolio
FINANCIAL STATEMENTS | FINANCIAL HIGHLIGHTS
The financial highlights table is intended to help you understand the fund’s financial performance for the semiannual period and the past 5 fiscal years. Certain information reflects financial results for a single fund share. The total returns in the table represent the rate that an investor would have earned (or lost) on an investment in the fund share class (assuming reinvestment of all distributions) held for the entire period.
| Initial Class | Six months 6/30/19 | Year ended | ||||||||||||||||||||||
| 12/31/18 | 12/31/17 | 12/31/16 | 12/31/15 | 12/31/14 | ||||||||||||||||||||
| (unaudited) | ||||||||||||||||||||||||
Net asset value, beginning of period | $10.81 | $11.64 | $11.36 | $11.16 | $11.76 | $11.58 | ||||||||||||||||||
| Income (loss) from investment operations | ||||||||||||||||||||||||
Net investment income (loss) (d) | $0.20 | $0.38 | $0.39 | $0.41 | (c) | $0.42 | $0.43 | |||||||||||||||||
Net realized and unrealized gain (loss) | 0.89 | (0.72 | ) | 0.33 | 0.31 | (0.46 | ) | 0.24 | ||||||||||||||||
Total from investment operations | $1.09 | $(0.34 | ) | $0.72 | $0.72 | $(0.04 | ) | $0.67 | ||||||||||||||||
| Less distributions declared to shareholders | ||||||||||||||||||||||||
From net investment income | $— | $(0.44 | ) | $(0.44 | ) | $(0.50 | ) | $(0.48 | ) | $(0.46 | ) | |||||||||||||
From net realized gain | — | (0.05 | ) | — | (0.02 | ) | (0.08 | ) | (0.03 | ) | ||||||||||||||
Total distributions declared to shareholders | $— | $(0.49 | ) | $(0.44 | ) | $(0.52 | ) | $(0.56 | ) | $(0.49 | ) | |||||||||||||
Net asset value, end of period (x) | $11.90 | $10.81 | $11.64 | $11.36 | $11.16 | $11.76 | ||||||||||||||||||
Total return (%) (k)(r)(s)(x) | 10.08 | (n) | (3.00 | ) | 6.39 | 6.28 | (c) | (0.31 | ) | 5.78 | ||||||||||||||
| Ratios (%) (to average net assets) and Supplemental data: | ||||||||||||||||||||||||
Expenses before expense reductions (f) | 0.69 | (a) | 0.68 | 0.68 | 0.65 | (c) | 0.68 | 0.67 | ||||||||||||||||
Expenses after expense reductions (f) | 0.63 | (a) | 0.63 | 0.63 | 0.60 | (c) | 0.63 | 0.65 | ||||||||||||||||
Net investment income (loss) | 3.52 | (a) | 3.44 | 3.37 | 3.52 | (c) | 3.64 | 3.59 | ||||||||||||||||
Portfolio turnover | 20 | (n) | 32 | 36 | 31 | 26 | 36 | |||||||||||||||||
Net assets at end of period (000 omitted) | $58,689 | $56,506 | $65,445 | $66,858 | $70,980 | $79,042 | ||||||||||||||||||
| Service Class | Six months 6/30/19 | Year ended | ||||||||||||||||||||||
| 12/31/18 | 12/31/17 | 12/31/16 | 12/31/15 | 12/31/14 | ||||||||||||||||||||
| (unaudited) | ||||||||||||||||||||||||
Net asset value, beginning of period | $10.66 | $11.49 | $11.22 | $11.03 | $11.63 | $11.45 | ||||||||||||||||||
| Income (loss) from investment operations | ||||||||||||||||||||||||
Net investment income (loss) (d) | $0.18 | $0.35 | $0.36 | $0.37 | (c) | $0.39 | $0.39 | |||||||||||||||||
Net realized and unrealized gain (loss) | 0.89 | (0.72 | ) | 0.32 | 0.30 | (0.46 | ) | 0.25 | ||||||||||||||||
Total from investment operations | $1.07 | $(0.37 | ) | $0.68 | $0.67 | $(0.07 | ) | $0.64 | ||||||||||||||||
| Less distributions declared to shareholders | ||||||||||||||||||||||||
From net investment income | $— | $(0.41 | ) | $(0.41 | ) | $(0.46 | ) | $(0.45 | ) | $(0.43 | ) | |||||||||||||
From net realized gain | — | (0.05 | ) | — | (0.02 | ) | (0.08 | ) | (0.03 | ) | ||||||||||||||
Total distributions declared to shareholders | $— | $(0.46 | ) | $(0.41 | ) | $(0.48 | ) | $(0.53 | ) | $(0.46 | ) | |||||||||||||
Net asset value, end of period (x) | $11.73 | $10.66 | $11.49 | $11.22 | $11.03 | $11.63 | ||||||||||||||||||
Total return (%) (k)(r)(s)(x) | 10.04 | (n) | (3.31 | ) | 6.11 | 5.98 | (c) | (0.58 | ) | 5.59 | ||||||||||||||
| Ratios (%) (to average net assets) and Supplemental data: | ||||||||||||||||||||||||
Expenses before expense reductions (f) | 0.94 | (a) | 0.93 | 0.93 | 0.90 | (c) | 0.93 | 0.92 | ||||||||||||||||
Expenses after expense reductions (f) | 0.88 | (a) | 0.88 | 0.88 | 0.85 | (c) | 0.88 | 0.90 | ||||||||||||||||
Net investment income (loss) | 3.27 | (a) | 3.18 | 3.12 | 3.27 | (c) | 3.39 | 3.34 | ||||||||||||||||
Portfolio turnover | 20 | (n) | 32 | 36 | 31 | 26 | 36 | |||||||||||||||||
Net assets at end of period (000 omitted) | $165,822 | $154,370 | $194,337 | $188,440 | $189,946 | $211,332 | ||||||||||||||||||
See Notes to Financial Statements
13
Table of Contents
MFS Corporate Bond Portfolio
Financial Highlights – continued
| (a) | Annualized. |
| (c) | Amount reflects aone-time reimbursement of expenses by the custodian (or former custodian) without which net investment income and performance would be lower and expenses would be higher. |
| (d) | Per share data is based on average shares outstanding. |
| (f) | Ratios do not reflect reductions from fees paid indirectly, if applicable. |
| (k) | The total return does not reflect expenses that apply to separate accounts. Inclusion of these charges would reduce the total return figures for all periods shown. |
| (n) | Not annualized. |
| (r) | Certain expenses have been reduced without which performance would have been lower. |
| (s) | From time to time the fund may receive proceeds from litigation settlements, without which performance would be lower. |
| (x) | The net asset values and total returns have been calculated on net assets which include adjustments made in accordance with U.S. generally accepted accounting principles required at period end for financial reporting purposes. |
See Notes to Financial Statements
14
Table of Contents
MFS Corporate Bond Portfolio
NOTES TO FINANCIAL STATEMENTS (unaudited)
| (1) | Business and Organization |
MFS Corporate Bond Portfolio (the fund) is a diversified series of MFS Variable Insurance Trust II (the trust). The trust is organized as a Massachusetts business trust and is registered under the Investment Company Act of 1940, as amended, as anopen-end management investment company. The shareholders of each series of the trust are separate accounts of insurance companies, which offer variable annuity and/or life insurance products, and qualified retirement and pension plans.
The fund is an investment company and accordingly follows the investment company accounting and reporting guidance of the Financial Accounting Standards Board (FASB) Accounting Standards Codification Topic 946 Financial Services – Investment Companies.
| (2) | Significant Accounting Policies |
General– The preparation of financial statements in conformity with U.S. generally accepted accounting principles requires management to make estimates and assumptions that affect the reported amounts of assets and liabilities, and disclosure of contingent assets and liabilities at the date of the financial statements and the reported amounts of increases and decreases in net assets from operations during the reporting period. Actual results could differ from those estimates. In the preparation of these financial statements, management has evaluated subsequent events occurring after the date of the fund’s Statement of Assets and Liabilities through the date that the financial statements were issued. The fund invests in foreign securities. Investments in foreign securities are vulnerable to the effects of changes in the relative values of the local currency and the U.S. dollar and to the effects of changes in each country’s market, economic, industrial, political, regulatory, geopolitical, and other conditions.
In March 2017, the FASB issued Accounting Standards Update2017-08, Receivables – Nonrefundable Fees and Other Costs (Subtopic310-20) – Premium Amortization on Purchased Callable Debt Securities (“ASU2017-08”). For callable debt securities purchased at a premium that have explicit,non-contingent call features and that are callable at fixed prices on preset dates, ASU2017-08 requires the premium to be amortized to the earliest call date. The fund adopted ASU2017-08 as of the beginning of the reporting period on a modified retrospective basis. The adoption resulted in a change in accounting principle, since the fund had historically amortized such premiums to maturity for U.S. GAAP. As a result of the adoption, the fund recognized a cumulative effect adjustment that decreased the beginning of period cost of investments and increased the unrealized appreciation on investments by offsetting amounts. Adoption had no impact on the fund’s net assets or any prior period information presented in the financial statements. With respect to the fund’s results of operations, amortization of premium to first call date under ASU2017-08 accelerates amortization with the intent of more closely aligning the recognition of income on such bonds with the economics of the instrument.
Balance Sheet Offsetting– The fund’s accounting policy with respect to balance sheet offsetting is that, absent an event of default by the counterparty or a termination of the agreement, the International Swaps and Derivatives Association (ISDA) Master Agreement, or similar agreement, does not result in an offset of reported amounts of financial assets and financial liabilities in the Statement of Assets and Liabilities across transactions between the fund and the applicable counterparty. The fund’s right to setoff may be restricted or prohibited by the bankruptcy or insolvency laws of the particular jurisdiction to which a specific master netting agreement counterparty is subject. Balance sheet offsetting disclosures, to the extent applicable to the fund, have been included in the fund’s Significant Accounting Policies note under the captions for each of the fund’sin-scope financial instruments and transactions.
Investment Valuations– Debt instruments and floating rate loans, including restricted debt instruments, are generally valued at an evaluated or composite bid as provided by a third-party pricing service. Short-term instruments with a maturity at issuance of 60 days or less may be valued at amortized cost, which approximates market value. Futures contracts are generally valued at last posted settlement price on their primary exchange as provided by a third-party pricing service. Futures contracts for which there were no trades that day for a particular position are generally valued at the closing bid quotation on their primary exchange as provided by a third-party pricing service.Open-end investment companies are generally valued at net asset value per share. Securities and other assets generally valued on the basis of information from a third-party pricing service may also be valued at a broker/dealer bid quotation. In determining values, third-party pricing services can utilize both transaction data and market information such as yield, quality, coupon rate, maturity, type of issue, trading characteristics, and other market data. The values of foreign securities and other assets and liabilities expressed in foreign currencies are converted to U.S. dollars using the mean of bid and asked prices for rates provided by a third-party pricing service.
The Board of Trustees has delegated primary responsibility for determining or causing to be determined the value of the fund’s investments (including any fair valuation) to the adviser pursuant to valuation policies and procedures approved by the Board. If the adviser determines that reliable market quotations are not readily available, investments are valued at fair value as determined in good faith by the adviser in accordance with such procedures under the oversight of the Board of Trustees. Under the fund’s valuation policies and procedures, market quotations are not considered to be readily available for most types of debt instruments and floating rate loans and many types of derivatives. These investments are generally valued at fair value based on information from
15
Table of Contents
MFS Corporate Bond Portfolio
Notes to Financial Statements (unaudited) – continued
third-party pricing services. In addition, investments may be valued at fair value if the adviser determines that an investment’s value has been materially affected by events occurring after the close of the exchange or market on which the investment is principally traded (such as foreign exchange or market) and prior to the determination of the fund’s net asset value, or after the halt of trading of a specific security where trading does not resume prior to the close of the exchange or market on which the security is principally traded. The adviser generally relies on third-party pricing services or other information (such as the correlation with price movements of similar securities in the same or other markets; the type, cost and investment characteristics of the security; the business and financial condition of the issuer; and trading and other market data) to assist in determining whether to fair value and at what value to fair value an investment. The value of an investment for purposes of calculating the fund’s net asset value can differ depending on the source and method used to determine value. When fair valuation is used, the value of an investment used to determine the fund’s net asset value may differ from quoted or published prices for the same investment. There can be no assurance that the fund could obtain the fair value assigned to an investment if it were to sell the investment at the same time at which the fund determines its net asset value per share.
Various inputs are used in determining the value of the fund’s assets or liabilities. These inputs are categorized into three broad levels. In certain cases, the inputs used to measure fair value may fall into different levels of the fair value hierarchy. In such cases, an investment’s level within the fair value hierarchy is based on the lowest level of input that is significant to the fair value measurement. The fund’s assessment of the significance of a particular input to the fair value measurement in its entirety requires judgment, and considers factors specific to the investment. Level 1 includes unadjusted quoted prices in active markets for identical assets or liabilities. Level 2 includes other significant observable market-based inputs (including quoted prices for similar securities, interest rates, prepayment speed, and credit risk). Level 3 includes unobservable inputs, which may include the adviser’s own assumptions in determining the fair value of investments. Other financial instruments are derivative instruments, such as futures contracts. The following is a summary of the levels used as of June 30, 2019 in valuing the fund’s assets or liabilities:
| Financial Instruments | Level 1 | Level 2 | Level 3 | Total | ||||||||||||
| U.S. Treasury Bonds & U.S. Government | ||||||||||||||||
| Agency & Equivalents | $— | $12,376,274 | $— | $12,376,274 | ||||||||||||
| Non-U.S. Sovereign Debt | — | 1,505,910 | — | 1,505,910 | ||||||||||||
| U.S. Corporate Bonds | — | 177,787,918 | — | 177,787,918 | ||||||||||||
| Residential Mortgage-Backed Securities | — | 73,064 | — | 73,064 | ||||||||||||
| Commercial Mortgage-Backed Securities | — | 222,029 | — | 222,029 | ||||||||||||
| Asset-Backed Securities (including CDOs) | — | 124,477 | — | 124,477 | ||||||||||||
| Foreign Bonds | — | 28,906,723 | — | 28,906,723 | ||||||||||||
| Mutual Funds | 1,259,251 | — | — | 1,259,251 | ||||||||||||
| Total | $1,259,251 | $220,996,395 | $— | $222,255,646 | ||||||||||||
| Futures Contracts – Assets | $268,823 | $— | $— | $268,823 | ||||||||||||
| Futures Contracts – Liabilities | (389,690 | ) | — | — | (389,690 | ) | ||||||||||
For further information regarding security characteristics, see the Portfolio of Investments.
Derivatives– The fund uses derivatives primarily to increase or decrease exposure to a particular market or segment of the market, or security, to increase or decrease interest rate or currency exposure, or as alternatives to direct investments. Derivatives are used for hedging ornon-hedging purposes. While hedging can reduce or eliminate losses, it can also reduce or eliminate gains. When the fund uses derivatives as an investment to increase market exposure, or for hedging purposes, gains and losses from derivative instruments may be substantially greater than the derivative’s original cost.
The derivative instruments used by the fund during the period were futures contracts. Depending on the type of derivative, the fund may exit a derivative position by entering into an offsetting transaction with a counterparty or exchange, negotiating an agreement with the derivative counterparty, or novating the position to a third party. The fund may be unable to promptly close out a futures position in instances where the daily fluctuation in the price for that type of future exceeds the daily limit set by the exchange. The fund’s period end derivatives, as presented in the Portfolio of Investments and the associated Derivative Contract tables, generally are indicative of the volume of its derivative activity during the period.
The following table presents, by major type of derivative contract, the fair value, on a gross basis, of the asset and liability components of derivatives held by the fund at June 30, 2019 as reported in the Statement of Assets and Liabilities:
| Fair Value (a) | ||||||||||
| Risk | Derivative Contracts | Asset Derivatives | Liability Derivatives | |||||||
| Interest Rate | Interest Rate Futures | $268,823 | $(389,690 | ) | ||||||
| (a) | Values presented in this table for futures contracts correspond to the values reported in the fund’s Portfolio of Investments. Only the current day net variation margin for futures contracts is separately reported within the fund’s Statement of Assets and Liabilities. |
16
Table of Contents
MFS Corporate Bond Portfolio
Notes to Financial Statements (unaudited) – continued
There is no realized gain (loss) from derivative transactions during the period.
The following table presents, by major type of derivative contract, the change in unrealized appreciation or depreciation on derivatives held by the fund for the six months ended June 30, 2019 as reported in the Statement of Operations:
| Risk | Futures Contracts | |||
| Interest Rate | $(120,867 | ) | ||
Derivative counterparty credit risk is managed through formal evaluation of the creditworthiness of all potential counterparties. On certain, but not all, uncleared derivatives, the fund attempts to reduce its exposure to counterparty credit risk whenever possible by entering into an ISDA Master Agreement on a bilateral basis. The ISDA Master Agreement gives each party to the agreement the right to terminate all transactions traded under such agreement if there is a specified deterioration in the credit quality of the other party. Upon an event of default or a termination of the ISDA Master Agreement, thenon-defaulting party has the right to close out all transactions traded under such agreement and to net amounts owed under each agreement to one net amount payable by one party to the other. This right to close out and net payments across all transactions traded under the ISDA Master Agreement could result in a reduction of the fund’s credit risk to such counterparty equal to any amounts payable by the fund under the applicable transactions, if any.
Collateral and margin requirements differ by type of derivative. For cleared derivatives (e.g., futures contracts, cleared swaps, and exchange-traded options), margin requirements are set by the clearing broker and the clearing house and collateral, in the form of cash or securities, is posted by the fund directly with the clearing broker. Collateral terms are counterparty agreement specific for uncleared derivatives (e.g., forward foreign currency exchange contracts, uncleared swap agreements, and uncleared options) and collateral, in the form of cash and securities, is held in segregated accounts with the fund’s custodian in connection with these agreements. For derivatives traded under an ISDA Master Agreement, which contains a collateral support annex, the collateral requirements are netted across all transactions traded under such counterparty-specific agreement and an amount is posted from one party to the other to collateralize such obligations. Cash that has been segregated or delivered to cover the fund’s collateral or margin obligations under derivative contracts, if any, will be reported separately in the Statement of Assets and Liabilities as restricted cash for uncleared derivatives and/or deposits with brokers for cleared derivatives. Securities pledged as collateral or margin for the same purpose, if any, are noted in the Portfolio of Investments. The fund may be required to make payments of interest on uncovered collateral or margin obligations with the broker. Any such payments are included in “Miscellaneous” expense in the Statement of Operations.
Futures Contracts– The fund entered into futures contracts which may be used to hedge against or obtain broad market exposure, interest rate exposure, currency exposure, or to manage duration. A futures contract represents a commitment for the future purchase or sale of an asset at a specified price on a specified date.
Upon entering into a futures contract, the fund is required to deposit with the broker, either in cash or securities, an initial margin in an amount equal to a specified percentage of the notional amount of the contract. Subsequent payments (variation margin) are made or received by the fund each day, depending on the daily fluctuations in the value of the contract, and are recorded for financial statement purposes as unrealized gain or loss by the fund until the contract is closed or expires at which point the gain or loss on futures contracts is realized.
The fund bears the risk of interest rates, exchange rates or securities prices moving unexpectedly, in which case, the fund may not achieve the anticipated benefits of the futures contracts and may realize a loss. While futures contracts may present less counterparty risk to the fund since the contracts are exchange traded and the exchange’s clearinghouse guarantees payments to the broker, there is still counterparty credit risk due to the insolvency of the broker. The fund’s maximum risk of loss due to counterparty credit risk is equal to the margin posted by the fund to the broker plus any gains or minus any losses on the outstanding futures contracts.
Indemnifications– Under the fund’s organizational documents, its officers and Trustees may be indemnified against certain liabilities and expenses arising out of the performance of their duties to the fund. Additionally, in the normal course of business, the fund enters into agreements with service providers that may contain indemnification clauses. The fund’s maximum exposure under these agreements is unknown as this would involve future claims that may be made against the fund that have not yet occurred.
Investment Transactions and Income– Investment transactions are recorded on the trade date. Interest income is recorded on the accrual basis. All premium and discount is amortized or accreted for financial statement purposes in accordance with U.S. generally accepted accounting principles. Interest payments received in additional securities are recorded on theex-interest date in an amount equal to the value of the security on such date.
The fund may receive proceeds from litigation settlements. Any proceeds received from litigation involving portfolio holdings are reflected in the Statement of Operations in realized gain/loss if the security has been disposed of by the fund or in unrealized gain/loss if the security is still held by the fund. Any other proceeds from litigation not related to portfolio holdings are reflected as other income in the Statement of Operations.
17
Table of Contents
MFS Corporate Bond Portfolio
Notes to Financial Statements (unaudited) – continued
Tax Matters and Distributions– The fund intends to qualify as a regulated investment company, as defined under Subchapter M of the Internal Revenue Code, and to distribute all of its taxable income, including realized capital gains. As a result, no provision for federal income tax is required. The fund’s federal tax returns, when filed, will remain subject to examination by the Internal Revenue Service for a three year period. Management has analyzed the fund’s tax positions taken on federal and state tax returns for all open tax years and does not believe that there are any uncertain tax positions that require recognition of a tax liability. Foreign taxes, if any, have been accrued by the fund in the accompanying financial statements in accordance with the applicable foreign tax law. Foreign income taxes may be withheld by certain countries in which the fund invests. Additionally, capital gains realized by the fund on securities issued in or by certain foreign countries may be subject to capital gains tax imposed by those countries.
Distributions to shareholders are recorded on theex-dividend date. Income and capital gain distributions are determined in accordance with income tax regulations, which may differ from U.S. generally accepted accounting principles. Certain capital accounts in the financial statements are periodically adjusted for permanent differences in order to reflect their tax character. These adjustments have no impact on net assets or net asset value per share. Temporary differences which arise from recognizing certain items of income, expense, gain or loss in different periods for financial statement and tax purposes will reverse at some time in the future. Distributions in excess of net investment income or net realized gains are temporary overdistributions for financial statement purposes resulting from differences in the recognition or classification of income or distributions for financial statement and tax purposes.
Book/tax differences primarily relate to amortization and accretion of debt securities.
The tax character of distributions declared to shareholders for the last fiscal year is as follows:
| Year ended 12/31/18 | ||||
| Ordinary income (including any short-term capital gains) | $9,320,203 | |||
| Long-term capital gains | 319,216 | |||
| Total distributions | $9,639,419 | |||
The federal tax cost and the tax basis components of distributable earnings were as follows:
| As of 6/30/19 | ||||
| Cost of investments | $211,942,297 | |||
| Gross appreciation | 11,110,255 | |||
| Gross depreciation | (796,906 | ) | ||
| Net unrealized appreciation (depreciation) | $10,313,349 | |||
| As of 12/31/18 | ||||
| Undistributed ordinary income | 8,023,326 | |||
| Capital loss carryforwards | (1,030,459 | ) | ||
| Net unrealized appreciation (depreciation) | (6,947,413 | ) | ||
The aggregate cost above includes prior fiscal year end tax adjustments, if applicable.
As of December 31, 2018, the fund had capital loss carryforwards available to offset future realized gains. These net capital losses may be carried forward indefinitely and their character is retained as short-term and/or long-term losses. Such losses are characterized as follows:
| Short-Term | $(934,200 | ) | ||
| Long-Term | (96,259 | ) | ||
| Total | $(1,030,459 | ) |
Multiple Classes of Shares of Beneficial Interest– The fund offers multiple classes of shares, which differ in their respective distribution and/or service fees. The fund’s income, realized and unrealized gain (loss), and common expenses are allocated to shareholders based on the daily net assets of each class. Dividends are declared separately for each class. Differences in per share dividend rates are generally due to differences in separate class expenses. The fund’s distributions declared to shareholders as reported in the Statements of Changes in Net Assets are presented by class as follows:
| From net investment income | From net realized gain | |||||||||||||||
| Six months ended 6/30/19 | Year ended 12/31/18 | Six months ended 6/30/19 | Year ended 12/31/18 | |||||||||||||
| Initial Class | $— | $2,333,444 | $— | $245,139 | ||||||||||||
| Service Class | — | 6,343,746 | — | 717,090 | ||||||||||||
| Total | $— | $8,677,190 | $— | $962,229 | ||||||||||||
18
Table of Contents
MFS Corporate Bond Portfolio
Notes to Financial Statements (unaudited) – continued
| (3) | Transactions with Affiliates |
Investment Adviser– The fund has an investment advisory agreement with MFS to provide overall investment management and related administrative services and facilities to the fund. The management fee is computed daily and paid monthly at the following annual rates based on the fund’s average daily net assets:
| Up to $1 billion | 0.60% | |||
| In excess of $1 billion | 0.50% |
MFS has agreed in writing to reduce its management fee by a specified amount if certain MFS mutual fund assets exceed thresholds agreed to by MFS and the fund’s Board of Trustees. For the six months ended June 30, 2019, this management fee reduction amounted to $10,453, which is included in the reduction of total expenses in the Statement of Operations. The management fee incurred for the six months ended June 30, 2019 was equivalent to an annual effective rate of 0.59% of the fund’s average daily net assets.
The investment adviser has agreed in writing to pay a portion of the fund’s total annual operating expenses, excluding interest, taxes, extraordinary expenses, brokerage and transaction costs, and investment-related expenses, such that total annual operating expenses do not exceed 0.63% of average daily net assets for the Initial Class shares and 0.88% of average daily net assets for the Service Class shares. This written agreement will continue until modified by the fund’s Board of Trustees, but such agreement will continue at least until April 30, 2021. For the six months ended June 30, 2019, this reduction amounted to $55,378, which is included in the reduction of total expenses in the Statement of Operations.
Distributor– MFS Fund Distributors, Inc. (MFD), a wholly-owned subsidiary of MFS, is the distributor of shares of the fund. The Trustees have adopted a distribution plan for the Service Class shares pursuant to Rule12b-1 under the Investment Company Act of 1940.
The fund’s distribution plan provides that the fund will pay MFD distribution and/or service fees equal to 0.25% per annum of its average daily net assets attributable to Service Class shares as partial consideration for services performed and expenses incurred by MFD and financial intermediaries (including participating insurance companies that invest in the fund to fund variable annuity and variable life insurance contracts, sponsors of qualified retirement and pension plans that invest in the fund, and affiliates of these participating insurance companies and plan sponsors) in connection with the sale and distribution of the Service Class shares. MFD may subsequently pay all, or a portion, of the distribution and/or service fees to financial intermediaries.
Shareholder Servicing Agent– MFS Service Center, Inc. (MFSC), a wholly-owned subsidiary of MFS, receives a fee from the fund for its services as shareholder servicing agent. For the six months ended June 30, 2019, the fee was $2,634, which equated to 0.0024% annually of the fund’s average daily net assets. MFSC also receives payment from the fund forout-of-pocket expenses paid by MFSC on behalf of the fund. For the six months ended June 30, 2019, these costs amounted to $114.
Administrator– MFS provides certain financial, legal, shareholder communications, compliance, and other administrative services to the fund. Under an administrative services agreement, the fund reimburses MFS the costs incurred to provide these services. The fund is charged an annual fixed amount of $17,500 plus a fee based on average daily net assets. The administrative services fee incurred for the six months ended June 30, 2019 was equivalent to an annual effective rate of 0.0188% of the fund’s average daily net assets.
Trustees’ and Officers’ Compensation– The fund pays compensation to independent Trustees in the form of a retainer, attendance fees, and additional compensation to Board and Committee chairpersons. The fund does not pay compensation directly to Trustees or officers of the fund who are also officers of the investment adviser, all of whom receive remuneration from MFS for their services to the fund. Certain officers and Trustees of the fund are officers or directors of MFS, MFD, and MFSC.
Other– This fund and certain other funds managed by MFS (the funds) had entered into a service agreement (the ISO Agreement) which provided for payment of fees solely by the funds to Tarantino LLC in return for the provision of services of an Independent Senior Officer (ISO) for the funds. Frank L. Tarantino served as the ISO and was an officer of the funds and the sole member of Tarantino LLC. Effective June 30, 2019, Mr. Tarantino retired from his position as ISO for the funds, and the ISO Agreement was terminated. For the six months ended June 30, 2019, the fee paid by the fund under this agreement was $260 and is included in “Miscellaneous” expense in the Statement of Operations. MFS had agreed to bear all expenses associated with office space, other administrative support, and supplies provided to the ISO.
The fund invests in the MFS Institutional Money Market Portfolio which is managed by MFS and seeks current income consistent with preservation of capital and liquidity. This money market fund does not pay a management fee to MFS.
19
Table of Contents
MFS Corporate Bond Portfolio
Notes to Financial Statements (unaudited) – continued
| (4) | Portfolio Securities |
For the six months ended June 30, 2019, purchases and sales of investments, other than short-term obligations, were as follows:
| Purchases | Sales | |||||||
| U.S. Government securities | $5,510,056 | $9,804,850 | ||||||
| Non-U.S. Government securities | $37,147,712 | $36,345,610 | ||||||
| (5) | Shares of Beneficial Interest |
The fund’s Declaration of Trust permits the Trustees to issue an unlimited number of full and fractional shares of beneficial interest. Transactions in fund shares were as follows:
| Six months ended 6/30/19 | Year ended 12/31/18 | |||||||||||||||
| Shares | Amount | Shares | Amount | |||||||||||||
| Shares sold | ||||||||||||||||
Initial Class | 100,820 | $1,149,265 | 126,159 | $1,417,456 | ||||||||||||
Service Class | 950,424 | 10,545,486 | 1,113,987 | 12,293,052 | ||||||||||||
| 1,051,244 | $11,694,751 | 1,240,146 | $13,710,508 | |||||||||||||
| Shares issued to shareholders in reinvestment of distributions | ||||||||||||||||
Initial Class | — | $— | 236,784 | $2,578,583 | ||||||||||||
Service Class | — | — | 656,822 | 7,060,836 | ||||||||||||
| — | $— | 893,606 | $9,639,419 | |||||||||||||
| Shares reacquired | ||||||||||||||||
Initial Class | (397,360 | ) | $(4,483,285 | ) | (756,941 | ) | $(8,379,096 | ) | ||||||||
Service Class | (1,286,312 | ) | (14,401,811 | ) | (4,210,235 | ) | (45,919,796 | ) | ||||||||
| (1,683,672 | ) | $(18,885,096 | ) | (4,967,176 | ) | $(54,298,892 | ) | |||||||||
| Net change | ||||||||||||||||
Initial Class | (296,540 | ) | $(3,334,020 | ) | (393,998 | ) | $(4,383,057 | ) | ||||||||
Service Class | (335,888 | ) | (3,856,325 | ) | (2,439,426 | ) | (26,565,908 | ) | ||||||||
| (632,428 | ) | $(7,190,345 | ) | (2,833,424 | ) | $(30,948,965 | ) | |||||||||
| (6) | Line of Credit |
The fund and certain other funds managed by MFS participate in a $1.25 billion unsecured committed line of credit, subject to a $1 billion sublimit, provided by a syndicate of banks under a credit agreement. Borrowings may be made for temporary financing needs. Interest is charged to each fund, based on its borrowings, generally at a rate equal to the highest of one month LIBOR, the Federal Funds Effective Rate and the Overnight Bank Funding Rate, plus an agreed upon spread. A commitment fee, based on the average daily, unused portion of the committed line of credit, is allocated among the participating funds. In addition, the fund and other funds managed by MFS have established unsecured uncommitted borrowing arrangements with certain banks for temporary financing needs. Interest is charged to each fund, based on its borrowings, at rates equal to customary reference rates plus an agreed upon spread. For the six months ended June 30, 2019, the fund’s commitment fee and interest expense were $696 and $0, respectively, and are included in “Miscellaneous” expense in the Statement of Operations.
| (7) | Investments in Affiliated Issuers |
An affiliated issuer may be considered one in which the fund owns 5% or more of the outstanding voting securities, or a company which is under common control. For the purposes of this report, the following were affiliated issuers:
| Affiliated Issuers | Beginning Value | Purchases | Sales Proceeds | Realized Gain (Loss) | Change in Unrealized Appreciation or Depreciation | Ending Value | ||||||||||||||||||
| MFS Institutional Money Market Portfolio | $3,006,790 | $37,162,921 | $38,910,687 | $66 | $161 | $1,259,251 | ||||||||||||||||||
| Affiliated Issuers | Dividend Income | Capital Gain Distributions | ||||||||||||||||||||||
| MFS Institutional Money Market Portfolio | $51,596 | $— | ||||||||||||||||||||||
20
Table of Contents
MFS Corporate Bond Portfolio
PROXY VOTING POLICIES AND INFORMATION
MFS votes proxies on behalf of the fund pursuant to proxy voting policies and procedures that are available without charge, upon request, by calling 1-800-225-2606, by visitingmfs.com/proxyvoting, or by visiting the SEC’s Web site athttp://www.sec.gov.
Information regarding how the fund voted proxies relating to portfolio securities during the most recent twelve-month period ended June 30 is available by August 31 of each year without charge by visitingmfs.com/proxyvoting, or by visiting the SEC’s Web site athttp://www.sec.gov.
QUARTERLY PORTFOLIO DISCLOSURE
The fund files a complete schedule of portfolio holdings with the SEC for the first and third quarters of each fiscal year on Form N-Q or as an exhibit to its reports on Form N-PORT (for first and third fiscal quarters ending March 31, 2019 or after). The fund’sForm N-Q or Form N-PORT reports are available on the SEC’s website athttp://www.sec.gov.A shareholder can obtain the portfolio holdings report for the first and third quarters of the fund’s fiscal year atmfs.com/vit2 by choosing the fund’s name and then selecting the “Resources” tab and clicking on “Prospectus and Reports”.
From time to time, MFS may post important information about the fund or the MFS funds on the MFS web site (mfs.com). This information is available athttps://www.mfs.com/en-us/what-we-do/announcements.htmlor atmfs.com/vit2 by choosing the fund’s name.
INFORMATION ABOUT FUND CONTRACTS AND LEGAL CLAIMS
The fund has entered into contractual arrangements with an investment adviser, administrator, distributor, shareholder servicing agent, 529 program manager (if applicable), and custodian who each provide services to the fund. Unless expressly stated otherwise, shareholders are not parties to, or intended beneficiaries of these contractual arrangements, and these contractual arrangements are not intended to create any shareholder right to enforce them against the service providers or to seek any remedy under them against the service providers, either directly or on behalf of the fund.
Under the Trust’s By-Laws and Declaration of Trust, any claims asserted against or on behalf of the MFS Funds, including claims against Trustees and Officers, must be brought in state and federal courts located within the Commonwealth of Massachusetts.
21
Table of Contents
Table of Contents
Semiannual Report
June 30, 2019

MFS® Core Equity Portfolio

MFS® Variable Insurance Trust II
Beginning on January 1, 2021, as permitted by regulations adopted by the U.S. Securities and Exchange Commission, the insurance company that offers your contract may determine that it will no longer send you paper copies of the fund’s annual and semiannual shareholder reports unless you specifically request paper copies from the insurance company or from your financial intermediary. Instead, the shareholder reports will be made available on a Web site (insurancefunds.mfs.com or other Web site of which you will be notified), and the insurance company will notify you by mail each time a report is posted and provide you with a Web site link to access the report. Instructions for requesting paper copies will be provided by your insurance company or financial intermediary.
If you already elected to receive shareholder reports by email, you will not be affected by this change and you need not take any action. If your insurance company or financial intermediary offers electronic delivery, you may elect to receive shareholder reports and other communications from the insurance company or financial intermediary by email by following the instructions provided by the insurance company or financial intermediary.
Beginning on January 1, 2019, you may elect to receive all future reports in paper free of charge from the insurance company or financial intermediary. You can inform the insurance company or financial intermediary that you wish to continue receiving paper copies of your shareholder reports by contacting your insurance company or financial intermediary. Your election to receive reports in paper will apply to all funds held in your account with your insurance company or financial intermediary.
RGS-SEM
Table of Contents
MFS® Core Equity Portfolio
The report is prepared for the general information of contract owners. It is authorized for distribution to prospective investors only when preceded or accompanied by a current prospectus.
NOT FDIC INSURED• MAY LOSE VALUE• NO BANK OR CREDIT UNION GUARANTEE• NOT A DEPOSIT• NOT INSURED BY ANY FEDERAL GOVERNMENT AGENCY OR NCUA/NCUSIF
Table of Contents
MFS Core Equity Portfolio
LETTER FROM THE EXECUTIVE CHAIRMAN

Dear Contract Owners:
Slowing global growth, low inflation, and increasing trade friction between the United States and China have been hallmarks of the past 12 months. After experiencing an uptick in market volatility in late 2018, markets steadied during the first half of 2019, thanks in large measure to the adoption of a dovish policy stance on the part of global central banks, who have largely abandoned efforts to normalize interest rates and have instead focused on supporting economic growth. Trade tensions remain high as the U.S. has ratcheted up tariffs on Chinese imports and China has retaliated. A truce of sorts was reached midyear, but significant challenges continue to confront negotiators, and it is not known whether a comprehensive agreement can be reached.
With Boris Johnson replacing Theresa May as Britain’s prime minister, uncertainty over Brexit remains high. Johnson has adopted a more combative stance than his predecessor toward the European Union, increasing concerns that there will be a “hard” Brexit.
Markets expect that the longest economic expansion in U.S. history will continue for the time being, albeit at a slower pace. Nevertheless, slower growth and low inflation have spurred the U.S. Federal Reserve to take a more accommodative policy stance, prompting investors to anticipate several interest rate cuts in the coming year. The European Central Bank has adopted a similar position. The more accommodative environment has helped fuel a continued rise in global equities and has been broadly supportive of risk assets.
Since launching the first U.S.open-end mutual fund in 1924, MFS® has been committed to a single purpose: to create value by allocating capital responsibly for clients. Through our powerful global investment platform, we combine collective expertise, thoughtful risk management, and long-term discipline to uncover what we believe are the best investment opportunities in the market.
Respectfully,

Robert J. Manning
Executive Chairman
MFS Investment Management
August 16, 2019
The opinions expressed in this letter are subject to change and may not be relied upon for investment advice. No forecasts can be guaranteed.
1
Table of Contents
MFS Core Equity Portfolio
Portfolio structure
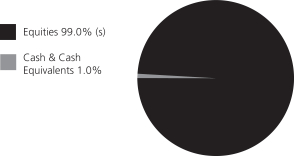
| Top ten holdings | ||||
| Apple, Inc. | 4.1% | |||
| Amazon.com, Inc. | 3.3% | |||
| Microsoft Corp. | 2.9% | |||
| Alphabet, Inc., “A” | 2.6% | |||
| American Tower Corp., REIT | 2.0% | |||
| Aon PLC | 2.0% | |||
| Mastercard, Inc., “A” | 2.0% | |||
| Facebook, Inc., “A” | 1.9% | |||
| Chevron Corp. | 1.8% | |||
| Pfizer, Inc. | 1.8% |
| Global equity sectors (k) | ||||
| Technology | 25.0% | |||
| Financial Services | 17.5% | |||
| Health Care (s) | 14.0% | |||
| Capital Goods | 13.3% | |||
| Consumer Cyclicals | 12.6% | |||
| Energy | 7.9% | |||
| Consumer Staples | 5.3% | |||
| Telecommunications and Cable Television (s) | 3.4% |
| (k) | The sectors set forth above and the associated portfolio composition are based on MFS’ own custom sector classification methodology. |
| (s) | Includes securities sold short. |
Cash & Cash Equivalents includes any cash, investments in money market funds, short-term securities, and other assets less liabilities. Please see the Statement of Assets and Liabilities for additional information related to the fund’s cash position and other assets and liabilities.
Percentages are based on net assets as of June 30, 2019.
The portfolio is actively managed and current holdings may be different.
2
Table of Contents
MFS Core Equity Portfolio
Fund Expenses Borne by the Contract Holders during the Period,
January 1, 2019 through June 30, 2019
As a contract holder of the fund, you incur ongoing costs, including management fees; distribution and/or service(12b-1) fees; and other fund expenses. This example is intended to help you understand your ongoing costs (in dollars) of investing in the fund and to compare these costs with the ongoing costs of investing in other mutual funds.
The example is based on an investment of $1,000 invested at the beginning of the period and held for the entire period January 1, 2019 through June 30, 2019.
Actual Expenses
The first line for each share class in the following table provides information about actual account values and actual expenses. You may use the information in this line, together with the amount you invested, to estimate the expenses that you paid over the period. Simply divide your account value by $1,000 (for example, an $8,600 account value divided by $1,000 = 8.6), then multiply the result by the number in the first line under the heading entitled “Expenses Paid During Period” to estimate the expenses you paid on your account during this period.
Hypothetical Example for Comparison Purposes
The second line for each share class in the following table provides information about hypothetical account values and hypothetical expenses based on the fund’s actual expense ratio and an assumed rate of return of 5% per year before expenses, which is not the fund’s actual return. The hypothetical account values and expenses may not be used to estimate the actual ending account balance or expenses you paid for the period. You may use this information to compare the ongoing costs of investing in the fund and other funds. To do so, compare this 5% hypothetical example with the 5% hypothetical examples that appear in the shareholder reports of the other funds.
Please note that the expenses shown in the table are meant to highlight the fund’s ongoing costs only and do not take into account the fees and expenses imposed under the variable contracts through which your investment in the fund is made. Therefore, the second line for each share class in the table is useful in comparing ongoing costs associated with an investment in vehicles (such as the fund) which fund benefits under variable annuity and variable life insurance contracts and to qualified pension and retirement plans only, and will not help you determine the relative total costs of investing in the fund through variable annuity and variable life insurance contracts. If the fees and expenses imposed under the variable contracts were included, your costs would have been higher.
| Share Class | Annualized Expense Ratio | Beginning Account Value 1/01/19 | Ending Account Value 6/30/19 | Expenses Paid During Period (p) 1/01/19-6/30/19 | ||||||||||||||
| Initial Class | Actual | 0.87% | $1,000.00 | $1,209.87 | $4.77 | |||||||||||||
| Hypothetical (h) | 0.87% | $1,000.00 | $1,020.48 | $4.36 | ||||||||||||||
| Service Class | Actual | 1.12% | $1,000.00 | $1,208.49 | $6.13 | |||||||||||||
| Hypothetical (h) | 1.12% | $1,000.00 | $1,019.24 | $5.61 | ||||||||||||||
| (h) | 5% class return per year before expenses. |
| (p) | “Expenses Paid During Period” are equal to each class’s annualized expense ratio, as shown above, multipliedby the average account value over the period, multiplied by 181/365 (to reflect theone-half year period). |
Notes to Expense Table
Expense ratios include 0.03% of investment related expenses from short sales (See Note 2 of the Notes to Financial Statements) that are outside of the expense limitation arrangement (See Note 3 of the Notes to Financial Statements).
3
Table of Contents
MFS Core Equity Portfolio
PORTFOLIO OF INVESTMENTS – 6/30/19 (unaudited)
The Portfolio of Investments is a complete list of all securities owned by your fund. It is categorized by broad-based asset classes.
| Issuer | Shares/Par | Value ($) | ||||||
| COMMON STOCKS – 99.4% | ||||||||
| Aerospace – 3.6% |
| |||||||
| Boeing Co. | 4,525 | $ | 1,647,145 | |||||
| CACI International, Inc., “A” (a) | 2,618 | 535,617 | ||||||
| Curtiss-Wright Corp. | 2,915 | 370,584 | ||||||
| FLIR Systems, Inc. | 2,998 | 162,192 | ||||||
| Honeywell International, Inc. | 11,090 | 1,936,203 | ||||||
| Northrop Grumman Corp. | 4,856 | 1,569,022 | ||||||
| United Technologies Corp. | 9,300 | 1,210,860 | ||||||
|
| |||||||
| $ | 7,431,623 | |||||||
|
| |||||||
| Alcoholic Beverages – 0.4% | ||||||||
| Constellation Brands, Inc., “A” | 4,276 | $ | 842,115 | |||||
|
| |||||||
| Apparel Manufacturers – 0.4% | ||||||||
| NIKE, Inc., “B” | 5,315 | $ | 446,194 | |||||
| Skechers USA, Inc., “A” (a) | 14,914 | 469,642 | ||||||
|
| |||||||
| $ | 915,836 | |||||||
|
| |||||||
| Automotive – 0.7% | ||||||||
| Copart, Inc. (a) | 6,311 | $ | 471,684 | |||||
| IAA, Inc. (a) | 5,160 | 200,105 | ||||||
| Lear Corp. | 3,496 | 486,888 | ||||||
| Stoneridge, Inc. (a) | 9,851 | 310,799 | ||||||
|
| |||||||
| $ | 1,469,476 | |||||||
|
| |||||||
| Biotechnology – 0.5% | ||||||||
| Biogen, Inc. (a) | 2,104 | $ | 492,063 | |||||
| Illumina, Inc. (a) | 1,629 | 599,716 | ||||||
|
| |||||||
| $ | 1,091,779 | |||||||
|
| |||||||
| Broadcasting – 0.6% | ||||||||
| Netflix, Inc. (a) | 3,255 | $ | 1,195,627 | |||||
|
| |||||||
| Brokerage & Asset Managers – 2.3% |
| |||||||
| Blackstone Group LP | 18,334 | $ | 814,396 | |||||
| CME Group, Inc. | 8,664 | 1,681,769 | ||||||
| HealthEquity, Inc. (a) | 6,495 | 424,773 | ||||||
| TD Ameritrade Holding Corp. | 37,423 | 1,868,156 | ||||||
|
| |||||||
| $ | 4,789,094 | |||||||
|
| |||||||
| Business Services – 4.6% | ||||||||
| Amdocs Ltd. | 8,211 | $ | 509,821 | |||||
| CarGurus, Inc. (a) | 20,287 | 732,564 | ||||||
| Cognizant Technology Solutions Corp., “A” | 15,496 | 982,291 | ||||||
| DXC Technology Co. | 11,706 | 645,586 | ||||||
| Endava PLC, ADR (a) | 3,936 | 158,385 | ||||||
| Equinix, Inc., REIT | 1,398 | 704,997 | ||||||
| Fidelity National Information Services, Inc. | 8,144 | 999,106 | ||||||
| First Data Corp. (a) | 20,048 | 542,699 | ||||||
| FleetCor Technologies, Inc. (a) | 4,849 | 1,361,842 | ||||||
| Global Payments, Inc. | 6,100 | 976,793 | ||||||
| Total System Services, Inc. | 6,382 | 818,619 | ||||||
| Verisk Analytics, Inc., “A” | 6,961 | 1,019,508 | ||||||
|
| |||||||
| $ | 9,452,211 | |||||||
|
| |||||||
| Issuer | Shares/Par | Value ($) | ||||||
| COMMON STOCKS – continued |
| |||||||
| Cable TV – 1.0% | ||||||||
| Altice USA, Inc. (a) | 49,841 | $ | 1,213,629 | |||||
| Comcast Corp., “A” | 21,044 | 889,740 | ||||||
|
| |||||||
| $ | 2,103,369 | |||||||
|
| |||||||
| Chemicals – 0.5% | ||||||||
| FMC Corp. | 6,909 | $ | 573,102 | |||||
| Ingevity Corp. (a) | 3,526 | 370,829 | ||||||
|
| |||||||
| $ | 943,931 | |||||||
|
| |||||||
| Computer Software – 6.3% | ||||||||
| Adobe Systems, Inc. (a) | 8,971 | $ | 2,643,306 | |||||
| Cadence Design Systems, Inc. (a) | 12,066 | 854,394 | ||||||
| DocuSign, Inc. (a) | 12,914 | 641,955 | ||||||
| Microsoft Corp. | 44,518 | 5,963,631 | ||||||
| Salesforce.com, Inc. (a) | 19,580 | 2,970,873 | ||||||
|
| |||||||
| $ | 13,074,159 | |||||||
|
| |||||||
| Computer Software – Systems – 5.2% |
| |||||||
| Apple, Inc. (s) | 42,614 | $ | 8,434,163 | |||||
| Pluralsight, Inc., “A” (a) | 22,236 | 674,195 | ||||||
| Rapid7, Inc. (a) | 11,146 | 644,685 | ||||||
| ServiceNow, Inc. (a) | 3,307 | 908,003 | ||||||
| Square, Inc., “A” (a) | 1,508 | 109,375 | ||||||
|
| |||||||
| $ | 10,770,421 | |||||||
|
| |||||||
| Construction – 1.5% | ||||||||
| Masco Corp. | 30,160 | $ | 1,183,478 | |||||
| Toll Brothers, Inc. | 26,475 | 969,515 | ||||||
| Vulcan Materials Co. | 7,343 | 1,008,267 | ||||||
|
| |||||||
| $ | 3,161,260 | |||||||
|
| |||||||
| Consumer Products – 1.4% | ||||||||
| Colgate-Palmolive Co. | 14,349 | $ | 1,028,393 | |||||
| Kimberly-Clark Corp. | 6,701 | 893,109 | ||||||
| Procter & Gamble Co. | 9,552 | 1,047,377 | ||||||
|
| |||||||
| $ | 2,968,879 | |||||||
|
| |||||||
| Consumer Services – 1.1% | ||||||||
| Booking Holdings, Inc. (a) | 540 | $ | 1,012,343 | |||||
| Bright Horizons Family Solutions, Inc. (a) | 4,370 | 659,302 | ||||||
| Grand Canyon Education, Inc. (a) | 4,584 | 536,420 | ||||||
|
| |||||||
| $ | 2,208,065 | |||||||
|
| |||||||
| Containers – 0.3% | ||||||||
| Berry Global Group, Inc. (a) | 5,783 | $ | 304,128 | |||||
| Sealed Air Corp. | 7,980 | 341,384 | ||||||
|
| |||||||
| $ | 645,512 | |||||||
|
| |||||||
| Electrical Equipment – 2.1% | ||||||||
| AMETEK, Inc. | 17,563 | $ | 1,595,423 | |||||
| Fortive Corp. | 9,979 | 813,488 | ||||||
| HD Supply Holdings, Inc. (a) | 15,924 | 641,419 | ||||||
| Sensata Technologies Holding PLC (a) | 14,073 | 689,577 | ||||||
| TE Connectivity Ltd. | 6,981 | 668,640 | ||||||
|
| |||||||
| $ | 4,408,547 | |||||||
|
| |||||||
4
Table of Contents
MFS Core Equity Portfolio
Portfolio of Investments (unaudited) – continued
| Issuer | Shares/Par | Value ($) | ||||||
| COMMON STOCKS – continued |
| |||||||
| Electronics – 3.0% |
| |||||||
| Analog Devices, Inc. | 16,617 | $ | 1,875,561 | |||||
| Applied Materials, Inc. | 4,866 | 218,532 | ||||||
| Marvell Technology Group Ltd. | 36,379 | 868,367 | ||||||
| Mellanox Technologies Ltd. (a) | 2,442 | 270,256 | ||||||
| Monolithic Power Systems, Inc. | 1,748 | 237,343 | ||||||
| nLIGHT, Inc. (a) | 8,181 | 157,075 | ||||||
| Silicon Laboratories, Inc. (a) | 2,679 | 277,009 | ||||||
| Texas Instruments, Inc. | 19,396 | 2,225,885 | ||||||
|
| |||||||
| $ | 6,130,028 | |||||||
|
| |||||||
| Energy – Independent – 1.9% |
| |||||||
| Diamondback Energy, Inc. | 6,660 | $ | 725,740 | |||||
| EOG Resources, Inc. | 12,684 | 1,181,642 | ||||||
| Hess Corp. | 5,583 | 354,911 | ||||||
| Marathon Petroleum Corp. | 18,005 | 1,006,120 | ||||||
| Pioneer Natural Resources Co. | 3,698 | 568,974 | ||||||
|
| |||||||
| $ | 3,837,387 | |||||||
|
| |||||||
| Energy – Integrated – 1.8% |
| |||||||
| Chevron Corp. | 29,938 | $ | 3,725,485 | |||||
|
| |||||||
| Engineering – Construction – 0.2% |
| |||||||
| KBR, Inc. | 17,980 | $ | 448,421 | |||||
|
| |||||||
| Entertainment – 0.1% |
| |||||||
| World Wrestling Entertainment, Inc., “A” | 3,473 | $ | 250,785 | |||||
|
| |||||||
| Food & Beverages – 2.9% |
| |||||||
| Archer Daniels Midland Co. | 13,761 | $ | 561,449 | |||||
| Coca-Cola Co. | 16,207 | 825,260 | ||||||
| Hostess Brands, Inc. (a) | 34,016 | 491,191 | ||||||
| J.M. Smucker Co. | 3,445 | 396,830 | ||||||
| Mondelez International, Inc. | 27,394 | 1,476,537 | ||||||
| Nomad Foods Ltd. (a) | 10,181 | 217,466 | ||||||
| PepsiCo, Inc. | 15,616 | 2,047,726 | ||||||
|
| |||||||
| $ | 6,016,459 | |||||||
|
| |||||||
| Food & Drug Stores – 0.1% |
| |||||||
| Grocery Outlet Holding Corp. (a) | 6,893 | $ | 226,642 | |||||
|
| |||||||
| Gaming & Lodging – 1.0% |
| |||||||
| Marriott International, Inc., “A” | 15,023 | $ | 2,107,577 | |||||
|
| |||||||
| General Merchandise – 1.4% |
| |||||||
| Dollar General Corp. | 11,703 | $ | 1,581,778 | |||||
| Dollar Tree, Inc. (a) | 11,644 | 1,250,449 | ||||||
|
| |||||||
| $ | 2,832,227 | |||||||
|
| |||||||
| Health Maintenance Organizations – 1.5% |
| |||||||
| Cigna Corp. | 10,555 | $ | 1,662,940 | |||||
| Humana, Inc. | 5,091 | 1,350,642 | ||||||
|
| |||||||
| $ | 3,013,582 | |||||||
|
| |||||||
| Insurance – 4.2% |
| |||||||
| Aon PLC | 21,458 | $ | 4,140,965 | |||||
| Assurant, Inc. | 7,206 | 766,574 | ||||||
| Chubb Ltd. | 9,862 | 1,452,574 | ||||||
| Everest Re Group Ltd. | 1,555 | 384,365 | ||||||
| Hartford Financial Services Group, Inc. | 14,437 | 804,430 | ||||||
| MetLife, Inc. | 13,303 | 660,760 | ||||||
| Issuer | Shares/Par | Value ($) | ||||||
| COMMON STOCKS – continued |
| |||||||
| Insurance – continued |
| |||||||
| Reinsurance Group of America, Inc. | 2,765 | $ | 431,423 | |||||
|
| |||||||
| $ | 8,641,091 | |||||||
|
| |||||||
| Internet – 4.6% |
| |||||||
| Alphabet, Inc., “A” (a)(s) | 5,036 | $ | 5,452,981 | |||||
| Facebook, Inc., “A” (a) | 20,830 | 4,020,190 | ||||||
|
| |||||||
| $ | 9,473,171 | |||||||
|
| |||||||
| Leisure & Toys – 0.8% |
| |||||||
| Brunswick Corp. | 8,042 | $ | 369,047 | |||||
| Electronic Arts, Inc. (a) | 12,658 | 1,281,749 | ||||||
|
| |||||||
| $ | 1,650,796 | |||||||
|
| |||||||
| Machinery & Tools – 1.4% |
| |||||||
| Flowserve Corp. | 13,080 | $ | 689,185 | |||||
| IDEX Corp. | 2,778 | 478,205 | ||||||
| ITT, Inc. | 6,847 | 448,341 | ||||||
| Roper Technologies, Inc. | 3,491 | 1,278,614 | ||||||
|
| |||||||
| $ | 2,894,345 | |||||||
|
| |||||||
| Major Banks – 2.2% |
| |||||||
| Goldman Sachs Group, Inc. | 11,719 | $ | 2,397,708 | |||||
| PNC Financial Services Group, Inc. | 8,608 | 1,181,706 | ||||||
| State Street Corp. | 9,036 | 506,558 | ||||||
| Wells Fargo & Co. | 11,222 | 531,025 | ||||||
|
| |||||||
| $ | 4,616,997 | |||||||
|
| |||||||
| Medical & Health Technology & Services – 1.3% |
| |||||||
| Guardant Health, Inc. (a) | 1,292 | $ | 111,538 | |||||
| HCA Healthcare, Inc. | 7,048 | 952,678 | ||||||
| ICON PLC (a) | 4,645 | 715,191 | ||||||
| IDEXX Laboratories, Inc. (a) | 1,158 | 318,832 | ||||||
| McKesson Corp. | 4,558 | 612,550 | ||||||
|
| |||||||
| $ | 2,710,789 | |||||||
|
| |||||||
| Medical Equipment – 4.4% |
| |||||||
| Adaptive Biotechnologies Corp. (a) | 2,116 | $ | 102,203 | |||||
| Becton, Dickinson and Co. | 5,367 | 1,352,538 | ||||||
| Boston Scientific Corp. (a) | 35,166 | 1,511,435 | ||||||
| Danaher Corp. | 6,118 | 874,384 | ||||||
| Masimo Corp. (a) | 3,892 | 579,207 | ||||||
| Medtronic PLC | 25,065 | 2,441,080 | ||||||
| PerkinElmer, Inc. | 10,033 | 966,579 | ||||||
| STERIS PLC | 3,837 | 571,253 | ||||||
| West Pharmaceutical Services, Inc. | 5,001 | 625,875 | ||||||
|
| |||||||
| $ | 9,024,554 | |||||||
|
| |||||||
| Natural Gas – Pipeline – 0.4% |
| |||||||
| Enterprise Products Partners LP | 19,033 | $ | 549,483 | |||||
| Equitrans Midstream Corp. | 16,658 | 328,329 | ||||||
|
| |||||||
| $ | 877,812 | |||||||
|
| |||||||
| Network & Telecom – 1.4% |
| |||||||
| Cisco Systems, Inc. | 43,148 | $ | 2,361,490 | |||||
| Interxion Holding N.V. (a) | 6,000 | 456,540 | ||||||
|
| |||||||
| $ | 2,818,030 | |||||||
|
| |||||||
5
Table of Contents
MFS Core Equity Portfolio
Portfolio of Investments (unaudited) – continued
| Issuer | Shares/Par | Value ($) | ||||||
| COMMON STOCKS – continued |
| |||||||
| Oil Services – 0.6% |
| |||||||
| Apergy Corp. (a) | 6,587 | $ | 220,928 | |||||
| Cactus, Inc., “A” (a) | 9,491 | 314,342 | ||||||
| Core Laboratories N.V. | 8,308 | 434,342 | ||||||
| Patterson-UTI Energy, Inc. | 20,641 | 237,578 | ||||||
|
| |||||||
| $ | 1,207,190 | |||||||
|
| |||||||
| Other Banks & Diversified Financials – 6.3% |
| |||||||
| Bank OZK | 23,308 | $ | 701,338 | |||||
| BB&T Corp. | 42,398 | 2,083,014 | ||||||
| Citigroup, Inc. | 39,606 | 2,773,608 | ||||||
| EuroDekania Ltd. (u) | 151,350 | 1,936 | ||||||
| Mastercard, Inc., “A” | 15,587 | 4,123,229 | ||||||
| Prosperity Bancshares, Inc. | 3,339 | 220,541 | ||||||
| Signature Bank | 6,670 | 806,003 | ||||||
| U.S. Bancorp | 33,155 | 1,737,322 | ||||||
| Wintrust Financial Corp. | 6,775 | 495,659 | ||||||
|
| |||||||
| $ | 12,942,650 | |||||||
|
| |||||||
| Pharmaceuticals – 6.7% |
| |||||||
| Elanco Animal Health, Inc. (a) | 76,100 | $ | 2,572,180 | |||||
| Eli Lilly & Co. | 18,606 | 2,061,359 | ||||||
| Johnson & Johnson | 21,438 | 2,985,885 | ||||||
| Pfizer, Inc. | 84,141 | 3,644,988 | ||||||
| Zoetis, Inc. | 22,972 | 2,607,092 | ||||||
|
| |||||||
| $ | 13,871,504 | |||||||
|
| |||||||
| Pollution Control – 0.5% |
| |||||||
| Evoqua Water Technologies LLC (a) | 25,085 | $ | 357,210 | |||||
| Waste Connections, Inc. | 6,714 | 641,724 | ||||||
|
| |||||||
| $ | 998,934 | |||||||
|
| |||||||
| Railroad & Shipping – 1.3% |
| |||||||
| Canadian Pacific Railway Ltd. | 6,356 | $ | 1,495,185 | |||||
| Kansas City Southern Co. | 10,616 | 1,293,241 | ||||||
|
| |||||||
| $ | 2,788,426 | |||||||
|
| |||||||
| Real Estate – 2.6% |
| |||||||
| Industrial Logistics Properties Trust, REIT | 38,300 | $ | 797,406 | |||||
| Life Storage, Inc., REIT | 1,880 | 178,750 | ||||||
| Medical Properties Trust, Inc., REIT | 113,003 | 1,970,772 | ||||||
| STORE Capital Corp., REIT | 27,499 | 912,692 | ||||||
| Sun Communities, Inc., REIT | 2,564 | 328,679 | ||||||
| W.P. Carey, Inc., REIT | 14,003 | 1,136,764 | ||||||
|
| |||||||
| $ | 5,325,063 | |||||||
|
| |||||||
| Restaurants – 1.2% |
| |||||||
| Starbucks Corp. | 22,296 | $ | 1,869,074 | |||||
| U.S. Foods Holding Corp. (a) | 19,178 | 685,805 | ||||||
|
| |||||||
| $ | 2,554,879 | |||||||
|
| |||||||
| Specialty Chemicals – 1.1% |
| |||||||
| Corteva, Inc. | 25,401 | $ | 751,108 | |||||
| DuPont de Nemours, Inc. | 15,761 | 1,183,178 | ||||||
| Univar, Inc. (a) | 16,776 | 369,743 | ||||||
|
| |||||||
| $ | 2,304,029 | |||||||
|
| |||||||
| Issuer | Shares/Par | Value ($) | ||||||
| COMMON STOCKS – continued |
| |||||||
| Specialty Stores – 5.8% |
| |||||||
| Amazon.com, Inc. (a)(s) | 3,592 | $ | 6,801,919 | |||||
| Chewy, Inc., “A” (a) | 6,408 | 224,280 | ||||||
| Costco Wholesale Corp. | 5,804 | 1,533,765 | ||||||
| Floor & Decor Holdings, Inc. (a) | 20,707 | 867,623 | ||||||
| Ross Stores, Inc. | 14,898 | 1,476,690 | ||||||
| Target Corp. | 13,135 | 1,137,622 | ||||||
|
| |||||||
| $ | 12,041,899 | |||||||
|
| |||||||
| Telecommunications – Wireless – 2.0% |
| |||||||
| American Tower Corp., REIT | 20,568 | $ | 4,205,128 | |||||
|
| |||||||
| Telephone Services – 0.6% |
| |||||||
| Verizon Communications, Inc. | 20,538 | $ | 1,173,336 | |||||
|
| |||||||
| Tobacco – 0.5% |
| |||||||
| Philip Morris International, Inc. | 14,356 | $ | 1,127,377 | |||||
|
| |||||||
| Utilities – Electric Power – 3.1% |
| |||||||
| American Electric Power Co., Inc. | 10,668 | $ | 938,891 | |||||
| Avangrid, Inc. | 4,157 | 209,928 | ||||||
| CenterPoint Energy, Inc. | 18,609 | 532,776 | ||||||
| CMS Energy Corp. | 12,987 | 752,077 | ||||||
| Evergy, Inc. | 12,418 | 746,943 | ||||||
| Exelon Corp. | 18,388 | 881,521 | ||||||
| NextEra Energy, Inc. | 6,224 | 1,275,049 | ||||||
| Southern Co. | 5,770 | 318,965 | ||||||
| Xcel Energy, Inc. | 14,041 | 835,299 | ||||||
|
| |||||||
| $ | 6,491,449 | |||||||
|
| |||||||
| Total Common Stocks (Identified Cost, $149,852,637) | $ | 205,799,946 | ||||||
|
| |||||||
| CONVERTIBLE PREFERRED STOCKS – 0.1% |
| |||||||
| Natural Gas – Distribution – 0.1% |
| |||||||
| South Jersey Industries, Inc., 7.25% | 4,203 | $ | 223,810 | |||||
|
| |||||||
| Utilities – Electric Power – 0.0% |
| |||||||
| American Electric Power Co., Inc., 6.125% | 1,150 | $ | 61,536 | |||||
|
| |||||||
| Total Convertible Preferred Stocks (Identified Cost, $267,650) | $ | 285,346 | ||||||
|
| |||||||
| INVESTMENT COMPANIES (h) – 0.4% |
| |||||||
| Money Market Funds – 0.4% |
| |||||||
| MFS Institutional Money Market Portfolio, 2.42% (v) (Identified Cost, $931,238) | 931,218 | $ | 931,311 | |||||
|
| |||||||
| SECURITIES SOLD SHORT – (0.5)% |
| |||||||
| Medical & Health Technology & Services – (0.3)% |
| |||||||
| Healthcare Services Group, Inc. | (20,858 | ) | $ | (632,414 | ) | |||
|
| |||||||
| Telecommunications – Wireless – (0.2)% |
| |||||||
| Crown Castle International Corp., REIT | (3,720 | ) | $ | (484,902 | ) | |||
|
| |||||||
| Total Securities Sold Short (Proceeds Received, $1,050,080) | $ | (1,117,316 | ) | |||||
|
| |||||||
| OTHER ASSETS, LESS LIABILITIES – 0.6% | 1,148,815 | |||||||
|
| |||||||
| NET ASSETS – 100.0% | $ | 207,048,102 | ||||||
|
| |||||||
6
Table of Contents
MFS Core Equity Portfolio
Portfolio of Investments (unaudited) – continued
| (a) | Non-income producing security. |
| (h) | An affiliated issuer, which may be considered one in which the fund owns 5% or more of the outstanding voting securities, or a company which is under common control. At period end, the aggregate values of the fund’s investments in affiliated issuers and in unaffiliated issuers were $931,311 and $206,085,292, respectively. |
| (s) | Security or a portion of the security was pledged to cover collateral requirements for securities sold short. |
| (u) | The security was valued using significant unobservable inputs and is considered level 3 under the fair value hierarchy. For further information about the fund’s level 3 holdings, please see Note 2 in the Notes to Financial Statements. |
| (v) | Affiliated issuer that is available only to investment companies managed by MFS. The rate quoted for the MFS Institutional Money Market Portfolio is the annualizedseven-day yield of the fund at period end. |
The following abbreviations are used in this report and are defined:
| ADR | American Depositary Receipt |
| REIT | Real Estate Investment Trust |
At June 30, 2019, the fund had cash collateral of $12,198 and other liquid securities with an aggregate value of $2,015,017 to cover any collateral or margin obligations for securities sold short. Restricted cash and/or deposits with brokers in the Statement of Assets and Liabilities are comprised of cash collateral.
See Notes to Financial Statements
7
Table of Contents
MFS Core Equity Portfolio
FINANCIAL STATEMENTS | STATEMENT OF ASSETS AND LIABILITIES (unaudited)
This statement represents your fund’s balance sheet, which details the assets and liabilities comprising the total value of the fund.
At 6/30/19 | ||||
Assets | ||||
Investments in unaffiliated issuers, at value (identified cost, $150,120,287) | $206,085,292 | |||
Investments in affiliated issuers, at value (identified cost, $931,238) | 931,311 | |||
Cash | 1,357 | |||
Deposits with brokers for | ||||
Securities sold short | 12,198 | |||
Receivables for | ||||
Investments sold | 2,304,088 | |||
Fund shares sold | 11,060 | |||
Dividends | 181,664 | |||
Other assets | 797 | |||
Total assets | $209,527,767 | |||
Liabilities | ||||
Payables for | ||||
Securities sold short, at value (proceeds received, $1,050,080) | $1,117,316 | |||
Investments purchased | 1,011,084 | |||
Fund shares reacquired | 254,580 | |||
Payable to affiliates | ||||
Investment adviser | 16,711 | |||
Administrative services fee | 419 | |||
Shareholder servicing costs | 66 | |||
Distribution and/or service fees | 1,246 | |||
Payable for independent Trustees’ compensation | 310 | |||
Accrued expenses and other liabilities | 77,933 | |||
Total liabilities | $2,479,665 | |||
Net assets | $207,048,102 | |||
Net assets consist of | ||||
Paid-in capital | $116,497,026 | |||
Total distributable earnings (loss) | 90,551,076 | |||
Net assets | $207,048,102 | |||
Shares of beneficial interest outstanding | 7,915,362 | |||
| Net assets | Shares outstanding | Net asset value per share | ||||||||||
Initial Class | $161,254,114 | 6,147,933 | $26.23 | |||||||||
Service Class | 45,793,988 | 1,767,429 | 25.91 | |||||||||
See Notes to Financial Statements
8
Table of Contents
MFS Core Equity Portfolio
FINANCIAL STATEMENTS | STATEMENT OF OPERATIONS (unaudited)
This statement describes how much your fund earned in investment income and accrued in expenses. It also describes any gains and/or losses generated by fund operations.
Six months ended 6/30/19 | ||||
Net investment income (loss) | ||||
Income | ||||
Dividends | $1,659,252 | |||
Income on securities loaned | 21,184 | |||
Other | 20,941 | |||
Dividends from affiliated issuers | 20,871 | |||
Foreign taxes withheld | (3,411 | ) | ||
Total investment income | $1,718,837 | |||
Expenses | ||||
Management fee | $752,952 | |||
Distribution and/or service fees | 56,144 | |||
Shareholder servicing costs | 5,311 | |||
Administrative services fee | 19,270 | |||
Independent Trustees’ compensation | 3,274 | |||
Custodian fee | 6,258 | |||
Shareholder communications | 20,261 | |||
Audit and tax fees | 28,325 | |||
Legal fees | 946 | |||
Dividend and interest expense on securities sold short | 35,075 | |||
Interest expense and fees | 613 | |||
Miscellaneous | 15,872 | |||
Total expenses | $944,301 | |||
Reduction of expenses by investment adviser | (9,697 | ) | ||
Net expenses | $934,604 | |||
Net investment income (loss) | $784,233 | |||
Realized and unrealized gain (loss) | ||||
Realized gain (loss) (identified cost basis) | ||||
Unaffiliated issuers | $6,142,097 | |||
Affiliated issuers | (103 | ) | ||
Foreign currency | (824 | ) | ||
Net realized gain (loss) | $6,141,170 | |||
Change in unrealized appreciation or depreciation | ||||
Unaffiliated issuers | $30,876,442 | |||
Affiliated issuers | 73 | |||
Securities sold short | 111,641 | |||
Translation of assets and liabilities in foreign currencies | 8 | |||
Net unrealized gain (loss) | $30,988,164 | |||
Net realized and unrealized gain (loss) | $37,129,334 | |||
Change in net assets from operations | $37,913,567 | |||
See Notes to Financial Statements
9
Table of Contents
MFS Core Equity Portfolio
FINANCIAL STATEMENTS | STATEMENTS OF CHANGES IN NET ASSETS
These statements describe the increases and/or decreases in net assets resulting from operations, any distributions, and any shareholder transactions.
| Six months ended 6/30/19 | Year ended 12/31/18 | |||||||
| (unaudited) | ||||||||
Change in net assets | ||||||||
From operations | ||||||||
Net investment income (loss) | $784,233 | $1,561,666 | ||||||
Net realized gain (loss) | 6,141,170 | 26,562,017 | ||||||
Net unrealized gain (loss) | 30,988,164 | (34,642,636 | ) | |||||
Change in net assets from operations | $37,913,567 | $(6,518,953 | ) | |||||
Total distributions to shareholders | $— | $(23,497,053 | ) | |||||
Change in net assets from fund share transactions | $(17,051,840 | ) | $(1,288,330 | ) | ||||
Total change in net assets | $20,861,727 | $(31,304,336 | ) | |||||
Net assets | ||||||||
At beginning of period | 186,186,375 | 217,490,711 | ||||||
At end of period | $207,048,102 | $186,186,375 | ||||||
See Notes to Financial Statements
10
Table of Contents
MFS Core Equity Portfolio
FINANCIAL STATEMENTS | FINANCIAL HIGHLIGHTS
The financial highlights table is intended to help you understand the fund’s financial performance for the semiannual period and the past 5 fiscal years. Certain information reflects financial results for a single fund share. The total returns in the table represent the rate that an investor would have earned (or lost) on an investment in the fund share class (assuming reinvestment of all distributions) held for the entire period.
| Initial Class | Six months 6/30/19 | Year ended | ||||||||||||||||||||||
| 12/31/18 | 12/31/17 | 12/31/16 | 12/31/15 | 12/31/14 | ||||||||||||||||||||
| (unaudited) | ||||||||||||||||||||||||
Net asset value, beginning of period | $21.68 | $25.21 | $21.67 | $21.28 | $23.40 | $21.49 | ||||||||||||||||||
| Income (loss) from investment operations | ||||||||||||||||||||||||
Net investment income (loss) (d) | $0.10 | $0.20 | $0.17 | $0.21 | (c) | $0.17 | $0.16 | |||||||||||||||||
Net realized and unrealized gain (loss) | 4.45 | (0.78 | ) | 5.04 | 2.16 | (0.35 | ) | 2.27 | ||||||||||||||||
Total from investment operations | $4.55 | $(0.58 | ) | $5.21 | $2.37 | $(0.18 | ) | $2.43 | ||||||||||||||||
| Less distributions declared to shareholders | ||||||||||||||||||||||||
From net investment income | $— | $(0.18 | ) | $(0.23 | ) | $(0.17 | ) | $(0.13 | ) | $(0.18 | ) | |||||||||||||
From net realized gain | — | (2.77 | ) | (1.44 | ) | (1.81 | ) | (1.81 | ) | (0.34 | ) | |||||||||||||
Total distributions declared to shareholders | $— | $(2.95 | ) | $(1.67 | ) | $(1.98 | ) | $(1.94 | ) | $(0.52 | ) | |||||||||||||
Net asset value, end of period (x) | $26.23 | $21.68 | $25.21 | $21.67 | $21.28 | $23.40 | ||||||||||||||||||
Total return (%) (k)(r)(s)(x) | 20.99 | (n) | (3.83 | ) | 24.82 | 11.38 | (c) | (0.21 | ) | 11.38 | ||||||||||||||
| Ratios (%) (to average net assets) and Supplemental data: | ||||||||||||||||||||||||
Expenses before expense reductions (f) | 0.88 | (a) | 0.87 | 0.87 | 0.84 | (c) | 0.86 | 0.85 | ||||||||||||||||
Expenses after expense reductions (f) | 0.87 | (a) | 0.86 | 0.86 | 0.82 | (c) | 0.85 | 0.84 | ||||||||||||||||
Net investment income (loss) | 0.84 | (a) | 0.79 | 0.72 | 1.00 | (c) | 0.75 | 0.74 | ||||||||||||||||
Portfolio turnover | 22 | (n) | 40 | 39 | 60 | 50 | 48 | |||||||||||||||||
Net assets at end of period (000 omitted) | $161,254 | $144,991 | $171,038 | $156,040 | $156,450 | $115,826 | ||||||||||||||||||
| Supplemental Ratios (%): | ||||||||||||||||||||||||
Ratio of expenses to average net assets after expense reductions excluding short sale expenses and interest expense and fees (f) | 0.84 | (a) | 0.83 | 0.84 | 0.80 | (c) | 0.84 | 0.84 | ||||||||||||||||
See Notes to Financial Statements
11
Table of Contents
MFS Core Equity Portfolio
Financial Highlights – continued
| Service Class | Six months 6/30/19 | Year ended | ||||||||||||||||||||||
| 12/31/18 | 12/31/17 | 12/31/16 | 12/31/15 | 12/31/14 | ||||||||||||||||||||
| (unaudited) | ||||||||||||||||||||||||
Net asset value, beginning of period | $21.44 | $24.96 | $21.47 | $21.10 | $23.20 | $21.32 | ||||||||||||||||||
| Income (loss) from investment operations | ||||||||||||||||||||||||
Net investment income (loss) (d) | $0.07 | $0.14 | $0.11 | $0.16 | (c) | $0.11 | $0.11 | |||||||||||||||||
Net realized and unrealized gain (loss) | 4.40 | (0.78 | ) | 4.99 | 2.13 | (0.33 | ) | 2.24 | ||||||||||||||||
Total from investment operations | $4.47 | $(0.64 | ) | $5.10 | $2.29 | $(0.22 | ) | $2.35 | ||||||||||||||||
| Less distributions declared to shareholders | ||||||||||||||||||||||||
From net investment income | $— | $(0.11 | ) | $(0.17 | ) | $(0.11 | ) | $(0.07 | ) | $(0.13 | ) | |||||||||||||
From net realized gain | — | (2.77 | ) | (1.44 | ) | (1.81 | ) | (1.81 | ) | (0.34 | ) | |||||||||||||
Total distributions declared to shareholders | $— | $(2.88 | ) | $(1.61 | ) | $(1.92 | ) | $(1.88 | ) | $(0.47 | ) | |||||||||||||
Net asset value, end of period (x) | $25.91 | $21.44 | $24.96 | $21.47 | $21.10 | $23.20 | ||||||||||||||||||
Total return (%) (k)(r)(s)(x) | 20.85 | (n) | (4.07 | ) | 24.50 | 11.07 | (c) | (0.40 | ) | 11.07 | ||||||||||||||
| Ratios (%) (to average net assets) and Supplemental data: | ||||||||||||||||||||||||
Expenses before expense reductions (f) | 1.13 | (a) | 1.12 | 1.12 | 1.09 | (c) | 1.11 | 1.10 | ||||||||||||||||
Expenses after expense reductions (f) | 1.12 | (a) | 1.11 | 1.11 | 1.07 | (c) | 1.10 | 1.09 | ||||||||||||||||
Net investment income (loss) | 0.59 | (a) | 0.54 | 0.47 | 0.75 | (c) | 0.50 | 0.49 | ||||||||||||||||
Portfolio turnover | 22 | (n) | 40 | 39 | 60 | 50 | 48 | |||||||||||||||||
Net assets at end of period (000 omitted) | $45,794 | $41,195 | $46,453 | $42,883 | $47,083 | $48,813 | ||||||||||||||||||
| Supplemental Ratios (%): | ||||||||||||||||||||||||
Ratio of expenses to average net assets after expense reductions excluding short sale expenses and interest expense and fees (f) | 1.09 | (a) | 1.08 | 1.09 | 1.06 | (c) | 1.09 | 1.09 | ||||||||||||||||
| (a) | Annualized. |
| (c) | Amount reflects aone-time reimbursement of expenses by the custodian (or former custodian) without which net investment income and performance would be lower and expenses would be higher. |
| (d) | Per share data is based on average shares outstanding. |
| (f) | Ratios do not reflect reductions from fees paid indirectly, if applicable. |
| (k) | The total return does not reflect expenses that apply to separate accounts. Inclusion of these charges would reduce the total return figures for all periods shown. |
| (n) | Not annualized. |
| (r) | Certain expenses have been reduced without which performance would have been lower. |
| (s) | From time to time the fund may receive proceeds from litigation settlements, without which performance would be lower. Excluding the effect of the proceeds received from anon-recurring litigation settlement against Household International, Inc., the total return for the year ended December 31, 2017 would have been lower by approximately 0.78%. |
| (x) | The net asset values and total returns have been calculated on net assets which include adjustments made in accordance with U.S. generally accepted accounting principles required at period end for financial reporting purposes. |
See Notes to Financial Statements
12
Table of Contents
MFS Core Equity Portfolio
NOTES TO FINANCIAL STATEMENTS (unaudited)
| (1) | Business and Organization |
MFS Core Equity Portfolio (the fund) is a diversified series of MFS Variable Insurance Trust II (the trust). The trust is organized as a Massachusetts business trust and is registered under the Investment Company Act of 1940, as amended, as anopen-end management investment company. The shareholders of each series of the trust are separate accounts of insurance companies, which offer variable annuity and/or life insurance products, and qualified retirement and pension plans.
The fund is an investment company and accordingly follows the investment company accounting and reporting guidance of the Financial Accounting Standards Board (FASB) Accounting Standards Codification Topic 946 Financial Services – Investment Companies.
| (2) | Significant Accounting Policies |
General– The preparation of financial statements in conformity with U.S. generally accepted accounting principles requires management to make estimates and assumptions that affect the reported amounts of assets and liabilities, and disclosure of contingent assets and liabilities at the date of the financial statements and the reported amounts of increases and decreases in net assets from operations during the reporting period. Actual results could differ from those estimates. In the preparation of these financial statements, management has evaluated subsequent events occurring after the date of the fund’s Statement of Assets and Liabilities through the date that the financial statements were issued.
Balance Sheet Offsetting– The fund’s accounting policy with respect to balance sheet offsetting is that, absent an event of default by the counterparty or a termination of the agreement, the International Swaps and Derivatives Association (ISDA) Master Agreement, or similar agreement, does not result in an offset of reported amounts of financial assets and financial liabilities in the Statement of Assets and Liabilities across transactions between the fund and the applicable counterparty. The fund’s right to setoff may be restricted or prohibited by the bankruptcy or insolvency laws of the particular jurisdiction to which a specific master netting agreement counterparty is subject. Balance sheet offsetting disclosures, to the extent applicable to the fund, have been included in the fund’s Significant Accounting Policies note under the captions for each of the fund’sin-scope financial instruments and transactions.
Investment Valuations– Equity securities, including restricted equity securities and equity securities sold short, are generally valued at the last sale or official closing price on their primary market or exchange as provided by a third-party pricing service. Equity securities, for which there were no sales reported that day, are generally valued at the last quoted daily bid quotation on their primary market or exchange as provided by a third-party pricing service. Equity securities sold short, for which there were no sales reported for that day, are generally valued at the last quoted daily ask quotation on their primary market or exchange as provided by a third-party pricing service. Short-term instruments with a maturity at issuance of 60 days or less may be valued at amortized cost, which approximates market value.Open-end investment companies are generally valued at net asset value per share. Securities and other assets generally valued on the basis of information from a third-party pricing service may also be valued at a broker/dealer bid quotation. In determining values, third-party pricing services can utilize both transaction data and market information such as yield, quality, coupon rate, maturity, type of issue, trading characteristics, and other market data. The values of foreign securities and other assets and liabilities expressed in foreign currencies are converted to U.S. dollars using the mean of bid and asked prices for rates provided by a third-party pricing service.
The Board of Trustees has delegated primary responsibility for determining or causing to be determined the value of the fund’s investments (including any fair valuation) to the adviser pursuant to valuation policies and procedures approved by the Board. If the adviser determines that reliable market quotations are not readily available, investments are valued at fair value as determined in good faith by the adviser in accordance with such procedures under the oversight of the Board of Trustees. Under the fund’s valuation policies and procedures, market quotations are not considered to be readily available for most types of debt instruments and floating rate loans and many types of derivatives. These investments are generally valued at fair value based on information from third-party pricing services. In addition, investments may be valued at fair value if the adviser determines that an investment’s value has been materially affected by events occurring after the close of the exchange or market on which the investment is principally traded (such as foreign exchange or market) and prior to the determination of the fund’s net asset value, or after the halt of trading of a specific security where trading does not resume prior to the close of the exchange or market on which the security is principally traded. Events that occur after foreign markets close (such as developments in foreign markets and significant movements in the U.S. markets) and prior to the determination of the fund’s net asset value may be deemed to have a material effect on the value of securities traded in foreign markets. Accordingly, the fund’s foreign equity securities may often be valued at fair value. The adviser generally relies on third-party pricing services or other information (such as the correlation with price movements of similar securities in the same or other markets; the type, cost and investment characteristics of the security; the business and financial condition of the issuer; and trading and other market data) to assist in determining whether to fair value and at what value to fair value an investment. The value of an investment for purposes of calculating the fund’s net asset value can differ depending on the source and method used to determine value. When fair valuation is used, the value of an investment used to determine the fund’s net asset
13
Table of Contents
MFS Core Equity Portfolio
Notes to Financial Statements (unaudited) – continued
value may differ from quoted or published prices for the same investment. There can be no assurance that the fund could obtain the fair value assigned to an investment if it were to sell the investment at the same time at which the fund determines its net asset value per share.
Various inputs are used in determining the value of the fund’s assets or liabilities. These inputs are categorized into three broad levels. In certain cases, the inputs used to measure fair value may fall into different levels of the fair value hierarchy. In such cases, an investment’s level within the fair value hierarchy is based on the lowest level of input that is significant to the fair value measurement. The fund’s assessment of the significance of a particular input to the fair value measurement in its entirety requires judgment, and considers factors specific to the investment. Level 1 includes unadjusted quoted prices in active markets for identical assets or liabilities. Level 2 includes other significant observable market-based inputs (including quoted prices for similar securities, interest rates, prepayment speed, and credit risk). Level 3 includes unobservable inputs, which may include the adviser’s own assumptions in determining the fair value of investments. The following is a summary of the levels used as of June 30, 2019 in valuing the fund’s assets or liabilities:
| Financial Instruments | Level 1 | Level 2 | Level 3 | Total | ||||||||||||
| Equity Securities: | ||||||||||||||||
United States | $202,398,864 | $— | $— | $202,398,864 | ||||||||||||
Canada | 2,136,910 | — | — | 2,136,910 | ||||||||||||
Ireland | 715,191 | — | — | 715,191 | ||||||||||||
Netherlands | 456,540 | — | — | 456,540 | ||||||||||||
United Kingdom | 375,851 | — | — | 375,851 | ||||||||||||
Cayman Islands | — | — | 1,936 | 1,936 | ||||||||||||
| Mutual Funds | 931,311 | — | — | 931,311 | ||||||||||||
| Total | $207,014,667 | $— | $1,936 | $207,016,603 | ||||||||||||
| Short Sales | $(1,117,316 | ) | $— | $— | $(1,117,316 | ) | ||||||||||
For further information regarding security characteristics, see the Portfolio of Investments.
The following is a reconciliation of level 3 assets for which significant unobservable inputs were used to determine fair value. The table presents the activity of level 3 securities held at the beginning and the end of the period.
| Equity Securities | ||||
| Balance as of 12/31/18 | $18,858 | |||
Change in unrealized appreciation or depreciation | (16,922 | ) | ||
| Balance as of 6/30/19 | $1,936 | |||
The net change in unrealized appreciation or depreciation from investments held as level 3 at June 30, 2019 is $(16,922). At June 30, 2019, the fund held one level 3 security.
Foreign Currency Translation– Purchases and sales of foreign investments, income, and expenses are converted into U.S. dollars based upon currency exchange rates prevailing on the respective dates of such transactions or on the reporting date for foreign denominated receivables and payables. Gains and losses attributable to foreign currency exchange rates on sales of securities are recorded for financial statement purposes as net realized gains and losses on investments. Gains and losses attributable to foreign exchange rate movements on receivables, payables, income and expenses are recorded for financial statement purposes as foreign currency transaction gains and losses. That portion of both realized and unrealized gains and losses on investments that results from fluctuations in foreign currency exchange rates is not separately disclosed.
Short Sales– The fund entered into short sales whereby it sells a security it does not own in anticipation of a decline in the value of that security. The fund will realize a gain if the security price decreases and a loss if the security price increases between the date of the short sale and the date on which the fund replaces the borrowed security. Losses from short sales can exceed the proceeds of the security sold; and they can also exceed the potential loss from an ordinary buy and sell transaction. The amount of any premium, dividends, or interest the fund may be required to pay in connection with a short sale will be recognized as a fund expense. During the six months ended June 30, 2019, this expense amounted to $35,075. The fund segregates cash or marketable securities in an amount that, when combined with the amount of proceeds from the short sale deposited with the broker, at least equals the current market value of the security sold short.
Security Loans– Under its Securities Lending Agency Agreement with the fund, State Street Bank and Trust Company, as lending agent, loans the securities of the fund to certain qualified institutions (the “Borrowers”) approved by the fund. Security loans can be terminated at the discretion of either the lending agent or the fund and the related securities must be returned within the earlier of the standard trade settlement period for such securities or within three business days. The loans are collateralized by cash and/or
U.S. Treasury and federal agency obligations in an amount typically at least equal to the market value of the securities loaned. On loans collateralized by cash, the cash collateral is invested in a money market fund. The market value of the loaned securities is
14
Table of Contents
MFS Core Equity Portfolio
Notes to Financial Statements (unaudited) – continued
determined at the close of business of the fund and any additional required collateral is delivered to the fund on the next business day. The lending agent provides the fund with indemnification against Borrower default. In the event of Borrower default, the lending agent will, for the benefit of the fund, either purchase securities identical to those loaned or, when such purchase is commercially impracticable, pay the fund the market value of the loaned securities. In return, the lending agent assumes the fund’s rights to the related collateral. If the collateral value is less than the cost to purchase identical securities, the lending agent is responsible for the shortfall, but only to the extent that such shortfall is not due to a decline in collateral value resulting from collateral reinvestment for which the fund bears the risk of loss. A portion of the income generated upon investment of the collateral is remitted to the Borrowers, and the remainder is allocated between the fund and the lending agent. On loans collateralized by U.S. Treasury and/or federal agency obligations, a fee is received from the Borrower, and is allocated between the fund and the lending agent. Income from securities lending is separately reported in the Statement of Operations. The dividend and interest income earned on the securities loaned is accounted for in the same manner as other dividend and interest income. At June 30, 2019, there were no securities on loan or collateral outstanding.
Indemnifications– Under the fund’s organizational documents, its officers and Trustees may be indemnified against certain liabilities and expenses arising out of the performance of their duties to the fund. Additionally, in the normal course of business, the fund enters into agreements with service providers that may contain indemnification clauses. The fund’s maximum exposure under these agreements is unknown as this would involve future claims that may be made against the fund that have not yet occurred.
Investment Transactions and Income– Investment transactions are recorded on the trade date. Dividends received in cash are recorded on theex-dividend date. Certain dividends from foreign securities will be recorded when the fund is informed of the dividend if such information is obtained subsequent to theex-dividend date. Dividend payments received in additional securities are recorded on theex-dividend date in an amount equal to the value of the security on such date.
The fund may receive proceeds from litigation settlements. Any proceeds received from litigation involving portfolio holdings are reflected in the Statement of Operations in realized gain/loss if the security has been disposed of by the fund or in unrealized gain/loss if the security is still held by the fund. Any other proceeds from litigation not related to portfolio holdings are reflected as other income in the Statement of Operations.
Tax Matters and Distributions– The fund intends to qualify as a regulated investment company, as defined under Subchapter M of the Internal Revenue Code, and to distribute all of its taxable income, including realized capital gains. As a result, no provision for federal income tax is required. The fund’s federal tax returns, when filed, will remain subject to examination by the Internal Revenue Service for a three year period. Management has analyzed the fund’s tax positions taken on federal and state tax returns for all open tax years and does not believe that there are any uncertain tax positions that require recognition of a tax liability. Foreign taxes, if any, have been accrued by the fund in the accompanying financial statements in accordance with the applicable foreign tax law. Foreign income taxes may be withheld by certain countries in which the fund invests. Additionally, capital gains realized by the fund on securities issued in or by certain foreign countries may be subject to capital gains tax imposed by those countries.
Distributions to shareholders are recorded on theex-dividend date. Income and capital gain distributions are determined in accordance with income tax regulations, which may differ from U.S. generally accepted accounting principles. Certain capital accounts in the financial statements are periodically adjusted for permanent differences in order to reflect their tax character. These adjustments have no impact on net assets or net asset value per share. Temporary differences which arise from recognizing certain items of income, expense, gain or loss in different periods for financial statement and tax purposes will reverse at some time in the future. Distributions in excess of net investment income or net realized gains are temporary overdistributions for financial statement purposes resulting from differences in the recognition or classification of income or distributions for financial statement and tax purposes.
Book/tax differences primarily relate to wash sale loss deferrals.
The tax character of distributions declared to shareholders for the last fiscal year is as follows:
| Year ended 12/31/18 | ||||
| Ordinary income (including any short-term capital gains) | $6,671,036 | |||
| Tax return of capital | 16,826,017 | |||
| Total distributions | $23,497,053 | |||
15
Table of Contents
MFS Core Equity Portfolio
Notes to Financial Statements (unaudited) – continued
The federal tax cost and the tax basis components of distributable earnings were as follows:
| As of 6/30/19 | ||||
| Cost of investments | $151,581,544 | |||
| Gross appreciation | 60,547,365 | |||
| Gross depreciation | (5,112,306 | ) | ||
| Net unrealized appreciation (depreciation) | $55,435,059 | |||
| As of 12/31/18 | ||||
| Undistributed ordinary income | 3,005,783 | |||
| Undistributed long-term capital gain | 25,156,626 | |||
| Other temporary differences | 95,433 | |||
| Net unrealized appreciation (depreciation) | 24,379,667 | |||
The aggregate cost above includes prior fiscal year end tax adjustments, if applicable.
Multiple Classes of Shares of Beneficial Interest– The fund offers multiple classes of shares, which differ in their respective distribution and/or service fees. The fund’s income, realized and unrealized gain (loss), and common expenses are allocated to shareholders based on the daily net assets of each class. Dividends are declared separately for each class. Differences in per share dividend rates are generally due to differences in separate class expenses. The fund’s distributions declared to shareholders as reported in the Statements of Changes in Net Assets are presented by class as follows:
| From net investment income | From net realized gain | |||||||||||||||
| Six months ended 6/30/19 | Year ended 12/31/18 | Six months ended 6/30/19 | Year ended 12/31/18 | |||||||||||||
| Initial Class | $— | $1,128,747 | $— | $17,409,241 | ||||||||||||
| Service Class | — | 196,254 | — | 4,762,811 | ||||||||||||
| Total | $— | $1,325,001 | $— | $22,172,052 | ||||||||||||
| (3) | Transactions with Affiliates |
Investment Adviser– The fund has an investment advisory agreement with MFS to provide overall investment management and related administrative services and facilities to the fund. The management fee is computed daily and paid monthly at the following annual rates based on the fund’s average daily net assets:
| Up to $1 billion | 0.75% | |||
| In excess of $1 billion and up to $2.5 billion | 0.65% | |||
| In excess of $2.5 billion | 0.60% |
MFS has agreed in writing to reduce its management fee by a specified amount if certain MFS mutual fund assets exceed thresholds agreed to by MFS and the fund’s Board of Trustees. For the six months ended June 30, 2019, this management fee reduction amounted to $9,697, which is included in the reduction of total expenses in the Statement of Operations. The management fee incurred for the six months ended June 30, 2019 was equivalent to an annual effective rate of 0.74% of the fund’s average daily net assets.
The investment adviser has agreed in writing to pay a portion of the fund’s total annual operating expenses, excluding interest, taxes, extraordinary expenses, brokerage and transaction costs, and investment-related expenses (such as short sale dividend and interest expenses incurred in connection with the fund’s investment activity), such that total annual operating expenses do not exceed 0.84% of average daily net assets for the Initial Class shares and 1.09% of average daily net assets for the Service Class shares. This written agreement will continue until modified by the fund’s Board of Trustees, but such agreement will continue at least until April 30, 2021. For the six months ended June 30, 2019, the fund’s actual operating expenses did not exceed the limit and therefore, the investment adviser did not pay any portion of the fund’s expenses related to this agreement.
Distributor– MFS Fund Distributors, Inc. (MFD), a wholly-owned subsidiary of MFS, is the distributor of shares of the fund. The Trustees have adopted a distribution plan for the Service Class shares pursuant to Rule12b-1 under the Investment Company Act of 1940.
The fund’s distribution plan provides that the fund will pay MFD distribution and/or service fees equal to 0.25% per annum of its average daily net assets attributable to Service Class shares as partial consideration for services performed and expenses incurred by MFD and financial intermediaries (including participating insurance companies that invest in the fund to fund variable annuity and variable life insurance contracts, sponsors of qualified retirement and pension plans that invest in the fund, and affiliates of these participating insurance companies and plan sponsors) in connection with the sale and distribution of the Service Class shares. MFD may subsequently pay all, or a portion, of the distribution and/or service fees to financial intermediaries.
16
Table of Contents
MFS Core Equity Portfolio
Notes to Financial Statements (unaudited) – continued
Shareholder Servicing Agent– MFS Service Center, Inc. (MFSC), a wholly-owned subsidiary of MFS, receives a fee from the fund for its services as shareholder servicing agent. For the six months ended June 30, 2019, the fee was $5,097, which equated to 0.0051% annually of the fund’s average daily net assets. MFSC also receives payment from the fund forout-of-pocket expenses paid by MFSC on behalf of the fund. For the six months ended June 30, 2019, these costs amounted to $214.
Administrator– MFS provides certain financial, legal, shareholder communications, compliance, and other administrative services to the fund. Under an administrative services agreement, the fund reimburses MFS the costs incurred to provide these services. The fund is charged an annual fixed amount of $17,500 plus a fee based on average daily net assets. The administrative services fee incurred for the six months ended June 30, 2019 was equivalent to an annual effective rate of 0.0192% of the fund’s average daily net assets.
Trustees’ and Officers’ Compensation– The fund pays compensation to independent Trustees in the form of a retainer, attendance fees, and additional compensation to Board and Committee chairpersons. The fund does not pay compensation directly to Trustees or officers of the fund who are also officers of the investment adviser, all of whom receive remuneration from MFS for their services to the fund. Certain officers and Trustees of the fund are officers or directors of MFS, MFD, and MFSC.
Other– This fund and certain other funds managed by MFS (the funds) had entered into a service agreement (the ISO Agreement) which provided for payment of fees solely by the funds to Tarantino LLC in return for the provision of services of an Independent Senior Officer (ISO) for the funds. Frank L. Tarantino served as the ISO and was an officer of the funds and the sole member of Tarantino LLC. Effective June 30, 2019, Mr. Tarantino retired from his position as ISO for the funds, and the ISO Agreement was terminated. For the six months ended June 30, 2019, the fee paid by the fund under this agreement was $237 and is included in “Miscellaneous” expense in the Statement of Operations. MFS had agreed to bear all expenses associated with office space, other administrative support, and supplies provided to the ISO.
The fund invests in the MFS Institutional Money Market Portfolio which is managed by MFS and seeks current income consistent with preservation of capital and liquidity. This money market fund does not pay a management fee to MFS.
The fund is permitted to engage in purchase and sale transactions with funds and accounts for which MFS serves as investment adviser orsub-adviser (“cross-trades”) pursuant to a policy adopted by the Board of Trustees. This policy has been designed to ensure that cross-trades conducted by the fund comply with Rule17a-7 under the Investment Company Act of 1940. During the six months ended June 30, 2019, the fund engaged in purchase and sale transactions pursuant to this policy, which amounted to $77,407 and $79,712, respectively. The sales transactions resulted in net realized gains (losses) of $10,948.
The adviser has voluntarily undertaken to reimburse the fund from its own resources on a quarterly basis for the cost of investment research embedded in the cost of the fund’s securities trades. This agreement may be rescinded at any time. For the six months ended June 30, 2019, this reimbursement amounted to $7,262, which is included in “Other” income in the Statement of Operations.
| (4) | Portfolio Securities |
For the six months ended June 30, 2019, purchases and sales of investments, other than short sales and short-term obligations, aggregated $44,987,264 and $60,099,232, respectively.
| (5) | Shares of Beneficial Interest |
The fund’s Declaration of Trust permits the Trustees to issue an unlimited number of full and fractional shares of beneficial interest. Transactions in fund shares were as follows:
| Six months ended 6/30/19 | Year ended 12/31/18 | |||||||||||||||
| Shares | Amount | Shares | Amount | |||||||||||||
| Shares sold | ||||||||||||||||
Initial Class | 75,252 | $1,858,151 | 194,535 | $4,980,452 | ||||||||||||
Service Class | 55,198 | 1,349,986 | 265,699 | 6,551,910 | ||||||||||||
| 130,450 | $3,208,137 | 460,234 | $11,532,362 | |||||||||||||
| Shares issued to shareholders in reinvestment of distributions | ||||||||||||||||
Initial Class | — | $— | 743,602 | $18,537,988 | ||||||||||||
Service Class | — | — | 200,935 | 4,959,065 | ||||||||||||
| — | $— | 944,537 | $23,497,053 | |||||||||||||
| Shares reacquired | ||||||||||||||||
Initial Class | (616,324 | ) | $(15,133,855 | ) | (1,034,631 | ) | $(26,088,919 | ) | ||||||||
Service Class | (209,278 | ) | (5,126,122 | ) | (406,173 | ) | (10,228,826 | ) | ||||||||
| (825,602 | ) | $(20,259,977 | ) | (1,440,804 | ) | $(36,317,745 | ) | |||||||||
17
Table of Contents
MFS Core Equity Portfolio
Notes to Financial Statements (unaudited) – continued
| Six months ended 6/30/19 | Year ended 12/31/18 | |||||||||||||||
| Shares | Amount | Shares | Amount | |||||||||||||
| Net change | ||||||||||||||||
Initial Class | (541,072 | ) | $(13,275,704 | ) | (96,494 | ) | $(2,570,479 | ) | ||||||||
Service Class | (154,080 | ) | (3,776,136 | ) | 60,461 | 1,282,149 | ||||||||||
| (695,152 | ) | $(17,051,840 | ) | (36,033 | ) | $(1,288,330 | ) | |||||||||
| (6) | Line of Credit |
The fund and certain other funds managed by MFS participate in a $1.25 billion unsecured committed line of credit, subject to a $1 billion sublimit, provided by a syndicate of banks under a credit agreement. Borrowings may be made for temporary financing needs. Interest is charged to each fund, based on its borrowings, generally at a rate equal to the highest of one month LIBOR, the Federal Funds Effective Rate and the Overnight Bank Funding Rate, plus an agreed upon spread. A commitment fee, based on the average daily, unused portion of the committed line of credit, is allocated among the participating funds. In addition, the fund and other funds managed by MFS have established unsecured uncommitted borrowing arrangements with certain banks for temporary financing needs. Interest is charged to each fund, based on its borrowings, at rates equal to customary reference rates plus an agreed upon spread. For the six months ended June 30, 2019, the fund’s commitment fee and interest expense were $591 and $0, respectively, and are included in “Interest expense and fees” in the Statement of Operations.
| (7) | Investments in Affiliated Issuers |
An affiliated issuer may be considered one in which the fund owns 5% or more of the outstanding voting securities, or a company which is under common control. For the purposes of this report, the following were affiliated issuers:
| Affiliated Issuers | Beginning Value | Purchases | Sales Proceeds | Realized Gain (Loss) | Change in Unrealized Appreciation or Depreciation | Ending Value | ||||||||||||||||||
| MFS Institutional Money Market Portfolio | $2,863,869 | $19,240,468 | $21,172,996 | $(103 | ) | $73 | $931,311 | |||||||||||||||||
| Affiliated Issuers | Dividend Income | Capital Gain Distributions | ||||||||||||||||||||||
| MFS Institutional Money Market Portfolio | $20,871 | $— | ||||||||||||||||||||||
18
Table of Contents
MFS Core Equity Portfolio
PROXY VOTING POLICIES AND INFORMATION
MFS votes proxies on behalf of the fund pursuant to proxy voting policies and procedures that are available without charge, upon request, by calling 1-800-225-2606, by visitingmfs.com/proxyvoting, or by visiting the SEC’s Web site athttp://www.sec.gov.
Information regarding how the fund voted proxies relating to portfolio securities during the most recent twelve-month period ended June 30 is available by August 31 of each year without charge by visitingmfs.com/proxyvoting, or by visiting the SEC’s Web site athttp://www.sec.gov.
QUARTERLY PORTFOLIO DISCLOSURE
The fund files a complete schedule of portfolio holdings with the SEC for the first and third quarters of each fiscal year on Form N-Q or as an exhibit to its reports on Form N-PORT (for first and third fiscal quarters ending March 31, 2019 or after). The fund’sForm N-Q or Form N-PORT reports are available on the SEC’s website athttp://www.sec.gov.A shareholder can obtain the portfolio holdings report for the first and third quarters of the fund’s fiscal year atmfs.com/vit2 by choosing the fund’s name and then selecting the “Resources” tab and clicking on “Prospectus and Reports”.
From time to time, MFS may post important information about the fund or the MFS funds on the MFS web site (mfs.com). This information is available athttps://www.mfs.com/en-us/what-we-do/announcements.htmlor atmfs.com/vit2 by choosing the fund’s name.
INFORMATION ABOUT FUND CONTRACTS AND LEGAL CLAIMS
The fund has entered into contractual arrangements with an investment adviser, administrator, distributor, shareholder servicing agent, 529 program manager (if applicable), and custodian who each provide services to the fund. Unless expressly stated otherwise, shareholders are not parties to, or intended beneficiaries of these contractual arrangements, and these contractual arrangements are not intended to create any shareholder right to enforce them against the service providers or to seek any remedy under them against the service providers, either directly or on behalf of the fund.
Under the Trust’s By-Laws and Declaration of Trust, any claims asserted against or on behalf of the MFS Funds, including claims against Trustees and Officers, must be brought in state and federal courts located within the Commonwealth of Massachusetts.
19
Table of Contents
Table of Contents
Semiannual Report
June 30, 2019

MFS® Emerging Markets
Equity Portfolio

MFS® Variable Insurance Trust II
Beginning on January 1, 2021, as permitted by regulations adopted by the U.S. Securities and Exchange Commission, the insurance company that offers your contract may determine that it will no longer send you paper copies of the fund’s annual and semiannual shareholder reports unless you specifically request paper copies from the insurance company or from your financial intermediary. Instead, the shareholder reports will be made available on a Web site (insurancefunds.mfs.com or other Web site of which you will be notified), and the insurance company will notify you by mail each time a report is posted and provide you with a Web site link to access the report. Instructions for requesting paper copies will be provided by your insurance company or financial intermediary.
If you already elected to receive shareholder reports by email, you will not be affected by this change and you need not take any action. If your insurance company or financial intermediary offers electronic delivery, you may elect to receive shareholder reports and other communications from the insurance company or financial intermediary by email by following the instructions provided by the insurance company or financial intermediary.
Beginning on January 1, 2019, you may elect to receive all future reports in paper free of charge from the insurance company or financial intermediary. You can inform the insurance company or financial intermediary that you wish to continue receiving paper copies of your shareholder reports by contacting your insurance company or financial intermediary. Your election to receive reports in paper will apply to all funds held in your account with your insurance company or financial intermediary.
FCE-SEM
Table of Contents
MFS® Emerging Markets Equity Portfolio
The report is prepared for the general information of contract owners. It is authorized for distribution to prospective investors only when preceded or accompanied by a current prospectus.
NOT FDIC INSURED• MAY LOSE VALUE• NO BANK OR CREDIT UNION GUARANTEE• NOT A DEPOSIT• NOT INSURED BY ANY FEDERAL GOVERNMENT AGENCY OR NCUA/NCUSIF
Table of Contents
MFS Emerging Markets Equity Portfolio
LETTER FROM THE EXECUTIVE CHAIRMAN

Dear Contract Owners:
Slowing global growth, low inflation, and increasing trade friction between the United States and China have been hallmarks of the past 12 months. After experiencing an uptick in market volatility in late 2018, markets steadied during the first half of 2019, thanks in large measure to the adoption of a dovish policy stance on the part of global central banks, who have largely abandoned efforts to normalize interest rates and have instead focused on supporting economic growth. Trade tensions remain high as the U.S. has ratcheted up tariffs on Chinese imports and China has retaliated. A truce of sorts was reached midyear, but significant challenges continue to confront negotiators, and it is not known whether a comprehensive agreement can be reached.
With Boris Johnson replacing Theresa May as Britain’s prime minister, uncertainty over Brexit remains high. Johnson has adopted a more combative stance than his predecessor toward the European Union, increasing concerns that there will be a “hard” Brexit.
Markets expect that the longest economic expansion in U.S. history will continue for the time being, albeit at a slower pace. Nevertheless, slower growth and low inflation have spurred the U.S. Federal Reserve to take a more accommodative policy stance, prompting investors to anticipate several interest rate cuts in the coming year. The European Central Bank has adopted a similar position. The more accommodative environment has helped fuel a continued rise in global equities and has been broadly supportive of risk assets.
Since launching the first U.S.open-end mutual fund in 1924, MFS® has been committed to a single purpose: to create value by allocating capital responsibly for clients. Through our powerful global investment platform, we combine collective expertise, thoughtful risk management, and long-term discipline to uncover what we believe are the best investment opportunities in the market.
Respectfully,

Robert J. Manning
Executive Chairman
MFS Investment Management
August 16, 2019
The opinions expressed in this letter are subject to change and may not be relied upon for investment advice. No forecasts can be guaranteed.
1
Table of Contents
MFS Emerging Markets Equity Portfolio
Portfolio structure
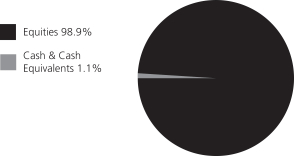
| Top ten holdings | ||||
| Taiwan Semiconductor Manufacturing Co. Ltd. | 5.3% | |||
| Samsung Electronics Co. Ltd. | 4.7% | |||
| Tencent Holdings Ltd. | 4.6% | |||
| Housing Development Finance Corp. Ltd. | 3.5% | |||
| Alibaba Group Holding Ltd., ADR | 3.1% | |||
| Yum China Holdings, Inc. | 2.8% | |||
| AIA Group Ltd. | 2.5% | |||
| China Resources Beer Holdings Co. Ltd. | 2.4% | |||
| Banco Bradesco S.A., ADR | 2.3% | |||
| LUKOIL PJSC, ADR | 2.2% | |||
| GICS equity sectors (g) | ||||
| Financials | 26.0% | |||
| Information Technology | 15.1% | |||
| Consumer Discretionary | 14.5% | |||
| Consumer Staples | 11.8% | |||
| Communication Services | 10.6% | |||
| Industrials | 8.2% | |||
| Energy | 4.7% | |||
| Materials | 4.1% | |||
| Real Estate | 2.0% | |||
| Utilities | 1.2% | |||
| Health Care | 0.7% | |||
| Issuer country weightings (x) | ||||
| China | 22.8% | |||
| South Korea | 11.6% | |||
| Brazil | 9.5% | |||
| India | 9.3% | |||
| Hong Kong | 7.8% | |||
| Taiwan | 7.7% | |||
| South Africa | 5.2% | |||
| Indonesia | 4.6% | |||
| Russia | 4.6% | |||
| Other Countries | 16.9% | |||
| Currency exposure weightings (y) | ||||
| Hong Kong Dollar | 19.4% | |||
| South Korean Won | 11.6% | |||
| Brazilian Real | 9.5% | |||
| Indian Rupee | 8.2% | |||
| Chinese Renminbi | 7.9% | |||
| Taiwan Dollar | 7.7% | |||
| United States Dollar | 7.7% | |||
| South African Rand | 5.2% | |||
| Indonesian Rupiah | 4.6% | |||
| Other Currencies | 18.2% | |||
| (g) | The Global Industry Classification Standard (GICS®) was developed by and/or is the exclusive property of MSCI, Inc. and S&P Global Market Intelligence Inc. (“S&P Global Market Intelligence”). GICS is a service mark of MSCI and S&P Global Market Intelligence and has been licensed for use by MFS. |
| (x) | Represents the portfolio’s exposure to issuer countries as a percentage of the portfolio’s net assets. For purposes of this presentation, United States (included in Other Countries) includes Cash & Cash Equivalents. |
| (y) | Represents the portfolio’s exposure to a particular currency as a percentage of a portfolio’s net assets. For purposes of this presentation, United States Dollar includes Cash & Cash Equivalents. |
Cash & Cash Equivalents includes any cash, investments in money market funds, short-term securities, and other assets less liabilities. Please see the Statement of Assets and Liabilities for additional information related to the fund’s cash position and other assets and liabilities.
Percentages are based on net assets as of June 30, 2019.
The portfolio is actively managed and current holdings may be different.
2
Table of Contents
MFS Emerging Markets Equity Portfolio
Fund Expenses Borne by the Contract Holders during the Period,
January 1, 2019 through June 30, 2019
As a contract holder of the fund, you incur ongoing costs, including management fees; distribution and/or service(12b-1) fees; and other fund expenses. This example is intended to help you understand your ongoing costs (in dollars) of investing in the fund and to compare these costs with the ongoing costs of investing in other mutual funds.
The example is based on an investment of $1,000 invested at the beginning of the period and held for the entire period January 1, 2019 through June 30, 2019.
Actual Expenses
The first line for each share class in the following table provides information about actual account values and actual expenses. You may use the information in this line, together with the amount you invested, to estimate the expenses that you paid over the period. Simply divide your account value by $1,000 (for example, an $8,600 account value divided by $1,000 = 8.6), then multiply the result by the number in the first line under the heading entitled “Expenses Paid During Period” to estimate the expenses you paid on your account during this period.
Hypothetical Example for Comparison Purposes
The second line for each share class in the following table provides information about hypothetical account values and hypothetical expenses based on the fund’s actual expense ratio and an assumed rate of return of 5% per year before expenses, which is not the fund’s actual return. The hypothetical account values and expenses may not be used to estimate the actual ending account balance or expenses you paid for the period. You may use this information to compare the ongoing costs of investing in the fund and other funds. To do so, compare this 5% hypothetical example with the 5% hypothetical examples that appear in the shareholder reports of the other funds.
Please note that the expenses shown in the table are meant to highlight the fund’s ongoing costs only and do not take into account the fees and expenses imposed under the variable contracts through which your investment in the fund is made. Therefore, the second line for each share class in the table is useful in comparing ongoing costs associated with an investment in vehicles (such as the fund) which fund benefits under variable annuity and variable life insurance contracts and to qualified pension and retirement plans only, and will not help you determine the relative total costs of investing in the fund through variable annuity and variable life insurance contracts. If the fees and expenses imposed under the variable contracts were included, your costs would have been higher.
| Share Class | Annualized Expense Ratio | Beginning Account Value 1/01/19 | Ending Account Value 6/30/19 | Expenses Paid During Period (p) 1/01/19-6/30/19 | ||||||||||||||
| Initial Class | Actual | 1.33% | $1,000.00 | $1,128.81 | $7.02 | |||||||||||||
| Hypothetical (h) | 1.33% | $1,000.00 | $1,018.20 | $6.66 | ||||||||||||||
| Service Class | Actual | 1.58% | $1,000.00 | $1,126.64 | $8.33 | |||||||||||||
| Hypothetical (h) | 1.58% | $1,000.00 | $1,016.96 | $7.90 | ||||||||||||||
| (h) | 5% class return per year before expenses. |
| (p) | “Expenses Paid During Period” are equal to each class’s annualized expense ratio, as shown above, multiplied by the average account value over the period, multiplied by 181/365 (to reflect theone-half year period). |
Notes to Expense Table
Changes to the fund’s fee arrangements will occur during the fund’s current fiscal year. Had these fee changes been in effect during the six month period, the annualized expense ratios, the actual expenses paid during the period, and the hypothetical expenses paid during the period would have been approximately 1.23%, $6.49, and $6.16 for Initial Class and 1.48%, $7.80, and $7.40 for Service Class, respectively. For further information about the fund’s fee arrangements and changes to those fee arrangements, please see Note 3 in the Notes to Financial Statements.
3
Table of Contents
MFS Emerging Markets Equity Portfolio
PORTFOLIO OF INVESTMENTS – 6/30/19 (unaudited)
The Portfolio of Investments is a complete list of all securities owned by your fund. It is categorized by broad-based asset classes.
| Issuer | Shares/Par | Value ($) | ||||||
| COMMON STOCKS – 98.9% | ||||||||
| Alcoholic Beverages – 5.0% |
| |||||||
| Ambev S.A., ADR | 162,995 | $ | 761,186 | |||||
| China Resources Beer Holdings Co. Ltd. | 234,000 | 1,111,333 | ||||||
| Kweichow Moutai Co., Ltd., “A” | 3,000 | 429,801 | ||||||
|
| |||||||
| $ | 2,302,320 | |||||||
|
| |||||||
| Apparel Manufacturers – 0.6% | ||||||||
| Stella International Holdings Ltd. | 166,000 | $ | 280,502 | |||||
|
| |||||||
| Automotive – 2.0% | ||||||||
| Mahindra & Mahindra Ltd. | 50,296 | $ | 477,512 | |||||
| PT Astra International Tbk | 822,100 | 433,527 | ||||||
|
| |||||||
| $ | 911,039 | |||||||
|
| |||||||
| Broadcasting – 0.1% | ||||||||
| Multichoice Group Ltd. (a) | 3,076 | $ | 29,258 | |||||
|
| |||||||
| Brokerage & Asset Managers – 0.4% | ||||||||
| B3 Brasil Bolsa Balcao S.A. | 19,600 | $ | 191,205 | |||||
|
| |||||||
| Business Services – 1.6% | ||||||||
| Cognizant Technology Solutions Corp., “A” | 10,633 | $ | 674,026 | |||||
| Motus Holdings Ltd. | 9,626 | 49,972 | ||||||
|
| |||||||
| $ | 723,998 | |||||||
|
| |||||||
| Computer Software – Systems – 1.1% | ||||||||
| Linx S.A. | 57,000 | $ | 529,187 | |||||
|
| |||||||
| Construction – 2.7% | ||||||||
| PT Indocement Tunggal Prakarsa Tbk | 380,100 | $ | 538,099 | |||||
| Techtronic Industries Co. Ltd. | 94,500 | 723,415 | ||||||
|
| |||||||
| $ | 1,261,514 | |||||||
|
| |||||||
| Consumer Products – 0.5% | ||||||||
| Dabur India Ltd. | 39,137 | $ | 227,074 | |||||
|
| |||||||
| Consumer Services – 3.4% | ||||||||
| 51job, Inc., ADR (a) | 7,930 | $ | 598,715 | |||||
| Ctrip.com International Ltd., ADR (a) | 8,440 | 311,520 | ||||||
| Localiza Rent a Car S.A. | 16,100 | 171,820 | ||||||
| MakeMyTrip Ltd. (a) | 20,613 | 511,202 | ||||||
|
| |||||||
| $ | 1,593,257 | |||||||
|
| |||||||
| Containers – 0.4% | ||||||||
| Lock & Lock Co. Ltd. | 14,494 | $ | 195,822 | |||||
|
| |||||||
| Electrical Equipment – 2.3% | ||||||||
| Bharat Heavy Electricals Ltd. | 334,655 | $ | 354,641 | |||||
| LS Industrial Systems Co. Ltd. | 15,847 | 693,088 | ||||||
|
| |||||||
| $ | 1,047,729 | |||||||
|
| |||||||
| Electronics – 11.2% | ||||||||
| Samsung Electronics Co. Ltd. | 53,683 | $ | 2,185,165 | |||||
| Silicon Motion Technology Corp., ADR | 12,323 | 546,895 | ||||||
| Taiwan Semiconductor Manufacturing Co. Ltd. | 320,258 | 2,464,356 | ||||||
|
| |||||||
| $ | 5,196,416 | |||||||
|
| |||||||
| Issuer | Shares/Par | Value ($) | ||||||
| COMMON STOCKS – continued |
| |||||||
| Energy – Integrated – 3.3% | ||||||||
| LUKOIL PJSC, ADR | 12,100 | $ | 1,021,482 | |||||
| Petroleo Brasileiro S.A., ADR | 33,245 | 517,625 | ||||||
|
| |||||||
| $ | 1,539,107 | |||||||
|
| |||||||
| Food & Beverages – 4.6% | ||||||||
| AVI Ltd. | 76,173 | $ | 494,084 | |||||
| BRF S.A. (a) | 17,854 | 137,254 | ||||||
| Fomento Economico Mexicano S.A.B. de C.V., ADR | 1,532 | 148,221 | ||||||
| Orion Corp. | 7,629 | 611,166 | ||||||
| Tingyi (Cayman Islands) Holding Corp. | 438,000 | 731,149 | ||||||
|
| |||||||
| $ | 2,121,874 | |||||||
|
| |||||||
| Food & Drug Stores – 0.6% | ||||||||
| Dairy Farm International Holdings Ltd. | 39,400 | $ | 281,710 | |||||
|
| |||||||
| Forest & Paper Products – 0.8% | ||||||||
| Suzano S.A. | 41,100 | $ | 351,602 | |||||
|
| |||||||
| Gaming & Lodging – 1.5% | ||||||||
| Genting Berhad | 419,400 | $ | 687,075 | |||||
|
| |||||||
| General Merchandise – 0.7% | ||||||||
| S.A.C.I. Falabella | �� | 22,544 | $ | 147,213 | ||||
| Walmart de Mexico S.A.B. de C.V. | 67,844 | 185,218 | ||||||
|
| |||||||
| $ | 332,431 | |||||||
|
| |||||||
| Insurance – 3.0% | ||||||||
| AIA Group Ltd. | 108,800 | $ | 1,173,419 | |||||
| Samsung Fire & Marine Insurance Co. Ltd. | 915 | 212,376 | ||||||
|
| |||||||
| $ | 1,385,795 | |||||||
|
| |||||||
| Internet – 11.3% | ||||||||
| Alibaba Group Holding Ltd., ADR (a) | 8,375 | $ | 1,419,143 | |||||
| Baidu, Inc., ADR (a) | 7,755 | 910,127 | ||||||
| NAVER Corp. | 7,613 | 751,641 | ||||||
| Tencent Holdings Ltd. | 47,700 | 2,153,055 | ||||||
|
| |||||||
| $ | 5,233,966 | |||||||
|
| |||||||
| Machinery & Tools – 3.6% | ||||||||
| Doosan Bobcat, Inc. | 22,679 | $ | 714,949 | |||||
| Haitian International Holdings Ltd. | 246,000 | 510,788 | ||||||
| PT United Tractors Tbk | 234,400 | 467,887 | ||||||
|
| |||||||
| $ | 1,693,624 | |||||||
|
| |||||||
| Major Banks – 7.0% | ||||||||
| ABSA Group Ltd. | 75,553 | $ | 944,077 | |||||
| Banco Bradesco S.A., ADR | 107,166 | 1,052,370 | ||||||
| China Construction Bank | 1,057,670 | 911,213 | ||||||
| Industrial & Commercial Bank of China, “H” | 310,000 | 226,199 | ||||||
| Nova Ljubljanska Banka d.d., GDR (z) | 10,663 | 140,649 | ||||||
|
| |||||||
| $ | 3,274,508 | |||||||
|
| |||||||
| Metals & Mining – 1.1% | ||||||||
| Vale S.A., ADR (a) | 36,819 | $ | 494,847 | |||||
|
| |||||||
4
Table of Contents
MFS Emerging Markets Equity Portfolio
Portfolio of Investments (unaudited) – continued
| Issuer | Shares/Par | Value ($) | ||||||
| COMMON STOCKS – continued |
| |||||||
| Network & Telecom – 1.3% | ||||||||
| VTech Holdings Ltd. | 69,700 | $ | 623,684 | |||||
|
| |||||||
| Oil Services – 0.3% |
| |||||||
| Lamprell PLC (a) | 199,974 | $ | 160,501 | |||||
|
| |||||||
| Other Banks & Diversified Financials – 15.6% |
| |||||||
| Abu Dhabi Commercial Bank | 103,835 | $ | 236,608 | |||||
| Banco Macro S.A., ADR | 2,909 | 211,921 | ||||||
| Bancolombia S.A., ADR | 4,041 | 206,253 | ||||||
| Credicorp Ltd. | 1,329 | 304,221 | ||||||
| E.Sun Financial Holding Co. Ltd. | 691,714 | 579,036 | ||||||
| Grupo Financiero Inbursa S.A. de C.V. | 284,689 | 411,747 | ||||||
| Housing Development Finance Corp. Ltd. | 50,492 | 1,603,470 | ||||||
| Kasikornbank Co. Ltd. | 98,500 | 608,649 | ||||||
| Komercni Banka A.S. | 10,612 | 422,850 | ||||||
| Metropolitan Bank & Trust Co. | 500,936 | 696,627 | ||||||
| Public Bank Berhad | 96,500 | 537,084 | ||||||
| Sberbank of Russia | 220,490 | 831,768 | ||||||
| Shriram Transport Finance Co. Ltd. | 37,757 | 590,990 | ||||||
|
| |||||||
| $ | 7,241,224 | |||||||
|
| |||||||
| Pharmaceuticals – 0.7% |
| |||||||
| Genomma Lab Internacional S.A., “B” (a) | 376,561 | $ | 341,762 | |||||
|
| |||||||
| Real Estate – 2.0% |
| |||||||
| Aldar Properties PJSC | 337,360 | $ | 173,587 | |||||
| Hang Lung Properties Ltd. | 230,000 | 547,051 | ||||||
| Multiplan Empreendimentos Imobiliarios S.A. | 29,450 | 212,902 | ||||||
|
| |||||||
| $ | 933,540 | |||||||
|
| |||||||
| Restaurants – 2.8% |
| |||||||
| Yum China Holdings, Inc. | 27,971 | $ | 1,292,260 | |||||
|
| |||||||
| Specialty Chemicals – 1.0% |
| |||||||
| Astra Argo Lestari | 208,100 | $ | 153,194 | |||||
| PTT Global Chemical PLC | 156,000 | 325,556 | ||||||
|
| |||||||
| $ | 478,750 | |||||||
|
| |||||||
| Issuer | Shares/Par | Value ($) | ||||||
| COMMON STOCKS – continued |
| |||||||
| Specialty Stores – 0.6% | ||||||||
| Dufry AG | 3,128 | $ | 264,928 | |||||
|
| |||||||
| Telecommunications – Wireless – 0.6% |
| |||||||
| Mobile TeleSystems PJSC, ADR | 31,191 | $ | 290,388 | |||||
|
| |||||||
| Telephone Services – 3.5% |
| |||||||
| Hellenic Telecommunications Organization S.A. | 28,575 | �� | $ | 422,404 | ||||
| Naspers Ltd. | 3,512 | 852,634 | ||||||
| PT XL Axiata Tbk (a) | 1,628,800 | 343,573 | ||||||
|
| |||||||
| $ | 1,618,611 | |||||||
|
| |||||||
| Tobacco – 0.5% |
| |||||||
| PT Hanjaya Mandala Sampoerna Tbk | 984,250 | $ | 218,761 | |||||
|
| |||||||
| Trucking – 0.0% |
| |||||||
| Imperial Logistics Ltd | 6,559 | $ | 23,950 | |||||
|
| |||||||
| Utilities – Electric Power – 1.2% |
| |||||||
| CESC Ltd. | 50,106 | $ | 569,311 | |||||
|
| |||||||
| Total Common Stocks (Identified Cost, $32,916,776) | $ | 45,943,530 | ||||||
|
| |||||||
| INVESTMENT COMPANIES (h) – 1.0% |
| |||||||
| Money Market Funds – 1.0% |
| |||||||
| MFS Institutional Money Market Portfolio, 2.42% (v) (Identified Cost, $448,401) | 448,378 | $ | 448,423 | |||||
|
| |||||||
| OTHER ASSETS, LESS LIABILITIES – 0.1% | 51,290 | |||||||
|
| |||||||
| NET ASSETS – 100.0% | $ | 46,443,243 | ||||||
|
| |||||||
| (a) | Non-income producing security. |
| (h) | An affiliated issuer, which may be considered one in which the fund owns 5% or more of the outstanding voting securities, or a company which is under common control. At period end, the aggregate values of the fund’s investments in affiliated issuers and in unaffiliated issuers were $448,423 and $45,943,530, respectively. |
| (v) | Affiliated issuer that is available only to investment companies managed by MFS. The rate quoted for the MFS Institutional Money Market Portfolio is the annualizedseven-day yield of the fund at period end. |
| (z) | Restricted securities are not registered under the Securities Act of 1933 and are subject to legal restrictions on resale. These securities generally may be resold in transactions exempt from registration or to the public if the securities are subsequently registered. Disposal of these securities may involve time-consuming negotiations and prompt sale at an acceptable price may be difficult. The fund holds the following restricted securities: |
| Restricted Securities | Acquisition Date | Cost | Value | |||||||
| Nova Ljubljanska Banka d.d., GDR | 11/09/18 | $124,519 | $140,649 | |||||||
| % of Net assets | 0.3% | |||||||||
The following abbreviations are used in this report and are defined:
| ADR | American Depositary Receipt |
| GDR | Global Depositary Receipt |
See Notes to Financial Statements
5
Table of Contents
MFS Emerging Markets Equity Portfolio
FINANCIAL STATEMENTS | STATEMENT OF ASSETS AND LIABILITIES (unaudited)
This statement represents your fund’s balance sheet, which details the assets and liabilities comprising the total value of the fund.
At 6/30/19 | ||||
Assets | ||||
Investments in unaffiliated issuers, at value (identified cost, $32,916,776) | $45,943,530 | |||
Investments in affiliated issuers, at value (identified cost, $448,401) | 448,423 | |||
Foreign currency, at value (identified cost, $19,675) | 19,708 | |||
Receivables for | ||||
Investments sold | 28,469 | |||
Fund shares sold | 281 | |||
Dividends | 169,806 | |||
Receivable from investment adviser | 1,667 | |||
Other assets | 324 | |||
Total assets | $46,612,208 | |||
Liabilities | ||||
Payables for | ||||
Fund shares reacquired | $21,996 | |||
Payable to affiliates | ||||
Administrative services fee | 192 | |||
Shareholder servicing costs | 28 | |||
Distribution and/or service fees | 698 | |||
Payable for independent Trustees’ compensation | 174 | |||
Deferred country tax expense payable | 29,334 | |||
Accrued expenses and other liabilities | 116,543 | |||
Total liabilities | $168,965 | |||
Net assets | $46,443,243 | |||
Net assets consist of | ||||
Paid-in capital | $31,188,112 | |||
Total distributable earnings (loss) | 15,255,131 | |||
Net assets | $46,443,243 | |||
Shares of beneficial interest outstanding | 2,816,685 | |||
| Net assets | Shares outstanding | Net asset value per share | ||||||||||
Initial Class | $20,927,657 | 1,257,813 | $16.64 | |||||||||
Service Class | 25,515,586 | 1,558,872 | 16.37 | |||||||||
See Notes to Financial Statements
6
Table of Contents
MFS Emerging Markets Equity Portfolio
FINANCIAL STATEMENTS | STATEMENT OF OPERATIONS (unaudited)
This statement describes how much your fund earned in investment income and accrued in expenses. It also describes any gains and/or losses generated by fund operations.
Six months ended 6/30/19 | ||||
Net investment income (loss) | ||||
Income | ||||
Dividends | $639,645 | |||
Dividends from affiliated issuers | 6,772 | |||
Other | 2,767 | |||
Interest | 1,162 | |||
Income on securities loaned | 17 | |||
Foreign taxes withheld | (66,403 | ) | ||
Total investment income | $583,960 | |||
Expenses | ||||
Management fee | $245,302 | |||
Distribution and/or service fees | 31,063 | |||
Shareholder servicing costs | 2,162 | |||
Administrative services fee | 8,679 | |||
Independent Trustees’ compensation | 956 | |||
Custodian fee | 62,687 | |||
Shareholder communications | 5,636 | |||
Audit and tax fees | 35,260 | |||
Legal fees | 305 | |||
Miscellaneous | 12,201 | |||
Total expenses | $404,251 | |||
Reduction of expenses by investment adviser | (62,221 | ) | ||
Net expenses | $342,030 | |||
Net investment income (loss) | $241,930 | |||
Realized and unrealized gain (loss) | ||||
Realized gain (loss) (identified cost basis) | ||||
Unaffiliated issuers (net of $844 country tax) | $1,210,747 | |||
Affiliated issuers | (53 | ) | ||
Foreign currency | (5,830 | ) | ||
Net realized gain (loss) | $1,204,864 | |||
Change in unrealized appreciation or depreciation | ||||
Unaffiliated issuers (net of $3,894 increase in deferred country tax) | $4,132,024 | |||
Affiliated issuers | 23 | |||
Translation of assets and liabilities in foreign currencies | 479 | |||
Net unrealized gain (loss) | $4,132,526 | |||
Net realized and unrealized gain (loss) | $5,337,390 | |||
Change in net assets from operations | $5,579,320 | |||
See Notes to Financial Statements
7
Table of Contents
MFS Emerging Markets Equity Portfolio
FINANCIAL STATEMENTS | STATEMENTS OF CHANGES IN NET ASSETS
These statements describe the increases and/or decreases in net assets resulting from operations, any distributions, and any shareholder transactions.
| Six months ended 6/30/19 | Year ended 12/31/18 | |||||||
| (unaudited) | ||||||||
Change in net assets | ||||||||
From operations | ||||||||
Net investment income (loss) | $241,930 | $276,402 | ||||||
Net realized gain (loss) | 1,204,864 | 2,579,877 | ||||||
Net unrealized gain (loss) | 4,132,526 | (10,326,119 | ) | |||||
Change in net assets from operations | $5,579,320 | $(7,469,840 | ) | |||||
Total distributions to shareholders | $— | $(118,016 | ) | |||||
Change in net assets from fund share transactions | $(3,996,526 | ) | $(5,242,859 | ) | ||||
Total change in net assets | $1,582,794 | $(12,830,715 | ) | |||||
Net assets | ||||||||
At beginning of period | 44,860,449 | 57,691,164 | ||||||
At end of period | $46,443,243 | $44,860,449 | ||||||
See Notes to Financial Statements
8
Table of Contents
MFS Emerging Markets Equity Portfolio
FINANCIAL STATEMENTS | FINANCIAL HIGHLIGHTS
The financial highlights table is intended to help you understand the fund’s financial performance for the semiannual period and the past 5 fiscal years. Certain information reflects financial results for a single fund share. The total returns in the table represent the rate that an investor would have earned (or lost) on an investment in the fund share class (assuming reinvestment of all distributions) held for the entire period.
| Initial Class | Six months 6/30/19 | Year ended | ||||||||||||||||||||||
| 12/31/18 | 12/31/17 | 12/31/16 | 12/31/15 | 12/31/14 | ||||||||||||||||||||
| (unaudited) | ||||||||||||||||||||||||
Net asset value, beginning of period | $14.75 | $17.19 | $12.59 | $11.59 | $13.46 | $14.51 | ||||||||||||||||||
| Income (loss) from investment operations | ||||||||||||||||||||||||
Net investment income (loss) (d) | $0.09 | $0.11 | $0.06 | $0.15 | (c) | $0.10 | $0.13 | |||||||||||||||||
Net realized and unrealized gain (loss) | 1.80 | (2.49 | ) | 4.71 | 0.93 | (1.84 | ) | (1.08 | ) | |||||||||||||||
Total from investment operations | $1.89 | $(2.38 | ) | $4.77 | $1.08 | $(1.74 | ) | $(0.95 | ) | |||||||||||||||
| Less distributions declared to shareholders | ||||||||||||||||||||||||
From net investment income | $— | $(0.06 | ) | $(0.17 | ) | $(0.08 | ) | $(0.13 | ) | $(0.10 | ) | |||||||||||||
Net asset value, end of period (x) | $16.64 | $14.75 | $17.19 | $12.59 | $11.59 | $13.46 | ||||||||||||||||||
Total return (%) (k)(r)(s)(x) | 12.81 | (n) | (13.89 | ) | 37.98 | 9.28 | (c) | (12.89 | ) | (6.66 | ) | |||||||||||||
| Ratios (%) (to average net assets) and Supplemental data: | ||||||||||||||||||||||||
Expenses before expense reductions (f) | 1.60 | (a) | 1.50 | 1.53 | 1.34 | (c) | 1.65 | 1.48 | ||||||||||||||||
Expenses after expense reductions (f) | 1.33 | (a) | 1.37 | 1.40 | 1.13 | (c) | 1.40 | 1.40 | ||||||||||||||||
Net investment income (loss) | 1.17 | (a)(l) | 0.65 | 0.41 | 1.29 | (c) | 0.74 | 0.89 | ||||||||||||||||
Portfolio turnover | 11 | (n) | 31 | 27 | 47 | 51 | 49 | |||||||||||||||||
Net assets at end of period (000 omitted) | $20,928 | $20,887 | $28,026 | $22,605 | $25,665 | $33,752 | ||||||||||||||||||
| Service Class | Six months 6/30/19 | Year ended | ||||||||||||||||||||||
| 12/31/18 | 12/31/17 | 12/31/16 | 12/31/15 | 12/31/14 | ||||||||||||||||||||
| (unaudited) | ||||||||||||||||||||||||
Net asset value, beginning of period | $14.53 | $16.94 | $12.41 | $11.42 | $13.24 | $14.29 | ||||||||||||||||||
| Income (loss) from investment operations | ||||||||||||||||||||||||
Net investment income (loss) (d) | $0.07 | $0.07 | $0.02 | $0.12 | (c) | $0.06 | $0.10 | |||||||||||||||||
Net realized and unrealized gain (loss) | 1.77 | (2.46 | ) | 4.64 | 0.91 | (1.80 | ) | (1.09 | ) | |||||||||||||||
Total from investment operations | $1.84 | $(2.39 | ) | $4.66 | $1.03 | $(1.74 | ) | $(0.99 | ) | |||||||||||||||
| Less distributions declared to shareholders | ||||||||||||||||||||||||
From net investment income | $— | $(0.02 | ) | $(0.13 | ) | $(0.04 | ) | $(0.08 | ) | $(0.06 | ) | |||||||||||||
Net asset value, end of period (x) | $16.37 | $14.53 | $16.94 | $12.41 | $11.42 | $13.24 | ||||||||||||||||||
Total return (%) (k)(r)(s)(x) | 12.66 | (n) | (14.13 | ) | 37.66 | 9.04 | (c) | (13.08 | ) | (6.99 | ) | |||||||||||||
| Ratios (%) (to average net assets) and Supplemental data: | ||||||||||||||||||||||||
Expenses before expense reductions (f) | 1.85 | (a) | 1.75 | 1.78 | 1.58 | (c) | 1.90 | 1.73 | ||||||||||||||||
Expenses after expense reductions (f) | 1.58 | (a) | 1.62 | 1.65 | 1.37 | (c) | 1.65 | 1.65 | ||||||||||||||||
Net investment income (loss) | 0.92 | (a)(l) | 0.40 | 0.16 | 1.02 | (c) | 0.46 | 0.70 | ||||||||||||||||
Portfolio turnover | 11 | (n) | 31 | 27 | 47 | 51 | 49 | |||||||||||||||||
Net assets at end of period (000 omitted) | $25,516 | $23,973 | $29,665 | $24,307 | $25,678 | $31,419 | ||||||||||||||||||
See Notes to Financial Statements
9
Table of Contents
MFS Emerging Markets Equity Portfolio
Financial Highlights – continued
| (a) | Annualized. |
| (c) | Amount reflects aone-time reimbursement of expenses by the custodian (or former custodian) without which net investment income and performance would be lower and expenses would be higher. |
| (d) | Per share data is based on average shares outstanding. |
| (f) | Ratios do not reflect reductions from fees paid indirectly, if applicable. |
| (k) | The total return does not reflect expenses that apply to separate accounts. Inclusion of these charges would reduce the total return figures for all periods shown. |
| (l) | Recognition of net investment income by the fund may be affected by the timing of the declaration of dividends by companies in which the fund invests and the actual annual net investment income ratio may differ. |
| (n) | Not annualized. |
| (r) | Certain expenses have been reduced without which performance would have been lower. |
| (s) | From time to time the fund may receive proceeds from litigation settlements, without which performance would be lower. |
| (x) | The net asset values and total returns have been calculated on net assets which include adjustments made in accordance with U.S. generally accepted accounting principles required at period end for financial reporting purposes. |
See Notes to Financial Statements
10
Table of Contents
MFS Emerging Markets Equity Portfolio
NOTES TO FINANCIAL STATEMENTS (unaudited)
| (1) | Business and Organization |
MFS Emerging Markets Equity Portfolio (the fund) is a diversified series of MFS Variable Insurance Trust II (the trust). The trust is organized as a Massachusetts business trust and is registered under the Investment Company Act of 1940, as amended, as anopen-end management investment company. The shareholders of each series of the trust are separate accounts of insurance companies, which offer variable annuity and/or life insurance products, and qualified retirement and pension plans.
The fund is an investment company and accordingly follows the investment company accounting and reporting guidance of the Financial Accounting Standards Board (FASB) Accounting Standards Codification Topic 946 Financial Services – Investment Companies.
| (2) | Significant Accounting Policies |
General– The preparation of financial statements in conformity with U.S. generally accepted accounting principles requires management to make estimates and assumptions that affect the reported amounts of assets and liabilities, and disclosure of contingent assets and liabilities at the date of the financial statements and the reported amounts of increases and decreases in net assets from operations during the reporting period. Actual results could differ from those estimates. In the preparation of these financial statements, management has evaluated subsequent events occurring after the date of the fund’s Statement of Assets and Liabilities through the date that the financial statements were issued. The fund invests in foreign securities, including securities of emerging market issuers. Investments in foreign securities are vulnerable to the effects of changes in the relative values of the local currency and the U.S. dollar and to the effects of changes in each country’s market, economic, industrial, political, regulatory, geopolitical, and other conditions. Investments in emerging markets can involve additional and greater risks than the risks associated with investments in developed foreign markets. Emerging markets can have less developed markets, greater custody and operational risk, less developed legal, regulatory, and accounting systems, and greater political, social, and economic instability than developed markets.
Balance Sheet Offsetting– The fund’s accounting policy with respect to balance sheet offsetting is that, absent an event of default by the counterparty or a termination of the agreement, the International Swaps and Derivatives Association (ISDA) Master Agreement, or similar agreement, does not result in an offset of reported amounts of financial assets and financial liabilities in the Statement of Assets and Liabilities across transactions between the fund and the applicable counterparty. The fund’s right to setoff may be restricted or prohibited by the bankruptcy or insolvency laws of the particular jurisdiction to which a specific master netting agreement counterparty is subject. Balance sheet offsetting disclosures, to the extent applicable to the fund, have been included in the fund’s Significant Accounting Policies note under the captions for each of the fund’sin-scope financial instruments and transactions.
Investment Valuations– Equity securities, including restricted equity securities, are generally valued at the last sale or official closing price on their primary market or exchange as provided by a third-party pricing service. Equity securities, for which there were no sales reported that day, are generally valued at the last quoted daily bid quotation on their primary market or exchange as provided by a third-party pricing service. Short-term instruments with a maturity at issuance of 60 days or less may be valued at amortized cost, which approximates market value.Open-end investment companies are generally valued at net asset value per share. Securities and other assets generally valued on the basis of information from a third-party pricing service may also be valued at a broker/dealer bid quotation. In determining values, third-party pricing services can utilize both transaction data and market information such as yield, quality, coupon rate, maturity, type of issue, trading characteristics, and other market data. The values of foreign securities and other assets and liabilities expressed in foreign currencies are converted to U.S. dollars using the mean of bid and asked prices for rates provided by a third-party pricing service.
The Board of Trustees has delegated primary responsibility for determining or causing to be determined the value of the fund’s investments (including any fair valuation) to the adviser pursuant to valuation policies and procedures approved by the Board. If the adviser determines that reliable market quotations are not readily available, investments are valued at fair value as determined in good faith by the adviser in accordance with such procedures under the oversight of the Board of Trustees. Under the fund’s valuation policies and procedures, market quotations are not considered to be readily available for most types of debt instruments and floating rate loans and many types of derivatives. These investments are generally valued at fair value based on information from third-party pricing services. In addition, investments may be valued at fair value if the adviser determines that an investment’s value has been materially affected by events occurring after the close of the exchange or market on which the investment is principally traded (such as foreign exchange or market) and prior to the determination of the fund’s net asset value, or after the halt of trading of a specific security where trading does not resume prior to the close of the exchange or market on which the security is principally traded. Events that occur after foreign markets close (such as developments in foreign markets and significant movements in the U.S. markets) and prior to the determination of the fund’s net asset value may be deemed to have a material effect on the value of securities traded in foreign markets. Accordingly, the fund’s foreign equity securities may often be valued at fair value. The adviser generally relies on third-party pricing services or other information (such as the correlation with price movements of similar securities
in the same or other markets; the type, cost and investment characteristics of the security; the business and financial condition of the
11
Table of Contents
MFS Emerging Markets Equity Portfolio
Notes to Financial Statements (unaudited) – continued
issuer; and trading and other market data) to assist in determining whether to fair value and at what value to fair value an investment. The value of an investment for purposes of calculating the fund’s net asset value can differ depending on the source and method used to determine value. When fair valuation is used, the value of an investment used to determine the fund’s net asset value may differ from quoted or published prices for the same investment. There can be no assurance that the fund could obtain the fair value assigned to an investment if it were to sell the investment at the same time at which the fund determines its net asset value per share.
Various inputs are used in determining the value of the fund’s assets or liabilities. These inputs are categorized into three broad levels. In certain cases, the inputs used to measure fair value may fall into different levels of the fair value hierarchy. In such cases, an investment’s level within the fair value hierarchy is based on the lowest level of input that is significant to the fair value measurement. The fund’s assessment of the significance of a particular input to the fair value measurement in its entirety requires judgment, and considers factors specific to the investment. Level 1 includes unadjusted quoted prices in active markets for identical assets or liabilities. Level 2 includes other significant observable market-based inputs (including quoted prices for similar securities, interest rates, prepayment speed, and credit risk). Level 3 includes unobservable inputs, which may include the adviser’s own assumptions in determining the fair value of investments. The following is a summary of the levels used as of June 30, 2019 in valuing the fund’s assets or liabilities:
| Financial Instruments | Level 1 | Level 2 | Level 3 | Total | ||||||||||||
| Equity Securities: | ||||||||||||||||
China | $10,605,306 | $— | $— | $10,605,306 | ||||||||||||
South Korea | 5,364,206 | — | — | 5,364,206 | ||||||||||||
Brazil | 4,419,998 | — | — | 4,419,998 | ||||||||||||
India | 4,334,201 | — | — | 4,334,201 | ||||||||||||
Hong Kong | 3,629,781 | — | — | 3,629,781 | ||||||||||||
Taiwan | 3,590,286 | — | — | 3,590,286 | ||||||||||||
South Africa | 2,393,974 | — | — | 2,393,974 | ||||||||||||
Indonesia | 2,155,040 | — | — | 2,155,040 | ||||||||||||
Russia | 1,311,870 | 831,768 | — | 2,143,638 | ||||||||||||
Other Countries | 6,840,895 | 466,205 | — | 7,307,100 | ||||||||||||
| Mutual Funds | 448,423 | — | — | 448,423 | ||||||||||||
| Total | $45,093,980 | $1,297,973 | $— | $46,391,953 | ||||||||||||
For further information regarding security characteristics, see the Portfolio of Investments.
Foreign Currency Translation– Purchases and sales of foreign investments, income, and expenses are converted into U.S. dollars based upon currency exchange rates prevailing on the respective dates of such transactions or on the reporting date for foreign denominated receivables and payables. Gains and losses attributable to foreign currency exchange rates on sales of securities are recorded for financial statement purposes as net realized gains and losses on investments. Gains and losses attributable to foreign exchange rate movements on receivables, payables, income and expenses are recorded for financial statement purposes as foreign currency transaction gains and losses. That portion of both realized and unrealized gains and losses on investments that results from fluctuations in foreign currency exchange rates is not separately disclosed.
Security Loans– Under its Securities Lending Agency Agreement with the fund, State Street Bank and Trust Company, as lending agent, loans the securities of the fund to certain qualified institutions (the “Borrowers”) approved by the fund. Security loans can be terminated at the discretion of either the lending agent or the fund and the related securities must be returned within the earlier of the standard trade settlement period for such securities or within three business days. The loans are collateralized by cash and/or U.S. Treasury and federal agency obligations in an amount typically at least equal to the market value of the securities loaned. On loans collateralized by cash, the cash collateral is invested in a money market fund. The market value of the loaned securities is determined at the close of business of the fund and any additional required collateral is delivered to the fund on the next business day. The lending agent provides the fund with indemnification against Borrower default. In the event of Borrower default, the lending agent will, for the benefit of the fund, either purchase securities identical to those loaned or, when such purchase is commercially impracticable, pay the fund the market value of the loaned securities. In return, the lending agent assumes the fund’s rights to the related collateral. If the collateral value is less than the cost to purchase identical securities, the lending agent is responsible for the shortfall, but only to the extent that such shortfall is not due to a decline in collateral value resulting from collateral reinvestment for which the fund bears the risk of loss. A portion of the income generated upon investment of the collateral is remitted to the Borrowers, and the remainder is allocated between the fund and the lending agent. On loans collateralized by U.S. Treasury and/or federal agency obligations, a fee is received from the Borrower, and is allocated between the fund and the lending agent. Income from securities lending is separately reported in the Statement of Operations. The dividend and interest income earned on the securities loaned is accounted for in the same manner as other dividend and interest income. At June 30, 2019, there were no securities on loan or collateral outstanding.
12
Table of Contents
MFS Emerging Markets Equity Portfolio
Notes to Financial Statements (unaudited) – continued
Indemnifications– Under the fund’s organizational documents, its officers and Trustees may be indemnified against certain liabilities and expenses arising out of the performance of their duties to the fund. Additionally, in the normal course of business, the fund enters into agreements with service providers that may contain indemnification clauses. The fund’s maximum exposure under these agreements is unknown as this would involve future claims that may be made against the fund that have not yet occurred.
Investment Transactions and Income– Investment transactions are recorded on the trade date. Interest income is recorded on the accrual basis. Dividends received in cash are recorded on theex-dividend date. Certain dividends from foreign securities will be recorded when the fund is informed of the dividend if such information is obtained subsequent to theex-dividend date. Dividend and interest payments received in additional securities are recorded on theex-dividend orex-interest date in an amount equal to the value of the security on such date.
The fund may receive proceeds from litigation settlements. Any proceeds received from litigation involving portfolio holdings are reflected in the Statement of Operations in realized gain/loss if the security has been disposed of by the fund or in unrealized gain/loss if the security is still held by the fund. Any other proceeds from litigation not related to portfolio holdings are reflected as other income in the Statement of Operations.
Tax Matters and Distributions– The fund intends to qualify as a regulated investment company, as defined under Subchapter M of the Internal Revenue Code, and to distribute all of its taxable income, including realized capital gains. As a result, no provision for federal income tax is required. The fund’s federal tax returns, when filed, will remain subject to examination by the Internal Revenue Service for a three year period. Management has analyzed the fund’s tax positions taken on federal and state tax returns for all open tax years and does not believe that there are any uncertain tax positions that require recognition of a tax liability. Foreign taxes, if any, have been accrued by the fund in the accompanying financial statements in accordance with the applicable foreign tax law. Foreign income taxes may be withheld by certain countries in which the fund invests. Additionally, capital gains realized by the fund on securities issued in or by certain foreign countries may be subject to capital gains tax imposed by those countries.
Distributions to shareholders are recorded on theex-dividend date. Income and capital gain distributions are determined in accordance with income tax regulations, which may differ from U.S. generally accepted accounting principles. Certain capital accounts in the financial statements are periodically adjusted for permanent differences in order to reflect their tax character. These adjustments have no impact on net assets or net asset value per share. Temporary differences which arise from recognizing certain items of income, expense, gain or loss in different periods for financial statement and tax purposes will reverse at some time in the future. Distributions in excess of net investment income or net realized gains are temporary overdistributions for financial statement purposes resulting from differences in the recognition or classification of income or distributions for financial statement and tax purposes.
Book/tax differences primarily relate to wash sale loss deferrals and foreign taxes.
The tax character of distributions declared to shareholders for the last fiscal year is as follows:
| Year ended 12/31/18 | ||||
| Ordinary income (including any short-term capital gains) | $118,016 | |||
The federal tax cost and the tax basis components of distributable earnings were as follows:
| As of 6/30/19 | ||||
| Cost of investments | $34,208,315 | |||
| Gross appreciation | 13,757,277 | |||
| Gross depreciation | (1,573,639 | ) | ||
| Net unrealized appreciation (depreciation) | $12,183,638 | |||
| As of 12/31/18 | ||||
| Undistributed ordinary income | 230,717 | |||
| Undistributed long-term capital gain | 1,420,887 | |||
| Other temporary differences | (23,490 | ) | ||
| Net unrealized appreciation (depreciation) | 8,047,697 | |||
The aggregate cost above includes prior fiscal year end tax adjustments, if applicable.
Multiple Classes of Shares of Beneficial Interest– The fund offers multiple classes of shares, which differ in their respective distribution and/or service fees. The fund’s income, realized and unrealized gain (loss), and common expenses are allocated to shareholders based on the daily net assets of each class. Dividends are declared separately for each class. Differences in per share
13
Table of Contents
MFS Emerging Markets Equity Portfolio
Notes to Financial Statements (unaudited) – continued
dividend rates are generally due to differences in separate class expenses. The fund’s distributions declared to shareholders as reported in the Statements of Changes in Net Assets are presented by class as follows:
| From net investment income | ||||||||
| Six months ended 6/30/19 | Year ended 12/31/18 | |||||||
| Initial Class | $— | $87,265 | ||||||
| Service Class | — | 30,751 | ||||||
| Total | $— | $118,016 | ||||||
| (3) | Transactions with Affiliates |
Investment Adviser– The fund has an investment advisory agreement with MFS to provide overall investment management and related administrative services and facilities to the fund. The management fee is computed daily and paid monthly at the following annual rates based on the fund’s average daily net assets:
| Up to $500 million | 1.05% | |||
| In excess of $500 million | 1.00% |
MFS has agreed in writing to reduce its management fee by a specified amount if certain MFS mutual fund assets exceed thresholds agreed to by MFS and the fund’s Board of Trustees. For the six months ended June 30, 2019, this management fee reduction amounted to $2,258, which is included in the reduction of total expenses in the Statement of Operations. The management fee incurred for the six months ended June 30, 2019 was equivalent to an annual effective rate of 1.04% of the fund’s average daily net assets.
The investment adviser has agreed in writing to pay a portion of the fund’s total annual operating expenses, excluding interest, taxes, extraordinary expenses, brokerage and transaction costs, and investment-related expenses, such that total annual operating expenses do not exceed 1.33% of average daily net assets for the Initial Class shares and 1.58% of average daily net assets for the Service Class shares. This written agreement will terminate on July 31, 2019. For the six months ended June 30, 2019, this reduction amounted to $59,963, which is included in the reduction of total expenses in the Statement of Operations. Effective August 1, 2019, the investment adviser has agreed in writing to pay a portion of the fund’s total annual operating expenses, excluding interest, taxes, extraordinary expenses, brokerage and transaction costs, and investment-related expenses, such that total annual operating expenses do not exceed 1.23% of average daily net assets for the Initial Class shares and 1.48% of average daily net assets for the Service Class shares. This written agreement will continue until modified by the fund’s Board of Trustees, but such agreement will continue at least until April 30, 2021.
Distributor– MFS Fund Distributors, Inc. (MFD), a wholly-owned subsidiary of MFS, is the distributor of shares of the fund. The Trustees have adopted a distribution plan for the Service Class shares pursuant to Rule12b-1 under the Investment Company Act of 1940.
The fund’s distribution plan provides that the fund will pay MFD distribution and/or service fees equal to 0.25% per annum of its average daily net assets attributable to Service Class shares as partial consideration for services performed and expenses incurred by MFD and financial intermediaries (including participating insurance companies that invest in the fund to fund variable annuity and variable life insurance contracts, sponsors of qualified retirement and pension plans that invest in the fund, and affiliates of these participating insurance companies and plan sponsors) in connection with the sale and distribution of the Service Class shares. MFD may subsequently pay all, or a portion, of the distribution and/or service fees to financial intermediaries.
Shareholder Servicing Agent– MFS Service Center, Inc. (MFSC), a wholly-owned subsidiary of MFS, receives a fee from the fund for its services as shareholder servicing agent. For the six months ended June 30, 2019, the fee was $2,055, which equated to 0.0088% annually of the fund’s average daily net assets. MFSC also receives payment from the fund forout-of-pocket expenses paid by MFSC on behalf of the fund. For the six months ended June 30, 2019, these costs amounted to $107.
Administrator– MFS provides certain financial, legal, shareholder communications, compliance, and other administrative services to the fund. Under an administrative services agreement, the fund reimburses MFS the costs incurred to provide these services. The fund is charged an annual fixed amount of $17,500 plus a fee based on average daily net assets. The administrative services fee incurred for the six months ended June 30, 2019 was equivalent to an annual effective rate of 0.0371% of the fund’s average daily net assets.
Trustees’ and Officers’ Compensation– The fund pays compensation to independent Trustees in the form of a retainer, attendance fees, and additional compensation to Board and Committee chairpersons. The fund does not pay compensation directly to Trustees or officers of the fund who are also officers of the investment adviser, all of whom receive remuneration from MFS for their services to the fund. Certain officers and Trustees of the fund are officers or directors of MFS, MFD, and MFSC.
14
Table of Contents
MFS Emerging Markets Equity Portfolio
Notes to Financial Statements (unaudited) – continued
Other– This fund and certain other funds managed by MFS (the funds) had entered into a service agreement (the ISO Agreement) which provided for payment of fees solely by the funds to Tarantino LLC in return for the provision of services of an Independent Senior Officer (ISO) for the funds. Frank L. Tarantino served as the ISO and was an officer of the funds and the sole member of Tarantino LLC. Effective June 30, 2019, Mr. Tarantino retired from his position as ISO for the funds, and the ISO Agreement was terminated. For the six months ended June 30, 2019, the fee paid by the fund under this agreement was $55 and is included in “Miscellaneous” expense in the Statement of Operations. MFS had agreed to bear all expenses associated with office space, other administrative support, and supplies provided to the ISO.
The fund invests in the MFS Institutional Money Market Portfolio which is managed by MFS and seeks current income consistent with preservation of capital and liquidity. This money market fund does not pay a management fee to MFS.
The fund is permitted to engage in purchase and sale transactions with funds and accounts for which MFS serves as investment adviser orsub-adviser (“cross-trades”) pursuant to a policy adopted by the Board of Trustees. This policy has been designed to ensure that cross-trades conducted by the fund comply with Rule17a-7 under the Investment Company Act of 1940. During the six months ended June 30, 2019, the fund engaged in purchase and sale transactions pursuant to this policy, which amounted to $73,509 and $108,747, respectively. The sales transactions resulted in net realized gains (losses) of $12,709.
The adviser has voluntarily undertaken to reimburse the fund from its own resources on a quarterly basis for the cost of investment research embedded in the cost of the fund’s securities trades. This agreement may be rescinded at any time. For the six months ended June 30, 2019, this reimbursement amounted to $2,749, which is included in “Other” income in the Statement of Operations.
| (4) | Portfolio Securities |
For the six months ended June 30, 2019, purchases and sales of investments, other than short-term obligations, aggregated $5,288,496 and $9,280,105, respectively.
| (5) | Shares of Beneficial Interest |
The fund’s Declaration of Trust permits the Trustees to issue an unlimited number of full and fractional shares of beneficial interest. Transactions in fund shares were as follows:
| Six months ended 6/30/19 | Year ended 12/31/18 | |||||||||||||||
| Shares | Amount | Shares | Amount | |||||||||||||
| Shares sold | ||||||||||||||||
Initial Class | 30,748 | $503,953 | 59,189 | $1,002,780 | ||||||||||||
Service Class | 95,940 | 1,520,502 | 398,376 | 6,530,385 | ||||||||||||
| 126,688 | $2,024,455 | 457,565 | $7,533,165 | |||||||||||||
| Shares issued to shareholders in reinvestment of distributions | ||||||||||||||||
Initial Class | — | $— | 5,241 | $87,265 | ||||||||||||
Service Class | — | — | 1,874 | 30,751 | ||||||||||||
| — | $— | 7,115 | $118,016 | |||||||||||||
| Shares reacquired | ||||||||||||||||
Initial Class | (188,840 | ) | $(3,014,434 | ) | (278,563 | ) | $(4,678,515 | ) | ||||||||
Service Class | (187,031 | ) | (3,006,547 | ) | (501,945 | ) | (8,215,525 | ) | ||||||||
| (375,871 | ) | $(6,020,981 | ) | (780,508 | ) | $(12,894,040 | ) | |||||||||
| Net change | ||||||||||||||||
Initial Class | (158,092 | ) | $(2,510,481 | ) | (214,133 | ) | $(3,588,470 | ) | ||||||||
Service Class | (91,091 | ) | (1,486,045 | ) | (101,695 | ) | (1,654,389 | ) | ||||||||
| (249,183 | ) | $(3,996,526 | ) | (315,828 | ) | $(5,242,859 | ) | |||||||||
The fund is one of several mutual funds in which certain MFS funds may invest. The MFS funds do not invest in the underlying funds for the purpose of exercising management or control. At the end of the period, the MFS Growth Allocation Portfolio was the owner of record of approximately 8% of the value of outstanding voting shares of the fund.
| (6) | Line of Credit |
The fund and certain other funds managed by MFS participate in a $1.25 billion unsecured committed line of credit, subject to a $1 billion sublimit, provided by a syndicate of banks under a credit agreement. Borrowings may be made for temporary financing needs. Interest is charged to each fund, based on its borrowings, generally at a rate equal to the highest of one month LIBOR, the Federal Funds Effective Rate and the Overnight Bank Funding Rate, plus an agreed upon spread. A commitment fee, based on the average daily, unused portion of the committed line of credit, is allocated among the participating funds. In addition, the fund and other funds managed by MFS have established unsecured uncommitted borrowing arrangements with certain banks for temporary
15
Table of Contents
MFS Emerging Markets Equity Portfolio
Notes to Financial Statements (unaudited) – continued
financing needs. Interest is charged to each fund, based on its borrowings, at rates equal to customary reference rates plus an agreed upon spread. For the six months ended June 30, 2019, the fund’s commitment fee and interest expense were $141 and $0, respectively, and are included in “Miscellaneous” expense in the Statement of Operations.
| (7) | Investments in Affiliated Issuers |
An affiliated issuer may be considered one in which the fund owns 5% or more of the outstanding voting securities, or a company which is under common control. For the purposes of this report, the following were affiliated issuers:
| Affiliated Issuers | Beginning Value | Purchases | Sales Proceeds | Realized Gain (Loss) | Change in Unrealized Appreciation or Depreciation | Ending Value | ||||||||||||||||||
| MFS Institutional Money Market Portfolio | $364,115 | $5,864,553 | $5,780,215 | $(53 | ) | $23 | $448,423 | |||||||||||||||||
| Affiliated Issuers | Dividend Income | Capital Gain Distributions | ||||||||||||||||||||||
| MFS Institutional Money Market Portfolio |
| $6,772 | $— | |||||||||||||||||||||
16
Table of Contents
MFS Emerging Markets Equity Portfolio
PROXY VOTING POLICIES AND INFORMATION
MFS votes proxies on behalf of the fund pursuant to proxy voting policies and procedures that are available without charge, upon request, by calling 1-800-225-2606, by visitingmfs.com/proxyvoting, or by visiting the SEC’s Web site athttp://www.sec.gov.
Information regarding how the fund voted proxies relating to portfolio securities during the most recent twelve-month period ended June 30 is available by August 31 of each year without charge by visitingmfs.com/proxyvoting, or by visiting the SEC’s Web site athttp://www.sec.gov.
QUARTERLY PORTFOLIO DISCLOSURE
The fund files a complete schedule of portfolio holdings with the SEC for the first and third quarters of each fiscal year on Form N-Q or as an exhibit to its reports on Form N-PORT (for first and third fiscal quarters ending March 31, 2019 or after). The fund’sForm N-Q or Form N-PORT reports are available on the SEC’s website athttp://www.sec.gov.A shareholder can obtain the portfolio holdings report for the first and third quarters of the fund’s fiscal year atmfs.com/vit2 by choosing the fund’s name and then selecting the “Resources” tab and clicking on “Prospectus and Reports”.
From time to time, MFS may post important information about the fund or the MFS funds on the MFS web site (mfs.com). This information is available athttps://www.mfs.com/en-us/what-we-do/announcements.htmlor atmfs.com/vit2 by choosing the fund’s name.
INFORMATION ABOUT FUND CONTRACTS AND LEGAL CLAIMS
The fund has entered into contractual arrangements with an investment adviser, administrator, distributor, shareholder servicing agent, 529 program manager (if applicable), and custodian who each provide services to the fund. Unless expressly stated otherwise, shareholders are not parties to, or intended beneficiaries of these contractual arrangements, and these contractual arrangements are not intended to create any shareholder right to enforce them against the service providers or to seek any remedy under them against the service providers, either directly or on behalf of the fund.
Under the Trust’s By-Laws and Declaration of Trust, any claims asserted against or on behalf of the MFS Funds, including claims against Trustees and Officers, must be brought in state and federal courts located within the Commonwealth of Massachusetts.
17
Table of Contents
Table of Contents
Semiannual Report
June 30, 2019

MFS® Global Governments Portfolio

MFS® Variable Insurance Trust II
Beginning on January 1, 2021, as permitted by regulations adopted by the U.S. Securities and Exchange Commission, the insurance company that offers your contract may determine that it will no longer send you paper copies of the fund’s annual and semiannual shareholder reports unless you specifically request paper copies from the insurance company or from your financial intermediary. Instead, the shareholder reports will be made available on a Web site (insurancefunds.mfs.com or other Web site of which you will be notified), and the insurance company will notify you by mail each time a report is posted and provide you with a Web site link to access the report. Instructions for requesting paper copies will be provided by your insurance company or financial intermediary.
If you already elected to receive shareholder reports by email, you will not be affected by this change and you need not take any action. If your insurance company or financial intermediary offers electronic delivery, you may elect to receive shareholder reports and other communications from the insurance company or financial intermediary by email by following the instructions provided by the insurance company or financial intermediary.
Beginning on January 1, 2019, you may elect to receive all future reports in paper free of charge from the insurance company or financial intermediary. You can inform the insurance company or financial intermediary that you wish to continue receiving paper copies of your shareholder reports by contacting your insurance company or financial intermediary. Your election to receive reports in paper will apply to all funds held in your account with your insurance company or financial intermediary.
WGS-SEM
Table of Contents
MFS® Global Governments Portfolio
The report is prepared for the general information of contract owners. It is authorized for distribution to prospective investors only when preceded or accompanied by a current prospectus.
NOT FDIC INSURED• MAY LOSE VALUE• NO BANK OR CREDIT UNION GUARANTEE• NOT A DEPOSIT• NOT INSURED BY ANY FEDERAL GOVERNMENT AGENCY OR NCUA/NCUSIF
Table of Contents
MFS Global Governments Portfolio
LETTER FROM THE EXECUTIVE CHAIRMAN

Dear Contract Owners:
Slowing global growth, low inflation, and increasing trade friction between the United States and China have been hallmarks of the past 12 months. After experiencing an uptick in market volatility in late 2018, markets steadied during the first half of 2019, thanks in large measure to the adoption of a dovish policy stance on the part of global central banks, who have largely abandoned efforts to normalize interest rates and have instead focused on supporting economic growth. Trade tensions remain high as the U.S. has ratcheted up tariffs on Chinese imports and China has retaliated. A truce of sorts was reached midyear, but significant challenges continue to confront negotiators, and it is not known whether a comprehensive agreement can be reached.
With Boris Johnson replacing Theresa May as Britain’s prime minister, uncertainty over Brexit remains high. Johnson has adopted a more combative stance than his predecessor toward the European Union, increasing concerns that there will be a “hard” Brexit.
Markets expect that the longest economic expansion in U.S. history will continue for the time being, albeit at a slower pace. Nevertheless, slower growth and low inflation have spurred the U.S. Federal Reserve to take a more accommodative policy stance, prompting investors to anticipate several interest rate cuts in the coming year. The European Central Bank has adopted a similar position. The more accommodative environment has helped fuel a continued rise in global equities and has been broadly supportive of risk assets.
Since launching the first U.S.open-end mutual fund in 1924, MFS® has been committed to a single purpose: to create value by allocating capital responsibly for clients. Through our powerful global investment platform, we combine collective expertise, thoughtful risk management, and long-term discipline to uncover what we believe are the best investment opportunities in the market.
Respectfully,

Robert J. Manning
Executive Chairman
MFS Investment Management
August 16, 2019
The opinions expressed in this letter are subject to change and may not be relied upon for investment advice. No forecasts can be guaranteed.
1
Table of Contents
MFS Global Governments Portfolio
Portfolio structure (i)
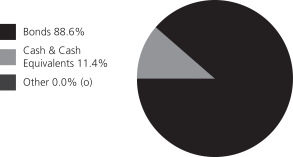
| Fixed income sectors (i) | ||||
| U.S. Treasury Securities | 42.6% | |||
| Non-U.S. Government Bonds | 40.9% | |||
| Emerging Markets Bonds | 4.1% | |||
| Mortgage-Backed Securities | 0.6% | |||
| U.S. Government Agencies | 0.4% | |||
| Composition including fixed income credit quality (a)(i) |
| |||
| AAA | 4.5% | |||
| AA | 10.1% | |||
| A | 17.2% | |||
| BBB | 9.2% | |||
| B | 4.0% | |||
| U.S. Government | 42.6% | |||
| Federal Agencies | 1.0% | |||
| Cash & Cash Equivalents | 11.4% | |||
| Other (o) | 0.0% | |||
| Portfolio facts (i) | ||||
| Average Duration (d) | 8.9 | |||
| Average Effective Maturity (m) | 12.3 yrs. | |||
| Issuer country weightings (i)(x) | ||||
| United States | 55.0% | |||
| Japan | 17.2% | |||
| United Kingdom | 5.0% | |||
| Portugal | 4.4% | |||
| Greece | 4.0% | |||
| Spain | 3.5% | |||
| Australia | 2.5% | |||
| New Zealand | 2.3% | |||
| Belgium | 1.7% | |||
| Other Countries | 4.4% | |||
| Currency exposure weightings (i)(y) | ||||
| United States Dollar | 41.3% | |||
| Euro | 27.6% | |||
| Japanese Yen | 22.8% | |||
| British Pound Sterling | 6.7% | |||
| Canadian Dollar | 1.3% | |||
| Norwegian Krone | 1.0% | |||
| Danish Krone | 0.4% | |||
| Australian Dollar | (0.4)% | |||
| New Zealand Dollar | (0.5)% | |||
| Other Currencies | (0.2)% | |||
| (a) | For all securities other than those specifically described below, ratings are assigned to underlying securities utilizing ratings from Moody’s, Fitch, and Standard & Poor’s rating agencies and applying the following hierarchy: If all three agencies provide a rating, the middle rating (after dropping the highest and lowest ratings) is assigned; if two of the three agencies rate a security, the lower of the two is assigned. Ratings are shown in the S&P and Fitch scale (e.g., AAA). Securities rated BBB or higher are considered investment grade. All ratings are subject to change. U.S. Government includes securities issued by the U.S. Department of the Treasury. Federal Agencies includes rated and unrated U.S. Agency fixed-income securities, U.S. Agency mortgage-backed securities, and collateralized mortgage obligations of U.S. Agency mortgage-backed securities. The fund may or may not have held all of these instruments on this date. The fund is not rated by these agencies. |
| (d) | Duration is a measure of how much a bond’s price is likely to fluctuate with general changes in interest rates, e.g., if rates rise 1.00%, a bond with a 5-year duration is likely to lose about 5.00% of its value due to the interest rate move. |
| (i) | For purposes of this presentation, the components include the value of securities, and reflect the impact of the equivalent exposure of derivative positions, if any. These amounts may be negative from time to time. Equivalent exposure is a calculated amount that translates the derivative position into a reasonable approximation of the amount of the underlying asset that the portfolio would have to hold at a given point in time to have the same price sensitivity that results from the portfolio’s ownership of the derivative contract. When dealing with derivatives, equivalent exposure is a more representative measure of the potential impact of a position on portfolio performance than value. The bond component will include any accrued interest amounts. |
| (m) | In determining each instrument’s effective maturity for purposes of calculating the fund’s dollar-weighted average effective maturity, MFS uses the instrument’s stated maturity or, if applicable, an earlier date on which MFS believes it is probable that a maturity-shortening device (such as a put, pre-refunding or prepayment) will cause the instrument to be repaid. Such an earlier date can be substantially shorter than the instrument’s stated maturity. |
| (o) | Less than 0.1%. |
| (x) | Represents the portfolio’s exposure to issuer countries as a percentage of a portfolio’s net assets. For purposes of this presentation, United States includes Cash & Cash Equivalents and Other. |
| (y) | Represents the portfolio’s exposure to a particular currency as a percentage of a portfolio’s net assets. For purposes of this presentation, United States Dollar includes Cash & Cash Equivalents. |
2
Table of Contents
MFS Global Governments Portfolio
Portfolio Composition – continued
Cash & Cash Equivalents includes any cash, investments in money market funds, short-term securities, and other assets less liabilities. Please see the Statement of Assets and Liabilities for additional information related to the fund’s cash position and other assets and liabilities.
Other includes equivalent exposure from currency derivatives and/or any offsets to derivative positions.
Percentages are based on net assets as of June 30, 2019.
The portfolio is actively managed and current holdings may be different.
3
Table of Contents
MFS Global Governments Portfolio
Fund Expenses Borne by the Contract Holders during the Period,
January 1, 2019 through June 30, 2019
As a contract holder of the fund, you incur ongoing costs, including management fees; distribution and/or service(12b-1) fees; and other fund expenses. This example is intended to help you understand your ongoing costs (in dollars) of investing in the fund and to compare these costs with the ongoing costs of investing in other mutual funds.
The example is based on an investment of $1,000 invested at the beginning of the period and held for the entire period January 1, 2019 through June 30, 2019.
Actual Expenses
The first line for each share class in the following table provides information about actual account values and actual expenses. You may use the information in this line, together with the amount you invested, to estimate the expenses that you paid over the period. Simply divide your account value by $1,000 (for example, an $8,600 account value divided by $1,000 = 8.6), then multiply the result by the number in the first line under the heading entitled “Expenses Paid During Period” to estimate the expenses you paid on your account during this period.
Hypothetical Example for Comparison Purposes
The second line for each share class in the following table provides information about hypothetical account values and hypothetical expenses based on the fund’s actual expense ratio and an assumed rate of return of 5% per year before expenses, which is not the fund’s actual return. The hypothetical account values and expenses may not be used to estimate the actual ending account balance or expenses you paid for the period. You may use this information to compare the ongoing costs of investing in the fund and other funds. To do so, compare this 5% hypothetical example with the 5% hypothetical examples that appear in the shareholder reports of the other funds.
Please note that the expenses shown in the table are meant to highlight the fund’s ongoing costs only and do not take into account the fees and expenses imposed under the variable contracts through which your investment in the fund is made. Therefore, the second line for each share class in the table is useful in comparing ongoing costs associated with an investment in vehicles (such as the fund) which fund benefits under variable annuity and variable life insurance contracts and to qualified pension and retirement plans only, and will not help you determine the relative total costs of investing in the fund through variable annuity and variable life insurance contracts. If the fees and expenses imposed under the variable contracts were included, your costs would have been higher.
| Share Class | Annualized Expense Ratio | Beginning Account Value 1/01/19 | Ending Account Value 6/30/19 | Expenses Paid During Period (p) 1/01/19-6/30/19 | ||||||||||||||
| Initial Class | Actual | 0.87% | $1,000.00 | $1,058.03 | $4.44 | |||||||||||||
| Hypothetical (h) | 0.87% | $1,000.00 | $1,020.48 | $4.36 | ||||||||||||||
| Service Class | Actual | 1.12% | $1,000.00 | $1,056.21 | $5.71 | |||||||||||||
| Hypothetical (h) | 1.12% | $1,000.00 | $1,019.24 | $5.61 | ||||||||||||||
| (h) | 5% class return per year before expenses. |
| (p) | “Expenses Paid During Period” are equal to each class’s annualized expense ratio, as shown above, multiplied by the average account value over the period, multiplied by 181/365 (to reflect theone-half year period). |
4
Table of Contents
MFS Global Governments Portfolio
PORTFOLIO OF INVESTMENTS – 6/30/19 (unaudited)
The Portfolio of Investments is a complete list of all securities owned by your fund. It is categorized by broad-based asset classes.
| Issuer | Shares/Par | Value ($) | ||||||
| BONDS – 88.0% | ||||||||
| Foreign Bonds – 44.7% | ||||||||
| Australia – 2.5% | ||||||||
| Commonwealth of Australia, 2.75%, 6/21/2035 | AUD | 3,192,000 | $ | 2,614,106 | ||||
| Commonwealth of Australia, 3.25%, 6/21/2039 | 350,000 | 308,214 | ||||||
| Commonwealth of Australia, 3%, 3/21/2047 | 450,000 | 388,123 | ||||||
|
| |||||||
| $ | 3,310,443 | |||||||
|
| |||||||
| Belgium – 1.7% | ||||||||
| Kingdom of Belgium, 0.9%, 6/22/2029 | EUR | 1,200,000 | $ | 1,477,448 | ||||
| Kingdom of Belgium, 1.6%, 6/22/2047 | 650,000 | 859,324 | ||||||
|
| |||||||
| $ | 2,336,772 | |||||||
|
| |||||||
| Canada – 1.0% | ||||||||
| Government of Canada, 1.5%, 6/01/2026 | CAD | 630,000 | $ | 483,328 | ||||
| Government of Canada, 2%, 6/01/2028 | 800,000 | 638,595 | ||||||
| Government of Canada, 5%, 6/01/2037 | 250,000 | 289,813 | ||||||
|
| |||||||
| $ | 1,411,736 | |||||||
|
| |||||||
| France – 1.0% | ||||||||
| Republic of France, 3.25%, 5/25/2045 | EUR | 405,000 | $ | 728,570 | ||||
| Republic of France, 4%, 4/25/2055 | 210,000 | 455,563 | ||||||
| Republic of France, 1.75%, 5/25/2066 | 150,000 | 209,335 | ||||||
|
| |||||||
| $ | 1,393,468 | |||||||
|
| |||||||
| Germany – 1.0% | ||||||||
| Federal Republic of Germany, 0.5%, 2/15/2028 | EUR | 1,104,000 | $ | 1,356,942 | ||||
|
| |||||||
| Greece – 4.0% | ||||||||
| Hellenic Republic, 3.375%, 2/15/2025 | EUR | 2,350,000 | $ | 2,930,238 | ||||
| Hellenic Republic, 3.875%, 3/12/2029 | 1,950,000 | 2,486,422 | ||||||
|
| |||||||
| $ | 5,416,660 | |||||||
|
| |||||||
| Italy – 1.3% | ||||||||
| Republic of Italy, 1.65%, 3/01/2032 | EUR | 200,000 | $ | 213,632 | ||||
| Republic of Italy, 5%, 9/01/2040 | 218,000 | 331,286 | ||||||
| Republic of Italy, 3.25%, 9/01/2046 | 980,000 | 1,194,975 | ||||||
|
| |||||||
| $ | 1,739,893 | |||||||
|
| |||||||
| Japan – 17.2% | ||||||||
| Government of Japan, 0%, 8/13/2019 | JPY | 700,000,000 | $ | 6,493,739 | ||||
| Government of Japan, 2.4%, 3/20/2037 | 352,600,000 | 4,545,716 | ||||||
| Government of Japan, 2.3%, 3/20/2039 | 440,000,000 | 5,702,309 | ||||||
| Government of Japan, 2.3%, 3/20/2040 | 327,000,000 | 4,286,258 | ||||||
| Government of Japan, 1.8%, 3/20/2043 | 13,000,000 | 161,912 | ||||||
| Issuer | Shares/Par | Value ($) | ||||||
| BONDS – continued | ||||||||
| Foreign Bonds – continued | ||||||||
| Government of Japan, 0.8%, 6/20/2047 | JPY | 125,000,000 | $ | 1,297,257 | ||||
| Government of Japan, 2%, 3/20/2052 | 53,900,000 | 745,571 | ||||||
|
| |||||||
| $ | 23,232,762 | |||||||
|
| |||||||
| New Zealand – 2.3% | ||||||||
| Government of New Zealand , 3%, 4/20/2029 | NZD | 4,150,000 | $ | 3,147,423 | ||||
|
| |||||||
| Portugal – 4.3% | ||||||||
| Republic of Portugal, 4.125%, 4/14/2027 | EUR | 1,650,000 | $ | 2,440,221 | ||||
| Republic of Portugal, 3.875%, 2/15/2030 | 800,000 | 1,219,211 | ||||||
| Republic of Portugal, 4.1%, 4/15/2037 | 750,000 | 1,277,181 | ||||||
| Republic of Portugal, 4.1%, 2/15/2045 | 511,000 | 921,788 | ||||||
|
| |||||||
| $ | 5,858,401 | |||||||
|
| |||||||
| Spain – 3.4% | ||||||||
| Kingdom of Spain, 5.15%, 10/31/2028 | EUR | 840,000 | $ | 1,377,312 | ||||
| Kingdom of Spain, 4.7%, 7/30/2041 | 870,000 | 1,684,223 | ||||||
| Kingdom of Spain, 5.15%, 10/31/2044 | 750,000 | 1,579,298 | ||||||
|
| |||||||
| $ | 4,640,833 | |||||||
|
| |||||||
| United Kingdom – 5.0% | ||||||||
| United Kingdom Treasury, 6%, 12/07/2028 | GBP | 700,000 | $ | 1,308,467 | ||||
| United Kingdom Treasury, 4.25%, 6/07/2032 | 71,000 | 124,687 | ||||||
| United Kingdom Treasury, 4.25%, 3/07/2036 | 438,000 | 806,110 | ||||||
| United Kingdom Treasury, 1.75%, 9/07/2037 | 580,000 | 783,932 | ||||||
| United Kingdom Treasury, 4.25%, 12/07/2040 | 127,000 | 246,176 | ||||||
| United Kingdom Treasury, 3.25%, 1/22/2044 | 980,000 | 1,700,499 | ||||||
| United Kingdom Treasury, 3.75%, 7/22/2052 | 489,000 | 998,582 | ||||||
| United Kingdom Treasury, 4%, 1/22/2060 | 180,000 | 412,933 | ||||||
| United Kingdom Treasury, 3.5%, 7/22/2068 | 150,000 | 333,337 | ||||||
|
| |||||||
| $ | 6,714,723 | |||||||
|
| |||||||
| Total Foreign Bonds | $ | 60,560,056 | ||||||
|
| |||||||
| U.S. Bonds – 43.3% | ||||||||
| Mortgage-Backed – 0.6% | ||||||||
| Freddie Mac, 3.32%, 2/25/2023 | $ | 5,000 | $ | 5,209 | ||||
| Freddie Mac, 3.243%, 4/25/2027 | 400,000 | 423,271 | ||||||
| Freddie Mac, 3.117%, 6/25/2027 | 322,320 | 338,342 | ||||||
|
| |||||||
| $ | 766,822 | |||||||
|
| |||||||
5
Table of Contents
MFS Global Governments Portfolio
Portfolio of Investments (unaudited) – continued
| Issuer | Shares/Par | Value ($) | ||||||
| BONDS – continued | ||||||||
| U.S. Bonds – continued | ||||||||
| U.S. Government Agencies and Equivalents – 0.4% |
| |||||||
| Small Business Administration, 4.57%, 6/01/2025 | $ | 3,836 | $ | 4,010 | ||||
| Small Business Administration, 5.09%, 10/01/2025 | 3,417 | 3,592 | ||||||
| Small Business Administration, 5.21%, 1/01/2026 | 49,939 | 52,648 | ||||||
| Small Business Administration, 2.22%, 3/01/2033 | 524,529 | 521,981 | ||||||
|
| |||||||
| $ | 582,231 | |||||||
|
| |||||||
| U.S. Treasury Obligations – 42.3% |
| |||||||
| U.S. Treasury Bonds, 2.25%, 2/15/2027 | $ | 11,096,000 | $ | 11,370,799 | ||||
| U.S. Treasury Bonds, 4.5%, 8/15/2039 | 4,598,400 | 6,211,433 | ||||||
| U.S. Treasury Bonds, 2.75%, 11/15/2042 | 2,011,000 | 2,108,094 | ||||||
| U.S. Treasury Bonds, 3.625%, 2/15/2044 | 2,600,000 | 3,141,734 | ||||||
| U.S. Treasury Notes, 3.5%, 5/15/2020 | 10,355,000 | 10,488,078 | ||||||
| U.S. Treasury Notes, 2.75%, 2/15/2024 | 6,790,000 | 7,090,245 | ||||||
| U.S. Treasury Notes, 2.125%, 5/15/2025 | 3,000,000 | 3,050,625 | ||||||
| Issuer | Shares/Par | Value ($) | ||||||
| BONDS – continued | ||||||||
| U.S. Bonds – continued | ||||||||
| U.S. Treasury Obligations – continued |
| |||||||
| U.S. Treasury Notes, 1.5%, 8/15/2026 | $ | 6,720,000 | $ | 6,549,113 | ||||
| U.S. Treasury Notes, 2.875%, 5/15/2028 | 6,812,300 | 7,314,973 | ||||||
|
| |||||||
| $ | 57,325,094 | |||||||
|
| |||||||
| Total U.S. Bonds | $ | 58,674,147 | ||||||
|
| |||||||
| Total Bonds (Identified Cost, $112,293,863) | $ | 119,234,203 | ||||||
|
| |||||||
| INVESTMENT COMPANIES (h) – 10.4% |
| |||||||
| Money Market Funds – 10.4% |
| |||||||
| MFS Institutional Money Market Portfolio, 2.42% (v) (Identified Cost, $14,122,782) | 14,123,929 | $ | 14,125,342 | |||||
|
| |||||||
| OTHER ASSETS, LESS LIABILITIES – 1.6% | 2,133,324 | |||||||
|
| |||||||
| NET ASSETS – 100.0% | $ | 135,492,869 | ||||||
|
| |||||||
| (h) | An affiliated issuer, which may be considered one in which the fund owns 5% or more of the outstanding voting securities, or a company which is under common control. At period end, the aggregate values of the fund’s investments in affiliated issuers and in unaffiliated issuers were $14,125,342 and $119,234,203, respectively. |
| (v) | Affiliated issuer that is available only to investment companies managed by MFS. The rate quoted for the MFS Institutional Money Market Portfolio is the annualizedseven-day yield of the fund at period end. |
Abbreviations indicate amounts shown in currencies other than the U.S. dollar. All amounts are stated in U.S. dollars unless otherwise indicated. A list of abbreviations is shown below:
| AUD | Australian Dollar |
| CAD | Canadian Dollar |
| CHF | Swiss Franc |
| DKK | Danish Krone |
| EUR | Euro |
| GBP | British Pound |
| JPY | Japanese Yen |
| MXN | Mexican Peso |
| NOK | Norwegian Krone |
| NZD | New Zealand Dollar |
| SEK | Swedish Krona |
| ZAR | South African Rand |
Derivative Contracts at 6/30/19
Forward Foreign Currency Exchange Contracts
| Currency Purchased | Currency Sold | Counterparty | Settlement Date | Unrealized Appreciation (Depreciation) | ||||||||||||||||
| Asset Derivatives | ||||||||||||||||||||
| AUD | 145,825 | USD | 102,180 | HSBC Bank | 7/12/2019 | $232 | ||||||||||||||
| CAD | 1,804,000 | USD | 1,342,106 | Brown Brothers Harriman | 7/12/2019 | 35,805 | ||||||||||||||
| CAD | 1,442,200 | USD | 1,088,167 | Merrill Lynch International | 7/12/2019 | 13,398 | ||||||||||||||
| CAD | 2,248,149 | USD | 1,693,210 | Morgan Stanley Capital Services, Inc. | 7/12/2019 | 23,945 | ||||||||||||||
| CAD | 900,000 | USD | 671,269 | UBS AG | 7/12/2019 | 16,159 | ||||||||||||||
| DKK | 3,709,237 | USD | 564,355 | UBS AG | 7/12/2019 | 1,221 | ||||||||||||||
| EUR | 335,000 | USD | 377,556 | Barclays Bank PLC | 7/12/2019 | 3,694 | ||||||||||||||
| EUR | 838,742 | USD | 945,048 | Brown Brothers Harriman | 7/12/2019 | 9,490 | ||||||||||||||
| EUR | 850,000 | USD | 959,011 | Citibank N.A. | 7/12/2019 | 8,340 | ||||||||||||||
| EUR | 2,441,928 | USD | 2,765,075 | Deutsche Bank AG | 7/12/2019 | 13,983 | ||||||||||||||
| EUR | 1,418,075 | USD | 1,608,529 | Goldman Sachs International | 7/12/2019 | 5,325 | ||||||||||||||
6
Table of Contents
MFS Global Governments Portfolio
Portfolio of Investments (unaudited) – continued
Forward Foreign Currency Exchange Contracts - continued
| Currency Purchased | Currency Sold | Counterparty | Settlement Date | Unrealized Appreciation (Depreciation) | ||||||||||||||||
| Asset Derivatives – continued | ||||||||||||||||||||
| EUR | 317,733 | USD | 358,629 | HSBC Bank | 7/12/2019 | $2,971 | ||||||||||||||
| EUR | 238,000 | USD | 269,196 | JPMorgan Chase Bank N.A. | 7/12/2019 | 1,662 | ||||||||||||||
| EUR | 9,363,884 | USD | 10,637,963 | Merrill Lynch International | 7/12/2019 | 18,696 | ||||||||||||||
| EUR | 968,435 | USD | 1,102,040 | State Street Bank Corp. | 7/12/2019 | 96 | ||||||||||||||
| EUR | 1,387,164 | USD | 1,569,443 | UBS AG | 7/12/2019 | 9,233 | ||||||||||||||
| GBP | 45,732 | USD | 57,968 | NatWest Markets PLC | 7/12/2019 | 139 | ||||||||||||||
| JPY | 1,569,234,164 | USD | 14,226,371 | HSBC Bank | 7/12/2019 | 340,209 | ||||||||||||||
| JPY | 146,843,000 | USD | 1,350,477 | JPMorgan Chase Bank N.A. | 7/12/2019 | 12,609 | ||||||||||||||
| JPY | 113,212,000 | USD | 1,038,478 | State Street Bank Corp. | 7/12/2019 | 12,424 | ||||||||||||||
| NZD | 995,000 | USD | 661,214 | Citibank N.A. | 7/12/2019 | 7,382 | ||||||||||||||
| NZD | 1,973,000 | USD | 1,307,403 | Morgan Stanley Capital Services, Inc. | 7/12/2019 | 18,367 | ||||||||||||||
| NZD | 226,992 | USD | 152,101 | State Street Bank Corp. | 7/12/2019 | 428 | ||||||||||||||
| USD | 3,282,121 | AUD | 4,592,210 | Deutsche Bank AG | 7/12/2019 | 57,035 | ||||||||||||||
| USD | 658,469 | AUD | 934,000 | JPMorgan Chase Bank N.A. | 7/10/2019 | 2,572 | ||||||||||||||
| USD | 158,498 | AUD | 224,620 | UBS AG | 7/12/2019 | 749 | ||||||||||||||
| USD | 63,601 | GBP | 50,000 | NatWest Markets PLC | 7/12/2019 | 71 | ||||||||||||||
| USD | 4,264,920 | NZD | 6,313,956 | Deutsche Bank AG | 7/12/2019 | 22,217 | ||||||||||||||
|
| |||||||||||||||||||
| $638,452 | ||||||||||||||||||||
|
| |||||||||||||||||||
| Liability Derivatives | ||||||||||||||||||||
| AUD | 1,950,000 | USD | 1,400,435 | Citibank N.A. | 7/12/2019 | $(30,960 | ) | |||||||||||||
| AUD | 937,000 | USD | 673,042 | NatWest Markets PLC | 7/12/2019 | (14,992 | ) | |||||||||||||
| AUD | 2,267,047 | USD | 1,629,673 | UBS AG | 7/12/2019 | (37,538 | ) | |||||||||||||
| GBP | 2,343,600 | USD | 3,075,589 | Deutsche Bank AG | 7/12/2019 | (97,812 | ) | |||||||||||||
| GBP | 131,181 | USD | 171,972 | State Street Bank Corp. | 7/12/2019 | (5,293 | ) | |||||||||||||
| JPY | 13,454,280 | USD | 124,967 | Deutsche Bank AG | 7/12/2019 | (76 | ) | |||||||||||||
| MXN | 74,144 | USD | 3,882 | JPMorgan Chase Bank N.A. | 7/12/2019 | (26 | ) | |||||||||||||
| NOK | 17,096,623 | USD | 2,009,481 | Goldman Sachs International | 7/12/2019 | (4,618 | ) | |||||||||||||
| NOK | 5,699,000 | USD | 673,197 | Merrill Lynch International | 7/12/2019 | (4,894 | ) | |||||||||||||
| SEK | 15,831,140 | USD | 1,724,608 | JPMorgan Chase Bank N.A. | 7/12/2019 | (18,493 | ) | |||||||||||||
| USD | 673,358 | AUD | 972,000 | Brown Brothers Harriman | 7/12/2019 | (9,273 | ) | |||||||||||||
| USD | 145,896 | AUD | 212,000 | JPMorgan Chase Bank N.A. | 7/12/2019 | (2,991 | ) | |||||||||||||
| USD | 2,724,261 | AUD | 3,925,000 | State Street Bank Corp. | 7/12/2019 | (32,248 | ) | |||||||||||||
| USD | 67,863 | CAD | 91,000 | Deutsche Bank AG | 7/12/2019 | (1,643 | ) | |||||||||||||
| USD | 4,374,845 | CAD | 5,830,140 | JPMorgan Chase Bank N.A. | 7/12/2019 | (78,265 | ) | |||||||||||||
| USD | 5,034 | CHF | 5,000 | BNP Paribas S.A. | 7/12/2019 | (93 | ) | |||||||||||||
| USD | 1,485,412 | EUR | 1,324,000 | Credit Suisse Group | 7/12/2019 | (21,379 | ) | |||||||||||||
| USD | 1,678,704 | EUR | 1,475,188 | JPMorgan Chase Bank N.A. | 7/12/2019 | (148 | ) | |||||||||||||
| USD | 759,854 | EUR | 675,632 | Merrill Lynch International | 7/12/2019 | (9,055 | ) | |||||||||||||
| USD | 132,659 | EUR | 117,848 | Morgan Stanley Capital Services, Inc. | 7/12/2019 | (1,459 | ) | |||||||||||||
| USD | 719,333 | EUR | 642,000 | State Street Bank Corp. | 7/12/2019 | (11,301 | ) | |||||||||||||
| USD | 768,745 | EUR | 676,811 | State Street Bank Corp. | 9/17/2019 | (5,504 | ) | |||||||||||||
| USD | 588,686 | EUR | 517,985 | UBS AG | 7/12/2019 | (812 | ) | |||||||||||||
| USD | 791,303 | GBP | 623,264 | Brown Brothers Harriman | 7/12/2019 | (616 | ) | |||||||||||||
| USD | 1,260,815 | JPY | 137,686,876 | Citibank N.A. | 7/12/2019 | (17,278 | ) | |||||||||||||
| USD | 6,442,491 | JPY | 700,281,400 | JPMorgan Chase Bank N.A. | 8/13/2019 | (73,183 | ) | |||||||||||||
| USD | 1,240,086 | JPY | 137,679,369 | Morgan Stanley Capital Services, Inc. | 7/12/2019 | (37,937 | ) | |||||||||||||
| USD | 434,367 | JPY | 46,869,000 | State Street Bank Corp. | 7/12/2019 | (699 | ) | |||||||||||||
| USD | 1,343,936 | NOK | 11,752,000 | Citibank N.A. | 7/12/2019 | (34,181 | ) | |||||||||||||
| USD | 40,350 | NZD | 61,000 | Deutsche Bank AG | 7/12/2019 | (639 | ) | |||||||||||||
| USD | 676,433 | NZD | 1,040,000 | Goldman Sachs International | 7/12/2019 | (22,402 | ) | |||||||||||||
| USD | 988,630 | NZD | 1,498,738 | State Street Bank Corp. | 7/12/2019 | (18,456 | ) | |||||||||||||
| USD | 1,328,212 | SEK | 12,384,000 | Citibank N.A. | 7/12/2019 | (6,407 | ) | |||||||||||||
| USD | 659,874 | SEK | 6,257,000 | Deutsche Bank AG | 7/12/2019 | (14,440 | ) | |||||||||||||
| USD | 4,890 | ZAR | 69,347 | JPMorgan Chase Bank N.A. | 7/12/2019 | (27 | ) | |||||||||||||
|
| |||||||||||||||||||
| $(615,138 | ) | |||||||||||||||||||
|
| |||||||||||||||||||
See Notes to Financial Statements
7
Table of Contents
MFS Global Governments Portfolio
FINANCIAL STATEMENTS | STATEMENT OF ASSETS AND LIABILITIES (unaudited)
This statement represents your fund’s balance sheet, which details the assets and liabilities comprising the total value of the fund.
At 6/30/19 | ||||
Assets | ||||
Investments in unaffiliated issuers, at value (identified cost, $112,293,863) | $119,234,203 | |||
Investments in affiliated issuers, at value (identified cost, $14,122,782) | 14,125,342 | |||
Foreign currency, at value (identified cost, $790,689) | 791,523 | |||
Receivables for | ||||
Forward foreign currency exchange contracts | 638,452 | |||
Investments sold | 1,404,968 | |||
Interest | 789,076 | |||
Other assets | 611 | |||
Total assets | $136,984,175 | |||
Liabilities | ||||
Payables for | ||||
Forward foreign currency exchange contracts | $615,138 | |||
Investments purchased | 791,514 | |||
Fund shares reacquired | 6,732 | |||
Payable to affiliates | ||||
Investment adviser | 10,986 | |||
Administrative services fee | 316 | |||
Shareholder servicing costs | 9 | |||
Distribution and/or service fees | 22 | |||
Payable for independent Trustees’ compensation | 100 | |||
Accrued expenses and other liabilities | 66,489 | |||
Total liabilities | $1,491,306 | |||
Net assets | $135,492,869 | |||
Net assets consist of | ||||
Paid-in capital | $131,843,869 | |||
Total distributable earnings (loss) | 3,649,000 | |||
Net assets | $135,492,869 | |||
Shares of beneficial interest outstanding | 12,387,435 | |||
| Net assets | Shares outstanding | Net asset value per share | ||||||||||
Initial Class | $134,704,228 | 12,313,818 | $10.94 | |||||||||
Service Class | 788,641 | 73,617 | 10.71 | |||||||||
See Notes to Financial Statements
8
Table of Contents
MFS Global Governments Portfolio
FINANCIAL STATEMENTS | STATEMENT OF OPERATIONS (unaudited)
This statement describes how much your fund earned in investment income and accrued in expenses. It also describes any gains and/or losses generated by fund operations.
Six months ended 6/30/19 | ||||
Net investment income (loss) | ||||
Income | ||||
Interest | $1,201,553 | |||
Dividends from affiliated issuers | 145,624 | |||
Other | 32 | |||
Total investment income | $1,347,209 | |||
Expenses | ||||
Management fee | $495,888 | |||
Distribution and/or service fees | 982 | |||
Shareholder servicing costs | 728 | |||
Administrative services fee | 14,477 | |||
Independent Trustees’ compensation | 2,994 | |||
Custodian fee | 13,274 | |||
Shareholder communications | 4,067 | |||
Audit and tax fees | 37,715 | |||
Legal fees | 675 | |||
Miscellaneous | 15,147 | |||
Total expenses | $585,947 | |||
Reduction of expenses by investment adviser | (6,393 | ) | ||
Net expenses | $579,554 | |||
Net investment income (loss) | $767,655 | |||
Realized and unrealized gain (loss) | ||||
Realized gain (loss) (identified cost basis) | ||||
Unaffiliated issuers | $2,253,319 | |||
Affiliated issuers | (939 | ) | ||
Forward foreign currency exchange contracts | (427,415 | ) | ||
Foreign currency | (24,079 | ) | ||
Net realized gain (loss) | $1,800,886 | |||
Change in unrealized appreciation or depreciation | ||||
Unaffiliated issuers | $4,988,638 | |||
Affiliated issuers | 2,634 | |||
Forward foreign currency exchange contracts | (30,621 | ) | ||
Translation of assets and liabilities in foreign currencies | 5,786 | |||
Net unrealized gain (loss) | $4,966,437 | |||
Net realized and unrealized gain (loss) | $6,767,323 | |||
Change in net assets from operations | $7,534,978 | |||
See Notes to Financial Statements
9
Table of Contents
MFS Global Governments Portfolio
FINANCIAL STATEMENTS | STATEMENTS OF CHANGES IN NET ASSETS
These statements describe the increases and/or decreases in net assets resulting from operations, any distributions, and any shareholder transactions.
| Six months ended 6/30/19 | Year ended 12/31/18 | |||||||
| (unaudited) | ||||||||
Change in net assets | ||||||||
From operations | ||||||||
Net investment income (loss) | $767,655 | $1,553,877 | ||||||
Net realized gain (loss) | 1,800,886 | 814,334 | ||||||
Net unrealized gain (loss) | 4,966,437 | (4,051,125 | ) | |||||
Change in net assets from operations | $7,534,978 | $(1,682,914 | ) | |||||
Total distributions to shareholders | $— | $(1,441,037 | ) | |||||
Change in net assets from fund share transactions | $(7,875,701 | ) | $(21,728,577 | ) | ||||
Total change in net assets | $(340,723 | ) | $(24,852,528 | ) | ||||
Net assets | ||||||||
At beginning of period | 135,833,592 | 160,686,120 | ||||||
At end of period | $135,492,869 | $135,833,592 | ||||||
See Notes to Financial Statements
10
Table of Contents
MFS Global Governments Portfolio
FINANCIAL STATEMENTS | FINANCIAL HIGHLIGHTS
The financial highlights table is intended to help you understand the fund’s financial performance for the semiannual period and the past 5 fiscal years. Certain information reflects financial results for a single fund share. The total returns in the table represent the rate that an investor would have earned (or lost) on an investment in the fund share class (assuming reinvestment of all distributions) held for the entire period.
| Initial Class | Six months 6/30/19 | Year ended | ||||||||||||||||||||||
| 12/31/18 | 12/31/17 | 12/31/16 | 12/31/15 | 12/31/14 | ||||||||||||||||||||
| (unaudited) | ||||||||||||||||||||||||
Net asset value, beginning of period | $10.34 | $10.56 | $9.87 | $9.84 | $10.47 | $10.45 | ||||||||||||||||||
| Income (loss) from investment operations | ||||||||||||||||||||||||
Net investment income (loss) (d) | $0.06 | $0.11 | $0.08 | $0.07 | (c) | $0.09 | $0.11 | |||||||||||||||||
Net realized and unrealized gain (loss) | 0.54 | (0.23 | ) | 0.61 | (0.04 | )(g) | (0.47 | ) | (0.03 | ) | ||||||||||||||
Total from investment operations | $0.60 | $(0.12 | ) | $0.69 | $0.03 | $(0.38 | ) | $0.08 | ||||||||||||||||
| Less distributions declared to shareholders | ||||||||||||||||||||||||
From net investment income | $— | $(0.10 | ) | $— | $— | $(0.25 | ) | $(0.06 | ) | |||||||||||||||
Net asset value, end of period (x) | $10.94 | $10.34 | $10.56 | $9.87 | $9.84 | $10.47 | ||||||||||||||||||
Total return (%) (k)(r)(s)(x) | 5.80 | (n) | (1.11 | ) | 6.99 | 0.30 | (c) | (3.66 | ) | 0.73 | ||||||||||||||
| Ratios (%) (to average net assets) and Supplemental data: | ||||||||||||||||||||||||
Expenses before expense reductions (f) | 0.88 | (a) | 0.87 | 0.86 | 0.83 | (c) | 0.85 | 0.84 | ||||||||||||||||
Expenses after expense reductions (f) | 0.87 | (a) | 0.86 | 0.85 | 0.82 | (c) | 0.84 | 0.83 | ||||||||||||||||
Net investment income (loss) | 1.16 | (a) | 1.05 | 0.77 | 0.66 | (c) | 0.92 | 1.07 | ||||||||||||||||
Portfolio turnover | 58 | (n) | 79 | 67 | 75 | 94 | 31 | |||||||||||||||||
Net assets at end of period (000 omitted) | $134,704 | $135,008 | $159,652 | $162,211 | $182,978 | $209,945 | ||||||||||||||||||
| Service Class | Six months 6/30/19 | Year ended | ||||||||||||||||||||||
| 12/31/18 | 12/31/17 | 12/31/16 | 12/31/15 | 12/31/14 | ||||||||||||||||||||
| (unaudited) | ||||||||||||||||||||||||
Net asset value, beginning of period | $10.14 | $10.34 | $9.69 | $9.69 | $10.31 | $10.28 | ||||||||||||||||||
| Income (loss) from investment operations | ||||||||||||||||||||||||
Net investment income (loss) (d) | $0.05 | $0.08 | $0.05 | $0.04 | (c) | $0.07 | $0.09 | |||||||||||||||||
Net realized and unrealized gain (loss) | 0.52 | (0.22 | ) | 0.60 | (0.04 | )(g) | (0.46 | ) | (0.04 | ) | ||||||||||||||
Total from investment operations | $0.57 | $(0.14 | ) | $0.65 | $0.00 | (w) | $(0.39 | ) | $0.05 | |||||||||||||||
| Less distributions declared to shareholders | ||||||||||||||||||||||||
From net investment income | $— | $(0.06 | ) | $— | $— | $(0.23 | ) | $(0.02 | ) | |||||||||||||||
Net asset value, end of period (x) | $10.71 | $10.14 | $10.34 | $9.69 | $9.69 | $10.31 | ||||||||||||||||||
Total return (%) (k)(r)(s)(x) | 5.62 | (n) | (1.32 | ) | 6.71 | 0.00 | (c)(w) | (3.86 | ) | 0.49 | ||||||||||||||
| Ratios (%) (to average net assets) and Supplemental data: | ||||||||||||||||||||||||
Expenses before expense reductions (f) | 1.13 | (a) | 1.12 | 1.11 | 1.08 | (c) | 1.10 | 1.09 | ||||||||||||||||
Expenses after expense reductions (f) | 1.12 | (a) | 1.11 | 1.10 | 1.07 | (c) | 1.09 | 1.08 | ||||||||||||||||
Net investment income (loss) | 0.91 | (a) | 0.80 | 0.52 | 0.41 | (c) | 0.67 | 0.81 | ||||||||||||||||
Portfolio turnover | 58 | (n) | 79 | 67 | 75 | 94 | 31 | |||||||||||||||||
Net assets at end of period (000 omitted) | $789 | $826 | $1,034 | $1,572 | $1,586 | $1,809 | ||||||||||||||||||
See Notes to Financial Statements
11
Table of Contents
MFS Global Governments Portfolio
Financial Highlights – continued
| (a) | Annualized. |
| (c) | Amount reflects aone-time reimbursement of expenses by the custodian (or former custodian) without which net investment income and performance would be lower and expenses would be higher. |
| (d) | Per share data is based on average shares outstanding. |
| (f) | Ratios do not reflect reductions from fees paid indirectly, if applicable. |
| (g) | The per share amount varies from the net realized and unrealized gain/loss for the period because of the timing of sales of fund shares and the per share amount of realized and unrealized gains and losses at such time. |
| (k) | The total return does not reflect expenses that apply to separate accounts. Inclusion of these charges would reduce the total return figures for all periods shown. |
| (n) | Not annualized. |
| (r) | Certain expenses have been reduced without which performance would have been lower. |
| (s) | From time to time the fund may receive proceeds from litigation settlements, without which performance would be lower. |
| (w) | Per share amount was less than $0.01 and total return or ratio was less than 0.01%, as applicable. |
| (x) | The net asset values and total returns have been calculated on net assets which include adjustments made in accordance with U.S. generally accepted accounting principles required at period end for financial reporting purposes. |
See Notes to Financial Statements
12
Table of Contents
MFS Global Governments Portfolio
NOTES TO FINANCIAL STATEMENTS (unaudited)
| (1) | Business and Organization |
MFS Global Governments Portfolio (the fund) is anon-diversified series of MFS Variable Insurance Trust II (the trust). The trust is organized as a Massachusetts business trust and is registered under the Investment Company Act of 1940, as amended, as anopen-end management investment company. The shareholders of each series of the trust are separate accounts of insurance companies, which offer variable annuity and/or life insurance products, and qualified retirement and pension plans.
The fund is an investment company and accordingly follows the investment company accounting and reporting guidance of the Financial Accounting Standards Board (FASB) Accounting Standards Codification Topic 946 Financial Services – Investment Companies.
| (2) | Significant Accounting Policies |
General – The preparation of financial statements in conformity with U.S. generally accepted accounting principles requires management to make estimates and assumptions that affect the reported amounts of assets and liabilities, and disclosure of contingent assets and liabilities at the date of the financial statements and the reported amounts of increases and decreases in net assets from operations during the reporting period. Actual results could differ from those estimates. In the preparation of these financial statements, management has evaluated subsequent events occurring after the date of the fund’s Statement of Assets and Liabilities through the date that the financial statements were issued. The fund invests in foreign securities. Investments in foreign securities are vulnerable to the effects of changes in the relative values of the local currency and the U.S. dollar and to the effects of changes in each country’s market, economic, industrial, political, regulatory, geopolitical, and other conditions.
Balance Sheet Offsetting – The fund’s accounting policy with respect to balance sheet offsetting is that, absent an event of default by the counterparty or a termination of the agreement, the International Swaps and Derivatives Association (ISDA) Master Agreement, or similar agreement, does not result in an offset of reported amounts of financial assets and financial liabilities in the Statement of Assets and Liabilities across transactions between the fund and the applicable counterparty. The fund’s right to setoff may be restricted or prohibited by the bankruptcy or insolvency laws of the particular jurisdiction to which a specific master netting agreement counterparty is subject. Balance sheet offsetting disclosures, to the extent applicable to the fund, have been included in the fund’s Significant Accounting Policies note under the captions for each of the fund’sin-scope financial instruments and transactions.
Investment Valuations – Debt instruments and floating rate loans, including restricted debt instruments, are generally valued at an evaluated or composite bid as provided by a third-party pricing service. Short-term instruments with a maturity at issuance of 60 days or less may be valued at amortized cost, which approximates market value. Forward foreign currency exchange contracts are generally valued at the mean of bid and asked prices for the time period interpolated from rates provided by a third-party pricing service for proximate time periods.Open-end investment companies are generally valued at net asset value per share. Securities and other assets generally valued on the basis of information from a third-party pricing service may also be valued at a broker/dealer bid quotation. In determining values, third-party pricing services can utilize both transaction data and market information such as yield, quality, coupon rate, maturity, type of issue, trading characteristics, and other market data. The values of foreign securities and other assets and liabilities expressed in foreign currencies are converted to U.S. dollars using the mean of bid and asked prices for rates provided by a third-party pricing service.
The Board of Trustees has delegated primary responsibility for determining or causing to be determined the value of the fund’s investments (including any fair valuation) to the adviser pursuant to valuation policies and procedures approved by the Board. If the adviser determines that reliable market quotations are not readily available, investments are valued at fair value as determined in good faith by the adviser in accordance with such procedures under the oversight of the Board of Trustees. Under the fund’s valuation policies and procedures, market quotations are not considered to be readily available for most types of debt instruments and floating rate loans and many types of derivatives. These investments are generally valued at fair value based on information from third-party pricing services. In addition, investments may be valued at fair value if the adviser determines that an investment’s value has been materially affected by events occurring after the close of the exchange or market on which the investment is principally traded (such as foreign exchange or market) and prior to the determination of the fund’s net asset value, or after the halt of trading of a specific security where trading does not resume prior to the close of the exchange or market on which the security is principally traded. The adviser generally relies on third-party pricing services or other information (such as the correlation with price movements of similar securities in the same or other markets; the type, cost and investment characteristics of the security; the business and financial condition of the issuer; and trading and other market data) to assist in determining whether to fair value and at what value to fair value an investment. The value of an investment for purposes of calculating the fund’s net asset value can differ depending on the source and method used to determine value. When fair valuation is used, the value of an investment used to determine the fund’s net asset value may differ from quoted or published prices for the same investment. There can be no assurance that the fund could obtain the fair value assigned to an investment if it were to sell the investment at the same time at which the fund determines its net asset value per share.
13
Table of Contents
MFS Global Governments Portfolio
Notes to Financial Statements (unaudited) – continued
Various inputs are used in determining the value of the fund’s assets or liabilities. These inputs are categorized into three broad levels. In certain cases, the inputs used to measure fair value may fall into different levels of the fair value hierarchy. In such cases, an investment’s level within the fair value hierarchy is based on the lowest level of input that is significant to the fair value measurement. The fund’s assessment of the significance of a particular input to the fair value measurement in its entirety requires judgment, and considers factors specific to the investment. Level 1 includes unadjusted quoted prices in active markets for identical assets or liabilities. Level 2 includes other significant observable market-based inputs (including quoted prices for similar securities, interest rates, prepayment speed, and credit risk). Level 3 includes unobservable inputs, which may include the adviser’s own assumptions in determining the fair value of investments. Other financial instruments are derivative instruments, such as forward foreign currency exchange contracts. The following is a summary of the levels used as of June 30, 2019 in valuing the fund’s assets or liabilities:
| Financial Instruments | Level 1 | Level 2 | Level 3 | Total | ||||||||||||
| U.S. Treasury Bonds & U.S. Government Agency & Equivalents | $— | $57,907,325 | $— | $57,907,325 | ||||||||||||
| Non-U.S. Sovereign Debt | — | 60,560,056 | — | 60,560,056 | ||||||||||||
| Residential Mortgage-Backed Securities | — | 766,822 | — | 766,822 | ||||||||||||
| Mutual Funds | 14,125,342 | — | — | 14,125,342 | ||||||||||||
| Total | $14,125,342 | $119,234,203 | $— | $133,359,545 | ||||||||||||
| Other Financial Instruments | ||||||||||||||||
| Forward Foreign Currency Exchange Contracts – Assets | $— | $638,452 | $— | $638,452 | ||||||||||||
| Forward Foreign Currency Exchange Contracts – Liabilities | — | (615,138 | ) | — | (615,138 | ) | ||||||||||
For further information regarding security characteristics, see the Portfolio of Investments.
Foreign Currency Translation – Purchases and sales of foreign investments, income, and expenses are converted into U.S. dollars based upon currency exchange rates prevailing on the respective dates of such transactions or on the reporting date for foreign denominated receivables and payables. Gains and losses attributable to foreign currency exchange rates on sales of securities are recorded for financial statement purposes as net realized gains and losses on investments. Gains and losses attributable to foreign exchange rate movements on receivables, payables, income and expenses are recorded for financial statement purposes as foreign currency transaction gains and losses. That portion of both realized and unrealized gains and losses on investments that results from fluctuations in foreign currency exchange rates is not separately disclosed.
Derivatives – The fund uses derivatives primarily to increase or decrease exposure to a particular market or segment of the market, or security, to increase or decrease interest rate or currency exposure, or as alternatives to direct investments. Derivatives are used for hedging ornon-hedging purposes. While hedging can reduce or eliminate losses, it can also reduce or eliminate gains. When the fund uses derivatives as an investment to increase market exposure, or for hedging purposes, gains and losses from derivative instruments may be substantially greater than the derivative’s original cost.
The derivative instruments used by the fund during the period were forward foreign currency exchange contracts. Depending on the type of derivative, the fund may exit a derivative position by entering into an offsetting transaction with a counterparty or exchange, negotiating an agreement with the derivative counterparty, or novating the position to a third party. The fund’s period end derivatives, as presented in the Portfolio of Investments and the associated Derivative Contract tables, generally are indicative of the volume of its derivative activity during the period.
The following table presents, by major type of derivative contract, the fair value, on a gross basis, of the asset and liability components of derivatives held by the fund at June 30, 2019 as reported in the Statement of Assets and Liabilities:
| Fair Value | ||||||||||
| Risk | Derivative Contracts | Asset Derivatives | Liability Derivatives | |||||||
| Foreign Exchange | Forward Foreign Currency Exchange Contracts | $638,452 | $(615,138 | ) | ||||||
The following table presents, by major type of derivative contract, the realized gain (loss) on derivatives held by the fund for the six months ended June 30, 2019 as reported in the Statement of Operations:
| Risk | Forward Foreign Currency Exchange Contracts | |||
| Foreign Exchange | $(427,415 | ) | ||
14
Table of Contents
MFS Global Governments Portfolio
Notes to Financial Statements (unaudited) – continued
The following table presents, by major type of derivative contract, the change in unrealized appreciation or depreciation on derivatives held by the fund for the six months ended June 30, 2019 as reported in the Statement of Operations:
| Risk | Forward Foreign Currency Exchange Contracts | |||
| Foreign Exchange | $(30,621 | ) | ||
Derivative counterparty credit risk is managed through formal evaluation of the creditworthiness of all potential counterparties. On certain, but not all, uncleared derivatives, the fund attempts to reduce its exposure to counterparty credit risk whenever possible by entering into an ISDA Master Agreement on a bilateral basis. The ISDA Master Agreement gives each party to the agreement the right to terminate all transactions traded under such agreement if there is a specified deterioration in the credit quality of the other party. Upon an event of default or a termination of the ISDA Master Agreement, thenon-defaulting party has the right to close out all transactions traded under such agreement and to net amounts owed under each agreement to one net amount payable by one party to the other. This right to close out and net payments across all transactions traded under the ISDA Master Agreement could result in a reduction of the fund’s credit risk to such counterparty equal to any amounts payable by the fund under the applicable transactions, if any.
Collateral and margin requirements differ by type of derivative. For cleared derivatives (e.g., futures contracts, cleared swaps, and exchange-traded options), margin requirements are set by the clearing broker and the clearing house and collateral, in the form of cash or securities, is posted by the fund directly with the clearing broker. Collateral terms are counterparty agreement specific for uncleared derivatives (e.g., forward foreign currency exchange contracts, uncleared swap agreements, and uncleared options) and collateral, in the form of cash and securities, is held in segregated accounts with the fund’s custodian in connection with these agreements. For derivatives traded under an ISDA Master Agreement, which contains a collateral support annex, the collateral requirements are netted across all transactions traded under such counterparty-specific agreement and an amount is posted from one party to the other to collateralize such obligations. Cash that has been segregated or delivered to cover the fund’s collateral or margin obligations under derivative contracts, if any, will be reported separately in the Statement of Assets and Liabilities as restricted cash for uncleared derivatives and/or deposits with brokers for cleared derivatives. Securities pledged as collateral or margin for the same purpose, if any, are noted in the Portfolio of Investments. The fund may be required to make payments of interest on uncovered collateral or margin obligations with the broker. Any such payments are included in “Interest expense and fees” in the Statement of Operations.
Forward Foreign Currency Exchange Contracts – The fund entered into forward foreign currency exchange contracts for the purchase or sale of a specific foreign currency at a fixed price on a future date. These contracts may be used to hedge the fund’s currency risk or fornon-hedging purposes. For hedging purposes, the fund may enter into contracts to deliver or receive foreign currency that the fund will receive from or use in its normal investment activities. The fund may also use contracts to hedge against declines in the value of foreign currency denominated securities due to unfavorable exchange rate movements. Fornon-hedging purposes, the fund may enter into contracts with the intent of changing the relative exposure of the fund’s portfolio of securities to different currencies to take advantage of anticipated exchange rate changes.
Forward foreign currency exchange contracts are adjusted by the daily exchange rate of the underlying currency and any unrealized gains or losses are recorded as a receivable or payable for forward foreign currency exchange contracts until the contract settlement date. On contract settlement date, any gain or loss on the contract is recorded as realized gains or losses on forward foreign currency exchange contracts.
Risks may arise upon entering into these contracts from unanticipated movements in the value of the contract and from the potential inability of counterparties to meet the terms of their contracts. Generally, the fund’s maximum risk due to counterparty credit risk is the unrealized gain on the contract due to the use of Continuous Linked Settlement, a multicurrency cash settlement system for the centralized settlement of foreign transactions. This risk is mitigated in cases where there is an ISDA Master Agreement between the fund and the counterparty providing for netting as described above and, where applicable, by the posting of collateral by the counterparty to the fund to cover the fund’s exposure to the counterparty under such ISDA Master Agreement.
Indemnifications – Under the fund’s organizational documents, its officers and Trustees may be indemnified against certain liabilities and expenses arising out of the performance of their duties to the fund. Additionally, in the normal course of business, the fund enters into agreements with service providers that may contain indemnification clauses. The fund’s maximum exposure under these agreements is unknown as this would involve future claims that may be made against the fund that have not yet occurred.
Investment Transactions and Income – Investment transactions are recorded on the trade date. Interest income is recorded on the accrual basis. All premium and discount is amortized or accreted for financial statement purposes in accordance with U.S. generally accepted accounting principles. Interest payments received in additional securities are recorded on theex-interest date in an amount equal to the value of the security on such date.
15
Table of Contents
MFS Global Governments Portfolio
Notes to Financial Statements (unaudited) – continued
The fund may receive proceeds from litigation settlements. Any proceeds received from litigation involving portfolio holdings are reflected in the Statement of Operations in realized gain/loss if the security has been disposed of by the fund or in unrealized gain/loss if the security is still held by the fund. Any other proceeds from litigation not related to portfolio holdings are reflected as other income in the Statement of Operations.
Tax Matters and Distributions – The fund intends to qualify as a regulated investment company, as defined under Subchapter M of the Internal Revenue Code, and to distribute all of its taxable income, including realized capital gains. As a result, no provision for federal income tax is required. The fund’s federal tax returns, when filed, will remain subject to examination by the Internal Revenue Service for a three year period. Management has analyzed the fund’s tax positions taken on federal and state tax returns for all open tax years and does not believe that there are any uncertain tax positions that require recognition of a tax liability. Foreign taxes, if any, have been accrued by the fund in the accompanying financial statements in accordance with the applicable foreign tax law. Foreign income taxes may be withheld by certain countries in which the fund invests. Additionally, capital gains realized by the fund on securities issued in or by certain foreign countries may be subject to capital gains tax imposed by those countries.
Distributions to shareholders are recorded on theex-dividend date. Income and capital gain distributions are determined in accordance with income tax regulations, which may differ from U.S. generally accepted accounting principles. Certain capital accounts in the financial statements are periodically adjusted for permanent differences in order to reflect their tax character. These adjustments have no impact on net assets or net asset value per share. Temporary differences which arise from recognizing certain items of income, expense, gain or loss in different periods for financial statement and tax purposes will reverse at some time in the future. Distributions in excess of net investment income or net realized gains are temporary overdistributions for financial statement purposes resulting from differences in the recognition or classification of income or distributions for financial statement and tax purposes.
Book/tax differences primarily relate to amortization and accretion of debt securities, wash sale loss deferrals, and straddle loss deferrals.
The tax character of distributions declared to shareholders for the last fiscal year is as follows:
| Year ended 12/31/18 | ||||
| Ordinary income (including any short-term capital gains) | $1,441,037 | |||
The federal tax cost and the tax basis components of distributable earnings were as follows:
| As of 6/30/19 | ||||
| Cost of investments | $128,051,949 | |||
| Gross appreciation | 5,982,400 | |||
| Gross depreciation | (674,804 | ) | ||
| Net unrealized appreciation (depreciation) | $5,307,596 | |||
| As of 12/31/18 | ||||
| Undistributed ordinary income | 3,198,236 | |||
| Capital loss carryforwards | (7,056,379 | ) | ||
| Other temporary differences | (2,715 | ) | ||
| Net unrealized appreciation (depreciation) | (25,120 | ) | ||
The aggregate cost above includes prior fiscal year end tax adjustments, if applicable.
As of December 31, 2018, the fund had capital loss carryforwards available to offset future realized gains. These net capital losses may be carried forward indefinitely and their character is retained as short-term and/or long-term losses. Such losses are characterized as follows:
| Short-Term | $(4,014,241 | ) | ||
| Long-Term | (3,042,138 | ) | ||
| Total | $(7,056,379 | ) |
Multiple Classes of Shares of Beneficial Interest – The fund offers multiple classes of shares, which differ in their respective distribution and/or service fees. The fund’s income, realized and unrealized gain (loss), and common expenses are allocated to shareholders based on the daily net assets of each class. Dividends are declared separately for each class. Differences in per share
16
Table of Contents
MFS Global Governments Portfolio
Notes to Financial Statements (unaudited) – continued
dividend rates are generally due to differences in separate class expenses. The fund’s distributions declared to shareholders as reported in the Statements of Changes in Net Assets are presented by class as follows:
| From net investment income | ||||||||
| Six months ended 6/30/19 | Year ended 12/31/18 | |||||||
| Initial Class | $— | $1,435,695 | ||||||
| Service Class | — | 5,342 | ||||||
| Total | $— | $1,441,037 | ||||||
| (3) | Transactions with Affiliates |
Investment Adviser – The fund has an investment advisory agreement with MFS to provide overall investment management and related administrative services and facilities to the fund. The management fee is computed daily and paid monthly at the following annual rates based on the fund’s average daily net assets:
| Up to $300 million | 0.75% | |||
| In excess of $300 million and up to $1 billion | 0.675% | |||
| In excess of $1 billion | 0.625% |
MFS has agreed in writing to reduce its management fee by a specified amount if certain MFS mutual fund assets exceed thresholds agreed to by MFS and the fund’s Board of Trustees. For the six months ended June 30, 2019, this management fee reduction amounted to $6,393, which is included in the reduction of total expenses in the Statement of Operations. The management fee incurred for the six months ended June 30, 2019 was equivalent to an annual effective rate of 0.74% of the fund’s average daily net assets.
The investment adviser has agreed in writing to pay a portion of the fund’s total annual operating expenses, excluding interest, taxes, extraordinary expenses, brokerage and transaction costs, and investment-related expenses, such that total annual operating expenses do not exceed 1.00% of average daily net assets for the Initial Class shares and 1.25% of average daily net assets for the Service Class shares. This written agreement will continue until modified by the fund’s Board of Trustees, but such agreement will continue at least until April 30, 2021. For the six months ended June 30, 2019, the fund’s actual operating expenses did not exceed the limit and therefore, the investment adviser did not pay any portion of the fund’s expenses related to this agreement.
Distributor – MFS Fund Distributors, Inc. (MFD), a wholly-owned subsidiary of MFS, is the distributor of shares of the fund. The Trustees have adopted a distribution plan for the Service Class shares pursuant to Rule12b-1 under the Investment Company Act of 1940.
The fund’s distribution plan provides that the fund will pay MFD distribution and/or service fees equal to 0.25% per annum of its average daily net assets attributable to Service Class shares as partial consideration for services performed and expenses incurred by MFD and financial intermediaries (including participating insurance companies that invest in the fund to fund variable annuity and variable life insurance contracts, sponsors of qualified retirement and pension plans that invest in the fund, and affiliates of these participating insurance companies and plan sponsors) in connection with the sale and distribution of the Service Class shares. MFD may subsequently pay all, or a portion, of the distribution and/or service fees to financial intermediaries.
Shareholder Servicing Agent – MFS Service Center, Inc. (MFSC), a wholly-owned subsidiary of MFS, receives a fee from the fund for its services as shareholder servicing agent. For the six months ended June 30, 2019, the fee was $667, which equated to 0.0010% annually of the fund’s average daily net assets. MFSC also receives payment from the fund forout-of-pocket expenses paid by MFSC on behalf of the fund. For the six months ended June 30, 2019, these costs amounted to $61.
Administrator – MFS provides certain financial, legal, shareholder communications, compliance, and other administrative services to the fund. Under an administrative services agreement, the fund reimburses MFS the costs incurred to provide these services. The fund is charged an annual fixed amount of $17,500 plus a fee based on average daily net assets. The administrative services fee incurred for the six months ended June 30, 2019 was equivalent to an annual effective rate of 0.0219% of the fund’s average daily net assets.
Trustees’ and Officers’ Compensation – The fund pays compensation to independent Trustees in the form of a retainer, attendance fees, and additional compensation to Board and Committee chairpersons. The fund does not pay compensation directly to Trustees or officers of the fund who are also officers of the investment adviser, all of whom receive remuneration from MFS for their services to the fund. Certain officers and Trustees of the fund are officers or directors of MFS, MFD, and MFSC.
Other – This fund and certain other funds managed by MFS (the funds) had entered into a service agreement (the ISO Agreement) which provided for payment of fees solely by the funds to Tarantino LLC in return for the provision of services of an Independent Senior Officer (ISO) for the funds. Frank L. Tarantino served as the ISO and was an officer of the funds and the sole member of Tarantino LLC. Effective June 30, 2019, Mr. Tarantino retired from his position as ISO for the funds, and the ISO Agreement was
17
Table of Contents
MFS Global Governments Portfolio
Notes to Financial Statements (unaudited) – continued
terminated. For the six months ended June 30, 2019, the fee paid by the fund under this agreement was $165 and is included in “Miscellaneous” expense in the Statement of Operations. MFS had agreed to bear all expenses associated with office space, other administrative support, and supplies provided to the ISO.
The fund invests in the MFS Institutional Money Market Portfolio which is managed by MFS and seeks current income consistent with preservation of capital and liquidity. This money market fund does not pay a management fee to MFS.
| (4) | Portfolio Securities |
For the six months ended June 30, 2019, purchases and sales of investments, other than short-term obligations, were as follows:
| Purchases | Sales | |||||||
| U.S. Government securities | $32,497,720 | $42,371,234 | ||||||
| Non-U.S. Government securities | $39,146,308 | $57,926,451 | ||||||
| (5) | Shares of Beneficial Interest |
The fund’s Declaration of Trust permits the Trustees to issue an unlimited number of full and fractional shares of beneficial interest. Transactions in fund shares were as follows:
| Six months ended 6/30/19 | Year ended 12/31/18 | |||||||||||||||
| Shares | Amount | Shares | Amount | |||||||||||||
| Shares sold | ||||||||||||||||
Initial Class | 100,289 | $1,047,334 | 70,831 | $740,148 | ||||||||||||
Service Class | 2,645 | 27,261 | 13,882 | 144,462 | ||||||||||||
| 102,934 | $1,074,595 | 84,713 | $884,610 | |||||||||||||
| Shares issued to shareholders in reinvestment of distributions | ||||||||||||||||
Initial Class | — | $— | 140,068 | $1,435,695 | ||||||||||||
Service Class | — | — | 531 | 5,342 | ||||||||||||
| — | $— | 140,599 | $1,441,037 | |||||||||||||
| Shares reacquired | ||||||||||||||||
Initial Class | (839,924 | ) | $(8,843,154 | ) | (2,278,906 | ) | $(23,714,753 | ) | ||||||||
Service Class | (10,449 | ) | (107,142 | ) | (32,954 | ) | (339,471 | ) | ||||||||
| (850,373 | ) | $(8,950,296 | ) | (2,311,860 | ) | $(24,054,224 | ) | |||||||||
| Net change | ||||||||||||||||
Initial Class | (739,635 | ) | $(7,795,820 | ) | (2,068,007 | ) | $(21,538,910 | ) | ||||||||
Service Class | (7,804 | ) | (79,881 | ) | (18,541 | ) | (189,667 | ) | ||||||||
| (747,439 | ) | $(7,875,701 | ) | (2,086,548 | ) | $(21,728,577 | ) | |||||||||
The fund is one of several mutual funds in which certain MFS funds may invest. The MFS funds do not invest in the underlying funds for the purpose of exercising management or control. At the end of the period, the MFS Moderate Allocation Portfolio and the MFS Conservative Allocation Portfolio were the owners of record of approximately 53% and 27%, respectively, of the value of outstanding voting shares of the fund.
| (6) | Line of Credit |
The fund and certain other funds managed by MFS participate in a $1.25 billion unsecured committed line of credit, subject to a $1 billion sublimit, provided by a syndicate of banks under a credit agreement. Borrowings may be made for temporary financing needs. Interest is charged to each fund, based on its borrowings, generally at a rate equal to the highest of one month LIBOR, the Federal Funds Effective Rate and the Overnight Bank Funding Rate, plus an agreed upon spread. A commitment fee, based on the average daily, unused portion of the committed line of credit, is allocated among the participating funds. In addition, the fund and other funds managed by MFS have established unsecured uncommitted borrowing arrangements with certain banks for temporary financing needs. Interest is charged to each fund, based on its borrowings, at rates equal to customary reference rates plus an agreed upon spread. For the six months ended June 30, 2019, the fund’s commitment fee and interest expense were $431 and $0, respectively, and are included in “Miscellaneous” expense in the Statement of Operations.
18
Table of Contents
MFS Global Governments Portfolio
Notes to Financial Statements (unaudited) – continued
| (7) | Investments in Affiliated Issuers |
An affiliated issuer may be considered one in which the fund owns 5% or more of the outstanding voting securities, or a company which is under common control. For the purposes of this report, the following were affiliated issuers:
| Affiliated Issuers | Beginning Value | Purchases | Sales Proceeds | Realized Gain (Loss) | Change in Unrealized Appreciation or Depreciation | Ending Value | ||||||||||||||||||
| MFS Institutional Money Market Portfolio | $902,742 | $46,690,848 | $33,469,943 | $(939 | ) | $2,634 | $14,125,342 | |||||||||||||||||
| Affiliated Issuers | Dividend Income | Capital Gain Distributions | ||||||||||||||||||||||
| MFS Institutional Money Market Portfolio | $145,624 | $— | ||||||||||||||||||||||
19
Table of Contents
MFS Global Governments Portfolio
PROXY VOTING POLICIES AND INFORMATION
MFS votes proxies on behalf of the fund pursuant to proxy voting policies and procedures that are available without charge, upon request, by calling 1-800-225-2606, by visitingmfs.com/proxyvoting, or by visiting the SEC’s Web site athttp://www.sec.gov.
Information regarding how the fund voted proxies relating to portfolio securities during the most recent twelve-month period ended June 30 is available by August 31 of each year without charge by visitingmfs.com/proxyvoting, or by visiting the SEC’s Web site athttp://www.sec.gov.
QUARTERLY PORTFOLIO DISCLOSURE
The fund files a complete schedule of portfolio holdings with the SEC for the first and third quarters of each fiscal year on Form N-Q or as an exhibit to its reports on Form N-PORT (for first and third fiscal quarters ending March 31, 2019 or after). The fund’sForm N-Q or Form N-PORT reports are available on the SEC’s website athttp://www.sec.gov.A shareholder can obtain the portfolio holdings report for the first and third quarters of the fund’s fiscal year atmfs.com/vit2 by choosing the fund’s name and then selecting the “Resources” tab and clicking on “Prospectus and Reports”.
From time to time, MFS may post important information about the fund or the MFS funds on the MFS web site (mfs.com). This information is available athttps://www.mfs.com/en-us/what-we-do/announcements.htmlor atmfs.com/vit2 by choosing the fund’s name.
INFORMATION ABOUT FUND CONTRACTS AND LEGAL CLAIMS
The fund has entered into contractual arrangements with an investment adviser, administrator, distributor, shareholder servicing agent, 529 program manager (if applicable), and custodian who each provide services to the fund. Unless expressly stated otherwise, shareholders are not parties to, or intended beneficiaries of these contractual arrangements, and these contractual arrangements are not intended to create any shareholder right to enforce them against the service providers or to seek any remedy under them against the service providers, either directly or on behalf of the fund.
Under the Trust’s By-Laws and Declaration of Trust, any claims asserted against or on behalf of the MFS Funds, including claims against Trustees and Officers, must be brought in state and federal courts located within the Commonwealth of Massachusetts.
20
Table of Contents
Table of Contents
Semiannual Report
June 30, 2019

MFS® Global Growth Portfolio

MFS® Variable Insurance Trust II
Beginning on January 1, 2021, as permitted by regulations adopted by the U.S. Securities and Exchange Commission, the insurance company that offers your contract may determine that it will no longer send you paper copies of the fund’s annual and semiannual shareholder reports unless you specifically request paper copies from the insurance company or from your financial intermediary. Instead, the shareholder reports will be made available on a Web site (insurancefunds.mfs.com or other Web site of which you will be notified), and the insurance company will notify you by mail each time a report is posted and provide you with a Web site link to access the report. Instructions for requesting paper copies will be provided by your insurance company or financial intermediary.
If you already elected to receive shareholder reports by email, you will not be affected by this change and you need not take any action. If your insurance company or financial intermediary offers electronic delivery, you may elect to receive shareholder reports and other communications from the insurance company or financial intermediary by email by following the instructions provided by the insurance company or financial intermediary.
Beginning on January 1, 2019, you may elect to receive all future reports in paper free of charge from the insurance company or financial intermediary. You can inform the insurance company or financial intermediary that you wish to continue receiving paper copies of your shareholder reports by contacting your insurance company or financial intermediary. Your election to receive reports in paper will apply to all funds held in your account with your insurance company or financial intermediary.
WGO-SEM
Table of Contents
MFS® Global Growth Portfolio
The report is prepared for the general information of contract owners. It is authorized for distribution to prospective investors only when preceded or accompanied by a current prospectus.
NOT FDIC INSURED• MAY LOSE VALUE• NO BANK OR CREDIT UNION GUARANTEE• NOT A DEPOSIT• NOT INSURED BY ANY FEDERAL GOVERNMENT AGENCY OR NCUA/NCUSIF
Table of Contents
MFS Global Growth Portfolio
LETTER FROM THE EXECUTIVE CHAIRMAN

Dear Contract Owners:
Slowing global growth, low inflation, and increasing trade friction between the United States and China have been hallmarks of the past 12 months. After experiencing an uptick in market volatility in late 2018, markets steadied during the first half of 2019, thanks in large measure to the adoption of a dovish policy stance on the part of global central banks, who have largely abandoned efforts to normalize interest rates and have instead focused on supporting economic growth. Trade tensions remain high as the U.S. has ratcheted up tariffs on Chinese imports and China has retaliated. A truce of sorts was reached midyear, but significant challenges continue to confront negotiators, and it is not known whether a comprehensive agreement can be reached.
With Boris Johnson replacing Theresa May as Britain’s prime minister, uncertainty over Brexit remains high. Johnson has adopted a more combative stance than his predecessor toward the European Union, increasing concerns that there will be a “hard” Brexit.
Markets expect that the longest economic expansion in U.S. history will continue for the time being, albeit at a slower pace. Nevertheless, slower growth and low inflation have spurred the U.S. Federal Reserve to take a more accommodative policy stance, prompting investors to anticipate several interest rate cuts in the coming year. The European Central Bank has adopted a similar position. The more accommodative environment has helped fuel a continued rise in global equities and has been broadly supportive of risk assets.
Since launching the first U.S.open-end mutual fund in 1924, MFS® has been committed to a single purpose: to create value by allocating capital responsibly for clients. Through our powerful global investment platform, we combine collective expertise, thoughtful risk management, and long-term discipline to uncover what we believe are the best investment opportunities in the market.
Respectfully,

Robert J. Manning
Executive Chairman
MFS Investment Management
August 16, 2019
The opinions expressed in this letter are subject to change and may not be relied upon for investment advice. No forecasts can be guaranteed.
1
Table of Contents
MFS Global Growth Portfolio
Portfolio structure
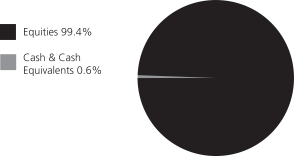
| Top ten holdings | ||||
| Alphabet, Inc., “A” | 3.2% | |||
| Microsoft Corp. | 3.2% | |||
| Accenture PLC, “A” | 2.1% | |||
| Nestle S.A. | 2.1% | |||
| LVMH Moet Hennessy Louis Vuitton SE | 2.1% | |||
| Aon PLC | 1.9% | |||
| Taiwan Semiconductor Manufacturing Co. Ltd., ADR | 1.8% | |||
| Visa, Inc., “A” | 1.8% | |||
| Thermo Fisher Scientific, Inc. | 1.8% | |||
| Reckitt Benckiser Group PLC | 1.7% | |||
| GICS equity sectors (g) | ||||
| Information Technology | 19.7% | |||
| Consumer Discretionary | 15.9% | |||
| Consumer Staples | 13.6% | |||
| Industrials | 12.8% | |||
| Health Care | 12.3% | |||
| Financials | 9.1% | |||
| Communication Services | 8.5% | |||
| Materials | 7.1% | |||
| Energy | 0.4% | |||
| Issuer country weightings (x) | ||||
| United States | 59.7% | |||
| United Kingdom | 6.2% | |||
| Switzerland | 6.0% | |||
| France | 5.2% | |||
| Germany | 4.1% | |||
| Japan | 3.5% | |||
| China | 3.3% | |||
| India | 2.2% | |||
| South Korea | 2.0% | |||
| Other Countries | 7.8% | |||
| Currency exposure weightings (y) | ||||
| United States Dollar | 60.5% | |||
| Euro | 10.2% | |||
| British Pound Sterling | 7.3% | |||
| Swiss Franc | 6.0% | |||
| Japanese Yen | 3.5% | |||
| Chinese Renminbi | 3.3% | |||
| Indian Rupee | 2.2% | |||
| South Korean Won | 2.0% | |||
| Taiwan Dollar | 1.8% | |||
| Other Currencies | 3.2% | |||
| (g) | The Global Industry Classification Standard (GICS®) was developed by and/or is the exclusive property of MSCI, Inc. and S&P Global Market Intelligence Inc. (“S&P Global Market Intelligence”). GICS is a service mark of MSCI and S&P Global Market Intelligence and has been licensed for use by MFS. |
| (x) | Represents the portfolio’s exposure to issuer countries as a percentage of a portfolio’s net assets. For purposes of this presentation, United States includes Cash & Cash Equivalents. |
| (y) | Represents the portfolio’s exposure to a particular currency as a percentage of a portfolio’s net assets. For purposes of this presentation, United States Dollar includes Cash & Cash Equivalents. |
Cash & Cash Equivalents includes any cash, investments in money market funds, short-term securities, and other assets less liabilities. Please see the Statement of Assets and Liabilities for additional information related to the fund’s cash position and other assets and liabilities.
Percentages are based on net assets as of June 30, 2019.
The portfolio is actively managed and current holdings may be different.
2
Table of Contents
MFS Global Growth Portfolio
Fund Expenses Borne by the Contract Holders during the Period,
January 1, 2019 through June 30, 2019
As a contract holder of the fund, you incur ongoing costs, including management fees; distribution and/or service(12b-1) fees; and other fund expenses. This example is intended to help you understand your ongoing costs (in dollars) of investing in the fund and to compare these costs with the ongoing costs of investing in other mutual funds.
The example is based on an investment of $1,000 invested at the beginning of the period and held for the entire period January 1, 2019 through June 30, 2019.
Actual Expenses
The first line for each share class in the following table provides information about actual account values and actual expenses. You may use the information in this line, together with the amount you invested, to estimate the expenses that you paid over the period. Simply divide your account value by $1,000 (for example, an $8,600 account value divided by $1,000 = 8.6), then multiply the result by the number in the first line under the heading entitled “Expenses Paid During Period” to estimate the expenses you paid on your account during this period.
Hypothetical Example for Comparison Purposes
The second line for each share class in the following table provides information about hypothetical account values and hypothetical expenses based on the fund’s actual expense ratio and an assumed rate of return of 5% per year before expenses, which is not the fund’s actual return. The hypothetical account values and expenses may not be used to estimate the actual ending account balance or expenses you paid for the period. You may use this information to compare the ongoing costs of investing in the fund and other funds. To do so, compare this 5% hypothetical example with the 5% hypothetical examples that appear in the shareholder reports of the other funds.
Please note that the expenses shown in the table are meant to highlight the fund’s ongoing costs only and do not take into account the fees and expenses imposed under the variable contracts through which your investment in the fund is made. Therefore, the second line for each share class in the table is useful in comparing ongoing costs associated with an investment in vehicles (such as the fund) which fund benefits under variable annuity and variable life insurance contracts and to qualified pension and retirement plans only, and will not help you determine the relative total costs of investing in the fund through variable annuity and variable life insurance contracts. If the fees and expenses imposed under the variable contracts were included, your costs would have been higher.
| Share Class | Annualized Expense Ratio | Beginning Account Value 1/01/19 | Ending Account Value 6/30/19 | Expenses Paid During Period (p) 1/01/19-6/30/19 | ||||||||||||||
| Initial Class | Actual | 1.00% | $1,000.00 | $1,217.12 | $5.50 | |||||||||||||
| Hypothetical (h) | 1.00% | $1,000.00 | $1,019.84 | $5.01 | ||||||||||||||
| Service Class | Actual | 1.25% | $1,000.00 | $1,215.65 | $6.87 | |||||||||||||
| Hypothetical (h) | 1.25% | $1,000.00 | $1,018.60 | $6.26 | ||||||||||||||
| (h) | 5% class return per year before expenses. |
| (p) | “Expenses Paid During Period” are equal to each class’s annualized expense ratio, as shown above, multiplied by the average account value over the period, multiplied by 181/365 (to reflect theone-half year period). |
3
Table of Contents
MFS Global Growth Portfolio
PORTFOLIO OF INVESTMENTS – 6/30/19 (unaudited)
The Portfolio of Investments is a complete list of all securities owned by your fund. It is categorized by broad-based asset classes.
| Issuer | Shares/Par | Value ($) | ||||||
| COMMON STOCKS – 99.4% | ||||||||
| Aerospace – 1.3% |
| |||||||
| United Technologies Corp. | 5,113 | $ | 665,713 | |||||
|
| |||||||
| Airlines – 0.9% |
| |||||||
| Aena S.A. | 2,364 | $ | 468,537 | |||||
|
| |||||||
| Alcoholic Beverages – 4.0% |
| |||||||
| Ambev S.A., ADR | 96,901 | $ | 452,528 | |||||
| Diageo PLC | 10,125 | 435,123 | ||||||
| Kweichow Moutai Co., Ltd., “A” | 4,000 | 573,067 | ||||||
| Pernod Ricard S.A. | 3,138 | 578,230 | ||||||
|
| |||||||
| $ | 2,038,948 | |||||||
|
| |||||||
| Apparel Manufacturers – 6.8% |
| |||||||
| Adidas AG | 2,517 | $ | 777,055 | |||||
| Burberry Group PLC | 10,226 | 241,809 | ||||||
| Compagnie Financiere Richemont S.A. | 4,088 | 346,906 | ||||||
| LVMH Moet Hennessy Louis Vuitton SE | 2,514 | 1,070,000 | ||||||
| NIKE, Inc., “B” | 7,168 | 601,754 | ||||||
| VF Corp. | 4,481 | 391,415 | ||||||
|
| |||||||
| $ | 3,428,939 | |||||||
|
| |||||||
| Broadcasting – 0.4% |
| |||||||
| Walt Disney Co. | 1,500 | $ | 209,460 | |||||
|
| |||||||
| Brokerage & Asset Managers – 2.9% |
| |||||||
| Blackstone Group LP | 15,808 | $ | 702,191 | |||||
| Charles Schwab Corp. | 6,673 | 268,188 | ||||||
| TD Ameritrade Holding Corp. | 10,465 | 522,413 | ||||||
|
| |||||||
| $ | 1,492,792 | |||||||
|
| |||||||
| Business Services – 10.9% |
| |||||||
| Accenture PLC, “A” | 5,903 | $ | 1,090,697 | |||||
| Brenntag AG | 6,366 | 313,512 | ||||||
| Cognizant Technology Solutions Corp., “A” | 9,605 | 608,861 | ||||||
| Compass Group PLC | 13,030 | 312,250 | ||||||
| Equifax, Inc. | 2,565 | 346,891 | ||||||
| Experian PLC | 21,127 | 639,633 | ||||||
| Fidelity National Information Services, Inc. | 6,474 | 794,230 | ||||||
| Fiserv, Inc. (a) | 7,352 | 670,208 | ||||||
| Intertek Group PLC | 3,365 | 235,121 | ||||||
| Verisk Analytics, Inc., “A” | 3,604 | 527,842 | ||||||
|
| |||||||
| $ | 5,539,245 | |||||||
|
| |||||||
| Cable TV – 1.6% |
| |||||||
| Comcast Corp., “A” | 19,152 | $ | 809,747 | |||||
|
| |||||||
| Chemicals – 1.3% |
| |||||||
| PPG Industries, Inc. | 5,782 | $ | 674,817 | |||||
|
| |||||||
| Computer Software – 3.2% |
| |||||||
| Microsoft Corp. | 12,052 | $ | 1,614,486 | |||||
|
| |||||||
| Computer Software – Systems – 1.3% |
| |||||||
| Apple, Inc. | 3,311 | $ | 655,313 | |||||
|
| |||||||
| Construction – 1.1% |
| |||||||
| Sherwin-Williams Co. | 1,261 | $ | 577,904 | |||||
|
| |||||||
| Issuer | Shares/Par | Value ($) | ||||||
| COMMON STOCKS – continued | ||||||||
| Consumer Products – 5.2% |
| |||||||
| Colgate-Palmolive Co. | 6,755 | $ | 484,131 | |||||
| Estee Lauder Cos., Inc., “A” | 3,498 | 640,519 | ||||||
| KOSE Corp. | 1,200 | 201,122 | ||||||
| L’Oréal | 1,635 | 465,719 | ||||||
| Reckitt Benckiser Group PLC | 10,956 | 864,589 | ||||||
|
| |||||||
| $ | 2,656,080 | |||||||
|
| |||||||
| Electrical Equipment – 3.2% |
| |||||||
| Amphenol Corp., “A” | 5,501 | $ | 527,766 | |||||
| Fortive Corp. | 5,797 | 472,571 | ||||||
| Mettler-Toledo International, Inc. (a) | 725 | 609,000 | ||||||
|
| |||||||
| $ | 1,609,337 | |||||||
|
| |||||||
| Electronics – 5.1% |
| |||||||
| Analog Devices, Inc. | 5,567 | $ | 628,348 | |||||
| Samsung Electronics Co. Ltd. | 9,561 | 389,180 | ||||||
| Taiwan Semiconductor Manufacturing Co. Ltd., ADR | 23,452 | 918,615 | ||||||
| Texas Instruments, Inc. | 5,912 | 678,461 | ||||||
|
| |||||||
| $ | 2,614,604 | |||||||
|
| |||||||
| Food & Beverages – 4.0% |
| |||||||
| Chr. Hansen Holding A.S. | 1,281 | $ | 120,291 | |||||
| Danone S.A. | 5,994 | 507,776 | ||||||
| Nestle S.A. | 10,522 | 1,089,278 | ||||||
| PepsiCo, Inc. | 2,338 | 306,582 | ||||||
|
| |||||||
| $ | 2,023,927 | |||||||
|
| |||||||
| Food & Drug Stores – 0.6% |
| |||||||
| Sundrug Co. Ltd. | 11,700 | $ | 316,442 | |||||
|
| |||||||
| Gaming & Lodging – 2.5% |
| |||||||
| Flutter Entertainment PLC | 7,269 | $ | 547,229 | |||||
| Marriott International, Inc., “A” | 5,032 | 705,939 | ||||||
|
| |||||||
| $ | 1,253,168 | |||||||
|
| |||||||
| General Merchandise – 2.1% |
| |||||||
| Dollarama, Inc. | 24,017 | $ | 844,918 | |||||
| Lojas Renner S.A. | 16,936 | 207,997 | ||||||
|
| |||||||
| $ | 1,052,915 | |||||||
|
| |||||||
| Health Maintenance Organizations – 0.6% |
| |||||||
| Cigna Corp. | 2,026 | $ | 319,196 | |||||
|
| |||||||
| Insurance – 1.9% |
| |||||||
| Aon PLC | 4,909 | $ | 947,339 | |||||
|
| |||||||
| Internet – 6.6% |
| |||||||
| Alibaba Group Holding Ltd., ADR (a) | 4,110 | $ | 696,440 | |||||
| Alphabet, Inc., “A” (a) | 1,513 | 1,638,276 | ||||||
| Baidu, Inc., ADR (a) | 3,326 | 390,339 | ||||||
| NAVER Corp. | 6,513 | 643,037 | ||||||
|
| |||||||
| $ | 3,368,092 | |||||||
|
| |||||||
| Leisure & Toys – 1.2% |
| |||||||
| Electronic Arts, Inc. (a) | 5,930 | $ | 600,472 | |||||
|
| |||||||
4
Table of Contents
MFS Global Growth Portfolio
Portfolio of Investments (unaudited) – continued
| Issuer | Shares/Par | Value ($) | ||||||
| COMMON STOCKS – continued |
| |||||||
| Machinery & Tools – 3.4% |
| |||||||
| Daikin Industries Ltd. | 5,000 | $ | 652,275 | |||||
| Nordson Corp. | 5,987 | 846,023 | ||||||
| Schindler Holding AG | 1,115 | 248,196 | ||||||
|
| |||||||
| $ | 1,746,494 | |||||||
|
| |||||||
| Medical Equipment – 6.3% | ||||||||
| Abbott Laboratories | 8,173 | $ | 687,349 | |||||
| Becton, Dickinson and Co. | 2,502 | 630,529 | ||||||
| Danaher Corp. | 2,918 | 417,040 | ||||||
| Thermo Fisher Scientific, Inc. | 3,051 | 896,018 | ||||||
| Waters Corp. (a) | 2,553 | 549,508 | ||||||
|
| |||||||
| $ | 3,180,444 | |||||||
|
| |||||||
| Oil Services – 0.4% | ||||||||
| Schlumberger Ltd. | 4,896 | $ | 194,567 | |||||
|
| |||||||
| Other Banks & Diversified Financials – 5.8% |
| |||||||
| Credicorp Ltd. | 1,761 | $ | 403,110 | |||||
| HDFC Bank Ltd. | 22,155 | 784,344 | ||||||
| Julius Baer Group Ltd. | 7,521 | 334,832 | ||||||
| Mastercard, Inc., “A” | 1,968 | 520,595 | ||||||
| Visa, Inc., “A” | 5,207 | 903,675 | ||||||
|
| |||||||
| $ | 2,946,556 | |||||||
|
| |||||||
| Pharmaceuticals – 4.2% | ||||||||
| Bayer AG | 11,231 | $ | 778,251 | |||||
| Elanco Animal Health, Inc. (a) | 14,644 | 494,967 | ||||||
| Roche Holding AG | 2,148 | 604,331 | ||||||
| Zoetis, Inc. | 2,301 | 261,141 | ||||||
|
| |||||||
| $ | 2,138,690 | |||||||
|
| |||||||
| Printing & Publishing – 1.3% | ||||||||
| Moody’s Corp. | 3,485 | $ | 680,655 | |||||
|
| |||||||
| Railroad & Shipping – 2.2% |
| |||||||
| Adani Ports and Special Economic Zone Ltd. | 55,594 | $ | 330,371 | |||||
| Union Pacific Corp. | 4,575 | 773,678 | ||||||
|
| |||||||
| $ | 1,104,049 | |||||||
|
| |||||||
| Restaurants – 1.3% | ||||||||
| Starbucks Corp. | 7,645 | $ | 640,880 | |||||
|
| |||||||
| Issuer | Shares/Par | Value ($) | ||||||
| COMMON STOCKS – continued |
| |||||||
| Specialty Chemicals – 4.4% | ||||||||
| Croda International PLC | 6,895 | $ | 448,322 | |||||
| Ecolab, Inc. | 2,740 | 540,986 | ||||||
| Kansai Paint Co. Ltd. | 29,800 | 624,386 | ||||||
| Sika AG | 2,362 | 403,103 | ||||||
| Symrise AG | 2,243 | 215,876 | ||||||
|
| |||||||
| $ | 2,232,673 | |||||||
|
| |||||||
| Specialty Stores – 1.4% | ||||||||
| TJX Cos., Inc. | 13,513 | $ | 714,567 | |||||
|
| |||||||
| Total Common Stocks (Identified Cost, $30,405,309) | $ | 50,517,048 | ||||||
|
| |||||||
| INVESTMENT COMPANIES (h) – 0.6% |
| |||||||
| Money Market Funds – 0.6% | ||||||||
| MFS Institutional Money Market Portfolio, 2.42% (v) (Identified Cost, $277,606) | 277,632 | $ | 277,660 | |||||
|
| |||||||
| OTHER ASSETS, LESS LIABILITIES – 0.0% | 17,445 | |||||||
|
| |||||||
| NET ASSETS – 100.0% | $ | 50,812,153 | ||||||
|
| |||||||
| (a) | Non-income producing security. |
| (h) | An affiliated issuer, which may be considered one in which the fund owns 5% or more of the outstanding voting securities, or a company which is under common control. At period end, the aggregate values of the fund’s investments in affiliated issuers and in unaffiliated issuers were $277,660 and $50,517,048, respectively. |
| (v) | Affiliated issuer that is available only to investment companies managed by MFS. The rate quoted for the MFS Institutional Money Market Portfolio is the annualizedseven-day yield of the fund at period end. |
The following abbreviations are used in this report and are defined:
| ADR | American Depositary Receipt |
See Notes to Financial Statements
5
Table of Contents
MFS Global Growth Portfolio
FINANCIAL STATEMENTS | STATEMENT OF ASSETS AND LIABILITIES (unaudited)
This statement represents your fund’s balance sheet, which details the assets and liabilities comprising the total value of the fund.
At 6/30/19 | ||||
Assets | ||||
Investments in unaffiliated issuers, at value (identified cost, $30,405,309) | $50,517,048 | |||
Investments in affiliated issuers, at value (identified cost, $277,606) | 277,660 | |||
Cash | 4 | |||
Foreign currency, at value (identified cost, $16,361) | 16,367 | |||
Receivables for | ||||
Dividends | 110,727 | |||
Receivable from investment adviser | 3,824 | |||
Other assets | 336 | |||
Total assets | $50,925,966 | |||
Liabilities | ||||
Payables for | ||||
Fund shares reacquired | $32,492 | |||
Payable to affiliates | ||||
Administrative services fee | 193 | |||
Shareholder servicing costs | 7 | |||
Distribution and/or service fees | 53 | |||
Payable for independent Trustees’ compensation | 171 | |||
Deferred country tax expense payable | 17,260 | |||
Accrued expenses and other liabilities | 63,637 | |||
Total liabilities | $113,813 | |||
Net assets | $50,812,153 | |||
Net assets consist of | ||||
Paid-in capital | $22,690,469 | |||
Total distributable earnings (loss) | 28,121,684 | |||
Net assets | $50,812,153 | |||
Shares of beneficial interest outstanding | 1,760,112 | |||
| Net assets | Shares outstanding | Net asset value per share | ||||||||||
Initial Class | $48,860,444 | 1,692,238 | $28.87 | |||||||||
Service Class | 1,951,709 | 67,874 | 28.75 | |||||||||
See Notes to Financial Statements
6
Table of Contents
MFS Global Growth Portfolio
FINANCIAL STATEMENTS | STATEMENT OF OPERATIONS (unaudited)
This statement describes how much your fund earned in investment income and accrued in expenses. It also describes any gains and/or losses generated by fund operations.
Six months ended 6/30/19 | ||||
Net investment income (loss) | ||||
Income | ||||
Dividends | $513,249 | |||
Dividends from affiliated issuers | 4,485 | |||
Income on securities loaned | 3,812 | |||
Other | 1,711 | |||
Foreign taxes withheld | (38,945 | ) | ||
Total investment income | $484,312 | |||
Expenses | ||||
Management fee | $221,171 | |||
Distribution and/or service fees | 2,315 | |||
Shareholder servicing costs | 610 | |||
Administrative services fee | 8,696 | |||
Independent Trustees’ compensation | 956 | |||
Custodian fee | 11,730 | |||
Shareholder communications | 4,585 | |||
Audit and tax fees | 37,379 | |||
Legal fees | 313 | |||
Miscellaneous | 11,994 | |||
Total expenses | $299,749 | |||
Reduction of expenses by investment adviser | (51,428 | ) | ||
Net expenses | $248,321 | |||
Net investment income (loss) | $235,991 | |||
Realized and unrealized gain (loss) | ||||
Realized gain (loss) (identified cost basis) | ||||
Unaffiliated issuers (net of $238 country tax) | $2,336,653 | |||
Affiliated issuers | 16 | |||
Foreign currency | (3,070 | ) | ||
Net realized gain (loss) | $2,333,599 | |||
Change in unrealized appreciation or depreciation | ||||
Unaffiliated issuers (net of $13,396 increase in deferred country tax) | $7,049,964 | |||
Affiliated issuers | 54 | |||
Translation of assets and liabilities in foreign currencies | 610 | |||
Net unrealized gain (loss) | $7,050,628 | |||
Net realized and unrealized gain (loss) | $9,384,227 | |||
Change in net assets from operations | $9,620,218 | |||
See Notes to Financial Statements
7
Table of Contents
MFS Global Growth Portfolio
FINANCIAL STATEMENTS | STATEMENTS OF CHANGES IN NET ASSETS
These statements describe the increases and/or decreases in net assets resulting from operations, any distributions, and any shareholder transactions.
| Six months ended 6/30/19 | Year ended 12/31/18 | |||||||
| (unaudited) | ||||||||
Change in net assets | ||||||||
From operations | ||||||||
Net investment income (loss) | $235,991 | $301,848 | ||||||
Net realized gain (loss) | 2,333,599 | 5,297,817 | ||||||
Net unrealized gain (loss) | 7,050,628 | (7,698,534 | ) | |||||
Change in net assets from operations | $9,620,218 | $(2,098,869 | ) | |||||
Total distributions to shareholders | $— | $(3,336,024 | ) | |||||
Change in net assets from fund share transactions | $(4,481,280 | ) | $(6,308,369 | ) | ||||
Total change in net assets | $5,138,938 | $(11,743,262 | )�� | |||||
Net assets | ||||||||
At beginning of period | 45,673,215 | 57,416,477 | ||||||
At end of period | $50,812,153 | $45,673,215 | ||||||
See Notes to Financial Statements
8
Table of Contents
MFS Global Growth Portfolio
FINANCIAL STATEMENTS | FINANCIAL HIGHLIGHTS
The financial highlights table is intended to help you understand the fund’s financial performance for the semiannual period and the past 5 fiscal years. Certain information reflects financial results for a single fund share. The total returns in the table represent the rate that an investor would have earned (or lost) on an investment in the fund share class (assuming reinvestment of all distributions) held for the entire period.
| Initial Class | Six months ended | Year ended | ||||||||||||||||||||||
| 12/31/18 | 12/31/17 | 12/31/16 | 12/31/15 | 12/31/14 | ||||||||||||||||||||
| (unaudited) | ||||||||||||||||||||||||
Net asset value, beginning of period | $23.72 | $26.53 | $21.00 | $20.88 | $22.45 | $21.63 | ||||||||||||||||||
| Income (loss) from investment operations | ||||||||||||||||||||||||
Net investment income (loss) (d) | $0.13 | $0.15 | $0.13 | $0.25 | (c) | $0.12 | $0.20 | |||||||||||||||||
Net realized and unrealized gain (loss) | 5.02 | (1.23 | ) | 6.51 | 1.08 | (0.53 | ) | 0.73 | ||||||||||||||||
Total from investment operations | $5.15 | $(1.08 | ) | $6.64 | $1.33 | $(0.41 | ) | $0.93 | ||||||||||||||||
| Less distributions declared to shareholders | ||||||||||||||||||||||||
From net investment income | $— | $(0.14 | ) | $(0.27 | ) | $(0.13 | ) | $(0.22 | ) | $(0.11 | ) | |||||||||||||
From net realized gain | — | (1.59 | ) | (0.84 | ) | (1.08 | ) | (0.94 | ) | — | ||||||||||||||
Total distributions declared to shareholders | $— | $(1.73 | ) | $(1.11 | ) | $(1.21 | ) | $(1.16 | ) | $(0.11 | ) | |||||||||||||
Net asset value, end of period (x) | $28.87 | $23.72 | $26.53 | $21.00 | $20.88 | $22.45 | ||||||||||||||||||
Total return (%) (k)(r)(s)(x) | 21.71 | (n) | (4.83 | ) | 32.14 | 6.07 | (c) | (1.54 | ) | 4.32 | ||||||||||||||
| Ratios (%) (to average net assets) and Supplemental data: | ||||||||||||||||||||||||
Expenses before expense reductions (f) | 1.21 | (a) | 1.17 | 1.17 | 0.72 | (c) | 1.17 | 1.20 | ||||||||||||||||
Expenses after expense reductions (f) | 1.00 | (a) | 1.00 | 1.00 | 0.55 | (c) | 1.01 | 1.12 | ||||||||||||||||
Net investment income (loss) | 0.97 | (a) | 0.56 | 0.55 | 1.18 | (c) | 0.52 | 0.91 | ||||||||||||||||
Portfolio turnover | 9 | (n) | 22 | 21 | 25 | 26 | 25 | |||||||||||||||||
Net assets at end of period (000 omitted) | $48,860 | $43,919 | $54,886 | $46,182 | $48,932 | $55,050 | ||||||||||||||||||
| Service Class | Six months ended | Year ended | ||||||||||||||||||||||
| 12/31/18 | 12/31/17 | 12/31/16 | 12/31/15 | 12/31/14 | ||||||||||||||||||||
| (unaudited) | ||||||||||||||||||||||||
Net asset value, beginning of period | $23.65 | $26.44 | $20.94 | $20.82 | $22.38 | $21.55 | ||||||||||||||||||
| Income (loss) from investment operations | ||||||||||||||||||||||||
Net investment income (loss) (d) | $0.09 | $0.09 | $0.07 | $0.20 | (c) | $0.06 | $0.14 | |||||||||||||||||
Net realized and unrealized gain (loss) | 5.01 | (1.24 | ) | 6.48 | 1.08 | (0.53 | ) | 0.73 | ||||||||||||||||
Total from investment operations | $5.10 | $(1.15 | ) | $6.55 | $1.28 | $(0.47 | ) | $0.87 | ||||||||||||||||
| Less distributions declared to shareholders | ||||||||||||||||||||||||
From net investment income | $— | $(0.05 | ) | $(0.21 | ) | $(0.08 | ) | $(0.15 | ) | $(0.04 | ) | |||||||||||||
From net realized gain | — | (1.59 | ) | (0.84 | ) | (1.08 | ) | (0.94 | ) | — | ||||||||||||||
Total distributions declared to shareholders | $— | $(1.64 | ) | $(1.05 | ) | $(1.16 | ) | $(1.09 | ) | $(0.04 | ) | |||||||||||||
Net asset value, end of period (x) | $28.75 | $23.65 | $26.44 | $20.94 | $20.82 | $22.38 | ||||||||||||||||||
Total return (%) (k)(r)(s)(x) | 21.56 | (n) | (5.06 | ) | 31.77 | 5.85 | (c) | (1.82 | ) | 4.05 | ||||||||||||||
| Ratios (%) (to average net assets) and Supplemental data: | ||||||||||||||||||||||||
Expenses before expense reductions (f) | 1.46 | (a) | 1.42 | 1.42 | 0.94 | (c) | 1.42 | 1.45 | ||||||||||||||||
Expenses after expense reductions (f) | 1.25 | (a) | 1.25 | 1.25 | 0.77 | (c) | 1.26 | 1.37 | ||||||||||||||||
Net investment income (loss) | 0.71 | (a) | 0.34 | 0.31 | 0.94 | (c) | 0.27 | 0.63 | ||||||||||||||||
Portfolio turnover | 9 | (n) | 22 | 21 | 25 | 26 | 25 | |||||||||||||||||
Net assets at end of period (000 omitted) | $1,952 | $1,754 | $2,530 | $2,355 | $2,031 | $2,372 | ||||||||||||||||||
See Notes to Financial Statements
9
Table of Contents
MFS Global Growth Portfolio
Financial Highlights – continued
| (a) | Annualized. |
| (c) | Amount reflects aone-time reimbursement of expenses by the custodian (or former custodian) without which net investment income and performance would be lower and expenses would be higher. Excluding the effect of the reimbursement of expenses, the total return for the year ended December 31, 2016 would have been approximately 0.55% lower. |
| (d) | Per share data is based on average shares outstanding. |
| (f) | Ratios do not reflect reductions from fees paid indirectly, if applicable. |
| (k) | The total return does not reflect expenses that apply to separate accounts. Inclusion of these charges would reduce the total return figures for all periods shown. |
| (n) | Not annualized. |
| (r) | Certain expenses have been reduced without which performance would have been lower. |
| (s) | From time to time the fund may receive proceeds from litigation settlements, without which performance would be lower. |
| (x) | The net asset values and total returns have been calculated on net assets which include adjustments made in accordance with U.S. generally accepted accounting principles required at period end for financial reporting purposes. |
See Notes to Financial Statements
10
Table of Contents
MFS Global Growth Portfolio
NOTES TO FINANCIAL STATEMENTS (unaudited)
| (1) | Business and Organization |
MFS Global Growth Portfolio (the fund) is a diversified series of MFS Variable Insurance Trust II (the trust). The trust is organized as a Massachusetts business trust and is registered under the Investment Company Act of 1940, as amended, as anopen-end management investment company. The shareholders of each series of the trust are separate accounts of insurance companies, which offer variable annuity and/or life insurance products, and qualified retirement and pension plans.
The fund is an investment company and accordingly follows the investment company accounting and reporting guidance of the Financial Accounting Standards Board (FASB) Accounting Standards Codification Topic 946 Financial Services – Investment Companies.
| (2) | Significant Accounting Policies |
General– The preparation of financial statements in conformity with U.S. generally accepted accounting principles requires management to make estimates and assumptions that affect the reported amounts of assets and liabilities, and disclosure of contingent assets and liabilities at the date of the financial statements and the reported amounts of increases and decreases in net assets from operations during the reporting period. Actual results could differ from those estimates. In the preparation of these financial statements, management has evaluated subsequent events occurring after the date of the fund’s Statement of Assets and Liabilities through the date that the financial statements were issued. The fund invests in foreign securities, including securities of emerging market issuers. Investments in foreign securities are vulnerable to the effects of changes in the relative values of the local currency and the U.S. dollar and to the effects of changes in each country’s market, economic, industrial, political, regulatory, geopolitical, and other conditions. Investments in emerging markets can involve additional and greater risks than the risks associated with investments in developed foreign markets. Emerging markets can have less developed markets, greater custody and operational risk, less developed legal, regulatory, and accounting systems, and greater political, social, and economic instability than developed markets.
Balance Sheet Offsetting – The fund’s accounting policy with respect to balance sheet offsetting is that, absent an event of default by the counterparty or a termination of the agreement, the International Swaps and Derivatives Association (ISDA) Master Agreement, or similar agreement, does not result in an offset of reported amounts of financial assets and financial liabilities in the Statement of Assets and Liabilities across transactions between the fund and the applicable counterparty. The fund’s right to setoff may be restricted or prohibited by the bankruptcy or insolvency laws of the particular jurisdiction to which a specific master netting agreement counterparty is subject. Balance sheet offsetting disclosures, to the extent applicable to the fund, have been included in the fund’s Significant Accounting Policies note under the captions for each of the fund’sin-scope financial instruments and transactions.
Investment Valuations– Equity securities, including restricted equity securities, are generally valued at the last sale or official closing price on their primary market or exchange as provided by a third-party pricing service. Equity securities, for which there were no sales reported that day, are generally valued at the last quoted daily bid quotation on their primary market or exchange as provided by a third-party pricing service. Short-term instruments with a maturity at issuance of 60 days or less may be valued at amortized cost, which approximates market value.Open-end investment companies are generally valued at net asset value per share. Securities and other assets generally valued on the basis of information from a third-party pricing service may also be valued at a broker/dealer bid quotation. In determining values, third-party pricing services can utilize both transaction data and market information such as yield, quality, coupon rate, maturity, type of issue, trading characteristics, and other market data. The values of foreign securities and other assets and liabilities expressed in foreign currencies are converted to U.S. dollars using the mean of bid and asked prices for rates provided by a third-party pricing service.
The Board of Trustees has delegated primary responsibility for determining or causing to be determined the value of the fund’s investments (including any fair valuation) to the adviser pursuant to valuation policies and procedures approved by the Board. If the adviser determines that reliable market quotations are not readily available, investments are valued at fair value as determined in good faith by the adviser in accordance with such procedures under the oversight of the Board of Trustees. Under the fund’s valuation policies and procedures, market quotations are not considered to be readily available for most types of debt instruments and floating rate loans and many types of derivatives. These investments are generally valued at fair value based on information from third-party pricing services. In addition, investments may be valued at fair value if the adviser determines that an investment’s value has been materially affected by events occurring after the close of the exchange or market on which the investment is principally traded (such as foreign exchange or market) and prior to the determination of the fund’s net asset value, or after the halt of trading of a specific security where trading does not resume prior to the close of the exchange or market on which the security is principally traded. Events that occur after foreign markets close (such as developments in foreign markets and significant movements in the U.S. markets) and prior to the determination of the fund’s net asset value may be deemed to have a material effect on the value of securities traded in foreign markets. Accordingly, the fund’s foreign equity securities may often be valued at fair value. The adviser generally relies on third-party pricing services or other information (such as the correlation with price movements of similar securities in the same or other markets; the type, cost and investment characteristics of the security; the business and financial condition of the
11
Table of Contents
MFS Global Growth Portfolio
Notes to Financial Statements (unaudited) – continued
issuer; and trading and other market data) to assist in determining whether to fair value and at what value to fair value an investment. The value of an investment for purposes of calculating the fund’s net asset value can differ depending on the source and method used to determine value. When fair valuation is used, the value of an investment used to determine the fund’s net asset value may differ from quoted or published prices for the same investment. There can be no assurance that the fund could obtain the fair value assigned to an investment if it were to sell the investment at the same time at which the fund determines its net asset value per share.
Various inputs are used in determining the value of the fund’s assets or liabilities. These inputs are categorized into three broad levels. In certain cases, the inputs used to measure fair value may fall into different levels of the fair value hierarchy. In such cases, an investment’s level within the fair value hierarchy is based on the lowest level of input that is significant to the fair value measurement. The fund’s assessment of the significance of a particular input to the fair value measurement in its entirety requires judgment, and considers factors specific to the investment. Level 1 includes unadjusted quoted prices in active markets for identical assets or liabilities. Level 2 includes other significant observable market-based inputs (including quoted prices for similar securities, interest rates, prepayment speed, and credit risk). Level 3 includes unobservable inputs, which may include the adviser’s own assumptions in determining the fair value of investments. The following is a summary of the levels used as of June 30, 2019 in valuing the fund’s assets or liabilities:
| Financial Instruments | Level 1 | Level 2 | Level 3 | Total | ||||||||||||
| Equity Securities | $50,517,048 | $— | $— | $50,517,048 | ||||||||||||
| Mutual Funds | 277,660 | — | — | 277,660 | ||||||||||||
| Total | $50,794,708 | $— | $— | $50,794,708 | ||||||||||||
For further information regarding security characteristics, see the Portfolio of Investments.
Foreign Currency Translation– Purchases and sales of foreign investments, income, and expenses are converted into U.S. dollars based upon currency exchange rates prevailing on the respective dates of such transactions or on the reporting date for foreign denominated receivables and payables. Gains and losses attributable to foreign currency exchange rates on sales of securities are recorded for financial statement purposes as net realized gains and losses on investments. Gains and losses attributable to foreign exchange rate movements on receivables, payables, income and expenses are recorded for financial statement purposes as foreign currency transaction gains and losses. That portion of both realized and unrealized gains and losses on investments that results from fluctuations in foreign currency exchange rates is not separately disclosed.
Security Loans– Under its Securities Lending Agency Agreement with the fund, State Street Bank and Trust Company, as lending agent, loans the securities of the fund to certain qualified institutions (the “Borrowers”) approved by the fund. Security loans can be terminated at the discretion of either the lending agent or the fund and the related securities must be returned within the earlier of the standard trade settlement period for such securities or within three business days. The loans are collateralized by cash and/or U.S. Treasury and federal agency obligations in an amount typically at least equal to the market value of the securities loaned. On loans collateralized by cash, the cash collateral is invested in a money market fund. The market value of the loaned securities is determined at the close of business of the fund and any additional required collateral is delivered to the fund on the next business day. The lending agent provides the fund with indemnification against Borrower default. In the event of Borrower default, the lending agent will, for the benefit of the fund, either purchase securities identical to those loaned or, when such purchase is commercially impracticable, pay the fund the market value of the loaned securities. In return, the lending agent assumes the fund’s rights to the related collateral. If the collateral value is less than the cost to purchase identical securities, the lending agent is responsible for the shortfall, but only to the extent that such shortfall is not due to a decline in collateral value resulting from collateral reinvestment for which the fund bears the risk of loss. A portion of the income generated upon investment of the collateral is remitted to the Borrowers, and the remainder is allocated between the fund and the lending agent. On loans collateralized by U.S. Treasury and/or federal agency obligations, a fee is received from the Borrower, and is allocated between the fund and the lending agent. Income from securities lending is separately reported in the Statement of Operations. The dividend and interest income earned on the securities loaned is accounted for in the same manner as other dividend and interest income. At June 30, 2019, there were no securities on loan or collateral outstanding.
Indemnifications– Under the fund’s organizational documents, its officers and Trustees may be indemnified against certain liabilities and expenses arising out of the performance of their duties to the fund. Additionally, in the normal course of business, the fund enters into agreements with service providers that may contain indemnification clauses. The fund’s maximum exposure under these agreements is unknown as this would involve future claims that may be made against the fund that have not yet occurred.
Investment Transactions and Income– Investment transactions are recorded on the trade date. Dividends received in cash are recorded on theex-dividend date. Certain dividends from foreign securities will be recorded when the fund is informed of the dividend if such information is obtained subsequent to theex-dividend date. Dividend payments received in additional securities are recorded on theex-dividend date in an amount equal to the value of the security on such date.
12
Table of Contents
MFS Global Growth Portfolio
Notes to Financial Statements (unaudited) – continued
The fund may receive proceeds from litigation settlements. Any proceeds received from litigation involving portfolio holdings are reflected in the Statement of Operations in realized gain/loss if the security has been disposed of by the fund or in unrealized gain/loss if the security is still held by the fund. Any other proceeds from litigation not related to portfolio holdings are reflected as other income in the Statement of Operations.
Tax Matters and Distributions– The fund intends to qualify as a regulated investment company, as defined under Subchapter M of the Internal Revenue Code, and to distribute all of its taxable income, including realized capital gains. As a result, no provision for federal income tax is required. The fund’s federal tax returns, when filed, will remain subject to examination by the Internal Revenue Service for a three year period. Management has analyzed the fund’s tax positions taken on federal and state tax returns for all open tax years and does not believe that there are any uncertain tax positions that require recognition of a tax liability. Foreign taxes, if any, have been accrued by the fund in the accompanying financial statements in accordance with the applicable foreign tax law. Foreign income taxes may be withheld by certain countries in which the fund invests. Additionally, capital gains realized by the fund on securities issued in or by certain foreign countries may be subject to capital gains tax imposed by those countries.
Distributions to shareholders are recorded on theex-dividend date. Income and capital gain distributions are determined in accordance with income tax regulations, which may differ from U.S. generally accepted accounting principles. Certain capital accounts in the financial statements are periodically adjusted for permanent differences in order to reflect their tax character. These adjustments have no impact on net assets or net asset value per share. Temporary differences which arise from recognizing certain items of income, expense, gain or loss in different periods for financial statement and tax purposes will reverse at some time in the future. Distributions in excess of net investment income or net realized gains are temporary overdistributions for financial statement purposes resulting from differences in the recognition or classification of income or distributions for financial statement and tax purposes.
Book/tax differences primarily relate to wash sale loss deferrals.
The tax character of distributions declared to shareholders for the last fiscal year is as follows:
| Year ended 12/31/18 | ||||
| Ordinary income (including any short-term capital gains) | $701,022 | |||
| Long-term capital gains | 2,635,002 | |||
| Total distributions | $3,336,024 | |||
The federal tax cost and the tax basis components of distributable earnings were as follows:
| As of 6/30/19 | ||||
| Cost of investments | $30,860,454 | |||
| Gross appreciation | 20,980,830 | |||
| Gross depreciation | (1,046,576 | ) | ||
| Net unrealized appreciation (depreciation) | $19,934,254 | |||
| As of 12/31/18 | ||||
| Undistributed ordinary income | 633,777 | |||
| Undistributed long-term capital gain | 5,000,726 | |||
| Other temporary differences | (13 | ) | ||
| Net unrealized appreciation (depreciation) | 12,866,976 | |||
The aggregate cost above includes prior fiscal year end tax adjustments, if applicable.
Multiple Classes of Shares of Beneficial Interest– The fund offers multiple classes of shares, which differ in their respective distribution and/or service fees. The fund’s income, realized and unrealized gain (loss), and common expenses are allocated to shareholders based on the daily net assets of each class. Dividends are declared separately for each class. Differences in per share dividend rates are generally due to differences in separate class expenses. The fund’s distributions declared to shareholders as reported in the Statements of Changes in Net Assets are presented by class as follows:
| From net investment income | From net realized gain | |||||||||||||||
| Six months ended 6/30/19 | Year ended 12/31/18 | Six months ended 6/30/19 | Year ended 12/31/18 | |||||||||||||
| Initial Class | $— | $258,094 | $— | $2,958,456 | ||||||||||||
| Service Class | — | 3,919 | — | 115,555 | ||||||||||||
| Total | $— | $262,013 | $— | $3,074,011 | ||||||||||||
13
Table of Contents
MFS Global Growth Portfolio
Notes to Financial Statements (unaudited) – continued
| (3) | Transactions with Affiliates |
Investment Adviser– The fund has an investment advisory agreement with MFS to provide overall investment management and related administrative services and facilities to the fund. The management fee is computed daily and paid monthly at the following annual rates based on the fund’s average daily net assets:
| Up to $1 billion | 0.90% | |||
| In excess of $1 billion and up to $2 billion | 0.75% | |||
| In excess of $2 billion | 0.65% |
MFS has agreed in writing to reduce its management fee by a specified amount if certain MFS mutual fund assets exceed thresholds agreed to by MFS and the fund’s Board of Trustees. For the six months ended June 30, 2019, this management fee reduction amounted to $2,370, which is included in the reduction of total expenses in the Statement of Operations. The management fee incurred for the six months ended June 30, 2019 was equivalent to an annual effective rate of 0.89% of the fund’s average daily net assets.
The investment adviser has agreed in writing to pay a portion of the fund’s total annual operating expenses, excluding interest, taxes, extraordinary expenses, brokerage and transaction costs, and investment-related expenses, such that total annual operating expenses do not exceed 1.00% of average daily net assets for the Initial Class shares and 1.25% of average daily net assets for the Service Class shares. This written agreement will continue until modified by the fund’s Board of Trustees, but such agreement will continue at least until April 30, 2021. For the six months ended June 30, 2019, this reduction amounted to $49,058, which is included in the reduction of total expenses in the Statement of Operations.
Distributor– MFS Fund Distributors, Inc. (MFD), a wholly-owned subsidiary of MFS, is the distributor of shares of the fund. The Trustees have adopted a distribution plan for the Service Class shares pursuant to Rule12b-1 under the Investment Company Act of 1940.
The fund’s distribution plan provides that the fund will pay MFD distribution and/or service fees equal to 0.25% per annum of its average daily net assets attributable to Service Class shares as partial consideration for services performed and expenses incurred by MFD and financial intermediaries (including participating insurance companies that invest in the fund to fund variable annuity and variable life insurance contracts, sponsors of qualified retirement and pension plans that invest in the fund, and affiliates of these participating insurance companies and plan sponsors) in connection with the sale and distribution of the Service Class shares. MFD may subsequently pay all, or a portion, of the distribution and/or service fees to financial intermediaries.
Shareholder Servicing Agent– MFS Service Center, Inc. (MFSC), a wholly-owned subsidiary of MFS, receives a fee from the fund for its services as shareholder servicing agent. For the six months ended June 30, 2019, the fee was $558, which equated to 0.0023% annually of the fund’s average daily net assets. MFSC also receives payment from the fund forout-of-pocket expenses paid by MFSC on behalf of the fund. For the six months ended June 30, 2019, these costs amounted to $52.
Administrator– MFS provides certain financial, legal, shareholder communications, compliance, and other administrative services to the fund. Under an administrative services agreement, the fund reimburses MFS the costs incurred to provide these services. The fund is charged an annual fixed amount of $17,500 plus a fee based on average daily net assets. The administrative services fee incurred for the six months ended June 30, 2019 was equivalent to an annual effective rate of 0.0354% of the fund’s average daily net assets.
Trustees’ and Officers’ Compensation– The fund pays compensation to independent Trustees in the form of a retainer, attendance fees, and additional compensation to Board and Committee chairpersons. The fund does not pay compensation directly to Trustees or officers of the fund who are also officers of the investment adviser, all of whom receive remuneration from MFS for their services to the fund. Certain officers and Trustees of the fund are officers or directors of MFS, MFD, and MFSC.
Other– This fund and certain other funds managed by MFS (the funds) had entered into a service agreement (the ISO Agreement) which provided for payment of fees solely by the funds to Tarantino LLC in return for the provision of services of an Independent Senior Officer (ISO) for the funds. Frank L. Tarantino served as the ISO and was an officer of the funds and the sole member of Tarantino LLC. Effective June 30, 2019, Mr. Tarantino retired from his position as ISO for the funds, and the ISO Agreement was terminated. For the six months ended June 30, 2019, the fee paid by the fund under this agreement was $51 and is included in “Miscellaneous” expense in the Statement of Operations. MFS had agreed to bear all expenses associated with office space, other administrative support, and supplies provided to the ISO.
The fund invests in the MFS Institutional Money Market Portfolio which is managed by MFS and seeks current income consistent with preservation of capital and liquidity. This money market fund does not pay a management fee to MFS.
The fund is permitted to engage in purchase and sale transactions with funds and accounts for which MFS serves as investment adviser orsub-adviser (“cross-trades”) pursuant to a policy adopted by the Board of Trustees. This policy has been designed to
14
Table of Contents
MFS Global Growth Portfolio
Notes to Financial Statements (unaudited) – continued
ensure that cross-trades conducted by the fund comply with Rule17a-7 under the Investment Company Act of 1940. During the six months ended June 30, 2019, the fund engaged in sale transactions pursuant to this policy, which amounted to $30,343. The sales transactions resulted in net realized gains (losses) of $(4,709).
The adviser has voluntarily undertaken to reimburse the fund from its own resources on a quarterly basis for the cost of investment research embedded in the cost of the fund’s securities trades. This agreement may be rescinded at any time. For the six months ended June 30, 2019, this reimbursement amounted to $1,692, which is included in “Other” income in the Statement of Operations.
| (4) | Portfolio Securities |
For the six months ended June 30, 2019, purchases and sales of investments, other than short-term obligations, aggregated $4,500,908 and $8,766,378, respectively.
| (5) | Shares of Beneficial Interest |
The fund’s Declaration of Trust permits the Trustees to issue an unlimited number of full and fractional shares of beneficial interest. Transactions in fund shares were as follows:
| Six months ended 6/30/19 | Year ended 12/31/18 | |||||||||||||||
| Shares | Amount | Shares | Amount | |||||||||||||
| Shares sold | ||||||||||||||||
Initial Class | 13,351 | $371,164 | 33,609 | $889,691 | ||||||||||||
Service Class | 1,463 | 41,645 | 5,546 | 148,393 | ||||||||||||
| 14,814 | $412,809 | 39,155 | $1,038,084 | |||||||||||||
| Shares issued to shareholders in reinvestment of distributions | ||||||||||||||||
Initial Class | — | $— | 119,842 | $3,216,550 | ||||||||||||
Service Class | — | — | 4,460 | 119,474 | ||||||||||||
| — | $— | 124,302 | $3,336,024 | |||||||||||||
| Shares reacquired | ||||||||||||||||
Initial Class | (172,901 | ) | $(4,685,832 | ) | (370,676 | ) | $(9,821,213 | ) | ||||||||
Service Class | (7,771 | ) | (208,257 | ) | (31,503 | ) | (861,264 | ) | ||||||||
| (180,672 | ) | $(4,894,089 | ) | (402,179 | ) | $(10,682,477 | ) | |||||||||
| Net change | ||||||||||||||||
Initial Class | (159,550 | ) | $(4,314,668 | ) | (217,225 | ) | $(5,714,972 | ) | ||||||||
Service Class | (6,308 | ) | (166,612 | ) | (21,497 | ) | (593,397 | ) | ||||||||
| (165,858 | ) | $(4,481,280 | ) | (238,722 | ) | $(6,308,369 | ) | |||||||||
| (6) | Line of Credit |
The fund and certain other funds managed by MFS participate in a $1.25 billion unsecured committed line of credit, subject to a $1 billion sublimit, provided by a syndicate of banks under a credit agreement. Borrowings may be made for temporary financing needs. Interest is charged to each fund, based on its borrowings, generally at a rate equal to the highest of one month LIBOR, the Federal Funds Effective Rate and the Overnight Bank Funding Rate, plus an agreed upon spread. A commitment fee, based on the average daily, unused portion of the committed line of credit, is allocated among the participating funds. In addition, the fund and other funds managed by MFS have established unsecured uncommitted borrowing arrangements with certain banks for temporary financing needs. Interest is charged to each fund, based on its borrowings, at rates equal to customary reference rates plus an agreed upon spread. For the six months ended June 30, 2019, the fund’s commitment fee and interest expense were $145 and $0, respectively, and are included in “Miscellaneous” expense in the Statement of Operations.
| (7) | Investments in Affiliated Issuers |
An affiliated issuer may be considered one in which the fund owns 5% or more of the outstanding voting securities, or a company which is under common control. For the purposes of this report, the following were affiliated issuers:
| Affiliated Issuers | Beginning Value | Purchases | Sales Proceeds | Realized Gain (Loss) | Change in Unrealized Appreciation or Depreciation | Ending Value | ||||||||||||||||||
| MFS Institutional Money Market Portfolio | $298,797 | $5,274,347 | $5,295,554 | $16 | $54 | $277,660 | ||||||||||||||||||
| Affiliated Issuers | Dividend Income | Capital Gain Distributions | ||||||||||||||||||||||
| MFS Institutional Money Market Portfolio |
| $4,485 | $— | |||||||||||||||||||||
15
Table of Contents
MFS Global Growth Portfolio
PROXY VOTING POLICIES AND INFORMATION
MFS votes proxies on behalf of the fund pursuant to proxy voting policies and procedures that are available without charge, upon request, by calling 1-800-225-2606, by visitingmfs.com/proxyvoting, or by visiting the SEC’s Web site athttp://www.sec.gov.
Information regarding how the fund voted proxies relating to portfolio securities during the most recent twelve-month period ended June 30 is available by August 31 of each year without charge by visitingmfs.com/proxyvoting, or by visiting the SEC’s Web site athttp://www.sec.gov.
QUARTERLY PORTFOLIO DISCLOSURE
The fund files a complete schedule of portfolio holdings with the SEC for the first and third quarters of each fiscal year on Form N-Q or as an exhibit to its reports on Form N-PORT (for first and third fiscal quarters ending March 31, 2019 or after). The fund’sForm N-Q or Form N-PORT reports are available on the SEC’s website athttp://www.sec.gov.A shareholder can obtain the portfolio holdings report for the first and third quarters of the fund’s fiscal year atmfs.com/vit2 by choosing the fund’s name and then selecting the “Resources” tab and clicking on “Prospectus and Reports”.
From time to time, MFS may post important information about the fund or the MFS funds on the MFS web site (mfs.com). This information is available athttps://www.mfs.com/en-us/what-we-do/announcements.htmlor atmfs.com/vit2 by choosing the fund’s name.
INFORMATION ABOUT FUND CONTRACTS AND LEGAL CLAIMS
The fund has entered into contractual arrangements with an investment adviser, administrator, distributor, shareholder servicing agent, 529 program manager (if applicable), and custodian who each provide services to the fund. Unless expressly stated otherwise, shareholders are not parties to, or intended beneficiaries of these contractual arrangements, and these contractual arrangements are not intended to create any shareholder right to enforce them against the service providers or to seek any remedy under them against the service providers, either directly or on behalf of the fund.
Under the Trust’s By-Laws and Declaration of Trust, any claims asserted against or on behalf of the MFS Funds, including claims against Trustees and Officers, must be brought in state and federal courts located within the Commonwealth of Massachusetts.
16
Table of Contents
Table of Contents
Semiannual Report
June 30, 2019

MFS® Global Research Portfolio

MFS® Variable Insurance Trust II
Beginning on January 1, 2021, as permitted by regulations adopted by the U.S. Securities and Exchange Commission, the insurance company that offers your contract may determine that it will no longer send you paper copies of the fund’s annual and semiannual shareholder reports unless you specifically request paper copies from the insurance company or from your financial intermediary. Instead, the shareholder reports will be made available on a Web site (insurancefunds.mfs.com or other Web site of which you will be notified), and the insurance company will notify you by mail each time a report is posted and provide you with a Web site link to access the report. Instructions for requesting paper copies will be provided by your insurance company or financial intermediary.
If you already elected to receive shareholder reports by email, you will not be affected by this change and you need not take any action. If your insurance company or financial intermediary offers electronic delivery, you may elect to receive shareholder reports and other communications from the insurance company or financial intermediary by email by following the instructions provided by the insurance company or financial intermediary.
Beginning on January 1, 2019, you may elect to receive all future reports in paper free of charge from the insurance company or financial intermediary. You can inform the insurance company or financial intermediary that you wish to continue receiving paper copies of your shareholder reports by contacting your insurance company or financial intermediary. Your election to receive reports in paper will apply to all funds held in your account with your insurance company or financial intermediary.
RES-SEM
Table of Contents
MFS® Global Research Portfolio
The report is prepared for the general information of contract owners. It is authorized for distribution to prospective investors only when preceded or accompanied by a current prospectus.
NOT FDIC INSURED• MAY LOSE VALUE• NO BANK OR CREDIT UNION GUARANTEE• NOT A DEPOSIT• NOT INSURED BY ANY FEDERAL GOVERNMENT AGENCY OR NCUA/NCUSIF
Table of Contents
MFS Global Research Portfolio
LETTER FROM THE EXECUTIVE CHAIRMAN

Dear Contract Owners:
Slowing global growth, low inflation, and increasing trade friction between the United States and China have been hallmarks of the past 12 months. After experiencing an uptick in market volatility in late 2018, markets steadied during the first half of 2019, thanks in large measure to the adoption of a dovish policy stance on the part of global central banks, who have largely abandoned efforts to normalize interest rates and have instead focused on supporting economic growth. Trade tensions remain high as the U.S. has ratcheted up tariffs on Chinese imports and China has retaliated. A truce of sorts was reached midyear, but significant challenges continue to confront negotiators, and it is not known whether a comprehensive agreement can be reached.
With Boris Johnson replacing Theresa May as Britain’s prime minister, uncertainty over Brexit remains high. Johnson has adopted a more combative stance than his predecessor toward the European Union, increasing concerns that there will be a “hard” Brexit.
Markets expect that the longest economic expansion in U.S. history will continue for the time being, albeit at a slower pace. Nevertheless, slower growth and low inflation have spurred the U.S. Federal Reserve to take a more accommodative policy stance, prompting investors to anticipate several interest rate cuts in the coming year. The European Central Bank has adopted a similar position. The more accommodative environment has helped fuel a continued rise in global equities and has been broadly supportive of risk assets.
Since launching the first U.S.open-end mutual fund in 1924, MFS® has been committed to a single purpose: to create value by allocating capital responsibly for clients. Through our powerful global investment platform, we combine collective expertise, thoughtful risk management, and long-term discipline to uncover what we believe are the best investment opportunities in the market.
Respectfully,

Robert J. Manning
Executive Chairman
MFS Investment Management
August 16, 2019
The opinions expressed in this letter are subject to change and may not be relied upon for investment advice. No forecasts can be guaranteed.
1
Table of Contents
MFS Global Research Portfolio
Portfolio structure

| Top ten holdings | ||||
| Microsoft Corp. | 2.7% | |||
| Amazon.com, Inc. | 2.4% | |||
| Alphabet, Inc., “A” | 2.0% | |||
| Facebook, Inc., “A” | 1.7% | |||
| AIA Group Ltd. | 1.5% | |||
| Mastercard, Inc., “A” | 1.4% | |||
| Citigroup, Inc. | 1.4% | |||
| Honeywell International, Inc. | 1.4% | |||
| Aon PLC | 1.4% | |||
| Salesforce.com, Inc. | 1.3% | |||
| Global equity sectors (k) | ||||
| Technology | 20.1% | |||
| Financial Services | 19.7% | |||
| Capital Goods | 16.8% | |||
| Health Care | 11.5% | |||
| Consumer Cyclicals | 11.2% | |||
| Energy | 8.8% | |||
| Consumer Staples | 6.6% | |||
| Telecommunications/Cable Television | 4.4% | |||
| Issuer country weightings (x) | ||||
| United States | 61.7% | |||
| Switzerland | 4.7% | |||
| France | 4.5% | |||
| Japan | 4.0% | |||
| Canada | 3.8% | |||
| United Kingdom | 3.2% | |||
| Germany | 3.0% | |||
| Hong Kong | 2.8% | |||
| China | 2.0% | |||
| Other Countries | 10.3% | |||
| Currency exposure weightings (y) | ||||
| United States Dollar | 64.2% | |||
| Euro | 12.3% | |||
| Swiss Franc | 4.7% | |||
| Japanese Yen | 4.0% | |||
| Hong Kong Dollar | 3.8% | |||
| British Pound Sterling | 3.5% | |||
| Canadian Dollar | 3.2% | |||
| Taiwan Dollar | 1.3% | |||
| Indian Rupee | 1.0% | |||
| Other Currencies | 2.0% | |||
| (k) | The sectors set forth above and the associated portfolio composition are based on MFS’ own custom sector classification methodology. |
| (x) | Represents the portfolio’s exposure to issuer countries as a percentage of a portfolio’s net assets. For purposes of this presentation, United States includes Cash & Cash Equivalents. |
| (y) | Represents the portfolio’s exposure to a particular currency as a percentage of a portfolio’s net assets. For purposes of this presentation, United States Dollar includes Cash & Cash Equivalents. |
Cash & Cash Equivalents includes any cash, investments in money market funds, short-term securities, and other assets less liabilities. Please see the Statement of Assets and Liabilities for additional information related to the fund’s cash position and other assets and liabilities.
Percentages are based on net assets as of June 30, 2019.
The portfolio is actively managed and current holdings may be different.
2
Table of Contents
MFS Global Research Portfolio
Fund Expenses Borne by the Contract Holders during the Period,
January 1, 2019 through June 30, 2019
As a contract holder of the fund, you incur ongoing costs, including management fees; distribution and/or service(12b-1) fees; and other fund expenses. This example is intended to help you understand your ongoing costs (in dollars) of investing in the fund and to compare these costs with the ongoing costs of investing in other mutual funds.
The example is based on an investment of $1,000 invested at the beginning of the period and held for the entire period January 1, 2019 through June 30, 2019.
Actual Expenses
The first line for each share class in the following table provides information about actual account values and actual expenses. You may use the information in this line, together with the amount you invested, to estimate the expenses that you paid over the period. Simply divide your account value by $1,000 (for example, an $8,600 account value divided by $1,000 = 8.6), then multiply the result by the number in the first line under the heading entitled “Expenses Paid During Period” to estimate the expenses you paid on your account during this period.
Hypothetical Example for Comparison Purposes
The second line for each share class in the following table provides information about hypothetical account values and hypothetical expenses based on the fund’s actual expense ratio and an assumed rate of return of 5% per year before expenses, which is not the fund’s actual return. The hypothetical account values and expenses may not be used to estimate the actual ending account balance or expenses you paid for the period. You may use this information to compare the ongoing costs of investing in the fund and other funds. To do so, compare this 5% hypothetical example with the 5% hypothetical examples that appear in the shareholder reports of the other funds.
Please note that the expenses shown in the table are meant to highlight the fund’s ongoing costs only and do not take into account the fees and expenses imposed under the variable contracts through which your investment in the fund is made. Therefore, the second line for each share class in the table is useful in comparing ongoing costs associated with an investment in vehicles (such as the fund) which fund benefits under variable annuity and variable life insurance contracts and to qualified pension and retirement plans only, and will not help you determine the relative total costs of investing in the fund through variable annuity and variable life insurance contracts. If the fees and expenses imposed under the variable contracts were included, your costs would have been higher.
| Share Class | Annualized Expense Ratio | Beginning Account Value 1/01/19 | Ending Account Value 6/30/19 | Expenses Paid During Period (p) 1/01/19-6/30/19 | ||||||||||||||
| Initial Class | Actual | 0.85% | $1,000.00 | $1,204.44 | $4.65 | |||||||||||||
| Hypothetical (h) | 0.85% | $1,000.00 | $1,020.58 | $4.26 | ||||||||||||||
| Service Class | Actual | 1.10% | $1,000.00 | $1,203.05 | $6.01 | |||||||||||||
| Hypothetical (h) | 1.10% | $1,000.00 | $1,019.34 | $5.51 | ||||||||||||||
| (h) | 5% class return per year before expenses. |
| (p) | “Expenses Paid During Period” are equal to each class’s annualized expense ratio, as shown above, multiplied by the average account value over the period, multiplied by 181/365 (to reflect theone-half year period). |
3
Table of Contents
MFS Global Research Portfolio
PORTFOLIO OF INVESTMENTS – 6/30/19 (unaudited)
The Portfolio of Investments is a complete list of all securities owned by your fund. It is categorized by broad-based asset classes.
| Issuer | Shares/Par | Value ($) | ||||||
| COMMON STOCKS – 99.1% | ||||||||
| Aerospace – 3.5% |
| |||||||
| Boeing Co. | 758 | $ | 275,920 | |||||
| Honeywell International, Inc. | 7,432 | 1,297,553 | ||||||
| Northrop Grumman Corp. | 2,858 | 923,448 | ||||||
| United Technologies Corp. | 5,509 | 717,272 | ||||||
|
| |||||||
| $ | 3,214,193 | |||||||
|
| |||||||
| Alcoholic Beverages – 1.3% | ||||||||
| Ambev S.A., ADR | 67,149 | $ | 313,586 | |||||
| China Resources Beer Holdings Co. Ltd. | 96,000 | 455,931 | ||||||
| Constellation Brands, Inc., “A” | 2,041 | 401,955 | ||||||
|
| |||||||
| $ | 1,171,472 | |||||||
|
| |||||||
| Apparel Manufacturers – 2.8% | ||||||||
| Adidas AG | 2,996 | $ | 924,933 | |||||
| LVMH Moet Hennessy Louis Vuitton SE | 2,246 | 955,935 | ||||||
| NIKE, Inc., “B” | 8,201 | 688,474 | ||||||
|
| |||||||
| $ | 2,569,342 | |||||||
|
| |||||||
| Automotive – 0.1% | ||||||||
| IAA, Inc. (a) | 3,714 | $ | 144,029 | |||||
|
| |||||||
| Brokerage & Asset Managers – 3.1% | ||||||||
| Blackstone Group LP | 14,177 | $ | 629,742 | |||||
| CME Group, Inc. | 3,949 | 766,541 | ||||||
| TD Ameritrade Holding Corp. | 16,511 | 824,229 | ||||||
| TMX Group Ltd. | 9,294 | 646,545 | ||||||
|
| |||||||
| $ | 2,867,057 | |||||||
|
| |||||||
| Business Services – 5.4% | ||||||||
| Accenture PLC, “A” | 3,765 | $ | 695,659 | |||||
| Cognizant Technology Solutions Corp., “A” | 8,800 | 557,832 | ||||||
| DXC Technology Co. | 12,113 | 668,032 | ||||||
| Fidelity National Information Services, Inc. | 7,800 | 956,904 | ||||||
| Fiserv, Inc. (a) | 12,288 | 1,120,174 | ||||||
| Global Payments, Inc. | 6,322 | 1,012,342 | ||||||
|
| |||||||
| $ | 5,010,943 | |||||||
|
| |||||||
| Cable TV – 0.8% | ||||||||
| Comcast Corp., “A” | 17,913 | $ | 757,362 | |||||
|
| |||||||
| Chemicals – 0.4% | ||||||||
| FMC Corp. | 4,491 | $ | 372,528 | |||||
|
| |||||||
| Computer Software – 6.0% | ||||||||
| Adobe Systems, Inc. (a) | 3,994 | $ | 1,176,832 | |||||
| Cadence Design Systems, Inc. (a) | 9,179 | 649,965 | ||||||
| Microsoft Corp. (s) | 18,710 | 2,506,392 | ||||||
| Salesforce.com, Inc. (a) | 8,010 | 1,215,357 | ||||||
|
| |||||||
| $ | 5,548,546 | |||||||
|
| |||||||
| Computer Software – Systems – 1.4% |
| |||||||
| Apple, Inc. | 1,921 | $ | 380,204 | |||||
| Constellation Software, Inc. | 712 | 671,060 | ||||||
| Square, Inc., “A” (a) | 3,866 | 280,401 | ||||||
|
| |||||||
| $ | 1,331,665 | |||||||
|
| |||||||
| Issuer | Shares/Par | Value ($) | ||||||
| COMMON STOCKS – continued |
| |||||||
| Construction – 3.1% | ||||||||
| Masco Corp. | 13,004 | $ | 510,277 | |||||
| Sherwin-Williams Co. | 1,888 | 865,252 | ||||||
| Techtronic Industries Co. Ltd. | 62,000 | 474,621 | ||||||
| Toll Brothers, Inc. | 12,134 | 444,347 | ||||||
| Vulcan Materials Co. | 4,131 | 567,228 | ||||||
|
| |||||||
| $ | 2,861,725 | |||||||
|
| |||||||
| Consumer Products – 1.1% | ||||||||
| Kao Corp. | 6,300 | $ | 479,738 | |||||
| Reckitt Benckiser Group PLC | 6,286 | 496,058 | ||||||
|
| |||||||
| $ | 975,796 | |||||||
|
| |||||||
| Consumer Services – 1.0% | ||||||||
| 51job, Inc., ADR (a) | 4,212 | $ | 318,006 | |||||
| Booking Holdings, Inc. (a) | 305 | 571,787 | ||||||
|
| |||||||
| $ | 889,793 | |||||||
|
| |||||||
| Electrical Equipment – 2.0% | ||||||||
| HD Supply Holdings, Inc. (a) | 12,005 | $ | 483,562 | |||||
| Schneider Electric S.A. | 10,709 | 971,254 | ||||||
| TE Connectivity Ltd. | 4,217 | 403,904 | ||||||
|
| |||||||
| $ | 1,858,720 | |||||||
|
| |||||||
| Electronics – 2.2% | ||||||||
| Analog Devices, Inc. | 7,881 | $ | 889,528 | |||||
| Taiwan Semiconductor Manufacturing Co. Ltd. | 114,000 | 877,220 | ||||||
| Taiwan Semiconductor Manufacturing Co. Ltd., ADR | 7,062 | 276,619 | ||||||
|
| |||||||
| $ | 2,043,367 | |||||||
|
| |||||||
| Energy – Independent – 1.7% | ||||||||
| EOG Resources, Inc. | 7,862 | $ | 732,424 | |||||
| Marathon Petroleum Corp. | 7,312 | 408,594 | ||||||
| Oil Search Ltd. | 86,952 | 431,586 | ||||||
|
| |||||||
| $ | 1,572,604 | |||||||
|
| |||||||
| Energy – Integrated – 2.4% | ||||||||
| BP PLC | 127,786 | $ | 890,278 | |||||
| Galp Energia SGPS S.A., “B” | 38,642 | 594,286 | ||||||
| Suncor Energy, Inc. | 23,329 | 727,723 | ||||||
|
| |||||||
| $ | 2,212,287 | |||||||
|
| |||||||
| Food & Beverages – 3.4% | ||||||||
| Danone S.A. | 6,440 | $ | 545,558 | |||||
| Mondelez International, Inc. | 13,265 | 714,983 | ||||||
| Nestle S.A. | 10,372 | 1,073,750 | ||||||
| PepsiCo, Inc. | 6,241 | 818,382 | ||||||
|
| |||||||
| $ | 3,152,673 | |||||||
|
| |||||||
| Gaming & Lodging – 1.0% | ||||||||
| Flutter Entertainment PLC | 3,505 | $ | 263,865 | |||||
| Marriott International, Inc., “A” | 4,768 | 668,903 | ||||||
|
| |||||||
| $ | 932,768 | |||||||
|
| |||||||
4
Table of Contents
MFS Global Research Portfolio
Portfolio of Investments (unaudited) – continued
| Issuer | Shares/Par | Value ($) | ||||||
| COMMON STOCKS – continued |
| |||||||
| General Merchandise – 0.9% |
| |||||||
| Dollar General Corp. | 5,962 | $ | 805,824 | |||||
|
| |||||||
| Health Maintenance Organizations – 0.5% |
| |||||||
| Cigna Corp. | 3,233 | $ | 509,359 | |||||
|
| |||||||
| Insurance – 3.8% |
| |||||||
| AIA Group Ltd. | 131,600 | $ | 1,419,320 | |||||
| Aon PLC | 6,682 | 1,289,492 | ||||||
| Chubb Ltd. | 5,354 | 788,591 | ||||||
|
| |||||||
| $ | 3,497,403 | |||||||
|
| |||||||
| Internet – 3.7% |
| |||||||
| Alphabet, Inc., “A” (a)(s) | 1,725 | $ | 1,867,830 | |||||
| Facebook, Inc., “A” (a) | 7,951 | 1,534,543 | ||||||
|
| |||||||
| $ | 3,402,373 | |||||||
|
| |||||||
| Leisure & Toys – 0.6% |
| |||||||
| Electronic Arts, Inc. (a) | 5,975 | $ | 605,028 | |||||
|
| |||||||
| Machinery & Tools – 2.9% |
| |||||||
| Flowserve Corp. | 9,239 | $ | 486,803 | |||||
| GEA Group AG | 11,922 | 338,913 | ||||||
| Kubota Corp. | 29,900 | 497,247 | ||||||
| Roper Technologies, Inc. | 2,536 | 928,835 | ||||||
| Schindler Holding AG | 1,798 | 400,231 | ||||||
|
| |||||||
| $ | 2,652,029 | |||||||
|
| |||||||
| Major Banks – 2.4% |
| |||||||
| BNP Paribas (l) | 19,478 | $ | 925,029 | |||||
| Mitsubishi UFJ Financial Group, Inc. | 120,200 | 570,815 | ||||||
| UBS AG | 59,471 | 706,683 | ||||||
|
| |||||||
| $ | 2,202,527 | |||||||
|
| |||||||
| Medical & Health Technology & Services – 0.8% |
| |||||||
| ICON PLC (a) | 5,026 | $ | 773,853 | |||||
|
| |||||||
| Medical Equipment – 5.7% |
| |||||||
| Becton, Dickinson and Co. | 3,361 | $ | 847,006 | |||||
| Boston Scientific Corp. (a) | 17,848 | 767,107 | ||||||
| Danaher Corp. | 7,466 | 1,067,041 | ||||||
| EssilorLuxottica | 5,736 | 748,446 | ||||||
| Medtronic PLC | 11,231 | 1,093,787 | ||||||
| PerkinElmer, Inc. | 8,057 | 776,211 | ||||||
|
| |||||||
| $ | 5,299,598 | |||||||
|
| |||||||
| Metals & Mining – 0.4% |
| |||||||
| Rio Tinto Ltd. | 5,712 | $ | 354,029 | |||||
|
| |||||||
| Natural Gas – Distribution – 0.5% |
| |||||||
| China Resources Gas Group Ltd. | 94,000 | $ | 466,288 | |||||
|
| |||||||
| Natural Gas – Pipeline – 1.0% |
| |||||||
| Enbridge, Inc. | 12,105 | $ | 437,224 | |||||
| Enterprise Products Partners LP | 16,772 | 484,207 | ||||||
|
| |||||||
| $ | 921,431 | |||||||
|
| |||||||
| Network & Telecom – 1.3% |
| |||||||
| Cisco Systems, Inc. | 21,241 | $ | 1,162,520 | |||||
|
| |||||||
| Issuer | Shares/Par | Value ($) | ||||||
| COMMON STOCKS – continued |
| |||||||
| Other Banks & Diversified Financials – 8.6% |
| |||||||
| Aeon Financial Service Co. Ltd. | 29,000 | $ | 466,679 | |||||
| BB&T Corp. | 20,810 | 1,022,395 | ||||||
| Citigroup, Inc. | 18,552 | 1,299,197 | ||||||
| Credicorp Ltd. | 3,928 | 899,158 | ||||||
| HDFC Bank Ltd. | 27,169 | 961,852 | ||||||
| Intesa Sanpaolo S.p.A. | 315,244 | 674,629 | ||||||
| Julius Baer Group Ltd. | 12,600 | 560,947 | ||||||
| KBC Groep N.V. | 11,238 | 736,566 | ||||||
| Mastercard, Inc., “A” | 5,015 | 1,326,618 | ||||||
|
| |||||||
| $ | 7,948,041 | |||||||
|
| |||||||
| Pharmaceuticals – 4.4% |
| |||||||
| Bayer AG | 9,584 | $ | 664,122 | |||||
| Elanco Animal Health, Inc. (a) | 23,261 | 786,222 | ||||||
| Roche Holding AG | 3,639 | 1,023,818 | ||||||
| Santen Pharmaceutical Co. Ltd. | 46,100 | 763,238 | ||||||
| Zoetis, Inc. | 7,136 | 809,865 | ||||||
|
| |||||||
| $ | 4,047,265 | |||||||
|
| |||||||
| Railroad & Shipping – 1.0% |
| |||||||
| Canadian Pacific Railway Ltd. | 2,364 | $ | 556,107 | |||||
| DP World Ltd. | 21,453 | 341,103 | ||||||
|
| |||||||
| $ | 897,210 | |||||||
|
| |||||||
| Real Estate – 1.8% |
| |||||||
| LEG Immobilien AG | 7,495 | $ | 845,439 | |||||
| STORE Capital Corp., REIT | 24,328 | 807,446 | ||||||
|
| |||||||
| $ | 1,652,885 | |||||||
|
| |||||||
| Restaurants – 1.5% |
| |||||||
| Starbucks Corp. | 9,289 | $ | 778,697 | |||||
| Yum China Holdings, Inc. | 12,519 | 578,378 | ||||||
|
| |||||||
| $ | 1,357,075 | |||||||
|
| |||||||
| Specialty Chemicals – 3.4% |
| |||||||
| Akzo Nobel N.V. | 5,525 | $ | 519,184 | |||||
| Croda International PLC | 9,545 | 620,629 | ||||||
| DuPont de Nemours, Inc. | 7,493 | 562,500 | ||||||
| Linde PLC | 4,389 | 881,613 | ||||||
| Sika AG | 3,168 | 540,656 | ||||||
|
| |||||||
| $ | 3,124,582 | |||||||
|
| |||||||
| Specialty Stores – 3.5% |
| |||||||
| Amazon.com, Inc. (a)(s) | 1,186 | $ | 2,245,845 | |||||
| Just Eat PLC (a) | 36,653 | 290,921 | ||||||
| Target Corp. | 7,788 | 674,519 | ||||||
|
| |||||||
| $ | 3,211,285 | |||||||
|
| |||||||
| Telecommunications – Wireless – 2.6% |
| |||||||
| Advanced Info Service Public Co. Ltd. | 114,800 | $ | 808,569 | |||||
| American Tower Corp., REIT | 3,208 | 655,876 | ||||||
| KDDI Corp. | 35,700 | 908,435 | ||||||
|
| |||||||
| $ | 2,372,880 | |||||||
|
| |||||||
| Telephone Services – 1.0% |
| |||||||
| Hellenic Telecommunications Organization S.A. | 30,969 | $ | 457,793 | |||||
5
Table of Contents
MFS Global Research Portfolio
Portfolio of Investments (unaudited) – continued
| Issuer | Shares/Par | Value ($) | ||||||
| COMMON STOCKS – continued |
| |||||||
| Telephone Services – continued |
| |||||||
| TELUS Corp. | 11,876 | $ | 439,019 | |||||
|
| |||||||
| $ | 896,812 | |||||||
|
| |||||||
| Tobacco – 0.9% |
| |||||||
| British American Tobacco PLC | 10,014 | $ | 349,598 | |||||
| Philip Morris International, Inc. | 5,967 | 468,588 | ||||||
|
| |||||||
| $ | 818,186 | |||||||
|
| |||||||
| Utilities – Electric Power – 3.2% |
| |||||||
| CLP Holdings Ltd. | 64,500 | $ | 711,740 | |||||
| CMS Energy Corp. | 17,020 | 985,628 | ||||||
| Iberdrola S.A. | 58,998 | 588,082 | ||||||
| NextEra Energy, Inc. | 3,412 | 698,982 | ||||||
|
| |||||||
| $ | 2,984,432 | |||||||
|
| |||||||
| Total Common Stocks (Identified Cost, $71,921,789) | $ | 91,449,785 | ||||||
|
| |||||||
| INVESTMENT COMPANIES (h) – 0.2% |
| |||||||
| Money Market Funds – 0.2% |
| |||||||
| MFS Institutional Money Market Portfolio, 2.42% (v) (Identified Cost, $176,902) | 176,885 | $ | 176,902 | |||||
|
| |||||||
| COLLATERAL FOR SECURITIES LOANED – 0.8% |
| |||||||
| State Street Navigator Securities Lending Government Money Market Portfolio, 2.36% (j) (Identified Cost, $740,223) | 740,223 | $ | 740,223 | |||||
|
| |||||||
| OTHER ASSETS, LESS LIABILITIES – (0.1)% | (70,028 | ) | ||||||
|
| |||||||
| NET ASSETS – 100.0% | $ | 92,296,882 | ||||||
|
| |||||||
| (a) | Non-income producing security. |
| (h) | An affiliated issuer, which may be considered one in which the fund owns 5% or more of the outstanding voting securities, or a company which is under common control. At period end, the aggregate values of the fund’s investments in affiliated issuers and in unaffiliated issuers were $176,902 and $92,190,008, respectively. |
| (j) | The rate quoted is the annualizedseven-day yield of the fund at period end. |
| (l) | A portion of this security is on loan. See Note 2 for additional information. |
| (s) | Security or a portion of the security was pledged to cover collateral requirements for certain derivative transactions. |
| (v) | Affiliated issuer that is available only to investment companies managed by MFS. The rate quoted for the MFS Institutional Money Market Portfolio is the annualizedseven-day yield of the fund at period end. |
The following abbreviations are used in this report and are defined:
| ADR | American Depositary Receipt |
| REIT | Real Estate Investment Trust |
At June 30, 2019, the fund had cash collateral of $2,565 and other liquid securities with an aggregate value of $548,229 to cover any collateral or margin obligations for certain derivative contracts. Restricted cash and deposits with brokers in the Statement of Assets and Liabilities are comprised of cash collateral.
See Notes to Financial Statements
6
Table of Contents
MFS Global Research Portfolio
FINANCIAL STATEMENTS | STATEMENT OF ASSETS AND LIABILITIES (unaudited)
This statement represents your fund’s balance sheet, which details the assets and liabilities comprising the total value of the fund.
At 6/30/19 | ||||
Assets | ||||
Investments in unaffiliated issuers, at value, including $710,398 of securities on loan (identified cost, $72,662,012) | $92,190,008 | |||
Investments in affiliated issuers, at value (identified cost, $176,902) | 176,902 | |||
Cash | 18 | |||
Foreign currency, at value (identified cost, $7,141) | 7,138 | |||
Deposits with brokers | 2,565 | |||
Receivables for | ||||
Investments sold | 819,752 | |||
Interest and dividends | 185,654 | |||
Other assets | 454 | |||
Total assets | $93,382,491 | |||
Liabilities | ||||
Payables for | ||||
Investments purchased | $149,983 | |||
Fund shares reacquired | 79,679 | |||
Collateral for securities loaned, at value | 740,223 | |||
Payable to affiliates | ||||
Investment adviser | 2,682 | |||
Administrative services fee | 253 | |||
Shareholder servicing costs | 10 | |||
Distribution and/or service fees | 165 | |||
Payable for independent Trustees’ compensation | 100 | |||
Deferred country tax expense payable | 39,061 | |||
Accrued expenses and other liabilities | 73,453 | |||
Total liabilities | $1,085,609 | |||
Net assets | $92,296,882 | |||
Net assets consist of | ||||
Paid-in capital | $61,117,033 | |||
Total distributable earnings (loss) | 31,179,849 | |||
Net assets | $92,296,882 | |||
Shares of beneficial interest outstanding | 2,839,425 | |||
| Net assets | Shares outstanding | Net asset value per share | ||||||||||
Initial Class | $86,228,900 | 2,651,844 | $32.52 | |||||||||
Service Class | 6,067,982 | 187,581 | 32.35 | |||||||||
See Notes to Financial Statements
7
Table of Contents
MFS Global Research Portfolio
FINANCIAL STATEMENTS | STATEMENT OF OPERATIONS (unaudited)
This statement describes how much your fund earned in investment income and accrued in expenses. It also describes any gains and/or losses generated by fund operations.
Six months ended 6/30/19 | ||||
Net investment income (loss) | ||||
Income | ||||
Dividends | $1,352,326 | |||
Income on securities loaned | 8,621 | |||
Dividends from affiliated issuers | 5,477 | |||
Other | 332 | |||
Foreign taxes withheld | (86,326 | ) | ||
Total investment income | $1,280,430 | |||
Expenses | ||||
Management fee | $334,902 | |||
Distribution and/or service fees | 7,442 | |||
Shareholder servicing costs | 815 | |||
Administrative services fee | 11,449 | |||
Independent Trustees’ compensation | 1,854 | |||
Custodian fee | 17,273 | |||
Shareholder communications | 7,587 | |||
Audit and tax fees | 30,157 | |||
Legal fees | 486 | |||
Miscellaneous | 14,782 | |||
Total expenses | $426,747 | |||
Reduction of expenses by investment adviser | (39,459 | ) | ||
Net expenses | $387,288 | |||
Net investment income (loss) | $893,142 | |||
Realized and unrealized gain (loss) | ||||
Realized gain (loss) (identified cost basis) | ||||
Unaffiliated issuers (net of $1,760 country tax) | $2,197,211 | |||
Affiliated issuers | 94 | |||
Foreign currency | 959 | |||
Net realized gain (loss) | $2,198,264 | |||
Change in unrealized appreciation or depreciation | ||||
Unaffiliated issuers (net of $35,488 increase in deferred country tax) | $13,393,133 | |||
Affiliated issuers | 34 | |||
Translation of assets and liabilities in foreign currencies | 699 | |||
Net unrealized gain (loss) | $13,393,866 | |||
Net realized and unrealized gain (loss) | $15,592,130 | |||
Change in net assets from operations | $16,485,272 | |||
See Notes to Financial Statements
8
Table of Contents
MFS Global Research Portfolio
FINANCIAL STATEMENTS | STATEMENTS OF CHANGES IN NET ASSETS
These statements describe the increases and/or decreases in net assets resulting from operations, any distributions, and any shareholder transactions.
| Six months ended 6/30/19 | Year ended 12/31/18 | |||||||
| (unaudited) | ||||||||
Change in net assets | ||||||||
From operations | ||||||||
Net investment income (loss) | $893,142 | $978,628 | ||||||
Net realized gain (loss) | 2,198,264 | 7,591,282 | ||||||
Net unrealized gain (loss) | 13,393,866 | (16,336,922 | ) | |||||
Change in net assets from operations | $16,485,272 | $(7,767,012 | ) | |||||
Total distributions to shareholders | $— | $(6,655,034 | ) | |||||
Change in net assets from fund share transactions | $(7,052,554 | ) | $(8,459,434 | ) | ||||
Total change in net assets | $9,432,718 | $(22,881,480 | ) | |||||
Net assets | ||||||||
At beginning of period | 82,864,164 | 105,745,644 | ||||||
At end of period | $92,296,882 | $82,864,164 | ||||||
See Notes to Financial Statements
9
Table of Contents
MFS Global Research Portfolio
FINANCIAL STATEMENTS | FINANCIAL HIGHLIGHTS
The financial highlights table is intended to help you understand the fund’s financial performance for the semiannual period and the past 5 fiscal years. Certain information reflects financial results for a single fund share. The total returns in the table represent the rate that an investor would have earned (or lost) on an investment in the fund share class (assuming reinvestment of all distributions) held for the entire period.
| Initial Class | Six months 6/30/19 | Year ended | ||||||||||||||||||||||
| 12/31/18 | 12/31/17 | 12/31/16 | 12/31/15 | 12/31/14 | ||||||||||||||||||||
| (unaudited) | ||||||||||||||||||||||||
Net asset value, beginning of period | $27.00 | $31.74 | $25.69 | $24.63 | $25.18 | $24.85 | ||||||||||||||||||
| Income (loss) from investment operations | ||||||||||||||||||||||||
Net investment income (loss) (d) | $0.30 | $0.32 | $0.28 | $0.41 | (c) | $0.25 | $0.29 | |||||||||||||||||
Net realized and unrealized gain (loss) | 5.22 | (2.82 | ) | 6.24 | 0.93 | (0.47 | ) | 0.31 | ||||||||||||||||
Total from investment operations | $5.52 | $(2.50 | ) | $6.52 | $1.34 | $(0.22 | ) | $0.60 | ||||||||||||||||
| Less distributions declared to shareholders | ||||||||||||||||||||||||
From net investment income | $— | $(0.33 | ) | $(0.47 | ) | $(0.28 | ) | $(0.33 | ) | $(0.27 | ) | |||||||||||||
From net realized gain | — | (1.91 | ) | — | — | — | — | |||||||||||||||||
Total distributions declared to shareholders | $— | $(2.24 | ) | $(0.47 | ) | $(0.28 | ) | $(0.33 | ) | $(0.27 | ) | |||||||||||||
Net asset value, end of period (x) | $32.52 | $27.00 | $31.74 | $25.69 | $24.63 | $25.18 | ||||||||||||||||||
Total return (%) (k)(r)(s)(x) | 20.44 | (n) | (8.83 | ) | 25.51 | 5.44 | (c) | (0.81 | ) | 2.40 | ||||||||||||||
| Ratios (%) (to average net assets) and Supplemental data: | ||||||||||||||||||||||||
Expenses before expense reductions (f) | 0.94 | (a) | 0.93 | 0.92 | 0.78 | (c) | 0.92 | 0.92 | ||||||||||||||||
Expenses after expense reductions (f) | 0.85 | (a) | 0.88 | 0.92 | 0.77 | (c) | 0.91 | 0.91 | ||||||||||||||||
Net investment income (loss) | 2.02 | (a)(l) | 1.01 | 0.97 | 1.64 | (c) | 0.98 | 1.15 | ||||||||||||||||
Portfolio turnover | 15 | (n) | 22 | 33 | 40 | 40 | 37 | |||||||||||||||||
Net assets at end of period (000 omitted) | $86,229 | $77,345 | $98,434 | $91,281 | $98,321 | $113,018 | ||||||||||||||||||
Ratio of expenses to average net assets after expense reductions | N/A | N/A | N/A | N/A | N/A | 0.91 | ||||||||||||||||||
| Service Class | Six months 6/30/19 | Year ended | ||||||||||||||||||||||
| 12/31/18 | 12/31/17 | 12/31/16 | 12/31/15 | 12/31/14 | ||||||||||||||||||||
| (unaudited) | ||||||||||||||||||||||||
Net asset value, beginning of period | $26.89 | $31.61 | $25.59 | $24.52 | $25.06 | $24.72 | ||||||||||||||||||
| Income (loss) from investment operations | ||||||||||||||||||||||||
Net investment income (loss) (d) | $0.27 | $0.24 | $0.21 | $0.34 | (c) | $0.19 | $0.23 | |||||||||||||||||
Net realized and unrealized gain (loss) | 5.19 | (2.82 | ) | 6.20 | 0.94 | (0.47 | ) | 0.31 | ||||||||||||||||
Total from investment operations | $5.46 | $(2.58 | ) | $6.41 | $1.28 | $(0.28 | ) | $0.54 | ||||||||||||||||
| Less distributions declared to shareholders | ||||||||||||||||||||||||
From net investment income | $— | $(0.23 | ) | $(0.39 | ) | $(0.21 | ) | $(0.26 | ) | $(0.20 | ) | |||||||||||||
From net realized gain | — | (1.91 | ) | — | — | — | — | |||||||||||||||||
Total distributions declared to shareholders | $— | $(2.14 | ) | $(0.39 | ) | $(0.21 | ) | $(0.26 | ) | $(0.20 | ) | |||||||||||||
Net asset value, end of period (x) | $32.35 | $26.89 | $31.61 | $25.59 | $24.52 | $25.06 | ||||||||||||||||||
Total return (%) (k)(r)(s)(x) | 20.30 | (n) | (9.06 | ) | 25.17 | 5.21 | (c) | (1.09 | ) | 2.15 | ||||||||||||||
| Ratios (%) (to average net assets) and Supplemental data: | ||||||||||||||||||||||||
Expenses before expense reductions (f) | 1.19 | (a) | 1.18 | 1.17 | 1.03 | (c) | 1.17 | 1.17 | ||||||||||||||||
Expenses after expense reductions (f) | 1.10 | (a) | 1.13 | 1.17 | 1.02 | (c) | 1.16 | 1.16 | ||||||||||||||||
Net investment income (loss) | 1.77 | (a)(l) | 0.76 | 0.73 | 1.39 | (c) | 0.74 | 0.90 | ||||||||||||||||
Portfolio turnover | 15 | (n) | 22 | 33 | 40 | 40 | 37 | |||||||||||||||||
Net assets at end of period (000 omitted) | $6,068 | $5,519 | $7,312 | $7,415 | $8,151 | $9,551 | ||||||||||||||||||
Ratio of expenses to average net assets after expense reductions | N/A | N/A | N/A | N/A | N/A | 1.16 | ||||||||||||||||||
See Notes to Financial Statements
10
Table of Contents
MFS Global Research Portfolio
Financial Highlights – continued
| (a) | Annualized. |
| (c) | Amount reflects aone-time reimbursement of expenses by the custodian (or former custodian) without which net investment income and performance would be lower and expenses would be higher. |
| (d) | Per share data is based on average shares outstanding. |
| (f) | Ratios do not reflect reductions from fees paid indirectly, if applicable. |
| (k) | The total return does not reflect expenses that apply to separate accounts. Inclusion of these charges would reduce the total return figures for all periods shown. |
| (l) | Recognition of net investment income by the fund may be affected by the timing of the declaration of dividends by companies in which the fund invests and the actual annual net investment income ratio may differ. |
| (n) | Not annualized. |
| (r) | Certain expenses have been reduced without which performance would have been lower. |
| (s) | From time to time the fund may receive proceeds from litigation settlements, without which performance would be lower. |
| (x) | The net asset values and total returns have been calculated on net assets which include adjustments made in accordance with U.S. generally accepted accounting principles required at period end for financial reporting purposes. |
See Notes to Financial Statements
11
Table of Contents
MFS Global Research Portfolio
NOTES TO FINANCIAL STATEMENTS (unaudited)
| (1) | Business and Organization |
MFS Global Research Portfolio (the fund) is a diversified series of MFS Variable Insurance Trust II (the trust). The trust is organized as a Massachusetts business trust and is registered under the Investment Company Act of 1940, as amended, as anopen-end management investment company. The shareholders of each series of the trust are separate accounts of insurance companies, which offer variable annuity and/or life insurance products, and qualified retirement and pension plans.
The fund is an investment company and accordingly follows the investment company accounting and reporting guidance of the Financial Accounting Standards Board (FASB) Accounting Standards Codification Topic 946 Financial Services – Investment Companies.
| (2) | Significant Accounting Policies |
General– The preparation of financial statements in conformity with U.S. generally accepted accounting principles requires management to make estimates and assumptions that affect the reported amounts of assets and liabilities, and disclosure of contingent assets and liabilities at the date of the financial statements and the reported amounts of increases and decreases in net assets from operations during the reporting period. Actual results could differ from those estimates. In the preparation of these financial statements, management has evaluated subsequent events occurring after the date of the fund’s Statement of Assets and Liabilities through the date that the financial statements were issued. The fund invests in foreign securities. Investments in foreign securities are vulnerable to the effects of changes in the relative values of the local currency and the U.S. dollar and to the effects of changes in each country’s market, economic, industrial, political, regulatory, geopolitical, and other conditions.
Balance Sheet Offsetting– The fund’s accounting policy with respect to balance sheet offsetting is that, absent an event of default by the counterparty or a termination of the agreement, the International Swaps and Derivatives Association (ISDA) Master Agreement, or similar agreement, does not result in an offset of reported amounts of financial assets and financial liabilities in the Statement of Assets and Liabilities across transactions between the fund and the applicable counterparty. The fund’s right to setoff may be restricted or prohibited by the bankruptcy or insolvency laws of the particular jurisdiction to which a specific master netting agreement counterparty is subject. Balance sheet offsetting disclosures, to the extent applicable to the fund, have been included in the fund’s Significant Accounting Policies note under the captions for each of the fund’sin-scope financial instruments and transactions.
Investment Valuations– Equity securities, including restricted equity securities, are generally valued at the last sale or official closing price on their primary market or exchange as provided by a third-party pricing service. Equity securities, for which there were no sales reported that day, are generally valued at the last quoted daily bid quotation on their primary market or exchange as provided by a third-party pricing service. Short-term instruments with a maturity at issuance of 60 days or less may be valued at amortized cost, which approximates market value.Open-end investment companies are generally valued at net asset value per share. Securities and other assets generally valued on the basis of information from a third-party pricing service may also be valued at a broker/dealer bid quotation. In determining values, third-party pricing services can utilize both transaction data and market information such as yield, quality, coupon rate, maturity, type of issue, trading characteristics, and other market data. The values of foreign securities and other assets and liabilities expressed in foreign currencies are converted to U.S. dollars using the mean of bid and asked prices for rates provided by a third-party pricing service.
The Board of Trustees has delegated primary responsibility for determining or causing to be determined the value of the fund’s investments (including any fair valuation) to the adviser pursuant to valuation policies and procedures approved by the Board. If the adviser determines that reliable market quotations are not readily available, investments are valued at fair value as determined in good faith by the adviser in accordance with such procedures under the oversight of the Board of Trustees. Under the fund’s valuation policies and procedures, market quotations are not considered to be readily available for most types of debt instruments and floating rate loans and many types of derivatives. These investments are generally valued at fair value based on information from third-party pricing services. In addition, investments may be valued at fair value if the adviser determines that an investment’s value has been materially affected by events occurring after the close of the exchange or market on which the investment is principally traded (such as foreign exchange or market) and prior to the determination of the fund’s net asset value, or after the halt of trading of a specific security where trading does not resume prior to the close of the exchange or market on which the security is principally traded. Events that occur after foreign markets close (such as developments in foreign markets and significant movements in the U.S. markets) and prior to the determination of the fund’s net asset value may be deemed to have a material effect on the value of securities traded in foreign markets. Accordingly, the fund’s foreign equity securities may often be valued at fair value. The adviser generally relies on third-party pricing services or other information (such as the correlation with price movements of similar securities in the same or other markets; the type, cost and investment characteristics of the security; the business and financial condition of the issuer; and trading and other market data) to assist in determining whether to fair value and at what value to fair value an investment. The value of an investment for purposes of calculating the fund’s net asset value can differ depending on the source and method used to determine value. When fair valuation is used, the value of an investment used to determine the fund’s net asset
12
Table of Contents
MFS Global Research Portfolio
Notes to Financial Statements (unaudited) – continued
value may differ from quoted or published prices for the same investment. There can be no assurance that the fund could obtain the fair value assigned to an investment if it were to sell the investment at the same time at which the fund determines its net asset value per share.
Various inputs are used in determining the value of the fund’s assets or liabilities. These inputs are categorized into three broad levels. In certain cases, the inputs used to measure fair value may fall into different levels of the fair value hierarchy. In such cases, an investment’s level within the fair value hierarchy is based on the lowest level of input that is significant to the fair value measurement. The fund’s assessment of the significance of a particular input to the fair value measurement in its entirety requires judgment, and considers factors specific to the investment. Level 1 includes unadjusted quoted prices in active markets for identical assets or liabilities. Level 2 includes other significant observable market-based inputs (including quoted prices for similar securities, interest rates, prepayment speed, and credit risk). Level 3 includes unobservable inputs, which may include the adviser’s own assumptions in determining the fair value of investments. The following is a summary of the levels used as of June 30, 2019 in valuing the fund’s assets or liabilities:
| Financial Instruments | Level 1 | Level 2 | Level 3 | Total | ||||||||||||
| Equity Securities | $91,449,785 | $— | $— | $91,449,785 | ||||||||||||
| Mutual Funds | 917,125 | — | — | 917,125 | ||||||||||||
| Total | $92,366,910 | $— | $— | $92,366,910 | ||||||||||||
For further information regarding security characteristics, see the Portfolio of Investments.
Foreign Currency Translation– Purchases and sales of foreign investments, income, and expenses are converted into U.S. dollars based upon currency exchange rates prevailing on the respective dates of such transactions or on the reporting date for foreign denominated receivables and payables. Gains and losses attributable to foreign currency exchange rates on sales of securities are recorded for financial statement purposes as net realized gains and losses on investments. Gains and losses attributable to foreign exchange rate movements on receivables, payables, income and expenses are recorded for financial statement purposes as foreign currency transaction gains and losses. That portion of both realized and unrealized gains and losses on investments that results from fluctuations in foreign currency exchange rates is not separately disclosed.
Security Loans– Under its Securities Lending Agency Agreement with the fund, State Street Bank and Trust Company, as lending agent, loans the securities of the fund to certain qualified institutions (the “Borrowers”) approved by the fund. Security loans can be terminated at the discretion of either the lending agent or the fund and the related securities must be returned within the earlier of the standard trade settlement period for such securities or within three business days. The loans are collateralized by cash and/or U.S. Treasury and federal agency obligations in an amount typically at least equal to the market value of the securities loaned. On loans collateralized by cash, the cash collateral is invested in a money market fund. The market value of the loaned securities is determined at the close of business of the fund and any additional required collateral is delivered to the fund on the next business day. The lending agent provides the fund with indemnification against Borrower default. In the event of Borrower default, the lending agent will, for the benefit of the fund, either purchase securities identical to those loaned or, when such purchase is commercially impracticable, pay the fund the market value of the loaned securities. In return, the lending agent assumes the fund’s rights to the related collateral. If the collateral value is less than the cost to purchase identical securities, the lending agent is responsible for the shortfall, but only to the extent that such shortfall is not due to a decline in collateral value resulting from collateral reinvestment for which the fund bears the risk of loss. At period end, the fund had investment securities on loan, all of which were classified as equity securities in the fund’s Portfolio of Investments, with a fair value of $710,398. The fair value of the fund’s investment securities on loan and a related liability of $740,223 for cash collateral received on securities loaned are both presented gross in the Statement of Assets and Liabilities. The collateral on securities loaned exceeded the value of securities on loan at period end. The liability for cash collateral for securities loaned is carried at fair value, which is categorized as level 2 within the fair value hierarchy. A portion of the income generated upon investment of the collateral is remitted to the Borrowers, and the remainder is allocated between the fund and the lending agent. On loans collateralized by U.S. Treasury and/or federal agency obligations, a fee is received from the Borrower, and is allocated between the fund and the lending agent. Income from securities lending is separately reported in the Statement of Operations. The dividend and interest income earned on the securities loaned is accounted for in the same manner as other dividend and interest income.
Indemnifications– Under the fund’s organizational documents, its officers and Trustees may be indemnified against certain liabilities and expenses arising out of the performance of their duties to the fund. Additionally, in the normal course of business, the fund enters into agreements with service providers that may contain indemnification clauses. The fund’s maximum exposure under these agreements is unknown as this would involve future claims that may be made against the fund that have not yet occurred.
Investment Transactions and Income– Investment transactions are recorded on the trade date. Interest income is recorded on the accrual basis. Dividends received in cash are recorded on theex-dividend date. Certain dividends from foreign securities will be
13
Table of Contents
MFS Global Research Portfolio
Notes to Financial Statements (unaudited) – continued
recorded when the fund is informed of the dividend if such information is obtained subsequent to theex-dividend date. Dividend payments received in additional securities are recorded on theex-dividend date in an amount equal to the value of the security on such date.
The fund may receive proceeds from litigation settlements. Any proceeds received from litigation involving portfolio holdings are reflected in the Statement of Operations in realized gain/loss if the security has been disposed of by the fund or in unrealized gain/loss if the security is still held by the fund. Any other proceeds from litigation not related to portfolio holdings are reflected as other income in the Statement of Operations.
Tax Matters and Distributions– The fund intends to qualify as a regulated investment company, as defined under Subchapter M of the Internal Revenue Code, and to distribute all of its taxable income, including realized capital gains. As a result, no provision for federal income tax is required. The fund’s federal tax returns, when filed, will remain subject to examination by the Internal Revenue Service for a three year period. Management has analyzed the fund’s tax positions taken on federal and state tax returns for all open tax years and does not believe that there are any uncertain tax positions that require recognition of a tax liability. Foreign taxes, if any, have been accrued by the fund in the accompanying financial statements in accordance with the applicable foreign tax law. Foreign income taxes may be withheld by certain countries in which the fund invests. Additionally, capital gains realized by the fund on securities issued in or by certain foreign countries may be subject to capital gains tax imposed by those countries.
Distributions to shareholders are recorded on theex-dividend date. Income and capital gain distributions are determined in accordance with income tax regulations, which may differ from U.S. generally accepted accounting principles. Certain capital accounts in the financial statements are periodically adjusted for permanent differences in order to reflect their tax character. These adjustments have no impact on net assets or net asset value per share. Temporary differences which arise from recognizing certain items of income, expense, gain or loss in different periods for financial statement and tax purposes will reverse at some time in the future. Distributions in excess of net investment income or net realized gains are temporary overdistributions for financial statement purposes resulting from differences in the recognition or classification of income or distributions for financial statement and tax purposes.
Book/tax differences primarily relate to partnership adjustments.
The tax character of distributions declared to shareholders for the last fiscal year is as follows:
| Year ended 12/31/18 | ||||
| Ordinary income (including any short-term capital gains) | $952,020 | |||
| Long-term capital gains | 5,703,014 | |||
| Total distributions | $6,655,034 | |||
The federal tax cost and the tax basis components of distributable earnings were as follows:
| As of 6/30/19 | ||||
| Cost of investments | $72,937,635 | |||
| Gross appreciation | 23,381,079 | |||
| Gross depreciation | (3,951,804 | ) | ||
| Net unrealized appreciation (depreciation) | $19,429,275 | |||
| As of 12/31/18 | ||||
| Undistributed ordinary income | 1,132,643 | |||
| Undistributed long-term capital gain | 7,435,745 | |||
| Other temporary differences | 128,069 | |||
| Net unrealized appreciation (depreciation) | 5,998,120 | |||
The aggregate cost above includes prior fiscal year end tax adjustments, if applicable.
Multiple Classes of Shares of Beneficial Interest– The fund offers multiple classes of shares, which differ in their respective distribution and/or service fees. The fund’s income, realized and unrealized gain (loss), and common expenses are allocated to shareholders based on the daily net assets of each class. Dividends are declared separately for each class. Differences in per share
14
Table of Contents
MFS Global Research Portfolio
Notes to Financial Statements (unaudited) – continued
dividend rates are generally due to differences in separate class expenses. The fund’s distributions declared to shareholders as reported in the Statements of Changes in Net Assets are presented by class as follows:
| From net investment income | From net realized gain | |||||||||||||||
| Six months ended 6/30/19 | Year ended 12/31/18 | Six months ended 6/30/19 | Year ended 12/31/18 | |||||||||||||
| Initial Class | $— | $905,232 | $— | $5,317,564 | ||||||||||||
| Service Class | — | 46,788 | — | 385,450 | ||||||||||||
| Total | $— | $952,020 | $— | $5,703,014 | ||||||||||||
| (3) | Transactions with Affiliates |
Investment Adviser– The fund has an investment advisory agreement with MFS to provide overall investment management and related administrative services and facilities to the fund. The management fee is computed daily and paid monthly at the following annual rates based on the fund’s average daily net assets:
| Up to $300 million | 0.75% | |||
| In excess of $300 million | 0.675% |
MFS has agreed in writing to reduce its management fee by a specified amount if certain MFS mutual fund assets exceed thresholds agreed to by MFS and the fund’s Board of Trustees. For the six months ended June 30, 2019, this management fee reduction amounted to $4,307, which is included in the reduction of total expenses in the Statement of Operations. The management fee incurred for the six months ended June 30, 2019 was equivalent to an annual effective rate of 0.74% of the fund’s average daily net assets.
The investment adviser has agreed in writing to pay a portion of the fund’s total annual operating expenses, excluding interest, taxes, extraordinary expenses, brokerage and transaction costs, and investment-related expenses, such that total annual operating expenses do not exceed 0.85% of average daily net assets for the Initial Class shares and 1.10% of average daily net assets for the Service Class shares. This written agreement will continue until modified by the fund’s Board of Trustees, but such agreement will continue at least until April 30, 2021. For the six months ended June 30, 2019, this reduction amounted to $35,152, which is included in the reduction of total expenses in the Statement of Operations.
Distributor– MFS Fund Distributors, Inc. (MFD), a wholly-owned subsidiary of MFS, is the distributor of shares of the fund. The Trustees have adopted a distribution plan for the Service Class shares pursuant to Rule12b-1 under the Investment Company Act of 1940.
The fund’s distribution plan provides that the fund will pay MFD distribution and/or service fees equal to 0.25% per annum of its average daily net assets attributable to Service Class shares as partial consideration for services performed and expenses incurred by MFD and financial intermediaries (including participating insurance companies that invest in the fund to fund variable annuity and variable life insurance contracts, sponsors of qualified retirement and pension plans that invest in the fund, and affiliates of these participating insurance companies and plan sponsors) in connection with the sale and distribution of the Service Class shares. MFD may subsequently pay all, or a portion, of the distribution and/or service fees to financial intermediaries.
Shareholder Servicing Agent– MFS Service Center, Inc. (MFSC), a wholly-owned subsidiary of MFS, receives a fee from the fund for its services as shareholder servicing agent. For the six months ended June 30, 2019, the fee was $771, which equated to 0.0017% annually of the fund’s average daily net assets. MFSC also receives payment from the fund forout-of-pocket expenses paid by MFSC on behalf of the fund. For the six months ended June 30, 2019, these costs amounted to $44.
Administrator– MFS provides certain financial, legal, shareholder communications, compliance, and other administrative services to the fund. Under an administrative services agreement, the fund reimburses MFS the costs incurred to provide these services. The fund is charged an annual fixed amount of $17,500 plus a fee based on average daily net assets. The administrative services fee incurred for the six months ended June 30, 2019 was equivalent to an annual effective rate of 0.0256% of the fund’s average daily net assets.
Trustees’ and Officers’ Compensation– The fund pays compensation to independent Trustees in the form of a retainer, attendance fees, and additional compensation to Board and Committee chairpersons. The fund does not pay compensation directly to Trustees or officers of the fund who are also officers of the investment adviser, all of whom receive remuneration from MFS for their services to the fund. Certain officers and Trustees of the fund are officers or directors of MFS, MFD, and MFSC.
Other– This fund and certain other funds managed by MFS (the funds) had entered into a service agreement (the ISO Agreement) which provided for payment of fees solely by the funds to Tarantino LLC in return for the provision of services of an Independent Senior Officer (ISO) for the funds. Frank L. Tarantino served as the ISO and was an officer of the funds and the sole member of Tarantino LLC. Effective June 30, 2019, Mr. Tarantino retired from his position as ISO for the funds, and the ISO Agreement was
15
Table of Contents
MFS Global Research Portfolio
Notes to Financial Statements (unaudited) – continued
terminated. For the six months ended June 30, 2019, the fee paid by the fund under this agreement was $106 and is included in “Miscellaneous” expense in the Statement of Operations. MFS had agreed to bear all expenses associated with office space, other administrative support, and supplies provided to the ISO.
The fund invests in the MFS Institutional Money Market Portfolio which is managed by MFS and seeks current income consistent with preservation of capital and liquidity. This money market fund does not pay a management fee to MFS.
The fund is permitted to engage in purchase and sale transactions with funds and accounts for which MFS serves as investment adviser orsub-adviser (“cross-trades”) pursuant to a policy adopted by the Board of Trustees. This policy has been designed to ensure that cross-trades conducted by the fund comply with Rule17a-7 under the Investment Company Act of 1940. During the six months ended June 30, 2019, the fund engaged in sale transactions pursuant to this policy, which amounted to $50,359. The sales transactions resulted in net realized gains (losses) of $13,870.
| (4) | Portfolio Securities |
For the six months ended June 30, 2019, purchases and sales of investments, other than short-term obligations, aggregated $13,657,627 and $20,157,929, respectively.
| (5) | Shares of Beneficial Interest |
The fund’s Declaration of Trust permits the Trustees to issue an unlimited number of full and fractional shares of beneficial interest. Transactions in fund shares were as follows:
| Six months ended 6/30/19 | Year ended 12/31/18 | |||||||||||||||
| Shares | Amount | Shares | Amount | |||||||||||||
| Shares sold | ||||||||||||||||
Initial Class | 9,717 | $294,634 | 21,167 | $662,568 | ||||||||||||
Service Class | 930 | 28,062 | 13,000 | 400,637 | ||||||||||||
| 10,647 | $322,696 | 34,167 | $1,063,205 | |||||||||||||
| Shares issued to shareholders in reinvestment of distributions | ||||||||||||||||
Initial Class | — | $— | 199,449 | $6,222,796 | ||||||||||||
Service Class | — | — | 13,898 | 432,238 | ||||||||||||
| — | $— | 213,347 | $6,655,034 | |||||||||||||
| Shares reacquired | ||||||||||||||||
Initial Class | (222,781 | ) | $(6,802,681 | ) | (457,412 | ) | $(14,510,661 | ) | ||||||||
Service Class | (18,585 | ) | (572,569 | ) | (52,984 | ) | (1,667,012 | ) | ||||||||
| (241,366 | ) | $(7,375,250 | ) | (510,396 | ) | $(16,177,673 | ) | |||||||||
| Net change | ||||||||||||||||
Initial Class | (213,064 | ) | $(6,508,047 | ) | (236,796 | ) | $(7,625,297 | ) | ||||||||
Service Class | (17,655 | ) | (544,507 | ) | (26,086 | ) | (834,137 | ) | ||||||||
| (230,719 | ) | $(7,052,554 | ) | (262,882 | ) | $(8,459,434 | ) | |||||||||
| (6) | Line of Credit |
The fund and certain other funds managed by MFS participate in a $1.25 billion unsecured committed line of credit, subject to a $1 billion sublimit, provided by a syndicate of banks under a credit agreement. Borrowings may be made for temporary financing needs. Interest is charged to each fund, based on its borrowings, generally at a rate equal to the highest of one month LIBOR, the Federal Funds Effective Rate and the Overnight Bank Funding Rate, plus an agreed upon spread. A commitment fee, based on the average daily, unused portion of the committed line of credit, is allocated among the participating funds. In addition, the fund and other funds managed by MFS have established unsecured uncommitted borrowing arrangements with certain banks for temporary financing needs. Interest is charged to each fund, based on its borrowings, at rates equal to customary reference rates plus an agreed upon spread. For the six months ended June 30, 2019, the fund’s commitment fee and interest expense were $264 and $0, respectively, and are included in “Miscellaneous” expense in the Statement of Operations.
16
Table of Contents
MFS Global Research Portfolio
Notes to Financial Statements (unaudited) – continued
| (7) | Investments in Affiliated Issuers |
An affiliated issuer may be considered one in which the fund owns 5% or more of the outstanding voting securities, or a company which is under common control. For the purposes of this report, the following were affiliated issuers:
| Affiliated Issuers | Beginning Value | Purchases | Sales Proceeds | Realized Gain (Loss) | Change in Unrealized Appreciation or Depreciation | Ending Value | ||||||||||||||||||
| MFS Institutional Money Market Portfolio | $503,401 | $6,407,137 | $6,733,764 | $94 | $34 | $176,902 | ||||||||||||||||||
| Affiliated Issuers | Dividend Income | Capital Gain Distributions | ||||||||||||||||||||||
| MFS Institutional Money Market Portfolio | $5,477 | $— | ||||||||||||||||||||||
17
Table of Contents
MFS Global Research Portfolio
PROXY VOTING POLICIES AND INFORMATION
MFS votes proxies on behalf of the fund pursuant to proxy voting policies and procedures that are available without charge, upon request, by calling 1-800-225-2606, by visitingmfs.com/proxyvoting, or by visiting the SEC’s Web site athttp://www.sec.gov.
Information regarding how the fund voted proxies relating to portfolio securities during the most recent twelve-month period ended June 30 is available by August 31 of each year without charge by visitingmfs.com/proxyvoting, or by visiting the SEC’s Web site athttp://www.sec.gov.
QUARTERLY PORTFOLIO DISCLOSURE
The fund files a complete schedule of portfolio holdings with the SEC for the first and third quarters of each fiscal year on Form N-Q or as an exhibit to its reports on Form N-PORT (for first and third fiscal quarters ending March 31, 2019 or after). The fund’sForm N-Q or Form N-PORT reports are available on the SEC’s website athttp://www.sec.gov.A shareholder can obtain the portfolio holdings report for the first and third quarters of the fund’s fiscal year atmfs.com/vit2 by choosing the fund’s name and then selecting the “Resources” tab and clicking on “Prospectus and Reports”.
From time to time, MFS may post important information about the fund or the MFS funds on the MFS web site (mfs.com). This information is available athttps://www.mfs.com/en-us/what-we-do/announcements.htmlor atmfs.com/vit2 by choosing the fund’s name.
INFORMATION ABOUT FUND CONTRACTS AND LEGAL CLAIMS
The fund has entered into contractual arrangements with an investment adviser, administrator, distributor, shareholder servicing agent, 529 program manager (if applicable), and custodian who each provide services to the fund. Unless expressly stated otherwise, shareholders are not parties to, or intended beneficiaries of these contractual arrangements, and these contractual arrangements are not intended to create any shareholder right to enforce them against the service providers or to seek any remedy under them against the service providers, either directly or on behalf of the fund.
Under the Trust’s By-Laws and Declaration of Trust, any claims asserted against or on behalf of the MFS Funds, including claims against Trustees and Officers, must be brought in state and federal courts located within the Commonwealth of Massachusetts.
18
Table of Contents
Table of Contents
Semiannual Report
June 30, 2019

MFS® Global Tactical
Allocation Portfolio

MFS® Variable Insurance Trust II
Beginning on January 1, 2021, as permitted by regulations adopted by the U.S. Securities and Exchange Commission, the insurance company that offers your contract may determine that it will no longer send you paper copies of the fund’s annual and semiannual shareholder reports unless you specifically request paper copies from the insurance company or from your financial intermediary. Instead, the shareholder reports will be made available on a Web site (insurancefunds.mfs.com or other Web site of which you will be notified), and the insurance company will notify you by mail each time a report is posted and provide you with a Web site link to access the report. Instructions for requesting paper copies will be provided by your insurance company or financial intermediary.
If you already elected to receive shareholder reports by email, you will not be affected by this change and you need not take any action. If your insurance company or financial intermediary offers electronic delivery, you may elect to receive shareholder reports and other communications from the insurance company or financial intermediary by email by following the instructions provided by the insurance company or financial intermediary.
Beginning on January 1, 2019, you may elect to receive all future reports in paper free of charge from the insurance company or financial intermediary. You can inform the insurance company or financial intermediary that you wish to continue receiving paper copies of your shareholder reports by contacting your insurance company or financial intermediary. Your election to receive reports in paper will apply to all funds held in your account with your insurance company or financial intermediary.
WTS-SEM
Table of Contents
MFS® Global Tactical Allocation Portfolio
The report is prepared for the general information of contract owners. It is authorized for distribution to prospective investors only when preceded or accompanied by a current prospectus.
NOT FDIC INSURED• MAY LOSE VALUE• NO BANK OR CREDIT UNION GUARANTEE• NOT A DEPOSIT• NOT INSURED BY ANY FEDERAL GOVERNMENT AGENCY OR NCUA/NCUSIF
Table of Contents
MFS Global Tactical Allocation Portfolio
LETTER FROM THE EXECUTIVE CHAIRMAN

Dear Contract Owners:
Slowing global growth, low inflation, and increasing trade friction between the United States and China have been hallmarks of the past 12 months. After experiencing an uptick in market volatility in late 2018, markets steadied during the first half of 2019, thanks in large measure to the adoption of a dovish policy stance on the part of global central banks, who have largely abandoned efforts to normalize interest rates and have instead focused on supporting economic growth. Trade tensions remain high as the U.S. has ratcheted up tariffs on Chinese imports and China has retaliated. A truce of sorts was reached midyear, but significant challenges continue to confront negotiators, and it is not known whether a comprehensive agreement can be reached.
With Boris Johnson replacing Theresa May as Britain’s prime minister, uncertainty over Brexit remains high. Johnson has adopted a more combative stance than his predecessor toward the European Union, increasing concerns that there will be a “hard” Brexit.
Markets expect that the longest economic expansion in U.S. history will continue for the time being, albeit at a slower pace. Nevertheless, slower growth and low inflation have spurred the U.S. Federal Reserve to take a more accommodative policy stance, prompting investors to anticipate several interest rate cuts in the coming year. The European Central Bank has adopted a similar position. The more accommodative environment has helped fuel a continued rise in global equities and has been broadly supportive of risk assets.
Since launching the first U.S.open-end mutual fund in 1924, MFS® has been committed to a single purpose: to create value by allocating capital responsibly for clients. Through our powerful global investment platform, we combine collective expertise, thoughtful risk management, and long-term discipline to uncover what we believe are the best investment opportunities in the market.
Respectfully,

Robert J. Manning
Executive Chairman
MFS Investment Management
August 16, 2019
The opinions expressed in this letter are subject to change and may not be relied upon for investment advice. No forecasts can be guaranteed.
1
Table of Contents
MFS Global Tactical Allocation Portfolio
Portfolio Structure
| Tactical Overlay (b) | ||||||||||||||||||
| Active Security Selection (a) | Long | Short | Net Market Exposure (c) | |||||||||||||||
| Fixed Income | U.S. | 21.9% | 38.2% | (14.6)% | 45.5% | |||||||||||||
| Japan | 6.0% | 9.5% | 0.0% | 15.5% | ||||||||||||||
| Asia/Pacificex-Japan | 2.4% | 8.4% | 0.0% | 10.8% | ||||||||||||||
| Emerging Markets | 5.4% | 0.0% | 0.0% | 5.4% | ||||||||||||||
| Europeex-U.K. | 5.7% | 0.0% | (0.4)% | 5.3% | ||||||||||||||
| Supranational | 0.8% | 0.0% | 0.0% | 0.8% | ||||||||||||||
| North Americaex-U.S. | 2.6% | 0.0% | (6.4)% | (3.8)% | ||||||||||||||
| United Kingdom | 3.1% | 0.0% | (8.4)% | (5.3)% | ||||||||||||||
| Total | 47.9% | 56.1% | (29.8)% | 74.2% | ||||||||||||||
| Equity | U.S. Large Cap | 17.8% | 0.1% | 0.0% | 17.9% | |||||||||||||
| Europeex-U.K. | 7.6% | 4.8% | (3.2)% | 9.2% | ||||||||||||||
| United Kingdom | 2.1% | 4.1% | 0.0% | 6.2% | ||||||||||||||
| Asia/Pacificex-Japan | 0.6% | 5.7% | (1.4)% | 4.9% | ||||||||||||||
| North Americaex-U.S. | 1.5% | 1.6% | 0.0% | 3.1% | ||||||||||||||
| Japan | 2.8% | 0.0% | (1.3)% | 1.5% | ||||||||||||||
| Emerging Markets | 2.0% | 3.7% | (6.1)% | (0.4)% | ||||||||||||||
| U.S. Small/Mid Cap | 1.1% | 0.0% | (4.3)% | (3.2)% | ||||||||||||||
| Total | 35.5% | 20.0% | (16.3)% | 39.2% | ||||||||||||||
| Real Estate-related | Non-U.S. | 0.7% | 0.0% | 0.0% | 0.7% | |||||||||||||
| U.S. | 0.5% | 0.0% | 0.0% | 0.5% | ||||||||||||||
| Total | 1.2% | 0.0% | 0.0% | 1.2% | ||||||||||||||
| Cash | Cash & Cash Equivalents (d) | 2.3% | ||||||||||||||||
| Other (e) | (16.9)% | |||||||||||||||||
| Total | (14.6)% | |||||||||||||||||
| Total Net Exposure Summary | 100.0% | |||||||||||||||||
| Strategic Allocation Targets & Net Exposure Ranges |
| |||||||
| Asset Class | Target (w) | Ranges (z) | ||||||
| Equities | 35% | 0 to 70% | ||||||
| Fixed Income, Cash and Cash Equivalents | 65% | 30 to 100% | ||||||
| Top ten holdings (c) | ||||
| USD Interest Rate Swap, Receive 2.437% – APR 2021 | 26.4% | |||
| USD Interest Rate Swap, Receive 2.533% – MAR 2024 | 11.9% | |||
| Japan Government Bond 10 yr Future – SEP 2019 | 9.5% | |||
| Australian Note 10 yr Future – SEP 2019 | 8.4% | |||
| U.S. Treasury Notes, 2%, 11/15/2026 | 4.7% | |||
| FTSE 100 Index Future – SEP 2019 | 4.1% | |||
| USD Interest Rate Swap, Pay 2.48% – APR 2029 | (5.7)% | |||
| Canadian Treasury Bond 10 yr Future – SEP 2019 | (6.4)% | |||
| Long Gilt 10 yr Future – SEP 2019 | (8.5)% | |||
| U.S. Treasury Note 10 yr Future – SEP 2019 | (10.6)% |
| (a) | Represents the actively managed portion of the portfolio and for purposes of this presentation, components include the value of securities, less any securities sold short. The bond component will include any accrued interest amounts. This also reflects the equivalent exposure of certain derivative positions. These amounts may be negative from time to time. |
| (b) | Represents the tactical overlay portion of the portfolio which is how the fund manages its exposure to markets and currencies through the use of derivative positions. Percentages reflect the equivalent exposure of those derivative positions. |
| (c) | For purposes of this presentation, the components include the value of securities, less any securities sold short, and reflect the impact of the equivalent exposure of all derivative positions. These amounts may be negative from time to time. The bond component will include any accrued interest amounts. |
2
Table of Contents
MFS Global Tactical Allocation Portfolio
Portfolio Composition – continued
| (d) | Cash & Cash Equivalents includes any cash, investments in money market funds, short term securities, and other assets less liabilities. Please see the Statement of Assets and Liabilities for additional information related to the fund’s cash position and other assets and liabilities. |
| (e) | Other includes currency derivatives and/or the offsetting of the leverage produced by the fund’s derivative positions, including payables and/or receivables of the finance leg of interest rate swaps and the unrealized gain or loss in connection with forward currency exchange contracts. |
| (w) | The strategic asset class allocations have been selected for investment over longer time periods. The actual strategic asset class weightings can deviate due to market movements and cash flows. |
| (z) | The fund’s net exposures to the asset classes referenced will normally fall within these ranges after taking into account the tactical overlay. |
Equivalent exposure is a calculated amount that translates the derivative position into a reasonable approximation of the amount of the underlying asset that the portfolio would have to hold at a given point in time to have the same price sensitivity that results from the portfolio’s ownership of the derivative contract. When dealing with derivatives, equivalent exposure is a more representative measure of the potential impact of a position on portfolio performance than value. The value of derivatives may be different.
Where the fund holds convertible bonds, they are treated as part of the equity portion of the portfolio.
Percentages are based on net assets as of June 30, 2019.
The portfolio is actively managed and current holdings may be different.
3
Table of Contents
MFS Global Tactical Allocation Portfolio
Fund Expenses Borne by the Contract Holders during the Period,
January 1, 2019 through June 30, 2019
As a contract holder of the fund, you incur ongoing costs, including management fees; distribution and/or service(12b-1) fees; and other fund expenses. This example is intended to help you understand your ongoing costs (in dollars) of investing in the fund and to compare these costs with the ongoing costs of investing in other mutual funds.
The example is based on an investment of $1,000 invested at the beginning of the period and held for the entire period January 1, 2019 through June 30, 2019.
Actual Expenses
The first line for each share class in the following table provides information about actual account values and actual expenses. You may use the information in this line, together with the amount you invested, to estimate the expenses that you paid over the period. Simply divide your account value by $1,000 (for example, an $8,600 account value divided by $1,000 = 8.6), then multiply the result by the number in the first line under the heading entitled “Expenses Paid During Period” to estimate the expenses you paid on your account during this period.
Hypothetical Example for Comparison Purposes
The second line for each share class in the following table provides information about hypothetical account values and hypothetical expenses based on the fund’s actual expense ratio and an assumed rate of return of 5% per year before expenses, which is not the fund’s actual return. The hypothetical account values and expenses may not be used to estimate the actual ending account balance or expenses you paid for the period. You may use this information to compare the ongoing costs of investing in the fund and other funds. To do so, compare this 5% hypothetical example with the 5% hypothetical examples that appear in the shareholder reports of the other funds.
Please note that the expenses shown in the table are meant to highlight the fund’s ongoing costs only and do not take into account the fees and expenses imposed under the variable contracts through which your investment in the fund is made. Therefore, the second line for each share class in the table is useful in comparing ongoing costs associated with an investment in vehicles (such as the fund) which fund benefits under variable annuity and variable life insurance contracts and to qualified pension and retirement plans only, and will not help you determine the relative total costs of investing in the fund through variable annuity and variable life insurance contracts. If the fees and expenses imposed under the variable contracts were included, your costs would have been higher.
| Share Class | Annualized Expense Ratio | Beginning Account Value 1/01/19 | Ending Account Value 6/30/19 | Expenses Paid During Period (p) 1/01/19-6/30/19 | ||||||||||||||
| Initial Class | Actual | 0.82% | $1,000.00 | $1,098.08 | $4.27 | |||||||||||||
| Hypothetical (h) | 0.82% | $1,000.00 | $1,020.73 | $4.11 | ||||||||||||||
| Service Class | Actual | 1.07% | $1,000.00 | $1,097.07 | $5.56 | |||||||||||||
| Hypothetical (h) | 1.07% | $1,000.00 | $1,019.49 | $5.36 | ||||||||||||||
| (h) | 5% class return per year before expenses. |
| (p) | “Expenses Paid During Period” are equal to each class’s annualized expense ratio, as shown above, multiplied by the average account value over the period, multiplied by 181/365 (to reflect theone-half year period). |
Notes to Expense Table
Expense ratios include 0.05% of interest expense on uncovered collateral or margin obligations with the broker (See Note 2 of the Notes to Financial Statements) that are outside of the expense limitation arrangement (See Note 3 of the Notes to Financial Statements).
4
Table of Contents
MFS Global Tactical Allocation Portfolio
PORTFOLIO OF INVESTMENTS – 6/30/19 (unaudited)
The Portfolio of Investments is a complete list of all securities owned by your fund. It is categorized by broad-based asset classes.
| Issuer | Shares/Par | Value ($) | ||||||
| BONDS – 61.5% | ||||||||
| Aerospace – 0.3% |
| |||||||
| Huntington Ingalls Industries, Inc., 3.483%, 12/01/2027 | $ | 370,000 | $ | 375,698 | ||||
| L3 Technologies, Inc., 3.85%, 6/15/2023 | 555,000 | 579,094 | ||||||
| Lockheed Martin Corp., 3.55%, 1/15/2026 | 749,000 | 796,043 | ||||||
|
| |||||||
| $ | 1,750,835 | |||||||
|
| |||||||
| Apparel Manufacturers – 0.1% |
| |||||||
| Tapestry, Inc., 4.125%, 7/15/2027 | $ | 493,000 | $ | 495,759 | ||||
|
| |||||||
| Asset-Backed & Securitized – 2.7% |
| |||||||
| Chesapeake Funding II LLC,2016-1A, “A2”, FLR, 3.544% (LIBOR - 1mo. + 1.15%), 3/15/2028 (n) | $ | 125,429 | $ | 125,523 | ||||
| Chesapeake Funding II LLC,2016-2A, “A2”, FLR, 3.394% (LIBOR - 1mo. + 1%), 6/15/2028 (z) | 233,501 | 233,800 | ||||||
| CPS Auto Trust,2016-D, “B”, 2.11%, 3/15/2021 (n) | 199,338 | 199,239 | ||||||
| Dryden Senior Loan Fund,2013-26A, “AR”, CLO, FLR, 3.496% (LIBOR - 3mo. + 0.9%), 4/15/2029 (z) | 1,292,000 | 1,280,742 | ||||||
| Dryden Senior Loan Fund,2018-55A, “A1”, CLO, FLR, 3.616% (LIBOR - 3mo. + 1.02%), 4/15/2031 (n) | 2,040,000 | 2,021,599 | ||||||
| Flatiron CLO Ltd.,2013-1A, “A2R”, FLR, 4.238% (LIBOR - 3mo. + 1.65%), 1/17/2026 (n) | 1,991,841 | 1,990,377 | ||||||
| Fort CRE LLC,2018-1A, “A1”, FLR, 3.754% (LIBOR - 1mo. + 1.35%), 11/21/2035 (n) | 584,500 | 584,499 | ||||||
| JPMBB Commercial Mortgage Securities Trust,2014-C26, 3.494%, 1/15/2048 | 2,570,000 | 2,697,799 | ||||||
| KKR Real Estate Financial Trust, | ||||||||
| Inc.,2018-FL1, “A”, FLR, 3.494% (LIBOR - 1mo. + 1.1%), 6/15/2036 (n) | 773,500 | 774,950 | ||||||
| Magnetite CLO Ltd.,2012-7A, “A1R2”, FLR, 3.396% (LIBOR - 3mo. + 0.8%), 1/15/2028 (n) | 1,398,000 | 1,382,415 | ||||||
| Morgan Stanley Capital I Trust,2017-H1, “A5”, 3.53%, 6/15/2050 | 659,762 | 698,466 | ||||||
| Octagon Investment Partners XVII Ltd.,2013-1A, “BR2”, FLR, 3.98% (LIBOR - 3mo. + 1.4%), 1/25/2031 (n) | 2,275,000 | 2,218,535 | ||||||
| Issuer | Shares/Par | Value ($) | ||||||
| BONDS – continued | ||||||||
| Asset-Backed & Securitized – continued |
| |||||||
| Wells Fargo Commercial Mortgage Trust,2015-C28, “A4”, 3.54%, 5/15/2048 | $ | 2,271,943 | $ | 2,394,426 | ||||
|
| |||||||
| $ | 16,602,370 | |||||||
|
| |||||||
| Automotive – 0.8% |
| |||||||
| FCA Bank S.p.A., 1%, 2/21/2022 | EUR | 250,000 | $ | 288,649 | ||||
| Ferrari N.V., 1.5%, 3/16/2023 | 900,000 | 1,056,351 | ||||||
| Ford Motor Credit Co. LLC, 1.514%, 2/17/2023 | 200,000 | 228,862 | ||||||
| General Motors Co., 6.75%, 4/01/2046 | $ | 312,000 | 352,129 | |||||
| General Motors Financial Co., Inc., 4.35%, 1/17/2027 | 565,000 | 575,527 | ||||||
| Lear Corp., 3.8%, 9/15/2027 | 416,000 | 411,784 | ||||||
| Lear Corp., 4.25%, 5/15/2029 | 432,000 | 436,385 | ||||||
| Volkswagen Financial Services AG, 2.125%, 6/27/2024 | GBP | 200,000 | 251,996 | |||||
| Volkswagen Financial Services AG, 1.5%, 10/01/2024 | EUR | 405,000 | 474,103 | |||||
| Volkswagen International Finance N.V., 1.875%, 3/30/2027 | 300,000 | 353,656 | ||||||
| Volkswagen Leasing GmbH, 1.5%, 6/19/2026 | 250,000 | 286,844 | ||||||
|
| |||||||
| $ | 4,716,286 | |||||||
|
| |||||||
| Broadcasting – 0.3% |
| |||||||
| Discovery, Inc., 4.125%, 5/15/2029 | $ | 184,000 | $ | 191,637 | ||||
| Fox Corp., 4.709%, 1/25/2029 (n) | 109,000 | 121,943 | ||||||
| MMS USA Financing, Inc., 1.75%, 6/13/2031 | EUR | 200,000 | 230,354 | |||||
| SES S.A., 1.625%, 3/22/2026 | 500,000 | 593,990 | ||||||
| WPP Finance, 2.875%, 9/14/2046 | GBP | 440,000 | 470,826 | |||||
| WPP Finance 2016 Co., 1.375%, 3/20/2025 | EUR | 330,000 | 388,953 | |||||
|
| |||||||
| $ | 1,997,703 | |||||||
|
| |||||||
| Brokerage & Asset Managers – 0.4% |
| |||||||
| E*TRADE Financial Corp., 2.95%, 8/24/2022 | $ | 364,000 | $ | 367,598 | ||||
| Euroclear Investments S.A., 2.625%, 4/11/2048 | EUR | 300,000 | 358,756 | |||||
| Intercontinental Exchange, Inc., 3.75%, 12/01/2025 | $ | 831,000 | 887,598 | |||||
| TD Ameritrade Holding Corp., 2.95%, 4/01/2022 | 676,000 | 688,223 | ||||||
|
| |||||||
| $ | 2,302,175 | |||||||
|
| |||||||
| Building – 0.4% |
| |||||||
| Holcim Finance (Luxembourg) S.A., 1.375%, 5/26/2023 | EUR | 500,000 | $ | 593,510 | ||||
| Imerys S.A., 1.5%, 1/15/2027 | 300,000 | 354,371 | ||||||
5
Table of Contents
MFS Global Tactical Allocation Portfolio
Portfolio of Investments (unaudited) – continued
| Issuer | Shares/Par | Value ($) | ||||||
| BONDS – continued | ||||||||
| Building – continued |
| |||||||
| Martin Marietta Materials, Inc., | ||||||||
| 4.25%, 7/02/2024 | $ | 367,000 | $ | 389,588 | ||||
| Martin Marietta Materials, Inc., 3.45%, 6/01/2027 | 339,000 | 337,233 | ||||||
| Martin Marietta Materials, Inc., 3.5%, 12/15/2027 | 446,000 | 445,251 | ||||||
| Sika Capital B.V., 1.5%, 4/29/2031 | EUR | 100,000 | 121,095 | |||||
|
| |||||||
| $ | 2,241,048 | |||||||
|
| |||||||
| Business Services – 0.3% |
| |||||||
| Fidelity National Information Services, Inc., 3.875%, 6/05/2024 | $ | 179,000 | $ | 189,228 | ||||
| Fidelity National Information Services, Inc., 2.602%, 5/21/2025 | GBP | 100,000 | 130,526 | |||||
| Fidelity National Information Services, Inc., 5%, 10/15/2025 | $ | 108,000 | 121,243 | |||||
| Fidelity National Information Services, Inc., 3%, 8/15/2026 | 758,000 | 766,979 | ||||||
| Fidelity National Information Services, Inc., 1.5%, 5/21/2027 | EUR | 100,000 | 118,624 | |||||
| Fidelity National Information Services, Inc., 3.36%, 5/21/2031 | GBP | 100,000 | 134,440 | |||||
| Fiserv, Inc., 2.25%, 7/01/2025 | 100,000 | 127,540 | ||||||
| Fiserv, Inc., 1.125%, 7/01/2027 | EUR | 100,000 | 115,176 | |||||
| Fiserv, Inc., 3%, 7/01/2031 | GBP | 100,000 | 128,699 | |||||
| Fiserv, Inc., 4.4%, 7/01/2049 | $ | 164,000 | 172,540 | |||||
|
| |||||||
| $ | 2,004,995 | |||||||
|
| |||||||
| Cable TV – 0.4% |
| |||||||
| Charter Communications Operating LLC/Charter Communications Operating Capital Corp., 6.384%, 10/23/2035 | $ | 332,000 | $ | 389,905 | ||||
| Cox Communications, Inc., 3.25%, 12/15/2022 (n) | 498,000 | 508,324 | ||||||
| Eutelsat S.A., 2.25%, 7/13/2027 | EUR | 400,000 | 463,516 | |||||
| Shaw Communications, Inc., 5.65%, 10/01/2019 | CAD | 674,000 | 518,891 | |||||
| Sky PLC, 2.5%, 9/15/2026 | EUR | 400,000 | 516,303 | |||||
|
| |||||||
| $ | 2,396,939 | |||||||
|
| |||||||
| Chemicals – 0.5% |
| |||||||
| Air Liquide Finance Co., 2.25%, 9/27/2023 (n) | $ | 727,000 | $ | 722,796 | ||||
| Argentum Netherlands B.V. for | ||||||||
| Givaudan S.A., 2%, 9/17/2030 | EUR | 300,000 | 379,937 | |||||
| Arkema S.A., 1.5%, 4/20/2027 | 300,000 | 366,691 | ||||||
| Sasol Financing (USA) LLC, 6.5%, 9/27/2028 | $ | 1,288,000 | 1,445,751 | |||||
| Symrise AG, 1.25%, 11/29/2025 | EUR | 323,000 | 378,358 | |||||
|
| |||||||
| $ | 3,293,533 | |||||||
|
| |||||||
| Computer Software – 0.4% |
| |||||||
| Dell International LLC/EMC Corp., 4.9%, 10/01/2026 (n) | $ | 749,000 | $ | 781,473 | ||||
| Microsoft Corp., 4.1%, 2/06/2037 | 824,000 | 940,152 | ||||||
| Issuer | Shares/Par | Value ($) | ||||||
| BONDS – continued | ||||||||
| Computer Software – continued |
| |||||||
| SAP S.E., 1.625%, 3/10/2031 | EUR | 400,000 | $ | 500,074 | ||||
|
| |||||||
| $ | 2,221,699 | |||||||
|
| |||||||
| Computer Software – Systems – 0.2% |
| |||||||
| Apple, Inc., 4.5%, 2/23/2036 | $ | 900,000 | $ | 1,055,084 | ||||
| Apple, Inc., 4.25%, 2/09/2047 | 225,000 | 252,939 | ||||||
|
| |||||||
| $ | 1,308,023 | |||||||
|
| |||||||
| Conglomerates – 0.3% |
| |||||||
| General Electric Co., 4.5%, 3/11/2044 | $ | 190,000 | $ | 184,342 | ||||
| Illinois Tool Works, Inc., 1%, 6/05/2031 | EUR | 260,000 | 299,474 | |||||
| United Technologies Corp., 4.125%, 11/16/2028 | $ | 690,000 | 758,035 | |||||
| Wabtec Corp., 4.95%, 9/15/2028 | 355,000 | 380,638 | ||||||
|
| |||||||
| $ | 1,622,489 | |||||||
|
| |||||||
| Consumer Products – 0.3% |
| |||||||
| Reckitt Benckiser Treasury Services PLC, 3.625%, 9/21/2023 (n) | $ | 577,000 | $ | 601,733 | ||||
| Reckitt Benckiser Treasury Services PLC, 3%, 6/26/2027 (n) | 425,000 | 428,510 | ||||||
| Whirlpool Corp., 4.75%, 2/26/2029 | 767,000 | 826,028 | ||||||
|
| |||||||
| $ | 1,856,271 | |||||||
|
| |||||||
| Consumer Services – 0.5% |
| |||||||
| Bookings Holdings, Inc., 1.8%, 3/03/2027 | EUR | 350,000 | $ | 430,266 | ||||
| Experian Finance PLC, 4.25%, 2/01/2029 (n) | $ | 692,000 | 750,164 | |||||
| G4S International Finance PLC, 1.5%, 1/09/2023 | EUR | 400,000 | 462,972 | |||||
| IHS Markit Ltd., 3.625%, 5/01/2024 | $ | 155,000 | 159,751 | |||||
| IHS Markit Ltd., 4.25%, 5/01/2029 | 232,000 | 243,540 | ||||||
| ManpowerGroup, Inc., 1.75%, 6/22/2026 | EUR | 400,000 | 484,315 | |||||
| Priceline Group, Inc., 3.55%, 3/15/2028 | $ | 356,000 | 371,052 | |||||
| Visa, Inc., 3.65%, 9/15/2047 | 390,000 | 419,272 | ||||||
|
| |||||||
| $ | 3,321,332 | |||||||
|
| |||||||
| Electronics – 0.2% |
| |||||||
| Broadcom Corp./Broadcom Cayman Finance Ltd., 3.875%, 1/15/2027 | $ | 471,000 | $ | 461,534 | ||||
| Broadcom, Inc., 4.25%, 4/15/2026 (n) | 632,000 | 641,401 | ||||||
|
| |||||||
| $ | 1,102,935 | |||||||
|
| |||||||
| Emerging Market Quasi-Sovereign – 1.1% |
| |||||||
| Office Cherifien des Phosphates, 6.875%, 4/25/2044 (n) | $ | 1,570,000 | $ | 1,795,050 | ||||
| Petroleos Mexicanos, 6.5%, 1/23/2029 | 1,423,000 | 1,376,753 | ||||||
| PT Pertamina Persero, 6%, 5/03/2042 (n) | 2,084,000 | 2,392,024 | ||||||
6
Table of Contents
MFS Global Tactical Allocation Portfolio
Portfolio of Investments (unaudited) – continued
| Issuer | Shares/Par | Value ($) | ||||||
| BONDS – continued | ||||||||
| Emerging Market Quasi-Sovereign – continued |
| |||||||
| State Bank of India (London), 4.375%, 1/24/2024 | $ | 400,000 | $ | 417,996 | ||||
| State Grid Overseas Investment (2016) Ltd., 3.5%, 5/04/2027 | 1,007,000 | 1,042,723 | ||||||
|
| |||||||
| $ | 7,024,546 | |||||||
|
| |||||||
| Emerging Market Sovereign – 2.2% |
| |||||||
| Oriental Republic of Uruguay, 4.375%, 1/23/2031 | $ | 1,972,000 | $ | 2,133,704 | ||||
| Republic of Croatia, 1.125%, 6/19/2029 | EUR | 2,050,000 | 2,331,055 | |||||
| Republic of Hungary, 5.375%, 2/21/2023 | $ | 1,972,000 | 2,169,259 | |||||
| Republic of Indonesia, 8.25%, 5/15/2029 | IDR | 42,896,000,000 | 3,218,528 | |||||
| Republic of Indonesia, 8.375%, 3/15/2034 | 40,090,000,000 | 3,007,992 | ||||||
| State of Qatar, 4%, 3/14/2029 (n) | $ | 462,000 | 497,805 | |||||
| United Mexican States, 4.6%, 2/10/2048 | 355,000 | 365,654 | ||||||
|
| |||||||
| $ | 13,723,997 | |||||||
|
| |||||||
| Energy – Independent – 0.4% |
| |||||||
| Tengizchevroil Finance Co. International Ltd., 4%, 8/15/2026 (n) | $ | 2,260,000 | $ | 2,298,628 | ||||
|
| |||||||
| Energy – Integrated – 0.3% |
| |||||||
| BP Capital Markets America, Inc., 3.41%, 2/11/2026 | $ | 1,142,000 | $ | 1,196,835 | ||||
| Eni S.p.A., 4.25%, 5/09/2029 (n) | 321,000 | 335,952 | ||||||
| OMV AG, 0%, 7/03/2025 | EUR | 300,000 | 339,193 | |||||
| OMV AG, 1%, 7/03/2034 | 180,000 | 204,236 | ||||||
|
| |||||||
| $ | 2,076,216 | |||||||
|
| |||||||
| Engineering – Construction – 0.1% |
| |||||||
| Vinci S.A., 3.75%, 4/10/2029 (z) | $ | 706,000 | $ | 758,632 | ||||
|
| |||||||
| Financial Institutions – 0.4% |
| |||||||
| AerCap Ireland Capital Ltd., 3.65%, 7/21/2027 | $ | 973,000 | $ | 967,849 | ||||
| Avolon Holdings Funding Ltd., 4.375%, 5/01/2026 (n) | 311,000 | 320,081 | ||||||
| GE Capital International Funding Co., 3.373%, 11/15/2025 | 959,000 | 970,798 | ||||||
|
| |||||||
| $ | 2,258,728 | |||||||
|
| |||||||
| Food & Beverages – 0.3% |
| |||||||
| Anheuser-Busch InBev N.V., 1.5%, 4/18/2030 | EUR | 400,000 | $ | 474,726 | ||||
| Anheuser-Busch InBev S.A., 1.65%, 3/28/2031 | 300,000 | 359,645 | ||||||
| Anheuser-Busch InBev Worldwide, Inc., 4.375%, 4/15/2038 | $ | 201,000 | 212,178 | |||||
| Anheuser-Busch InBev Worldwide, Inc., 5.55%, 1/23/2049 | 292,000 | 357,848 | ||||||
| Issuer | Shares/Par | Value ($) | ||||||
| BONDS – continued | ||||||||
| Food & Beverages – continued |
| |||||||
| Constellation Brands, Inc., 4.4%, 11/15/2025 | $ | 586,000 | $ | 638,255 | ||||
|
| |||||||
| $ | 2,042,652 | |||||||
|
| |||||||
| Forest & Paper Products – 0.1% |
| |||||||
| Suzano Austria GmbH, 6%, 1/15/2029 (n) | $ | 675,000 | $ | 735,750 | ||||
|
| |||||||
| Health Maintenance Organizations – 0.1% |
| |||||||
| Halfmoon Parent, Inc., 4.125%, 11/15/2025 (n) | $ | 510,000 | $ | 543,120 | ||||
|
| |||||||
| Industrial – 0.0% |
| |||||||
| Investor AB, 1.5%, 6/20/2039 | EUR | 160,000 | $ | 187,136 | ||||
|
| |||||||
| Insurance – 0.2% |
| |||||||
| American International Group, Inc., 1.875%, 6/21/2027 | EUR | 380,000 | $ | 454,664 | ||||
| Argentum Zurich Insurance, 3.5%, 10/01/2046 | 400,000 | 523,053 | ||||||
| NN Group N.V., 4.625% to 4/08/2024, FLR (EURIBOR - 3mo. + 3.95%) to 4/08/2044 | 350,000 | 451,252 | ||||||
|
| |||||||
| $ | 1,428,969 | |||||||
|
| |||||||
| Insurance – Property & Casualty – 0.6% |
| |||||||
| Berkshire Hathaway Finance Corp., 2.375%, 6/19/2039 | GBP | 100,000 | $ | 129,232 | ||||
| Berkshire Hathaway Finance Corp., 2.625%, 6/19/2059 | 130,000 | 174,254 | ||||||
| Berkshire Hathaway, Inc., 2.75%, 3/15/2023 | $ | 636,000 | 646,275 | |||||
| Berkshire Hathaway, Inc., 4.5%, 2/11/2043 | 400,000 | 465,482 | ||||||
| Chubb INA Holdings, Inc., 0.875%, 6/15/2027 | EUR | 100,000 | 115,168 | |||||
| Chubb INA Holdings, Inc., 2.5%, 3/15/2038 | 320,000 | 415,855 | ||||||
| Hiscox Ltd., 6.125%, 11/24/2045 | GBP | 300,000 | 424,011 | |||||
| Marsh & McLennan Cos., Inc., 1.979%, 3/21/2030 | EUR | 100,000 | 122,175 | |||||
| Marsh & McLennan Cos., Inc., 4.35%, 1/30/2047 | $ | 359,000 | 389,270 | |||||
| QBE Capital Funding III Ltd., 7.5% to 5/24/2021, FLR (GBP Swap Rate - 10yr. + 4.003%) to 5/24/2041 | GBP | 400,000 | 536,889 | |||||
| XLIT Ltd., 3.25%, 6/29/2047 | EUR | 300,000 | 370,142 | |||||
|
| |||||||
| $ | 3,788,753 | |||||||
|
| |||||||
| International Market Quasi-Sovereign – 1.3% |
| |||||||
| BNG Bank N.V., 0.75%, 1/11/2028 | EUR | 2,079,000 | $ | 2,513,916 | ||||
| Electricite de France, 5.875% to 1/22/2029, FLR (GBP SwapRate - 15yr. + 3.046%) to 1/22/2049, FLR (GBP Swap Rate - 15yr. + 3.796%) to 12/31/2065 | GBP | 300,000 | 402,891 | |||||
| ESB Finance DAC, 1.125%, 6/11/2030 | EUR | 100,000 | 117,176 | |||||
7
Table of Contents
MFS Global Tactical Allocation Portfolio
Portfolio of Investments (unaudited) – continued
| Issuer | Shares/Par | Value ($) | ||||||
| BONDS – continued | ||||||||
| International Market Quasi-Sovereign – continued |
| |||||||
| KFW German Government Development Bank, 1.125%, 6/15/2037 | EUR | 1,015,000 | $ | 1,286,895 | ||||
| Landsbanki Islands HF, 1.125%, 1/19/2024 | 680,000 | 768,375 | ||||||
| Temasek Financial I Ltd., 2.375%, 1/23/2023 (n) | $ | 2,880,000 | 2,898,203 | |||||
| Vattenfall AB, 0.5%, 6/24/2026 | EUR | 100,000 | 114,983 | |||||
|
| |||||||
| $ | 8,102,439 | |||||||
|
| |||||||
| International Market Sovereign – 18.5% |
| |||||||
| Bundesrepublik Deutschland, 0.25%, 8/15/2028 | EUR | 4,235,000 | $ | 5,093,625 | ||||
| Commonwealth of Australia, 2.75%, 11/21/2027 | AUD | 1,290,000 | 1,011,497 | |||||
| Commonwealth of Australia, 2.75%, 6/21/2035 | 10,610,000 | 8,689,117 | ||||||
| Federal Republic of Germany, 3.25%, 7/04/2042 | EUR | 400,000 | 776,717 | |||||
| Federal Republic of Germany, 2.5%, 7/04/2044 | 4,480,000 | 7,960,019 | ||||||
| Federal Republic of Germany, 2.5%, 8/15/2046 | 1,383,000 | 2,510,567 | ||||||
| Government of Canada, 1.5%, 6/01/2026 | CAD | 13,299,000 | 10,202,823 | |||||
| Government of Canada, 5%, 6/01/2037 | 990,000 | 1,147,661 | ||||||
| Government of Japan, 1.7%, 9/20/2032 | JPY | 745,300,000 | 8,475,260 | |||||
| Government of Japan, 2.4%, 3/20/2037 | 398,650,000 | 5,139,392 | ||||||
| Government of Japan, 0.5%, 6/20/2038 | 1,979,200,000 | 19,324,988 | ||||||
| Government of Japan, 2.3%, 3/20/2040 | 176,000,000 | 2,306,977 | ||||||
| Kingdom of Belgium, 1.6%, 6/22/2047 | EUR | 1,550,000 | 2,049,157 | |||||
| Kingdom of Spain, 5.15%, 10/31/2028 | 6,861,000 | 11,249,690 | ||||||
| Kingdom of Spain, 1.95%, 7/30/2030 | 2,985,000 | 3,916,514 | ||||||
| Kingdom of Spain, 5.15%, 10/31/2044 | 670,000 | 1,410,839 | ||||||
| Obrigacoes do Tesouro, 2.25%, 4/18/2034 | 7,042,000 | 9,570,003 | ||||||
| Republic of Italy, 3.1%, 3/01/2040 | 900,000 | 1,072,717 | ||||||
| Republic of Italy, 3.85%, 9/01/2049 | 1,190,000 | 1,563,740 | ||||||
| Republic of Portugal, 4.1%, 4/15/2037 | 715,000 | 1,217,579 | ||||||
| United Kingdom Treasury, 4.25%, 6/07/2032 | GBP | 2,050,000 | 3,600,106 | |||||
| United Kingdom Treasury, 1.75%, 9/07/2037 | 860,000 | 1,162,382 | ||||||
| United Kingdom Treasury, 3.25%, 1/22/2044 | 409,000 | 709,698 | ||||||
| Issuer | Shares/Par | Value ($) | ||||||
| BONDS – continued |
| |||||||
| International Market Sovereign – continued |
| |||||||
| United Kingdom Treasury, 3.75%, 7/22/2052 | GBP | 1,469,000 | $ | 2,999,832 | ||||
| United Kingdom Treasury, 4%, 1/22/2060 | 344,000 | 789,162 | ||||||
|
| |||||||
| $ | 113,950,062 | |||||||
|
| |||||||
| Local Authorities – 0.2% |
| |||||||
| Province of Alberta, 4.5%, 12/01/2040 | CAD | 665,000 | $ | 671,144 | ||||
| Province of British Columbia, 2.3%, 6/18/2026 | 965,000 | 754,875 | ||||||
|
| |||||||
| $ | 1,426,019 | |||||||
|
| |||||||
| Machinery & Tools – 0.1% |
| |||||||
| CNH Industrial Finance Europe S.A., 1.625%, 7/03/2029 | EUR | 400,000 | $ | 451,183 | ||||
| John Deere Cash Management S.A., 1.65%, 6/13/2039 | 270,000 | 318,042 | ||||||
|
| |||||||
| $ | 769,225 | |||||||
|
| |||||||
| Major Banks – 2.4% |
| |||||||
| ABN AMRO Bank N.V., 2.875%, 1/18/2028 | EUR | 300,000 | $ | 367,722 | ||||
| Bank of America Corp., 2.625%, 4/19/2021 | $ | 972,000 | 978,058 | |||||
| Bank of America Corp., 3.5%, 4/19/2026 | 1,274,000 | 1,334,110 | ||||||
| Bank of America Corp., 3.248%, 10/21/2027 | 1,280,000 | 1,311,478 | ||||||
| Bankia S.A., 1%, 6/25/2024 | EUR | 100,000 | 114,315 | |||||
| Bankinter S.A., 0.875%, 7/08/2026 | 400,000 | 454,317 | ||||||
| Barclays Bank PLC, 6%, 1/14/2021 | 548,000 | 672,443 | ||||||
| Barclays PLC, 3.125%, 1/17/2024 | GBP | 350,000 | 457,182 | |||||
| Credit Suisse Group AG, 1.25% to 7/17/2024, FLR (EUR Swap Rate - 1yr. + 0.75%) to 7/17/2025 | EUR | 400,000 | 471,472 | |||||
| Credit Suisse Group AG, 1% to 6/24/2026, FLR (EUR ICE Swap Rate - 1yr. + 1.05%) to 6/24/2027 | 150,000 | 172,852 | ||||||
| Erste Group Bank AG, 0.875%, 5/22/2026 | 300,000 | 348,778 | ||||||
| HSBC Holdings PLC, 4.375%, 11/23/2026 | $ | 743,000 | 784,644 | |||||
| JPMorgan Chase & Co., 2.95%, 10/01/2026 | 1,647,000 | 1,676,571 | ||||||
| JPMorgan Chase & Co., 3.54%, 5/01/2028 | 745,000 | 775,470 | ||||||
| Morgan Stanley, 5.5%, 7/28/2021 | 850,000 | 903,094 | ||||||
| Morgan Stanley, 3.95%, 4/23/2027 | 636,000 | 665,239 | ||||||
| Nationwide Building Society, 1.5%, 3/08/2026 | EUR | 200,000 | 232,220 | |||||
| Sumitomo Mitsui Financial Group, Inc., 0.465%, 5/30/2024 | 200,000 | 229,001 | ||||||
| Sumitomo Mitsui Financial Group, Inc., 3.544%, 1/17/2028 | $ | 1,096,000 | 1,154,114 | |||||
8
Table of Contents
MFS Global Tactical Allocation Portfolio
Portfolio of Investments (unaudited) – continued
| Issuer | Shares/Par | Value ($) | ||||||
| BONDS – continued |
| |||||||
| Major Banks – continued |
| |||||||
| Svenska Handelsbanken AB, 5.25%, 12/29/2049 | $ | 606,000 | $ | 610,545 | ||||
| UBS Group Funding (Switzerland) AG, 1.5% to 1/31/2024, FLR (Swap Rate - 5yr. + 4.34%) to 11/30/2024 | EUR | 500,000 | 596,978 | |||||
| Wells Fargo & Co., 4.15%, 1/24/2029 | $ | 441,000 | 480,418 | |||||
|
| |||||||
| $ | 14,791,021 | |||||||
|
| |||||||
| Medical & Health Technology & Services – 0.7% |
| |||||||
| Becton, Dickinson and Co., 1.401%, 5/24/2023 | EUR | 500,000 | $ | 589,755 | ||||
| Becton, Dickinson and Co., 0.632%, 6/04/2023 | 100,000 | 114,541 | ||||||
| Becton, Dickinson and Co., 3.734%, 12/15/2024 | $ | 619,000 | 649,295 | |||||
| HCA, Inc., 5.125%, 6/15/2039 | 240,000 | 249,533 | ||||||
| Laboratory Corp. of America Holdings, 3.2%, 2/01/2022 | 1,025,000 | 1,041,794 | ||||||
| Laboratory Corp. of America Holdings, 4.7%, 2/01/2045 | 141,000 | 145,918 | ||||||
| Medtronic Global Holdings S.C.A., 1.75%, 7/02/2049 | EUR | 300,000 | 329,136 | |||||
| Northwell Healthcare, Inc., 4.26%, 11/01/2047 | $ | 438,000 | 467,676 | |||||
| Thermo Fisher Scientific, Inc., 2.95%, 9/19/2026 | 394,000 | 396,245 | ||||||
| Thermo Fisher Scientific, Inc., 3.2%, 8/15/2027 | 507,000 | 519,075 | ||||||
|
| |||||||
| $ | 4,502,968 | |||||||
|
| |||||||
| Medical Equipment – 0.2% |
| |||||||
| Abbott Ireland Financing Co., 1.5%, 9/27/2026 | EUR | 350,000 | $ | 426,775 | ||||
| Abbott Laboratories, 4.9%, 11/30/2046 | $ | 593,000 | 732,805 | |||||
|
| |||||||
| $ | 1,159,580 | |||||||
|
| |||||||
| Metals & Mining – 0.1% |
| |||||||
| Cameco Corp., 5.67%, 9/02/2019 | CAD | 679,000 | $ | 521,039 | ||||
|
| |||||||
| Midstream – 0.6% |
| |||||||
| APT Pipelines Ltd., 5%, 3/23/2035 (n) | $ | 705,000 | $ | 752,065 | ||||
| MPLX LP, 4.5%, 4/15/2038 | 449,000 | 453,314 | ||||||
| ONEOK, Inc., 4.95%, 7/13/2047 | 1,191,000 | 1,254,578 | ||||||
| Sabine Pass Liquefaction LLC, 4.2%, 3/15/2028 | 890,000 | 936,918 | ||||||
|
| |||||||
| $ | 3,396,875 | |||||||
|
| |||||||
| Mortgage-Backed – 5.1% |
| |||||||
| Fannie Mae,5%, 12/01/2020 - 8/01/2040 | $ | 2,076,244 | $ | 2,256,321 | ||||
| Fannie Mae,4.5%, 7/01/2023 - 2/01/2046 | 7,382,915 | 7,920,111 | ||||||
| Fannie Mae,4%, 3/01/2025 - 2/01/2041 | 3,875,336 | 4,086,625 | ||||||
| Issuer | Shares/Par | Value ($) | ||||||
| BONDS – continued |
| |||||||
| Mortgage-Backed – continued |
| |||||||
| Fannie Mae,5.5%, 11/01/2036 - 4/01/2037 | $ | 166,113 | $ | 184,153 | ||||
| Fannie Mae,6%, 9/01/2037 - 6/01/2038 | 286,162 | 322,733 | ||||||
| Fannie Mae,3.5%, 5/01/2043 - 1/01/2047 | 3,523,208 | 3,659,843 | ||||||
| Freddie Mac, 4.186%, 8/25/2019 | 250,745 | 250,667 | ||||||
| Freddie Mac, 4%, 7/01/2025 | 118,993 | 124,833 | ||||||
| Freddie Mac, 3.224%, 3/25/2027 | 4,000,000 | 4,227,654 | ||||||
| Freddie Mac, 3.286%, 11/25/2027 | 1,303,000 | 1,385,164 | ||||||
| Freddie Mac, 3.35%, 1/25/2028 | 2,001,000 | 2,134,652 | ||||||
| Freddie Mac,5.5%, 5/01/2034 - 7/01/2037 | 44,350 | 49,244 | ||||||
| Freddie Mac,5%, 10/01/2036 - 7/01/2041 | 766,501 | 834,309 | ||||||
| Freddie Mac,4.5%, 12/01/2039 - 5/01/2042 | 1,389,602 | 1,493,427 | ||||||
| Freddie Mac, 3.5%, 1/01/2047 | 1,393,446 | 1,438,484 | ||||||
| Ginnie Mae, 5%, 5/15/2040 | 120,202 | 132,182 | ||||||
| Ginnie Mae, 3.5%, 6/20/2043 | 1,139,009 | 1,187,674 | ||||||
|
| |||||||
| $ | 31,688,076 | |||||||
|
| |||||||
| Municipals – 0.2% |
| |||||||
| Commonwealth of Puerto Rico, Public Improvement,“C-7”, NATL, 6%, 7/01/2027 | $ | 55,000 | $ | 56,151 | ||||
| Oklahoma Development Finance Authority, Health System Rev. (OU Medicine Project), “C”, AGM, 4.65%, 8/15/2030 | 572,000 | 655,232 | ||||||
| Puerto Rico Electric Power Authority Rev., “PP”, NATL, 5%, 7/01/2022 | 245,000 | 247,808 | ||||||
|
| |||||||
| $ | 959,191 | |||||||
|
| |||||||
| Natural Gas – Distribution – 0.2% |
| |||||||
| GNL Quintero S.A., 4.634%, 7/31/2029 (n) | $ | 1,420,000 | $ | 1,503,425 | ||||
|
| |||||||
| Network & Telecom – 0.5% |
| |||||||
| AT&T, Inc., 4.75%, 5/15/2046 | $ | 602,000 | $ | 635,720 | ||||
| Empresa Nacional de Telecomunicaciones S.A., 4.75%, 8/01/2026 (n) | 2,129,000 | 2,248,247 | ||||||
|
| |||||||
| $ | 2,883,967 | |||||||
|
| |||||||
| Oils – 0.3% |
| |||||||
| Marathon Petroleum Corp., 3.625%, 9/15/2024 | $ | 500,000 | $ | 517,565 | ||||
| Neste Oyj, 1.5%, 6/07/2024 | EUR | 500,000 | 591,668 | |||||
| Phillips 66, 4.875%, 11/15/2044 | $ | 795,000 | 891,186 | |||||
|
| |||||||
| $ | 2,000,419 | |||||||
|
| |||||||
| Other Banks & Diversified Financials – 0.8% |
| |||||||
| AIB Group PLC, 1.25%, 5/28/2024 | EUR | 155,000 | $ | 177,943 | ||||
| Belfius Bank S.A., 3.125%, 5/11/2026 | 300,000 | 378,149 | ||||||
9
Table of Contents
MFS Global Tactical Allocation Portfolio
Portfolio of Investments (unaudited) – continued
| Issuer | Shares/Par | Value ($) | ||||||
| BONDS – continued |
| |||||||
| Other Banks & Diversified Financials – continued |
| |||||||
| BPCE S.A., 0.625%, 9/26/2023 | EUR | 300,000 | $ | 348,733 | ||||
| BPCE S.A., 5.25%, 4/16/2029 | GBP | 400,000 | 604,652 | |||||
| Capital One Financial Corp., 0.8%, 6/12/2024 | EUR | 250,000 | 286,077 | |||||
| Commerzbank AG, 0.625%, 8/28/2024 | 200,000 | 231,282 | ||||||
| Commerzbank AG, 1.125%, 6/22/2026 | 200,000 | 229,147 | ||||||
| Cooperatieve Rabobank U.A., 1.125%, 5/07/2031 | 200,000 | 233,674 | ||||||
| Groupe BPCE S.A., 4.5%, 3/15/2025 (n) | $ | 384,000 | 404,724 | |||||
| Intesa Sanpaolo S.p.A., 5.25%, 1/28/2022 | GBP | 450,000 | 613,294 | |||||
| Macquarie Group Ltd., 1.25%, 3/05/2025 | EUR | 300,000 | 351,398 | |||||
| UBS AG, 5.125%, 5/15/2024 | $ | 866,000 | 917,428 | |||||
| UniCredito Italiano S.p.A., 6.572%, 1/14/2022 (n) | 362,000 | 384,827 | ||||||
|
| |||||||
| $ | 5,161,328 | |||||||
|
| |||||||
| Pharmaceuticals – 0.1% |
| |||||||
| Allergan Funding SCS, 2.625%, 11/15/2028 | EUR | 320,000 | $ | 399,775 | ||||
|
| |||||||
| Pollution Control – 0.1% |
| |||||||
| Republic Services, Inc., 3.95%, 5/15/2028 | $ | 637,000 | $ | 687,164 | ||||
|
| |||||||
| Real Estate – Apartment – 0.2% |
| |||||||
| Grand City Properties S.A., 1.375%, 8/03/2026 | EUR | 700,000 | $ | 818,234 | ||||
| Grand City Properties S.A., 2.5% to 10/24/2023, FLR (EUR SwapRate-5yr. + 2.432%) to 10/24/2028, FLR (EUR SwapRate-5yr. + 2.682%) to 10/24/2043, FLR (EUR Swap Rate - 5yr. + 3.432%) to 10/24/2069 | 500,000 | 568,550 | ||||||
|
| |||||||
| $ | 1,386,784 | |||||||
|
| |||||||
| Real Estate – Office – 0.1% |
| |||||||
| Merlin Properties SOCIMI S.A., REIT, 1.875%, 11/02/2026 | EUR | 350,000 | $ | 417,901 | ||||
|
| |||||||
| Real Estate – Other – 0.1% |
| |||||||
| SELP Finance S.à r.l., 1.5%, 12/20/2026 | EUR | 400,000 | $ | 462,524 | ||||
|
| |||||||
| Retailers – 0.4% |
| |||||||
| AA Bond Co. Ltd., 2.875%, 1/31/2022 | GBP | 200,000 | $ | 241,641 | ||||
| AA Bond Co. Ltd., 2.75%, 7/31/2023 | 650,000 | 753,144 | ||||||
| Best Buy Co., Inc., 4.45%, 10/01/2028 | $ | 520,000 | 548,768 | |||||
| Home Depot, Inc., 2.625%, 6/01/2022 | 695,000 | 706,845 | ||||||
|
| |||||||
| $ | 2,250,398 | |||||||
|
| |||||||
| Issuer | Shares/Par | Value ($) | ||||||
| BONDS – continued | ||||||||
| Specialty Stores – 0.1% |
| |||||||
| Richemont International S.A., 1.5%, 3/26/2030 | EUR | 400,000 | $ | 495,825 | ||||
|
| |||||||
| Supermarkets – 0.1% |
| |||||||
| Ahold Delhaize, 0.25%, 6/26/2025 | EUR | 150,000 | $ | 169,820 | ||||
| Loblaw Cos. Ltd., 4.86%, 9/12/2023 | CAD | 680,000 | 567,045 | |||||
|
| |||||||
| $ | 736,865 | |||||||
|
| |||||||
| Supranational – 0.8% |
| |||||||
| European Stability Mechanism, 0.75%, 3/15/2027 | EUR | 3,450,000 | $ | 4,200,799 | ||||
| International Bank for Reconstruction and Development, 2.8%, 1/13/2021 | AUD | 420,000 | 301,670 | |||||
| International Bank for Reconstruction and Development, 4.25%, 6/24/2025 | 465,000 | 376,927 | ||||||
|
| |||||||
| $ | 4,879,396 | |||||||
|
| |||||||
| Telecommunications – Wireless – 0.7% |
| |||||||
| American Tower Corp., REIT, 4.7%, 3/15/2022 | $ | 327,000 | $ | 345,838 | ||||
| American Tower Corp., REIT, 3.5%, 1/31/2023 | 812,000 | 838,257 | ||||||
| Crown Castle International Corp., 2.25%, 9/01/2021 | 1,072,000 | 1,067,219 | ||||||
| Crown Castle International Corp., 3.7%, 6/15/2026 | 425,000 | 441,368 | ||||||
| SBA Tower Trust, 2.898%, 10/15/2044 (n) | 349,000 | 348,995 | ||||||
| Tele2 AB Co., 2.125%, 5/15/2028 | EUR | 700,000 | 855,814 | |||||
| Vodafone Group PLC, 0.9%, 11/24/2026 | 100,000 | 116,324 | ||||||
| Vodafone Group PLC, 2.5%, 5/24/2039 | 250,000 | 300,719 | ||||||
|
| |||||||
| $ | 4,314,534 | |||||||
|
| |||||||
| Telephone Services – 0.1% |
| |||||||
| TELUS Corp., 5.05%, 7/23/2020 | CAD | 687,000 | $ | 540,210 | ||||
|
| |||||||
| Tobacco – 0.2% |
| |||||||
| Altria Group, Inc., 1.7%, 6/15/2025 | EUR | 230,000 | $ | 271,599 | ||||
| Altria Group, Inc., 3.125%, 6/15/2031 | 280,000 | 345,177 | ||||||
| Imperial Brands Finance PLC, 1.375%, 1/27/2025 | 300,000 | 348,667 | ||||||
|
| |||||||
| $ | 965,443 | |||||||
|
| |||||||
| Transportation – Services – 0.4% |
| |||||||
| Abertis Infraestructuras S.A., 2.375%, 9/27/2027 | EUR | 300,000 | $ | 365,558 | ||||
| Adani Ports and Special Economic Zone Ltd., 4.375%, 7/03/2029 | $ | 296,000 | 300,226 | |||||
| Autostrade per l’Italia S.p.A., 6.25%, 6/09/2022 | GBP | 250,000 | 347,799 | |||||
| ERAC USA Finance LLC, 7%, 10/15/2037 (n) | $ | 574,000 | 784,001 | |||||
10
Table of Contents
MFS Global Tactical Allocation Portfolio
Portfolio of Investments (unaudited) – continued
| Issuer | Shares/Par | Value ($) | ||||||
| BONDS – continued | ||||||||
| Transportation – Services – continued |
| |||||||
| Heathrow Funding Ltd., 4.625%, 10/31/2046 | GBP | 225,000 | $ | 380,865 | ||||
| Transurban Finance Co., 1.75%, 3/29/2028 | EUR | 400,000 | 486,642 | |||||
|
| |||||||
| $ | 2,665,091 | |||||||
|
| |||||||
| U.S. Government Agencies and Equivalents – 0.2% |
| |||||||
| Small Business Administration, 5.09%, 10/01/2025 | $ | 4,418 | $ | 4,644 | ||||
| Small Business Administration, 5.21%, 1/01/2026 | 156,060 | 164,525 | ||||||
| Small Business Administration, 5.31%, 5/01/2027 | 46,438 | 49,733 | ||||||
| Small Business Administration, 2.22%, 3/01/2033 | 1,161,894 | 1,156,249 | ||||||
|
| |||||||
| $ | 1,375,151 | |||||||
|
| |||||||
| U.S. Treasury Obligations – 10.8% |
| |||||||
| U.S. Treasury Bonds, 3.5%, 2/15/2039 | $ | 4,220,000 | $ | 5,012,734 | ||||
| U.S. Treasury Bonds, 3.125%, 2/15/2043 | 7,220,000 | 8,050,864 | ||||||
| U.S. Treasury Bonds, 3%, 5/15/2047 | 1,415,000 | 1,549,701 | ||||||
| U.S. Treasury Notes, 2%, 11/15/2026 (f) | 28,500,000 | 28,717,090 | ||||||
| U.S. Treasury Notes, 2.25%, 11/15/2027 | 8,575,000 | 8,778,656 | ||||||
| U.S. Treasury Notes, 2.75%, 2/15/2028 | 4,314,000 | 4,586,995 | ||||||
| U.S. Treasury Notes, 2.875%, 5/15/2028 | 9,080,000 | 9,750,005 | ||||||
|
| |||||||
| $ | 66,446,045 | |||||||
|
| |||||||
| Utilities – Electric Power – 2.0% |
| |||||||
| Consorcio Transmantaro S.A., 4.7%, 4/16/2034 (n) | $ | 200,000 | $ | 210,500 | ||||
| Duke Energy Corp., 2.65%, 9/01/2026 | 995,000 | 983,729 | ||||||
| Duke Energy Florida LLC, 3.2%, 1/15/2027 | 842,000 | 868,541 | ||||||
| Emera U.S. Finance LP, 2.7%, 6/15/2021 | 376,000 | 377,285 | ||||||
| Emera U.S. Finance LP, 3.55%, 6/15/2026 | 430,000 | 439,370 | ||||||
| Enel Finance International N.V., 3.5%, 4/06/2028 (n) | 414,000 | 408,138 | ||||||
| Enel Finance International N.V., 4.75%, 5/25/2047 (n) | 343,000 | 356,906 | ||||||
| Enersis Americas S.A., 4%, 10/25/2026 | 1,891,000 | 1,947,730 | ||||||
| Engie Energia Chile S.A., 4.5%, 1/29/2025 (n) | 1,180,000 | 1,241,259 | ||||||
| Exelon Corp., 3.497%, 6/01/2022 | 406,000 | 415,940 | ||||||
| Issuer | Shares/Par | Value ($) | ||||||
| BONDS – continued | ||||||||
| Utilities – Electric Power – continued |
| |||||||
| Iberdrola International B.V., 3.25% to 11/12/2024, FLR (EUR Swap Rate - 5yr. + 2.973%) to 2/12/2030, FLR (EUR SwapRate - 5yr. + 3.223%) to 2/12/2045, FLR (EUR Swap Rate - 5yr. + 3.973%) to 2/12/2068 | EUR | 500,000 | $ | 613,898 | ||||
| innogy Finance B.V., 1.5%, 7/31/2029 | 300,000 | 360,786 | ||||||
| innogy Finance B.V., 4.75%, 1/31/2034 | GBP | 300,000 | 473,107 | |||||
| LLPL Capital Pte. Ltd., 6.875%, 2/04/2039 (n) | $ | 343,000 | 391,545 | |||||
| NextEra Energy Capital Holdings, Inc., 3.55%, 5/01/2027 | 992,000 | 1,035,615 | ||||||
| PPL Capital Funding, Inc., 5%, 3/15/2044 | 473,000 | 525,768 | ||||||
| PPL WEM Holdings PLC, 5.375%, 5/01/2021 (n) | 280,000 | 289,839 | ||||||
| Virginia Electric & Power Co., 3.5%, 3/15/2027 | 1,200,000 | 1,264,494 | ||||||
|
| |||||||
| $ | 12,204,450 | |||||||
|
| |||||||
| Total Bonds (Identified Cost, $359,685,009) |
| $ | 379,144,709 | |||||
|
| |||||||
| COMMON STOCKS – 35.7% |
| |||||||
| Aerospace – 1.3% |
| |||||||
| Honeywell International, Inc. | 17,309 | $ | 3,021,978 | |||||
| Lockheed Martin Corp. | 7,836 | 2,848,700 | ||||||
| Northrop Grumman Corp. | 2,409 | 778,372 | ||||||
| United Technologies Corp. | 8,395 | 1,093,029 | ||||||
|
| |||||||
| $ | 7,742,079 | |||||||
|
| |||||||
| Airlines – 0.3% |
| |||||||
| Aena S.A. | 1,913 | $ | 379,150 | |||||
| Air Canada (a) | 52,659 | 1,595,995 | ||||||
|
| |||||||
| $ | 1,975,145 | |||||||
|
| |||||||
| Alcoholic Beverages – 0.9% |
| |||||||
| Diageo PLC | 14,517 | $ | 623,869 | |||||
| Heineken N.V. | 18,617 | 2,077,564 | ||||||
| Molson Coors Brewing Co. | 8,259 | 462,504 | ||||||
| Pernod Ricard S.A. | 12,209 | 2,249,717 | ||||||
|
| |||||||
| $ | 5,413,654 | |||||||
|
| |||||||
| Apparel Manufacturers – 0.2% |
| |||||||
| Compagnie Financiere Richemont S.A. | 15,070 | $ | 1,278,835 | |||||
|
| |||||||
| Automotive – 0.5% |
| |||||||
| Aptiv PLC | 11,178 | $ | 903,518 | |||||
| Bridgestone Corp. | 9,100 | 358,041 | ||||||
| Magna International, Inc. | 27,748 | 1,380,673 | ||||||
| USS Co. Ltd. | 32,700 | 643,900 | ||||||
|
| |||||||
| $ | 3,286,132 | |||||||
|
| |||||||
11
Table of Contents
MFS Global Tactical Allocation Portfolio
Portfolio of Investments (unaudited) – continued
| Issuer | Shares/Par | Value ($) | ||||||
| COMMON STOCKS – continued |
| |||||||
| Biotechnology – 0.1% | ||||||||
| Biogen, Inc. (a) | 2,566 | $ | 600,110 | |||||
|
| |||||||
| Broadcasting – 0.2% | ||||||||
| Omnicom Group, Inc. | 11,142 | $ | 913,087 | |||||
| Publicis Groupe S.A. | 11,726 | 619,081 | ||||||
|
| |||||||
| $ | 1,532,168 | |||||||
|
| |||||||
| Brokerage & Asset Managers – 0.4% |
| |||||||
| ASX Ltd. | 3,915 | $ | 226,396 | |||||
| BlackRock, Inc. | 3,157 | 1,481,580 | ||||||
| TMX Group Ltd. | 9,778 | 680,215 | ||||||
|
| |||||||
| $ | 2,388,191 | |||||||
|
| |||||||
| Business Services – 3.0% | ||||||||
| Accenture PLC, “A” | 18,733 | $ | 3,461,296 | |||||
| Bunzl PLC | 25,401 | 669,998 | ||||||
| CGI Group, Inc. (a) | 9,993 | 768,276 | ||||||
| Cognizant Technology Solutions Corp., “A” | 14,130 | 895,701 | ||||||
| Compass Group PLC | 94,043 | 2,253,641 | ||||||
| DXC Technology Co. | 17,165 | 946,650 | ||||||
| Equifax, Inc. | 8,443 | 1,141,831 | ||||||
| Experian PLC | 38,560 | 1,167,427 | ||||||
| Fidelity National Information Services, Inc. | 8,380 | 1,028,058 | ||||||
| Fiserv, Inc. (a) | 16,795 | 1,531,032 | ||||||
| Nomura Research Institute Ltd. | 74,700 | 1,196,558 | ||||||
| Secom Co. Ltd. | 21,200 | 1,823,576 | ||||||
| SGS S.A. | 239 | 608,884 | ||||||
| Thomson Reuters Corp. | 17,991 | 1,159,700 | ||||||
|
| |||||||
| $ | 18,652,628 | |||||||
|
| |||||||
| Cable TV – 0.6% | ||||||||
| Comcast Corp., “A” | 81,645 | $ | 3,451,951 | |||||
|
| |||||||
| Chemicals – 1.0% | ||||||||
| 3M Co. | 9,864 | $ | 1,709,826 | |||||
| Givaudan S.A. | 733 | 2,069,400 | ||||||
| PPG Industries, Inc. | 19,486 | 2,274,211 | ||||||
|
| |||||||
| $ | 6,053,437 | |||||||
|
| |||||||
| Computer Software – 0.2% | ||||||||
| Adobe Systems, Inc. (a) | 2,223 | $ | 655,007 | |||||
| Cadence Design Systems, Inc. (a) | 12,681 | 897,942 | ||||||
|
| |||||||
| $ | 1,552,949 | |||||||
|
| |||||||
| Computer Software – Systems – 0.4% |
| |||||||
| Amadeus IT Group S.A. | 18,401 | $ | 1,457,550 | |||||
| Hitachi Ltd. | 21,400 | 783,830 | ||||||
| Panasonic Corp. | 40,800 | 339,675 | ||||||
|
| |||||||
| $ | 2,581,055 | |||||||
|
| |||||||
| Construction – 0.6% | ||||||||
| Daito Trust Construction Co., Ltd. | 2,700 | $ | 343,964 | |||||
| Persimmon PLC | 13,043 | 330,782 | ||||||
| Sherwin-Williams Co. | 3,219 | 1,475,236 | ||||||
| Stanley Black & Decker, Inc. | 9,854 | 1,424,987 | ||||||
|
| |||||||
| $ | 3,574,969 | |||||||
|
| |||||||
| Issuer | Shares/Par | Value ($) | ||||||
| COMMON STOCKS – continued |
| |||||||
| Consumer Products – 1.0% | ||||||||
| Colgate-Palmolive Co. | 11,622 | $ | 832,949 | |||||
| Kao Corp. | 14,400 | 1,096,545 | ||||||
| Kimberly-Clark Corp. | 17,688 | 2,357,456 | ||||||
| Reckitt Benckiser Group PLC | 23,060 | 1,819,772 | ||||||
|
| |||||||
| $ | 6,106,722 | |||||||
|
| |||||||
| Containers – 0.1% | ||||||||
| Amcor Ltd. | 80,656 | $ | 916,751 | |||||
|
| |||||||
| Electrical Equipment – 1.3% | ||||||||
| Johnson Controls International PLC | 34,594 | $ | 1,429,078 | |||||
| Legrand S.A. | 13,979 | 1,022,082 | ||||||
| OMRON Corp. | 14,400 | 750,619 | ||||||
| Schneider Electric S.A. | 49,161 | 4,458,662 | ||||||
| Spectris PLC | 15,194 | 555,328 | ||||||
|
| |||||||
| $ | 8,215,769 | |||||||
|
| |||||||
| Electronics – 2.0% | ||||||||
| Analog Devices, Inc. | 12,970 | $ | 1,463,924 | |||||
| Halma PLC | 6,895 | 176,877 | ||||||
| Hoya Corp. | 12,000 | 918,685 | ||||||
| Kyocera Corp. | 14,700 | 959,184 | ||||||
| Samsung Electronics Co. Ltd. | 30,991 | 1,261,488 | ||||||
| Taiwan Semiconductor | ||||||||
| Manufacturing Co. Ltd., ADR | 119,629 | 4,685,868 | ||||||
| Texas Instruments, Inc. | 25,234 | 2,895,854 | ||||||
|
| |||||||
| $ | 12,361,880 | |||||||
|
| |||||||
| Energy – Independent – 0.3% | ||||||||
| Marathon Petroleum Corp. | 14,524 | $ | 811,601 | |||||
| Phillips 66 | 10,075 | 942,416 | ||||||
|
| |||||||
| $ | 1,754,017 | |||||||
|
| |||||||
| Energy – Integrated – 1.3% | ||||||||
| BP PLC | 89,816 | $ | 625,743 | |||||
| Chevron Corp. | 7,157 | 890,617 | ||||||
| China Petroleum & Chemical Corp. | 1,278,000 | 868,720 | ||||||
| Eni S.p.A. | 76,428 | 1,269,353 | ||||||
| Exxon Mobil Corp. | 23,611 | 1,809,311 | ||||||
| Galp Energia SGPS S.A., “B” | 44,208 | 679,887 | ||||||
| LUKOIL PJSC, ADR | 9,235 | 779,619 | ||||||
| Suncor Energy, Inc. | 33,261 | 1,037,541 | ||||||
|
| |||||||
| $ | 7,960,791 | |||||||
|
| |||||||
| Food & Beverages – 1.4% | ||||||||
| Danone S.A. | 19,547 | $ | 1,655,904 | |||||
| General Mills, Inc. | 18,968 | 996,199 | ||||||
| J.M. Smucker Co. | 10,648 | 1,226,543 | ||||||
| Marine Harvest | 11,993 | 280,408 | ||||||
| Nestle S.A. | 41,371 | 4,282,886 | ||||||
|
| |||||||
| $ | 8,441,940 | |||||||
|
| |||||||
| Food & Drug Stores – 0.2% | ||||||||
| Wesfarmers Ltd. | 41,097 | $ | 1,043,294 | |||||
|
| |||||||
| Health Maintenance Organizations – 0.3% |
| |||||||
| Cigna Corp. | 10,540 | $ | 1,660,577 | |||||
|
| |||||||
12
Table of Contents
MFS Global Tactical Allocation Portfolio
Portfolio of Investments (unaudited) – continued
| Issuer | Shares/Par | Value ($) | ||||||
| COMMON STOCKS – continued |
| |||||||
| Insurance – 2.4% |
| |||||||
| Aon PLC | 19,197 | $ | 3,704,637 | |||||
| AXA | 22,089 | 580,212 | ||||||
| Chubb Ltd. | 12,623 | 1,859,242 | ||||||
| Hiscox Ltd. | 31,003 | 666,178 | ||||||
| Manulife Financial Corp. | 34,043 | 618,704 | ||||||
| Marsh & McLennan Cos., Inc. | 7,997 | 797,701 | ||||||
| MetLife, Inc. | 19,685 | 977,754 | ||||||
| Prudential Financial, Inc. | 7,435 | 750,935 | ||||||
| Samsung Fire & Marine Insurance Co. Ltd. | 1,530 | 355,120 | ||||||
| Travelers Cos., Inc. | 15,181 | 2,269,863 | ||||||
| Zurich Insurance Group AG | 6,597 | 2,296,989 | ||||||
|
| |||||||
| $ | 14,877,335 | |||||||
|
| |||||||
| Machinery & Tools – 0.9% |
| |||||||
| AGCO Corp. | 4,040 | $ | 313,383 | |||||
| Eaton Corp. PLC | 32,727 | 2,725,504 | ||||||
| Illinois Tool Works, Inc. | 11,798 | 1,779,256 | ||||||
| Kubota Corp. | 64,100 | 1,066,005 | ||||||
|
| |||||||
| $ | 5,884,148 | |||||||
|
| |||||||
| Major Banks – 2.2% |
| |||||||
| ABSA Group Ltd. | 53,956 | $ | 674,211 | |||||
| Bank of New York Mellon Corp. | 27,335 | 1,206,840 | ||||||
| China Construction Bank | 1,587,000 | 1,367,245 | ||||||
| Goldman Sachs Group, Inc. | 4,664 | 954,254 | ||||||
| JPMorgan Chase & Co. | 32,551 | 3,639,202 | ||||||
| PNC Financial Services Group, Inc. | 6,548 | 898,910 | ||||||
| Royal Bank of Canada | 8,075 | 641,155 | ||||||
| State Street Corp. | 19,468 | 1,091,376 | ||||||
| UBS AG | 141,830 | 1,685,339 | ||||||
| Wells Fargo & Co. | 24,085 | 1,139,702 | ||||||
|
| |||||||
| $ | 13,298,234 | |||||||
|
| |||||||
| Medical & Health Technology & Services – 0.4% |
| |||||||
| HCA Healthcare, Inc. | 13,917 | $ | 1,881,161 | |||||
| Sonic Healthcare Ltd. | 34,386 | 654,213 | ||||||
|
| |||||||
| $ | 2,535,374 | |||||||
|
| |||||||
| Medical Equipment – 1.2% | ||||||||
| Abbott Laboratories | 22,093 | $ | 1,858,021 | |||||
| Danaher Corp. | 12,021 | 1,718,042 | ||||||
| EssilorLuxottica | 4,523 | 590,171 | ||||||
| Medtronic PLC | 25,319 | 2,465,818 | ||||||
| Thermo Fisher Scientific, Inc. | 3,274 | 961,508 | ||||||
|
| |||||||
| $ | 7,593,560 | |||||||
|
| |||||||
| Metals & Mining – 0.1% | ||||||||
| POSCO | 1,052 | $ | 222,764 | |||||
| Rio Tinto Ltd. | 6,787 | 420,657 | ||||||
|
| |||||||
| $ | 643,421 | |||||||
|
| |||||||
| Natural Gas – Pipeline – 0.1% | ||||||||
| Enterprise Products Partners LP | 18,368 | $ | 530,284 | |||||
|
| |||||||
| Network & Telecom – 0.2% |
| |||||||
| Cisco Systems, Inc. | 17,785 | $ | 973,373 | |||||
|
| |||||||
| Issuer | Shares/Par | Value ($) | ||||||
| COMMON STOCKS – continued |
| |||||||
| Oil Services – 0.2% |
| |||||||
| Schlumberger Ltd. | 26,848 | $ | 1,066,939 | |||||
|
| |||||||
| Other Banks & Diversified Financials – 1.5% |
| |||||||
| American Express Co. | 6,408 | $ | 791,003 | |||||
| BB&T Corp. | 29,182 | 1,433,712 | ||||||
| Citigroup, Inc. | 43,720 | 3,061,711 | ||||||
| DBS Group Holdings Ltd. | 45,200 | 867,252 | ||||||
| KBC Groep N.V. | 11,516 | 754,787 | ||||||
| Komercni Banka A.S. | 2,593 | 103,322 | ||||||
| ORIX Corp. | 17,800 | 265,477 | ||||||
| Sberbank of Russia PJSC, ADR | 12,779 | �� | 196,541 | |||||
| U.S. Bancorp | 33,324 | 1,746,178 | ||||||
|
| |||||||
| $ | 9,219,983 | |||||||
|
| |||||||
| Pharmaceuticals – 3.5% |
| |||||||
| Bayer AG | 30,294 | $ | 2,099,219 | |||||
| Bristol-Myers Squibb Co. | 26,235 | 1,189,757 | ||||||
| Eli Lilly & Co. | 8,862 | 981,821 | ||||||
| Johnson & Johnson | 27,616 | 3,846,356 | ||||||
| Novartis AG | 31,759 | 2,901,970 | ||||||
| Novo Nordisk A.S., “B” | 20,088 | 1,023,657 | ||||||
| Pfizer, Inc. | 82,961 | 3,593,871 | ||||||
| Roche Holding AG | 18,390 | 5,173,954 | ||||||
| Santen Pharmaceutical Co. Ltd. | 62,300 | 1,031,447 | ||||||
|
| |||||||
| $ | 21,842,052 | |||||||
|
| |||||||
| Printing & Publishing – 0.4% |
| |||||||
| Moody’s Corp. | 7,930 | $ | 1,548,808 | |||||
| RELX Group PLC | 48,664 | 1,177,547 | ||||||
|
| |||||||
| $ | 2,726,355 | |||||||
|
| |||||||
| Railroad & Shipping – 0.3% |
| |||||||
| Canadian National Railway Co. | 5,215 | $ | 482,283 | |||||
| Union Pacific Corp. | 7,113 | 1,202,880 | ||||||
|
| |||||||
| $ | 1,685,163 | |||||||
|
| |||||||
| Real Estate – 0.7% |
| |||||||
| Daiwa House Industry Co. Ltd. | 6,000 | $ | 174,799 | |||||
| Deutsche Wohnen SE | 37,453 | 1,374,309 | ||||||
| Grand City Properties S.A. | 18,911 | 432,224 | ||||||
| Longfor Properties | 30,500 | 114,984 | ||||||
| Medical Properties Trust, Inc., REIT | 62,181 | 1,084,437 | ||||||
| Public Storage, Inc., REIT | 1,586 | 377,738 | ||||||
| STORE Capital Corp., REIT | 14,783 | 490,648 | ||||||
|
| |||||||
| $ | 4,049,139 | |||||||
|
| |||||||
| Restaurants – 0.3% |
| |||||||
| Greggs PLC | 23,878 | $ | 696,842 | |||||
| Starbucks Corp. | 15,413 | 1,292,072 | ||||||
|
| |||||||
| $ | 1,988,914 | |||||||
|
| |||||||
| Specialty Chemicals – 0.5% |
| |||||||
| Akzo Nobel N.V. | 13,492 | $ | 1,267,843 | |||||
| Corteva, Inc. | 3,972 | 117,452 | ||||||
| DuPont de Nemours, Inc. | 3,972 | 298,178 | ||||||
| PTT Global Chemical PLC | 603,300 | 1,259,026 | ||||||
|
| |||||||
| $ | 2,942,499 | |||||||
|
| |||||||
13
Table of Contents
MFS Global Tactical Allocation Portfolio
Portfolio of Investments (unaudited) – continued
| Issuer | Shares/Par | Value ($) | ||||||
| COMMON STOCKS – continued |
| |||||||
| Specialty Stores – 0.1% |
| |||||||
| Dufry AG | 4,396 | $ | 372,323 | |||||
|
| |||||||
| Telecommunications – Wireless – 0.8% |
| |||||||
| KDDI Corp. | 158,500 | $ | 4,033,249 | |||||
| Vodafone Group PLC | 679,127 | 1,115,329 | ||||||
|
| |||||||
| $ | 5,148,578 | |||||||
|
| |||||||
| Telephone Services – 0.3% | ||||||||
| Royal KPN N.V. | 110,389 | $ | 338,913 | |||||
| TELUS Corp. | 19,709 | 728,581 | ||||||
| TELUS Corp. | 6,936 | 256,008 | ||||||
| Verizon Communications, Inc. | 10,111 | 577,641 | ||||||
|
| |||||||
| $ | 1,901,143 | |||||||
|
| |||||||
| Tobacco – 1.0% | ||||||||
| Altria Group, Inc. | 7,581 | $ | 358,960 | |||||
| Imperial Tobacco Group PLC | 26,938 | 631,788 | ||||||
| Japan Tobacco, Inc. | 78,400 | 1,730,305 | ||||||
| Philip Morris International, Inc. (s) | 47,082 | 3,697,350 | ||||||
|
| |||||||
| $ | 6,418,403 | |||||||
|
| |||||||
| Utilities – Electric Power – 1.0% |
| |||||||
| Duke Energy Corp. | 19,378 | $ | 1,709,915 | |||||
| E.ON AG | 31,975 | 347,263 | ||||||
| Exelon Corp. | 40,111 | 1,922,921 | ||||||
| SSE PLC | 95,440 | 1,359,908 | ||||||
| Xcel Energy, Inc. | 11,600 | 690,084 | ||||||
|
| |||||||
| $ | 6,030,091 | |||||||
|
| |||||||
| Total Common Stocks (Identified Cost, $145,708,355) | $ | 220,272,355 | ||||||
|
| |||||||
| PREFERRED STOCKS – 0.3% |
| |||||||
| Consumer Products – 0.3% | ||||||||
| Henkel AG & Co. KGaA | 15,462 | $ | 1,512,390 | |||||
|
| |||||||
| Telephone Services – 0.0% | ||||||||
| Telefonica Brasil S.A | 13,800 | $ | 179,367 | |||||
|
| |||||||
| Total Preferred Stocks (Identified Cost, $958,003) | $ | 1,691,757 | ||||||
|
| |||||||
| Issuer | Shares/Par | Value ($) | ||||||
| CONVERTIBLE PREFERRED STOCKS – 0.1% |
| |||||||
| Medical Equipment – 0.0% | ||||||||
| Danaher Corp., 4.75% | 101 | $ | 111,570 | |||||
|
| |||||||
| Utilities – Electric Power – 0.1% |
| |||||||
| CenterPoint Energy, Inc., 7% | 7,938 | $ | 398,646 | |||||
| NextEra Energy, Inc., 6.123% | 3,325 | 215,892 | ||||||
|
| |||||||
| $ | 614,538 | |||||||
|
| |||||||
| Total Convertible Preferred Stocks (Identified Cost, $696,458) |
| $ | 726,108 | |||||
|
| |||||||
| INVESTMENT COMPANIES (h) – 0.9% |
| |||||||
| Money Market Funds – 0.9% | ||||||||
| MFS Institutional Money Market | ||||||||
| Portfolio, 2.42% (v) (Identified Cost, $5,380,642) | 5,380,910 | $ | 5,381,448 | |||||
|
| |||||||
| Underlying/ Expiration Date/ Exercise Price | Put/ Call | Counter- party | Notional Amount | Par Amount/ | ||||||||||||||
| PURCHASED OPTIONS – 0.0% |
| |||||||||||||||||
| Market Index Securities – 0.0% |
| |||||||||||||||||
| Markit iTraxx Europe Index – September 2019 @ EUR 73 | Put | Merrill Lynch International | $ | 44,487,286 | EUR 38,200,000 | $ | 31,584 | |||||||||||
| Russell 2000 Index – September 2019 @ $1,330 | Put | Goldman Sachs International | 25,065,150 | 160 | 96,000 | |||||||||||||
|
| |||||||||||||||||
| Total Purchased Options (Premiums Paid, $308,204) |
| $ | 127,584 | |||||||||||||||
|
| |||||||||||||||||
| WRITTEN OPTIONS (SEE TABLE BELOW) – 0.0% |
| |||||||||||||||||
| (Premiums Received, $82,628) |
| $ | (21,708 | ) | ||||||||||||||
|
| |||||||||||||||||
| OTHER ASSETS, LESS LIABILITIES – 1.5% |
| 9,144,336 | ||||||||||||||||
|
| |||||||||||||||||
| NET ASSETS – 100.0% | $ | 616,466,589 | ||||||||||||||||
|
| |||||||||||||||||
| (a) | Non-income producing security. |
| (f) | All or a portion of the security has been segregated as collateral for open futures contracts. |
| (h) | An affiliated issuer, which may be considered one in which the fund owns 5% or more of the outstanding voting securities, or a company which is under common control. At period end, the aggregate values of the fund’s investments in affiliated issuers and in unaffiliated issuers were $5,381,448 and $601,962,513, respectively. |
| (n) | Securities exempt from registration under Rule 144A of the Securities Act of 1933. These securities may be sold in the ordinary course of business in transactions exempt from registration, normally to qualified institutional buyers. At period end, the aggregate value of these securities was $34,994,565, representing 5.7% of net assets. |
| (s) | Security or a portion of the security was pledged to cover collateral requirements for certain derivative transactions. |
| (v) | Affiliated issuer that is available only to investment companies managed by MFS. The rate quoted for the MFS Institutional Money Market Portfolio is the annualizedseven-day yield of the fund at period end. |
14
Table of Contents
MFS Global Tactical Allocation Portfolio
Portfolio of Investments (unaudited) – continued
| (z) | Restricted securities are not registered under the Securities Act of 1933 and are subject to legal restrictions on resale. These securities generally may be resold in transactions exempt from registration or to the public if the securities are subsequently registered. Disposal of these securities may involve time-consuming negotiations and prompt sale at an acceptable price may be difficult. The fund holds the following restricted securities: |
| Restricted Securities | Acquisition Date | Cost | Value | |||||||
| Chesapeake Funding II LLC,2016-2A, “A2”, FLR, 3.394% (LIBOR - 1mo. + 1%), 6/15/2028 | 6/14/16 | $233,501 | $233,800 | |||||||
| Dryden Senior Loan Fund,2013-26A, “AR”, CLO, FLR, 3.496% (LIBOR - 3mo. + 0.9%), 4/15/2029 | 4/09/18 | 1,292,000 | 1,280,742 | |||||||
| Vinci S.A., 3.75%, 4/10/2029 | 4/03/19 | 704,282 | 758,632 | |||||||
| Total Restricted Securities | $2,273,174 | |||||||||
| % of Net assets | 0.4% | |||||||||
The following abbreviations are used in this report and are defined:
| ADR | American Depositary Receipt |
| AGM | Assured Guaranty Municipal |
| CLO | Collateralized Loan Obligation |
| EURIBOR | Euro Interbank Offered Rate |
| FLR | Floating Rate. Interest rate resets periodically based on the parenthetically disclosed reference rate plus a spread (if any). Theperiod-end rate reported may not be the current rate. All reference rates are USD unless otherwise noted. |
| ICE | Intercontinental Exchange |
| LIBOR | London Interbank Offered Rate |
| NATL | National Public Finance Guarantee Corp. |
| REIT | Real Estate Investment Trust |
Abbreviations indicate amounts shown in currencies other than the U.S. dollar. All amounts are stated in U.S. dollars unless otherwise indicated. A list of abbreviations is shown below:
| AUD | Australian Dollar |
| BRL | Brazilian Real |
| CAD | Canadian Dollar |
| CHF | Swiss Franc |
| CNH | Chinese Yuan Renminbi (Offshore) |
| CZK | Czech Koruna |
| DKK | Danish Krone |
| EUR | Euro |
| GBP | British Pound |
| HKD | Hong Kong Dollar |
| IDR | Indonesian Rupiah |
| ILS | Israeli Shekel |
| INR | Indian Rupee |
| JPY | Japanese Yen |
| KRW | South Korean Won |
| MXN | Mexican Peso |
| NOK | Norwegian Krone |
| NZD | New Zealand Dollar |
| PHP | Philippine Peso |
| PLN | Polish Zloty |
| RUB | Russian Ruble |
| SEK | Swedish Krona |
| SGD | Singapore Dollar |
| THB | Thai Baht |
| TRY | Turkish Lira |
| ZAR | South African Rand |
15
Table of Contents
MFS Global Tactical Allocation Portfolio
Portfolio of Investments (unaudited) – continued
Derivative Contracts at 6/30/19
Written Options
| Underlying | Put/Call | Counterparty | Par Amount/ Number of Contracts | Notional Amount | Exercise Price | Expiration Date | Value | |||||||||||||||||
| Liability Derivatives | ||||||||||||||||||||||||
| Market Index Securities | ||||||||||||||||||||||||
| Markit CDX North America Investment Grade Index | Put | Goldman Sachs International | $(22,700,000) | $(23,190,270) | $70 | September - 2019 | $(21,708 | ) | ||||||||||||||||
|
| |||||||||||||||||||||||
Forward Foreign Currency Exchange Contracts
| Currency Purchased | Currency Sold | Counterparty | Settlement Date | Unrealized Appreciation (Depreciation) | ||||||||||||||||||||
| Asset Derivatives |
| |||||||||||||||||||||||
| AUD | 4,526,895 | USD | 3,175,304 | JPMorgan Chase Bank N.A. | 7/10/2019 | $3,685 | ||||||||||||||||||
| AUD | 15,386,965 | USD | 10,806,727 | JPMorgan Chase Bank N.A. | 8/16/2019 | 11,576 | ||||||||||||||||||
| CAD | 4,068,811 | USD | 3,027,443 | JPMorgan Chase Bank N.A. | 7/10/2019 | 80,205 | ||||||||||||||||||
| CAD | 45,402,422 | USD | 33,817,442 | JPMorgan Chase Bank N.A. | 8/16/2019 | 885,317 | ||||||||||||||||||
| CHF | 2,289,000 | USD | 2,304,586 | BNP Paribas S.A. | 7/12/2019 | 42,468 | ||||||||||||||||||
| CHF | 4,206,539 | USD | 4,155,000 | JPMorgan Chase Bank N.A. | 7/10/2019 | 157,416 | ||||||||||||||||||
| CHF | 5,443,464 | USD | 5,420,910 | JPMorgan Chase Bank N.A. | 8/16/2019 | 178,370 | ||||||||||||||||||
| CZK | 9,851,000 | USD | 433,851 | Morgan Stanley Capital Services, Inc. | 7/12/2019 | 6,777 | ||||||||||||||||||
| DKK | 6,419,079 | USD | 976,653 | UBS AG | 7/12/2019 | 2,114 | ||||||||||||||||||
| EUR | 418,752 | USD | 469,347 | Brown Brothers Harriman | 7/12/2019 | 7,217 | ||||||||||||||||||
| EUR | 4,677,237 | USD | 5,257,971 | Citibank N.A. | 7/12/2019 | 65,003 | ||||||||||||||||||
| EUR | 1,988,332 | USD | 2,245,070 | Deutsche Bank AG | 7/12/2019 | 17,771 | ||||||||||||||||||
| EUR | 2,671,925 | USD | 3,032,359 | Goldman Sachs International | 7/12/2019 | 8,452 | ||||||||||||||||||
| EUR | 5,139,000 | USD | 5,835,227 | JPMorgan Chase Bank N.A. | 7/12/2019 | 13,262 | ||||||||||||||||||
| EUR | 5,061,393 | USD | 5,719,000 | JPMorgan Chase Bank N.A. | 8/16/2019 | 57,150 | ||||||||||||||||||
| EUR | 1,241,833 | USD | 1,408,631 | Merrill Lynch International | 7/12/2019 | 4,648 | ||||||||||||||||||
| EUR | 2,887,064 | USD | 3,235,941 | NatWest Markets PLC | 7/12/2019 | 49,709 | ||||||||||||||||||
| EUR | 3,161,222 | USD | 3,566,403 | UBS AG | 7/12/2019 | 31,257 | ||||||||||||||||||
| GBP | 200,718 | USD | 254,037 | Merrill Lynch International | 7/12/2019 | 994 | ||||||||||||||||||
| GBP | 346,061 | USD | 435,929 | UBS AG | 7/12/2019 | 3,777 | ||||||||||||||||||
| INR | 132,008,000 | USD | 1,881,742 | JPMorgan Chase Bank N.A. | 7/10/2019 | 28,628 | ||||||||||||||||||
| INR | 133,780,000 | USD | 1,908,417 | JPMorgan Chase Bank N.A. | 7/18/2019 | 25,755 | ||||||||||||||||||
| JPY | 416,861,000 | USD | 3,848,339 | Deutsche Bank AG | 7/12/2019 | 21,217 | ||||||||||||||||||
| JPY | 4,180,117,344 | USD | 37,896,129 | HSBC Bank | 7/12/2019 | 906,247 | ||||||||||||||||||
| JPY | 1,006,742,937 | USD | 9,347,000 | JPMorgan Chase Bank N.A. | 8/16/2019 | 22,015 | ||||||||||||||||||
| JPY | 210,555,000 | USD | 1,929,402 | UBS AG | 7/12/2019 | 25,096 | ||||||||||||||||||
| MXN | 36,183,000 | USD | 1,842,161 | Citibank N.A. | 7/12/2019 | 39,923 | ||||||||||||||||||
| NOK | 49,976,595 | USD | 5,781,000 | Goldman Sachs International | 7/10/2019 | 79,190 | ||||||||||||||||||
| NOK | 158,060,710 | USD | 18,166,585 | Goldman Sachs International | 8/16/2019 | 388,019 | ||||||||||||||||||
| NZD | 28,392,864 | USD | 18,707,575 | Goldman Sachs International | 7/10/2019 | 370,315 | ||||||||||||||||||
| NZD | 13,438,058 | USD | 8,860,800 | Goldman Sachs International | 8/16/2019 | 175,396 | ||||||||||||||||||
| NZD | 2,874,000 | USD | 1,916,984 | JPMorgan Chase Bank N.A. | 7/12/2019 | 14,219 | ||||||||||||||||||
| PHP | 157,364,000 | USD | 2,992,280 | JPMorgan Chase Bank N.A. | 7/10/2019 | 78,348 | ||||||||||||||||||
| PLN | 3,697,931 | USD | 975,905 | Merrill Lynch International | 7/12/2019 | 14,813 | ||||||||||||||||||
| SEK | 124,238,883 | USD | 12,940,188 | Goldman Sachs International | 7/10/2019 | 446,952 | ||||||||||||||||||
| SEK | 8,189,516 | USD | 864,102 | Goldman Sachs International | 8/16/2019 | 20,718 | ||||||||||||||||||
| THB | 37,638,650 | USD | 1,185,955 | JPMorgan Chase Bank N.A. | 8/13/2019 | 41,853 | ||||||||||||||||||
| USD | 8,891,507 | AUD | 12,440,633 | Deutsche Bank AG | 7/12/2019 | 154,514 | ||||||||||||||||||
| USD | 1,954,305 | AUD | 2,772,000 | Goldman Sachs International | 7/12/2019 | 7,544 | ||||||||||||||||||
| USD | 3,193,000 | AUD | 4,526,895 | JPMorgan Chase Bank N.A. | 7/10/2019 | 14,011 | ||||||||||||||||||
| USD | 1,871,823 | AUD | 2,655,000 | JPMorgan Chase Bank N.A. | 7/12/2019 | 7,230 | ||||||||||||||||||
| USD | 218,393 | AUD | 309,000 | NatWest Markets PLC | 7/12/2019 | 1,384 | ||||||||||||||||||
| USD | 578,057 | AUD | 819,210 | UBS AG | 7/12/2019 | 2,730 | ||||||||||||||||||
| USD | 974,634 | EUR | 855,000 | Deutsche Bank AG | 7/12/2019 | 1,594 | ||||||||||||||||||
| USD | 454,711 | EUR | 399,540 | UBS AG | 7/12/2019 | 10 | ||||||||||||||||||
16
Table of Contents
MFS Global Tactical Allocation Portfolio
Portfolio of Investments (unaudited) – continued
Forward Foreign Currency Exchange Contracts - continued
| Currency Purchased | Currency Sold | Counterparty | Settlement Date | Unrealized Appreciation (Depreciation) | ||||||||||||||||
| Asset Derivatives – continued | ||||||||||||||||||||
| USD | 770,326 | GBP | 585,029 | Citibank N.A. | 7/12/2019 | $26,989 | ||||||||||||||
| USD | 7,646,823 | GBP | 5,829,571 | JPMorgan Chase Bank N.A. | 8/16/2019 | 227,765 | ||||||||||||||
| USD | 974,112 | GBP | 750,484 | Merrill Lynch International | 7/12/2019 | 20,546 | ||||||||||||||
| USD | 1,426,873 | GBP | 1,119,618 | UBS AG | 7/12/2019 | 4,287 | ||||||||||||||
| USD | 4,687,061 | KRW | 5,268,382,630 | JPMorgan Chase Bank N.A. | 7/10/2019 | 123,188 | ||||||||||||||
| USD | 3,373,855 | NZD | 4,994,789 | Deutsche Bank AG | 7/12/2019 | 17,575 | ||||||||||||||
|
| |||||||||||||||||||
| $4,935,239 | ||||||||||||||||||||
|
| |||||||||||||||||||
| Liability Derivatives | ||||||||||||||||||||
| AUD | 8,140,000 | USD | 5,852,401 | JPMorgan Chase Bank N.A. | 7/12/2019 | $(135,720 | ) | |||||||||||||
| AUD | 3,504,608 | USD | 2,519,298 | UBS AG | 7/12/2019 | (58,029 | ) | |||||||||||||
| CNH | 16,896,000 | USD | 2,512,529 | JPMorgan Chase Bank N.A. | 10/15/2019 | (55,211 | ) | |||||||||||||
| EUR | 4,073,674 | USD | 4,636,988 | Goldman Sachs International | 7/12/2019 | (904 | ) | |||||||||||||
| GBP | 245,570 | USD | 321,127 | Citibank N.A. | 7/12/2019 | (9,106 | ) | |||||||||||||
| GBP | 3,113,023 | USD | 4,085,329 | Deutsche Bank AG | 7/12/2019 | (129,925 | ) | |||||||||||||
| GBP | 8,189,190 | USD | 10,633,000 | JPMorgan Chase Bank N.A. | 7/10/2019 | (228,859 | ) | |||||||||||||
| GBP | 549,985 | USD | 699,007 | Merrill Lynch International | 7/12/2019 | (196 | ) | |||||||||||||
| ILS | 1,799,000 | USD | 505,924 | Goldman Sachs International | 7/12/2019 | (1,531 | ) | |||||||||||||
| KRW | 5,460,044,000 | USD | 4,862,882 | JPMorgan Chase Bank N.A. | 7/10/2019 | (132,978 | ) | |||||||||||||
| MXN | 23,425,560 | USD | 1,226,644 | JPMorgan Chase Bank N.A. | 7/12/2019 | (8,147 | ) | |||||||||||||
| NOK | 71,028,720 | USD | 8,348,482 | Goldman Sachs International | 7/12/2019 | (19,186 | ) | |||||||||||||
| NOK | 16,499,000 | USD | 1,949,642 | JPMorgan Chase Bank N.A. | 7/12/2019 | (14,861 | ) | |||||||||||||
| RUB | 42,540,000 | USD | 668,369 | JPMorgan Chase Bank N.A. | 8/27/2019 | (1,008 | ) | |||||||||||||
| SEK | 16,299,522 | USD | 1,775,632 | JPMorgan Chase Bank N.A. | 7/12/2019 | (19,039 | ) | |||||||||||||
| SGD | 1,023,000 | USD | 757,699 | JPMorgan Chase Bank N.A. | 7/12/2019 | (1,449 | ) | |||||||||||||
| USD | 379,458 | AUD | 548,000 | Citibank N.A. | 7/12/2019 | (5,400 | ) | |||||||||||||
| USD | 1,676,440 | AUD | 2,441,000 | Deutsche Bank AG | 7/12/2019 | (37,862 | ) | |||||||||||||
| USD | 2,143,768 | AUD | 3,121,000 | Goldman Sachs International | 7/12/2019 | (48,094 | ) | |||||||||||||
| USD | 24,611,907 | AUD | 35,181,842 | JPMorgan Chase Bank N.A. | 8/16/2019 | (123,825 | ) | |||||||||||||
| USD | 371,231 | CAD | 496,000 | Citibank N.A. | 7/12/2019 | (7,618 | ) | |||||||||||||
| USD | 12,157,636 | CAD | 16,149,718 | Deutsche Bank AG | 7/12/2019 | (177,655 | ) | |||||||||||||
| USD | 3,026,000 | CAD | 4,068,811 | JPMorgan Chase Bank N.A. | 7/10/2019 | (81,648 | ) | |||||||||||||
| USD | 17,904,774 | CAD | 24,044,590 | JPMorgan Chase Bank N.A. | 8/16/2019 | (473,399 | ) | |||||||||||||
| USD | 4,154,643 | CHF | 4,206,539 | JPMorgan Chase Bank N.A. | 7/10/2019 | (157,773 | ) | |||||||||||||
| USD | 31,238,782 | CHF | 31,611,617 | JPMorgan Chase Bank N.A. | 8/16/2019 | (1,277,708 | ) | |||||||||||||
| USD | 753,659 | DKK | 4,986,300 | JPMorgan Chase Bank N.A. | 8/16/2019 | (8,911 | ) | |||||||||||||
| USD | 378,961 | EUR | 339,000 | Brown Brothers Harriman | 7/12/2019 | (6,841 | ) | |||||||||||||
| USD | 2,722,378 | EUR | 2,414,000 | Citibank N.A. | 7/12/2019 | (24,898 | ) | |||||||||||||
| USD | 952,906 | EUR | 848,492 | Deutsche Bank AG | 7/12/2019 | (12,729 | ) | |||||||||||||
| USD | 73,981,208 | EUR | 65,591,294 | Goldman Sachs International | 8/16/2019 | (872,712 | ) | |||||||||||||
| USD | 112,101 | �� | EUR | 99,956 | JPMorgan Chase Bank N.A. | 7/12/2019 | (1,655 | ) | ||||||||||||
| USD | 34,394,198 | EUR | 30,547,097 | JPMorgan Chase Bank N.A. | 8/16/2019 | (466,677 | ) | |||||||||||||
| USD | 2,374,805 | EUR | 2,102,372 | Merrill Lynch International | 7/12/2019 | (17,820 | ) | |||||||||||||
| USD | 4,390,539 | EUR | 3,887,241 | NatWest Markets PLC | 7/12/2019 | (33,374 | ) | |||||||||||||
| USD | 6,910,866 | EUR | 6,118,770 | UBS AG | 7/12/2019 | (52,659 | ) | |||||||||||||
| USD | 3,825,624 | GBP | 3,034,000 | JPMorgan Chase Bank N.A. | 7/12/2019 | (29,374 | ) | |||||||||||||
| USD | 1,344,000 | GBP | 1,056,806 | JPMorgan Chase Bank N.A. | 8/16/2019 | (955 | ) | |||||||||||||
| USD | 538,687 | GBP | 426,202 | UBS AG | 7/12/2019 | (2,845 | ) | |||||||||||||
| USD | 5,795,128 | IDR | 83,977,192,000 | JPMorgan Chase Bank N.A. | 7/10/2019 | (144,029 | ) | |||||||||||||
| USD | 370,333 | ILS | 1,321,342 | JPMorgan Chase Bank N.A. | 8/16/2019 | (932 | ) | |||||||||||||
| USD | 4,358,005 | JPY | 476,753,062 | Citibank N.A. | 7/12/2019 | (67,505 | ) | |||||||||||||
| USD | 45,161,125 | JPY | 4,946,385,072 | JPMorgan Chase Bank N.A. | 8/16/2019 | (871,238 | ) | |||||||||||||
| USD | 915,062 | JPY | 101,478,000 | UBS AG | 7/12/2019 | (26,918 | ) | |||||||||||||
| USD | 33,957 | NOK | 292,000 | Citibank N.A. | 7/12/2019 | (285 | ) | |||||||||||||
| USD | 18,949,000 | NZD | 28,392,864 | Goldman Sachs International | 7/10/2019 | (128,890 | ) | |||||||||||||
| USD | 1,901,525 | NZD | 2,928,000 | Goldman Sachs International | 7/12/2019 | (65,963 | ) | |||||||||||||
| USD | 33,067,715 | NZD | 50,118,661 | Goldman Sachs International | 8/16/2019 | (633,736 | ) | |||||||||||||
17
Table of Contents
MFS Global Tactical Allocation Portfolio
Portfolio of Investments (unaudited) – continued
Forward Foreign Currency Exchange Contracts - continued
| Currency Purchased | Currency Sold | Counterparty | Settlement Date | Unrealized Appreciation (Depreciation) | ||||||||||||||||
| Liability Derivatives – continued | ||||||||||||||||||||
| USD | 2,946,891 | PHP | 157,364,000 | JPMorgan Chase Bank N.A. | 7/10/2019 | $(123,737 | ) | |||||||||||||
| USD | 522,358 | SEK | 4,934,000 | Citibank N.A. | 7/12/2019 | (9,377 | ) | |||||||||||||
| USD | 13,164,000 | SEK | 124,238,883 | Goldman Sachs International | 7/10/2019 | (223,139 | ) | |||||||||||||
| USD | 3,314,215 | SEK | 31,618,000 | Goldman Sachs International | 7/12/2019 | (93,243 | ) | |||||||||||||
| USD | 12,975,927 | SEK | 124,238,883 | Goldman Sachs International | 8/16/2019 | (447,219 | ) | |||||||||||||
| USD | 16,965 | SEK | 160,000 | NatWest Markets PLC | 7/12/2019 | (278 | ) | |||||||||||||
| USD | 909,283 | SGD | 1,238,213 | JPMorgan Chase Bank N.A. | 8/16/2019 | (6,572 | ) | |||||||||||||
| USD | 65,569 | ZAR | 929,865 | JPMorgan Chase Bank N.A. | 7/12/2019 | (367 | ) | |||||||||||||
|
| |||||||||||||||||||
| $(7,582,009 | ) | |||||||||||||||||||
|
| |||||||||||||||||||
Futures Contracts
| Description | Long/ Short | Currency | Contracts | Notional Amount | Expiration Date | Value/Unrealized Appreciation (Depreciation) | ||||||||||||||||||
| Asset Derivatives | ||||||||||||||||||||||||
| Equity Futures | ||||||||||||||||||||||||
| BIST 30 Index | Long | TRY | 7,947 | $17,172,410 | August - 2019 | $79,175 | ||||||||||||||||||
| CAC 40 Index | Long | EUR | 182 | 11,450,667 | July - 2019 | 347,224 | ||||||||||||||||||
| FTSE 100 Index | Long | GBP | 268 | 25,080,127 | September - 2019 | 264,960 | ||||||||||||||||||
| FTSE MIB Index | Long | EUR | 125 | 15,035,307 | September - 2019 | 479,963 | ||||||||||||||||||
| FTSE/JSE Top 40 Index | Short | ZAR | 229 | 8,524,621 | September - 2019 | 58,530 | ||||||||||||||||||
| Hang Seng China Enterprises Index | Long | HKD | 9 | 624,160 | July - 2019 | 1,507 | ||||||||||||||||||
| Hang Seng Index | Long | HKD | 134 | 24,448,392 | July - 2019 | 172,539 | ||||||||||||||||||
| KOSPI 200 Index | Long | KRW | 21 | 1,265,838 | September - 2019 | 36,602 | ||||||||||||||||||
| Mexican Bolsa Index | Short | MXN | 31 | 705,399 | September - 2019 | 1,034 | ||||||||||||||||||
| MSCI Singapore Index | Long | SGD | 378 | 10,564,723 | July - 2019 | 97,506 | ||||||||||||||||||
| OMX 30 Index | Long | SEK | 175 | 3,054,347 | July - 2019 | 63,226 | ||||||||||||||||||
| S&P 500E-Mini Index | Long | USD | 5 | 736,050 | September - 2019 | 14,797 | ||||||||||||||||||
| S&P/TSX 60 Index | Long | CAD | 67 | 10,004,337 | September - 2019 | 90,845 | ||||||||||||||||||
|
| |||||||||||||||||||||||
| $1,707,908 | ||||||||||||||||||||||||
|
| |||||||||||||||||||||||
| Interest Rate Futures | ||||||||||||||||||||||||
| Australian Note 10 yr | Long | AUD | 511 | $51,534,131 | September - 2019 | $616,483 | ||||||||||||||||||
| Japan Government Bond 10 yr | Long | JPY | 41 | 58,506,238 | September - 2019 | 166,753 | ||||||||||||||||||
| U.S. Treasury Note 2 yr | Long | USD | 43 | 9,252,727 | September - 2019 | 44,192 | ||||||||||||||||||
| U.S. Treasury Ultra Bond | Long | USD | 21 | 3,728,812 | September - 2019 | 85,304 | ||||||||||||||||||
|
| |||||||||||||||||||||||
| $912,732 | ||||||||||||||||||||||||
|
| |||||||||||||||||||||||
| $2,620,640 | ||||||||||||||||||||||||
|
| |||||||||||||||||||||||
| Liability Derivatives | ||||||||||||||||||||||||
| Equity Futures | ||||||||||||||||||||||||
| AEX 25 Index | Short | EUR | 62 | $7,909,137 | July - 2019 | $(120,492 | ) | |||||||||||||||||
| DAX Index | Short | EUR | 19 | 6,691,039 | September - 2019 | (164,791 | ) | |||||||||||||||||
| IBEX 35 Index | Short | EUR | 47 | 4,902,391 | July - 2019 | (54,994 | ) | |||||||||||||||||
| IBOV Index | Short | BRL | 450 | 11,902,889 | August - 2019 | (304,106 | ) | |||||||||||||||||
| MSCI Taiwan Index | Long | USD | 87 | 3,362,550 | July - 2019 | (4,741 | ) | |||||||||||||||||
| NIFTY Index | Short | USD | 700 | 16,573,200 | July - 2019 | (66,496 | ) | |||||||||||||||||
| Russell 2000 Index | Short | USD | 315 | 24,681,825 | September - 2019 | (661,969 | ) | |||||||||||||||||
| S&P/ASX 200 Index | Short | AUD | 74 | 8,518,780 | September - 2019 | (75,869 | ) | |||||||||||||||||
| Topix Index | Short | JPY | 57 | 8,199,879 | September - 2019 | (32,831 | ) | |||||||||||||||||
|
| |||||||||||||||||||||||
| $(1,486,289 | ) | |||||||||||||||||||||||
|
| |||||||||||||||||||||||
18
Table of Contents
MFS Global Tactical Allocation Portfolio
Portfolio of Investments (unaudited) – continued
Futures Contracts - continued
| Description | Long/ Short | Currency | Contracts | Notional Amount | Expiration Date | Value/Unrealized Appreciation (Depreciation) | ||||||||||||||||||
| Liability Derivatives – continued |
| |||||||||||||||||||||||
| Interest Rate Futures | ||||||||||||||||||||||||
| Canadian Treasury Bond 10 yr | Short | CAD | 359 | $39,182,826 | September - 2019 | $(371,186 | ) | |||||||||||||||||
| Euro-Bobl 5 yr | Short | EUR | 161 | 24,612,351 | September - 2019 | (104,721 | ) | |||||||||||||||||
| Euro-Bund 10 yr | Short | EUR | 49 | 9,624,711 | September - 2019 | (98,587 | ) | |||||||||||||||||
| Euro-Buxl 30 yr | Short | EUR | 20 | 4,614,353 | September - 2019 | (128,766 | ) | |||||||||||||||||
| Long Gilt 10 yr | Short | GBP | 315 | 52,124,435 | September - 2019 | (286,468 | ) | |||||||||||||||||
| U.S. Treasury Bond | Short | USD | 10 | 1,555,938 | September - 2019 | (31,092 | ) | |||||||||||||||||
| U.S. Treasury Note 10 yr | Short | USD | 511 | 65,392,031 | September - 2019 | (911,050 | ) | |||||||||||||||||
| U.S. Treasury Note 5 yr | Short | USD | 113 | 13,351,656 | September - 2019 | (148,858 | ) | |||||||||||||||||
| U.S. Treasury Ultra Note 10 yr | Short | USD | 113 | 15,608,125 | September - 2019 | (282,910 | ) | |||||||||||||||||
|
| |||||||||||||||||||||||
| $(2,363,638 | ) | |||||||||||||||||||||||
|
| |||||||||||||||||||||||
| $(3,849,927 | ) | |||||||||||||||||||||||
|
| |||||||||||||||||||||||
Cleared Swap Agreements
| Maturity Date | Notional Amount | Counterparty | Cash Flows to Receive/ Frequency | Cash Flows to Pay/ Frequency | Unrealized Appreciation (Depreciation) | Net Unamortized Upfront Payments (Receipts) | Value | |||||||||||||||
| Asset Derivatives | ||||||||||||||||||||||
| Interest Rate Swaps | ||||||||||||||||||||||
| 4/11/21 | USD | 159,920,000 | centrally cleared | 2.43%/ Semi-annually | 2.58%(3-Month Libor)/Quarterly | $1,651,957 | $— | $1,651,957 | ||||||||||||||
| 3/01/24 | USD | 70,278,000 | centrally cleared | 2.53%/ Semi-annually | 2.52%(3-Month Libor)/Quarterly | 2,921,451 | — | 2,921,451 | ||||||||||||||
|
|
|
|
|
| |||||||||||||||||
| $4,573,408 | $— | $4,573,408 | ||||||||||||||||||||
|
|
|
|
|
| |||||||||||||||||
| Liability Derivatives | ||||||||||||||||||||||
| Interest Rate Swaps | ||||||||||||||||||||||
| 4/11/29 | USD | 35,135,553 | centrally cleared | 2.58% (3-Month Libor)/Quarterly | 2.48%/ Semi-annually | $(1,697,643 | ) | $— | $(1,697,643 | ) | ||||||||||||
| 3/01/49 | USD | 15,600,000 | centrally cleared | 2.52%(3-Month Libor)/Quarterly | 2.84%/ Semi-annually | (2,348,466 | ) | — | (2,348,466 | ) | ||||||||||||
|
|
|
|
|
| |||||||||||||||||
| $(4,046,109 | ) | $— | $(4,046,109 | ) | ||||||||||||||||||
|
|
|
|
|
| |||||||||||||||||
Uncleared Swap Agreements
| Maturity Date | Notional Amount | Counterparty | Cash Flows to Receive/ Frequency | Cash Flows to Pay/ Frequency | Unrealized Appreciation (Depreciation) | Net Unamortized Upfront Payments (Receipts) | Value | |||||||||||||||||
| Asset Derivatives | ||||||||||||||||||||||||
| Credit Default Swaps | ||||||||||||||||||||||||
| 6/20/24 | EUR | 500,000 | JPMorgan Chase Bank N.A. | 5.00%/Quarterly | (1) | $2,160 | $100,188 | $102,348 | ||||||||||||||||
|
|
|
|
|
| |||||||||||||||||||
| (1) | Fund, as protection seller, to pay notional amount upon a defined credit event by Glencore PLC, 3.375%, 9/30/2020, a BBB rated bond. The fund entered into the contract to gain issuer exposure. |
19
Table of Contents
MFS Global Tactical Allocation Portfolio
Portfolio of Investments (unaudited) – continued
The credit ratings presented here are an indicator of the current payment/performance risk of the related swap agreement, the reference obligation for which may be either a single security or, in the case of a credit default index, a basket of securities issued by corporate or sovereign issuers. Ratings are assigned to each reference security, including each individual security within a reference basket of securities, utilizing ratings from Moody’s, Fitch, and Standard & Poor’s rating agencies and applying the following hierarchy: If all three agencies provide a rating, the middle rating (after dropping the highest and lowest ratings) is assigned; if two of the three agencies rate a security, the lower of the two is assigned. Ratings are shown in the S&P and Fitch scale (e.g., AAA). The ratings for a credit default index are calculated by MFS as a weighted average of the external credit ratings of the individual securities that compose the index’s reference basket of securities.
At June 30, 2019, the fund had cash collateral of $5,224,232 and other liquid securities with an aggregate value of $16,093,797 to cover any collateral or margin obligations for certain derivative contracts. Restricted cash and/or deposits with brokers in the Statement of Assets and Liabilities are comprised of cash collateral.
See Notes to Financial Statements
20
Table of Contents
MFS Global Tactical Allocation Portfolio
FINANCIAL STATEMENTS | STATEMENT OF ASSETS AND LIABILITIES (unaudited)
This statement represents your fund’s balance sheet, which details the assets and liabilities comprising the total value of the fund.
At 6/30/19 | ||||
Assets | ||||
Investments in unaffiliated issuers, at value (identified cost, $507,356,029) | $601,962,513 | |||
Investments in affiliated issuers, at value (identified cost, $5,380,642) | 5,381,448 | |||
Cash | 718,912 | |||
Foreign currency, at value (identified cost, $18,962) | 19,002 | |||
Restricted cash for | ||||
Forward foreign currency exchange contracts | 3,231,000 | |||
Deposits with brokers for | ||||
Futures contracts | 1,993,232 | |||
Receivables for | ||||
Net daily variation margin on open cleared swap agreements | 20,487 | |||
Forward foreign currency exchange contracts | 4,935,239 | |||
Net daily variation margin on open futures contracts | 287,430 | |||
Investments sold | 7,023,018 | |||
Interest and dividends | 3,748,240 | |||
Uncleared swaps, at value (net of unamortized premiums paid, $100,188) | 102,348 | |||
Other assets | 1,980 | |||
Total assets | $629,424,849 | |||
Liabilities | ||||
Payables for | ||||
Forward foreign currency exchange contracts | $7,582,009 | |||
Investments purchased | 4,763,313 | |||
Fund shares reacquired | 354,903 | |||
Written options | 21,708 | |||
Payable to affiliates | ||||
Investment adviser | 47,324 | |||
Administrative services fee | 1,016 | |||
Shareholder servicing costs | 61 | |||
Distribution and/or service fees | 15,563 | |||
Payable for independent Trustees’ compensation | 100 | |||
Deferred country tax expense payable | 7,403 | |||
Accrued expenses and other liabilities | 164,860 | |||
Total liabilities | $12,958,260 | |||
Net assets | $616,466,589 | |||
Net assets consist of | ||||
Paid-in capital | $490,929,770 | |||
Total distributable earnings (loss) | 125,536,819 | |||
Net assets | $616,466,589 | |||
Shares of beneficial interest outstanding | 39,185,717 | |||
| Net assets | Shares outstanding | Net asset value per share | ||||||||||
Initial Class | $47,064,024 | 2,939,918 | $16.01 | |||||||||
Service Class | 569,402,565 | 36,245,799 | 15.71 | |||||||||
See Notes to Financial Statements
21
Table of Contents
MFS Global Tactical Allocation Portfolio
FINANCIAL STATEMENTS | STATEMENT OF OPERATIONS (unaudited)
This statement describes how much your fund earned in investment income and accrued in expenses. It also describes any gains and/or losses generated by fund operations.
Six months ended 6/30/19 | ||||
Net investment income (loss) | ||||
Income | ||||
Interest | $4,983,487 | |||
Dividends | 4,274,125 | |||
Dividends from affiliated issuers | 214,008 | |||
Income on securities loaned | 22,237 | |||
Other | 2,182 | |||
Foreign taxes withheld | (312,555 | ) | ||
Total investment income | $9,183,484 | |||
Expenses | ||||
Management fee | $2,166,916 | |||
Distribution and/or service fees | 702,685 | |||
Shareholder servicing costs | 4,844 | |||
Administrative services fee | 47,952 | |||
Independent Trustees’ compensation | 10,013 | |||
Custodian fee | 56,602 | |||
Shareholder communications | 22,949 | |||
Audit and tax fees | 42,716 | |||
Legal fees | 2,769 | |||
Miscellaneous | 172,151 | |||
Total expenses | $3,229,597 | |||
Reduction of expenses by investment adviser | (29,451 | ) | ||
Net expenses | $3,200,146 | |||
Net investment income (loss) | $5,983,338 | |||
Realized and unrealized gain (loss) | ||||
Realized gain (loss) (identified cost basis) | ||||
Unaffiliated issuers (net of $864 country tax) | $7,230,152 | |||
Affiliated issuers | (135 | ) | ||
Written options | 74,879 | |||
Futures contracts | (4,330,547 | ) | ||
Swap agreements | (375,721 | ) | ||
Forward foreign currency exchange contracts | 1,252,439 | |||
Foreign currency | (437,368 | ) | ||
Net realized gain (loss) | $3,413,699 | |||
Change in unrealized appreciation or depreciation | ||||
Unaffiliated issuers (net of $16,802 decrease in deferred country tax) | $46,721,697 | |||
Affiliated issuers | 555 | |||
Written options | 60,920 | |||
Futures contracts | 202,513 | |||
Swap agreements | 529,459 | |||
Forward foreign currency exchange contracts | (157,385 | ) | ||
Translation of assets and liabilities in foreign currencies | 171,559 | |||
Net unrealized gain (loss) | $47,529,318 | |||
Net realized and unrealized gain (loss) | $50,943,017 | |||
Change in net assets from operations | $56,926,355 | |||
See Notes to Financial Statements
22
Table of Contents
MFS Global Tactical Allocation Portfolio
FINANCIAL STATEMENTS | STATEMENTS OF CHANGES IN NET ASSETS
These statements describe the increases and/or decreases in net assets resulting from operations, any distributions, and any shareholder transactions.
| Six months ended 6/30/19 | Year ended 12/31/18 | |||||||
| (unaudited) | ||||||||
Change in net assets | ||||||||
From operations | ||||||||
Net investment income (loss) | $5,983,338 | $11,065,268 | ||||||
Net realized gain (loss) | 3,413,699 | 23,197,631 | ||||||
Net unrealized gain (loss) | 47,529,318 | (66,871,760 | ) | |||||
Change in net assets from operations | $56,926,355 | $(32,608,861 | ) | |||||
Total distributions to shareholders | $— | $(33,921,546 | ) | |||||
Change in net assets from fund share transactions | $(47,454,448 | ) | $(89,026,534 | ) | ||||
Total change in net assets | $9,471,907 | $(155,556,941 | ) | |||||
Net assets | ||||||||
At beginning of period | 606,994,682 | 762,551,623 | ||||||
At end of period | $616,466,589 | $606,994,682 | ||||||
See Notes to Financial Statements
23
Table of Contents
MFS Global Tactical Allocation Portfolio
FINANCIAL STATEMENTS | FINANCIAL HIGHLIGHTS
The financial highlights table is intended to help you understand the fund’s financial performance for the semiannual period and the past 5 fiscal years. Certain information reflects financial results for a single fund share. The total returns in the table represent the rate that an investor would have earned (or lost) on an investment in the fund share class (assuming reinvestment of all distributions) held for the entire period.
| Initial Class | Six months 6/30/19 | Year ended | ||||||||||||||||||||||
| 12/31/18 | 12/31/17 | 12/31/16 | 12/31/15 | 12/31/14 | ||||||||||||||||||||
| (unaudited) | ||||||||||||||||||||||||
Net asset value, beginning of period | $14.58 | $16.11 | $15.04 | $14.92 | $16.43 | $16.20 | ||||||||||||||||||
| Income (loss) from investment operations | ||||||||||||||||||||||||
Net investment income (loss) (d) | $0.17 | $0.29 | $0.26 | $0.29 | (c) | $0.29 | $0.37 | |||||||||||||||||
Net realized and unrealized gain (loss) | 1.26 | (0.99 | ) | 1.36 | 0.67 | (0.66 | ) | 0.36 | ||||||||||||||||
Total from investment operations | $1.43 | $(0.70 | ) | $1.62 | $0.96 | $(0.37 | ) | $0.73 | ||||||||||||||||
| Less distributions declared to shareholders | ||||||||||||||||||||||||
From net investment income | $— | $(0.13 | ) | $(0.51 | ) | $— | $(0.87 | ) | $(0.48 | ) | ||||||||||||||
From net realized gain | — | (0.70 | ) | (0.04 | ) | (0.84 | ) | (0.27 | ) | (0.02 | ) | |||||||||||||
Total distributions declared to shareholders | $— | $(0.83 | ) | $(0.55 | ) | $(0.84 | ) | $(1.14 | ) | $(0.50 | ) | |||||||||||||
Net asset value, end of period (x) | $16.01 | $14.58 | $16.11 | $15.04 | $14.92 | $16.43 | ||||||||||||||||||
Total return (%) (k)(r)(s)(x) | 9.81 | (n) | (4.50 | ) | 10.83 | 6.24 | (c) | (2.23 | ) | 4.46 | ||||||||||||||
| Ratios (%) (to average net assets) and Supplemental data: | ||||||||||||||||||||||||
Expenses before expense reductions (f) | 0.83 | (a) | 0.81 | 0.81 | 0.79 | (c) | 0.76 | 0.76 | ||||||||||||||||
Expenses after expense reductions (f) | 0.82 | (a) | 0.80 | 0.80 | 0.78 | (c) | 0.75 | 0.75 | ||||||||||||||||
Net investment income (loss) | 2.19 | (a) | 1.83 | 1.64 | 1.88 | (c) | 1.80 | 2.23 | ||||||||||||||||
Portfolio turnover | 42 | (n) | 86 | 35 | 38 | 57 | 32 | |||||||||||||||||
Net assets at end of period (000 omitted) | $47,064 | $47,517 | $56,096 | $58,053 | $63,253 | $76,670 | ||||||||||||||||||
| Service Class | Six months 6/30/19 | Year ended | ||||||||||||||||||||||
| 12/31/18 | 12/31/17 | 12/31/16 | 12/31/15 | 12/31/14 | ||||||||||||||||||||
| (unaudited) | ||||||||||||||||||||||||
Net asset value, beginning of period | $14.32 | $15.84 | $14.79 | $14.72 | $16.22 | $15.99 | ||||||||||||||||||
| Income (loss) from investment operations | ||||||||||||||||||||||||
Net investment income (loss) (d) | $0.15 | $0.24 | $0.22 | $0.25 | (c) | $0.25 | $0.33 | |||||||||||||||||
Net realized and unrealized gain (loss) | 1.24 | (0.98 | ) | 1.34 | 0.66 | (0.66 | ) | 0.35 | ||||||||||||||||
Total from investment operations | $1.39 | $(0.74 | ) | $1.56 | $0.91 | $(0.41 | ) | $0.68 | ||||||||||||||||
| Less distributions declared to shareholders | ||||||||||||||||||||||||
From net investment income | $— | $(0.08 | ) | $(0.47 | ) | $— | $(0.82 | ) | $(0.43 | ) | ||||||||||||||
From net realized gain | — | (0.70 | ) | (0.04 | ) | (0.84 | ) | (0.27 | ) | (0.02 | ) | |||||||||||||
Total distributions declared to shareholders | $— | $(0.78 | ) | $(0.51 | ) | $(0.84 | ) | $(1.09 | ) | $(0.45 | ) | |||||||||||||
Net asset value, end of period (x) | $15.71 | $14.32 | $15.84 | $14.79 | $14.72 | $16.22 | ||||||||||||||||||
Total return (%) (k)(r)(s)(x) | 9.71 | (n) | (4.80 | ) | 10.58 | 5.98 | (c) | (2.49 | ) | 4.25 | ||||||||||||||
| Ratios (%) (to average net assets) and Supplemental data: | ||||||||||||||||||||||||
Expenses before expense reductions (f) | 1.08 | (a) | 1.06 | 1.06 | 1.04 | (c) | 1.01 | 1.01 | ||||||||||||||||
Expenses after expense reductions (f) | 1.07 | (a) | 1.05 | 1.05 | 1.03 | (c) | 1.00 | 1.00 | ||||||||||||||||
Net investment income (loss) | 1.94 | (a) | 1.58 | 1.39 | 1.63 | (c) | 1.55 | 2.00 | ||||||||||||||||
Portfolio turnover | 42 | (n) | 86 | 35 | 38 | 57 | 32 | |||||||||||||||||
Net assets at end of period (000 omitted) | $569,403 | $559,478 | $706,456 | $733,775 | $773,721 | $912,616 | ||||||||||||||||||
See Notes to Financial Statements
24
Table of Contents
MFS Global Tactical Allocation Portfolio
Financial Highlights – continued
| (a) | Annualized. |
| (c) | Amount reflects aone-time reimbursement of expenses by the custodian (or former custodian) without which net investment income and performance would be lower and expenses would be higher. |
| (d) | Per share data is based on average shares outstanding. |
| (f) | Ratios do not reflect reductions from fees paid indirectly, if applicable. |
| (k) | The total return does not reflect expenses that apply to separate accounts. Inclusion of these charges would reduce the total return figures for all periods shown. |
| (n) | Not annualized. |
| (r) | Certain expenses have been reduced without which performance would have been lower. |
| (s) | From time to time the fund may receive proceeds from litigation settlements, without which performance would be lower. |
| (x) | The net asset values and total returns have been calculated on net assets which include adjustments made in accordance with U.S. generally accepted accounting principles required at period end for financial reporting purposes. |
See Notes to Financial Statements
25
Table of Contents
MFS Global Tactical Allocation Portfolio
NOTES TO FINANCIAL STATEMENTS (unaudited)
| (1) | Business and Organization |
MFS Global Tactical Allocation Portfolio (the fund) is a diversified series of MFS Variable Insurance Trust II (the trust). The trust is organized as a Massachusetts business trust and is registered under the Investment Company Act of 1940, as amended, as anopen-end management investment company. The shareholders of each series of the trust are separate accounts of insurance companies, which offer variable annuity and/or life insurance products, and qualified retirement and pension plans.
The fund is an investment company and accordingly follows the investment company accounting and reporting guidance of the Financial Accounting Standards Board (FASB) Accounting Standards Codification Topic 946 Financial Services – Investment Companies.
| (2) | Significant Accounting Policies |
General– The preparation of financial statements in conformity with U.S. generally accepted accounting principles requires management to make estimates and assumptions that affect the reported amounts of assets and liabilities, and disclosure of contingent assets and liabilities at the date of the financial statements and the reported amounts of increases and decreases in net assets from operations during the reporting period. Actual results could differ from those estimates. In the preparation of these financial statements, management has evaluated subsequent events occurring after the date of the fund’s Statement of Assets and Liabilities through the date that the financial statements were issued. The fund invests in derivatives as part of its principal investment strategy. Derivatives can be highly volatile and involve risks in addition to the risks of the underlying indicators on which the derivative is based. Derivatives can involve leverage. The fund invests in foreign securities. Investments in foreign securities are vulnerable to the effects of changes in the relative values of the local currency and the U.S. dollar and to the effects of changes in each country’s market, economic, industrial, political, regulatory, geopolitical, and other conditions.
In March 2017, the FASB issued Accounting Standards Update2017-08, Receivables – Nonrefundable Fees and Other Costs (Subtopic310-20) – Premium Amortization on Purchased Callable Debt Securities (“ASU2017-08”). For callable debt securities purchased at a premium that have explicit,non-contingent call features and that are callable at fixed prices on preset dates,ASU 2017-08 requires the premium to be amortized to the earliest call date. The fund adopted ASU2017-08 as of the beginning of the reporting period on a modified retrospective basis. The adoption resulted in a change in accounting principle, since the fund had historically amortized such premiums to maturity for U.S. GAAP. As a result of the adoption, the fund recognized a cumulative effect adjustment that decreased the beginning of period cost of investments and increased the unrealized appreciation on investments by offsetting amounts. Adoption had no impact on the fund’s net assets or any prior period information presented in the financial statements. With respect to the fund’s results of operations, amortization of premium to first call date under ASU2017-08 accelerates amortization with the intent of more closely aligning the recognition of income on such bonds with the economics of the instrument.
Balance Sheet Offsetting– The fund’s accounting policy with respect to balance sheet offsetting is that, absent an event of default by the counterparty or a termination of the agreement, the International Swaps and Derivatives Association (ISDA) Master Agreement, or similar agreement, does not result in an offset of reported amounts of financial assets and financial liabilities in the Statement of Assets and Liabilities across transactions between the fund and the applicable counterparty. The fund’s right to setoff may be restricted or prohibited by the bankruptcy or insolvency laws of the particular jurisdiction to which a specific master netting agreement counterparty is subject. Balance sheet offsetting disclosures, to the extent applicable to the fund, have been included in the fund’s Significant Accounting Policies note under the captions for each of the fund’sin-scope financial instruments and transactions.
Investment Valuations– Equity securities, including restricted equity securities, are generally valued at the last sale or official closing price on their primary market or exchange as provided by a third-party pricing service. Equity securities, for which there were no sales reported that day, are generally valued at the last quoted daily bid quotation on their primary market or exchange as provided by a third-party pricing service. Debt instruments and floating rate loans, including restricted debt instruments, are generally valued at an evaluated or composite bid as provided by a third-party pricing service. Short-term instruments with a maturity at issuance of 60 days or less may be valued at amortized cost, which approximates market value. Exchange-traded options are generally valued at the last sale or official closing price on their primary exchange as provided by a third-party pricing service. Exchange-traded options for which there were no sales reported that day are generally valued at the last daily bid quotation on their primary exchange as provided by a third-party pricing service. Options not traded on an exchange are generally valued at a broker/dealer bid quotation. Foreign currency options are generally valued at valuations provided by a third-party pricing service. Futures contracts are generally valued at last posted settlement price on their primary exchange as provided by a third-party pricing service. Futures contracts for which there were no trades that day for a particular position are generally valued at the closing bid quotation on their primary exchange as provided by a third-party pricing service. Forward foreign currency exchange contracts are generally valued at the mean of bid and asked prices for the time period interpolated from rates provided by a third-party pricing service for proximate time periods. Swap agreements are generally valued at valuations provided by a third-party pricing service, which for cleared swaps includes an evaluation of any trading activity at the clearinghouses.Open-end investment companies are
26
Table of Contents
MFS Global Tactical Allocation Portfolio
Notes to Financial Statements (unaudited) – continued
generally valued at net asset value per share. Securities and other assets generally valued on the basis of information from a third-party pricing service may also be valued at a broker/dealer bid quotation. In determining values, third-party pricing services can utilize both transaction data and market information such as yield, quality, coupon rate, maturity, type of issue, trading characteristics, and other market data. The values of foreign securities and other assets and liabilities expressed in foreign currencies are converted to U.S. dollars using the mean of bid and asked prices for rates provided by a third-party pricing service.
The Board of Trustees has delegated primary responsibility for determining or causing to be determined the value of the fund’s investments (including any fair valuation) to the adviser pursuant to valuation policies and procedures approved by the Board. If the adviser determines that reliable market quotations are not readily available, investments are valued at fair value as determined in good faith by the adviser in accordance with such procedures under the oversight of the Board of Trustees. Under the fund’s valuation policies and procedures, market quotations are not considered to be readily available for most types of debt instruments and floating rate loans and many types of derivatives. These investments are generally valued at fair value based on information from third-party pricing services. In addition, investments may be valued at fair value if the adviser determines that an investment’s value has been materially affected by events occurring after the close of the exchange or market on which the investment is principally traded (such as foreign exchange or market) and prior to the determination of the fund’s net asset value, or after the halt of trading of a specific security where trading does not resume prior to the close of the exchange or market on which the security is principally traded. Events that occur after foreign markets close (such as developments in foreign markets and significant movements in the U.S. markets) and prior to the determination of the fund’s net asset value may be deemed to have a material effect on the value of securities traded in foreign markets. Accordingly, the fund’s foreign equity securities may often be valued at fair value. The adviser generally relies on third-party pricing services or other information (such as the correlation with price movements of similar securities in the same or other markets; the type, cost and investment characteristics of the security; the business and financial condition of the issuer; and trading and other market data) to assist in determining whether to fair value and at what value to fair value an investment. The value of an investment for purposes of calculating the fund’s net asset value can differ depending on the source and method used to determine value. When fair valuation is used, the value of an investment used to determine the fund’s net asset value may differ from quoted or published prices for the same investment. There can be no assurance that the fund could obtain the fair value assigned to an investment if it were to sell the investment at the same time at which the fund determines its net asset value per share.
Various inputs are used in determining the value of the fund’s assets or liabilities. These inputs are categorized into three broad levels. In certain cases, the inputs used to measure fair value may fall into different levels of the fair value hierarchy. In such cases, an investment’s level within the fair value hierarchy is based on the lowest level of input that is significant to the fair value measurement. The fund’s assessment of the significance of a particular input to the fair value measurement in its entirety requires judgment, and considers factors specific to the investment. Level 1 includes unadjusted quoted prices in active markets for identical assets or liabilities. Level 2 includes other significant observable market-based inputs (including quoted prices for similar securities, interest rates, prepayment speed, and credit risk). Level 3 includes unobservable inputs, which may include the adviser’s own
27
Table of Contents
MFS Global Tactical Allocation Portfolio
Notes to Financial Statements (unaudited) – continued
assumptions in determining the fair value of investments. Other financial instruments are derivative instruments, such as futures contracts, forward foreign currency exchange contracts, swap agreements, and written options. The following is a summary of the levels used as of June 30, 2019 in valuing the fund’s assets or liabilities:
| Financial Instruments | Level 1 | Level 2 | Level 3 | Total | ||||||||||||
| Equity Securities: | ||||||||||||||||
United States | $119,629,188 | $— | $— | $119,629,188 | ||||||||||||
Switzerland | 20,670,579 | — | — | 20,670,579 | ||||||||||||
Japan | 17,515,860 | — | — | 17,515,860 | ||||||||||||
United Kingdom | 14,291,688 | — | — | 14,291,688 | ||||||||||||
France | 11,175,829 | — | — | 11,175,829 | ||||||||||||
Canada | 9,349,130 | — | — | 9,349,130 | ||||||||||||
Germany | 5,765,405 | — | — | 5,765,405 | ||||||||||||
Taiwan | 4,685,868 | — | — | 4,685,868 | ||||||||||||
Netherlands | 3,684,320 | — | — | 3,684,320 | ||||||||||||
Other Countries | 14,759,327 | 1,259,027 | — | 16,018,354 | ||||||||||||
| U.S. Treasury Bonds & U.S. Government Agency & Equivalents | — | 67,821,195 | — | 67,821,195 | ||||||||||||
| Non-U.S. Sovereign Debt | — | 147,680,440 | — | 147,680,440 | ||||||||||||
| Municipal Bonds | — | 959,191 | — | 959,191 | ||||||||||||
| U.S. Corporate Bonds | — | 56,526,909 | — | 56,526,909 | ||||||||||||
| Residential Mortgage-Backed Securities | — | 31,688,076 | — | 31,688,076 | ||||||||||||
| Commercial Mortgage-Backed Securities | — | 7,150,141 | — | 7,150,141 | ||||||||||||
| Asset-Backed Securities (including CDOs) | — | 9,452,229 | — | 9,452,229 | ||||||||||||
| Foreign Bonds | — | 57,898,111 | — | 57,898,111 | ||||||||||||
| Mutual Funds | 5,381,448 | — | — | 5,381,448 | ||||||||||||
| Total | $226,908,642 | $380,435,319 | $— | $607,343,961 | ||||||||||||
| Other Financial Instruments | ||||||||||||||||
| Futures Contracts – Assets | $2,620,640 | $— | $— | $2,620,640 | ||||||||||||
| Futures Contracts – Liabilities | (3,849,927 | ) | — | — | (3,849,927 | ) | ||||||||||
| Forward Foreign Currency Exchange Contracts – Assets | — | 4,935,239 | — | 4,935,239 | ||||||||||||
| Forward Foreign Currency Exchange Contracts – Liabilities | — | (7,582,009 | ) | — | (7,582,009 | ) | ||||||||||
| Swap Agreements – Assets | — | 4,675,757 | — | 4,675,757 | ||||||||||||
| Swap Agreements – Liabilities | — | (4,046,109 | ) | — | (4,046,109 | ) | ||||||||||
| Written Options – Liabilities | — | (21,708 | ) | — | (21,708 | ) | ||||||||||
For further information regarding security characteristics, see the Portfolio of Investments.
Inflation-Adjusted Debt Securities– The fund invests in inflation-adjusted debt securities issued by the U.S. Treasury. The principal value of these debt securities is adjusted through income according to changes in the Consumer Price Index. These debt securities typically pay a fixed rate of interest, but this fixed rate is applied to the inflation-adjusted principal amount. The principal paid at maturity of the debt security is typically equal to the inflation-adjusted principal amount, or the security’s original par value, whichever is greater. Other types of inflation-adjusted securities may use other methods to adjust for other measures of inflation.
Foreign Currency Translation– Purchases and sales of foreign investments, income, and expenses are converted into U.S. dollars based upon currency exchange rates prevailing on the respective dates of such transactions or on the reporting date for foreign denominated receivables and payables. Gains and losses attributable to foreign currency exchange rates on sales of securities are recorded for financial statement purposes as net realized gains and losses on investments. Gains and losses attributable to foreign exchange rate movements on receivables, payables, income and expenses are recorded for financial statement purposes as foreign currency transaction gains and losses. That portion of both realized and unrealized gains and losses on investments that results from fluctuations in foreign currency exchange rates is not separately disclosed.
Derivatives– The fund uses derivatives in an attempt to adjust exposure to markets, asset classes, and currencies based on the adviser’s assessment of the relative attractiveness of such markets, asset classes, and currencies. Derivatives are used to increase or decrease the fund’s exposure to markets, asset classes, or currencies resulting from the fund’s individual security selections, and to expose the fund to markets, asset classes, or currencies in which the fund’s individual security selection has resulted in little or no exposure. Derivatives are used for hedging ornon-hedging purposes. While hedging can reduce or eliminate losses, it can also reduce or eliminate gains. When the fund uses derivatives as an investment to increase or decrease market exposure, or for hedging purposes, gains and losses from derivative instruments may be substantially greater than the derivative’s original cost.
28
Table of Contents
MFS Global Tactical Allocation Portfolio
Notes to Financial Statements (unaudited) – continued
The derivative instruments used by the fund during the period were written options, purchased options, futures contracts, forward foreign currency exchange contracts, and swap agreements. Depending on the type of derivative, the fund may exit a derivative position by entering into an offsetting transaction with a counterparty or exchange, negotiating an agreement with the derivative counterparty, or novating the position to a third party. The fund may be unable to promptly close out a futures position in instances where the daily fluctuation in the price for that type of future exceeds the daily limit set by the exchange. The fund’s period end derivatives, as presented in the Portfolio of Investments and the associated Derivative Contract tables, generally are indicative of the volume of its derivative activity during the period.
The following table presents, by major type of derivative contract, the fair value, on a gross basis, of the asset and liability components of derivatives held by the fund at June 30, 2019 as reported in the Statement of Assets and Liabilities:
| Fair Value (a) | ||||||||||
| Risk | Derivative Contracts | Asset Derivatives | Liability Derivatives | |||||||
| Interest Rate | Interest Rate Futures | $912,732 | $(2,363,638 | ) | ||||||
| Equity | Equity Futures | 1,707,908 | (1,486,289 | ) | ||||||
| Equity | Purchased Equity Options | 96,000 | — | |||||||
| Credit | Purchased Credit Options | 31,584 | — | |||||||
| Foreign Exchange | Forward Foreign Currency Exchange Contracts | 4,935,239 | (7,582,009 | ) | ||||||
| Interest Rate | Interest Rate Swaps | 4,573,409 | (4,046,109 | ) | ||||||
| Credit | Credit Default Swaps | 102,348 | — | |||||||
| Credit | Written Credit Options | — | (21,708 | ) | ||||||
| Total | $12,359,220 | $(15,499,753 | ) | |||||||
| (a) | The value of purchased options outstanding is included in investments in unaffiliated issuers, at value, within the fund’s Statement of Assets and Liabilities. Values presented in this table for futures contracts and cleared swap agreements correspond to the values reported in the fund’s Portfolio of Investments. Only the current day net variation margin for futures contracts and cleared swap agreements is separately reported within the fund’s Statement of Assets and Liabilities. |
The following table presents, by major type of derivative contract, the realized gain (loss) on derivatives held by the fund for the six months ended June 30, 2019 as reported in the Statement of Operations:
| Risk | Futures Contracts | Swap Agreements | Forward Foreign Currency Exchange Contracts | Unaffiliated Issuers (Purchased Options) | Written Options | |||||||||||||||
| Interest Rate | $(6,616,773 | ) | $(378,728 | ) | $— | $— | $— | |||||||||||||
| Foreign Exchange | — | — | 1,252,439 | — | — | |||||||||||||||
| Equity | 2,286,226 | — | — | (21,714 | ) | — | ||||||||||||||
| Credit | — | 3,007 | — | (38,947 | ) | 74,879 | ||||||||||||||
| Total | $(4,330,547 | ) | $(375,721 | ) | $1,252,439 | $(60,661 | ) | $74,879 | ||||||||||||
The following table presents, by major type of derivative contract, the change in unrealized appreciation or depreciation on derivatives held by the fund for the six months ended June 30, 2019 as reported in the Statement of Operations:
| Risk | Futures Contracts | Swap Agreements | Forward Foreign Currency Exchange Contracts | Unaffiliated Issuers (Purchased Options) | Written Options | |||||||||||||||
| Interest Rate | $240,085 | $527,299 | $— | $— | $— | |||||||||||||||
| Foreign Exchange | — | — | (157,385 | ) | — | — | ||||||||||||||
| Equity | (37,572 | ) | — | — | (392,442 | ) | — | |||||||||||||
| Credit | — | 2,160 | — | (155,708 | ) | 60,920 | ||||||||||||||
| Total | $202,513 | $529,459 | $(157,385 | ) | $(548,150 | ) | $60,920 | |||||||||||||
Derivative counterparty credit risk is managed through formal evaluation of the creditworthiness of all potential counterparties. On certain, but not all, uncleared derivatives, the fund attempts to reduce its exposure to counterparty credit risk whenever possible by entering into an ISDA Master Agreement on a bilateral basis. The ISDA Master Agreement gives each party to the agreement the right to terminate all transactions traded under such agreement if there is a specified deterioration in the credit quality of the other party. Upon an event of default or a termination of the ISDA Master Agreement, thenon-defaulting party has the right to close out all transactions traded under such agreement and to net amounts owed under each agreement to one net amount payable by one party to the other. This right to close out and net payments across all transactions traded under the ISDA Master Agreement could result in a reduction of the fund’s credit risk to such counterparty equal to any amounts payable by the fund under the applicable transactions, if any.
29
Table of Contents
MFS Global Tactical Allocation Portfolio
Notes to Financial Statements (unaudited) – continued
Collateral and margin requirements differ by type of derivative. For cleared derivatives (e.g., futures contracts, cleared swaps, and exchange-traded options), margin requirements are set by the clearing broker and the clearing house and collateral, in the form of cash or securities, is posted by the fund directly with the clearing broker. Collateral terms are counterparty agreement specific for uncleared derivatives (e.g., forward foreign currency exchange contracts, uncleared swap agreements, and uncleared options) and collateral, in the form of cash and securities, is held in segregated accounts with the fund’s custodian in connection with these agreements. For derivatives traded under an ISDA Master Agreement, which contains a collateral support annex, the collateral requirements are netted across all transactions traded under such counterparty-specific agreement and an amount is posted from one party to the other to collateralize such obligations. Cash that has been segregated or delivered to cover the fund’s collateral or margin obligations under derivative contracts, if any, will be reported separately in the Statement of Assets and Liabilities as restricted cash for uncleared derivatives and/or deposits with brokers for cleared derivatives. Securities pledged as collateral or margin for the same purpose, if any, are noted in the Portfolio of Investments. The fund may be required to make payments of interest on uncovered collateral or margin obligations with the broker. Any such payments are included in “Miscellaneous” expense in the Statement of Operations.
The following table presents the fund’s derivative assets and liabilities (by type) on a gross basis as of June 30, 2019:
| Gross Amounts of: | Derivative Assets | Derivative Liabilities | ||||||
| Future Contracts (a) | $287,430 | $— | ||||||
| Swaps, at value | 102,348 | — | ||||||
| Cleared Swaps Agreements (a) | 20,487 | — | ||||||
| Forward Foreign Currency Exchange Contracts | 4,935,239 | (7,582,009 | ) | |||||
| Purchased Options | 127,584 | — | ||||||
| Written Options | — | (21,708 | ) | |||||
| Total Gross Amount of Derivative Assets and Liabilities Presented in the Statement of Assets & Liabilities | $5,473,088 | $(7,603,717 | ) | |||||
Less: Derivatives Assets and Liabilities Not Subject to a Master Netting Agreement or Similar Arrangement | 1,564,459 | (195,807 | ) | |||||
| Total Gross Amount of Derivative Assets and Liabilities Subject to a Master Netting Agreement or Similar Arrangement | $3,908,629 | $(7,407,910 | ) | |||||
| (a) | The amount presented here represents the fund’s current day net variation margin for futures contracts and for cleared swaps agreements. This amount, which is recognized within the fund’s Statement of Assets and Liabilities, differs from the fair value of the futures contracts and cleared swap agreements which is presented in the tables that follow the fund’s Portfolio of Investments. |
The following table presents (by counterparty) the fund’s derivative assets net of amounts available for offset under Master Netting Agreements (or similar arrangements) and net of the related collateral held by the fund at June 30, 2019:
| Amounts Not Offset in the Statement of Assets & Liabilities | ||||||||||||||||||||
| Gross Amount of Derivative Assets Subject to a Master Netting Agreement (or Similar Arrangement) by Counterparty | Financial Instruments Available for Offset | Financial Instruments Collateral Received (b) | Cash Collateral Received (b) | Net Amount of Derivative Assets by Counterparty | ||||||||||||||||
| BNP Paribas S.A. | $42,468 | $— | $— | $— | $42,468 | |||||||||||||||
| Brown Brothers Harriman | 7,218 | (6,841 | ) | — | — | 377 | ||||||||||||||
| Citibank N.A. | 131,916 | (124,189 | ) | — | — | 7,727 | ||||||||||||||
| Deutsche Bank AG | 212,671 | (212,671 | ) | — | — | — | ||||||||||||||
| Goldman Sachs International | 1,496,585 | (1,496,585 | ) | — | — | — | ||||||||||||||
| JPMorgan Chase Bank N.A. | 1,969,992 | (1,969,992 | ) | — | — | — | ||||||||||||||
| Merrill Lynch International | 41,002 | (18,017 | ) | — | — | 22,985 | ||||||||||||||
| Morgan Stanley Capital Services, Inc. | 6,777 | — | — | — | 6,777 | |||||||||||||||
| Total | $3,908,629 | $(3,828,295 | ) | $— | $— | $80,334 | ||||||||||||||
30
Table of Contents
MFS Global Tactical Allocation Portfolio
Notes to Financial Statements (unaudited) – continued
The following table presents (by counterparty) the fund’s derivative liabilities net of amounts available for offset under Master Netting Agreements (or similar arrangements) and net of the related collateral pledged by the fund at June 30, 2019:
| Amounts Not Offset in the Statement of Assets & Liabilities | ||||||||||||||||||||
| Gross Amounts of Derivative Liabilities Subject to a Master Netting Agreement (or Similar Arrangement) by Counterparty | Financial Instruments Available for Offset | Financial Instruments Collateral Pledged (b) | Cash Collateral Pledged (b) | Net Amount of Derivative Liabilities by Counterparty | ||||||||||||||||
| Brown Brothers Harriman | $(6,841 | ) | $6,841 | $— | $— | $— | ||||||||||||||
| Citibank N.A. | (124,189 | ) | 124,189 | — | — | — | ||||||||||||||
| Deutsche Bank AG | (358,171 | ) | 212,671 | — | — | (145,500 | ) | |||||||||||||
| Goldman Sachs International | (2,534,619 | ) | 1,496,585 | — | 980,000 | (58,034 | ) | |||||||||||||
| JPMorgan Chase Bank N.A. | (4,366,073 | ) | 1,969,992 | — | 2,251,000 | (145,081 | ) | |||||||||||||
| Merrill Lynch International | (18,017 | ) | 18,017 | — | — | — | ||||||||||||||
| Total | $(7,407,910 | ) | $3,828,295 | $— | $3,231,000 | $(348,615 | ) | |||||||||||||
| (b) | The amount presented here may be less than the total amount of collateral (received)/pledged as the excess collateral (received)/pledged is not shown for purposes of this presentation. |
Written Options– In exchange for a premium, the fund wrote put options on securities for which it anticipated the price would increase. At the time the option was written, the fund believed the premium received exceeded the potential loss that could result from adverse price changes in the options’ underlying securities. In a written option, the fund as the option writer grants the buyer the right to purchase from, or sell to, the fund a specified number of shares or units of a particular security, currency or index at a specified price within a specified period of time.
The premium received is initially recorded as a liability in the Statement of Assets and Liabilities. The option is subsequentlymarked-to-market daily with the difference between the premium received and the market value of the written option being recorded as unrealized appreciation or depreciation. When a written option expires, the fund realizes a gain equal to the amount of the premium received. The difference between the premium received and the amount paid on effecting a closing transaction is considered a realized gain or loss. When a written put option is exercised, the premium reduces the cost basis of the security purchased by the fund.
At the initiation of the written option contract, for exchange traded options, the fund is required to deposit securities or cash as collateral with the custodian for the benefit of the broker or directly with the clearing broker, based on the type of option. For uncleared options, the fund may post collateral subject to the terms of an ISDA Master Agreement as generally described above if the market value of the options contract moves against it. The fund, as writer of an option, may have no control over whether the underlying securities may be sold (call) or purchased (put) and, as a result, bears the market risk of an unfavorable change in the price of the securities underlying the written option. Losses from writing options can exceed the premium received and can exceed the potential loss from an ordinary buy and sell transaction. Although the fund’s market risk may be significant, the maximum counterparty credit risk to the fund is equal to the market value of any collateral posted to the broker. For uncleared options, this risk is mitigated in cases where there is an ISDA Master Agreement between the fund and the counterparty providing for netting as described above.
Purchased Options– The fund purchased put options for a premium. Purchased put options entitle the holder to sell a specified number of shares or units of a particular security, currency or index at a specified price at a specified date or within a specified period of time. Purchasing put options may hedge against an anticipated decline in the value of portfolio securities or currency or decrease the fund’s exposure to an underlying instrument.
The premium paid is initially recorded as an investment in the Statement of Assets and Liabilities. That investment is subsequentlymarked-to-market daily with the difference between the premium paid and the market value of the purchased option being recorded as unrealized appreciation or depreciation. Premiums paid for purchased put options which have expired are treated as realized losses on investments in the Statement of Operations. Upon the exercise or closing of a purchased put option, the premium paid is offset against the proceeds on the sale of the underlying security or financial instrument in order to determine the realized gain or loss on investments.
Whether or not the option is exercised, the fund’s maximum risk of loss from purchasing an option is the amount of premium paid. All option contracts involve credit risk if the counterparty to the option contract fails to perform. For uncleared options, this risk is mitigated in cases where there is an ISDA Master Agreement between the fund and the counterparty providing for netting as described above and, where applicable, by the posting of collateral by the counterparty to the fund to cover the fund’s exposure to the counterparty under such ISDA Master Agreement.
31
Table of Contents
MFS Global Tactical Allocation Portfolio
Notes to Financial Statements (unaudited) – continued
Futures Contracts– The fund entered into futures contracts which may be used to hedge against or obtain broad market exposure, interest rate exposure, currency exposure, or to manage duration. A futures contract represents a commitment for the future purchase or sale of an asset at a specified price on a specified date.
Upon entering into a futures contract, the fund is required to deposit with the broker, either in cash or securities, an initial margin in an amount equal to a specified percentage of the notional amount of the contract. Subsequent payments (variation margin) are made or received by the fund each day, depending on the daily fluctuations in the value of the contract, and are recorded for financial statement purposes as unrealized gain or loss by the fund until the contract is closed or expires at which point the gain or loss on futures contracts is realized.
The fund bears the risk of interest rates, exchange rates or securities prices moving unexpectedly, in which case, the fund may not achieve the anticipated benefits of the futures contracts and may realize a loss. While futures contracts may present less counterparty risk to the fund since the contracts are exchange traded and the exchange’s clearinghouse guarantees payments to the broker, there is still counterparty credit risk due to the insolvency of the broker. The fund’s maximum risk of loss due to counterparty credit risk is equal to the margin posted by the fund to the broker plus any gains or minus any losses on the outstanding futures contracts.
Forward Foreign Currency Exchange Contracts– The fund entered into forward foreign currency exchange contracts for the purchase or sale of a specific foreign currency at a fixed price on a future date. These contracts may be used to hedge the fund’s currency risk or fornon-hedging purposes. For hedging purposes, the fund may enter into contracts to deliver or receive foreign currency that the fund will receive from or use in its normal investment activities. The fund may also use contracts to hedge against declines in the value of foreign currency denominated securities due to unfavorable exchange rate movements. Fornon-hedging purposes, the fund may enter into contracts with the intent of changing the relative exposure of the fund’s portfolio of securities to different currencies to take advantage of anticipated exchange rate changes.
Forward foreign currency exchange contracts are adjusted by the daily exchange rate of the underlying currency and any unrealized gains or losses are recorded as a receivable or payable for forward foreign currency exchange contracts until the contract settlement date. On contract settlement date, any gain or loss on the contract is recorded as realized gains or losses on forward foreign currency exchange contracts.
Risks may arise upon entering into these contracts from unanticipated movements in the value of the contract and from the potential inability of counterparties to meet the terms of their contracts. Generally, the fund’s maximum risk due to counterparty credit risk is the unrealized gain on the contract due to the use of Continuous Linked Settlement, a multicurrency cash settlement system for the centralized settlement of foreign transactions. This risk is mitigated in cases where there is an ISDA Master Agreement between the fund and the counterparty providing for netting as described above and, where applicable, by the posting of collateral by the counterparty to the fund to cover the fund’s exposure to the counterparty under such ISDA Master Agreement.
Swap Agreements– During the period the fund entered into swap agreements. Swap agreements generally involve a periodic exchange of cash payments on a net basis, at specified intervals or upon the occurrence of specified events, between the fund and a counterparty. Certain swap agreements may be entered into as a bilateral contract (“uncleared swaps”) while others are required to be centrally cleared (“cleared swaps”). In a cleared swap transaction, the ultimate counterparty to the transaction is a clearinghouse (the “clearinghouse”). The contract is transferred and accepted by the clearinghouse immediately following execution of the swap contract with an executing broker. Thereafter, throughout the term of the cleared swap, the fund interfaces indirectly with the clearinghouse through a clearing broker and has counterparty risk to the clearing broker as well.
Both cleared and uncleared swap agreements are marked to market daily. The value of uncleared swap agreements is reported in the Statement of Assets and Liabilities as “Uncleared swaps, at value” which includes any related interest accruals to be paid or received by the fund. For cleared swaps, payments (variation margin) are made or received by the fund each day, depending on the daily fluctuations in the value of the cleared swap, such that only the current day net receivable or payable for variation margin is reported in the Statement of Assets and Liabilities.
For both cleared and uncleared swaps, the periodic exchange of net cash payments, at specified intervals or upon the occurrence of specified events as stipulated by the agreement, is recorded as realized gain or loss on swap agreements in the Statement of Operations. Premiums paid or received at the inception of the agreements are amortized using the effective interest method over the term of the agreement as realized gain or loss on swap agreements in the Statement of Operations. A liquidation payment received or made upon early termination is recorded as a realized gain or loss on swap agreements in the Statement of Operations. The change in unrealized appreciation or depreciation on swap agreements in the Statement of Operations reflects the aggregate change over the reporting period in the value of swaps net of any unamortized premiums paid or received.
Risks related to swap agreements include the possible lack of a liquid market, unfavorable market and interest rate movements of the underlying instrument and the failure of the counterparty to perform under the terms of the agreements. The fund’s maximum risk of loss from counterparty credit risk is the discounted net value of the cash flows to be received from/paid to the counterparty over the contract’s remaining life, to the extent that the amount is positive. To address counterparty risk, uncleared swap
32
Table of Contents
MFS Global Tactical Allocation Portfolio
Notes to Financial Statements (unaudited) – continued
agreements are limited to only highly-rated counterparties. Risk is further reduced by having an ISDA Master Agreement between the fund and the counterparty providing for netting as described above and, where applicable, by the posting of collateral by the counterparty to the fund to cover the fund’s exposure to the counterparty under such ISDA Master Agreement. The fund’s counterparty risk due to cleared swaps is mitigated by the fact that the clearinghouse is the true counterparty to the transaction and the regulatory requirement safeguards in the event of a clearing broker bankruptcy.
The fund entered into interest rate swap agreements in order to manage its exposure to interest or foreign exchange rate fluctuations. Interest rate swap agreements involve the periodic exchange of cash flows, between the fund and a counterparty, based on the difference between two interest rates applied to a notional principal amount. The two interest rates exchanged may either be a fixed rate and a floating rate or two floating rates based on different indices.
The fund entered into credit default swap agreements in order to manage its exposure to the market or certain sectors of the market, to reduce its credit risk exposure to defaults of corporate and sovereign issuers or to create exposure to corporate or sovereign issuers to which it is not otherwise exposed. In a credit default swap agreement, the protection buyer can make an upfront payment and will make a stream of payments to the protection seller based on a fixed percentage applied to the agreement notional amount in exchange for the right to receive a specified return upon the occurrence of a defined credit event on the reference obligation (which may be either a single security or a basket of securities issued by corporate or sovereign issuers) and, with respect to the cases where physical settlement applies, the delivery by the buyer to the seller of a defined deliverable obligation. Although agreement-specific, credit events generally consist of a combination of the following: bankruptcy, failure to pay, restructuring, obligation acceleration, obligation default, or repudiation/moratorium, each as defined in the 2003 ISDA Credit Derivatives Definitions as amended by the relevant agreement. Restructuring is generally not applicable when the reference obligation is issued by a North American corporation and obligation acceleration, obligation default, or repudiation/moratorium are generally only applicable when the reference obligation is issued by a sovereign entity or an entity in an emerging country. Upon determination of the final price for the deliverable obligation (or upon delivery of the deliverable obligation in the case of physical settlement), the difference between the value of the deliverable obligation and the swap agreement’s notional amount is recorded as realized gain or loss on swap agreements in the Statement of Operations.
Credit default swap agreements are considered to have credit-risk-related contingent features since they trigger payment by the protection seller to the protection buyer upon the occurrence of a defined credit event. The maximum amount of future, undiscounted payments that the fund, as protection seller, could be required to make is equal to the swap agreement’s notional amount. The protection seller’s payment obligation would be offset to the extent of the value of the agreement’s deliverable obligation. At June 30, 2019, the fund did not hold any credit default swap agreements at an unrealized loss where it is the protection seller. The fund’s maximum risk of loss from counterparty risk, either as the protection seller or as the protection buyer, is the fair value of the agreement.
Security Loans– Under its Securities Lending Agency Agreement with the fund, State Street Bank and Trust Company, as lending agent, loans the securities of the fund to certain qualified institutions (the “Borrowers”) approved by the fund. Security loans can be terminated at the discretion of either the lending agent or the fund and the related securities must be returned within the earlier of the standard trade settlement period for such securities or within three business days. The loans are collateralized by cash and/or U.S. Treasury and federal agency obligations in an amount typically at least equal to the market value of the securities loaned. On loans collateralized by cash, the cash collateral is invested in a money market fund. The market value of the loaned securities is determined at the close of business of the fund and any additional required collateral is delivered to the fund on the next business day. The lending agent provides the fund with indemnification against Borrower default. In the event of Borrower default, the lending agent will, for the benefit of the fund, either purchase securities identical to those loaned or, when such purchase is commercially impracticable, pay the fund the market value of the loaned securities. In return, the lending agent assumes the fund’s rights to the related collateral. If the collateral value is less than the cost to purchase identical securities, the lending agent is responsible for the shortfall, but only to the extent that such shortfall is not due to a decline in collateral value resulting from collateral reinvestment for which the fund bears the risk of loss. A portion of the income generated upon investment of the collateral is remitted to the Borrowers, and the remainder is allocated between the fund and the lending agent. On loans collateralized by U.S. Treasury and/or federal agency obligations, a fee is received from the Borrower, and is allocated between the fund and the lending agent. Income from securities lending is separately reported in the Statement of Operations. The dividend and interest income earned on the securities loaned is accounted for in the same manner as other dividend and interest income. At June 30, 2019, there were no securities on loan or collateral outstanding.
Indemnifications– Under the fund’s organizational documents, its officers and Trustees may be indemnified against certain liabilities and expenses arising out of the performance of their duties to the fund. Additionally, in the normal course of business, the fund enters into agreements with service providers that may contain indemnification clauses. The fund’s maximum exposure under these agreements is unknown as this would involve future claims that may be made against the fund that have not yet occurred.
33
Table of Contents
MFS Global Tactical Allocation Portfolio
Notes to Financial Statements (unaudited) – continued
Investment Transactions and Income– Investment transactions are recorded on the trade date. Interest income is recorded on the accrual basis. All premium and discount is amortized or accreted for financial statement purposes in accordance with U.S. generally accepted accounting principles. Inflation-indexed bonds are fixed-income securities whose principal value is periodically adjusted upward or downward based on the rate of inflation. Interest is accrued based on the principal value, which is adjusted for inflation. Any increase or decrease in the principal amount of an inflation-indexed bond is generally recorded as an increase or decrease in interest income, respectively, even though the adjusted principal is not received until maturity. Dividends received in cash are recorded on theex-dividend date. Certain dividends from foreign securities will be recorded when the fund is informed of the dividend if such information is obtained subsequent to theex-dividend date. Dividend and interest payments received in additional securities are recorded on theex-dividend orex-interest date in an amount equal to the value of the security on such date.
The fund may receive proceeds from litigation settlements. Any proceeds received from litigation involving portfolio holdings are reflected in the Statement of Operations in realized gain/loss if the security has been disposed of by the fund or in unrealized gain/loss if the security is still held by the fund. Any other proceeds from litigation not related to portfolio holdings are reflected as other income in the Statement of Operations.
The fund invests a significant portion of its assets in asset-backed and/or mortgage-backed securities. For these securities, the value of the debt instrument also depends on the credit quality and adequacy of the underlying assets or collateral as well as whether there is a security interest in the underlying assets or collateral. Enforcing rights, if any, against the underlying assets or collateral may be difficult. U.S. Government securities not supported as to the payment of principal or interest by the U.S. Treasury, such as those issued by Fannie Mae, Freddie Mac, and the Federal Home Loan Banks, are subject to greater credit risk than are U.S. Government securities supported by the U.S. Treasury, such as those issued by Ginnie Mae.
The fund purchased or sold debt securities on a when-issued or delayed delivery basis, or in a “To Be Announced” (TBA) or “forward commitment” transaction with delivery or payment to occur at a later date beyond the normal settlement period. When the fund sells securities on a when-issued, delayed delivery, or forward commitment basis, the fund typically owns or has the right to acquire securities equivalent in kind and amount to the delivered securities. At the time a fund enters into a commitment to purchase or sell a security, the transaction is recorded and the value of the security acquired is reflected in the fund’s net asset value. The price of such security and the date that the security will be delivered and paid for are fixed at the time the transaction is negotiated. The value of the security may vary with market fluctuations. No interest accrues to the fund until payment takes place. At the time that a fund enters into this type of transaction, the fund is required to have sufficient cash and/or liquid securities to cover its commitments. Losses may arise due to changes in the value of the underlying securities prior to settlement date or if the counterparty does not perform under the contract’s terms, or if the issuer does not issue the securities due to political, economic or other factors.
To mitigate the counterparty credit risk on TBA securities and other types of forward settling mortgage-backed securities, the fund whenever possible enters into a Master Securities Forward Transaction Agreement (“MSFTA”) on a bilateral basis with each of the counterparties with whom it undertakes a significant volume of transactions. The MSFTA gives each party to the agreement the right to terminate all transactions traded under such agreement if there is a specified deterioration in the credit quality of the other party. Upon an event of default or a termination of the MSFTA, thenon-defaulting party has the right to close out all transactions traded under such agreement and to net amounts owed under each transaction to one net amount payable by one party to the other. This right to close out and net payments across all transactions traded under the MSFTA could result in a reduction of the fund’s credit risk to such counterparty equal to any amounts payable by the fund under the applicable transactions, if any.
For mortgage-backed securities traded under a MSFTA, the collateral and margining requirements are contract specific. Collateral amounts across all transactions traded under such agreement are netted and an amount is posted from one party to the other to collateralize such obligations. Cash that has been pledged to cover the fund’s collateral or margin obligations under a MSFTA, if any, will be reported separately on the Statement of Assets and Liabilities as restricted cash. Securities pledged as collateral or margin for the same purpose, if any, are noted in the Portfolio of Investments.
Tax Matters and Distributions– The fund intends to qualify as a regulated investment company, as defined under Subchapter M of the Internal Revenue Code, and to distribute all of its taxable income, including realized capital gains. As a result, no provision for federal income tax is required. The fund’s federal tax returns, when filed, will remain subject to examination by the Internal Revenue Service for a three year period. Management has analyzed the fund’s tax positions taken on federal and state tax returns for all open tax years and does not believe that there are any uncertain tax positions that require recognition of a tax liability. Foreign taxes, if any, have been accrued by the fund in the accompanying financial statements in accordance with the applicable foreign tax law. Foreign income taxes may be withheld by certain countries in which the fund invests. Additionally, capital gains realized by the fund on securities issued in or by certain foreign countries may be subject to capital gains tax imposed by those countries.
Distributions to shareholders are recorded on theex-dividend date. Income and capital gain distributions are determined in accordance with income tax regulations, which may differ from U.S. generally accepted accounting principles. Certain capital accounts in the financial statements are periodically adjusted for permanent differences in order to reflect their tax character. These
34
Table of Contents
MFS Global Tactical Allocation Portfolio
Notes to Financial Statements (unaudited) – continued
adjustments have no impact on net assets or net asset value per share. Temporary differences which arise from recognizing certain items of income, expense, gain or loss in different periods for financial statement and tax purposes will reverse at some time in the future. Distributions in excess of net investment income or net realized gains are temporary overdistributions for financial statement purposes resulting from differences in the recognition or classification of income or distributions for financial statement and tax purposes.
Book/tax differences primarily relate to amortization and accretion of debt securities, wash sale loss deferrals, straddle loss deferrals, and derivative transactions.
The tax character of distributions declared to shareholders for the last fiscal year is as follows:
| Year ended 12/31/18 | ||||
| Ordinary income (including any short-term capital gains) | $16,001,318 | |||
| Long-term capital gains | 17,920,228 | |||
| Total distributions | $33,921,546 | |||
The federal tax cost and the tax basis components of distributable earnings were as follows:
| As of 6/30/19 | ||||
| Cost of investments | $518,144,017 | |||
| Gross appreciation | 95,768,148 | |||
| Gross depreciation | (6,568,204 | ) | ||
| Net unrealized appreciation (depreciation) | $89,199,944 | |||
| As of 12/31/18 | ||||
| Undistributed ordinary income | 15,597,284 | |||
| Undistributed long-term capital gain | 13,215,190 | |||
| Other temporary differences | 61,991 | |||
| Net unrealized appreciation (depreciation) | 39,735,999 | |||
The aggregate cost above includes prior fiscal year end tax adjustments, if applicable.
Multiple Classes of Shares of Beneficial Interest– The fund offers multiple classes of shares, which differ in their respective distribution and/or service fees. The fund’s income, realized and unrealized gain (loss), and common expenses are allocated to shareholders based on the daily net assets of each class. Dividends are declared separately for each class. Differences in per share dividend rates are generally due to differences in separate class expenses. The fund’s distributions declared to shareholders as reported in the Statements of Changes in Net Assets are presented by class as follows:
| From net investment income | From net realized gain | |||||||||||||||
| Six months ended 6/30/19 | Year ended 12/31/18 | Six months ended 6/30/19 | Year ended 12/31/18 | |||||||||||||
| Initial Class | $— | $407,616 | $— | $2,268,848 | ||||||||||||
| Service Class | — | 3,217,529 | — | 28,027,553 | ||||||||||||
| Total | $— | $3,625,145 | $— | $30,296,401 | ||||||||||||
| (3) | Transactions with Affiliates |
Investment Adviser– The fund has an investment advisory agreement with MFS to provide overall investment management and related administrative services and facilities to the fund. The management fee is computed daily and paid monthly at the following annual rates based on the fund’s average daily net assets:
| Up to $300 million | 0.75% | |||
| In excess of $300 million and up to $2.5 billion | 0.675% | |||
| In excess of $2.5 billion | 0.65% |
MFS has agreed in writing to reduce its management fee by a specified amount if certain MFS mutual fund assets exceed thresholds agreed to by MFS and the fund’s Board of Trustees. For the six months ended June 30, 2019, this management fee reduction amounted to $29,451, which is included in the reduction of total expenses in the Statement of Operations. The management fee incurred for the six months ended June 30, 2019 was equivalent to an annual effective rate of 0.70% of the fund’s average daily net assets.
The investment adviser has agreed in writing to pay a portion of the fund’s total annual operating expenses, excluding interest, taxes, extraordinary expenses, brokerage and transaction costs, and investment-related expenses, such that total annual operating
35
Table of Contents
MFS Global Tactical Allocation Portfolio
Notes to Financial Statements (unaudited) – continued
expenses do not exceed 0.90% of average daily net assets for the Initial Class shares and 1.15% of average daily net assets for the Service Class shares. This written agreement will continue until modified by the fund’s Board of Trustees, but such agreement will continue at least until April 30, 2021. For the six months ended June 30, 2019, the fund’s actual operating expenses did not exceed the limit and therefore, the investment adviser did not pay any portion of the fund’s expenses related to this agreement.
Distributor– MFS Fund Distributors, Inc. (MFD), a wholly-owned subsidiary of MFS, is the distributor of shares of the fund. The Trustees have adopted a distribution plan for the Service Class shares pursuant to Rule12b-1 under the Investment Company Act of 1940.
The fund’s distribution plan provides that the fund will pay MFD distribution and/or service fees equal to 0.25% per annum of its average daily net assets attributable to Service Class shares as partial consideration for services performed and expenses incurred by MFD and financial intermediaries (including participating insurance companies that invest in the fund to fund variable annuity and variable life insurance contracts, sponsors of qualified retirement and pension plans that invest in the fund, and affiliates of these participating insurance companies and plan sponsors) in connection with the sale and distribution of the Service Class shares. MFD may subsequently pay all, or a portion, of the distribution and/or service fees to financial intermediaries.
Shareholder Servicing Agent– MFS Service Center, Inc. (MFSC), a wholly-owned subsidiary of MFS, receives a fee from the fund for its services as shareholder servicing agent. For the six months ended June 30, 2019, the fee was $4,748, which equated to 0.0016% annually of the fund’s average daily net assets. MFSC also receives payment from the fund forout-of-pocket expenses paid by MFSC on behalf of the fund. For the six months ended June 30, 2019, these costs amounted to $96.
Administrator– MFS provides certain financial, legal, shareholder communications, compliance, and other administrative services to the fund. Under an administrative services agreement, the fund reimburses MFS the costs incurred to provide these services. The fund is charged an annual fixed amount of $17,500 plus a fee based on average daily net assets. The administrative services fee incurred for the six months ended June 30, 2019 was equivalent to an annual effective rate of 0.0157% of the fund’s average daily net assets.
Trustees’ and Officers’ Compensation– The fund pays compensation to independent Trustees in the form of a retainer, attendance fees, and additional compensation to Board and Committee chairpersons. The fund does not pay compensation directly to Trustees or officers of the fund who are also officers of the investment adviser, all of whom receive remuneration from MFS for their services to the fund. Certain officers and Trustees of the fund are officers or directors of MFS, MFD, and MFSC.
Other– This fund and certain other funds managed by MFS (the funds) had entered into a service agreement (the ISO Agreement) which provided for payment of fees solely by the funds to Tarantino LLC in return for the provision of services of an Independent Senior Officer (ISO) for the funds. Frank L. Tarantino served as the ISO and was an officer of the funds and the sole member of Tarantino LLC. Effective June 30, 2019, Mr. Tarantino retired from his position as ISO for the funds, and the ISO Agreement was terminated. For the six months ended June 30, 2019, the fee paid by the fund under this agreement was $801 and is included in “Miscellaneous” expense in the Statement of Operations. MFS had agreed to bear all expenses associated with office space, other administrative support, and supplies provided to the ISO.
The fund invests in the MFS Institutional Money Market Portfolio which is managed by MFS and seeks current income consistent with preservation of capital and liquidity. This money market fund does not pay a management fee to MFS.
The fund is permitted to engage in purchase and sale transactions with funds and accounts for which MFS serves as investment adviser orsub-adviser (“cross-trades”) pursuant to a policy adopted by the Board of Trustees. This policy has been designed to ensure that cross-trades conducted by the fund comply with Rule17a-7 under the Investment Company Act of 1940. During the six months ended June 30, 2019, the fund engaged in purchase and sale transactions pursuant to this policy, which amounted to $86,785 and $525,264, respectively. The sales transactions resulted in net realized gains (losses) of $79,670.
| (4) | Portfolio Securities |
For the six months ended June 30, 2019, purchases and sales of investments, other than purchased option transactions andshort-term obligations, were as follows:
| Purchases | Sales | |||||||
| U.S. Government securities | $77,027,742 | $89,537,053 | ||||||
| Non-U.S. Government securities | $168,225,263 | $184,693,121 | ||||||
36
Table of Contents
MFS Global Tactical Allocation Portfolio
Notes to Financial Statements (unaudited) – continued
| (5) | Shares of Beneficial Interest |
The fund’s Declaration of Trust permits the Trustees to issue an unlimited number of full and fractional shares of beneficial interest. Transactions in fund shares were as follows:
| Six months ended 6/30/19 | Year ended 12/31/18 | |||||||||||||||
| Shares | Amount | Shares | Amount | |||||||||||||
| Shares sold | ||||||||||||||||
Initial Class | 7,110 | $110,746 | 80,272 | $1,254,421 | ||||||||||||
Service Class | 143,718 | 2,195,850 | 437,166 | 6,748,306 | ||||||||||||
| 150,828 | $2,306,596 | 517,438 | $8,002,727 | |||||||||||||
| Shares issued to shareholders in reinvestment of distributions | ||||||||||||||||
Initial Class | — | $— | 177,720 | $2,676,464 | ||||||||||||
Service Class | — | — | 2,109,729 | 31,245,082 | ||||||||||||
| — | $— | 2,287,449 | $33,921,546 | |||||||||||||
| Shares reacquired | ||||||||||||||||
Initial Class | (327,333 | ) | $(5,007,921 | ) | (479,270 | ) | $(7,461,633 | ) | ||||||||
Service Class | (2,966,334 | ) | (44,753,123 | ) | (8,081,155 | ) | (123,489,174 | ) | ||||||||
| (3,293,667 | ) | $(49,761,044 | ) | (8,560,425 | ) | $(130,950,807 | ) | |||||||||
| Net change | ||||||||||||||||
Initial Class | (320,223 | ) | $(4,897,175 | ) | (221,278 | ) | $(3,530,748 | ) | ||||||||
Service Class | (2,822,616 | ) | (42,557,273 | ) | (5,534,260 | ) | (85,495,786 | ) | ||||||||
| (3,142,839 | ) | $(47,454,448 | ) | (5,755,538 | ) | $(89,026,534 | ) | |||||||||
| (6) | Line of Credit |
The fund and certain other funds managed by MFS participate in a $1.25 billion unsecured committed line of credit, subject to a $1 billion sublimit, provided by a syndicate of banks under a credit agreement. Borrowings may be made for temporary financing needs. Interest is charged to each fund, based on its borrowings, generally at a rate equal to the highest of one month LIBOR, the Federal Funds Effective Rate and the Overnight Bank Funding Rate, plus an agreed upon spread. A commitment fee, based on the average daily, unused portion of the committed line of credit, is allocated among the participating funds. In addition, the fund and other funds managed by MFS have established unsecured uncommitted borrowing arrangements with certain banks for temporary financing needs. Interest is charged to each fund, based on its borrowings, at rates equal to customary reference rates plus an agreed upon spread. For the six months ended June 30, 2019, the fund’s commitment fee and interest expense were $1,927 and $0, respectively, and are included in “Interest expense and fees” in the Statement of Operations.
| (7) | Investments in Affiliated Issuers |
An affiliated issuer may be considered one in which the fund owns 5% or more of the outstanding voting securities, or a company which is under common control. For the purposes of this report, the following were affiliated issuers:
| Affiliated Issuers | Beginning Value | Purchases | Sales Proceeds | Realized Gain (Loss) | Change in Unrealized Appreciation or Depreciation | Ending Value | ||||||||||||||||||
| MFS Institutional Money Market Portfolio | $24,746,728 | $113,965,407 | $133,331,107 | $(135 | ) | $555 | $5,381,448 | |||||||||||||||||
| Affiliated Issuers | Dividend Income | Capital Gain Distributions | ||||||||||||||||||||||
| MFS Institutional Money Market Portfolio |
| $214,008 | $— | |||||||||||||||||||||
37
Table of Contents
MFS Global Tactical Allocation Portfolio
PROXY VOTING POLICIES AND INFORMATION
MFS votes proxies on behalf of the fund pursuant to proxy voting policies and procedures that are available without charge, upon request, by calling 1-800-225-2606, by visitingmfs.com/proxyvoting, or by visiting the SEC’s Web site athttp://www.sec.gov.
Information regarding how the fund voted proxies relating to portfolio securities during the most recent twelve-month period ended June 30 is available by August 31 of each year without charge by visitingmfs.com/proxyvoting, or by visiting the SEC’s Web site athttp://www.sec.gov.
QUARTERLY PORTFOLIO DISCLOSURE
The fund files a complete schedule of portfolio holdings with the SEC for the first and third quarters of each fiscal year on Form N-Q or as an exhibit to its reports on Form N-PORT (for first and third fiscal quarters ending March 31, 2019 or after). The fund’sForm N-Q or Form N-PORT reports are available on the SEC’s website athttp://www.sec.gov.A shareholder can obtain the portfolio holdings report for the first and third quarters of the fund’s fiscal year atmfs.com/vit2 by choosing the fund’s name and then selecting the “Resources” tab and clicking on “Prospectus and Reports”.
From time to time, MFS may post important information about the fund or the MFS funds on the MFS web site (mfs.com). This information is available athttps://www.mfs.com/en-us/what-we-do/announcements.htmlor atmfs.com/vit2 by choosing the fund’s name.
INFORMATION ABOUT FUND CONTRACTS AND LEGAL CLAIMS
The fund has entered into contractual arrangements with an investment adviser, administrator, distributor, shareholder servicing agent, 529 program manager (if applicable), and custodian who each provide services to the fund. Unless expressly stated otherwise, shareholders are not parties to, or intended beneficiaries of these contractual arrangements, and these contractual arrangements are not intended to create any shareholder right to enforce them against the service providers or to seek any remedy under them against the service providers, either directly or on behalf of the fund.
Under the Trust’s By-Laws and Declaration of Trust, any claims asserted against or on behalf of the MFS Funds, including claims against Trustees and Officers, must be brought in state and federal courts located within the Commonwealth of Massachusetts.
38
Table of Contents
Table of Contents
Semiannual Report
June 30, 2019

MFS® Government Securities Portfolio

MFS® Variable Insurance Trust II
Beginning on January 1, 2021, as permitted by regulations adopted by the U.S. Securities and Exchange Commission, the insurance company that offers your contract may determine that it will no longer send you paper copies of the fund’s annual and semiannual shareholder reports unless you specifically request paper copies from the insurance company or from your financial intermediary. Instead, the shareholder reports will be made available on a Web site (insurancefunds.mfs.com or other Web site of which you will be notified), and the insurance company will notify you by mail each time a report is posted and provide you with a Web site link to access the report. Instructions for requesting paper copies will be provided by your insurance company or financial intermediary.
If you already elected to receive shareholder reports by email, you will not be affected by this change and you need not take any action. If your insurance company or financial intermediary offers electronic delivery, you may elect to receive shareholder reports and other communications from the insurance company or financial intermediary by email by following the instructions provided by the insurance company or financial intermediary.
Beginning on January 1, 2019, you may elect to receive all future reports in paper free of charge from the insurance company or financial intermediary. You can inform the insurance company or financial intermediary that you wish to continue receiving paper copies of your shareholder reports by contacting your insurance company or financial intermediary. Your election to receive reports in paper will apply to all funds held in your account with your insurance company or financial intermediary.
GSS-SEM
Table of Contents
MFS® Government Securities Portfolio
The report is prepared for the general information of contract owners. It is authorized for distribution to prospective investors only when preceded or accompanied by a current prospectus.
NOT FDIC INSURED• MAY LOSE VALUE• NO BANK OR CREDIT UNION GUARANTEE• NOT A DEPOSIT• NOT INSURED BY ANY FEDERAL GOVERNMENT AGENCY OR NCUA/NCUSIF
Table of Contents
MFS Government Securities Portfolio
LETTER FROM THE EXECUTIVE CHAIRMAN

Dear Contract Owners:
Slowing global growth, low inflation, and increasing trade friction between the United States and China have been hallmarks of the past 12 months. After experiencing an uptick in market volatility in late 2018, markets steadied during the first half of 2019, thanks in large measure to the adoption of a dovish policy stance on the part of global central banks, who have largely abandoned efforts to normalize interest rates and have instead focused on supporting economic growth. Trade tensions remain high as the U.S. has ratcheted up tariffs on Chinese imports and China has retaliated. A truce of sorts was reached midyear, but significant challenges continue to confront negotiators, and it is not known whether a comprehensive agreement can be reached.
With Boris Johnson replacing Theresa May as Britain’s prime minister, uncertainty over Brexit remains high. Johnson has adopted a more combative stance than his predecessor toward the European Union, increasing concerns that there will be a “hard” Brexit.
Markets expect that the longest economic expansion in U.S. history will continue for the time being, albeit at a slower pace. Nevertheless, slower growth and low inflation have spurred the U.S. Federal Reserve to take a more accommodative policy stance, prompting investors to anticipate several interest rate cuts in the coming year. The European Central Bank has adopted a similar position. The more accommodative environment has helped fuel a continued rise in global equities and has been broadly supportive of risk assets.
Since launching the first U.S.open-end mutual fund in 1924, MFS® has been committed to a single purpose: to create value by allocating capital responsibly for clients. Through our powerful global investment platform, we combine collective expertise, thoughtful risk management, and long-term discipline to uncover what we believe are the best investment opportunities in the market.
Respectfully,

Robert J. Manning
Executive Chairman
MFS Investment Management
August 16, 2019
The opinions expressed in this letter are subject to change and may not be relied upon for investment advice. No forecasts can be guaranteed.
1
Table of Contents
MFS Government Securities Portfolio
Portfolio structure (i)
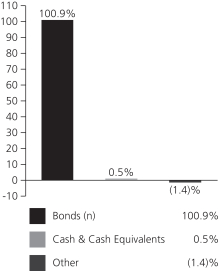
| Fixed income sectors (i) | ||||
| Mortgage-Backed Securities (n) | 54.6% | |||
| U.S. Treasury Securities | 28.2% | |||
| U.S. Government Agencies | 8.6% | |||
| Investment Grade Corporates | 2.7% | |||
| Commercial Mortgage-Backed Securities | 2.2% | |||
| Collateralized Debt Obligations | 2.0% | |||
| Municipal Bonds | 1.4% | |||
| Asset-Backed Securities | 0.9% | |||
| Non-U.S. Government Bonds | 0.3% |
| Composition including fixed income credit quality (a)(i) |
| |||
| AAA | 4.4% | |||
| AA | 1.3% | |||
| A | 2.3% | |||
| BBB | 1.5% | |||
| U.S. Government | 26.8% | |||
| Federal Agencies (n) | 63.2% | |||
| Not Rated | 1.4% | |||
| Cash & Cash Equivalents | 0.5% | |||
| Other | (1.4)% | |||
| Portfolio facts (i) | ||||
| Average Duration (d) | 5.1 | |||
| Average Effective Maturity (m) | 7.0 yrs. | |||
| (a) | For all securities other than those specifically described below, ratings are assigned to underlying securities utilizing ratings from Moody’s, Fitch, and Standard & Poor’s rating agencies and applying the following hierarchy: If all three agencies provide a rating, the middle rating (after dropping the highest and lowest ratings) is assigned; if two of the three agencies rate a security, the lower of the two is assigned. Ratings are shown in the S&P and Fitch scale (e.g., AAA). Securities rated BBB or higher are considered investment grade. All ratings are subject to change. U.S. Government includes securities issued by the U.S. Department of the Treasury. Federal Agencies includes rated and unrated U.S. Agency fixed-income securities, U.S. Agency mortgage-backed securities, and collateralized mortgage obligations of U.S. Agency mortgage-backed securities. Not Rated includes fixed income securities and fixed income derivatives, which have not been rated by any rating agency. The fund may or may not have held all of these instruments on this date. The fund is not rated by these agencies. |
| (d) | Duration is a measure of how much a bond’s price is likely to fluctuate with general changes in interest rates, e.g., if rates rise 1.00%, a bond with a5-year duration is likely to lose about 5.00% of its value due to the interest rate move. |
| (i) | For purposes of this presentation, the components include the value of securities, and reflect the impact of the equivalent exposure of derivative positions, if any. These amounts may be negative from time to time. Equivalent exposure is a calculated amount that translates the derivative position into a reasonable approximation of the amount of the underlying asset that the portfolio would have to hold at a given point in time to have the same price sensitivity that results from the portfolio’s ownership of the derivative contract. When dealing with derivatives, equivalent exposure is a more representative measure of the potential impact of a position on portfolio performance than value. The bond component will include any accrued interest amounts. |
| (m) | In determining each instrument’s effective maturity for purposes of calculating the fund’s dollar-weighted average effective maturity, MFS uses the instrument’s stated maturity or, if applicable, an earlier date on which MFS believes it is probable that a maturity-shortening device (such as a put,pre-refunding or prepayment) will cause the instrument to be repaid. Such an earlier date can be substantially shorter than the instrument’s stated maturity. |
| (n) | Includes TBA sale commitments. |
Where the fund holds convertible bonds, they are treated as part of the equity portion of the portfolio.
Cash & Cash Equivalents includes any cash, investments in money market funds, short-term securities, and other assets less liabilities. Please see the Statement of Assets and Liabilities for additional information related to the fund’s cash position and other assets and liabilities.
Other includes equivalent exposure from currency derivatives and/or any offsets to derivative positions and may be negative.
Percentages are based on net assets as of June 30, 2019.
The portfolio is actively managed and current holdings may be different.
2
Table of Contents
MFS Government Securities Portfolio
Fund Expenses Borne by the Contract Holders during the Period,
January 1, 2019 through June 30, 2019
As a contract holder of the fund, you incur ongoing costs, including management fees; distribution and/or service(12b-1) fees; and other fund expenses. This example is intended to help you understand your ongoing costs (in dollars) of investing in the fund and to compare these costs with the ongoing costs of investing in other mutual funds.
The example is based on an investment of $1,000 invested at the beginning of the period and held for the entire period January 1, 2019 through June 30, 2019.
Actual Expenses
The first line for each share class in the following table provides information about actual account values and actual expenses. You may use the information in this line, together with the amount you invested, to estimate the expenses that you paid over the period. Simply divide your account value by $1,000 (for example, an $8,600 account value divided by $1,000 = 8.6), then multiply the result by the number in the first line under the heading entitled “Expenses Paid During Period” to estimate the expenses you paid on your account during this period.
Hypothetical Example for Comparison Purposes
The second line for each share class in the following table provides information about hypothetical account values and hypothetical expenses based on the fund’s actual expense ratio and an assumed rate of return of 5% per year before expenses, which is not the fund’s actual return. The hypothetical account values and expenses may not be used to estimate the actual ending account balance or expenses you paid for the period. You may use this information to compare the ongoing costs of investing in the fund and other funds. To do so, compare this 5% hypothetical example with the 5% hypothetical examples that appear in the shareholder reports of the other funds.
Please note that the expenses shown in the table are meant to highlight the fund’s ongoing costs only and do not take into account the fees and expenses imposed under the variable contracts through which your investment in the fund is made. Therefore, the second line for each share class in the table is useful in comparing ongoing costs associated with an investment in vehicles (such as the fund) which fund benefits under variable annuity and variable life insurance contracts and to qualified pension and retirement plans only, and will not help you determine the relative total costs of investing in the fund through variable annuity and variable life insurance contracts. If the fees and expenses imposed under the variable contracts were included, your costs would have been higher.
| Share Class | Annualized Expense Ratio | Beginning Account Value | Ending Account Value | Expenses Paid During Period (p) 1/01/19-6/30/19 | ||||||||||||||
| Initial Class | Actual | 0.58% | $1,000.00 | $1,049.00 | $2.95 | |||||||||||||
| Hypothetical (h) | 0.58% | $1,000.00 | $1,021.92 | $2.91 | ||||||||||||||
| Service Class | Actual | 0.83% | $1,000.00 | $1,048.50 | $4.22 | |||||||||||||
| Hypothetical (h) | 0.83% | $1,000.00 | $1,020.68 | $4.16 | ||||||||||||||
| (h) | 5% class return per year before expenses. |
| (p) | “Expenses Paid During Period” are equal to each class’s annualized expense ratio, as shown above, multiplied by the average account value over the period, multiplied by 181/365 (to reflect theone-half year period). |
3
Table of Contents
MFS Government Securities Portfolio
PORTFOLIO OF INVESTMENTS – 6/30/19 (unaudited)
The Portfolio of Investments is a complete list of all securities owned by your fund. It is categorized by broad-based asset classes.
| Issuer | Shares/Par | Value ($) | ||||||
| BONDS – 99.4% | ||||||||
| Asset-Backed & Securitized – 5.0% |
| |||||||
| ALM Loan Funding, CLO,2015-12A, “A1R2”, FLR , 3.491% (LIBOR - 3mo. + 0.89%), 4/16/2027 (n) | $ | 1,042,247 | $ | 1,041,548 | ||||
| Chesapeake Funding II LLC,2018-1A, “A1”, 3.04%, 4/15/2030 (n) | 940,360 | 949,529 | ||||||
| Chesapeake Funding II LLC,2018-3A, “A1”, 3.39%, 1/15/2031 (n) | 1,700,000 | 1,727,882 | ||||||
| Commercial Mortgage Trust,2015-DC1, “A5”, 3.35%, 2/10/2048 | 1,536,000 | 1,598,223 | ||||||
| Commercial Mortgage Trust, 2017-COR2, “A3”, 3.51%, 9/10/2050 | 1,414,455 | 1,492,724 | ||||||
| CSAIL Commercial Mortgage Trust,2015-C2, “A4”, 3.504%, 6/15/2057 | 144,366 | 151,032 | ||||||
| DLL Securitization Trust,2019-DA1, “A2”, 2.79%, 11/22/2021 (n) | 1,630,000 | 1,636,906 | ||||||
| Dryden Senior Loan Fund,2018-55A, “A1”, CLO, FLR, 3.616% (LIBOR - 3mo. + 1.02%), 4/15/2031 (n) | 1,537,212 | 1,523,346 | ||||||
| GS Mortgage Securities Trust, 2015-GC30, “A4”, 3.382%, 5/10/2050 | 1,965,000 | 2,057,475 | ||||||
| Loomis, Sayles & Co., CLO, “A2”, FLR, 3.996% (LIBOR - 3mo. + 1.4%), 4/15/2028 (n) | 1,489,774 | 1,478,529 | ||||||
| Madison Park Funding Ltd.,2014-13A, “BR2”, FLR, 4.091% (LIBOR - 3mo. + 1.5%), 4/19/2030 (n) | 1,572,067 | 1,557,219 | ||||||
| Morgan Stanley Bank of America Merrill Lynch Trust,2017-C34, “A4”, 3.536%, 11/15/2052 | 415,862 | 440,397 | ||||||
| Morgan Stanley Capital I Trust,2018-H4, “XA”, 1.036%, 12/15/2051 (i) | 6,265,055 | 415,793 | ||||||
| Oaktree CLO Ltd.,2014-2A, “A1BR”, 2.953%, 10/20/2026 (n) | 1,072,069 | 1,072,063 | ||||||
| Symphony CLO Ltd.,2016-17A, “BR”, FLR, 3.796% (LIBOR - 3mo. + 1.2%), 4/15/2028 (n) | 1,332,260 | 1,326,410 | ||||||
| TICP CLO Ltd., FLR, 3.431% (LIBOR - 3mo. + 0.8%), 4/20/2028 (n) | 1,261,352 | 1,253,042 | ||||||
| UBS Commercial Mortgage Trust,2017-C1, “A4”, 3.544%, 11/15/2050 | 968,000 | 1,024,022 | ||||||
| Wells Fargo Commercial Mortgage Trust,2015-C28, “A4”, 3.54%, 5/15/2048 | 1,937,516 | 2,041,970 | ||||||
| Wells Fargo Commercial Mortgage Trust, 2015-NXS1, “A5”, 3.148%, 5/15/2048 | 918,829 | 949,461 | ||||||
| Wells Fargo Commercial Mortgage Trust,2018-C48, “XA”, 1.126%, 1/15/2052 (i)(n) | 3,746,531 | 274,515 | ||||||
| West CLO Ltd.2013-1A, “A1AR”, FLR, 3.725% (LIBOR - 3mo. + 1.16%), 11/07/2025 (n) | 95,405 | 95,371 | ||||||
|
| |||||||
| $ | 24,107,457 | |||||||
|
| |||||||
| Chemicals – 0.4% | ||||||||
| Sherwin Williams Co., 2.75%, 6/01/2022 | $ | 1,673,000 | $ | 1,690,168 | ||||
|
| |||||||
| Issuer | Shares/Par | Value ($) | ||||||
| BONDS – continued |
| |||||||
| Conglomerates – 0.2% | ||||||||
| United Technologies Corp., 3.95%, 8/16/2025 | $ | 764,000 | $ | 823,899 | ||||
|
| |||||||
| Consumer Products – 0.3% | ||||||||
| Reckitt Benckiser Treasury Services PLC, 2.75%, 6/26/2024 (n) | $ | 1,311,000 | $ | 1,320,958 | ||||
|
| |||||||
| Local Authorities – 0.2% | ||||||||
| Philadelphia, PA, School District, “A”, 5.995%, 9/01/2030 | $ | 960,000 | $ | 1,195,325 | ||||
|
| |||||||
| Major Banks – 0.1% | ||||||||
| UBS Group Funding (Switzerland) AG, 3.491%, 5/23/2023 (n) | $ | 565,000 | $ | 579,225 | ||||
|
| |||||||
| Medical & Health Technology & Services – 0.5% |
| |||||||
| Montefiore Obligated Group, 5.246%, 11/01/2048 | $ | 2,012,000 | $ | 2,383,162 | ||||
|
| |||||||
| Mortgage-Backed – 54.8% | ||||||||
| Fannie Mae,5%, 7/01/2019 - 3/01/2041 | $ | 4,883,471 | $ | 5,302,803 | ||||
| Fannie Mae, 4.785%, 8/01/2019 | 797,213 | 797,122 | ||||||
| Fannie Mae, 5.05%, 8/01/2019 | 285,942 | 285,442 | ||||||
| Fannie Mae,5.5%, 8/01/2019 - 3/01/2038 | 7,409,280 | 8,213,892 | ||||||
| Fannie Mae, 1.99%, 10/01/2019 | 906,233 | 904,618 | ||||||
| Fannie Mae,4.5%, 7/01/2020 - 6/01/2044 | 14,504,636 | 15,562,404 | ||||||
| Fannie Mae, 4.14%, 8/01/2020 | 407,269 | 411,955 | ||||||
| Fannie Mae,6%, 2/01/2021 - 7/01/2037 | 844,229 | 951,146 | ||||||
| Fannie Mae, 2.56%, 10/01/2021 | 224,569 | 226,524 | ||||||
| Fannie Mae, 2.67%, 3/01/2022 | 430,201 | 437,192 | ||||||
| Fannie Mae, 2.152%, 1/25/2023 | 1,513,489 | 1,513,282 | ||||||
| Fannie Mae, 2.73%, 4/01/2023 | 486,959 | 496,518 | ||||||
| Fannie Mae, 2.41%, 5/01/2023 | 614,573 | 619,925 | ||||||
| Fannie Mae, 2.55%, 5/01/2023 | 528,659 | 535,878 | ||||||
| Fannie Mae, 2.59%, 5/01/2023 | 337,356 | 342,453 | ||||||
| Fannie Mae,3.5%, 5/25/2025 - 1/01/2047 | 24,480,486 | 25,304,928 | ||||||
| Fannie Mae, 2.28%, 11/01/2026 | 259,485 | 259,177 | ||||||
| Fannie Mae, 2.672%, 12/25/2026 | 1,032,000 | 1,040,491 | ||||||
| Fannie Mae, 3.144%, 3/25/2028 | 1,276,000 | 1,329,303 | ||||||
| Fannie Mae,4%, 3/25/2028 - 2/01/2045 | 30,015,869 | 31,640,559 | ||||||
| Fannie Mae,6.5%, 9/01/2031 - 10/01/2037 | 698,866 | 805,089 | ||||||
| Fannie Mae,3%, 12/01/2031 - 11/01/2046 | 18,112,881 | 18,490,367 | ||||||
| Fannie Mae,2%, 10/25/2040 - 4/25/2046 | 1,805,810 | 1,787,814 | ||||||
| Fannie Mae, TBA,2.5%, 7/01/2028 - 8/25/2034 | 875,000 | 880,986 | ||||||
| Fannie Mae, TBA, 3%, 7/01/2034 | 1,875,000 | 1,911,859 | ||||||
| Fannie Mae, TBA, 3.5%, 7/01/2034 | 3,075,000 | 3,173,993 | ||||||
| Freddie Mac,6%, 8/01/2019 - 10/01/2038 | 2,303,580 | 2,577,385 | ||||||
| Freddie Mac, 2.456%, 8/25/2019 | 54,934 | 54,837 | ||||||
| Freddie Mac, 4.186%, 8/25/2019 | 314,010 | 313,913 | ||||||
| Freddie Mac, 1.869%, 11/25/2019 | 1,681,757 | 1,676,755 | ||||||
| Freddie Mac, 4.251%, 1/25/2020 | 1,420,474 | 1,425,775 | ||||||
| Freddie Mac, 2.313%, 3/25/2020 | 1,456,949 | 1,454,434 | ||||||
| Freddie Mac, 4.224%, 3/25/2020 | 1,829,345 | 1,838,829 | ||||||
| Freddie Mac,5%, 4/01/2020 - 6/01/2040 | 1,237,909 | 1,349,280 | ||||||
4
Table of Contents
MFS Government Securities Portfolio
Portfolio of Investments (unaudited) – continued
| Issuer | Shares/Par | Value ($) | ||||||
| BONDS – continued | ||||||||
| Mortgage-Backed – continued |
| |||||||
| Freddie Mac, 3.808%, 8/25/2020 | $ | 985,668 | $ | 996,528 | ||||
| Freddie Mac, 3.034%, 10/25/2020 | 1,303,893 | 1,312,523 | ||||||
| Freddie Mac,5.5%, 5/01/2022 - 6/01/2041 | 1,651,648 | 1,831,220 | ||||||
| Freddie Mac,4.5%, 11/01/2022 - 5/01/2042 | 2,570,915 | 2,754,369 | ||||||
| Freddie Mac, 2.51%, 11/25/2022 | 2,326,000 | 2,359,931 | ||||||
| Freddie Mac, 3.32%, 2/25/2023 | 1,993,000 | 2,076,425 | ||||||
| Freddie Mac, 3.25%, 4/25/2023 | 3,500,000 | 3,640,820 | ||||||
| Freddie Mac, 3.3%, 4/25/2023 | 1,997,044 | 2,083,474 | ||||||
| Freddie Mac, 3.06%, 7/25/2023 | 1,286,000 | 1,331,902 | ||||||
| Freddie Mac, 1.016%, 4/25/2024 (i) | 16,560,383 | 564,315 | ||||||
| Freddie Mac, 0.735%, 7/25/2024 (i) | 17,591,157 | 458,278 | ||||||
| Freddie Mac, 3.064%, 8/25/2024 | 1,703,107 | 1,771,684 | ||||||
| Freddie Mac, 2.67%, 12/25/2024 | 3,924,000 | 4,011,688 | ||||||
| Freddie Mac, 2.811%, 1/25/2025 | 3,025,000 | 3,116,992 | ||||||
| Freddie Mac, 3.329%, 5/25/2025 | 3,082,000 | 3,259,919 | ||||||
| Freddie Mac,4%, 7/01/2025 - 4/01/2044 | 2,373,197 | 2,490,051 | ||||||
| Freddie Mac, 3.01%, 7/25/2025 | 904,000 | 941,444 | ||||||
| Freddie Mac, 2.745%, 1/25/2026 | 2,656,000 | 2,731,006 | ||||||
| Freddie Mac, 3.224%, 3/25/2027 | 2,380,000 | 2,515,454 | ||||||
| Freddie Mac, 0.713%, 7/25/2027 (i) | 29,975,384 | 1,249,389 | ||||||
| Freddie Mac, 0.567%, 8/25/2027 (i) | 25,091,594 | 791,178 | ||||||
| Freddie Mac, 3.187%, 9/25/2027 | 3,000,000 | 3,165,553 | ||||||
| Freddie Mac, 0.426%, 1/25/2028 (i) | 42,784,432 | 1,058,393 | ||||||
| Freddie Mac, 0.434%, 1/25/2028 (i) | 17,618,087 | 446,044 | ||||||
| Freddie Mac, 0.269%, 2/25/2028 (i) | 49,858,749 | 653,897 | ||||||
| Freddie Mac, 2.5%, 3/15/2028 | 210,370 | 213,135 | ||||||
| Freddie Mac, 0.262%, 4/25/2028 (i) | 32,039,814 | 393,785 | ||||||
| Freddie Mac,3%, 6/15/2028 - 11/01/2046 | 17,335,524 | 17,699,156 | ||||||
| Freddie Mac,3.5%, 6/15/2028 - 8/25/2058 | 30,873,526 | 31,988,956 | ||||||
| Freddie Mac,6.5%, 8/01/2032 - 5/01/2037 | 420,690 | 489,546 | ||||||
| Ginnie Mae,2.5%, 7/20/2032 - 6/20/2042 | 620,000 | 606,837 | ||||||
| Ginnie Mae,5.5%, 7/15/2033 - 1/20/2042 | 1,488,759 | 1,666,374 | ||||||
| Ginnie Mae,4.5%, 8/15/2039 - 9/20/2041 | 3,605,709 | 3,881,695 | ||||||
| Ginnie Mae,4%, 10/15/2039 - 7/20/2049 | 5,644,099 | 5,891,478 | ||||||
| Ginnie Mae,3.5%, 12/15/2041 - 6/20/2049 | 6,791,410 | 7,058,872 | ||||||
| Ginnie Mae,3%, 11/20/2047 - 2/20/2048 | 10,516,497 | 10,760,281 | ||||||
| Ginnie Mae, 5.87%, 4/20/2058 | 17,198 | 19,413 | ||||||
| Ginnie Mae, 0.659%, 2/16/2059 (i) | 2,229,264 | 135,143 | ||||||
|
| |||||||
| $ | 262,334,076 | |||||||
|
| |||||||
| Municipals – 1.2% | ||||||||
| New Jersey Economic Development Authority State Pension Funding Rev., Capital Appreciation, “B”, 0%, 2/15/2023 | $ | 4,114,000 | $ | 3,739,214 | ||||
| University of California Rev. (Build America Bonds), 5.77%, 5/15/2043 | 1,345,000 | 1,768,823 | ||||||
|
| |||||||
| $ | 5,508,037 | |||||||
|
| |||||||
| Other Banks & Diversified Financials – 0.3% |
| |||||||
| ING Groep N.V., 3.15%, 3/29/2022 | $ | 1,606,000 | $ | 1,636,348 | ||||
|
| |||||||
| Restaurants – 0.4% | ||||||||
| Starbucks Corp., 3.8%, 8/15/2025 | $ | 1,651,000 | $ | 1,762,006 | ||||
|
| |||||||
| Supranational – 0.3% | ||||||||
| Inter-American Development Bank, 4.375%, 1/24/2044 | $ | 1,093,000 | $ | 1,411,327 | ||||
|
| |||||||
| Issuer | Shares/Par | Value ($) | ||||||
| BONDS – continued | ||||||||
| Tobacco – 0.3% | ||||||||
| B.A.T Capital Corp., 2.764%, 8/15/2022 | $ | 1,283,000 | $ | 1,284,947 | ||||
|
| |||||||
| U.S. Government Agencies and Equivalents – 8.5% |
| |||||||
| AID-Tunisia, 2.452%, 7/24/2021 | $ | 1,444,000 | $ | 1,450,186 | ||||
| AID-Ukraine, 1.847%, 5/29/2020 | 1,135,000 | 1,136,425 | ||||||
| Federal Home Loan Bank, 2.375%, 3/30/2020 | 5,500,000 | 5,515,970 | ||||||
| Federal Home Loan Bank, 2.625%, 12/10/2021 | 4,800,000 | 4,890,025 | ||||||
| Federal Home Loan Bank, 3%, 12/10/2021 | 20,500,000 | 21,073,777 | ||||||
| Private Export Funding Corp., 2.25%, 3/15/2020 | 594,000 | 593,945 | ||||||
| Private Export Funding Corp., 2.3%, 9/15/2020 | 770,000 | 772,453 | ||||||
| Small Business Administration, 6.35%, 4/01/2021 | 24,757 | 25,281 | ||||||
| Small Business Administration, 6.34%, 5/01/2021 | 35,637 | 36,354 | ||||||
| Small Business Administration, 6.44%, 6/01/2021 | 52,314 | 53,698 | ||||||
| Small Business Administration, 6.625%, 7/01/2021 | 77,290 | 78,911 | ||||||
| Small Business Administration, 6.07%, 3/01/2022 | 60,166 | 61,809 | ||||||
| Small Business Administration, 4.98%, 11/01/2023 | 90,579 | 94,827 | ||||||
| Small Business Administration, 4.77%, 4/01/2024 | 223,596 | 232,976 | ||||||
| Small Business Administration, 5.52%, 6/01/2024 | 100,904 | 106,455 | ||||||
| Small Business Administration, 4.99%, 9/01/2024 | 18,597 | 19,493 | ||||||
| Small Business Administration, 5.11%, 4/01/2025 | 134,880 | 141,705 | ||||||
| Small Business Administration, 2.21%, 2/01/2033 | 793,039 | 787,946 | ||||||
| Small Business Administration, 2.22%, 3/01/2033 | 1,324,030 | 1,317,598 | ||||||
| Small Business Administration, 3.15%, 7/01/2033 | 1,285,968 | 1,322,901 | ||||||
| Small Business Administration, 3.16%, 8/01/2033 | 688,659 | 708,826 | ||||||
| Small Business Administration, 3.62%, 9/01/2033 | 449,974 | 474,109 | ||||||
|
| |||||||
| $ | 40,895,670 | |||||||
|
| |||||||
| U.S. Treasury Obligations – 26.6% |
| |||||||
| U.S. Treasury Bonds, 7.875%, 2/15/2021 | $ | 177,000 | $ | 194,002 | ||||
| U.S. Treasury Bonds, 6.25%, 8/15/2023 | 2,891,000 | 3,406,185 | ||||||
| U.S. Treasury Bonds, 6%, 2/15/2026 | 2,699,000 | 3,393,149 | ||||||
| U.S. Treasury Bonds, 6.75%, 8/15/2026 | 1,862,000 | 2,465,186 | ||||||
| U.S. Treasury Bonds, 6.375%, 8/15/2027 | 326,000 | 434,752 | ||||||
| U.S. Treasury Bonds, 4.5%, 8/15/2039 | 1,287,500 | 1,739,131 | ||||||
| U.S. Treasury Bonds, 3.125%, 2/15/2043 | 8,176,700 | 9,117,659 | ||||||
| U.S. Treasury Bonds, 2.875%, 5/15/2043 | 13,519,500 | 14,459,528 | ||||||
| U.S. Treasury Bonds, 2.5%, 2/15/2045 | 21,059,000 | 20,979,206 | ||||||
5
Table of Contents
MFS Government Securities Portfolio
Portfolio of Investments (unaudited) – continued
| Issuer | Shares/Par | Value ($) | ||||||
| BONDS – continued |
| |||||||
| U.S. Treasury Obligations – continued |
| |||||||
| U.S. Treasury Bonds, 2.875%, 11/15/2046 | $ | 2,917,000 | $ | 3,121,760 | ||||
| U.S. Treasury Notes, 2.375%, 3/15/2021 | 8,200,000 | 8,279,117 | ||||||
| U.S. Treasury Notes, 1.75%, 5/15/2022 | 6,594,000 | 6,598,894 | ||||||
| U.S. Treasury Notes, 2.5%, 8/15/2023 (f) | 25,869,000 | 26,650,122 | ||||||
| U.S. Treasury Notes, 2.5%, 5/15/2024 | 5,385,000 | 5,569,899 | ||||||
| U.S. Treasury Notes, 2.875%, 7/31/2025 | 5,161,000 | 5,470,257 | ||||||
| U.S. Treasury Notes, 2%, 8/15/2025 | 438,000 | 442,192 | ||||||
| U.S. Treasury Notes, 2.625%, 12/31/2025 | 2,800,000 | 2,932,453 | ||||||
| U.S. Treasury Notes, 2%, 11/15/2026 | 5,700,000 | 5,743,418 | ||||||
| U.S. Treasury Notes, 2.875%, 5/15/2028 | 6,000,000 | 6,442,734 | ||||||
|
| |||||||
| $ | 127,439,644 | |||||||
|
| |||||||
| Utilities – Electric Power – 0.3% |
| |||||||
| Enel Finance International N.V., 2.875%, 5/25/2022 (n) | $ | 1,518,000 | $ | 1,530,024 | ||||
|
| |||||||
| Total Bonds (Identified Cost, $462,231,476) | $ | 475,902,273 | ||||||
|
| |||||||
| Issuer | Shares/Par | Value ($) | ||||||
| INVESTMENT COMPANIES (h) – 1.8% |
| |||||||
| Money Market Funds – 1.8% |
| |||||||
| MFS Institutional Money Market Portfolio, 2.42% (v) (Identified Cost, $8,466,241) | 8,466,689 | $ | 8,467,535 | |||||
|
| |||||||
| TBA SALE COMMITMENTS – (0.4)% |
| |||||||
| Mortgage-Backed – (0.4)% |
| |||||||
| Ginnie Mae, TBA, 3.5%, 7/01/2049 (Proceeds Received, $1,826,031) | (1,775,000 | ) | $ | (1,833,728 | ) | |||
|
| |||||||
| OTHER ASSETS, LESS LIABILITIES – (0.8)% | (3,980,642 | ) | ||||||
|
| |||||||
| NET ASSETS – 100.0% | $ | 478,555,438 | ||||||
|
| |||||||
| (f) | All or a portion of the security has been segregated as collateral for open futures contracts. |
| (h) | An affiliated issuer, which may be considered one in which the fund owns 5% or more of the outstanding voting securities, or a company which is under common control. At period end, the aggregate values of the fund’s investments in affiliated issuers and in unaffiliated issuers were $8,467,535 and $475,902,273, respectively. |
| (i) | Interest only security for which the fund receives interest on notional principal (Par amount). Par amount shown is the notional principal and does not reflect the cost of the security. |
| (n) | Securities exempt from registration under Rule 144A of the Securities Act of 1933. These securities may be sold in the ordinary course of business in transactions exempt from registration, normally to qualified institutional buyers. At period end, the aggregate value of these securities was $17,366,567, representing 3.6% of net assets. |
| (v) | Affiliated issuer that is available only to investment companies managed by MFS. The rate quoted for the MFS Institutional Money Market Portfolio is the annualizedseven-day yield of the fund at period end. |
The following abbreviations are used in this report and are defined:
| CLO | Collateralized Loan Obligation |
| FLR | Floating Rate. Interest rate resets periodically based on the parenthetically disclosed reference rate plus a spread (if any). Theperiod-end rate reported may not be the current rate. All reference rates are USD unless otherwise noted. |
| LIBOR | London Interbank Offered Rate |
| TBA | To Be Announced |
Derivative Contracts at 6/30/19
Futures Contracts
| Description | Long/ Short | Currency | Contracts | Notional Amount | Expiration Date | Value/Unrealized Appreciation (Depreciation) | ||||||||||||||||
| Asset Derivatives | ||||||||||||||||||||||
| Interest Rate Futures | ||||||||||||||||||||||
| U.S. Treasury Note 10 yr | Long | USD | 56 | $7,166,250 | September - 2019 | $38,922 | ||||||||||||||||
| U.S. Treasury Note 2 yr | Long | USD | 35 | 7,531,289 | September - 2019 | 35,970 | ||||||||||||||||
|
| |||||||||||||||||||||
| $74,892 | ||||||||||||||||||||||
|
| |||||||||||||||||||||
| Liability Derivatives | ||||||||||||||||||||||
| Interest Rate Futures | ||||||||||||||||||||||
| U.S. Treasury Bond | Short | USD | 52 | $8,090,875 | September - 2019 | $(161,677 | ) | |||||||||||||||
|
| |||||||||||||||||||||
At June 30, 2019, the fund had liquid securities with an aggregate value of $84,476 to cover any collateral or margin obligations for certain derivative contracts.
See Notes to Financial Statements
6
Table of Contents
MFS Government Securities Portfolio
FINANCIAL STATEMENTS | STATEMENT OF ASSETS AND LIABILITIES (unaudited)
This statement represents your fund’s balance sheet, which details the assets and liabilities comprising the total value of the fund.
At 6/30/19 | ||||
Assets | ||||
Investments in unaffiliated issuers, at value (identified cost, $462,231,476) | $475,902,273 | |||
Investments in affiliated issuers, at value (identified cost, $8,466,241) | 8,467,535 | |||
Receivables for | ||||
Net daily variation margin on open futures contracts | 6,871 | |||
Investments sold on an extended settlement basis | 2,037,185 | |||
TBA sale commitments | 1,826,031 | |||
Interest | 2,282,890 | |||
Other assets | 1,656 | |||
Total assets | $490,524,441 | |||
Liabilities | ||||
Payables for | ||||
Investments purchased | $1,618,644 | |||
Investments purchased on an extended settlement basis | 7,985,791 | |||
Fund shares reacquired | 393,262 | |||
TBA sale commitments, at value (proceeds received $1,826,031) | 1,833,728 | |||
Payable to affiliates | ||||
Investment adviser | 25,914 | |||
Administrative services fee | 816 | |||
Shareholder servicing costs | 32 | |||
Distribution and/or service fees | 4,665 | |||
Payable for independent Trustees’ compensation | 100 | |||
Accrued expenses and other liabilities | 106,051 | |||
Total liabilities | $11,969,003 | |||
Net assets | $478,555,438 | |||
Net assets consist of | ||||
Paid-in capital | $475,554,317 | |||
Total distributable earnings (loss) | 3,001,121 | |||
Net assets | $478,555,438 | |||
Shares of beneficial interest outstanding | 37,981,411 | |||
| Net assets | Shares outstanding | Net asset value per share | ||||||||||
Initial Class | $308,258,194 | 24,402,285 | $12.63 | |||||||||
Service Class | 170,297,244 | 13,579,126 | 12.54 | |||||||||
See Notes to Financial Statements
7
Table of Contents
MFS Government Securities Portfolio
FINANCIAL STATEMENTS | STATEMENT OF OPERATIONS (unaudited)
This statement describes how much your fund earned in investment income and accrued in expenses. It also describes any gains and/or losses generated by fund operations.
Six months ended 6/30/19 | ||||
Net investment income (loss) | ||||
Income | ||||
Interest | $7,657,011 | |||
Dividends from affiliated issuers | 64,171 | |||
Other | 1,807 | |||
Total investment income | $7,722,989 | |||
Expenses | ||||
Management fee | $1,300,592 | |||
Distribution and/or service fees | 211,841 | |||
Shareholder servicing costs | 2,692 | |||
Administrative services fee | 38,392 | |||
Independent Trustees’ compensation | 6,100 | |||
Custodian fee | 13,151 | |||
Shareholder communications | 17,452 | |||
Audit and tax fees | 31,612 | |||
Legal fees | 2,170 | |||
Miscellaneous | 24,069 | |||
Total expenses | $1,648,071 | |||
Reduction of expenses by investment adviser | (61,299 | ) | ||
Net expenses | $1,586,772 | |||
Net investment income (loss) | $6,136,217 | |||
Realized and unrealized gain (loss) | ||||
Realized gain (loss) (identified cost basis) | ||||
Unaffiliated issuers | $(85,944 | ) | ||
Affiliated issuers | 230 | |||
Futures contracts | (529,625 | ) | ||
Net realized gain (loss) | $(615,339 | ) | ||
Change in unrealized appreciation or depreciation | ||||
Unaffiliated issuers | $17,333,450 | |||
Affiliated issuers | 1,294 | |||
Futures contracts | 35,869 | |||
Net unrealized gain (loss) | $17,370,613 | |||
Net realized and unrealized gain (loss) | $16,755,274 | |||
Change in net assets from operations | $22,891,491 | |||
See Notes to Financial Statements
8
Table of Contents
MFS Government Securities Portfolio
FINANCIAL STATEMENTS | STATEMENTS OF CHANGES IN NET ASSETS
These statements describe the increases and/or decreases in net assets resulting from operations, any distributions, and any shareholder transactions.
| Six months ended 6/30/19 | Year ended 12/31/18 | |||||||
| (unaudited) | ||||||||
Change in net assets | ||||||||
From operations | ||||||||
Net investment income (loss) | $6,136,217 | $12,522,612 | ||||||
Net realized gain (loss) | (615,339 | ) | (2,245,384 | ) | ||||
Net unrealized gain (loss) | 17,370,613 | (9,703,493 | ) | |||||
Change in net assets from operations | $22,891,491 | $573,735 | ||||||
Total distributions to shareholders | $— | $(16,541,275 | ) | |||||
Change in net assets from fund share transactions | $(26,662,004 | ) | $(78,202,132 | ) | ||||
Total change in net assets | $(3,770,513 | ) | $(94,169,672 | ) | ||||
Net assets | ||||||||
At beginning of period | 482,325,951 | 576,495,623 | ||||||
At end of period | $478,555,438 | $482,325,951 | ||||||
See Notes to Financial Statements
9
Table of Contents
MFS Government Securities Portfolio
FINANCIAL STATEMENTS | FINANCIAL HIGHLIGHTS
The financial highlights table is intended to help you understand the fund’s financial performance for the semiannual period and the past 5 fiscal years. Certain information reflects financial results for a single fund share. The total returns in the table represent the rate that an investor would have earned (or lost) on an investment in the fund share class (assuming reinvestment of all distributions) held for the entire period.
| Initial Class | Six months 6/30/19 | Year ended | ||||||||||||||||||||||
| 12/31/18 | 12/31/17 | 12/31/16 | 12/31/15 | 12/31/14 | ||||||||||||||||||||
| (unaudited) | ||||||||||||||||||||||||
Net asset value, beginning of period | $12.04 | $12.39 | $12.51 | $12.72 | $13.02 | $12.73 | ||||||||||||||||||
| Income (loss) from investment operations | ||||||||||||||||||||||||
Net investment income (loss) (d) | $0.16 | $0.30 | $0.31 | $0.31 | (c) | $0.27 | $0.26 | |||||||||||||||||
Net realized and unrealized gain (loss) | 0.43 | (0.25 | ) | (0.03 | ) | (0.17 | ) | (0.21 | ) | 0.35 | ||||||||||||||
Total from investment operations | $0.59 | $0.05 | $0.28 | $0.14 | $0.06 | $0.61 | ||||||||||||||||||
| Less distributions declared to shareholders | ||||||||||||||||||||||||
From net investment income | $— | $(0.40 | ) | $(0.40 | ) | $(0.35 | ) | $(0.36 | ) | $(0.32 | ) | |||||||||||||
Net asset value, end of period (x) | $12.63 | $12.04 | $12.39 | $12.51 | $12.72 | $13.02 | ||||||||||||||||||
Total return (%) (k)(r)(s)(x) | 4.90 | (n) | 0.47 | 2.22 | 1.04 | (c) | 0.47 | 4.86 | ||||||||||||||||
| Ratios (%) (to average net assets) and Supplemental data: | ||||||||||||||||||||||||
Expenses before expense reductions (f) | 0.61 | (a) | 0.60 | 0.60 | 0.57 | (c) | 0.60 | 0.60 | ||||||||||||||||
Expenses after expense reductions (f) | 0.58 | (a) | 0.59 | 0.60 | 0.56 | (c) | 0.59 | 0.59 | ||||||||||||||||
Net investment income (loss) | 2.68 | (a) | 2.45 | 2.45 | 2.40 | (c) | 2.09 | 2.04 | ||||||||||||||||
Portfolio turnover | 19 | (n) | 35 | 24 | 48 | 81 | 61 | |||||||||||||||||
Net assets at end of period (000 omitted) | $308,258 | $310,387 | $364,445 | $388,457 | $424,025 | $484,573 | ||||||||||||||||||
| Service Class | Six months 6/30/19 | Year ended | ||||||||||||||||||||||
| 12/31/18 | 12/31/17 | 12/31/16 | 12/31/15 | 12/31/14 | ||||||||||||||||||||
| (unaudited) | ||||||||||||||||||||||||
Net asset value, beginning of period | $11.96 | $12.31 | $12.42 | $12.64 | $12.93 | $12.63 | ||||||||||||||||||
| Income (loss) from investment operations | ||||||||||||||||||||||||
Net investment income (loss) (d) | $0.15 | $0.26 | $0.27 | $0.28 | (c) | $0.24 | $0.23 | |||||||||||||||||
Net realized and unrealized gain (loss) | 0.43 | (0.24 | ) | (0.02 | ) | (0.18 | ) | (0.21 | ) | 0.36 | ||||||||||||||
Total from investment operations | $0.58 | $0.02 | $0.25 | $0.10 | $0.03 | $0.59 | ||||||||||||||||||
| Less distributions declared to shareholders | ||||||||||||||||||||||||
From net investment income | $— | $(0.37 | ) | $(0.36 | ) | $(0.32 | ) | $(0.32 | ) | $(0.29 | ) | |||||||||||||
Net asset value, end of period (x) | $12.54 | $11.96 | $12.31 | $12.42 | $12.64 | $12.93 | ||||||||||||||||||
Total return (%) (k)(r)(s)(x) | 4.85 | (n) | 0.17 | 2.03 | 0.68 | (c) | 0.26 | 4.67 | ||||||||||||||||
| Ratios (%) (to average net assets) and Supplemental data: | ||||||||||||||||||||||||
Expenses before expense reductions (f) | 0.86 | (a) | 0.85 | 0.85 | 0.82 | (c) | 0.85 | 0.85 | ||||||||||||||||
Expenses after expense reductions (f) | 0.83 | (a) | 0.84 | 0.85 | 0.81 | (c) | 0.84 | 0.84 | ||||||||||||||||
Net investment income (loss) | 2.43 | (a) | 2.20 | 2.20 | 2.15 | (c) | 1.84 | 1.79 | ||||||||||||||||
Portfolio turnover | 19 | (n) | 35 | 24 | 48 | 81 | 61 | |||||||||||||||||
Net assets at end of period (000 omitted) | $170,297 | $171,938 | $212,050 | $236,831 | $256,958 | $299,520 | ||||||||||||||||||
See Notes to Financial Statements
10
Table of Contents
MFS Government Securities Portfolio
Financial Highlights – continued
| (a) | Annualized. |
| (c) | Amount reflects aone-time reimbursement of expenses by the custodian (or former custodian) without which net investment income and performance would be lower and expenses would be higher. |
| (d) | Per share data is based on average shares outstanding. |
| (f) | Ratios do not reflect reductions from fees paid indirectly, if applicable. |
| (k) | The total return does not reflect expenses that apply to separate accounts. Inclusion of these charges would reduce the total return figures for all periods shown. |
| (n) | Not annualized. |
| (r) | Certain expenses have been reduced without which performance would have been lower. |
| (s) | From time to time the fund may receive proceeds from litigation settlements, without which performance would be lower. |
| (x) | The net asset values and total returns have been calculated on net assets which include adjustments made in accordance with U.S. generally accepted accounting principles required at period end for financial reporting purposes. |
See Notes to Financial Statements
11
Table of Contents
MFS Government Securities Portfolio
NOTES TO FINANCIAL STATEMENTS (unaudited)
| (1) | Business and Organization |
MFS Government Securities Portfolio (the fund) is a diversified series of MFS Variable Insurance Trust II (the trust). The trust is organized as a Massachusetts business trust and is registered under the Investment Company Act of 1940, as amended, as anopen-end management investment company. The shareholders of each series of the trust are separate accounts of insurance companies, which offer variable annuity and/or life insurance products, and qualified retirement and pension plans.
The fund is an investment company and accordingly follows the investment company accounting and reporting guidance of the Financial Accounting Standards Board (FASB) Accounting Standards Codification Topic 946 Financial Services – Investment Companies.
| (2) | Significant Accounting Policies |
General – The preparation of financial statements in conformity with U.S. generally accepted accounting principles requires management to make estimates and assumptions that affect the reported amounts of assets and liabilities, and disclosure of contingent assets and liabilities at the date of the financial statements and the reported amounts of increases and decreases in net assets from operations during the reporting period. Actual results could differ from those estimates. In the preparation of these financial statements, management has evaluated subsequent events occurring after the date of the fund’s Statement of Assets and Liabilities through the date that the financial statements were issued.
Balance Sheet Offsetting – The fund’s accounting policy with respect to balance sheet offsetting is that, absent an event of default by the counterparty or a termination of the agreement, the International Swaps and Derivatives Association (ISDA) Master Agreement, or similar agreement, does not result in an offset of reported amounts of financial assets and financial liabilities in the Statement of Assets and Liabilities across transactions between the fund and the applicable counterparty. The fund’s right to setoff may be restricted or prohibited by the bankruptcy or insolvency laws of the particular jurisdiction to which a specific master netting agreement counterparty is subject. Balance sheet offsetting disclosures, to the extent applicable to the fund, have been included in the fund’s Significant Accounting Policies note under the captions for each of the fund’sin-scope financial instruments and transactions.
Investment Valuations – Debt instruments and floating rate loans, including restricted debt instruments, are generally valued at an evaluated or composite bid as provided by a third-party pricing service. Debt instruments sold short are generally valued at an evaluated or composite mean as provided by a third-party pricing service. Short-term instruments with a maturity at issuance of 60 days or less may be valued at amortized cost, which approximates market value. Futures contracts are generally valued at last posted settlement price on their primary exchange as provided by a third-party pricing service. Futures contracts for which there were no trades that day for a particular position are generally valued at the closing bid quotation on their primary exchange as provided by a third-party pricing service.Open-end investment companies are generally valued at net asset value per share. Securities and other assets generally valued on the basis of information from a third-party pricing service may also be valued at a broker/dealer bid quotation. In determining values, third-party pricing services can utilize both transaction data and market information such as yield, quality, coupon rate, maturity, type of issue, trading characteristics, and other market data.
The Board of Trustees has delegated primary responsibility for determining or causing to be determined the value of the fund’s investments (including any fair valuation) to the adviser pursuant to valuation policies and procedures approved by the Board. If the adviser determines that reliable market quotations are not readily available, investments are valued at fair value as determined in good faith by the adviser in accordance with such procedures under the oversight of the Board of Trustees. Under the fund’s valuation policies and procedures, market quotations are not considered to be readily available for most types of debt instruments and floating rate loans and many types of derivatives. These investments are generally valued at fair value based on information from third-party pricing services. In addition, investments may be valued at fair value if the adviser determines that an investment’s value has been materially affected by events occurring after the close of the exchange or market on which the investment is principally traded (such as foreign exchange or market) and prior to the determination of the fund’s net asset value, or after the halt of trading of a specific security where trading does not resume prior to the close of the exchange or market on which the security is principally traded. The adviser generally relies on third-party pricing services or other information (such as the correlation with price movements of similar securities in the same or other markets; the type, cost and investment characteristics of the security; the business and financial condition of the issuer; and trading and other market data) to assist in determining whether to fair value and at what value to fair value an investment. The value of an investment for purposes of calculating the fund’s net asset value can differ depending on the source and method used to determine value. When fair valuation is used, the value of an investment used to determine the fund’s net asset value may differ from quoted or published prices for the same investment. There can be no assurance that the fund could obtain the fair value assigned to an investment if it were to sell the investment at the same time at which the fund determines its net asset value per share.
Various inputs are used in determining the value of the fund’s assets or liabilities. These inputs are categorized into three broad levels. In certain cases, the inputs used to measure fair value may fall into different levels of the fair value hierarchy. In such cases, an investment’s level within the fair value hierarchy is based on the lowest level of input that is significant to the fair value
12
Table of Contents
MFS Government Securities Portfolio
Notes to Financial Statements (unaudited) – continued
measurement. The fund’s assessment of the significance of a particular input to the fair value measurement in its entirety requires judgment, and considers factors specific to the investment. Level 1 includes unadjusted quoted prices in active markets for identical assets or liabilities. Level 2 includes other significant observable market-based inputs (including quoted prices for similar securities, interest rates, prepayment speed, and credit risk). Level 3 includes unobservable inputs, which may include the adviser’s own assumptions in determining the fair value of investments. Other financial instruments are derivative instruments, such as futures contracts. The following is a summary of the levels used as of June 30, 2019 in valuing the fund’s assets or liabilities:
| Financial Instruments | Level 1 | Level 2 | Level 3 | Total | ||||||||||||
| U.S. Treasury Bonds & U.S. Government Agency & Equivalents | $— | $168,335,314 | $— | $168,335,314 | ||||||||||||
| Non-U.S. Sovereign Debt | — | 1,411,327 | — | 1,411,327 | ||||||||||||
| Municipal Bonds | — | 6,703,362 | — | 6,703,362 | ||||||||||||
| U.S. Corporate Bonds | — | 6,659,234 | — | 6,659,234 | ||||||||||||
| Residential Mortgage-Backed Securities | — | 262,334,077 | — | 262,334,077 | ||||||||||||
| Commercial Mortgage-Backed Securities | — | 10,445,612 | — | 10,445,612 | ||||||||||||
| Asset-Backed Securities (including CDOs) | — | 13,661,846 | — | 13,661,846 | ||||||||||||
| Foreign Bonds | — | 6,351,501 | — | 6,351,501 | ||||||||||||
| Mutual Funds | 8,467,535 | — | — | 8,467,535 | ||||||||||||
| Total | $8,467,535 | $475,902,273 | $— | $484,369,808 | ||||||||||||
| TBA Sale Commitments | $— | $(1,833,728 | ) | $— | $(1,833,728 | ) | ||||||||||
| Other Financial Instruments | ||||||||||||||||
| Futures Contracts – Assets | $74,892 | $— | $— | $74,892 | ||||||||||||
| Futures Contracts – Liabilities | (161,677 | ) | — | — | (161,677 | ) | ||||||||||
For further information regarding security characteristics, see the Portfolio of Investments.
Derivatives– The fund uses derivatives primarily to increase or decrease exposure to a particular market or segment of the market, or security, to increase or decrease interest rate or currency exposure, or as alternatives to direct investments. Derivatives are used for hedging ornon-hedging purposes. While hedging can reduce or eliminate losses, it can also reduce or eliminate gains. When the fund uses derivatives as an investment to increase market exposure, or for hedging purposes, gains and losses from derivative instruments may be substantially greater than the derivative’s original cost.
The derivative instruments used by the fund during the period were futures contracts. Depending on the type of derivative, the fund may exit a derivative position by entering into an offsetting transaction with a counterparty or exchange, negotiating an agreement with the derivative counterparty, or novating the position to a third party. The fund may be unable to promptly close out a futures position in instances where the daily fluctuation in the price for that type of future exceeds the daily limit set by the exchange. The fund’s period end derivatives, as presented in the Portfolio of Investments and the associated Derivative Contract tables, generally are indicative of the volume of its derivative activity during the period.
The following table presents, by major type of derivative contract, the fair value, on a gross basis, of the asset and liability components of derivatives held by the fund at June 30, 2019 as reported in the Statement of Assets and Liabilities:
| Fair Value (a) | ||||||||||
| Risk | Derivative Contracts | Asset Derivatives | Liability Derivatives | |||||||
| Interest Rate | Interest Rate Futures | $74,892 | $(161,677 | ) | ||||||
| (a) | Values presented in this table for futures contracts correspond to the values reported in the fund’s Portfolio of Investments. Only the current day net variation margin for futures contracts is separately reported within the fund’s Statement of Assets and Liabilities. |
The following table presents, by major type of derivative contract, the realized gain (loss) on derivatives held by the fund for the six months ended June 30, 2019 as reported in the Statement of Operations:
| Risk | Futures Contracts | |||
| Interest Rate | $(529,625 | ) | ||
The following table presents, by major type of derivative contract, the change in unrealized appreciation or depreciation on derivatives held by the fund for the six months ended June 30, 2019 as reported in the Statement of Operations:
| Risk | Futures Contracts | |||
| Interest Rate | $35,869 | |||
Derivative counterparty credit risk is managed through formal evaluation of the creditworthiness of all potential counterparties. On certain, but not all, uncleared derivatives, the fund attempts to reduce its exposure to counterparty credit risk whenever possible by entering into an ISDA Master Agreement on a bilateral basis. The ISDA Master Agreement gives each party to the agreement the
13
Table of Contents
MFS Government Securities Portfolio
Notes to Financial Statements (unaudited) – continued
right to terminate all transactions traded under such agreement if there is a specified deterioration in the credit quality of the other party. Upon an event of default or a termination of the ISDA Master Agreement, thenon-defaulting party has the right to close out all transactions traded under such agreement and to net amounts owed under each agreement to one net amount payable by one party to the other. This right to close out and net payments across all transactions traded under the ISDA Master Agreement could result in a reduction of the fund’s credit risk to such counterparty equal to any amounts payable by the fund under the applicable transactions, if any.
Collateral and margin requirements differ by type of derivative. For cleared derivatives (e.g., futures contracts, cleared swaps, and exchange-traded options), margin requirements are set by the clearing broker and the clearing house and collateral, in the form of cash or securities, is posted by the fund directly with the clearing broker. Collateral terms are counterparty agreement specific for uncleared derivatives (e.g., forward foreign currency exchange contracts, uncleared swap agreements, and uncleared options) and collateral, in the form of cash and securities, is held in segregated accounts with the fund’s custodian in connection with these agreements. For derivatives traded under an ISDA Master Agreement, which contains a collateral support annex, the collateral requirements are netted across all transactions traded under such counterparty-specific agreement and an amount is posted from one party to the other to collateralize such obligations. Cash that has been segregated or delivered to cover the fund’s collateral or margin obligations under derivative contracts, if any, will be reported separately in the Statement of Assets and Liabilities as restricted cash for uncleared derivatives and/or deposits with brokers for cleared derivatives. Securities pledged as collateral or margin for the same purpose, if any, are noted in the Portfolio of Investments. The fund may be required to make payments of interest on uncovered collateral or margin obligations with the broker. Any such payments are included in “Miscellaneous” expense in the Statement of Operations.
Futures Contracts– The fund entered into futures contracts which may be used to hedge against or obtain broad market exposure, interest rate exposure, or to manage duration. A futures contract represents a commitment for the future purchase or sale of an asset at a specified price on a specified date.
Upon entering into a futures contract, the fund is required to deposit with the broker, either in cash or securities, an initial margin in an amount equal to a specified percentage of the notional amount of the contract. Subsequent payments (variation margin) are made or received by the fund each day, depending on the daily fluctuations in the value of the contract, and are recorded for financial statement purposes as unrealized gain or loss by the fund until the contract is closed or expires at which point the gain or loss on futures contracts is realized.
The fund bears the risk of interest rates or securities prices moving unexpectedly, in which case, the fund may not achieve the anticipated benefits of the futures contracts and may realize a loss. While futures contracts may present less counterparty risk to the fund since the contracts are exchange traded and the exchange’s clearinghouse guarantees payments to the broker, there is still counterparty credit risk due to the insolvency of the broker. The fund’s maximum risk of loss due to counterparty credit risk is equal to the margin posted by the fund to the broker plus any gains or minus any losses on the outstanding futures contracts.
TBA Dollar Roll Transactions– The fund enters into TBA dollar roll transactions in which the fund sells TBA mortgage-backed securities to financial institutions and simultaneously agrees to repurchase similar (same issuer, type and coupon) securities at a later date at an agreed-upon price. During the period between the sale and repurchase, the fund will not be entitled to receive interest and principal payments on the securities sold. The fund accounts for dollar roll transactions as purchases and sales and realizes gains and losses on these transactions. TBA dollar roll transactions involve the risk that the market value of the securities that the fund is required to purchase may decline below the agreed upon repurchase price of those securities.
Indemnifications – Under the fund’s organizational documents, its officers and Trustees may be indemnified against certain liabilities and expenses arising out of the performance of their duties to the fund. Additionally, in the normal course of business, the fund enters into agreements with service providers that may contain indemnification clauses. The fund’s maximum exposure under these agreements is unknown as this would involve future claims that may be made against the fund that have not yet occurred.
Investment Transactions and Income – Investment transactions are recorded on the trade date. Interest income is recorded on the accrual basis. All premium and discount is amortized or accreted for financial statement purposes in accordance with U.S. generally accepted accounting principles. Some securities may be purchased on a “when-issued” or “forward delivery” basis, which means that the securities will be delivered to the fund at a future date, usually beyond customary settlement time. Interest payments received in additional securities are recorded on theex-interest date in an amount equal to the value of the security on such date.
The fund may receive proceeds from litigation settlements. Any proceeds received from litigation involving portfolio holdings are reflected in the Statement of Operations in realized gain/loss if the security has been disposed of by the fund or in unrealized gain/loss if the security is still held by the fund. Any other proceeds from litigation not related to portfolio holdings are reflected as other income in the Statement of Operations.
The fund invests a significant portion of its assets in asset-backed and/or mortgage-backed securities. For these securities, the value of the debt instrument also depends on the credit quality and adequacy of the underlying assets or collateral as well as whether
14
Table of Contents
MFS Government Securities Portfolio
Notes to Financial Statements (unaudited) – continued
there is a security interest in the underlying assets or collateral. Enforcing rights, if any, against the underlying assets or collateral may be difficult. U.S. Government securities not supported as to the payment of principal or interest by the U.S. Treasury, such as those issued by Fannie Mae, Freddie Mac, and the Federal Home Loan Banks, are subject to greater credit risk than are U.S. Government securities supported by the U.S. Treasury, such as those issued by Ginnie Mae.
The fund purchased or sold debt securities on a when-issued or delayed delivery basis, or in a “To Be Announced” (TBA) or “forward commitment” transaction with delivery or payment to occur at a later date beyond the normal settlement period. When the fund sells securities on a when-issued, delayed delivery, or forward commitment basis, the fund typically owns or has the right to acquire securities equivalent in kind and amount to the delivered securities. At the time a fund enters into a commitment to purchase or sell a security, the transaction is recorded and the value of the security acquired is reflected in the fund’s net asset value. The price of such security and the date that the security will be delivered and paid for are fixed at the time the transaction is negotiated. The value of the security may vary with market fluctuations. TBA securities resulting from these transactions are included in the Portfolio of Investments. TBA purchase (sale) commitments are held at carrying amount, which approximates fair value and are categorized as level 2 within the fair value hierarchy. No interest accrues to the fund until payment takes place. At the time that a fund enters into this type of transaction, the fund is required to have sufficient cash and/or liquid securities to cover its commitments. Losses may arise due to changes in the value of the underlying securities prior to settlement date or if the counterparty does not perform under the contract’s terms, or if the issuer does not issue the securities due to political, economic or other factors.
To mitigate the counterparty credit risk on TBA securities and other types of forward settling mortgage-backed securities, the fund whenever possible enters into a Master Securities Forward Transaction Agreement (“MSFTA”) on a bilateral basis with each of the counterparties with whom it undertakes a significant volume of transactions. The MSFTA gives each party to the agreement the right to terminate all transactions traded under such agreement if there is a specified deterioration in the credit quality of the other party. Upon an event of default or a termination of the MSFTA, thenon-defaulting party has the right to close out all transactions traded under such agreement and to net amounts owed under each transaction to one net amount payable by one party to the other. This right to close out and net payments across all transactions traded under the MSFTA could result in a reduction of the fund’s credit risk to such counterparty equal to any amounts payable by the fund under the applicable transactions, if any.
For mortgage-backed securities traded under a MSFTA, the collateral and margining requirements are contract specific. Collateral amounts across all transactions traded under such agreement are netted and an amount is posted from one party to the other to collateralize such obligations. Cash that has been pledged to cover the fund’s collateral or margin obligations under a MSFTA, if any, will be reported separately on the Statement of Assets and Liabilities as restricted cash. Securities pledged as collateral or margin for the same purpose, if any, are noted in the Portfolio of Investments.
Tax Matters and Distributions – The fund intends to qualify as a regulated investment company, as defined under Subchapter M of the Internal Revenue Code, and to distribute all of its taxable income, including realized capital gains. As a result, no provision for federal income tax is required. The fund’s federal tax returns, when filed, will remain subject to examination by the Internal Revenue Service for a three year period. Management has analyzed the fund’s tax positions taken on federal and state tax returns for all open tax years and does not believe that there are any uncertain tax positions that require recognition of a tax liability. Foreign taxes, if any, have been accrued by the fund in the accompanying financial statements in accordance with the applicable foreign tax law. Foreign income taxes may be withheld by certain countries in which the fund invests. Additionally, capital gains realized by the fund on securities issued in or by certain foreign countries may be subject to capital gains tax imposed by those countries.
Distributions to shareholders are recorded on theex-dividend date. Income and capital gain distributions are determined in accordance with income tax regulations, which may differ from U.S. generally accepted accounting principles. Certain capital accounts in the financial statements are periodically adjusted for permanent differences in order to reflect their tax character. These adjustments have no impact on net assets or net asset value per share. Temporary differences which arise from recognizing certain items of income, expense, gain or loss in different periods for financial statement and tax purposes will reverse at some time in the future. Distributions in excess of net investment income or net realized gains are temporary overdistributions for financial statement purposes resulting from differences in the recognition or classification of income or distributions for financial statement and tax purposes.
Book/tax differences primarily relate to amortization and accretion of debt securities and wash sale loss deferrals.
The tax character of distributions declared to shareholders for the last fiscal year is as follows:
| Year ended 12/31/18 | ||||
| Ordinary income (including any short-term capital gains) | $16,541,275 | |||
15
Table of Contents
MFS Government Securities Portfolio
Notes to Financial Statements (unaudited) – continued
The federal tax cost and the tax basis components of distributable earnings were as follows:
| As of 6/30/19 | ||||
| Cost of investments | $472,383,413 | |||
| Gross appreciation | 12,307,808 | |||
| Gross depreciation | (2,155,140 | ) | ||
| Net unrealized appreciation (depreciation) | $10,152,668 | |||
| As of 12/31/18 | ||||
| Undistributed ordinary income | 13,608,126 | |||
| Capital loss carryforwards | (26,214,609 | ) | ||
| Net unrealized appreciation (depreciation) | (7,283,887 | ) | ||
The aggregate cost above includes prior fiscal year end tax adjustments, if applicable.
As of December 31, 2018, the fund had capital loss carryforwards available to offset future realized gains. These net capital losses may be carried forward indefinitely and their character is retained as short-term and/or long-term losses. Such losses are characterized as follows:
| Short-Term | $(6,565,848 | ) | ||
| Long-Term | (19,648,761 | ) | ||
| Total | $(26,214,609 | ) |
Multiple Classes of Shares of Beneficial Interest– The fund offers multiple classes of shares, which differ in their respective distribution and/or service fees. The fund’s income, realized and unrealized gain (loss), and common expenses are allocated to shareholders based on the daily net assets of each class. Dividends are declared separately for each class. Differences in per share dividend rates are generally due to differences in separate class expenses. The fund’s distributions declared to shareholders as reported in the Statements of Changes in Net Assets are presented by class as follows:
| From net investment income | ||||||||
| Six months ended 6/30/19 | Year ended 12/31/18 | |||||||
| Initial Class | $— | $10,880,020 | ||||||
| Service Class | — | 5,661,255 | ||||||
| Total | $— | $16,541,275 | ||||||
| (3) | Transactions with Affiliates |
Investment Adviser – The fund has an investment advisory agreement with MFS to provide overall investment management and related administrative services and facilities to the fund. The management fee is computed daily and paid monthly at the following annual rates based on the fund’s average daily net assets:
| Up to $1 billion | 0.55% | |||
| In excess of $1 billion | 0.50% |
MFS has agreed in writing to reduce its management fee by a specified amount if certain MFS mutual fund assets exceed thresholds agreed to by MFS and the fund’s Board of Trustees. For the six months ended June 30, 2019, this management fee reduction amounted to $22,642, which is included in the reduction of total expenses in the Statement of Operations. The management fee incurred for the six months ended June 30, 2019 was equivalent to an annual effective rate of 0.54% of the fund’s average daily net assets.
The investment adviser has agreed in writing to pay a portion of the fund’s total annual operating expenses, excluding interest, taxes, extraordinary expenses, brokerage and transaction costs, and investment-related expenses, such that total annual operating expenses do not exceed 0.58% of average daily net assets for the Initial Class shares and 0.83% of average daily net assets for the Service Class shares. This written agreement will continue until modified by the fund’s Board of Trustees, but such agreement will continue at least until April 30, 2021. For the six months ended June 30, 2019, this reduction amounted to $38,657, which is included in the reduction of total expenses in the Statement of Operations.
Distributor – MFS Fund Distributors, Inc. (MFD), a wholly-owned subsidiary of MFS, is the distributor of shares of the fund. The Trustees have adopted a distribution plan for the Service Class shares pursuant to Rule12b-1 under the Investment Company Act of 1940.
The fund’s distribution plan provides that the fund will pay MFD distribution and/or service fees equal to 0.25% per annum of its average daily net assets attributable to Service Class shares as partial consideration for services performed and expenses incurred by
16
Table of Contents
MFS Government Securities Portfolio
Notes to Financial Statements (unaudited) – continued
MFD and financial intermediaries (including participating insurance companies that invest in the fund to fund variable annuity and variable life insurance contracts, sponsors of qualified retirement and pension plans that invest in the fund, and affiliates of these participating insurance companies and plan sponsors) in connection with the sale and distribution of the Service Class shares. MFD may subsequently pay all, or a portion, of the distribution and/or service fees to financial intermediaries.
Shareholder Servicing Agent – MFS Service Center, Inc. (MFSC), a wholly-owned subsidiary of MFS, receives a fee from the fund for its services as shareholder servicing agent. For the six months ended June 30, 2019, the fee was $2,542, which equated to 0.0011% annually of the fund’s average daily net assets. MFSC also receives payment from the fund forout-of-pocket expenses paid by MFSC on behalf of the fund. For the six months ended June 30, 2019, these costs amounted to $150.
Administrator – MFS provides certain financial, legal, shareholder communications, compliance, and other administrative services to the fund. Under an administrative services agreement, the fund reimburses MFS the costs incurred to provide these services. The fund is charged an annual fixed amount of $17,500 plus a fee based on average daily net assets. The administrative services fee incurred for the six months ended June 30, 2019 was equivalent to an annual effective rate of 0.0162% of the fund’s average daily net assets.
Trustees’ and Officers’ Compensation – The fund pays compensation to independent Trustees in the form of a retainer, attendance fees, and additional compensation to Board and Committee chairpersons. The fund does not pay compensation directly to Trustees or officers of the fund who are also officers of the investment adviser, all of whom receive remuneration from MFS for their services to the fund. Certain officers and Trustees of the fund are officers or directors of MFS, MFD, and MFSC.
Other – This fund and certain other funds managed by MFS (the funds) had entered into a service agreement (the ISO Agreement) which provided for payment of fees solely by the funds to Tarantino LLC in return for the provision of services of an Independent Senior Officer (ISO) for the funds. Frank L. Tarantino served as the ISO and was an officer of the funds and the sole member of Tarantino LLC. Effective June 30, 2019, Mr. Tarantino retired from his position as ISO for the funds, and the ISO Agreement was terminated. For the six months ended June 30, 2019, the fee paid by the fund under this agreement was $567 and is included in “Miscellaneous” expense in the Statement of Operations. MFS had agreed to bear all expenses associated with office space, other administrative support, and supplies provided to the ISO.
The fund invests in the MFS Institutional Money Market Portfolio which is managed by MFS and seeks current income consistent with preservation of capital and liquidity. This money market fund does not pay a management fee to MFS.
| (4) | Portfolio Securities |
For the six months ended June 30, 2019, purchases and sales of investments, other than TBA sale commitments and short-term obligations, were as follows:
| Purchases | Sales | |||||||
| U.S. Government securities | $85,086,831 | $92,757,844 | ||||||
| Non-U.S. Government securities | $5,783,106 | $19,258,759 | ||||||
| (5) | Shares of Beneficial Interest |
The fund’s Declaration of Trust permits the Trustees to issue an unlimited number of full and fractional shares of beneficial interest. Transactions in fund shares were as follows:
| Six months ended 6/30/19 | Year ended 12/31/18 | |||||||||||||||
| Shares | Amount | Shares | Amount | |||||||||||||
| Shares sold | ||||||||||||||||
Initial Class | 280,864 | $3,451,650 | 420,018 | $5,061,750 | ||||||||||||
Service Class | 561,827 | 6,814,317 | 642,376 | 7,707,935 | ||||||||||||
| 842,691 | $10,265,967 | 1,062,394 | $12,769,685 | |||||||||||||
| Shares issued to shareholders in reinvestment of distributions | ||||||||||||||||
Initial Class | — | $— | 916,598 | $10,880,020 | ||||||||||||
Service Class | — | — | 479,361 | 5,661,255 | ||||||||||||
| — | $— | 1,395,959 | $16,541,275 | |||||||||||||
| Shares reacquired | ||||||||||||||||
Initial Class | (1,668,014 | ) | $(20,414,380 | ) | (4,972,729 | ) | $(59,818,993 | ) | ||||||||
Service Class | (1,354,881 | ) | (16,513,591 | ) | (3,978,973 | ) | (47,694,099 | ) | ||||||||
| (3,022,895 | ) | $(36,927,971 | ) | (8,951,702 | ) | $(107,513,092 | ) | |||||||||
| Net change | ||||||||||||||||
Initial Class | (1,387,150 | ) | $(16,962,730 | ) | (3,636,113 | ) | $(43,877,223 | ) | ||||||||
Service Class | (793,054 | ) | (9,699,274 | ) | (2,857,236 | ) | (34,324,909 | ) | ||||||||
| (2,180,204 | ) | $(26,662,004 | ) | (6,493,349 | ) | $(78,202,132 | ) | |||||||||
17
Table of Contents
MFS Government Securities Portfolio
Notes to Financial Statements (unaudited) – continued
The fund is one of several mutual funds in which certain MFS funds may invest. The MFS funds do not invest in the underlying funds for the purpose of exercising management or control. At the end of the period, the MFS Moderate Allocation Portfolio and the MFS Conservative Allocation Portfolio were the owners of record of approximately 30% and 9%, respectively, of the value of outstanding voting shares of the fund.
| (6) | Line of Credit |
The fund and certain other funds managed by MFS participate in a $1.25 billion unsecured committed line of credit, subject to a $1 billion sublimit, provided by a syndicate of banks under a credit agreement. Borrowings may be made for temporary financing needs. Interest is charged to each fund, based on its borrowings, generally at a rate equal to the highest of one month LIBOR, the Federal Funds Effective Rate and the Overnight Bank Funding Rate, plus an agreed upon spread. A commitment fee, based on the average daily, unused portion of the committed line of credit, is allocated among the participating funds. In addition, the fund and other funds managed by MFS have established unsecured uncommitted borrowing arrangements with certain banks for temporary financing needs. Interest is charged to each fund, based on its borrowings, at rates equal to customary reference rates plus an agreed upon spread. For the six months ended June 30, 2019, the fund’s commitment fee and interest expense were $1,535 and $0, respectively, and are included in “Miscellaneous” expense in the Statement of Operations.
| (7) | Investments in Affiliated Issuers |
An affiliated issuer may be considered one in which the fund owns 5% or more of the outstanding voting securities, or a company which is under common control. For the purposes of this report, the following were affiliated issuers:
| Affiliated Issuers | Beginning Value | Purchases | Sales Proceeds | Realized Gain (Loss) | Change in Unrealized Appreciation or Depreciation | Ending Value | ||||||||||||||||||
| MFS Institutional Money Market Portfolio | $26,672 | $69,754,097 | $61,314,758 | $230 | $1,294 | $8,467,535 | ||||||||||||||||||
| Affiliated Issuers | Dividend Income | Capital Gain Distributions | ||||||||||||||||||||||
| MFS Institutional Money Market Portfolio | $64,171 | $— | ||||||||||||||||||||||
18
Table of Contents
MFS Government Securities Portfolio
PROXY VOTING POLICIES AND INFORMATION
MFS votes proxies on behalf of the fund pursuant to proxy voting policies and procedures that are available without charge, upon request, by calling 1-800-225-2606, by visitingmfs.com/proxyvoting, or by visiting the SEC’s Web site athttp://www.sec.gov.
Information regarding how the fund voted proxies relating to portfolio securities during the most recent twelve-month period ended June 30 is available by August 31 of each year without charge by visitingmfs.com/proxyvoting, or by visiting the SEC’s Web site athttp://www.sec.gov.
QUARTERLY PORTFOLIO DISCLOSURE
The fund files a complete schedule of portfolio holdings with the SEC for the first and third quarters of each fiscal year on Form N-Q or as an exhibit to its reports on Form N-PORT (for first and third fiscal quarters ending March 31, 2019 or after). The fund’sForm N-Q or Form N-PORT reports are available on the SEC’s website athttp://www.sec.gov.A shareholder can obtain the portfolio holdings report for the first and third quarters of the fund’s fiscal year atmfs.com/vit2 by choosing the fund’s name and then selecting the “Resources” tab and clicking on “Prospectus and Reports”.
From time to time, MFS may post important information about the fund or the MFS funds on the MFS web site (mfs.com). This information is available athttps://www.mfs.com/en-us/what-we-do/announcements.htmlor atmfs.com/vit2 by choosing the fund’s name.
INFORMATION ABOUT FUND CONTRACTS AND LEGAL CLAIMS
The fund has entered into contractual arrangements with an investment adviser, administrator, distributor, shareholder servicing agent, 529 program manager (if applicable), and custodian who each provide services to the fund. Unless expressly stated otherwise, shareholders are not parties to, or intended beneficiaries of these contractual arrangements, and these contractual arrangements are not intended to create any shareholder right to enforce them against the service providers or to seek any remedy under them against the service providers, either directly or on behalf of the fund.
Under the Trust’s By-Laws and Declaration of Trust, any claims asserted against or on behalf of the MFS Funds, including claims against Trustees and Officers, must be brought in state and federal courts located within the Commonwealth of Massachusetts.
19
Table of Contents
Table of Contents
Semiannual Report
June 30, 2019

MFS® High Yield Portfolio

MFS® Variable Insurance Trust II
Beginning on January 1, 2021, as permitted by regulations adopted by the U.S. Securities and Exchange Commission, the insurance company that offers your contract may determine that it will no longer send you paper copies of the fund’s annual and semiannual shareholder reports unless you specifically request paper copies from the insurance company or from your financial intermediary. Instead, the shareholder reports will be made available on a Web site (insurancefunds.mfs.com or other Web site of which you will be notified), and the insurance company will notify you by mail each time a report is posted and provide you with a Web site link to access the report. Instructions for requesting paper copies will be provided by your insurance company or financial intermediary.
If you already elected to receive shareholder reports by email, you will not be affected by this change and you need not take any action. If your insurance company or financial intermediary offers electronic delivery, you may elect to receive shareholder reports and other communications from the insurance company or financial intermediary by email by following the instructions provided by the insurance company or financial intermediary.
Beginning on January 1, 2019, you may elect to receive all future reports in paper free of charge from the insurance company or financial intermediary. You can inform the insurance company or financial intermediary that you wish to continue receiving paper copies of your shareholder reports by contacting your insurance company or financial intermediary. Your election to receive reports in paper will apply to all funds held in your account with your insurance company or financial intermediary.
HYS-SEM
Table of Contents
MFS® High Yield Portfolio
The report is prepared for the general information of contract owners. It is authorized for distribution to prospective investors only when preceded or accompanied by a current prospectus.
NOT FDIC INSURED• MAY LOSE VALUE• NO BANK OR CREDIT UNION GUARANTEE• NOT A DEPOSIT• NOT INSURED BY ANY FEDERAL GOVERNMENT AGENCY OR NCUA/NCUSIF
Table of Contents
MFS High Yield Portfolio
LETTER FROM THE EXECUTIVE CHAIRMAN

Dear Contract Owners:
Slowing global growth, low inflation, and increasing trade friction between the United States and China have been hallmarks of the past 12 months. After experiencing an uptick in market volatility in late 2018, markets steadied during the first half of 2019, thanks in large measure to the adoption of a dovish policy stance on the part of global central banks, who have largely abandoned efforts to normalize interest rates and have instead focused on supporting economic growth. Trade tensions remain high as the U.S. has ratcheted up tariffs on Chinese imports and China has retaliated. A truce of sorts was reached midyear, but significant challenges continue to confront negotiators, and it is not known whether a comprehensive agreement can be reached.
With Boris Johnson replacing Theresa May as Britain’s prime minister, uncertainty over Brexit remains high. Johnson has adopted a more combative stance than his predecessor toward the European Union, increasing concerns that there will be a “hard” Brexit.
Markets expect that the longest economic expansion in U.S. history will continue for the time being, albeit at a slower pace. Nevertheless, slower growth and low inflation have spurred the U.S. Federal Reserve to take a more accommodative policy stance, prompting investors to anticipate several interest rate cuts in the coming year. The European Central Bank has adopted a similar position. The more accommodative environment has helped fuel a continued rise in global equities and has been broadly supportive of risk assets.
Since launching the first U.S.open-end mutual fund in 1924, MFS® has been committed to a single purpose: to create value by allocating capital responsibly for clients. Through our powerful global investment platform, we combine collective expertise, thoughtful risk management, and long-term discipline to uncover what we believe are the best investment opportunities in the market.
Respectfully,

Robert J. Manning
Executive Chairman
MFS Investment Management
August 16, 2019
The opinions expressed in this letter are subject to change and may not be relied upon for investment advice. No forecasts can be guaranteed.
1
Table of Contents
MFS High Yield Portfolio
Portfolio structure (i)
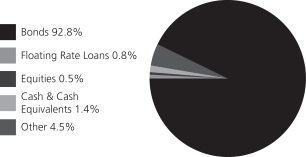
| Top five industries (i) | ||||
| Cable TV | 9.8% | |||
| Medical & Health Technology & Services | 6.5% | |||
| Telecommunications – Wireless | 5.6% | |||
| Building | 5.1% | |||
| Gaming & Lodging | 5.0% |
| Composition including fixed income credit quality (a)(i) |
| |||
| BBB | 3.2% | |||
| BB | 51.0% | |||
| B | 34.1% | |||
| CCC | 9.5% | |||
| CC | 0.2% | |||
| C (o) | 0.0% | |||
| Not Rated | (4.4)% | |||
| Non-Fixed Income | 0.5% | |||
| Cash & Cash Equivalents | 1.4% | |||
| Other | 4.5% | |||
| Portfolio facts (i) | ||||
| Average Duration (d) | 2.9 | |||
| Average Effective Maturity (m) | 4.0 yrs. | |||
| (a) | For all securities other than those specifically described below, ratings are assigned to underlying securities utilizing ratings from Moody’s, Fitch, and Standard & Poor’s rating agencies and applying the following hierarchy: If all three agencies provide a rating, the middle rating (after dropping the highest and lowest ratings) is assigned; if two of the three agencies rate a security, the lower of the two is assigned. Ratings are shown in the S&P and Fitch scale (e.g., AAA). Securities rated BBB or higher are considered investment grade. All ratings are subject to change. Not Rated includes fixed income securities and fixed income derivatives, which have not been rated by any rating agency.Non-Fixed Income includes any equity securities (including convertible bonds and equity derivatives) and/or commodity-linked derivatives. The fund may or may not have held all of these instruments on this date. The fund is not rated by these agencies. |
| (d) | Duration is a measure of how much a bond’s price is likely to fluctuate with general changes in interest rates, e.g., if rates rise 1.00%, a bond with a5-year duration is likely to lose about 5.00% of its value due to the interest rate move. |
| (i) | For purposes of this presentation, the components include the value of securities, and reflect the impact of the equivalent exposure of derivative positions, if any. These amounts may be negative from time to time. Equivalent exposure is a calculated amount that translates the derivative position into a reasonable approximation of the amount of the underlying asset that the portfolio would have to hold at a given point in time to have the same price sensitivity that results from the portfolio’s ownership of the derivative contract. When dealing with derivatives, equivalent exposure is a more representative measure of the potential impact of a position on portfolio performance than value. The bond component will include any accrued interest amounts. |
| (m) | In determining each instrument’s effective maturity for purposes of calculating the fund’s dollar-weighted average effective maturity, MFS uses the instrument’s stated maturity or, if applicable, an earlier date on which MFS believes it is probable that a maturity-shortening device (such as a put,pre-refunding or prepayment) will cause the instrument to be repaid. Such an earlier date can be substantially shorter than the instrument’s stated maturity. |
| (o) | Less than 0.1%. |
Where the fund holds convertible bonds, they are treated as part of the equity portion of the portfolio.
Cash & Cash Equivalents includes any cash, investments in money market funds, short-term securities, and other assets less liabilities. Please see the Statement of Assets and Liabilities for additional information related to the fund’s cash position and other assets and liabilities.
Other includes equivalent exposure from currency derivatives and/or any offsets to derivative positions.
Percentages are based on net assets as of June 30, 2019.
The portfolio is actively managed and current holdings may be different.
2
Table of Contents
MFS High Yield Portfolio
Fund Expenses Borne by the Contract Holders during the Period,
January 1, 2019 through June 30, 2019
As a contract holder of the fund, you incur ongoing costs, including management fees; distribution and/or service(12b-1) fees; and other fund expenses. This example is intended to help you understand your ongoing costs (in dollars) of investing in the fund and to compare these costs with the ongoing costs of investing in other mutual funds.
The example is based on an investment of $1,000 invested at the beginning of the period and held for the entire period January 1, 2019 through June 30, 2019.
Actual Expenses
The first line for each share class in the following table provides information about actual account values and actual expenses. You may use the information in this line, together with the amount you invested, to estimate the expenses that you paid over the period. Simply divide your account value by $1,000 (for example, an $8,600 account value divided by $1,000 = 8.6), then multiply the result by the number in the first line under the heading entitled “Expenses Paid During Period” to estimate the expenses you paid on your account during this period.
Hypothetical Example for Comparison Purposes
The second line for each share class in the following table provides information about hypothetical account values and hypothetical expenses based on the fund’s actual expense ratio and an assumed rate of return of 5% per year before expenses, which is not the fund’s actual return. The hypothetical account values and expenses may not be used to estimate the actual ending account balance or expenses you paid for the period. You may use this information to compare the ongoing costs of investing in the fund and other funds. To do so, compare this 5% hypothetical example with the 5% hypothetical examples that appear in the shareholder reports of the other funds.
Please note that the expenses shown in the table are meant to highlight the fund’s ongoing costs only and do not take into account the fees and expenses imposed under the variable contracts through which your investment in the fund is made. Therefore, the second line for each share class in the table is useful in comparing ongoing costs associated with an investment in vehicles (such as the fund) which fund benefits under variable annuity and variable life insurance contracts and to qualified pension and retirement plans only, and will not help you determine the relative total costs of investing in the fund through variable annuity and variable life insurance contracts. If the fees and expenses imposed under the variable contracts were included, your costs would have been higher.
| Share Class | Annualized Expense Ratio | Beginning Account Value 1/01/19 | Ending Account Value 6/30/19 | Expenses Paid During Period (p) 1/01/19-6/30/19 | ||||||||||||||
| Initial Class | Actual | 0.72% | $1,000.00 | $1,098.49 | $3.75 | |||||||||||||
| Hypothetical (h) | 0.72% | $1,000.00 | $1,021.22 | $3.61 | ||||||||||||||
| Service Class | Actual | 0.97% | $1,000.00 | $1,097.70 | $5.05 | |||||||||||||
| Hypothetical (h) | 0.97% | $1,000.00 | $1,019.98 | $4.86 | ||||||||||||||
| (h) | 5% class return per year before expenses. |
| (p) | “Expenses Paid During Period” are equal to each class’s annualized expense ratio, as shown above, multipliedby the average account value over the period, multiplied by 181/365 (to reflect theone-half year period). |
3
Table of Contents
MFS High Yield Portfolio
PORTFOLIO OF INVESTMENTS – 6/30/19 (unaudited)
The Portfolio of Investments is a complete list of all securities owned by your fund. It is categorized by broad-based asset classes.
| Issuer | Shares/Par | Value ($) | ||||||
| BONDS – 95.9% | ||||||||
| Aerospace – 1.1% |
| |||||||
| Bombardier, Inc., 7.5%, 3/15/2025 (n) | $ | 520,000 | $ | 521,456 | ||||
| TransDigm, Inc., 6.5%, 7/15/2024 | 955,000 | 965,744 | ||||||
| TransDigm, Inc., 6.5%, 5/15/2025 | 555,000 | 561,383 | ||||||
| TransDigm, Inc., 6.25%, 3/15/2026 (n) | 1,160,000 | 1,220,900 | ||||||
| TransDigm, Inc., 6.375%, 6/15/2026 | 915,000 | 921,862 | ||||||
|
| |||||||
| $ | 4,191,345 | |||||||
|
| |||||||
| Asset-Backed & Securitized – 0.0% |
| |||||||
| CWCapital Cobalt Ltd., CDO, “F”, FLR, 3.886% (0% cash or 3.886% PIK), (LIBOR- 3 mo. + 1.3%), 4/26/2050 (a)(p)(z) | $ | 1,213,946 | $ | 121 | ||||
|
| |||||||
| Automotive – 1.7% |
| |||||||
| Allison Transmission, Inc., 5%, 10/01/2024 (n) | $ | 3,559,000 | $ | 3,630,180 | ||||
| Allison Transmission, Inc., 5.875%, 6/01/2029 (n) | 165,000 | 173,662 | ||||||
| IAA Spinco, Inc., 5.5%, 6/15/2027 (n) | 915,000 | 951,600 | ||||||
| Panther BR Aggregator 2 LP/Panther Finance Co., Inc., 8.5%, 5/15/2027 (n) | 1,715,000 | 1,766,450 | ||||||
|
| |||||||
| $ | 6,521,892 | |||||||
|
| |||||||
| Broadcasting – 3.8% |
| |||||||
| iHeartCommunications, Inc., 6.375%, 5/01/2026 (z) | $ | 270,000 | $ | 286,538 | ||||
| Liberty Media Corp. - Liberty Formula One, 8.5%, 7/15/2029 | 1,535,000 | 1,558,025 | ||||||
| Match Group, Inc., 6.375%, 6/01/2024 | 1,750,000 | 1,837,500 | ||||||
| Match Group, Inc., 5%, 12/15/2027 (n) | 1,095,000 | 1,146,903 | ||||||
| Netflix, Inc., 5.875%, 2/15/2025 | 1,885,000 | 2,078,212 | ||||||
| Netflix, Inc., 4.875%, 4/15/2028 | 450,000 | 464,063 | ||||||
| Netflix, Inc., 5.875%, 11/15/2028 | 940,000 | 1,040,693 | ||||||
| Netflix, Inc., 4.625%, 5/15/2029 (n) | EUR | 715,000 | 923,639 | |||||
| Netflix, Inc., 3.875%, 11/15/2029 (z) | 1,200,000 | 1,478,141 | ||||||
| Nexstar Escrow Corp., 5.625%, 7/15/2027 (z) | $ | 630,000 | 644,962 | |||||
| Univision Communications, Inc., 5.125%, 2/15/2025 (n) | 320,000 | 304,400 | ||||||
| WMG Acquisition Corp., 5%, 8/01/2023 (n) | 525,000 | 535,500 | ||||||
| WMG Acquisition Corp., 4.875%, 11/01/2024 (n) | 1,595,000 | 1,632,881 | ||||||
| WMG Acquisition Corp., 5.5%, 4/15/2026 (n) | 300,000 | 309,720 | ||||||
|
| |||||||
| $ | 14,241,177 | |||||||
|
| |||||||
| Building – 5.0% |
| |||||||
| ABC Supply Co., Inc., 5.75%, 12/15/2023 (n) | $ | 1,880,000 | $ | 1,948,150 | ||||
| ABC Supply Co., Inc., 5.875%, 5/15/2026 (n) | 1,770,000 | 1,845,225 | ||||||
| Beacon Escrow Corp., 4.875%, 11/01/2025 (n) | 1,233,000 | 1,220,670 | ||||||
| Issuer | Shares/Par | Value ($) | ||||||
| BONDS – continued | ||||||||
| Building – continued |
| |||||||
| Core & Main LP, 6.125%, 8/15/2025 (n) | $ | 1,380,000 | $ | 1,393,800 | ||||
| HD Supply, Inc., 5.375%, 10/15/2026 (n) | 2,035,000 | 2,146,925 | ||||||
| James Hardie International Finance Ltd., 4.75%, 1/15/2025 (n) | 810,000 | 826,200 | ||||||
| James Hardie International Finance Ltd., 5%, 1/15/2028 (n) | 935,000 | 930,325 | ||||||
| NCI Building Systems, Inc., 8%, 4/15/2026 (n) | 1,000,000 | 973,750 | ||||||
| New Enterprise Stone & Lime Co., Inc., 10.125%, 4/01/2022 (n) | 680,000 | 695,300 | ||||||
| New Enterprise Stone & Lime Co., Inc., 6.25%, 3/15/2026 (n) | 997,000 | 1,011,955 | ||||||
| PriSo Acquisition Corp., 9%, 5/15/2023 (n) | 1,134,000 | 1,060,290 | ||||||
| Standard Industries, Inc., 5.375%, 11/15/2024 (n) | 1,045,000 | 1,081,575 | ||||||
| Standard Industries, Inc., 6%, 10/15/2025 (n) | 1,950,000 | 2,069,437 | ||||||
| Summit Materials LLC/Summit Materials Finance Co., 6.125%, 7/15/2023 | 1,650,000 | 1,670,625 | ||||||
|
| |||||||
| $ | 18,874,227 | |||||||
|
| |||||||
| Business Services – 4.4% |
| |||||||
| Alliance Data Systems Corp., 5.875%, 11/01/2021 (n) | $ | 540,000 | $ | 555,876 | ||||
| Ascend Learning LLC, 6.875%, 8/01/2025 (n) | 1,325,000 | 1,347,790 | ||||||
| CDK Global, Inc., 4.875%, 6/01/2027 | 2,155,000 | 2,228,787 | ||||||
| Equinix, Inc., 5.375%, 4/01/2023 | 745,000 | 759,900 | ||||||
| Equinix, Inc., 5.75%, 1/01/2025 | 1,000,000 | 1,041,000 | ||||||
| Equinix, Inc., 5.875%, 1/15/2026 | 1,045,000 | 1,106,394 | ||||||
| Financial & Risk U.S. Holdings, Inc., 8.25%, 11/15/2026 (n) | 1,435,000 | 1,475,898 | ||||||
| First Data Corp., 5%, 1/15/2024 (n) | 2,785,000 | 2,853,232 | ||||||
| Iron Mountain, Inc., 4.875%, 9/15/2027 | 435,000 | 431,194 | ||||||
| MSCI, Inc., 5.75%, 8/15/2025 (n) | 260,000 | 273,000 | ||||||
| MSCI, Inc., 4.75%, 8/01/2026 (n) | 2,610,000 | 2,707,875 | ||||||
| Vantiv LLC/Vantiv Issuer Corp., 4.375%, 11/15/2025 (n) | 835,000 | 867,356 | ||||||
| Verscend Escrow Corp., 9.75%, 8/15/2026 (n) | 1,005,000 | 1,043,944 | ||||||
|
| |||||||
| $ | 16,692,246 | |||||||
|
| |||||||
| Cable TV – 9.5% | ||||||||
| Altice Financing S.A., 7.5%, 5/15/2026 (n) | $ | 560,000 | $ | 562,856 | ||||
| CCO Holdings LLC/CCO Holdings Capital Corp., 5.75%, 1/15/2024 | 2,250,000 | 2,300,344 | ||||||
| CCO Holdings LLC/CCO Holdings Capital Corp., 5.375%, 5/01/2025 (n) | 615,000 | 635,756 | ||||||
| CCO Holdings LLC/CCO Holdings Capital Corp., 5.75%, 2/15/2026 (n) | 3,780,000 | 3,964,275 | ||||||
| CCO Holdings LLC/CCO Holdings Capital Corp., 5.875%, 5/01/2027 (n) | 1,595,000 | 1,682,725 | ||||||
| CSC Holdings LLC, 5.5%, 5/15/2026 (n) | 1,340,000 | 1,405,258 | ||||||
4
Table of Contents
MFS High Yield Portfolio
Portfolio of Investments (unaudited) – continued
| Issuer | Shares/Par | Value ($) | ||||||
| BONDS – continued |
| |||||||
| Cable TV – continued | ||||||||
| CSC Holdings LLC, 5.5%, 4/15/2027 (n) | $ | 4,160,000 | $ | 4,368,000 | ||||
| CSC Holdings LLC, 7.5%, 4/01/2028 (n) | 875,000 | 960,575 | ||||||
| DISH DBS Corp., 5.875%, 11/15/2024 | 760,000 | 719,150 | ||||||
| Intelsat Connect Finance, 9.5%, 2/15/2023 (n) | 785,000 | 694,725 | ||||||
| Intelsat Jackson Holdings S.A., 5.5%, 8/01/2023 | 1,805,000 | 1,647,063 | ||||||
| Sirius XM Holdings, Inc., 4.625%, 7/15/2024 (z) | 2,205,000 | 2,256,332 | ||||||
| Sirius XM Holdings, Inc., 5.5%, 7/01/2029 (n) | 810,000 | 830,412 | ||||||
| Sirius XM Radio, Inc., 4.625%, 5/15/2023 (n) | 920,000 | 929,200 | ||||||
| Sirius XM Radio, Inc., 6%, 7/15/2024 (n) | 1,605,000 | 1,649,539 | ||||||
| Sirius XM Radio, Inc., 5.375%, 4/15/2025 (n) | 745,000 | 768,281 | ||||||
| Telenet Finance Luxembourg S.A., 5.5%, 3/01/2028 (n) | 1,400,000 | 1,421,000 | ||||||
| Unitymedia KabelBW GmbH, 6.125%, 1/15/2025 (n) | 1,665,000 | 1,732,016 | ||||||
| Videotron Ltd., 5.375%, 6/15/2024 (n) | 455,000 | 486,850 | ||||||
| Videotron Ltd., 5.125%, 4/15/2027 (n) | 3,030,000 | 3,162,562 | ||||||
| Virgin Media Finance PLC, 5.75%, 1/15/2025 (n) | 200,000 | 206,998 | ||||||
| Virgin Media Secured Finance PLC, 5.25%, 1/15/2026 (n) | 1,655,000 | 1,695,895 | ||||||
| Ziggo Bond Finance B.V., 5.875%, 1/15/2025 (n) | 1,830,000 | 1,849,069 | ||||||
|
| |||||||
| $ | 35,928,881 | |||||||
|
| |||||||
| Chemicals – 1.9% | ||||||||
| Axalta Coating Systems Co., 4.875%, 8/15/2024 (n) | $ | 2,855,000 | $ | 2,940,650 | ||||
| Consolidated Energy Finance S.A., 6.875%, 6/15/2025 (n) | 1,235,000 | 1,264,838 | ||||||
| SPCM S.A., 4.875%, 9/15/2025 (n) | 1,520,000 | 1,527,600 | ||||||
| Starfruit Finance Co./Starfruit U.S. Holding Co. LLC, 6.5%, 10/01/2026 (n) | EUR | 925,000 | 1,061,915 | |||||
| Starfruit Finance Co./Starfruit U.S. Holding Co. LLC, 6.5%, 10/01/2026 | 325,000 | 373,105 | ||||||
|
| |||||||
| $ | 7,168,108 | |||||||
|
| |||||||
| Computer Software – 1.3% | ||||||||
| Diamond 1 Finance Corp./Diamond 2 Finance Corp., 5.875%, 6/15/2021 (n) | $ | 1,285,000 | $ | 1,306,330 | ||||
| Diamond 1 Finance Corp./Diamond 2 Finance Corp., 6.02%, 6/15/2026 (n) | 735,000 | 810,838 | ||||||
| VeriSign, Inc., 5.25%, 4/01/2025 | 1,530,000 | 1,633,275 | ||||||
| VeriSign, Inc., 4.75%, 7/15/2027 | 1,095,000 | 1,140,169 | ||||||
|
| |||||||
| $ | 4,890,612 | |||||||
|
| |||||||
| Computer Software – Systems – 2.2% |
| |||||||
| Fair Isaac Corp., 5.25%, 5/15/2026 (n) | $ | 2,225,000 | $ | 2,336,250 | ||||
| JDA Software Group, Inc., 7.375%, 10/15/2024 (n) | 1,205,000 | 1,256,212 | ||||||
| Sabre GLBL, Inc., 5.375%, 4/15/2023 (n) | 2,410,000 | 2,464,225 | ||||||
| Issuer | Shares/Par | Value ($) | ||||||
| BONDS – continued | ||||||||
| Computer Software – Systems – continued |
| |||||||
| SS&C Technologies Holdings, Inc., 5.5%, 9/30/2027 (n) | $ | 1,980,000 | $ | 2,054,250 | ||||
|
| |||||||
| $ | 8,110,937 | |||||||
|
| |||||||
| Conglomerates – 3.0% | ||||||||
| Amsted Industries Co., 5.625%, 7/01/2027 (n) | $ | 1,045,000 | $ | 1,089,413 | ||||
| BWX Technologies, Inc., 5.375%, 7/15/2026 (n) | 1,995,000 | 2,059,738 | ||||||
| EnerSys, 5%, 4/30/2023 (n) | 1,700,000 | 1,731,569 | ||||||
| Entegris, Inc., 4.625%, 2/10/2026 (n) | 1,480,000 | 1,491,100 | ||||||
| Gates Global LLC, 6%, 7/15/2022 (n) | 872,000 | 872,545 | ||||||
| Stevens Holding Co., Inc., 6.125%, 10/01/2026 (n) | 1,450,000 | 1,527,937 | ||||||
| TriMas Corp., 4.875%, 10/15/2025 (n) | 2,490,000 | 2,521,125 | ||||||
|
| |||||||
| $ | 11,293,427 | |||||||
|
| |||||||
| Construction – 1.2% | ||||||||
| Mattamy Group Corp., 6.5%, 10/01/2025 (n) | $ | 1,405,000 | $ | 1,480,518 | ||||
| Toll Brothers Finance Corp., 4.875%, 11/15/2025 | 965,000 | 1,007,219 | ||||||
| Toll Brothers Finance Corp., 4.35%, 2/15/2028 | 2,010,000 | 2,004,975 | ||||||
|
| |||||||
| $ | 4,492,712 | |||||||
|
| |||||||
| Consumer Products – 0.7% | ||||||||
| Coty, Inc., 6.5%, 4/15/2026 (n) | $ | 895,000 | $ | 871,506 | ||||
| Energizer Holdings, Inc., 6.375%, 7/15/2026 (n) | 1,410,000 | 1,448,775 | ||||||
| Mattel, Inc., 6.75%, 12/31/2025 (z) | 270,000 | 277,763 | ||||||
|
| |||||||
| $ | 2,598,044 | |||||||
|
| |||||||
| Consumer Services – 2.0% |
| |||||||
| Allied Universal Holdco LLC, 9.75%, 7/15/2027 (z) | $ | 825,000 | $ | 821,906 | ||||
| Cimpress N.V., 7%, 6/15/2026 (n) | 1,230,000 | 1,254,588 | ||||||
| Frontdoor, Inc., 6.75%, 8/15/2026 (n) | 1,025,000 | 1,091,625 | ||||||
| Garda World Security Corp., 8.75%, 5/15/2025 (z) | 220,000 | 217,250 | ||||||
| Matthews International Corp., 5.25%, 12/01/2025 (n) | 860,000 | 846,025 | ||||||
| NVA Holdings, Inc., 6.875%, 4/01/2026 (n) | 640,000 | 668,800 | ||||||
| Realogy Group LLC, 9.375%, 4/01/2027 (n) | 1,120,000 | 981,400 | ||||||
| ServiceMaster Co. LLC, 5.125%, 11/15/2024 (n) | 1,610,000 | 1,656,287 | ||||||
|
| |||||||
| $ | 7,537,881 | |||||||
|
| |||||||
| Containers – 4.7% | ||||||||
| ARD Finance S.A., 7.125%, 9/15/2023 | $ | 1,075,000 | $ | 1,099,188 | ||||
| ARD Securities Finance, 8.75%, (8.75% cash or 8.75% PIK) 1/31/2023 (n)(p) | 593,062 | 575,600 | ||||||
| Berry Global Group, Inc., 5.5%, 5/15/2022 | 1,310,000 | 1,324,738 | ||||||
| Berry Global Group, Inc., 6%, 10/15/2022 | 500,000 | 510,000 | ||||||
| BWAY Holding Co., Inc., 7.25%, 4/15/2025 (n) | 1,005,000 | 969,825 | ||||||
5
Table of Contents
MFS High Yield Portfolio
Portfolio of Investments (unaudited) – continued
| Issuer | Shares/Par | Value ($) | ||||||
| BONDS – continued |
| |||||||
| Containers – continued | ||||||||
| Crown American LLC, 4.5%, 1/15/2023 | $ | 1,342,000 | $ | 1,397,357 | ||||
| Crown Americas LLC/Crown Americas Capital Corp. V, 4.25%, 9/30/2026 | 1,880,000 | 1,917,600 | ||||||
| Crown Americas LLC/Crown Americas Capital Corp. VI, 4.75%, 2/01/2026 | 775,000 | 796,313 | ||||||
| Flex Acquisition Co., Inc., 6.875%, 1/15/2025 (n) | 1,175,000 | 1,063,375 | ||||||
| Multi-Color Corp., 6.125%, 12/01/2022 (n) | 1,824,000 | 1,881,000 | ||||||
| Reynolds Group, 5.75%, 10/15/2020 | 741,367 | 743,221 | ||||||
| Reynolds Group, 5.125%, 7/15/2023 (n) | 960,000 | 978,000 | ||||||
| Reynolds Group, 7%, 7/15/2024 (n) | 370,000 | 382,587 | ||||||
| Sealed Air Corp., 4.875%, 12/01/2022 (n) | 1,575,000 | 1,651,781 | ||||||
| Silgan Holdings, Inc., 4.75%, 3/15/2025 | 1,385,000 | 1,395,387 | ||||||
| W/S Packaging Group, Inc., 9%, 4/15/2023 (n) | 936,000 | 1,016,730 | ||||||
|
| |||||||
| $ | 17,702,702 | |||||||
|
| |||||||
| Electrical Equipment – 0.6% | ||||||||
| CommScope Technologies LLC, 6%, 6/15/2025 (n) | $ | 830,000 | $ | 777,884 | ||||
| CommScope Technologies LLC, 5%, 3/15/2027 (n) | 1,765,000 | 1,535,550 | ||||||
|
| |||||||
| $ | 2,313,434 | |||||||
|
| |||||||
| Electronics – 1.6% | ||||||||
| Qorvo, Inc., 5.5%, 7/15/2026 | $ | 2,090,000 | $ | 2,211,847 | ||||
| Sensata Technologies B.V., 5.625%, 11/01/2024 (n) | 1,655,000 | 1,783,262 | ||||||
| Sensata Technologies B.V., 5%, 10/01/2025 (n) | 2,080,000 | 2,168,400 | ||||||
|
| |||||||
| $ | 6,163,509 | |||||||
|
| |||||||
| Energy – Independent – 2.5% | ||||||||
| Callon Petroleum Co., 6.375%, 7/01/2026 | $ | 1,250,000 | $ | 1,262,500 | ||||
| Carrizo Oil & Gas, Inc., 6.25%, 4/15/2023 | 375,000 | 361,875 | ||||||
| CrownRock LP/CrownRock Finance, Inc., 5.625%, 10/15/2025 (n) | 1,320,000 | 1,323,300 | ||||||
| Jagged Peak Energy LLC, 5.875%, 5/01/2026 | 845,000 | 832,325 | ||||||
| Magnolia Oil & Gas Operating LLC/Magnolia Oil & Gas Finance Corp., 6%, 8/01/2026 (n) | 1,380,000 | 1,407,600 | ||||||
| Parsley Energy LLC/Parsley Finance Corp., 5.25%, 8/15/2025 (n) | 430,000 | 436,450 | ||||||
| Parsley Energy LLC/Parsley Finance Corp., 5.625%, 10/15/2027 (n) | 1,345,000 | 1,405,525 | ||||||
| Sanchez Energy Corp., 6.125%, 1/15/2023 | 1,180,000 | 53,100 | ||||||
| SM Energy Co., 6.75%, 9/15/2026 | 1,235,000 | 1,157,812 | ||||||
| Whiting Petroleum Corp., 6.625%, 1/15/2026 | 375,000 | 361,641 | ||||||
| WPX Energy, Inc., 5.75%, 6/01/2026 | 840,000 | 872,550 | ||||||
|
| |||||||
| $ | 9,474,678 | |||||||
|
| |||||||
| Entertainment – 1.7% | ||||||||
| AMC Entertainment Holdings, Inc., 5.75%, 6/15/2025 | $ | 1,065,000 | $ | 986,510 | ||||
| Issuer | Shares/Par | Value ($) | ||||||
| BONDS – continued |
| |||||||
| Entertainment – continued | ||||||||
| Live Nation Entertainment, Inc., 4.875%, 11/01/2024 (z) | $ | 545,000 | $ | 560,669 | ||||
| Live Nation Entertainment, Inc., 5.625%, 3/15/2026 (n) | 2,035,000 | 2,134,206 | ||||||
| Six Flags Entertainment Corp., 4.875%, 7/31/2024 (n) | 2,685,000 | 2,726,953 | ||||||
|
| |||||||
| $ | 6,408,338 | |||||||
|
| |||||||
| Financial Institutions – 2.0% | ||||||||
| Avation Capital S.A., 6.5%, 5/15/2021 (z) | $ | 635,000 | $ | 649,288 | ||||
| Avolon Holdings Funding Ltd., 5.125%, 10/01/2023 | 935,000 | 989,698 | ||||||
| Avolon Holdings Funding Ltd., 3.95%, 7/01/2024 (n) | 711,000 | 728,476 | ||||||
| OneMain Financial Corp., 6.875%, 3/15/2025 | 500,000 | 547,490 | ||||||
| Park Aerospace Holdings Ltd., 5.5%, 2/15/2024 (n) | 2,690,000 | 2,899,766 | ||||||
| Wand Merger Corp., 8.125%, 7/15/2023 (n) | 1,575,000 | 1,606,500 | ||||||
|
| |||||||
| $ | 7,421,218 | |||||||
|
| |||||||
| Food & Beverages – 3.3% | ||||||||
| Aramark Services, Inc., 4.75%, 6/01/2026 | $ | 1,620,000 | $ | 1,648,350 | ||||
| Cott Holdings, Inc., 5.5%, 4/01/2025 (n) | 1,535,000 | 1,563,781 | ||||||
| JBS USA LLC/JBS USA Finance, Inc., 6.75%, 2/15/2028 (n) | 1,060,000 | 1,151,425 | ||||||
| JBS USA Lux S.A./JBS USA Finance, Inc., 5.875%, 7/15/2024 (n) | 1,095,000 | 1,126,481 | ||||||
| Lamb Weston Holdings, Inc., 4.625%, 11/01/2024 (n) | 2,900,000 | 3,005,125 | ||||||
| Lamb Weston Holdings, Inc., 4.875%, 11/01/2026 (n) | 550,000 | 572,000 | ||||||
| Pilgrim’s Pride Corp., 5.75%, 3/15/2025 (n) | 495,000 | 502,425 | ||||||
| Pilgrim’s Pride Corp., 5.875%, 9/30/2027 (n) | 995,000 | 1,031,069 | ||||||
| U.S. Foods Holding Corp., 5.875%, 6/15/2024 (n) | 1,815,000 | 1,864,913 | ||||||
|
| |||||||
| $ | 12,465,569 | |||||||
|
| |||||||
| Gaming & Lodging – 4.9% | ||||||||
| CCM Merger, Inc., 6%, 3/15/2022 (n) | $ | 1,220,000 | $ | 1,250,500 | ||||
| GLP Capital LP/GLP Financing II, Inc., 5.375%, 11/01/2023 | 625,000 | 670,113 | ||||||
| GLP Capital LP/GLP Financing II, Inc., 5.25%, 6/01/2025 | 1,245,000 | 1,333,893 | ||||||
| GLP Capital LP/GLP Financing II, Inc., 5.375%, 4/15/2026 | 585,000 | 632,648 | ||||||
| Hilton Domestic Operating Co., Inc., 5.125%, 5/01/2026 | 1,975,000 | 2,061,406 | ||||||
| Hilton Worldwide Finance LLC, 4.625%, 4/01/2025 | 1,995,000 | 2,042,381 | ||||||
| Marriott Vacations Worldwide Corp./ILG, Inc., 5.625%, 4/15/2023 | 1,225,000 | 1,243,375 | ||||||
| MGM Growth Properties LLC, 4.5%, 9/01/2026 | 1,575,000 | 1,616,344 | ||||||
6
Table of Contents
MFS High Yield Portfolio
Portfolio of Investments (unaudited) – continued
| Issuer | Shares/Par | Value ($) | ||||||
| BONDS – continued | ||||||||
| Gaming & Lodging – continued | ||||||||
| Ryman Hospitality Properties, Inc., REIT, 5%, 4/15/2021 | $ | 1,540,000 | $ | 1,538,075 | ||||
| Ryman Hospitality Properties, Inc., REIT, 5%, 4/15/2023 | 920,000 | 932,650 | ||||||
| Scientific Games Corp., 8.25%, 3/15/2026 (n) | 760,000 | 797,992 | ||||||
| Wyndham Hotels Group LLC, 5.375%, 4/15/2026 (n) | 2,418,000 | 2,529,833 | ||||||
| Wynn Las Vegas LLC/Wynn Las Vegas Capital Corp., 5.5%, 3/01/2025 (n) | 1,900,000 | 1,962,320 | ||||||
|
| |||||||
| $ | 18,611,530 | |||||||
|
| |||||||
| Industrial – 0.6% | ||||||||
| KAR Auction Services, Inc., 5.125%, 6/01/2025 (n) | $ | 2,215,000 | $ | 2,253,763 | ||||
|
| |||||||
| Insurance – Health – 0.5% | ||||||||
| Centene Corp., 6.125%, 2/15/2024 | $ | 750,000 | $ | 785,625 | ||||
| Centene Corp., 5.375%, 6/01/2026 (n) | 1,195,000 | 1,256,244 | ||||||
|
| |||||||
| $ | 2,041,869 | |||||||
|
| |||||||
| Insurance – Property & Casualty – 0.9% |
| |||||||
| AssuredPartners, Inc., 7%, 8/15/2025 (n) | $ | 1,555,000 | $ | 1,545,281 | ||||
| Hub International Ltd., 7%, 5/01/2026 (n) | 1,655,000 | 1,677,756 | ||||||
|
| |||||||
| $ | 3,223,037 | |||||||
|
| |||||||
| Machinery & Tools – 0.2% | ||||||||
| Ashtead Capital, Inc., 5.625%, 10/01/2024 (n) | $ | 880,000 | $ | 910,800 | ||||
|
| |||||||
| Major Banks – 0.9% | ||||||||
| Barclays PLC, 7.875%, 12/29/2049 | $ | 750,000 | $ | 784,687 | ||||
| Credit Suisse Group AG, 7.25% to 9/12/2025, FLR (Swap Rate - 5yr. + 4.332%) to 12/29/2049 (n) | 705,000 | 757,875 | ||||||
| UBS Group AG, 6.875% to 8/07/2025, FLR (Swap Rate - 5yr. + 4.59%) to 12/29/2049 | 1,745,000 | 1,865,405 | ||||||
|
| |||||||
| $ | 3,407,967 | |||||||
|
| |||||||
| Medical & Health Technology & Services – 6.2% |
| |||||||
| Acadia Healthcare Co., Inc., 5.625%, 2/15/2023 | $ | 1,430,000 | $ | 1,453,238 | ||||
| Avantor, Inc., 9%, 10/01/2025 (n) | 1,645,000 | 1,834,175 | ||||||
| BCPE Cycle Merger Sub II, Inc., 10.625%, 7/15/2027 (z) | 540,000 | 546,750 | ||||||
| DaVita, Inc., 5%, 5/01/2025 | 845,000 | 834,226 | ||||||
| Encompass Health Corp., 5.75%, 9/15/2025 | 695,000 | 721,931 | ||||||
| HCA, Inc., 7.5%, 2/15/2022 | 1,430,000 | 1,576,575 | ||||||
| HCA, Inc., 5.375%, 2/01/2025 | 3,260,000 | 3,518,762 | ||||||
| HCA, Inc., 5.875%, 2/15/2026 | 1,870,000 | 2,066,350 | ||||||
| HCA, Inc., 5.625%, 9/01/2028 | 340,000 | 368,050 | ||||||
| HealthSouth Corp., 5.125%, 3/15/2023 | 1,375,000 | 1,399,063 | ||||||
| HealthSouth Corp., 5.75%, 11/01/2024 | 452,000 | 460,272 | ||||||
| Heartland Dental LLC, 8.5%, 5/01/2026 (n) | 775,000 | 732,375 | ||||||
| IQVIA Holdings, Inc., 5%, 5/15/2027 (n) | 1,300,000 | 1,342,250 | ||||||
| MPH Acquisition Holdings LLC, 7.125%, 6/01/2024 (z) | 980,000 | 918,946 | ||||||
| Issuer | Shares/Par | Value ($) | ||||||
| BONDS – continued | ||||||||
| Medical & Health Technology & Services – continued |
| |||||||
| Polaris, 8.5%, (8.5% cash or 8.5% PIK) 12/01/2022 (n)(p) | $ | 565,000 | $ | 498,613 | ||||
| Quintiles IMS Holdings, Inc., 5%, 10/15/2026 (n) | 1,400,000 | 1,445,500 | ||||||
| Regional Care/LifePoint Health, Inc., 9.75%, 12/01/2026 (n) | 1,535,000 | 1,607,912 | ||||||
| Team Health Holdings to Team Health, Inc., 6.375%, 2/01/2025 (z) | 315,000 | 240,975 | ||||||
| Tenet Healthcare Corp., 6.75%, 6/15/2023 | 520,000 | 521,950 | ||||||
| West Street Merger Sub, Inc., 6.375%, 9/01/2025 (n) | 1,170,000 | 1,082,250 | ||||||
|
| |||||||
| $ | 23,170,163 | |||||||
|
| |||||||
| Medical Equipment – 1.0% | ||||||||
| Teleflex, Inc., 5.25%, 6/15/2024 | $ | 1,360,000 | $ | 1,396,975 | ||||
| Teleflex, Inc., 4.875%, 6/01/2026 | 785,000 | 814,437 | ||||||
| Teleflex, Inc., 4.625%, 11/15/2027 | 1,525,000 | 1,568,844 | ||||||
|
| |||||||
| $ | 3,780,256 | |||||||
|
| |||||||
| Metals & Mining – 4.4% | ||||||||
| Baffinland Iron Mines Corp./Baffinland Iron Mines LP, 8.75%, 7/15/2026 (n) | $ | 735,000 | $ | 747,863 | ||||
| Big River Steel LLC, 7.25%, 9/01/2025 (n) | 1,070,000 | 1,124,089 | ||||||
| First Quantum Minerals Ltd., 7.25%, 4/01/2023 (n) | 1,065,000 | 1,037,044 | ||||||
| Freeport-McMoRan Copper & Gold, Inc., 5.4%, 11/14/2034 | 780,000 | 746,850 | ||||||
| Freeport-McMoRan, Inc., 6.875%, 2/15/2023 | 2,549,000 | 2,682,822 | ||||||
| Grinding Media,Inc./Moly-Cop AltaSteel Ltd., 7.375%, 12/15/2023 (z) | 530,000 | 507,475 | ||||||
| Harsco Corp., 5.75%, 7/31/2027 (z) | 1,030,000 | 1,072,601 | ||||||
| Northwest Acquisitions ULC/Dominion Finco, Inc., 7.125%, 11/01/2022 (n) | 1,685,000 | 1,162,650 | ||||||
| Novelis Corp., 5.875%, 9/30/2026 (n) | 1,745,000 | 1,766,812 | ||||||
| Petra Diamonds U.S. Treasury PLC, 7.25%, 5/01/2022 (n) | 775,000 | 767,250 | ||||||
| Steel Dynamics, Inc., 4.125%, 9/15/2025 | 1,480,000 | 1,472,600 | ||||||
| Steel Dynamics, Inc., 5%, 12/15/2026 | 1,095,000 | 1,141,537 | ||||||
| SunCoke Energy Partners LP/SunCoke Energy Partners Finance Corp., 7.5%, 6/15/2025 (n) | 890,000 | 868,863 | ||||||
| TMS International Corp., 7.25%, 8/15/2025 (n) | 1,345,000 | 1,301,287 | ||||||
|
| |||||||
| $ | 16,399,743 | |||||||
|
| |||||||
| Midstream – 4.9% | ||||||||
| Blue Racer Midstream LLC/Blue | ||||||||
| Racer Finance Corp., 6.125%, 11/15/2022 (n) | $ | 720,000 | $ | 729,900 | ||||
| Blue Racer Midstream LLC/Blue Racer Finance Corp., 6.625%, 7/15/2026 (n) | 820,000 | 826,150 | ||||||
| Cheniere Energy Partners LP, 5.25%, 10/01/2025 | 2,621,000 | 2,709,459 | ||||||
| Cheniere Energy, Inc., 5.875%, 3/31/2025 | 3,310,000 | 3,686,512 | ||||||
| DCP Midstream Operating LP, 4.95%, 4/01/2022 | 636,000 | 659,850 | ||||||
7
Table of Contents
MFS High Yield Portfolio
Portfolio of Investments (unaudited) – continued
| Issuer | Shares/Par | Value ($) | ||||||
| BONDS – continued | ||||||||
| Midstream – continued | ||||||||
| DCP Midstream Operating LP, 3.875%, 3/15/2023 | $ | 1,180,000 | $ | 1,188,850 | ||||
| DCP Midstream Operating LP, 5.6%, 4/01/2044 | 312,000 | 293,280 | ||||||
| Energy Transfer Operating Co., 5.875%, 1/15/2024 | 1,735,000 | 1,931,340 | ||||||
| EnLink Midstream Partners LP, 4.4%, 4/01/2024 | 2,275,000 | 2,300,548 | ||||||
| Tallgrass Energy Partners LP, 5.5%, 1/15/2028 (n) | 716,000 | 724,055 | ||||||
| Targa Resources Partners LP/Targa Resources Finance Corp., 5.25%, 5/01/2023 | 1,365,000 | 1,383,905 | ||||||
| Targa Resources Partners LP/Targa Resources Finance Corp., 5.125%, 2/01/2025 (n) | 545,000 | 562,713 | ||||||
| Targa Resources Partners LP/Targa Resources Finance Corp., 5.375%, 2/01/2027 | 1,410,000 | 1,459,350 | ||||||
|
| |||||||
| $ | 18,455,912 | |||||||
|
| |||||||
| Network & Telecom – 0.2% | ||||||||
| Zayo Group LLC/Zayo Capital, Inc., 5.75%, 1/15/2027 (n) | $ | 850,000 | $ | 866,048 | ||||
|
| |||||||
| Oil Services – 0.7% | ||||||||
| Apergy Corp., 6.375%, 5/01/2026 | $ | 1,290,000 | $ | 1,299,675 | ||||
| Diamond Offshore Drill Co., 5.7%, 10/15/2039 | 1,540,000 | 1,031,800 | ||||||
| Ensign Drilling, Inc., 9.25%, 4/15/2024 (z) | 335,000 | 329,975 | ||||||
|
| |||||||
| $ | 2,661,450 | |||||||
|
| |||||||
| Oils – 0.8% | ||||||||
| Parkland Fuel Corp., 6%, 4/01/2026 (n) | $ | 1,600,000 | $ | 1,636,000 | ||||
| PBF Holding Co. LLC/PBF Finance Corp., 7%, 11/15/2023 | 260,000 | 269,753 | ||||||
| PBF Holding Co. LLC/PBF Finance Corp., 7.25%, 6/15/2025 | 1,120,000 | 1,173,200 | ||||||
|
| |||||||
| $ | 3,078,953 | |||||||
|
| |||||||
| Pharmaceuticals – 1.3% | ||||||||
| Eagle Holding Co. II LLC, 7.625%, 5/15/2022 (n) | $ | 1,065,000 | $ | 1,070,325 | ||||
| Eagle Holding Co. II LLC, 7.75%, 5/15/2022 (z) | 165,000 | 166,237 | ||||||
| Endo Finance LLC/Endo Finco, Inc., 5.375%, 1/15/2023 (n) | 820,000 | 590,400 | ||||||
| Valeant Pharmaceuticals International, Inc., 5.5%, 3/01/2023 (n) | 664,000 | 669,312 | ||||||
| Valeant Pharmaceuticals International, Inc., 6.125%, 4/15/2025 (n) | 2,440,000 | 2,491,777 | ||||||
|
| |||||||
| $ | 4,988,051 | |||||||
|
| |||||||
| Printing & Publishing – 0.4% | ||||||||
| Nielsen Finance LLC, 5%, 4/15/2022 (n) | $ | 1,335,000 | $ | 1,331,663 | ||||
|
| |||||||
| Real Estate – Healthcare – 0.5% | ||||||||
| MPT Operating Partnership LP/MPT Financial Co., REIT, 5.25%, 8/01/2026 | $ | 1,125,000 | $ | 1,172,813 | ||||
| Issuer | Shares/Par | Value ($) | ||||||
| BONDS – continued | ||||||||
| Real Estate – Healthcare – continued |
| |||||||
| MPT Operating Partnership LP/MPT Financial Co., REIT, 5%, 10/15/2027 | $ | 605,000 | $ | 623,150 | ||||
|
| |||||||
| $ | 1,795,963 | |||||||
|
| |||||||
| Real Estate – Other – 0.9% | ||||||||
| CyrusOne LP/CyrusOne Finance Corp., REIT, 5%, 3/15/2024 | $ | 2,085,000 | $ | 2,142,338 | ||||
| CyrusOne LP/CyrusOne Finance Corp., REIT, 5.375%, 3/15/2027 | 1,000,000 | 1,052,500 | ||||||
|
| |||||||
| $ | 3,194,838 | |||||||
|
| |||||||
| Restaurants – 1.0% | ||||||||
| Golden Nugget, Inc., 6.75%, 10/15/2024 (n) | $ | 1,320,000 | $ | 1,359,600 | ||||
| KFC Holding Co./Pizza Hut Holdings LLC/Taco Bell of America LLC, 5.25%, 6/01/2026 (n) | 2,120,000 | 2,223,329 | ||||||
|
| |||||||
| $ | 3,582,929 | |||||||
|
| |||||||
| Retailers – 1.2% | ||||||||
| DriveTime Automotive Group, Inc./DT | ||||||||
| Acceptance Corp., 8%, 6/01/2021 (n) | $ | 915,000 | $ | 926,438 | ||||
| EG Global Finance PLC, 6.75%, 2/07/2025 (z) | 1,005,000 | 997,161 | ||||||
| L Brands, Inc., 5.25%, 2/01/2028 | 1,825,000 | 1,672,156 | ||||||
| Party City Holdings, Inc., 6.625%, 8/01/2026 (z) | 535,000 | 518,950 | ||||||
| Sally Beauty Holdings, Inc., 5.625%, 12/01/2025 | 580,000 | 569,096 | ||||||
|
| |||||||
| $ | 4,683,801 | |||||||
|
| |||||||
| Specialty Chemicals – 0.9% | ||||||||
| Koppers, Inc., 6%, 2/15/2025 (n) | $ | 1,235,000 | $ | 1,157,812 | ||||
| Univar USA, Inc., 6.75%, 7/15/2023 (n) | 2,220,000 | 2,261,625 | ||||||
|
| |||||||
| $ | 3,419,437 | |||||||
|
| |||||||
| Specialty Stores – 0.6% | ||||||||
| Penske Automotive Group Co., 5.375%, 12/01/2024 | $ | 910,000 | $ | 935,025 | ||||
| Penske Automotive Group Co., 5.5%, 5/15/2026 | 935,000 | 974,738 | ||||||
| PetSmart, Inc., 5.875%, 6/01/2025 (z) | 270,000 | 261,900 | ||||||
|
| |||||||
| $ | 2,171,663 | |||||||
|
| |||||||
| Supermarkets – 0.1% | ||||||||
| Albertsons Cos. LLC/Safeway, Inc., 5.75%, 3/15/2025 | $ | 380,000 | $ | 382,964 | ||||
|
| |||||||
| Telecommunications – Wireless – 5.5% |
| |||||||
| Altice France S.A., 6.25%, 5/15/2024 (n) | $ | 292,000 | $ | 300,760 | ||||
| Altice France S.A., 8.125%, 2/01/2027 (n) | 1,285,000 | 1,349,250 | ||||||
| Altice Luxembourg S.A., 7.75%, 5/15/2022 (n) | 200,000 | 203,250 | ||||||
| Altice Luxembourg S.A., 7.625%, 2/15/2025 (n) | 1,450,000 | 1,363,906 | ||||||
| Digicel International Finance Ltd., 8.75%, 5/25/2024 (n) | 530,000 | 500,850 | ||||||
| SBA Communications Corp., 4%, 10/01/2022 | 2,125,000 | 2,154,219 | ||||||
8
Table of Contents
MFS High Yield Portfolio
Portfolio of Investments (unaudited) – continued
| Issuer | Shares/Par | Value ($) | ||||||
| BONDS – continued | ||||||||
| Telecommunications – Wireless – continued |
| |||||||
| SBA Communications Corp., 4.875%, 9/01/2024 | $ | 1,840,000 | $ | 1,895,200 | ||||
| SFR Group S.A., 7.375%, 5/01/2026 (n) | 1,340,000 | 1,373,500 | ||||||
| Sprint Corp., 7.875%, 9/15/2023 | 1,865,000 | 2,025,856 | ||||||
| Sprint Corp., 7.125%, 6/15/2024 | 3,115,000 | 3,302,834 | ||||||
| Sprint Nextel Corp., 6%, 11/15/2022 | 1,005,000 | 1,047,713 | ||||||
| T-Mobile USA, Inc., 6.5%, 1/15/2024 | 630,000 | 652,050 | ||||||
| T-Mobile USA, Inc., 5.125%, 4/15/2025 | 1,190,000 | 1,238,528 | ||||||
| T-Mobile USA, Inc., 6.5%, 1/15/2026 | 965,000 | 1,043,223 | ||||||
| T-Mobile USA, Inc., 5.375%, 4/15/2027 | 1,980,000 | 2,118,600 | ||||||
|
| |||||||
| $ | 20,569,739 | |||||||
|
| |||||||
| Telephone Services – 0.6% | ||||||||
| Level 3 Financing, Inc., 5.375%, 1/15/2024 | $ | 715,000 | $ | 731,088 | ||||
| Level 3 Financing, Inc., 5.375%, 5/01/2025 | 1,640,000 | 1,693,300 | ||||||
|
| |||||||
| $ | 2,424,388 | |||||||
|
| |||||||
| Utilities – Electric Power – 2.5% | ||||||||
| Calpine Corp., 5.75%, 1/15/2025 | $ | 270,000 | $ | 267,975 | ||||
| Clearway Energy Operating LLC, 5.75%, 10/15/2025 (n) | 2,850,000 | 2,892,750 | ||||||
| Covanta Holding Corp., 5.875%, 3/01/2024 | 1,040,000 | 1,071,200 | ||||||
| Covanta Holding Corp., 6%, 1/01/2027 | 350,000 | 365,750 | ||||||
| Drax Finco PLC, 6.625%, 11/01/2025 (n) | 1,020,000 | 1,042,511 | ||||||
| NextEra Energy Operating Co., 4.25%, 9/15/2024 (n) | 2,175,000 | 2,186,528 | ||||||
| NextEra Energy Operating Co., 4.5%, 9/15/2027 (n) | 640,000 | 632,000 | ||||||
| NextEra Energy, Inc., 4.25%, 7/15/2024 (z) | 768,000 | 772,815 | ||||||
|
| |||||||
| $ | 9,231,529 | |||||||
|
| |||||||
| Total Bonds (Identified Cost, $358,063,964) | $ | 361,129,514 | ||||||
|
| |||||||
| FLOATING RATE LOANS (r) – 0.8% |
| |||||||
| Broadcasting – 0.1% | ||||||||
| Warner Music Group, Term Loan F, 4.527%, 11/01/2023 | $ | 319,000 | $ | 314,436 | ||||
|
| |||||||
| Conglomerates – 0.1% | ||||||||
| Gates Global LLC, Term Loan B2, 5.152%, 4/01/2024 | $ | 377,121 | $ | 374,555 | ||||
|
| |||||||
| Entertainment – 0.1% | ||||||||
| Live Nation Entertainment, Inc., Term Loan B3, 4.187%, 10/31/2023 | $ | 488,254 | $ | 486,728 | ||||
|
| |||||||
| Issuer | Shares/Par | Value ($) | ||||||
| FLOATING RATE LOANS (r) – continued |
| |||||||
| Food & Beverages – 0.1% | ||||||||
| U.S. Foods, Inc., Term Loan B, 4.402%, 6/27/2023 | $ | 316,553 | $ | 314,235 | ||||
|
| |||||||
| Medical & Health Technology & Services – 0.2% |
| |||||||
| DaVita, Inc., Term Loan B, 5.135%, 6/24/2021 | $ | 960,881 | $ | 959,380 | ||||
|
| |||||||
| Oil Services – 0.2% | ||||||||
| Apergy Corp., Term Loan B, 4.937%, 5/09/2025 | $ | 614,698 | $ | 612,137 | ||||
|
| |||||||
| Total Floating Rate Loans (Identified Cost, $3,034,393) |
| $ | 3,061,471 | |||||
|
| |||||||
| COMMON STOCKS – 0.3% | ||||||||
| Construction – 0.1% | ||||||||
| ICA Tenedora, S.A. de C.V. (a) | 147,380 | $ | 253,761 | |||||
|
| |||||||
| Oil Services – 0.2% | ||||||||
| LTRI Holdings LP (a)(u) | 1,115 | $ | 991,703 | |||||
|
| |||||||
| Total Common Stocks (Identified Cost, $663,681) | $ | 1,245,464 | ||||||
|
| |||||||
| CONVERTIBLE BONDS – 0.1% | ||||||||
| Cable TV – 0.1% | ||||||||
| DISH Network Corp., 3.375%, 8/15/2026 (Identified Cost, $516,549) | $ | 570,000 | $ | 554,145 | ||||
|
| |||||||
| Strike Price | First Exercise | |||||||||||||||
| WARRANTS – 0.0% |
| |||||||||||||||
| Forest & Paper Products – 0.0% |
| |||||||||||||||
| Appvion Holdings Corp. - Tranche A (1 share for 1 warrant) (a) | $ | 27.17 | 8/24/18 | 670 | $ | 335 | ||||||||||
| Appvion Holdings Corp. - Tranche B (1 share for 1 warrant) (a) | 31.25 | 8/24/18 | 670 | 84 | ||||||||||||
|
| |||||||||||||||
| Total Warrants (Identified Cost, $0) |
| $ | 419 | |||||||||||||
|
| |||||||||||||||
| INVESTMENT COMPANIES (h) – 2.1% |
| |||||||||||||||
| Money Market Funds – 2.1% |
| |||||||||||||||
| MFS Institutional Money Market Portfolio, 2.42% (v) (Identified Cost, $7,793,246) |
| 7,793,245 | $ | 7,794,024 | ||||||||||||
|
| |||||||||||||||
| OTHER ASSETS, LESS LIABILITIES – 0.8% |
| 2,833,891 | ||||||||||||||
|
| |||||||||||||||
| NET ASSETS – 100.0% |
| $ | 376,618,928 | |||||||||||||
|
| |||||||||||||||
9
Table of Contents
MFS High Yield Portfolio
Portfolio of Investments (unaudited) – continued
| (a) | Non-income producing security. |
| (h) | An affiliated issuer, which may be considered one in which the fund owns 5% or more of the outstanding voting securities, or a company which is under common control. At period end, the aggregate values of the fund’s investments in affiliated issuers and in unaffiliated issuers were $7,794,024 and $365,991,013, respectively. |
| (n) | Securities exempt from registration under Rule 144A of the Securities Act of 1933. These securities may be sold in the ordinary course of business in transactions exempt from registration, normally to qualified institutional buyers. At period end, the aggregate value of these securities was $212,871,653, representing 56.5% of net assets. |
| (p) | Payment-in-kind (PIK) security for which interest income may be received in additional securities and/or cash. |
| (r) | The remaining maturities of floating rate loans may be less than the stated maturities shown as a result of contractual or optional prepayments by the borrower. Such prepayments cannot be predicted with certainty. These loans may be subject to restrictions on resale. The interest rate shown represents the weighted average of the floating interest rates on settled contracts within the loan facility at period end, unless otherwise indicated. The floating interest rates on settled contracts are determined periodically by reference to a base lending rate and a spread. |
| (u) | The security was valued using significant unobservable inputs and is considered level 3 under the fair value hierarchy. For further information about the fund’s level 3 holdings, please see Note 2 in the Notes to Financial Statements. |
| (v) | Affiliated issuer that is available only to investment companies managed by MFS. The rate quoted for the MFS Institutional Money Market Portfolio is the annualized seven-day yield of the fund at period end. |
| (z) | Restricted securities are not registered under the Securities Act of 1933 and are subject to legal restrictions on resale. These securities generally may be resold in transactions exempt from registration or to the public if the securities are subsequently registered. Disposal of these securities may involve time-consuming negotiations and prompt sale at an acceptable price may be difficult. The fund holds the following restricted securities: |
| Restricted Securities | Acquisition Date | Cost | Value | |||||||
| Allied Universal Holdco LLC, 9.75%, 7/15/2027 | 6/27/19 | $813,788 | $821,906 | |||||||
| Avation Capital S.A., 6.5%, 5/15/2021 | 6/13/19 | 648,700 | 649,288 | |||||||
| BCPE Cycle Merger Sub II, Inc., 10.625%, 7/15/2027 | 6/13/19 | 540,000 | 546,750 | |||||||
| CWCapital Cobalt Ltd., CDO, “F”, FLR, 3.886% (0% cash or 3.886% PIK), (LIBOR - 3 mo. + 1.3%), 4/26/2050 | 4/12/06 | 1,106,654 | 121 | |||||||
| Eagle Holding Co. II LLC, 7.75%, 5/15/2022 | 5/07/19 | 163,415 | 166,237 | |||||||
| EG Global Finance PLC, 6.75%, 2/07/2025 | 5/02/19 | 1,006,137 | 997,161 | |||||||
| Ensign Drilling, Inc., 9.25%, 4/15/2024 | 5/03/19-6/06/19 | 328,721 | 329,975 | |||||||
| Garda World Security Corp., 8.75%, 5/15/2025 | 5/14/19-6/21/19 | 213,711 | 217,250 | |||||||
| Grinding Media, Inc./Moly-Cop AltaSteel Ltd., 7.375%, 12/15/2023 | 6/04/19-6/17/19 | 494,448 | 507,475 | |||||||
| Harsco Corp., 5.75%, 7/31/2027 | 6/12/19-6/18/19 | 1,048,218 | 1,072,601 | |||||||
| iHeartCommunications, Inc., 6.375%, 5/01/2026 | 6/05/19 | 282,736 | 286,538 | |||||||
| Live Nation Entertainment, Inc., 4.875%, 11/01/2024 | 4/10/19-4/12/19 | 555,944 | 560,669 | |||||||
| Mattel, Inc., 6.75%, 12/31/2025 | 6/05/19 | 269,331 | 277,763 | |||||||
| MPH Acquisition Holdings LLC, 7.125%, 6/01/2024 | 3/20/19-4/02/19 | 977,277 | 918,946 | |||||||
| Netflix, Inc., 3.875%, 11/15/2029 | 4/24/19-4/29/19 | 1,348,093 | 1,478,141 | |||||||
| Nexstar Escrow Corp., 5.625%, 7/15/2027 | 6/19/19-6/21/19 | 641,906 | 644,962 | |||||||
| NextEra Energy, Inc., 4.25%, 7/15/2024 | 6/24/19 | 768,000 | 772,815 | |||||||
| Party City Holdings, Inc., 6.625%, 8/01/2026 | 5/09/19-6/05/19 | 529,221 | 518,950 | |||||||
| PetSmart, Inc., 5.875%, 6/01/2025 | 6/05/19 | 258,295 | 261,900 | |||||||
| Sirius XM Holdings, Inc., 4.625%, 7/15/2024 | 6/18/19-6/19/19 | 2,212,294 | 2,256,332 | |||||||
| Team Health Holdings to Team Health, Inc., 6.375%, 2/01/2025 | 5/15/19-5/23/19 | 268,830 | 240,975 | |||||||
| Total Restricted Securities | $13,526,755 | |||||||||
| % of Net assets | 3.6% | |||||||||
The following abbreviations are used in this report and are defined:
| CDO | Collateralized Debt Obligation |
| FLR | Floating Rate. Interest rate resets periodically based on the parenthetically disclosed reference rate plus a spread (if any). The period-end rate reported may not be the current rate. All reference rates are USD unless otherwise noted. |
| LIBOR | London Interbank Offered Rate |
| REIT | Real Estate Investment Trust |
10
Table of Contents
MFS High Yield Portfolio
Portfolio of Investments (unaudited) – continued
Abbreviations indicate amounts shown in currencies other than the U.S. dollar. All amounts are stated in U.S. dollars unless otherwise indicated. A list of abbreviations is shown below:
| EUR | Euro |
Derivative Contracts at 6/30/19
Forward Foreign Currency Exchange Contracts
| Currency Purchased | Currency Sold | Counterparty | Settlement Date | Unrealized Appreciation (Depreciation) | ||||||||||||||||
| Asset Derivatives | ||||||||||||||||||||
| EUR | 531,478 | USD | 597,157 | UBS AG | 7/12/2019 | $7,697 | ||||||||||||||
|
| |||||||||||||||||||
| Liability Derivatives | ||||||||||||||||||||
| USD | 285,670 | EUR | 255,000 | Citibank N.A. | 7/12/2019 | $(4,535 | ) | |||||||||||||
| USD | 2,855,311 | EUR | 2,513,390 | Merrill Lynch International | 7/12/2019 | (5,076 | ) | |||||||||||||
| USD | 1,070,370 | EUR | 954,143 | UBS AG | 7/12/2019 | (15,503 | ) | |||||||||||||
|
| |||||||||||||||||||
| $(25,114 | ) | |||||||||||||||||||
|
| |||||||||||||||||||
Futures Contracts
| Description | Long/ Short | Currency | Contracts | Notional Amount | Expiration Date | Value/Unrealized Appreciation (Depreciation) | ||||||||||||||||
| Liability Derivatives | ||||||||||||||||||||||
| Interest Rate Futures | ||||||||||||||||||||||
| Euro-Bobl 5 yr | Short | EUR | 6 | $917,230 | September - 2019 | $(3,903 | ) | |||||||||||||||
| U.S. Treasury Note 10 yr | Short | USD | 51 | 6,526,406 | September - 2019 | (97,802 | ) | |||||||||||||||
| U.S. Treasury Note 5 yr | Short | USD | 82 | 9,688,813 | September - 2019 | (108,020 | ) | |||||||||||||||
|
| |||||||||||||||||||||
| $(209,725 | ) | |||||||||||||||||||||
|
| |||||||||||||||||||||
At June 30, 2019, the fund had cash collateral of $115,344 to cover any collateral or margin obligations for certain derivative contracts. Restricted cash and/or deposits with brokers in the Statement of Assets and Liabilities are comprised of cash collateral.
See Notes to Financial Statements
11
Table of Contents
MFS High Yield Portfolio
FINANCIAL STATEMENTS | STATEMENT OF ASSETS AND LIABILITIES (unaudited)
This statement represents your fund’s balance sheet, which details the assets and liabilities comprising the total value of the fund.
At 6/30/19 | ||||
Assets | ||||
Investments in unaffiliated issuers, at value (identified cost, $362,278,587) | $365,991,013 | |||
Investments in affiliated issuers, at value (identified cost, $7,793,246) | 7,794,024 | |||
Cash | 65,285 | |||
Deposits with brokers for | ||||
Futures contracts | 115,344 | |||
Receivables for | ||||
Forward foreign currency exchange contracts | 7,697 | |||
Investments sold | 1,734,312 | |||
Fund shares sold | 10,983 | |||
Interest | 5,472,613 | |||
Other assets | 1,318 | |||
Total assets | $381,192,589 | |||
Liabilities | ||||
Payables for | ||||
Forward foreign currency exchange contracts | $25,114 | |||
Net daily variation margin on open futures contracts | 2,059 | |||
Investments purchased | 4,105,580 | |||
Fund shares reacquired | 303,807 | |||
Payable to affiliates | ||||
Investment adviser | 10,858 | |||
Administrative services fee | 667 | |||
Shareholder servicing costs | 58 | |||
Distribution and/or service fees | 1,245 | |||
Payable for independent Trustees’ compensation | 100 | |||
Accrued expenses and other liabilities | 124,173 | |||
Total liabilities | $4,573,661 | |||
Net assets | $376,618,928 | |||
Net assets consist of | ||||
Paid-in capital | $386,871,177 | |||
Total distributable earnings (loss) | (10,252,249 | ) | ||
Net assets | $376,618,928 | |||
Shares of beneficial interest outstanding | 65,011,986 | |||
| Net assets | Shares outstanding | Net asset value per share | ||||||||||
Initial Class | $331,224,001 | 57,084,218 | $5.80 | |||||||||
Service Class | 45,394,927 | 7,927,768 | 5.73 | |||||||||
See Notes to Financial Statements
12
Table of Contents
MFS High Yield Portfolio
FINANCIAL STATEMENTS | STATEMENT OF OPERATIONS (unaudited)
This statement describes how much your fund earned in investment income and accrued in expenses. It also describes any gains and/or losses generated by fund operations.
Six months ended 6/30/19 | ||||
Net investment income (loss) | ||||
Income | ||||
Interest | $10,498,529 | |||
Dividends from affiliated issuers | 110,485 | |||
Other | 21,464 | |||
Total investment income | $10,630,478 | |||
Expenses | ||||
Management fee | $1,305,190 | |||
Distribution and/or service fees | 56,801 | |||
Shareholder servicing costs | 4,947 | |||
Administrative services fee | 31,366 | |||
Independent Trustees’ compensation | 5,996 | |||
Custodian fee | 12,870 | |||
Shareholder communications | 27,221 | |||
Audit and tax fees | 39,713 | |||
Legal fees | 2,019 | |||
Miscellaneous | 22,841 | |||
Total expenses | $1,508,964 | |||
Reduction of expenses by investment adviser | (107,368 | ) | ||
Net expenses | $1,401,596 | |||
Net investment income (loss) | $9,228,882 | |||
Realized and unrealized gain (loss) | ||||
Realized gain (loss) (identified cost basis) | ||||
Unaffiliated issuers | $(4,205,862 | ) | ||
Affiliated issuers | 247 | |||
Futures contracts | (429,968 | ) | ||
Forward foreign currency exchange contracts | 94,726 | |||
Foreign currency | 70 | |||
Net realized gain (loss) | $(4,540,787 | ) | ||
Change in unrealized appreciation or depreciation | ||||
Unaffiliated issuers | $30,571,128 | |||
Affiliated issuers | 1,738 | |||
Futures contracts | (53,598 | ) | ||
Forward foreign currency exchange contracts | (41,324 | ) | ||
Translation of assets and liabilities in foreign currencies | 186 | |||
Net unrealized gain (loss) | $30,478,130 | |||
Net realized and unrealized gain (loss) | $25,937,343 | |||
Change in net assets from operations | $35,166,225 | |||
See Notes to Financial Statements
13
Table of Contents
MFS High Yield Portfolio
FINANCIAL STATEMENTS | STATEMENTS OF CHANGES IN NET ASSETS
These statements describe the increases and/or decreases in net assets resulting from operations, any distributions, and any shareholder transactions.
| Six months ended 6/30/19 | Year ended 12/31/18 | |||||||
| (unaudited) | ||||||||
Change in net assets | ||||||||
From operations | ||||||||
Net investment income (loss) | $9,228,882 | $20,091,721 | ||||||
Net realized gain (loss) | (4,540,787 | ) | (3,788,533 | ) | ||||
Net unrealized gain (loss) | 30,478,130 | (28,224,537 | ) | |||||
Change in net assets from operations | $35,166,225 | $(11,921,349 | ) | |||||
Total distributions to shareholders | $— | $(22,864,139 | ) | |||||
Change in net assets from fund share transactions | $(23,923,108 | ) | $(42,731,313 | ) | ||||
Total change in net assets | $11,243,117 | $(77,516,801 | ) | |||||
Net assets | ||||||||
At beginning of period | 365,375,811 | 442,892,612 | ||||||
At end of period | $376,618,928 | $365,375,811 | ||||||
See Notes to Financial Statements
14
Table of Contents
MFS High Yield Portfolio
FINANCIAL STATEMENTS | FINANCIAL HIGHLIGHTS
The financial highlights table is intended to help you understand the fund’s financial performance for the semiannual period and the past 5 fiscal years. Certain information reflects financial results for a single fund share. The total returns in the table represent the rate that an investor would have earned (or lost) on an investment in the fund share class (assuming reinvestment of all distributions) held for the entire period.
| Initial Class | Six months ended 6/30/19 | Year ended | ||||||||||||||||||||||
| 12/31/18 | 12/31/17 | 12/31/16 | 12/31/15 | 12/31/14 | ||||||||||||||||||||
| (unaudited) | ||||||||||||||||||||||||
Net asset value, beginning of period | $5.28 | $5.77 | $5.78 | $5.43 | $6.11 | $6.28 | ||||||||||||||||||
| Income (loss) from investment operations | ||||||||||||||||||||||||
Net investment income (loss) (d) | $0.14 | $0.28 | $0.28 | $0.32 | (c) | $0.33 | $0.35 | |||||||||||||||||
Net realized and unrealized gain (loss) | 0.38 | (0.45 | ) | 0.10 | 0.42 | (0.57 | ) | (0.17 | ) | |||||||||||||||
Total from investment operations | $0.52 | $(0.17 | ) | $0.38 | $0.74 | $(0.24 | ) | $0.18 | ||||||||||||||||
| Less distributions declared to shareholders | ||||||||||||||||||||||||
From net investment income | $— | $(0.32 | ) | $(0.39 | ) | $(0.39 | ) | $(0.44 | ) | $(0.35 | ) | |||||||||||||
Net asset value, end of period (x) | $5.80 | $5.28 | $5.77 | $5.78 | $5.43 | $6.11 | ||||||||||||||||||
Total return (%) (k)(r)(s)(x) | 9.85 | (n) | (3.08 | ) | 6.69 | 13.82 | (c) | (4.22 | ) | 2.81 | ||||||||||||||
| Ratios (%) (to average net assets) and Supplemental data: | ||||||||||||||||||||||||
Expenses before expense reductions (f) | 0.78 | (a) | 0.77 | 0.78 | 0.76 | (c) | 0.77 | 0.77 | ||||||||||||||||
Expenses after expense reductions (f) | 0.72 | (a) | 0.72 | 0.72 | 0.70 | (c) | 0.72 | 0.74 | ||||||||||||||||
Net investment income (loss) | 4.98 | (a) | 4.91 | 4.78 | 5.60 | (c) | 5.43 | 5.44 | ||||||||||||||||
Portfolio turnover | 31 | (n) | 40 | 49 | 41 | 33 | 43 | |||||||||||||||||
Net assets at end of period (000 omitted) | $331,224 | $320,380 | $384,393 | $404,118 | $419,474 | $514,089 | ||||||||||||||||||
| Service Class | Six months 6/30/19 | Year ended | ||||||||||||||||||||||
| 12/31/18 | 12/31/17 | 12/31/16 | 12/31/15 | 12/31/14 | ||||||||||||||||||||
| (unaudited) | ||||||||||||||||||||||||
Net asset value, beginning of period | $5.22 | $5.70 | $5.72 | $5.37 | $6.04 | $6.21 | ||||||||||||||||||
| Income (loss) from investment operations | ||||||||||||||||||||||||
Net investment income (loss) (d) | $0.13 | $0.26 | $0.26 | $0.30 | (c) | $0.31 | $0.33 | |||||||||||||||||
Net realized and unrealized gain (loss) | 0.38 | (0.43 | ) | 0.10 | 0.43 | (0.56 | ) | (0.16 | ) | |||||||||||||||
Total from investment operations | $0.51 | $(0.17 | ) | $0.36 | $0.73 | $(0.25 | ) | $0.17 | ||||||||||||||||
| Less distributions declared to shareholders | ||||||||||||||||||||||||
From net investment income | $— | $(0.31 | ) | $(0.38 | ) | $(0.38 | ) | $(0.42 | ) | $(0.34 | ) | |||||||||||||
Net asset value, end of period (x) | $5.73 | $5.22 | $5.70 | $5.72 | $5.37 | $6.04 | ||||||||||||||||||
Total return (%) (k)(r)(s)(x) | 9.77 | (n) | (3.24 | ) | 6.31 | 13.64 | (c) | (4.42 | ) | 2.53 | ||||||||||||||
| Ratios (%) (to average net assets) and Supplemental data: | ||||||||||||||||||||||||
Expenses before expense reductions (f) | 1.03 | (a) | 1.02 | 1.03 | 1.02 | (c) | 1.02 | 1.02 | ||||||||||||||||
Expenses after expense reductions (f) | 0.97 | (a) | 0.97 | 0.97 | 0.95 | (c) | 0.97 | 0.99 | ||||||||||||||||
Net investment income (loss) | 4.73 | (a) | 4.66 | 4.54 | 5.36 | (c) | 5.18 | 5.19 | ||||||||||||||||
Portfolio turnover | 31 | (n) | 40 | 49 | 41 | 33 | 43 | |||||||||||||||||
Net assets at end of period (000 omitted) | $45,395 | $44,995 | $58,499 | $69,189 | $71,421 | $84,272 | ||||||||||||||||||
See Notes to Financial Statements
15
Table of Contents
MFS High Yield Portfolio
Financial Highlights – continued
| (a) | Annualized. |
| (c) | Amount reflects aone-time reimbursement of expenses by the custodian (or former custodian) without which net investment income and performance would be lower and expenses would be higher. |
| (d) | Per share data is based on average shares outstanding. |
| (f) | Ratios do not reflect reductions from fees paid indirectly, if applicable. |
| (k) | The total return does not reflect expenses that apply to separate accounts. Inclusion of these charges would reduce the total return figures for all periods shown. |
| (n) | Not annualized. |
| (r) | Certain expenses have been reduced without which performance would have been lower. |
| (s) | From time to time the fund may receive proceeds from litigation settlements, without which performance would be lower. |
| (x) | The net asset values and total returns have been calculated on net assets which include adjustments made in accordance with U.S. generally accepted accounting principles required at period end for financial reporting purposes. |
See Notes to Financial Statements
16
Table of Contents
MFS High Yield Portfolio
NOTES TO FINANCIAL STATEMENTS (unaudited)
| (1) | Business and Organization |
MFS High Yield Portfolio (the fund) is a diversified series of MFS Variable Insurance Trust II (the trust). The trust is organized as a Massachusetts business trust and is registered under the Investment Company Act of 1940, as amended, as anopen-end management investment company. The shareholders of each series of the trust are separate accounts of insurance companies, which offer variable annuity and/or life insurance products, and qualified retirement and pension plans.
The fund is an investment company and accordingly follows the investment company accounting and reporting guidance of the Financial Accounting Standards Board (FASB) Accounting Standards Codification Topic 946 Financial Services – Investment Companies.
| (2) | Significant Accounting Policies |
General– The preparation of financial statements in conformity with U.S. generally accepted accounting principles requires management to make estimates and assumptions that affect the reported amounts of assets and liabilities, and disclosure of contingent assets and liabilities at the date of the financial statements and the reported amounts of increases and decreases in net assets from operations during the reporting period. Actual results could differ from those estimates. In the preparation of these financial statements, management has evaluated subsequent events occurring after the date of the fund’s Statement of Assets and Liabilities through the date that the financial statements were issued. The fund invests in high-yield securities rated below investment grade. Investments in below investment grade quality securities can involve a substantially greater risk of default or can already be in default, and their values can decline significantly. Below investment grade quality securities tend to be more sensitive to adverse news about the issuer, or the market or economy in general, than higher quality debt instruments. The fund invests in foreign securities. Investments in foreign securities are vulnerable to the effects of changes in the relative values of the local currency and the U.S. dollar and to the effects of changes in each country’s market, economic, industrial, political, regulatory, geopolitical, and other conditions.
In March 2017, the FASB issued Accounting Standards Update2017-08, Receivables – Nonrefundable Fees and Other Costs (Subtopic310-20) – Premium Amortization on Purchased Callable Debt Securities (“ASU2017-08”). For callable debt securities purchased at a premium that have explicit,non-contingent call features and that are callable at fixed prices on preset dates, ASU2017-08 requires the premium to be amortized to the earliest call date. The fund adopted ASU2017-08 as of the beginning of the reporting period on a modified retrospective basis. The adoption resulted in a change in accounting principle, since the fund had historically amortized such premiums to maturity for U.S. GAAP. As a result of the adoption, the fund recognized a cumulative effect adjustment that increased the beginning of period cost of investments and decreased the unrealized appreciation on investments by $253,952. Adoption had no impact on the fund’s net assets or any prior period information presented in the financial statements. With respect to the fund’s results of operations, amortization of premium to first call date under ASU2017-08 accelerates amortization with the intent of more closely aligning the recognition of income on such bonds with the economics of the instrument.
Balance Sheet Offsetting– The fund’s accounting policy with respect to balance sheet offsetting is that, absent an event of default by the counterparty or a termination of the agreement, the International Swaps and Derivatives Association (ISDA) Master Agreement, or similar agreement, does not result in an offset of reported amounts of financial assets and financial liabilities in the Statement of Assets and Liabilities across transactions between the fund and the applicable counterparty. The fund’s right to setoff may be restricted or prohibited by the bankruptcy or insolvency laws of the particular jurisdiction to which a specific master netting agreement counterparty is subject. Balance sheet offsetting disclosures, to the extent applicable to the fund, have been included in the fund’s Significant Accounting Policies note under the captions for each of the fund’sin-scope financial instruments and transactions.
Investment Valuations– Equity securities, including restricted equity securities, are generally valued at the last sale or official closing price on their primary market or exchange as provided by a third-party pricing service. Equity securities, for which there were no sales reported that day, are generally valued at the last quoted daily bid quotation on their primary market or exchange as provided by a third-party pricing service. Debt instruments and floating rate loans, including restricted debt instruments, are generally valued at an evaluated or composite bid as provided by a third-party pricing service. Short-term instruments with a maturity at issuance of 60 days or less may be valued at amortized cost, which approximates market value. Futures contracts are generally valued at last posted settlement price on their primary exchange as provided by a third-party pricing service. Futures contracts for which there were no trades that day for a particular position are generally valued at the closing bid quotation on their primary exchange as provided by a third-party pricing service. Forward foreign currency exchange contracts are generally valued at the mean of bid and asked prices for the time period interpolated from rates provided by a third-party pricing service for proximate time periods.Open-end investment companies are generally valued at net asset value per share. Securities and other assets generally valued on the basis of information from a third-party pricing service may also be valued at a broker/dealer bid quotation. In determining values, third-party pricing services can utilize both transaction data and market information such as yield, quality,
17
Table of Contents
MFS High Yield Portfolio
Notes to Financial Statements (unaudited) – continued
coupon rate, maturity, type of issue, trading characteristics, and other market data. The values of foreign securities and other assets and liabilities expressed in foreign currencies are converted to U.S. dollars using the mean of bid and asked prices for rates provided by a third-party pricing service.
The Board of Trustees has delegated primary responsibility for determining or causing to be determined the value of the fund’s investments (including any fair valuation) to the adviser pursuant to valuation policies and procedures approved by the Board. If the adviser determines that reliable market quotations are not readily available, investments are valued at fair value as determined in good faith by the adviser in accordance with such procedures under the oversight of the Board of Trustees. Under the fund’s valuation policies and procedures, market quotations are not considered to be readily available for most types of debt instruments and floating rate loans and many types of derivatives. These investments are generally valued at fair value based on information from third-party pricing services. In addition, investments may be valued at fair value if the adviser determines that an investment’s value has been materially affected by events occurring after the close of the exchange or market on which the investment is principally traded (such as foreign exchange or market) and prior to the determination of the fund’s net asset value, or after the halt of trading of a specific security where trading does not resume prior to the close of the exchange or market on which the security is principally traded. The adviser generally relies on third-party pricing services or other information (such as the correlation with price movements of similar securities in the same or other markets; the type, cost and investment characteristics of the security; the business and financial condition of the issuer; and trading and other market data) to assist in determining whether to fair value and at what value to fair value an investment. The value of an investment for purposes of calculating the fund’s net asset value can differ depending on the source and method used to determine value. When fair valuation is used, the value of an investment used to determine the fund’s net asset value may differ from quoted or published prices for the same investment. There can be no assurance that the fund could obtain the fair value assigned to an investment if it were to sell the investment at the same time at which the fund determines its net asset value per share.
Various inputs are used in determining the value of the fund’s assets or liabilities. These inputs are categorized into three broad levels. In certain cases, the inputs used to measure fair value may fall into different levels of the fair value hierarchy. In such cases, an investment’s level within the fair value hierarchy is based on the lowest level of input that is significant to the fair value measurement. The fund’s assessment of the significance of a particular input to the fair value measurement in its entirety requires judgment, and considers factors specific to the investment. Level 1 includes unadjusted quoted prices in active markets for identical assets or liabilities. Level 2 includes other significant observable market-based inputs (including quoted prices for similar securities, interest rates, prepayment speed, and credit risk). Level 3 includes unobservable inputs, which may include the adviser’s own assumptions in determining the fair value of investments. Other financial instruments are derivative instruments, such as futures contracts and forward foreign currency exchange contracts. The following is a summary of the levels used as of June 30, 2019 in valuing the fund’s assets or liabilities:
| Financial Instruments | Level 1 | Level 2 | Level 3 | Total | ||||||||||||
| Equity Securities | $— | $254,180 | $991,703 | $1,245,883 | ||||||||||||
| U.S. Corporate Bonds | — | 307,180,074 | — | 307,180,074 | ||||||||||||
| Asset-Backed Securities (including CDOs) | — | 121 | — | 121 | ||||||||||||
| Foreign Bonds | — | 54,503,464 | — | 54,503,464 | ||||||||||||
| Floating Rate Loans | — | 3,061,471 | — | 3,061,471 | ||||||||||||
| Mutual Funds | 7,794,024 | — | — | 7,794,024 | ||||||||||||
| Total | $7,794,024 | $364,999,310 | $991,703 | $373,785,037 | ||||||||||||
| Other Financial Instruments | ||||||||||||||||
| Futures Contracts – Liabilities | $(209,725 | ) | $— | $— | $(209,725 | ) | ||||||||||
| Forward Foreign Currency Exchange Contracts – Assets | — | 7,697 | — | 7,697 | ||||||||||||
| Forward Foreign Currency Exchange Contracts – Liabilities | — | (25,114 | ) | — | (25,114 | ) | ||||||||||
For further information regarding security characteristics, see the Portfolio of Investments.
The following is a reconciliation of level 3 assets for which significant unobservable inputs were used to determine fair value. The table presents the activity of level 3 securities held at the beginning and the end of the period.
| Equity Securities | ||||
| Balance as of 12/31/18 | $991,703 | |||
Change in unrealized appreciation or depreciation | 0 | |||
| Balance as of 6/30/19 | $991,703 | |||
The net change in unrealized appreciation or depreciation from investments held as level 3 at June 30, 2019 is $0. At June 30, 2019, the fund held one level 3 security.
18
Table of Contents
MFS High Yield Portfolio
Notes to Financial Statements (unaudited) – continued
Foreign Currency Translation– Purchases and sales of foreign investments, income, and expenses are converted into U.S. dollars based upon currency exchange rates prevailing on the respective dates of such transactions or on the reporting date for foreign denominated receivables and payables. Gains and losses attributable to foreign currency exchange rates on sales of securities are recorded for financial statement purposes as net realized gains and losses on investments. Gains and losses attributable to foreign exchange rate movements on receivables, payables, income and expenses are recorded for financial statement purposes as foreign currency transaction gains and losses. That portion of both realized and unrealized gains and losses on investments that results from fluctuations in foreign currency exchange rates is not separately disclosed.
Derivatives– The fund uses derivatives primarily to increase or decrease exposure to a particular market or segment of the market, or security, to increase or decrease interest rate exposure, or as alternatives to direct investments. Derivatives are used for hedging ornon-hedging purposes. While hedging can reduce or eliminate losses, it can also reduce or eliminate gains. When the fund uses derivatives as an investment to increase market exposure, or for hedging purposes, gains and losses from derivative instruments may be substantially greater than the derivative’s original cost.
The derivative instruments used by the fund during the period were futures contracts and forward foreign currency exchange contracts. Depending on the type of derivative, the fund may exit a derivative position by entering into an offsetting transaction with a counterparty or exchange, negotiating an agreement with the derivative counterparty, or novating the position to a third party. The fund may be unable to promptly close out a futures position in instances where the daily fluctuation in the price for that type of future exceeds the daily limit set by the exchange. The fund’s period end derivatives, as presented in the Portfolio of Investments and the associated Derivative Contract tables, generally are indicative of the volume of its derivative activity during the period.
The following table presents, by major type of derivative contract, the fair value, on a gross basis, of the asset and liability components of derivatives held by the fund at June 30, 2019 as reported in the Statement of Assets and Liabilities:
| Fair Value (a) | ||||||||||
| Risk | Derivative Contracts | Asset Derivatives | Liability Derivatives | |||||||
| Interest Rate | Interest Rate Futures | $— | $(209,725 | ) | ||||||
| Foreign Exchange | Forward Foreign Currency Exchange Contracts | 7,697 | (25,114 | ) | ||||||
| Total | $7,697 | $(234,839 | ) | |||||||
| (a) | Values presented in this table for futures contracts correspond to the values reported in the fund’s Portfolio of Investments. Only the current day net variation margin for futures contracts is separately reported within the fund’s Statement of Assets and Liabilities. |
The following table presents, by major type of derivative contract, the realized gain (loss) on derivatives held by the fund for the six months ended June 30, 2019 as reported in the Statement of Operations:
| Risk | Futures Contracts | Forward Foreign Currency Exchange Contracts | ||||||
| Interest Rate | $(429,968 | ) | $— | |||||
| Foreign Exchange | — | 94,726 | ||||||
| Total | $(429,968 | ) | $94,726 | |||||
The following table presents, by major type of derivative contract, the change in unrealized appreciation or depreciation on derivatives held by the fund for the six months ended June 30, 2019 as reported in the Statement of Operations:
| Risk | Futures Contracts | Forward Foreign Currency Exchange Contracts | ||||||
| Interest Rate | $(53,598 | ) | $— | |||||
| Foreign Exchange | — | (41,324 | ) | |||||
| Total | $(53,598 | ) | $(41,324 | ) | ||||
Derivative counterparty credit risk is managed through formal evaluation of the creditworthiness of all potential counterparties. On certain, but not all, uncleared derivatives, the fund attempts to reduce its exposure to counterparty credit risk whenever possible by entering into an ISDA Master Agreement on a bilateral basis. The ISDA Master Agreement gives each party to the agreement the right to terminate all transactions traded under such agreement if there is a specified deterioration in the credit quality of the other party. Upon an event of default or a termination of the ISDA Master Agreement, thenon-defaulting party has the right to close out all transactions traded under such agreement and to net amounts owed under each agreement to one net amount payable by one
19
Table of Contents
MFS High Yield Portfolio
Notes to Financial Statements (unaudited) – continued
party to the other. This right to close out and net payments across all transactions traded under the ISDA Master Agreement could result in a reduction of the fund’s credit risk to such counterparty equal to any amounts payable by the fund under the applicable transactions, if any.
Collateral and margin requirements differ by type of derivative. For cleared derivatives (e.g., futures contracts, cleared swaps, and exchange-traded options), margin requirements are set by the clearing broker and the clearing house and collateral, in the form of cash or securities, is posted by the fund directly with the clearing broker. Collateral terms are counterparty agreement specific for uncleared derivatives (e.g., forward foreign currency exchange contracts, uncleared swap agreements, and uncleared options) and collateral, in the form of cash and securities, is held in segregated accounts with the fund’s custodian in connection with these agreements. For derivatives traded under an ISDA Master Agreement, which contains a collateral support annex, the collateral requirements are netted across all transactions traded under such counterparty-specific agreement and an amount is posted from one party to the other to collateralize such obligations. Cash that has been segregated or delivered to cover the fund’s collateral or margin obligations under derivative contracts, if any, will be reported separately in the Statement of Assets and Liabilities as restricted cash for uncleared derivatives and/or deposits with brokers for cleared derivatives. Securities pledged as collateral or margin for the same purpose, if any, are noted in the Portfolio of Investments. The fund may be required to make payments of interest on uncovered collateral or margin obligations with the broker. Any such payments are included in “Miscellaneous” in the Statement of Operations.
Futures Contracts– The fund entered into futures contracts which may be used to hedge against or obtain broad market exposure, interest rate exposure, currency exposure, or to manage duration. A futures contract represents a commitment for the future purchase or sale of an asset at a specified price on a specified date.
Upon entering into a futures contract, the fund is required to deposit with the broker, either in cash or securities, an initial margin in an amount equal to a specified percentage of the notional amount of the contract. Subsequent payments (variation margin) are made or received by the fund each day, depending on the daily fluctuations in the value of the contract, and are recorded for financial statement purposes as unrealized gain or loss by the fund until the contract is closed or expires at which point the gain or loss on futures contracts is realized.
The fund bears the risk of interest rates, exchange rates or securities prices moving unexpectedly, in which case, the fund may not achieve the anticipated benefits of the futures contracts and may realize a loss. While futures contracts may present less counterparty risk to the fund since the contracts are exchange traded and the exchange’s clearinghouse guarantees payments to the broker, there is still counterparty credit risk due to the insolvency of the broker. The fund’s maximum risk of loss due to counterparty credit risk is equal to the margin posted by the fund to the broker plus any gains or minus any losses on the outstanding futures contracts.
Forward Foreign Currency Exchange Contracts– The fund entered into forward foreign currency exchange contracts for the purchase or sale of a specific foreign currency at a fixed price on a future date. These contracts may be used to hedge the fund’s currency risk or fornon-hedging purposes. For hedging purposes, the fund may enter into contracts to deliver or receive foreign currency that the fund will receive from or use in its normal investment activities. The fund may also use contracts to hedge against declines in the value of foreign currency denominated securities due to unfavorable exchange rate movements. Fornon-hedging purposes, the fund may enter into contracts with the intent of changing the relative exposure of the fund’s portfolio of securities to different currencies to take advantage of anticipated exchange rate changes.
Forward foreign currency exchange contracts are adjusted by the daily exchange rate of the underlying currency and any unrealized gains or losses are recorded as a receivable or payable for forward foreign currency exchange contracts until the contract settlement date. On contract settlement date, any gain or loss on the contract is recorded as realized gains or losses on forward foreign currency exchange contracts.
Risks may arise upon entering into these contracts from unanticipated movements in the value of the contract and from the potential inability of counterparties to meet the terms of their contracts. Generally, the fund’s maximum risk due to counterparty credit risk is the unrealized gain on the contract due to the use of Continuous Linked Settlement, a multicurrency cash settlement system for the centralized settlement of foreign transactions. This risk is mitigated in cases where there is an ISDA Master Agreement between the fund and the counterparty providing for netting as described above and, where applicable, by the posting of collateral by the counterparty to the fund to cover the fund’s exposure to the counterparty under such ISDA Master Agreement.
Loans and Other Direct Debt Instruments–The fund invests in loans and loan participations or other receivables. These investments may include standby financing commitments, including revolving credit facilities, which contractually obligate the fund to supply additional cash to the borrower on demand. The fund generally provides this financial support in order to preserve its existing investment or to obtain a more senior secured interest in the assets of the borrower. Loan participations involve a risk of insolvency of the lending bank or other financial intermediary.
Indemnifications– Under the fund’s organizational documents, its officers and Trustees may be indemnified against certain liabilities and expenses arising out of the performance of their duties to the fund. Additionally, in the normal course of business, the
20
Table of Contents
MFS High Yield Portfolio
Notes to Financial Statements (unaudited) – continued
fund enters into agreements with service providers that may contain indemnification clauses. The fund’s maximum exposure under these agreements is unknown as this would involve future claims that may be made against the fund that have not yet occurred.
Investment Transactions and Income– Investment transactions are recorded on the trade date. Interest income is recorded on the accrual basis. All premium and discount is amortized or accreted for financial statement purposes in accordance with U.S. generally accepted accounting principles. The fund earns certain fees in connection with its floating rate loan purchasing activities. These fees are in addition to interest payments earned and may include amendment fees, commitment fees, facility fees, consent fees, and prepayment fees. Commitment fees are recorded on an accrual basis as income in the accompanying financial statements. Dividends received in cash are recorded on theex-dividend date. Certain dividends from foreign securities will be recorded when the fund is informed of the dividend if such information is obtained subsequent to theex-dividend date. Dividend and interest payments received in additional securities are recorded on theex-dividend orex-interest date in an amount equal to the value of the security on such date.
The fund may receive proceeds from litigation settlements. Any proceeds received from litigation involving portfolio holdings are reflected in the Statement of Operations in realized gain/loss if the security has been disposed of by the fund or in unrealized gain/loss if the security is still held by the fund. Any other proceeds from litigation not related to portfolio holdings are reflected as other income in the Statement of Operations.
Legal fees and other related expenses incurred to preserve and protect the value of a security owned are added to the cost of the security; other legal fees are expensed. Capital infusions made directly to the security issuer, which are generallynon-recurring, incurred to protect or enhance the value of high-yield debt securities, are reported as additions to the cost basis of the security. Costs that are incurred to negotiate the terms or conditions of capital infusions or that are expected to result in a plan of reorganization are reported as realized losses. Ongoing costs incurred to protect or enhance an investment, or costs incurred to pursue other claims or legal actions, are expensed.
Tax Matters and Distributions– The fund intends to qualify as a regulated investment company, as defined under Subchapter M of the Internal Revenue Code, and to distribute all of its taxable income, including realized capital gains. As a result, no provision for federal income tax is required. The fund’s federal tax returns, when filed, will remain subject to examination by the Internal Revenue Service for a three year period. Management has analyzed the fund’s tax positions taken on federal and state tax returns for all open tax years and does not believe that there are any uncertain tax positions that require recognition of a tax liability. Foreign taxes, if any, have been accrued by the fund in the accompanying financial statements in accordance with the applicable foreign tax law. Foreign income taxes may be withheld by certain countries in which the fund invests. Additionally, capital gains realized by the fund on securities issued in or by certain foreign countries may be subject to capital gains tax imposed by those countries.
Distributions to shareholders are recorded on theex-dividend date. Income and capital gain distributions are determined in accordance with income tax regulations, which may differ from U.S. generally accepted accounting principles. Certain capital accounts in the financial statements are periodically adjusted for permanent differences in order to reflect their tax character. These adjustments have no impact on net assets or net asset value per share. Temporary differences which arise from recognizing certain items of income, expense, gain or loss in different periods for financial statement and tax purposes will reverse at some time in the future. Distributions in excess of net investment income or net realized gains are temporary overdistributions for financial statement purposes resulting from differences in the recognition or classification of income or distributions for financial statement and tax purposes.
Book/tax differences primarily relate to amortization and accretion of debt securities.
The tax character of distributions declared to shareholders for the last fiscal year is as follows:
| Year ended 12/31/18 | ||||
| Ordinary income (including any short-term capital gains) | $22,864,139 | |||
The federal tax cost and the tax basis components of distributable earnings were as follows:
| As of 6/30/19 | ||||
| Cost of investments | $371,619,570 | |||
| Gross appreciation | 7,529,872 | |||
| Gross depreciation | (5,364,405 | ) | ||
| Net unrealized appreciation (depreciation) | $2,165,467 | |||
| As of 12/31/18 | ||||
| Undistributed ordinary income | 20,864,558 | |||
| Capital loss carryforwards | (37,990,618 | ) | ||
| Other temporary differences | 249 | |||
| Net unrealized appreciation (depreciation) | (28,292,663 | ) | ||
21
Table of Contents
MFS High Yield Portfolio
Notes to Financial Statements (unaudited) – continued
The aggregate cost above includes prior fiscal year end tax adjustments, if applicable.
As of December 31, 2018, the fund had capital loss carryforwards available to offset future realized gains. These net capital losses may be carried forward indefinitely and their character is retained as short-term and/or long-term losses. Such losses are characterized as follows:
| Short-Term | $(1,274,958 | ) | ||
| Long-Term | (36,715,660 | ) | ||
| Total | $(37,990,618 | ) |
Multiple Classes of Shares of Beneficial Interest– The fund offers multiple classes of shares, which differ in their respective distribution and/or service fees. The fund’s income, realized and unrealized gain (loss), and common expenses are allocated to shareholders based on the daily net assets of each class. Dividends are declared separately for each class. Differences in per share dividend rates are generally due to differences in separate class expenses. The fund’s distributions declared to shareholders as reported in the Statements of Changes in Net Assets are presented by class as follows:
| From net investment income | ||||||||
| Six months ended 6/30/19 | Year ended 12/31/18 | |||||||
| Initial Class | $— | $20,085,625 | ||||||
| Service Class | — | 2,778,514 | ||||||
| Total | $— | $22,864,139 | ||||||
| (3) | Transactions with Affiliates |
Investment Adviser– The fund has an investment advisory agreement with MFS to provide overall investment management and related administrative services and facilities to the fund. The management fee is computed daily and paid monthly at the following annual rates based on the fund’s average daily net assets:
| Up to $1 billion | 0.70% | |||
| In excess of $1 billion | 0.65% |
MFS has agreed in writing to reduce its management fee by a specified amount if certain MFS mutual fund assets exceed thresholds agreed to by MFS and the fund’s Board of Trustees. For the six months ended June 30, 2019, this management fee reduction amounted to $18,028, which is included in the reduction of total expenses in the Statement of Operations. The management fee incurred for the six months ended June 30, 2019 was equivalent to an annual effective rate of 0.69% of the fund’s average daily net assets.
The investment adviser has agreed in writing to pay a portion of the fund’s total annual operating expenses, excluding interest, taxes, extraordinary expenses, brokerage and transaction costs, and investment-related expenses, such that total annual operating expenses do not exceed 0.72% of average daily net assets for the Initial Class shares and 0.97% of average daily net assets for the Service Class shares. This written agreement will continue until modified by the fund’s Board of Trustees, but such agreement will continue at least until April 30, 2021. For the six months ended June 30, 2019, this reduction amounted to $89,340, which is included in the reduction of total expenses in the Statement of Operations.
Distributor– MFS Fund Distributors, Inc. (MFD), a wholly-owned subsidiary of MFS, is the distributor of shares of the fund. The Trustees have adopted a distribution plan for the Service Class shares pursuant to Rule12b-1 under the Investment Company Act of 1940.
The fund’s distribution plan provides that the fund will pay MFD distribution and/or service fees equal to 0.25% per annum of its average daily net assets attributable to Service Class shares as partial consideration for services performed and expenses incurred by MFD and financial intermediaries (including participating insurance companies that invest in the fund to fund variable annuity and variable life insurance contracts, sponsors of qualified retirement and pension plans that invest in the fund, and affiliates of these participating insurance companies and plan sponsors) in connection with the sale and distribution of the Service Class shares. MFD may subsequently pay all, or a portion, of the distribution and/or service fees to financial intermediaries.
Shareholder Servicing Agent– MFS Service Center, Inc. (MFSC), a wholly-owned subsidiary of MFS, receives a fee from the fund for its services as shareholder servicing agent. For the six months ended June 30, 2019, the fee was $4,627, which equated to 0.0025% annually of the fund’s average daily net assets. MFSC also receives payment from the fund forout-of-pocket expenses paid by MFSC on behalf of the fund. For the six months ended June 30, 2019, these costs amounted to $320.
Administrator– MFS provides certain financial, legal, shareholder communications, compliance, and other administrative services to the fund. Under an administrative services agreement, the fund reimburses MFS the costs incurred to provide these services. The
22
Table of Contents
MFS High Yield Portfolio
Notes to Financial Statements (unaudited) – continued
fund is charged an annual fixed amount of $17,500 plus a fee based on average daily net assets. The administrative services fee incurred for the six months ended June 30, 2019 was equivalent to an annual effective rate of 0.0168% of the fund’s average daily net assets.
Trustees’ and Officers’ Compensation– The fund pays compensation to independent Trustees in the form of a retainer, attendance fees, and additional compensation to Board and Committee chairpersons. The fund does not pay compensation directly to Trustees or officers of the fund who are also officers of the investment adviser, all of whom receive remuneration from MFS for their services to the fund. Certain officers and Trustees of the fund are officers or directors of MFS, MFD, and MFSC.
Other– This fund and certain other funds managed by MFS (the funds) had entered into a service agreement (the ISO Agreement) which provided for payment of fees solely by the funds to Tarantino LLC in return for the provision of services of an Independent Senior Officer (ISO) for the funds. Frank L. Tarantino served as the ISO and was an officer of the funds and the sole member of Tarantino LLC. Effective June 30, 2019, Mr. Tarantino retired from his position as ISO for the funds, and the ISO Agreement was terminated. For the six months ended June 30, 2019, the fee paid by the fund under this agreement was $442 and is included in “Miscellaneous” expense in the Statement of Operations. MFS had agreed to bear all expenses associated with office space, other administrative support, and supplies provided to the ISO.
The fund invests in the MFS Institutional Money Market Portfolio which is managed by MFS and seeks current income consistent with preservation of capital and liquidity. This money market fund does not pay a management fee to MFS.
| (4) | Portfolio Securities |
For the six months ended June 30, 2019, purchases and sales of investments, other than short-term obligations, aggregated $110,723,690 and $123,608,148, respectively.
| (5) | Shares of Beneficial Interest |
The fund’s Declaration of Trust permits the Trustees to issue an unlimited number of full and fractional shares of beneficial interest. Transactions in fund shares were as follows:
| Six months ended 6/30/19 | Year ended 12/31/18 | |||||||||||||||
| Shares | Amount | Shares | Amount | |||||||||||||
| Shares sold | ||||||||||||||||
Initial Class | 1,184,705 | $6,648,545 | 2,683,377 | $15,262,881 | ||||||||||||
Service Class | 142,091 | 789,568 | 318,476 | 1,796,833 | ||||||||||||
| 1,326,796 | $7,438,113 | 3,001,853 | $17,059,714 | |||||||||||||
| Shares issued to shareholders in reinvestment of distributions | ||||||||||||||||
Initial Class | — | $— | 3,658,584 | $20,085,625 | ||||||||||||
Service Class | — | — | 511,697 | 2,778,514 | ||||||||||||
| — | $— | 4,170,281 | $22,864,139 | |||||||||||||
| Shares reacquired | ||||||||||||||||
Initial Class | (4,772,435 | ) | $(26,711,053 | ) | (12,326,049 | ) | $(68,941,144 | ) | ||||||||
Service Class | (838,147 | ) | (4,650,168 | ) | (2,472,313 | ) | (13,714,022 | ) | ||||||||
| (5,610,582 | ) | $(31,361,221 | ) | (14,798,362 | ) | $(82,655,166 | ) | |||||||||
| Net change | ||||||||||||||||
Initial Class | (3,587,730 | ) | $(20,062,508 | ) | (5,984,088 | ) | $(33,592,638 | ) | ||||||||
Service Class | (696,056 | ) | (3,860,600 | ) | (1,642,140 | ) | (9,138,675 | ) | ||||||||
| (4,283,786 | ) | $(23,923,108 | ) | (7,626,228 | ) | $(42,731,313 | ) | |||||||||
The fund is one of several mutual funds in which certain MFS funds may invest. The MFS funds do not invest in the underlying funds for the purpose of exercising management or control. At the end of the period, the MFS Moderate Allocation Portfolio, the MFS Conservative Allocation Portfolio, and the MFS Growth Allocation Portfolio were the owners of record of approximately 19%, 6%, and 5%, respectively, of the value of outstanding voting shares of the fund.
| (6) | Line of Credit |
The fund and certain other funds managed by MFS participate in a $1.25 billion unsecured committed line of credit, subject to a $1 billion sublimit, provided by a syndicate of banks under a credit agreement. Borrowings may be made for temporary financing needs. Interest is charged to each fund, based on its borrowings, generally at a rate equal to the highest of one month LIBOR, the Federal Funds Effective Rate and the Overnight Bank Funding Rate, plus an agreed upon spread. A commitment fee, based on the average daily, unused portion of the committed line of credit, is allocated among the participating funds. In addition, the fund and other funds managed by MFS have established unsecured uncommitted borrowing arrangements with certain banks for temporary
23
Table of Contents
MFS High Yield Portfolio
Notes to Financial Statements (unaudited) – continued
financing needs. Interest is charged to each fund, based on its borrowings, at rates equal to customary reference rates plus an agreed upon spread. For the six months ended June 30, 2019, the fund’s commitment fee and interest expense were $1,181 and $0, respectively, and are included in “Miscellaneous” expense in the Statement of Operations.
| (7) | Investments in Affiliated Issuers |
An affiliated issuer may be considered one in which the fund owns 5% or more of the outstanding voting securities, or a company which is under common control. For the purposes of this report, the following were affiliated issuers:
| Affiliated Issuers | Beginning Value | Purchases | Sales Proceeds | Realized Gain (Loss) | Change in Unrealized Appreciation or Depreciation | Ending Value | ||||||||||||||||||
| MFS Institutional Money Market Portfolio | $9,625,650 | $49,153,166 | $50,986,777 | $247 | $1,738 | $7,794,024 | ||||||||||||||||||
| Affiliated Issuers | Dividend Income | Capital Gain Distributions | ||||||||||||||||||||||
| MFS Institutional Money Market Portfolio | $110,485 | $— | ||||||||||||||||||||||
24
Table of Contents
MFS High Yield Portfolio
PROXY VOTING POLICIES AND INFORMATION
MFS votes proxies on behalf of the fund pursuant to proxy voting policies and procedures that are available without charge, upon request, by calling 1-800-225-2606, by visitingmfs.com/proxyvoting, or by visiting the SEC’s Web site athttp://www.sec.gov.
Information regarding how the fund voted proxies relating to portfolio securities during the most recent twelve-month period ended June 30 is available by August 31 of each year without charge by visitingmfs.com/proxyvoting, or by visiting the SEC’s Web site athttp://www.sec.gov.
QUARTERLY PORTFOLIO DISCLOSURE
The fund files a complete schedule of portfolio holdings with the SEC for the first and third quarters of each fiscal year on Form N-Q or as an exhibit to its reports on Form N-PORT (for first and third fiscal quarters ending March 31, 2019 or after). The fund’sForm N-Q or Form N-PORT reports are available on the SEC’s website athttp://www.sec.gov. A shareholder can obtain the portfolio holdings report for the first and third quarters of the fund’s fiscal year atmfs.com/vit2 by choosing the fund’s name and then selecting the “Resources” tab and clicking on “Prospectus and Reports”.
From time to time, MFS may post important information about the fund or the MFS funds on the MFS web site (mfs.com). This information is available athttps://www.mfs.com/en-us/what-we-do/announcements.htmlor atmfs.com/vit2 by choosing the fund’s name.
INFORMATION ABOUT FUND CONTRACTS AND LEGAL CLAIMS
The fund has entered into contractual arrangements with an investment adviser, administrator, distributor, shareholder servicing agent, 529 program manager (if applicable), and custodian who each provide services to the fund. Unless expressly stated otherwise, shareholders are not parties to, or intended beneficiaries of these contractual arrangements, and these contractual arrangements are not intended to create any shareholder right to enforce them against the service providers or to seek any remedy under them against the service providers, either directly or on behalf of the fund.
Under the Trust’s By-Laws and Declaration of Trust, any claims asserted against or on behalf of the MFS Funds, including claims against Trustees and Officers, must be brought in state and federal courts located within the Commonwealth of Massachusetts.
25
Table of Contents
Table of Contents
Semiannual Report
June 30, 2019

MFS® International Growth Portfolio

MFS® Variable Insurance Trust II
Beginning on January 1, 2021, as permitted by regulations adopted by the U.S. Securities and Exchange Commission, the insurance company that offers your contract may determine that it will no longer send you paper copies of the fund’s annual and semiannual shareholder reports unless you specifically request paper copies from the insurance company or from your financial intermediary. Instead, the shareholder reports will be made available on a Web site (insurancefunds.mfs.com or other Web site of which you will be notified), and the insurance company will notify you by mail each time a report is posted and provide you with a Web site link to access the report. Instructions for requesting paper copies will be provided by your insurance company or financial intermediary.
If you already elected to receive shareholder reports by email, you will not be affected by this change and you need not take any action. If your insurance company or financial intermediary offers electronic delivery, you may elect to receive shareholder reports and other communications from the insurance company or financial intermediary by email by following the instructions provided by the insurance company or financial intermediary.
Beginning on January 1, 2019, you may elect to receive all future reports in paper free of charge from the insurance company or financial intermediary. You can inform the insurance company or financial intermediary that you wish to continue receiving paper copies of your shareholder reports by contacting your insurance company or financial intermediary. Your election to receive reports in paper will apply to all funds held in your account with your insurance company or financial intermediary.
FCI-SEM
Table of Contents
MFS® International Growth Portfolio
The report is prepared for the general information of contract owners. It is authorized for distribution to prospective investors only when preceded or accompanied by a current prospectus.
NOT FDIC INSURED• MAY LOSE VALUE• NO BANK OR CREDIT UNION GUARANTEE• NOT A DEPOSIT• NOT INSURED BY ANY FEDERAL GOVERNMENT AGENCY OR NCUA/NCUSIF
Table of Contents
MFS International Growth Portfolio
LETTER FROM THE EXECUTIVE CHAIRMAN

Dear Contract Owners:
Slowing global growth, low inflation, and increasing trade friction between the United States and China have been hallmarks of the past 12 months. After experiencing an uptick in market volatility in late 2018, markets steadied during the first half of 2019, thanks in large measure to the adoption of a dovish policy stance on the part of global central banks, who have largely abandoned efforts to normalize interest rates and have instead focused on supporting economic growth. Trade tensions remain high as the U.S. has ratcheted up tariffs on Chinese imports and China has retaliated. A truce of sorts was reached midyear, but significant challenges continue to confront negotiators, and it is not known whether a comprehensive agreement can be reached.
With Boris Johnson replacing Theresa May as Britain’s prime minister, uncertainty over Brexit remains high. Johnson has adopted a more combative stance than his predecessor toward the European Union, increasing concerns that there will be a “hard” Brexit.
Markets expect that the longest economic expansion in U.S. history will continue for the time being, albeit at a slower pace. Nevertheless, slower growth and low inflation have spurred the U.S. Federal Reserve to take a more accommodative policy stance, prompting investors to anticipate several interest rate cuts in the coming year. The European Central Bank has adopted a similar position. The more accommodative environment has helped fuel a continued rise in global equities and has been broadly supportive of risk assets.
Since launching the first U.S.open-end mutual fund in 1924, MFS® has been committed to a single purpose: to create value by allocating capital responsibly for clients. Through our powerful global investment platform, we combine collective expertise, thoughtful risk management, and long-term discipline to uncover what we believe are the best investment opportunities in the market.
Respectfully,

Robert J. Manning
Executive Chairman
MFS Investment Management
August 16, 2019
The opinions expressed in this letter are subject to change and may not be relied upon for investment advice. No forecasts can be guaranteed.
1
Table of Contents
MFS International Growth Portfolio
Portfolio structure
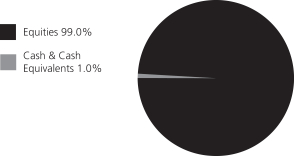
| Top ten holdings | ||||
| Nestle S.A. | 5.1% | |||
| Roche Holding AG | 4.2% | |||
| SAP AG | 3.8% | |||
| AIA Group Ltd. | 3.8% | |||
| LVMH Moet Hennessy Louis Vuitton SE | 3.3% | |||
| Taiwan Semiconductor Manufacturing Co. Ltd., ADR | 3.0% | |||
| L’Oréal | 2.8% | |||
| Danone S.A. | 2.5% | |||
| Linde PLC | 2.5% | |||
| Pernod Ricard S.A. | 2.4% | |||
| GICS equity sectors (g) | ||||
| Consumer Staples | 20.7% | |||
| Information Technology | 14.2% | |||
| Industrials | 14.2% | |||
| Health Care | 13.3% | |||
| Financials | 12.0% | |||
| Consumer Discretionary | 10.7% | |||
| Materials | 8.9% | |||
| Communication Services | 3.2% | |||
| Energy | 1.2% | |||
| Utilities | 0.6% | |||
| Issuer country weightings (x) | ||||
| France | 18.7% | |||
| Switzerland | 14.3% | |||
| United Kingdom | 11.2% | |||
| Germany | 10.1% | |||
| Japan | 8.2% | |||
| United States | 6.6% | |||
| India | 4.3% | |||
| China | 3.9% | |||
| Hong Kong | 3.8% | |||
| Other Countries | 18.9% | |||
| Currency exposure weightings (y) | ||||
| Euro | 34.5% | |||
| Swiss Franc | 14.3% | |||
| British Pound Sterling | 11.8% | |||
| Japanese Yen | 8.2% | |||
| United States Dollar | 7.6% | |||
| Hong Kong Dollar | 4.9% | |||
| Indian Rupee | 4.3% | |||
| Taiwan Dollar | 3.0% | |||
| Chinese Renminbi | 2.4% | |||
| Other Currencies | 9.0% | |||
| (g) | The Global Industry Classification Standard (GICS®) was developed by and/or is the exclusive property of MSCI, Inc. and S&P Global Market Intelligence Inc. (“S&P Global Market Intelligence”). GICS is a service mark of MSCI and S&P Global Market Intelligence and has been licensed for use by MFS. |
| (x) | Represents the portfolio’s exposure to issuer countries as a percentage of a portfolio’s net assets. For purposes of this presentation, United States includes Cash & Cash Equivalents. |
| (y) | Represents the portfolio’s exposure to a particular currency as a percentage of a portfolio’s net assets. For purposes of this presentation, United States Dollar includes Cash & Cash Equivalents. |
Cash & Cash Equivalents includes any cash, investments in money market funds, short-term securities, and other assets less liabilities. Please see the Statement of Assets and Liabilities for additional information related to the fund’s cash position and other assets and liabilities.
Percentages are based on net assets as of June 30, 2019.
The portfolio is actively managed and current holdings may be different.
2
Table of Contents
MFS International Growth Portfolio
Fund Expenses Borne by the Contract Holders during the Period,
January 1, 2019 through June 30, 2019
As a contract holder of the fund, you incur ongoing costs, including management fees; distribution and/or service(12b-1) fees; and other fund expenses. This example is intended to help you understand your ongoing costs (in dollars) of investing in the fund and to compare these costs with the ongoing costs of investing in other mutual funds.
The example is based on an investment of $1,000 invested at the beginning of the period and held for the entire period January 1, 2019 through June 30, 2019.
Actual Expenses
The first line for each share class in the following table provides information about actual account values and actual expenses. You may use the information in this line, together with the amount you invested, to estimate the expenses that you paid over the period. Simply divide your account value by $1,000 (for example, an $8,600 account value divided by $1,000 = 8.6), then multiply the result by the number in the first line under the heading entitled “Expenses Paid During Period” to estimate the expenses you paid on your account during this period.
Hypothetical Example for Comparison Purposes
The second line for each share class in the following table provides information about hypothetical account values and hypothetical expenses based on the fund’s actual expense ratio and an assumed rate of return of 5% per year before expenses, which is not the fund’s actual return. The hypothetical account values and expenses may not be used to estimate the actual ending account balance or expenses you paid for the period. You may use this information to compare the ongoing costs of investing in the fund and other funds. To do so, compare this 5% hypothetical example with the 5% hypothetical examples that appear in the shareholder reports of the other funds.
Please note that the expenses shown in the table are meant to highlight the fund’s ongoing costs only and do not take into account the fees and expenses imposed under the variable contracts through which your investment in the fund is made. Therefore, the second line for each share class in the table is useful in comparing ongoing costs associated with an investment in vehicles (such as the fund) which fund benefits under variable annuity and variable life insurance contracts and to qualified pension and retirement plans only, and will not help you determine the relative total costs of investing in the fund through variable annuity and variable life insurance contracts. If the fees and expenses imposed under the variable contracts were included, your costs would have been higher.
| Share Class | Annualized Expense Ratio | Beginning Account Value 1/01/19 | Ending Account Value 6/30/19 | Expenses Paid During Period (p) 1/01/19-6/30/19 | ||||||||||||||
| Initial Class | Actual | 0.88% | $1,000.00 | $1,181.53 | $4.76 | |||||||||||||
| Hypothetical (h) | 0.88% | $1,000.00 | $1,020.43 | $4.41 | ||||||||||||||
| Service Class | Actual | 1.13% | $1,000.00 | $1,180.24 | $6.11 | |||||||||||||
| Hypothetical (h) | 1.13% | $1,000.00 | $1,019.19 | $5.66 | ||||||||||||||
| (h) | 5% class return per year before expenses. |
| (p) | “Expenses Paid During Period” are equal to each class’s annualized expense ratio, as shown above, multiplied by the average account value over the period, multiplied by 181/365 (to reflect theone-half year period). |
3
Table of Contents
MFS International Growth Portfolio
PORTFOLIO OF INVESTMENTS – 6/30/19 (unaudited)
The Portfolio of Investments is a complete list of all securities owned by your fund. It is categorized by broad-based asset classes.
| Issuer | Shares/Par | Value ($) | ||||||
| COMMON STOCKS – 99.0% |
| |||||||
| Aerospace – 1.3% | ||||||||
| Rolls-Royce Holdings PLC | 181,312 | $ | 1,935,080 | |||||
|
| |||||||
| Airlines – 0.3% | ||||||||
| Japan Airport Terminal Co. Ltd. | 9,600 | $ | 409,145 | |||||
|
| |||||||
| Alcoholic Beverages – 5.7% | ||||||||
| Ambev S.A., ADR | 154,051 | $ | 719,418 | |||||
| China Resources Beer Holdings Co. Ltd. | 154,000 | 731,390 | ||||||
| Diageo PLC | 76,105 | 3,270,619 | ||||||
| Pernod Ricard S.A. | 19,175 | 3,533,321 | ||||||
|
| |||||||
| $ | 8,254,748 | |||||||
|
| |||||||
| Apparel Manufacturers – 5.3% | ||||||||
| Burberry Group PLC | 39,625 | $ | 936,991 | |||||
| Kering S.A. | 3,341 | 1,975,887 | ||||||
| LVMH Moet Hennessy Louis Vuitton SE | 11,102 | 4,725,195 | ||||||
|
| |||||||
| $ | 7,638,073 | |||||||
|
| |||||||
| Broadcasting – 0.8% | ||||||||
| WPP PLC | 87,032 | $ | 1,094,431 | |||||
|
| |||||||
| Business Services – 6.2% | ||||||||
| Accenture PLC, “A” | 12,665 | $ | 2,340,112 | |||||
| Brenntag AG | 20,884 | 1,028,491 | ||||||
| Compass Group PLC | 56,686 | 1,358,420 | ||||||
| Experian PLC | 75,210 | 2,277,027 | ||||||
| Infosys Technologies Ltd., ADR | 106,045 | 1,134,682 | ||||||
| Intertek Group PLC | 12,427 | 868,307 | ||||||
|
| |||||||
| $ | 9,007,039 | |||||||
|
| |||||||
| Computer Software – 4.6% | ||||||||
| OBIC Co. Ltd. | 9,300 | $ | 1,052,358 | |||||
| SAP AG | 40,350 | 5,540,710 | ||||||
|
| |||||||
| $ | 6,593,068 | |||||||
|
| |||||||
| Computer Software – Systems – 3.6% |
| |||||||
| Amadeus IT Group S.A. | 19,249 | $ | 1,524,721 | |||||
| Hitachi Ltd. | 64,900 | 2,377,128 | ||||||
| NICE Systems Ltd., ADR (a) | 9,062 | 1,241,494 | ||||||
|
| |||||||
| $ | 5,143,343 | |||||||
|
| |||||||
| Construction – 0.7% | ||||||||
| Toto Ltd. | 27,100 | $ | 1,069,522 | |||||
|
| |||||||
| Consumer Products – 5.6% | ||||||||
| Kao Corp. | 14,800 | $ | 1,127,005 | |||||
| L’Oréal | 14,344 | 4,085,796 | ||||||
| Reckitt Benckiser Group PLC | 36,062 | 2,845,820 | ||||||
|
| |||||||
| $ | 8,058,621 | |||||||
|
| |||||||
| Consumer Services – 0.4% | ||||||||
| 51job, Inc., ADR (a) | 7,915 | $ | 597,582 | |||||
|
| |||||||
| Containers – 0.6% | ||||||||
| Brambles Ltd. | 92,839 | $ | 839,488 | |||||
|
| |||||||
| Issuer | Shares/Par | Value ($) | ||||||
| COMMON STOCKS – continued | ||||||||
| Electrical Equipment – 4.1% | ||||||||
| Legrand S.A. | 10,489 | $ | 766,909 | |||||
| Mettler-Toledo International, Inc. (a) | 1,304 | 1,095,360 | ||||||
| Prysmian S.p.A. | 44,776 | 924,104 | ||||||
| Schneider Electric S.A. | 34,192 | 3,101,047 | ||||||
|
| |||||||
| $ | 5,887,420 | |||||||
|
| |||||||
| Electronics – 3.7% | ||||||||
| Mellanox Technologies Ltd. (a) | 9,352 | $ | 1,034,986 | |||||
| Taiwan Semiconductor Manufacturing Co. Ltd., ADR | 110,471 | 4,327,149 | ||||||
|
| |||||||
| $ | 5,362,135 | |||||||
|
| |||||||
| Energy – Independent – 1.2% | ||||||||
| Caltex Australia Ltd. | 28,115 | $ | 488,519 | |||||
| Oil Search Ltd. | 262,323 | 1,302,038 | ||||||
|
| |||||||
| $ | 1,790,557 | |||||||
|
| |||||||
| Food & Beverages – 7.6% | ||||||||
| Danone S.A. | 43,207 | $ | 3,660,236 | |||||
| Nestle S.A. | 71,402 | 7,391,811 | ||||||
|
| |||||||
| $ | 11,052,047 | |||||||
|
| |||||||
| Gaming & Lodging – 0.6% | ||||||||
| Flutter Entertainment PLC | 11,308 | $ | 851,296 | |||||
|
| |||||||
| Insurance – 3.8% | ||||||||
| AIA Group Ltd. | 508,800 | $ | 5,487,461 | |||||
|
| |||||||
| Internet – 2.8% | ||||||||
| Alibaba Group Holding Ltd., ADR (a) | 5,769 | $ | 977,557 | |||||
| Baidu, Inc., ADR (a) | 15,792 | 1,853,349 | ||||||
| NAVER Corp. | 11,655 | 1,150,713 | ||||||
|
| |||||||
| $ | 3,981,619 | |||||||
|
| |||||||
| Leisure & Toys – 0.6% | ||||||||
| BANDAI NAMCO Holdings, Inc. | 17,800 | $ | 863,461 | |||||
|
| |||||||
| Machinery & Tools – 1.8% | ||||||||
| GEA Group AG | 42,682 | $ | 1,213,343 | |||||
| Ritchie Bros. Auctioneers, Inc. | 42,341 | 1,408,079 | ||||||
|
| |||||||
| $ | 2,621,422 | |||||||
|
| |||||||
| Major Banks – 1.2% | ||||||||
| UBS AG | 140,750 | $ | 1,672,506 | |||||
|
| |||||||
| Medical & Health Technology & Services – 1.5% |
| |||||||
| Alcon, Inc. (a) | 7,046 | $ | 435,088 | |||||
| Fresenius Medical Care AG & Co. KGaA | 22,046 | 1,730,730 | ||||||
|
| |||||||
| $ | 2,165,818 | |||||||
|
| |||||||
| Medical Equipment – 4.1% | ||||||||
| EssilorLuxottica | 21,881 | $ | 2,855,082 | |||||
| QIAGEN N.V. (a) | 31,956 | 1,296,874 | ||||||
| Terumo Corp. | 57,900 | 1,723,869 | ||||||
|
| |||||||
| $ | 5,875,825 | |||||||
|
| |||||||
4
Table of Contents
MFS International Growth Portfolio
Portfolio of Investments (unaudited) – continued
| Issuer | Shares/Par | Value ($) | ||||||
| COMMON STOCKS – continued |
| |||||||
| Metals & Mining – 0.3% | ||||||||
| Grupo Mexico S.A.B. de C.V., “B” | 157,534 | $ | 418,340 | |||||
|
| |||||||
| Natural Gas – Distribution – 0.5% | ||||||||
| China Resources Gas Group Ltd. | 158,000 | $ | 783,760 | |||||
|
| |||||||
| Other Banks & Diversified Financials – 7.1% |
| |||||||
| Aeon Financial Service Co. Ltd. | 59,500 | $ | 957,497 | |||||
| Credicorp Ltd. | 4,092 | 936,700 | ||||||
| DBS Group Holdings Ltd. | 104,700 | 2,008,878 | ||||||
| Element Fleet Management Corp. | 70,496 | 514,636 | ||||||
| Grupo Financiero Banorte S.A. de C.V. | 227,271 | 1,318,601 | ||||||
| HDFC Bank Ltd. | 91,661 | 3,245,034 | ||||||
| Julius Baer Group Ltd. | 18,574 | 826,906 | ||||||
| Komercni Banka A.S. | 10,061 | 400,895 | ||||||
|
| |||||||
| $ | 10,209,147 | |||||||
|
| |||||||
| Pharmaceuticals – 8.9% | ||||||||
| Bayer AG | 33,972 | $ | 2,354,086 | |||||
| Novartis AG | 35,230 | 3,219,131 | ||||||
| Novo Nordisk A.S., “B” | 24,464 | 1,246,651 | ||||||
| Roche Holding AG | 21,436 | 6,030,934 | ||||||
|
| |||||||
| $ | 12,850,802 | |||||||
|
| |||||||
| Railroad & Shipping – 2.8% | ||||||||
| Adani Ports and Special Economic Zone Ltd. | 101,971 | $ | 605,969 | |||||
| Canadian National Railway Co. | 37,167 | 3,437,204 | ||||||
|
| |||||||
| $ | 4,043,173 | |||||||
|
| |||||||
| Restaurants – 0.5% | ||||||||
| Yum China Holdings, Inc. | 14,144 | $ | 653,453 | |||||
|
| |||||||
| Specialty Chemicals – 8.6% | ||||||||
| Akzo Nobel N.V. | 24,863 | $ | 2,336,375 | |||||
| Croda International PLC | 20,096 | 1,306,670 | ||||||
| Kansai Paint Co. Ltd. | 23,700 | 496,576 | ||||||
| L’Air Liquide S.A. | 16,588 | 2,320,996 | ||||||
| Linde PLC | 17,659 | 3,547,141 | ||||||
| Sika AG | 6,284 | 1,072,438 | ||||||
| Symrise AG | 14,400 | 1,385,916 | ||||||
|
| |||||||
| $ | 12,466,112 | |||||||
|
| |||||||
| Issuer | Shares/Par | Value ($) | ||||||
| COMMON STOCKS – continued |
| |||||||
| Specialty Stores – 0.2% | ||||||||
| Just Eat PLC (a) | 34,805 | $ | 276,254 | |||||
|
| |||||||
| Telecommunications – Wireless – 0.3% |
| |||||||
| SoftBank Corp. | 10,300 | $ | 493,433 | |||||
|
| |||||||
| Tobacco – 1.7% | ||||||||
| ITC Ltd. | 304,995 | $ | 1,209,994 | |||||
| Japan Tobacco, Inc. | 58,400 | 1,288,901 | ||||||
|
| |||||||
| $ | 2,498,895 | |||||||
|
| |||||||
| Total Common Stocks (Identified Cost, $88,520,837) | $ | 142,945,076 | ||||||
|
| |||||||
| INVESTMENT COMPANIES (h) – 0.1% |
| |||||||
| Money Market Funds – 0.1% | ||||||||
| MFS Institutional Money Market Portfolio, 2.42% (v) (Identified Cost, $209,751) | 209,771 | $ | 209,792 | |||||
|
| |||||||
| OTHER ASSETS, LESS LIABILITIES – 0.9% | 1,311,905 | |||||||
|
| |||||||
| NET ASSETS – 100.0% | $ | 144,466,773 | ||||||
|
| |||||||
| (a) | Non-income producing security. |
| (h) | An affiliated issuer, which may be considered one in which the fund owns 5% or more of the outstanding voting securities, or a company which is under common control. At period end, the aggregate values of the fund’s investments in affiliated issuers and in unaffiliated issuers were $209,792 and $142,945,076, respectively. |
| (v) | Affiliated issuer that is available only to investment companies managed by MFS. The rate quoted for the MFS Institutional Money Market Portfolio is the annualizedseven-day yield of the fund at period end. |
The following abbreviations are used in this report and are defined:
| ADR | American Depositary Receipt |
See Notes to Financial Statements
5
Table of Contents
MFS International Growth Portfolio
FINANCIAL STATEMENTS | STATEMENT OF ASSETS AND LIABILITIES (unaudited)
This statement represents your fund’s balance sheet, which details the assets and liabilities comprising the total value of the fund.
At 6/30/19 | ||||
Assets | ||||
Investments in unaffiliated issuers, at value (identified cost, $88,520,837) | $142,945,076 | |||
Investments in affiliated issuers, at value (identified cost, $209,751) | 209,792 | |||
Cash | 28,209 | |||
Foreign currency, at value (identified cost, $7,701) | 7,699 | |||
Receivables for | ||||
Investments sold | 694,610 | |||
Fund shares sold | 63,154 | |||
Dividends | 911,135 | |||
Receivable from investment adviser | 6,831 | |||
Other assets | 651 | |||
Total assets | $144,867,157 | |||
Liabilities | ||||
Payables for | ||||
Investments purchased | $44,117 | |||
Fund shares reacquired | 221,078 | |||
Payable to affiliates | ||||
Administrative services fee | 328 | |||
Shareholder servicing costs | 27 | |||
Distribution and/or service fees | 860 | |||
Payable for independent Trustees’ compensation | 100 | |||
Deferred country tax expense payable | 44,954 | |||
Accrued expenses and other liabilities | 88,920 | |||
Total liabilities | $400,384 | |||
Net assets | $144,466,773 | |||
Net assets consist of | ||||
Paid-in capital | $71,582,849 | |||
Total distributable earnings (loss) | 72,883,924 | |||
Net assets | $144,466,773 | |||
Shares of beneficial interest outstanding | 9,592,236 | |||
| Net assets | Shares outstanding | Net asset value per share | ||||||||||
Initial Class | $112,912,632 | 7,479,223 | $15.10 | |||||||||
Service Class | 31,554,141 | 2,113,013 | 14.93 | |||||||||
See Notes to Financial Statements
6
Table of Contents
MFS International Growth Portfolio
FINANCIAL STATEMENTS | STATEMENT OF OPERATIONS (unaudited)
This statement describes how much your fund earned in investment income and accrued in expenses. It also describes any gains and/or losses generated by fund operations.
Six months ended 6/30/19 | ||||
Net investment income (loss) | ||||
Income | ||||
Dividends | $2,931,512 | |||
Dividends from affiliated issuers | 8,816 | |||
Other | 22 | |||
Foreign taxes withheld | (269,949 | ) | ||
Total investment income | $2,670,401 | |||
Expenses | ||||
Management fee | $630,963 | |||
Distribution and/or service fees | 36,870 | |||
Shareholder servicing costs | 1,998 | |||
Administrative services fee | 15,025 | |||
Independent Trustees’ compensation | 3,002 | |||
Custodian fee | 28,606 | |||
Shareholder communications | 5,352 | |||
Audit and tax fees | 33,274 | |||
Legal fees | 694 | |||
Miscellaneous | 13,335 | |||
Total expenses | $769,119 | |||
Reduction of expenses by investment adviser | (114,218 | ) | ||
Net expenses | $654,901 | |||
Net investment income (loss) | $2,015,500 | |||
Realized and unrealized gain (loss) | ||||
Realized gain (loss) (identified cost basis) | ||||
Unaffiliated issuers | $759,628 | |||
Affiliated issuers | 39 | |||
Foreign currency | (5,703 | ) | ||
Net realized gain (loss) | $753,964 | |||
Change in unrealized appreciation or depreciation | ||||
Unaffiliated issuers (net of $43,910 increase in deferred country tax) | $20,649,252 | |||
Affiliated issuers | 41 | |||
Translation of assets and liabilities in foreign currencies | 4,960 | |||
Net unrealized gain (loss) | $20,654,253 | |||
Net realized and unrealized gain (loss) | $21,408,217 | |||
Change in net assets from operations | $23,423,717 | |||
See Notes to Financial Statements
7
Table of Contents
MFS International Growth Portfolio
FINANCIAL STATEMENTS | STATEMENTS OF CHANGES IN NET ASSETS
These statements describe the increases and/or decreases in net assets resulting from operations, any distributions, and any shareholder transactions.
| Six months ended 6/30/19 | Year ended 12/31/18 | |||||||
| (unaudited) | ||||||||
Change in net assets | ||||||||
From operations | ||||||||
Net investment income (loss) | $2,015,500 | $1,668,996 | ||||||
Net realized gain (loss) | 753,964 | 15,697,610 | ||||||
Net unrealized gain (loss) | 20,654,253 | (30,584,499 | ) | |||||
Change in net assets from operations | $23,423,717 | $(13,217,893 | ) | |||||
Total distributions to shareholders | $— | $(14,569,147 | ) | |||||
Change in net assets from fund share transactions | $(12,109,038 | ) | $804,364 | |||||
Total change in net assets | $11,314,679 | $(26,982,676 | ) | |||||
Net assets | ||||||||
At beginning of period | 133,152,094 | 160,134,770 | ||||||
At end of period | $144,466,773 | $133,152,094 | ||||||
See Notes to Financial Statements
8
Table of Contents
MFS International Growth Portfolio
FINANCIAL STATEMENTS | FINANCIAL HIGHLIGHTS
The financial highlights table is intended to help you understand the fund’s financial performance for the semiannual period and the past 5 fiscal years. Certain information reflects financial results for a single fund share. The total returns in the table represent the rate that an investor would have earned (or lost) on an investment in the fund share class (assuming reinvestment of all distributions) held for the entire period.
| Initial Class | Six months ended 6/30/19 | Year ended | ||||||||||||||||||||||
| 12/31/18 | 12/31/17 | 12/31/16 | 12/31/15 | 12/31/14 | ||||||||||||||||||||
| (unaudited) | ||||||||||||||||||||||||
Net asset value, beginning of period | $12.78 | $15.50 | $12.13 | $12.57 | $13.29 | $14.77 | ||||||||||||||||||
| Income (loss) from investment operations | ||||||||||||||||||||||||
Net investment income (loss) (d) | $0.21 | $0.17 | $0.14 | $0.17 | (c) | $0.13 | $0.21 | |||||||||||||||||
Net realized and unrealized gain (loss) | 2.11 | (1.38 | ) | 3.77 | 0.19 | (0.11 | )(g) | (0.90 | ) | |||||||||||||||
Total from investment operations | $2.32 | $(1.21 | ) | $3.91 | $0.36 | $0.02 | $(0.69 | ) | ||||||||||||||||
| Less distributions declared to shareholders | ||||||||||||||||||||||||
From net investment income | $— | $(0.16 | ) | $(0.20 | ) | $(0.15 | ) | $(0.22 | ) | $(0.13 | ) | |||||||||||||
From net realized gain | — | (1.35 | ) | (0.34 | ) | (0.65 | ) | (0.52 | ) | (0.66 | ) | |||||||||||||
Total distributions declared to shareholders | $— | $(1.51 | ) | $(0.54 | ) | $(0.80 | ) | $(0.74 | ) | $(0.79 | ) | |||||||||||||
Net asset value, end of period (x) | $15.10 | $12.78 | $15.50 | $12.13 | $12.57 | $13.29 | ||||||||||||||||||
Total return (%) (k)(r)(s)(x) | 18.15 | (n) | (9.02 | ) | 32.64 | 2.49 | (c) | 0.32 | (4.98 | ) | ||||||||||||||
| Ratios (%) (to average net assets) and Supplemental data: | ||||||||||||||||||||||||
Expenses before expense reductions (f) | 1.04 | (a) | 1.05 | 1.05 | 0.91 | (c) | 1.03 | 1.02 | ||||||||||||||||
Expenses after expense reductions (f) | 0.88 | (a) | 0.97 | 1.05 | 0.91 | (c) | 1.03 | 1.01 | ||||||||||||||||
Net investment income (loss) | 2.92 | (a)(l) | 1.16 | 0.96 | 1.33 | (c) | 0.99 | 1.44 | ||||||||||||||||
Portfolio turnover | 3 | (n) | 18 | 10 | 15 | 22 | 22 | |||||||||||||||||
Net assets at end of period (000 omitted) | $112,913 | $105,919 | $130,591 | $126,668 | $138,482 | $164,724 | ||||||||||||||||||
| Service Class | Six months ended 6/30/19 | Year ended | ||||||||||||||||||||||
| 12/31/18 | 12/31/17 | 12/31/16 | 12/31/15 | 12/31/14 | ||||||||||||||||||||
| (unaudited) | ||||||||||||||||||||||||
Net asset value, beginning of period | $12.65 | $15.37 | $12.03 | $12.48 | $13.19 | $14.66 | ||||||||||||||||||
| Income (loss) from investment operations | ||||||||||||||||||||||||
Net investment income (loss) (d) | $0.19 | $0.13 | $0.10 | $0.13 | (c) | $0.10 | $0.17 | |||||||||||||||||
Net realized and unrealized gain (loss) | 2.09 | (1.38 | ) | 3.74 | 0.18 | (0.11 | )(g) | (0.88 | ) | |||||||||||||||
Total from investment operations | $2.28 | $(1.25 | ) | $3.84 | $0.31 | $(0.01 | ) | $(0.71 | ) | |||||||||||||||
| Less distributions declared to shareholders | ||||||||||||||||||||||||
From net investment income | $— | $(0.12 | ) | $(0.16 | ) | $(0.11 | ) | $(0.18 | ) | $(0.10 | ) | |||||||||||||
From net realized gain | — | (1.35 | ) | (0.34 | ) | (0.65 | ) | (0.52 | ) | (0.66 | ) | |||||||||||||
Total distributions declared to shareholders | $— | $(1.47 | ) | $(0.50 | ) | $(0.76 | ) | $(0.70 | ) | $(0.76 | ) | |||||||||||||
Net asset value, end of period (x) | $14.93 | $12.65 | $15.37 | $12.03 | $12.48 | $13.19 | ||||||||||||||||||
Total return (%) (k)(r)(s)(x) | 18.02 | (n) | (9.30 | ) | 32.35 | 2.15 | (c) | 0.10 | (5.19 | ) | ||||||||||||||
| Ratios (%) (to average net assets) and Supplemental data: | ||||||||||||||||||||||||
Expenses before expense reductions (f) | 1.29 | (a) | 1.30 | 1.30 | 1.16 | (c) | 1.28 | 1.27 | ||||||||||||||||
Expenses after expense reductions (f) | 1.13 | (a) | 1.22 | 1.30 | 1.16 | (c) | 1.28 | 1.26 | ||||||||||||||||
Net investment income (loss) | 2.69 | (a)(l) | 0.87 | 0.70 | 1.08 | (c) | 0.72 | 1.19 | ||||||||||||||||
Portfolio turnover | 3 | (n) | 18 | 10 | 15 | 22 | 22 | |||||||||||||||||
Net assets at end of period (000 omitted) | $31,554 | $27,233 | $29,544 | $25,277 | $26,144 | $30,365 | ||||||||||||||||||
See Notes to Financial Statements
9
Table of Contents
MFS International Growth Portfolio
Financial Highlights – continued
| (a) | Annualized. |
| (c) | Amount reflects aone-time reimbursement of expenses by the custodian (or former custodian) without which net investment income and performance would be lower and expenses would be higher. |
| (d) | Per share data is based on average shares outstanding. |
| (f) | Ratios do not reflect reductions from fees paid indirectly, if applicable. |
| (g) | The per share amount varies from the net realized and unrealized gain/loss for the period because of the timing of sales of fund shares and the per share amount of realized and unrealized gains and losses at such time. |
| (k) | The total return does not reflect expenses that apply to separate accounts. Inclusion of these charges would reduce the total return figures for all periods shown. |
| (l) | Recognition of net investment income by the fund may be affected by the timing of the declaration of dividends by companies in which the fund invests and the actual annual net investment income ratio may differ. |
| (n) | Not annualized. |
| (r) | Certain expenses have been reduced without which performance would have been lower. |
| (s) | From time to time the fund may receive proceeds from litigation settlements, without which performance would be lower. |
| (x) | The net asset values and total returns have been calculated on net assets which include adjustments made in accordance with U.S. generally accepted accounting principles required at period end for financial reporting purposes. |
See Notes to Financial Statements
10
Table of Contents
MFS International Growth Portfolio
NOTES TO FINANCIAL STATEMENTS (unaudited)
| (1) | Business and Organization |
MFS International Growth Portfolio (the fund) is a diversified series of MFS Variable Insurance Trust II (the trust). The trust is organized as a Massachusetts business trust and is registered under the Investment Company Act of 1940, as amended, as anopen-end management investment company. The shareholders of each series of the trust are separate accounts of insurance companies, which offer variable annuity and/or life insurance products, and qualified retirement and pension plans.
The fund is an investment company and accordingly follows the investment company accounting and reporting guidance of the Financial Accounting Standards Board (FASB) Accounting Standards Codification Topic 946 Financial Services – Investment Companies.
| (2) | Significant Accounting Policies |
General– The preparation of financial statements in conformity with U.S. generally accepted accounting principles requires management to make estimates and assumptions that affect the reported amounts of assets and liabilities, and disclosure of contingent assets and liabilities at the date of the financial statements and the reported amounts of increases and decreases in net assets from operations during the reporting period. Actual results could differ from those estimates. In the preparation of these financial statements, management has evaluated subsequent events occurring after the date of the fund’s Statement of Assets and Liabilities through the date that the financial statements were issued. The fund invests in foreign securities, including securities of emerging market issuers. Investments in foreign securities are vulnerable to the effects of changes in the relative values of the local currency and the U.S. dollar and to the effects of changes in each country’s market, economic, industrial, political, regulatory, geopolitical, and other conditions. Investments in emerging markets can involve additional and greater risks than the risks associated with investments in developed foreign markets. Emerging markets can have less developed markets, greater custody and operational risk, less developed legal, regulatory, and accounting systems, and greater political, social, and economic instability than developed markets.
Balance Sheet Offsetting– The fund’s accounting policy with respect to balance sheet offsetting is that, absent an event of default by the counterparty or a termination of the agreement, the International Swaps and Derivatives Association (ISDA) Master Agreement, or similar agreement, does not result in an offset of reported amounts of financial assets and financial liabilities in the Statement of Assets and Liabilities across transactions between the fund and the applicable counterparty. The fund’s right to setoff may be restricted or prohibited by the bankruptcy or insolvency laws of the particular jurisdiction to which a specific master netting agreement counterparty is subject. Balance sheet offsetting disclosures, to the extent applicable to the fund, have been included in the fund’s Significant Accounting Policies note under the captions for each of the fund’sin-scope financial instruments and transactions.
Investment Valuations– Equity securities, including restricted equity securities, are generally valued at the last sale or official closing price on their primary market or exchange as provided by a third-party pricing service. Equity securities, for which there were no sales reported that day, are generally valued at the last quoted daily bid quotation on their primary market or exchange as provided by a third-party pricing service. Short-term instruments with a maturity at issuance of 60 days or less may be valued at amortized cost, which approximates market value.Open-end investment companies are generally valued at net asset value per share. Securities and other assets generally valued on the basis of information from a third-party pricing service may also be valued at a broker/dealer bid quotation. In determining values, third-party pricing services can utilize both transaction data and market information such as yield, quality, coupon rate, maturity, type of issue, trading characteristics, and other market data. The values of foreign securities and other assets and liabilities expressed in foreign currencies are converted to U.S. dollars using the mean of bid and asked prices for rates provided by a third-party pricing service.
The Board of Trustees has delegated primary responsibility for determining or causing to be determined the value of the fund’s investments (including any fair valuation) to the adviser pursuant to valuation policies and procedures approved by the Board. If the adviser determines that reliable market quotations are not readily available, investments are valued at fair value as determined in good faith by the adviser in accordance with such procedures under the oversight of the Board of Trustees. Under the fund’s valuation policies and procedures, market quotations are not considered to be readily available for most types of debt instruments and floating rate loans and many types of derivatives. These investments are generally valued at fair value based on information from third-party pricing services. In addition, investments may be valued at fair value if the adviser determines that an investment’s value has been materially affected by events occurring after the close of the exchange or market on which the investment is principally traded (such as foreign exchange or market) and prior to the determination of the fund’s net asset value, or after the halt of trading of a specific security where trading does not resume prior to the close of the exchange or market on which the security is principally traded. Events that occur after foreign markets close (such as developments in foreign markets and significant movements in the U.S. markets) and prior to the determination of the fund’s net asset value may be deemed to have a material effect on the value of securities traded in foreign markets. Accordingly, the fund’s foreign equity securities may often be valued at fair value. The adviser generally relies on third-party pricing services or other information (such as the correlation with price movements of similar securities in the same or other markets; the type, cost and investment characteristics of the security; the business and financial condition of the
11
Table of Contents
MFS International Growth Portfolio
Notes to Financial Statements (unaudited) – continued
issuer; and trading and other market data) to assist in determining whether to fair value and at what value to fair value an investment. The value of an investment for purposes of calculating the fund’s net asset value can differ depending on the source and method used to determine value. When fair valuation is used, the value of an investment used to determine the fund’s net asset value may differ from quoted or published prices for the same investment. There can be no assurance that the fund could obtain the fair value assigned to an investment if it were to sell the investment at the same time at which the fund determines its net asset value per share.
Various inputs are used in determining the value of the fund’s assets or liabilities. These inputs are categorized into three broad levels. In certain cases, the inputs used to measure fair value may fall into different levels of the fair value hierarchy. In such cases, an investment’s level within the fair value hierarchy is based on the lowest level of input that is significant to the fair value measurement. The fund’s assessment of the significance of a particular input to the fair value measurement in its entirety requires judgment, and considers factors specific to the investment. Level 1 includes unadjusted quoted prices in active markets for identical assets or liabilities. Level 2 includes other significant observable market-based inputs (including quoted prices for similar securities, interest rates, prepayment speed, and credit risk). Level 3 includes unobservable inputs, which may include the adviser’s own assumptions in determining the fair value of investments. The following is a summary of the levels used as of June 30, 2019 in valuing the fund’s assets or liabilities:
| Financial Instruments | Level 1 | Level 2 | Level 3 | Total | ||||||||||||
| Equity Securities | $142,945,076 | $— | $— | $142,945,076 | ||||||||||||
| Mutual Funds | 209,792 | — | — | 209,792 | ||||||||||||
| Total | $143,154,868 | $— | $— | $143,154,868 | ||||||||||||
For further information regarding security characteristics, see the Portfolio of Investments.
Foreign Currency Translation– Purchases and sales of foreign investments, income, and expenses are converted into U.S. dollars based upon currency exchange rates prevailing on the respective dates of such transactions or on the reporting date for foreign denominated receivables and payables. Gains and losses attributable to foreign currency exchange rates on sales of securities are recorded for financial statement purposes as net realized gains and losses on investments. Gains and losses attributable to foreign exchange rate movements on receivables, payables, income and expenses are recorded for financial statement purposes as foreign currency transaction gains and losses. That portion of both realized and unrealized gains and losses on investments that results from fluctuations in foreign currency exchange rates is not separately disclosed.
Indemnifications– Under the fund’s organizational documents, its officers and Trustees may be indemnified against certain liabilities and expenses arising out of the performance of their duties to the fund. Additionally, in the normal course of business, the fund enters into agreements with service providers that may contain indemnification clauses. The fund’s maximum exposure under these agreements is unknown as this would involve future claims that may be made against the fund that have not yet occurred.
Investment Transactions and Income– Investment transactions are recorded on the trade date. Dividends received in cash are recorded on theex-dividend date. Certain dividends from foreign securities will be recorded when the fund is informed of the dividend if such information is obtained subsequent to theex-dividend date. Dividend payments received in additional securities are recorded on theex-dividend date in an amount equal to the value of the security on such date.
The fund may receive proceeds from litigation settlements. Any proceeds received from litigation involving portfolio holdings are reflected in the Statement of Operations in realized gain/loss if the security has been disposed of by the fund or in unrealized gain/loss if the security is still held by the fund. Any other proceeds from litigation not related to portfolio holdings are reflected as other income in the Statement of Operations.
Tax Matters and Distributions– The fund intends to qualify as a regulated investment company, as defined under Subchapter M of the Internal Revenue Code, and to distribute all of its taxable income, including realized capital gains. As a result, no provision for federal income tax is required. The fund’s federal tax returns, when filed, will remain subject to examination by the Internal Revenue Service for a three year period. Management has analyzed the fund’s tax positions taken on federal and state tax returns for all open tax years and does not believe that there are any uncertain tax positions that require recognition of a tax liability. Foreign taxes, if any, have been accrued by the fund in the accompanying financial statements in accordance with the applicable foreign tax law. Foreign income taxes may be withheld by certain countries in which the fund invests. Additionally, capital gains realized by the fund on securities issued in or by certain foreign countries may be subject to capital gains tax imposed by those countries.
Distributions to shareholders are recorded on theex-dividend date. Income and capital gain distributions are determined in accordance with income tax regulations, which may differ from U.S. generally accepted accounting principles. Certain capital accounts in the financial statements are periodically adjusted for permanent differences in order to reflect their tax character. These adjustments have no impact on net assets or net asset value per share. Temporary differences which arise from recognizing certain items of income, expense, gain or loss in different periods for financial statement and tax purposes will reverse at some time in the
12
Table of Contents
MFS International Growth Portfolio
Notes to Financial Statements (unaudited) – continued
future. Distributions in excess of net investment income or net realized gains are temporary overdistributions for financial statement purposes resulting from differences in the recognition or classification of income or distributions for financial statement and tax purposes.
Book/tax differences primarily relate to wash sale loss deferrals.
The tax character of distributions declared to shareholders for the last fiscal year is as follows:
| Year ended 12/31/18 | ||||
| Ordinary income (including any short-term capital gains) | $2,194,070 | |||
| Long-term capital gains | 12,375,077 | |||
| Total distributions | $14,569,147 | |||
The federal tax cost and the tax basis components of distributable earnings were as follows:
| As of 6/30/19 | ||||
| Cost of investments | $90,047,506 | |||
| Gross appreciation | 57,721,007 | |||
| Gross depreciation | (4,613,645 | ) | ||
| Net unrealized appreciation (depreciation) | $53,107,362 | |||
| As of 12/31/18 | ||||
| Undistributed ordinary income | 1,866,096 | |||
| Undistributed long-term capital gain | 15,187,168 | |||
| Other temporary differences | (7,216 | ) | ||
| Net unrealized appreciation (depreciation) | 32,414,159 | |||
The aggregate cost above includes prior fiscal year end tax adjustments, if applicable.
Multiple Classes of Shares of Beneficial Interest– The fund offers multiple classes of shares, which differ in their respective distribution and/or service fees. The fund’s income, realized and unrealized gain (loss), and common expenses are allocated to shareholders based on the daily net assets of each class. Dividends are declared separately for each class. Differences in per share dividend rates are generally due to differences in separate class expenses. The fund’s distributions declared to shareholders as reported in the Statements of Changes in Net Assets are presented by class as follows:
| From net investment income | From net realized gain | |||||||||||||||
| Six months ended 6/30/19 | Year ended 12/31/18 | Six months ended 6/30/19 | Year ended 12/31/18 | |||||||||||||
| Initial Class | $— | $1,206,626 | $— | $10,382,224 | ||||||||||||
| Service Class | — | 248,418 | — | 2,731,879 | ||||||||||||
| Total | $— | $1,455,044 | $— | $13,114,103 | ||||||||||||
| (3) | Transactions with Affiliates |
Investment Adviser– The fund has an investment advisory agreement with MFS to provide overall investment management and related administrative services and facilities to the fund. The management fee is computed daily and paid monthly at the following annual rates based on the fund’s average daily net assets:
| Up to $1 billion | 0.90% | |||
| In excess of $1 billion and up to $2 billion | 0.80% | |||
| In excess of $2 billion | 0.70% |
MFS has agreed in writing to reduce its management fee by a specified amount if certain MFS mutual fund assets exceed thresholds agreed to by MFS and the fund’s Board of Trustees. For the six months ended June 30, 2019, this management fee reduction amounted to $6,772, which is included in the reduction of total expenses in the Statement of Operations. The management fee incurred for the six months ended June 30, 2019 was equivalent to an annual effective rate of 0.89% of the fund’s average daily net assets.
The investment adviser has agreed in writing to pay a portion of the fund’s total annual operating expenses, excluding interest, taxes, extraordinary expenses, brokerage and transaction costs, and investment-related expenses, such that total annual operating expenses do not exceed 0.88% of average daily net assets for the Initial Class shares and 1.13% of average daily net assets for the Service Class shares. This written agreement will continue until modified by the fund’s Board of Trustees, but such agreement will continue at least until April 30, 2021. For the six months ended June 30, 2019, this reduction amounted to $107,446, which is included in the reduction of total expenses in the Statement of Operations.
13
Table of Contents
MFS International Growth Portfolio
Notes to Financial Statements (unaudited) – continued
Distributor– MFS Fund Distributors, Inc. (MFD), a wholly-owned subsidiary of MFS, is the distributor of shares of the fund. The Trustees have adopted a distribution plan for the Service Class shares pursuant to Rule12b-1 under the Investment Company Act of 1940.
The fund’s distribution plan provides that the fund will pay MFD distribution and/or service fees equal to 0.25% per annum of its average daily net assets attributable to Service Class shares as partial consideration for services performed and expenses incurred by MFD and financial intermediaries (including participating insurance companies that invest in the fund to fund variable annuity and variable life insurance contracts, sponsors of qualified retirement and pension plans that invest in the fund, and affiliates of these participating insurance companies and plan sponsors) in connection with the sale and distribution of the Service Class shares. MFD may subsequently pay all, or a portion, of the distribution and/or service fees to financial intermediaries.
Shareholder Servicing Agent– MFS Service Center, Inc. (MFSC), a wholly-owned subsidiary of MFS, receives a fee from the fund for its services as shareholder servicing agent. For the six months ended June 30, 2019, the fee was $1,883, which equated to 0.0027% annually of the fund’s average daily net assets. MFSC also receives payment from the fund forout-of-pocket expenses paid by MFSC on behalf of the fund. For the six months ended June 30, 2019, these costs amounted to $115.
Administrator– MFS provides certain financial, legal, shareholder communications, compliance, and other administrative services to the fund. Under an administrative services agreement, the fund reimburses MFS the costs incurred to provide these services. The fund is charged an annual fixed amount of $17,500 plus a fee based on average daily net assets. The administrative services fee incurred for the six months ended June 30, 2019 was equivalent to an annual effective rate of 0.0214% of the fund’s average daily net assets.
Trustees’ and Officers’ Compensation– The fund pays compensation to independent Trustees in the form of a retainer, attendance fees, and additional compensation to Board and Committee chairpersons. The fund does not pay compensation directly to Trustees or officers of the fund who are also officers of the investment adviser, all of whom receive remuneration from MFS for their services to the fund. Certain officers and Trustees of the fund are officers or directors of MFS, MFD, and MFSC.
Other– This fund and certain other funds managed by MFS (the funds) had entered into a service agreement (the ISO Agreement) which provided for payment of fees solely by the funds to Tarantino LLC in return for the provision of services of an Independent Senior Officer (ISO) for the funds. Frank L. Tarantino served as the ISO and was an officer of the funds and the sole member of Tarantino LLC. Effective June 30, 2019, Mr. Tarantino retired from his position as ISO for the funds, and the ISO Agreement was terminated. For the six months ended June 30, 2019, the fee paid by the fund under this agreement was $166 and is included in “Miscellaneous” expense in the Statement of Operations. MFS had agreed to bear all expenses associated with office space, other administrative support, and supplies provided to the ISO.
The fund invests in the MFS Institutional Money Market Portfolio which is managed by MFS and seeks current income consistent with preservation of capital and liquidity. This money market fund does not pay a management fee to MFS.
The fund is permitted to engage in purchase and sale transactions with funds and accounts for which MFS serves as investment adviser orsub-adviser (“cross-trades”) pursuant to a policy adopted by the Board of Trustees. This policy has been designed to ensure that cross-trades conducted by the fund comply with Rule17a-7 under the Investment Company Act of 1940. During the six months ended June 30, 2019, the fund engaged in purchase and sale transactions pursuant to this policy, which amounted to $3,549 and $249,480, respectively. The sales transactions resulted in net realized gains (losses) of $15,401.
| (4) | Portfolio Securities |
For the six months ended June 30, 2019, purchases and sales of investments, other than short-term obligations, aggregated $4,498,939 and $15,051,854, respectively.
| (5) | Shares of Beneficial Interest |
The fund’s Declaration of Trust permits the Trustees to issue an unlimited number of full and fractional shares of beneficial interest. Transactions in fund shares were as follows:
| Six months ended 6/30/19 | Year ended 12/31/18 | |||||||||||||||
| Shares | Amount | Shares | Amount | |||||||||||||
| Shares sold | ||||||||||||||||
Initial Class | 90,303 | $1,271,831 | 214,354 | $3,094,484 | ||||||||||||
Service Class | 209,079 | 2,955,555 | 512,468 | 7,721,161 | ||||||||||||
| 299,382 | $4,227,386 | 726,822 | $10,815,645 | |||||||||||||
| Shares issued to shareholders in reinvestment of distributions | ||||||||||||||||
Initial Class | — | $— | 792,671 | $11,588,850 | ||||||||||||
Service Class | — | — | 205,680 | 2,980,297 | ||||||||||||
| — | $— | 998,351 | $14,569,147 | |||||||||||||
14
Table of Contents
MFS International Growth Portfolio
Notes to Financial Statements (unaudited) – continued
| Six months ended 6/30/19 | Year ended 12/31/18 | |||||||||||||||
| Shares | Amount | Shares | Amount | |||||||||||||
| Shares reacquired | ||||||||||||||||
Initial Class | (901,561 | ) | $(12,840,022 | ) | (1,142,698 | ) | $(17,486,023 | ) | ||||||||
Service Class | (248,312 | ) | (3,496,402 | ) | (488,312 | ) | (7,094,405 | ) | ||||||||
| (1,149,873 | ) | $(16,336,424 | ) | (1,631,010 | ) | $(24,580,428 | ) | |||||||||
| Net change | ||||||||||||||||
Initial Class | (811,258 | ) | $(11,568,191 | ) | (135,673 | ) | $(2,802,689 | ) | ||||||||
Service Class | (39,233 | ) | (540,847 | ) | 229,836 | 3,607,053 | ||||||||||
| (850,491 | ) | $(12,109,038 | ) | 94,163 | $804,364 | |||||||||||
The fund is one of several mutual funds in which certain MFS funds may invest. The MFS funds do not invest in the underlying funds for the purpose of exercising management or control. At the end of the period, the MFS Moderate Allocation Portfolio, the MFS Growth Allocation Portfolio, and the MFS Conservative Allocation Portfolio were the owners of record of approximately 30%, 12%, and 6%, respectively, of the value of outstanding voting shares of the fund.
| (6) | Line of Credit |
The fund and certain other funds managed by MFS participate in a $1.25 billion unsecured committed line of credit, subject to a $1 billion sublimit, provided by a syndicate of banks under a credit agreement. Borrowings may be made for temporary financing needs. Interest is charged to each fund, based on its borrowings, generally at a rate equal to the highest of one month LIBOR, the Federal Funds Effective Rate and the Overnight Bank Funding Rate, plus an agreed upon spread. A commitment fee, based on the average daily, unused portion of the committed line of credit, is allocated among the participating funds. In addition, the fund and other funds managed by MFS have established unsecured uncommitted borrowing arrangements with certain banks for temporary financing needs. Interest is charged to each fund, based on its borrowings, at rates equal to customary reference rates plus an agreed upon spread. For the six months ended June 30, 2019, the fund’s commitment fee and interest expense were $418 and $0, respectively, and are included in “Miscellaneous” expense in the Statement of Operations.
| (7) | Investments in Affiliated Issuers |
An affiliated issuer may be considered one in which the fund owns 5% or more of the outstanding voting securities, or a company which is under common control. For the purposes of this report, the following were affiliated issuers:
| Affiliated Issuers | Beginning Value | Purchases | Sales Proceeds | Realized Gain (Loss) | Change in Unrealized Appreciation or Depreciation | Ending Value | ||||||||||||||||||
| MFS Institutional Money Market Portfolio | $468,227 | $10,719,384 | $10,977,899 | $39 | $41 | $209,792 | ||||||||||||||||||
| Affiliated Issuers | Dividend Income | Capital Gain Distributions | ||||||||||||||||||||||
| MFS Institutional Money Market Portfolio | $8,816 | $— | ||||||||||||||||||||||
15
Table of Contents
MFS International Growth Portfolio
PROXY VOTING POLICIES AND INFORMATION
MFS votes proxies on behalf of the fund pursuant to proxy voting policies and procedures that are available without charge, upon request, by calling 1-800-225-2606, by visitingmfs.com/proxyvoting, or by visiting the SEC’s Web site athttp://www.sec.gov.
Information regarding how the fund voted proxies relating to portfolio securities during the most recent twelve-month period ended June 30 is available by August 31 of each year without charge by visitingmfs.com/proxyvoting, or by visiting the SEC’s Web site athttp://www.sec.gov.
QUARTERLY PORTFOLIO DISCLOSURE
The fund files a complete schedule of portfolio holdings with the SEC for the first and third quarters of each fiscal year on Form N-Q or as an exhibit to its reports on Form N-PORT (for first and third fiscal quarters ending March 31, 2019 or after). The fund’sForm N-Q or Form N-PORT reports are available on the SEC’s website athttp://www.sec.gov.A shareholder can obtain the portfolio holdings report for the first and third quarters of the fund’s fiscal year atmfs.com/vit2 by choosing the fund’s name and then selecting the “Resources” tab and clicking on “Prospectus and Reports”.
From time to time, MFS may post important information about the fund or the MFS funds on the MFS web site (mfs.com). This information is available at https://www.mfs.com/en-us/what-we-do/announcements.html or atmfs.com/vit2 by choosing the fund’s name.
INFORMATION ABOUT FUND CONTRACTS AND LEGAL CLAIMS
The fund has entered into contractual arrangements with an investment adviser, administrator, distributor, shareholder servicing agent, 529 program manager (if applicable), and custodian who each provide services to the fund. Unless expressly stated otherwise, shareholders are not parties to, or intended beneficiaries of these contractual arrangements, and these contractual arrangements are not intended to create any shareholder right to enforce them against the service providers or to seek any remedy under them against the service providers, either directly or on behalf of the fund.
Under the Trust’s By-Laws and Declaration of Trust, any claims asserted against or on behalf of the MFS Funds, including claims against Trustees and Officers, must be brought in state and federal courts located within the Commonwealth of Massachusetts.
16
Table of Contents
Table of Contents
Semiannual Report
June 30, 2019

MFS® International Intrinsic Value Portfolio
(formerly MFS® International Value Portfolio)

MFS® Variable Insurance Trust II
Beginning on January 1, 2021, as permitted by regulations adopted by the U.S. Securities and Exchange Commission, the insurance company that offers your contract may determine that it will no longer send you paper copies of the fund’s annual and semiannual shareholder reports unless you specifically request paper copies from the insurance company or from your financial intermediary. Instead, the shareholder reports will be made available on a Web site (insurancefunds.mfs.com or other Web site of which you will be notified), and the insurance company will notify you by mail each time a report is posted and provide you with a Web site link to access the report. Instructions for requesting paper copies will be provided by your insurance company or financial intermediary.
If you already elected to receive shareholder reports by email, you will not be affected by this change and you need not take any action. If your insurance company or financial intermediary offers electronic delivery, you may elect to receive shareholder reports and other communications from the insurance company or financial intermediary by email by following the instructions provided by the insurance company or financial intermediary.
Beginning on January 1, 2019, you may elect to receive all future reports in paper free of charge from the insurance company or financial intermediary. You can inform the insurance company or financial intermediary that you wish to continue receiving paper copies of your shareholder reports by contacting your insurance company or financial intermediary. Your election to receive reports in paper will apply to all funds held in your account with your insurance company or financial intermediary.
FCG-SEM
Table of Contents
MFS® International Intrinsic Value Portfolio
(formerly MFS® International Value Portfolio)
Note to Contract Owners: Effective June 1, 2019, the fund’s name changed from MFS International Value Portfolio to MFS International Intrinsic Value Portfolio.
The report is prepared for the general information of contract owners. It is authorized for distribution to prospective investors only when preceded or accompanied by a current prospectus.
NOT FDIC INSURED• MAY LOSE VALUE• NO BANK OR CREDIT UNION GUARANTEE• NOT A DEPOSIT• NOT INSURED BY ANY FEDERAL GOVERNMENT AGENCY OR NCUA/NCUSIF
Table of Contents
MFS International Intrinsic Value Portfolio
LETTER FROM THE EXECUTIVE CHAIRMAN

Dear Contract Owners:
Slowing global growth, low inflation, and increasing trade friction between the United States and China have been hallmarks of the past 12 months. After experiencing an uptick in market volatility in late 2018, markets steadied during the first half of 2019, thanks in large measure to the adoption of a dovish policy stance on the part of global central banks, who have largely abandoned efforts to normalize interest rates and have instead focused on supporting economic growth. Trade tensions remain high as the U.S. has ratcheted up tariffs on Chinese imports and China has retaliated. A truce of sorts was reached midyear, but significant challenges continue to confront negotiators, and it is not known whether a comprehensive agreement can be reached.
With Boris Johnson replacing Theresa May as Britain’s prime minister, uncertainty over Brexit remains high. Johnson has adopted a more combative stance than his predecessor toward the European Union, increasing concerns that there will be a “hard” Brexit.
Markets expect that the longest economic expansion in U.S. history will continue for the time being, albeit at a slower pace. Nevertheless, slower growth and low inflation have spurred the U.S. Federal Reserve to take a more accommodative policy stance, prompting investors to anticipate several interest rate cuts in the coming year. The European Central Bank has adopted a similar position. The more accommodative environment has helped fuel a continued rise in global equities and has been broadly supportive of risk assets.
Since launching the first U.S.open-end mutual fund in 1924, MFS® has been committed to a single purpose: to create value by allocating capital responsibly for clients. Through our powerful global investment platform, we combine collective expertise, thoughtful risk management, and long-term discipline to uncover what we believe are the best investment opportunities in the market.
Respectfully,

Robert J. Manning
Executive Chairman
MFS Investment Management
August 16, 2019
The opinions expressed in this letter are subject to change and may not be relied upon for investment advice. No forecasts can be guaranteed.
1
Table of Contents
MFS International Intrinsic Value Portfolio
Portfolio structure
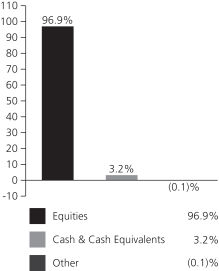
| Top ten holdings | ||||
| Nestle S.A. | 5.3% | |||
| Givaudan S.A. | 3.5% | |||
| Cadence Design Systems, Inc. | 3.4% | |||
| Pernod Ricard S.A. | 2.8% | |||
| Diageo PLC | 2.7% | |||
| Henkel AG & Co. KGaA | 2.3% | |||
| Amadeus IT Group S.A. | 2.3% | |||
| Reckitt Benckiser Group PLC | 2.2% | |||
| Colgate-Palmolive Co. | 2.2% | |||
| Kao Corp. | 2.2% |
| GICS equity sectors (g) | ||||
| Consumer Staples | 31.1% | |||
| Information Technology | 23.9% | |||
| Industrials | 18.1% | |||
| Materials | 6.4% | |||
| Real Estate | 4.4% | |||
| Health Care | 4.2% | |||
| Financials | 4.1% | |||
| Consumer Discretionary | 3.6% | |||
| Communication Services | 0.7% | |||
| Energy | 0.4% | |||
| Issuer country weightings (x) | ||||
| Japan | 19.1% | |||
| United States | 15.3% | |||
| United Kingdom | 14.5% | |||
| France | 13.6% | |||
| Switzerland | 13.3% | |||
| Germany | 11.5% | |||
| Spain | 2.3% | |||
| Taiwan | 1.8% | |||
| Netherlands | 1.8% | |||
| Other Countries | 6.8% | |||
| Currency exposure weightings (y) | ||||
| Euro | 31.6% | |||
| United States Dollar | 19.6% | |||
| Japanese Yen | 15.5% | |||
| British Pound Sterling | 14.0% | |||
| Swiss Franc | 13.3% | |||
| Taiwan Dollar | 1.8% | |||
| Canadian Dollar | 1.6% | |||
| South Korean Won | 0.8% | |||
| Australian Dollar | 0.7% | |||
| Other Currencies | 1.1% | |||
| (g) | The Global Industry Classification Standard (GICS®) was developed by and/or is the exclusive property of MSCI, Inc. and S&P Global Market Intelligence Inc. (“S&P Global Market Intelligence”). GICS is a service mark of MSCI and S&P Global Market Intelligence and has been licensed for use by MFS. |
| (x) | Represents the portfolio’s exposure to issuer countries as a percentage of a portfolio’s net assets. For purposes of this presentation, United States includes Cash & Cash Equivalents and Other. |
| (y) | Represents the portfolio’s exposure to a particular currency as a percentage of a portfolio’s net assets. For purposes of this presentation, United States Dollar includes Cash & Cash Equivalents. |
Cash & Cash Equivalents includes any cash, investments in money market funds, short-term securities, and other assets less liabilities. Please see the Statement of Assets and Liabilities for additional information related to the fund’s cash position and other assets and liabilities.
Other includes equivalent exposure from currency derivatives and/or any offsets to derivative positions and may be negative.
Percentages are based on net assets as of June 30, 2019.
The portfolio is actively managed and current holdings may be different.
2
Table of Contents
MFS International Intrinsic Value Portfolio
Fund Expenses Borne by the Contract Holders during the Period,
January 1, 2019 through June 30, 2019
As a contract holder of the fund, you incur ongoing costs, including management fees; distribution and/or service(12b-1) fees; and other fund expenses. This example is intended to help you understand your ongoing costs (in dollars) of investing in the fund and to compare these costs with the ongoing costs of investing in other mutual funds.
The example is based on an investment of $1,000 invested at the beginning of the period and held for the entire period January 1, 2019 through June 30, 2019.
Actual Expenses
The first line for each share class in the following table provides information about actual account values and actual expenses. You may use the information in this line, together with the amount you invested, to estimate the expenses that you paid over the period. Simply divide your account value by $1,000 (for example, an $8,600 account value divided by $1,000 = 8.6), then multiply the result by the number in the first line under the heading entitled “Expenses Paid During Period” to estimate the expenses you paid on your account during this period.
Hypothetical Example for Comparison Purposes
The second line for each share class in the following table provides information about hypothetical account values and hypothetical expenses based on the fund’s actual expense ratio and an assumed rate of return of 5% per year before expenses, which is not the fund’s actual return. The hypothetical account values and expenses may not be used to estimate the actual ending account balance or expenses you paid for the period. You may use this information to compare the ongoing costs of investing in the fund and other funds. To do so, compare this 5% hypothetical example with the 5% hypothetical examples that appear in the shareholder reports of the other funds.
Please note that the expenses shown in the table are meant to highlight the fund’s ongoing costs only and do not take into account the fees and expenses imposed under the variable contracts through which your investment in the fund is made. Therefore, the second line for each share class in the table is useful in comparing ongoing costs associated with an investment in vehicles (such as the fund) which fund benefits under variable annuity and variable life insurance contracts and to qualified pension and retirement plans only, and will not help you determine the relative total costs of investing in the fund through variable annuity and variable life insurance contracts. If the fees and expenses imposed under the variable contracts were included, your costs would have been higher.
| Share Class | Annualized Expense Ratio | Beginning Account Value 1/01/19 | Ending Account Value 6/30/19 | Expenses Paid During Period (p) 1/01/19-6/30/19 | ||||||||||||||
| Initial Class | Actual | 0.90% | $1,000.00 | $1,170.66 | $4.84 | |||||||||||||
| Hypothetical (h) | 0.90% | $1,000.00 | $1,020.33 | $4.51 | ||||||||||||||
| Service Class | Actual | 1.15% | $1,000.00 | $1,169.11 | $6.18 | |||||||||||||
| Hypothetical (h) | 1.15% | $1,000.00 | $1,019.09 | $5.76 | ||||||||||||||
| (h) | 5% class return per year before expenses. |
| (p) | “Expenses Paid During Period” are equal to each class’s annualized expense ratio, as shown above, multiplied by the average account value over the period, multiplied by 181/365 (to reflect theone-half year period). |
3
Table of Contents
MFS International Intrinsic Value Portfolio
PORTFOLIO OF INVESTMENTS – 6/30/19 (unaudited)
The Portfolio of Investments is a complete list of all securities owned by your fund. It is categorized by broad-based asset classes.
| Issuer | Shares/Par | Value ($) | ||||||
| COMMON STOCKS – 94.6% |
| |||||||
| Airlines – 0.5% |
| |||||||
| Ryanair Holdings PLC, ADR (a) | 104,841 | $ | 6,724,502 | |||||
|
| |||||||
| Alcoholic Beverages – 7.3% |
| |||||||
| Diageo PLC | 811,751 | $ | 34,885,069 | |||||
| Heineken N.V. | 212,225 | 23,683,251 | ||||||
| Pernod Ricard S.A. | 200,264 | 36,902,063 | ||||||
|
| |||||||
| $ | 95,470,383 | |||||||
|
| |||||||
| Apparel Manufacturers – 1.1% |
| |||||||
| Compagnie Financiere Richemont S.A. | 109,453 | $ | 9,288,144 | |||||
| LVMH Moet Hennessy Louis Vuitton SE | 11,424 | 4,862,244 | ||||||
|
| |||||||
| $ | 14,150,388 | |||||||
|
| |||||||
| Automotive – 0.3% |
| |||||||
| USS Co. Ltd. | 183,700 | $ | 3,617,262 | |||||
|
| |||||||
| Biotechnology – 0.2% |
| |||||||
| Novozymes A/S | 64,499 | $ | 3,007,723 | |||||
|
| |||||||
| Brokerage & Asset Managers – 0.3% |
| |||||||
| Euronext N.V. | 47,451 | $ | 3,590,808 | |||||
|
| |||||||
| Business Services – 9.7% |
| |||||||
| Brenntag AG | 150,636 | $ | 7,418,493 | |||||
| Compass Group PLC | 1,041,642 | 24,961,850 | ||||||
| Experian PLC | 458,066 | 13,868,219 | ||||||
| Intertek Group PLC | 187,009 | 13,066,807 | ||||||
| Nomura Research Institute Ltd. | 852,900 | 13,661,905 | ||||||
| Rentokil Initial PLC | 618,534 | 3,122,390 | ||||||
| Secom Co. Ltd. | 185,900 | 15,990,693 | ||||||
| SGS S.A. | 7,566 | 19,275,397 | ||||||
| Sohgo Security Services Co. Ltd. | 127,000 | 5,854,380 | ||||||
| Thomson Reuters Corp. | 153,115 | 9,877,557 | ||||||
|
| |||||||
| $ | 127,097,691 | |||||||
|
| |||||||
| Chemicals – 3.5% |
| |||||||
| Givaudan S.A. | 16,239 | $ | 45,845,814 | |||||
|
| |||||||
| Computer Software – 9.4% |
| |||||||
| ANSYS, Inc. (a) | 109,968 | $ | 22,523,646 | |||||
| Cadence Design Systems, Inc. (a) | 629,319 | 44,562,078 | ||||||
| Check Point Software Technologies Ltd. (a) | 43,986 | 5,085,222 | ||||||
| Dassault Systems S.A. | 137,907 | 22,001,014 | ||||||
| OBIC Co. Ltd. | 142,000 | 16,068,265 | ||||||
| SAP AG | 78,095 | 10,723,710 | ||||||
| Wisetech Global Ltd. | 108,805 | 2,116,671 | ||||||
|
| |||||||
| $ | 123,080,606 | |||||||
|
| |||||||
| Computer Software – Systems – 2.5% |
| |||||||
| Amadeus IT Group S.A. | 377,636 | $ | 29,912,698 | |||||
| Descartes Systems Group, Inc. (a) | 67,618 | 2,501,693 | ||||||
|
| |||||||
| $ | 32,414,391 | |||||||
|
| |||||||
| Construction – 0.4% |
| |||||||
| Geberit AG | 12,092 | $ | 5,648,384 | |||||
|
| |||||||
| Issuer | Shares/Par | Value ($) | ||||||
| COMMON STOCKS – continued |
| |||||||
| Consumer Products – 9.5% |
| |||||||
| Colgate-Palmolive Co. | 398,747 | $ | 28,578,198 | |||||
| Kao Corp. | 375,200 | 28,571,089 | ||||||
| KOSE Corp. | 23,200 | 3,888,364 | ||||||
| L’Oréal | 95,438 | 27,184,903 | ||||||
| Reckitt Benckiser Group PLC | 368,927 | 29,113,745 | ||||||
| ROHTO Pharmaceutical Co. Ltd. | 261,800 | 7,100,155 | ||||||
|
| |||||||
| $ | 124,436,454 | |||||||
|
| |||||||
| Containers – 0.6% |
| |||||||
| Brambles Ltd. | 815,910 | $ | 7,377,788 | |||||
|
| |||||||
| Electrical Equipment – 6.8% |
| |||||||
| IMI PLC | 889,692 | $ | 11,727,986 | |||||
| Legrand S.A. | 304,481 | 22,262,293 | ||||||
| OMRON Corp. | 250,600 | 13,062,858 | ||||||
| Schneider Electric S.A. | 312,625 | 28,353,559 | ||||||
| Spectris PLC | 234,933 | 8,586,599 | ||||||
| Yokogawa Electric Corp. | 257,100 | 5,036,360 | ||||||
|
| |||||||
| $ | 89,029,655 | |||||||
|
| |||||||
| Electronics – 8.8% |
| |||||||
| Analog Devices, Inc. | 234,412 | $ | 26,458,083 | |||||
| DISCO Corp. | 16,300 | 2,672,949 | ||||||
| Halma PLC | 525,916 | 13,491,311 | ||||||
| Hirose Electric Co. Ltd. | 115,300 | 12,854,482 | ||||||
| Infineon Technologies AG | 630,726 | 11,152,439 | ||||||
| Samsung Electronics Co. Ltd. | 264,645 | 10,772,368 | ||||||
| Taiwan Semiconductor Manufacturing Co. | ||||||||
| Ltd., ADR | 614,947 | 24,087,474 | ||||||
| Texas Instruments, Inc. | 120,866 | 13,870,582 | ||||||
|
| |||||||
| $ | 115,359,688 | |||||||
|
| |||||||
| Engineering – Construction – 0.1% |
| |||||||
| Wartsila Corp. | 139,344 | $ | 2,021,005 | |||||
|
| |||||||
| Food & Beverages – 11.5% |
| |||||||
| Chocoladefabriken Lindt & Sprungli AG | 187 | $ | 1,361,027 | |||||
| Danone S.A. | 336,200 | 28,480,834 | ||||||
| Ezaki Glico Co. Ltd. | 25,100 | 1,117,470 | ||||||
| ITO EN Ltd. | 334,000 | 15,551,454 | ||||||
| Kerry Group PLC | 140,042 | 16,720,387 | ||||||
| Nestle S.A. | 667,771 | 69,130,237 | ||||||
| Nissan Foods Holdings Co. Ltd. | 51,800 | 3,334,341 | ||||||
| Toyo Suisan Kaisha Ltd. | 369,200 | 15,204,267 | ||||||
|
| |||||||
| $ | 150,900,017 | |||||||
|
| |||||||
| Insurance – 1.3% |
| |||||||
| Fairfax Financial Holdings Ltd. | 17,067 | $ | 8,376,912 | |||||
| Hiscox Ltd. | 395,142 | 8,490,630 | ||||||
|
| |||||||
| $ | 16,867,542 | |||||||
|
| |||||||
| Internet – 0.2% |
| |||||||
| Wix.com Ltd. (a) | 18,224 | $ | 2,589,630 | |||||
|
| |||||||
4
Table of Contents
MFS International Intrinsic Value Portfolio
Portfolio of Investments (unaudited) – continued
| Issuer | Shares/Par | Value ($) | ||||||
| COMMON STOCKS – continued |
| |||||||
| Machinery & Tools – 4.5% |
| |||||||
| GEA Group AG | 297,386 | $ | 8,453,942 | |||||
| Misumi Group, Inc. | 213,200 | 5,343,100 | ||||||
| Nordson Corp. | 85,237 | 12,044,840 | ||||||
| Schindler Holding AG | 23,625 | 5,258,874 | ||||||
| SMC Corp. | 24,000 | 8,941,984 | ||||||
| Spirax Sarco Engineering PLC | 165,106 | 19,258,764 | ||||||
|
| |||||||
| $ | 59,301,504 | |||||||
|
| |||||||
| Major Banks – 1.3% |
| |||||||
| Svenska Handelsbanken AB, “A” | 764,436 | $ | 7,563,563 | |||||
| UBS AG | 751,592 | 8,931,026 | ||||||
|
| |||||||
| $ | 16,494,589 | |||||||
|
| |||||||
| Medical Equipment – 2.5% |
| |||||||
| Dentsply Sirona, Inc. | 118,621 | $ | 6,922,722 | |||||
| EssilorLuxottica | 33,339 | 4,350,147 | ||||||
| Nihon Kohden Corp. | 367,000 | 9,932,811 | ||||||
| Terumo Corp. | 386,000 | 11,492,464 | ||||||
|
| |||||||
| $ | 32,698,144 | |||||||
|
| |||||||
| Oil Services – 0.4% |
| |||||||
| Core Laboratories N.V. | 96,953 | $ | 5,068,703 | |||||
|
| |||||||
| Other Banks & Diversified Financials – 1.2% |
| |||||||
| Chiba Bank Ltd. | 527,900 | $ | 2,575,480 | |||||
| Hachijuni Bank Ltd. | 517,800 | 2,108,373 | ||||||
| Julius Baer Group Ltd. | 75,744 | 3,372,090 | ||||||
| Jyske Bank A.S. | 65,741 | 2,278,448 | ||||||
| Mebuki Financial Group, Inc. | 872,000 | 2,272,708 | ||||||
| North Pacific Bank Ltd. | 776,300 | 1,843,276 | ||||||
| Sydbank A.S. | 87,172 | 1,661,330 | ||||||
|
| |||||||
| $ | 16,111,705 | |||||||
|
| |||||||
| Pharmaceuticals – 2.6% |
| |||||||
| Bayer AG | 69,522 | $ | 4,817,519 | |||||
| Kobayashi Pharmaceutical Co. Ltd. | 201,200 | 14,388,091 | ||||||
| Santen Pharmaceutical Co. Ltd. | 906,200 | 15,003,172 | ||||||
|
| |||||||
| $ | 34,208,782 | |||||||
|
| |||||||
| Issuer | Shares/Par | Value ($) | ||||||
| COMMON STOCKS – continued |
| |||||||
| Printing & Publishing – 0.5% |
| |||||||
| RELX Group PLC | 251,054 | $ | 6,074,877 | |||||
|
| |||||||
| Real Estate – 4.4% |
| |||||||
| Deutsche Wohnen SE | 567,768 | $ | 20,833,805 | |||||
| LEG Immobilien AG | 76,640 | 8,645,018 | ||||||
| TAG Immobilien AG | 293,149 | 6,773,464 | ||||||
| Vonovia SE | 452,999 | 21,634,420 | ||||||
|
| |||||||
| $ | 57,886,707 | |||||||
|
| |||||||
| Specialty Chemicals – 2.6% |
| |||||||
| Croda International PLC | 49,103 | $ | 3,192,746 | |||||
| Kansai Paint Co. Ltd. | 248,200 | 5,200,425 | ||||||
| Sika AG | 33,502 | 5,717,510 | ||||||
| Symrise AG | 212,480 | 20,449,958 | ||||||
|
| |||||||
| $ | 34,560,639 | |||||||
|
| |||||||
| Specialty Stores – 0.0% |
| |||||||
| Esprit Holdings Ltd. (a) | 2,468,795 | $ | 470,897 | |||||
|
| |||||||
| Telecommunications – Wireless – 0.6% |
| |||||||
| KDDI Corp. | 336,100 | $ | 8,552,524 | |||||
|
| |||||||
| Total Common Stocks (Identified Cost, $939,724,432) | $ | 1,240,658,802 | ||||||
|
| |||||||
| PREFERRED STOCKS – 2.3% |
| |||||||
| Consumer Products – 2.3% |
| |||||||
| Henkel AG & Co. KGaA (Identified Cost, $37,384,943) | 306,678 | $ | 29,997,204 | |||||
|
| |||||||
| INVESTMENT COMPANIES (h) – 2.0% |
| |||||||
| Money Market Funds – 2.0% |
| |||||||
| MFS Institutional Money Market Portfolio, 2.42% (v) (Identified Cost, $25,999,547) | 26,004,641 | $ | 26,007,241 | |||||
|
| |||||||
| OTHER ASSETS, LESS LIABILITIES – 1.1% | 15,002,828 | |||||||
|
| |||||||
| NET ASSETS – 100.0% | $ | 1,311,666,075 | ||||||
|
| |||||||
| (a) | Non-income producing security. |
| (h) | An affiliated issuer, which may be considered one in which the fund owns 5% or more of the outstanding voting securities, or a company which is under common control. At period end, the aggregate values of the fund’s investments in affiliated issuers and in unaffiliated issuers were $26,007,241 and $1,270,656,006, respectively. |
| (v) | Affiliated issuer that is available only to investment companies managed by MFS. The rate quoted for the MFS Institutional Money Market Portfolio is the annualizedseven-day yield of the fund at period end. |
The following abbreviations are used in this report and are defined:
| ADR | American Depositary Receipt |
Abbreviations indicate amounts shown in currencies other than the U.S. dollar. All amounts are stated in U.S. dollars unless otherwise indicated. A list of abbreviations is shown below:
| JPY | Japanese Yen |
5
Table of Contents
MFS International Intrinsic Value Portfolio
Portfolio of Investments (unaudited) – continued
Derivative Contracts at 6/30/19
Forward Foreign Currency Exchange Contracts
Currency Purchased | Currency Sold | Counterparty | Settlement Date | Unrealized Appreciation (Depreciation) | ||||||||||||||||
| Asset Derivatives | ||||||||||||||||||||
| JPY | 3,458,260,000 | USD | 31,655,713 | BNP Paribas S.A. | 8/22/2019 | $540,901 | ||||||||||||||
|
| |||||||||||||||||||
| Liability Derivatives | ||||||||||||||||||||
| USD | 3,575,190 | JPY | 390,183,000 | Citibank N.A. | 8/22/2019 | $(57,438 | ) | |||||||||||||
| USD | 37,962,885 | JPY | 4,135,866,500 | Goldman Sachs International | 8/22/2019 | (542,287 | ) | |||||||||||||
| USD | 37,851,185 | JPY | 4,135,866,500 | JPMorgan Chase Bank N.A. | 8/22/2019 | (653,987 | ) | |||||||||||||
|
| |||||||||||||||||||
| $(1,253,712 | ) | |||||||||||||||||||
|
| |||||||||||||||||||
At June 30, 2019, the fund had cash collateral of $1,630,000 to cover any collateral or margin obligations for certain derivative contracts. Restricted cash and/or deposits with brokers in the Statement of Assets and Liabilities are comprised of cash collateral.
See Notes to Financial Statements
6
Table of Contents
MFS International Intrinsic Value Portfolio
FINANCIAL STATEMENTS | STATEMENT OF ASSETS AND LIABILITIES (unaudited)
This statement represents your fund’s balance sheet, which details the assets and liabilities comprising the total value of the fund.
At 6/30/19 | ||||
Assets | ||||
Investments in unaffiliated issuers, at value (identified cost, $977,109,375) | $1,270,656,006 | |||
Investments in affiliated issuers, at value (identified cost, $25,999,547) | 26,007,241 | |||
Foreign currency, at value (identified cost, $2,141,747) | 2,139,036 | |||
Restricted cash for | ||||
Forward foreign currency exchange contracts | 1,630,000 | |||
Receivables for | ||||
Forward foreign currency exchange contracts | 540,901 | |||
Investments sold | 9,034,909 | |||
Fund shares sold | 1,730,049 | |||
Interest and dividends | 5,627,586 | |||
Other assets | 3,652 | |||
Total assets | $1,317,369,380 | |||
Liabilities | ||||
Payables for | ||||
Forward foreign currency exchange contracts | $1,253,712 | |||
Investments purchased | 2,896,557 | |||
Fund shares reacquired | 1,162,347 | |||
Payable to affiliates | ||||
Investment adviser | 113,202 | |||
Administrative services fee | 2,022 | |||
Shareholder servicing costs | 157 | |||
Distribution and/or service fees | 27,068 | |||
Payable for independent Trustees’ compensation | 100 | |||
Accrued expenses and other liabilities | 248,140 | |||
Total liabilities | $5,703,305 | |||
Net assets | $1,311,666,075 | |||
Net assets consist of | ||||
Paid-in capital | $947,938,457 | |||
Total distributable earnings (loss) | 363,727,618 | |||
Net assets | $1,311,666,075 | |||
Shares of beneficial interest outstanding | 45,405,473 | |||
| Net assets | Shares outstanding | Net asset value per share | ||||||||||
Initial Class | $319,915,896 | 10,923,105 | $29.29 | |||||||||
Service Class | 991,750,179 | 34,482,368 | 28.76 | |||||||||
See Notes to Financial Statements
7
Table of Contents
MFS International Intrinsic Value Portfolio
FINANCIAL STATEMENTS | STATEMENT OF OPERATIONS (unaudited)
This statement describes how much your fund earned in investment income and accrued in expenses. It also describes any gains and/or losses generated by fund operations.
Six months ended 6/30/19 | ||||
Net investment income (loss) | ||||
Income | ||||
Dividends | $18,895,058 | |||
Dividends from affiliated issuers | 455,695 | |||
Income on securities loaned | 19,650 | |||
Other | 206 | |||
Foreign taxes withheld | (1,798,848 | ) | ||
Total investment income | $17,571,761 | |||
Expenses | ||||
Management fee | $5,478,542 | |||
Distribution and/or service fees | 1,177,329 | |||
Shareholder servicing costs | 12,215 | |||
Administrative services fee | 92,416 | |||
Independent Trustees’ compensation | 15,501 | |||
Custodian fee | 104,461 | |||
Shareholder communications | 28,799 | |||
Audit and tax fees | 29,957 | |||
Legal fees | 7,849 | |||
Miscellaneous | 26,541 | |||
Total expenses | $6,973,610 | |||
Reduction of expenses by investment adviser | (179,221 | ) | ||
Net expenses | $6,794,389 | |||
Net investment income (loss) | $10,777,372 | |||
Realized and unrealized gain (loss) | ||||
Realized gain (loss) (identified cost basis) | ||||
Unaffiliated issuers | $6,950,162 | |||
Affiliated issuers | 3,032 | |||
Forward foreign currency exchange contracts | 1,542,207 | |||
Foreign currency | 80,930 | |||
Net realized gain (loss) | $8,576,331 | |||
Change in unrealized appreciation or depreciation | ||||
Unaffiliated issuers | $175,373,321 | |||
Affiliated issuers | 5,186 | |||
Forward foreign currency exchange contracts | (1,646,738 | ) | ||
Translation of assets and liabilities in foreign currencies | 28,355 | |||
Net unrealized gain (loss) | $173,760,124 | |||
Net realized and unrealized gain (loss) | $182,336,455 | |||
Change in net assets from operations | $193,113,827 | |||
See Notes to Financial Statements
8
Table of Contents
MFS International Intrinsic Value Portfolio
FINANCIAL STATEMENTS | STATEMENTS OF CHANGES IN NET ASSETS
These statements describe the increases and/or decreases in net assets resulting from operations, any distributions, and any shareholder transactions.
| Six months ended 6/30/19 | Year ended 12/31/18 | |||||||
| (unaudited) | ||||||||
Change in net assets | ||||||||
From operations | ||||||||
Net investment income (loss) | $10,777,372 | $18,761,103 | ||||||
Net realized gain (loss) | 8,576,331 | 331,520,353 | ||||||
Net unrealized gain (loss) | 173,760,124 | (519,204,339 | ) | |||||
Change in net assets from operations | $193,113,827 | $(168,922,883 | ) | |||||
Total distributions to shareholders | $— | $(42,976,985 | ) | |||||
Change in net assets from fund share transactions | $(21,969,787 | ) | $(693,239,677 | ) | ||||
Total change in net assets | $171,144,040 | $(905,139,545 | ) | |||||
Net assets | ||||||||
At beginning of period | 1,140,522,035 | 2,045,661,580 | ||||||
At end of period | $1,311,666,075 | $1,140,522,035 | ||||||
See Notes to Financial Statements
9
Table of Contents
MFS International Intrinsic Value Portfolio
FINANCIAL STATEMENTS | FINANCIAL HIGHLIGHTS
The financial highlights table is intended to help you understand the fund’s financial performance for the semiannual period and the past 5 fiscal years. Certain information reflects financial results for a single fund share. The total returns in the table represent the rate that an investor would have earned (or lost) on an investment in the fund share class (assuming reinvestment of all distributions) held for the entire period.
| Initial Class | Six months 6/30/19 | Year ended | ||||||||||||||||||||||
| 12/31/18 | 12/31/17 | 12/31/16 | 12/31/15 | 12/31/14 | ||||||||||||||||||||
| (unaudited) | ||||||||||||||||||||||||
Net asset value, beginning of period | $25.02 | $28.25 | $22.57 | $22.46 | $21.73 | $21.86 | ||||||||||||||||||
| Income (loss) from investment operations | ||||||||||||||||||||||||
Net investment income (loss) (d) | $0.26 | $0.30 | $0.29 | $0.32 | (c) | $0.30 | $0.57 | |||||||||||||||||
Net realized and unrealized gain (loss) | 4.01 | (2.91 | ) | 5.80 | 0.64 | 1.11 | (0.27 | ) | ||||||||||||||||
Total from investment operations | $4.27 | $(2.61 | ) | $6.09 | $0.96 | $1.41 | $0.30 | |||||||||||||||||
| Less distributions declared to shareholders | ||||||||||||||||||||||||
From net investment income | $— | $(0.31 | ) | $(0.39 | ) | $(0.32 | ) | $(0.45 | ) | $(0.43 | ) | |||||||||||||
From net realized gain | — | (0.31 | ) | (0.02 | ) | (0.53 | ) | (0.23 | ) | — | ||||||||||||||
Total distributions declared to shareholders | $— | $(0.62 | ) | $(0.41 | ) | $(0.85 | ) | $(0.68 | ) | $(0.43 | ) | |||||||||||||
Net asset value, end of period (x) | $29.29 | $25.02 | $28.25 | $22.57 | $22.46 | $21.73 | ||||||||||||||||||
Total return (%) (k)(r)(s)(x) | 17.07 | (n) | (9.49 | ) | 27.14 | 4.05 | (c) | 6.65 | 1.34 | |||||||||||||||
| Ratios (%) (to average net assets) and Supplemental data: | ||||||||||||||||||||||||
Expenses before expense reductions (f) | 0.93 | (a) | 0.91 | 0.91 | 0.91 | (c) | 0.93 | 0.95 | ||||||||||||||||
Expenses after expense reductions (f) | 0.90 | (a) | 0.90 | 0.90 | 0.89 | (c) | 0.91 | 0.94 | ||||||||||||||||
Net investment income (loss) | 1.91 | (a) | 1.08 | 1.13 | 1.41 | (c) | 1.33 | 2.58 | ||||||||||||||||
Portfolio turnover | 7 | (n) | 16 | 10 | 17 | 24 | 22 | |||||||||||||||||
Net assets at end of period (000 omitted) | $319,916 | $282,244 | $317,415 | $238,192 | $230,349 | $218,258 | ||||||||||||||||||
| Service Class | Six months 6/30/19 | Year ended | ||||||||||||||||||||||
| 12/31/18 | 12/31/17 | 12/31/16 | 12/31/15 | 12/31/14 | ||||||||||||||||||||
| (unaudited) | ||||||||||||||||||||||||
Net asset value, beginning of period | $24.60 | $27.80 | $22.23 | $22.13 | $21.44 | $21.58 | ||||||||||||||||||
| Income (loss) from investment operations | ||||||||||||||||||||||||
Net investment income (loss) (d) | $0.23 | $0.27 | $0.23 | $0.26 | (c) | $0.25 | $0.49 | |||||||||||||||||
Net realized and unrealized gain (loss) | 3.93 | (2.91 | ) | 5.70 | 0.63 | 1.07 | (0.24 | ) | ||||||||||||||||
Total from investment operations | $4.16 | $(2.64 | ) | $5.93 | $0.89 | $1.32 | $0.25 | |||||||||||||||||
| Less distributions declared to shareholders | ||||||||||||||||||||||||
From net investment income | $— | $(0.25 | ) | $(0.34 | ) | $(0.26 | ) | $(0.40 | ) | $(0.39 | ) | |||||||||||||
From net realized gain | — | (0.31 | ) | (0.02 | ) | (0.53 | ) | (0.23 | ) | — | ||||||||||||||
Total distributions declared to shareholders | $— | $(0.56 | ) | $(0.36 | ) | $(0.79 | ) | $(0.63 | ) | $(0.39 | ) | |||||||||||||
Net asset value, end of period (x) | $28.76 | $24.60 | $27.80 | $22.23 | $22.13 | $21.44 | ||||||||||||||||||
Total return (%) (k)(r)(s)(x) | 16.91 | (n) | (9.72 | ) | 26.82 | 3.84 | (c) | 6.32 | 1.13 | |||||||||||||||
| Ratios (%) (to average net assets) and Supplemental data: | ||||||||||||||||||||||||
Expenses before expense reductions (f) | 1.18 | (a) | 1.15 | 1.16 | 1.16 | (c) | 1.18 | 1.20 | ||||||||||||||||
Expenses after expense reductions (f) | 1.15 | (a) | 1.14 | 1.15 | 1.14 | (c) | 1.16 | 1.19 | ||||||||||||||||
Net investment income (loss) | 1.67 | (a) | 0.97 | 0.89 | 1.17 | (c) | 1.10 | 2.25 | ||||||||||||||||
Portfolio turnover | 7 | (n) | 16 | 10 | 17 | 24 | 22 | |||||||||||||||||
Net assets at end of period (000 omitted) | $991,750 | $858,278 | $1,728,247 | $1,273,735 | $1,124,133 | $984,842 | ||||||||||||||||||
See Notes to Financial Statements
10
Table of Contents
MFS International Intrinsic Value Portfolio
Financial Highlights – continued
| (a) | Annualized. |
| (c) | Amount reflects aone-time reimbursement of expenses by the custodian (or former custodian) without which net investment income and performance would be lower and expenses would be higher. |
| (d) | Per share data is based on average shares outstanding. |
| (f) | Ratios do not reflect reductions from fees paid indirectly, if applicable. |
| (k) | The total return does not reflect expenses that apply to separate accounts. Inclusion of these charges would reduce the total return figures for all periods shown. |
| (n) | Not annualized. |
| (r) | Certain expenses have been reduced without which performance would have been lower. |
| (s) | From time to time the fund may receive proceeds from litigation settlements, without which performance would be lower. |
| (x) | The net asset values and total returns have been calculated on net assets which include adjustments made in accordance with U.S. generally accepted accounting principles required at period end for financial reporting purposes. |
See Notes to Financial Statements
11
Table of Contents
MFS International Intrinsic Value Portfolio
NOTES TO FINANCIAL STATEMENTS (unaudited)
| (1) | Business and Organization |
MFS International Intrinsic Value Portfolio (formerly MFS International Value Portfolio) (the fund) is a diversified series of MFS Variable Insurance Trust II (the trust). The trust is organized as a Massachusetts business trust and is registered under the Investment Company Act of 1940, as amended, as anopen-end management investment company. The shareholders of each series of the trust are separate accounts of insurance companies, which offer variable annuity and/or life insurance products, and qualified retirement and pension plans.
The fund is an investment company and accordingly follows the investment company accounting and reporting guidance of the Financial Accounting Standards Board (FASB) Accounting Standards Codification Topic 946 Financial Services – Investment Companies.
| (2) | Significant Accounting Policies |
General – The preparation of financial statements in conformity with U.S. generally accepted accounting principles requires management to make estimates and assumptions that affect the reported amounts of assets and liabilities, and disclosure of contingent assets and liabilities at the date of the financial statements and the reported amounts of increases and decreases in net assets from operations during the reporting period. Actual results could differ from those estimates. In the preparation of these financial statements, management has evaluated subsequent events occurring after the date of the fund’s Statement of Assets and Liabilities through the date that the financial statements were issued. The fund invests in foreign securities. Investments in foreign securities are vulnerable to the effects of changes in the relative values of the local currency and the U.S. dollar and to the effects of changes in each country’s market, economic, industrial, political, regulatory, geopolitical, and other conditions.
Balance Sheet Offsetting – The fund’s accounting policy with respect to balance sheet offsetting is that, absent an event of default by the counterparty or a termination of the agreement, the International Swaps and Derivatives Association (ISDA) Master Agreement, or similar agreement, does not result in an offset of reported amounts of financial assets and financial liabilities in the Statement of Assets and Liabilities across transactions between the fund and the applicable counterparty. The fund’s right to setoff may be restricted or prohibited by the bankruptcy or insolvency laws of the particular jurisdiction to which a specific master netting agreement counterparty is subject. Balance sheet offsetting disclosures, to the extent applicable to the fund, have been included in the fund’s Significant Accounting Policies note under the captions for each of the fund’sin-scope financial instruments and transactions.
Investment Valuations – Equity securities, including restricted equity securities, are generally valued at the last sale or official closing price on their primary market or exchange as provided by a third-party pricing service. Equity securities, for which there were no sales reported that day, are generally valued at the last quoted daily bid quotation on their primary market or exchange as provided by a third-party pricing service. Short-term instruments with a maturity at issuance of 60 days or less may be valued at amortized cost, which approximates market value. Forward foreign currency exchange contracts are generally valued at the mean of bid and asked prices for the time period interpolated from rates provided by a third-party pricing service for proximate time periods.Open-end investment companies are generally valued at net asset value per share. Securities and other assets generally valued on the basis of information from a third-party pricing service may also be valued at a broker/dealer bid quotation. In determining values, third-party pricing services can utilize both transaction data and market information such as yield, quality, coupon rate, maturity, type of issue, trading characteristics, and other market data. The values of foreign securities and other assets and liabilities expressed in foreign currencies are converted to U.S. dollars using the mean of bid and asked prices for rates provided by a third-party pricing service.
The Board of Trustees has delegated primary responsibility for determining or causing to be determined the value of the fund’s investments (including any fair valuation) to the adviser pursuant to valuation policies and procedures approved by the Board. If the adviser determines that reliable market quotations are not readily available, investments are valued at fair value as determined in good faith by the adviser in accordance with such procedures under the oversight of the Board of Trustees. Under the fund’s valuation policies and procedures, market quotations are not considered to be readily available for most types of debt instruments and floating rate loans and many types of derivatives. These investments are generally valued at fair value based on information from third-party pricing services. In addition, investments may be valued at fair value if the adviser determines that an investment’s value has been materially affected by events occurring after the close of the exchange or market on which the investment is principally traded (such as foreign exchange or market) and prior to the determination of the fund’s net asset value, or after the halt of trading of a specific security where trading does not resume prior to the close of the exchange or market on which the security is principally traded. Events that occur after foreign markets close (such as developments in foreign markets and significant movements in the U.S. markets) and prior to the determination of the fund’s net asset value may be deemed to have a material effect on the value of securities traded in foreign markets. Accordingly, the fund’s foreign equity securities may often be valued at fair value. The adviser generally relies on third-party pricing services or other information (such as the correlation with price movements of similar securities in the same or other markets; the type, cost and investment characteristics of the security; the business and financial condition of the issuer; and trading and other market data) to assist in determining whether to fair value and at what value to fair value an
12
Table of Contents
MFS International Intrinsic Value Portfolio
Notes to Financial Statements (unaudited) – continued
investment. The value of an investment for purposes of calculating the fund’s net asset value can differ depending on the source and method used to determine value. When fair valuation is used, the value of an investment used to determine the fund’s net asset value may differ from quoted or published prices for the same investment. There can be no assurance that the fund could obtain the fair value assigned to an investment if it were to sell the investment at the same time at which the fund determines its net asset value per share.
Various inputs are used in determining the value of the fund’s assets or liabilities. These inputs are categorized into three broad levels. In certain cases, the inputs used to measure fair value may fall into different levels of the fair value hierarchy. In such cases, an investment’s level within the fair value hierarchy is based on the lowest level of input that is significant to the fair value measurement. The fund’s assessment of the significance of a particular input to the fair value measurement in its entirety requires judgment, and considers factors specific to the investment. Level 1 includes unadjusted quoted prices in active markets for identical assets or liabilities. Level 2 includes other significant observable market-based inputs (including quoted prices for similar securities, interest rates, prepayment speed, and credit risk). Level 3 includes unobservable inputs, which may include the adviser’s own assumptions in determining the fair value of investments. Other financial instruments are derivative instruments, such as forward foreign currency exchange contracts. The following is a summary of the levels used as of June 30, 2019 in valuing the fund’s assets or liabilities:
| Financial Instruments | Level 1 | Level 2 | Level 3 | Total | ||||||||||||
| Equity Securities | $1,270,656,006 | $— | $— | $1,270,656,006 | ||||||||||||
| Mutual Funds | 26,007,241 | — | — | 26,007,241 | ||||||||||||
| Total | $1,296,663,247 | $— | $— | $1,296,663,247 | ||||||||||||
| Other Financial Instruments | ||||||||||||||||
| Forward Foreign Currency Exchange Contracts – Assets | $— | $540,901 | $— | $540,901 | ||||||||||||
| Forward Foreign Currency Exchange Contracts – Liabilities | — | (1,253,712 | ) | — | (1,253,712 | ) | ||||||||||
For further information regarding security characteristics, see the Portfolio of Investments.
Foreign Currency Translation – Purchases and sales of foreign investments, income, and expenses are converted into U.S. dollars based upon currency exchange rates prevailing on the respective dates of such transactions or on the reporting date for foreign denominated receivables and payables. Gains and losses attributable to foreign currency exchange rates on sales of securities are recorded for financial statement purposes as net realized gains and losses on investments. Gains and losses attributable to foreign exchange rate movements on receivables, payables, income and expenses are recorded for financial statement purposes as foreign currency transaction gains and losses. That portion of both realized and unrealized gains and losses on investments that results from fluctuations in foreign currency exchange rates is not separately disclosed.
Derivatives – The fund uses derivatives primarily to increase or decrease exposure to a particular market or segment of the market, or security, to increase or decrease interest rate or currency exposure, or as alternatives to direct investments. Derivatives are used for hedging ornon-hedging purposes. While hedging can reduce or eliminate losses, it can also reduce or eliminate gains. When the fund uses derivatives as an investment to increase market exposure, or for hedging purposes, gains and losses from derivative instruments may be substantially greater than the derivative’s original cost.
The derivative instruments used by the fund during the period were forward foreign currency exchange contracts. Depending on the type of derivative, the fund may exit a derivative position by entering into an offsetting transaction with a counterparty or exchange, negotiating an agreement with the derivative counterparty, or novating the position to a third party. The fund’s period end derivatives, as presented in the Portfolio of Investments and the associated Derivative Contract tables, generally are indicative of the volume of its derivative activity during the period.
The following table presents, by major type of derivative contract, the fair value, on a gross basis, of the asset and liability components of derivatives held by the fund at June 30, 2019 as reported in the Statement of Assets and Liabilities:
| Fair Value | ||||||||||
| Risk | Derivative Contracts | Asset Derivatives | Liability Derivatives | |||||||
| Foreign Exchange | Forward Foreign Currency Exchange Contracts | $540,901 | $(1,253,712 | ) | ||||||
The following table presents, by major type of derivative contract, the realized gain (loss) on derivatives held by the fund for the six months ended June 30, 2019 as reported in the Statement of Operations:
| Risk | Forward Foreign Exchange | |||
| Foreign Exchange | $1,542,207 | |||
13
Table of Contents
MFS International Intrinsic Value Portfolio
Notes to Financial Statements (unaudited) – continued
The following table presents, by major type of derivative contract, the change in unrealized appreciation or depreciation on derivatives held by the fund for the six months ended June 30, 2019 as reported in the Statement of Operations:
| Risk | Forward Foreign Exchange | |||
| Foreign Exchange | $(1,646,738 | ) | ||
Derivative counterparty credit risk is managed through formal evaluation of the creditworthiness of all potential counterparties. On certain, but not all, uncleared derivatives, the fund attempts to reduce its exposure to counterparty credit risk whenever possible by entering into an ISDA Master Agreement on a bilateral basis. The ISDA Master Agreement gives each party to the agreement the right to terminate all transactions traded under such agreement if there is a specified deterioration in the credit quality of the other party. Upon an event of default or a termination of the ISDA Master Agreement, thenon-defaulting party has the right to close out all transactions traded under such agreement and to net amounts owed under each agreement to one net amount payable by one party to the other. This right to close out and net payments across all transactions traded under the ISDA Master Agreement could result in a reduction of the fund’s credit risk to such counterparty equal to any amounts payable by the fund under the applicable transactions, if any.
Collateral and margin requirements differ by type of derivative. For cleared derivatives (e.g., futures contracts, cleared swaps, and exchange-traded options), margin requirements are set by the clearing broker and the clearing house and collateral, in the form of cash or securities, is posted by the fund directly with the clearing broker. Collateral terms are counterparty agreement specific for uncleared derivatives (e.g., forward foreign currency exchange contracts, uncleared swap agreements, and uncleared options) and collateral, in the form of cash and securities, is held in segregated accounts with the fund’s custodian in connection with these agreements. For derivatives traded under an ISDA Master Agreement, which contains a collateral support annex, the collateral requirements are netted across all transactions traded under such counterparty-specific agreement and an amount is posted from one party to the other to collateralize such obligations. Cash that has been segregated or delivered to cover the fund’s collateral or margin obligations under derivative contracts, if any, will be reported separately in the Statement of Assets and Liabilities as restricted cash for uncleared derivatives and/or deposits with brokers for cleared derivatives. Securities pledged as collateral or margin for the same purpose, if any, are noted in the Portfolio of Investments. The fund may be required to make payments of interest on uncovered collateral or margin obligations with the broker. Any such payments are included in “Miscellaneous” expense in the Statement of Operations.
Forward Foreign Currency Exchange Contracts – The fund entered into forward foreign currency exchange contracts for the purchase or sale of a specific foreign currency at a fixed price on a future date. These contracts may be used to hedge the fund’s currency risk or fornon-hedging purposes. For hedging purposes, the fund may enter into contracts to deliver or receive foreign currency that the fund will receive from or use in its normal investment activities. The fund may also use contracts to hedge against declines in the value of foreign currency denominated securities due to unfavorable exchange rate movements. Fornon-hedging purposes, the fund may enter into contracts with the intent of changing the relative exposure of the fund’s portfolio of securities to different currencies to take advantage of anticipated exchange rate changes.
Forward foreign currency exchange contracts are adjusted by the daily exchange rate of the underlying currency and any unrealized gains or losses are recorded as a receivable or payable for forward foreign currency exchange contracts until the contract settlement date. On contract settlement date, any gain or loss on the contract is recorded as realized gains or losses on forward foreign currency exchange contracts.
Risks may arise upon entering into these contracts from unanticipated movements in the value of the contract and from the potential inability of counterparties to meet the terms of their contracts. Generally, the fund’s maximum risk due to counterparty credit risk is the unrealized gain on the contract due to the use of Continuous Linked Settlement, a multicurrency cash settlement system for the centralized settlement of foreign transactions. This risk is mitigated in cases where there is an ISDA Master Agreement between the fund and the counterparty providing for netting as described above and, where applicable, by the posting of collateral by the counterparty to the fund to cover the fund’s exposure to the counterparty under such ISDA Master Agreement.
Security Loans – Under its Securities Lending Agency Agreement with the fund, State Street Bank and Trust Company, as lending agent, loans the securities of the fund to certain qualified institutions (the “Borrowers”) approved by the fund. Security loans can be terminated at the discretion of either the lending agent or the fund and the related securities must be returned within the earlier of the standard trade settlement period for such securities or within three business days. The loans are collateralized by cash and/or U.S. Treasury and federal agency obligations in an amount typically at least equal to the market value of the securities loaned. On loans collateralized by cash, the cash collateral is invested in a money market fund. The market value of the loaned securities is determined at the close of business of the fund and any additional required collateral is delivered to the fund on the next business day. The lending agent provides the fund with indemnification against Borrower default. In the event of Borrower default, the lending agent
14
Table of Contents
MFS International Intrinsic Value Portfolio
Notes to Financial Statements (unaudited) – continued
will, for the benefit of the fund, either purchase securities identical to those loaned or, when such purchase is commercially impracticable, pay the fund the market value of the loaned securities. In return, the lending agent assumes the fund’s rights to the related collateral. If the collateral value is less than the cost to purchase identical securities, the lending agent is responsible for the shortfall, but only to the extent that such shortfall is not due to a decline in collateral value resulting from collateral reinvestment for which the fund bears the risk of loss. A portion of the income generated upon investment of the collateral is remitted to the Borrowers, and the remainder is allocated between the fund and the lending agent. On loans collateralized by U.S. Treasury and/or federal agency obligations, a fee is received from the Borrower, and is allocated between the fund and the lending agent. Income from securities lending is separately reported in the Statement of Operations. The dividend and interest income earned on the securities loaned is accounted for in the same manner as other dividend and interest income. At June 30, 2019, there were no securities on loan or collateral outstanding.
Indemnifications – Under the fund’s organizational documents, its officers and Trustees may be indemnified against certain liabilities and expenses arising out of the performance of their duties to the fund. Additionally, in the normal course of business, the fund enters into agreements with service providers that may contain indemnification clauses. The fund’s maximum exposure under these agreements is unknown as this would involve future claims that may be made against the fund that have not yet occurred.
Investment Transactions and Income – Investment transactions are recorded on the trade date. Interest income is recorded on the accrual basis. Dividends received in cash are recorded on theex-dividend date. Certain dividends from foreign securities will be recorded when the fund is informed of the dividend if such information is obtained subsequent to theex-dividend date. Dividend payments received in additional securities are recorded on theex-dividend date in an amount equal to the value of the security on such date.
The fund may receive proceeds from litigation settlements. Any proceeds received from litigation involving portfolio holdings are reflected in the Statement of Operations in realized gain/loss if the security has been disposed of by the fund or in unrealized gain/loss if the security is still held by the fund. Any other proceeds from litigation not related to portfolio holdings are reflected as other income in the Statement of Operations.
Tax Matters and Distributions – The fund intends to qualify as a regulated investment company, as defined under Subchapter M of the Internal Revenue Code, and to distribute all of its taxable income, including realized capital gains. As a result, no provision for federal income tax is required. The fund’s federal tax returns, when filed, will remain subject to examination by the Internal Revenue Service for a three year period. Management has analyzed the fund’s tax positions taken on federal and state tax returns for all open tax years and does not believe that there are any uncertain tax positions that require recognition of a tax liability. Foreign taxes, if any, have been accrued by the fund in the accompanying financial statements in accordance with the applicable foreign tax law. Foreign income taxes may be withheld by certain countries in which the fund invests. Additionally, capital gains realized by the fund on securities issued in or by certain foreign countries may be subject to capital gains tax imposed by those countries.
Distributions to shareholders are recorded on theex-dividend date. Income and capital gain distributions are determined in accordance with income tax regulations, which may differ from U.S. generally accepted accounting principles. Certain capital accounts in the financial statements are periodically adjusted for permanent differences in order to reflect their tax character. These adjustments have no impact on net assets or net asset value per share. Temporary differences which arise from recognizing certain items of income, expense, gain or loss in different periods for financial statement and tax purposes will reverse at some time in the future. Distributions in excess of net investment income or net realized gains are temporary overdistributions for financial statement purposes resulting from differences in the recognition or classification of income or distributions for financial statement and tax purposes.
Book/tax differences primarily relate to wash sale loss deferrals, derivative transactions, and redemptionsin-kind.
The tax character of distributions declared to shareholders for the last fiscal year is as follows:
| Year ended 12/31/18 | ||||
| Ordinary income (including any short-term capital gains) | $19,511,316 | |||
| Long-term capital gains | 23,465,669 | |||
| Total distributions | $42,976,985 | |||
15
Table of Contents
MFS International Intrinsic Value Portfolio
Notes to Financial Statements (unaudited) – continued
The federal tax cost and the tax basis components of distributable earnings were as follows:
| As of 6/30/19 | ||||
| Cost of investments | $1,009,513,715 | |||
| Gross appreciation | 329,776,641 | |||
| Gross depreciation | (42,627,109 | ) | ||
| Net unrealized appreciation (depreciation) | $287,149,532 | |||
| As of 12/31/18 | ||||
| Undistributed ordinary income | 21,215,624 | |||
| Undistributed long-term capital gain | 37,691,707 | |||
| Other temporary differences | (64,566 | ) | ||
| Net unrealized appreciation (depreciation) | 111,771,026 | |||
The aggregate cost above includes prior fiscal year end tax adjustments, if applicable.
Multiple Classes of Shares of Beneficial Interest – The fund offers multiple classes of shares, which differ in their respective distribution and/or service fees. The fund’s income, realized and unrealized gain (loss), and common expenses are allocated to shareholders based on the daily net assets of each class. Dividends are declared separately for each class. Differences in per share dividend rates are generally due to differences in separate class expenses. The fund’s distributions declared to shareholders as reported in the Statements of Changes in Net Assets are presented by class as follows:
| From net investment income | From net realized gain | |||||||||||||||
| Six months ended 6/30/19 | Year ended 12/31/18 | Six months ended 6/30/19 | Year ended 12/31/18 | |||||||||||||
| Initial Class | $— | $3,352,328 | $— | $3,375,683 | ||||||||||||
| Service Class | — | 16,158,988 | — | 20,089,986 | ||||||||||||
| Total | $— | $19,511,316 | $— | $23,465,669 | ||||||||||||
| (3) | Transactions with Affiliates |
Investment Adviser – The fund has an investment advisory agreement with MFS to provide overall investment management and related administrative services and facilities to the fund. The management fee is computed daily and paid monthly at the following annual rates based on the fund’s average daily net assets:
| Up to $1 billion | 0.90% | |||
| In excess of $1 billion and up to $2 billion | 0.80% | |||
| In excess of $2 billion | 0.70% |
MFS has agreed in writing to reduce its management fee by a specified amount if certain MFS mutual fund assets exceed thresholds agreed to by MFS and the fund’s Board of Trustees. For the six months ended June 30, 2019, this management fee reduction amounted to $60,132, which is included in the reduction of total expenses in the Statement of Operations. The management fee incurred for the six months ended June 30, 2019 was equivalent to an annual effective rate of 0.87% of the fund’s average daily net assets.
The investment adviser has agreed in writing to pay a portion of the fund’s total annual operating expenses, excluding interest, taxes, extraordinary expenses, brokerage and transaction costs, and investment-related expenses, such that total annual operating expenses do not exceed 0.90% of average daily net assets for the Initial Class shares and 1.15% of average daily net assets for the Service Class shares. This written agreement will continue until modified by the fund’s Board of Trustees, but such agreement will continue at least until April 30, 2021. For the six months ended June 30, 2019, this reduction amounted to $119,089, which is included in the reduction of total expenses in the Statement of Operations.
Distributor – MFS Fund Distributors, Inc. (MFD), a wholly-owned subsidiary of MFS, is the distributor of shares of the fund. The Trustees have adopted a distribution plan for the Service Class shares pursuant to Rule12b-1 under the Investment Company Act of 1940.
The fund’s distribution plan provides that the fund will pay MFD distribution and/or service fees equal to 0.25% per annum of its average daily net assets attributable to Service Class shares as partial consideration for services performed and expenses incurred by MFD and financial intermediaries (including participating insurance companies that invest in the fund to fund variable annuity and variable life insurance contracts, sponsors of qualified retirement and pension plans that invest in the fund, and affiliates of these participating insurance companies and plan sponsors) in connection with the sale and distribution of the Service Class shares. MFD may subsequently pay all, or a portion, of the distribution and/or service fees to financial intermediaries.
16
Table of Contents
MFS International Intrinsic Value Portfolio
Notes to Financial Statements (unaudited) – continued
Shareholder Servicing Agent – MFS Service Center, Inc. (MFSC), a wholly-owned subsidiary of MFS, receives a fee from the fund for its services as shareholder servicing agent. For the six months ended June 30, 2019, the fee was $11,642, which equated to 0.0019% annually of the fund’s average daily net assets. MFSC also receives payment from the fund forout-of-pocket expenses paid by MFSC on behalf of the fund. For the six months ended June 30, 2019, these costs amounted to $573.
Administrator – MFS provides certain financial, legal, shareholder communications, compliance, and other administrative services to the fund. Under an administrative services agreement, the fund reimburses MFS the costs incurred to provide these services. The fund is charged an annual fixed amount of $17,500 plus a fee based on average daily net assets. The administrative services fee incurred for the six months ended June 30, 2019 was equivalent to an annual effective rate of 0.0148% of the fund’s average daily net assets.
Trustees’ and Officers’ Compensation – The fund pays compensation to independent Trustees in the form of a retainer, attendance fees, and additional compensation to Board and Committee chairpersons. The fund does not pay compensation directly to Trustees or officers of the fund who are also officers of the investment adviser, all of whom receive remuneration from MFS for their services to the fund. Certain officers and Trustees of the fund are officers or directors of MFS, MFD, and MFSC.
Other – This fund and certain other funds managed by MFS (the funds) had entered into a service agreement (the ISO Agreement) which provided for payment of fees solely by the funds to Tarantino LLC in return for the provision of services of an Independent Senior Officer (ISO) for the funds. Frank L. Tarantino served as the ISO and was an officer of the funds and the sole member of Tarantino LLC. Effective June 30, 2019, Mr. Tarantino retired from his position as ISO for the funds, and the ISO Agreement was terminated. For the six months ended June 30, 2019, the fee paid by the fund under this agreement was $1,476 and is included in “Miscellaneous” expense in the Statement of Operations. MFS had agreed to bear all expenses associated with office space, other administrative support, and supplies provided to the ISO.
The fund invests in the MFS Institutional Money Market Portfolio which is managed by MFS and seeks current income consistent with preservation of capital and liquidity. This money market fund does not pay a management fee to MFS.
The fund is permitted to engage in purchase and sale transactions with funds and accounts for which MFS serves as investment adviser orsub-adviser (“cross-trades”) pursuant to a policy adopted by the Board of Trustees. This policy has been designed to ensure that cross-trades conducted by the fund comply with Rule17a-7 under the Investment Company Act of 1940. During the six months ended June 30, 2019, the fund engaged in purchase and sale transactions pursuant to this policy, which amounted to $790,033 and $198,244, respectively. The sales transactions resulted in net realized gains (losses) of $37,773.
| (4) | Portfolio Securities |
For the six months ended June 30, 2019, purchases and sales of investments, other than short-term obligations, aggregated $80,450,160 and $97,196,264, respectively.
| (5) | Shares of Beneficial Interest |
The fund’s Declaration of Trust permits the Trustees to issue an unlimited number of full and fractional shares of beneficial interest. Transactions in fund shares were as follows:
| Six months ended 6/30/19 | Year ended 12/31/18 | |||||||||||||||
| Shares | Amount | Shares | Amount | |||||||||||||
| Shares sold | ||||||||||||||||
Initial Class | 622,978 | $17,257,137 | 1,807,723 | $49,642,877 | ||||||||||||
Service Class | 2,361,972 | 63,809,880 | 9,068,135 | 246,748,145 | ||||||||||||
| 2,984,950 | $81,067,017 | 10,875,858 | $296,391,022 | |||||||||||||
| Shares issued to shareholders in reinvestment of distributions | ||||||||||||||||
Initial Class | — | $— | 227,591 | $6,449,925 | ||||||||||||
Service Class | — | — | 1,299,712 | 36,248,974 | ||||||||||||
| — | $— | 1,527,303 | $42,698,899 | |||||||||||||
| Shares reacquired | ||||||||||||||||
Initial Class | (982,291 | ) | $(27,126,600 | ) | (1,988,524 | ) | $(55,464,604 | ) | ||||||||
Service Class | (2,773,710 | ) | (75,910,204 | ) | (37,642,907 | ) | (976,864,994 | ) | ||||||||
| (3,756,001 | ) | $(103,036,804 | ) | (39,631,431 | ) | $(1,032,329,598 | ) | |||||||||
| Net change | ||||||||||||||||
Initial Class | (359,313 | ) | $(9,869,463 | ) | 46,790 | $628,198 | ||||||||||
Service Class | (411,738 | ) | (12,100,324 | ) | (27,275,060 | ) | (693,867,875 | ) | ||||||||
| (771,051 | ) | $(21,969,787 | ) | (27,228,270 | ) | $(693,239,677 | ) | |||||||||
17
Table of Contents
MFS International Intrinsic Value Portfolio
Notes to Financial Statements (unaudited) – continued
The fund is one of several mutual funds in which certain MFS funds may invest. The MFS funds do not invest in the underlying funds for the purpose of exercising management or control. At the end of the period, the MFS Moderate Allocation Portfolio, the MFS Growth Allocation Portfolio, and the MFS Conservative Allocation Portfolio were the owners of record of approximately 3%, 1%, and 1%, respectively, of the value of outstanding voting shares of the fund.
Effective at the close of business on October 16, 2017, the fund is closed to new investors subject to certain exceptions. Please see the fund’s prospectus for details.
| (6) | Line of Credit |
The fund and certain other funds managed by MFS participate in a $1.25 billion unsecured committed line of credit, subject to a $1 billion sublimit, provided by a syndicate of banks under a credit agreement. Borrowings may be made for temporary financing needs. Interest is charged to each fund, based on its borrowings, generally at a rate equal to the highest of one month LIBOR, the Federal Funds Effective Rate and the Overnight Bank Funding Rate, plus an agreed upon spread. A commitment fee, based on the average daily, unused portion of the committed line of credit, is allocated among the participating funds. In addition, the fund and other funds managed by MFS have established unsecured uncommitted borrowing arrangements with certain banks for temporary financing needs. Interest is charged to each fund, based on its borrowings, at rates equal to customary reference rates plus an agreed upon spread. For the six months ended June 30, 2019, the fund’s commitment fee and interest expense were $3,549 and $0, respectively, and are included in “Miscellaneous” expense in the Statement of Operations.
| (7) | Investments in Affiliated Issuers |
An affiliated issuer may be considered one in which the fund owns 5% or more of the outstanding voting securities, or a company which is under common control. For the purposes of this report, the following were affiliated issuers:
| Affiliated Issuers | Beginning Value | Purchases | Sales Proceeds | Realized Gain (Loss) | Change in Unrealized Appreciation or Depreciation | Ending Value | ||||||||||||||||||
| MFS Institutional Money Market Portfolio | $34,696,385 | $74,362,081 | $83,059,443 | $3,032 | $5,186 | $26,007,241 | ||||||||||||||||||
| Affiliated Issuers | Dividend Income | Capital Gain Distributions | ||||||||||||||||||||||
| MFS Institutional Money Market Portfolio | $455,695 | $— | ||||||||||||||||||||||
18
Table of Contents
MFS International Intrinsic Value Portfolio
PROXY VOTING POLICIES AND INFORMATION
MFS votes proxies on behalf of the fund pursuant to proxy voting policies and procedures that are available without charge, upon request, by calling 1-800-225-2606, by visitingmfs.com/proxyvoting, or by visiting the SEC’s Web site athttp://www.sec.gov.
Information regarding how the fund voted proxies relating to portfolio securities during the most recent twelve-month period ended June 30 is available by August 31 of each year without charge by visitingmfs.com/proxyvoting, or by visiting the SEC’s Web site athttp://www.sec.gov.
QUARTERLY PORTFOLIO DISCLOSURE
The fund files a complete schedule of portfolio holdings with the SEC for the first and third quarters of each fiscal year on Form N-Q or as an exhibit to its reports on Form N-PORT (for first and third fiscal quarters ending March 31, 2019 or after). The fund’sForm N-Q or Form N-PORT reports are available on the SEC’s website athttp://www.sec.gov.A shareholder can obtain the portfolio holdings report for the first and third quarters of the fund’s fiscal year atmfs.com/vit2 by choosing the fund’s name and then selecting the “Resources” tab and clicking on “Prospectus and Reports”.
From time to time, MFS may post important information about the fund or the MFS funds on the MFS web site (mfs.com). This information is available athttps://www.mfs.com/en-us/what-we-do/announcements.htmlor atmfs.com/vit2 by choosing the fund’s name.
INFORMATION ABOUT FUND CONTRACTS AND LEGAL CLAIMS
The fund has entered into contractual arrangements with an investment adviser, administrator, distributor, shareholder servicing agent, 529 program manager (if applicable), and custodian who each provide services to the fund. Unless expressly stated otherwise, shareholders are not parties to, or intended beneficiaries of these contractual arrangements, and these contractual arrangements are not intended to create any shareholder right to enforce them against the service providers or to seek any remedy under them against the service providers, either directly or on behalf of the fund.
Under the Trust’s By-Laws and Declaration of Trust, any claims asserted against or on behalf of the MFS Funds, including claims against Trustees and Officers, must be brought in state and federal courts located within the Commonwealth of Massachusetts.
19
Table of Contents
Table of Contents
Semiannual Report
June 30, 2019

MFS® Massachusetts Investors Growth Stock Portfolio

MFS® Variable Insurance Trust II
Beginning on January 1, 2021, as permitted by regulations adopted by the U.S. Securities and Exchange Commission, the insurance company that offers your contract may determine that it will no longer send you paper copies of the fund’s annual and semiannual shareholder reports unless you specifically request paper copies from the insurance company or from your financial intermediary. Instead, the shareholder reports will be made available on a Web site (insurancefunds.mfs.com or other Web site of which you will be notified), and the insurance company will notify you by mail each time a report is posted and provide you with a Web site link to access the report. Instructions for requesting paper copies will be provided by your insurance company or financial intermediary.
If you already elected to receive shareholder reports by email, you will not be affected by this change and you need not take any action. If your insurance company or financial intermediary offers electronic delivery, you may elect to receive shareholder reports and other communications from the insurance company or financial intermediary by email by following the instructions provided by the insurance company or financial intermediary.
Beginning on January 1, 2019, you may elect to receive all future reports in paper free of charge from the insurance company or financial intermediary. You can inform the insurance company or financial intermediary that you wish to continue receiving paper copies of your shareholder reports by contacting your insurance company or financial intermediary. Your election to receive reports in paper will apply to all funds held in your account with your insurance company or financial intermediary.
MIS-SEM
Table of Contents
MFS® Massachusetts Investors Growth Stock Portfolio
The report is prepared for the general information of contract owners. It is authorized for distribution to prospective investors only when preceded or accompanied by a current prospectus.
NOT FDIC INSURED• MAY LOSE VALUE• NO BANK OR CREDIT UNION GUARANTEE• NOT A DEPOSIT• NOT INSURED BY ANY FEDERAL GOVERNMENT AGENCY OR NCUA/NCUSIF
Table of Contents
MFS Massachusetts Investors Growth Stock Portfolio
LETTER FROM THE EXECUTIVE CHAIRMAN

Dear Contract Owners:
Slowing global growth, low inflation, and increasing trade friction between the United States and China have been hallmarks of the past 12 months. After experiencing an uptick in market volatility in late 2018, markets steadied during the first half of 2019, thanks in large measure to the adoption of a dovish policy stance on the part of global central banks, who have largely abandoned efforts to normalize interest rates and have instead focused on supporting economic growth. Trade tensions remain high as the U.S. has ratcheted up tariffs on Chinese imports and China has retaliated. A truce of sorts was reached midyear, but significant challenges continue to confront negotiators, and it is not known whether a comprehensive agreement can be reached.
With Boris Johnson replacing Theresa May as Britain’s prime minister, uncertainty over Brexit remains high. Johnson has adopted a more combative stance than his predecessor toward the European Union, increasing concerns that there will be a “hard” Brexit.
Markets expect that the longest economic expansion in U.S. history will continue for the time being, albeit at a slower pace. Nevertheless, slower growth and low inflation have spurred the U.S. Federal Reserve to take a more accommodative policy stance, prompting investors to anticipate several interest rate cuts in the coming year. The European Central Bank has adopted a similar position. The more accommodative environment has helped fuel a continued rise in global equities and has been broadly supportive of risk assets.
Since launching the first U.S.open-end mutual fund in 1924, MFS® has been committed to a single purpose: to create value by allocating capital responsibly for clients. Through our powerful global investment platform, we combine collective expertise, thoughtful risk management, and long-term discipline to uncover what we believe are the best investment opportunities in the market.
Respectfully,

Robert J. Manning
Executive Chairman
MFS Investment Management
August 16, 2019
The opinions expressed in this letter are subject to change and may not be relied upon for investment advice. No forecasts can be guaranteed.
1
Table of Contents
MFS Massachusetts Investors Growth Stock Portfolio
Portfolio structure

| Top ten holdings | ||||
| Alphabet, Inc., “A” | 5.5% | |||
| Microsoft Corp. | 5.1% | |||
| Accenture PLC, “A” | 3.7% | |||
| Visa, Inc., “A” | 3.5% | |||
| Aon PLC | 2.9% | |||
| Thermo Fisher Scientific, Inc. | 2.7% | |||
| Apple, Inc. | 2.6% | |||
| Texas Instruments, Inc. | 2.4% | |||
| Comcast Corp., “A” | 2.2% | |||
| Fidelity National Information Services, Inc. | 2.1% |
| GICS equity sectors (g) | ||||
| Information Technology | 28.7% | |||
| Consumer Discretionary | 14.9% | |||
| Health Care | 14.8% | |||
| Industrials | 9.8% | |||
| Communication Services | 9.7% | |||
| Financials | 9.3% | |||
| Consumer Staples | 7.6% | |||
| Materials | 4.9% | |||
| Energy | 0.1% |
| (g) | The Global Industry Classification Standard (GICS®) was developed by and/or is the exclusive property of MSCI, Inc. and S&P Global Market Intelligence Inc. (“S&P Global Market Intelligence”). GICS is a service mark of MSCI and S&P Global Market Intelligence and has been licensed for use by MFS. |
Cash & Cash Equivalents includes any cash, investments in money market funds, short-term securities, and other assets less liabilities. Please see the Statement of Assets and Liabilities for additional information related to the fund’s cash position and other assets and liabilities.
Percentages are based on net assets as of June 30, 2019.
The portfolio is actively managed and current holdings may be different.
2
Table of Contents
MFS Massachusetts Investors Growth Stock Portfolio
Fund Expenses Borne by the Contract Holders during the Period,
January 1, 2019 through June 30, 2019
As a contract holder of the fund, you incur ongoing costs, including management fees; distribution and/or service(12b-1) fees; and other fund expenses. This example is intended to help you understand your ongoing costs (in dollars) of investing in the fund and to compare these costs with the ongoing costs of investing in other mutual funds.
The example is based on an investment of $1,000 invested at the beginning of the period and held for the entire period January 1, 2019 through June 30, 2019.
Actual Expenses
The first line for each share class in the following table provides information about actual account values and actual expenses. You may use the information in this line, together with the amount you invested, to estimate the expenses that you paid over the period. Simply divide your account value by $1,000 (for example, an $8,600 account value divided by $1,000 = 8.6), then multiply the result by the number in the first line under the heading entitled “Expenses Paid During Period” to estimate the expenses you paid on your account during this period.
Hypothetical Example for Comparison Purposes
The second line for each share class in the following table provides information about hypothetical account values and hypothetical expenses based on the fund’s actual expense ratio and an assumed rate of return of 5% per year before expenses, which is not the fund’s actual return. The hypothetical account values and expenses may not be used to estimate the actual ending account balance or expenses you paid for the period. You may use this information to compare the ongoing costs of investing in the fund and other funds. To do so, compare this 5% hypothetical example with the 5% hypothetical examples that appear in the shareholder reports of the other funds.
Please note that the expenses shown in the table are meant to highlight the fund’s ongoing costs only and do not take into account the fees and expenses imposed under the variable contracts through which your investment in the fund is made. Therefore, the second line for each share class in the table is useful in comparing ongoing costs associated with an investment in vehicles (such as the fund) which fund benefits under variable annuity and variable life insurance contracts and to qualified pension and retirement plans only, and will not help you determine the relative total costs of investing in the fund through variable annuity and variable life insurance contracts. If the fees and expenses imposed under the variable contracts were included, your costs would have been higher.
| Share Class | Annualized Expense Ratio | Beginning Account Value 1/01/19 | Ending Account Value 6/30/19 | Expenses Paid During Period (p) 1/01/19-6/30/19 | ||||||||||||||
| Initial Class | Actual | 0.79% | $1,000.00 | $1,243.18 | $4.39 | |||||||||||||
| Hypothetical (h) | 0.79% | $1,000.00 | $1,020.88 | $3.96 | ||||||||||||||
| Service Class | Actual | 1.04% | $1,000.00 | $1,241.08 | $5.78 | |||||||||||||
| Hypothetical (h) | 1.04% | $1,000.00 | $1,019.64 | $5.21 | ||||||||||||||
| (h) | 5% class return per year before expenses. |
| (p) | “Expenses Paid During Period” are equal to each class’s annualized expense ratio, as shown above, multiplied by the average account value over the period, multiplied by 181/365 (to reflect theone-half year period). |
3
Table of Contents
MFS Massachusetts Investors Growth Stock Portfolio
PORTFOLIO OF INVESTMENTS – 6/30/19 (unaudited)
The Portfolio of Investments is a complete list of all securities owned by your fund. It is categorized by broad-based asset classes.
| Issuer | Shares/Par | Value ($) | ||||||
| COMMON STOCKS – 99.8% | ||||||||
| Aerospace – 1.8% | ||||||||
| United Technologies Corp. | 130,252 | $ | 16,958,810 | |||||
|
| |||||||
| Apparel Manufacturers – 6.1% | ||||||||
| Adidas AG | 31,991 | $ | 9,876,348 | |||||
| LVMH Moet Hennessy Louis Vuitton SE | 47,444 | 20,192,954 | ||||||
| NIKE, Inc., “B” | 197,642 | 16,592,046 | ||||||
| VF Corp. | 121,230 | 10,589,440 | ||||||
|
| |||||||
| $ | 57,250,788 | |||||||
|
| |||||||
| Broadcasting – 0.4% | ||||||||
| Walt Disney Co. | 30,774 | $ | 4,297,281 | |||||
|
| |||||||
| Brokerage & Asset Managers – 4.6% | ||||||||
| Blackstone Group LP | 411,705 | $ | 18,287,936 | |||||
| Charles Schwab Corp. | 161,020 | 6,471,394 | ||||||
| CME Group, Inc. | 23,337 | 4,529,945 | ||||||
| TD Ameritrade Holding Corp. | 276,181 | 13,786,956 | ||||||
|
| |||||||
| $ | 43,076,231 | |||||||
|
| |||||||
| Business Services – 12.3% | ||||||||
| Accenture PLC, “A” | 188,234 | $ | 34,779,996 | |||||
| Cognizant Technology Solutions Corp., “A” | 234,635 | 14,873,513 | ||||||
| Equifax, Inc. | 72,614 | 9,820,317 | ||||||
| Experian PLC | 240,987 | 7,296,024 | ||||||
| Fidelity National Information Services, Inc. | 165,365 | 20,286,978 | ||||||
| Fiserv, Inc. (a) | 180,910 | 16,491,756 | ||||||
| Verisk Analytics, Inc., “A” | 86,138 | 12,615,772 | ||||||
|
| |||||||
| $ | 116,164,356 | |||||||
|
| |||||||
| Cable TV – 2.2% | ||||||||
| Comcast Corp., “A” | 482,458 | $ | 20,398,324 | |||||
|
| |||||||
| Chemicals – 1.7% | ||||||||
| PPG Industries, Inc. | 134,842 | $ | 15,737,410 | |||||
|
| |||||||
| Computer Software – 5.1% | ||||||||
| Microsoft Corp. | 357,774 | $ | 47,927,405 | |||||
|
| |||||||
| Computer Software – Systems – 2.6% |
| |||||||
| Apple, Inc. | 123,382 | $ | 24,419,765 | |||||
|
| |||||||
| Construction – 1.8% | ||||||||
| Sherwin-Williams Co. | 36,321 | $ | 16,645,551 | |||||
|
| |||||||
| Consumer Products – 5.8% | ||||||||
| Church & Dwight Co., Inc. | 64,254 | $ | 4,694,397 | |||||
| Colgate-Palmolive Co. | 268,904 | 19,272,350 | ||||||
| Estee Lauder Cos., Inc., “A” | 80,261 | 14,696,592 | ||||||
| L’Oréal | 22,007 | 6,268,553 | ||||||
| Reckitt Benckiser Group PLC | 131,218 | 10,355,022 | ||||||
|
| |||||||
| $ | 55,286,914 | |||||||
|
| |||||||
| Electrical Equipment – 4.3% | ||||||||
| Amphenol Corp., “A” | 143,897 | $ | 13,805,478 | |||||
| Fortive Corp. | 131,847 | 10,748,168 | ||||||
| Mettler-Toledo International, Inc. (a) | 19,170 | 16,102,800 | ||||||
|
| |||||||
| $ | 40,656,446 | |||||||
|
| |||||||
| Issuer | Shares/Par | Value ($) | ||||||
| COMMON STOCKS – continued |
| |||||||
| Electronics – 5.2% | ||||||||
| Analog Devices, Inc. | 133,777 | $ | 15,099,410 | |||||
| Taiwan Semiconductor Manufacturing Co. Ltd., ADR | 284,930 | 11,160,708 | ||||||
| Texas Instruments, Inc. | 200,550 | 23,015,118 | ||||||
|
| |||||||
| $ | 49,275,236 | |||||||
|
| |||||||
| Food & Beverages – 1.7% | ||||||||
| PepsiCo, Inc. | 125,629 | $ | 16,473,731 | |||||
|
| |||||||
| Gaming & Lodging – 2.7% | ||||||||
| Flutter Entertainment PLC | 74,858 | $ | 5,635,505 | |||||
| Marriott International, Inc., “A” | 140,876 | 19,763,494 | ||||||
|
| |||||||
| $ | 25,398,999 | |||||||
|
| |||||||
| Health Maintenance Organizations – 0.8% |
| |||||||
| Cigna Corp. | 48,994 | $ | 7,719,005 | |||||
|
| |||||||
| Insurance – 2.9% | ||||||||
| Aon PLC | 140,798 | $ | 27,171,198 | |||||
|
| |||||||
| Internet – 7.1% | ||||||||
| Alibaba Group Holding Ltd., ADR (a) | 92,629 | $ | 15,695,984 | |||||
| Alphabet, Inc., “A” (a) | 47,914 | 51,881,279 | ||||||
|
| |||||||
| $ | 67,577,263 | |||||||
|
| |||||||
| Leisure & Toys – 1.6% | ||||||||
| Electronic Arts, Inc. (a) | 150,344 | $ | 15,223,833 | |||||
|
| |||||||
| Machinery & Tools – 2.0% | ||||||||
| Nordson Corp. | 132,432 | $ | 18,713,966 | |||||
|
| |||||||
| Medical Equipment – 9.2% | ||||||||
| Abbott Laboratories | 226,523 | $ | 19,050,584 | |||||
| Becton, Dickinson and Co. | 58,849 | 14,830,537 | ||||||
| Danaher Corp. | 102,113 | 14,593,990 | ||||||
| Thermo Fisher Scientific, Inc. | 85,295 | 25,049,436 | ||||||
| Waters Corp. (a) | 64,080 | 13,792,579 | ||||||
|
| |||||||
| $ | 87,317,126 | |||||||
|
| |||||||
| Oil Services – 0.1% | ||||||||
| Schlumberger Ltd. | 20,637 | $ | 820,114 | |||||
|
| |||||||
| Other Banks & Diversified Financials – 5.2% |
| |||||||
| Mastercard, Inc., “A” | 61,499 | $ | 16,268,330 | |||||
| Visa, Inc., “A” | 189,112 | 32,820,388 | ||||||
|
| |||||||
| $ | 49,088,718 | |||||||
|
| |||||||
| Pharmaceuticals – 3.0% | ||||||||
| Elanco Animal Health, Inc. (a) | 450,347 | $ | 15,221,728 | |||||
| Eli Lilly & Co. | 40,304 | 4,465,280 | ||||||
| Zoetis, Inc. | 75,038 | 8,516,063 | ||||||
|
| |||||||
| $ | 28,203,071 | |||||||
|
| |||||||
| Printing & Publishing – 1.8% | ||||||||
| Moody’s Corp. | 89,846 | $ | 17,547,822 | |||||
|
| |||||||
| Railroad & Shipping – 1.8% | ||||||||
| Union Pacific Corp. | 98,517 | $ | 16,660,210 | |||||
|
| |||||||
4
Table of Contents
MFS Massachusetts Investors Growth Stock Portfolio
Portfolio of Investments (unaudited) – continued
| Issuer | Shares/Par | Value ($) | ||||||
| COMMON STOCKS – continued |
| |||||||
| Restaurants – 2.0% | ||||||||
| Starbucks Corp. | 230,788 | $ | 19,346,958 | |||||
|
| |||||||
| Specialty Chemicals – 1.5% | ||||||||
| Ecolab, Inc. | 69,892 | $ | 13,799,477 | |||||
|
| |||||||
| Specialty Stores – 2.5% | ||||||||
| AutoZone, Inc. (a) | 5,258 | $ | 5,781,013 | |||||
| TJX Cos., Inc. | 331,231 | 17,515,496 | ||||||
|
| |||||||
| $ | 23,296,509 | |||||||
|
| |||||||
| Total Common Stocks (Identified Cost, $514,629,279) | $ | 942,452,517 | ||||||
|
| |||||||
| INVESTMENT COMPANIES (h) – 0.3% |
| |||||||
| Money Market Funds – 0.3% |
| |||||||
| MFS Institutional Money Market Portfolio, 2.42% (v) (Identified Cost, $2,536,365) | 2,536,616 | $ | 2,536,869 | |||||
|
| |||||||
| OTHER ASSETS, LESS LIABILITIES – (0.1)% | (788,972 | ) | ||||||
|
| |||||||
| NET ASSETS – 100.0% | $ | 944,200,414 | ||||||
|
| |||||||
| (a) | Non-income producing security. |
| (h) | An affiliated issuer, which may be considered one in which the fund owns 5% or more of the outstanding voting securities, or a company which is under common control. At period end, the aggregate values of the fund’s investments in affiliated issuers and in unaffiliated issuers were $2,536,869 and $942,452,517, respectively. |
| (v) | Affiliated issuer that is available only to investment companies managed by MFS. The rate quoted for the MFS Institutional Money Market Portfolio is the annualizedseven-day yield of the fund at period end. |
The following abbreviations are used in this report and are defined:
| ADR | American Depositary Receipt |
See Notes to Financial Statements
5
Table of Contents
MFS Massachusetts Investors Growth Stock Portfolio
FINANCIAL STATEMENTS | STATEMENT OF ASSETS AND LIABILITIES (unaudited)
This statement represents your fund’s balance sheet, which details the assets and liabilities comprising the total value of the fund.
At 6/30/19 | ||||
Assets | ||||
Investments in unaffiliated issuers, at value (identified cost, $514,629,279) | $942,452,517 | |||
Investments in affiliated issuers, at value (identified cost, $2,536,365) | 2,536,869 | |||
Cash | 292 | |||
Receivables for | ||||
Fund shares sold | 32,617 | |||
Dividends | 691,103 | |||
Other assets | 2,583 | |||
Total assets | $945,715,981 | |||
Liabilities | ||||
Payables for | ||||
Fund shares reacquired | $1,271,011 | |||
Payable to affiliates | ||||
Investment adviser | 81,885 | |||
Administrative services fee | 1,488 | |||
Shareholder servicing costs | 134 | |||
Distribution and/or service fees | 10,162 | |||
Payable for independent Trustees’ compensation | 100 | |||
Accrued expenses and other liabilities | 150,787 | |||
Total liabilities | $1,515,567 | |||
Net assets | $944,200,414 | |||
Net assets consist of | ||||
Paid-in capital | $399,581,563 | |||
Total distributable earnings (loss) | 544,618,851 | |||
Net assets | $944,200,414 | |||
Shares of beneficial interest outstanding | 43,399,255 | |||
| Net assets | Shares outstanding | Net asset value per share | ||||||||||
Initial Class | $571,487,340 | 26,123,337 | $21.88 | |||||||||
Service Class | 372,713,074 | 17,275,918 | 21.57 | |||||||||
See Notes to Financial Statements
6
Table of Contents
MFS Massachusetts Investors Growth Stock Portfolio
FINANCIAL STATEMENTS | STATEMENT OF OPERATIONS (unaudited)
This statement describes how much your fund earned in investment income and accrued in expenses. It also describes any gains and/or losses generated by fund operations.
Six months ended 6/30/19 | ||||
Net investment income (loss) | ||||
Income | ||||
Dividends | $6,373,594 | |||
Income on securities loaned | 134,056 | |||
Dividends from affiliated issuers | 82,872 | |||
Other | 17,999 | |||
Foreign taxes withheld | (145,001 | ) | ||
Total investment income | $6,463,520 | |||
Expenses | ||||
Management fee | $3,380,428 | |||
Distribution and/or service fees | 443,175 | |||
Shareholder servicing costs | 11,137 | |||
Administrative services fee | 68,216 | |||
Independent Trustees’ compensation | 10,351 | |||
Custodian fee | 25,144 | |||
Shareholder communications | 35,860 | |||
Audit and tax fees | 29,126 | |||
Legal fees | 3,766 | |||
Miscellaneous | 21,398 | |||
Total expenses | $4,028,601 | |||
Reduction of expenses by investment adviser | (43,444 | ) | ||
Net expenses | $3,985,157 | |||
Net investment income (loss) | $2,478,363 | |||
Realized and unrealized gain (loss) | ||||
Realized gain (loss) (identified cost basis) | ||||
Unaffiliated issuers | $39,386,731 | |||
Affiliated issuers | 39 | |||
Foreign currency | (2,060 | ) | ||
Net realized gain (loss) | $39,384,710 | |||
Change in unrealized appreciation or depreciation | ||||
Unaffiliated issuers | $150,924,298 | |||
Affiliated issuers | 504 | |||
Translation of assets and liabilities in foreign currencies | (232 | ) | ||
Net unrealized gain (loss) | $150,924,570 | |||
Net realized and unrealized gain (loss) | $190,309,280 | |||
Change in net assets from operations | $192,787,643 | |||
See Notes to Financial Statements
7
Table of Contents
MFS Massachusetts Investors Growth Stock Portfolio
FINANCIAL STATEMENTS | STATEMENTS OF CHANGES IN NET ASSETS
These statements describe the increases and/or decreases in net assets resulting from operations, any distributions, and any shareholder transactions.
| Six months ended 6/30/19 | Year ended 12/31/18 | |||||||
| (unaudited) | ||||||||
Change in net assets | ||||||||
From operations | ||||||||
Net investment income (loss) | $2,478,363 | $5,083,246 | ||||||
Net realized gain (loss) | 39,384,710 | 71,408,277 | ||||||
Net unrealized gain (loss) | 150,924,570 | (63,328,636 | ) | |||||
Change in net assets from operations | $192,787,643 | $13,162,887 | ||||||
Total distributions to shareholders | $— | $(57,933,374 | ) | |||||
Change in net assets from fund share transactions | $(62,320,576 | ) | $(73,917,493 | ) | ||||
Total change in net assets | $130,467,067 | $(118,687,980 | ) | |||||
Net assets | ||||||||
At beginning of period | 813,733,347 | 932,421,327 | ||||||
At end of period | $944,200,414 | $813,733,347 | ||||||
See Notes to Financial Statements
8
Table of Contents
MFS Massachusetts Investors Growth Stock Portfolio
FINANCIAL STATEMENTS | FINANCIAL HIGHLIGHTS
The financial highlights table is intended to help you understand the fund’s financial performance for the semiannual period and the past 5 fiscal years. Certain information reflects financial results for a single fund share. The total returns in the table represent the rate that an investor would have earned (or lost) on an investment in the fund share class (assuming reinvestment of all distributions) held for the entire period.
| Initial Class | Six months ended 6/30/19 | Year ended | ||||||||||||||||||||||
| 12/31/18 | 12/31/17 | 12/31/16 | 12/31/15 | 12/31/14 | ||||||||||||||||||||
| (unaudited) | ||||||||||||||||||||||||
Net asset value, beginning of period | $17.60 | $18.60 | $15.38 | $16.38 | $17.61 | $17.31 | ||||||||||||||||||
| Income (loss) from investment operations | ||||||||||||||||||||||||
Net investment income (loss) (d) | $0.07 | $0.13 | $0.11 | $0.11 | (c) | $0.10 | $0.14 | |||||||||||||||||
Net realized and unrealized gain (loss) | 4.21 | 0.16 | 4.16 | 0.95 | (0.21 | ) | 1.77 | |||||||||||||||||
Total from investment operations | $4.28 | $0.29 | $4.27 | $1.06 | $(0.11 | ) | $1.91 | |||||||||||||||||
| Less distributions declared to shareholders | ||||||||||||||||||||||||
From net investment income | $— | $(0.12 | ) | $(0.12 | ) | $(0.10 | ) | $(0.09 | ) | $(0.10 | ) | |||||||||||||
From net realized gain | — | (1.17 | ) | (0.93 | ) | (1.96 | ) | (1.03 | ) | (1.51 | ) | |||||||||||||
Total distributions declared to shareholders | $— | $(1.29 | ) | $(1.05 | ) | $(2.06 | ) | $(1.12 | ) | $(1.61 | ) | |||||||||||||
Net asset value, end of period (x) | $21.88 | $17.60 | $18.60 | $15.38 | $16.38 | $17.61 | ||||||||||||||||||
Total return (%) (k)(r)(s)(x) | 24.32 | (n) | 0.81 | 28.42 | 6.08 | (c) | (0.12 | ) | 11.51 | |||||||||||||||
| Ratios (%) (to average net assets) and Supplemental data: | ||||||||||||||||||||||||
Expenses before expense reductions (f) | 0.80 | (a) | 0.80 | 0.81 | 0.78 | (c) | 0.79 | 0.80 | ||||||||||||||||
Expenses after expense reductions (f) | 0.79 | (a) | 0.79 | 0.80 | 0.77 | (c) | 0.79 | 0.80 | ||||||||||||||||
Net investment income (loss) | 0.65 | (a) | 0.65 | 0.66 | 0.70 | (c) | 0.56 | 0.81 | ||||||||||||||||
Portfolio turnover | 9 | (n) | 23 | 21 | 24 | 27 | 23 | |||||||||||||||||
Net assets at end of period (000 omitted) | $571,487 | $493,783 | $562,471 | $500,924 | $537,645 | $542,830 | ||||||||||||||||||
| Service Class | Six months ended 6/30/19 | Year ended | ||||||||||||||||||||||
| 12/31/18 | 12/31/17 | 12/31/16 | 12/31/15 | 12/31/14 | ||||||||||||||||||||
| (unaudited) | ||||||||||||||||||||||||
Net asset value, beginning of period | $17.38 | $18.38 | $15.21 | $16.22 | $17.48 | $17.19 | ||||||||||||||||||
| Income (loss) from investment operations | ||||||||||||||||||||||||
Net investment income (loss) (d) | $0.04 | $0.08 | $0.07 | $0.07 | (c) | $0.06 | $0.10 | |||||||||||||||||
Net realized and unrealized gain (loss) | 4.15 | 0.16 | 4.10 | 0.94 | (0.21 | ) | 1.75 | |||||||||||||||||
Total from investment operations | $4.19 | $0.24 | $4.17 | $1.01 | $(0.15 | ) | $1.85 | |||||||||||||||||
| Less distributions declared to shareholders | ||||||||||||||||||||||||
From net investment income | $— | $(0.07 | ) | $(0.07 | ) | $(0.06 | ) | �� | $(0.08 | ) | $(0.05 | ) | ||||||||||||
From net realized gain | — | (1.17 | ) | (0.93 | ) | (1.96 | ) | (1.03 | ) | (1.51 | ) | |||||||||||||
Total distributions declared to shareholders | $— | $(1.24 | ) | $(1.00 | ) | $(2.02 | ) | $(1.11 | ) | $(1.56 | ) | |||||||||||||
Net asset value, end of period (x) | $21.57 | $17.38 | $18.38 | $15.21 | $16.22 | $17.48 | ||||||||||||||||||
Total return (%) (k)(r)(s)(x) | 24.11 | (n) | 0.58 | 28.10 | 5.84 | (c) | (0.33 | ) | 11.23 | |||||||||||||||
| Ratios (%) (to average net assets) and Supplemental data: | ||||||||||||||||||||||||
Expenses before expense reductions (f) | 1.04 | (a) | 1.05 | 1.06 | 1.03 | (c) | 1.04 | 1.05 | ||||||||||||||||
Expenses after expense reductions (f) | 1.04 | (a) | 1.04 | 1.05 | 1.02 | (c) | 1.03 | 1.05 | ||||||||||||||||
Net investment income (loss) | 0.40 | (a) | 0.40 | 0.41 | 0.45 | (c) | 0.35 | 0.55 | ||||||||||||||||
Portfolio turnover | 9 | (n) | 23 | 21 | 24 | 27 | 23 | |||||||||||||||||
Net assets at end of period (000 omitted) | $372,713 | $319,950 | $369,950 | $328,673 | $337,742 | $50,731 | ||||||||||||||||||
See Notes to Financial Statements
9
Table of Contents
MFS Massachusetts Investors Growth Stock Portfolio
Financial Highlights – continued
| (a) | Annualized. |
| (c) | Amount reflects aone-time reimbursement of expenses by the custodian (or former custodian) without which net investment income and performance would be lower and expenses would be higher. |
| (d) | Per share data is based on average shares outstanding. |
| (f) | Ratios do not reflect reductions from fees paid indirectly, if applicable. |
| (k) | The total return does not reflect expenses that apply to separate accounts. Inclusion of these charges would reduce the total return figures for all periods shown. |
| (n) | Not annualized. |
| (r) | Certain expenses have been reduced without which performance would have been lower. |
| (s) | From time to time the fund may receive proceeds from litigation settlements, without which performance would be lower. |
| (x) | The net asset values and total returns have been calculated on net assets which include adjustments made in accordance with U.S. generally accepted accounting principles required at period end for financial reporting purposes. |
See Notes to Financial Statements
10
Table of Contents
MFS Massachusetts Investors Growth Stock Portfolio
NOTES TO FINANCIAL STATEMENTS (unaudited)
| (1) | Business and Organization |
MFS Massachusetts Investors Growth Stock Portfolio (the fund) is a diversified series of MFS Variable Insurance Trust II (the trust). The trust is organized as a Massachusetts business trust and is registered under the Investment Company Act of 1940, as amended, as anopen-end management investment company. The shareholders of each series of the trust are separate accounts of insurance companies, which offer variable annuity and/or life insurance products, and qualified retirement and pension plans.
The fund is an investment company and accordingly follows the investment company accounting and reporting guidance of the Financial Accounting Standards Board (FASB) Accounting Standards Codification Topic 946 Financial Services – Investment Companies.
| (2) | Significant Accounting Policies |
General – The preparation of financial statements in conformity with U.S. generally accepted accounting principles requires management to make estimates and assumptions that affect the reported amounts of assets and liabilities, and disclosure of contingent assets and liabilities at the date of the financial statements and the reported amounts of increases and decreases in net assets from operations during the reporting period. Actual results could differ from those estimates. In the preparation of these financial statements, management has evaluated subsequent events occurring after the date of the fund’s Statement of Assets and Liabilities through the date that the financial statements were issued.
Balance Sheet Offsetting– The fund’s accounting policy with respect to balance sheet offsetting is that, absent an event of default by the counterparty or a termination of the agreement, the International Swaps and Derivatives Association (ISDA) Master Agreement, or similar agreement, does not result in an offset of reported amounts of financial assets and financial liabilities in the Statement of Assets and Liabilities across transactions between the fund and the applicable counterparty. The fund’s right to setoff may be restricted or prohibited by the bankruptcy or insolvency laws of the particular jurisdiction to which a specific master netting agreement counterparty is subject. Balance sheet offsetting disclosures, to the extent applicable to the fund, have been included in the fund’s Significant Accounting Policies note under the captions for each of the fund’sin-scope financial instruments and transactions.
Investment Valuations– Equity securities, including restricted equity securities, are generally valued at the last sale or official closing price on their primary market or exchange as provided by a third-party pricing service. Equity securities, for which there were no sales reported that day, are generally valued at the last quoted daily bid quotation on their primary market or exchange as provided by a third-party pricing service. Short-term instruments with a maturity at issuance of 60 days or less may be valued at amortized cost, which approximates market value.Open-end investment companies are generally valued at net asset value per share. Securities and other assets generally valued on the basis of information from a third-party pricing service may also be valued at a broker/dealer bid quotation. In determining values, third-party pricing services can utilize both transaction data and market information such as yield, quality, coupon rate, maturity, type of issue, trading characteristics, and other market data. The values of foreign securities and other assets and liabilities expressed in foreign currencies are converted to U.S. dollars using the mean of bid and asked prices for rates provided by a third-party pricing service.
The Board of Trustees has delegated primary responsibility for determining or causing to be determined the value of the fund’s investments (including any fair valuation) to the adviser pursuant to valuation policies and procedures approved by the Board. If the adviser determines that reliable market quotations are not readily available, investments are valued at fair value as determined in good faith by the adviser in accordance with such procedures under the oversight of the Board of Trustees. Under the fund’s valuation policies and procedures, market quotations are not considered to be readily available for most types of debt instruments and floating rate loans and many types of derivatives. These investments are generally valued at fair value based on information from third-party pricing services. In addition, investments may be valued at fair value if the adviser determines that an investment’s value has been materially affected by events occurring after the close of the exchange or market on which the investment is principally traded (such as foreign exchange or market) and prior to the determination of the fund’s net asset value, or after the halt of trading of a specific security where trading does not resume prior to the close of the exchange or market on which the security is principally traded. Events that occur after foreign markets close (such as developments in foreign markets and significant movements in the U.S. markets) and prior to the determination of the fund’s net asset value may be deemed to have a material effect on the value of securities traded in foreign markets. Accordingly, the fund’s foreign equity securities may often be valued at fair value. The adviser generally relies on third-party pricing services or other information (such as the correlation with price movements of similar securities in the same or other markets; the type, cost and investment characteristics of the security; the business and financial condition of the issuer; and trading and other market data) to assist in determining whether to fair value and at what value to fair value an investment. The value of an investment for purposes of calculating the fund’s net asset value can differ depending on the source and method used to determine value. When fair valuation is used, the value of an investment used to determine the fund’s net asset value may differ from quoted or published prices for the same investment. There can be no assurance that the fund could obtain the fair value assigned to an investment if it were to sell the investment at the same time at which the fund determines its net asset value per share.
11
Table of Contents
MFS Massachusetts Investors Growth Stock Portfolio
Notes to Financial Statements (unaudited) – continued
Various inputs are used in determining the value of the fund’s assets or liabilities. These inputs are categorized into three broad levels. In certain cases, the inputs used to measure fair value may fall into different levels of the fair value hierarchy. In such cases, an investment’s level within the fair value hierarchy is based on the lowest level of input that is significant to the fair value measurement. The fund’s assessment of the significance of a particular input to the fair value measurement in its entirety requires judgment, and considers factors specific to the investment. Level 1 includes unadjusted quoted prices in active markets for identical assets or liabilities. Level 2 includes other significant observable market-based inputs (including quoted prices for similar securities, interest rates, prepayment speed, and credit risk). Level 3 includes unobservable inputs, which may include the adviser’s own assumptions in determining the fair value of investments. The following is a summary of the levels used as of June 30, 2019 in valuing the fund’s assets or liabilities:
| Financial Instruments | Level 1 | Level 2 | Level 3 | Total | ||||||||||||
| Equity Securities | $942,452,517 | $— | $— | $942,452,517 | ||||||||||||
| Mutual Funds | 2,536,869 | — | — | 2,536,869 | ||||||||||||
| Total | $944,989,386 | $— | $— | $944,989,386 | ||||||||||||
For further information regarding security characteristics, see the Portfolio of Investments.
Foreign Currency Translation– Purchases and sales of foreign investments, income, and expenses are converted into U.S. dollars based upon currency exchange rates prevailing on the respective dates of such transactions or on the reporting date for foreign denominated receivables and payables. Gains and losses attributable to foreign currency exchange rates on sales of securities are recorded for financial statement purposes as net realized gains and losses on investments. Gains and losses attributable to foreign exchange rate movements on receivables, payables, income and expenses are recorded for financial statement purposes as foreign currency transaction gains and losses. That portion of both realized and unrealized gains and losses on investments that results from fluctuations in foreign currency exchange rates is not separately disclosed.
Security Loans– Under its Securities Lending Agency Agreement with the fund, State Street Bank and Trust Company, as lending agent, loans the securities of the fund to certain qualified institutions (the “Borrowers”) approved by the fund. Security loans can be terminated at the discretion of either the lending agent or the fund and the related securities must be returned within the earlier of the standard trade settlement period for such securities or within three business days. The loans are collateralized by cash and/or U.S. Treasury and federal agency obligations in an amount typically at least equal to the market value of the securities loaned. On loans collateralized by cash, the cash collateral is invested in a money market fund. The market value of the loaned securities is determined at the close of business of the fund and any additional required collateral is delivered to the fund on the next business day. The lending agent provides the fund with indemnification against Borrower default. In the event of Borrower default, the lending agent will, for the benefit of the fund, either purchase securities identical to those loaned or, when such purchase is commercially impracticable, pay the fund the market value of the loaned securities. In return, the lending agent assumes the fund’s rights to the related collateral. If the collateral value is less than the cost to purchase identical securities, the lending agent is responsible for the shortfall, but only to the extent that such shortfall is not due to a decline in collateral value resulting from collateral reinvestment for which the fund bears the risk of loss. A portion of the income generated upon investment of the collateral is remitted to the Borrowers, and the remainder is allocated between the fund and the lending agent. On loans collateralized by U.S. Treasury and/or federal agency obligations, a fee is received from the Borrower, and is allocated between the fund and the lending agent. Income from securities lending is separately reported in the Statement of Operations. The dividend and interest income earned on the securities loaned is accounted for in the same manner as other dividend and interest income. At June 30, 2019, there were no securities on loan or collateral outstanding.
Indemnifications– Under the fund’s organizational documents, its officers and Trustees may be indemnified against certain liabilities and expenses arising out of the performance of their duties to the fund. Additionally, in the normal course of business, the fund enters into agreements with service providers that may contain indemnification clauses. The fund’s maximum exposure under these agreements is unknown as this would involve future claims that may be made against the fund that have not yet occurred.
Investment Transactions and Income– Investment transactions are recorded on the trade date. Interest income is recorded on the accrual basis. Dividends received in cash are recorded on theex-dividend date. Certain dividends from foreign securities will be recorded when the fund is informed of the dividend if such information is obtained subsequent to theex-dividend date. Dividend payments received in additional securities are recorded on theex-dividend date in an amount equal to the value of the security on such date.
The fund may receive proceeds from litigation settlements. Any proceeds received from litigation involving portfolio holdings are reflected in the Statement of Operations in realized gain/loss if the security has been disposed of by the fund or in unrealized gain/loss if the security is still held by the fund. Any other proceeds from litigation not related to portfolio holdings are reflected as other income in the Statement of Operations.
12
Table of Contents
MFS Massachusetts Investors Growth Stock Portfolio
Notes to Financial Statements (unaudited) – continued
Tax Matters and Distributions– The fund intends to qualify as a regulated investment company, as defined under Subchapter M of the Internal Revenue Code, and to distribute all of its taxable income, including realized capital gains. As a result, no provision for federal income tax is required. The fund’s federal tax returns, when filed, will remain subject to examination by the Internal Revenue Service for a three year period. Management has analyzed the fund’s tax positions taken on federal and state tax returns for all open tax years and does not believe that there are any uncertain tax positions that require recognition of a tax liability. Foreign taxes, if any, have been accrued by the fund in the accompanying financial statements in accordance with the applicable foreign tax law. Foreign income taxes may be withheld by certain countries in which the fund invests. Additionally, capital gains realized by the fund on securities issued in or by certain foreign countries may be subject to capital gains tax imposed by those countries.
Distributions to shareholders are recorded on theex-dividend date. Income and capital gain distributions are determined in accordance with income tax regulations, which may differ from U.S. generally accepted accounting principles. Certain capital accounts in the financial statements are periodically adjusted for permanent differences in order to reflect their tax character. These adjustments have no impact on net assets or net asset value per share. Temporary differences which arise from recognizing certain items of income, expense, gain or loss in different periods for financial statement and tax purposes will reverse at some time in the future. Distributions in excess of net investment income or net realized gains are temporary overdistributions for financial statement purposes resulting from differences in the recognition or classification of income or distributions for financial statement and tax purposes.
Book/tax differences primarily relate to wash sale loss deferrals.
The tax character of distributions declared to shareholders for the last fiscal year is as follows:
| Year ended 12/31/18 | ||||
| Ordinary income (including any short-term capital gains) | $9,646,280 | |||
| Long-term capital gains | 48,287,094 | |||
| Total distributions | $57,933,374 | |||
The federal tax cost and the tax basis components of distributable earnings were as follows:
| As of 6/30/19 | ||||
| Cost of investments | $517,165,644 | |||
| Gross appreciation | 432,978,704 | |||
| Gross depreciation | (5,154,962 | ) | ||
| Net unrealized appreciation (depreciation) | $427,823,742 | |||
| As of 12/31/18 | ||||
| Undistributed ordinary income | 9,803,031 | |||
| Undistributed long-term capital gain | 67,455,400 | |||
| Other temporary differences | (18 | ) | ||
| Net unrealized appreciation (depreciation) | 274,572,795 | |||
The aggregate cost above includes prior fiscal year end tax adjustments, if applicable.
Multiple Classes of Shares of Beneficial Interest– The fund offers multiple classes of shares, which differ in their respective distribution and/or service fees. The fund’s income, realized and unrealized gain (loss), and common expenses are allocated to shareholders based on the daily net assets of each class. Dividends are declared separately for each class. Differences in per share dividend rates are generally due to differences in separate class expenses. The fund’s distributions declared to shareholders as reported in the Statements of Changes in Net Assets are presented by class as follows:
| From net investment income | From net realized gain | |||||||||||||||
| Six months ended 6/30/19 | Year ended 12/31/18 | Six months ended 6/30/19 | Year ended 12/31/18 | |||||||||||||
| Initial Class | $— | $3,178,874 | $— | $32,343,736 | ||||||||||||
| Service Class | — | 1,200,214 | — | 21,210,550 | ||||||||||||
| Total | $— | $4,379,088 | $— | $53,554,286 | ||||||||||||
| (3) | Transactions with Affiliates |
Investment Adviser– The fund has an investment advisory agreement with MFS to provide overall investment management and related administrative services and facilities to the fund. The management fee is computed daily and paid monthly at the following annual rates based on the fund’s average daily net assets:
| Up to $1 billion | 0.75% | |||
| In excess of $1 billion | 0.65% |
13
Table of Contents
MFS Massachusetts Investors Growth Stock Portfolio
Notes to Financial Statements (unaudited) – continued
MFS has agreed in writing to reduce its management fee by a specified amount if certain MFS mutual fund assets exceed thresholds agreed to by MFS and the fund’s Board of Trustees. For the six months ended June 30, 2019, this management fee reduction amounted to $43,444, which is included in the reduction of total expenses in the Statement of Operations. The management fee incurred for the six months ended June 30, 2019 was equivalent to an annual effective rate of 0.74% of the fund’s average daily net assets.
The investment adviser has agreed in writing to pay a portion of the fund’s total annual operating expenses, excluding interest, taxes, extraordinary expenses, brokerage and transaction costs, and investment-related expenses, such that total annual operating expenses do not exceed 0.82% of average daily net assets for the Initial Class shares and 1.07% of average daily net assets for the Service Class shares. This written agreement will continue until modified by the fund’s Board of Trustees, but such agreement will continue at least until April 30, 2021. For the six months ended June 30, 2019, the fund’s actual operating expenses did not exceed the limit and therefore, the investment adviser did not pay any portion of the fund’s expenses related to this agreement.
Distributor– MFS Fund Distributors, Inc. (MFD), a wholly-owned subsidiary of MFS, is the distributor of shares of the fund. The Trustees have adopted a distribution plan for the Service Class shares pursuant to Rule12b-1 under the Investment Company Act of 1940.
The fund’s distribution plan provides that the fund will pay MFD distribution and/or service fees equal to 0.25% per annum of its average daily net assets attributable to Service Class shares as partial consideration for services performed and expenses incurred by MFD and financial intermediaries (including participating insurance companies that invest in the fund to fund variable annuity and variable life insurance contracts, sponsors of qualified retirement and pension plans that invest in the fund, and affiliates of these participating insurance companies and plan sponsors) in connection with the sale and distribution of the Service Class shares. MFD may subsequently pay all, or a portion, of the distribution and/or service fees to financial intermediaries.
Shareholder Servicing Agent– MFS Service Center, Inc. (MFSC), a wholly-owned subsidiary of MFS, receives a fee from the fund for its services as shareholder servicing agent. For the six months ended June 30, 2019, the fee was $10,663, which equated to 0.0024% annually of the fund’s average daily net assets. MFSC also receives payment from the fund forout-of-pocket expenses paid by MFSC on behalf of the fund. For the six months ended June 30, 2019, these costs amounted to $474.
Administrator– MFS provides certain financial, legal, shareholder communications, compliance, and other administrative services to the fund. Under an administrative services agreement, the fund reimburses MFS the costs incurred to provide these services. The fund is charged an annual fixed amount of $17,500 plus a fee based on average daily net assets. The administrative services fee incurred for the six months ended June 30, 2019 was equivalent to an annual effective rate of 0.0151% of the fund’s average daily net assets.
Trustees’ and Officers’ Compensation– The fund pays compensation to independent Trustees in the form of a retainer, attendance fees, and additional compensation to Board and Committee chairpersons. The fund does not pay compensation directly to Trustees or officers of the fund who are also officers of the investment adviser, all of whom receive remuneration from MFS for their services to the fund. Certain officers and Trustees of the fund are officers or directors of MFS, MFD, and MFSC.
Other– This fund and certain other funds managed by MFS (the funds) had entered into a service agreement (the ISO Agreement) which provided for payment of fees solely by the funds to Tarantino LLC in return for the provision of services of an Independent Senior Officer (ISO) for the funds. Frank L. Tarantino served as the ISO and was an officer of the funds and the sole member of Tarantino LLC. Effective June 30, 2019, Mr. Tarantino retired from his position as ISO for the funds, and the ISO Agreement was terminated. For the six months ended June 30, 2019, the fee paid by the fund under this agreement was $1,063 and is included in “Miscellaneous” expense in the Statement of Operations. MFS had agreed to bear all expenses associated with office space, other administrative support, and supplies provided to the ISO.
The fund invests in the MFS Institutional Money Market Portfolio which is managed by MFS and seeks current income consistent with preservation of capital and liquidity. This money market fund does not pay a management fee to MFS.
The fund is permitted to engage in purchase and sale transactions with funds and accounts for which MFS serves as investment adviser orsub-adviser (“cross-trades”) pursuant to a policy adopted by the Board of Trustees. This policy has been designed to ensure that cross-trades conducted by the fund comply with Rule17a-7 under the Investment Company Act of 1940. During the six months ended June 30, 2019, the fund engaged in sale transactions pursuant to this policy, which amounted to $97,678. The sales transactions resulted in net realized gains (losses) of $23,358.
The adviser has voluntarily undertaken to reimburse the fund from its own resources on a quarterly basis for the cost of investment research embedded in the cost of the fund’s securities trades. This agreement may be rescinded at any time. For the six months ended June 30, 2019, this reimbursement amounted to $17,854, which is included in “Other” income in the Statement of Operations.
14
Table of Contents
MFS Massachusetts Investors Growth Stock Portfolio
Notes to Financial Statements (unaudited) – continued
| (4) | Portfolio Securities |
For the six months ended June 30, 2019, purchases and sales of investments, other than short-term obligations, aggregated $84,295,272 and $138,328,959, respectively.
| (5) | Shares of Beneficial Interest |
The fund’s Declaration of Trust permits the Trustees to issue an unlimited number of full and fractional shares of beneficial interest. Transactions in fund shares were as follows:
| Six months ended 6/30/19 | Year ended 12/31/18 | |||||||||||||||
| Shares | Amount | Shares | Amount | |||||||||||||
| Shares sold | ||||||||||||||||
Initial Class | 278,427 | $5,687,963 | 382,702 | $7,410,077 | ||||||||||||
Service Class | 609,438 | 12,154,129 | 772,807 | 14,681,490 | ||||||||||||
| 887,865 | $17,842,092 | 1,155,509 | $22,091,567 | |||||||||||||
| Shares issued to shareholders in reinvestment of distributions | ||||||||||||||||
Initial Class | — | $— | 1,805,928 | $35,522,610 | ||||||||||||
Service Class | — | — | 1,152,817 | 22,410,764 | ||||||||||||
| — | $— | 2,958,745 | $57,933,374 | |||||||||||||
| Shares reacquired | ||||||||||||||||
Initial Class | (2,209,781 | ) | $(45,075,957 | ) | (4,374,590 | ) | $(84,354,144 | ) | ||||||||
Service Class | (1,743,749 | ) | (35,086,711 | ) | (3,641,613 | ) | (69,588,290 | ) | ||||||||
| (3,953,530 | ) | $(80,162,668 | ) | (8,016,203 | ) | $(153,942,434 | ) | |||||||||
| Net change | ||||||||||||||||
Initial Class | (1,931,354 | ) | $(39,387,994 | ) | (2,185,960 | ) | $(41,421,457 | ) | ||||||||
Service Class | (1,134,311 | ) | (22,932,582 | ) | (1,715,989 | ) | (32,496,036 | ) | ||||||||
| (3,065,665 | ) | $(62,320,576 | ) | (3,901,949 | ) | $(73,917,493 | ) | |||||||||
| (6) | Line of Credit |
The fund and certain other funds managed by MFS participate in a $1.25 billion unsecured committed line of credit, subject to a $1 billion sublimit, provided by a syndicate of banks under a credit agreement. Borrowings may be made for temporary financing needs. Interest is charged to each fund, based on its borrowings, generally at a rate equal to the highest of one month LIBOR, the Federal Funds Effective Rate and the Overnight Bank Funding Rate, plus an agreed upon spread. A commitment fee, based on the
average daily, unused portion of the committed line of credit, is allocated among the participating funds. In addition, the fund and other funds managed by MFS have established unsecured uncommitted borrowing arrangements with certain banks for temporary financing needs. Interest is charged to each fund, based on its borrowings, at rates equal to customary reference rates plus an agreed upon spread. For the six months ended June 30, 2019, the fund’s commitment fee and interest expense were $2,585 and $0, respectively, and are included in “Miscellaneous” expense in the Statement of Operations.
| (7) | Investments in Affiliated Issuers |
An affiliated issuer may be considered one in which the fund owns 5% or more of the outstanding voting securities, or a company which is under common control. For the purposes of this report, the following were affiliated issuers:
| Affiliated Issuers | Beginning Value | Purchases | Sales Proceeds | Realized Gain (Loss) | Change in Unrealized Appreciation or Depreciation | Ending Value | ||||||||||||||||||
| MFS Institutional Money Market Portfolio | $6,790,527 | $85,679,832 | $89,934,033 | $39 | $504 | $2,536,869 | ||||||||||||||||||
| Affiliated Issuers | Dividend Income | Capital Gain Distributions | ||||||||||||||||||||||
| MFS Institutional Money Market Portfolio |
| $82,872 | $— | |||||||||||||||||||||
15
Table of Contents
MFS Massachusetts Investors Growth Stock Portfolio
PROXY VOTING POLICIES AND INFORMATION
MFS votes proxies on behalf of the fund pursuant to proxy voting policies and procedures that are available without charge, upon request, by calling 1-800-225-2606, by visitingmfs.com/proxyvoting, or by visiting the SEC’s Web site athttp://www.sec.gov.
Information regarding how the fund voted proxies relating to portfolio securities during the most recent twelve-month period ended June 30 is available by August 31 of each year without charge by visitingmfs.com/proxyvoting, or by visiting the SEC’s Web site athttp://www.sec.gov.
QUARTERLY PORTFOLIO DISCLOSURE
The fund files a complete schedule of portfolio holdings with the SEC for the first and third quarters of each fiscal year on Form N-Q or as an exhibit to its reports on Form N-PORT (for first and third fiscal quarters ending March 31, 2019 or after). The fund’sForm N-Q or Form N-PORT reports are available on the SEC’s website athttp://www.sec.gov.A shareholder can obtain the portfolio holdings report for the first and third quarters of the fund’s fiscal year atmfs.com/vit2 by choosing the fund’s name and then selecting the “Resources” tab and clicking on “Prospectus and Reports”.
From time to time, MFS may post important information about the fund or the MFS funds on the MFS web site (mfs.com). This information is available athttps://www.mfs.com/en-us/what-we-do/announcements.htmlor atmfs.com/vit2 by choosing the fund’s name.
INFORMATION ABOUT FUND CONTRACTS AND LEGAL CLAIMS
The fund has entered into contractual arrangements with an investment adviser, administrator, distributor, shareholder servicing agent, 529 program manager (if applicable), and custodian who each provide services to the fund. Unless expressly stated otherwise, shareholders are not parties to, or intended beneficiaries of these contractual arrangements, and these contractual arrangements are not intended to create any shareholder right to enforce them against the service providers or to seek any remedy under them against the service providers, either directly or on behalf of the fund.
Under the Trust’s By-Laws and Declaration of Trust, any claims asserted against or on behalf of the MFS Funds, including claims against Trustees and Officers, must be brought in state and federal courts located within the Commonwealth of Massachusetts.
16
Table of Contents
Table of Contents
Semiannual Report
June 30, 2019

MFS® Research International Portfolio

MFS® Variable Insurance Trust II
Beginning on January 1, 2021, as permitted by regulations adopted by the U.S. Securities and Exchange Commission, the insurance company that offers your contract may determine that it will no longer send you paper copies of the fund’s annual and semiannual shareholder reports unless you specifically request paper copies from the insurance company or from your financial intermediary. Instead, the shareholder reports will be made available on a Web site (insurancefunds.mfs.com or other Web site of which you will be notified), and the insurance company will notify you by mail each time a report is posted and provide you with a Web site link to access the report. Instructions for requesting paper copies will be provided by your insurance company or financial intermediary.
If you already elected to receive shareholder reports by email, you will not be affected by this change and you need not take any action. If your insurance company or financial intermediary offers electronic delivery, you may elect to receive shareholder reports and other communications from the insurance company or financial intermediary by email by following the instructions provided by the insurance company or financial intermediary.
Beginning on January 1, 2019, you may elect to receive all future reports in paper free of charge from the insurance company or financial intermediary. You can inform the insurance company or financial intermediary that you wish to continue receiving paper copies of your shareholder reports by contacting your insurance company or financial intermediary. Your election to receive reports in paper will apply to all funds held in your account with your insurance company or financial intermediary.
RSS-SEM
Table of Contents
MFS® Research International Portfolio
The report is prepared for the general information of contract owners. It is authorized for distribution to prospective investors only when preceded or accompanied by a current prospectus.
NOT FDIC INSURED• MAY LOSE VALUE• NO BANK OR CREDIT UNION GUARANTEE• NOT A DEPOSIT• NOT INSURED BY ANY FEDERAL GOVERNMENT AGENCY OR NCUA/NCUSIF
Table of Contents
MFS Research International Portfolio
LETTER FROM THE EXECUTIVE CHAIRMAN

Dear Contract Owners:
Slowing global growth, low inflation, and increasing trade friction between the United States and China have been hallmarks of the past 12 months. After experiencing an uptick in market volatility in late 2018, markets steadied during the first half of 2019, thanks in large measure to the adoption of a dovish policy stance on the part of global central banks, who have largely abandoned efforts to normalize interest rates and have instead focused on supporting economic growth. Trade tensions remain high as the U.S. has ratcheted up tariffs on Chinese imports and China has retaliated. A truce of sorts was reached midyear, but significant challenges continue to confront negotiators, and it is not known whether a comprehensive agreement can be reached.
With Boris Johnson replacing Theresa May as Britain’s prime minister, uncertainty over Brexit remains high. Johnson has adopted a more combative stance than his predecessor toward the European Union, increasing concerns that there will be a “hard” Brexit.
Markets expect that the longest economic expansion in U.S. history will continue for the time being, albeit at a slower pace. Nevertheless, slower growth and low inflation have spurred the U.S. Federal Reserve to take a more accommodative policy stance, prompting investors to anticipate several interest rate cuts in the coming year. The European Central Bank has adopted a similar position. The more accommodative environment has helped fuel a continued rise in global equities and has been broadly supportive of risk assets.
Since launching the first U.S.open-end mutual fund in 1924, MFS® has been committed to a single purpose: to create value by allocating capital responsibly for clients. Through our powerful global investment platform, we combine collective expertise, thoughtful risk management, and long-term discipline to uncover what we believe are the best investment opportunities in the market.
Respectfully,

Robert J. Manning
Executive Chairman
MFS Investment Management
August 16, 2019
The opinions expressed in this letter are subject to change and may not be relied upon for investment advice. No forecasts can be guaranteed.
1
Table of Contents
MFS Research International Portfolio
Portfolio structure
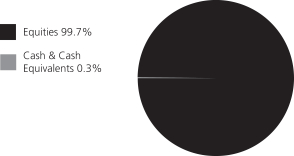
| Top ten holdings | ||||
| Nestle S.A. | 3.3% | |||
| Roche Holding AG | 2.8% | |||
| Linde AG | 2.4% | |||
| Schneider Electric S.A. | 2.2% | |||
| LVMH Moet Hennessy Louis Vuitton SE | 2.2% | |||
| AIA Group Ltd. | 2.1% | |||
| Novo Nordisk A.S., “B” | 1.8% | |||
| Aon PLC | 1.6% | |||
| BP PLC | 1.6% | |||
| EssilorLuxottica | 1.6% | |||
| Global equity sectors (k) | ||||
| Capital Goods | 22.8% | |||
| Financial Services | 22.2% | |||
| Health Care | 11.3% | |||
| Technology | 11.0% | |||
| Consumer Staples | 10.1% | |||
| Consumer Cyclicals | 9.2% | |||
| Energy | 9.1% | |||
| Telecommunications/Cable Television | 4.0% | |||
| Issuer country weightings (x) | ||||
| Japan | 19.5% | |||
| Switzerland | 13.5% | |||
| France | 11.7% | |||
| United Kingdom | 9.4% | |||
| United States | 7.6% | |||
| Germany | 7.3% | |||
| Hong Kong | 4.8% | |||
| Australia | 3.2% | |||
| Spain | 2.7% | |||
| Other Countries | 20.3% | |||
| Currency exposure weightings (y) | ||||
| Euro | 32.8% | |||
| Japanese Yen | 19.5% | |||
| Swiss Franc | 13.5% | |||
| British Pound Sterling | 8.4% | |||
| United States Dollar | 6.6% | |||
| Hong Kong Dollar | 5.4% | |||
| Australian Dollar | 3.2% | |||
| Canadian Dollar | 2.4% | |||
| Danish Krone | 2.2% | |||
| Other Currencies | 6.0% | |||
| (k) | The sectors set forth above and the associated portfolio composition are based on MFS’ own custom sector classification methodology. |
| (x) | Represents the portfolio’s exposure to issuer countries as a percentage of a portfolio’s net assets. For purposes of this presentation, United States includes Cash & Cash Equivalents. |
| (y) | Represents the portfolio’s exposure to a particular currency as a percentage of a portfolio’s net assets. For purposes of this presentation, United States Dollar includes Cash & Cash Equivalents. |
Cash & Cash Equivalents includes any cash, investments in money market funds, short-term securities, and other assets less liabilities. Please see the Statement of Assets and Liabilities for additional information related to the fund’s cash position and other assets and liabilities.
Percentages are based on net assets as of June 30, 2019.
The portfolio is actively managed and current holdings may be different.
2
Table of Contents
MFS Research International Portfolio
Fund Expenses Borne by the Contract Holders during the Period,
January 1, 2019 through June 30, 2019
As a contract holder of the fund, you incur ongoing costs, including management fees; distribution and/or service(12b-1) fees; and other fund expenses. This example is intended to help you understand your ongoing costs (in dollars) of investing in the fund and to compare these costs with the ongoing costs of investing in other mutual funds.
The example is based on an investment of $1,000 invested at the beginning of the period and held for the entire period January 1, 2019 through June 30, 2019.
Actual Expenses
The first line for each share class in the following table provides information about actual account values and actual expenses. You may use the information in this line, together with the amount you invested, to estimate the expenses that you paid over the period. Simply divide your account value by $1,000 (for example, an $8,600 account value divided by $1,000 = 8.6), then multiply the result by the number in the first line under the heading entitled “Expenses Paid During Period” to estimate the expenses you paid on your account during this period.
Hypothetical Example for Comparison Purposes
The second line for each share class in the following table provides information about hypothetical account values and hypothetical expenses based on the fund’s actual expense ratio and an assumed rate of return of 5% per year before expenses, which is not the fund’s actual return. The hypothetical account values and expenses may not be used to estimate the actual ending account balance or expenses you paid for the period. You may use this information to compare the ongoing costs of investing in the fund and other funds. To do so, compare this 5% hypothetical example with the 5% hypothetical examples that appear in the shareholder reports of the other funds.
Please note that the expenses shown in the table are meant to highlight the fund’s ongoing costs only and do not take into account the fees and expenses imposed under the variable contracts through which your investment in the fund is made. Therefore, the second line for each share class in the table is useful in comparing ongoing costs associated with an investment in vehicles (such as the fund) which fund benefits under variable annuity and variable life insurance contracts and to qualified pension and retirement plans only, and will not help you determine the relative total costs of investing in the fund through variable annuity and variable life insurance contracts. If the fees and expenses imposed under the variable contracts were included, your costs would have been higher.
| Share Class | Annualized Expense Ratio | Beginning Account Value 1/01/19 | Ending Account Value 6/30/19 | Expenses Paid During Period (p) 1/01/19-6/30/19 | ||||||||||||||
| Initial Class | Actual | 0.96% | $1,000.00 | $1,172.71 | $5.17 | |||||||||||||
| Hypothetical (h) | 0.96% | $1,000.00 | $1,020.03 | $4.81 | ||||||||||||||
| Service Class | Actual | 1.21% | $1,000.00 | $1,170.50 | $6.51 | |||||||||||||
| Hypothetical (h) | 1.21% | $1,000.00 | $1,018.79 | $6.06 | ||||||||||||||
| (h) | 5% class return per year before expenses. |
| (p) | “Expenses Paid During Period” are equal to each class’s annualized expense ratio, as shown above, multiplied by the average account value over the period, multiplied by 181/365 (to reflect theone-half year period). |
3
Table of Contents
MFS Research International Portfolio
PORTFOLIO OF INVESTMENTS – 6/30/19 (unaudited)
The Portfolio of Investments is a complete list of all securities owned by your fund. It is categorized by broad-based asset classes.
| Issuer | Shares/Par | Value ($) | ||||||
| COMMON STOCKS – 99.7% | ||||||||
| Airlines – 0.9% |
| |||||||
| Aena S.A. | 8,152 | $ | 1,615,698 | |||||
| Malaysia Airports Holdings Berhad | 503,800 | 1,039,907 | ||||||
| Ryanair Holdings PLC, ADR (a) | 15,868 | 1,017,773 | ||||||
|
| |||||||
| $ | 3,673,378 | |||||||
|
| |||||||
| Alcoholic Beverages – 0.4% | ||||||||
| Ambev S.A., ADR | 348,650 | $ | 1,628,195 | |||||
|
| |||||||
| Apparel Manufacturers – 4.4% | ||||||||
| Adidas AG | 17,501 | $ | 5,402,956 | |||||
| Compagnie Financiere Richemont S.A. | 44,374 | 3,765,562 | ||||||
| LVMH Moet Hennessy Louis Vuitton SE | 21,132 | 8,994,130 | ||||||
|
| |||||||
| $ | 18,162,648 | |||||||
|
| |||||||
| Automotive – 2.0% | ||||||||
| Koito Manufacturing Co. Ltd. | 70,800 | $ | 3,775,912 | |||||
| USS Co. Ltd. | 224,200 | 4,414,753 | ||||||
|
| |||||||
| $ | 8,190,665 | |||||||
|
| |||||||
| Brokerage & Asset Managers – 2.7% |
| |||||||
| Euronext N.V. | 56,467 | $ | 4,273,085 | |||||
| Hong Kong Exchanges & Clearing Ltd. | 100,500 | 3,548,255 | ||||||
| TMX Group Ltd. | 46,954 | 3,266,396 | ||||||
|
| |||||||
| $ | 11,087,736 | |||||||
|
| |||||||
| Business Services – 1.9% | ||||||||
| Cerved Information Solutions S.p.A. | 85,408 | $ | 757,031 | |||||
| Cognizant Technology Solutions Corp., “A” | 55,627 | 3,526,195 | ||||||
| Nomura Research Institute Ltd. | 217,800 | 3,488,759 | ||||||
|
| |||||||
| $ | 7,771,985 | |||||||
|
| |||||||
| Computer Software – 1.3% | ||||||||
| Cadence Design Systems, Inc. (a) | 23,500 | $ | 1,664,035 | |||||
| Check Point Software Technologies Ltd. (a) | 30,832 | 3,564,488 | ||||||
|
| |||||||
| $ | 5,228,523 | |||||||
|
| |||||||
| Computer Software – Systems – 3.6% |
| |||||||
| Amadeus IT Group S.A. | 56,669 | $ | 4,488,774 | |||||
| Constellation Software, Inc. | 2,335 | 2,200,736 | ||||||
| EPAM Systems, Inc. (a) | 16,691 | 2,889,212 | ||||||
| Fujitsu Ltd. | 11,600 | 808,229 | ||||||
| Hitachi Ltd. | 120,000 | 4,395,307 | ||||||
|
| |||||||
| $ | 14,782,258 | |||||||
|
| |||||||
| Conglomerates – 0.4% | ||||||||
| Melrose Industries PLC | 788,603 | $ | 1,811,187 | |||||
|
| |||||||
| Construction – 2.1% | ||||||||
| Techtronic Industries Co. Ltd. | 592,000 | $ | 4,531,869 | |||||
| Toto Ltd. | 100,700 | 3,974,201 | ||||||
|
| |||||||
| $ | 8,506,070 | |||||||
|
| |||||||
| Consumer Products – 3.3% | ||||||||
| Kao Corp. | 52,900 | $ | 4,028,280 | |||||
| L’Oréal | 17,354 | 4,943,176 | ||||||
| Issuer | Shares/Par | Value ($) | ||||||
| COMMON STOCKS – continued |
| |||||||
| Consumer Products – continued | ||||||||
| Reckitt Benckiser Group PLC | 60,984 | $ | 4,812,531 | |||||
|
| |||||||
| $ | 13,783,987 | |||||||
|
| |||||||
| Consumer Services – 0.5% | ||||||||
| 51job, Inc., ADR (a) | 27,994 | $ | 2,113,547 | |||||
|
| |||||||
| Containers – 1.0% | ||||||||
| Brambles Ltd. | 479,536 | $ | 4,336,158 | |||||
|
| |||||||
| Electrical Equipment – 3.3% | ||||||||
| Legrand S.A. | 61,843 | $ | 4,521,685 | |||||
| Schneider Electric S.A. | 99,550 | 9,028,698 | ||||||
|
| |||||||
| $ | 13,550,383 | |||||||
|
| |||||||
| Electronics – 3.0% | ||||||||
| Kyocera Corp. | 28,700 | $ | 1,872,694 | |||||
| Mellanox Technologies Ltd. (a) | 21,675 | 2,398,772 | ||||||
| Samsung Electronics Co. Ltd. | 57,717 | 2,349,369 | ||||||
| Silicon Motion Technology Corp., ADR | 32,020 | 1,421,048 | ||||||
| Taiwan Semiconductor Manufacturing Co. Ltd. | 551,804 | 4,246,081 | ||||||
|
| |||||||
| $ | 12,287,964 | |||||||
|
| |||||||
| Energy – Independent – 1.5% | ||||||||
| Cairn Energy PLC (a) | 901,495 | $ | 1,981,740 | |||||
| Caltex Australia Ltd. | 125,622 | 2,182,775 | ||||||
| Oil Search Ltd. | 378,421 | 1,878,290 | ||||||
|
| |||||||
| $ | 6,042,805 | |||||||
|
| |||||||
| Energy – Integrated – 3.5% | ||||||||
| BP PLC | 944,397 | $ | 6,579,559 | |||||
| Eni S.p.A. | 244,036 | 4,053,068 | ||||||
| Galp Energia SGPS S.A., “B” | 246,158 | 3,785,733 | ||||||
|
| |||||||
| $ | 14,418,360 | |||||||
|
| |||||||
| Food & Beverages – 4.4% | ||||||||
| Danone S.A. | 56,546 | $ | 4,790,236 | |||||
| Nestle S.A. | 130,667 | 13,527,153 | ||||||
|
| |||||||
| $ | 18,317,389 | |||||||
|
| |||||||
| Food & Drug Stores – 0.4% | ||||||||
| Sundrug Co. Ltd. | 57,000 | $ | 1,541,641 | |||||
|
| |||||||
| Gaming & Lodging – 0.4% | ||||||||
| Flutter Entertainment PLC | 20,620 | $ | 1,552,327 | |||||
|
| |||||||
| Insurance – 6.3% | ||||||||
| AIA Group Ltd. | 796,400 | $ | 8,589,257 | |||||
| Aon PLC | 34,299 | 6,619,021 | ||||||
| Hiscox Ltd. | 175,044 | 3,761,266 | ||||||
| Swiss Re Ltd. | 26,628 | 2,706,989 | ||||||
| Zurich Insurance Group AG | 12,643 | 4,402,126 | ||||||
|
| |||||||
| $ | 26,078,659 | |||||||
|
| |||||||
4
Table of Contents
MFS Research International Portfolio
Portfolio of Investments (unaudited) – continued
| Issuer | Shares/Par | Value ($) | ||||||
| COMMON STOCKS – continued |
| |||||||
| Internet – 0.8% | ||||||||
| NAVER Corp. | 15,613 | $ | 1,541,491 | |||||
| Scout24 AG | 34,441 | 1,829,689 | ||||||
|
| |||||||
| $ | 3,371,180 | |||||||
|
| |||||||
| Machinery & Tools – 5.0% | ||||||||
| Daikin Industries Ltd. | 48,600 | $ | 6,340,110 | |||||
| GEA Group AG | 110,792 | 3,149,540 | ||||||
| Kubota Corp. | 306,800 | 5,102,188 | ||||||
| Ritchie Bros. Auctioneers, Inc. | 61,645 | 2,050,048 | ||||||
| Schindler Holding AG | 17,775 | 3,956,676 | ||||||
|
| |||||||
| $ | 20,598,562 | |||||||
|
| |||||||
| Major Banks – 4.2% | ||||||||
| Barclays PLC | 1,077,247 | $ | 2,049,338 | |||||
| BNP Paribas (l) | 109,427 | 5,196,796 | ||||||
| Mitsubishi UFJ Financial Group, Inc. | 947,800 | 4,500,984 | ||||||
| UBS AG | 473,562 | 5,627,248 | ||||||
|
| |||||||
| $ | 17,374,366 | |||||||
|
| |||||||
| Medical & Health Technology & Services – 0.6% |
| |||||||
| Sonic Healthcare Ltd. | 127,170 | $ | 2,419,480 | |||||
|
| |||||||
| Medical Equipment – 2.9% | ||||||||
| EssilorLuxottica | 49,367 | $ | 6,441,517 | |||||
| Terumo Corp. | 185,700 | 5,528,887 | ||||||
|
| |||||||
| $ | 11,970,404 | |||||||
|
| |||||||
| Natural Gas – Distribution – 0.6% |
| |||||||
| China Resources Gas Group Ltd. | 470,000 | $ | 2,331,439 | |||||
|
| |||||||
| Natural Gas – Pipeline – 1.1% | ||||||||
| APA Group | 323,312 | $ | 2,451,397 | |||||
| Enbridge, Inc. | 61,803 | 2,232,279 | ||||||
|
| |||||||
| $ | 4,683,676 | |||||||
|
| |||||||
| Network & Telecom – 0.5% | ||||||||
| LM Ericsson Telephone Co., “B” | 217,356 | $ | 2,062,110 | |||||
|
| |||||||
| Other Banks & Diversified Financials – 6.6% |
| |||||||
| Aeon Financial Service Co. Ltd. | 231,300 | $ | 3,722,168 | |||||
| AIB Group PLC | 905,222 | 3,701,464 | ||||||
| HDFC Bank Ltd. | 108,095 | 3,826,839 | ||||||
| Intesa Sanpaolo S.p.A. | 2,136,306 | 4,571,743 | ||||||
| Julius Baer Group Ltd. | 98,596 | 4,389,451 | ||||||
| KBC Groep N.V. | 62,357 | 4,087,031 | ||||||
| Mastercard, Inc., “A” | 11,780 | 3,116,163 | ||||||
|
| |||||||
| $ | 27,414,859 | |||||||
|
| |||||||
| Pharmaceuticals – 7.8% | ||||||||
| Bayer AG | 79,662 | $ | 5,520,169 | |||||
| Kyowa Hakko Kirin Co. Ltd. | 100,000 | 1,798,451 | ||||||
| Novo Nordisk A.S., “B” | 145,812 | 7,430,378 | ||||||
| Roche Holding AG | 40,423 | 11,372,851 | ||||||
| Santen Pharmaceutical Co. Ltd. | 358,600 | 5,937,031 | ||||||
|
| |||||||
| $ | 32,058,880 | |||||||
|
| |||||||
| Printing & Publishing – 1.3% | ||||||||
| RELX Group PLC | 229,923 | $ | 5,563,560 | |||||
|
| |||||||
| Issuer | Shares/Par | Value ($) | ||||||
| COMMON STOCKS – continued |
| |||||||
| Real Estate – 2.3% | ||||||||
| Grand City Properties S.A. | 204,498 | $ | 4,673,948 | |||||
| LEG Immobilien AG | 44,322 | 4,999,536 | ||||||
|
| |||||||
| $ | 9,673,484 | |||||||
|
| |||||||
| Restaurants – 0.6% | ||||||||
| Yum China Holdings, Inc. | 54,571 | $ | 2,521,180 | |||||
|
| |||||||
| Specialty Chemicals – 8.6% | ||||||||
| Akzo Nobel N.V. | 63,902 | $ | 6,004,868 | |||||
| Croda International PLC | 77,934 | 5,067,378 | ||||||
| Kansai Paint Co. Ltd. | 96,700 | 2,026,112 | ||||||
| Linde PLC | 50,372 | 10,118,161 | ||||||
| Nitto Denko Corp. | 56,700 | 2,796,215 | ||||||
| Sika AG | 27,767 | 4,738,765 | ||||||
| Symrise AG | 48,562 | 4,673,809 | ||||||
|
| |||||||
| $ | 35,425,308 | |||||||
|
| |||||||
| Specialty Stores – 0.7% | ||||||||
| Dufry AG | 13,125 | $ | 1,111,632 | |||||
| Just Eat PLC (a) | 241,718 | 1,918,560 | ||||||
|
| |||||||
| $ | 3,030,192 | |||||||
|
| |||||||
| Telecommunications – Wireless – 3.5% |
| |||||||
| Advanced Info Service Public Co. Ltd. | 409,700 | $ | 2,885,635 | |||||
| KDDI Corp. | 205,300 | 5,224,139 | ||||||
| SoftBank Corp. | 100,100 | 4,795,404 | ||||||
| Tele2 AB, “B” | 108,250 | 1,579,543 | ||||||
|
| |||||||
| $ | 14,484,721 | |||||||
|
| |||||||
| Telephone Services – 0.5% | ||||||||
| Hellenic Telecommunications Organization S.A. | 147,622 | $ | 2,182,193 | |||||
|
| |||||||
| Tobacco – 2.0% | ||||||||
| British American Tobacco PLC | 147,352 | $ | 5,144,192 | |||||
| Japan Tobacco, Inc. | 132,100 | 2,915,475 | ||||||
|
| |||||||
| $ | 8,059,667 | |||||||
|
| |||||||
| Trucking – 0.4% | ||||||||
| Yamato Holdings Co. Ltd. | 86,900 | $ | 1,765,969 | |||||
|
| |||||||
| Utilities – Electric Power – 2.4% | ||||||||
| CLP Holdings Ltd. | 304,500 | $ | 3,360,075 | |||||
| Iberdrola S.A. | 494,542 | 4,929,506 | ||||||
| Orsted A/S | 20,154 | 1,742,710 | ||||||
|
| |||||||
| $ | 10,032,291 | |||||||
|
| |||||||
| Total Common Stocks (Identified Cost, $368,514,182) | $ | 411,889,386 | ||||||
|
| |||||||
| INVESTMENT COMPANIES (h) – 0.0% |
| |||||||
| Money Market Funds – 0.0% | ||||||||
| MFS Institutional Money Market Portfolio, 2.42% (v) (Identified Cost, $7,919) | 7,918 | $ | 7,919 | |||||
|
| |||||||
5
Table of Contents
MFS Research International Portfolio
Portfolio of Investments (unaudited) – continued
| Issuer | Shares/Par | Value ($) | ||||||
| COLLATERAL FOR SECURITIES LOANED – 1.2% |
| |||||||
| State Street Navigator Securities Lending Government Money Market Portfolio, 2.36% (j) (Identified Cost, $4,746,555) | 4,746,555 | $ | 4,746,555 | |||||
|
| |||||||
| OTHER ASSETS, LESS LIABILITIES – (0.9)% | (3,654,263 | ) | ||||||
|
| |||||||
| NET ASSETS – 100.0% | $ | 412,989,597 | ||||||
|
| |||||||
| (a) | Non-income producing security. |
| (h) | An affiliated issuer, which may be considered one in which the fund owns 5% or more of the outstanding voting securities, or a company which is under common control. At period end, the aggregate values of the fund’s investments in affiliated issuers and in unaffiliated issuers were $7,919 and $416,635,941, respectively. |
| (j) | The rate quoted is the annualizedseven-day yield of the fund at period end. |
| (l) | A portion of this security is on loan. See Note 2 for additional information. |
| (v) | Affiliated issuer that is available only to investment companies managed by MFS. The rate quoted for the MFS Institutional Money Market Portfolio is the annualizedseven-day yield of the fund at period end. |
The following abbreviations are used in this report and are defined:
| ADR | American Depositary Receipt |
See Notes to Financial Statements
6
Table of Contents
MFS Research International Portfolio
FINANCIAL STATEMENTS | STATEMENT OF ASSETS AND LIABILITIES (unaudited)
This statement represents your fund’s balance sheet, which details the assets and liabilities comprising the total value of the fund.
At 6/30/19 | ||||
Assets | ||||
Investments in unaffiliated issuers, at value, including $4,555,308 of securities on loan (identified cost, $373,260,737) | $416,635,941 | |||
Investments in affiliated issuers, at value (identified cost, $7,919) | 7,919 | |||
Foreign currency, at value (identified cost, $152,599) | 152,543 | |||
Receivables for | ||||
Investments sold | 2,117,143 | |||
Fund shares sold | 48,223 | |||
Interest and dividends | 1,751,994 | |||
Other assets | 1,304 | |||
Total assets | $420,715,067 | |||
Liabilities | ||||
Payable to custodian | $20,236 | |||
Payables for | ||||
Fund shares reacquired | 2,627,961 | |||
Collateral for securities loaned, at value | 4,746,555 | |||
Payable to affiliates | ||||
Investment adviser | 33,559 | |||
Administrative services fee | 722 | |||
Shareholder servicing costs | 63 | |||
Distribution and/or service fees | 1,968 | |||
Payable for independent Trustees’ compensation | 100 | |||
Deferred country tax expense payable | 160,566 | |||
Accrued expenses and other liabilities | 133,740 | |||
Total liabilities | $7,725,470 | |||
Net assets | $412,989,597 | |||
Net assets consist of | ||||
Paid-in capital | $336,984,776 | |||
Total distributable earnings (loss) | 76,004,821 | |||
Net assets | $412,989,597 | |||
Shares of beneficial interest outstanding | 25,096,256 | |||
| Net assets | Shares outstanding | Net asset value per share | ||||||||||
Initial Class | $340,752,587 | 20,657,615 | $16.50 | |||||||||
Service Class | 72,237,010 | 4,438,641 | 16.27 | |||||||||
See Notes to Financial Statements
7
Table of Contents
MFS Research International Portfolio
FINANCIAL STATEMENTS | STATEMENT OF OPERATIONS (unaudited)
This statement describes how much your fund earned in investment income and accrued in expenses. It also describes any gains and/or losses generated by fund operations.
Six months ended 6/30/19 | ||||
Net investment income (loss) | ||||
Income | ||||
Dividends | $9,683,001 | |||
Dividends from affiliated issuers | 46,190 | |||
Income on securities loaned | 11,079 | |||
Other | 2,319 | |||
Foreign taxes withheld | (872,018 | ) | ||
Total investment income | $8,870,571 | |||
Expenses | ||||
Management fee | $1,790,082 | |||
Distribution and/or service fees | 87,423 | |||
Shareholder servicing costs | 5,018 | |||
Administrative services fee | 33,045 | |||
Independent Trustees’ compensation | 6,021 | |||
Custodian fee | 57,419 | |||
Shareholder communications | 19,991 | |||
Audit and tax fees | 29,764 | |||
Legal fees | 1,710 | |||
Miscellaneous | 16,746 | |||
Total expenses | $2,047,219 | |||
Reduction of expenses by investment adviser | (48,645 | ) | ||
Net expenses | $1,998,574 | |||
Net investment income (loss) | $6,871,997 | |||
Realized and unrealized gain (loss) | ||||
Realized gain (loss) (identified cost basis) | ||||
Unaffiliated issuers (net of $16,973 country tax) | $3,502,958 | |||
Affiliated issuers | 129 | |||
Foreign currency | (17,840 | ) | ||
Net realized gain (loss) | $3,485,247 | |||
Change in unrealized appreciation or depreciation | ||||
Unaffiliated issuers (net of $138,114 increase in deferred country tax) | $52,398,209 | |||
Affiliated issuers | 380 | |||
Translation of assets and liabilities in foreign currencies | 11,074 | |||
Net unrealized gain (loss) | $52,409,663 | |||
Net realized and unrealized gain (loss) | $55,894,910 | |||
Change in net assets from operations | $62,766,907 | |||
See Notes to Financial Statements
8
Table of Contents
MFS Research International Portfolio
FINANCIAL STATEMENTS | STATEMENTS OF CHANGES IN NET ASSETS
These statements describe the increases and/or decreases in net assets resulting from operations, any distributions, and any shareholder transactions.
| Six months ended 6/30/19 | Year ended 12/31/18 | |||||||
| (unaudited) | ||||||||
Change in net assets | ||||||||
From operations | ||||||||
Net investment income (loss) | $6,871,997 | $5,966,858 | ||||||
Net realized gain (loss) | 3,485,247 | 17,686,976 | ||||||
Net unrealized gain (loss) | 52,409,663 | (82,712,215 | ) | |||||
Change in net assets from operations | $62,766,907 | $(59,058,381 | ) | |||||
Total distributions to shareholders | $— | $(16,070,335 | ) | |||||
Change in net assets from fund share transactions | $(18,951,926 | ) | $22,056,598 | |||||
Total change in net assets | $43,814,981 | $(53,072,118 | ) | |||||
Net assets | ||||||||
At beginning of period | 369,174,616 | 422,246,734 | ||||||
At end of period | $412,989,597 | $369,174,616 | ||||||
See Notes to Financial Statements
9
Table of Contents
MFS Research International Portfolio
FINANCIAL STATEMENTS | FINANCIAL HIGHLIGHTS
The financial highlights table is intended to help you understand the fund’s financial performance for the semiannual period and the past 5 fiscal years. Certain information reflects financial results for a single fund share. The total returns in the table represent the rate that an investor would have earned (or lost) on an investment in the fund share class (assuming reinvestment of all distributions) held for the entire period.
| Initial Class | Six months ended | Year ended | ||||||||||||||||||||||
| 12/31/18 | 12/31/17 | 12/31/16 | 12/31/15 | 12/31/14 | ||||||||||||||||||||
| (unaudited) | ||||||||||||||||||||||||
Net asset value, beginning of period | $14.07 | $17.05 | $13.54 | $13.85 | $14.56 | $16.09 | ||||||||||||||||||
| Income (loss) from investment operations | ||||||||||||||||||||||||
Net investment income (loss) (d) | $0.27 | $0.25 | $0.22 | $0.25 | (c) | $0.24 | $0.39 | |||||||||||||||||
Net realized and unrealized gain (loss) | 2.16 | (2.56 | ) | 3.59 | (0.34 | ) | (0.52 | ) | (1.46 | ) | ||||||||||||||
Total from investment operations | $2.43 | $(2.31 | ) | $3.81 | $(0.09 | ) | $(0.28 | ) | $(1.07 | ) | ||||||||||||||
| Less distributions declared to shareholders | ||||||||||||||||||||||||
From net investment income | $— | $(0.25 | ) | $(0.30 | ) | $(0.22 | ) | $(0.30 | ) | $(0.30 | ) | |||||||||||||
From net realized gain | — | (0.42 | ) | — | — | (0.13 | ) | (0.16 | ) | |||||||||||||||
Total distributions declared to shareholders | $— | $(0.67 | ) | $(0.30 | ) | $(0.22 | ) | $(0.43 | ) | $(0.46 | ) | |||||||||||||
Net asset value, end of period (x) | $16.50 | $14.07 | $17.05 | $13.54 | $13.85 | $14.56 | ||||||||||||||||||
Total return (%) (k)(r)(s)(x) | 17.27 | (n) | (14.12 | ) | 28.29 | (0.70 | )(c) | (1.96 | ) | (6.88 | ) | |||||||||||||
| Ratios (%) (to average net assets) and Supplemental data: | ||||||||||||||||||||||||
Expenses before expense reductions (f) | 0.99 | (a) | 0.98 | 1.00 | 0.95 | (c) | 1.00 | 1.00 | ||||||||||||||||
Expenses after expense reductions (f) | 0.96 | (a) | 0.97 | 0.99 | 0.94 | (c) | 1.00 | 0.99 | ||||||||||||||||
Net investment income (loss) | 3.50 | (a)(l) | 1.51 | 1.44 | 1.87 | (c) | 1.61 | 2.49 | ||||||||||||||||
Portfolio turnover | 13 | (n) | 25 | 27 | 41 | 38 | 27 | |||||||||||||||||
Net assets at end of period (000 omitted) | $340,753 | $302,386 | $341,613 | $318,753 | $305,502 | $253,001 | ||||||||||||||||||
| Service Class | Six months ended | Year ended | ||||||||||||||||||||||
| 12/31/18 | 12/31/17 | 12/31/16 | 12/31/15 | 12/31/14 | ||||||||||||||||||||
| (unaudited) | ||||||||||||||||||||||||
Net asset value, beginning of period | $13.90 | $16.84 | $13.38 | $13.68 | $14.39 | $15.91 | ||||||||||||||||||
| Income (loss) from investment operations | ||||||||||||||||||||||||
Net investment income (loss) (d) | $0.25 | $0.21 | $0.19 | $0.21 | (c) | $0.20 | $0.36 | |||||||||||||||||
Net realized and unrealized gain (loss) | 2.12 | (2.53 | ) | 3.52 | (0.33 | ) | (0.51 | ) | (1.47 | ) | ||||||||||||||
Total from investment operations | $2.37 | $(2.32 | ) | $3.71 | $(0.12 | ) | $(0.31 | ) | $(1.11 | ) | ||||||||||||||
| Less distributions declared to shareholders | ||||||||||||||||||||||||
From net investment income | $— | $(0.20 | ) | $(0.25 | ) | $(0.18 | ) | $(0.27 | ) | $(0.25 | ) | |||||||||||||
From net realized gain | — | (0.42 | ) | — | — | (0.13 | ) | (0.16 | ) | |||||||||||||||
Total distributions declared to shareholders | $— | $(0.62 | ) | $(0.25 | ) | $(0.18 | ) | $(0.40 | ) | $(0.41 | ) | |||||||||||||
Net asset value, end of period (x) | $16.27 | $13.90 | $16.84 | $13.38 | $13.68 | $14.39 | ||||||||||||||||||
Total return (%) (k)(r)(s)(x) | 17.05 | (n) | (14.32 | ) | 27.90 | (0.91 | )(c) | (2.20 | ) | (7.16 | ) | |||||||||||||
| Ratios (%) (to average net assets) and Supplemental data: | ||||||||||||||||||||||||
Expenses before expense reductions (f) | 1.23 | (a) | 1.23 | 1.25 | 1.20 | (c) | 1.25 | 1.25 | ||||||||||||||||
Expenses after expense reductions (f) | 1.21 | (a) | 1.22 | 1.24 | 1.19 | (c) | 1.25 | 1.24 | ||||||||||||||||
Net investment income (loss) | 3.24 | (a)(l) | 1.27 | 1.26 | 1.58 | (c) | 1.36 | 2.30 | ||||||||||||||||
Portfolio turnover | 13 | (n) | 25 | 27 | 41 | 38 | 27 | |||||||||||||||||
Net assets at end of period (000 omitted) | $72,237 | $66,789 | $80,634 | $83,138 | $97,958 | $74,383 | ||||||||||||||||||
See Notes to Financial Statements
10
Table of Contents
MFS Research International Portfolio
Financial Highlights – continued
| (a) | Annualized. |
| (c) | Amount reflects aone-time reimbursement of expenses by the custodian (or former custodian) without which net investment income and performance would be lower and expenses would be higher. |
| (d) | Per share data is based on average shares outstanding. |
| (f) | Ratios do not reflect reductions from fees paid indirectly, if applicable. |
| (k) | The total return does not reflect expenses that apply to separate accounts. Inclusion of these charges would reduce the total return figures for all periods shown. |
| (l) | Recognition of net investment income by the fund may be affected by the timing of the declaration of dividends by companies in which the fund invests and the actual annual net investment income ratio may differ. |
| (n) | Not annualized. |
| (r) | Certain expenses have been reduced without which performance would have been lower. |
| (s) | From time to time the fund may receive proceeds from litigation settlements, without which performance would be lower. |
| (x) | The net asset values and total returns have been calculated on net assets which include adjustments made in accordance with U.S. generally accepted accounting principles required at period end for financial reporting purposes. |
See Notes to Financial Statements
11
Table of Contents
MFS Research International Portfolio
NOTES TO FINANCIAL STATEMENTS (unaudited)
| (1) | Business and Organization |
MFS Research International Portfolio (the fund) is a diversified series of MFS Variable Insurance Trust II (the trust). The trust is organized as a Massachusetts business trust and is registered under the Investment Company Act of 1940, as amended, as anopen-end management investment company. The shareholders of each series of the trust are separate accounts of insurance companies, which offer variable annuity and/or life insurance products, and qualified retirement and pension plans.
The fund is an investment company and accordingly follows the investment company accounting and reporting guidance of the Financial Accounting Standards Board (FASB) Accounting Standards Codification Topic 946 Financial Services – Investment Companies.
| (2) | Significant Accounting Policies |
General – The preparation of financial statements in conformity with U.S. generally accepted accounting principles requires management to make estimates and assumptions that affect the reported amounts of assets and liabilities, and disclosure of contingent assets and liabilities at the date of the financial statements and the reported amounts of increases and decreases in net assets from operations during the reporting period. Actual results could differ from those estimates. In the preparation of these financial statements, management has evaluated subsequent events occurring after the date of the fund’s Statement of Assets and Liabilities through the date that the financial statements were issued. The fund invests in foreign securities. Investments in foreign securities are vulnerable to the effects of changes in the relative values of the local currency and the U.S. dollar and to the effects of changes in each country’s market, economic, industrial, political, regulatory, geopolitical, and other conditions.
Balance Sheet Offsetting – The fund’s accounting policy with respect to balance sheet offsetting is that, absent an event of default by the counterparty or a termination of the agreement, the International Swaps and Derivatives Association (ISDA) Master Agreement, or similar agreement, does not result in an offset of reported amounts of financial assets and financial liabilities in the Statement of Assets and Liabilities across transactions between the fund and the applicable counterparty. The fund’s right to setoff may be restricted or prohibited by the bankruptcy or insolvency laws of the particular jurisdiction to which a specific master netting agreement counterparty is subject. Balance sheet offsetting disclosures, to the extent applicable to the fund, have been included in the fund’s Significant Accounting Policies note under the captions for each of the fund’sin-scope financial instruments and transactions.
Investment Valuations – Equity securities, including restricted equity securities, are generally valued at the last sale or official closing price on their primary market or exchange as provided by a third-party pricing service. Equity securities, for which there were no sales reported that day, are generally valued at the last quoted daily bid quotation on their primary market or exchange as provided by a third-party pricing service. Short-term instruments with a maturity at issuance of 60 days or less may be valued at amortized cost, which approximates market value.Open-end investment companies are generally valued at net asset value per share. Securities and other assets generally valued on the basis of information from a third-party pricing service may also be valued at a broker/dealer bid quotation. In determining values, third-party pricing services can utilize both transaction data and market information such as yield, quality, coupon rate, maturity, type of issue, trading characteristics, and other market data. The values of foreign securities and other assets and liabilities expressed in foreign currencies are converted to U.S. dollars using the mean of bid and asked prices for rates provided by a third-party pricing service.
The Board of Trustees has delegated primary responsibility for determining or causing to be determined the value of the fund’s investments (including any fair valuation) to the adviser pursuant to valuation policies and procedures approved by the Board. If the adviser determines that reliable market quotations are not readily available, investments are valued at fair value as determined in good faith by the adviser in accordance with such procedures under the oversight of the Board of Trustees. Under the fund’s valuation policies and procedures, market quotations are not considered to be readily available for most types of debt instruments and floating rate loans and many types of derivatives. These investments are generally valued at fair value based on information from third-party pricing services. In addition, investments may be valued at fair value if the adviser determines that an investment’s value has been materially affected by events occurring after the close of the exchange or market on which the investment is principally traded (such as foreign exchange or market) and prior to the determination of the fund’s net asset value, or after the halt of trading of a specific security where trading does not resume prior to the close of the exchange or market on which the security is principally traded. Events that occur after foreign markets close (such as developments in foreign markets and significant movements in the U.S. markets) and prior to the determination of the fund’s net asset value may be deemed to have a material effect on the value of securities traded in foreign markets. Accordingly, the fund’s foreign equity securities may often be valued at fair value. The adviser generally relies on third-party pricing services or other information (such as the correlation with price movements of similar securities in the same or other markets; the type, cost and investment characteristics of the security; the business and financial condition of the issuer; and trading and other market data) to assist in determining whether to fair value and at what value to fair value an investment. The value of an investment for purposes of calculating the fund’s net asset value can differ depending on the source and method used to determine value. When fair valuation is used, the value of an investment used to determine the fund’s net asset
12
Table of Contents
MFS Research International Portfolio
Notes to Financial Statements (unaudited) – continued
value may differ from quoted or published prices for the same investment. There can be no assurance that the fund could obtain the fair value assigned to an investment if it were to sell the investment at the same time at which the fund determines its net asset value per share.
Various inputs are used in determining the value of the fund’s assets or liabilities. These inputs are categorized into three broad levels. In certain cases, the inputs used to measure fair value may fall into different levels of the fair value hierarchy. In such cases, an investment’s level within the fair value hierarchy is based on the lowest level of input that is significant to the fair value measurement. The fund’s assessment of the significance of a particular input to the fair value measurement in its entirety requires judgment, and considers factors specific to the investment. Level 1 includes unadjusted quoted prices in active markets for identical assets or liabilities. Level 2 includes other significant observable market-based inputs (including quoted prices for similar securities, interest rates, prepayment speed, and credit risk). Level 3 includes unobservable inputs, which may include the adviser’s own assumptions in determining the fair value of investments. The following is a summary of the levels used as of June 30, 2019 in valuing the fund’s assets or liabilities:
| Financial Instruments | Level 1 | Level 2 | Level 3 | Total | ||||||||||||
| Equity Securities | $411,889,386 | $— | $— | $411,889,386 | ||||||||||||
| Mutual Funds | 4,754,474 | — | — | 4,754,474 | ||||||||||||
| Total | $416,643,860 | $— | $— | $416,643,860 | ||||||||||||
For further information regarding security characteristics, see the Portfolio of Investments.
Foreign Currency Translation – Purchases and sales of foreign investments, income, and expenses are converted into U.S. dollars based upon currency exchange rates prevailing on the respective dates of such transactions or on the reporting date for foreign denominated receivables and payables. Gains and losses attributable to foreign currency exchange rates on sales of securities are recorded for financial statement purposes as net realized gains and losses on investments. Gains and losses attributable to foreign exchange rate movements on receivables, payables, income and expenses are recorded for financial statement purposes as foreign currency transaction gains and losses. That portion of both realized and unrealized gains and losses on investments that results from fluctuations in foreign currency exchange rates is not separately disclosed.
Security Loans – Under its Securities Lending Agency Agreement with the fund, State Street Bank and Trust Company, as lending agent, loans the securities of the fund to certain qualified institutions (the “Borrowers”) approved by the fund. Security loans can be terminated at the discretion of either the lending agent or the fund and the related securities must be returned within the earlier of the standard trade settlement period for such securities or within three business days. The loans are collateralized by cash and/or U.S. Treasury and federal agency obligations in an amount typically at least equal to the market value of the securities loaned. On loans collateralized by cash, the cash collateral is invested in a money market fund. The market value of the loaned securities is determined at the close of business of the fund and any additional required collateral is delivered to the fund on the next business day. The lending agent provides the fund with indemnification against Borrower default. In the event of Borrower default, the lending agent will, for the benefit of the fund, either purchase securities identical to those loaned or, when such purchase is commercially impracticable, pay the fund the market value of the loaned securities. In return, the lending agent assumes the fund’s rights to the related collateral. If the collateral value is less than the cost to purchase identical securities, the lending agent is responsible for the shortfall, but only to the extent that such shortfall is not due to a decline in collateral value resulting from collateral reinvestment for which the fund bears the risk of loss. At period end, the fund had investment securities on loan, all of which were classified as equity securities in the fund’s Portfolio of Investments, with a fair value of $4,555,308. The fair value of the fund’s investment securities on loan and a related liability of $4,746,555 for cash collateral received on securities loaned are both presented gross in the Statement of Assets and Liabilities. The collateral on securities loaned exceeded the value of securities on loan at period end. The liability for cash collateral for securities loaned is carried at fair value, which is categorized as level 2 within the fair value hierarchy. A portion of the income generated upon investment of the collateral is remitted to the Borrowers, and the remainder is allocated between the fund and the lending agent. On loans collateralized by U.S. Treasury and/or federal agency obligations, a fee is received from the Borrower, and is allocated between the fund and the lending agent. Income from securities lending is separately reported in the Statement of Operations. The dividend and interest income earned on the securities loaned is accounted for in the same manner as other dividend and interest income.
Indemnifications – Under the fund’s organizational documents, its officers and Trustees may be indemnified against certain liabilities and expenses arising out of the performance of their duties to the fund. Additionally, in the normal course of business, the fund enters into agreements with service providers that may contain indemnification clauses. The fund’s maximum exposure under these agreements is unknown as this would involve future claims that may be made against the fund that have not yet occurred.
Investment Transactions and Income – Investment transactions are recorded on the trade date. Dividends received in cash are recorded on theex-dividend date. Certain dividends from foreign securities will be recorded when the fund is informed of the dividend if such information is obtained subsequent to theex-dividend date. Dividend payments received in additional securities are recorded on theex-dividend date in an amount equal to the value of the security on such date.
13
Table of Contents
MFS Research International Portfolio
Notes to Financial Statements (unaudited) – continued
The fund may receive proceeds from litigation settlements. Any proceeds received from litigation involving portfolio holdings are reflected in the Statement of Operations in realized gain/loss if the security has been disposed of by the fund or in unrealized gain/loss if the security is still held by the fund. Any other proceeds from litigation not related to portfolio holdings are reflected as other income in the Statement of Operations.
Tax Matters and Distributions – The fund intends to qualify as a regulated investment company, as defined under Subchapter M of the Internal Revenue Code, and to distribute all of its taxable income, including realized capital gains. As a result, no provision for federal income tax is required. The fund’s federal tax returns, when filed, will remain subject to examination by the Internal Revenue Service for a three year period. Management has analyzed the fund’s tax positions taken on federal and state tax returns for all open tax years and does not believe that there are any uncertain tax positions that require recognition of a tax liability. Foreign taxes, if any, have been accrued by the fund in the accompanying financial statements in accordance with the applicable foreign tax law. Foreign income taxes may be withheld by certain countries in which the fund invests. Additionally, capital gains realized by the fund on securities issued in or by certain foreign countries may be subject to capital gains tax imposed by those countries.
Distributions to shareholders are recorded on theex-dividend date. Income and capital gain distributions are determined in accordance with income tax regulations, which may differ from U.S. generally accepted accounting principles. Certain capital accounts in the financial statements are periodically adjusted for permanent differences in order to reflect their tax character. These adjustments have no impact on net assets or net asset value per share. Temporary differences which arise from recognizing certain items of income, expense, gain or loss in different periods for financial statement and tax purposes will reverse at some time in the future. Distributions in excess of net investment income or net realized gains are temporary overdistributions for financial statement purposes resulting from differences in the recognition or classification of income or distributions for financial statement and tax purposes.
Book/tax differences primarily relate to wash sale loss deferrals.
The tax character of distributions declared to shareholders for the last fiscal year is as follows:
| Year ended | ||||
| 12/31/18 | ||||
| Ordinary income (including any short-term capital gains) | $10,715,230 | |||
| Long-term capital gains | 5,355,105 | |||
| Total distributions | $16,070,335 | |||
The federal tax cost and the tax basis components of distributable earnings were as follows:
| As of 6/30/19 | ||||
| Cost of investments | $373,918,758 | |||
| Gross appreciation | 74,781,307 | |||
| Gross depreciation | (32,056,205 | ) | ||
| Net unrealized appreciation (depreciation) | $42,725,102 | |||
| As of 12/31/18 | ||||
| Undistributed ordinary income | 5,843,260 | |||
| Undistributed long-term capital gain | 17,244,963 | |||
| Other temporary differences | (38,708 | ) | ||
| Net unrealized appreciation (depreciation) | (9,811,601 | ) | ||
The aggregate cost above includes prior fiscal year end tax adjustments, if applicable.
Multiple Classes of Shares of Beneficial Interest – The fund offers multiple classes of shares, which differ in their respective distribution and/or service fees. The fund’s income, realized and unrealized gain (loss), and common expenses are allocated to shareholders based on the daily net assets of each class. Dividends are declared separately for each class. Differences in per share dividend rates are generally due to differences in separate class expenses. The fund’s distributions declared to shareholders as reported in the Statements of Changes in Net Assets are presented by class as follows:
| From net investment income | From net realized gain | |||||||||||||||
| Six months ended 6/30/19 | Year ended 12/31/18 | Six months ended 6/30/19 | Year ended 12/31/18 | |||||||||||||
| Initial Class | $— | $4,990,946 | $— | $8,444,733 | ||||||||||||
| Service Class | — | 846,065 | — | 1,788,591 | ||||||||||||
| Total | $— | $5,837,011 | $— | $10,233,324 | ||||||||||||
14
Table of Contents
MFS Research International Portfolio
Notes to Financial Statements (unaudited) – continued
| (3) | Transactions with Affiliates |
Investment Adviser – The fund has an investment advisory agreement with MFS to provide overall investment management and related administrative services and facilities to the fund. The management fee is computed daily and paid monthly at the following annual rates based on the fund’s average daily net assets:
| Up to $1 billion | 0.90% | |||
| In excess of $1 billion and up to $2 billion | 0.80% | |||
| In excess of $2 billion | 0.70% |
MFS has agreed in writing to reduce its management fee by a specified amount if certain MFS mutual fund assets exceed thresholds agreed to by MFS and the fund’s Board of Trustees. For the six months ended June 30, 2019, this management fee reduction amounted to $19,191, which is included in the reduction of total expenses in the Statement of Operations. The management fee incurred for the six months ended June 30, 2019 was equivalent to an annual effective rate of 0.89% of the fund’s average daily net assets.
The investment adviser has agreed in writing to pay a portion of the fund’s total annual operating expenses, excluding interest, taxes, extraordinary expenses, brokerage and transaction costs, and investment-related expenses, such that total annual operating expenses do not exceed 0.96% of average daily net assets for the Initial Class shares and 1.21% of average daily net assets for the Service Class shares. This written agreement will continue until modified by the fund’s Board of Trustees, but such agreement will continue at least until April 20, 2021. For the six months ended June 30, 2019, this reduction amounted to $29,454, which is included in the reduction of total expenses in the Statement of Operations.
Distributor – MFS Fund Distributors, Inc. (MFD), a wholly-owned subsidiary of MFS, is the distributor of shares of the fund. The Trustees have adopted a distribution plan for the Service Class shares pursuant to Rule12b-1 under the Investment Company Act of 1940.
The fund’s distribution plan provides that the fund will pay MFD distribution and/or service fees equal to 0.25% per annum of its average daily net assets attributable to Service Class shares as partial consideration for services performed and expenses incurred by MFD and financial intermediaries (including participating insurance companies that invest in the fund to fund variable annuity and variable life insurance contracts, sponsors of qualified retirement and pension plans that invest in the fund, and affiliates of these participating insurance companies and plan sponsors) in connection with the sale and distribution of the Service Class shares. MFD may subsequently pay all, or a portion, of the distribution and/or service fees to financial intermediaries.
Shareholder Servicing Agent – MFS Service Center, Inc. (MFSC), a wholly-owned subsidiary of MFS, receives a fee from the fund for its services as shareholder servicing agent. For the six months ended June 30, 2019, the fee was $4,669, which equated to 0.0023% annually of the fund’s average daily net assets. MFSC also receives payment from the fund forout-of-pocket expenses paid by MFSC on behalf of the fund. For the six months ended June 30, 2019, these costs amounted to $349.
Administrator – MFS provides certain financial, legal, shareholder communications, compliance, and other administrative services to the fund. Under an administrative services agreement, the fund reimburses MFS the costs incurred to provide these services. The fund is charged an annual fixed amount of $17,500 plus a fee based on average daily net assets. The administrative services fee incurred for the six months ended June 30, 2019 was equivalent to an annual effective rate of 0.0166% of the fund’s average daily net assets.
Trustees’ and Officers’ Compensation – The fund pays compensation to independent Trustees in the form of a retainer, attendance fees, and additional compensation to Board and Committee chairpersons. The fund does not pay compensation directly to Trustees or officers of the fund who are also officers of the investment adviser, all of whom receive remuneration from MFS for their services to the fund. Certain officers and Trustees of the fund are officers or directors of MFS, MFD, and MFSC.
Other – This fund and certain other funds managed by MFS (the funds) had entered into a service agreement (the ISO Agreement) which provided for payment of fees solely by the funds to Tarantino LLC in return for the provision of services of an Independent Senior Officer (ISO) for the funds. Frank L. Tarantino served as the ISO and was an officer of the funds and the sole member of Tarantino LLC. Effective June 30, 2019, Mr. Tarantino retired from his position as ISO for the funds, and the ISO Agreement was terminated. For the six months ended June 30, 2019, the fee paid by the fund under this agreement was $469 and is included in “Miscellaneous” expense in the Statement of Operations. MFS had agreed to bear all expenses associated with office space, other administrative support, and supplies provided to the ISO.
The fund invests in the MFS Institutional Money Market Portfolio which is managed by MFS and seeks current income consistent with preservation of capital and liquidity. This money market fund does not pay a management fee to MFS.
The fund is permitted to engage in purchase and sale transactions with funds and accounts for which MFS serves as investment adviser orsub-adviser (“cross-trades”) pursuant to a policy adopted by the Board of Trustees. This policy has been designed to ensure that cross-trades conducted by the fund comply with Rule17a-7 under the Investment Company Act of 1940. During the
15
Table of Contents
MFS Research International Portfolio
Notes to Financial Statements (unaudited) – continued
six months ended June 30, 2019, the fund engaged in purchase and sale transactions pursuant to this policy, which amounted to $27,975 and $112,396, respectively. The sales transactions resulted in net realized gains (losses) of $39,379.
| (4) | Portfolio Securities |
For the six months ended June 30, 2019, purchases and sales of investments, other than short-term obligations, aggregated $49,595,119 and $56,531,873, respectively.
| (5) | Shares of Beneficial Interest |
The fund’s Declaration of Trust permits the Trustees to issue an unlimited number of full and fractional shares of beneficial interest. Transactions in fund shares were as follows:
| Six months ended 6/30/19 | Year ended 12/31/18 | |||||||||||||||
| Shares | Amount | Shares | Amount | |||||||||||||
| Shares sold | ||||||||||||||||
Initial Class | 824,058 | $12,759,879 | 2,518,504 | $40,932,805 | ||||||||||||
Service Class | 119,032 | 1,852,116 | 915,577 | 14,411,304 | ||||||||||||
| 943,090 | $14,611,995 | 3,434,081 | $55,344,109 | |||||||||||||
| Shares issued to shareholders in reinvestment of distributions | ||||||||||||||||
Initial Class | — | $— | 816,759 | $13,435,679 | ||||||||||||
Service Class | — | — | 161,933 | 2,634,656 | ||||||||||||
| — | $— | 978,692 | $16,070,335 | |||||||||||||
| Shares reacquired | ||||||||||||||||
Initial Class | (1,653,397 | ) | $(26,106,809 | ) | (1,888,605 | ) | $(31,993,445 | ) | ||||||||
Service Class | (484,682 | ) | (7,457,112 | ) | (1,061,519 | ) | (17,364,401 | ) | ||||||||
| (2,138,079 | ) | $(33,563,921 | ) | (2,950,124 | ) | $(49,357,846 | ) | |||||||||
| Net change | ||||||||||||||||
Initial Class | (829,339 | ) | $(13,346,930 | ) | 1,446,658 | $22,375,039 | ||||||||||
Service Class | (365,650 | ) | (5,604,996 | ) | 15,991 | (318,441 | ) | |||||||||
| (1,194,989 | ) | $(18,951,926 | ) | 1,462,649 | $22,056,598 | |||||||||||
The fund is one of several mutual funds in which certain MFS funds may invest. The MFS funds do not invest in the underlying funds for the purpose of exercising management or control. At the end of the period, the MFS Moderate Allocation Portfolio, the MFS Growth Allocation Portfolio, and the MFS Conservative Allocation Portfolio were the owners of record of approximately 25%, 8%, and 4% respectively, of the value of outstanding voting shares of the fund.
| (6) | Line of Credit |
The fund and certain other funds managed by MFS participate in a $1.25 billion unsecured committed line of credit, subject to a $1 billion sublimit, provided by a syndicate of banks under a credit agreement. Borrowings may be made for temporary financing needs. Interest is charged to each fund, based on its borrowings, generally at a rate equal to the highest of one month LIBOR, the Federal Funds Effective Rate and the Overnight Bank Funding Rate, plus an agreed upon spread. A commitment fee, based on the
average daily, unused portion of the committed line of credit, is allocated among the participating funds. In addition, the fund and other funds managed by MFS have established unsecured uncommitted borrowing arrangements with certain banks for temporary financing needs. Interest is charged to each fund, based on its borrowings, at rates equal to customary reference rates plus an agreed upon spread. For the six months ended June 30, 2019, the fund’s commitment fee and interest expense were $1,163 and $0, respectively, and are included in “Miscellaneous” expense in the Statement of Operations.
| (7) | Investments in Affiliated Issuers |
An affiliated issuer may be considered one in which the fund owns 5% or more of the outstanding voting securities, or a company which is under common control. For the purposes of this report, the following were affiliated issuers:
| Affiliated Issuers | Beginning Value | Purchases | Sales Proceeds | Realized Gain (Loss) | Change in Unrealized Appreciation or Depreciation | Ending Value | ||||||||||||||||||
| MFS Institutional Money Market Portfolio | $5,381,057 | $36,446,372 | $41,820,019 | $129 | $380 | $7,919 | ||||||||||||||||||
| Affiliated Issuers | Dividend Income | Capital Gain Distributions | ||||||||||||||||||||||
| MFS Institutional Money Market Portfolio |
| $46,190 | $— | |||||||||||||||||||||
16
Table of Contents
MFS Research International Portfolio
PROXY VOTING POLICIES AND INFORMATION
MFS votes proxies on behalf of the fund pursuant to proxy voting policies and procedures that are available without charge, upon request, by calling 1-800-225-2606, by visitingmfs.com/proxyvoting, or by visiting the SEC’s Web site athttp://www.sec.gov.
Information regarding how the fund voted proxies relating to portfolio securities during the most recent twelve-month period ended June 30 is available by August 31 of each year without charge by visitingmfs.com/proxyvoting, or by visiting the SEC’s Web site athttp://www.sec.gov.
QUARTERLY PORTFOLIO DISCLOSURE
The fund files a complete schedule of portfolio holdings with the SEC for the first and third quarters of each fiscal year on Form N-Q or as an exhibit to its reports on Form N-PORT (for first and third fiscal quarters ending March 31, 2019 or after). The fund’sForm N-Q or Form N-PORT reports are available on the SEC’s website athttp://www.sec.gov. A shareholder can obtain the portfolio holdings report for the first and third quarters of the fund’s fiscal year atmfs.com/vit2 by choosing the fund’s name and then selecting the “Resources” tab and clicking on “Prospectus and Reports”.
From time to time, MFS may post important information about the fund or the MFS funds on the MFS web site (mfs.com). This information is available athttps://www.mfs.com/en-us/what-we-do/announcements.htmlor atmfs.com/vit2 by choosing the fund’s name.
INFORMATION ABOUT FUND CONTRACTS AND LEGAL CLAIMS
The fund has entered into contractual arrangements with an investment adviser, administrator, distributor, shareholder servicing agent, 529 program manager (if applicable), and custodian who each provide services to the fund. Unless expressly stated otherwise, shareholders are not parties to, or intended beneficiaries of these contractual arrangements, and these contractual arrangements are not intended to create any shareholder right to enforce them against the service providers or to seek any remedy under them against the service providers, either directly or on behalf of the fund.
Under the Trust’s By-Laws and Declaration of Trust, any claims asserted against or on behalf of the MFS Funds, including claims against Trustees and Officers, must be brought in state and federal courts located within the Commonwealth of Massachusetts.
17
Table of Contents
Table of Contents
Semiannual Report
June 30, 2019

MFS® Strategic Income Portfolio

MFS® Variable Insurance Trust II
Beginning on January 1, 2021, as permitted by regulations adopted by the U.S. Securities and Exchange Commission, the insurance company that offers your contract may determine that it will no longer send you paper copies of the fund’s annual and semiannual shareholder reports unless you specifically request paper copies from the insurance company or from your financial intermediary. Instead, the shareholder reports will be made available on a Web site (insurancefunds.mfs.com or other Web site of which you will be notified), and the insurance company will notify you by mail each time a report is posted and provide you with a Web site link to access the report. Instructions for requesting paper copies will be provided by your insurance company or financial intermediary.
If you already elected to receive shareholder reports by email, you will not be affected by this change and you need not take any action. If your insurance company or financial intermediary offers electronic delivery, you may elect to receive shareholder reports and other communications from the insurance company or financial intermediary by email by following the instructions provided by the insurance company or financial intermediary.
Beginning on January 1, 2019, you may elect to receive all future reports in paper free of charge from the insurance company or financial intermediary. You can inform the insurance company or financial intermediary that you wish to continue receiving paper copies of your shareholder reports by contacting your insurance company or financial intermediary. Your election to receive reports in paper will apply to all funds held in your account with your insurance company or financial intermediary.
SIS-SEM
Table of Contents
MFS® Strategic Income Portfolio
The report is prepared for the general information of contract owners. It is authorized for distribution to prospective investors only when preceded or accompanied by a current prospectus.
NOT FDIC INSURED• MAY LOSE VALUE• NO BANK OR CREDIT UNION GUARANTEE• NOT A DEPOSIT• NOT INSURED BY ANY FEDERAL GOVERNMENT AGENCY OR NCUA/NCUSIF
Table of Contents
MFS Strategic Income Portfolio
LETTER FROM THE EXECUTIVE CHAIRMAN

Dear Contract Owners:
Slowing global growth, low inflation, and increasing trade friction between the United States and China have been hallmarks of the past 12 months. After experiencing an uptick in market volatility in late 2018, markets steadied during the first half of 2019, thanks in large measure to the adoption of a dovish policy stance on the part of global central banks, who have largely abandoned efforts to normalize interest rates and have instead focused on supporting economic growth. Trade tensions remain high as the U.S. has ratcheted up tariffs on Chinese imports and China has retaliated. A truce of sorts was reached midyear, but significant challenges continue to confront negotiators, and it is not known whether a comprehensive agreement can be reached.
With Boris Johnson replacing Theresa May as Britain’s prime minister, uncertainty over Brexit remains high. Johnson has adopted a more combative stance than his predecessor toward the European Union, increasing concerns that there will be a “hard” Brexit.
Markets expect that the longest economic expansion in U.S. history will continue for the time being, albeit at a slower pace. Nevertheless, slower growth and low inflation have spurred the U.S. Federal Reserve to take a more accommodative policy stance, prompting investors to anticipate several interest rate cuts in the coming year. The European Central Bank has adopted a similar position. The more accommodative environment has helped fuel a continued rise in global equities and has been broadly supportive of risk assets.
Since launching the first U.S.open-end mutual fund in 1924, MFS® has been committed to a single purpose: to create value by allocating capital responsibly for clients. Through our powerful global investment platform, we combine collective expertise, thoughtful risk management, and long-term discipline to uncover what we believe are the best investment opportunities in the market.
Respectfully,

Robert J. Manning
Executive Chairman
MFS Investment Management
August 16, 2019
The opinions expressed in this letter are subject to change and may not be relied upon for investment advice. No forecasts can be guaranteed.
1
Table of Contents
MFS Strategic Income Portfolio
Portfolio structure at value
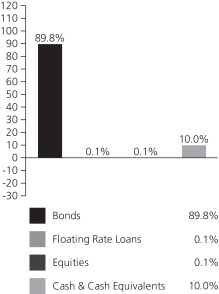
| Fixed income sectors (i) | ||||
| Investment Grade Corporates | 29.7% | |||
| U.S. Treasury Securities | 29.5% | |||
| Commercial Mortgage-Backed Securities | 14.2% | |||
| High Yield Corporates | 10.0% | |||
| Collateralized Debt Obligations | 8.6% | |||
| Emerging Markets Bonds | 8.4% | |||
| Asset-Backed Securities | 4.2% | |||
| Municipal Bonds | 1.7% | |||
| Non-U.S. Government Bonds | 1.6% | |||
| Mortgage-Backed Securities | 0.6% | |||
| Residential Mortgage-Backed Securities | 0.3% | |||
| U.S. Government Agencies | 0.2% | |||
| Floating Rate Loans | 0.1% |
Portfolio structure reflecting equivalent exposure of derivative positions (i)
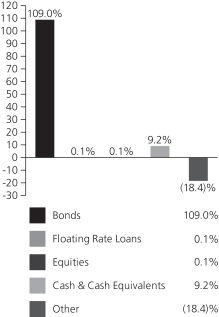
| Composition including fixed income credit quality (a)(i) |
| |||
| AAA | 8.0% | |||
| AA | 4.9% | |||
| A | 18.0% | |||
| BBB | 23.9% | |||
| BB | 12.1% | |||
| B | 6.8% | |||
| CCC | 1.7% | |||
| CC (o) | 0.0% | |||
| C (o) | 0.0% | |||
| D | 0.1% | |||
| U.S. Government | 6.3% | |||
| Federal Agencies | 0.8% | |||
| Not Rated | 26.5% | |||
| Non-Fixed Income | 0.1% | |||
| Cash & Cash Equivalents | 9.2% | |||
| Other | (18.4)% | |||
| Portfolio facts (i) | ||||
| Average Duration (d) | 5.7 | |||
| Average Effective Maturity (m) | 7.8 yrs. | |||
2
Table of Contents
MFS Strategic Income Portfolio
Portfolio Composition – continued
| (a) | For all securities other than those specifically described below, ratings are assigned to underlying securities utilizing ratings from Moody’s, Fitch, and Standard & Poor’s rating agencies and applying the following hierarchy: If all three agencies provide a rating, the middle rating (after dropping the highest and lowest ratings) is assigned; if two of the three agencies rate a security, the lower of the two is assigned. Ratings are shown in the S&P and Fitch scale (e.g., AAA). Securities rated BBB or higher are considered investment grade. All ratings are subject to change. U.S. Government includes securities issued by the U.S. Department of the Treasury. Federal Agencies includes rated and unrated U.S. Agency fixed-income securities, U.S. Agency mortgage-backed securities, and collateralized mortgage obligations of U.S. Agency mortgage-backed securities. Not Rated includes fixed income securities and fixed income derivatives, which have not been rated by any rating agency.Non-Fixed Income includes any equity securities (including convertible bonds and equity derivatives) and/or commodity-linked derivatives. The fund may or may not have held all of these instruments on this date. The fund is not rated by these agencies. |
| (d) | Duration is a measure of how much a bond’s price is likely to fluctuate with general changes in interest rates, e.g., if rates rise 1.00%, a bond with a5-year duration is likely to lose about 5.00% of its value due to the interest rate move. |
| (i) | For purposes of this presentation, the components include the value of securities, and reflect the impact of the equivalent exposure of derivative positions, if any. These amounts may be negative from time to time. Equivalent exposure is a calculated amount that translates the derivative position into a reasonable approximation of the amount of the underlying asset that the portfolio would have to hold at a given point in time to have the same price sensitivity that results from the portfolio’s ownership of the derivative contract. When dealing with derivatives, equivalent exposure is a more representative measure of the potential impact of a position on portfolio performance than value. The bond component will include any accrued interest amounts. |
| (m) | In determining each instrument’s effective maturity for purposes of calculating the fund’s dollar-weighted average effective maturity, MFS uses the instrument’s stated maturity or, if applicable, an earlier date on which MFS believes it is probable that a maturity-shortening device (such as a put,pre-refunding or prepayment) will cause the instrument to be repaid. Such an earlier date can be substantially shorter than the instrument’s stated maturity. |
Where the fund holds convertible bonds, they are treated as part of the equity portion of the portfolio.
The fund invests a portion of its assets in the MFS High Yield Pooled Portfolio. Percentages reflect exposure to the underlying holdings, including Cash & Cash Equivalents and Other, of the MFS High Yield Pooled Portfolio and not to the exposure from investing directly in the MFS High Yield Pooled Portfolio itself.
Cash & Cash Equivalents includes any cash, investments in money market funds, short-term securities, and other assets less liabilities. Please see the Statement of Assets and Liabilities for additional information related to the fund’s cash position and other assets and liabilities.
Other includes equivalent exposure from currency derivatives and/or any offsets to derivative positions and may be negative.
Percentages are based on net assets as of June 30, 2019.
The portfolio is actively managed and current holdings may be different.
3
Table of Contents
MFS Strategic Income Portfolio
Fund Expenses Borne by the Contract Holders during the Period,
January 1, 2019 through June 30, 2019
As a contract holder of the fund, you incur ongoing costs, including management fees; distribution and/or service(12b-1) fees; and other fund expenses. This example is intended to help you understand your ongoing costs (in dollars) of investing in the fund and to compare these costs with the ongoing costs of investing in other mutual funds.
In addition to the fees and expenses which the fund bears directly, the fund indirectly bears a pro rata share of the fees and expenses of the MFS High Yield Pooled Portfolio, an underlying MFS Pooled Portfolio in which the fund invests. MFS Pooled Portfolios are mutual funds advised by MFS that do not pay management fees to MFS but do incur investment and operating costs. If these transactional and indirect costs were included, your costs would have been higher.
The example is based on an investment of $1,000 invested at the beginning of the period and held for the entire period
January 1, 2019 through June 30, 2019.
Actual Expenses
The first line for each share class in the following table provides information about actual account values and actual expenses. You may use the information in this line, together with the amount you invested, to estimate the expenses that you paid over the period. Simply divide your account value by $1,000 (for example, an $8,600 account value divided by $1,000 = 8.6), then multiply the result by the number in the first line under the heading entitled “Expenses Paid During Period” to estimate the expenses you paid on your account during this period.
Hypothetical Example for Comparison Purposes
The second line for each share class in the following table provides information about hypothetical account values and hypothetical expenses based on the fund’s actual expense ratio and an assumed rate of return of 5% per year before expenses, which is not the fund’s actual return. The hypothetical account values and expenses may not be used to estimate the actual ending account balance or expenses you paid for the period. You may use this information to compare the ongoing costs of investing in the fund and other funds. To do so, compare this 5% hypothetical example with the 5% hypothetical examples that appear in the shareholder reports of the other funds.
Please note that the expenses shown in the table are meant to highlight the fund’s ongoing costs only and do not take into account the fees and expenses imposed under the variable contracts through which your investment in the fund is made. Therefore, the second line for each share class in the table is useful in comparing ongoing costs associated with an investment in vehicles (such as the fund) which fund benefits under variable annuity and variable life insurance contracts and to qualified pension and retirement plans only, and will not help you determine the relative total costs of investing in the fund through variable annuity and variable life insurance contracts. If the fees and expenses imposed under the variable contracts were included, your costs would have been higher.
| Share Class | Annualized Expense Ratio | Beginning Account Value 1/01/19 | Ending Account Value 6/30/19 | Expenses Paid During Period (p) 1/01/19-6/30/19 | ||||||||||||||
| Initial Class | Actual | 0.81% | $1,000.00 | $1,083.15 | $4.18 | |||||||||||||
| Hypothetical (h) | 0.81% | $1,000.00 | $1,020.78 | $4.06 | ||||||||||||||
| Service Class | Actual | 1.06% | $1,000.00 | $1,081.61 | $5.47 | |||||||||||||
| Hypothetical (h) | 1.06% | $1,000.00 | $1,019.54 | $5.31 | ||||||||||||||
| (h) | 5% class return per year before expenses. |
| (p) | “Expenses Paid During Period” are equal to each class’s annualized expense ratio, as shown above, multiplied by the average account value over the period, multiplied by 181/365 (to reflect theone-half year period). In addition to the fees and expenses which the fund bears directly, the fund indirectly bears a pro rata share of the fees and expenses of the underlying funds in which the fund invests. If these indirect costs were included, your costs would have been higher. |
Notes to Expense Table
Changes to the fund’s fee arrangements will occur during the fund’s current fiscal year. Had these fee changes been in effect during the six month period, the annualized expense ratios, the actual expenses paid during the period, and the hypothetical expenses paid during the period would have been approximately 0.76%, $3.93, and $3.81 for Initial Class and 1.01%, $5.21, and $5.06 for Service Class, respectively. For further information about the fund’s fee arrangements and changes to those fee arrangements, please see Note 3 in the Notes to Financial Statements.
Expense ratios include 0.01% of interest expense on uncovered collateral or margin obligations with the broker (See Note 2 of the Notes to Financial Statements) that are outside of the expense limitation arrangement (See Note 3 of the Notes to Financial Statements).
4
Table of Contents
MFS Strategic Income Portfolio
PORTFOLIO OF INVESTMENTS – 6/30/19 (unaudited)
The Portfolio of Investments is a complete list of all securities owned by your fund. It is categorized by broad-based asset classes.
| Issuer | Shares/Par | Value ($) | ||||||
| BONDS – 74.9% | ||||||||
| Asset-Backed & Securitized – 27.2% |
| |||||||
| Allegro CLO Ltd.,2014-1RA, “C”, FLR, 5.591% (LIBOR - 3mo. + 3%), 10/21/2028 (z) | $ | 250,000 | $ | 247,421 | ||||
| Allegro CLO Ltd.,2015-1X, “CR”, FLR, 4.23% (LIBOR - 3mo. + 1.65%), 7/25/2027 (z) | 250,000 | 246,222 | ||||||
| ALM Loan Funding CLO,2015-16A, “BR2”, FLR, 4.496% (LIBOR - 3mo. + 1.9%), 7/15/2027 (n) | 260,000 | 259,476 | ||||||
| Arbor Realty CLO Ltd.,2018-FL1, “A”, FLR, 3.544% (LIBOR - 1mo. + 1.15%), 6/15/2028 (n) | 260,000 | 260,565 | ||||||
| Arbor Realty Trust, Inc., CLO,2019-FL1, “D”, FLR, 5% (LIBOR - 1mo. + 2.5%), 5/15/2037 (z) | 244,000 | 245,066 | ||||||
| Babson CLO Ltd.,2013-IIA, “BR”, FLR, 3.841% (LIBOR - 3mo.+ 1.25%), 1/20/2028 (n) | 250,000 | 245,164 | ||||||
| Bancorp Commercial Mortgage Trust,2018-CR3, “D”, FLR, 5.094% (LIBOR - 1mo. + 2.7%), 1/15/2033 (z) | 248,157 | 249,345 | ||||||
| Bancorp Commercial Mortgage Trust, 2018-CRE4, “AS”, FLR, 3.494% (LIBOR - 1mo. + 1.1%), 9/15/2035 (n) | 250,000 | 248,594 | ||||||
| Bancorp Commercial Mortgage Trust, 2018-CRE4, “D”, FLR, 4.494% (LIBOR - 1mo. + 2.1%), 9/15/2035 (z) | 200,000 | 200,434 | ||||||
| Bancorp Commercial Mortgage Trust, 2019-CRE5, “D”, FLR, 4.744% (LIBOR - 1mo. + 2.35%), 3/15/2036 (z) | 280,000 | 280,000 | ||||||
| Bayview Financial Revolving Mortgage Loan Trust, FLR, 4.002% (LIBOR - 1mo. + 1.6%), 12/28/2040 (z) | 137,423 | 132,422 | ||||||
| BDS Ltd.,2018-FL2, “C”, FLR, 4.244% (LIBOR - 1mo. + 1.85%), 8/15/2035 (z) | 200,000 | 200,503 | ||||||
| BSPRT Ltd.,2017-FL2, “C”, FLR, 4.544% (LIBOR - 1mo. + 2.15%), 10/15/2034 (n) | 250,000 | 250,545 | ||||||
| BSPRT Ltd.,2019-FL5, “C”, FLR, 4.478% (LIBOR - 1mo. + 2%), 5/15/2029 (z) | 245,000 | 245,153 | ||||||
| Business Jet Securities LLC,2018-1, “C”, 7.748%, 2/15/2033 (z) | 78,806 | 80,901 | ||||||
| Chesapeake Funding II LLC,2017-2A, “C”, 3.01%, 5/15/2029 (n) | 215,000 | 216,081 | ||||||
| Commercial Mortgage Pass-Through Certificates, 2017-BNK8, “A3”, 3.229%, 11/15/2050 | 250,000 | 260,175 | ||||||
| Commercial Mortgage Pass-Through Certificates, 2018-BNK10, “A5”, 3.688%, 2/15/2061 | 250,000 | 268,471 | ||||||
| Commercial Mortgage Trust,2015-PC1, “A5”, 3.902%, 7/10/2050 | 346,107 | 370,190 | ||||||
| Issuer | Shares/Par | Value ($) | ||||||
| BONDS – continued | ||||||||
| Asset-Backed & Securitized – continued |
| |||||||
| Commercial Mortgage Trust, 2017-COR2, “A3”, 3.51%, 9/10/2050 | $ | 250,000 | $ | 263,834 | ||||
| CPS Auto Trust,2016-D, “B”, 2.11%, 3/15/2021 (n) | 49,951 | 49,926 | ||||||
| Crest Ltd., CDO, 7%, (0.001% cash or 7% PIK) 1/28/2040 (a)(p) | 664,497 | 31,717 | ||||||
| Cutwater Ltd.,2015-IA, “BR”, FLR, 4.396% (LIBOR - 3mo. + 1.8%), 1/15/2029 (z) | 250,000 | 249,182 | ||||||
| Drive Auto Receivables Trust,2017-1, “C”, 2.84%, 4/15/2022 | 49,919 | 49,960 | ||||||
| DT Auto Owner Trust,2017-2A, “C”, 3.03%, 1/17/2023 (n) | 105,593 | 105,642 | ||||||
| DT Auto Owner Trust,2018-2A, “C”, 3.67%, 3/15/2024 (n) | 82,000 | 83,266 | ||||||
| Exantas Capital Corp. CLO Ltd., 2018-RS06, “B”, FLR, 3.544% (LIBOR - 1mo. + 1.15%), 6/15/2035 (n) | 260,000 | 260,003 | ||||||
| Falcon Franchise Loan LLC, 8.886%, 1/05/2023 (i)(z) | 5,344 | 207 | ||||||
| Figueroa CLO Ltd.,2014-1A, “DR”, FLR, 5.846% (LIBOR - 3mo. + 3.25%), 1/15/2027 (z) | 250,000 | 249,368 | ||||||
| Flagship CLO,2014-8A, “BRR”, FLR, 4.001% (LIBOR - 3mo. + 1.4%), 1/16/2026 (n) | 259,587 | 257,817 | ||||||
| Flatiron CLO Ltd.,2015-1A, “CR”, FLR, 4.496% (LIBOR - 3mo. + 1.9%), 4/15/2027 (n) | 260,000 | 258,599 | ||||||
| GMF Floorplan Owner Revolving Trust,2017-2, “C”, 2.63%, 7/15/2022 (n) | 260,000 | 259,881 | ||||||
| Hunt CRE Ltd.,2018-FL2, “D”, FLR, 5.144% (LIBOR - 1mo. + 2.75%), 8/15/2028 (z) | 200,000 | 200,500 | ||||||
| Invitation Homes Trust, 2018-SFR1, “C”, FLR, 3.644% (LIBOR - 1mo. + 1.25%), 3/17/2037 (z) | 130,000 | 129,313 | ||||||
| JPMorgan Chase Commercial Mortgage Securities Corp., 3.454%, 9/15/2050 | 134,136 | 140,970 | ||||||
| KKR Real Estate Financial Trust, Inc. Ltd.,2018-FL1, “D”, FLR, 4.944% (LIBOR - 1mo. + 2.55%), 6/15/2036 (z) | 205,000 | 206,537 | ||||||
| Lehman Brothers Commercial Conduit Mortgage Trust, 1.116%, 2/18/2030 (i) | 5,384 | 0 | ||||||
| LoanCore Ltd., 2018-CRE1, “C”, FLR, 4.944% (LIBOR - 1mo. + 2.55%), 5/15/2028 (n) | 260,000 | 261,466 | ||||||
| LoanCore Ltd., 2018-CRE1, “C”, FLR, 4.344% (LIBOR - 1mo. + 1.95%), 4/15/2034 (z) | 243,500 | 244,486 | ||||||
| LoanCore Ltd., 2019-CRE2, “D”, FLR, 4.844% (LIBOR - 1mo. + 2.45%), 5/09/2036 (z) | 209,000 | 210,049 | ||||||
5
Table of Contents
MFS Strategic Income Portfolio
Portfolio of Investments (unaudited) – continued
| Issuer | Shares/Par | Value ($) | ||||||
| BONDS – continued | ||||||||
| Asset-Backed & Securitized – continued |
| |||||||
| Man GLG U.S. CLO2018-2 Ltd.,2018-2A, “BR”, FLR, 5.046% (LIBOR - 3mo. + 2.45%), 10/15/2028 | $ | 250,000 | $ | 250,131 | ||||
| Morgan Stanley Bank of America Merrill Lynch Trust,2017-C34, “A4”, 3.536%, 11/15/2052 | 250,000 | 264,750 | ||||||
| Morgan Stanley Capital I Trust,2017-H1, “A5”, 3.53%, 6/15/2050 | 187,518 | 198,518 | ||||||
| Navistar Financial Dealer Note Master Owner Trust II,2018-1, FLR, 3.954% (LIBOR - 1mo. + 1.55%), 9/25/2023 (z) | 269,000 | 269,538 | ||||||
| Neuberger Berman CLO Ltd.,2016-21A, “CR”, FLR, 4.191% (LIBOR - 3mo. + 1.6%), 4/20/2027 (n) | 250,000 | 241,805 | ||||||
| NextGear Floorplan Master Owner Trust,2017-2A, “B”, 3.02%, 10/17/2022 (n) | 212,000 | 213,208 | ||||||
| NextGear Floorplan Master Owner Trust,2018-1A, “B”, 3.57%, 2/15/2023 (z) | 200,000 | 202,947 | ||||||
| Oaktree CLO Ltd.,2014-2A, “BR”, FLR, 5.141% (LIBOR - 3mo. + 2.55%), 10/20/2026 (n) | 300,000 | 299,484 | ||||||
| Parallel Ltd.,2015-1A, “DR”, FLR, 5.141% (LIBOR - 3mo. + 2.55%), 7/20/2027 (n) | 250,000 | 244,461 | ||||||
| Race Point CLO Ltd.,2013-8A, “CR”, FLR, 5.019% (LIBOR - 3mo. + 2.5%), 2/20/2030 (n) | 300,000 | 298,353 | ||||||
| Santander Drive Auto Receivables Trust,2017-2, “C”, 2.79%, 8/15/2022 | 214,000 | 214,303 | ||||||
| Sierra Receivables Funding Co. LLC,2015-1A, “A”, 2.4%, 3/22/2032 (n) | 26,544 | 26,488 | ||||||
| UBS Commercial Mortgage Trust2017-C8, “A4”, 3.983%, 2/15/2051 | 250,000 | 272,603 | ||||||
| UBS Commercial Mortgage Trust,2017-C1, “A4”, 3.544%, 11/15/2050 | 251,247 | 265,788 | ||||||
| Wells Fargo Commercial Mortgage Trust,2017-C42, “A5”, 3.589%, 12/15/2050 | 250,000 | 265,359 | ||||||
| Wells Fargo Commercial Mortgage Trust,2017-RB1, “A4”, 3.374%, 3/15/2050 | 280,000 | 293,121 | ||||||
| West CLO Ltd.,2014-1A, “CR”, FLR, 5.6% (LIBOR - 3mo. + 3%), 7/18/2026 (n) | 260,000 | 260,024 | ||||||
| Wind River CLO Ltd.,2012-1A, “CR2”, 1%, 1/15/2026 (w)(z) | 250,000 | 250,000 | ||||||
|
| |||||||
| $ | 12,350,332 | |||||||
|
| |||||||
| Brokerage & Asset Managers – 0.7% |
| |||||||
| E*TRADE Financial Corp., 4.5%, 6/20/2028 | $ | 292,000 | $ | 307,045 | ||||
|
| |||||||
| Building – 0.8% | ||||||||
| Martin Marietta Materials, Inc., 4.25%, 7/02/2024 | $ | 215,000 | $ | 228,233 | ||||
| Martin Marietta Materials, Inc., 3.5%, 12/15/2027 | 115,000 | 114,807 | ||||||
|
| |||||||
| $ | 343,040 | |||||||
|
| |||||||
| Issuer | Shares/Par | Value ($) | ||||||
| BONDS – continued | ||||||||
| Cable TV – 0.4% | ||||||||
| Time Warner Cable, Inc., 4.5%, 9/15/2042 | $ | 183,000 | $ | 170,996 | ||||
|
| |||||||
| Computer Software – 1.4% | ||||||||
| Dell Investments LLC/EMC Corp., 5.3%, 10/01/2029 (n) | $ | 224,000 | $ | 236,051 | ||||
| Microsoft Corp., 3.125%, 11/03/2025 | 133,000 | 140,012 | ||||||
| Microsoft Corp., 4.25%, 2/06/2047 | 205,000 | 241,572 | ||||||
|
| |||||||
| $ | 617,635 | |||||||
|
| |||||||
| Computer Software – Systems – 0.6% |
| |||||||
| Apple, Inc., 4.25%, 2/09/2047 | $ | 250,000 | $ | 281,043 | ||||
|
| |||||||
| Conglomerates – 1.6% | ||||||||
| United Technologies Corp., 4.125%, 11/16/2028 | $ | 444,000 | $ | 487,779 | ||||
| Wabtec Corp., 4.95%, 9/15/2028 | 226,000 | 242,322 | ||||||
|
| |||||||
| $ | 730,101 | |||||||
|
| |||||||
| Consumer Products – 1.5% | ||||||||
| Reckitt Benckiser Treasury Services PLC, 3.625%, 9/21/2023 (n) | $ | 259,000 | $ | 270,102 | ||||
| Reckitt Benckiser Treasury Services PLC, 2.75%, 6/26/2024 (n) | 401,000 | 404,046 | ||||||
|
| |||||||
| $ | 674,148 | |||||||
|
| |||||||
| Consumer Services – 0.9% | ||||||||
| Priceline Group, Inc., 3.55%, 3/15/2028 | $ | 242,000 | $ | 252,232 | ||||
| Toll Road Investors Partnership II LP, Capital Appreciation, 0%, 2/15/2026 (n) | 46,000 | 32,698 | ||||||
| Toll Road Investors Partnership II LP, Capital Appreciation, 0%, 2/15/2029 (n) | 132,000 | 79,966 | ||||||
| Toll Road Investors Partnership II LP, Capital Appreciation, 0%, 2/15/2031 (n) | 46,000 | 24,660 | ||||||
|
| |||||||
| $ | 389,556 | |||||||
|
| |||||||
| Electronics – 0.8% | ||||||||
| Broadcom Corp./Broadcom Cayman Finance Ltd., 3.5%, 1/15/2028 | $ | 225,000 | $ | 213,600 | ||||
| Broadcom, Inc., 4.75%, 4/15/2029 (n) | 153,000 | 157,098 | ||||||
|
| |||||||
| $ | 370,698 | |||||||
|
| |||||||
| Emerging Market Quasi-Sovereign – 1.6% |
| |||||||
| KazTransGas JSC, 4.375%, 9/26/2027 | $ | 200,000 | $ | 203,632 | ||||
| Petrobras Global Finance B.V., 6.9%, 3/19/2049 | 102,000 | 108,630 | ||||||
| REC Ltd., 3.875%, 7/07/2027 | 200,000 | 194,814 | ||||||
| Southern Gas Corridor CJSC, 6.875%, 3/24/2026 | 200,000 | 231,831 | ||||||
|
| |||||||
| $ | 738,907 | |||||||
|
| |||||||
| Emerging Market Sovereign – 4.3% |
| |||||||
| Government of Ukraine, 7.75%, 9/01/2027 | $ | 120,000 | $ | 123,302 | ||||
| Republic of Argentina, 7.5%, 4/22/2026 | 150,000 | 126,675 | ||||||
| Republic of Guatemala, 6.125%, 6/01/2050 (n) | 200,000 | 209,502 | ||||||
6
Table of Contents
MFS Strategic Income Portfolio
Portfolio of Investments (unaudited) – continued
| Issuer | Shares/Par | Value ($) | ||||||
| BONDS – continued | ||||||||
| Emerging Market Sovereign – continued |
| |||||||
| Republic of Indonesia, 8.375%, 3/15/2034 | IDR | 1,539,000,000 | $ | 115,473 | ||||
| Republic of Kenya, 8%, 5/22/2032 (z) | $ | 200,000 | 211,323 | |||||
| Republic of Namibia, 5.25%, 10/29/2025 | 200,000 | 200,616 | ||||||
| Republic of Panama, 3.75%, 4/17/2026 | 114,000 | 117,820 | ||||||
| Republic of Romania, 3.375%, 2/08/2038 | EUR | 206,000 | 252,694 | |||||
| Republic of South Africa, 8.25%, 3/31/2032 | ZAR | 1,797,189 | 118,855 | |||||
| Russian Federation, 4.375%, 3/21/2029 | $ | 200,000 | 207,333 | |||||
| Socialist Republic of Vietnam, 4.8%, 11/19/2024 | 231,000 | 245,776 | ||||||
|
| |||||||
| $ | 1,929,369 | |||||||
|
| |||||||
| Energy – Independent – 0.3% | ||||||||
| Canadian Oil Sands Co., 4.5%, 4/01/2022 (n) | $ | 118,000 | $ | 122,273 | ||||
|
| |||||||
| Energy – Integrated – 1.4% | ||||||||
| Eni S.p.A., 4%, 9/12/2023 (n) | $ | 200,000 | $ | 208,394 | ||||
| Eni S.p.A., 4.25%, 5/09/2029 (n) | 200,000 | 209,316 | ||||||
| Shell International Finance B.V., 2.875%, 5/10/2026 | 225,000 | 230,087 | ||||||
|
| |||||||
| $ | 647,797 | |||||||
|
| |||||||
| Financial Institutions – 0.4% | ||||||||
| GE Capital International Funding Co., 4.418%, 11/15/2035 | $ | 200,000 | $ | 197,951 | ||||
|
| |||||||
| Food & Beverages – 0.8% | ||||||||
| Anheuser-Busch InBev Worldwide, Inc., 5.45%, 1/23/2039 | $ | 189,000 | $ | 224,922 | ||||
| Anheuser-Busch InBev Worldwide, Inc., 4.439%, 10/06/2048 | 125,491 | 131,150 | ||||||
|
| |||||||
| $ | 356,072 | |||||||
|
| |||||||
| Insurance – 0.9% | ||||||||
| American International Group, Inc., 3.9%, 4/01/2026 | $ | 294,000 | $ | 307,701 | ||||
| American International Group, Inc., 4.7%, 7/10/2035 | 59,000 | 64,711 | ||||||
| American International Group, Inc., 4.5%, 7/16/2044 | 53,000 | 56,025 | ||||||
|
| |||||||
| $ | 428,437 | |||||||
|
| |||||||
| Insurance – Property & Casualty – 2.0% |
| |||||||
| Allied World Assurance Co. Holdings Ltd., 4.35%, 10/29/2025 | $ | 310,000 | $ | 313,376 | ||||
| Fairfax Financial Holdings Ltd., 4.85%, 4/17/2028 | 283,000 | 298,386 | ||||||
| Marsh & McLennan Cos., Inc., 4.2%, 3/01/2048 | 277,000 | 292,552 | ||||||
|
| |||||||
| $ | 904,314 | |||||||
|
| |||||||
| Issuer | Shares/Par | Value ($) | ||||||
| BONDS – continued | ||||||||
| International Market Quasi-Sovereign – 0.6% |
| |||||||
| Dexia Credit Local S.A., 2.25%, 2/18/2020 (n) | $ | 270,000 | $ | 269,914 | ||||
|
| |||||||
| International Market Sovereign – 1.0% |
| |||||||
| Government of Japan, 0%, 7/01/2019 | JPY | 50,000,000 | $ | 463,757 | ||||
|
| |||||||
| Machinery & Tools – 0.7% | ||||||||
| CNH Industrial Capital LLC, 4.2%, 1/15/2024 | $ | 174,000 | $ | 181,073 | ||||
| CNH Industrial Capital LLC, 3.85%, 11/15/2027 | 145,000 | 144,795 | ||||||
|
| |||||||
| $ | 325,868 | |||||||
|
| |||||||
| Major Banks – 7.0% | ||||||||
| Bank of America Corp., 2.151%, 11/09/2020 | $ | 100,000 | $ | 99,694 | ||||
| Bank of America Corp., 4.125%, 1/22/2024 | 136,000 | 145,456 | ||||||
| Bank of America Corp., 3.248%, 10/21/2027 | 656,000 | 672,133 | ||||||
| Bank of America Corp., 4.271% to 7/23/2028, FLR (LIBOR - 3mo. + 1.31%) to 7/23/2029 | 136,000 | 148,539 | ||||||
| Barclays PLC, 4.375%, 1/12/2026 | 200,000 | 206,974 | ||||||
| Credit Suisse Group AG, 3.869%, 1/12/2029 (n) | 250,000 | 257,726 | ||||||
| JPMorgan Chase & Co., 3.125%, 1/23/2025 | 325,000 | 334,205 | ||||||
| JPMorgan Chase & Co., 3.882% to 7/24/2037, FLR (LIBOR - 3mo. + 1.36%) to 7/24/2038 | 269,000 | 281,972 | ||||||
| Morgan Stanley, 3.625%, 1/20/2027 | 317,000 | 332,703 | ||||||
| Royal Bank of Scotland Group PLC, 4.269% to 3/22/2024, FLR (LIBOR -3mo. + 1.762%) to 3/22/2025 | 218,000 | 225,454 | ||||||
| UBS Group Funding (Switzerland) AG, 4.253%, 3/23/2028 (n) | 415,000 | 447,310 | ||||||
|
| |||||||
| $ | 3,152,166 | |||||||
|
| |||||||
| Medical Equipment – 0.5% | ||||||||
| Abbott Laboratories, 4.75%, 11/30/2036 | $ | 205,000 | $ | 242,201 | ||||
|
| |||||||
| Midstream – 0.9% | ||||||||
| MPLX LP, 4.5%, 4/15/2038 | $ | 389,000 | $ | 392,737 | ||||
|
| |||||||
| Mortgage-Backed – 0.6% | ||||||||
| Fannie Mae,5.5%, 3/01/2020 - 9/01/2034 | $ | 10,401 | $ | 11,512 | ||||
| Fannie Mae, 6.5%, 4/01/2032 | 17,848 | 20,658 | ||||||
| Freddie Mac, 4.224%, 3/25/2020 | 230,937 | 232,134 | ||||||
|
| |||||||
| $ | 264,304 | |||||||
|
| |||||||
| Municipals – 1.7% | ||||||||
| Bridgeview, IL, Stadium and Redevelopment Projects, 5.14%, 12/01/2036 | $ | 195,000 | $ | 195,298 | ||||
7
Table of Contents
MFS Strategic Income Portfolio
Portfolio of Investments (unaudited) – continued
| Issuer | Shares/Par | Value ($) | ||||||
| BONDS – continued | ||||||||
| Municipals – continued | ||||||||
| New Jersey Economic Development Authority State Pension Funding Rev., Capital Appreciation, “B”, 0%, 2/15/2023 | $ | 350,000 | $ | 318,115 | ||||
| Puerto Rico Electric Power Authority Rev., “A”, 5%, 7/01/2042 (a)(d) | 5,000 | 3,912 | ||||||
| Puerto Rico Electric Power Authority Rev., “ZZ”, 5%, 7/01/2022 (a)(d) | 75,000 | 58,219 | ||||||
| Puerto Rico Sales Tax Financing Corp., Restructured Sales Tax Rev.,“2019A-1”, 4.5%, 7/01/2034 | 8,000 | 8,254 | ||||||
| Puerto Rico Sales Tax Financing Corp., Restructured Sales Tax Rev.,“2019A-1”, 4.55%, 7/01/2040 | 4,000 | 4,000 | ||||||
| Puerto Rico Sales Tax Financing Corp., Restructured Sales Tax Rev.,“2019A-1”, 4.75%, 7/01/2053 | 31,000 | 30,134 | ||||||
| Puerto Rico Sales Tax Financing Corp., Restructured Sales Tax Rev.,“2019A-1”, 5%, 7/01/2058 | 78,000 | 78,000 | ||||||
| Puerto Rico Sales Tax Financing Corp., Restructured Sales Tax Rev., Capital Appreciation,“2019A-1”, 0%, 7/01/2024 | 4,000 | 3,400 | ||||||
| Puerto Rico Sales Tax Financing Corp., Restructured Sales Tax Rev., Capital Appreciation,“2019A-1”, 0%, 7/01/2027 | 8,000 | 6,123 | ||||||
| Puerto Rico Sales Tax Financing Corp., Restructured Sales Tax Rev., Capital Appreciation,“2019A-1”, 0%, 7/01/2029 | 8,000 | 5,606 | ||||||
| Puerto Rico Sales Tax Financing Corp., Restructured Sales Tax Rev., Capital Appreciation,“2019A-1”, 0%, 7/01/2031 | 10,000 | 6,257 | ||||||
| Puerto Rico Sales Tax Financing Corp., Restructured Sales Tax Rev., Capital Appreciation,“2019A-1”, 0%, 7/01/2033 | 11,000 | 6,143 | ||||||
| Puerto Rico Sales Tax Financing Corp., Restructured Sales Tax Rev., Capital Appreciation,“2019A-1”, 0%, 7/01/2046 | 108,000 | 24,700 | ||||||
| Puerto Rico Sales Tax Financing Corp., Restructured Sales Tax Rev., Capital Appreciation,“2019A-1”, 0%, 7/01/2051 | 88,000 | 14,845 | ||||||
|
| |||||||
| $ | 763,006 | |||||||
|
| |||||||
| Network & Telecom – 0.7% | ||||||||
| AT&T, Inc., 3.8%, 2/15/2027 | $ | 125,000 | $ | 130,084 | ||||
| AT&T, Inc., 5.45%, 3/01/2047 | 169,000 | 194,151 | ||||||
|
| |||||||
| $ | 324,235 | |||||||
|
| |||||||
| Oils – 0.2% | ||||||||
| Marathon Petroleum Corp., 3.8%, 4/01/2028 | $ | 103,000 | $ | 104,690 | ||||
|
| |||||||
| Other Banks & Diversified Financials – 0.7% |
| |||||||
| Compass Bank, 2.875%, 6/29/2022 | $ | 250,000 | $ | 252,114 | ||||
| JSC Kazkommertsbank, 5.5%, 12/21/2022 | 72,530 | 72,676 | ||||||
|
| |||||||
| $ | 324,790 | |||||||
|
| |||||||
| Issuer | Shares/Par | Value ($) | ||||||
| BONDS – continued | ||||||||
| Pharmaceuticals – 0.4% | ||||||||
| Actavis Funding SCS, 3.8%, 3/15/2025 | $ | 179,000 | $ | 185,761 | ||||
|
| |||||||
| Supermarkets – 0.5% | ||||||||
| Eurotorg LLC Via Bonitron DAC, 8.75%, 10/30/2022 | $ | 209,000 | $ | 220,495 | ||||
|
| |||||||
| Supranational – 0.8% | ||||||||
| Corporacion Andina de Fomento, 4.375%, 6/15/2022 | $ | 340,000 | $ | 357,755 | ||||
|
| |||||||
| Telecommunications – Wireless – 1.1% |
| |||||||
| American Tower Corp., REIT, 3.55%, 7/15/2027 | $ | 358,000 | $ | 364,910 | ||||
| American Tower Corp., REIT, 3.6%, 1/15/2028 | 125,000 | 127,244 | ||||||
|
| |||||||
| $ | 492,154 | |||||||
|
| |||||||
| Tobacco – 0.5% | ||||||||
| Altria Group, Inc., 4.8%, 2/14/2029 | $ | 227,000 | $ | 244,205 | ||||
|
| |||||||
| Transportation – Services – 1.0% | ||||||||
| ERAC USA Finance LLC, 3.8%, 11/01/2025 (n) | $ | 267,000 | $ | 282,719 | ||||
| GMR Hyderabad International Airport Ltd., 4.25%, 10/27/2027 | 200,000 | 181,933 | ||||||
|
| |||||||
| $ | 464,652 | |||||||
|
| |||||||
| U.S. Government Agencies and Equivalents – 0.2% |
| |||||||
| Small Business Administration, 6.35%, 4/01/2021 | $ | 1,238 | $ | 1,264 | ||||
| Small Business Administration, 4.77%, 4/01/2024 | 17,161 | 17,881 | ||||||
| Small Business Administration, 4.99%, 9/01/2024 | 13,719 | 14,380 | ||||||
| Small Business Administration, 4.86%, 1/01/2025 | 16,829 | 17,589 | ||||||
| Small Business Administration, 4.625%, 2/01/2025 | 23,239 | 24,240 | ||||||
| Small Business Administration, 5.11%, 8/01/2025 | 18,701 | 19,650 | ||||||
|
| |||||||
| $ | 95,004 | |||||||
|
| |||||||
| U.S. Treasury Obligations – 6.2% | ||||||||
| U.S. Treasury Bonds, 4.75%, 2/15/2037 | $ | 54,000 | $ | 73,946 | ||||
| U.S. Treasury Bonds, 2.5%, 2/15/2045 (f) | 1,099,000 | 1,094,836 | ||||||
| U.S. Treasury Bonds, 3%, 2/15/2048 | 260,000 | 284,832 | ||||||
| U.S. Treasury Notes, 1.75%, 11/30/2021 | 450,000 | 450,141 | ||||||
| U.S. Treasury Notes, 2.5%, 8/15/2023 | 900,000 | 927,176 | ||||||
|
| |||||||
| $ | 2,830,931 | |||||||
|
| |||||||
| Utilities – Electric Power – 2.0% | ||||||||
| Adani Green Energy (UP) Ltd./Prayatna Developers Private Ltd., 6.25%, 12/10/2024 (n) | $ | 200,000 | $ | 204,212 | ||||
| Enel Finance International N.V., 3.625%, 5/25/2027 (n) | 280,000 | 281,278 | ||||||
| Enel Finance International N.V., 4.875%, 6/14/2029 (n) | 200,000 | 219,530 | ||||||
8
Table of Contents
MFS Strategic Income Portfolio
Portfolio of Investments (unaudited) – continued
| Issuer | Shares/Par | Value ($) | ||||||
| BONDS – continued | ||||||||
| Utilities – Electric Power – continued |
| |||||||
| Firstenergy Corp., 4.85%, 7/15/2047 | $ | 190,000 | $ | 215,985 | ||||
|
| |||||||
| $ | 921,005 | |||||||
|
| |||||||
| Total Bonds (Identified Cost, $33,152,059) | $ | 33,999,344 | ||||||
|
| |||||||
| COMMON STOCKS – 0.0% |
| |||||||
| Energy – Independent – 0.0% | ||||||||
| Frontera Energy Corp. (Identified Cost, $106,984) | 1,188 | $ | 11,880 | |||||
|
| |||||||
| INVESTMENT COMPANIES (h) – 24.6% |
| |||||||
| Bond Funds – 15.8% | ||||||||
| MFS High Yield Pooled Portfolio (v) | 777,231 | $ | 7,150,528 | |||||
|
| |||||||
| Money Market Funds – 8.8% |
| |||||||
| MFS Institutional Money Market Portfolio, 2.42% (v) | 4,007,181 | $ | 4,007,582 | |||||
|
| |||||||
| Total Investment Companies (Identified Cost, $11,970,648) | $ | 11,158,110 | ||||||
|
| |||||||
| Underlying/ Expiration Date/ Exercise Price | Put/ Call | Counter- party | Notional Amount | Par Amount/ Number of Contracts | Value ($) | |||||||||||
| PURCHASED OPTIONS – 0.1% |
| |||||||||||||||
| Market Index Securities – 0.1% |
| |||||||||||||||
| Markit CDX North America Investment Grade Index – December 2019 @ $65 (Premiums Paid, $17,662) | Put | Goldman Sachs International | $ | 4,597,190 | $ | 4,500,000 | $ | 12,660 | ||||||||
|
| |||||||||||||||
| U.S. Treasury Obligations – 0.0% |
| |||||||||||||||
| U.S. Treasury Note 10 yr Futures – August 2019 @ $122 (Premiums Paid, $7,643) | Put | Merrill Lynch International | $ | 2,815,313 | $ | 22 | $ | 688 | ||||||||
|
| |||||||||||||||
| Total Purchased Options (Premiums Paid, $25,305) |
| $ | 13,348 | |||||||||||||
|
| |||||||||||||||
| OTHER ASSETS, LESS LIABILITIES – 0.4% |
| 192,957 | ||||||||||||||
|
| |||||||||||||||
| NET ASSETS – 100.0% |
| $ | 45,375,639 | |||||||||||||
|
| |||||||||||||||
| (a) | Non-income producing security. |
| (d) | In default. |
| (f) | All or a portion of the security has been segregated as collateral for open futures contracts. |
| (h) | An affiliated issuer, which may be considered one in which the fund owns 5% or more of the outstanding voting securities, or a company which is under common control. At period end, the aggregate values of the fund’s investments in affiliated issuers and in unaffiliated issuers were $11,158,110 and $34,024,572, respectively. |
| (i) | Interest only security for which the fund receives interest on notional principal (Par amount). Par amount shown is the notional principal and does not reflect the cost of the security. |
| (n) | Securities exempt from registration under Rule 144A of the Securities Act of 1933. These securities may be sold in the ordinary course of business in transactions exempt from registration, normally to qualified institutional buyers. At period end, the aggregate value of these securities was $8,517,643, representing 18.8% of net assets. |
| (p) | Payment-in-kind (PIK) security for which interest income may be received in additional securities and/or cash. |
| (v) | Affiliated issuer that is available only to investment companies managed by MFS. The rate quoted for the MFS Institutional Money Market Portfolio is the annualizedseven-day yield of the fund at period end. |
| (w) | When-issued security. At June 30, 2019, the fund had sufficient cash and/or securities at least equal to the value of the when-issued security. |
| (z) | Restricted securities are not registered under the Securities Act of 1933 and are subject to legal restrictions on resale. These securities generally may be resold in transactions exempt from registration or to the public if the securities are subsequently registered. Disposal of these securities may involve time-consuming negotiations and prompt sale at an acceptable price may be difficult. The fund holds the following restricted securities: |
| Restricted Securities | Acquisition Date | Cost | Value | |||||||
| Allegro CLO Ltd.,2014-1RA, “C”, FLR, 5.591% (LIBOR - 3mo. + 3%), 10/21/2028 | 8/22/18 | $250,000 | $247,421 | |||||||
| Allegro CLO Ltd.,2015-1X, “CR”, FLR, 4.23% (LIBOR - 3mo. + 1.65%), 7/25/2027 | 3/06/19 | 247,286 | 246,222 | |||||||
| Arbor Realty Trust, Inc., CLO,2019-FL1, “D”, FLR, 5% (LIBOR - 1mo. + 2.5%), 5/15/2037 | 5/14/19 | 244,000 | 245,066 | |||||||
| Bancorp Commercial Mortgage Trust,2018-CR3, “D”, FLR, 5.094% (LIBOR - 1mo. + 2.7%), 1/15/2033 | 3/13/18-9/06/18 | 248,157 | 249,345 | |||||||
| Bancorp Commercial Mortgage Trust, 2018-CRE4, “D”, FLR, 4.494% (LIBOR - 1mo. + 2.1%), 9/15/2035 | 9/17/18 | 200,000 | 200,434 | |||||||
| Bancorp Commercial Mortgage Trust, 2019-CRE5, “D”, FLR, 4.744% (LIBOR - 1mo. + 2.35%), 3/15/2036 | 3/08/19 | 280,000 | 280,000 | |||||||
9
Table of Contents
MFS Strategic Income Portfolio
Portfolio of Investments (unaudited) – continued
| Restricted Securities - continued | Acquisition Date | Cost | Value | |||||||
| Bayview Financial Revolving Mortgage Loan Trust, FLR, 4.002% (LIBOR - 1mo. + 1.6%), 12/28/2040 | 3/01/06 | $137,423 | $132,422 | |||||||
| BDS Ltd.,2018-FL2, “C”, FLR, 4.244% (LIBOR - 1mo. + 1.85%), 8/15/2035 | 7/25/18 | 200,000 | 200,503 | |||||||
| BSPRT Ltd.,2019-FL5, “C”, FLR, 4.478% (LIBOR - 1mo. + 2%), 5/15/2029 | 5/20/19 | 245,000 | 245,153 | |||||||
| Business Jet Securities LLC,2018-1, “C”, 7.748%, 2/15/2033 | 2/21/18 | 78,803 | 80,901 | |||||||
| Cutwater Ltd.,2015-IA, “BR”, FLR, 4.396% (LIBOR - 3mo. + 1.8%), 1/15/2029 | 8/15/18 | 250,000 | 249,182 | |||||||
| Falcon Franchise Loan LLC, 8.886%, 1/05/2023 | 1/18/02 | 208 | 207 | |||||||
| Figueroa CLO Ltd.,2014-1A, “DR”, FLR, 5.846% (LIBOR - 3mo. + 3.25%), 1/15/2027 | 1/28/18 | 250,000 | 249,368 | |||||||
| Hunt CRE Ltd.,2018-FL2, “D”, FLR, 5.144% (LIBOR - 1mo. + 2.75%), 8/15/2028 | 8/03/18 | 200,000 | 200,500 | |||||||
| Invitation Homes Trust, 2018-SFR1, “C”, FLR, 3.644% (LIBOR - 1mo. + 1.25%), 3/17/2037 | 1/26/18 | 130,000 | 129,313 | |||||||
| KKR Real Estate Financial Trust, Inc. Ltd.,2018-FL1, “D”, FLR, 4.944% (LIBOR - 1mo. + 2.55%), 6/15/2036 | 11/07/18 | 205,000 | 206,537 | |||||||
| LoanCore Ltd., 2018-CRE1, “C”, FLR, 4.344% (LIBOR - 1mo. + 1.95%), 4/15/2034 | 5/13/19 | 243,500 | 244,486 | |||||||
| LoanCore Ltd., 2019-CRE2, “D”, FLR, 4.844% (LIBOR - 1mo. + 2.45%), 5/09/2036 | 5/07/19 | 209,000 | 210,049 | |||||||
| Navistar Financial Dealer Note Master Owner Trust II,2018-1, FLR, 3.954% (LIBOR - 1mo. + 1.55%), 9/25/2023 | 9/17/18 | 269,000 | 269,538 | |||||||
| NextGear Floorplan Master Owner Trust,2018-1A, “B”, 3.57%, 2/15/2023 | 3/06/18 | 199,986 | 202,947 | |||||||
| Republic of Kenya, 8%, 5/22/2032 | 5/15/19 | 200,000 | 211,323 | |||||||
| Wind River CLO Ltd.,2012-1A, “CR2”, 1%, 1/15/2026 | 6/19/19 | 250,000 | 250,000 | |||||||
| Total Restricted Securities | $4,550,917 | |||||||||
| % of Net assets | 10.0% | |||||||||
The following abbreviations are used in this report and are defined:
| CDO | Collateralized Debt Obligation |
| CLO | Collateralized Loan Obligation |
| FLR | Floating Rate. Interest rate resets periodically based on the parenthetically disclosed reference rate plus a spread (if any). Theperiod-end rate reported may not be the current rate. All reference rates are USD unless otherwise noted. |
| LIBOR | London Interbank Offered Rate |
| REIT | Real Estate Investment Trust |
Abbreviations indicate amounts shown in currencies other than the U.S. dollar. All amounts are stated in U.S. dollars unless otherwise indicated. A list of abbreviations is shown below:
| EUR | Euro |
| IDR | Indonesian Rupiah |
| JPY | Japanese Yen |
| MXN | Mexican Peso |
| PHP | Philippine Peso |
| ZAR | South African Rand |
Derivative Contracts at 6/30/19
Forward Foreign Currency Exchange Contracts
| Currency Purchased | Currency Sold | Counterparty | Settlement Date | Unrealized Appreciation (Depreciation) | ||||||||||||||||
| Asset Derivatives | ||||||||||||||||||||
| EUR | 103,301 | USD | 117,427 | Merrill Lynch International | 7/12/2019 | $135 | ||||||||||||||
| EUR | 103,640 | USD | 116,709 | UBS AG | 7/12/2019 | 1,240 | ||||||||||||||
| PHP | 18,075,000 | USD | 347,555 | JPMorgan Chase Bank N.A. | 7/10/2019 | 5,142 | ||||||||||||||
| ZAR | 1,460,207 | USD | 100,284 | Barclays Bank PLC | 7/12/2019 | 3,257 | ||||||||||||||
| ZAR | 1,629,023 | USD | 111,264 | JPMorgan Chase Bank N.A. | 7/12/2019 | 4,248 | ||||||||||||||
| ZAR | 29,000 | USD | 1,997 | State Street Bank Corp. | 7/12/2019 | 59 | ||||||||||||||
|
| |||||||||||||||||||
| $14,081 | ||||||||||||||||||||
|
| |||||||||||||||||||
10
Table of Contents
MFS Strategic Income Portfolio
Portfolio of Investments (unaudited) – continued
Forward Foreign Currency Exchange Contracts - continued
| Currency Purchased | Currency Sold | Counterparty | Settlement Date | Unrealized Appreciation (Depreciation) | ||||||||||||||||
| Liability Derivatives | ||||||||||||||||||||
| MXN | 192 | USD | 10 | JPMorgan Chase Bank N.A. | 7/12/2019 | $(0 | ) | |||||||||||||
| USD | 463,441 | EUR | 408,390 | Merrill Lynch International | 7/12/2019 | (1,332 | ) | |||||||||||||
| USD | 113,409 | IDR | 1,617,217,000 | JPMorgan Chase Bank N.A. | 8/26/2019 | (350 | ) | |||||||||||||
| USD | 458,445 | JPY | 50,000,000 | JPMorgan Chase Bank N.A. | 7/10/2019 | (5,615 | ) | |||||||||||||
| USD | 343,644 | PHP | 18,075,000 | JPMorgan Chase Bank N.A. | 7/10/2019 | (9,052 | ) | |||||||||||||
| USD | 114,404 | ZAR | 1,636,908 | BNP Paribas S.A. | 7/12/2019 | (1,667 | ) | |||||||||||||
| USD | 221,009 | ZAR | 3,134,240 | JPMorgan Chase Bank N.A. | 7/12/2019 | (1,236 | ) | |||||||||||||
| USD | 2,517 | ZAR | 36,000 | State Street Bank Corp. | 7/12/2019 | (36 | ) | |||||||||||||
|
| |||||||||||||||||||
| $(19,288 | ) | |||||||||||||||||||
|
| |||||||||||||||||||
Futures Contracts
| Description | Long/ Short | Currency | Contracts | Notional Amount | Expiration Date | Value/Unrealized Appreciation (Depreciation) | ||||||||||||||||
| Asset Derivatives |
| |||||||||||||||||||||
| Interest Rate Futures |
| |||||||||||||||||||||
| U.S. Treasury Note 2 yr | Long | USD | 44 | $9,467,906 | September - 2019 | $45,220 | ||||||||||||||||
| U.S. Treasury Note 5 yr | Long | USD | 12 | 1,417,875 | September - 2019 | 14,676 | ||||||||||||||||
| U.S. Treasury Ultra Bond | Long | USD | 11 | 1,953,188 | September - 2019 | 44,683 | ||||||||||||||||
|
| |||||||||||||||||||||
| $104,579 | ||||||||||||||||||||||
|
| |||||||||||||||||||||
| Liability Derivatives |
| |||||||||||||||||||||
| Interest Rate Futures |
| |||||||||||||||||||||
| U.S. Treasury Ultra Note 10 yr | Short | USD | 14 | $1,933,750 | September - 2019 | $(35,051 | ) | |||||||||||||||
|
| |||||||||||||||||||||
At June 30, 2019, the fund had liquid securities with an aggregate value of $60,769 to cover any collateral or margin obligations for certain derivative contracts.
See Notes to Financial Statements
11
Table of Contents
MFS Strategic Income Portfolio
FINANCIAL STATEMENTS | STATEMENT OF ASSETS AND LIABILITIES (unaudited)
This statement represents your fund’s balance sheet, which details the assets and liabilities comprising the total value of the fund.
At 6/30/19 | ||||
Assets | ||||
Investments in unaffiliated issuers, at value (identified cost, $33,284,348) | $34,024,572 | |||
Investments in affiliated issuers, at value (identified cost, $11,970,648) | 11,158,110 | |||
Cash | 3,591 | |||
Receivables for | ||||
Forward foreign currency exchange contracts | 14,081 | |||
Investments sold | 463,421 | |||
Fund shares sold | 2,800 | |||
Interest | 270,817 | |||
Receivable from investment adviser | 7,285 | |||
Other assets | 296 | |||
Total assets | $45,944,973 | |||
Liabilities | ||||
Payables for | ||||
Forward foreign currency exchange contracts | $19,288 | |||
Net daily variation margin on open futures contracts | 4,204 | |||
Fund shares reacquired | 232,278 | |||
When-issued investments purchased | 250,000 | |||
Payable to affiliates | ||||
Administrative services fee | 192 | |||
Shareholder servicing costs | 48 | |||
Distribution and/or service fees | 177 | |||
Payable for independent Trustees’ compensation | 100 | |||
Accrued expenses and other liabilities | 63,047 | |||
Total liabilities | $569,334 | |||
Net assets | $45,375,639 | |||
Net assets consist of | ||||
Paid-in capital | $43,849,914 | |||
Total distributable earnings (loss) | 1,525,725 | |||
Net assets | $45,375,639 | |||
Shares of beneficial interest outstanding | 4,530,527 | |||
| Net assets | Shares outstanding | Net asset value per share | ||||||||||
Initial Class | $38,914,685 | 3,880,386 | $10.03 | |||||||||
Service Class | 6,460,954 | 650,141 | 9.94 | |||||||||
See Notes to Financial Statements
12
Table of Contents
MFS Strategic Income Portfolio
FINANCIAL STATEMENTS | STATEMENT OF OPERATIONS (unaudited)
This statement describes how much your fund earned in investment income and accrued in expenses. It also describes any gains and/or losses generated by fund operations.
Six months ended 6/30/19 | ||||
Net investment income (loss) | ||||
Income | ||||
Interest | $747,479 | |||
Dividends from affiliated issuers | 261,577 | |||
Dividends | 434 | |||
Other | 17 | |||
Foreign taxes withheld | (410 | ) | ||
Total investment income | $1,009,097 | |||
Expenses | ||||
Management fee | $156,218 | |||
Distribution and/or service fees | 8,091 | |||
Shareholder servicing costs | 4,107 | |||
Administrative services fee | 8,679 | |||
Independent Trustees’ compensation | 863 | |||
Custodian fee | 5,284 | |||
Shareholder communications | 7,988 | |||
Audit and tax fees | 39,514 | |||
Legal fees | 299 | |||
Miscellaneous | 16,211 | |||
Total expenses | $247,254 | |||
Reduction of expenses by investment adviser | (59,127 | ) | ||
Net expenses | $188,127 | |||
Net investment income (loss) | $820,970 | |||
Realized and unrealized gain (loss) | ||||
Realized gain (loss) (identified cost basis) | ||||
Unaffiliated issuers | $251,089 | |||
Affiliated issuers | 21,815 | |||
Futures contracts | 161,217 | |||
Swap agreements | (27,664 | ) | ||
Forward foreign currency exchange contracts | 14,380 | |||
Foreign currency | 37,832 | |||
Net realized gain (loss) | $458,669 | |||
Change in unrealized appreciation or depreciation | ||||
Unaffiliated issuers | $1,844,798 | |||
Affiliated issuers | 475,626 | |||
Futures contracts | (23,671 | ) | ||
Swap agreements | 6,904 | |||
Forward foreign currency exchange contracts | 43,678 | |||
Translation of assets and liabilities in foreign currencies | (44,378 | ) | ||
Net unrealized gain (loss) | $2,302,957 | |||
Net realized and unrealized gain (loss) | $2,761,626 | |||
Change in net assets from operations | $3,582,596 | |||
See Notes to Financial Statements
13
Table of Contents
MFS Strategic Income Portfolio
FINANCIAL STATEMENTS | STATEMENTS OF CHANGES IN NET ASSETS
These statements describe the increases and/or decreases in net assets resulting from operations, any distributions, and any shareholder transactions.
| Six months ended 6/30/19 | Year ended 12/31/18 | |||||||
| (unaudited) | ||||||||
Change in net assets | ||||||||
From operations | ||||||||
Net investment income (loss) | $820,970 | $1,579,876 | ||||||
Net realized gain (loss) | 458,669 | (1,005,609 | ) | |||||
Net unrealized gain (loss) | 2,302,957 | (1,556,805 | ) | |||||
Change in net assets from operations | $3,582,596 | $(982,538 | ) | |||||
Total distributions to shareholders | $— | $(1,829,013 | ) | |||||
Change in net assets from fund share transactions | $(2,931,722 | ) | $(2,160,371 | ) | ||||
Total change in net assets | $650,874 | $(4,971,922 | ) | |||||
Net assets | ||||||||
At beginning of period | 44,724,765 | 49,696,687 | ||||||
At end of period | $45,375,639 | $44,724,765 | ||||||
See Notes to Financial Statements
14
Table of Contents
MFS Strategic Income Portfolio
FINANCIAL STATEMENTS | FINANCIAL HIGHLIGHTS
The financial highlights table is intended to help you understand the fund’s financial performance for the semiannual period and the past 5 fiscal years. Certain information reflects financial results for a single fund share. The total returns in the table represent the rate that an investor would have earned (or lost) on an investment in the fund share class (assuming reinvestment of all distributions) held for the entire period.
| Initial Class | Six months ended 6/30/19 | Year ended | ||||||||||||||||||||||
| 12/31/18 | 12/31/17 | 12/31/16 | 12/31/15 | 12/31/14 | ||||||||||||||||||||
| (unaudited) | ||||||||||||||||||||||||
Net asset value, beginning of period | $9.26 | $9.84 | $9.71 | $9.25 | $10.01 | $10.01 | ||||||||||||||||||
| Income (loss) from investment operations | ||||||||||||||||||||||||
Net investment income (loss) (d) | $0.18 | $0.33 | $0.34 | $0.40 | (c) | $0.37 | $0.41 | |||||||||||||||||
Net realized and unrealized gain (loss) | 0.59 | (0.52 | ) | 0.26 | 0.37 | (0.55 | ) | (0.08 | ) | |||||||||||||||
Total from investment operations | $0.77 | $(0.19 | ) | $0.60 | $0.77 | $(0.18 | ) | $0.33 | ||||||||||||||||
| Less distributions declared to shareholders | ||||||||||||||||||||||||
From net investment income | $— | $(0.39 | ) | $(0.47 | ) | $(0.31 | ) | $(0.58 | ) | $(0.33 | ) | |||||||||||||
Net asset value, end of period (x) | $10.03 | $9.26 | $9.84 | $9.71 | $9.25 | $10.01 | ||||||||||||||||||
Total return (%) (k)(r)(s)(x) | 8.32 | (n) | (1.99 | ) | 6.24 | 8.24 | (c) | (1.85 | ) | 3.27 | ||||||||||||||
| Ratios (%) (to average net assets) and Supplemental data: | ||||||||||||||||||||||||
Expenses before expense reductions (f)(h) | 1.07 | (a) | 1.03 | 1.02 | 0.89 | (c) | 0.96 | 0.94 | ||||||||||||||||
Expenses after expense reductions (f)(h) | 0.81 | (a) | 0.80 | 0.80 | 0.71 | (c) | 0.80 | 0.80 | ||||||||||||||||
Net investment income (loss) | 3.71 | (a) | 3.42 | 3.39 | 4.09 | (c) | 3.74 | 4.05 | ||||||||||||||||
Portfolio turnover | 50 | (n) | 59 | 72 | 21 | 31 | 21 | |||||||||||||||||
Net assets at end of period (000 omitted) | $38,915 | $38,111 | $42,409 | $44,191 | $47,422 | $59,824 | ||||||||||||||||||
| Service Class | Six months 6/30/19 | Year ended | ||||||||||||||||||||||
| 12/31/18 | 12/31/17 | 12/31/16 | 12/31/15 | 12/31/14 | ||||||||||||||||||||
| (unaudited) | ||||||||||||||||||||||||
Net asset value, beginning of period | $9.19 | $9.75 | $9.63 | $9.17 | $9.92 | $9.93 | ||||||||||||||||||
| Income (loss) from investment operations | ||||||||||||||||||||||||
Net investment income (loss) (d) | $0.16 | $0.30 | $0.31 | $0.37 | (c) | $0.34 | $0.39 | |||||||||||||||||
Net realized and unrealized gain (loss) | 0.59 | (0.50 | ) | 0.25 | 0.37 | (0.54 | ) | (0.09 | ) | |||||||||||||||
Total from investment operations | $0.75 | $(0.20 | ) | $0.56 | $0.74 | $(0.20 | ) | $0.30 | ||||||||||||||||
| Less distributions declared to shareholders | ||||||||||||||||||||||||
From net investment income | $— | $(0.36 | ) | $(0.44 | ) | $(0.28 | ) | $(0.55 | ) | $(0.31 | ) | |||||||||||||
Net asset value, end of period (x) | $9.94 | $9.19 | $9.75 | $9.63 | $9.17 | $9.92 | ||||||||||||||||||
Total return (%) (k)(r)(s)(x) | 8.16 | (n) | (2.11 | ) | 5.88 | 8.00 | (c) | (2.06 | ) | 2.99 | ||||||||||||||
| Ratios (%) (to average net assets) and Supplemental data: | ||||||||||||||||||||||||
Expenses before expense reductions (f)(h) | 1.32 | (a) | 1.28 | 1.27 | 1.14 | (c) | 1.21 | 1.19 | ||||||||||||||||
Expenses after expense reductions (f)(h) | 1.06 | (a) | 1.05 | 1.05 | 0.97 | (c) | 1.05 | 1.05 | ||||||||||||||||
Net investment income (loss) | 3.46 | (a) | 3.17 | 3.16 | 3.83 | (c) | 3.49 | 3.80 | ||||||||||||||||
Portfolio turnover | 50 | (n) | 59 | 72 | 21 | 31 | 21 | |||||||||||||||||
Net assets at end of period (000 omitted) | $6,461 | $6,614 | $7,287 | $8,776 | $9,548 | $10,719 | ||||||||||||||||||
See Notes to Financial Statements
15
Table of Contents
MFS Strategic Income Portfolio
Financial Highlights – continued
| (a) | Annualized. |
| (c) | Amount reflects aone-time reimbursement of expenses by the custodian (or former custodian) without which net investment income and performance would be lower and expenses would be higher. |
| (d) | Per share data is based on average shares outstanding. |
| (f) | Ratios do not reflect reductions from fees paid indirectly, if applicable. |
| (h) | In addition to the fees and expenses which the fund bears directly, the fund indirectly bears a pro rata share of the fees and expenses of the underlying affiliated funds in which the fund invests. Accordingly, the expense ratio for the fund reflects only those fees and expenses borne directly by the fund. Because the underlying affiliated funds have varied expense and fee levels and the fund may own different proportions of the underlying affiliated funds at different times, the amount of fees and expenses incurred indirectly by the fund will vary. |
| (k) | The total return does not reflect expenses that apply to separate accounts. Inclusion of these charges would reduce the total return figures for all periods shown. |
| (n) | Not annualized. |
| (r) | Certain expenses have been reduced without which performance would have been lower. |
| (s) | From time to time the fund may receive proceeds from litigation settlements, without which performance would be lower. |
| (x) | The net asset values and total returns have been calculated on net assets which include adjustments made in accordance with U.S. generally accepted accounting principles required at period end for financial reporting purposes. |
See Notes to Financial Statements
16
Table of Contents
MFS Strategic Income Portfolio
NOTES TO FINANCIAL STATEMENTS (unaudited)
| (1) | Business and Organization |
MFS Strategic Income Portfolio (the fund) is a diversified series of MFS Variable Insurance Trust II (the trust). The trust is organized as a Massachusetts business trust and is registered under the Investment Company Act of 1940, as amended, as anopen-end management investment company. The shareholders of each series of the trust are separate accounts of insurance companies, which offer variable annuity and/or life insurance products, and qualified retirement and pension plans.
The fund is an investment company and accordingly follows the investment company accounting and reporting guidance of the Financial Accounting Standards Board (FASB) Accounting Standards Codification Topic 946 Financial Services – Investment Companies.
| (2) | Significant Accounting Policies |
General– The preparation of financial statements in conformity with U.S. generally accepted accounting principles requires management to make estimates and assumptions that affect the reported amounts of assets and liabilities, and disclosure of contingent assets and liabilities at the date of the financial statements and the reported amounts of increases and decreases in net assets from operations during the reporting period. Actual results could differ from those estimates. In the preparation of these financial statements, management has evaluated subsequent events occurring after the date of the fund’s Statement of Assets and Liabilities through the date that the financial statements were issued. The fund invests in the MFS High Yield Pooled Portfolio (“High Yield Pooled Portfolio”). MFS does not receive a management fee from the High Yield Pooled Portfolio. The High Yield Pooled Portfolio’s investment objective is to seek total return with an emphasis on high current income, but also considering capital appreciation. The accounting policies of the High Yield Pooled Portfolio are outlined in its shareholder report, which is available without charge by calling1-800-225-2606 and on the Securities and Exchange Commission (SEC) web site at http://www.sec.gov. The accounting policies detailed in the Significant Accounting Policies note cover both the fund and the High Yield Pooled Portfolio. For purposes of this policy disclosure, “fund” refers to both the fund and the High Yield Pooled Portfolio in which the fund invests. The High Yield Pooled Portfolio’s shareholder report is not covered by this report. The fund and the High Yield Pooled Portfolio invest in high-yield securities rated below investment grade. Investments in below investment grade quality securities can involve a substantially greater risk of default or can already be in default, and their values can decline significantly. Below investment grade quality securities tend to be more sensitive to adverse news about the issuer, or the market or economy in general, than higher quality debt instruments. The fund and the High Yield Pooled Portfolio invest in foreign securities. Investments in foreign securities are vulnerable to the effects of changes in the relative values of the local currency and the U.S. dollar and to the effects of changes in each country’s market, economic, industrial, political, regulatory, geopolitical, and other conditions.
In March 2017, the FASB issued Accounting Standards Update2017-08, Receivables – Nonrefundable Fees and Other Costs (Subtopic310-20) – Premium Amortization on Purchased Callable Debt Securities (“ASU2017-08”). For callable debt securities purchased at a premium that have explicit,non-contingent call features and that are callable at fixed prices on preset dates,ASU 2017-08 requires the premium to be amortized to the earliest call date. The fund adopted ASU2017-08 as of the beginning of the reporting period on a modified retrospective basis. The adoption resulted in a change in accounting principle, since the fund had historically amortized such premiums to maturity for U.S. GAAP. As a result of the adoption, the fund recognized a cumulative effect adjustment that decreased the beginning of period cost of investments and increased the unrealized appreciation on investments by offsetting amounts. Adoption had no impact on the fund’s net assets or any prior period information presented in the financial statements. With respect to the fund’s results of operations, amortization of premium to first call date under ASU2017-08 accelerates amortization with the intent of more closely aligning the recognition of income on such bonds with the economics of the instrument.
Balance Sheet Offsetting– The fund’s accounting policy with respect to balance sheet offsetting is that, absent an event of default by the counterparty or a termination of the agreement, the International Swaps and Derivatives Association (ISDA) Master Agreement, or similar agreement, does not result in an offset of reported amounts of financial assets and financial liabilities in the Statement of Assets and Liabilities across transactions between the fund and the applicable counterparty. The fund’s right to setoff may be restricted or prohibited by the bankruptcy or insolvency laws of the particular jurisdiction to which a specific master netting agreement counterparty is subject. Balance sheet offsetting disclosures, to the extent applicable to the fund, have been included in the fund’s Significant Accounting Policies note under the captions for each of the fund’sin-scope financial instruments and transactions.
Investment Valuations– The investments of the fund and the High Yield Pooled Portfolio are valued as described below.
Equity securities, including restricted equity securities, are generally valued at the last sale or official closing price on their primary market or exchange as provided by a third-party pricing service. Equity securities, for which there were no sales reported that day, are generally valued at the last quoted daily bid quotation on their primary market or exchange as provided by a third-party pricing service. Debt instruments and floating rate loans, including restricted debt instruments, are generally valued at an evaluated or composite bid as provided by a third-party pricing service. Short-term instruments with a maturity at issuance of 60 days or less may be valued at amortized cost, which approximates market value. Exchange-traded options are generally valued at the last sale or
17
Table of Contents
MFS Strategic Income Portfolio
Notes to Financial Statements (unaudited) – continued
official closing price on their primary exchange as provided by a third-party pricing service. Exchange-traded options for which there were no sales reported that day are generally valued at the last daily bid quotation on their primary exchange as provided by athird-party pricing service. Options not traded on an exchange are generally valued at a broker/dealer bid quotation. Foreign currency options are generally valued at valuations provided by a third-party pricing service. Futures contracts are generally valued at last posted settlement price on their primary exchange as provided by a third-party pricing service. Futures contracts for which there were no trades that day for a particular position are generally valued at the closing bid quotation on their primary exchange as provided by a third-party pricing service. Forward foreign currency exchange contracts are generally valued at the mean of bid and asked prices for the time period interpolated from rates provided by a third-party pricing service for proximate time periods. Swap agreements are generally valued at valuations provided by a third-party pricing service, which for cleared swaps includes an evaluation of any trading activity at the clearinghouses.Open-end investment companies are generally valued at net asset value per share. Securities and other assets generally valued on the basis of information from a third-party pricing service may also be valued at a broker/dealer bid quotation. In determining values, third-party pricing services can utilize both transaction data and market information such as yield, quality, coupon rate, maturity, type of issue, trading characteristics, and other market data. The values of foreign securities and other assets and liabilities expressed in foreign currencies are converted to U.S. dollars using the mean of bid and asked prices for rates provided by a third-party pricing service.
The Board of Trustees has delegated primary responsibility for determining or causing to be determined the value of the fund’s investments (including any fair valuation) to the adviser pursuant to valuation policies and procedures approved by the Board. If the adviser determines that reliable market quotations are not readily available, investments are valued at fair value as determined in good faith by the adviser in accordance with such procedures under the oversight of the Board of Trustees. Under the fund’s valuation policies and procedures, market quotations are not considered to be readily available for most types of debt instruments and floating rate loans and many types of derivatives. These investments are generally valued at fair value based on information from third-party pricing services. In addition, investments may be valued at fair value if the adviser determines that an investment’s value has been materially affected by events occurring after the close of the exchange or market on which the investment is principally traded (such as foreign exchange or market) and prior to the determination of the fund’s net asset value, or after the halt of trading of a specific security where trading does not resume prior to the close of the exchange or market on which the security is principally traded. The adviser generally relies on third-party pricing services or other information (such as the correlation with price movements of similar securities in the same or other markets; the type, cost and investment characteristics of the security; the business and financial condition of the issuer; and trading and other market data) to assist in determining whether to fair value and at what value to fair value an investment. The value of an investment for purposes of calculating the fund’s net asset value can differ depending on the source and method used to determine value. When fair valuation is used, the value of an investment used to determine the fund’s net asset value may differ from quoted or published prices for the same investment. There can be no assurance that the fund could obtain the fair value assigned to an investment if it were to sell the investment at the same time at which the fund determines its net asset value per share.
Various inputs are used in determining the value of the fund’s assets or liabilities. These inputs are categorized into three broad levels. In certain cases, the inputs used to measure fair value may fall into different levels of the fair value hierarchy. In such cases, an investment’s level within the fair value hierarchy is based on the lowest level of input that is significant to the fair value measurement. The fund’s assessment of the significance of a particular input to the fair value measurement in its entirety requires judgment, and considers factors specific to the investment. Level 1 includes unadjusted quoted prices in active markets for identical assets or liabilities. Level 2 includes other significant observable market-based inputs (including quoted prices for similar securities, interest rates, prepayment speed, and credit risk). Level 3 includes unobservable inputs, which may include the adviser’s own
18
Table of Contents
MFS Strategic Income Portfolio
Notes to Financial Statements (unaudited) – continued
assumptions in determining the fair value of investments. Other financial instruments are derivative instruments, such as futures contracts and forward foreign currency exchange contracts. The following is a summary of the levels used as of June 30, 2019 in valuing the fund’s assets or liabilities:
| Financial Instruments | Level 1 | Level 2 | Level 3 | Total | ||||||||||||
| Equity Securities | $11,880 | $— | $— | $11,880 | ||||||||||||
| U.S. Treasury Bonds & U.S. Government Agency & Equivalents | 688 | 2,925,935 | — | 2,926,623 | ||||||||||||
| Non-U.S. Sovereign Debt | — | 3,759,702 | — | 3,759,702 | ||||||||||||
| Municipal Bonds | — | 763,006 | — | 763,006 | ||||||||||||
| U.S. Corporate Bonds | — | 9,430,360 | — | 9,430,360 | ||||||||||||
| Residential Mortgage-Backed Securities | — | 393,617 | — | 393,617 | ||||||||||||
| Commercial Mortgage-Backed Securities | — | 6,427,232 | — | 6,427,232 | ||||||||||||
| Asset-Backed Securities (including CDOs) | — | 5,793,788 | — | 5,793,788 | ||||||||||||
| Foreign Bonds | — | 4,518,364 | — | 4,518,364 | ||||||||||||
| Mutual Funds | 11,158,110 | — | — | 11,158,110 | ||||||||||||
| Total | $11,170,678 | $34,012,004 | $— | $45,182,682 | ||||||||||||
| Other Financial Instruments | ||||||||||||||||
| Futures Contracts – Assets | $104,579 | $— | $— | $104,579 | ||||||||||||
| Futures Contracts – Liabilities | (35,051 | ) | — | — | (35,051 | ) | ||||||||||
| Forward Foreign Currency Exchange Contracts – Assets | — | 14,081 | — | 14,081 | ||||||||||||
| Forward Foreign Currency Exchange Contracts – Liabilities | — | (19,288 | ) | — | (19,288 | ) | ||||||||||
For further information regarding security characteristics, see the Portfolio of Investments. Please refer to the High Yield Pooled Portfolio’s shareholder report for further information regarding the levels used in valuing its assets or liabilities.
Foreign Currency Translation– Purchases and sales of foreign investments, income, and expenses are converted into U.S. dollars based upon currency exchange rates prevailing on the respective dates of such transactions or on the reporting date for foreign denominated receivables and payables. Gains and losses attributable to foreign currency exchange rates on sales of securities are recorded for financial statement purposes as net realized gains and losses on investments. Gains and losses attributable to foreign exchange rate movements on receivables, payables, income and expenses are recorded for financial statement purposes as foreign currency transaction gains and losses. That portion of both realized and unrealized gains and losses on investments that results from fluctuations in foreign currency exchange rates is not separately disclosed.
Derivatives– The fund uses derivatives primarily to increase or decrease exposure to a particular market or segment of the market, or security, to increase or decrease interest rate or currency exposure, or as alternatives to direct investments. Derivatives are used for hedging ornon-hedging purposes. While hedging can reduce or eliminate losses, it can also reduce or eliminate gains. When the fund uses derivatives as an investment to increase market exposure, or for hedging purposes, gains and losses from derivative instruments may be substantially greater than the derivative’s original cost.
The derivative instruments used by the fund during the period were purchased options, futures contracts, forward foreign currency exchange contracts, and swap agreements. Depending on the type of derivative, the fund may exit a derivative position by entering into an offsetting transaction with a counterparty or exchange, negotiating an agreement with the derivative counterparty, or novating the position to a third party. The fund may be unable to promptly close out a futures position in instances where the daily fluctuation in the price for that type of future exceeds the daily limit set by the exchange. The fund’s period end derivatives, as presented in the Portfolio of Investments and the associated Derivative Contract tables, generally are indicative of the volume of its derivative activity during the period.
The following table presents, by major type of derivative contract, the fair value, on a gross basis, of the asset and liability components of derivatives held by the fund at June 30, 2019 as reported in the Statement of Assets and Liabilities:
| Fair Value (a) | ||||||||||
| Risk | Derivative Contracts | Asset Derivatives | Liability Derivatives | |||||||
| Interest Rate | Interest Rate Futures | $104,579 | $(35,051 | ) | ||||||
| Interest Rate | Purchased Interest Rate Options | 13,348 | — | |||||||
| Foreign Exchange | Forward Foreign Currency Exchange Contracts | 14,081 | (19,288 | ) | ||||||
| Total | $132,008 | $(54,339 | ) | |||||||
| (a) | The value of purchased options outstanding is included in investments in unaffiliated issuers, at value, within the fund’s Statement of Assets and Liabilities. Values presented in this table for futures contracts correspond to the values reported in the fund’s Portfolio of Investments. Only the current day net variation margin for futures contracts is separately reported within the fund’s Statement of Assets and Liabilities. |
19
Table of Contents
MFS Strategic Income Portfolio
Notes to Financial Statements (unaudited) – continued
The following table presents, by major type of derivative contract, the realized gain (loss) on derivatives held by the fund for the six months ended June 30, 2019 as reported in the Statement of Operations:
| Risk | Futures Contracts | Swap Agreements | Forward Foreign Contracts | Unaffiliated Issuers (Purchased Options) | ||||||||||||
| Interest Rate | $161,217 | $— | $— | $(5,490 | ) | |||||||||||
| Foreign Exchange | — | — | 14,380 | — | ||||||||||||
| Credit | — | (27,664 | ) | — | — | |||||||||||
| Total | $161,217 | $(27,664 | ) | $14,380 | $(5,490 | ) | ||||||||||
The following table presents, by major type of derivative contract, the change in unrealized appreciation or depreciation on derivatives held by the fund for the six months ended June 30, 2019 as reported in the Statement of Operations:
| Risk | Futures Contracts | Swap Agreements | Forward Foreign Currency Contracts | Unaffiliated Issuers (Purchased Options) | ||||||||||||
| Interest Rate | $(23,671 | ) | $— | $— | $11,957 | |||||||||||
| Foreign Exchange | — | — | 43,678 | — | ||||||||||||
| Credit | — | 6,904 | — | — | ||||||||||||
| Total | $(23,671 | ) | $6,904 | $43,678 | $11,957 | |||||||||||
Derivative counterparty credit risk is managed through formal evaluation of the creditworthiness of all potential counterparties. On certain, but not all, uncleared derivatives, the fund attempts to reduce its exposure to counterparty credit risk whenever possible by entering into an ISDA Master Agreement on a bilateral basis. The ISDA Master Agreement gives each party to the agreement the right to terminate all transactions traded under such agreement if there is a specified deterioration in the credit quality of the other party. Upon an event of default or a termination of the ISDA Master Agreement, thenon-defaulting party has the right to close out all transactions traded under such agreement and to net amounts owed under each agreement to one net amount payable by one party to the other. This right to close out and net payments across all transactions traded under the ISDA Master Agreement could result in a reduction of the fund’s credit risk to such counterparty equal to any amounts payable by the fund under the applicable transactions, if any.
Collateral and margin requirements differ by type of derivative. For cleared derivatives (e.g., futures contracts, cleared swaps, and exchange-traded options), margin requirements are set by the clearing broker and the clearing house and collateral, in the form of cash or securities, is posted by the fund directly with the clearing broker. Collateral terms are counterparty agreement specific for uncleared derivatives (e.g., forward foreign currency exchange contracts, uncleared swap agreements, and uncleared options) and collateral, in the form of cash and securities, is held in segregated accounts with the fund’s custodian in connection with these agreements. For derivatives traded under an ISDA Master Agreement, which contains a collateral support annex, the collateral requirements are netted across all transactions traded under such counterparty-specific agreement and an amount is posted from one party to the other to collateralize such obligations. Cash that has been segregated or delivered to cover the fund’s collateral or margin obligations under derivative contracts, if any, will be reported separately in the Statement of Assets and Liabilities as restricted cash for uncleared derivatives and/or deposits with brokers for cleared derivatives. Securities pledged as collateral or margin for the same purpose, if any, are noted in the Portfolio of Investments. The fund may be required to make payments of interest on uncovered collateral or margin obligations with the broker. Any such payments are included in “Miscellaneous” expense in the Statement of Operations.
Purchased Options– The fund purchased put options for a premium. Purchased put options entitle the holder to sell a specified number of shares or units of a particular security, currency or index at a specified price at a specified date or within a specified period of time. Purchasing put options may hedge against an anticipated decline in the value of portfolio securities or currency or decrease the fund’s exposure to an underlying instrument.
The premium paid is initially recorded as an investment in the Statement of Assets and Liabilities. That investment is subsequentlymarked-to-market daily with the difference between the premium paid and the market value of the purchased option being recorded as unrealized appreciation or depreciation. Premiums paid for purchased put options which have expired are treated as realized losses on investments in the Statement of Operations. Upon the exercise or closing of a purchased put option, the premium paid is offset against the proceeds on the sale of the underlying security or financial instrument in order to determine the realized gain or loss on investments.
Whether or not the option is exercised, the fund’s maximum risk of loss from purchasing an option is the amount of premium paid. All option contracts involve credit risk if the counterparty to the option contract fails to perform. For uncleared options, this risk is
20
Table of Contents
MFS Strategic Income Portfolio
Notes to Financial Statements (unaudited) – continued
mitigated in cases where there is an ISDA Master Agreement between the fund and the counterparty providing for netting as described above and, where applicable, by the posting of collateral by the counterparty to the fund to cover the fund’s exposure to the counterparty under such ISDA Master Agreement.
Futures Contracts– The fund entered into futures contracts which may be used to hedge against or obtain broad market exposure, interest rate exposure, currency exposure, or to manage duration. A futures contract represents a commitment for the future purchase or sale of an asset at a specified price on a specified date.
Upon entering into a futures contract, the fund is required to deposit with the broker, either in cash or securities, an initial margin in an amount equal to a specified percentage of the notional amount of the contract. Subsequent payments (variation margin) are made or received by the fund each day, depending on the daily fluctuations in the value of the contract, and are recorded for financial statement purposes as unrealized gain or loss by the fund until the contract is closed or expires at which point the gain or loss on futures contracts is realized.
The fund bears the risk of interest rates, exchange rates or securities prices moving unexpectedly, in which case, the fund may not achieve the anticipated benefits of the futures contracts and may realize a loss. While futures contracts may present less counterparty risk to the fund since the contracts are exchange traded and the exchange’s clearinghouse guarantees payments to the broker, there is still counterparty credit risk due to the insolvency of the broker. The fund’s maximum risk of loss due to counterparty credit risk is equal to the margin posted by the fund to the broker plus any gains or minus any losses on the outstanding futures contracts.
Forward Foreign Currency Exchange Contracts– The fund entered into forward foreign currency exchange contracts for the purchase or sale of a specific foreign currency at a fixed price on a future date. These contracts may be used to hedge the fund’s currency risk or fornon-hedging purposes. For hedging purposes, the fund may enter into contracts to deliver or receive foreign currency that the fund will receive from or use in its normal investment activities. The fund may also use contracts to hedge against declines in the value of foreign currency denominated securities due to unfavorable exchange rate movements. Fornon-hedging purposes, the fund may enter into contracts with the intent of changing the relative exposure of the fund’s portfolio of securities to different currencies to take advantage of anticipated exchange rate changes.
Forward foreign currency exchange contracts are adjusted by the daily exchange rate of the underlying currency and any unrealized gains or losses are recorded as a receivable or payable for forward foreign currency exchange contracts until the contract settlement date. On contract settlement date, any gain or loss on the contract is recorded as realized gains or losses on forward foreign currency exchange contracts.
Risks may arise upon entering into these contracts from unanticipated movements in the value of the contract and from the potential inability of counterparties to meet the terms of their contracts. Generally, the fund’s maximum risk due to counterparty credit risk is the unrealized gain on the contract due to the use of Continuous Linked Settlement, a multicurrency cash settlement system for the centralized settlement of foreign transactions. This risk is mitigated in cases where there is an ISDA Master Agreement between the fund and the counterparty providing for netting as described above and, where applicable, by the posting of collateral by the counterparty to the fund to cover the fund’s exposure to the counterparty under such ISDA Master Agreement.
Swap Agreements– During the period the fund entered into swap agreements. Swap agreements generally involve a periodic exchange of cash payments on a net basis, at specified intervals or upon the occurrence of specified events, between the fund and a counterparty. Certain swap agreements may be entered into as a bilateral contract (“uncleared swaps”) while others are required to be centrally cleared (“cleared swaps”). In a cleared swap transaction, the ultimate counterparty to the transaction is a clearinghouse (the “clearinghouse”). The contract is transferred and accepted by the clearinghouse immediately following execution of the swap contract with an executing broker. Thereafter, throughout the term of the cleared swap, the fund interfaces indirectly with the clearinghouse through a clearing broker and has counterparty risk to the clearing broker as well.
Both cleared and uncleared swap agreements are marked to market daily. The value of uncleared swap agreements is reported in the Statement of Assets and Liabilities as “Uncleared swaps, at value” which includes any related interest accruals to be paid or received by the fund. For cleared swaps, payments (variation margin) are made or received by the fund each day, depending on the daily fluctuations in the value of the cleared swap, such that only the current day net receivable or payable for variation margin is reported in the Statement of Assets and Liabilities.
For both cleared and uncleared swaps, the periodic exchange of net cash payments, at specified intervals or upon the occurrence of specified events as stipulated by the agreement, is recorded as realized gain or loss on swap agreements in the Statement of Operations. Premiums paid or received at the inception of the agreements are amortized using the effective interest method over the term of the agreement as realized gain or loss on swap agreements in the Statement of Operations. A liquidation payment received or made upon early termination is recorded as a realized gain or loss on swap agreements in the Statement of Operations. The change in unrealized appreciation or depreciation on swap agreements in the Statement of Operations reflects the aggregate change over the reporting period in the value of swaps net of any unamortized premiums paid or received.
21
Table of Contents
MFS Strategic Income Portfolio
Notes to Financial Statements (unaudited) – continued
Risks related to swap agreements include the possible lack of a liquid market, unfavorable market and interest rate movements of the underlying instrument and the failure of the counterparty to perform under the terms of the agreements. The fund’s maximum risk of loss from counterparty credit risk is the discounted net value of the cash flows to be received from/paid to the counterparty over the contract’s remaining life, to the extent that the amount is positive. To address counterparty risk, uncleared swap agreements are limited to only highly-rated counterparties. Risk is further reduced by having an ISDA Master Agreement between the fund and the counterparty providing for netting as described above and, where applicable, by the posting of collateral by the counterparty to the fund to cover the fund’s exposure to the counterparty under such ISDA Master Agreement. The fund’s counterparty risk due to cleared swaps is mitigated by the fact that the clearinghouse is the true counterparty to the transaction and the regulatory requirement safeguards in the event of a clearing broker bankruptcy.
The fund entered into credit default swap agreements in order to manage its exposure to the market or certain sectors of the market, to reduce its credit risk exposure to defaults of corporate and sovereign issuers or to create exposure to corporate or sovereign issuers to which it is not otherwise exposed. In a credit default swap agreement, the protection buyer can make an upfront payment and will make a stream of payments to the protection seller based on a fixed percentage applied to the agreement notional amount in exchange for the right to receive a specified return upon the occurrence of a defined credit event on the reference obligation (which may be either a single security or a basket of securities issued by corporate or sovereign issuers) and, with respect to the cases where physical settlement applies, the delivery by the buyer to the seller of a defined deliverable obligation. Although agreement-specific, credit events generally consist of a combination of the following: bankruptcy, failure to pay, restructuring, obligation acceleration, obligation default, or repudiation/moratorium, each as defined in the 2003 ISDA Credit Derivatives Definitions as amended by the relevant agreement. Restructuring is generally not applicable when the reference obligation is issued by a North American corporation and obligation acceleration, obligation default, or repudiation/moratorium are generally only applicable when the reference obligation is issued by a sovereign entity or an entity in an emerging country. Upon determination of the final price for the deliverable obligation (or upon delivery of the deliverable obligation in the case of physical settlement), the difference between the value of the deliverable obligation and the swap agreement’s notional amount is recorded as realized gain or loss on swap agreements in the Statement of Operations.
Loans and Other Direct Debt Instruments– The fund invests in loans and loan participations or other receivables. These investments may include standby financing commitments, including revolving credit facilities, which contractually obligate the fund to supply additional cash to the borrower on demand. The fund generally provides this financial support in order to preserve its existing investment or to obtain a more senior secured interest in the assets of the borrower. Loan participations involve a risk of insolvency of the lending bank or other financial intermediary.
Indemnifications– Under the fund’s organizational documents, its officers and Trustees may be indemnified against certain liabilities and expenses arising out of the performance of their duties to the fund. Additionally, in the normal course of business, the fund enters into agreements with service providers that may contain indemnification clauses. The fund’s maximum exposure under these agreements is unknown as this would involve future claims that may be made against the fund that have not yet occurred.
Investment Transactions and Income– Investment transactions are recorded on the trade date. Interest income is recorded on the accrual basis. All premium and discount is amortized or accreted for financial statement purposes in accordance with U.S. generally accepted accounting principles. Some securities may be purchased on a “when-issued” or “forward delivery” basis, which means that the securities will be delivered to the fund at a future date, usually beyond customary settlement time. Dividends received in cash are recorded on theex-dividend date. Certain dividends from foreign securities will be recorded when the fund is informed of the dividend if such information is obtained subsequent to theex-dividend date. Dividend and interest payments received in additional securities are recorded on theex-dividend orex-interest date in an amount equal to the value of the security on such date. Debt obligations may be placed onnon-accrual status or set to accrue at a rate of interest less than the contractual coupon when the collection of all or a portion of interest has become doubtful. Interest income for those debt obligations may be further reduced by thewrite-off of the related interest receivables when deemed uncollectible.
The fund may receive proceeds from litigation settlements. Any proceeds received from litigation involving portfolio holdings are reflected in the Statement of Operations in realized gain/loss if the security has been disposed of by the fund or in unrealized gain/loss if the security is still held by the fund. Any other proceeds from litigation not related to portfolio holdings are reflected as other income in the Statement of Operations.
The fund purchased or sold debt securities on a when-issued or delayed delivery basis, or in a “To Be Announced” (TBA) or “forward commitment” transaction with delivery or payment to occur at a later date beyond the normal settlement period. When the fund sells securities on a when-issued, delayed delivery, or forward commitment basis, the fund typically owns or has the right to acquire securities equivalent in kind and amount to the delivered securities. At the time a fund enters into a commitment to purchase or sell a security, the transaction is recorded and the value of the security acquired is reflected in the fund’s net asset value. The price of such security and the date that the security will be delivered and paid for are fixed at the time the transaction is negotiated. The value of the security may vary with market fluctuations. When issued investments purchased are held at carrying amount, which
22
Table of Contents
MFS Strategic Income Portfolio
Notes to Financial Statements (unaudited) – continued
approximates fair value and are categorized as level 2 within the fair value hierarchy. No interest accrues to the fund until payment takes place. At the time that a fund enters into this type of transaction, the fund is required to have sufficient cash and/or liquid securities to cover its commitments. Losses may arise due to changes in the value of the underlying securities prior to settlement date or if the counterparty does not perform under the contract’s terms, or if the issuer does not issue the securities due to political, economic or other factors.
To mitigate the counterparty credit risk on TBA securities and other types of forward settling mortgage-backed securities, the fund whenever possible enters into a Master Securities Forward Transaction Agreement (“MSFTA”) on a bilateral basis with each of the counterparties with whom it undertakes a significant volume of transactions. The MSFTA gives each party to the agreement the right to terminate all transactions traded under such agreement if there is a specified deterioration in the credit quality of the other party. Upon an event of default or a termination of the MSFTA, thenon-defaulting party has the right to close out all transactions traded under such agreement and to net amounts owed under each transaction to one net amount payable by one party to the other. This right to close out and net payments across all transactions traded under the MSFTA could result in a reduction of the fund’s credit risk to such counterparty equal to any amounts payable by the fund under the applicable transactions, if any.
For mortgage-backed securities traded under a MSFTA, the collateral and margining requirements are contract specific. Collateral amounts across all transactions traded under such agreement are netted and an amount is posted from one party to the other to collateralize such obligations. Cash that has been pledged to cover the fund’s collateral or margin obligations under a MSFTA, if any, will be reported separately on the Statement of Assets and Liabilities as restricted cash. Securities pledged as collateral or margin for the same purpose, if any, are noted in the Portfolio of Investments.
Tax Matters and Distributions– The fund intends to qualify as a regulated investment company, as defined under Subchapter M of the Internal Revenue Code, and to distribute all of its taxable income, including realized capital gains. As a result, no provision for federal income tax is required. The fund’s federal tax returns, when filed, will remain subject to examination by the Internal Revenue Service for a three year period. Management has analyzed the fund’s tax positions taken on federal and state tax returns for all open tax years and does not believe that there are any uncertain tax positions that require recognition of a tax liability. Foreign taxes, if any, have been accrued by the fund in the accompanying financial statements in accordance with the applicable foreign tax law. Foreign income taxes may be withheld by certain countries in which the fund invests. Additionally, capital gains realized by the fund on securities issued in or by certain foreign countries may be subject to capital gains tax imposed by those countries.
Distributions to shareholders are recorded on theex-dividend date. Income and capital gain distributions are determined in accordance with income tax regulations, which may differ from U.S. generally accepted accounting principles. Certain capital accounts in the financial statements are periodically adjusted for permanent differences in order to reflect their tax character. These adjustments have no impact on net assets or net asset value per share. Temporary differences which arise from recognizing certain items of income, expense, gain or loss in different periods for financial statement and tax purposes will reverse at some time in the future. Distributions in excess of net investment income or net realized gains are temporary overdistributions for financial statement purposes resulting from differences in the recognition or classification of income or distributions for financial statement and tax purposes.
Book/tax differences primarily relate to defaulted bonds, amortization and accretion of debt securities, and derivative transactions.
The tax character of distributions declared to shareholders for the last fiscal year is as follows:
| Year ended 12/31/18 | ||||
| Ordinary income (including any short-term capital gains) | $1,829,013 | |||
The federal tax cost and the tax basis components of distributable earnings were as follows:
| As of 6/30/19 | ||||
| Cost of investments | $45,543,417 | |||
| Gross appreciation | 1,200,355 | |||
| Gross depreciation | (1,561,090 | ) | ||
| Net unrealized appreciation (depreciation) | $(360,735 | ) | ||
| As of 12/31/18 | ||||
| Undistributed ordinary income | 1,557,309 | |||
| Capital loss carryforwards | (881,148 | ) | ||
| Other temporary differences | 44,469 | |||
| Net unrealized appreciation (depreciation) | (2,777,501 | ) | ||
The aggregate cost above includes prior fiscal year end tax adjustments, if applicable.
23
Table of Contents
MFS Strategic Income Portfolio
Notes to Financial Statements (unaudited) – continued
As of December 31, 2018, the fund had capital loss carryforwards available to offset future realized gains. These net capital losses may be carried forward indefinitely and their character is retained as short-term and/or long-term losses. Such losses are characterized as follows:
| Short-Term | $(330,666 | ) | ||
| Long-Term | (550,482 | ) | ||
| Total | $(881,148 | ) |
Multiple Classes of Shares of Beneficial Interest– The fund offers multiple classes of shares, which differ in their respective distribution and/or service fees. The fund’s income, realized and unrealized gain (loss), and common expenses are allocated to shareholders based on the daily net assets of each class. Dividends are declared separately for each class. Differences in per share dividend rates are generally due to differences in separate class expenses. The fund’s distributions declared to shareholders as reported in the Statements of Changes in Net Assets are presented by class as follows:
| From net investment income | ||||||||
| Six months ended 6/30/19 | Year ended 12/31/18 | |||||||
| Initial Class | $— | $1,585,207 | ||||||
| Service Class | — | 243,806 | ||||||
| Total | $— | $1,829,013 | ||||||
| (3) | Transactions with Affiliates |
Investment Adviser– The fund has an investment advisory agreement with MFS to provide overall investment management and related administrative services and facilities to the fund. The management fee is computed daily and paid monthly at the following annual rates based on the fund’s average daily net assets:
| Up to $1 billion | 0.70% | |||
| In excess of $1 billion | 0.65% |
MFS has agreed in writing to reduce its management fee by a specified amount if certain MFS mutual fund assets exceed thresholds agreed to by MFS and the fund’s Board of Trustees. For the six months ended June 30, 2019, this management fee reduction amounted to $2,158, which is included in the reduction of total expenses in the Statement of Operations. The management fee incurred for the six months ended June 30, 2019 was equivalent to an annual effective rate of 0.69% of the fund’s average daily net assets.
The investment adviser has agreed in writing to pay a portion of the fund’s total annual operating expenses, excluding interest, taxes, extraordinary expenses, brokerage and transaction costs, and investment-related expenses (such as fees and expenses associated with investments in investment companies and other similar investment vehicles), such that total annual operating expenses do not exceed 0.80% of average daily net assets for the Initial Class shares and 1.05% of average daily net assets for the Service Class shares. This written agreement will terminate on July 31, 2019. For the six months ended June 30, 2019, this reduction amounted to $56,969, which is included in the reduction of total expenses in the Statement of Operations. Effective August 1, 2019, the investment adviser has agreed in writing to pay a portion of the fund’s total annual operating expenses, excluding interest, taxes, extraordinary expenses, brokerage and transaction costs, and investment-related expenses (such as fees and expenses associated with investments in investment companies and other similar investment vehicles), such that total annual operating expenses do not exceed 0.75% of average daily net assets for the Initial Class shares and 1.00% of average daily net assets for the Service Class shares. This written agreement will continue until modified by the fund’s Board of Trustees, but such agreement will continue at least until April 30, 2021.
Distributor– MFS Fund Distributors, Inc. (MFD), a wholly-owned subsidiary of MFS, is the distributor of shares of the fund. The Trustees have adopted a distribution plan for the Service Class shares pursuant to Rule12b-1 under the Investment Company Act of 1940.
The fund’s distribution plan provides that the fund will pay MFD distribution and/or service fees equal to 0.25% per annum of its average daily net assets attributable to Service Class shares as partial consideration for services performed and expenses incurred by MFD and financial intermediaries (including participating insurance companies that invest in the fund to fund variable annuity and variable life insurance contracts, sponsors of qualified retirement and pension plans that invest in the fund, and affiliates of these participating insurance companies and plan sponsors) in connection with the sale and distribution of the Service Class shares. MFD may subsequently pay all, or a portion, of the distribution and/or service fees to financial intermediaries.
24
Table of Contents
MFS Strategic Income Portfolio
Notes to Financial Statements (unaudited) – continued
Shareholder Servicing Agent– MFS Service Center, Inc. (MFSC), a wholly-owned subsidiary of MFS, receives a fee from the fund for its services as shareholder servicing agent. For the six months ended June 30, 2019, the fee was $3,871, which equated to 0.0173% annually of the fund’s average daily net assets. MFSC also receives payment from the fund forout-of-pocket expenses paid by MFSC on behalf of the fund. For the six months ended June 30, 2019, these costs amounted to $236.
Administrator– MFS provides certain financial, legal, shareholder communications, compliance, and other administrative services to the fund. Under an administrative services agreement, the fund reimburses MFS the costs incurred to provide these services. The fund is charged an annual fixed amount of $17,500 plus a fee based on average daily net assets. The administrative services fee incurred for the six months ended June 30, 2019 was equivalent to an annual effective rate of 0.0389% of the fund’s average daily net assets.
Trustees’ and Officers’ Compensation– The fund pays compensation to independent Trustees in the form of a retainer, attendance fees, and additional compensation to Board and Committee chairpersons. The fund does not pay compensation directly to Trustees or officers of the fund who are also officers of the investment adviser, all of whom receive remuneration from MFS for their services to the fund. Certain officers and Trustees of the fund are officers or directors of MFS, MFD, and MFSC.
Other– This fund and certain other funds managed by MFS (the funds) had entered into a service agreement (the ISO Agreement) which provided for payment of fees solely by the funds to Tarantino LLC in return for the provision of services of an Independent Senior Officer (ISO) for the funds. Frank L. Tarantino served as the ISO and was an officer of the funds and the sole member of Tarantino LLC. Effective June 30, 2019, Mr. Tarantino retired from his position as ISO for the funds, and the ISO Agreement was terminated. For the six months ended June 30, 2019, the fee paid by the fund under this agreement was $53 and is included in “Miscellaneous” expense in the Statement of Operations. MFS had agreed to bear all expenses associated with office space, other administrative support, and supplies provided to the ISO.
The fund invests in the MFS Institutional Money Market Portfolio which is managed by MFS and seeks current income consistent with preservation of capital and liquidity. This money market fund does not pay a management fee to MFS.
The fund invests in the High Yield Pooled Portfolio, which is a mutual fund advised by MFS that does not pay management fees to MFS but does incur investment and operating costs. The fund invests in the High Yield Pooled Portfolio to gain exposure to high income debt instruments, rather than investing in high income debt instruments directly. The High Yield Pooled Portfolio does not pay a management fee to MFS or distribution and/or service fee to MFD.
| (4) | Portfolio Securities |
For the six months ended June 30, 2019, purchases and sales of investments, other than purchased option transactions andshort-term obligations, were as follows:
| Purchases | Sales | |||||||
| U.S. Government securities | $1,626,126 | $4,922,657 | ||||||
| Non-U.S. Government securities | $19,695,046 | $19,502,685 | ||||||
| (5) | Shares of Beneficial Interest |
The fund’s Declaration of Trust permits the Trustees to issue an unlimited number of full and fractional shares of beneficial interest. Transactions in fund shares were as follows:
| Six months ended 6/30/19 | Year ended 12/31/18 | |||||||||||||||
| Shares | Amount | Shares | Amount | |||||||||||||
| Shares sold | ||||||||||||||||
Initial Class | 105,929 | $1,018,790 | 273,324 | $2,588,388 | ||||||||||||
Service Class | 12,456 | 120,086 | 93,876 | 876,047 | ||||||||||||
| 118,385 | $1,138,876 | 367,200 | $3,464,435 | |||||||||||||
| Shares issued to shareholders in reinvestment of distributions | ||||||||||||||||
Initial Class | — | $— | 170,087 | $1,585,207 | ||||||||||||
Service Class | — | — | 26,357 | 243,806 | ||||||||||||
| — | $— | 196,444 | $1,829,013 | |||||||||||||
| Shares reacquired | ||||||||||||||||
Initial Class | (341,194 | ) | $(3,284,206 | ) | (639,667 | ) | $(6,059,623 | ) | ||||||||
Service Class | (82,302 | ) | (786,392 | ) | (147,390 | ) | (1,394,196 | ) | ||||||||
| (423,496 | ) | $(4,070,598 | ) | (787,057 | ) | $(7,453,819 | ) | |||||||||
| Net change | ||||||||||||||||
Initial Class | (235,265 | ) | $(2,265,416 | ) | (196,256 | ) | $(1,886,028 | ) | ||||||||
Service Class | (69,846 | ) | (666,306 | ) | (27,157 | ) | (274,343 | ) | ||||||||
| (305,111 | ) | $(2,931,722 | ) | (223,413 | ) | $(2,160,371 | ) | |||||||||
25
Table of Contents
MFS Strategic Income Portfolio
Notes to Financial Statements (unaudited) – continued
| (6) | Line of Credit |
The fund and certain other funds managed by MFS participate in a $1.25 billion unsecured committed line of credit, subject to a $1 billion sublimit, provided by a syndicate of banks under a credit agreement. Borrowings may be made for temporary financing needs. Interest is charged to each fund, based on its borrowings, generally at a rate equal to the highest of one month LIBOR, the Federal Funds Effective Rate and the Overnight Bank Funding Rate, plus an agreed upon spread. A commitment fee, based on the average daily, unused portion of the committed line of credit, is allocated among the participating funds. In addition, the fund and other funds managed by MFS have established unsecured uncommitted borrowing arrangements with certain banks for temporary financing needs. Interest is charged to each fund, based on its borrowings, at rates equal to customary reference rates plus an agreed upon spread. For the six months ended June 30, 2019, the fund’s commitment fee and interest expense were $143 and $0, respectively, and are included in “Miscellaneous” expense in the Statement of Operations.
| (7) | Investments in Affiliated Issuers |
An affiliated issuer may be considered one in which the fund owns 5% or more of the outstanding voting securities, or a company which is under common control. For the purposes of this report, the following were affiliated issuers:
| Affiliated Issuers | Beginning Value | Purchases | Sales Proceeds | Realized Gain (Loss) | Change in Unrealized Appreciation or Depreciation | Ending Value | ||||||||||||||||||
| MFS High Yield Pooled Portfolio | $6,231,072 | $3,863,764 | $3,441,369 | $21,926 | $475,135 | $7,150,528 | ||||||||||||||||||
| MFS Institutional Money Market Portfolio | 1,455,501 | 15,641,266 | 13,089,565 | (111 | ) | 491 | 4,007,582 | |||||||||||||||||
| $7,686,573 | $19,520,544 | $16,530,934 | $21,815 | $475,626 | $11,158,110 | |||||||||||||||||||
| Affiliated Issuers | Dividend Income | Capital Gain Distributions | ||||||||||||||||||||||
| MFS High Yield Pooled Portfolio | $244,936 | $— | ||||||||||||||||||||||
| MFS Institutional Money Market Portfolio | 16,641 | — | ||||||||||||||||||||||
| $261,577 | $— | |||||||||||||||||||||||
26
Table of Contents
MFS Strategic Income Portfolio
PROXY VOTING POLICIES AND INFORMATION
MFS votes proxies on behalf of the fund pursuant to proxy voting policies and procedures that are available without charge, upon request, by calling 1-800-225-2606, by visitingmfs.com/proxyvoting, or by visiting the SEC’s Web site athttp://www.sec.gov.
Information regarding how the fund voted proxies relating to portfolio securities during the most recent twelve-month period ended June 30 is available by August 31 of each year without charge by visitingmfs.com/proxyvoting, or by visiting the SEC’s Web site athttp://www.sec.gov.
QUARTERLY PORTFOLIO DISCLOSURE
The fund files a complete schedule of portfolio holdings with the SEC for the first and third quarters of each fiscal year on Form N-Q or as an exhibit to its reports on Form N-PORT (for first and third fiscal quarters ending March 31, 2019 or after). The fund’sForm N-Q or Form N-PORT reports are available on the SEC’s website athttp://www.sec.gov.A shareholder can obtain the portfolio holdings report for the first and third quarters of the fund’s fiscal year atmfs.com/vit2 by choosing the fund’s name and then selecting the “Resources” tab and clicking on “Prospectus and Reports”.
From time to time, MFS may post important information about the fund or the MFS funds on the MFS web site (mfs.com). This information is available athttps://www.mfs.com/en-us/what-we-do/announcements.htmlor atmfs.com/vit2 by choosing the fund’s name.
INFORMATION ABOUT FUND CONTRACTS AND LEGAL CLAIMS
The fund has entered into contractual arrangements with an investment adviser, administrator, distributor, shareholder servicing agent, 529 program manager (if applicable), and custodian who each provide services to the fund. Unless expressly stated otherwise, shareholders are not parties to, or intended beneficiaries of these contractual arrangements, and these contractual arrangements are not intended to create any shareholder right to enforce them against the service providers or to seek any remedy under them against the service providers, either directly or on behalf of the fund.
Under the Trust’s By-Laws and Declaration of Trust, any claims asserted against or on behalf of the MFS Funds, including claims against Trustees and Officers, must be brought in state and federal courts located within the Commonwealth of Massachusetts.
27
Table of Contents
Table of Contents
Semiannual Report
June 30, 2019

MFS® Technology Portfolio

MFS® Variable Insurance Trust II
Beginning on January 1, 2021, as permitted by regulations adopted by the U.S. Securities and Exchange Commission, the insurance company that offers your contract may determine that it will no longer send you paper copies of the fund’s annual and semiannual shareholder reports unless you specifically request paper copies from the insurance company or from your financial intermediary. Instead, the shareholder reports will be made available on a Web site (insurancefunds.mfs.com or other Web site of which you will be notified), and the insurance company will notify you by mail each time a report is posted and provide you with a Web site link to access the report. Instructions for requesting paper copies will be provided by your insurance company or financial intermediary.
If you already elected to receive shareholder reports by email, you will not be affected by this change and you need not take any action. If your insurance company or financial intermediary offers electronic delivery, you may elect to receive shareholder reports and other communications from the insurance company or financial intermediary by email by following the instructions provided by the insurance company or financial intermediary.
Beginning on January 1, 2019, you may elect to receive all future reports in paper free of charge from the insurance company or financial intermediary. You can inform the insurance company or financial intermediary that you wish to continue receiving paper copies of your shareholder reports by contacting your insurance company or financial intermediary. Your election to receive reports in paper will apply to all funds held in your account with your insurance company or financial intermediary.
TKS-SEM
Table of Contents
MFS® Technology Portfolio
The report is prepared for the general information of contract owners. It is authorized for distribution to prospective investors only when preceded or accompanied by a current prospectus.
NOT FDIC INSURED• MAY LOSE VALUE• NO BANK OR CREDIT UNION GUARANTEE• NOT A DEPOSIT• NOT INSURED BY ANY FEDERAL GOVERNMENT AGENCY OR NCUA/NCUSIF
Table of Contents
MFS Technology Portfolio
LETTER FROM THE EXECUTIVE CHAIRMAN

Dear Contract Owners:
Slowing global growth, low inflation, and increasing trade friction between the United States and China have been hallmarks of the past 12 months. After experiencing an uptick in market volatility in late 2018, markets steadied during the first half of 2019, thanks in large measure to the adoption of a dovish policy stance on the part of global central banks, who have largely abandoned efforts to normalize interest rates and have instead focused on supporting economic growth. Trade tensions remain high as the U.S. has ratcheted up tariffs on Chinese imports and China has retaliated. A truce of sorts was reached midyear, but significant challenges continue to confront negotiators, and it is not known whether a comprehensive agreement can be reached.
With Boris Johnson replacing Theresa May as Britain’s prime minister, uncertainty over Brexit remains high. Johnson has adopted a more combative stance than his predecessor toward the European Union, increasing concerns that there will be a “hard” Brexit.
Markets expect that the longest economic expansion in U.S. history will continue for the time being, albeit at a slower pace. Nevertheless, slower growth and low inflation have spurred the U.S. Federal Reserve to take a more accommodative policy stance, prompting investors to anticipate several interest rate cuts in the coming year. The European Central Bank has adopted a similar position. The more accommodative environment has helped fuel a continued rise in global equities and has been broadly supportive of risk assets.
Since launching the first U.S.open-end mutual fund in 1924, MFS® has been committed to a single purpose: to create value by allocating capital responsibly for clients. Through our powerful global investment platform, we combine collective expertise, thoughtful risk management, and long-term discipline to uncover what we believe are the best investment opportunities in the market.
Respectfully,

Robert J. Manning
Executive Chairman
MFS Investment Management
August 16, 2019
The opinions expressed in this letter are subject to change and may not be relied upon for investment advice. No forecasts can be guaranteed.
1
Table of Contents
MFS Technology Portfolio
Portfolio structure

| Top ten holdings | ||||
| Amazon.com, Inc. | 10.1% | |||
| Alphabet, Inc., “A” | 9.2% | |||
| Facebook, Inc., “A” | 6.9% | |||
| Microsoft Corp. | 5.5% | |||
| Visa, Inc., “A” | 4.9% | |||
| Mastercard, Inc., “A” | 4.2% | |||
| Adobe Systems, Inc. | 3.9% | |||
| Salesforce.com, Inc. | 3.6% | |||
| PayPal Holdings, Inc. | 2.6% | |||
| Global Payments, Inc. | 2.5% |
| Top five industries | ||||
| Internet | 19.4% | |||
| Business Services | 18.5% | |||
| Computer Software | 18.0% | |||
| Specialty Stores | 10.5% | |||
| Other Banks & Diversified Financials | 9.2% |
| (s) | Includes securities sold short. |
Cash & Cash Equivalents includes any cash, investments in money market funds, short-term securities, and other assets less liabilities. Please see the Statement of Assets and Liabilities for additional information related to the fund’s cash position and other assets and liabilities.
Percentages are based on net assets as of June 30, 2019.
The portfolio is actively managed and current holdings may be different.
2
Table of Contents
MFS Technology Portfolio
Fund Expenses Borne by the Contract Holders during the Period,
January 1, 2019 through June 30, 2019
As a contract holder of the fund, you incur ongoing costs, including management fees; distribution and/or service(12b-1) fees; and other fund expenses. This example is intended to help you understand your ongoing costs (in dollars) of investing in the fund and to compare these costs with the ongoing costs of investing in other mutual funds.
The example is based on an investment of $1,000 invested at the beginning of the period and held for the entire period January 1, 2019 through June 30, 2019.
Actual Expenses
The first line for each share class in the following table provides information about actual account values and actual expenses. You may use the information in this line, together with the amount you invested, to estimate the expenses that you paid over the period. Simply divide your account value by $1,000 (for example, an $8,600 account value divided by $1,000 = 8.6), then multiply the result by the number in the first line under the heading entitled “Expenses Paid During Period” to estimate the expenses you paid on your account during this period.
Hypothetical Example for Comparison Purposes
The second line for each share class in the following table provides information about hypothetical account values and hypothetical expenses based on the fund’s actual expense ratio and an assumed rate of return of 5% per year before expenses, which is not the fund’s actual return. The hypothetical account values and expenses may not be used to estimate the actual ending account balance or expenses you paid for the period. You may use this information to compare the ongoing costs of investing in the fund and other funds. To do so, compare this 5% hypothetical example with the 5% hypothetical examples that appear in the shareholder reports of the other funds.
Please note that the expenses shown in the table are meant to highlight the fund’s ongoing costs only and do not take into account the fees and expenses imposed under the variable contracts through which your investment in the fund is made. Therefore, the second line for each share class in the table is useful in comparing ongoing costs associated with an investment in vehicles (such as the fund) which fund benefits under variable annuity and variable life insurance contracts and to qualified pension and retirement plans only, and will not help you determine the relative total costs of investing in the fund through variable annuity and variable life insurance contracts. If the fees and expenses imposed under the variable contracts were included, your costs would have been higher.
| Share Class | Annualized Expense Ratio | Beginning Account Value 1/01/19 | Ending Account Value 6/30/19 | Expenses Paid During Period (p) 1/01/19-6/30/19 | ||||||||||||||
| Initial Class | Actual | 0.98% | $1,000.00 | $1,265.28 | $5.50 | |||||||||||||
| Hypothetical (h) | 0.98% | $1,000.00 | $1,019.93 | $4.91 | ||||||||||||||
| Service Class | Actual | 1.23% | $1,000.00 | $1,263.99 | $6.90 | |||||||||||||
| Hypothetical (h) | 1.23% | $1,000.00 | $1,018.70 | $6.16 | ||||||||||||||
| (h) | 5% class return per year before expenses. |
| (p) | “Expenses Paid During Period” are equal to each class’s annualized expense ratio, as shown above, multiplied by the average account value over the period, multiplied by 181/365 (to reflect theone-half year period). |
Notes to Expense Table
Expense ratios include 0.02% of investment related expenses from short sales (See Note 2 of the Notes to Financial Statements) that are outside of the expense limitation arrangement (See Note 3 of the Notes to Financial Statements).
3
Table of Contents
MFS Technology Portfolio
PORTFOLIO OF INVESTMENTS – 6/30/19 (unaudited)
The Portfolio of Investments is a complete list of all securities owned by your fund. It is categorized by broad-based asset classes.
| Issuer | Shares/Par | Value ($) | ||||||
| COMMON STOCKS – 99.2% | ||||||||
| Aerospace – 3.0% |
| |||||||
| CACI International, Inc., “A” (a) | 634 | $ | 129,710 | |||||
| FLIR Systems, Inc. | 9,293 | 502,751 | ||||||
| L3 Harris Technologies, Inc. | 5,121 | 968,535 | ||||||
| Northrop Grumman Corp. | 1,285 | 415,197 | ||||||
|
| |||||||
| $ | 2,016,193 | |||||||
|
| |||||||
| Biotechnology – 1.7% |
| |||||||
| Bio-Techne Corp. | 3,619 | $ | 754,525 | |||||
| Illumina, Inc. (a) | 974 | 358,578 | ||||||
|
| |||||||
| $ | 1,113,103 | |||||||
|
| |||||||
| Broadcasting – 0.6% |
| |||||||
| Netflix, Inc. (a) | 1,028 | $ | 377,605 | |||||
|
| |||||||
| Brokerage & Asset Managers – 1.2% |
| |||||||
| NASDAQ, Inc. | 4,770 | $ | 458,731 | |||||
| Tradeweb Markets, Inc. | 7,145 | 313,022 | ||||||
|
| |||||||
| $ | 771,753 | |||||||
|
| |||||||
| Business Services – 18.5% |
| |||||||
| Cognizant Technology Solutions Corp., “A” | 2,342 | $ | 148,459 | |||||
| DXC Technology Co. | 28,972 | 1,597,806 | ||||||
| Endava PLC, ADR (a) | 20,922 | 841,901 | ||||||
| Fidelity National Information Services, Inc. | 10,234 | 1,255,507 | ||||||
| First Data Corp. (a) | 18,460 | 499,712 | ||||||
| Fiserv, Inc. (a) | 14,768 | 1,346,251 | ||||||
| FleetCor Technologies, Inc. (a) | 2,497 | 701,282 | ||||||
| Global Payments, Inc. | 10,159 | 1,626,761 | ||||||
| PayPal Holdings, Inc. (a) | 15,088 | 1,726,972 | ||||||
| Total System Services, Inc. | 11,202 | 1,436,881 | ||||||
| TransUnion | 7,307 | 537,138 | ||||||
| Verisk Analytics, Inc., “A” | 3,365 | 492,838 | ||||||
|
| |||||||
| $ | 12,211,508 | |||||||
|
| |||||||
| Cable TV – 1.0% |
| |||||||
| Altice USA, Inc. (a) | 26,968 | $ | 656,671 | |||||
|
| |||||||
| Computer Software – 18.0% |
| |||||||
| Adobe Systems, Inc. (a) | 8,768 | $ | 2,583,491 | |||||
| Autodesk, Inc. (a) | 4,579 | 745,919 | ||||||
| Blue Prism Group PLC (a) | 9,844 | 172,769 | ||||||
| DocuSign, Inc. (a) | 5,175 | 257,249 | ||||||
| Microsoft Corp. | 27,060 | 3,624,958 | ||||||
| Pagerduty, Inc. (a) | 247 | 11,621 | ||||||
| Red Hat, Inc. (a) | 2,434 | 457,008 | ||||||
| RingCentral, Inc. (a) | 3,824 | 439,454 | ||||||
| Salesforce.com, Inc. (a) | 15,864 | 2,407,045 | ||||||
| Uber Technologies, Inc. (a) | 17,137 | 794,814 | ||||||
| Zendesk, Inc. (a) | 4,269 | 380,069 | ||||||
|
| |||||||
| $ | 11,874,397 | |||||||
|
| |||||||
| Computer Software – Systems – 7.7% |
| |||||||
| Apple, Inc. | 7,505 | $ | 1,485,390 | |||||
| Constellation Software, Inc. | 678 | 639,015 | ||||||
| Issuer | Shares/Par | Value ($) | ||||||
| COMMON STOCKS – continued |
| |||||||
| Computer Software – Systems – continued |
| |||||||
| EPAM Systems, Inc. (a) | 1,370 | $ | 237,147 | |||||
| HubSpot, Inc. (a) | 2,199 | 374,973 | ||||||
| New Relic, Inc. (a) | 3,335 | 288,511 | ||||||
| Pluralsight, Inc., “A” (a) | 13,600 | 412,352 | ||||||
| Presidio, Inc. | 23,060 | 315,230 | ||||||
| Rapid7, Inc. (a) | 2,511 | 145,236 | ||||||
| ServiceNow, Inc. (a) | 2,993 | 821,788 | ||||||
| Square, Inc., “A” (a) | 4,919 | 356,775 | ||||||
|
| |||||||
| $ | 5,076,417 | |||||||
|
| |||||||
| Consumer Services – 1.0% |
| |||||||
| Grand Canyon Education, Inc. (a) | 5,431 | $ | 635,536 | |||||
|
| |||||||
| Electrical Equipment – 0.8% | ||||||||
| Amphenol Corp., “A” | 5,846 | $ | 560,865 | |||||
|
| |||||||
| Electronics – 3.0% |
| |||||||
| Applied Materials, Inc. | 19,482 | $ | 874,937 | |||||
| Microchip Technology, Inc. | 12,542 | 1,087,391 | ||||||
| Silicon Laboratories, Inc. (a) | 358 | 37,017 | ||||||
|
| |||||||
| $ | 1,999,345 | |||||||
|
| |||||||
| Internet – 19.4% |
| |||||||
| Alibaba Group Holding Ltd., ADR (a) | 2,500 | $ | 423,625 | |||||
| Alphabet, Inc., “A” (a)(s) | 5,617 | 6,082,088 | ||||||
| Facebook, Inc., “A” (a)(s) | 23,728 | 4,579,504 | ||||||
| GoDaddy, Inc. (a) | 12,475 | 875,121 | ||||||
| RealReal, Inc. (a) | 5,439 | 157,187 | ||||||
| Spotify Technology S.A. (a) | 2,111 | 308,670 | ||||||
| Wix.com Ltd. (a) | 2,725 | 387,223 | ||||||
|
| |||||||
| $ | 12,813,418 | |||||||
|
| |||||||
| Leisure & Toys – 1.9% |
| |||||||
| Activision Blizzard, Inc. | 1,422 | $ | 67,118 | |||||
| Electronic Arts, Inc. (a) | 11,548 | 1,169,351 | ||||||
|
| |||||||
| $ | 1,236,469 | |||||||
|
| |||||||
| Medical & Health Technology & Services – 0.7% |
| |||||||
| Guardant Health, Inc. (a) | 5,221 | $ | 450,729 | |||||
|
| |||||||
| Medical Equipment – 0.1% |
| |||||||
| Adaptive Biotechnologies Corp. (a) | 126 | $ | 6,086 | |||||
| Senseonics Holdings, Inc. (a) | 39,984 | 81,567 | ||||||
|
| |||||||
| $ | 87,653 | |||||||
|
| |||||||
| Other Banks & Diversified Financials – 9.2% |
| |||||||
| Mastercard, Inc., “A” | 10,610 | $ | 2,806,663 | |||||
| Visa, Inc., “A” | 18,742 | 3,252,674 | ||||||
|
| |||||||
| $ | 6,059,337 | |||||||
|
| |||||||
| Printing & Publishing – 1.0% |
| |||||||
| IHS Markit Ltd. (a) | 10,680 | $ | 680,530 | |||||
|
| |||||||
4
Table of Contents
MFS Technology Portfolio
Portfolio of Investments (unaudited) – continued
| Issuer | Shares/Par | Value ($) | ||||||
| COMMON STOCKS – continued |
| |||||||
| Specialty Stores – 10.4% |
| |||||||
| Amazon.com, Inc. (a)(s) | 3,542 | $ | 6,707,238 | |||||
| Chewy, Inc., “A” (a) | 5,754 | 201,390 | ||||||
|
| |||||||
| $ | 6,908,628 | |||||||
|
| |||||||
| Total Common Stocks (Identified Cost, $45,608,881) | $ | 65,530,157 | ||||||
|
| |||||||
| INVESTMENT COMPANIES (h) – 1.8% |
| |||||||
| Money Market Funds – 1.8% | ||||||||
| MFS Institutional Money Market Portfolio, 2.42% (v) (Identified Cost, $1,203,447) | 1,203,416 | $ | 1,203,536 | |||||
|
| |||||||
| SECURITIES SOLD SHORT – (0.7)% |
| |||||||
| Automotive – (0.7)% |
| |||||||
| Tesla, Inc. (Proceeds Received, $550,618) | (1,977 | ) | $ | (441,780 | ) | |||
|
| |||||||
| OTHER ASSETS, LESS LIABILITIES – (0.3)% | (197,986 | ) | ||||||
|
| |||||||
| NET ASSETS – 100.0% | $ | 66,093,927 | ||||||
|
| |||||||
| (a) | Non-income producing security. |
| (h) | An affiliated issuer, which may be considered one in which the fund owns 5% or more of the outstanding voting securities, or a company which is under common control. At period end, the aggregate values of the fund’s investments in affiliated issuers and in unaffiliated issuers were $1,203,536 and $65,530,157, respectively. |
| (s) | Security or a portion of the security was pledged to cover collateral requirements for securities sold short. |
| (v) | Affiliated issuer that is available only to investment companies managed by MFS. The rate quoted for the MFS Institutional Money Market Portfolio is the annualizedseven-day yield of the fund at period end. |
The following abbreviations are used in this report and are defined:
| ADR | American Depositary Receipt |
At June 30, 2019, the fund had cash collateral of $57,834 and other liquid securities with an aggregate value of $959,521 to cover any collateral or margin obligations for securities sold short. Restricted cash and/or deposits with brokers in the Statement of Assets and Liabilities are comprised of cash collateral.
See Notes to Financial Statements
5
Table of Contents
MFS Technology Portfolio
FINANCIAL STATEMENTS | STATEMENT OF ASSETS AND LIABILITIES (unaudited)
This statement represents your fund’s balance sheet, which details the assets and liabilities comprising the total value of the fund.
At 6/30/19 | ||||
Assets | ||||
Investments in unaffiliated issuers, at value (identified cost, $45,608,881) | $65,530,157 | |||
Investments in affiliated issuers, at value (identified cost, $1,203,447) | 1,203,536 | |||
Deposits with brokers for | ||||
Securities sold short | 57,834 | |||
Receivables for | ||||
Investments sold | 124,869 | |||
Fund shares sold | 10,751 | |||
Interest and dividends | 10,294 | |||
Other assets | 550 | |||
Total assets | $66,937,991 | |||
Liabilities | ||||
Payables for | ||||
Securities sold short, at value (proceeds received, $550,618) | $441,780 | |||
Investments purchased | 136,507 | |||
Fund shares reacquired | 190,803 | |||
Payable to affiliates | ||||
Investment adviser | 5,693 | |||
Administrative services fee | 215 | |||
Shareholder servicing costs | 25 | |||
Distribution and/or service fees | 1,266 | |||
Payable for independent Trustees’ compensation | 1,301 | |||
Accrued expenses and other liabilities | 66,474 | |||
Total liabilities | $844,064 | |||
Net assets | $66,093,927 | |||
Net assets consist of | ||||
Paid-in capital | $39,406,046 | |||
Total distributable earnings (loss) | 26,687,881 | |||
Net assets | $66,093,927 | |||
Shares of beneficial interest outstanding | 3,128,968 | |||
| Net assets | Shares outstanding | Net asset value per share | ||||||||||
Initial Class | $19,592,798 | 892,358 | $21.96 | |||||||||
Service Class | 46,501,129 | 2,236,610 | 20.79 | |||||||||
See Notes to Financial Statements
6
Table of Contents
MFS Technology Portfolio
FINANCIAL STATEMENTS | STATEMENT OF OPERATIONS (unaudited)
This statement describes how much your fund earned in investment income and accrued in expenses. It also describes any gains and/or losses generated by fund operations.
Six months ended 6/30/19 | ||||
Net investment income (loss) | ||||
Income | ||||
Dividends | $155,725 | |||
Other | 16,842 | |||
Dividends from affiliated issuers | 13,007 | |||
Income on securities loaned | 582 | |||
Foreign taxes withheld | (2,776 | ) | ||
Total investment income | $183,380 | |||
Expenses | ||||
Management fee | $241,438 | |||
Distribution and/or service fees | 56,878 | |||
Shareholder servicing costs | 1,651 | |||
Administrative services fee | 9,701 | |||
Independent Trustees’ compensation | 2,988 | |||
Custodian fee | 5,746 | |||
Shareholder communications | 6,288 | |||
Audit and tax fees | 28,054 | |||
Legal fees | 1,080 | |||
Dividend and interest expense on securities sold short | 6,807 | |||
Interest expense and fees | 427 | |||
Miscellaneous | 14,812 | |||
Total expenses | $375,870 | |||
Reduction of expenses by investment adviser | (3,103 | ) | ||
Net expenses | $372,767 | |||
Net investment income (loss) | $(189,387 | ) | ||
Realized and unrealized gain (loss) | ||||
Realized gain (loss) (identified cost basis) | ||||
Unaffiliated issuers | $237,912 | |||
Affiliated issuers | 88 | |||
Written options | 11,625 | |||
Securities sold short | 34,797 | |||
Foreign currency | (6 | ) | ||
Net realized gain (loss) | $284,416 | |||
Change in unrealized appreciation or depreciation | ||||
Unaffiliated issuers | $14,624,447 | |||
Affiliated issuers | 89 | |||
Securities sold short | 108,838 | |||
Translation of assets and liabilities in foreign currencies | 8 | |||
Net unrealized gain (loss) | $14,733,382 | |||
Net realized and unrealized gain (loss) | $15,017,798 | |||
Change in net assets from operations | $14,828,411 | |||
See Notes to Financial Statements
7
Table of Contents
MFS Technology Portfolio
FINANCIAL STATEMENTS | STATEMENTS OF CHANGES IN NET ASSETS
These statements describe the increases and/or decreases in net assets resulting from operations, any distributions, and any shareholder transactions.
| Six months ended 6/30/19 | Year ended 12/31/18 | |||||||
| (unaudited) | ||||||||
Change in net assets | ||||||||
From operations | ||||||||
Net investment income (loss) | $(189,387 | ) | $(1,354,994 | ) | ||||
Net realized gain (loss) | 284,416 | 108,354,927 | ||||||
Net unrealized gain (loss) | 14,733,382 | (82,721,053 | ) | |||||
Change in net assets from operations | $14,828,411 | $24,278,880 | ||||||
Total distributions to shareholders | $— | $(15,602,152 | ) | |||||
Change in net assets from fund share transactions | $(5,062,055 | ) | $(183,617,707 | ) | ||||
Total change in net assets | $9,766,356 | $(174,940,979 | ) | |||||
Net assets | ||||||||
At beginning of period | 56,327,571 | 231,268,550 | ||||||
At end of period | $66,093,927 | $56,327,571 | ||||||
See Notes to Financial Statements
8
Table of Contents
MFS Technology Portfolio
FINANCIAL STATEMENTS | FINANCIAL HIGHLIGHTS
The financial highlights table is intended to help you understand the fund’s financial performance for the semiannual period and the past 5 fiscal years. Certain information reflects financial results for a single fund share. The total returns in the table represent the rate that an investor would have earned (or lost) on an investment in the fund share class (assuming reinvestment of all distributions) held for the entire period.
| Initial Class | Six months ended 6/30/19 | Year ended | ||||||||||||||||||||||
| 12/31/18 | 12/31/17 | 12/31/16 | 12/31/15 | 12/31/14 | ||||||||||||||||||||
| (unaudited) | ||||||||||||||||||||||||
Net asset value, beginning of period | $17.34 | $17.96 | $13.19 | $12.45 | $11.63 | $10.71 | ||||||||||||||||||
| Income (loss) from investment operations | ||||||||||||||||||||||||
Net investment income (loss) (d) | $(0.04 | ) | $(0.07 | ) | $(0.05 | ) | $(0.01 | )(c) | $(0.03 | ) | $(0.02 | ) | ||||||||||||
Net realized and unrealized gain (loss) | 4.66 | 0.58 | 5.16 | 1.10 | 1.22 | 1.16 | ||||||||||||||||||
Total from investment operations | $4.62 | $0.51 | $5.11 | $1.09 | $1.19 | $1.14 | ||||||||||||||||||
| Less distributions declared to shareholders | ||||||||||||||||||||||||
From net realized gain | $— | $(1.13 | ) | $(0.34 | ) | $(0.35 | ) | $(0.37 | ) | $(0.22 | ) | |||||||||||||
Net asset value, end of period (x) | $21.96 | $17.34 | $17.96 | $13.19 | $12.45 | $11.63 | ||||||||||||||||||
Total return (%) (k)(r)(s)(x) | 26.64 | (n) | 1.73 | 39.00 | 8.69 | (c) | 10.75 | 10.71 | ||||||||||||||||
| Ratios (%) (to average net assets) and Supplemental data: | ||||||||||||||||||||||||
Expenses before expense reductions (f) | 0.99 | (a) | 0.94 | 0.88 | 0.85 | (c) | 0.91 | 0.94 | ||||||||||||||||
Expenses after expense reductions (f) | 0.98 | (a) | 0.93 | 0.88 | 0.85 | (c) | 0.91 | 0.93 | ||||||||||||||||
Net investment income (loss) | (0.41 | )(a) | (0.38 | ) | (0.29 | ) | (0.10 | )(c) | (0.22 | ) | (0.20 | ) | ||||||||||||
Portfolio turnover | 17 | (n) | 39 | 31 | 36 | 45 | 35 | |||||||||||||||||
Net assets at end of period (000 omitted) | $19,593 | $17,056 | $27,659 | $15,195 | $15,588 | $16,062 | ||||||||||||||||||
| Supplemental Ratios (%): | ||||||||||||||||||||||||
Ratio of expenses to average net assets after expense reductions excluding short sale expenses and interest expense and fees (f) | 0.96 | 0.85 | 0.85 | 0.82 | (c) | 0.89 | 0.91 | |||||||||||||||||
| Service Class | Six months 6/30/19 | Year ended | ||||||||||||||||||||||
| 12/31/18 | 12/31/17 | 12/31/16 | 12/31/15 | 12/31/14 | ||||||||||||||||||||
| (unaudited) | ||||||||||||||||||||||||
Net asset value, beginning of period | $16.44 | $17.11 | $12.61 | $11.95 | $11.20 | $10.35 | ||||||||||||||||||
| Income (loss) from investment operations | ||||||||||||||||||||||||
Net investment income (loss) (d) | $(0.06 | ) | $(0.12 | ) | $(0.08 | ) | $(0.04 | )(c) | $(0.05 | ) | $(0.05 | ) | ||||||||||||
Net realized and unrealized gain (loss) | 4.41 | 0.58 | 4.92 | 1.05 | 1.17 | 1.12 | ||||||||||||||||||
Total from investment operations | $4.35 | $0.46 | $4.84 | $1.01 | $1.12 | $1.07 | ||||||||||||||||||
| Less distributions declared to shareholders | ||||||||||||||||||||||||
From net realized gain | $— | $(1.13 | ) | $(0.34 | ) | $(0.35 | ) | $(0.37 | ) | $(0.22 | ) | |||||||||||||
Net asset value, end of period (x) | $20.79 | $16.44 | $17.11 | $12.61 | $11.95 | $11.20 | ||||||||||||||||||
Total return (%) (k)(r)(s)(x) | 26.46 | (n) | 1.52 | 38.65 | 8.39 | (c) | 10.53 | 10.40 | ||||||||||||||||
| Ratios (%) (to average net assets) and Supplemental data: | ||||||||||||||||||||||||
Expenses before expense reductions (f) | 1.24 | (a) | 1.16 | 1.14 | 1.10 | (c) | 1.16 | 1.19 | ||||||||||||||||
Expenses after expense reductions (f) | 1.23 | (a) | 1.15 | 1.13 | 1.10 | (c) | 1.16 | 1.18 | ||||||||||||||||
Net investment income (loss) | (0.66 | )(a) | (0.61 | ) | (0.53 | ) | (0.35 | )(c) | (0.47 | ) | (0.45 | ) | ||||||||||||
Portfolio turnover | 17 | (n) | 39 | 31 | 36 | 45 | 35 | |||||||||||||||||
Net assets at end of period (000 omitted) | $46,501 | $39,272 | $203,610 | $126,561 | $106,002 | $81,693 | ||||||||||||||||||
| Supplemental Ratios (%): | ||||||||||||||||||||||||
Ratio of expenses to average net assets after expense reductions excluding short sale expenses and interest expense and fees (f) | 1.21 | 1.07 | 1.10 | 1.06 | (c) | 1.14 | 1.16 | |||||||||||||||||
See Notes to Financial Statements
9
Table of Contents
MFS Technology Portfolio
Financial Highlights – continued
| (a) | Annualized. |
| (c) | Amount reflects aone-time reimbursement of expenses by the custodian (or former custodian) without which net investment income and performance would be lower and expenses would be higher. |
| (d) | Per share data is based on average shares outstanding. |
| (f) | Ratios do not reflect reductions from fees paid indirectly, if applicable. |
| (k) | The total return does not reflect expenses that apply to separate accounts. Inclusion of these charges would reduce the total return figures for all periods shown. |
| (n) | Not annualized. |
| (r) | Certain expenses have been reduced without which performance would have been lower. |
| (s) | From time to time the fund may receive proceeds from litigation settlements, without which performance would be lower. |
| (x) | The net asset values and total returns have been calculated on net assets which include adjustments made in accordance with U.S. generally accepted accounting principles required at period end for financial reporting purposes. |
See Notes to Financial Statements
10
Table of Contents
MFS Technology Portfolio
NOTES TO FINANCIAL STATEMENTS (unaudited)
| (1) | Business and Organization |
MFS Technology Portfolio (the fund) is anon-diversified series of MFS Variable Insurance Trust II (the trust). The trust is organized as a Massachusetts business trust and is registered under the Investment Company Act of 1940, as amended, as anopen-end management investment company. The shareholders of each series of the trust are separate accounts of insurance companies, which offer variable annuity and/or life insurance products, and qualified retirement and pension plans.
The fund is an investment company and accordingly follows the investment company accounting and reporting guidance of the Financial Accounting Standards Board (FASB) Accounting Standards Codification Topic 946 Financial Services – Investment Companies.
| (2) | Significant Accounting Policies |
General– The preparation of financial statements in conformity with U.S. generally accepted accounting principles requires management to make estimates and assumptions that affect the reported amounts of assets and liabilities, and disclosure of contingent assets and liabilities at the date of the financial statements and the reported amounts of increases and decreases in net assets from operations during the reporting period. Actual results could differ from those estimates. In the preparation of these financial statements, management has evaluated subsequent events occurring after the date of the fund’s Statement of Assets and Liabilities through the date that the financial statements were issued. The fund invests primarily in securities of issuers in the technology industry. Issuers in a single industry can react similarly to market, currency, political, economic, regulatory, geopolitical, and other conditions. The value of stocks in the technology sector can be very volatile due to the rapid pace of product change, technological developments, and other factors.
Balance Sheet Offsetting– The fund’s accounting policy with respect to balance sheet offsetting is that, absent an event of default by the counterparty or a termination of the agreement, the International Swaps and Derivatives Association (ISDA) Master Agreement, or similar agreement, does not result in an offset of reported amounts of financial assets and financial liabilities in the Statement of Assets and Liabilities across transactions between the fund and the applicable counterparty. The fund’s right to setoff may be restricted or prohibited by the bankruptcy or insolvency laws of the particular jurisdiction to which a specific master netting agreement counterparty is subject. Balance sheet offsetting disclosures, to the extent applicable to the fund, have been included in the fund’s Significant Accounting Policies note under the captions for each of the fund’sin-scope financial instruments and transactions.
Investment Valuations– Equity securities, including restricted equity securities and equity securities sold short, are generally valued at the last sale or official closing price on their primary market or exchange as provided by a third-party pricing service. Equity securities, for which there were no sales reported that day, are generally valued at the last quoted daily bid quotation on their primary market or exchange as provided by a third-party pricing service. Equity securities sold short, for which there were no sales reported for that day, are generally valued at the last quoted daily ask quotation on their primary market or exchange as provided by a third-party pricing service. Short-term instruments with a maturity at issuance of 60 days or less may be valued at amortized cost, which approximates market value. Exchange-traded options are generally valued at the last sale or official closing price on their primary exchange as provided by a third-party pricing service. Exchange-traded options for which there were no sales reported that day are generally valued at the last daily bid quotation on their primary exchange as provided by a third-party pricing service. Options not traded on an exchange are generally valued at a broker/dealer bid quotation. Foreign currency options are generally valued at valuations provided by a third-party pricing service.Open-end investment companies are generally valued at net asset value per share. Securities and other assets generally valued on the basis of information from a third-party pricing service may also be valued at a broker/dealer bid quotation. In determining values, third-party pricing services can utilize both transaction data and market information such as yield, quality, coupon rate, maturity, type of issue, trading characteristics, and other market data. The values of foreign securities and other assets and liabilities expressed in foreign currencies are converted to U.S. dollars using the mean of bid and asked prices for rates provided by a third-party pricing service.
The Board of Trustees has delegated primary responsibility for determining or causing to be determined the value of the fund’s investments (including any fair valuation) to the adviser pursuant to valuation policies and procedures approved by the Board. If the adviser determines that reliable market quotations are not readily available, investments are valued at fair value as determined in good faith by the adviser in accordance with such procedures under the oversight of the Board of Trustees. Under the fund’s valuation policies and procedures, market quotations are not considered to be readily available for most types of debt instruments and floating rate loans and many types of derivatives. These investments are generally valued at fair value based on information from third-party pricing services. In addition, investments may be valued at fair value if the adviser determines that an investment’s value has been materially affected by events occurring after the close of the exchange or market on which the investment is principally traded (such as foreign exchange or market) and prior to the determination of the fund’s net asset value, or after the halt of trading of a specific security where trading does not resume prior to the close of the exchange or market on which the security is principally traded. Events that occur after foreign markets close (such as developments in foreign markets and significant movements in the U.S. markets) and prior to the determination of the fund’s net asset value may be deemed to have a material effect on the value of
11
Table of Contents
MFS Technology Portfolio
Notes to Financial Statements (unaudited) – continued
securities traded in foreign markets. Accordingly, the fund’s foreign equity securities may often be valued at fair value. The adviser generally relies on third-party pricing services or other information (such as the correlation with price movements of similar securities in the same or other markets; the type, cost and investment characteristics of the security; the business and financial condition of the issuer; and trading and other market data) to assist in determining whether to fair value and at what value to fair value an investment. The value of an investment for purposes of calculating the fund’s net asset value can differ depending on the source and method used to determine value. When fair valuation is used, the value of an investment used to determine the fund’s net asset value may differ from quoted or published prices for the same investment. There can be no assurance that the fund could obtain the fair value assigned to an investment if it were to sell the investment at the same time at which the fund determines its net asset value per share.
Various inputs are used in determining the value of the fund’s assets or liabilities. These inputs are categorized into three broad levels. In certain cases, the inputs used to measure fair value may fall into different levels of the fair value hierarchy. In such cases, an investment’s level within the fair value hierarchy is based on the lowest level of input that is significant to the fair value measurement. The fund’s assessment of the significance of a particular input to the fair value measurement in its entirety requires judgment, and considers factors specific to the investment. Level 1 includes unadjusted quoted prices in active markets for identical assets or liabilities. Level 2 includes other significant observable market-based inputs (including quoted prices for similar securities, interest rates, prepayment speed, and credit risk). Level 3 includes unobservable inputs, which may include the adviser’s own assumptions in determining the fair value of investments. The following is a summary of the levels used as of June 30, 2019 in valuing the fund’s assets or liabilities:
| Financial Instruments | Level 1 | Level 2 | Level 3 | Total | ||||||||||||
| Equity Securities | $65,530,157 | $— | $— | $65,530,157 | ||||||||||||
| Mutual Funds | 1,203,536 | — | — | 1,203,536 | ||||||||||||
| Total | $66,733,693 | $— | $— | $66,733,693 | ||||||||||||
| Securities Sold Short | $(441,780 | ) | $— | $— | $(441,780 | ) | ||||||||||
For further information regarding security characteristics, see the Portfolio of Investments.
Foreign Currency Translation– Purchases and sales of foreign investments, income, and expenses are converted into U.S. dollars based upon currency exchange rates prevailing on the respective dates of such transactions or on the reporting date for foreign denominated receivables and payables. Gains and losses attributable to foreign currency exchange rates on sales of securities are recorded for financial statement purposes as net realized gains and losses on investments. Gains and losses attributable to foreign exchange rate movements on receivables, payables, income and expenses are recorded for financial statement purposes as foreign currency transaction gains and losses. That portion of both realized and unrealized gains and losses on investments that results from fluctuations in foreign currency exchange rates is not separately disclosed.
Derivatives– The fund uses derivatives primarily to increase or decrease exposure to a particular market or segment of the market, or security, to increase or decrease interest rate or currency exposure, or as alternatives to direct investments. Derivatives are used for hedging ornon-hedging purposes. While hedging can reduce or eliminate losses, it can also reduce or eliminate gains. When the fund uses derivatives as an investment to increase market exposure, or for hedging purposes, gains and losses from derivative instruments may be substantially greater than the derivative’s original cost.
The derivative instruments used by the fund during the period were written options and purchased options. Depending on the type of derivative, the fund may exit a derivative position by entering into an offsetting transaction with a counterparty or exchange, negotiating an agreement with the derivative counterparty, or novating the position to a third party. The fund’s period end derivatives, as presented in the Portfolio of Investments and the associated Derivative Contract tables, generally are indicative of the volume of its derivative activity during the period.
At June 30, 2019, the fund did not have any outstanding derivative instruments.
The following table presents, by major type of derivative contract, the realized gain (loss) on derivatives held by the fund for the six months ended June 30, 2019 as reported in the Statement of Operations:
| Risk | Unaffiliated Issuers (Purchased Options) | Written Options | ||||||
| Equity | $(5,363 | ) | $11,625 | |||||
There is no change in unrealized appreciation (depreciation) on derivative transactions at period end.
Derivative counterparty credit risk is managed through formal evaluation of the creditworthiness of all potential counterparties. On certain, but not all, uncleared derivatives, the fund attempts to reduce its exposure to counterparty credit risk whenever possible by entering into an ISDA Master Agreement on a bilateral basis. The ISDA Master Agreement gives each party to the agreement the right to terminate all transactions traded under such agreement if there is a specified deterioration in the credit quality of the other
12
Table of Contents
MFS Technology Portfolio
Notes to Financial Statements (unaudited) – continued
party. Upon an event of default or a termination of the ISDA Master Agreement, thenon-defaulting party has the right to close out all transactions traded under such agreement and to net amounts owed under each agreement to one net amount payable by one party to the other. This right to close out and net payments across all transactions traded under the ISDA Master Agreement could result in a reduction of the fund’s credit risk to such counterparty equal to any amounts payable by the fund under the applicable transactions, if any.
Collateral and margin requirements differ by type of derivative. For cleared derivatives (e.g., futures contracts, cleared swaps, and exchange-traded options), margin requirements are set by the clearing broker and the clearing house and collateral, in the form of cash or securities, is posted by the fund directly with the clearing broker. Collateral terms are counterparty agreement specific for uncleared derivatives (e.g., forward foreign currency exchange contracts, uncleared swap agreements, and uncleared options) and collateral, in the form of cash and securities, is held in segregated accounts with the fund’s custodian in connection with these agreements. For derivatives traded under an ISDA Master Agreement, which contains a collateral support annex, the collateral requirements are netted across all transactions traded under such counterparty-specific agreement and an amount is posted from one party to the other to collateralize such obligations. Cash that has been segregated or delivered to cover the fund’s collateral or margin obligations under derivative contracts, if any, will be reported separately in the Statement of Assets and Liabilities as restricted cash for uncleared derivatives and/or deposits with brokers for cleared derivatives. Securities pledged as collateral or margin for the same purpose, if any, are noted in the Portfolio of Investments. The fund may be required to make payments of interest on uncovered collateral or margin obligations with the broker. Any such payments are included in “Miscellaneous” expense in the Statement of Operations.
Written Options– In exchange for a premium, the fund wrote call options on securities for which it anticipated the price would decline and also wrote put options on securities for which it anticipated the price would increase. At the time the option was written, the fund believed the premium received exceeded the potential loss that could result from adverse price changes in the options’ underlying securities. In a written option, the fund as the option writer grants the buyer the right to purchase from, or sell to, the fund a specified number of shares or units of a particular security, currency or index at a specified price within a specified period of time.
The premium received is initially recorded as a liability in the Statement of Assets and Liabilities. The option is subsequentlymarked-to-market daily with the difference between the premium received and the market value of the written option being recorded as unrealized appreciation or depreciation. When a written option expires, the fund realizes a gain equal to the amount of the premium received. The difference between the premium received and the amount paid on effecting a closing transaction is considered a realized gain or loss. When a written call option is exercised, the premium received is offset against the proceeds to determine the realized gain or loss. When a written put option is exercised, the premium reduces the cost basis of the security purchased by the fund.
At the initiation of the written option contract, for exchange traded options, the fund is required to deposit securities or cash as collateral with the custodian for the benefit of the broker or directly with the clearing broker, based on the type of option. For uncleared options, the fund may post collateral subject to the terms of an ISDA Master Agreement as generally described above if the market value of the options contract moves against it. The fund, as writer of an option, may have no control over whether the underlying securities may be sold (call) or purchased (put) and, as a result, bears the market risk of an unfavorable change in the price of the securities underlying the written option. Losses from writing options can exceed the premium received and can exceed the potential loss from an ordinary buy and sell transaction. Although the fund’s market risk may be significant, the maximum counterparty credit risk to the fund is equal to the market value of any collateral posted to the broker. For uncleared options, this risk is mitigated in cases where there is an ISDA Master Agreement between the fund and the counterparty providing for netting as described above.
Purchased Options– The fund purchased put options for a premium. Purchased put options entitle the holder to buy and sell a specified number of shares or units of a particular security, currency or index at a specified price at a specified date or within a specified period of time. Purchasing put options may hedge against an anticipated decline in the value of portfolio securities or currency or decrease the fund’s exposure to an underlying instrument.
The premium paid is initially recorded as an investment in the Statement of Assets and Liabilities. That investment is subsequentlymarked-to-market daily with the difference between the premium paid and the market value of the purchased option being recorded as unrealized appreciation or depreciation. Premiums paid for purchased put options which have expired are treated as realized losses on investments in the Statement of Operations. Upon the exercise or closing of a purchased put option, the premium paid is offset against the proceeds on the sale of the underlying security or financial instrument in order to determine the realized gain or loss on investments.
Whether or not the option is exercised, the fund’s maximum risk of loss from purchasing an option is the amount of premium paid. All option contracts involve credit risk if the counterparty to the option contract fails to perform. For uncleared options, this risk is
13
Table of Contents
MFS Technology Portfolio
Notes to Financial Statements (unaudited) – continued
mitigated in cases where there is an ISDA Master Agreement between the fund and the counterparty providing for netting as described above and, where applicable, by the posting of collateral by the counterparty to the fund to cover the fund’s exposure to the counterparty under such ISDA Master Agreement.
Short Sales– The fund entered into short sales whereby it sells a security it does not own in anticipation of a decline in the value of that security. The fund will realize a gain if the security price decreases and a loss if the security price increases between the date of the short sale and the date on which the fund replaces the borrowed security. Losses from short sales can exceed the proceeds of the security sold; and they can also exceed the potential loss from an ordinary buy and sell transaction. The amount of any premium, dividends, or interest the fund may be required to pay in connection with a short sale will be recognized as a fund expense. During the six months ended June 30, 2019, this expense amounted to $6,807. The fund segregates cash or marketable securities in an amount that, when combined with the amount of proceeds from the short sale deposited with the broker, at least equals the current market value of the security sold short.
Security Loans– Under its Securities Lending Agency Agreement with the fund, State Street Bank and Trust Company, as lending agent, loans the securities of the fund to certain qualified institutions (the “Borrowers”) approved by the fund. Security loans can be terminated at the discretion of either the lending agent or the fund and the related securities must be returned within the earlier of the standard trade settlement period for such securities or within three business days. The loans are collateralized by cash and/or U.S. Treasury and federal agency obligations in an amount typically at least equal to the market value of the securities loaned. On loans collateralized by cash, the cash collateral is invested in a money market fund. The market value of the loaned securities is determined at the close of business of the fund and any additional required collateral is delivered to the fund on the next business day. The lending agent provides the fund with indemnification against Borrower default. In the event of Borrower default, the lending agent will, for the benefit of the fund, either purchase securities identical to those loaned or, when such purchase is commercially impracticable, pay the fund the market value of the loaned securities. In return, the lending agent assumes the fund’s rights to the related collateral. If the collateral value is less than the cost to purchase identical securities, the lending agent is responsible for the shortfall, but only to the extent that such shortfall is not due to a decline in collateral value resulting from collateral reinvestment for which the fund bears the risk of loss. A portion of the income generated upon investment of the collateral is remitted to the Borrowers, and the remainder is allocated between the fund and the lending agent. On loans collateralized by U.S. Treasury and/or federal agency obligations, a fee is received from the Borrower, and is allocated between the fund and the lending agent. Income from securities lending is separately reported in the Statement of Operations. The dividend and interest income earned on the securities loaned is accounted for in the same manner as other dividend and interest income. At June 30, 2019, there were no securities on loan or collateral outstanding.
Indemnifications– Under the fund’s organizational documents, its officers and Trustees may be indemnified against certain liabilities and expenses arising out of the performance of their duties to the fund. Additionally, in the normal course of business, the fund enters into agreements with service providers that may contain indemnification clauses. The fund’s maximum exposure under these agreements is unknown as this would involve future claims that may be made against the fund that have not yet occurred.
Investment Transactions and Income– Investment transactions are recorded on the trade date. Interest income is recorded on the accrual basis. Dividends received in cash are recorded on theex-dividend date. Certain dividends from foreign securities will be recorded when the fund is informed of the dividend if such information is obtained subsequent to theex-dividend date. Dividend payments received in additional securities are recorded on theex-dividend date in an amount equal to the value of the security on such date.
The fund may receive proceeds from litigation settlements. Any proceeds received from litigation involving portfolio holdings are reflected in the Statement of Operations in realized gain/loss if the security has been disposed of by the fund or in unrealized gain/loss if the security is still held by the fund. Any other proceeds from litigation not related to portfolio holdings are reflected as other income in the Statement of Operations.
Tax Matters and Distributions– The fund intends to qualify as a regulated investment company, as defined under Subchapter M of the Internal Revenue Code, and to distribute all of its taxable income, including realized capital gains. As a result, no provision for federal income tax is required. The fund’s federal tax returns, when filed, will remain subject to examination by the Internal Revenue Service for a three year period. Management has analyzed the fund’s tax positions taken on federal and state tax returns for all open tax years and does not believe that there are any uncertain tax positions that require recognition of a tax liability. Foreign taxes, if any, have been accrued by the fund in the accompanying financial statements in accordance with the applicable foreign tax law. Foreign income taxes may be withheld by certain countries in which the fund invests. Additionally, capital gains realized by the fund on securities issued in or by certain foreign countries may be subject to capital gains tax imposed by those countries.
Distributions to shareholders are recorded on theex-dividend date. Income and capital gain distributions are determined in accordance with income tax regulations, which may differ from U.S. generally accepted accounting principles. Certain capital accounts in the financial statements are periodically adjusted for permanent differences in order to reflect their tax character. These adjustments have no impact on net assets or net asset value per share. Temporary differences which arise from recognizing certain
14
Table of Contents
MFS Technology Portfolio
Notes to Financial Statements (unaudited) – continued
items of income, expense, gain or loss in different periods for financial statement and tax purposes will reverse at some time in the future. Distributions in excess of net investment income or net realized gains are temporary overdistributions for financial statement purposes resulting from differences in the recognition or classification of income or distributions for financial statement and tax purposes.
Book/tax differences primarily relate to wash sale loss deferrals, straddle loss deferrals, and redemptionsin-kind.
The tax character of distributions declared to shareholders for the last fiscal year is as follows:
| Year ended 12/31/18 | ||||
| Ordinary income (including any short-term capital gains) | $3,607,065 | |||
| Long-term capital gains | 11,995,087 | |||
| Total distributions | $15,602,152 | |||
The federal tax cost and the tax basis components of distributable earnings were as follows:
| As of 6/30/19 | ||||
| Cost of investments | $47,205,776 | |||
| Gross appreciation | 20,427,710 | |||
| Gross depreciation | (899,793 | ) | ||
| Net unrealized appreciation (depreciation) | $19,527,917 | |||
| As of 12/31/18 | ||||
| Undistributed ordinary income | 96,810 | |||
| Undistributed long-term capital gain | 6,859,279 | |||
| Net unrealized appreciation (depreciation) | 4,903,381 | |||
The aggregate cost above includes prior fiscal year end tax adjustments, if applicable.
Multiple Classes of Shares of Beneficial Interest– The fund offers multiple classes of shares, which differ in their respective distribution and/or service fees. The fund’s income, realized and unrealized gain (loss), and common expenses are allocated to shareholders based on the daily net assets of each class. Dividends are declared separately for each class. Differences in per share dividend rates are generally due to differences in separate class expenses. The fund’s distributions declared to shareholders as reported in the Statements of Changes in Net Assets are presented by class as follows:
| From net realized gain | ||||||||
| Six months ended 6/30/19 | Year ended 12/31/18 | |||||||
| Initial Class | $— | $1,094,630 | ||||||
| Service Class | — | 14,507,522 | ||||||
| Total | $— | $15,602,152 | ||||||
| (3) | Transactions with Affiliates |
Investment Adviser– The fund has an investment advisory agreement with MFS to provide overall investment management and related administrative services and facilities to the fund. The management fee is computed daily and paid monthly at the following annual rates based on the fund’s average daily net assets:
| Up to $1 billion | 0.75% | |||
| In excess of $1 billion | 0.70% |
MFS has agreed in writing to reduce its management fee by a specified amount if certain MFS mutual fund assets exceed thresholds agreed to by MFS and the fund’s Board of Trustees. For the six months ended June 30, 2019, this management fee reduction amounted to $3,103, which is included in the reduction of total expenses in the Statement of Operations. The management fee incurred for the six months ended June 30, 2019 was equivalent to an annual effective rate of 0.74% of the fund’s average daily net assets.
The investment adviser has agreed in writing to pay a portion of the fund’s total annual operating expenses, excluding interest, taxes, extraordinary expenses, brokerage and transaction costs, and investment-related expenses, (such as short sale dividend and interest expenses incurred in connection with the fund’s investment activity), such that total annual operating expenses do not exceed 1.00% of average daily net assets for the Initial Class shares and 1.25% of average daily net assets for the Service Class shares. This written agreement will continue until modified by the fund’s Board of Trustees, but such agreement will continue at least until April 30, 2021. For the six months ended June 30, 2019, the fund’s actual operating expenses did not exceed the limit and therefore, the investment adviser did not pay any portion of the fund’s expenses related to this agreement.
15
Table of Contents
MFS Technology Portfolio
Notes to Financial Statements (unaudited) – continued
Distributor– MFS Fund Distributors, Inc. (MFD), a wholly-owned subsidiary of MFS, is the distributor of shares of the fund. The Trustees have adopted a distribution plan for the Service Class shares pursuant to Rule12b-1 under the Investment Company Act of 1940.
The fund’s distribution plan provides that the fund will pay MFD distribution and/or service fees equal to 0.25% per annum of its average daily net assets attributable to Service Class shares as partial consideration for services performed and expenses incurred by MFD and financial intermediaries (including participating insurance companies that invest in the fund to fund variable annuity and variable life insurance contracts, sponsors of qualified retirement and pension plans that invest in the fund, and affiliates of these participating insurance companies and plan sponsors) in connection with the sale and distribution of the Service Class shares. MFD may subsequently pay all, or a portion, of the distribution and/or service fees to financial intermediaries.
Shareholder Servicing Agent– MFS Service Center, Inc. (MFSC), a wholly-owned subsidiary of MFS, receives a fee from the fund for its services as shareholder servicing agent. For the six months ended June 30, 2019, the fee was $1,539, which equated to 0.0048% annually of the fund’s average daily net assets. MFSC also receives payment from the fund forout-of-pocket expenses paid by MFSC on behalf of the fund. For the six months ended June 30, 2019, these costs amounted to $112.
Administrator– MFS provides certain financial, legal, shareholder communications, compliance, and other administrative services to the fund. Under an administrative services agreement, the fund reimburses MFS the costs incurred to provide these services. The fund is charged an annual fixed amount of $17,500 plus a fee based on average daily net assets. The administrative services fee incurred for the six months ended June 30, 2019 was equivalent to an annual effective rate of 0.0301% of the fund’s average daily net assets.
Trustees’ and Officers’ Compensation– The fund pays compensation to independent Trustees in the form of a retainer, attendance fees, and additional compensation to Board and Committee chairpersons. The fund does not pay compensation directly to Trustees or officers of the fund who are also officers of the investment adviser, all of whom receive remuneration from MFS for their services to the fund. Certain officers and Trustees of the fund are officers or directors of MFS, MFD, and MFSC.
Other– This fund and certain other funds managed by MFS (the funds) had entered into a service agreement (the ISO Agreement) which provided for payment of fees solely by the funds to Tarantino LLC in return for the provision of services of an Independent Senior Officer (ISO) for the funds. Frank L. Tarantino served as the ISO and was an officer of the funds and the sole member of Tarantino LLC. Effective June 30, 2019, Mr. Tarantino retired from his position as ISO for the funds, and the ISO Agreement was terminated. For the six months ended June 30, 2019, the fee paid by the fund under this agreement was $77 and is included in “Miscellaneous” expense in the Statement of Operations. MFS had agreed to bear all expenses associated with office space, other administrative support, and supplies provided to the ISO.
The fund invests in the MFS Institutional Money Market Portfolio which is managed by MFS and seeks current income consistent with preservation of capital and liquidity. This money market fund does not pay a management fee to MFS.
The fund is permitted to engage in purchase and sale transactions with funds and accounts for which MFS serves as investment adviser orsub-adviser (“cross-trades”) pursuant to a policy adopted by the Board of Trustees. This policy has been designed to ensure that cross-trades conducted by the fund comply with Rule17a-7 under the Investment Company Act of 1940. During the six months ended June 30, 2019, the fund engaged in purchase transactions pursuant to this policy, which amounted to $40,977.
The adviser has voluntarily undertaken to reimburse the fund from its own resources on a quarterly basis for the cost of investment research embedded in the cost of the fund’s securities trades. This agreement may be rescinded at any time. For the six months ended June 30, 2019, this reimbursement amounted to $7,881, which is included in “Other” income in the Statement of Operations.
| (4) | Portfolio Securities |
For the six months ended June 30, 2019, purchases and sales of investments, other than purchased option transactions, short sales, and short-term obligations, aggregated $10,506,170 and $14,951,170, respectively.
| (5) | Shares of Beneficial Interest |
The fund’s Declaration of Trust permits the Trustees to issue an unlimited number of full and fractional shares of beneficial interest. Transactions in fund shares were as follows:
| Six months ended 6/30/19 | Year ended 12/31/18 | |||||||||||||||
| Shares | Amount | Shares | Amount | |||||||||||||
| Shares sold | ||||||||||||||||
Initial Class | 16,415 | $338,894 | 93,157 | $1,884,589 | ||||||||||||
Service Class | 299,300 | 5,630,587 | 2,524,146 | 48,418,535 | ||||||||||||
| 315,715 | $5,969,481 | 2,617,303 | $50,303,124 | |||||||||||||
16
Table of Contents
MFS Technology Portfolio
Notes to Financial Statements (unaudited) – continued
| Six months ended 6/30/19 | Year ended 12/31/18 | |||||||||||||||
| Shares | Amount | Shares | Amount | |||||||||||||
| Shares issued to shareholders in reinvestment of distributions | ||||||||||||||||
Initial Class | — | $— | 51,805 | $1,094,630 | ||||||||||||
Service Class | — | — | 723,567 | 14,507,522 | ||||||||||||
| — | $— | 775,372 | $15,602,152 | |||||||||||||
| Shares reacquired | ||||||||||||||||
Initial Class | (107,416 | ) | $(2,145,678 | ) | (701,868 | ) | $(14,582,305 | ) | ||||||||
Service Class | (450,842 | ) | (8,885,858 | ) | (12,758,134 | ) | (234,940,678 | ) | ||||||||
| (558,258 | ) | $(11,031,536 | ) | (13,460,002 | ) | $(249,522,983 | ) | |||||||||
| Net change | ||||||||||||||||
Initial Class | (91,001 | ) | $(1,806,784 | ) | (556,906 | ) | $(11,603,086 | ) | ||||||||
Service Class | (151,542 | ) | (3,255,271 | ) | (9,510,421 | ) | (172,014,621 | ) | ||||||||
| (242,543 | ) | $(5,062,055 | ) | (10,067,327 | ) | $(183,617,707 | ) | |||||||||
| (6) | Line of Credit |
The fund and certain other funds managed by MFS participate in a $1.25 billion unsecured committed line of credit, subject to a $1 billion sublimit, provided by a syndicate of banks under a credit agreement. Borrowings may be made for temporary financing needs. Interest is charged to each fund, based on its borrowings, generally at a rate equal to the highest of one month LIBOR, the Federal Funds Effective Rate and the Overnight Bank Funding Rate, plus an agreed upon spread. A commitment fee, based on the average daily, unused portion of the committed line of credit, is allocated among the participating funds. In addition, the fund and other funds managed by MFS have established unsecured uncommitted borrowing arrangements with certain banks for temporary financing needs. Interest is charged to each fund, based on its borrowings, at rates equal to customary reference rates plus an agreed upon spread. For the six months ended June 30, 2019, the fund’s commitment fee and interest expense were $165 and $0, respectively, and are included in “Interest expense and fees” in the Statement of Operations.
| (7) | Investments in Affiliated Issuers |
An affiliated issuer may be considered one in which the fund owns 5% or more of the outstanding voting securities, or a company which is under common control. For the purposes of this report, the following were affiliated issuers:
| Affiliated Issuers | Beginning Value | Purchases | Sales Proceeds | Realized Gain (Loss) | Change in Unrealized Appreciation or Depreciation | Ending Value | ||||||||||||||||||
| MFS Institutional Money Market Portfolio | $1,116,606 | $10,812,583 | $10,725,830 | $88 | $89 | $1,203,536 | ||||||||||||||||||
| Affiliated Issuers | Dividend Income | Capital Gain Distributions | ||||||||||||||||||||||
| MFS Institutional Money Market Portfolio |
| $13,007 | $— | |||||||||||||||||||||
17
Table of Contents
MFS Technology Portfolio
PROXY VOTING POLICIES AND INFORMATION
MFS votes proxies on behalf of the fund pursuant to proxy voting policies and procedures that are available without charge, upon request, by calling 1-800-225-2606, by visitingmfs.com/proxyvoting, or by visiting the SEC’s Web site athttp://www.sec.gov.
Information regarding how the fund voted proxies relating to portfolio securities during the most recent twelve-month period ended June 30 is available by August 31 of each year without charge by visitingmfs.com/proxyvoting, or by visiting the SEC’s Web site athttp://www.sec.gov.
QUARTERLY PORTFOLIO DISCLOSURE
The fund files a complete schedule of portfolio holdings with the SEC for the first and third quarters of each fiscal year on Form N-Q or as an exhibit to its reports on Form N-PORT (for first and third fiscal quarters ending March 31, 2019 or after). The fund’sForm N-Q or Form N-PORT reports are available on the SEC’s website athttp://www.sec.gov.A shareholder can obtain the portfolio holdings report for the first and third quarters of the fund’s fiscal year atmfs.com/vit2 by choosing the fund’s name and then selecting the “Resources” tab and clicking on “Prospectus and Reports”.
From time to time, MFS may post important information about the fund or the MFS funds on the MFS web site (mfs.com). This information is available athttps://www.mfs.com/en-us/what-we-do/announcements.htmlor atmfs.com/vit2 by choosing the fund’s name.
INFORMATION ABOUT FUND CONTRACTS AND LEGAL CLAIMS
The fund has entered into contractual arrangements with an investment adviser, administrator, distributor, shareholder servicing agent, 529 program manager (if applicable), and custodian who each provide services to the fund. Unless expressly stated otherwise, shareholders are not parties to, or intended beneficiaries of these contractual arrangements, and these contractual arrangements are not intended to create any shareholder right to enforce them against the service providers or to seek any remedy under them against the service providers, either directly or on behalf of the fund.
Under the Trust’s By-Laws and Declaration of Trust, any claims asserted against or on behalf of the MFS Funds, including claims against Trustees and Officers, must be brought in state and federal courts located within the Commonwealth of Massachusetts.
18
Table of Contents
Table of Contents
Semiannual Report
June 30, 2019

MFS® U.S. Government Money Market Portfolio

MFS® Variable Insurance Trust II
Beginning on January 1, 2021, as permitted by regulations adopted by the U.S. Securities and Exchange Commission, the insurance company that offers your contract may determine that it will no longer send you paper copies of the fund’s annual and semiannual shareholder reports unless you specifically request paper copies from the insurance company or from your financial intermediary. Instead, the shareholder reports will be made available on a Web site (insurancefunds.mfs.com or other Web site of which you will be notified), and the insurance company will notify you by mail each time a report is posted and provide you with a Web site link to access the report. Instructions for requesting paper copies will be provided by your insurance company or financial intermediary.
If you already elected to receive shareholder reports by email, you will not be affected by this change and you need not take any action. If your insurance company or financial intermediary offers electronic delivery, you may elect to receive shareholder reports and other communications from the insurance company or financial intermediary by email by following the instructions provided by the insurance company or financial intermediary.
Beginning on January 1, 2019, you may elect to receive all future reports in paper free of charge from the insurance company or financial intermediary. You can inform the insurance company or financial intermediary that you wish to continue receiving paper copies of your shareholder reports by contacting your insurance company or financial intermediary. Your election to receive reports in paper will apply to all funds held in your account with your insurance company or financial intermediary.
MKS-SEM
Table of Contents
MFS® U.S. Government Money Market Portfolio
The report is prepared for the general information of contract owners. It is authorized for distribution to prospective investors only when preceded or accompanied by a current prospectus.
NOT FDIC INSURED• MAY LOSE VALUE• NO BANK OR CREDIT UNION GUARANTEE• NOT A DEPOSIT• NOT INSURED BY ANY FEDERAL GOVERNMENT AGENCY OR NCUA/NCUSIF
Table of Contents
MFS U.S. Government Money Market Portfolio
LETTER FROM THE EXECUTIVE CHAIRMAN

Dear Contract Owners:
Slowing global growth, low inflation, and increasing trade friction between the United States and China have been hallmarks of the past 12 months. After experiencing an uptick in market volatility in late 2018, markets steadied during the first half of 2019, thanks in large measure to the adoption of a dovish policy stance on the part of global central banks, who have largely abandoned efforts to normalize interest rates and have instead focused on supporting economic growth. Trade tensions remain high as the U.S. has ratcheted up tariffs on Chinese imports and China has retaliated. A truce of sorts was reached midyear, but significant challenges continue to confront negotiators, and it is not known whether a comprehensive agreement can be reached.
With Boris Johnson replacing Theresa May as Britain’s prime minister, uncertainty over Brexit remains high. Johnson has adopted a more combative stance than his predecessor toward the European Union, increasing concerns that there will be a “hard” Brexit.
Markets expect that the longest economic expansion in U.S. history will continue for the time being, albeit at a slower pace. Nevertheless, slower growth and low inflation have spurred the U.S. Federal Reserve to take a more accommodative policy stance, prompting investors to anticipate several interest rate cuts in the coming year. The European Central Bank has adopted a similar position. The more accommodative environment has helped fuel a continued rise in global equities and has been broadly supportive of risk assets.
Since launching the first U.S.open-end mutual fund in 1924, MFS® has been committed to a single purpose: to create value by allocating capital responsibly for clients. Through our powerful global investment platform, we combine collective expertise, thoughtful risk management, and long-term discipline to uncover what we believe are the best investment opportunities in the market.
Respectfully,

Robert J. Manning
Executive Chairman
MFS Investment Management
August 16, 2019
The opinions expressed in this letter are subject to change and may not be relied upon for investment advice. No forecasts can be guaranteed.
1
Table of Contents
MFS U.S. Government Money Market Portfolio
Portfolio structure (u)
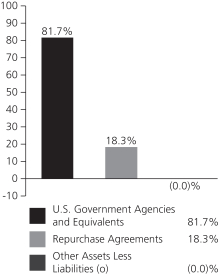
| Composition including fixed income credit quality (a)(u) |
| |||
| A-1+ | 11.1% | |||
| A-1 | 88.9% | |||
| Other Assets Less Liabilities (o) | (0.0)% | |||
| Maturity breakdown (u) | ||||
| 0 - 7 days | 31.6% | |||
| 8 - 29 days | 22.6% | |||
| 30 - 59 days | 27.8% | |||
| 60 - 89 days | 9.7% | |||
| 90 - 365 days | 8.3% | |||
| Other Assets Less Liabilities (o) | (0.0)% |
| (a) | Ratings are assigned to portfolio securities utilizing ratings from Moody’s, Fitch, and Standard & Poor’s rating agencies and applying the following hierarchy: If all three agencies provide a rating, the middle rating (after dropping the highest and lowest ratings) is assigned; if two of the three agencies rate a security, the lower of the two is assigned. Ratings are shown in the S&P scale. All ratings are subject to change. The fund is not rated by these agencies. |
| (o) | Less than 0.1%. |
| (u) | For purposes of this presentation, accrued interest, where applicable, is included. |
Percentages are based on net assets as of June 30, 2019.
The portfolio is actively managed and current holdings may be different.
2
Table of Contents
MFS U.S. Government Money Market Portfolio
Fund Expenses Borne by the Contract Holders during the Period,
January 1, 2019 through June 30, 2019
As a contract holder of the fund, you incur ongoing costs, including management fees; distribution and/or service(12b-1) fees; and other fund expenses. This example is intended to help you understand your ongoing costs (in dollars) of investing in the fund and to compare these costs with the ongoing costs of investing in other mutual funds.
The example is based on an investment of $1,000 invested at the beginning of the period and held for the entire period January 1, 2019 through June 30, 2019.
Actual Expenses
The first line for each share class in the following table provides information about actual account values and actual expenses. You may use the information in this line, together with the amount you invested, to estimate the expenses that you paid over the period. Simply divide your account value by $1,000 (for example, an $8,600 account value divided by $1,000 = 8.6), then multiply the result by the number in the first line under the heading entitled “Expenses Paid During Period” to estimate the expenses you paid on your account during this period.
Hypothetical Example for Comparison Purposes
The second line for each share class in the following table provides information about hypothetical account values and hypothetical expenses based on the fund’s actual expense ratio and an assumed rate of return of 5% per year before expenses, which is not the fund’s actual return. The hypothetical account values and expenses may not be used to estimate the actual ending account balance or expenses you paid for the period. You may use this information to compare the ongoing costs of investing in the fund and other funds. To do so, compare this 5% hypothetical example with the 5% hypothetical examples that appear in the shareholder reports of the other funds.
Please note that the expenses shown in the table are meant to highlight the fund’s ongoing costs only and do not take into account the fees and expenses imposed under the variable contracts through which your investment in the fund is made. Therefore, the second line for each share class in the table is useful in comparing ongoing costs associated with an investment in vehicles (such as the fund) which fund benefits under variable annuity and variable life insurance contracts and to qualified pension and retirement plans only, and will not help you determine the relative total costs of investing in the fund through variable annuity and variable life insurance contracts. If the fees and expenses imposed under the variable contracts were included, your costs would have been higher.
| Share Class | Annualized Expense Ratio | Beginning Account Value 1/01/19 | Ending Account Value 6/30/19 | Expenses Paid During Period (p) 1/01/19-6/30/19 | ||||||||||||||
| Initial Class | Actual | 0.55% | $1,000.00 | $1,009.19 | $2.74 | |||||||||||||
| Hypothetical (h) | 0.55% | $1,000.00 | $1,022.07 | $2.76 | ||||||||||||||
| Service Class | Actual | 0.55% | $1,000.00 | $1,009.19 | $2.74 | |||||||||||||
| Hypothetical (h) | 0.55% | $1,000.00 | $1,022.07 | $2.76 | ||||||||||||||
| (h) | 5% class return per year before expenses. |
| (p) | “Expenses Paid During Period” are equal to each class’s annualized expense ratio, as shown above, multiplied by the average account value over the period, multiplied by 181/365 (to reflect theone-half year period). |
3
Table of Contents
MFS U.S. Government Money Market Portfolio
PORTFOLIO OF INVESTMENTS – 6/30/19 (unaudited)
The Portfolio of Investments is a complete list of all securities owned by your fund. It is categorized by broad-based asset classes.
| Issuer | Shares/Par | Value ($) | ||||||
| U.S. GOVERNMENT AGENCIES AND EQUIVALENTS (y) – 81.7% |
| |||||||
| Fannie Mae, 2.395%, due 7/01/2019 | $ | 11,400,000 | $ | 11,400,000 | ||||
| Fannie Mae, 2.391%, due 7/08/2019 | 4,900,000 | 4,897,761 | ||||||
| Fannie Mae, 2.307%, due 7/15/2019 | 5,600,000 | 5,595,056 | ||||||
| Fannie Mae, 2.226%, due 7/22/2019 | 5,610,000 | 5,602,833 | ||||||
| Fannie Mae, 2.165%, due 7/29/2019 | 10,510,000 | 10,492,588 | ||||||
| Fannie Mae, 2.258%, due 8/05/2019 | 4,200,000 | 4,190,935 | ||||||
| Fannie Mae, 2.422%, due 8/07/2019 | 9,500,000 | 9,476,811 | ||||||
| Fannie Mae, 2.365%, due 8/28/2019 | 4,420,000 | 4,403,479 | ||||||
| Federal Farm Credit Bank, 2.337%, due 7/08/2019 | 11,400,000 | 11,394,902 | ||||||
| Federal Farm Credit Bank, 2.422%, due 7/09/2019 | 6,500,000 | 6,496,562 | ||||||
| Federal Farm Credit Bank, 2.266%, due 7/17/2019 | 10,620,000 | 10,609,474 | ||||||
| Federal Farm Credit Bank, 2.239%, due 8/12/2019 | 7,100,000 | 7,081,777 | ||||||
| Federal Farm Credit Bank, 2.343%, due 8/20/2019 | 11,000,000 | 10,964,861 | ||||||
| Federal Farm Credit Bank, 2.24%, due 8/23/2019 | 7,100,000 | 7,077,004 | ||||||
| Federal Home Loan Bank, 2.341%, due 7/02/2019 | 17,900,000 | 17,898,854 | ||||||
| Federal Home Loan Bank, 2.487%, due 7/10/2019 | 11,600,000 | 11,592,939 | ||||||
| Federal Home Loan Bank, 2.436%, due 7/12/2019 | 3,000,000 | 2,997,811 | ||||||
| Federal Home Loan Bank, 2.256%, due 7/19/2019 | 4,293,000 | 4,288,235 | ||||||
| Federal Home Loan Bank, 2.299%, due 7/31/2019 | 5,400,000 | 5,389,830 | ||||||
| Federal Home Loan Bank, 2.305%, due 9/11/2019 | 11,400,000 | 11,348,472 | ||||||
| Freddie Mac, 2.438%, due 9/04/2019 | 11,510,000 | 11,460,539 | ||||||
| Freddie Mac, 2.168%, due 11/13/2019 | 5,005,000 | 4,965,210 | ||||||
| Freddie Mac, 2.205%, due 11/13/2019 | 11,400,000 | 11,307,874 | ||||||
| Freddie Mac, 2.169%, due 11/19/2019 | 6,940,000 | 6,882,375 | ||||||
| U.S. Treasury Bill, 2.422%, due 7/02/2019 | 2,600,000 | 2,599,828 | ||||||
| U.S. Treasury Bill, 2.412%, due 7/05/2019 | 5,500,000 | 5,498,555 | ||||||
| U.S. Treasury Bill, 2.351%, due 7/30/2019 | 11,700,000 | 11,678,228 | ||||||
| U.S. Treasury Bill, 2.428%, due 8/08/2019 | 11,500,000 | 11,471,170 | ||||||
|
| |||||||
| Total U.S. Government Agencies and Equivalents, at Amortized Cost and Value |
| $ | 229,063,963 | |||||
|
| |||||||
| Issuer | Shares/Par | Value ($) | ||||||
| REPURCHASE AGREEMENTS – 18.3% |
| |||||||
| Goldman Sachs Repurchase Agreement, 2.51%, dated 6/28/2019, due 7/01/2019, total to be received $7,901,652 (secured by U.S. Treasury and Federal Agency obligations valued at $8,058,000 in a jointly traded account) | $ | 7,900,000 | $ | 7,900,000 | ||||
| Merrill Lynch, Pierce, Fenner & Smith, Inc. Repurchase Agreement, 2.48%, dated 6/28/2019, due 7/01/2019, total to be received $43,351,958 (secured by U.S. Treasury and Federal Agency obligations valued at $44,210,850 in a jointly traded account) | 43,343,000 | 43,343,000 | ||||||
|
| |||||||
| Total Repurchase Agreements, at Cost and Value | $ | 51,243,000 | ||||||
|
| |||||||
| OTHER ASSETS, LESS LIABILITIES – (0.0)% | (33,590 | ) | ||||||
|
| |||||||
| NET ASSETS – 100.0% | $ | 280,273,373 | ||||||
|
| |||||||
| (y) | The rate shown represents an annualized yield at time of purchase. |
See Notes to Financial Statements
4
Table of Contents
MFS U.S. Government Money Market Portfolio
FINANCIAL STATEMENTS | STATEMENT OF ASSETS AND LIABILITIES (unaudited)
This statement represents your fund’s balance sheet, which details the assets and liabilities comprising the total value of the fund.
At 6/30/19 | ||||
Assets | ||||
Investments in unaffiliated issuers, at cost and value | $229,063,963 | |||
Investments in unaffiliated repurchase agreements, at cost and value | 51,243,000 | |||
Cash | 717 | |||
Receivables for | ||||
Fund shares sold | 145,690 | |||
Interest | 10,610 | |||
Other assets | 1,086 | |||
Total assets | $280,465,066 | |||
Liabilities | ||||
Payables for | ||||
Fund shares reacquired | $108,182 | |||
Payable to affiliates | ||||
Investment adviser | 15,044 | |||
Administrative services fee | 527 | |||
Shareholder servicing costs | 24 | |||
Accrued expenses and other liabilities | 67,916 | |||
Total liabilities | $191,693 | |||
Net assets | $280,273,373 | |||
Net assets consist of | ||||
Paid-in capital | $280,273,357 | |||
Total distributable earnings (loss) | 16 | |||
Net assets | $280,273,373 | |||
Shares of beneficial interest outstanding | 280,493,403 | |||
| Net assets | Shares outstanding | Net asset value per share | ||||||||||
Initial Class | $154,345,897 | �� | 154,467,013 | $1.00 | ||||||||
Service Class | 125,927,476 | 126,026,390 | 1.00 | |||||||||
See Notes to Financial Statements
5
Table of Contents
MFS U.S. Government Money Market Portfolio
FINANCIAL STATEMENTS | STATEMENT OF OPERATIONS (unaudited)
This statement describes how much your fund earned in investment income and accrued in expenses. It also describes any gains and/or losses generated by fund operations.
Six months ended 6/30/19 | ||||
Net investment income (loss) | ||||
Income | ||||
Interest | $3,388,255 | |||
Other | 62 | |||
Total investment income | $3,388,317 | |||
Expenses | ||||
Management fee | $705,777 | |||
Distribution and/or service fees | 157,156 | |||
Shareholder servicing costs | 2,239 | |||
Administrative services fee | 25,022 | |||
Independent Trustees’ compensation | 4,019 | |||
Custodian fee | 7,804 | |||
Shareholder communications | 12,228 | |||
Audit and tax fees | 18,283 | |||
Legal fees | 1,236 | |||
Miscellaneous | 16,724 | |||
Total expenses | $950,488 | |||
Reduction of expenses by investment adviser and distributor | (170,811 | ) | ||
Net expenses | $779,677 | |||
Net investment income (loss) | $2,608,640 | |||
Realized gain (loss) (identified cost basis) | ||||
Unaffiliated issuers | $16 | |||
Change in net assets from operations | $2,608,656 | |||
See Notes to Financial Statements
6
Table of Contents
MFS U.S. Government Money Market Portfolio
FINANCIAL STATEMENTS | STATEMENTS OF CHANGES IN NET ASSETS
These statements describe the increases and/or decreases in net assets resulting from operations, any distributions, and any shareholder transactions.
| Six months ended 6/30/19 | Year ended 12/31/18 | |||||||
| (unaudited) | ||||||||
Change in net assets | ||||||||
From operations | ||||||||
Net investment income (loss) | $2,608,640 | $3,659,550 | ||||||
Net realized gain (loss) | 16 | — | ||||||
Change in net assets from operations | $2,608,656 | $3,659,550 | ||||||
Total distributions to shareholders | $(2,608,640 | ) | $(3,659,550 | ) | ||||
Change in net assets from fund share transactions | $(8,186,011 | ) | $(26,075,131 | ) | ||||
Total change in net assets | $(8,185,995 | ) | $(26,075,131 | ) | ||||
Net assets | ||||||||
At beginning of period | 288,459,368 | 314,534,499 | ||||||
At end of period | $280,273,373 | $288,459,368 | ||||||
See Notes to Financial Statements
7
Table of Contents
MFS U.S. Government Money Market Portfolio
FINANCIAL STATEMENTS | FINANCIAL HIGHLIGHTS
The financial highlights table is intended to help you understand the fund’s financial performance for the semiannual period and the past 5 fiscal years. Certain information reflects financial results for a single fund share. The total returns in the table represent the rate that an investor would have earned (or lost) on an investment in the fund share class (assuming reinvestment of all distributions) held for the entire period.
| Initial Class | Six months 6/30/19 | Year ended | ||||||||||||||||||||||
| 12/31/18 | 12/31/17 | 12/31/16 | 12/31/15 | 12/31/14 | ||||||||||||||||||||
| (unaudited) | ||||||||||||||||||||||||
Net asset value, beginning of period | $1.00 | $1.00 | $1.00 | $1.00 | $1.00 | $1.00 | ||||||||||||||||||
| Income (loss) from investment operations | ||||||||||||||||||||||||
Net investment income (loss) (d) | $0.01 | $0.01 | $0.00 | (w) | $0.00 | (c)(w) | $0.00 | $0.00 | ||||||||||||||||
Net realized and unrealized gain (loss) | 0.00 | (w) | — | 0.00 | (w) | 0.00 | (w) | 0.00 | (w) | 0.00 | (w) | |||||||||||||
Total from investment operations | $0.01 | $0.01 | $0.00 | (w) | $0.00 | (w) | $0.00 | (w) | $0.00 | (w) | ||||||||||||||
| Less distributions declared to shareholders | ||||||||||||||||||||||||
From net investment income | $(0.01 | ) | $(0.01 | ) | $(0.00 | )(w) | $(0.00 | )(w) | $— | $— | ||||||||||||||
Net asset value, end of period | $1.00 | $1.00 | $1.00 | $1.00 | $1.00 | $1.00 | ||||||||||||||||||
Total return (%) (k)(r) | 0.92 | (n) | 1.26 | 0.30 | 0.01 | (c) | 0.00 | 0.00 | ||||||||||||||||
| Ratios (%) (to average net assets) and Supplemental data: | ||||||||||||||||||||||||
Expenses before expense reductions (f) | 0.56 | (a) | 0.56 | 0.56 | 0.53 | (c) | 0.57 | 0.55 | ||||||||||||||||
Expenses after expense reductions (f) | 0.55 | (a) | 0.55 | 0.54 | 0.30 | (c) | 0.13 | 0.10 | ||||||||||||||||
Net investment income (loss) | 1.85 | (a) | 1.25 | 0.29 | 0.01 | (c) | 0.00 | 0.00 | ||||||||||||||||
Net assets at end of period (000 omitted) | $154,346 | $160,304 | $168,107 | $179,458 | $190,761 | $214,019 | ||||||||||||||||||
| Service Class | Six months 6/30/19 | Year ended | ||||||||||||||||||||||
| 12/31/18 | 12/31/17 | 12/31/16 | 12/31/15 | 12/31/14 | ||||||||||||||||||||
| (unaudited) | ||||||||||||||||||||||||
Net asset value, beginning of period | $1.00 | $1.00 | $1.00 | $1.00 | $1.00 | $1.00 | ||||||||||||||||||
| Income (loss) from investment operations | ||||||||||||||||||||||||
Net investment income (loss) (d) | $0.01 | $0.01 | $0.00 | (w) | $0.00 | (c)(w) | $0.00 | $0.00 | ||||||||||||||||
Net realized and unrealized gain (loss) | 0.00 | (w) | — | 0.00 | (w) | 0.00 | (w) | 0.00 | (w) | 0.00 | (w) | |||||||||||||
Total from investment operations | $0.01 | $0.01 | $0.00 | (w) | $0.00 | (w) | $0.00 | (w) | $0.00 | (w) | ||||||||||||||
| Less distributions declared to shareholders | ||||||||||||||||||||||||
From net investment income | $(0.01 | ) | $(0.01 | ) | $(0.00 | )(w) | $(0.00 | )(w) | $— | $— | ||||||||||||||
Net asset value, end of period | $1.00 | $1.00 | $1.00 | $1.00 | $1.00 | $1.00 | ||||||||||||||||||
Total return (%) (k)(r) | 0.92 | (n) | 1.26 | 0.29 | 0.01 | (c) | 0.00 | 0.00 | ||||||||||||||||
| Ratios (%) (to average net assets) and Supplemental data: | ||||||||||||||||||||||||
Expenses before expense reductions (f) | 0.81 | (a) | 0.81 | 0.81 | 0.79 | (c) | 0.82 | 0.80 | ||||||||||||||||
Expenses after expense reductions (f) | 0.55 | (a) | 0.55 | 0.55 | 0.30 | (c) | 0.13 | 0.10 | ||||||||||||||||
Net investment income (loss) | 1.85 | (a) | 1.24 | 0.27 | 0.01 | (c) | 0.00 | 0.00 | ||||||||||||||||
Net assets at end of period (000 omitted) | $125,927 | $128,156 | $146,428 | $182,935 | $182,097 | $205,550 | ||||||||||||||||||
See Notes to Financial Statements
8
Table of Contents
MFS U.S. Government Money Market Portfolio
Financial Highlights – continued
| (a) | Annualized. |
| (c) | Amount reflects aone-time reimbursement of expenses by the custodian (or former custodian) without which net investment income and performance would be lower and expenses would be higher. |
| (d) | Per share data is based on average shares outstanding. |
| (f) | Ratios do not reflect reductions from fees paid indirectly, if applicable. |
| (k) | The total return does not reflect expenses that apply to separate accounts. Inclusion of these charges would reduce the total return figures for all periods shown. |
| (n) | Not annualized. |
| (r) | Certain expenses have been reduced without which performance would have been lower. |
| (w) | Per share amount was less than $0.01. |
See Notes to Financial Statements
9
Table of Contents
MFS U.S. Government Money Market Portfolio
NOTES TO FINANCIAL STATEMENTS (unaudited)
| (1) | Business and Organization |
MFS U.S. Government Money Market Portfolio (the fund) is a diversified series of MFS Variable Insurance Trust II (the trust). The trust is organized as a Massachusetts business trust and is registered under the Investment Company Act of 1940, as amended, as anopen-end management investment company. The shareholders of each series of the trust are separate accounts of insurance companies, which offer variable annuity and/or life insurance products, and qualified retirement and pension plans.
The fund is an investment company and accordingly follows the investment company accounting and reporting guidance of the Financial Accounting Standards Board (FASB) Accounting Standards Codification Topic 946 Financial Services – Investment Companies.
| (2) | Significant Accounting Policies |
General– The preparation of financial statements in conformity with U.S. generally accepted accounting principles requires management to make estimates and assumptions that affect the reported amounts of assets and liabilities, and disclosure of contingent assets and liabilities at the date of the financial statements and the reported amounts of increases and decreases in net assets from operations during the reporting period. Actual results could differ from those estimates. In the preparation of these financial statements, management has evaluated subsequent events occurring after the date of the fund’s Statement of Assets and Liabilities through the date that the financial statements were issued.
Balance Sheet Offsetting– The fund’s accounting policy with respect to balance sheet offsetting is that, absent an event of default by the counterparty or a termination of the agreement, the International Swaps and Derivatives Association (ISDA) Master Agreement, or similar agreement, does not result in an offset of reported amounts of financial assets and financial liabilities in the Statement of Assets and Liabilities across transactions between the fund and the applicable counterparty. The fund’s right to setoff may be restricted or prohibited by the bankruptcy or insolvency laws of the particular jurisdiction to which a specific master netting agreement counterparty is subject. Balance sheet offsetting disclosures, to the extent applicable to the fund, have been included in the fund’s Significant Accounting Policies note under the captions for each of the fund’sin-scope financial instruments and transactions.
Investment Valuations– Pursuant to procedures approved by the Board of Trustees, investments held by the fund are generally valued at amortized cost, which approximates market value. Amortized cost involves valuing an instrument at its cost as adjusted for amortization of premium or accretion of discount rather than its current market value. The amortized cost value of an instrument can be different from the market value of an instrument.
Various inputs are used in determining the value of the fund’s assets or liabilities. These inputs are categorized into three broad levels. In certain cases, the inputs used to measure fair value may fall into different levels of the fair value hierarchy. In such cases, an investment’s level within the fair value hierarchy is based on the lowest level of input that is significant to the fair value measurement. The fund’s assessment of the significance of a particular input to the fair value measurement in its entirety requires judgment, and considers factors specific to the investment. Level 1 includes unadjusted quoted prices in active markets for identical assets or liabilities. Level 2 includes other significant observable market-based inputs (including quoted prices for similar securities, interest rates, prepayment speed, and credit risk). Level 3 includes unobservable inputs, which may include the adviser’s own assumptions in determining the fair value of investments. The following is a summary of the levels used as of June 30, 2019 in valuing the fund’s assets or liabilities:
| Financial Instruments | Level 1 | Level 2 | Level 3 | Total | ||||||||||||
| Short-Term Securities | $— | $280,306,963 | $— | $280,306,963 | ||||||||||||
For further information regarding security characteristics, see the Portfolio of Investments.
Repurchase Agreements– The fund enters into repurchase agreements under the terms of Master Repurchase Agreements with approved counterparties. Each repurchase agreement is recorded at cost. The fund requires that the securities collateral in a repurchase transaction be transferred to a custodian. The fund monitors, on a daily basis, the value of the collateral to ensure that its value, including accrued interest, is greater than amounts owed to the fund under each such repurchase agreement. Upon an event of default under a Master Repurchase Agreement, thenon-defaulting party may close out all transactions traded under such agreement and net amounts owed under each transaction to one net amount payable by one party to the other. Absent an event of default, the Master Repurchase Agreement does not result in an offset of reported amounts of assets and liabilities in the Statement of Assets and Liabilities across transactions between the fund and the applicable counterparty. The fund and other funds managed by MFS may utilize a joint trading account for the purpose of entering into one or more repurchase agreements. At June 30, 2019, the fund had investments in repurchase agreements with a gross value of $51,243,000 in the Statement of Assets and Liabilities. The value of the related collateral exceeded the value of the repurchase agreements at period end.
10
Table of Contents
MFS U.S. Government Money Market Portfolio
Notes to Financial Statements (unaudited) – continued
Indemnifications– Under the fund’s organizational documents, its officers and Trustees may be indemnified against certain liabilities and expenses arising out of the performance of their duties to the fund. Additionally, in the normal course of business, the fund enters into agreements with service providers that may contain indemnification clauses. The fund’s maximum exposure under these agreements is unknown as this would involve future claims that may be made against the fund that have not yet occurred.
Investment Transactions and Income– Investment transactions are recorded on the trade date. Interest income is recorded on the accrual basis. All premium and discount is amortized or accreted for financial statement purposes in accordance with U.S. generally accepted accounting principles.
Tax Matters and Distributions– The fund intends to qualify as a regulated investment company, as defined under Subchapter M of the Internal Revenue Code, and to distribute all of its taxable income, including realized capital gains. As a result, no provision for federal income tax is required. The fund’s federal tax returns, when filed, will remain subject to examination by the Internal Revenue Service for a three year period. Management has analyzed the fund’s tax positions taken on federal and state tax returns for all open tax years and does not believe that there are any uncertain tax positions that require recognition of a tax liability.
Distributions to shareholders are recorded on theex-dividend date. Income and capital gain distributions are determined in accordance with income tax regulations, which may differ from U.S. generally accepted accounting principles. Certain capital accounts in the financial statements are periodically adjusted for permanent differences in order to reflect their tax character. These adjustments have no impact on net assets or net asset value per share. Temporary differences which arise from recognizing certain items of income, expense, gain or loss in different periods for financial statement and tax purposes will reverse at some time in the future. Distributions in excess of net investment income or net realized gains are temporary overdistributions for financial statement purposes resulting from differences in the recognition or classification of income or distributions for financial statement and tax purposes.
During the year ended December 31, 2018, there were no significant adjustments due to differences between book and tax accounting.
The tax character of distributions made during the current period will be determined at fiscal year end. The tax character of distributions declared to shareholders for the last fiscal year is as follows:
| Year ended 12/31/18 | ||||
| Ordinary income (including any short-term capital gains) | $3,659,550 | |||
The federal tax cost and the tax basis components of distributable earnings were as follows:
| As of 6/30/19 | ||||
| Cost of investments | $280,306,963 | |||
The aggregate cost above includes prior fiscal year end tax adjustments, if applicable.
Multiple Classes of Shares of Beneficial Interest– The fund offers multiple classes of shares, which differ in their respective distribution and/or service fees. The fund’s income and common expenses are allocated to shareholders based on the value of settled shares outstanding of each class. The fund’s realized and unrealized gain (loss) are allocated to shareholders based on the daily net assets of each class. Dividends are declared separately for each class. Differences in per share dividend rates are generally due to differences in separate class expenses. The fund’s distributions declared to shareholders as reported in the Statements of Changes in Net Assets are presented by class as follows:
| From net investment income | ||||||||
| Six months ended 6/30/19 | Year ended 12/31/18 | |||||||
| Initial Class | $1,446,920 | $1,937,963 | ||||||
| Service Class | 1,161,720 | 1,721,587 | ||||||
| Total | $2,608,640 | $3,659,550 | ||||||
| (3) | Transactions with Affiliates |
Investment Adviser– The fund has an investment advisory agreement with MFS to provide overall investment management and related administrative services and facilities to the fund. The management fee is computed daily and paid monthly at the following annual rates based on the fund’s average daily net assets:
| Up to $500 million | 0.50% | |||
| In excess of $500 million | 0.45% |
11
Table of Contents
MFS U.S. Government Money Market Portfolio
Notes to Financial Statements (unaudited) – continued
MFS has agreed in writing to reduce its management fee by a specified amount if certain MFS mutual fund assets exceed thresholds agreed to by MFS and the fund’s Board of Trustees. For the six months ended June 30, 2019, this management fee reduction amounted to $13,655, which is included in the reduction of total expenses in the Statement of Operations. The management fee incurred for the six months ended June 30, 2019 was equivalent to an annual effective rate of 0.49% of the fund’s average daily net assets.
The investment adviser has agreed in writing to pay a portion of the fund’s total annual operating expenses, excluding interest, taxes, extraordinary expenses, brokerage and transaction costs, and investment-related expenses, such that total annual operating expenses do not exceed 0.57% of average daily net assets for each of the Initial Class and Service Class shares. This written agreement will continue until modified by the fund’s Board of Trustees, but such agreement will continue at least until April 30, 2021. For the six months ended June 30, 2019, the fund’s actual operating expenses did not exceed the limits described above and therefore, the investment adviser did not pay any portion of the fund’s expenses related to this agreement.
Distributor– MFS Fund Distributors, Inc. (MFD), a wholly-owned subsidiary of MFS, is the distributor of shares of the fund. The Trustees have adopted a distribution plan for the Service Class shares pursuant to Rule12b-1 under the Investment Company Act of 1940.
The fund’s distribution plan provides that the fund will pay MFD distribution and/or service fees equal to 0.25% per annum of its average daily net assets attributable to Service Class shares as partial consideration for services performed and expenses incurred by MFD and financial intermediaries (including participating insurance companies that invest in the fund to fund variable annuity and variable life insurance contracts, sponsors of qualified retirement and pension plans that invest in the fund, and affiliates of these participating insurance companies and plan sponsors) in connection with the sale and distribution of the Service Class shares. MFD may subsequently pay all, or a portion, of the distribution and/or service fees to financial intermediaries. MFD has agreed in writing to waive the entire 0.25% distribution and/or service fee. This written agreement will continue until modified by the fund’s Board of Trustees, but such agreement will continue at least until April 30, 2021. For the six months ended June 30, 2019, this waiver amounted to $157,156, which is included in the reduction of total expenses in the Statement of Operations. The distribution and/or service fees incurred for the six months ended June 30, 2019 were equivalent to an annual effective rate of 0.00% of the average daily net assets attributable to Service Class shares.
Shareholder Servicing Agent– MFS Service Center, Inc. (MFSC), a wholly-owned subsidiary of MFS, receives a fee from the fund for its services as shareholder servicing agent. For the six months ended June 30, 2019, the fee was $2,089, which equated to 0.0015% annually of the fund’s average daily net assets. MFSC also receives payment from the fund forout-of-pocket expenses paid by MFSC on behalf of the fund. For the six months ended June 30, 2019, these costs amounted to $150.
Administrator– MFS provides certain financial, legal, shareholder communications, compliance, and other administrative services to the fund. Under an administrative services agreement, the fund reimburses MFS the costs incurred to provide these services. The fund is charged an annual fixed amount of $17,500 plus a fee based on average daily net assets. The administrative services fee incurred for the six months ended June 30, 2019 was equivalent to an annual effective rate of 0.0177% of the fund’s average daily net assets.
Trustees’ and Officers’ Compensation– The fund pays compensation to independent Trustees in the form of a retainer, attendance fees, and additional compensation to Board and Committee chairpersons. The fund does not pay compensation directly to Trustees or officers of the fund who are also officers of the investment adviser, all of whom receive remuneration from MFS for their services to the fund. Certain officers and Trustees of the fund are officers or directors of MFS, MFD, and MFSC.
Other– This fund and certain other funds managed by MFS (the funds) had entered into a service agreement (the ISO Agreement) which provided for payment of fees solely by the funds to Tarantino LLC in return for the provision of services of an Independent Senior Officer (ISO) for the funds. Frank L. Tarantino served as the ISO and was an officer of the funds and the sole member of Tarantino LLC. Effective June 30, 2019, Mr. Tarantino retired from his position as ISO for the funds, and the ISO Agreement was terminated. For the six months ended June 30, 2019, the fee paid by the fund under this agreement was $336 and is included in “Miscellaneous” expense in the Statement of Operations. MFS had agreed to bear all expenses associated with office space, other administrative support, and supplies provided to the ISO.
12
Table of Contents
MFS U.S. Government Money Market Portfolio
Notes to Financial Statements (unaudited) – continued
| (4) | Shares of Beneficial Interest |
The fund’s Declaration of Trust permits the Trustees to issue an unlimited number of full and fractional shares of beneficial interest. The number of shares sold, reinvested and reacquired corresponds to the net proceeds from the sale of shares, reinvestment of distributions and cost of shares reacquired, respectively, since shares are sold and reacquired at $1.00 per share. Transactions in fund shares were as follows:
Six months ended 6/30/19 | Year ended 12/31/18 | |||||||
| Shares sold | ||||||||
Initial Class | 17,217,002 | 40,333,024 | ||||||
Service Class | 16,698,380 | 35,513,369 | ||||||
| 33,915,382 | 75,846,393 | |||||||
| Shares issued to shareholders in reinvestment of distributions | ||||||||
Initial Class | 1,446,920 | 1,937,963 | ||||||
Service Class | 1,161,720 | 1,721,587 | ||||||
| 2,608,640 | 3,659,550 | |||||||
| Shares reacquired | ||||||||
Initial Class | (24,622,397 | ) | (50,062,009 | ) | ||||
Service Class | (20,087,636 | ) | (55,519,065 | ) | ||||
| (44,710,033 | ) | (105,581,074 | ) | |||||
| Net change | ||||||||
Initial Class | (5,958,475 | ) | (7,791,022 | ) | ||||
Service Class | (2,227,536 | ) | (18,284,109 | ) | ||||
| (8,186,011 | ) | (26,075,131 | ) | |||||
| (5) | Line of Credit |
The fund and certain other funds managed by MFS participate in a $1.25 billion unsecured committed line of credit, subject to a $1 billion sublimit, provided by a syndicate of banks under a credit agreement. Borrowings may be made for temporary financing needs. Interest is charged to each fund, based on its borrowings, generally at a rate equal to the highest of one month LIBOR, the Federal Funds Effective Rate and the Overnight Bank Funding Rate, plus an agreed upon spread. A commitment fee, based on the average daily, unused portion of the committed line of credit, is allocated among the participating funds. In addition, the fund and other funds managed by MFS have established unsecured uncommitted borrowing arrangements with certain banks for temporary financing needs. Interest is charged to each fund, based on its borrowings, at rates equal to customary reference rates plus an agreed upon spread. For the six months ended June 30, 2019, the fund’s commitment fee and interest expense were $915 and $0, respectively, and are included in “Miscellaneous” expense in the Statement of Operations.
13
Table of Contents
MFS U.S. Government Money Market Portfolio
PROXY VOTING POLICIES AND INFORMATION
MFS votes proxies on behalf of the fund pursuant to proxy voting policies and procedures that are available without charge, upon request, by calling 1-800-225-2606, by visitingmfs.com/proxyvoting, or by visiting the SEC’s Web site athttp://www.sec.gov.
Information regarding how the fund voted proxies relating to portfolio securities during the most recent twelve-month period ended June 30 is available by August 31 of each year without charge by visitingmfs.com/proxyvoting, or by visiting the SEC’s Web site athttp://www.sec.gov.
PORTFOLIO HOLDINGS INFORMATION
The fund files monthly portfolio information with the SEC on Form N-MFP. The fund’s Form N-MFP reports are available on the SEC’s website athttp://www.sec.gov.A shareholder can also access the fund’s portfolio holdings as of each month end and the fund’s Form N-MFP reports atmfs.com/vit2 after choosing “Click here for access to Money Market fund reports”.
From time to time, MFS may post important information about the fund or the MFS funds on the MFS web site (mfs.com). This information is available athttps://www.mfs.com/en-us/what-we-do/announcements.htmlor atmfs.com/vit2 by choosing the fund’s name.
INFORMATION ABOUT FUND CONTRACTS AND LEGAL CLAIMS
The fund has entered into contractual arrangements with an investment adviser, administrator, distributor, shareholder servicing agent, 529 program manager (if applicable), and custodian who each provide services to the fund. Unless expressly stated otherwise, shareholders are not parties to, or intended beneficiaries of these contractual arrangements, and these contractual arrangements are not intended to create any shareholder right to enforce them against the service providers or to seek any remedy under them against the service providers, either directly or on behalf of the fund.
Under the Trust’s By-Laws and Declaration of Trust, any claims asserted against or on behalf of the MFS Funds, including claims against Trustees and Officers, must be brought in state and federal courts located within the Commonwealth of Massachusetts.
14
Table of Contents
Table of Contents
| ITEM 2. | CODE OF ETHICS. |
During the period covered by this report, the Registrant has not amended any provision in its Code of Ethics (the “Code”) that relates to an element of the Code’s definitions enumerated in paragraph (b) of Item 2 of this FormN-CSR. During the period covered by this report, the Registrant did not grant a waiver, including an implicit waiver, from any provision of the Code.
| ITEM 3. | AUDIT COMMITTEE FINANCIAL EXPERT. |
Not applicable for semi-annual reports.
| ITEM 4. | PRINCIPAL ACCOUNTANT FEES AND SERVICES. |
Not applicable for semi-annual reports.
| ITEM 5. | AUDIT COMMITTEE OF LISTED REGISTRANTS. |
Not applicable to the Registrant.
| ITEM 6. | INVESTMENTS |
A schedule of investments for each series of the Registrant is included as part of the report to shareholders of such series under Item 1 of this FormN-CSR.
| ITEM 7. | DISCLOSURE OF PROXY VOTING POLICIES AND PROCEDURES FORCLOSED-END MANAGEMENT INVESTMENT COMPANIES. |
Not applicable to the Registrant.
| ITEM 8. | PORTFOLIO MANAGERS OFCLOSED-END MANAGEMENT INVESTMENT COMPANIES. |
Not applicable to the Registrant.
| ITEM 9. | PURCHASES OF EQUITY SECURITIES BYCLOSED-END MANAGEMENT INVESTMENT COMPANY AND AFFILIATED PURCHASERS. |
Not applicable to the Registrant.
| ITEM 10. | SUBMISSION OF MATTERS TO A VOTE OF SECURITY HOLDERS. |
There were no material changes to the procedures by which shareholders may send recommendations to the Board for nominees to the Registrant’s Board since the Registrant last provided disclosure as to such procedures in response to the requirements of Item 407 (c)(2)(iv) of RegulationS-K or this Item.
Table of Contents
| ITEM 11. | CONTROLS AND PROCEDURES. |
| (a) | Based upon their evaluation of the effectiveness of the registrant’s disclosure controls and procedures (as defined in Rule30a-3(c) under the Investment Company Act of 1940 (the “Act”)) as conducted within 90 days of the filing date of this report on FormN-CSR, the registrant’s principal financial officer and principal executive officer have concluded that those disclosure controls and procedures provide reasonable assurance that the material information required to be disclosed by the registrant on this report is recorded, processed, summarized and reported within the time periods specified in the Securities and Exchange Commission’s rules and forms. |
| (b) | There were no changes in the registrant’s internal controls over financial reporting (as defined in Rule30a-3(d) under the Act) that occurred during the second fiscal quarter of the period covered by the report that have materially affected, or are reasonably likely to materially affect, the registrant’s internal control over financial reporting. |
| ITEM 12. | DISCLOSURE OF SECURITIES LENDING ACTIVITIES FORCLOSED-END MANAGEMENT INVESTMENT COMPANIES. |
Not applicable to the Registrant.
| ITEM 13. | EXHIBITS. |
| (a) (1) | Any code of ethics, or amendment thereto, that is the subject of the disclosure required by Item 2, to the extent that the registrant intends to satisfy the Item 2 requirements through filing of an exhibit. Not applicable. |
| (2) | A separate certification for each principal executive officer and principal financial officer of the registrant as required by Rule30a-2(a) under the Act (17 CFR270.30a-2): Attached hereto asEX-99.302CERT. |
| (3) | Any written solicitation to purchase securities under Rule23c-1 under the Act (17 CFR270.23c-1) sent or given during the period covered by the report by or on behalf of the registrant to 10 or more persons. Not applicable. |
| (4) | Change in the registrant’s independent public accountant. Not applicable. |
| (b) | If the report is filed under Section 13(a) or 15(d) of the Exchange Act, provide the certifications required by Rule30a-2(b) under the Act (17 CFR270.30a-2(b)), Rule13a-14(b) or Rule15d-14(b) under the Exchange Act (17 CFR240.13a-14(b) or240.15d-14(b)) and Section 1350 of Chapter 63 of Title 18 of the United States Code (18 U.S.C. 1350) as an exhibit. A certification furnished pursuant to this paragraph will not be deemed “filed” for the purposes of Section 18 of the Exchange Act (15 U.S.C. 78r), or otherwise subject to the liability of that section. Such certification will not be deemed to be incorporated by reference into any filing under the Securities Act of 1933 or the Exchange Act, except to the extent that the registrant specifically incorporates it by reference. Attached hereto asEX-99.906CERT. |
Table of Contents
Notice
A copy of the Amended and Restated Declaration of Trust, as amended, of the Registrant is on file with the Secretary of State of The Commonwealth of Massachusetts and notice is hereby given that this instrument is executed on behalf of the Registrant by an officer of the Registrant as an officer and not individually and the obligations of or arising out of this instrument are not binding upon any of the Trustees or shareholders individually, but are binding only upon the assets and property of the respective constituent series of the Registrant.
Table of Contents
SIGNATURES
Pursuant to the requirements of the Securities Exchange Act of 1934 and the Investment Company Act of 1940, the registrant has duly caused this report to be signed on its behalf by the undersigned, thereunto duly authorized.
(Registrant) MFS VARIABLE INSURANCE TRUST II
| By (Signature and Title)* | DAVID L. DILORENZO | |
| David L. DiLorenzo, President |
Date: August 16, 2019
Pursuant to the requirements of the Securities Exchange Act of 1934 and the Investment Company Act of 1940, this report has been signed below by the following persons on behalf of the registrant and in the capacities and on the dates indicated.
| By (Signature and Title)* | DAVID L. DILORENZO | |
| David L. DiLorenzo, President (Principal Executive Officer) |
Date: August 16, 2019
| By (Signature and Title)* | JAMES O. YOST | |
| James O. Yost, Treasurer (Principal Financial Officer and Accounting Officer) |
Date: August 16, 2019
| * | Print name and title of each signing officer under his or her signature. |