Our current business strategy is to focus our financial and human resources in the following areas:
| | · | Operating our properties cost-effectively. |
| | · | Expanding our proven and probable reserves and production capacity at our operating properties. |
| | · | Maintaining and investing in exploration projects at our four mining district land packages, which we believe to be under-explored and under-invested: North Idaho’s Silver Valley in the historic Coeur d’Alene Mining District; our Greens Creek unit on Alaska’s Admiralty Island, located near Juneau; the silver producing district near Durango, Mexico; and the Creede district of Southwestern Colorado. |
| | · | Continuing to seek opportunities to acquire and invest in other mining properties and companies (see the Results of Operations and Financial Liquidity and Capital Resources sections below). |
Below is a summary of net income (loss) for each of the last five years (in thousands):
| | | Year Ended December 31, | |
| | | 2010 | | | 2009 | | | 2008 | | | 2007 | | | 2006 | |
| Net income (loss) | | $ | 48,983 | | | $ | 67,826 | | | $ | (66,563 | ) | | $ | 53,197 | | | $ | 69,122 | |
Our financial results over the last five years have been impacted by:
| | · | Fluctuations in prices of the metals we produce. The high and low daily closing market prices for silver, gold, lead and zinc for each of the last five years are as follows: |
| | | 2010 | | | 2009 | | | 2008 | | | 2007 | | | 2006 | |
| Silver (per oz.): | | | | | | | | | | | | | | | |
| High | | $ | 30.70 | | | $ | 19.18 | | | $ | 20.92 | | | $ | 15.82 | | | $ | 14.94 | |
| Low | | $ | 15.14 | | | $ | 10.51 | | | $ | 8.88 | | | $ | 11.67 | | | $ | 8.83 | |
| Gold (per oz.): | | | | | | | | | | | | | | | | | | | | |
| High | | $ | 1,421.00 | | | $ | 1,212.50 | | | $ | 1,011.25 | | | $ | 841.10 | | | $ | 725.00 | |
| Low | | $ | 1,058.00 | | | $ | 810.00 | | | $ | 712.50 | | | $ | 608.40 | | | $ | 524.75 | |
| Lead (per lb.): | | | | | | | | | | | | | | | | | | | | |
| High | | $ | 1.18 | | | $ | 1.11 | | | $ | 1.57 | | | $ | 1.81 | | | $ | 0.82 | |
| Low | | $ | 0.71 | | | $ | 0.45 | | | $ | 0.40 | | | $ | 0.71 | | | $ | 0.41 | |
| Zinc (per lb.): | | | | | | | | | | | | | | | | | | | | |
| High | | $ | 1.20 | | | $ | 1.17 | | | $ | 1.28 | | | $ | 1.93 | | | $ | 2.10 | |
| Low | | $ | 0.72 | | | $ | 0.48 | | | $ | 0.47 | | | $ | 1.00 | | | $ | 0.87 | |
See Item 7. Management’s Discussion and Analysis of Financial Condition and Results of Operations – Results of Operations for a summary of average market and realized prices for each of the three years ended December 31, 2010, 2009 and 2008. Hecla’s average realized prices for all four metals increased in 2010 compared to 2009, and our realized prices for silver and gold in 2010 were higher than average market prices for those metals in 2010, due in part to the timing of concentrate shipments and their final settlement in comparison to fluctuating prices. However, we believe that market metal price trends are a significant factor in our operating and financial perf ormance. Because we are unable to predict fluctuations in prices for metals and have limited control over the timing of our concentrate shipments, there can be no assurance that our realized prices for silver and gold will exceed or even meet average market metals prices for any future period. In April 2010, we began utilizing forward contracts for lead and zinc with the objective of managing the exposure to changes in prices of lead and zinc contained in our concentrate shipments between the time of sale and final settlement. See Note 10 of Notes to Consolidated Financial Statements for more information on our base metal forward contract programs. Our results of operations are significantly impacted by fluctuations in the prices of silver, gold, lead and zinc, which are affected by numerous factors beyond our control. See Item 1A. Risk Factors – Financial Risks – A substantial or extended decline in metals prices would have a material adverse effect on us for information on the various factors that can impact prices of the metals we produce.
| | · | Exploration and pre-production development expenditures totaling $21.6 million, $9.2 million, $22.5 million, $17.0 million and $22.8 million, respectively, for the years ended December 31, 2010, 2009, 2008, 2007 and 2006. These amounts include expenditures for the now-divested Hollister Development Block, as its development progressed until the sale of our interest in the project in April 2007, of $2.2 million and $14.4 million, respectively, for the years ended December 31, 2007 and 2006. In addition to the amounts above, we also incurred exploration expenditures of $1.2 million, $3.9 million and $5.6 million, respectively, for the years ended December 31, 2008, 2007 and 2006 at our now divested Venezuelan operations. These amounts have been reported in income (loss) from discontinued operations for each period. |
| | · | Provision for closed operations and environmental matters of $201.1 million, $7.7 million, $4.3 million, $49.2 million and $3.5 million, respectively, for the years ended December 31, 2010, 2009, 2008, 2007, and 2006. The 2010 provision includes a $193.2 million adjustment to increase our accrued liability for environmental obligations in Idaho’s Coeur d’Alene Basin as a result of the negotiators representing Hecla, the United States, the Coeur d’Alene Indian Tribe, and the State of Idaho reaching an understanding on proposed financial terms to be incorporated into a comprehensive settlement of the Coeur d’Alene Basin environmental litigation and related claims, including any remaining obligations of Hecla Limited under the 1994 Box Consent Decree. Such compr ehensive settlement would contain additional terms yet to be negotiated, and certain other conditions must be satisfied before a settlement is finalized. The increase in our accrual from prior periods results from several factors impacting the Basin liability, all of which would be addressed in the potential settlement. These factors include: (i) as a result of work completed, and information learned by us, in the fourth quarter of 2010, we expect the cost of future remediation and past response costs in the upper Basin to increase from previous estimates; (ii) any potential settlement of the Basin litigation would address the entire Basin, including the lower Basin, for which we do not know the extent of any future remediation plans, other than the EPA has announced that it plans to issue a ROD amendment for the lower Basin in the future, which would include a lower Basin remediation plan for which Hecla Limited may have had some liability; and (iii) inclusion of natural resource damag es in any potential settlement, for which we are unable to estimate any range of liability, however, as stated in their own filings, the United States’ and the Tribe’s claims for natural resource damages may range in the billions of dollars. The 2007 amount includes an increase of $44.7 million to our then-estimated liabilities for the Coeur d’Alene Basin and the Bunker Hill Superfund Site. See Note 7 and Note 19 of Notes to Consolidated Financial Statements for further discussion. |
| | · | Variability in prices for diesel fuel and amounts of fuel used, and variability in prices for other consumables, which have impacted production costs at our operations. See Item 7. Management’s Discussion and Analysis of Financial Condition and Results of Operations – The Greens Creek Segment for information on the variability in diesel fuel prices and consumption on production costs for the last three years. |
| | · | Our acquisition of the remaining 70.3% of the Greens Creek mine for $758.5 million in April 2008, a portion of which was funded by a $140 million term loan and $220 million bridge loan. We recorded interest expense related to these credit facilities, including amortization of loan fees and interest rate swap adjustments, of $10.1 million and $19.1 million, respectively in 2009 and 2008. The amount of interest expense in 2009 is net of $1.9 million in capitalized interest. We also recorded approximately $6.0 million in expense in 2009 for additional debt-related fees. We completed repayment of the bridge loan balance in February 2009 and repayment of the term loan balance in October 2009. |
| | · | The 2008-2010 global financial crisis and recession, which impacted metals prices, production costs, and our access to capital markets. |
| | · | An increase in the number of shares of our common stock outstanding, which impacts our income per common share. |
| | · | Losses from discontinued operations, net of tax, for the years ended December 31, 2008 and 2007 of $17.4 million and $15.0 million, respectively, and income from discontinued operations, net of tax, for the year ended December 31, 2006 of $4.3 million. |
A comprehensive discussion of our financial results for the years ended December 31, 2010, 2009 and 2008, individual operating unit performance, general corporate expenses and other significant items can be found in Item 7. — Management’s Discussion and Analysis of Consolidated Financial Condition and Results of Operations, as well as the Consolidated Financial Statements and Notes thereto.
Products and Segments
Our segments are differentiated by geographic region. We produce zinc, lead and bulk concentrates at our Greens Creek unit and lead and zinc concentrates at our Lucky Friday unit, which we sell to custom smelters on contract, and unrefined gold and silver bullion bars (doré) at Greens Creek, which are sold directly to customers or further refined before sale to precious metals traders. The concentrates produced at our Greens Creek and Lucky Friday units contain payable silver, zinc and lead, and the concentrates produced at Greens Creek also contain payable gold. Our segments as of December 31, 2010 included:
| | · | The Greens Creek unit, a joint venture arrangement which is 100%-owned by us through our subsidiaries Hecla Alaska LLC, Hecla Greens Creek Mining Company and Hecla Juneau Mining Company. We acquired 70.3% of our ownership of Greens Creek in April 2008 from indirect subsidiaries of Rio Tinto, plc. Greens Creek is located on Admiralty Island, near Juneau, Alaska, and has been in production since 1989, with a temporary care and maintenance period from April 1993 through July 1996. During 2010, Greens Creek contributed $313.3 million, or 75%, of our consolidated sales. |
| | · | The Lucky Friday unit located in northern Idaho. Lucky Friday is, through our subsidiaries Hecla Limited and Silver Hunter Mining Company, 100%-owned and has been a producing mine for us since 1958. During 2010, Lucky Friday contributed $105.5 million, or 25%, of our consolidated sales. |
The table below summarizes our production for the years ended December 31, 2010, 2009 and 2008, which reflects our previous 29.7% ownership of Greens Creek until April 16, 2008, and our 100% ownership thereafter. Zinc and lead production quantities are presented in short tons (“tons”).
| | | Year | |
| | | 2010 | | | 2009 | | | 2008 | |
| Silver (ounces) | | | 10,566,352 | | | | 10,989,660 | | | | 8,709,517 | |
| Gold (ounces) | | | 68,838 | | | | 67,278 | | | | 76,810 | |
| Lead (tons) | | | 46,955 | | | | 44,263 | | | | 35,023 | |
| Zinc (tons) | | | 83,782 | | | | 80,995 | | | | 61,441 | |
The gold production amount above for the year ended December 31, 2008 includes 22,160 ounces produced at our discontinued Venezuelan operations sold in July 2008.
Licenses, Permits and Concessions
We are required to obtain various licenses and permits to operate our mines and conduct exploration and reclamation activities. See Item 1A. Risk Factors - Legal, Market and Regulatory Risks - We are required to obtain governmental and lessor approvals and permits in order to conduct mining operations. In addition, we conduct our exploration activities in Mexico pursuant to concessions granted by the Mexican government, which are subject to certain political risks associated with foreign operations. See Item 1A. Risk Factors - Operation, Development, Exploration and Acquisition Risks - Our foreign activities are subject to additional inherent risks.
Physical Assets
Our business is capital intensive and requires ongoing capital investment for the replacement, modernization or expansion of equipment and facilities. At December 31, 2010, the book value of our property, plant, equipment and mineral interests, net of accumulated depreciation, was approximately $833.3 million. We maintain insurance policies against property loss and business interruption. However, such insurance contains exclusions and limitations on coverage, and there can be no assurance that claims would be paid under such insurance policies in connection with a particular event. See Item 1A. Risk Factors - Operation, Development, Exploration and Acquisition Risks - -Our operations may be adversely affected by risks and hazards associated with the mining industry that may not be fully covered by insurance.
Employees
As of December 31, 2010, we employed 686 people, and we believe relations with our employees are generally good.
Many of the employees at our Lucky Friday unit are represented by a union. The current collective bargaining agreement with workers at our Lucky Friday unit, which was signed in 2010, expires on April 30, 2016.
Available Information
Hecla Mining Company is a Delaware corporation. Our current holding company structure dates from the incorporation of Hecla Mining Company in 2006 and the renaming of its subsidiary (previously Hecla Mining Company) as Hecla Limited. Our principal executive offices are located at 6500 N. Mineral Drive, Suite 200, Coeur d’Alene, Idaho 83815-9408. Our telephone number is (208) 769-4100. Our web site address is www.hecla-mining.com. We file our annual, quarterly and current reports and any amendments to these reports with the SEC, copies of which are available on our website or from the SEC free of charge (www.sec.gov or 800-SEC-0330 or the SEC’s Public Reference Room, 100 F Stre et, N.E., Washington, D.C. 20549). Charters of our audit, compensation, corporate governance, and directors’ nominating committees, as well as our Code of Ethics for the Chief Executive Officer and Senior Financial Officers and our Code of Business Conduct and Ethics for Directors, Officers and Employees, are also available on our website. We will provide copies of these materials to shareholders upon request using the above-listed contact information, directed to the attention of Investor Relations, or via e-mail request sent to www.info@hecla-mining.com.
We have included the Chief Executive Officer (CEO) and Chief Financial Officer (CFO) certifications regarding our public disclosure required by Section 302 of the Sarbanes-Oxley Act of 2002 as Exhibits 31.1 and 31.2 to this report. Additionally, we filed with the New York Stock Exchange (“NYSE”) the CEO’s certification regarding our compliance with the NYSE’s Corporate Governance Listing Standards (“Listing Standards”) pursuant to Section 303A.12(a) of the Listing Standards, which certification was dated May 28, 2010, and indicated that the CEO was not aware of any violations of the Listing Standards.
Item 1A. Risk Factors
The following risks and uncertainties, together with the other information set forth in this Form 10-K, should be carefully considered by those who invest in our securities. Any of the following risks could materially adversely affect our business, financial condition or operating results and could decrease the value of our common and/or preferred stock.
FINANCIAL RISKS
A global financial crisis may have an impact on our business and financial condition in ways that we currently cannot predict.
The recent credit crisis and related turmoil in the global financial system had an impact on our business and financial position, and a similar financial crisis in the future may also impact us. The continuation or re-emergence of the financial crisis may limit our ability to raise capital through credit and equity markets. As discussed further below, the prices of the metals that we produce are affected by a number of factors, and it is unknown how these factors may be impacted by a global financial crisis.
We have had losses that could reoccur in the future.
Although we reported net income for the years ended December 31, 2010, 2009 and 2007 of $49.0 million, $67.8 million and $53.2 million, respectively, we reported a net loss for the year ended December 31, 2008 of $66.6 million. A comparison of operating results over the past three years can be found in Results of Operations in Management’s Discussion and Analysis of Financial Condition and Results of Operations.
Many of the factors affecting our operating results are beyond our control, including the volatility of metals prices; smelter terms; diesel fuel prices; interest rates; global or regional political or economic policies; inflation; availability and cost of labor; economic developments and crises; governmental regulations; continuity of orebodies; ore grades; recoveries; and speculation, aggregation and sales by central banks and other holders and producers of gold and silver in response to these factors. We cannot foresee whether our operations will continue to generate sufficient revenue in order for us to generate net cash from operating activities. There can be no assurance that we will not experience net losses in the future.
Commodity risk management activities could expose us to losses.
We periodically enter into risk management activities, such as forward sales contracts and commodity put and call option contracts, to manage the prices received on the metals we produce. Such activities are utilized to attempt to insulate our operating results from changes in prices for those metals. However, such activities may prevent us from realizing possible revenues in the event that the market price of a metal exceeds the price stated in a forward sale or call option contract. In addition, we may experience losses if a counterparty fails to purchase under a contract when the contract price exceeds the spot price of a commodity.
During the second quarter of 2010, we initiated financially settled forward contract programs to manage the exposure to changes in lead and zinc prices contained in our concentrate shipments between the time of sale and final settlement, and to manage the exposure of changes in the prices of lead and zinc contained in our forecasted future concentrate shipments. See Note 10 of Notes to Consolidated Financial Statements for more information on these base metals forward contract programs.
If we are able to settle the Coeur d’Alene Basin environmental litigation and other claims, the financial terms of settlement will materially impact our cash resources and our access to additional financing.
The negotiators representing Hecla and the United States and the Coeur d’Alene Indian Tribe (“Plaintiffs”), and the State of Idaho, have reached an understanding on proposed financial terms to be incorporated into a comprehensive settlement of the Coeur d’Alene Basin environmental litigation and related claims, including any remaining obligations of Hecla Limited under the 1994 Box Consent Decree. Such a comprehensive settlement would contain additional terms yet to be negotiated, and certain other conditions must be satisfied before a settlement is finalized. If such settlement is finalized and a Consent Decree entered, substantial cash payment obligations by us would be required, including:
| | · | $102 million within 30 days after entry of the Consent Decree. |
| | · | $55.5 million in cash or shares of Hecla Mining Company common stock, at our election, within 30 days after entry of the Consent Decree. |
| | · | $25 million within 30 days after the first anniversary of entry of the Consent Decree. |
| | · | $15 million within 30 days after the second anniversary of entry of the Consent Decree. |
| | · | $65.9 million by August 2014, in the form of quarterly payments of the proceeds from exercises of any outstanding Series 1 and Series 3 warrants (which have an exercise price of between $2.45 and $2.50 per share) during the quarter with the balance of the $65.9 million due in August 2014 (regardless of the amount of warrants that have been exercised). We have received proceeds of approximately $9.5 million for the exercise of Series 1 and Series 3 warrants as of the date of this report, which we anticipate would be paid to the Plaintiffs within 30 days after entry of the Consent Decree. |
More information about the proposed financial terms of settlement is set forth in Note 19 of Notes to Consolidated Financial Statements.
The requirement to pay $102 million plus proceeds from exercised warrants (which totaled approximately $5.2 million as of December 31, 2010) in cash in 2011 would cause us to use a significant portion of our cash on hand, which, as of December 31, 2010, was $283.6 million (including cash equivalents). Our cash on hand could be further reduced in the near term if we elect to pay the $55.5 million in cash, instead of shares of our common stock. Also, if additional warrants are not exercised, the requirement to pay up to $96.4 million (excluding interest) in cash over the next approximately three years will cause us to use a significant portion of either our cash currently on hand, or future cash resources. There can be no assurance that we will have the cash on hand to meet these oblig ations.
Financial terms of settlement would also require that Hecla Mining Company or Hecla Limited post third party surety in some form to secure the $25 million, $15 million, and $65.9 million payments. Obtaining surety will cause us to incur costs, and will also cause us to utilize credit capacity which could otherwise be used to fund other areas of our business, including operations and capital expenditures. Moreover, there is no guarantee that we will be able to obtain or maintain such surety, in which case we could be in default of the Consent Decree, which could have a material adverse effect on Hecla Limited’s or our results from operations or financial position.
The financial terms summarized above would be part of any final and complete settlement reflected in a Consent Decree. However, no assurance can be given that final settlement will be reached and a Consent Decree entered. See Item 1A. Risk Factors – Legal, Market and Regulatory Risks – The financial terms of proposed settlement that we negotiated with the Plaintiffs’ and the State of Idaho’s negotiators regarding the Coeur d’Alene Basin environmental litigation and related claims are non-binding and are not final, and complete settlement of the litigation and other claims may not be reached and We are required to obtain governmental and lessor approvals and permits in or der to conduct mining operations.
Our profitability could be affected by the prices of other commodities and services.
Our business activities are highly dependent on the costs of commodities and services such as fuel, steel, cement and electricity. The recent prices for such commodities have been volatile and may increase our costs of production and development. A material increase in costs at any of our operating properties could have a significant effect on our profitability. For additional discussion, see Results of Operations in Management’s Discussion and Analysis of Financial Condition and Results of Operations.
Our accounting and other estimates may be imprecise.
Preparing financial statements requires management to make estimates and assumptions that affect the reported amounts and related disclosure of assets, liabilities, revenue and expenses at the date of the consolidated financial statements and reporting periods. The more significant areas requiring the use of management assumptions and estimates relate to:
| | · | mineral reserves and other mineralized material that are the basis for future income and cash flow estimates and units-of-production depreciation, depletion and amortization calculations; |
| | · | environmental, reclamation and closure obligations; |
| | · | reserves for contingencies and litigation; and |
| | · | deferred tax asset valuation allowance. |
Actual results may differ materially from these estimates using different assumptions or conditions. For additional information, see Critical Accounting Estimates in Management’s Discussion and Analysis of Financial Condition and Results of Operations, Note 1 — Significant Accounting Policies of Notes to Consolidated Financial Statements and the risk factors: “Our development of new orebodies and other capital costs may cost more and provide less return than we estimated,” “Our ore reserve estimates may be impreci se” and “Our environmental obligations may exceed the provisions we have made.”
A substantial or extended decline in metals prices would have a material adverse effect on us.
Our revenue is derived from the sale of silver, gold, lead and zinc and, as a result, our earnings are directly related to the prices of these metals. Silver, gold, lead and zinc prices fluctuate widely and are affected by numerous factors, including:
| | · | relative exchange rates of the U.S. dollar; |
| | · | global and regional demand and production; |
| | · | inflation, recession or increased or reduced economic activity; and |
| | · | other political, regulatory and economic conditions. |
These factors are largely beyond our control and are difficult to predict. If the market prices for these metals fall below our production or development costs for a sustained period of time, we will experience losses and may have to discontinue exploration, development or operations, or incur asset write-downs at one or more of our properties.
The following table sets forth the average daily closing prices of the following metals for the year ended December 31, 2006 and each year thereafter through 2010.
| | | 2010 | | | 2009 | | | 2008 | | | 2007 | | | 2006 | |
Silver (1) (per oz.) | | $ | 20.16 | | | $ | 14.65 | | | $ | 15.02 | | | $ | 13.39 | | | $ | 11.57 | |
Gold (2) (per oz.) | | $ | 1,224.66 | | | $ | 972.98 | | | $ | 871.71 | | | $ | 696.66 | | | $ | 604.34 | |
Lead (3) (per lb.) | | $ | 0.97 | | | $ | 0.78 | | | $ | 0.95 | | | $ | 1.17 | | | $ | 0.58 | |
Zinc (4) (per lb.) | | $ | 0.98 | | | $ | 0.75 | | | $ | 0.85 | | | $ | 1.47 | | | $ | 1.49 | |
______________
| (3) | London Metals Exchange — Cash |
| (4) | London Metals Exchange — Special High Grade — Cash |
On February 22, 2011, the closing prices for silver, gold, lead and zinc were $32.89 per ounce, $1,401 per ounce, $1.16 per pound and $1.13 per pound, respectively.
An extended decline in metals prices, an increase in operating or capital costs, or our inability to convert exploration potential to reserves may cause us to record write-downs, which could negatively impact our results of operations.
We review the recoverability of the cost of our long-lived assets by estimating the future undiscounted cash flows expected to result from the use and eventual disposition of the asset. Impairment, measured by comparing an asset’s carrying value to its fair value, must be recognized when the carrying value of the asset exceeds these cash flows, and recognizing impairment write-downs could negatively impact our results of operations. Metal price estimates are a key component used in the analysis of the carrying values of our assets. We evaluated the December 31, 2010 carrying values of long-lived assets at our Greens Creek and Lucky Friday segments by comparing them to the average estimated undiscounted cash flows resulting from operatin g plans using various metals price scenarios. Our estimates of undiscounted cash flows for each of our properties also include an estimate of the market value of the exploration potential beyond the current operating plans. Because the average estimated undiscounted cash flows exceeded the asset carrying values, we did not record impairments as of December 31, 2010. However, if the prices of silver, gold, zinc and lead decline for an extended period of time or we fail to control production costs or realize the mineable ore reserves or exploration potential at our mining properties, we may be required to recognize asset write-downs in the future. In addition, the perceived market value of the exploration potential of our properties is dependent upon prevailing metals prices as well as our ability to discover economic ore. A decline in metals prices for an extended period of time or our inability to convert exploration potential to reserves could signific antly reduce our estimations of the value of the exploration potential at our properties and result in asset write-downs.
Our ability to recognize the benefits of deferred tax assets is dependent on future cash flows and taxable income
We recognize the expected future tax benefit from deferred tax assets when the tax benefit is considered to be more likely than not of being realized. Otherwise, a valuation allowance is applied against deferred tax assets. Assessing the recoverability of deferred tax assets requires management to make significant estimates related to expectations of future taxable income. Estimates of future taxable income are based on forecasted income from operations and the application of existing tax laws in each jurisdiction. Metal price estimates are a key component used in the determination of our ability to realize the expected future benefit of our deferred tax assets. To the extent that future taxable income differs significan tly from estimates as a result of a decline in metals prices or other factors, our ability to realize the deferred tax assets could be impacted. Additionally, significant future issuances of common stock or common stock equivalents could limit our ability to utilize our net operating loss carryforwards pursuant to Section 382 of the Internal Revenue Code. Future changes in tax law or changes in ownership structure could limit our ability to utilize our recorded tax assets. As of December 31, 2010, we lifted substantially all deferred tax valuation allowances and our current and non-current deferred tax asset balances were $87.3 million and $100.1 million, respectively. See Note 5 of Notes to Consolidated Financial Statements for further discussion of our deferred tax assets.
Returns for Investments in Pension Plans and Pension Plan Funding Requirements Are Uncertain
We maintain defined benefit pension plans for employees, which provide for specified payments after retirement for most employees. The ability of the pension plans to provide the specified benefits depends on our funding of the plans and returns on investments made by the plans. Returns, if any, on investments are subject to fluctuations based on investment choices and market conditions. A sustained period of low returns or losses on investments could require us to fund the pension plans to a greater extent than anticipated. See Note 8 of Notes to Consolidated Financial Statements for more information on our pension plans.
OPERATION, DEVELOPMENT, EXPLORATION AND ACQUISITION RISKS
We may be subject to a number of unanticipated risks related to inadequate infrastructure.
Mining, processing, development and exploration activities depend on adequate infrastructure. Reliable roads, bridges, power sources and water supply are important determinants, which affect capital and operating costs. Unusual or infrequent weather phenomena, sabotage, government or other interference in the maintenance or provision of such infrastructure could adversely affect our mining operations.
Our development of new orebodies and other capital costs may be higher and provide less return than we estimated.
Capitalized development projects may cost more and provide less return than we estimate. If we are unable to realize a return on these investments, we may incur a related asset write-down that could adversely affect our financial results or condition.
Our ability to sustain or increase our current level of metals production partly depends on our ability to develop new orebodies and/or expand existing mining operations. Before we can begin a development project, we must first determine whether it is economically feasible to do so. This determination is based on estimates of several factors, including:
| | · | expected recovery rates of metals from the ore; |
| | · | facility and equipment costs; |
| | · | availability of adequate manpower; |
| | · | availability of affordable sources of power and adequacy of water supply; |
| | · | exploration and drilling success; |
| | · | capital and operating costs of a development project; |
| | · | environmental considerations and permitting; |
| | · | adequate access to the site, including competing land uses (such as agriculture); |
| | · | foreign currency fluctuation and inflation rates; and |
| | · | availability of financing. |
These estimates are based on geological and other interpretive data, which may be imprecise. As a result, actual operating and capital costs and returns from a development project may differ substantially from our estimates, and, as such, it may not be economically feasible to continue with a development project.
Our ore reserve estimates may be imprecise.
Our ore reserve figures and costs are primarily estimates and are not guarantees that we will recover the indicated quantities of these metals. You are strongly cautioned not to place undue reliance on estimates of reserves. Reserves are estimates made by our professional technical personnel, and no assurance can be given that the estimated amount of metal or the indicated level of recovery of these metals will be realized. Reserve estimation is an interpretive process based upon available data and various assumptions. Our reserve estimates may change based on actual production experience. Further, reserves are valued based on estimates of costs and metals prices, which may not be consistent among our properties. The economic value of ore reserves may be adversely affected by:
| | · | declines in the market price of the various metals we mine; |
| | · | increased production or capital costs; |
| | · | reduction in the grade or tonnage of the deposit; |
| | · | increase in the dilution of the ore; and |
Short-term operating factors relating to our ore reserves, such as the need to sequentially develop orebodies and the processing of new or different ore grades, may adversely affect our cash flow. If the prices of metals that we produce decline substantially below the levels used to calculate reserves for an extended period, we could experience:
| | · | delays in new project development; |
| | · | write-downs of asset values; and |
Efforts to expand the finite lives of our mines may not be successful or could result in significant demands on our liquidity, which could hinder our growth and decrease the value of our stock.
One of the risks we face is that our mines are a depleting asset. Thus, we must continually replace depleted ore reserves. Our ability to expand or replace ore reserves primarily depends on the success of our exploration programs. Mineral exploration, particularly for silver and gold, is highly speculative and expensive. It involves many risks and is often non-productive. Even if we believe we have found a valuable mineral deposit, it may be several years before production from that deposit is possible. During that time, it may become no longer feasible to produce those minerals for economic, regulatory, political or other reasons. As a result of high costs and other uncertainties, we may not be able to expand or replace our existing ore reserves as they are depleted, which would adversely affect our business and fi nancial position in the future.
Over the past years we have evaluated alternatives for deeper access at the Lucky Friday mine in order to expand its operational life. As a result, we initiated work on an internal shaft at Lucky Friday (“#4 Shaft”), including: detailed shaft design, excavation of the hoist room and off shaft development access to shaft facilities, placement and receipt of orders for major equipment purchases, and other construction activities. Upon completion, #4 Shaft would allow us to mine mineralized material below our current workings and provide deeper platforms for exploration. Construction of #4 Shaft would take approximately four more years to complete, and capital expenditures for the project would total approximately $200 million, including approximately $50 million spent on the project through December 31, 2010. Our management currently expects to seek final approval of the project by the Board of Directors in the first half of 2011. We believe that our current capital resources will allow us to proceed. However, there are a number of factors that could affect final approval of the project, including: a significant decline in metals prices, a significant increase in operating or capital costs, or our inability to successfully settle or otherwise manage our existing and potential environmental liabilities relating to historical mining activities in the Coeur d’Alene Basin. An increase in the capital cost could potentially require us to suspend the project or access additional capital though debt financing, the sale of securities, or other external sources. This additional financing could be costly or unavailable.
Our joint development and operating arrangements may not be successful.
We have in the past entered into, and may in the future enter into joint venture arrangements in order to share the risks and costs of developing and operating properties. In a typical joint venture arrangement, the partners own a proportionate share of the assets, are entitled to indemnification from each other and are only responsible for any future liabilities in proportion to their interest in the joint venture. If a party fails to perform its obligations under a joint venture agreement, we could incur liabilities and losses in excess of our pro-rata share of the joint venture. We make investments in exploration and development projects that may have to be written off in the event we do not proceed to a commercially viable mining operation.
On February 21, 2008, we announced that our wholly-owned subsidiary, Rio Grande Silver Inc., acquired the right to earn into a 70% joint venture interest in an approximately 25-square-mile consolidated land package in the Creede Mining District of Colorado. For more information on the terms of the agreement, see Note 17 of Notes to Consolidated Financial Statements.
Our ability to market our metals production may be affected by disruptions or closures of custom smelters and/or refining facilities.
We sell substantially all of our metallic concentrates to custom smelters, with our doré bars sent to refiners for further processing before being sold to metal traders. If our ability to sell concentrates to our contracted smelters becomes unavailable to us, it is possible our operations could be adversely affected. See Note 11 of Notes to Consolidated Financial Statements for more information on the distribution of our sales and our significant customers.
We face inherent risks in acquisitions of other mining companies or properties that may adversely impact our growth strategy.
Mines have limited lives, which is an inherent risk in acquiring mining properties. We are actively seeking to expand our mineral reserves by acquiring other mining companies or properties. Although we are pursuing opportunities that we feel are in the best interest of our investors, these pursuits are costly and often unproductive. Inherent risks in acquisitions we may undertake in the future could adversely affect our current business and financial condition and our growth.
There is a limited supply of desirable mineral lands available in the United States and foreign countries where we would consider conducting exploration and/or production activities, and any acquisition we may undertake is subject to inherent risks. In addition to the risk associated with limited mine lives, we may not realize the value of the companies or properties that are acquired due to a possible decline in metals prices, failure to obtain permits, labor problems, changes in regulatory environment, failure to achieve anticipated synergies, an inability to obtain financing and other factors previously described. Acquisitions of other mining companies or properties may also expose us to new geographic, political, operating, and geological risks. In addition, we face strong competition for companies and propertie s from other mining companies, some of which have greater financial resources than we do, and we may be unable to acquire attractive companies and mining properties on terms that we consider acceptable.
Our business depends on good relations with our employees.
We are dependent upon the ability and experience of our executive officers, managers, employees and other personnel, and there can be no assurance that we will be able to retain all of such employees. We compete with other companies both within and outside the mining industry in connection with the recruiting and retention of qualified employees knowledgeable of the mining business. The loss of these persons or our inability to attract and retain additional highly skilled employees could have an adverse effect on our business and future operations. The Lucky Friday mine is our only operation subject to a collective bargaining agreement, and that agreement expires on April 30, 2016.
Competition from other mining companies may harm our business.
We compete with other mining companies to attract and retain key executives, skilled labor, contractors and other employees. We compete with other mining companies for the services of skilled personnel and contractors and their specialized equipment, components and supplies, such as drill rigs, necessary for exploration and development. We also compete with other mining companies for rights to mine properties. We may be unable to continue to obtain the services of skilled personnel and contractors or specialized equipment or supplies, or to acquire additional rights to mine properties.
Mining accidents or other adverse events at an operation could decrease our anticipated production.
Production may be reduced below our historical or estimated levels as a result of mining accidents; unfavorable ground conditions; work stoppages or slow-downs; lower than expected ore grades; the metallurgical characteristics of the ore that are less economic than anticipated; or our equipment or facilities fail to operate properly or as expected. For example, in the second quarter of 2010, mining activities at the Lucky Friday mine stopped for approximately two weeks due to some deterioration of shaft infrastructure at the #2 Shaft, which is the mine’s secondary escape way. That stoppage adversely impacted production in the second quarter of 2010. Upon completion of repairs to #2 Shaft, the mine returned to normal production.
Our operations may be adversely affected by risks and hazards associated with the mining industry that may not be fully covered by insurance.
Our business is capital intensive, requiring ongoing capital investment for the replacement, modernization or expansion of equipment and facility. The Company maintains insurance policies against property loss and business interruption and insures against risks that are typical in the operation of our business, in amounts we believe to be reasonable. Such insurance, however, contains exclusions and limitations on coverage, particularly with respect to environmental liability and political risk. There can be no assurance that claims would be paid under such insurance policies in connection with a particular event. Our business is subject to a number of risks and hazards including:
| | · | political and country risks; |
| | · | civil unrest or terrorism; |
| | · | labor disputes or strikes; |
| | · | unusual or unexpected geologic formations; |
| | · | underground fires or floods; |
| | · | explosive rock failures; and |
| | · | unanticipated hydrologic conditions, including flooding and periodic interruptions due to inclement or hazardous weather conditions. |
Such risks could result in:
| | · | personal injury or fatalities; |
| | · | damage to or destruction of mineral properties or producing facilities; |
| | · | delays in exploration, development or mining; |
| | · | temporary or permanent closure of facilities. |
We maintain insurance to protect against losses that may result from some of these risks at levels consistent with our historical experience, industry practice and circumstances surrounding each identified risk. Insurance against environmental risks is generally either unavailable or, we believe, too expensive for us, and we therefore do not maintain environmental insurance. Occurrence of events for which we are not insured may have an adverse effect on our business.
Our foreign activities are subject to additional inherent risks.
We sold our mining operations and assets in Venezuela in July 2008, but still currently conduct exploration projects in Mexico and continue to own assets, real estate and mineral interests there. We anticipate that we will continue to conduct operations in Mexico and possibly other international locations in the future. Because we conduct operations internationally, we are subject to political and economic risks such as:
| | · | the effects of local political, labor and economic developments and unrest; |
| | · | significant or abrupt changes in the applicable regulatory or legal climate; |
| | · | exchange controls and export restrictions; |
| | · | expropriation or nationalization of assets with inadequate compensation; |
| | · | currency fluctuations and repatriation restrictions; |
| | · | invalidation of governmental orders, permits or agreements; |
| | · | renegotiation or nullification of existing concessions, licenses, permits and contracts; |
| | · | corruption, demands for improper payments, expropriation, and uncertain legal enforcement and physical security; |
| | · | disadvantages of competing against companies from countries that are not subject to U.S. laws and regulations; |
| | · | fuel or other commodity shortages; |
| | · | laws or policies of foreign countries and the United States affecting trade, investment and taxation; |
| | · | civil disturbances, war and terrorist actions; and |
Consequently, our exploration, development and production activities outside of the United States may be substantially affected by factors beyond our control, any of which could materially adversely affect our financial condition or results of operations.
LEGAL, MARKET AND REGULATORY RISKS
We are currently involved in ongoing legal disputes that may materially adversely affect us.
There are several ongoing legal disputes in which we are involved. If any of these disputes result in a substantial monetary judgment against us, are settled on terms in excess of our current accruals, or otherwise impact our operations, our financial results or condition could be materially adversely affected. For example, we may ultimately incur environmental remediation costs or the plaintiffs in environmental proceedings may be awarded damages substantially in excess of the amounts we have accrued. In particular, we face this risk in connection with the Coeur d’Alene Basin environmental lawsuit in which the Plaintiffs have alleged damages totaling in the billions of dollars and in which Hecla Limited is the sole remaining defendant. In February 2011, the negotiators representing Hecla , the Plaintiffs, and the State of Idaho reached an understanding on proposed financial terms to be incorporated into a comprehensive settlement of the Coeur d’Alene Basin environmental litigation and related claims. Those financial terms of potential settlement are set forth in Note 19 of Notes to Consolidated Financial Statements. See risk titled “The financial terms of proposed settlement that we negotiated with the Plaintiffs’ and the State of Idaho’s negotiators regarding the Coeur d’Alene Basin environmental litigation and related claims are non-binding and are not final, and complete settlement of the litigation and other claims may not be reached.” For a description of the lawsuits in which we are involved, see Note 7 a nd Note 19 of Notes to Consolidated Financial Statements.
The financial terms of proposed settlement that we negotiated with the Plaintiffs’ and the State of Idaho’s negotiators regarding the Coeur d’Alene Basin environmental litigation and related claims are non-binding and are not final, and complete settlement of the litigation and other claims may not be reached.
In February 2011, the negotiators representing Hecla, the Plaintiffs, and the State of Idaho reached an understanding on proposed financial terms to be incorporated into a comprehensive settlement of the Coeur d’Alene Basin environmental litigation and related claims. The proposed financial terms would require that we pay in the aggregate $263.4 million to the Plaintiffs and the State of Idaho over approximately three years, and provide a limited amount of land to be used as a repository waste site, as part of settling the litigation and other claims. The proposed financial terms of settlement are set forth in Note 19 of Notes to Consolidated Financial Statements.
Any comprehensive settlement would contain additional material terms yet to be negotiated. While the negotiators have reached an understanding on proposed financial terms, no party has agreed to any of these terms. Thus, these terms are not, at this point, binding on us, the Plaintiffs, or the State of Idaho until an agreement on all of the other terms of settlement is reached and a Consent Decree is entered by the Court. On February 18, 2011, the Court issued an order giving the parties until April 15, 2011 to file a joint status report regarding settlement efforts and stated no extensions will be given absent a showing of extraordinary cause.
If the negotiators for Hecla, the Plaintiffs, and the State of Idaho do reach a final settlement in the form of a proposed Consent Decree that they are prepared to recommend to their respective managements and clients, that Consent Decree will be subject to (i) approval by the parties’ management and clients, (ii) a 30-day public comment period and a period for responses to those public comments and (iii) approval by the United States District Court in Idaho. There can be no assurance that the parties will be successful in negotiating and agreeing on the final terms of the Consent Decree, or that the Consent Decree will be entered by the Court and thereby become final and binding. If we are unable to successfully settle the litigation and other claims and have the Consent Decree entered, it is possible that Hecla Limited’s liability for environmental remediation and other damages in the Coeur d’Alene Basin will exceed the amounts we have accrued for such liabilities. See risk titled “Our environmental obligations may exceed the provisions we have made.”
We are required to obtain governmental and lessor approvals and permits in order to conduct mining operations.
In the ordinary course of business, mining companies are required to seek governmental and lessor approvals and permits for expansion of existing operations or for the commencement of new operations. Obtaining the necessary governmental permits is a complex, time-consuming and costly process. The duration and success of our efforts to obtain permits are contingent upon many variables not within our control. Obtaining environmental permits, including the approval of reclamation plans, may increase costs and cause delays depending on the nature of the activity to be permitted and the interpretation of applicable requirements implemented by the permitting authority. There can be no assurance that all necessary approvals and permits will be obtained and, if obtained, that the costs involved will not exceed those that we previously estimated. It is possible that the costs and delays associated with the compliance with such standards and regulations could become such that we would not proceed with the development or operation. We are required to post surety bonds or cash collateral to secure our reclamation obligations and we may be unable to obtain the required surety bonds or may not have the resources to provide cash collateral.
We face substantial governmental regulation and environmental risk.
Our business is subject to extensive U.S. and foreign, federal, state and local laws and regulations governing development, production, labor standards, occupational health, waste disposal, use of toxic substances, environmental regulations, mine safety and other matters. For example, in 2010 both of our operating mines received several citations under the Mine Safety and Health Act of 1977, as administered by the Federal Mine Safety and Health Administration. Further, we have been and are currently involved in lawsuits or disputes in which we have been accused of causing environmental damage, violating environmental laws, or violating environmental permits, and we may be subject to similar lawsuits or disputes in the future. See risk titled � 220;Our environmental obligations may exceed the provisions we have made.” For example, in late 2008 and during 2009, Hecla Limited experienced a number of alleged water permit exceedances for water discharges at its Lucky Friday unit. The 2008 alleged violations resulted in Hecla Limited entering into a Consent Agreement and Final Order (“CAFO”) and a Compliance Order with the EPA in April 2009, which included an extended compliance timeline. In connection with the CAFO, Hecla Limited agreed to pay an administrative penalty to the EPA of $177,500 to settle any liability for such exceedances. The 2009 alleged violations were the subject of a December 2010 letter from the EPA informing Hecla Limited that EPA is prepared to seek civil penalties for these alleged violations, as well as for alleged unpermitted discharges of waste water in 2009 at the Lucky Friday unit. In the same letter, EPA invited Hecla Limited to discuss these ma tters with them prior to filing a complaint. Hecla Limited disputes EPA’s assertions, but has begun negotiations with EPA in an attempt to resolve these matters.
Hecla Limited has undertaken efforts to bring its water discharges at the Lucky Friday unit into compliance with the permit, but cannot provide assurances that it will be able to fully comply with the permit limits in the future. Any future non-compliance with the permit limits or other regulatory or environmental requirements could lead to future penalties, regulatory or other legal action, damages, or otherwise impact our operations and financial results.
In addition to existing regulatory requirements, legislation and regulations may be adopted or permit limits reduced at any time that result in additional operating expense, capital expenditures or restrictions and delays in the mining, production or development of our properties. In addition, enforcement or regulatory tools and methods available to governmental regulators such as the U.S. Environmental Protection Agency which have not been used or seldomly used against us, could in the future be used against us.
Legislative and regulatory measures to address climate change and green house gas emissions are in various phases of consideration. If adopted, such measures could increase our cost of environmental compliance and also delay or otherwise negatively affect efforts to obtain permits and other regulatory approvals with regard to existing and new facilities. Proposed measures could also result in increased cost of fuel and other consumables used at our operations, including the diesel generation of electricity at our Greens Creek operation if we are unable to access utility power. Climate change legislation may also affect our smelter customers who burn fossil fuels, resulting in increased costs to us, and may affect the market for the metals we produce with effects on prices that are not possible for us to predict.
From time to time, the U.S. Congress considers proposed amendments to the General Mining Law of 1872, as amended, which governs mining claims and related activities on federal lands. The extent of any future changes is not known and the potential impact on us as a result of U.S. Congressional action is difficult to predict. Changes to the General Mining Law, if adopted, could adversely affect our ability to economically develop mineral reserves on federal lands. Although we are not currently mining on federal land, exploration and future mining could occur on federal land.
Our environmental obligations may exceed the provisions we have made.
We are subject to significant environmental obligations, particularly in northern Idaho through our subsidiary Hecla Limited. At December 31, 2010, we had accrued $318.8 million as a provision for environmental obligations, including $278.1 million accrued for Hecla Limited’s various liabilities in Idaho. As of the date of this report, these accrual balances included a total of $262.2 million for environmental claims with respect to the entire Coeur d’Alene Basin (“Basin”), including the Box, in northern Idaho. These accrual balances include an increase of $193.2 million in the fourth quarter of 2010 as a result of negotiators representing Hecla, the Plaintiffs, and the State of Idaho with respect to the Coeur d’Alene Basin environmental litigation an d related claims reaching an understanding on proposed financial terms to be incorporated into a comprehensive settlement that would contain additional terms yet to be negotiated. Despite reaching such an understanding, there is no guarantee that final settlement terms will be reached and a Consent Decree entered. If we are unable to successfully settle the litigation and have a Consent Decree entered, it is possible that Hecla Limited’s liability for environmental remediation and other damages in the Coeur d’Alene Basin will exceed the amounts we have accrued for such liabilities.
For an overview of our potential environmental liabilities, see Note 7 and Note 19 of Notes to Consolidated Financial Statements.
The titles to some of our properties may be defective or challenged.
Unpatented mining claims constitute a significant portion of our undeveloped property holdings, the validity of which could be uncertain and may be contested. Although we have conducted title reviews of our property holdings, title review does not necessarily preclude third parties from challenging our title. In accordance with mining industry practice, we do not generally obtain title opinions until we decide to develop a property. Therefore, while we have attempted to acquire satisfactory title to our undeveloped properties, some titles may be defective.
The price of our stock has a history of volatility and could decline in the future.
Our common and preferred stocks are listed on the New York Stock Exchange. The market price for our stock has been volatile, often based on:
| | · | changes in metals prices, particularly silver; |
| | · | our results of operations and financial condition as reflected in our public news releases or periodic filings with the Securities and Exchange Commission; |
| | · | fluctuating proven and probable reserves; |
| | · | factors unrelated to our financial performance or future prospects, such as global economic developments, market perceptions of the attractiveness of particular industries, or the reliability of metals markets,; |
| | · | political and regulatory risk; |
| | · | the success of our exploration programs; |
| | · | ability to meet production estimates; |
| | · | environmental and legal risk; |
| | · | the extent of analytical coverage concerning our business; and |
| | · | the trading volume and general market interest in our securities. |
The market price of our stock at any given point in time may not accurately reflect our value, and may prevent shareholders from realizing a profit on their investment.
Our Series B Preferred Stock has a liquidation preference of $50 per share or $7.9 million.
If we were liquidated, holders of our preferred stock would be entitled to receive approximately $7.9 million (plus any accrued and unpaid dividends) from any liquidation proceeds before holders of our common stock would be entitled to receive any proceeds.
We may not be able to pay preferred stock dividends in the future.
Since July 2005, we paid regular quarterly dividends on our Series B Preferred Stock through the third quarter of 2008. The annual dividend payable on the Series B Preferred Stock is currently $0.6 million. Prior to the fourth quarter of 2004, we had not declared preferred dividends on Series B Preferred Stock since the second quarter of 2000. Series B Preferred Stock dividends due on January 1, 2009, for the fourth quarter of 2008 and dividends due for the three quarters thereafter were deferred. In January 2010 we paid all dividends in arrears and dividends due for the fourth quarter of 2009 for the Series B Preferred Stock, and we paid all regular quarterly dividends for 2010. However, there can be no assurance that we will continue to pay dividends in the future.
Additional issuances of equity securities by us would dilute the ownership of our existing stockholders and could reduce our earnings per share.
We may issue equity in the future in connection with acquisitions, strategic transactions or for other purposes, including funding our obligations under any settlement of litigation of other claims. Any such acquisition could be material to us and could significantly increase the size and scope of our business, including our market capitalization. To the extent we issue any additional equity securities, the ownership of our existing stockholders would be diluted and our earnings per share could be reduced. As of December 31, 2010, there were warrants outstanding for purchase of 24,479,513 shares of our common stock. The warrants give the holders the right to purchase our common stock at the following prices: $2.45 (6,328,793 shares), $2.56 (460,976 shares), and $2.50 (17,6 89,744 shares). The remaining warrants expire in June and August 2014. See Note 9 of Notes to Consolidated Financial Statements.
The issuance of additional shares of our preferred stock or common stock in the future could adversely affect holders of common stock.
The market price of our common stock is likely to be influenced by our preferred stock. For example, the market price of our Common Stock could become more volatile and could be depressed by our failure to pay dividends on our currently outstanding Series B Preferred Stock, which would prevent us from paying dividends to holders of our common stock.
In addition, our board of directors is authorized to issue additional classes or series of preferred stock without any action on the part of our stockholders. This includes the power to set the terms of any such classes or series of preferred stock that may be issued, including voting rights, dividend rights and preferences over common stock with respect to dividends or upon the liquidation, dissolution or winding up of the business and other terms. If we issue preferred stock in the future that has preference over our common stock with respect to the payment of dividends or upon liquidation, dissolution or winding up, or if we issue preferred stock with voting rights that dilute the voting power of our common stock, the rights of holders of the common stock or the market price of the common st ock could be adversely affected.
We may issue substantial additional shares of common stock or other securities in connection with acquisitions, strategic transactions or for other purposes, including funding of our obligations under any settlement of litigation or other claims, to the extent permitted by our credit facility. Any such acquisition could be material to us and could significantly increase the size and scope of our business. Issuances or sales of substantial amounts of additional common stock or the perception that such issuances or sales could occur may cause prevailing market prices for our common stock to decline and could result in dilution to our stockholders.
As noted above, as of December 31, 2010, there were warrants outstanding to purchase a total of 24,479,513 shares of our common stock.
As described in Note 19 to Notes to Consolidated Financial Statements, we issued 18.9 million shares of our common stock in January of 2011 in connection with conversion of our 6.5% Mandatory Convertible Preferred Stock.
If a large number of shares of our common stock are sold in the public market, the sales could reduce the trading price of our common stock, impede our ability to raise future capital.
We cannot predict what effect, if any, future issuances by us of our common stock or other equity will have on the market price of our common stock. In addition, shares of our common stock that we issue in connection with an acquisition may not be subject to resale restrictions. We may issue substantial additional shares of common stock or other securities in connection with material acquisition transactions or for other purposes, including funding of our obligations under any settlement of litigation or other claims. The market price of our common stock could decline if certain large holders of our common stock, or recipients of our common stock, sell all or a significant portion of their shares of common stock or are perceived by the market as intending to sell these shares other than in an orderly manner. In addi tion, these sales could also impair our ability to raise capital through the sale of additional common stock in the capital markets.
The provisions in our certificate of incorporation, our by-laws and Delaware law could delay or deter tender offers or takeover attempts that may offer a premium for our common stock.
The provisions in our certificate of incorporation, our by-laws and Delaware law could make it more difficult for a third party to acquire control of us, even if that transaction would be beneficial to stockholders. These impediments include:
| | · | the classification of our board of directors into three classes serving staggered three-year terms, which makes it more difficult to quickly replace board members; |
| | · | the ability of our board of directors to issue shares of preferred stock with rights as it deems appropriate without stockholder approval; |
| | · | a provision that special meetings of our board of directors may be called only by our chief executive officer or a majority of our board of directors; |
| | · | a provision that special meetings of stockholders may only be called pursuant to a resolution approved by a majority of our entire board of directors; |
| | · | a prohibition against action by written consent of our stockholders; |
| | · | a provision that our board members may only be removed for cause and by an affirmative vote of at least 80% of the outstanding voting stock; |
| | · | a provision that our stockholders comply with advance-notice provisions to bring director nominations or other matters before meetings of our stockholders; |
| | · | a prohibition against certain business combinations with an acquirer of 15% or more of our common stock for three years after such acquisition unless the stock acquisition or the business combination is approved by our board prior to the acquisition of the 15% interest, or after such acquisition our board and the holders of two-thirds of the other common stock approve the business combination; and |
| | · | a prohibition against our entering into certain business combinations with interested stockholders without the affirmative vote of the holders of at least 80% of the voting power of the then outstanding shares of voting stock. |
The existence of these provisions may deprive stockholders of an opportunity to sell our stock at a premium over prevailing prices. The potential inability of our stockholders to obtain a control premium could adversely affect the market price for our common stock.
If we cannot meet the New York Stock Exchange continued listing requirements, the NYSE may delist our common stock.
Our common stock is currently listed on the NYSE. In the future, if we are not be able to meet the continued listing requirements of the NYSE, which require, among other things, that the average closing price of our common stock be above $1.00 over 30 consecutive trading days, our common stock may be delisted. Our closing stock price on February 22, 2011 was $10.40. The closing price of our common stock was last below $1.00 for over 30 consecutive trading days was during the second quarter of 2001.
If we are unable to satisfy the NYSE criteria for continued listing, our common stock would be subject to delisting. A delisting of our common stock could negatively impact us by, among other things, reducing the liquidity and market price of our common stock; reducing the number of investors willing to hold or acquire our common stock, which could negatively impact our ability to raise equity financing; decreasing the amount of news and analyst coverage for the Company; and limiting our ability to issue additional securities or obtain additional financing in the future. In addition, delisting from the NYSE might negatively impact our reputation and, as a consequence, our business.
Item 1B. Unresolved Staff Comments
None.
Item 2. Property Descriptions
OPERATING PROPERTIES
The Greens Creek Unit
Our various subsidiaries own 100% of the Greens Creek Mine, located in Southeast Alaska, which has been in production since 1989, with a temporary care and maintenance period from April 1993 through July 1996. Since the start of production, Greens Creek has been owned and operated through various joint venture arrangements involving a variety of partners, including us. For approximately 15 years prior to April 16, 2008, our wholly-owned subsidiary, Hecla Alaska LLC, owned an undivided 29.7% joint venture interest in the assets of Greens Creek. On April 16, 2008, we completed the acquisition of all of the equity of two Rio Tinto subsidiaries holding a 70.3% interest in the Greens Creek mine for approximately $758.5 million. The acquisition gives our various subsidiaries con trol of 100% of the Greens Creek mine.
The Greens Creek orebody contains silver, zinc, gold and lead, and lies adjacent to the Admiralty Island National Monument, an environmentally sensitive area. The Greens Creek property includes 17 patented lode claims and one patented mill site claim, in addition to property leased from the U.S. Forest Service. Greens Creek also has title to mineral rights on 7,500 acres of federal land adjacent to the properties. The entire project is accessed by boat and served by 13 miles of road and consists of the mine, an ore concentrating mill, a tailings impoundment area, a ship-loading facility, camp facilities and a ferry dock. The map below illustrates the location and access to Greens Creek:

The Greens Creek deposit is a polymetallic, stratiform, massive sulfide deposit. The host rock consists of predominantly marine sedimentary, and mafic to ultramafic volcanic and plutonic rocks, which have been subjected to multiple periods of deformation. These deformational episodes have imposed intense tectonic fabrics on the rocks. Mineralization occurs discontinuously along the contact between a structural hanging wall of quartz mica carbonate phyllites and a structural footwall of graphitic and calcareous argillite. Major sulfide minerals are pyrite, sphalerite, galena, and tetrahedrite/tennanite.
Pursuant to a 1996 land exchange agreement, the joint venture transferred private property equal to a value of $1.0 million to the U.S. Forest Service and received exploration and mining rights to approximately 7,500 acres of land with mining potential surrounding the existing mine. Production from new ore discoveries on the exchanged lands will be subject to federal royalties included in the land exchange agreement. The royalty is only due on production from reserves that are not part of Greens Creek’s extralateral rights. Thus far, there has been no production triggering payment of the royalty. The royalty is 3% if the average value of the ore during a year is greater than $120 per ton of ore, and 0.75% if the value is $120 per ton or less. The benchmark of $120 per ton is adjusted annually according to the Gross Domestic Product (GDP) Implicit Price Deflator until the year 2016, and at December 31, 2010, was at approximately $160 per ton when applying the latest GDP Implicit Price Deflator observation.
Greens Creek is an underground mine which produces approximately 2,200 tons of ore per day. The primary mining methods are cut and fill and longhole stoping. The ore is processed on site at a mill, which produces lead, zinc and bulk concentrates, as well as gold doré. In 2010, ore was processed at an average rate of approximately 2,193 tons per day. During 2010, mill recovery totaled approximately 73% silver, 78% zinc, 68% lead and 64% gold. The doré is further refined by precious metal refiners and sold to banks, and the three concentrate products are sold to a number of major smelters worldwide. See Note 11 of Notes to Consolidated Financial Statements for information on the significant customers for Greens Creek’s products. Concentrates are shipped from a marine terminal located on Admiralty Island about nine miles from the mine site.
Electricity for the Greens Creek unit has historically been provided by diesel generators located on site. However, an agreement was reached during 2005 to purchase excess hydroelectric power from the local power company, Alaska Electric Light and Power Company (“AEL&P”). Installation of the necessary infrastructure was completed in 2006, and use of hydroelectric power commenced during the third quarter of 2006. The infrastructure is also used to provide power to surrounding communities. This project has reduced production costs at Greens Creek to the extent power has been available. Low lake levels and increased demand in the Juneau area combined to restrict the amount of power available to Greens Creek prior to 2009. In 2009 and 2010, the mine received an increased proportion of its power needs from AEL&P. However, when weather conditions are not favorable to maintain lake water levels, the mine relies on diesel generated power.
The employees at Greens Creek are employees of Hecla Greens Creek Mining Company, our wholly-owned subsidiary, and are not represented by a bargaining agent. There were 343 employees at the Greens Creek unit at December 31, 2010.
As of December 31, 2010, we have recorded a $35.3 million asset retirement obligation for reclamation and closure costs. We maintain a $30 million reclamation bond secured by the restricted cash balance of $7.6 million for Greens Creek. The net book value of the Greens Creek unit property and its associated plant, equipment and mineral interests was approximately $670 million as of December 31, 2010.
Information with respect to production, average costs per ounce of silver produced and proven and probable ore reserves is set forth in the following table, and represents our 100% ownership of Greens Creek after April 16, 2008, and our previous 29.7% ownership prior to that date.
| | | Years Ended December 31, | |
| Production | | 2010 | | | 2009 | | | 2008 | |
| Ore milled (tons) | | | 800,397 | | | | 790,871 | | | | 598,931 | |
| Silver (ounces) | | | 7,206,973 | | | | 7,459,170 | | | | 5,829,253 | |
| Gold (ounces) | | | 68,838 | | | | 67,278 | | | | 54,650 | |
| Zinc (tons) | | | 74,496 | | | | 70,379 | | | | 52,055 | |
| Lead (tons) | | | 25,336 | | | | 22,253 | | | | 16,630 | |
| | | | | | | | | | | | | |
Average Cost per Ounce of Silver Produced (1) | | | | | | | | | | | | |
| Total cash costs | | $ | (3.90 | ) | | $ | 0.35 | | | $ | 3.29 | |
| Total production costs | | $ | 3.36 | | | $ | 7.65 | | | $ | 8.52 | |
| | | | | | | | | | | | | |
Probable Ore Reserves (2,3,4,5,6,7) | | | | | | | | | | | | |
| Total tons | | | 8,243,100 | | | | 8,314,700 | | | | 8,064,700 | |
| Silver (ounces per ton) | | | 12.1 | | | | 12.1 | | | | 13.7 | |
| Gold (ounces per ton) | | | 0.09 | | | | 0.10 | | | | 0.11 | |
| Zinc (percent) | | | 9.3 | | | | 10.3 | | | | 10.5 | |
| Lead (percent) | | | 3.5 | | | | 3.6 | | | | 3.8 | |
| Contained silver (ounces) | | | 99,730,000 | | | | 100,973,300 | | | | 110,583,200 | |
| Contained gold (ounces) | | | 757,000 | | | | 847,400 | | | | 870,100 | |
| Contained zinc (tons) | | | 766,500 | | | | 852,900 | | | | 850,700 | |
| Contained lead (tons) | | | 291,300 | | | | 303,300 | | | | 308,700 | |
| (1) | Includes by-product credits from gold, lead and zinc production. Cash costs per ounce of silver represent measurements that are not in accordance with GAAP that management uses to monitor and evaluate the performance of our mining operations. We believe cash costs per ounce of silver provide an indicator of economic performance and efficiency at each location and on a consolidated basis, as well as providing a meaningful basis to compare our results to those of other mining companies and other mining operating properties. A reconciliation of this non-GAAP measure to cost of sales and other direct production costs and depreciation, depletion and amortization, the most comparable GAAP measure, can be found in Item 7. — MD&A, under Reconciliation of Total Cash Costs (non-GAAP) to Costs of Sales and O ther Direct Production Costs and Depreciation, Depletion and Amortization (GAAP). |
| (2) | Estimates of proven and probable ore reserves for the Greens Creek unit as of December 2010, 2009 and 2008 are calculated and reviewed in-house and are derived from successive generations of reserve and feasibility analyses for different areas of the mine, using a separate assessment of metals prices for each year. The average prices used for the Greens Creek unit were: |
| | | December 31, | |
| | | 2010 | | | 2009 | | | 2008 | |
| Silver (per ounce) | | $ | 16.00 | | | $ | 13.75 | | | $ | 12.25 | |
| Gold (per ounce) | | $ | 950 | | | $ | 775 | | | $ | 650 | |
| Lead (per pound) | | $ | 0.80 | | | $ | 0.70 | | | $ | 0.80 | |
| Zinc (per pound) | | $ | 0.80 | | | $ | 0.70 | | | $ | 0.80 | |
| (3) | Ore reserves represent in-place material, diluted and adjusted for expected mining recovery. Mill recoveries of ore reserve grades differ by ore zones and are expected to average 74% for silver, 68% for gold, 77% for zinc and 73% for lead. |
| (4) | The changes in reserves in 2010 versus 2009 are due to the lower ore grades combined with continued depletion of the deposit, partially offset by increases in forecasted metals prices and additional drilling at the East ore zone. The changes in reserves in 2009 versus 2008 were due to lower anticipated ore grades and depletion due to production, partially offset by the addition of new drill data and increases in forecasted precious metals prices. |
| (5) | We only report probable reserves at the Greens Creek unit, which are based on average drill spacing of 50 to 100 feet. Proven reserves typically require that mining samples are partly the basis of the ore grade estimates used, while probable reserve grade estimates can be based entirely on drilling results. Cutoff grade assumptions vary by orebody and are developed based on reserve prices, anticipated mill recoveries and smelter payables and cash operating costs. Due to multiple ore metals, and complex combinations of ore types, metal ratios and metallurgical performances at Greens Creek, the cutoff grade is expressed in terms of net smelter return (“NSR”), rather than metal grade. The cutoff grade was $100 per ton NSR. |
| (6) | Greens Creek ore reserve estimates were prepared by Lourens Smuts, Senior Resource Geologist at the Greens Creek unit and reviewed by John Taylor, Senior Resource Geologist at Hecla Limited. |
| (7) | An independent review by AMEC E&C, Inc. was completed in 2010 for the 2009 reserve models for the 5250 and 9A zones. |
The Lucky Friday Unit
Since 1958, we have owned and operated the Lucky Friday unit, a deep underground silver, lead and zinc mine located in the Coeur d’Alene Mining District in northern Idaho. Lucky Friday is one-quarter mile east of Mullan, Idaho, and is adjacent to U.S. Interstate 90. Below is a map illustrating the location and access to the Lucky Friday unit:
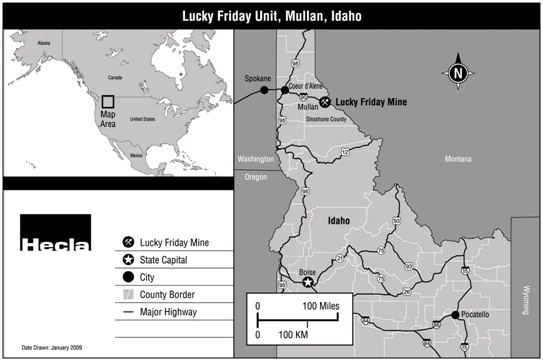
There have been two ore-bearing structures mined at the Lucky Friday unit. The first, mined through 2001, was the Lucky Friday vein, a fissure vein typical of many in the Coeur d’Alene Mining District. The ore body is located in the Revett Formation, which is known to provide excellent host rocks for a number of ore bodies in the Coeur d’Alene Mining District. The Lucky Friday vein strikes northeasterly and dips steeply to the south with an average width of six to seven feet. Its principal ore minerals are galena and tetrahedrite with minor amounts of sphalerite and chalcopyrite. The ore occurs as a single continuous ore body in and along the Lucky Friday vein. The major part of the ore body has extended from 1,200-feet to 6,020 feet below surface.
The second ore-bearing structure, known as the Lucky Friday Expansion Area, has been mined since 1997 pursuant to an operating agreement with Silver Hunter Mining Company (“Silver Hunter”), our wholly owned subsidiary. During 1991, we discovered several mineralized structures containing some high-grade silver ores in an area known as the Gold Hunter property, approximately 5,000 feet northwest of the then existing Lucky Friday workings. This discovery led to the development of the Gold Hunter property on the 4900 level. On November 6, 2008, we, through Silver Hunter, completed the acquisition of substantially all of the assets of Independence Lead Mines Company (“Independence”), including all future interest or royalty obligation to Independence and the mining claims pertaining to the operating agreement with Hecla Limited that was assigned to Silver Hunter (see Note 17 of Notes to Consolidated Financial Statements for further discussion).
The principal mining method at the Lucky Friday unit is ramp access, cut and fill. This method utilizes rubber-tired equipment to access the veins through ramps developed outside of the ore body. Once a cut is taken along the strike of the vein, it is backfilled with cemented tailings and the next cut is accessed, either above or below, from the ramp system.
The ore produced from Lucky Friday is processed in a conventional flotation mill, which produces both a lead concentrate and a zinc concentrate. In 2010, ore was processed at an average rate of approximately 960 tons per day. During 2010, mill recovery totaled approximately 93% silver, 93% lead and 87% zinc. All silver-lead and zinc concentrate production during 2010 was shipped to Teck Cominco Limited’s smelter in Trail, British Columbia, Canada.
Information with respect to the Lucky Friday unit’s production, average cost per ounce of silver produced and proven and probable ore reserves for the past three years is set forth in the table below.
| | | Years Ended December 31, | |
| Production | | 2010 | | | 2009 | | | 2008 | |
| Ore milled (tons) | | | 351,074 | | | | 346,395 | | | | 317,777 | |
| Silver (ounces) | | | 3,359,379 | | | | 3,530,490 | | | | 2,880,264 | |
| Lead (tons) | | | 21,619 | | | | 22,010 | | | | 18,393 | |
| Zinc (tons) | | | 9,286 | | | | 10,616 | | | | 9,386 | |
| | | | | | | | | | | | | |
Average Cost per Ounce of Silver Produced (1) | | | | | | | | | | | | |
| Total cash costs | | $ | 3.76 | | | $ | 5.21 | | | $ | 6.06 | |
| Total production costs | | $ | 6.25 | | | $ | 8.02 | | | $ | 7.87 | |
| | | | | | | | | | | | | |
Proven Ore Reserves (2,3,4) | | | | | | | | | | | | |
| Total tons | | | 1,642,100 | | | | 1,358,200 | | | | 1,270,000 | |
| Silver (ounces per ton) | | | 12.4 | | | | 12.3 | | | | 12.4 | |
| Lead (percent) | | | 7.8 | | | | 8.0 | | | | 7.8 | |
| Zinc (percent) | | | 2.8 | | | | 2.6 | | | | 2.5 | |
| Contained silver (ounces) | | | 20,387,600 | | | | 16,640,300 | | | | 15,800,800 | |
| Contained lead (tons) | | | 128,000 | | | | 109,100 | | | | 98,700 | |
| Contained zinc (tons) | | | 46,000 | | | | 35,100 | | | | 31,600 | |
| | | | | | | | | | | | | |
Probable Ore Reserves (2,3,4) | | | | | | | | | | | | |
| Total tons | | | 1,545,100 | | | | 1,577,000 | | | | 523,400 | |
| Silver (ounces per ton) | | | 14.2 | | | | 13.9 | | | | 11.6 | |
| Lead (percent) | | | 8.9 | | | | 8.9 | | | | 6.5 | |
| Zinc (percent) | | | 3.0 | | | | 2.9 | | | | 2.7 | |
| Contained silver (ounces) | | | 21,955,000 | | | | 21,947,600 | | | | 6,046,800 | |
| Contained lead (tons) | | | 136,800 | | | | 140,300 | | | | 33,900 | |
| Contained zinc (tons) | | | 46,500 | | | | 46,100 | | | | 14,300 | |
| | | | | | | | | | | | | |
Total Proven and Probable Ore Reserves (2,3,4,5,6) | | | | | | | | | | | | |
| Total tons | | | 3,187,200 | | | | 2,935,200 | | | | 1,793,400 | |
| Silver (ounces per ton) | | | 13.3 | | | | 13.1 | | | | 12.2 | |
| Lead (percent) | | | 8.3 | | | | 8.5 | | | | 7.4 | |
| Zinc (percent) | | | 2.9 | | | | 2.8 | | | | 2.6 | |
| Contained silver (ounces) | | | 42,342,600 | | | | 38,587,900 | | | | 21,847,500 | |
| Contained lead (tons) | | | 264,900 | | | | 249,400 | | | | 132,600 | |
| Contained zinc (tons) | | | 92,500 | | | | 81,200 | | | | 45,900 | |
| (1) | Includes by-product credits from lead and zinc production. Cash costs per ounce of silver represent measurements that are not in accordance with GAAP that management uses to monitor and evaluate the performance of our mining operations. We believe cash costs per ounce of silver provide an indicator of economic performance and efficiency at each location and on a consolidated basis, as well as providing a meaningful basis to compare our results to those of other mining companies and other mining operating properties. A reconciliation of this non-GAAP measure to cost of sales and other direct production costs and depreciation, depletion and amortization, the most comparable GAAP measure, can be found in Item 7. — Management’s Discussion and Analysis of Financial Condition and Results of Operations, under Reconciliation of Total Cash Costs (non-GAAP) to Costs of Sales and Other Direct Production Costs and Depreciation, Depletion and Amortization (GAAP). |
| (2) | Proven and probable ore reserves are calculated and reviewed in-house and are subject to periodic audit by others, although audits are not performed on an annual basis. Cutoff grade assumptions vary by ore body and are developed based on reserve prices, anticipated mill recoveries and smelter payables and cash operating costs. Due to multiple ore metals, and complex combinations of ore types, metal ratios and metallurgical performances at the Lucky Friday, the cutoff grade is expressed in terms of net smelter return (“NSR”), rather than metal grade. The cutoff grade at the Lucky Friday ranges from $72 per ton NSR to $87 per ton NSR. Our estimates of proven and probable reserves are based on the following metals prices: |
| | | December 31, | |
| | | 2010 | | | 2009 | | | 2008 | |
| Silver (per ounce) | | $ | 16.00 | | | $ | 13.75 | | | $ | 12.25 | |
| Lead (per pound) | | $ | 0.80 | | | $ | 0.70 | | | $ | 0.80 | |
| Zinc (per pound) | | $ | 0.80 | | | $ | 0.70 | | | $ | 0.80 | |
| (3) | Reserves are in-place materials that incorporate estimates of the amount of waste that must be mined along with the ore and expected mining recovery. Mill recoveries are expected to be 94% for silver, 93% for lead and 89% for zinc. Zinc recovery has improved from historical levels due to mill upgrades completed during 2007, 2006 and 2005. |
| (4) | The changes in reserves in 2010 versus 2009, and in 2009 versus 2008, are due to addition of data from new drill holes and development work, higher anticipated ore grades, and increases in forecasted metals prices, which has resulted in the addition of new reserves based on updated estimates, partially offset by depletion due to production. The change in reserves in 2010 versus 2009 is also attributed to potential expansion of the mine plan resulting from deeper access beyond the current workings due to anticipated construction of the #4 Shaft. |
| (5) | Lucky Friday ore reserve estimates were prepared by Terry DeVoe, Chief Geologist at the Lucky Friday unit and reviewed by John Taylor, Senior Resource Geologist at Hecla Limited. |
| (6) | An independent audit by Scott Wilson Roscoe Postle Associates Inc. was completed in January 2010 for the 2009 reserve model at the Lucky Friday mine. |
During 2008, we initiated engineering, procurement and development activities relating to construction of #4 Shaft at the Lucky Friday mine, which, upon completion, would provide access from the 4900 level down to the 8800 of the mine. The project was temporarily placed on hold in the fourth quarter of 2008 due to then prevailing metals prices. However, detailed engineering, long lead time procurement, and other early-stage activities for the internal shaft project resumed in 2009. Activities in 2010 included engineering, erection of a surface concrete batch plant, and work on #4 Shaft, including: detailed shaft design, excavation of the hoist room and off shaft development access to shaft facilities, placement and receipt of orders for major equipment purchases, and other early cons truction activities. Upon completion, #4 Shaft would allow us to mine mineralized material below our current workings and provide deeper platforms for exploration. Construction of #4 Shaft would take approximately four more years to complete, and capital expenditures for the project would total approximately $200 million, including approximately $50 million spent on the project through December 31, 2010. Our management currently expects to seek final approval of the project by the Board of Directors in the first half of 2011. We believe that our current capital resources will allow us to proceed. However, there are a number of factors that could affect final approval of the project, including: a significant decline in metals prices, a significant increase in operating or capital costs, or our inability to successfully settle or otherwise manage our potential environmental liabilities relating to historical mining activities in the Coeur d̵ 7;Alene Basin. An increase in the capital cost could potentially require us to suspend the project or access additional capital though debt financing, the sale of securities, or other external sources. This additional financing could be costly or unavailable.
Ultimate reclamation activities are anticipated to include stabilization of tailings ponds and waste rock areas. No final reclamation activities were performed in 2010, and at December 31, 2010, an asset retirement obligation of approximately $1.6 million had been recorded for reclamation and closure costs. The net book value of the Lucky Friday unit property and its associated plant, equipment and mineral interests was approximately $148 million as of December 31, 2010. The construction of the facilities at Lucky Friday ranges from the 1950s to 2010. The plant is maintained by our employees with assistance from outside contractors as required.
At December 31, 2010, there were 274 employees at the Lucky Friday unit. United Steel, Paper and Forestry, Rubber, Manufacturing, Energy, Allied Industrial, and Service Workers International Union is the bargaining agent for the Lucky Friday’s 216 hourly employees. The current labor agreement expires on April 30, 2016.
Avista Corporation supplies electrical power to the Lucky Friday unit.
Item 3. Legal Proceedings
For a discussion of our legal proceedings, see Note 7 of Notes to Consolidated Financial Statements.
PART II
| Item 5. | Market for Registrant’s Common Equity, Related Stockholder Matters and Issuer Purchases of Equity Securities |
| (a) | (i) | Shares of our common stock are traded on the New York Stock Exchange, Inc. |
| | (ii) | Our common stock quarterly high and low sale prices for the past two years were as follows: |
| | | | Fourth Quarter | | | Third Quarter | | | Second Quarter | | | First Quarter | |
| 2010 | – High | | $ | 11.52 | | | $ | 6.44 | | | $ | 6.47 | | | $ | 6.99 | |
| | – Low | | $ | 6.20 | | | $ | 4.52 | | | $ | 4.86 | | | $ | 4.27 | |
| 2009 | – High | | $ | 7.47 | | | $ | 5.04 | | | $ | 3.89 | | | $ | 2.95 | |
| | – Low | | $ | 3.79 | | | $ | 2.26 | | | $ | 1.85 | | | $ | 1.17 | |
| (b) | As of February 22, 2011, there were 7,172 shareholders of record of the common stock. |
| (c) | Quarterly dividends were paid on our Series B and 6.5% Mandatory Convertible Preferred Stock for 2010, and no dividends are in arrears. All outstanding shares of our 6.5% Mandatory Convertible Preferred Stock converted to common stock on January 1, 2011. On January 4, 2010, we paid all cumulative, unpaid dividends on both our Series B and 6.5% Mandatory Convertible Preferred Stock. No dividends have been declared on our common stock since 1990. We cannot pay dividends on our common stock if we fail to pay dividends on our Series B Preferred Stock. Prior to January 2010, quarterly dividends were paid on our Series B Preferred Stock through the first three quarters of 2008, with $0.7 million for cumulative, unpaid dividends at December 31, 2009 for the fourth quarter 2008 and year ended December 31, 2009. Prior to January 2010, dividends were paid on our 6.5% Mandatory Convertible Preferred Stock through the first three quarters of 2008, with cumulative, unpaid dividends of $16.5 million at December 31, 2009 for the fourth quarter of 2008 and year ended December 31, 2009. The $0.7 million in dividends paid in January 2010 on our Series B Preferred Stock were paid in cash, while the $16.5 million in dividends on our 6.5% Mandatory Convertible Preferred Stock were paid in shares of our common stock. |
| (d) | The following table provides information as of December 31, 2010, regarding our compensation plans under which equity securities are authorized for issuance: |
| | | Number of Securities To Be Issued Upon Exercise of Outstanding Options, Warrants and Rights | | | Weighted-Average Exercise Price of Outstanding Options | | | Number of Securities Remaining Available For Future Issuance Under Equity Compensation Plans | |
| Equity Compensation Plans Approved by Security Holders: | | | | | | | | | |
| 2010 Stock Incentive Plan | | | 14,663 | | | | 5.94 | | | | 19,911,631 | |
| 1995 Stock Incentive Plan | | | 1,255,001 | | | | 6.69 | | | | - | |
| Stock Plan for Nonemployee Directors | | | - | | | | N/A | | | | 671,061 | |
| Key Employee Deferred Compensation Plan | | | - | | | | N/A | | | | 2,409,447 | |
| Total | | | 1,269,664 | | | | 6.68 | | | | 22,992,139 | |
See Notes 8 and 9 of Notes to Consolidated Financial Statements for information regarding the above plans.
| (e) | We did not sell any unregistered securities in 2010. However, we did issue 604,555 and 631,832 shares of common stock on April 1 and July 1, 2010, respectively, as payment of the quarterly dividend on our formerly outstanding 6.5% Mandatory Convertible Preferred Stock. During 2008 and 2009, we issued unregistered securities as follows: |
| | a. | On January 17, 2008, we issued 550,000 unregistered shares of common stock to fund our donation to the Hecla Charitable Foundation. |
| | b. | On January 24, 2008, we issued 118,333 unregistered shares of common stock in a private placement pursuant to section 4(2) of the 1933 Act and Regulation D to an accredited investor to acquire properties in the Silver Valley of Northern Idaho. |
| | c. | On February 21, 2008, we issued 927,716 unregistered shares of common stock in a private placement pursuant to section 4(2) of the 1933 Act and Regulation D to an accredited investor to acquire a joint venture interest (see Note 18 of Notes to Consolidated Financial Statements). |
| | d. | On April 16, 2008, we issued 4,365,000 unregistered shares of common stock in a private placement pursuant to section 4(2) of the 1933 Act and Regulation D to an accredited investor to partially fund our acquisition of the remaining 70.3% interest in the Greens Creek Joint Venture (see Note 18 of Notes to Consolidated Financial Statements). |
| | e. | On October 24, 2008, we issued 633,360 unregistered shares of common stock in a private placement pursuant to section 4(2) of the 1933 Act and Regulation D to an accredited investor as the result of an amendment to a joint venture buy-in agreement (see Note 18 of Notes to Consolidated Financial Statements). |
| | f. | On February 10, 2009, we issued 42,621 unregistered shares of our 12% Convertible Preferred Stock to our various lenders listed in the Fourth Amendment to our Credit Agreement filed as exhibit 10.5 to our Current Report on Form 8-K filed on February 4, 2009. The shares were not registered under the Securities Act of 1933 in reliance on Section 4(2) of such Act and Regulation D thereunder and issued as a fee to the lenders for the deferral of principal payments under the Fourth Amendment. |
| | g. | On June 4, 2009, we issued unregistered equity securities in a private placement pursuant to Section 4(2) of the Securities Act of 1933 Act and Regulation D thereunder to accredited investors. The securities consist of 17,391,302 shares of our common stock and Series 4 Warrants to purchase 12,173,913 shares of our common stock. The Series 4 Warrants had an exercise price of $3.68 per share, subject to certain adjustments. They became exercisable on December 7, 2009 and remained exercisable during the 181 day period following that date. The proceeds from the issuance were used to repay a portion of the prior outstanding balance on our amended and restated credit facility. |
| (f) | Comparison of Five-Year Cumulative Total Shareholder Return—December 2005 through December 2010(1): |
Hecla Mining Company, S&P 500, S&P 500 Gold Index, and Custom Peer Group(2,3)
| Date | | Hecla Mining | | | S&P 500 | | | S&P 500 Gold Index | | | 2009 Old Peer Group 2 | | | 2010 New Peer Group 3 | |
| | | | | | | | | | | | | | | | |
| December 2005 | | $ | 100.00 | | | $ | 100.00 | | | $ | 100.00 | | | $ | 100.00 | | | $ | 100.00 | |
| December 2006 | | $ | 188.67 | | | $ | 115.80 | | | $ | 85.23 | | | $ | 123.22 | | | $ | 140.63 | |
| December 2007 | | $ | 230.30 | | | $ | 122.16 | | | $ | 93.02 | | | $ | 117.78 | | | $ | 150.37 | |
| December 2008 | | $ | 68.97 | | | $ | 76.96 | | | $ | 78.30 | | | $ | 76.04 | | | $ | 115.15 | |
| December 2009 | | $ | 152.22 | | | $ | 97.33 | | | $ | 91.83 | | | $ | 155.25 | | | $ | 179.83 | |
| December 2010 | | $ | 277.34 | | | $ | 111.99 | | | $ | 120.26 | | | $ | 227.12 | | | $ | 251.67 | |
| (1) | Total shareholder return assuming $100 invested on December 31, 2005 and reinvestment of dividends on quarterly basis. |
| (2) | Agnico-Eagle Mines Ltd., Centerra Gold, Inc., Coeur d’Alene Mines Corp., Eldorado Gold Corp., Gammon Gold Inc., Golden Star Resources Ltd., IAMGOLD Corporation, Northgate Minerals Corporation, Pan American Silver Corp., Stillwater Mining Company |
| (3) | Centerra Gold, Inc., Coeur d’Alene Mines Corp., Eldorado Gold Corp., Gammon Gold Inc., Golden Star Resources Ltd., IAMGOLD Corporation, New Gold Inc., Northgate Minerals Corporation, Pan American Silver Corp., Stillwater Mining Company. The changes in our 2010 peer group compared to the 2009 peer group were to add New Gold Inc. and exclude Agnico-Eagle Mines Ltd. These changes were made in order to limit the peer group to companies that are included within with what we have determined to be an acceptable revenue range. |
Item 6. Selected Financial Data
The following table (in thousands, except per share amounts, common shares issued, shareholders of record, and employees) sets forth selected historical consolidated financial data as of and for each of the years ended December 31, 2006 through 2010, and is derived from our audited financial statements. The data set forth below should be read in conjunction with, and is qualified in its entirety by, our Consolidated Financial Statements and the Notes thereto.
| | | 2010 (3) | | | 2009 (3) | | | 2008 (3) | | | 2007 (3) | | | 2006 (3) | |
| Sales of products | | $ | 418,813 | | | $ | 312,548 | | | $ | 204,665 | | | $ | 157,640 | | | $ | 126,108 | |
| Net income (loss) from continuing operations | | $ | 48,983 | | | $ | 67,826 | | | $ | (37,173 | ) | | $ | 68,157 | | | $ | 64,788 | |
Income (loss) from discontinued operations, net of tax (4) | | $ | --- | | | $ | --- | | | $ | (17,395 | ) | | $ | (14,960 | ) | | $ | 4,334 | |
Loss on disposal of discontinued operations, net of tax (4) | | $ | --- | | | $ | --- | | | $ | (11,995 | ) | | $ | --- | | | $ | --- | |
| (Net income (loss) | | $ | 48,983 | | | $ | 67,826 | | | $ | (66,563 | ) | | $ | 53,197 | | | $ | 69,122 | |
Preferred stock dividends (1,2) | | $ | (13,633 | ) | | $ | (13,633 | ) | | $ | (13,633 | ) | | $ | (1,024 | ) | | $ | (552 | ) |
| Income (loss) applicable to common shareholders | | $ | 35,350 | | | $ | 54,193 | | | $ | (80,196 | ) | | $ | 52,173 | | | $ | 68,570 | |
| Basic income (loss) per common share | | $ | 0.14 | | | $ | 0.24 | | | $ | (0.57 | ) | | $ | 0.43 | | | $ | 0.57 | |
| Diluted income (loss) per common share | | $ | 0.13 | | | $ | 0.23 | | | $ | (0.57 | ) | | $ | 0.43 | | | $ | 0.57 | |
| Total assets | | $ | 1,382,493 | | | $ | 1,046,784 | | | $ | 988,791 | | | $ | 650,737 | | | $ | 346,269 | |
| Accrued reclamation & closure costs | | $ | 318,797 | | | $ | 131,201 | | | $ | 121,347 | | | $ | 106,139 | | | $ | 65,904 | |
| Noncurrent portion of debt and capital leases | | $ | 3,792 | | | $ | 3,281 | | | $ | 113,649 | | | $ | --- | | | $ | --- | |
| Cash dividends paid per common share | | $ | --- | | | $ | --- | | | $ | --- | | | $ | --- | | | $ | --- | |
Cash dividends paid per Series B preferred share (1) | | $ | 7.00 | | | $ | --- | | | $ | 3.50 | | | $ | 3.50 | | | $ | 3.50 | |
Cash dividends paid per 6.5% Mandatory Convertible Preferred share (2) | | $ | 1.69 | | | $ | --- | | | $ | 3.48 | | | $ | --- | | | $ | --- | |
| Common shares issued and outstanding | | | 258,485,666 | | | | 238,335,526 | | | | 180,461,371 | | | | 121,456,837 | | | | 119,828,707 | |
| 6.5% Mandatory Convertible Preferred shares issued | | | 2,012,500 | | | | 2,012,500 | | | | 2,012,500 | | | | 2,012,500 | | | | --- | |
| Series B Preferred shares issued | | | 157,816 | | | | 157,816 | | | | 157,816 | | | | 157,816 | | | | 157,816 | |
| Shareholders of record | | | 7,388 | | | | 7,647 | | | | 7,936 | | | | 6,598 | | | | 6,815 | |
| Employees | | | 686 | | | | 656 | | | | 742 | | | | 871 | | | | 1,155 | |
______________
| (1) | During 2006 and 2007, $0.6 million in Series B preferred dividends were declared and paid. During 2008, $0.4 million in Series B preferred dividends were declared and paid, while $0.1 million in dividends for the fourth quarter of 2008 were deferred. Series B preferred dividends for the first three quarters of 2009, which totaled $0.6 million, were also deferred. In December 2009, we declared all dividends in arrears on our Series B preferred stock of $0.6 million and the scheduled $0.1 dividend for the fourth quarter of 2009. These dividends were paid in cash in January 2010. Therefore, dividends declared on our Series B preferred shares of $0.7 million were included in the determination of income applicable to common shareholders for 2009 with no cash paid for Series B preferred dividends during 2009. We declared and paid all quarter ly dividends on our Series B preferred shares totaling $0.6 million for 2010. |
| (2) | Cumulative undeclared, unpaid 6.5% Mandatory Convertible Preferred Stock dividends for the period from issuance to December 31, 2007 totaled $0.5 million, and are reported in determining income applicable to common shareholders for the year ended December 31, 2007. The $0.5 million in cumulative undeclared dividends were paid in April 2008. During 2008, $9.8 million in 6.5% Mandatory Convertible Preferred dividends were declared and paid. $6.5 million of the dividends declared in 2008 were paid in cash, and are included in the amount reported as cash dividends paid per 6.5% Mandatory Convertible Preferred Share, and $3.3 million of the dividends declared in 2008 were paid in our Common Stock. 6.5% Mandatory Convertible Preferred Stock dividends for the fourth quarter of 2008 totaling $3.3 million were deferred. Dividends on our 6.5% Mandatory Convertible Pre ferred Stock totaling $9.8 million for the first three quarters of 2009 were deferred. In December 2009, we declared the $13.1 million in dividends in arrears on our 6.5% Mandatory Convertible Preferred Stock and the scheduled $3.3 million dividend for the fourth quarter of 2009. These dividends were paid in shares of our common stock in January 2010. Therefore, dividends declared on our 6.5% Mandatory Convertible Preferred Stock of $13.1 million were included in the determination of income applicable to common shareholders for 2009 with no cash paid for 6.5% Mandatory Convertible Preferred Stock dividends in 2009. We declared and paid all quarterly dividends on our 6.5% Mandatory Convertible Preferred Stock totaling $13.1 million for 2010. Dividends declared for the first and second quarters of 2010 were paid in shares of our common stock and dividends for the third and fourth quarters of 2010 were paid in cash. The cash dividend declared for the fourth quarter of 2010, which was paid in January 2011, represents the last dividend to be paid on the 6.5% Mandatory Convertible Preferred Stock, which automatically converted to shares of our common stock on January 1, 2011. |
| (3) | On April 16, 2008, we completed the acquisition of all of the equity of two Rio Tinto subsidiaries holding a 70.3% interest in the Greens Creek mine for approximately $758.5 million. The acquisition gives our various subsidiaries control of 100% of the Greens Creek mine. Our operating results reflect our 100% ownership of Greens Creek after April 16, 2008 and our 29.7% ownership of Greens Creek prior to that date. See Note 17 of Notes to Consolidated Financial Statements for further discussion of the acquisition. |
| (4) | On July 8, 2008, we completed the sale of all of the outstanding capital stock of El Callao Gold Mining Company and Drake-Bering Holdings B.V., our wholly owned subsidiaries which together owned our business and operations in Venezuela, the “La Camorra unit.” The results of the Venezuelan operations have been reported in discontinued operations for all periods presented. |
Item 7. Management’s Discussion and Analysis of Financial Condition and Results of Operations
Overview
Established in 1891 in northern Idaho’s Silver Valley, we believe we are the oldest precious metals mining company in the United States still operating and the largest silver producer in the U.S. Our corporate offices are in Coeur d’Alene, Idaho and Vancouver, British Columbia. Our production profile includes:
| | · | silver, gold, lead, and zinc contained in concentrates shipped to various smelters; and |
Our operating properties comprise our two business segments for financial reporting purposes: the Greens Creek operating unit on Admiralty Island in Alaska and the Lucky Friday operating unit in Idaho. Since both of our mines are located in the U.S., we believe they have low political risk, and less economic risk than mines located in other parts of the world. Our exploration interests are located in jurisdictions with low and relatively moderate political and economic risk in the United States and Mexico, respectively, and are located in historically successful mining districts.
Our operating and strategic framework is based on expanding our production and locating and developing new resource potential. In 2010, we
| | · | Attained record revenue of $418.8 million, gross profit of $194.8 million, and cash flow from operating activities of $198.3 million, surpassing 2009’s previous record levels as a result of higher metals prices. Our acquisition of the remaining 70.3% interest of the Greens Creek Mine near Juneau, Alaska in 2008 also contributed to our performance in both years. |
| | · | Committed a record level of capital investment at our existing operations, with capital expenditures in 2010 totaling approximately $70.9 million, including $53.3 million at Lucky Friday and $16.3 million at Greens Creek. We advanced preliminary work on construction of an internal shaft at the Lucky Friday unit. |
| | · | Increased overall proven and probable reserves at December 31, 2010 compared to their levels at the same time last year, with higher reserves at Lucky Friday due to the addition of data from new drill holes and development work, higher anticipated ore grades, increases in forecasted metals prices, and the potential expansion of the mine plan resulting from deeper access beyond the current workings due to anticipated construction of the #4 Shaft. The increase in reserves at Lucky Friday was partially offset by a slight decrease in reserves at Greens Creek in 2010 due to lower ore grades and depletion of the deposit through production. |
| | · | Produced new record ore volume at our Lucky Friday mine near Mullan, Idaho, exceeding 2009’s record throughput. |
| | · | Significantly boosted our financial liquidity, with a cash and cash equivalents balance of over $283 million and no debt at the end of the year. |
| | · | Increased our exploration spending during the year by 133% in comparison to 2009, drilling targets at each of our four land packages in Alaska, Idaho, Colorado, and Mexico. |
In addition to these significant developments, in February 2011, the negotiators representing Hecla, the United States and the Coeur d’Alene Indian Tribe (“Plaintiffs”), and the State of Idaho reached an understanding on proposed financial terms to be incorporated into a comprehensive settlement of the Coeur d’Alene Basin environmental litigation and related claims that would contain additional terms yet to be negotiated. As a result of such negotiations, we recorded a $193.2 million provision in the fourth quarter of 2010, increasing Hecla Limited’s total liability for past response costs, future remediation and natural resource damages in the entire Coeur d’Alene Basin, including the Box, to $262.2 million. See Note 7 and Note 19 of Notes to Consolidated Financial Statements for further discussion.
The global financial crisis and recession affected us in 2008 and 2009, and demonstrated the high volatility of metals prices. After seeing the silver price fall from a high of $20.92 in 2008 to a low of $8.88 for the same year, we saw prices rebound to an average of $14.65 for 2009, and a continuation of this trend to an average silver price of $20.16 for 2010 and $26.43 for the fourth quarter of 2010. Similar volatility was shown by our important base metals by-products, lead and zinc, which fell by two-thirds during 2008, but have since rebounded to levels double their low points in 2008. The increased exposure to metals prices resulting from our ownership of 100% of Greens Creek, combined with the continuation of cost controls put into place in 2009 to address the impact of the global financial crisis, put us in a position to benefit significantly from the metals price recovery and achieve the milestones described above.
In spite of higher mill throughput at both Greens Creek and Lucky Friday, our production of silver in 2010 decreased slightly to 10.6 million ounces from a record 10.9 million ounces in 2009 due to lower silver ore grades at both operations. However, production of lead and zinc, important by-products at our Lucky Friday and Greens Creek mines, increased to new record levels in 2010 due to higher ore volumes at both operations. Consequently, revenues in 2010 of $418.8 million represented a 34% increase over 2009 revenues of $312.5 million, with the increase primarily due to higher realized metal prices.
We reported diluted income per share of $0.13 in 2010 compared to $0.23 in 2009. Gross profit from operations improved to $194.8 million in 2010 from $101.1 million in 2009 primarily as a result of higher realized prices for all four metals we sell. Exploration costs were 133% higher in 2010 due to ramping-up of efforts curtailed in 2009. We recorded net losses on impairments of investments and dispositions of fixed assets, net of gains on sales of investments of $0.2 million in 2010 versus a net gain of $7.3 million in 2009. Provision for closed operations and environmental matters increased by $193.4 million in 2010 due primarily to an increase in our estimated liability for environmental obligations in Idaho’s Coeur d’Alene Basin. In 2010, we recorded an $88.1 million income tax benefit fro m a decreased valuation allowance on deferred tax assets compared to a $7.1 million benefit recorded in 2009. Our deferred tax asset balances are recorded net of an offsetting valuation allowance to the extent that we estimate that the assets are not realizable through future taxable income. We removed substantially all of the valuation allowance on our deferred tax assets in the fourth quarter of 2010. Significant evidence in 2010, including record cash flows from operations and higher metals prices, led us to conclude that our deferred tax assets are more likely than not realizable through estimated future profitability. See Note 5 of Notes to Consolidated Financial Statements for further discussion.
The factors driving metals prices are beyond our control and are difficult to predict. As noted above, prices have been highly volatile in the last three years and could be so in the future. Average prices in 2010 compared to those in 2009 and 2008 are illustrated in the Results of Operations section below. Moreover, variations in the metal grades of ore mined are impacted by geology and mine planning efficiencies and operations, potentially creating constraints on metals produced. Ore transportation and smelting schedules also impact the timing of sales and final settlement.
Key Issues
We intend to achieve our long-term strategy of increasing production and expanding our proven and probable reserves through development and exploration, as well as by future acquisitions. Our strategic plan requires that we manage several pervasive challenges and risks inherent in conducting mining, development, exploration and metal sales at multiple locations.
One such risk involves metals prices, over which we have no control except through derivative and other contracts. While the metals mining industry enjoyed continued strength in metals prices from 2006 through mid-2008, prices have been highly volatile, falling sharply in the last quarter of 2008 and recovering through 2009 and into 2010. Industrial demand of silver is closely linked to world GDP growth and to industrial fabrication levels, as it is difficult to substitute for silver in industrial fabrication. We believe that global economic conditions are continuing to improve and that industrial trends, including growth of the middle class in countries like China and India, will result in continued consumer and industrial demand for silver. Investment demand for silver and gold has been relatively stron g for the past three years and is influenced by various factors, including: the strength of the U.S. Dollar and other currencies, expanding U.S. budget deficits, widening availability of exchange-traded commodity funds, interest rate levels, the health of credit markets, and inflationary expectations. Uncertainty concerning the continued progress of global economic recovery could result in continued investment demand for precious metals. However, there can be no assurance whether these trends will continue or how they will impact prices of the metals we produce.
We make our strategic plans in the context of significant uncertainty about future revenues, which may impact new opportunities that require many years and substantial cost from discovery to production. We approach this challenge by investing in exploration and capital in districts with an established history of success, and in managing our operations in a manner that seeks to mitigate the effects of lower prices. We significantly increased our exploration activity in 2010 compared to 2009, and we anticipate a further increase in exploration activity in the coming year at or near our operating mines at Greens Creek and Lucky Friday, as well as at our exploration projects in the past-producing mining districts in Colorado and Mexico.
As a result of continued improvement in our financial condition, available capital resources, and strong operating performance, we believe that we are well positioned to seek opportunities for growth through both acquisitions and expansion of our current operations. One such opportunity involves the construction of the #4 Shaft, an internal shaft at our Lucky Friday mine, which, we believe, could significantly increase production and extend the life of the mine. We have commenced with engineering and construction activities on #4 Shaft, and management plans to seek final approval of the project by the Board of Directors in mid-2011 (see additional discussion in The Lucky Friday Segment section below). If approved, construction of #4 Shaft as currently designed is expected to cost a t otal of approximately $200 million, including approximately $50 million that that has been spent as of December 31, 2010, and take an additional four years to complete. We believe that our current capital resources will allow us to proceed. However, there are a number of factors that could affect completion of the project, including: a significant decline in metals prices, a reduction in cash available, whether arising from decreased cash flow or other uses of available cash, a significant increase in operating or capital costs, or our inability to successfully settle or otherwise manage our existing and potential environmental liabilities relating to historical mining activities in the Coeur d’Alene Basin.
Volatility in global financial markets poses a significant challenge to our ability to access credit and equity markets, should we need to do so, and to predict sales prices for our products. Our stock price has rebounded from its lowest levels in 2008. We eliminated our debt in 2009 partly by increasing our shares of common stock outstanding by 32% during 2009 and issuing warrants at exercises prices ranging from $2.50 to $3.68 per share. Our shares of common stock outstanding increased by an additional 9% in 2010 primarily as a result of exercises of warrants issued in 2008 and 2009, and by an additional 7% on January 1, 2011 as a result of the conversion of our 6.5% Mandatory Convertible Preferred Stock. We have also entered into a three-year, $60 million revolving credit agreement under which there are no outsta nding borrowings as of December 31, 2010, yet our ability to retain the facility depends in part on financial thresholds driven by the prices of products we sell.
Another challenge is the risk associated with environmental litigation and ongoing reclamation activities. As described in Item 1A. Risk Factors and Note 7 of Notes to Consolidated Financial Statements, it is possible that our estimate of these liabilities may change in the future, affecting our strategic plans. For example, the EPA has released for public comment its proposed plan for remediation of the upper portion of the Coeur d’Alene Basin, a plan with an estimated present value cost of $1.3 billion and duration of between 50 and 90 years. This plan represents a significant increase from the EPA’s interim 2002 Record of Decision with its estimated cost of $359 million for both the upper and lower portions of the Basin. We do not know the extent to which the EPA’s proposal will be ultimately implemented, its effect on current operations in the Basin, or how Hecla Limited’s liability for environmental damages could be affected. As also discussed in Notes 7 and 19 of Notes to Consolidated Financial Statements, although we have resumed settlement negotiations, and we believe we have reached an understanding on the proposed financial terms of potential settlement with the Plaintiffs in the Coeur d’Alene Basin environmental litigation and the State of Idaho, no assurance can be given that final settlement will be reached and a Consent Decree entered. Because the uncertainty surrounding settlement efforts and the status of the EPA’s proposed remediation plan makes calculating accruals and planning for our business generally more difficult and uncertain, we believe resolving such litigation during 2011 would assist our planning efforts and decrease uncertainty regarding our liability and our liquidity needs. See Item 1A. Risk Factors – Legal, Market and Regulatory Risks – The financial terms of settlement that we negotiated with the Plaintiffs in the Coeur d’Alene Basin environmental litigation, and the State of Idaho, are non-binding, and complete settlement of the litigation and other claims may not be reached.
In addition, proposed measures to address climate change and green house gas emissions could have an adverse impact on our operations and financial performance in the future (see Item 1A. Risk Factors – Legal, Market and Regulatory Risks - We face substantial governmental regulation and environmental risk). We intend to continue to strive to ensure that our activities are conducted in compliance with applicable laws and regulations and to attempt to settle the environmental litigation.
Reserve estimation is a major risk inherent in mining. Our reserve estimates, which drive our mining and investment plans and many of our costs, may change based on economic factors and actual production experience. Until ore is actually mined and processed, the volumes and grades of our reserves must be considered as estimates. Our reserves are depleted as we mine. Reserves can also change as a result of changes in metals prices and costs, as well as economic and operating assumptions.
We strive to achieve excellent mine safety and health performance. We seek to implement this goal by: training employees in safe work practices; openly communicating with employees; establishing, following and improving safety standards; investigating accidents, incidents and losses to avoid reoccurrence; and involving employees in the establishment of safety standards. We attempt to implement reasonable best practices with respect to mine safety and emergency preparedness.
As a result of industry-wide fatal accidents in recent years, primarily at underground coal mines, there has been an increase in mining regulation in the United States. This increase has taken the form of vigorous enforcement of existing laws and regulations, and the adoption of new safety and training regulations, primarily by the U.S. Labor Department’s Mine Safety and Health Administration. In addition, under the Dodd-Frank Wall Street Reform and Consumer Protection Act, the Securities and Exchange Commission was directed to issue new rules regarding the disclosure of mine safety data. These changes may have a significant effect on our future operating costs, in the form of increased costs for monitoring and administration of and by regulatory agencies. Furthermore, to the extent our competitors operate their mines in a less-regulated jurisdiction, we may be disadvantaged.
Results of Operations
For the year ended December 31, 2010, we reported income applicable to common shareholders of $35.4 million compared to income applicable to common shareholders of $54.2 million in 2009 and a loss applicable to common shareholders of $80.2 million in 2008. The following factors had a positive impact on results for the year ended December 31, 2010 compared to 2009 and 2008:
| | · | Increased gross profit at our Greens Creek and Lucky Friday units in 2010 compared to 2009 and 2008. See the Greens Creek Segment and Lucky Friday Segment sections below for further discussion of operating results. |
| | · | Valuation allowance adjustments to our deferred tax asset balances contributed to reporting a $123.5 million income tax benefit in 2010 compared to a $7.7 million income tax benefit recognized in 2009 and a $3.8 million income tax provision in 2008. These adjustments are included in the aggregate income tax benefit (provision) for each respective period. Our deferred tax asset balances are recorded net of an offsetting valuation allowance to the extent that we estimate that the assets are not realizable through future taxable income. In the fourth quarter of 2010, we removed substantially all of the valuation allowance on our deferred tax assets. Significant evidence in 2010, including record cash flows from operations and higher metals prices, led us to conclude that our deferred tax assets are more likely than not realizable due to estimated future profitability. See Note 5 of Notes to Consolidated Financial Statements for further discussion. |
| | · | Loss from discontinued operations and a loss on sale of the now-divested La Camorra unit for the year ended December 31, 2008 for a total of $29.4 million. There were no such comparable losses reported in 2010 or 2009 as we completed the sale of our discontinued Venezuelan operations in July 2008 (see the Discontinued Operations – La Camorra Unit section below and Note 12 of Notes to Consolidated Financial Statements for more information). |
| | · | Interest expense, net of interest capitalized, decreased to $2.2 million in 2010 from $11.3 million in 2009 and $19.6 million for the year ended December 31, 2008 due to repayment in 2009 of debt incurred for the acquisition of the remaining 70.3% ownership interest in Greens Creek. See Note 6 of Notes to the Consolidated Financial Statements for more information on our debt facilities. |
| | · | Higher debt-related fees in 2009 due to $4.3 million in expense recognized in the first quarter of 2009 for preferred stock issued pursuant to our amended and restated credit agreement and $1.7 million in professional fees incurred in 2009 related to compliance with our amended and restated credit agreement. See Note 6 and Note 9 of Notes to Consolidated Financial Statements for more information. |
| | · | In the second quarter of 2009 we recognized a $3.0 million loss on impairment of shares of Rusoro stock received in the 2008 sale of our discontinued Venezuelan operations compared to a $0.7 million impairment loss recognized on the Rusoro stock recognized during the second quarter of 2010 (see Note 2 of Notes to the Consolidated Financial Statements for further discussion). |
| | · | Higher average prices for all four metals produced at our operations in 2010 compared to 2009 and 2008. The following table summarizes average market prices and our realized prices for silver, gold, lead and zinc for the years ended December 31, 2010, 2009 and 2008: |
| | | Average for the year ended December 31, | |
| | | 2010 | | | 2009 | | | 2008 | |
| Silver — | London PM Fix ($/ounce) | | $ | 20.16 | | | $ | 14.65 | | | $ | 15.02 | |
| | Realized price per ounce | | $ | 22.70 | | | $ | 15.63 | | | $ | 14.40 | |
| Gold — | London PM Fix ($/ounce) | | $ | 1,225 | | | $ | 973 | | | $ | 872 | |
| | Realized price per ounce | | $ | 1,271 | | | $ | 1,017 | | | $ | 865 | |
| Lead — | LME Final Cash Buyer ($/pound) | | $ | 0.97 | | | $ | 0.78 | | | $ | 0.95 | |
| | Realized price per pound | | $ | 0.98 | | | $ | 0.88 | | | $ | 0.83 | |
| Zinc — | LME Final Cash Buyer ($/pound) | | $ | 0.98 | | | $ | 0.75 | | | $ | 0.85 | |
| | Realized price per pound | | $ | 0.96 | | | $ | 0.90 | | | $ | 0.71 | |
The differences between realized metal prices and average market prices are due to timing of sales and settlements, including provisional price adjustments and gains and losses on zinc and lead forward contracts included in our revenues resulting from the difference between metal prices upon transfer of title of concentrates to the buyer and metal prices at the time of final settlement.
These differences arise from our accounting policy on revenue recognition. Concentrate sales are generally recorded as revenues at the time of shipment from our location at forward prices for the estimated month of settlement, which may extend up to four months after shipment. Due to the time elapsed between shipment of concentrates and final settlement with the buyers, we must estimate the prices at which sales of our metals will be settled. Previously recorded sales are adjusted to estimated settlement metal prices each period through final settlement. For 2010, we recorded positive price adjustments to provisional settlements of $14.9 million compared to positive price adjustments of $25.6 million in 2009 and negative price adjustments of $25.7 million in 2008. The pric e adjustments for 2010 attributable to zinc and lead were partially offset by net losses on forward contracts for those metals initiated in the second quarter of 2010 (see Note 10 of Notes to Consolidated Financial Statements for more information). The net losses on these forward contracts are included in revenues and impact the realized prices for zinc and lead. We recognized a net loss on the contracts of $3.0 million in 2010.
Other significant variances affecting the comparison of our income applicable to common shareholders for 2010 to results for 2009 and 2008 were as follows:
| | · | An accrual of $193.2 million to increase our liability for environmental obligations in Idaho’s Coeur d’Alene Basin pursuant to negotiations with the Plaintiffs in the Coeur d’Alene Basin environmental litigation and the State of Idaho on the financial terms of potential settlement of the litigation and related claims. In the fourth quarter of 2009, we recorded an increase of approximately $4.0 million to our estimated liabilities for environmental remediation at our Grouse Creek unit ($3.2 million) and the Bunker Hill Superfund Site ($0.8 million) as a result of revisions to the reclamation work plans. For additional discussion, see Coeur d’Alene River Basin Environmental Claims in Notes 7 and 19 of Notes to the Consolidated Financial Statements. |
| | · | A $20.8 million net loss on base metal derivative contracts in 2010, with no comparable events in 2009 and 2008. The losses primarily represent non-cash, mark-to-market adjustments on outstanding financially-settled forward contracts related to forecasted zinc and lead production as a part of a risk management program initiated in the second quarter of 2010. See Note 10 of Notes to Consolidated Financial Statements for more information on our derivatives contracts. |
| | · | Exploration expense of $21.6 million in 2010 compared to $9.2 million in 2009 and $22.5 million in 2008. The increase in 2010 compared to 2009 is due to the resumption, following a lower level of activity in 2009 imposed by financial circumstances, of exploration activity at or near our current operations at the Greens Creek and Lucky Friday units, at the San Juan Silver project in Colorado, and at our San Sebastian unit in Mexico. |
| | · | The termination of an employee benefit plan resulting in a non-cash gain of $9.0 million recognized in the first quarter of 2009 (see Note 8 of Notes to Consolidated Financial Statements for more information). |
| | · | The sale of our Velardeña mill in Mexico in March 2009 generating a pre-tax gain of $6.2 million (see Note 18 of Notes to Consolidated Financial Statements for more information). |
| | · | The sale of our investment in Aquiline Resources Inc. stock for proceeds and a pre-tax gain of approximately $4.1 million in the fourth quarter of 2009. |
Greens Creek Segment
Below is a comparison of the operating results and key production statistics of our Greens Creek segment, which reflects our 29.7% ownership share through April 16, 2008 and our 100% ownership thereafter. See Note 18 of Notes to Consolidated Financial Statements for further discussion of the acquisition of the 70.3% interest in Greens Creek. Dollars are presented in thousands, except for per ton and per ounce amounts.
| | | Years Ended December 31, | |
| | | 2010 | | | 2009 | | | 2008 | |
| Sales | | $ | 313,318 | | | $ | 229,318 | | | $ | 141,103 | |
| Cost of sales and other direct production costs | | $ | (116,824 | ) | | $ | (103,670 | ) | | $ | (110,540 | ) |
| Depreciation, depletion and amortization | | $ | (51,671 | ) | | $ | (52,909 | ) | | $ | (30,022 | ) |
| Gross Profit | | $ | 144,823 | | | $ | 72,739 | | | $ | 541 | |
| | | | | | | | | | | | | |
| Tons of ore milled | | | 800,397 | | | | 790,871 | | | | 598,931 | |
| Production: | | | | | | | | | | | | |
| Silver (ounces) | | | 7,206,973 | | | | 7,459,170 | | | | 5,829,253 | |
| Gold (ounces) | | | 68,838 | | | | 67,278 | | | | 54,650 | |
| Zinc (tons) | | | 74,496 | | | | 70,379 | | | | 52,055 | |
| Lead (tons) | | | 25,336 | | | | 22,253 | | | | 16,630 | |
| Payable metal quantities sold: | | | | | | | | | | | | |
| Silver (ounces) | | | 6,223,967 | | | | 6,482,439 | | | | 5,143,758 | |
| Gold (ounces) | | | 57,386 | | | | 54,801 | | | | 44,977 | |
| Zinc (tons) | | | 56,001 | | | | 52,928 | | | | 39,433 | |
| Lead (tons) | | | 20,221 | | | | 16,749 | | | | 13,877 | |
| Ore grades: | | | | | | | | | | | | |
| Silver ounces per ton | | | 12.30 | | | | 13.01 | | | | 13.69 | |
| Gold ounces per ton | | | 0.13 | | | | 0.13 | | | | 0.14 | |
| Zinc percent | | | 10.66 | | | | 10.13 | | | | 10.13 | |
| Lead percent | | | 4.09 | | | | 3.64 | | | | 3.59 | |
| Mining cost per ton | | $ | 43.00 | | | $ | 43.33 | | | $ | 49.43 | |
| Milling cost per ton | | $ | 24.23 | | | $ | 23.22 | | | $ | 30.91 | |
Total cash cost per silver ounce (1) | | $ | (3.90 | ) | | $ | 0.35 | | | $ | 3.29 | |
______________
| (1) | A reconciliation of this non-GAAP measure to cost of sales and other direct production costs and depreciation, depletion and amortization, the most comparable GAAP measure, can be found in Reconciliation of Total Cash Costs to Costs (non-GAAP) of Sales and Other Direct Production Costs and Depreciation, Depletion and Amortization (GAAP). |
The increase in gross profit for 2010 compared to 2009 and 2008 was primarily the result of the following factors:
| | · | Higher average market and realized prices in 2010 for all four metals produced at Greens Creek compared to 2009 and 2008, as further discussed in Results of Operations above. |
| | · | Positive price adjustments to revenues of $12.8 million, net of base metal forward contract losses, during 2010 compared to $22.2 million in 2009. The price adjustments in 2010 and 2009 were favorable compared to the $22.9 million in negative price adjustments recorded in 2008. Price adjustments to revenues result from changes in metals prices between transfer of title of concentrates to buyers and final settlements during the period. Positive price adjustments for lead and zinc in 2010 were substantially offset by net losses on $2.1 million on financially-settled forward contracts. The base metal forward contract program was initiated in April 2010, and there were no comparable losses impacting 2009 and 2008 gross profit. |
| | · | Higher zinc and lead ore grades which, coupled with slightly higher mill throughput, resulted in increased production of those metals in 2010. |
| | · | Production costs per ton of ore milled for 2010 remained within 1% of their 2009 levels, which decreased by 19% compared to 2008. The lower costs in 2010 and 2009 are primarily due to increased availability of hydroelectric power, cost reduction efforts, lower diesel prices and improved ore production. |
| | · | An increase in our share of production due to our acquisition of the remaining 70.3% of Greens Creek in April 2008. |
| | · | Cost of sales in 2008 included the excess of fair value over cost of the finished and in-process product inventory acquired upon purchase of the 70.3% ownership interest. Upon the sale of the acquired inventory, the excess of fair market value over costs was expensed, which increased cost of sales and decreased gross profit margin in 2008 by $16.6 million. |
These factors were partially offset by:
| | · | A silver ore grade in 2010 that was 5% lower than the ore grade in 2009 and 10% lower than the ore grade in 2008. The lower silver grade, along with the higher zinc and lead ore grades discussed above, are due to differences in the sequencing of production from the various mine areas as a part of the overall mine plan. |
| | · | Higher depreciation, depletion and amortization expense in 2010 and 2009 of $21.6 million and $22.9 million, respectively, compared to 2008 as a result of the fair market valuation of the acquired 70.3% share of property, plant, equipment and mineral interests at the acquisition date, additional depreciable assets placed into service, and an increase in units-of-production depreciation driven by higher production in 2010 and 2009. |
| | · | Mine license taxes that increased in 2010 by $4.0 million compared to 2009 and by $8.6 million compared to 2008. The higher taxes are due to the increased profits resulting from the other factors discussed in this section. |
The Greens Creek operation is partially powered by diesel generators, and production costs have historically been significantly affected by fluctuations in fuel prices. Infrastructure has been installed that allows hydroelectric power to be supplied to Greens Creek by AEL&P via a submarine cable from North Douglas Island, near Juneau, to Admiralty Island, where Greens Creek is located. This project has reduced production costs at Greens Creek to the extent power has been available. During 2009, the mine began receiving an increased proportion of its power needs from AEL&P. The increased hydroelectric power utilization continued through part of 2010. Fuel costs represented approximately 6% of total production costs at Greens Creek in 2010 compared to 8% in 2009 and 20% i n 2008.
The $4.25 decrease in total cash cost per silver ounce in 2010 compared to 2009 is primarily due to by-product credits that increased by $8.10 per ounce, due to higher zinc, gold, and lead prices and production, partially offset by higher treatment and freight costs, production costs, and production taxes of $2.36, $0.91, and $0.57 per ounce, respectively. The higher treatment and freight costs in 2010 are due primarily to increased price participation charges by smelters resulting from higher metals prices. The $2.94 decrease in total cash cost per silver ounce in 2009 compared to 2008 is primarily due to production costs and treatment and freight costs that decreased by $2.21 and $0.59 per ounce, respectively, and by-product credits that increased by $0.71 per ounce, partially offset by production taxes that increased by $0.59 per ounce. While value from zinc, lead and gold by-products is significant, we believe that identification of silver as the primary product is appropriate because:
| | · | silver has historically accounted for a higher proportion of revenue than any other metal and is expected to do so in the future; |
| | · | we have historically presented Greens Creek as a producer primarily of silver, based on the original analysis that justified putting the project into production, and believe that consistency in disclosure is important to our investors regardless of the relationships of metals prices and production from year to year; |
| | · | metallurgical treatment maximizes silver recovery; |
| | · | the Greens Creek deposit is a massive sulfide deposit containing an unusually high proportion of silver; and |
| | · | in most of its working areas, Greens Creek utilizes selective mining methods in which silver is the metal targeted for highest recovery. |
We periodically review our proven and probable reserves to ensure that reporting of primary products and by-products is appropriate. Within our cost per ounce calculations, because we consider zinc, lead and gold to be by-products of our silver production, the values of these metals offset operating costs.
The Lucky Friday Segment
The following is a comparison of the operating results and key production statistics of our Lucky Friday segment (dollars are in thousands, except per ounce and per ton amounts):
| | | Years Ended December 31, | |
| | | 2010 | | | 2009 | | | 2008 | |
| Sales | | $ | 105,495 | | | $ | 83,230 | | | $ | 63,562 | |
| Cost of sales and other direct production costs | | $ | (47,159 | ) | | $ | (44,972 | ) | | $ | (41,059 | ) |
| Depreciation, depletion and amortization | | $ | (8,340 | ) | | $ | (9,928 | ) | | $ | (5,185 | ) |
| Gross profit | | $ | 49,996 | | | $ | 28,330 | | | $ | 17,318 | |
| | | | | | | | | | | | | |
| Tons of ore milled | | | 351,074 | | | | 346,395 | | | | 317,777 | |
| Production: | | | | | | | | | | | | |
| Silver (ounces) | | | 3,359,379 | | | | 3,530,490 | | | | 2,880,264 | |
| Lead (tons) | | | 21,619 | | | | 22,010 | | | | 18,393 | |
| Zinc (tons) | | | 9,286 | | | | 10,616 | | | | 9,386 | |
| Payable metal quantities sold: | | | | | | | | | | | | |
| Silver (ounces) | | | 3,136,205 | | | | 3,316,034 | | | | 2,697,089 | |
| Lead (tons) | | | 20,213 | | | | 20,461 | | | | 16,915 | |
| Zinc (tons) | | | 6,850 | | | | 7,794 | | | | 6,299 | |
| Ore grades: | | | | | | | | | | | | |
| Silver ounces per ton | | | 10.25 | | | | 10.86 | | | | 9.70 | |
| Lead percent | | | 6.60 | | | | 6.82 | | | | 6.23 | |
| Zinc percent | | | 3.04 | | | | 3.46 | | | | 3.52 | |
| Mining cost per ton | | $ | 54.27 | | | $ | 58.56 | | | $ | 63.68 | |
| Milling cost per ton | | $ | 14.74 | | | $ | 14.98 | | | $ | 13.73 | |
Total cash cost per silver ounce (1) | | $ | 3.76 | | | $ | 5.21 | | | $ | 6.06 | |
______________
| (1) | A reconciliation of this non-GAAP measure to cost of sales and other direct production costs and depreciation, depletion and amortization, the most comparable GAAP measure, can be found below in Reconciliation of Total Cash Costs (non-GAAP) to Costs of Sales and Other Direct Production Costs and Depreciation, Depletion and Amortization (GAAP). |
The increase in gross profit for 2010 compared to 2009 and 2008 is primarily due to:
| | · | Higher average market and realized prices for all metals produced at the Lucky Friday (further discussed in Results of Operations above). |
| | · | A decrease in production costs by 4% and 9%, on a per ton basis, compared to 2009 and 2008, respectively. |
Gross profit for 2010 was also impacted by silver ore grades that decreased by 6% compared to 2009, but that exceeded 2008 levels by 6%. In addition, positive price adjustments to revenues of $2.1 million and $3.4 million impacted results for 2010 and 2009, respectively, due to increases in metals prices between transfer of title of concentrates to buyers and final settlement during the year. Revenues for 2008 at Lucky Friday included $2.8 million in negative price adjustments. 2010 revenues include net losses of $1.0 million on forward contracts related to zinc and lead contained in concentrates shipped in 2010. The base metal forward contract program was initiated in April 2010, and there were no comparable losses impacting 2009 and 2008 gross profit.
The $1.45 decrease in total cash costs per silver ounce in 2010 compared to 2009 is due primarily to higher by-product credits by $2.95 per ounce resulting from higher lead and zinc prices, partially offset by higher employee profit sharing, production, expensed site infrastructure, and treatment and freight costs by $0.72, $0.34, $0.33, and $0.13 per ounce, respectively. The $0.85 decrease in total cash costs per silver ounce in 2009 compared to 2008 is primarily due to lower production costs and treatment and freight costs by $1.87 and $1.34 per ounce, respectively. The lower costs were partially offset by a decrease in by-product credits by $2.10 per ounce due to lower average lead and zinc prices. While value from lead and zinc is significant at the Lucky Friday, we believe that identification of silver as the primary product, with zinc and lead as by-products, is appropriate because:
| | · | silver has historically accounted for a higher proportion of revenue than any other metal and is expected to do so in the future; |
| | · | the Lucky Friday unit is situated in a mining district long associated with silver production; and |
| | · | the Lucky Friday unit generally utilizes selective mining methods to target silver production. |
We periodically review our proven and probable reserves to ensure that reporting of primary products and by-products is appropriate. Within our cost per ounce calculations, because we consider zinc and lead to be by-products of our silver production, the values of these metals offset operating costs.
Over the past years we have evaluated alternatives for deeper access at the Lucky Friday mine in order to expand its operational life. As a result, we initiated work on the #4 Shaft, an internal shaft at Lucky Friday, including: detailed shaft design, excavation of the hoist room and off shaft development access to shaft facilities, placement and receipt of orders for major equipment purchases, and other construction activities. Upon completion, #4 Shaft could allow us to mine mineralized material below our current workings and provide deeper platforms for exploration. Construction of #4 Shaft would take approximately four more years to complete, and capital expenditures for the project would total approximately $200 million, including approximately $50 million already committed as o f December 31, 2010. Our management currently expects to seek final approval of the project by the Board of Directors in the first half of 2011. We believe that our current and anticipated capital resources will allow us to proceed even if the proposed settlement of the Basin litigation and related claims is finalized and payments made as anticipated thereunder. However, there are a number of factors that could affect final approval of the project, including: a significant decline in metals prices, a significant increase in operating or capital costs, reductions in cash or financing available, whether arising from decreased cash flow or other uses of available cash, or our inability to successfully settle or otherwise manage our existing and potential environmental liabilities relating to historical mining activities in the Coeur d’Alene Basin.
Discontinued Operations - The La Camorra Unit
During the third quarter of 2008, we sold our wholly owned subsidiaries holding our business and operations of the La Camorra Unit to Rusoro Mining, Ltd. (“Rusoro”) for $20 million in cash and 3,595,781 shares of Rusoro common stock. The results of our Venezuelan operations have been reported in discontinued operations for all periods presented. See Note 12 of Notes to Consolidated Financial Statements for more information.
The following is a summary of operating results and key production statistics for our discontinued Venezuelan operations, which included the La Camorra mine, a custom milling business and Mina Isidora (dollars are in thousands):
| | | December 31, | |
| | | 2008 | |
| Sales | | $ | 23,855 | |
| Cost of sales and other direct production costs | | | (21,656 | ) |
| Depreciation, depletion and amortization | | | (4,785 | ) |
| Gross profit (loss) | | $ | (2,586 | ) |
| Tons of ore milled | | | 25,516 | |
| Gold ounces produced | | | 22,160 | |
| Gold ounce per ton | | | 0.894 | |
Corporate Matters
Other significant variances affecting our 2010 results compared to 2009 results were as follows:
| | · | A gain of $6.2 million in 2009 on the sale of our mill in Mexico, with no similar event in 2010. |
| | · | Termination of an employee benefit plan in 2009 with a gain of $9.0 million, with no similar event in 2010. |
| | · | Other operating expense included cash donations totaling $1.5 million in 2010 to the Hecla Charitable Foundation for its charitable work, including supporting the communities in which Hecla has employees and interests. This was offset by a decrease in pension benefit costs recognized resulting from an increase in the expected returns calculated for plan assets due to higher plan asset values. |
| | · | Higher provision for closed operations and environmental matters in 2010 by $193.4 million. The principal cause of the increase was a $193.2 million increase in our accrual for environmental obligations related to the Coeur d’Alene Basin, compared to $4.0 million in 2009. The increase in 2010 was pursuant to negotiations with the Plaintiffs in the Coeur d’Alene Basin environmental litigation and the State of Idaho on the financial terms of potential settlement of the litigation and related claims. For further discussion, see Note 19 to Notes to Consolidated Financial Statements. |
| | · | Interest expense and debt-related fees were $15.1 million lower in 2010 as a result of payoff in 2009 of corporate debt, offset partly by increased capital leases in 2010. |
| | · | Mark-to-market losses on financially-settled forward contracts for forecasted lead and zinc sales totaling $20.8 million in 2010. The program commenced in April 2010, and hence, no such activity was reported in 2009. |
| | · | An income tax benefit of $123.5 million compared to an income tax benefit of $7.7 million in 2009. The 2010 income tax benefit is primarily related to deferred tax asset valuation allowance adjustments of $88.1 million partially offset by current income tax provision and amortization of deferred tax assets. See Note 5 to Notes to Consolidated Financial Statements for further discussion. |
Other significant variances affecting 2009 results compared to 2008 results were as follows:
| | · | General and administrative expense was higher by $4.7 million in 2009 due to negative mark-to-market adjustments for the valuation of stock appreciation rights in 2008 and costs incurred for workforce reductions, partially offset by decreased staffing. |
| | · | Increase in other operating expense of $2.6 million in 2009 primarily due to an increase in pension benefit costs recognized resulting from a decrease in the expected returns calculated for plan assets due to lower plan asset values. |
| | · | $2.7 million decrease in interest income in 2009 as a result of lower cash balances. |
| | · | Lower interest expense, net of amount capitalized, in 2009 by $8.2 million due to payoff of our bridge facility balance in February 2009 and payoff of our term facility balance in October 2009. See Note 6 of Notes to Consolidated Financial Statements for more information on our credit facilities. |
| | · | Higher debt-related fees in 2009 due to $4.3 million in expense recognized in the first quarter of 2009 for preferred shares issued pursuant to our amended and restated credit agreement and $1.7 million in professional fees incurred in 2009 related to compliance with our amended and restated credit agreement. See Note 6 and Note 9 of Notes to Consolidated Financial Statements for more information. |
| | · | An income tax benefit of $7.7 million in 2009 compared to an income tax provision of $3.8 million in 2008. The 2009 income tax benefit is primarily related to a $7.1 million reduction in the valuation allowance for our deferred tax asset balances in the fourth quarter. See Note 5 to Notes to Consolidated Financial Statements for further discussion. |
Reconciliation of Total Cash Costs (non-GAAP) to Cost of Sales and Other Direct Production Costs and Depreciation, Depletion and Amortization (GAAP)
The tables below present reconciliations between non-GAAP total cash costs to cost of sales and other direct production costs and depreciation, depletion and amortization (GAAP) for our operations at the Greens Creek and Lucky Friday units for the years ended December 31, 2010, 2009 and 2008 (in thousands, except costs per ounce).
Total cash costs include all direct and indirect operating cash costs related directly to the physical activities of producing metals, including mining, processing and other plant costs, third-party refining expense, on-site general and administrative costs, royalties and mining production taxes, net of by-product revenues earned from all metals other than the primary metal produced at each unit. Total cash costs provide management and investors an indication of net cash flow, after consideration of the realized price received for production sold. Management also uses this measurement for the comparative monitoring of performance of our mining operations period-to-period from a cash flow perspective. “Total cash cost per ounce” is a measure developed by precious metals companies in an effort to provide a comparable standard; however, there can be no assurance that our reporting of this non-GAAP measure is similar to that reported by other mining companies.
Cost of sales and other direct production costs and depreciation, depletion and amortization, is the most comparable financial measure calculated in accordance with GAAP to total cash costs. The sum of the cost of sales and other direct production costs and depreciation, depletion and amortization for our operating units in the tables below is presented in our Consolidated Statement of Operations and Comprehensive Income (Loss).
| | | Total, All Properties | |
| | | Year ended December 31, | |
| | | 2010 | | | 2009 | | | 2008 | |
| Total cash costs | | $ | (15,435 | ) | | $ | 20,958 | | | $ | 36,621 | |
| Divided by silver ounces produced | | | 10,566 | | | | 10,989 | | | | 8,709 | |
| Total cash cost per ounce produced | | $ | (1.46 | ) | | $ | 1.91 | | | $ | 4.20 | |
| Reconciliation to GAAP: | | | | | | | | | | | | |
| Total cash costs | | $ | (15,435 | ) | | $ | 20,958 | | | $ | 36,621 | |
| Depreciation, depletion and amortization | | | 60,011 | | | | 62,837 | | | | 35,207 | |
| Treatment costs | | | (92,144 | ) | | | (80,830 | ) | | | (70,776 | ) |
| By-product credits | | | 267,272 | | | | 206,608 | | | | 164,963 | |
| Change in product inventory | | | 3,660 | | | | 310 | | | | 20,254 | |
| Reclamation and other costs | | | 630 | | | | 1,596 | | | | 537 | |
| Cost of sales and other direct production costs and depreciation, depletion and amortization (GAAP) | | $ | 223,994 | | | $ | 211,479 | | | $ | 186,806 | |
| | | Greens Creek Unit | |
| | | Year ended December 31, | |
| | | 2010 | | | 2009 | | | 2008 | |
| Total cash costs | | $ | (28,073 | ) | | $ | 2,582 | | | $ | 19,157 | |
| Divided by silver ounces produced | | | 7,207 | | | | 7,459 | | | | 5,829 | |
| Total cash cost per ounce produced | | $ | (3.90 | ) | | $ | 0.35 | | | $ | 3.29 | |
| Reconciliation to GAAP: | | | | | | | | | | | | |
| Total cash costs | | $ | (28,073 | ) | | $ | 2,582 | | | $ | 19,157 | |
| Depreciation, depletion and amortization | | | 51,671 | | | | 52,909 | | | | 30,022 | |
| Treatment costs | | | (73,817 | ) | | | (62,037 | ) | | | (51,495 | ) |
| By-product credits | | | 214,462 | | | | 161,537 | | | | 122,146 | |
| Change in product inventory | | | 3,685 | | | | 14 | | | | 20,245 | |
| Reclamation and other costs | | | 567 | | | | 1,574 | | | | 487 | |
| Cost of sales and other direct production costs and depreciation, depletion and amortization (GAAP) | | $ | 168,495 | | | $ | 156,579 | | | $ | 140,562 | |
| | | Lucky Friday Unit | |
| | | Year ended December 31, | |
| | | 2010 | | | 2009 | | | 2008 | |
| Total cash costs | | $ | 12,638 | | | $ | 18,376 | | | $ | 17,464 | |
| Divided by silver ounces produced | | | 3,359 | | | | 3,530 | | | | 2,880 | |
| Total cash cost per ounce produced | | $ | 3.76 | | | $ | 5.21 | | | $ | 6.06 | |
| Reconciliation to GAAP: | | | | | | | | | | | | |
| Total cash costs | | $ | 12,638 | | | $ | 18,376 | | | $ | 17,464 | |
| Depreciation, depletion and amortization | | | 8,340 | | | | 9,928 | | | | 5,185 | |
| Treatment costs | | | (18,327 | ) | | | (18,793 | ) | | | (19,281 | ) |
| By-product credits | | | 52,810 | | | | 45,071 | | | | 42,817 | |
| Change in product inventory | | | (25 | ) | | | 296 | | | | 9 | |
| Reclamation and other costs | | | 63 | | | | 22 | | | | 50 | |
| Cost of sales and other direct production costs and depreciation, depletion and amortization (GAAP) | | $ | 55,499 | | | $ | 54,900 | | | $ | 46,244 | |
Financial Liquidity and Capital Resources
Our liquid assets include (in millions):
| | | December 31, 2010 | | | December 31, 2009 | | | December 31, 2008 | |
| Cash and cash equivalents held in U.S. dollars | | $ | 283.1 | | | $ | 104.6 | | | $ | 36.2 | |
| Cash and cash equivalents held in foreign currency | | | 0.5 | | | | 0.1 | | | | 0.3 | |
| Marketable equity securities, current | | | 1.5 | | | | 1.1 | | | | --- | |
| Marketable equity securities, non-current | | | 1.2 | | | | 2.2 | | | | 3.1 | |
| Total cash, cash equivalents and investments | | $ | 286.3 | | | $ | 108.0 | | | $ | 39.6 | |
Cash and cash equivalents held in U.S. dollars increased by $178.5 million in 2010, as discussed below. Cash held in foreign currencies represent nominal balances in Canadian dollars and Mexican pesos.
In February of 2011, the negotiators representing Hecla, the Plaintiffs, and the State of Idaho with respect to the Coeur d’Alene Basin environmental litigation and related claims reached an understanding on proposed financial terms to be incorporated into a comprehensive settlement that would contain additional terms yet to be negotiated. The final terms of settlement, if agreed upon by all parties, would be part of a full and final settlement in the form of a Consent Decree. If we reach agreement on the final terms of the settlement, and a Consent Decree is entered, it would resolve Hecla Limited’s liability related to historical mine workings in the Basin (including the Box). While full and final settlement of the litigation and other claims has not been reached, and t here is no assurance that such a settlement will be reached, the negotiated financial terms would require the following payments:
| | · | $102 million within 30 days after entry of the Consent Decree. |
| | · | $55.5 million in cash or shares of Hecla Mining Company common stock, at our election, within 30 days after entry of the Consent Decree. |
| | · | $25 million within 30 days after the first anniversary of entry of the Consent Decree. |
| | · | $15 million within 30 days after the second anniversary of entry of the Consent Decree. |
| | · | $65.9 million by August 2014, in the form of quarterly payments of the proceeds from exercises of any outstanding Series 1 and Series 3 warrants (which have an exercise price of between $2.45 and $2.50 per share) during the quarter with the balance of the $65.9 million due in August 2014 (regardless of the amount of warrants that have been exercised). We have received proceeds of approximately $9.5 million for the exercise of Series 1 and Series 3 warrants as of the date of this report, which we anticipate would be paid to the Plaintiffs within 30 days after entry of the Consent Decree. |
The foregoing payments of $25 million, $15 million, and $65.9 million would require third party surety, the form of which remains to be determined. Further, from April 16, 2011 until the lodging of the Consent Decree, each of the foregoing payments (with the exception of the $65.9 million payment) would accrue interest at the Prime Rate (currently 3.25%). The $25 million and $15 million payments would also accrue interest from the entry of the Consent Decree until payment at the Superfund rate (currently 0.69%).
In addition to the foregoing payments, we would be obligated to provide the Plaintiffs or the State of Idaho with a limited amount of land we currently own to be used as a repository waste site. The interest in the land to be provided was acquired by Hecla Limited in prior periods, and will require no cash payment.
We entered into a $380 million credit facility in April of 2008 for the acquisition of the companies owning 70.3% of the joint venture operating the Greens Creek mine. We fully repaid the facility with a final payment of $38.3 million from available cash in October 2009. We also entered into an amended three year, $60 million senior-secured revolving credit facility in October 2009. The facility is available for general corporate purposes and, based on our current cash position and business plan, we do not currently anticipate drawing on the facility in the near term. See Note 6 of Notes to Consolidated Financial Statements for information on how the covenants in our credit facility may impact our liquidity and capital resources in the future. We may engage in other transactions, such as additional acquisition opportunities or capital projects, which could require additional equity issuances or financing. There can be no assurances that such financing will be available to us.
As a result of our current cash balance, the performance of our operations, current metals prices, and full availability of our $60 million revolving credit agreement, we believe our cash, cash equivalents, investments, cash from operations, and availability of financing if needed will be adequate to meet our obligations during the next twelve months. We currently estimate that a total of approximately $97 million will be incurred on capital expenditures for equipment, infrastructure, and development at our Lucky Friday and Greens Creek units in 2011. We also estimate that exploration expenditures will total approximately $28 million in 2011.
To increase production and longevity at the Lucky Friday mine, we have initiated work on the #4 Shaft, including: detailed shaft design, excavation of the hoist room and off shaft development access to shaft facilities, placement and receipt of orders for major equipment purchases, and other construction activities. If we decide to continue with construction of #4 Shaft, it would involve capital expenditures of approximately $200 million, which includes approximately $50 million that has been spent on the project as of December 31, 2010. Our ability to finance such a project will depend on our operational performance, metals prices, our ability to estimate capital costs, sources of liquidity available to us, and other factors. We believe that our available cash, revolving credit agreement, cash from operations, and access to equity and financial markets will allow us to proceed even if the proposed settlement of the Basin litigation and related claims is finalized and payments made as anticipated thereunder. We may also mitigate market risk from time to time with selective base metal derivative contract programs. However, a sustained downturn in metals prices or significant increases in operational or capital costs or other factors beyond our control could compel us to suspend the project in the future.
Hecla Limited, our wholly-owned subsidiary, has been involved in settlement negotiations with the U.S. government, the Coeur d’Alene Indian Tribe, and the State of Idaho regarding our existing and potential liability relating to historical mining activity in the Coeur d’Alene Basin (see Notes 7 and 19 of Notes to Consolidated Financial Statements for more information).
On January 1, 2011, all of the outstanding shares of our 6.5% Mandatory Convertible Preferred Stock were converted to shares of our common stock, and we paid the final quarterly dividend on that series of preferred stock in January 2011 (see Note 9 of Notes to Consolidated Financial Statements for more information). We are no longer required to pay quarterly dividends of approximately $3.3 million as a result of the conversion.
| | | Year Ended December 31, | |
| | | 2010 | | | 2009 | | | 2008 | |
| Cash provided by operating activities (in millions) | | $ | 197.8 | | | $ | 119.2 | | | $ | 11.0 | |
Cash provided by operating activities increased by $78.6 million in 2010 compared to 2009 due to higher income, as adjusted for non-cash items. The improved results are primarily due to higher prices for all four metals produced at our operations. Working capital and other asset and liability changes increased cash flow by $8.1 million in 2010, compared to a $12.2 million decrease in 2009. The $20.3 million difference is due to an increase in accounts payable and accrued liability and accrued taxes balances and lower trade accounts receivable, other current and noncurrent asset, and inventory balances, partially offset by lower payroll-related accruals and higher cash reductions to accrued reclamation and closure costs. The increase in accounts payable is due to increased activity at our operating units and the accrual of dividends in the fourth quarter of 2010 on our 6.5% Mandatory Convertible Preferred Stock, which were paid in cash in January 2011. We recorded increased accruals for income and production taxes as a result of higher profitability at our operations. The smaller increase in accounts receivable and decrease in inventory balances is due to the timing of concentrate shipments at our Greens Creek unit. Other current and noncurrent asset balances decreased due to the timing of payment of prepaid expenditures. The lower accrued payroll and related benefits balance is due mainly to the payment of 2009 incentive compensation in the first quarter of 2010. The cash decrease in our reclamation accruals is due to the payment of $5.3 million related to past response costs at the Bunker Hill Superfund Site, and increased reclamation work performed at our Grouse Creek site in 2010.
The higher cash provided by operating activities in 2009 compared to 2008 is primarily due to net income from continuing operations, adjusted for non-cash elements, which increased by $117.2 million due to improved prices and production, lower interest expense, and lower exploration expense. Working capital changes reduced cash flow in 2009, primarily as a result of a $36.7 million increase in the change in accounts receivable. The increase in accounts receivable is due to an increase in the quantity of concentrate shipped that was pending final settlement at year end 2009 versus 2008 and an increase in metals prices in 2009, resulting in higher values per ton of concentrate. In addition, a 2008 adjustment to product inventory related to the purchase price allocation for Greens Creek did not have a counte rpart in 2009. $12.5 million in net cash used by discontinued operations in 2008 had no comparable event in 2009, as we sold our discontinued Venezuelan operations in the third quarter of 2008.
| | Year Ended December 31, | |
| | 2010 | | | 2009 | | | 2008 | |
| Cash used in investing activities (in millions) | | $ | 64.8 | | | $ | 12.1 | | | $ | 677.3 | |
We spent $67.4 million on capital expenditures in 2010, including $50.9 million at Lucky Friday and $16.5 million at Greens Creek, which, in the aggregate, was $39.7 million higher than total capital expenditures of $27.7 million in 2009, which included $18.9 million spent for projects at Lucky Friday and $8.8 million for Greens Creek. The increase capital spending was due, in part, to the deferral of projects in 2009. We received $8.0 million in proceeds from the sale of the Velardeña mill in Mexico in the first quarter of 2009 (see Note 18 of Notes to Consolidated Financial Statements for more information on the sale). Our restricted cash balances for environmental bonds were reduced by $1.5 million in 2010 versus $3.5 million in 2009. Sales of investments yielded $1.1 million versus $4.1 million in 2009.
Cash outlay for capital expenditures totaled $27.7 million in 2009, a $37.2 million decrease compared to 2008. The reduced level of capital spending in 2009 was the result of cost-reduction efforts in response to the impact of the global economic crisis. In addition, during 2008 we invested $688.5 million for the acquisition of the remaining 70.3% interest in Greens Creek Joint Venture, and received $21.2 million from Rusoro for its acquisition of our Venezuelan operations. Sales of investments yielded $27.0 million in proceeds in 2008, and we reduced our restricted cash and investment balances by $23.3 million in 2008 by lowering our collateral requirements. Short-term investment maturities yielded $4.0 million in 2008.
| | | Year Ended December 31, | |
| | | 2010 | | | 2009 | | | 2008 | |
| Cash provided by (used in) financing activities (in millions) | | $ | 45.9 | | | $ | (38.9 | ) | | $ | 329.6 | |
Cash provided by financing activities for 2010 included $53.1 million, net of tax benefits, in proceeds from the exercise of warrants and stock options (see Note 9 of Notes to Consolidated Financial Statements for more information), while we paid cash dividends of $4.5 million on our preferred stock and made repayments on our capital leases of $1.8 million. In addition, we acquired treasury shares of our common stock having a value of $0.7 million in 2010 as a result of cashless employee stock option exercises . Our financing activities in 2009 included sales of common stock and warrants, which yielded $128.3 million cash, net of related issuance costs. Net proceeds from the stock and warrant sales were applied to repayments of our debt facility totaling $161.7 million and payments totaling $3.0 million pursuant to our interest rate swap. We declared cash dividends of $3.3 million and $0.1 million on our Mandatory Convertible and Series B Preferred Stock in the fourth quarter of 2010, which were paid in January 2011. This represented the last dividend on our 6.5% Mandatory Convertible Preferred Stock, which converted to shares of our common stock in January 2011.
In 2008, we borrowed $380 million on our debt facility for the acquisition of the remaining 70.3% of the Greens Creek joint venture, of which we repaid $218.3 million in 2008 largely from common stock sales totaling $183.4 million. We also incurred loan origination fees in 2008 of $8.1 million versus $1.5 million in 2009, and paid cash dividends totaling $7.4 million in 2008.
Contractual Obligations and Contingent Liabilities and Commitments
The table below presents our fixed, non-cancelable contractual obligations and commitments primarily related to our outstanding purchase orders, certain capital expenditures, our credit facility (as modified by amendments), and lease arrangements as of December 31, 2010 (in thousands):
| | | Payments Due By Period | |
| | | Less than 1 year | | | 1-3 years | | | 3-5 years | | | After 5 years | | | Total | |
Purchase obligations (1) | | $ | 3,268 | | | $ | -- | | | $ | -- | | | $ | -- | | | $ | 3,268 | |
Commitment fees (2) | | | 495 | | | | 1,485 | | | | - - | | | | - - | | | | 1,980 | |
Contractual obligations (3) | | | 1,328 | | | | - - | | | | - - | | | | - - | | | | 1,328 | |
Capital lease commitments (4) | | | 2,876 | | | | 1,913 | | | | 1,448 | | | | 654 | | | | 6,891 | |
Operating lease commitments (5) | | | 2,986 | | | | 5,010 | | | | 2,365 | | | | 1,347 | | | | 11,708 | |
Supplemental executive retirement plan (6) | | | 323 | | | | 657 | | | | 701 | | | | 2,586 | | | | 4,267 | |
| Total contractual cash obligations | | $ | 11,276 | | | $ | 9,065 | | | $ | 4,514 | | | $ | 4,587 | | | $ | 29,442 | |
| (1) | Consist of open purchase orders of approximately $2.2 million at the Greens Creek unit and $1.0 million at the Lucky Friday unit. Included in these amounts are approximately $1.8 million and $0.5 million related to various capital projects at the Greens Creek and Lucky Friday units, respectively. |
| (2) | In October 2009 we entered into a $60 million revolving credit agreement, which was amended in March 2010, July 2010, and December 2010. We are required to pay a standby fee, dependent on our leverage ratio, of between 0.825% and 1.05% per annum on undrawn amounts under the revolving credit agreement. There was no amount drawn under the revolving credit agreement as of December 31, 2010, and the amounts above assume no amounts will be drawn during the agreement’s term. For more information on our credit facility, see Note 6 of Notes to Consolidated Financial Statements. |
| (3) | As of December 31, 2010, we were committed to approximately $1.3 million for various capital projects at the Greens Creek and Lucky Friday units. Total contractual obligations at December 31, 2010 also include approximately $65,000 for commitments relating to non-capital items at Greens Creek. |
| (4) | Represents scheduled capital lease payments of $5.0 million and $1.9 million (including interest), respectively, for equipment at our Greens Creek and Lucky Friday units. These leases have fixed payment terms and contain bargain purchase options at the end of the lease periods. See Note 6 of Notes to Consolidated Financial Statements for more information. |
| (5) | We enter into operating leases in the normal course of business. Substantially all lease agreements have fixed payment terms based on the passage of time. Some lease agreements provide us with the option to renew the lease or purchase the leased property. Our future operating lease obligations would change if we exercised these renewal options and if we entered into additional operating lease arrangements. |
| (6) | There are no funding requirements as of December 31, 2010 under our other defined benefit pension plans. See Note 8 of Notes to Consolidated Financial Statements for more information. |
We record a liability for costs associated with mine closure, reclamation of land and other environmental matters. At December 31, 2010, our liability for these matters totaled $318.8 million, including $262.2 for Hecla Limited’s liability relating to the Coeur d’Alene Basin in northern Idaho, for which no contractual or commitment obligations exist. However, in February of 2011, the negotiators representing Hecla, the Plaintiffs, and the State of Idaho with respect to the Coeur d’Alene Basin environmental litigation and related claims reached an understanding on proposed financial terms to be incorporated into a comprehensive settlement that would contain additional terms yet to be negotiated. While full and final settlement of the l itigation and other claims has not been reached, and there is no assurance that such a settlement will be reached, we believe we will be obligated to make significant cash payments to the Plaintiffs. See the Financial Liquidity and Capital Resources section above for more information on the financial terms of the proposed settlement. Future expenditures related to closure, reclamation and environmental expenditures at our other sites are difficult to estimate, although we anticipate we will make substantial expenditures relating to these obligations over the next 30 years. For additional information relating to our environmental obligations, see Notes 4, 7 and 19 of Notes to Consolidated Financial Statements.
Off-Balance Sheet Arrangements
At December 31, 2010, we had no existing off-balance sheet arrangements, as defined under SEC regulations, that have or are reasonably likely to have a current or future effect on our financial condition, revenues or expenses, results of operations, liquidity, capital expenditures or capital resources that is material to investors.
Critical Accounting Estimates
Our significant accounting policies are described in Note 1 of Notes to Consolidated Financial Statements. As described in Note 1, we are required to make estimates and assumptions that affect the reported amounts and related disclosures of assets, liabilities, revenue, and expenses. Our estimates are based on our experience and our interpretation of economic, political, regulatory, and other factors that affect our business prospects. Actual results may differ significantly from our estimates.
We believe that our most critical accounting estimates are related to future metals prices; obligations for environmental, reclamation, and closure matters; mineral reserves; and accounting for business combinations, as they require us to make assumptions that were highly uncertain at the time the accounting estimates were made and changes in them are reasonably likely to occur from period to period. Management has discussed the development and selection of these critical accounting estimates with the Audit Committee of our board of directors, and the Audit Committee has reviewed the disclosures presented below. In addition, there are other items within our financial statements that require estimation, but are not deemed to be critical. However, changes in estimates used in these and other items could have a materia l impact on our financial statements.
Future Metals Prices
Metals prices are key components in estimates that determine the valuation of some of our significant assets and liabilities, including properties, plants and equipment, deferred tax assets, and certain accounts receivable. As shown under Item 1A. — Risk Factors, metals prices have historically been volatile. While average prices for all four metals we produce performed favorably for the five consecutive years prior to 2008, there was a reduction in the average prices for zinc and lead in 2008 compared to 2007, and average prices for silver, zinc and lead were lower in 2009 compared to 2008. Average prices for all four metals rebounded in 2010 and were higher than their levels in both 2009 and 2008. However, we have recorded impairm ents to our asset carrying value because of low prices in the past, and we can offer no assurance that prices will either remain at their current levels or increase. Future metals prices may also affect the analysis of our ability to pay for environmental remediation or damage settlements.
Processes supporting valuation of our assets and liabilities that are most significantly affected by prices include analyses of asset carrying values, depreciation, and deferred income taxes. On at least an annual basis – and more frequently if circumstances warrant – we examine the carrying values of our assets, our depreciation rates, and the valuation allowances on our deferred tax assets. In our analyses of carrying values and deferred taxes, we apply several pricing views to our forecasting model, including current prices, analyst price estimates, forward-curve prices, and historical prices (see Mineral Reserves, below, regarding prices used for reserve estimates). Using applicable accounting guidance and our view of metals markets, we use the average of the various methods to determine whether the values of our assets are fairly stated, and to determine the level of valuation allowances, if any, on our deferred tax assets. In addition, estimates of future metals prices are used in the valuation of certain assets in the determination of the purchase price allocations for our acquisitions (see Business Combinations below).
Sales of all metals products sold directly to smelters are recorded as revenues when title and risk of loss transfer to the smelter (generally at the time of shipment) at estimated forward metals prices for the estimated month of settlement. Due to the time elapsed from shipment to the smelter to the final settlement with the smelter, we must estimate the prices at which sales of our metals will be settled. Previously recorded sales and trade accounts receivable are adjusted to estimated settlement metals prices until final settlement by the smelter. Changes in metals prices between shipment and final settlement result in changes to revenues and accounts receivable previously recorded upon shipment. As a result, our trade accounts receivable balances are subject to changes in metals prices until final set tlement occurs. For more information, see part O. Revenue Recognition of Note 1 of Notes to Consolidated Financial Statements.
We utilize financially-settled forward contracts to manage our exposure to changes in prices for zinc and lead. See Item 7A. Quantitative and Qualitative Disclosures About Market Risk - Commodity-Price Risk Management below for more information on our contract programs. These contracts do not qualify for hedge accounting and are therefore marked-to-market though earnings each period. Changes in zinc and lead prices between the dates that the contracts are entered into and their settlements will result in changes to the fair value asset or liability associated with the contracts, with a corresponding gain or loss recognized in earnings.
Obligations for Environmental, Reclamation and Closure Matters
The most significant liability on our balance sheet is for accrued reclamation and closure costs. We have conducted considerable remediation work at sites in the United States for which remediation requirements have not been fully determined, nor have they been agreed between us and various regulatory agencies with oversight over the properties. We have estimated our liabilities under appropriate accounting guidance. On at least an annual basis – and more frequently if warranted – management reviews our liabilities with our Audit Committee. However, the range of liability proposed by the plaintiffs in environmental proceedings considerably exceeds the liabilities we have recognized. If substantial damages were awarded, claims were settled, or remediation costs incurred in excess of our accruals, our fina ncial results or condition could be materially adversely affected.
Mineral Reserves
Critical estimates are inherent in the process of determining our reserves. Our reserves are affected largely by our assessment of future metals prices, as well as by engineering and geological estimates of ore grade, accessibility and production cost. Metals prices are estimated at long-term averages, as described in Item 2. — Property Descriptions. Our assessment of reserves occurs at least annually, and periodically utilizes external audits.
Reserves are a key component in valuation of our properties, plants and equipment. Reserve estimates are used in determining appropriate rates of units-of-production depreciation, with net book value of many assets depreciated over remaining estimated reserves. Reserves are also a key component in forecasts, with which we compare future cash flows to current asset values to ensure that carrying values are reported appropriately. Reserves also play a key role in the valuation of certain assets in the determination of the purchase price allocations for acquisitions (see Business Combinations below). Reserves are a culmination of many estimates and are not guarantees that we will recover the indicated quantities of metals.
Business Combinations
We are required to allocate the purchase price of acquired companies to the tangible and intangible assets acquired and liabilities assumed based on their estimated fair values at acquisition date. The valuation of assets acquired and liabilities assumed requires management to make significant estimates and assumptions, especially with respect to long-lived assets, including estimates of future metals prices and mineral reserves, as discussed above. In some cases, we use third-party appraisers to determine the fair values and lives of property and other identifiable assets.
New Accounting Pronouncements
In January 2010, the FASB issued ASU 2010-06, which amends Subtopic 820-10 to require new disclosures on fair value measurements as follows:
| | 1. | The amounts of and reasons for significant transfers in and out of Levels 1 and 2. |
| | 2. | Separate information about purchases, sales, issuances, and settlements in Level 3 fair value measurements. |
ASU 2010-06 also provides amendments to Subtopic 820-10 that clarifies existing fair value measurement disclosures as follows:
| | 1. | A reporting entity should provide fair value measurement disclosures for each class of assets and liabilities. A class is often a subset of assets or liabilities within a line item in the statement of financial position. |
| | 2. | A reporting entity should provide disclosures about the valuation techniques and inputs used to measure fair value for both recurring and nonrecurring fair value measurements. Those disclosures are required for fair value measurements that fall in either Level 2 or Level 3. |
ASU 2010-06 also includes conforming amendments to the guidance on employers’ disclosures about postretirement benefit plan assets (Subtopic 715-20), changes the terminology in Subtopic 715-20 from major categories of assets to classes of assets, and provides a cross reference to the guidance in Subtopic 820-10 on how to determine appropriate classes to present fair value disclosures.
The new disclosures and clarifications of existing disclosures discussed above are effective for interim and annual reporting periods beginning after December 15, 2009, except for the disclosures about purchases, sales, issuances and settlements in the roll forward of activity in Level 3 fair value measurements. Those disclosures are effective for fiscal years beginning after December 15, 2010, and for interim periods within those fiscal years. Adoption of this guidance has not, and is not expected to have a material impact on our consolidated financial statements.
During February 2010, the FASB issued ASU 2010-08, which corrected existing guidance for various topics. The update became generally effective for the first reporting period (including interim periods) beginning after issuance. These conditions did not have a material impact on our consolidated financial statements.
Forward-Looking Statements
The foregoing discussion and analysis, as well as certain information contained elsewhere in this Form 10-K, contain forward-looking statements within the meaning of Section 27A of the Securities Act of 1933, as amended, and Section 21E of the Securities Exchange Act of 1934, as amended, and are intended to be covered by the safe harbor created thereby. See the discussion in Special Note on Forward-Looking Statements included prior to Part I, Item 1.
Item 7A. Quantitative and Qualitative Disclosures about Market Risk
The following discussion about our risk-management activities includes forward-looking statements that involve risk and uncertainties, as well as summarizes the financial instruments held by us at December 31, 2010, which are sensitive to changes in interest rates and commodity prices and are not held for trading purposes. Actual results could differ materially from those projected in the forward-looking statements. In the normal course of business, we also face risks that are either non-financial or non-quantifiable (see Part I, Item 1A. – Risk Factors).
Short-term Investments
From time to time we hold various types of short-term investments that are subject to changes in market interest rates and are sensitive to those changes. We did not carry any such short-term investments as of December 31, 2010.
Commodity-Price Risk Management
At times, we may use commodity forward sales commitments, commodity swap contracts and commodity put and call option contracts to manage our exposure to fluctuation in the prices of certain metals which we produce. Contract positions are designed to ensure that we will receive a defined minimum price for certain quantities of our production, thereby partially offsetting our exposure to price fluctuations. These instruments do, however, expose us to other risks, including the amount by which the contract price differs from the spot price of a commodity, and nonperformance by the counterparties to these agreements.
In April 2010, we began utilizing financially-settled forward contracts to sell lead and zinc at fixed prices for settlement at approximately the same time that our unsettled concentrate sales contracts will settle. The settlement of each concentrate contract is based on the average spot price of the metal during the month of settlement, which may differ from the prices used to record the sale when the sale takes place. The objective of the contracts is to manage the exposure to changes in prices of zinc and lead contained in our concentrate shipments between the time of sale and final settlement. These contracts do not qualify for hedge accounting and are marked-to-market through earnings each period. At December 31, 2010, we recorded a current liability of $2.0 million, which is included in current derivative contract liabilities, for the fair value of the contracts. We recognized a $3.0 million net loss on the contracts during 2010, which is included in sales of products. The net loss recognized on the contracts offset price adjustments on our provisional concentrate sales related to changes to lead and zinc prices between the time of sale and final settlement.
In addition, in May 2010 we began utilizing financially-settled forward contracts to manage the exposure of changes in prices of zinc and lead contained in our forecasted future concentrate shipments. These contracts also do not qualify for hedge accounting and are marked-to-market through earnings each period. At December 31, 2010, we recorded a current liability of $18.0 million, which is included in current derivative contract liabilities, and a non-current liability of $0.8 million, which is included in other non-current liabilities, for the fair value of the contracts. We recognized a $20.8 million net loss on the contracts, including $2.0 million in losses realized on settled contracts, during 2010. The net loss on these contracts is included as a separate line item under other income (expense), as they relate to forecasted future shipments, as opposed to sales that have already taken place but are subject to final pricing. The losses recognized during the 2010 are the result of increasing lead and zinc prices during the end of 2010. However, this program is designed to mitigate the impact of potential future declines in lead and zinc prices from the price levels established in the contracts (see average price information below).
The following table summarizes the quantities of base metals committed under forward sales contracts at December 31, 2010:
| | | Metric tonnes under contract | | | Average price per pound | |
| | | Zinc | | | Lead | | | Zinc | | | Lead | |
| Contracts on provisional sales | | | | | | | | | | | | |
| 2011 settlements | | | 11,575 | | | | 3,925 | | | $ | 1.05 | | | $ | 1.11 | |
| | | | | | | | | | | | | | | | | |
| Contracts on forecasted sales | | | | | | | | | | | | | | | | |
| 2011 settlements | | | 19,475 | | | | 15,550 | | | $ | 0.96 | | | $ | 0.96 | |
| 2012 settlements | | | 21,475 | | | | 15,000 | | | $ | 1.11 | | | $ | 1.11 | |
Interest-Rate Risk Management
Historically we have periodically used derivative financial instruments to manage interest rate risk. In May 2008, we entered into an interest rate swap agreement that had the economic effect of modifying the LIBOR-based variable interest obligations associated with the previous version of our credit facility. As a result, the interest payable related to the term facility balance was to be fixed at a rate of 9.38% until the scheduled maturity on September 30, 2010 pursuant to the amended and restated credit facility. Hedge accounting was applied for this swap and the terms of the interest rate swap agreement including notational amounts, interest rate reset dates, and maturity dates matched the terms of the hedged note to which the swap agreement pertained. At inception and on an ongoing basis, we performed an effectiveness test using the hypothetical derivative method, and the swap was determined to be highly effective at offsetting changes in the fair value of the hedged note. The interest rate swap was designated as a cash flow hedge, and the fair value of the swap was calculated using the discounted cash flow method based on market observable inputs. In October 2009 we repaid the remaining facility balance and settled the remaining fair value liability associated with the swap.
In October 2009 we entered into an amended $60 million revolving credit agreement for a three-year term, which was amended in March 2010, July 2010, and again in December 2010. See Note 6 of Notes to Condensed Consolidated Financial Statements (Unaudited) for more information. We have not drawn on the current revolving credit facility. However, if used, amounts borrowed under the facility would be subject to changes in market interest rates.
Provisional Sales
Sales of all metals products sold directly to smelters, including by-product metals, are recorded as revenues when title and risk of loss transfers to the smelter (generally at the time of shipment) at forward prices for the estimated month of settlement. Due to the time elapsed from shipment to the smelter and the final settlement with the smelter, we must estimate the prices at which sales of our metals will be settled. Previously recorded sales are adjusted to estimated settlement metals prices until final settlement by the smelter. Changes in metals prices between shipment and final settlement will result in changes to revenues previously recorded upon shipment. Metals prices can and often do fluctuate widely and are affected by numerous factors beyond our control (see Item 1A – Risk Factors – A substantial or extended decline in metals prices would have a material adverse effect on us for more information). At December 31, 2010, metals contained in concentrates and exposed to future price changes totaled approximately 1.3 million ounces of silver, 6,035 ounces of gold, 16,726 tons of zinc, and 4,613 tons of lead. If the price for each metal were to change by one percent, the change in the total value of the concentrates sold would be approximately $1.0 million. However, as noted in Commodity-Price Risk Management above, in April 2010 we initiated a program designed to mitigate the risk of negative price adjustments with limited mark-to-market financially-settled forward contracts for our zinc and lead sales.
Item 8. Financial Statements and Supplementary Data
Our Consolidated Financial Statements are included herein beginning on page F-1. Financial statement schedules are omitted as they are not applicable or the information required is included in the Consolidated Financial Statements.
The following table sets forth supplementary financial data (in thousands, except per share amounts) for each quarter of the years ended December 31, 2010 and 2009, derived from our unaudited financial statements. The data set forth below should be read in conjunction with and is qualified in its entirety by reference to our Consolidated Financial Statements.
| | | Fourth Quarter | | | Third Quarter | | | Second Quarter | | | First Quarter | | | Total | |
| 2010 | | | | | | | | | | | | | | | |
| Sales of products | | $ | 134,460 | | | $ | 115,847 | | | $ | 88,631 | | | $ | 79,875 | | | $ | 418,813 | |
| Gross profit | | $ | 74,693 | | | $ | 54,524 | | | $ | 38,066 | | | $ | 27,536 | | | $ | 194,819 | |
Net income (loss) 1,2 | | $ | (9,736 | ) | | $ | 19,791 | | | $ | 17,084 | | | $ | 21,844 | | | $ | 48,983 | |
| Preferred stock dividends | | $ | (3,408 | ) | | $ | (3,408 | ) | | $ | (3,409 | )) ) | | $ | (3,408 | ) | | $ | (13,633 | ) |
| Income (loss) applicable to common shareholders | | $ | (13,144 | ) | | $ | 16,383 | | | $ | 13,675 | | | $ | 18,436 | | | $ | 35,350 | |
| Basic income (loss) per common share | | $ | (0.05 | ) | | $ | 0.06 | | | $ | 0.06 | | | $ | 0.08 | | | $ | 0.14 | |
| Diluted income (loss) per common share | | $ | (0.05 | ) | | $ | 0.06 | | | $ | 0.05 | | | $ | 0.07 | | | $ | 0.13 | |
| | | | | | | | | | | | | | | | | | | | | |
| 2009 | | | | | | | | | | | | | | | | | | | | |
| Sales of products | | $ | 88,036 | | | $ | 95,181 | | | $ | 74,610 | | | $ | 54,721 | | | $ | 312,548 | |
| Gross profit | | $ | 35,928 | | | $ | 38,116 | | | $ | 17,157 | | | $ | 9,868 | | | $ | 101,069 | |
| Net income | | $ | 32,068 | | | $ | 25,946 | | | $ | 2,499 | | | $ | 7,313 | | | $ | 67,826 | |
| Preferred stock dividends | | $ | (3,408 | ) | | $ | (3,408 | ) | | $ | (3,409 | )) ) | | $ | (3,408 | ) | | $ | (13,633 | ) |
| Income (loss) applicable to common shareholders | | $ | 28,660 | | | $ | 22,538 | | | $ | (910 | ) | | $ | 3,905 | | | $ | 54,193 | |
| Basic income per common share | | $ | 0.12 | | | $ | 0.10 | | | $ | 0.00 | | | $ | 0.02 | | | $ | 0.24 | |
| Diluted income per common share | | $ | 0.11 | | | $ | 0.09 | | | $ | 0.00 | | | $ | 0.02 | | | $ | 0.23 | |
| | 1) | In the fourth quarter of 2010, we recorded an accrual of $193.2 million to increase our accrual for environmental obligations in Idaho’s Coeur d’Alene Basin pursuant to settlement discussions with the Plaintiffs in the Basin environmental litigation and the State of Idaho. See Note 19 of Notes to Consolidated Financial Statements for further discussion. |
| | 2) | In the fourth quarter of 2010, we removed substantially all of the valuation allowance on our deferred tax assets, resulting in a $80.4 million income tax benefit. We also recorded a $7.7 million tax benefit as a result of reducing the valuation allowance on our deferred tax assets in the first quarter of 2010, and recorded a $7.1 million tax benefit in the fourth quarter of 2009. For additional information, see Note 5 of Notes to Consolidated Financial Statement. |
Item 9. Changes in and Disagreements with Accountants on Accounting and Financial Disclosures
None.
Item 9A. Controls and Procedures
Disclosure Controls and Procedures
An evaluation was performed under the supervision and with the participation of our management, including the Chief Executive Officer (“CEO”) and Chief Financial Officer (“CFO”), of the effectiveness of the design and operation of our disclosure controls and procedures. Based on that evaluation, our CEO and CFO concluded that our disclosure controls and procedures were effective as of December 31, 2010, in ensuring them in a timely manner that material information required to be disclosed in this report has been properly recorded, processed, summarized and reported.
Management’s Annual Report on Internal Control over Financial Reporting
Management is responsible for establishing and maintaining adequate internal control over our financial reporting, which is designed to provide reasonable assurance regarding the reliability of financial reporting and the preparation of financial statements for external purposes in accordance with generally accepted accounting principles in the United States of America.
Because of its inherent limitations, any system of internal control over financial reporting, no matter how well designed, may not prevent or detect misstatements due to the possibility that a control can be circumvented or overridden or that misstatements due to error or fraud may occur that are not detected. Also, because of changes in conditions, internal control effectiveness may vary over time.
Management assessed the effectiveness of our internal control over financial reporting as of December 31, 2010, using criteria established in Internal Control-Integrated Framework issued by the Committee of Sponsoring Organizations of the Treadway Commission (“COSO”) and concluded that we have maintained effective internal control over financial reporting as of December 31, 2010, based on these criteria.
An evaluation was performed under the supervision and with the participation of management, including the Chief Executive Officer (“CEO”) and Chief Financial Officer (“CFO”), of the effectiveness of the design and operation of our disclosure controls and procedures as required by Exchange Act Rules 13a-15(e) and 15(d)-15(e) as of the end of the reporting period covered by this report. Based on that evaluation, our CEO and CFO concluded that our disclosure controls and procedures, including controls and procedures designed to ensure that information required to be disclosed by us is accumulated and communicated to our management (including our CEO and CFO), were effective as of December 31, 2010, in ensuring then in a timely manner that material information required to be disclosed in this report has been properly recorded, processed, summarized and reported.
Our internal control over financial reporting as of December 31, 2010 has been audited by BDO USA, LLP, an independent registered public accounting firm, as stated in the attestation report which is included herein.
Report of Independent Registered Public Accounting Firm
Board of Directors and Shareholders
Hecla Mining Company
Coeur d’Alene, Idaho
We have audited Hecla Mining Company’s internal control over financial reporting as of December 31, 2010, based on criteria established in Internal Control – Integrated Framework issued by the Committee of Sponsoring Organizations of the Treadway Commission (the COSO criteria). Hecla Mining Company’s management is responsible for maintaining effective internal control over financial reporting and for its assessment of the effectiveness of internal control over financial reporting, included in the accompanying Item 9A, Management’s Report on Internal Control Over Financial Reporting. Our responsibility is to express an opinion on the company’s internal control over financial r eporting based on our audit.
We conducted our audit in accordance with the standards of the Public Company Accounting Oversight Board (United States). Those standards require that we plan and perform the audit to obtain reasonable assurance about whether effective internal control over financial reporting was maintained in all material respects. Our audit included obtaining an understanding of internal control over financial reporting, assessing the risk that a material weakness exists, and testing and evaluating the design and operating effectiveness of internal control based on the assessed risk. Our audit also included performing such other procedures as we considered necessary in the circumstances. We believe that our audit provides a reasonable basis for our opinion.
A company’s internal control over financial reporting is a process designed to provide reasonable assurance regarding the reliability of financial reporting and the preparation of financial statements for external purposes in accordance with generally accepted accounting principles. A company’s internal control over financial reporting includes those policies and procedures that (1) pertain to the maintenance of records that, in reasonable detail, accurately and fairly reflect the transactions and dispositions of the assets of the company; (2) provide reasonable assurance that transactions are recorded as necessary to permit preparation of financial statements in accordance with generally accepted accounting principles, and that receipts and expenditures of the company are being made only in accordance wi th authorizations of management and directors of the company; and (3) provide reasonable assurance regarding prevention or timely detection of unauthorized acquisition, use, or disposition of the company’s assets that could have a material effect on the financial statements.
Because of its inherent limitations, internal control over financial reporting may not prevent or detect misstatements. Also, projections of any evaluation of effectiveness to future periods are subject to the risk that controls may become inadequate because of changes in conditions, or that the degree of compliance with the policies or procedures may deteriorate.
In our opinion, Hecla Mining Company maintained, in all material respects, effective internal control over financial reporting as of December 31, 2010, based on the COSO criteria.
We also have audited, in accordance with the standards of the Public Company Accounting Oversight Board (United States), the consolidated balance sheets of Hecla Mining Company as of December 31, 2010 and 2009, and the related consolidated statements of operations and comprehensive income (loss), shareholders’ equity, and cash flows for each of the three years in the period ended December 31, 2010 and our report dated February 25, 2011 expressed an unqualified opinion thereon.
/s/ BDO USA, LLP
Spokane, Washington
February 25, 2011
Changes in Internal Control over Financial Reporting
There have been no changes in our internal controls over financial reporting during the quarter ended December 31, 2010, that have materially affected, or are reasonably likely to materially affect, our internal controls over financial reporting.
Item 9B. Other Information
None.
PART III
Item 10. Directors and Executive Officers of the Registrant
In accordance with Hecla Mining Company’s Certificate of Incorporation, our Board of Directors is divided into three classes. The terms of office of the directors in each class expire at different times. The directors are elected for three-year terms. The Effective Dates listed below for each director is their current term of office. All officers are elected for a term, which ordinarily expires on the date of the meeting of the Board of Directors immediately following the Annual Meeting of Shareholders. The positions and ages listed below are as of the date of our next Annual Meeting of Shareholders in May 2011. There are no arrangements or understandings between any of the directors or officers and any other person(s) pursuant to which such officers were elected.
| | Age at May 3, 2011 | | Position and Committee Assignments | | Current Base Term |
| Phillips S. Baker, Jr. | 51 | | President and CEO, Director (1) | | 5/10 — 5/11 5/08 — 5/11 |
| James A. Sabala | 56 | | Senior Vice President and Chief Financial Officer | | 5/10 — 5/11 |
| Dr. Dean W.A. McDonald | 53 | | Vice President – Exploration | | 5/10 — 5/11 |
| Don Poirier | 52 | | Vice President – Corporate Development | | 5/10 – 5/11 |
| David C. Sienko | 42 | | Vice President and General Counsel | | 5/10 – 5/11 |
| John H. Bowles | 65 | | Director (1,2,5) | | 5/09 — 5/12 |
| David J. Christensen | 49 | | Director (1,2,3) | | 5/08 — 5/11 |
| Ted Crumley | 66 | | Director and Chairman of the Board (1,4) | | 5/10 — 5/13 |
| George R. Nethercutt, Jr. | 66 | | Director (3,4) | | 5/09 — 5/12 |
| Terry V. Rogers | 64 | | Director (2,4,5) | | 5/10 – 05/13 |
| Charles B. Stanley | 52 | | Director (2,5) | | 5/10 – 05/13 |
| Dr. Anthony P. Taylor | 69 | | Director (3,4,5) | | 5/08 — 5/11 |
| (1) | Member of Executive Committee |
| (2) | Member of Audit Committee |
| (3) | Member of Corporate Governance and Directors Nominating Committee |
| (4) | Member of Compensation Committee |
| (5) | Member of Health, Safety, Environmental and Technical Committee |
Phillips S. Baker, Jr., has been our Chief Executive Officer since May 2003; President since November 2001; and a director since November 2001. Prior to that, Mr. Baker was our Chief Financial Officer from May 2001 to June 2003; Chief Operating Officer from November 2001 to May 2003; and Vice President from May 2001 to November 2001. Prior to joining us, Mr. Baker served as Vice President and Chief Financial Officer of Battle Mountain Gold Company (a gold mining company) from March 1998 to January 2001. Mr. Baker served as a director of Questar Corporation (a U.S. natural gas-focused exploration and production, interstate pipeline and local distribution company) from February 2004 to June 2010, and has served as a director for QEP Resources, Inc. (a leading independent natural gas and oil explor ation and production company) since May 2010.
James A. Sabala was appointed Chief Financial Officer in May 2008 and Senior Vice President in March 2008. Prior to his employment with Hecla, Mr. Sabala was Executive Vice President – Chief Financial Officer of Coeur d’Alene Mines Corporation (a mining company) from 2003 to February 2008. Mr. Sabala also served as Vice President – Chief Financial Officer of Stillwater Mining Company (a mining company) from 1998 to 2002.
Dr. Dean W.A. McDonald was appointed Vice President – Exploration in August 2006. Dr. McDonald has also been our Vice President – Exploration of our Canadian subsidiary, Hecla Canada Ltd., since January 2007. Prior to joining Hecla, Dr. McDonald was Vice President Exploration and Business Development for Committee Bay Resource Ltd. (a Canadian-based exploration and development company) from 2003 to August 2006 and Exploration Manager at Miramar Mining Company/Northern Orion Explorations (an exploration company) from 1996 to 2003.
Don Poirier was appointed Vice President – Corporate Development in July 2007. Mr. Poirier has also been our Vice President – Corporate Development of our Canadian subsidiary, Hecla Canada Ltd. since January 2007. Prior to joining Hecla, Mr. Poirier was a mining analyst with Blackmont Capital (capital market specialists) from September 2002 to June 2007. Mr. Poirier held other mining analyst positions from 1988 to 2002.
David C. Sienko was appointed Vice President and General Counsel in January 2010. Prior to his appointment, Mr. Sienko was a partner of, and practiced law with K&L Gates LLP (a law firm) and its predecessor, Bell, Boyd & Lloyd, LLP, from 2004 to January 2010, where he specialized in counseling public and private entities on compliance with securities laws and trading market rules, mergers and acquisitions, and corporate governance. Mr. Sienko was also an associate at Bell, Boyd & Lloyd, LLP from 2000 to 2004 and an associate in the Corporate and Securities Section of Locke Lord Bissell & Liddell LLP (a law firm) from 1998 to 2000, as well as an attorney with the Division of Enforcement at the U.S. Securities Exchange Commission from 1995 to 1998.
David J. Christensen previously served as a director from May 2002 to October 2002, when he was elected to the Board of Directors by preferred shareholders in May 2002. He was re-appointed to Hecla’s Board of Directors in August 2003. The payment of the dividends in arrears in July 2005 resulted in the elimination of this director position, at such time he was then appointed to the Board of Directors when the number of director positions was increased from seven to nine. Mr. Christensen has been Chief Executive Officer of ASA Limited (a closed-end investment company) since February 2009, as well as being appointed to the board of directors of ASA Limited in November 2008. He served as Vice President – Investments of ASA Limited from May 2007 to February 2009. He served as Vice President o f Corporate Development for Gabriel Resources Ltd. (a Canadian-based resource company) from October 2006 to February 2008.
John H. Bowles was elected by the shareholders to Hecla’s Board of Directors in May 2006. Mr. Bowles was a partner in the Audit and Assurance Group of PricewaterhouseCoopers LLP (an accounting firm) from April 1976 until his retirement in June 2006. He concentrated his practice on public companies operating in the mining industry. Mr. Bowles was a Director of HudBay Minerals Inc. (a zinc, copper, gold and silver mining company) from May 2006 to March 2009. He has also served as a Director of Boss Power Corp. (a mineral exploration company) since September 2007. He holds Fellowships in both the British Columbia Institute of Chartered Accountants and the Canadian Institute of Mining and Metallurgy. Mr. Bowles has been the Treasurer of Mining Suppliers Association of Bri tish Columbia (an association of providers of equipment, products and related services to the British Columbia mining industry) since May 1999. He has been Director Emeritus of Ducks Unlimited Canada since March 1996.
Ted Crumley has served as a director since 1995 and became Chairman of the Board in May 2006. Mr. Crumley served as the Executive Vice President and Chief Financial Officer of OfficeMax Incorporated (a distributor of office products) from January 2005 until his retirement in December 2005, and as Senior Vice President from November 2004 to January 2005. Prior to that, Mr. Crumley was Senior Vice President and Chief Financial Officer of Boise Cascade Company (a wood and paper company), from 1994 to 2004.
George R. Nethercutt, Jr., was appointed to Hecla’s Board of Directors in February 2005. Mr. Nethercutt has served as a principal of Nethercutt Consulting LLC (a strategic planning and consulting firm), since January 2007. Prior to that, Mr. Nethercutt was a principal of Lundquist, Nethercutt & Griles, LLC (a strategic planning and consulting firm) from February 2005 to January 2007. Mr. Nethercutt has also been a board member for the Washington Policy Center (a premiere public policy organization providing high quality analysis on issues relating to the free market and government regulation) since January 2005. In September 2009, Mr. Nethercutt was appointed Of Counsel with the law firm of Lee & Hayes PLLC. Mr. Nethercutt serves as a board member of ARCADIS Corporat ion (an international company providing consultancy, engineering and management services), the Juvenile Diabetes Research Foundation International (a charity and advocate of juvenile diabetes research worldwide), and served as U.S. Chairman of the Permanent Joint Board on Defense – U.S./Canada from April 2005 to December 2009. He is the founder and Chairman of the George Nethercutt Foundation (a charitable non-profit educational foundation) formed in February 2007. From 1995 to 2005, Mr. Nethercutt served in the U.S. House of Representatives, including House Appropriations subcommittees on Interior, Agriculture and Defense and the Science Committees subcommittee on Energy. He has been a member of the Washington State Bar Association since 1972.
Charles B. Stanley was elected to Hecla’s Board of Directors in May 2007. Mr. Stanley has been the Chief Executive Officer, President and Director of QEP Resources, Inc. (a leading independent natural gas and oil exploration and production company) since May 2010. He served as Chief Operating Officer of Questar Corporation (a U.S. natural gas-focused exploration and production, interstate pipeline and local distribution company) from March 2008 to June 2010, and also as its Executive Vice President and Director from February 2002 to June 2010.
Terry V. Rogers was elected to Hecla’s Board of Directors in May 2007. Mr. Rogers was the Senior Vice President and Chief Operating Officer of Cameco Corporation (the world’s largest uranium producer) from February 2003 until his retirement in June 2007. Mr. Rogers also served as President of Kumtor Operating Company (a gold producing company and a division of Cameco Corporation) from 1999 to 2003.
Dr. Anthony P. Taylor has served as a director since May 2002 upon election by preferred shareholders. The payment of the dividends in arrears in July 2005 resulted in the elimination of this director position. At such time he was then appointed to the Board of Directors when the number of director positions was increased from seven to nine. Dr. Taylor is Executive Chairman of Crown Gold Corporation (a public Canadian minerals exploration company), after serving as CEO and Director of Gold Summit Corporation (a public Canadian minerals exploration company) since October 2003. He also served as President from October 2003 to October 2009. Dr. Taylor has also served as President and Director of Caughlin Preschool Corporation (a private Nevada corporation that operates a preschool) since Octob er 2001 and was a director of Greencastle Resources Corporation (an exploration company) from December 2003 to June 2008. Prior to that, Dr. Taylor was President, Chief Executive Officer and Director of Millennium Mining Corporation (a private Nevada minerals exploration company) from January 2000 to October 2003.
Information with respect to our directors is set forth under the caption “Proposal 1 - Election of Directors” in our proxy statement to be filed pursuant to Regulation 14A for the annual meeting scheduled to be held on May 3, 2011 (the Proxy Statement), which information is incorporated herein by reference.
Reference is made to the information set forth in the first paragraph under the caption “Audit Committee Report – Membership and Role of the Audit Committee,” and under the caption “Corporate Governance” in the Proxy Statement to be filed pursuant to Regulation 14A, which information is incorporated herein by reference.
Reference is made to the information set forth under the caption “Section 16(a) Beneficial Ownership Reporting Compliance” in the Proxy Statement to be filed pursuant to Regulation 14A, which information is incorporated herein by reference.
Reference is made to the information set forth under the caption “Available Information” in Item 1 for information about the Company’s Code of Business Conduct and Ethics, which information is incorporated herein by reference.
There have been no material changes to the procedures by which shareholders may recommend director nominees.
Item 11. Executive Compensation
Reference is made to the information set forth under the caption “Compensation of Non-Management Directors;” the caption “Compensation Discussion and Analysis;” the caption “Compensation Committee Interlocks and Insider Participation;” the caption “Compensation Committee Report,” the caption “Compensation Tables;” the first paragraph under the caption “Board of Directors and Committee Information;” and under the caption “Other Benefits” in the Proxy Statement to be filed pursuant to Regulation 14A, which information is incorporated herein by reference.
Item 12. Security Ownership of Certain Beneficial Owners and Management and Related Stockholder Matters
Reference is made to the information set forth under the caption “Security Ownership of Certain Beneficial Owners and Management” and the caption “Equity Compensation Plan Information” in the Proxy Statement to be filed pursuant to Regulation 14A, which information is incorporated herein by reference.
Item 13. Certain Relationships and Related Transactions
Reference is made to the information set forth in the Proxy Statement to be filed pursuant to Regulation 14A, which information is incorporated herein by reference.
Item 14. Principal Accounting Fees and Services
Reference is made to the information set forth under the caption “Audit Fees – Audit and Non-Audit Fees” in the Proxy Statement to be filed pursuant to Regulation 14A, which information is incorporated herein by reference. Reference is made to the information set forth under the caption “Audit Fees – Policy on Audit Committee Pre-Approval of Audit and Non-Audit Services of Independent Auditor” in the Proxy Statement to be filed pursuant to Regulation 14A, which information is incorporated herein by reference.
Item 15. Exhibits, Financial Statement Schedules and Reports on Form 8-K
| (a) | (1) | Financial Statements |
| | | |
| | | See Index to Financial Statements on Page F-1 |
| | | |
| (a) | (2) | Financial Statement Schedules |
| | | |
| | | Not applicable |
| | | |
| (a) | (3) | Exhibits |
| | | |
| | | See Exhibit Index following the Financial Statements |
Signatures
Pursuant to the requirements of Section 13 or 15(d) of the Securities Exchange Act of 1934, the registrant has duly caused this report to be signed on its behalf by the undersigned, thereunto duly authorized.
| | HECLA MINING COMPANY | |
| | | | |
| | | | |
| | By: | /s/ Phillips S. Baker, Jr. | |
| | | Phillips S. Baker, Jr., President, Chief Executive Officer and Director | |
| | | | |
| | Date: | February 25, 2011 | |
| | | | |
| | | | |
Pursuant to the requirements of the Securities Exchange Act of 1934, this report has been signed below by the following persons on behalf of the registrant and in the capacities and on the dates indicated.
| /s/ Phillips S. Baker, Jr. | | 2/25/11 | | /s/ Ted Crumley | | 2/25/11 |
Phillips S. Baker, Jr. President, Chief Executive Officer and Director (principal executive officer) | | Date | | Ted Crumley Director | | Date |
| | | | | | | |
| /s/ James A. Sabala | | 2/25/11 | | /s/ Charles B. Stanley | | 2/25/11 |
James A. Sabala Senior Vice President and Chief Financial Officer (principal financial and accounting officer) | | Date | | Charles B. Stanley Director | | Date |
| | | | | | | |
| /s/ John H. Bowles | | 2/25/11 | | /s/ George R. Nethercutt, Jr. | | 2/25/11 |
John H. Bowles Director | | Date | | George R. Nethercutt, Jr. Director | | Date |
| | | | | | | |
| /s/ David J. Christensen | | 2/25/11 | | /s/ Terry V. Rogers | | 2/25/11 |
David J. Christensen Director | | Date | | Terry V. Rogers Director | | Date |
| | | | | | | |
| /s/ Anthony P. Taylor | | 2/25/11 | | | | |
Anthony P. Taylor Director | | Date | | | | |