May 24, 2013
VIA EDGAR
Ms. Tia L. Jenkins Senior Assistant Chief Accountant Office of Beverages, Apparel, and Mining Division of Corporation Finance Securities and Exchange Commission 100 F Street, N.E. Washington, D.C. 20549 |
Re: | Hecla Mining Company Filed February 25, 2013 File No. 001-08491 |
Dear Ms. Jenkins:
This letter responds to the comments contained in your letter dated May 14, 2013, regarding the annual report on Form 10-K for the fiscal year ended December 31, 2012 of Hecla Mining Company (the “Company”). For convenience, each of your comments is repeated below, with responses immediately following.
Form 10-K for the Year Ended December 31, 2012
Item 7. Management ’s Discussion and Analysis of Financial Condition and Results of Operations, page 32
Results of Operations, page 34
1. | We note that the sum of the average price realized per ounce/pound multiplied by the payable metal quantities sold for silver, gold, zinc and lead does not appear to agree to the reported total sales of products of $321,143. Please provide your calculations reconciling these amounts. |
Response: Our revenue recognition policy summarized inN. Revenue Recognition and Smelter Accounts Receivableof Note 1: Summary of Significant Accounting Policies ofNotes to Consolidated Financial Statements states: “Sales and accounts receivable for concentrate shipments to smelters are recorded net of charges by the smelters for treatment, refining, smelting losses, and other charges negotiated by us with the smelters.” We elaborate on the smelter charges further in our note: “Costs charged by smelters include fixed treatment and refining costs per ton of concentrate, and also include price escalators which allow the smelters to participate in the increase of lead and zinc prices above a negotiated baseline.”
Ms. Tia L. Jenkins
May 24, 2013
Page 2
For the year ended December 31, 2012, we incurred $48.1 million in smelter charges which are netted against gross revenues inSales of products on ourConsolidated Statements of Operations Comprehensive Income. The following is a calculation of gross revenues by metal and sales of products (gross revenues net of smelter charges) for the year ended December 31, 2012:
Metal | Payable Metal Sold | Realized Prices | Sales of products (in thousands) | |||||||||
| (1) | (2) | (1) X (2) | ||||||||||
Gold (oz) | 43,133 | $ | 1,687.00 | $ | 72,757 | |||||||
Silver (oz) | 5,430,252 | $ | 32.11 | 174,379 | ||||||||
Lead (tons) | 15,733 | $ | 0.96 | 30,074 | ||||||||
Zinc (tons) | 50,895 | $ | 0.90 | 91,998 | ||||||||
Gross revenues | 369,208 | |||||||||||
Less: Smelter charges* | (48,065 | ) | ||||||||||
Sales of products | $ | 321,143 | ||||||||||
* Smelter charges include treatment costs, refining costs, smelter losses, and price escalators.
2. | To enhance an investor’s understanding of your business, please provide us with, and confirm that you will include in future filings, the amount of revenues derived from sales of silver, gold, lead and zinc for each of the periods presented. |
Response: Sales of products by metal for the years ended December 31, 2012, 2011, and 2010 is as follows (in thousands):
Sales of products by metal | ||||||||||||
2012 | 2011 | 2010 | ||||||||||
Silver | $ | 174,379 | $ | 286,637 | $ | 212,498 | ||||||
Gold | 72,757 | 69,964 | 72,947 | |||||||||
Lead | 30,074 | 69,482 | 78,961 | |||||||||
Zinc | 91,998 | 107,585 | 121,280 | |||||||||
Less: Smelter charges | (48,065 | ) | (56,033 | ) | (66,873 | ) | ||||||
Sales of products | $ | 321,143 | $ | 477,634 | $ | 418,813 | ||||||
Ms. Tia L. Jenkins
May 24, 2013
Page 3
As discussed in the response to Comment 1. above, sales of products are reported net of smelter charges, which include treatment costs, refining costs, smelter losses, and price escalators.
In future Forms 10-Q and 10-K, this information will be included for each period being presented in theResults of Operations section ofManagement’s Discussion and Analysis of Financial Condition and Results of Operations, starting with the Form 10-Q for the quarter ended June 30, 2013.
Reconciliation of Total Cash Costs (non-GAAP) to Cost of Sales and Other Direct ProductionCosts and Depreciation, Depletion and Amortization (GAAP), page 42
3. | We note you present the non-GAAP measure of cash cost per silver ounce of $2.70, computed by deducting by-product sales of gold, lead and zinc (“by-product credits”). We believe the offset of by-product credits to your production costs suggests you incurred no mining costs for silver, which in actuality is not the case. We believe the significance of by-product credits to your operations can be described textually in a manner that investors can understand without including the item as an adjustment in the computation of your non- GAAP measure. In future filings please modify your computation of this measure so as not to include the by-product credit. Please provide us with draft disclosures that you plan to include in future filings. |
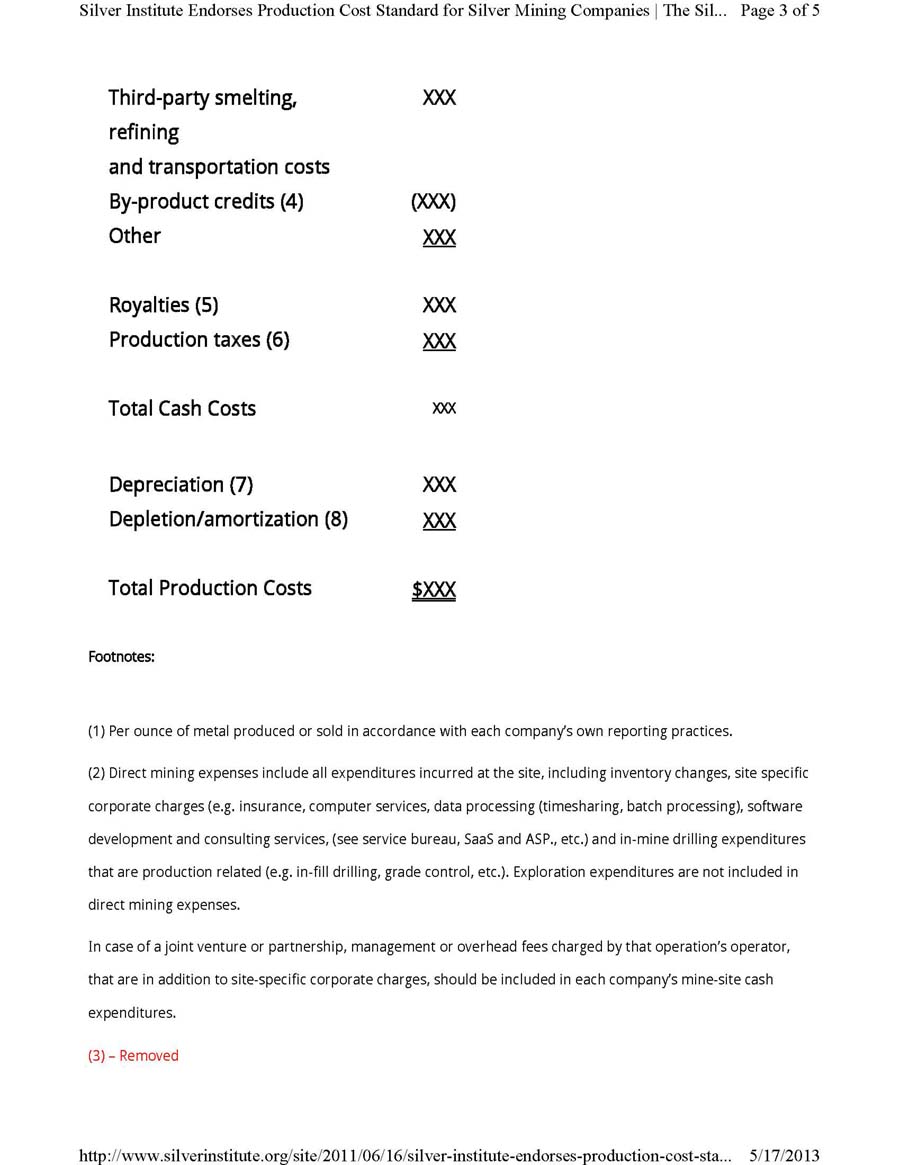
Response: The Company adheres to the cash costs standard endorsed by the Silver Institute (and previously, the Gold Institute), which encourages use of the standard within the silver mining industry. The standard is also universally accepted by the gold mining industry, and is widely used by both the analytical and investing communities as a common tool for measuring the operating costs of mines across a spectrum of differing geologic and metallurgical characteristics. It does not supplant the GAAP measure but instead provides an additional tool that is useful to the investing public. In addition, in theGreens Creek Segment andLucky Friday Segmentsections ofResults of Operations ofItem 7: Management’s Discussion and Analysis of Financial Condition and Results of Operationsof our Form 10-K, we disclose “we periodically review our revenues to ensure that reporting of primary products and by-products is appropriate.”Accordingly, we regularly revisit this approach to confirm its appropriateness. Further, inclusion of by-product credits in cost per ounce constitutes an industry-standard measure of our performance vis-à-vis our peer companies, as well as our own prior performance. Were we to eliminate by-product credits completely from the cash cost measure, we believe the result would be a lack of comparability between the non-GAAP measures of the Company and other primary silver producers. The standard can be found athttp://www.silverinstitute.org/site/2011/06/16/silver-institute-endorses-production-cost-standard-for-silver-mining-companies/, and is also appended to this letter.
Ms. Tia L. Jenkins
May 24, 2013
Page 4
In the Company’s Form 10-K for the year ended December 31, 2012, total by-product credits for each operation were depicted graphically in a manner that allows investors to understand the magnitude of such credits on pages 37 and 40. In response to the Staff’s comments, the Company proposes to expand its discussion of cost per ounce in future filings of Forms 10-K and 10-Q inManagement’s Discussion and Analysis of Financial Condition and Results of Operations to explicitly focus investors on by-product credits and to provide a more fulsome discussion of the nature of such credits in the manner described below, using as an example Form 10-K for the year ended December 31, 2012:
Greens Creek Segment
The chart below illustrates the factors contributing to the variances in total cash costs per silver ounce for 2012 compared to 2011 and 2010:
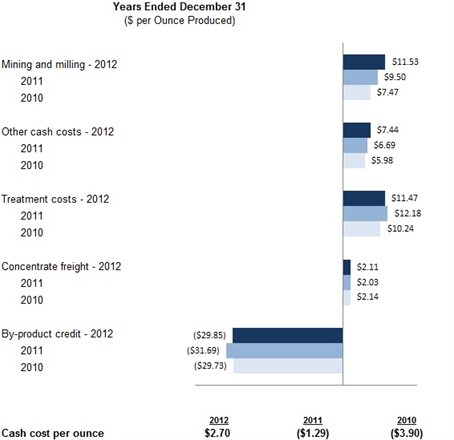
As set forth above, cash cost per ounce in 2012 was $2.70 per ounce, consisting of $32.55 per ounce of cash operating costs and $29.85 per ounce of by-product credits. In 2011, cash cost per ounce was negative $1.29 per ounce due to the fact that by-product credits of $31.69 per ounce exceeded the per ounce cash operating costs of $30.40 per ounce. Similarly, in 2010, cash cost per ounce was negative $3.90, as by-product credits of $29.73 per ounce exceeded cash operating costs of $25.83 per ounce.
Ms. Tia L. Jenkins
May 24, 2013
Page 5
Lucky Friday Segment
The chart below illustrates the factors contributing to the variances in total cash costs per silver ounce for 2011 and 2010:

As set forth above, cash cost per ounce in 2011 was $6.47 per ounce, consisting of $2.69 per ounce of cash operating costs and by-product credits of $16.22 per ounce. In 2010, cash cost per ounce was $3.76 per ounce, consisting of $19.48 per ounce in cash operating costs, partially offset by $15.72 per ounce in by-product credits.
Reconciliation of Total Cash Costs (non-GAAP) to Cost of Sales and Other Direct Production Costs and Depreciation, Depletion and Amortization (GAAP)
The tables below present reconciliations between non-GAAP total cash costs to cost of sales and other direct production costs and depreciation, depletion and amortization (GAAP) for our operations at the Greens Creek and Lucky Friday units for the years ended December 31, 2012, 2011 and 2010 (in thousands, except costs per ounce).
Ms. Tia L. Jenkins
May 24, 2013
Page 6
Total cash costs include all direct and indirect operating cash costs related directly to the physical activities of producing metals, including mining, processing and other plant costs, third-party refining expense, on-site general and administrative costs, royalties and mining production taxes, net of by-product revenues earned from all metals other than the primary metal produced at each unit. Total cash costs provide management and investors an indication of net cash flow, after consideration of the realized price received for production sold. Management also uses this measurement for the comparative monitoring of performance of our mining operations period-to-period from a cash flow perspective. “Total cash cost per ounce” is a measure developed by precious metals companies in an effort to provide a uniform standard for comparison purposes; however, there can be no assurance that our reporting of this non-GAAP measure is similar to that reported by other mining companies.
As depicted graphically in The Greens Creek Segment and The Lucky Friday Segment sections above, by-product credits comprise an essential element of our unit cost structure. By-product credits constitute an important competitive distinction for our silver operations due to the polymetallic nature of their orebodies. Total by-product credits included in our presentation of cost per ounce include:
By-product value, all silver properties: | ||||||||||||
Zinc | $ | 84,087 | $ | 109,708 | $ | 121,557 | ||||||
Gold | 75,860 | 71,794 | 68,330 | |||||||||
Lead | 30,969 | 72,870 | 77,385 | |||||||||
Total by-product credits | $ | 190,916 | $ | 254,372 | $ | 267,272 |
By-product value per ounce of silver produced, all silver properties: | ||||||||||||
Zinc | $ | 13.16 | $ | 11.57 | $ | 11.51 | ||||||
Gold | 11.86 | 7.57 | 6.47 | |||||||||
Lead | 4.84 | 7.68 | 7.32 | |||||||||
Total by-product credits | $ | 29.86 | $ | 26.82 | $ | 25.30 |
Cost of sales and other direct production costs and depreciation, depletion and amortization, is the most comparable financial measure calculated in accordance with GAAP to total cash costs. The sum of the cost of sales and other direct production costs and depreciation, depletion and amortization for our operating units in the tables below is presented in our Consolidated Statement of Operations and Comprehensive Income (Loss).
Ms. Tia L. Jenkins
May 24, 2013
Page 7
Total, All Properties | ||||||||||||
Year ended December 31, | ||||||||||||
2012 | 2011 | 2010 | ||||||||||
Total cash costs | $ | 17,262 | $ | 10,934 | $ | (15,435 | ) | |||||
Divided by silver ounces produced | 6,394 | 9,483 | 10,566 | |||||||||
Total cash cost per silver ounce produced | $ | 2.70 | $ | 1.15 | $ | (1.46 | ) | |||||
Reconciliation to GAAP: | ||||||||||||
Total cash costs | $ | 17,262 | $ | 10,934 | $ | (15,435 | ) | |||||
Depreciation, depletion and amortization | 43,522 | 47,066 | 60,011 | |||||||||
Treatment costs | (73,355 | ) | (99,019 | ) | (92,144 | ) | ||||||
By-product credits | 190,916 | 254,372 | 267,272 | |||||||||
Change in product inventory | (1,381 | ) | (4,805 | ) | 3,660 | |||||||
Suspension-related costs1 | — | 4,135 | — | |||||||||
Reclamation and other costs | 663 | (44 | ) | 630 | ||||||||
Cost of sales and other direct production costs and depreciation, depletion and amortization (GAAP) | $ | 177,627 | $ | 212,639 | $ | 223,994 | ||||||
4. | Please explain to us the nature of “treatment costs” and why they are included as an adjustment in the calculation of the cash cost non-GAAP measure. |
Response: The amounts reported for “treatment costs” (also referred to as “smelter charges”) represent the estimated treatment and refining costs, smelter losses, and price escalators based on concentrates and doré produced in the periods presented and terms negotiated by us with the smelters and refiners. As further explained in the response to Comment 1. above, treatment costs are netted intoSales of products, andare therefore not included inCost of sales and other direct production costs and depreciation, depletion andamortization, on our Consolidated Statements of Operations Comprehensive Income. However, treatment charges are included in the calculation ofTotal cash costs,and therefore are not an adjustment but rather a component of the cash cost non-GAAP measure. As such, treatment costs must be included as a reconciling item betweenTotal cash costsandCost of sales and other direct production costs and depreciation, depletion and amortization.
Note that the amounts reported for treatment costs in theReconciliation of Total Cash Costs (non-GAAP) to Cost of Sales and Other Direct Production Costs and Depreciation, Depletion and Amortization (GAAP)differ from the amounts of smelter charges included inSales of products, as discussed in the response to Comment 2. above. This is because amounts included in the calculation ofTotal cash costs, including treatment charges, are based on production activity, while smelter charges included inSales of products are based on quantities of products sold during the periods presented.
Ms. Tia L. Jenkins
May 24, 2013
Page 8
Financial Liquidity and Capital Resources
Cash used in investing activities, page 45
5. | We note your capital expenditures at the Lucky Friday mine included approximately $26.4 million for the rehabilitation of the Silver Shaft in 2012. Please reconcile the capitalization of these costs with your accounting policy, which states that maintenance and repairs on capitalized property, plant and equipment are charged to operations as incurred (page F-8). In your response, please provide a detailed discussion of activities capitalized during the rehabilitation of the Silver Shaft of Lucky Friday mine and quantify such amounts. |
Response: Our capital policy inG. Properties, Plants and Equipment ofNote 1: Summary of Significant Accounting Policies ofNotes to Consolidated Financial Statements states: “Expenditures incurred during the development and production stages for…major mine development expenditures are capitalized, including primary development costs such as costs of building access ways, shaft sinking, lateral development, drift development, ramps and infrastructure developments.” Based upon our accounting research, we concluded that it was appropriate to capitalize costs to improve, alter, or rehabilitate primary development assets which appreciably extend the life, increase capacity, or improve the efficiency or safety of such assets. In contrast, costs related to rehabilitation of secondary development, or those related to rehabilitation of primary development which do not appreciably extend the life, increase capacity, or improve the efficiency or safety of the asset are expensed as incurred. We believe these outcomes are consistent with both our internal accounting policies and our disclosure of the same. To further clarify our accounting policy on capitalization, we will modify the following paragraph fromG. Properties, Plants and Equipment ofNote 1: Summary of Significant Accounting Policies ofNotes to Consolidated Financial Statementsin future Forms 10-K, starting with the 10-K for the year ended December 31, 2013, as follows (modifications are underlined):
G. Properties, Plants and Equipment – Costs are capitalized when it has been determined an ore body can be economically developed. The development stage begins at new projects when our management and/or Board of Directors makes the decision to bring a mine into commercial production, and ends when the production stage, or exploitation of reserves, begins. Expenditures incurred during the development and production stages for new facilities or new assets that extend the useful lives of existing facilities and major mine development expenditures are capitalized, including primary development costs such as costs of building access ways, shaft sinking, lateral development, drift development, ramps and infrastructure developments.Costs to improve, alter, or rehabilitate primary development assets which appreciably extend the life, increase capacity, or improve the efficiency or safety of such assets are also capitalized.
Ms. Tia L. Jenkins
May 24, 2013
Page 9
The $26.4 million in costs incurred for work performed on the Silver Shaft at the Lucky Friday mine during 2012 were for improvement and rehabilitation of a primary development asset. The work included removal of built-up cementitious material from the concrete lining of the shaft, removal of unused utilities, construction of a water ring to prevent ice from forming in the winter, instillation of a metal brattice which separates the shaft into two compartments, rehabilitation of shaft steel, and installation of a new power cable. The following is a detail of the costs of the activities involved in the Silver Shaft project (in thousands of dollars):
Description | Amount |
Contractor construction and rehabilitation | $ 8,118 |
Equipment purchases | 6,865 |
Contractor fee and administration | 6,385 |
Internal labor and other costs | 3,541 |
Engineering | 1,502 |
Total | $26,411 |
We believe that this work has improved the safety of the shaft, extended its life and functionality, and will also potentially facilitate improved capacity and efficiency, as the alterations would be required for installation of a proposed new auxiliary hoist in the currently-unused shaft compartment in the near future. The auxiliary hoist would be used to transport personnel and materials through the shaft, allowing the primary hoist to be dedicated to ore haulage, which would facilitate increased mine production. Because the above-described Silver Shaft work was for improvement and rehabilitation of a primary development asset, and the work has improved the safety of the asset and facilitates additional production and improved capacity and efficiency, the costs meet the criteria for capitalization.
All costs at the Lucky Friday during 2012 which did not meet the aforementioned criteria and which totaled approximately $25.3 million were recorded to expense as incurred and included inLucky Friday suspension-related costson our Consolidated Statements of Operations and Comprehensive Income.
Contractual Obligations and Contingent Liabilities and Commitments, page 46
Ms. Tia L. Jenkins
May 24, 2013
Page 10
6. | Please tell us how you analyzed the requirements of Item 303(a)(5) of Regulation S-K with respect to your disclosure of pension funding for just one year. |
Response: The statutory funding requirements for our defined benefit pension plans are determined based on the estimated funded status of the plans, considering the fair value of plan assets and the actuarial estimate of future benefit obligations under each plan. Based on these estimates as of December 31, 2012, we determined that payments to fund the plans of approximately $1 million would be required during the year ended December 31, 2013. Between December 31, 2012 and the filing of Form 10-K, there was ongoing consideration by management to amend the plan in an effort to reduce future cost and cash requirements. Accordingly, at the time of filing of the Form 10-K, it was deemed more likely than not that estimates of benefit obligations would not result in additional funding requirements in the periods of time described inContractual Obligations and Contingent Liabilities and Commitments in response to Item 303(a)(5) of Regulation S-K. Subsequent to the filing of Form 10-K, an amendment was proposed and approved by the Company’s Board of Directors. The Company plans to disclose the amendment and its effects in its Form 10-Q for the period ended June 30, 2013.
* * * * *
The Company acknowledges that: (i) the Company is responsible for the adequacy and accuracy of the disclosure in the filing; (ii) staff comments or changes to disclosure in response to staff comments do not foreclose the Commission from taking any action with respect to the filing; and (iii) the Company may not assert staff comments as a defense in any proceeding initiated by the Commission or any person under the federal securities laws of the United States.
If you have any questions regarding the above, please contact me at (208) 209-1258. Please contact Jim Sabala, the Company’s Senior Vice President and Chief Financial Officer, at (208) 209-1255 with regard to any accounting matters.
| Very truly yours, |
|
|
| /s/ David C. Sienko |
|
|
| David C. Sienko |
cc: Blaise Rhodes
Jim Sabala