July 19, 2013
VIA EDGAR
Ms. Tia L. Jenkins Senior Assistant Chief Accountant Office of Beverages, Apparel, and Mining Division of Corporation Finance Securities and Exchange Commission 100 F Street, N.E. Washington, D.C. 20549
|
Re: | Hecla Mining Company Filed February 25, 2013 File No. 001-08491 |
Dear Ms. Jenkins:
This letter responds to the comments contained in your letter dated July 9, 2013, regarding the annual report on Form 10-K for the fiscal year ended December 31, 2012 of Hecla Mining Company (the “Company”). For convenience, each of your comments is repeated below, with responses immediately following.
Form 10-K for the Year Ended December 31, 2012
Item 7. Management ’s Discussion and Analysis of Financial Condition and Results of Operations, page 32
Reconciliation of Total Cash Costs (non-GAAP) to Cost of Sales and Other Direct ProductionCosts and Depreciation, Depletion and Amortization (GAAP), page 42
1. | We read your response to our prior comment 3. We believe that the reduction for by-product revenues is not appropriate because it materially distorts your actual production costs. As such, we continue to believe that the significance of by-product revenues can be described textually in a manner that investors can understand without including the item as an adjustment to the non-GAAP cost measure. Please revise accordingly and provide us with draft disclosures that you plan to include in future filings. |
Response: As set forth in our response of May 24, 2013, absent definitive industry-wide guidance from the Securities and Exchange Commission (“SEC”) or another industry or authoritative body, the Company believes it is appropriate to adhere to the cash costs standard endorsed by the Silver Institute, the World Gold Council and previously, the Gold Institute, which encourage use of the standard within the silver mining industry. The standard is also accepted throughout the gold and silver mining industry, and is widely used by both the analytical and investing communities as a common tool for measuring the operating costs of mines across a spectrum of differing geologic and metallurgical characteristics. It does not supplant the GAAP measure but instead provides an additional tool that the Company, along with other participants in our industry, believes is useful to the investing public.1 Further, our existing and proposed disclosures are in full compliance with Regulation G, setting forth a clear explanation of the components of cash costs. In particular, subparagraph (b) of Regulation G states that the non-GAAP financial measure must be “taken together with the information accompanying the measure and any other discussion of that measure.” Because the text of the Company’s disclosure, both in the 10-K as filed and as proposed to be modified in our May 24 response and below, clearly provides the amount and description of by-product credits immediately next to the cash operating costs, we respectfully disagree with the assertion that the reduction for by-product revenues “materially distorts [the Company’s] actual production costs.” Of course, in order to further comply with Regulation G, the Company’s Forms 10-K and 10-Q also include a reconciliation to the nearest GAAP measure.
Inclusion of by-product credits in cost per ounce constitutes an industry-standard measure of our performance vis-à-vis our peer companies, as well as our own prior performance. Were we to eliminate by-product credits completely from the cash cost measure, we believe the result would be a lack of comparability between the non-GAAP measures of the Company and other primary silver producers. In fact, their exclusion may be misleading when one company reports a lower cost per ounce before by-products, but another company reporting in the same format actually has superior economics due to higher by-products which allows it to pursue its metal of primary interest at a lower net cost. The Company would be happy to supplement this response with a list of issuers with a class of securities registered under the Securities Exchange Act of 1934 who report cash costs net of by-product credits in their SEC filings, as well as other examples of the widespread use within the investor, analyst and financial communities of this metric.
In response to the Staff’s comments, the Company proposes to significantly expand its discussion of cash cost per ounce. We feel it is appropriate to do so prospectively 2 in future filings of Forms 10-K and 10-Q inManagement’s Discussion and Analysis of Financial Condition and Results of Operations to explicitly focus investors on both operating costs and by-product credits and to provide a more fulsome discussion of the nature of such credits in the manner described below, using as an example Form 10-K for the year ended December 31, 2012 (with our proposed additional language, which includes further revisions from the disclosure proposed in our May 24, 2013 letter, underscored):
1 | Indeed, in this respect, the Company believes the cash costs standard serves a function helpful to investors and consistent with the goal of the SEC's recent implementation of interactive data and XBRL, as each is a method of facilitating comparisons among issuers. |
2 | We believe amending previous filings would create the risk of confusing investors by creating the impression that financial results were previously inaccurately reported, rather than simply portraying a new format of reporting. In addition, we believe amending past reports would exacerbate the disparity among formats of financial results reporting within the mining industry. |
Ms. Tia L. Jenkins
July 19, 2013
Page 2
Greens Creek Segment
The chart below illustrates the factors contributing to the variances in total cash costs per silver ounce for 2012 compared to 2011 and 2010:

As set forth above, cash cost per ounce, net of by-products in 2012 was $2.70 per ounce, consisting of $32.55 per ounce of cash operating costs and $29.85 per ounce of by-product credits. In 2011, cash cost per ounce, net of by-products was negative $1.29 per ounce due to the fact that by-product credits of $31.69 per ounce exceeded the per ounce cash operating costs of $30.40 per ounce. Similarly, in 2010, cash cost per ounce, net of by-products was negative $3.90, as by-product credits of $29.73 per ounce exceeded cash operating costs of $25.83 per ounce.
Ms. Tia L. Jenkins
July 19, 2013
Page 3
Lucky Friday Segment
The chart below illustrates the factors contributing to the variances in total cash costs per silver ounce for 2011 and 2010:
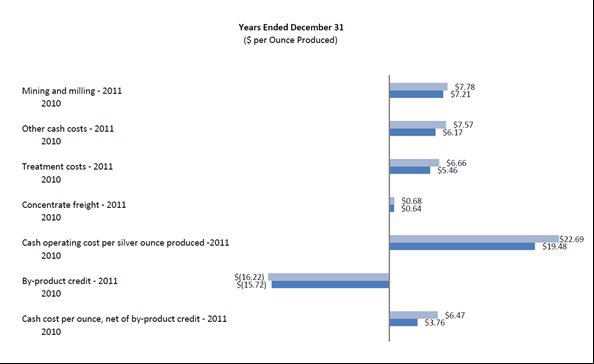
As set forth above, cash cost per ounce, net of by-products in 2011 was $6.47 per ounce, consisting of $22.69 per ounce of cash operating costs and by-product credits of $16.22 per ounce. In 2010, cash cost per ounce, net of by-products was $3.76 per ounce, consisting of $19.48 per ounce in cash operating costs, partially offset by $15.72 per ounce in by-product credits.
Reconciliation of Total Cash Costs (non-GAAP) to Cost of Sales and Other Direct Production Costs and Depreciation, Depletion and Amortization (GAAP)
The tables below present reconciliations between non-GAAP total cash costs to cost of sales and other direct production costs and depreciation, depletion and amortization (GAAP) for our operations at the Greens Creek and Lucky Friday units for the years ended December 31, 2012, 2011 and 2010 (in thousands, except costs per ounce).
Cash operating costs include all direct and indirect operating cash costs related directly to the physical activities of producing metals, including mining, processing and other plant costs, third-party refining expense, on-site general and administrative costs, royalties and mining production taxes., By-product credits include revenues earned from all metals other than the primary metal produced at each unit. Cash costs per ounce, net of by-product credit, provides management and investors an indication of net cash flow, after consideration of the realized price received for production sold. Management also uses this measurement for the comparative monitoring of performance of our mining operations period-to-period from a cash flow perspective. “Cash cost per ounce, net of by-product credit” is a measure developed by precious metals companies in an effort to provide a uniform standard for comparison purposes; however, there can be no assurance that our reporting of this non-GAAP measure is similar to that reported by other mining companies.
Ms. Tia L. Jenkins
July 19, 2013
Page 4
As depicted graphically in The Greens Creek Segment and The Lucky Friday Segment sections above, by-product credits comprise an essential element of our unit cost structure. By-product credits constitute an important competitive distinction for our silver operations due to the polymetallic nature of their orebodies. Total by-product credits included in our presentation of cost per ounce include:
By-product value, all silver properties: |
|
| |||||||||
Zinc | $ | 84,087 | $ | 109,708 | $ | 121,557 | |||||
Gold | 75,860 | 71,794 | 68,330 | ||||||||
Lead | 30,969 | 72,870 | 77,385 | ||||||||
Total by-product credits | $ | 190,916 | $ | 254,372 | $ | 267,272 | |||||
By-product value per ounce of silver produced, all silver properties: |
|
| |||||||||
Zinc | $ | 13.15 | $ | 11.57 | $ | 11.51 | |||||
Gold | 11.86 | 7.57 | 6.47 | ||||||||
Lead | 4.84 | 7.68 | 7.32 | ||||||||
Total by-product credits | $ | 29.85 | $ | 26.82 | $ | 25.30 | |||||
Cost of sales and other direct production costs and depreciation, depletion and amortization, is the most comparable financial measure calculated in accordance with GAAP to total cash costs. The sum of the cost of sales and other direct production costs and depreciation, depletion and amortization for our operating units in the tables below is presented in our Consolidated Statement of Operations and Comprehensive Income (Loss).
| Total, All Properties | ||||||||||||
| Year ended December 31, | ||||||||||||
| 2012 | 2011 | 2010 | ||||||||||
Cash operating costs | $ | 208,178 | $ | 265,306 | $ | 251,837 | |||||||
By-product credits | (190,916 | ) | 254,372 | 267,272 | |||||||||
Cash operating costs after by-product credits | $ | 17,262 | $ | 10,934 | $ | (15,435 | ) | ||||||
Divided by silver ounces produced | 6,394 | 9,483 | 10,566 | ||||||||||
Cash operating cost per silver ounce produced | 32.56 | 27.98 | 23.83 | ||||||||||
By-product credits per silver once produced | (29.86 | ) | (26.82 | ) | (25.29 | ) | |||||||
Cash cost per ounce, net of by-product credit | $ | 2.70 | $ | 1.15 | $ | (1.46 | ) | ||||||
Reconciliation to GAAP: | |||||||||||||
Cash operating costs – net of by-product credits | $ | 17,262 | $ | 10,934 | $ | (15,435 | ) | ||||||
Depreciation, depletion and amortization | 43,522 | 47,066 | 60,011 | ||||||||||
Treatment costs | (73,355 | ) | (99,019 | ) | (92,144 | ) | |||||||
By-product credits | (190,916 | ) | (254,372 | ) | (267,272 | ) | |||||||
Change in product inventory | (1,381 | ) | (4,805 | ) | 3,660 | ||||||||
Suspension-related costs1 | — | 4,135 | — | ||||||||||
Reclamation and other costs | 663 | (44 | ) | 630 | |||||||||
Cost of sales and other direct production costs and depreciation, depletion and amortization (GAAP) | $ | 177,627 | $ | 212,639 | $ | 223,994 | |||||||
Ms. Tia L. Jenkins
July 19, 2013
Page 5
The Company believes that its revised proposed disclosure above clearly sets forth both the amount and effect of by-product credits, and that such proposed disclosure is not distorting or otherwise misleading in any way.
2. | Please also revise your financial statement footnotes to describe how you classify by-product credits in the income statement and provide us with draft disclosures that you plan to include in future filings. |
Response: Our accounting policy with regard to the classification of by-product credits is set forth inN. Revenue Recognition and Smelter Accounts Receivables in Note 1 and provides, in part: “Sales of all metals products sold directly to smelters, including by-product metals, are recorded as revenues and accounts receivable when title and risk of loss transfer to the smelter (generally at the time of shipment) at estimated forward prices for the anticipated month of settlement.”
* * * * *
The Company acknowledges that: (i) the Company is responsible for the adequacy and accuracy of the disclosure in the filing; (ii) staff comments or changes to disclosure in response to staff comments do not foreclose the Commission from taking any action with respect to the filing; and (iii) the Company may not assert staff comments as a defense in any proceeding initiated by the Commission or any person under the federal securities laws of the United States.
If you have any questions regarding the above, please contact me at (208) 209-1258. Please contact Jim Sabala, the Company’s Senior Vice President and Chief Financial Officer, at (208) 209-1255 with regard to any accounting matters.
Very truly yours,
/s/ David C. Sienko
David C. Sienko
cc: | Blaise Rhodes |
| Jim Sabala |