Exhibit 96.1
 Technical Report Summary on the
Greens Creek Mine, Alaska, USA
S-K 1300 Report
Hecla Mining Company
SLR Project No: 101.00632.00020
February 21, 2022
Technical Report Summary on the Greens Creek Mine, Alaska, USA
SLR Project No: 101.00632.00020
Prepared by
SLR International Corporation
1658 Cole Blvd, Suite 100
Lakewood, CO 80401
for
Hecla Mining Company
6500 N. Mineral Drive, Suite 200
Coeur d’Alene
Idaho, USA 83815
Effective Date – December 31, 2021
Signature Date - February 21, 2022
Distribution: | 1 copy – Hecla Mining Company |
| | 1 copy – SLR International Corporation |

CONTENTS
| | | |
1.0 | EXECUTIVE SUMMARY | 1-1 |
1.1 | Summary | 1-1 |
1.2 | Economic Analysis | 1-7 |
1.3 | Technical Summary | 1-10 |
| | | |
2.0 | INTRODUCTION | 2-1 |
2.1 | Site Visits | 2-1 |
2.2 | Sources of Information | 2-2 |
2.3 | List of Abbreviations | 2-3 |
| | | |
3.0 | PROPERTY DESCRIPTION | 3-1 |
3.1 | Property and Title in Alaska | 3-4 |
3.2 | Mineral Tenure | 3-11 |
3.3 | Surface Rights and Property Agreements | 3-19 |
3.4 | Royalties and Encumbrances | 3-20 |
3.5 | First Nations | 3-21 |
3.6 | Other Significant Factors and Risks | |
| | | |
4.0 | ACCESSIBILITY, CLIMATE, LOCAL RESOURCES, INFRASTRUCTURE AND PHYSIOGRAPHY | 4-1 |
4.1 | Accessibility | 4-1 |
4.2 | Climate | 4-1 |
4.3 | Local Resources and Infrastructure | 4-2 |
4.4 | Physiography | 4-2 |
| | | |
5.0 | HISTORY | 5-1 |
5.1 | Previous Ownership | 5-1 |
5.2 | Exploration and Development | 5-1 |
5.3 | Mineral Reserve History | 5-11 |
5.4 | Past Production | 5-12 |
| | | |
6.0 | GEOLOGICAL SETTING, MINERALIZATION, AND DEPOSIT | 6-1 |
6.1 | Regional Geology | 6-1 |
6.2 | Project Geology | 6-4 |
6.3 | Geology of Mineralization | 6-11 |
6.4 | Mineralized Zones | 6-22 |
6.5 | Comments on Geological Setting and Mineralization | 6-52 |
6.6 | Deposit Types | 6-52 |
| | | |
7.0 | EXPLORATION | 7-1 |
7.1 | Exploration | 7-1 |
7.2 | Drilling | 7-31 |

Hecla Mining Company | Greens Creek Mine, SLR Project No: 101.00632.00020
Technical Report Summary - February 21, 2022
8.0 | SAMPLE PREPARATION, ANALYSES, AND SECURITY | 8-1 |
8.1 | Sampling Methods | 8-1 |
8.2 | Metallurgical Sampling | 8-2 |
8.3 | Density/Specific Gravity Determinations | 8-2 |
8.4 | Analytical and Test Laboratories | 8-3 |
8.5 | Sample Preparation and Analysis | 8-4 |
8.6 | Quality Assurance and Quality Control (QA/QC) | 8-5 |
8.7 | Databases | 8-23 |
8.8 | Drill Core and Sample Chain-of-Custody and Security | 8-23 |
8.9 | Comments on Sample Preparation, Analyses, and Security | 8-24 |
| | | |
9.0 | DATA VERIFICATION | 9-1 |
9.1 | External Reviews | 9-1 |
9.2 | Internal Reviews | 9-6 |
9.3 | SLR Data Validation Methods | 9-7 |
9.4 | Comments on Data Verification | 9-7 |
| | | |
10.0 | MINERAL PROCESSING AND METALLURGICAL TESTING | 10-1 |
10.1 | Metallurgical Test Work | 10-1 |
10.2 | Recovery Estimates | 10-4 |
10.3 | Metallurgical Variability | 10-10 |
10.4 | Deleterious Elements | 10-11 |
10.5 | Metallurgical Accounting | 10-11 |
10.6 | Overall Process Monitoring and Control | 10-11 |
| | | |
11.0 | MINERAL RESOURCE ESTIMATES | 11-1 |
11.1 | Summary | 11-1 |
11.2 | Resource Database | 11-2 |
11.3 | Geological Interpretation, Structure, and Mineralization Wireframes | 11-3 |
11.4 | Exploratory Data Analysis | 11-7 |
11.5 | Treatment of High Grade Assays | 11-9 |
11.6 | Compositing | 11-9 |
11.7 | Trend Analysis | 11-11 |
11.8 | Bulk Density | 11-16 |
11.9 | Excavation Volumes | 11-17 |
11.10 | Block Model Construction | 11-17 |
11.11 | Estimation/Interpolation Methods | 11-18 |
11.12 | Depletion for Mining Activities | 11-19 |
11.13 | Block Model Validation | 11-19 |
11.14 | Cut-Off Grade (Value) | 11-27 |
Hecla Mining Company | Greens Creek Mine, SLR Project No: 101.00632.00020
Technical Report Summary - February 21, 2022
11.15 | Classification of Mineral Resources | 11-28 |
11.16 | Reasonable Prospects of Economic Extraction | 11-28 |
11.17 | Mineral Resource Statement | 11-29 |
| | | |
12.0 | MINERAL RESERVE ESTIMATES | 12-1 |
12.1 | Summary | 12-1 |
12.2 | Conversion to Mineral Reserves | 12-2 |
12.3 | NSR Formula | 12-3 |
12.4 | Metal Price Assumptions | 12-4 |
12.5 | Cut-off Grade and “Must-Take” Ore | 12-4 |
12.6 | Other Mineral Reserves Criteria | 12-5 |
12.7 | Dilution | 12-5 |
12.8 | Extraction | 12-7 |
12.9 | Mineral Reserves Statement | 12-7 |
12.10 | Factors That May Affect the Mineral Reserve Estimates | 12-8 |
12.11 | Reconciliation | 12-9 |
| | | |
13.0 | MINING METHODS | 13-1 |
13.1 | Underground Mine Access & Layout | 13-1 |
13.2 | Mine Development | 13-3 |
13.3 | Production Mining | 13-3 |
13.4 | Ore Handling | 13-6 |
13.5 | Waste Handling | 13-6 |
13.6 | Mine Backfill | 13-6 |
13.7 | Ventilation | 13-7 |
13.8 | Communications and Emergency Infrastructure | 13-11 |
13.9 | Blasting and Explosives | 13-11 |
13.10 | Ground Support | 13-11 |
13.11 | Underground Water Handling | 13-13 |
13.12 | Underground Electrical System | 13-14 |
13.13 | Compressed Air System | 13-14 |
13.14 | Underground Mobile Equipment | 13-14 |
13.15 | Maintenance | 13-15 |
13.16 | Mine Plan | 13-16 |
| | | |
14.0 | PROCESSING AND RECOVERY METHODS | 14-1 |
14.1 | Process Flowsheet | 14-1 |
14.2 | Mill Process Description | 14-4 |
14.3 | Materials, Water and Power Consumption | 14-8 |
14.4 | Production and Recovery Forecasts | 14-10 |
| | | |
15.0 | INFRASTRUCTURE | 15-1 |
Hecla Mining Company | Greens Creek Mine, SLR Project No: 101.00632.00020
Technical Report Summary - February 21, 2022
15.1 | Site Layout | 15-1 |
15.2 | Roadways | 15-5 |
15.3 | Tailings Disposal Facilities | 15-5 |
15.4 | Mine Development Rock Disposal Facilities | 15-8 |
15.5 | Stockpiles | 15-8 |
15.6 | Water Supply | 15-10 |
15.7 | Water Management | 15-10 |
15.8 | Power and Electrical | 15-13 |
15.9 | Concentrate Handling | 15-13 |
15.10 | Fuel | 15-13 |
15.11 | Accommodation Camp | 15-13 |
15.12 | Other Supplies | 15-13 |
15.13 | Communications | 15-13 |
| | | |
16.0 | MARKET STUDIES | 16-1 |
16.1 | Markets | 16-1 |
16.2 | Contracts | 16-2 |
| | | |
17.0 | ENVIRONMENTAL STUDIES, PERMITTING, AND PLANS, NEGOTIATIONS, OR AGREEMENTS WITH LOCAL INDIVIDUALS OR GROUPS | 17-1 |
17.1 | Environmental Studies and Monitoring | 17-1 |
17.2 | Permitting | 17-1 |
17.3 | Reclamation and Closure | 17-9 |
17.4 | Social Governance | 17-10 |
| | | |
18.0 | CAPITAL AND OPERATING COSTS | 18-1 |
18.1 | Capital Cost Estimates | 18-1 |
18.2 | Operating Cost Estimates | 18-3 |
| | | |
19.0 | ECONOMIC ANALYSIS | 19-1 |
19.1 | Economic Criteria | 19-1 |
19.2 | Cash Flow Analysis | 19-2 |
19.3 | Sensitivity Analysis | 19-5 |
| | | |
20.0 | ADJACENT PROPERTIES | 20-1 |
| | | |
21.0 | OTHER RELEVANT DATA AND INFORMATION | 21-1 |
| | | |
22.0 | INTERPRETATION AND CONCLUSIONS | 22-1 |
| 22.1 | Geology and Mineral Resources | 22-1 |
| 22.2 | Mining and Mineral Reserves | 22-2 |
| 22.3 | Mineral Processing | 22-3 |
| 22.4 | Infrastructure | 22-4 |
| 22.5 | Enviroment | 22-4 |
Hecla Mining Company | Greens Creek Mine, SLR Project No: 101.00632.00020
Technical Report Summary - February 21, 2022
23.0 | RECOMMENDATIONS | 23-1 |
| 23.1 | Geology and Mineral Resources | 23-1 |
| 23.2 | Mining and Mineral Reserves | 23-1 |
| 23.3 | Mineral Processing | 23-1 |
| 23.4 | Enviroment | 23-2 |
| | | |
24.0 | REFERENCES | 24-1 |
| | | |
25.0 | RELIANCE ON INFORMATION PROVIDED BY THE REGISTRANT | 25-1 |
26.0 | DATE AND SIGNATURE PAGE | 26-1 |
| | | |
27.0 | APPENDIX 1 | 27-1 |
| 27.1 | Claims List | 27-1 |
Hecla Mining Company | Greens Creek Mine, SLR Project No: 101.00632.00020
Technical Report Summary - February 21, 2022
TABLES
| | | |
Table 1‑1: | Production Summary | 1-7 |
Table 1‑2: | Life of Mine Indicative Economic Results | 1-9 |
Table 1‑3: | Summary of Mineral Resources – December 31, 2021 | 1-12 |
Table 1‑4: | Summary of Mineral Reserves – December 31, 2021 | 1-13 |
Table 1‑5: | Capital Cost Summary | 1-18 |
Table 1‑6: | Operating Cost Summary | 1-18 |
Table 3‑1: | Summary- Patented Claims and Mill Sites | 3-13 |
Table 3‑2: | Summary- Land Exchange and Other Fee Properties | 3-13 |
Table 3‑3: | Summary- Claims Holding Obligations | 3-14 |
Table 4‑1: | Climate Summary Table | 4-2 |
Table 5‑1: | Exploration and Development History, 1973 to 2020 | 5-2 |
Table 12‑2: | Greens Creek Mineral Reserve History including Inferred Material, 1997 to 2021 | 5-11 |
Table 5‑3: | Production History, 1989 to 2020 (Imperial Units) | 5-13 |
Table 5‑4: | Production History, 1989 to 2020 (Metric Units) | 5-15 |
Table 5‑5: | Life of Mine Production 1989 to 2020 | 5-17 |
Table 6‑1: | Correlation of USGS Units to Greens Creek Mine Lithologic Units | 6-4 |
Table 7‑1: | Summary Table of Hecla Greens Creek Exploration Activities 2008 to 2020 | 7-2 |
Table 7‑2: | Coordinate Transform Coefficients to Convert from/to Mine Grid to Geo-Grid | 7-8 |
Table 7‑3: | Affine Transform Parameters Used for Coordinate Transformation of Mine Grid to Alaska State Plane Zone 1, NAD83 | 7-8 |
Table 7‑4: | Summary Table of Greens Creek Soil Sampling Activities 1974-2020 | 7-11 |
Table 7‑5: | Greens Creek Geophysical Surveys 1996 through 2020 | 7-16 |
Table 7‑6: | Summary of Legacy Drilling- 1975 to 2007 | 7-33 |
Table 7‑7: | Summary of Hecla Drilling 2008 to 2020 | 7-34 |
Table 7‑8: | Summary of Legacy Drill Methods- 1975 to 2007 | 7-35 |
Table 7‑9: | Summary of Current Drill Methods- Post-2008 | 7-36 |
Table 7‑10: | Drill Equipment Utilized for Core Drilling- Post-2008 | 7-36 |
Table 7‑11: | Summary of Surface Geotechnical and Hydrological Drilling- 2008 to 2020 | 7-40 |
Table 8‑1: | Assay Laboratories used at Greens Creek | 8-3 |
Table 8‑2: | Standards Used at Greens Creek Since 2008 | 8-7 |
Table 8‑3: | Standards Used at Greens Creek – Source, Characterization, and Recommended Values | 8-9 |
Hecla Mining Company | Greens Creek Mine, SLR Project No: 101.00632.00020
Technical Report Summary - February 21, 2022
Table 8‑4: | Standard T17 2020 Analytical Results – Bureau Veritas | 8-11 |
Table 8‑5: | Blank BHQ1 – 2020 Analytical Results – Bureau Veritas | 8-14 |
Table 10‑1: | Greens Creek Metallurgical Studies | 10-2 |
Table 10‑2: | Projected Life of Mine Recovery Estimates | 10-9 |
Table 11‑1: | Summary of Mineral Resources – December 31, 2021 | 11-1 |
Table 11‑2: | Summary of Drill Hole Database Crystallization Dates | 11-2 |
Table 11‑3: | Summary of Assay Database NSR Factors | 11-4 |
Table 11‑4: | Descriptive Statistics of the Raw Assay Values by Domain | 11-8 |
Table 11‑5: | Summary of Capping Values by Deposit | 11-9 |
Table 11‑6: | Descriptive Statistics of the Composited Assay Values by Domain | 11-10 |
Table 11‑7: | Summary of Density Coefficients by Deposit | 11-16 |
Table 11‑8: | Summary of Search Strategies | 11-18 |
Table 11‑9: | Summary of Mineral Resource Metal Prices, 2020 and 2021 | 11-19 |
Table 11‑10: | Block Statistics- Nearest Neighbor vs Ordinary Kriging | 11-20 |
Table 11‑11: | Summary of Estimated Operating Costs for Mineral Resource Reporting | 11-27 |
Table 11‑12: | Summary of Classification Parameters by Zone | 11-28 |
Table 11‑13: | Measured and Indicated Mineral Resources December 31, 2021 | 11-31 |
Table 11‑14: | Inferred Mineral Resources - December 31, 2021 | 11-32 |
Table 11‑15: | Comparison of 2020 and 2021 Mineral Resource Statements | 11-33 |
Table 12‑1: | Summary of Mineral Reserves – December 31, 2021 | 12-1 |
Table 12‑3: | Metal Price Assumptions | 12-4 |
Table 12‑4: | Rock Dilution Grades | 12-6 |
Table 12‑5: | Backfill Dilution Grades | 12-6 |
Table 12‑6: | Greens Creek Mineral Reserve Estimate | 12-7 |
Table 12‑7: | Greens Creek Reconciliation Data for 2021 | 12-9 |
Table 12‑8: | F3 Factors by Year: Mill Production / Mineral Reserve Depletion | 12-10 |
Table 13‑1: | List of Major Underground Equipment | 13-14 |
Table 13‑2: | Mine Plan – Mine Production Overview | 13-17 |
Table 13‑3: | Mine Plan – Development Schedule | 13-18 |
Table 14‑1: | Reagent and Consumable Summary Table 2021 Actuals | 14-8 |
Table 14‑2: | Five Year and Life of Mine Production Forecast | 14-10 |
Table 14‑3: | Concentrate Production and Grade Forecast | 14-12 |
Table 16‑1: | Hecla Historical Average Realized Metal Prices | 16-2 |
Hecla Mining Company | Greens Creek Mine, SLR Project No: 101.00632.00020
Technical Report Summary - February 21, 2022
Table 16‑2: | Payability and Treatment Charges Summary | 16-3 |
Table 17‑1: | Current Project Permits/Approvals | 17-2 |
Table 18‑1: | Capital Cost Summary | 18-1 |
Table 18‑2: | Other Capital Cost Summary | 18-2 |
Table 18‑3: | Operating Cost Summary | 18-3 |
Table 18‑4: | Current Manpower | 18-4 |
Table 18‑5: | LOM Manpower Levels | 18-5 |
Table 19‑1: | Production Summary | 19-1 |
Table 19‑2: | Life of Mine Indicative Economic Results | 19-3 |
Table 19‑3: | Sensitivity Analysis Summary | 19-6 |
Table 21‑1: | LTP versus LOM Plan | 21-2 |
Figures
| | | |
Figure 3‑1: | Project Location | 3-2 |
Figure 3‑2: | Mine Layout Plan | 3-3 |
Figure 3‑3: | Ownership Structure of Greens Creek Mining Operations | 3-11 |
Figure 3‑4: | Project and Regional Land Holdings Layout Plan | 3-12 |
Figure 5‑1: | Plan Map of Exploration Target Areas, with Land Exchange and Claims | 5-10 |
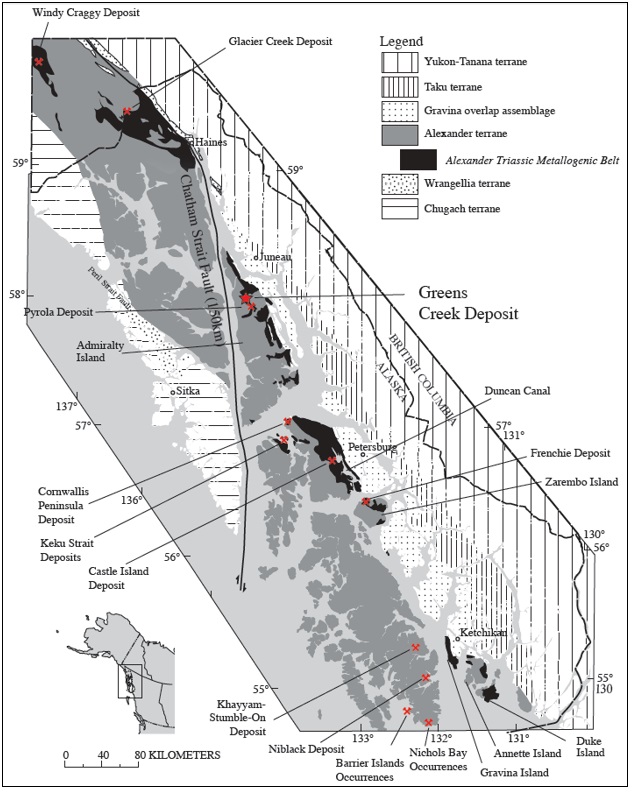
Figure 6‑1: | Regional Tectono-Stratigraphic Map | 6-2 |
Figure 6‑2: | Geologic Map of Admiralty Island | 6-3 |
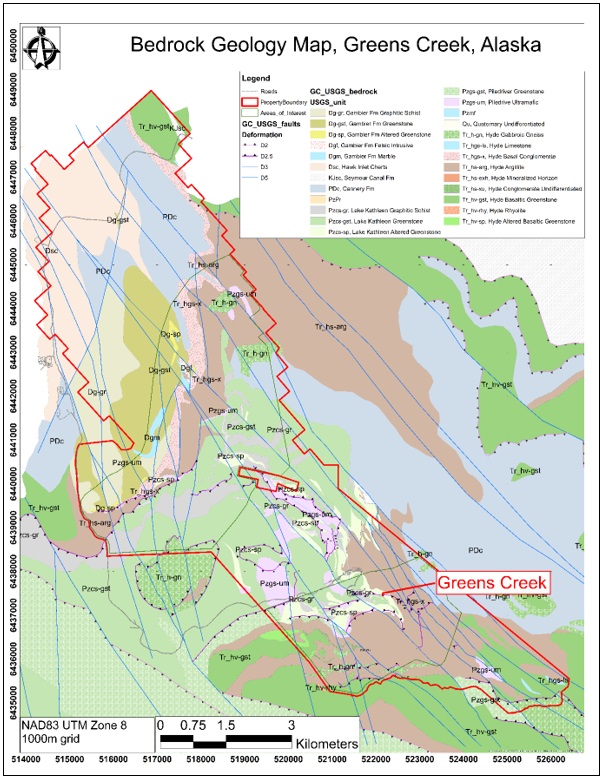
Figure 6‑3: | Geologic Map of the Greens Creek Claim Area | 6-5 |
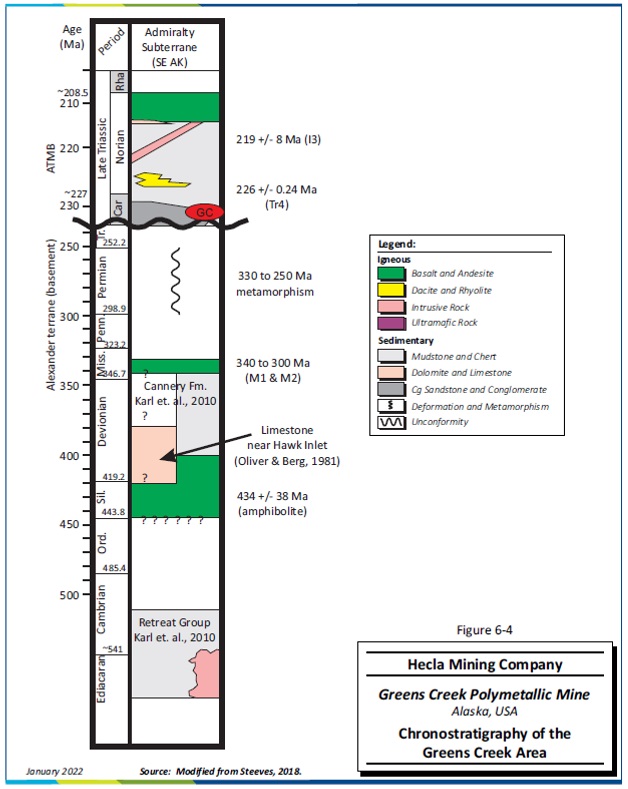
Figure 6‑4: | Chronostratigraphy of the Greens Creek Area | 6-6 |
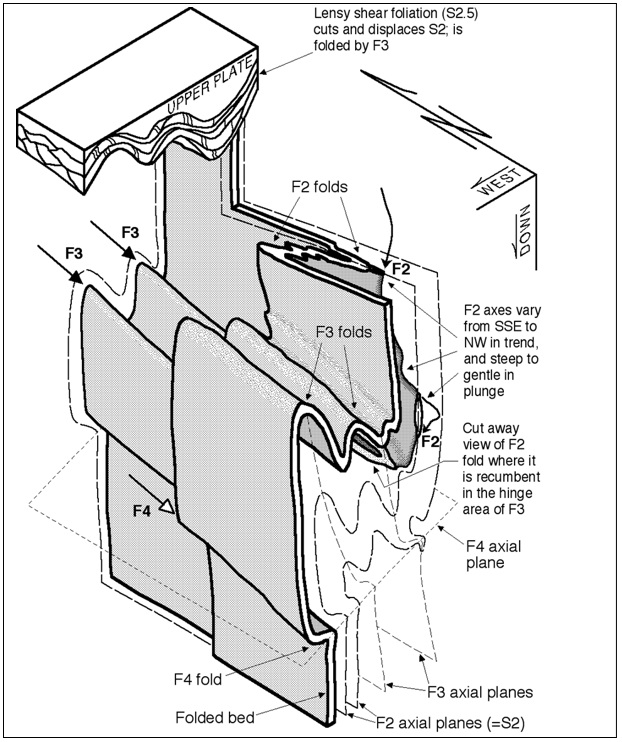
Figure 6‑5: | Fold and Shear Relationships at Greens Creek | 6-10 |
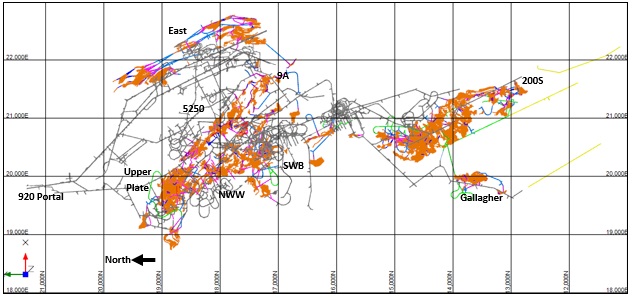
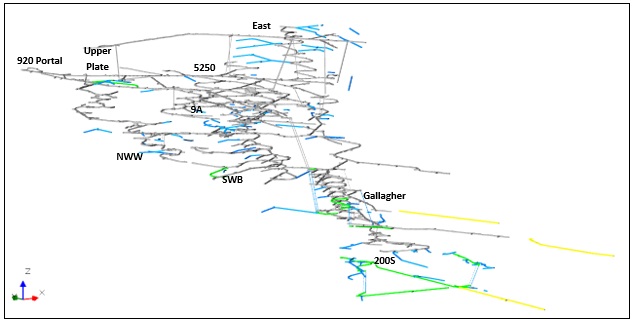
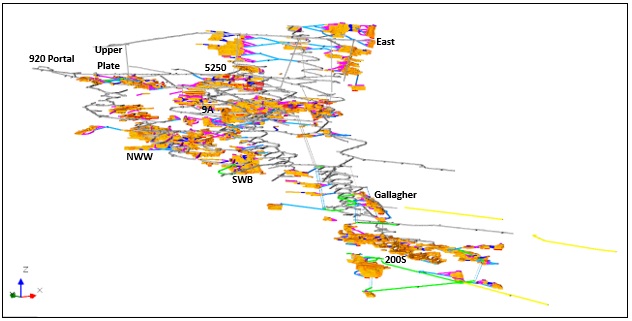
Figure 6‑6: | Plan View of the Mineral Resource and Mineral Reserve Mineralization Shells of the Greens Creek Mineralized Zones | 6-12 |
Figure 6‑7: | Section through the East, 9A, 5250 and Southwest Zones | 6-13 |
Figure 6‑8: | Simplified Mineralization Cross –Section | 6-14 |
Figure 6‑9: | Plan View of Mineral Types across the Greens Creek Mineral Deposit | 6-15 |
Figure 6‑10: | Mineral Zonation at Greens Creek by Mineral Type | 6-16 |
Figure 6‑11: | Massive Pyritic Material (MFP) at Greens Creek | 6-17 |
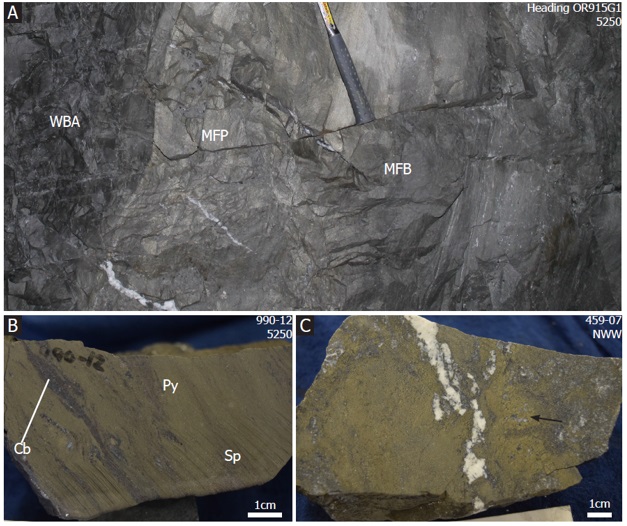
Figure 6‑12: | Massive Base Metal-Rich Mineral Type (MFB) at Greens Creek | 6-18 |
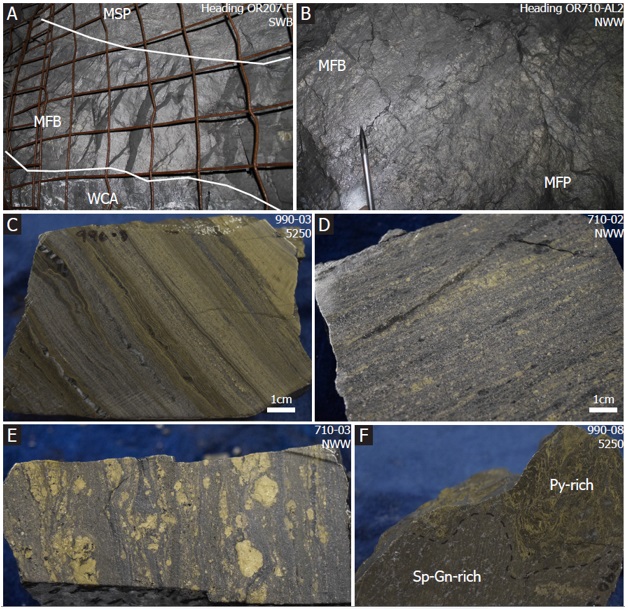
Figure 6‑13: | Massive Base Metal-rich Mineral Type (MFB) at Greens Creek | 6-19 |
Hecla Mining Company | Greens Creek Mine, SLR Project No: 101.00632.00020
Technical Report Summary - February 21, 2022
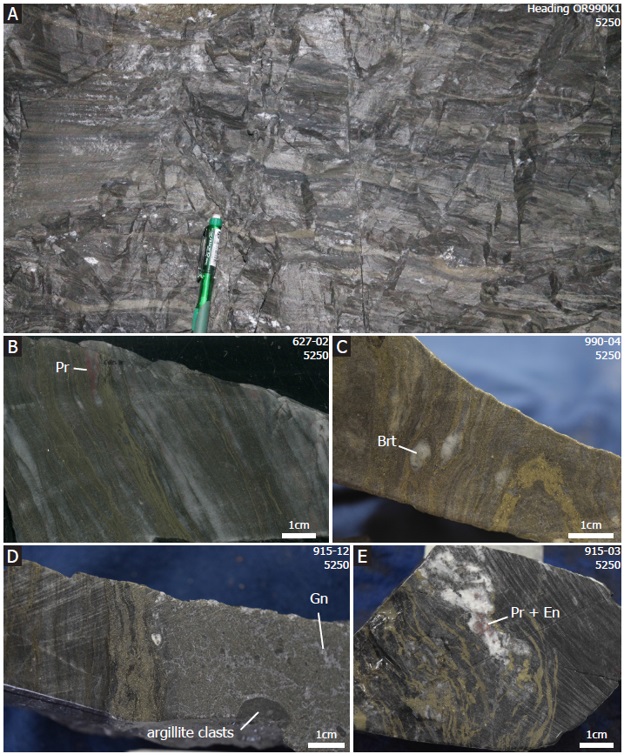
Figure 6‑14: | White Carbonate-Rich Mineral Type (WCA) at Greens Creek | 6-20 |
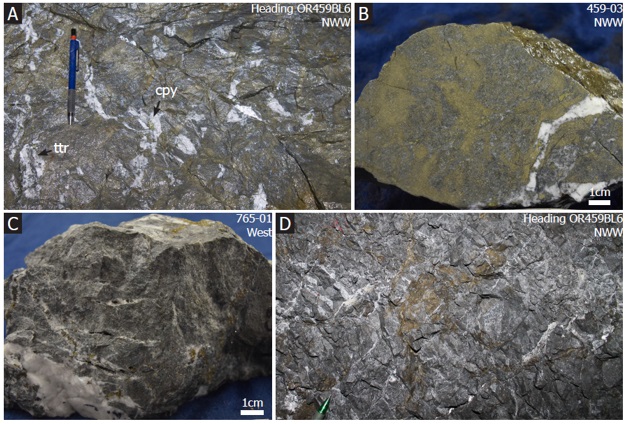
Figure 6‑15: | White Siliceous Mineral Type (WSI) at Greens Creek | 6-21 |
Figure 6‑16: | East Zone – 3D Model | 6-23 |
Figure 6‑17: | East Zone – Level Plan 1100 | 6-24 |
Figure 6‑18: | East Zone – Cross Section 2600 | 6-25 |
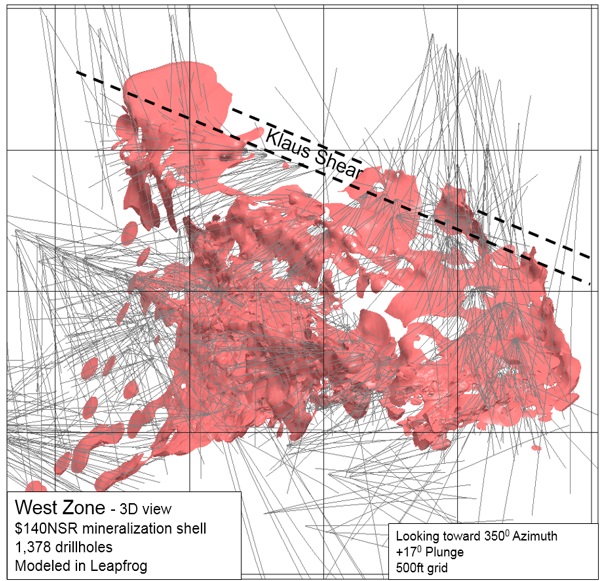
Figure 6‑19: | West Zone – 3D Model | 6-26 |
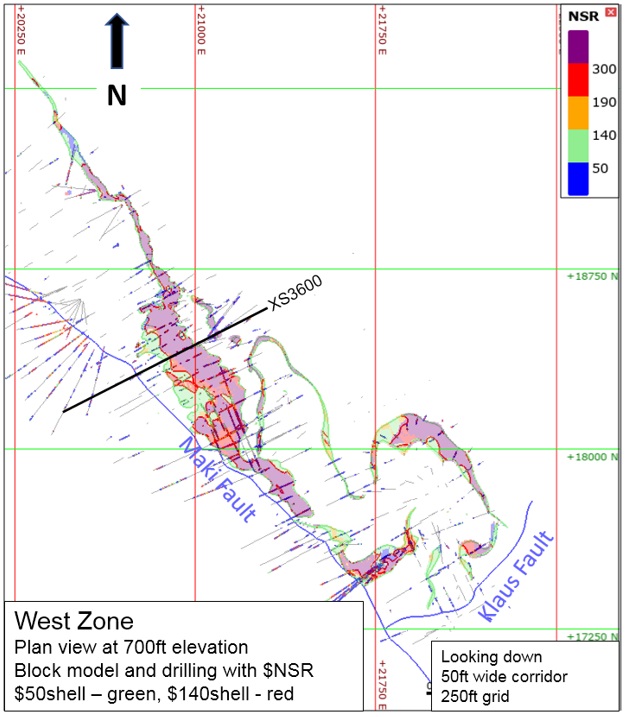
Figure 6‑20: | West Zone – Level Plan 700 | 6-27 |
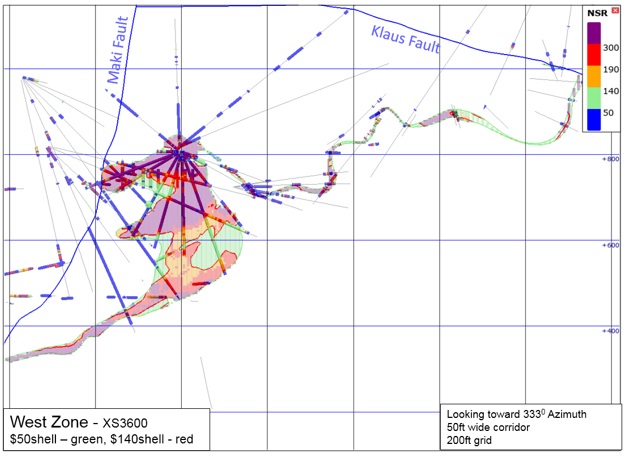
Figure 6‑21: | West Zone – Cross Section 3600 | 6-28 |
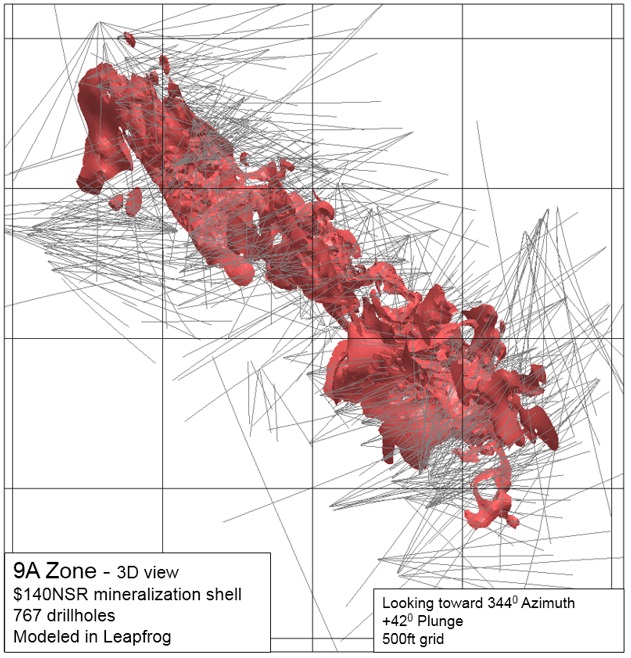
Figure 6‑22: | 9A Zone – 3D Model | 6-29 |
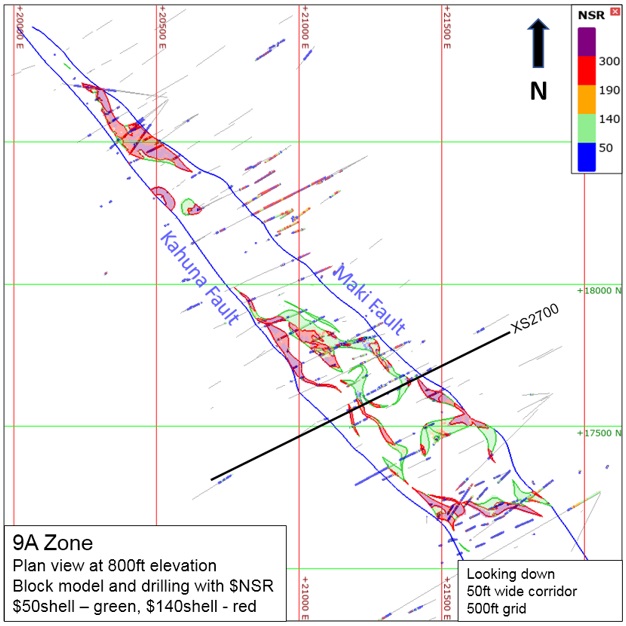
Figure 6‑23: | 9A Zone – Level 800 | 6-30 |
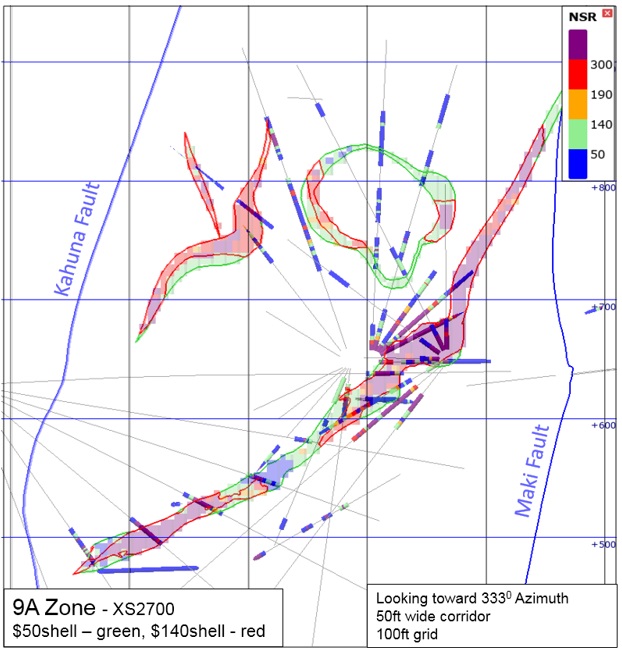
Figure 6‑24: | 9A Zone – Cross Section 2700 | 6-31 |
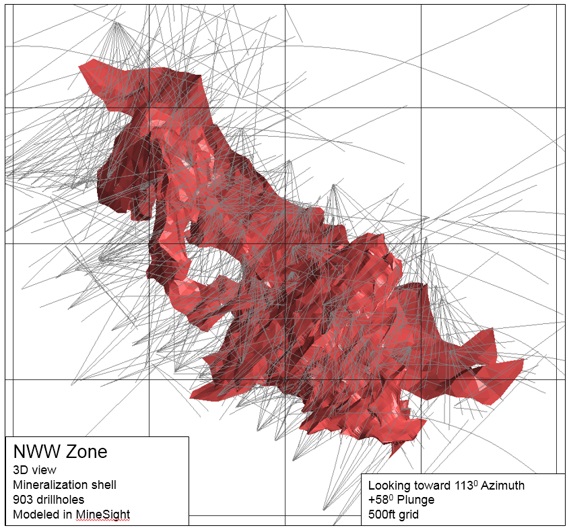
Figure 6‑25: | Northwest West Zone – 3D Model | 6-32 |
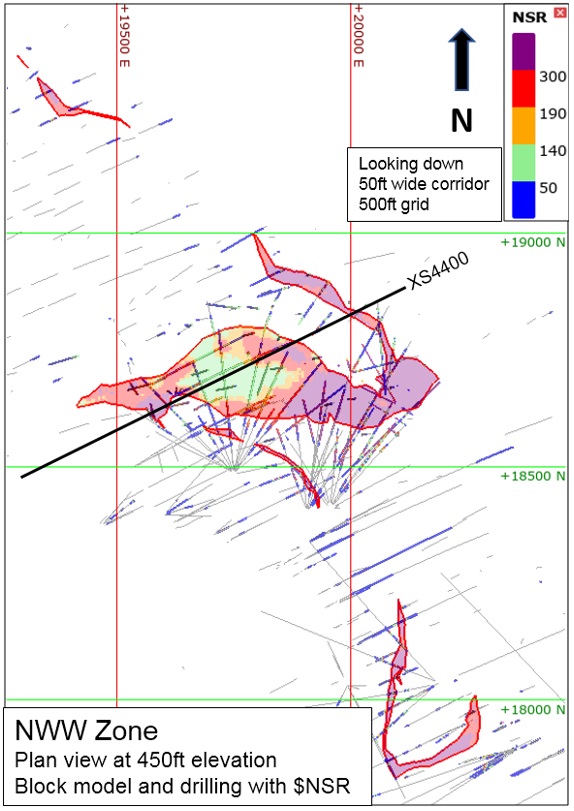
Figure 6‑26: | Northwest West Zone – Level Plan 450 | 6-33 |
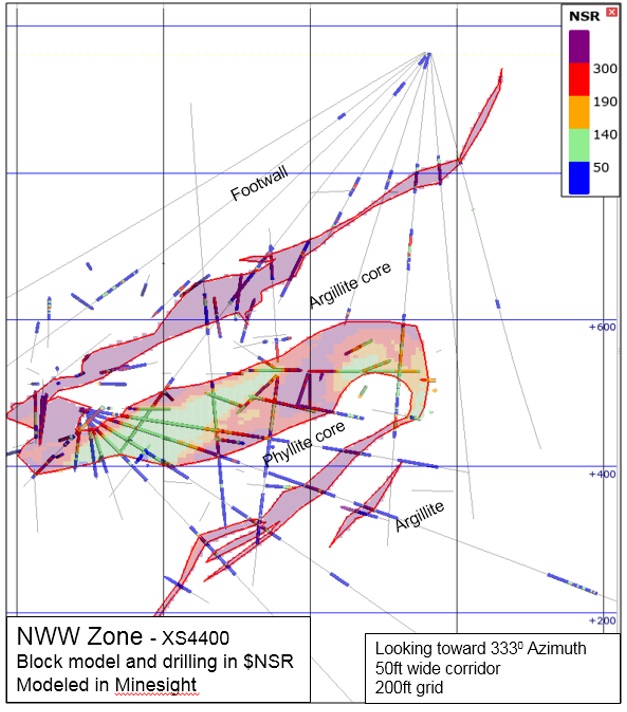
Figure 6‑27: | Northwest West Zone – Cross Section 4400 | 6-34 |
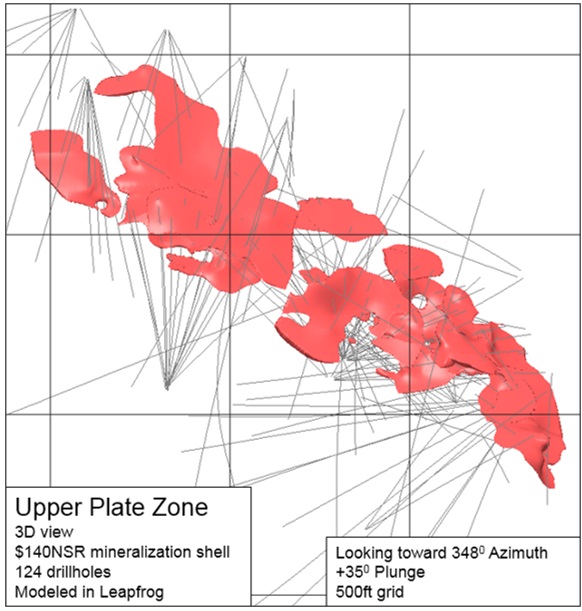
Figure 6‑28: | Upper Plate Zone – 3D Model | 6-35 |
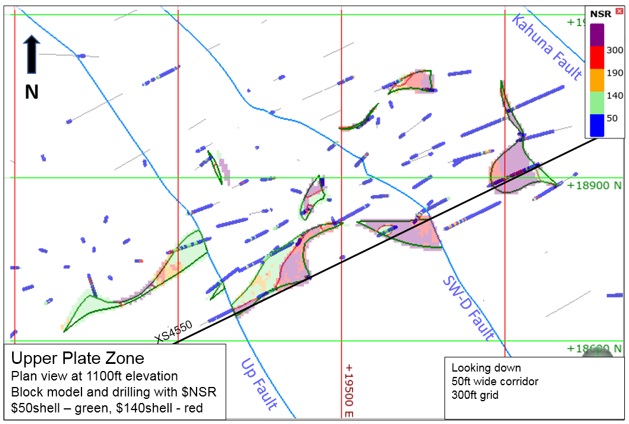
Figure 6‑29: | Upper Plate Zone – Level Plan 1100 | 6-36 |
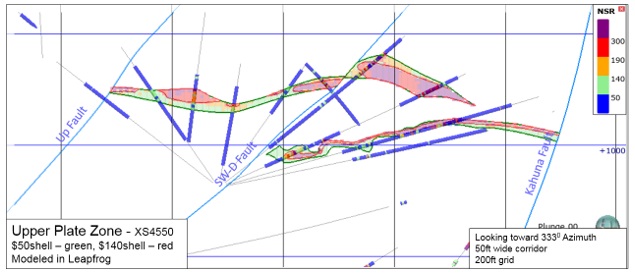
Figure 6‑30: | Upper Plate Zone – Cross Section 4550 | 6-36 |
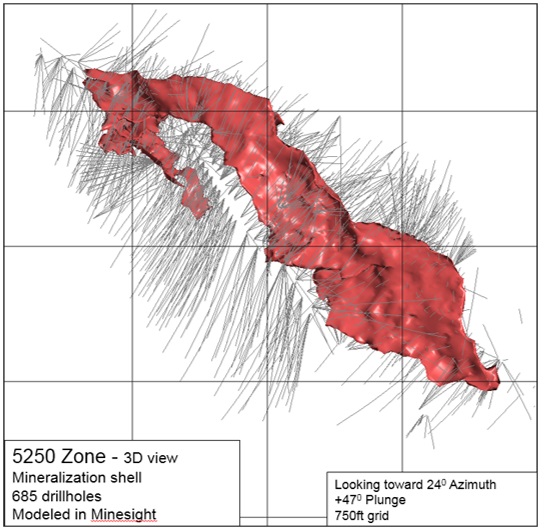
Figure 6‑31: | 5250 Zone – 3D Model | 6-37 |
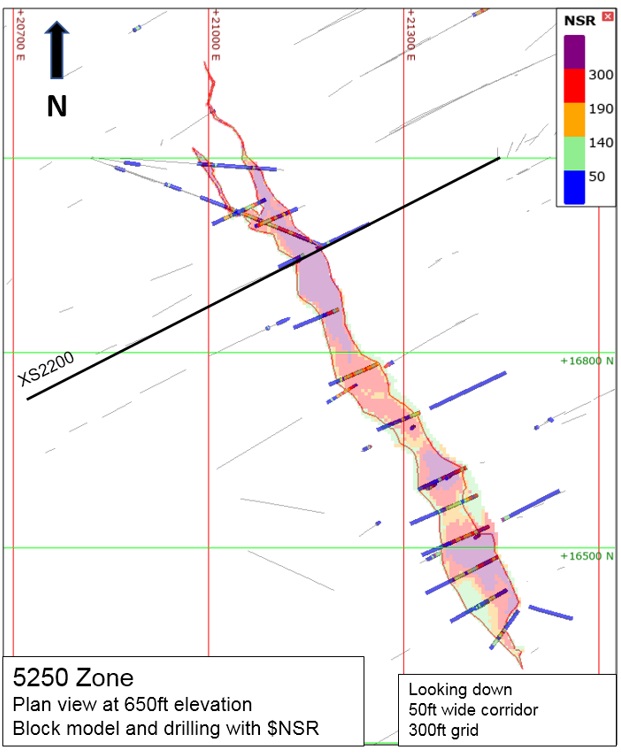
Figure 6‑32: | 5250 Zone – Level 650 | 6-38 |
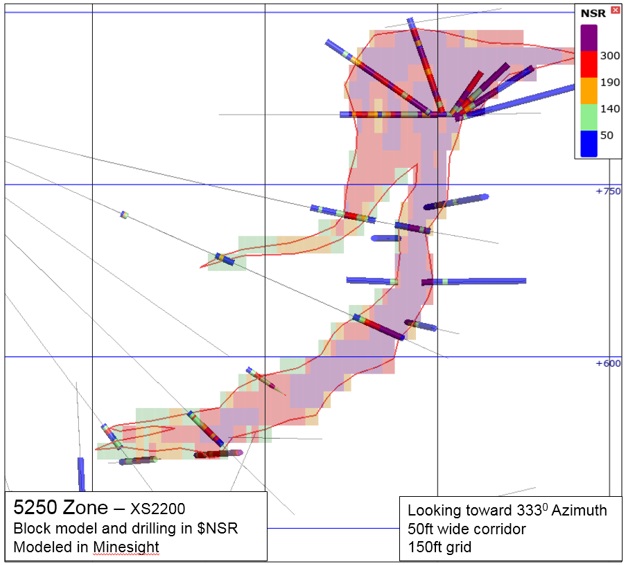
Figure 6‑33: | 5250 Zone – Cross Section 2200 | 6-39 |
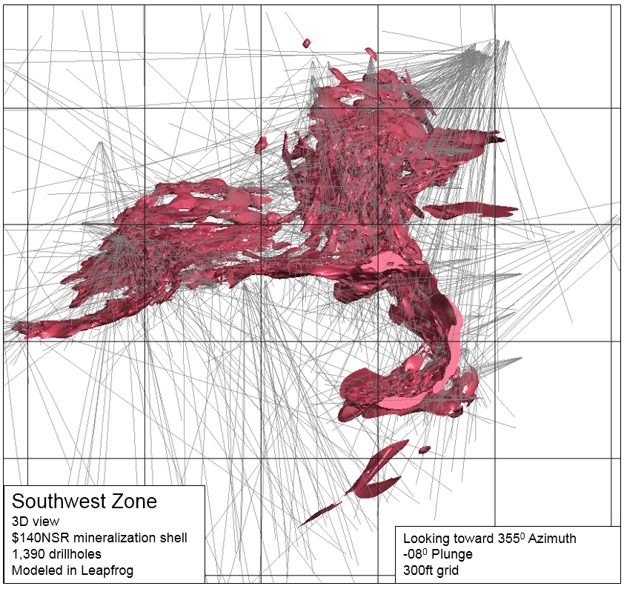
Figure 6‑34: | Southwest Zone – 3D Model | 6-40 |
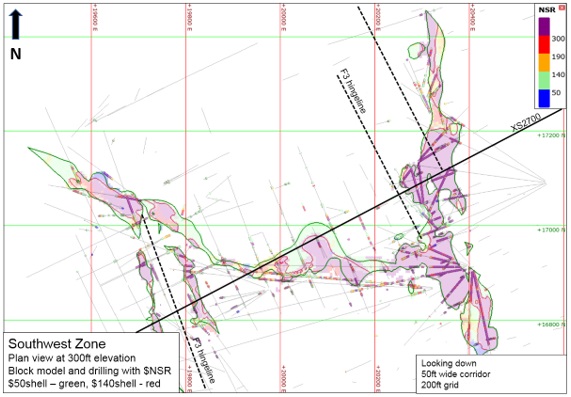
Figure 6‑35: | Southwest Zone – Level Plan 300 | 6-41 |
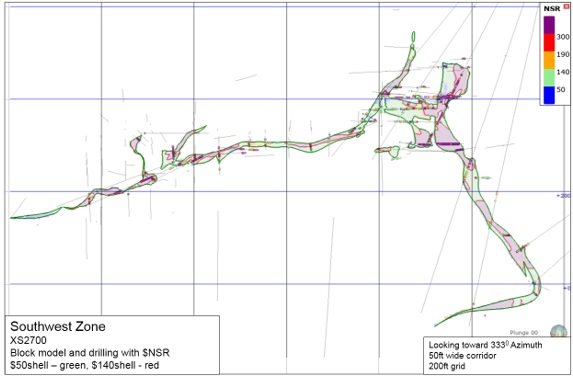
Figure 6‑36: | Southwest Zone – Cross Section 2700 | 6-41 |
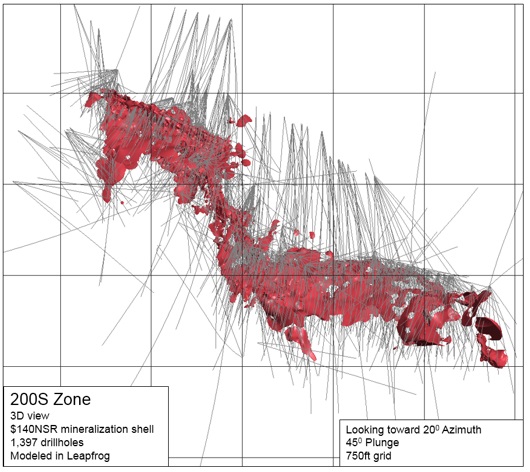
Figure 6‑37: | 200S Zone -3D Model | 6-42 |
Figure 6‑38: | 200S Zone – Level Plan 100 | 6-43 |
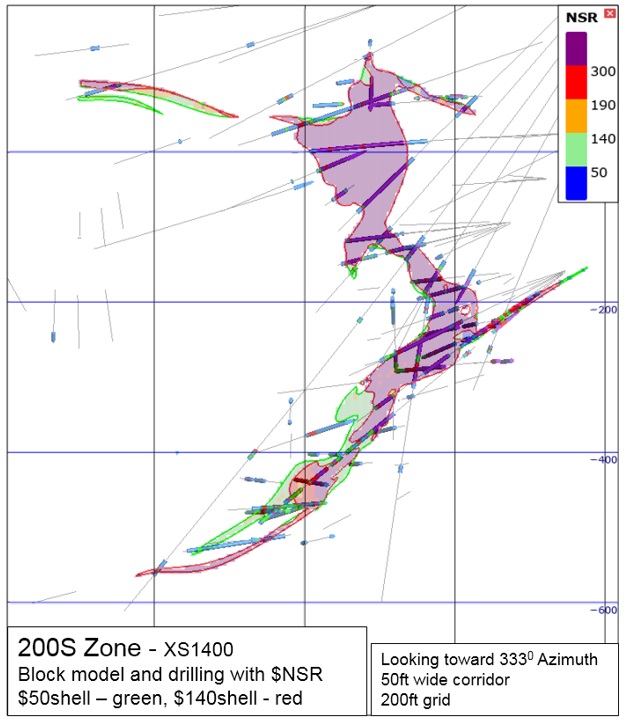
Figure 6‑39: | 200S Zone – Cross Section 1400 | 6-44 |
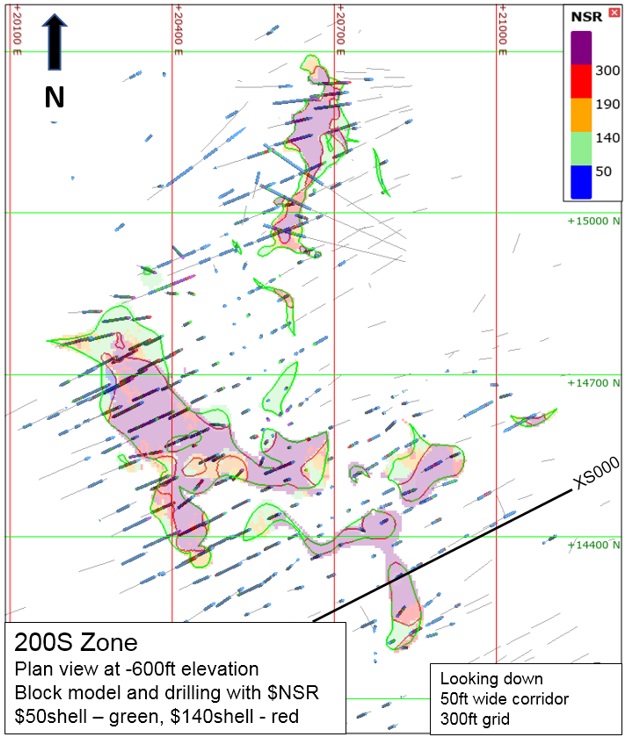
Figure 6‑40: | 200S Zone – Level Plan at -600 Elevation | 6-46 |
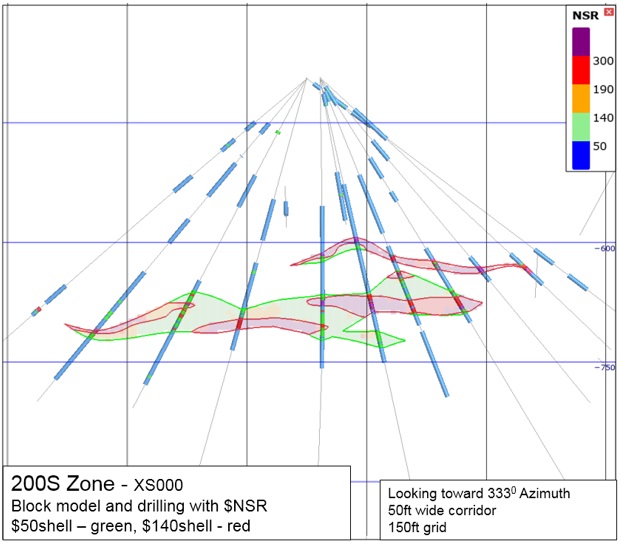
Figure 6‑41: | 200S Zone – Cross Section XS000 | 6-47 |
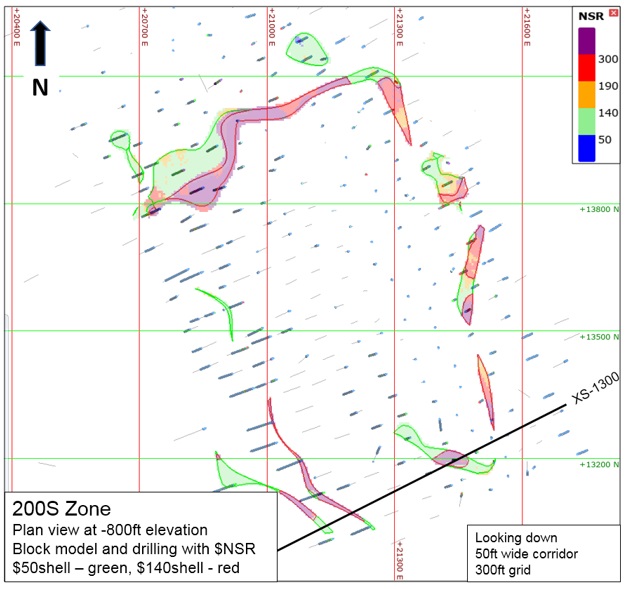
Figure 6‑42: | 200S Zone – Level Plan – 800 Elevation | 6-48 |
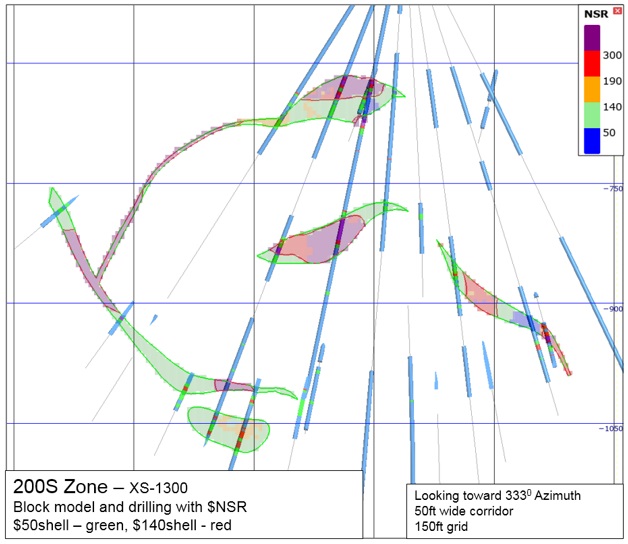
Figure 6‑43: | 200S Zone – Cross Section XS-1300 | 6-49 |
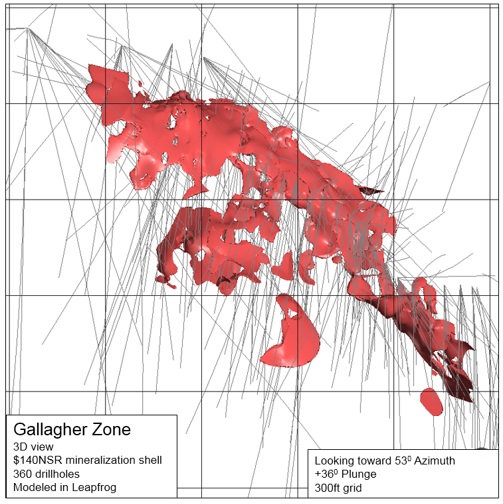
Figure 6‑44: | Gallagher Zone – 3D Model | 6-50 |
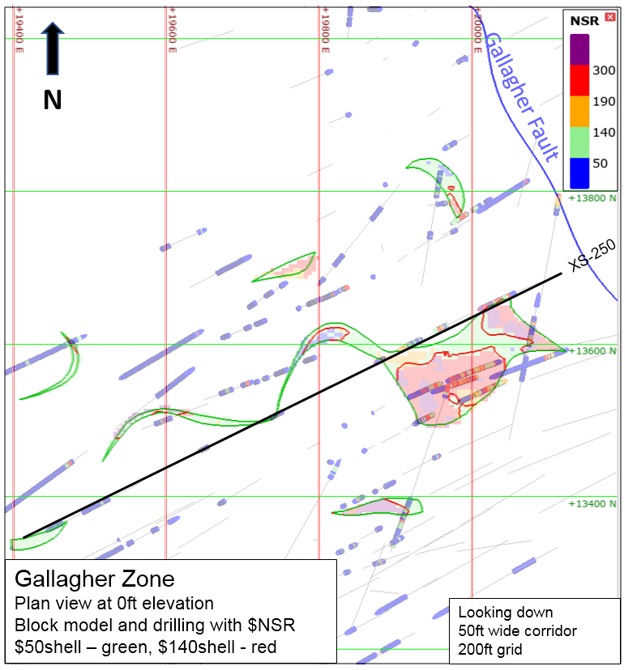
Figure 6‑45: | Gallagher Zone – Level Plan at 0 ft Elevation | 6-51 |
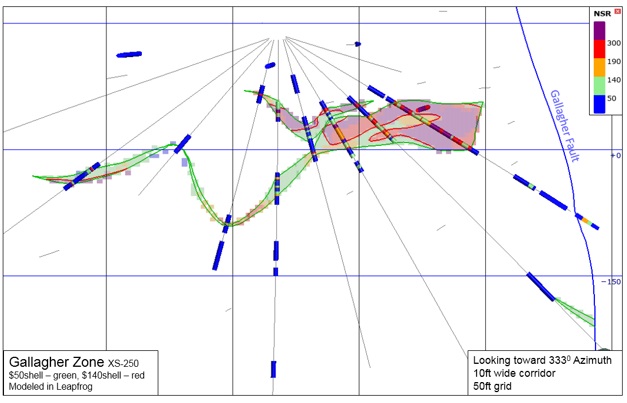
Figure 6‑46: | Gallagher Zone – Cross Section -250 | 6-52 |
Hecla Mining Company | Greens Creek Mine, SLR Project No: 101.00632.00020
Technical Report Summary - February 21, 2022
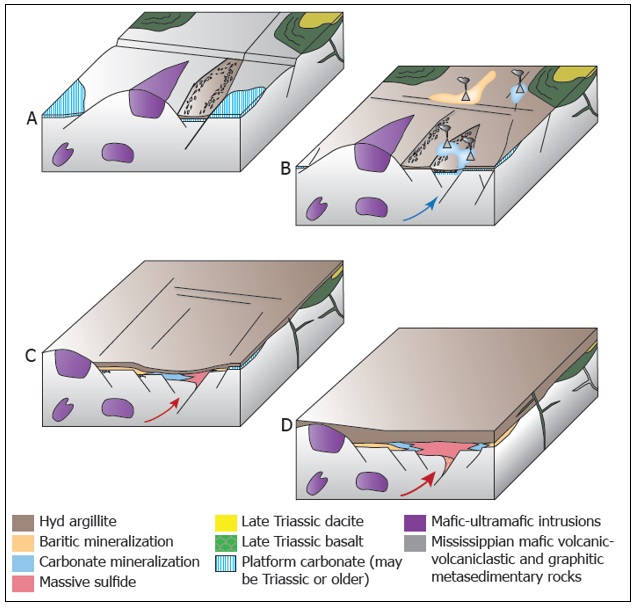
Figure 6‑47: | Schematic Depositional Setting for the Greens Creek Mineral Deposit | 6-54 |
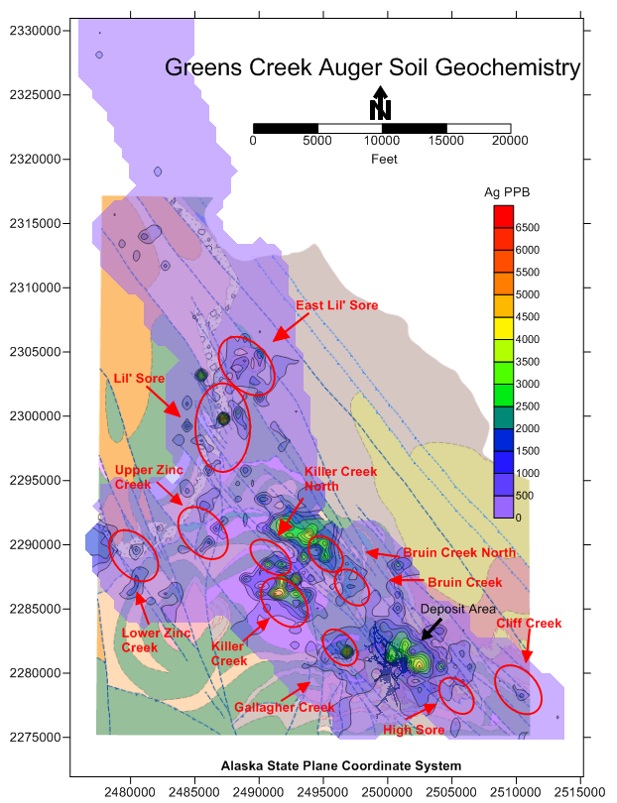
Figure 7‑1: | Greens Creek Soil Auger Geochemical Sample Location and Silver Contour Map | 7-13 |
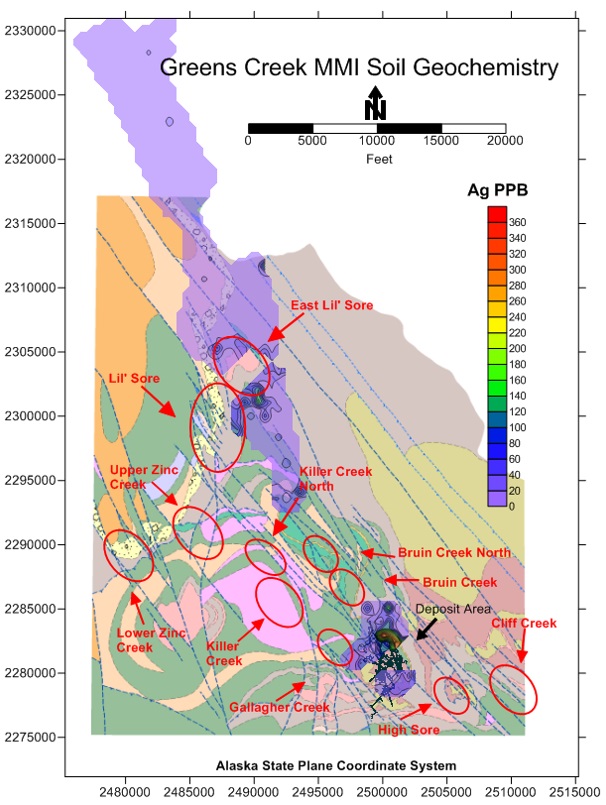
Figure 7‑2: | Greens Creek Soil MMI Geochemical Sample Location and Silver Contour Map | 7-14 |
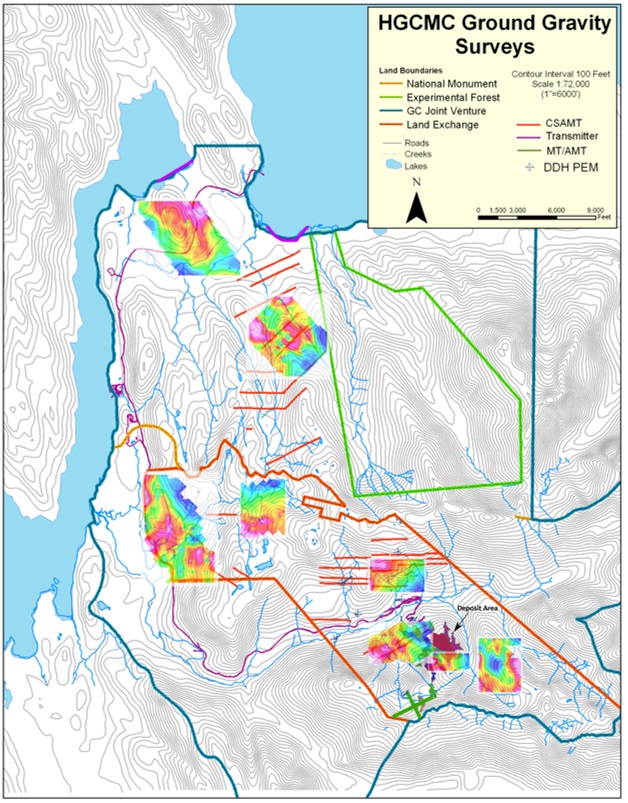
Figure 7‑3: | Greens Creek Ground Gravity Surveys | 7-22 |
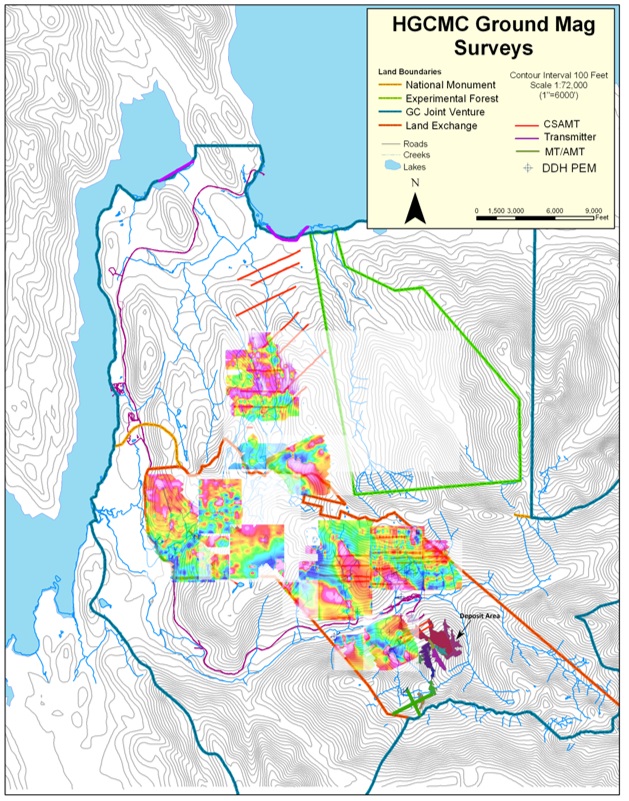
Figure 7‑4: | Greens Creek Ground Magnetic Surveys | 7-23 |
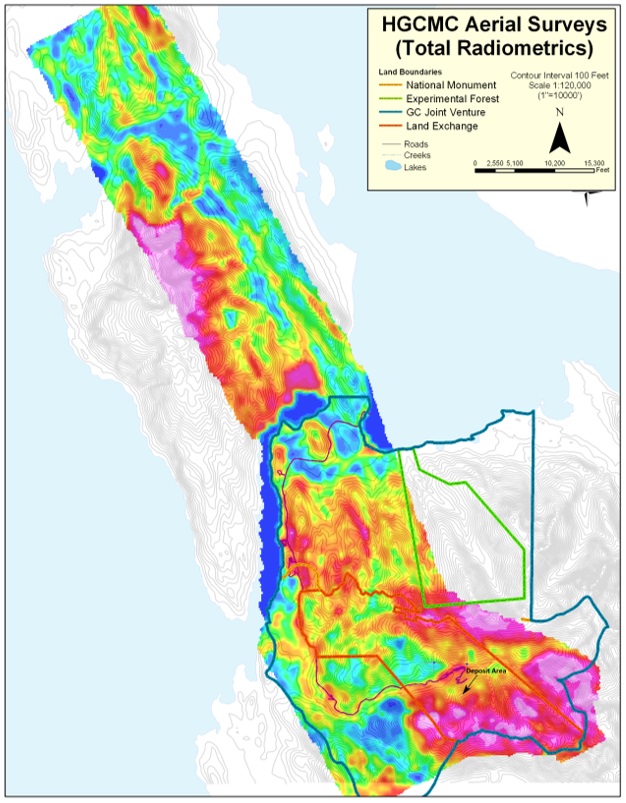
Figure 7‑5: | Greens Creek AeroDat Surveys Total Radiometrics | 7-24 |
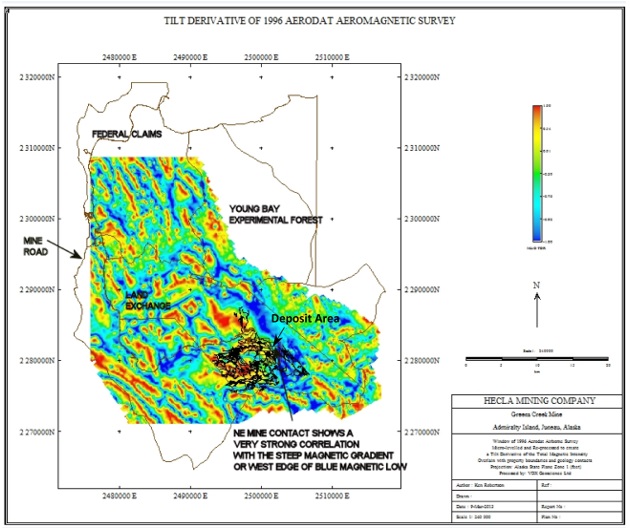
Figure 7‑6: | Greens Creek 2010-2011 Tilt Derivative Reprocessing of the AeroDat Survey Magnetics Data | 7-25 |
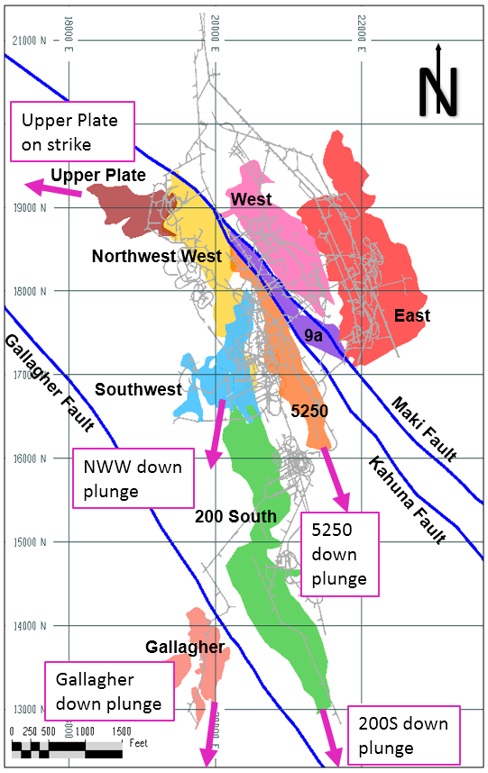
Figure 7‑7: | Plan View of Underground Exploration Targets in Relation to the Mineral Zones | 7-28 |
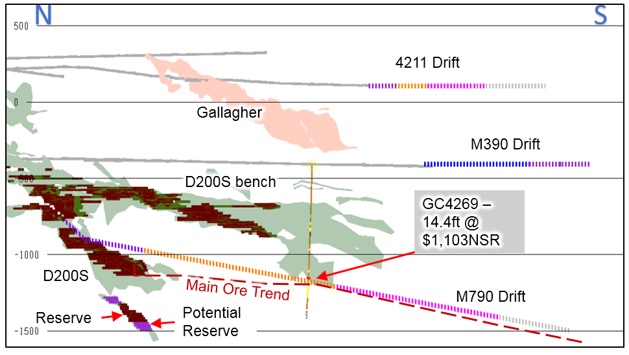
Figure 7‑8: | Drifts Planned for Exploring Down Plunge on the Gallagher Zone (4211 Drift), Upper Bench of 200S Zone (M390 Drift), and Lower Trend of 200S Zone (M790 Drift) | 7-29 |
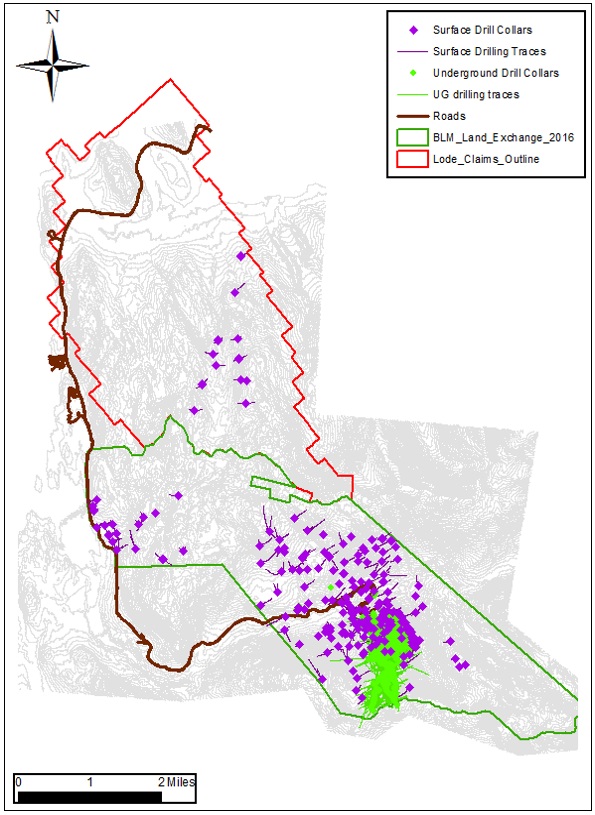
Figure 7‑9: | Plan View Map with Drill Hole Locations | 7-32 |
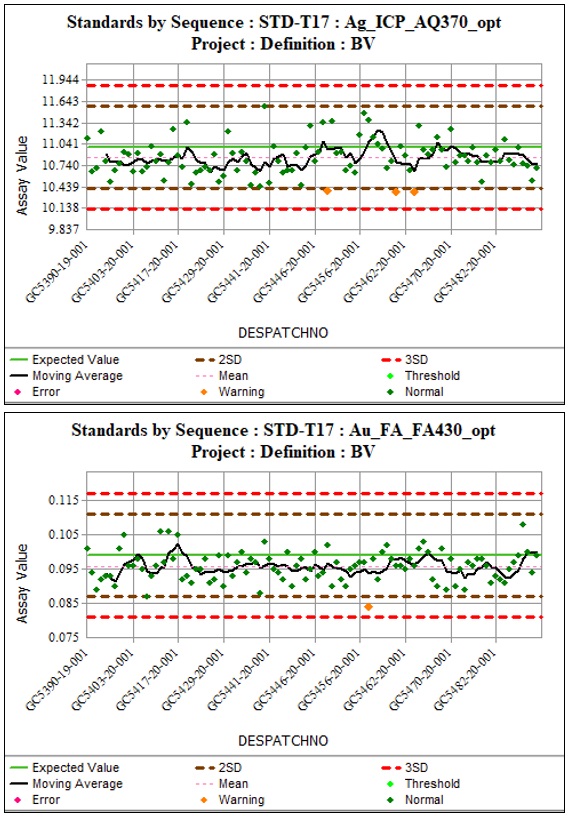
Figure 8‑1: | Standard Control Charts – Standard T17: Ag, Au – Bureau Veritas 2020 | 8-12 |
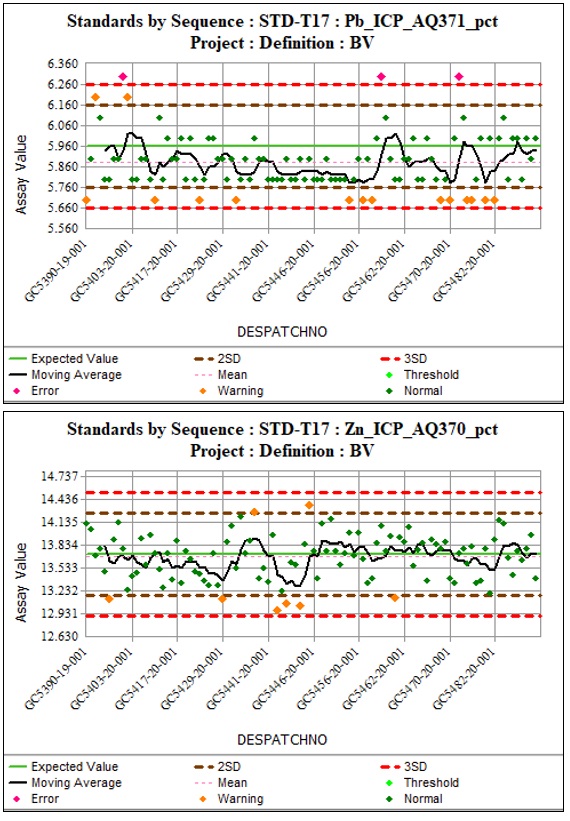
Figure 8‑2: | Standard Control Charts – Standard T17: Pb, Zn – Bureau Veritas 2020 | 8-13 |
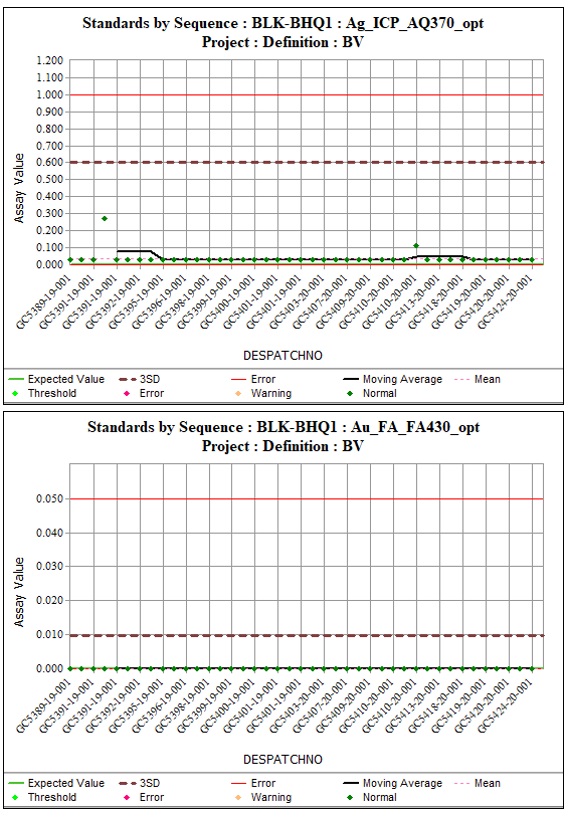
Figure 8‑3: | Standard Control Charts- Blank BHQ1: Au and Ag- Bureau Veritas 2020 | 8-15 |
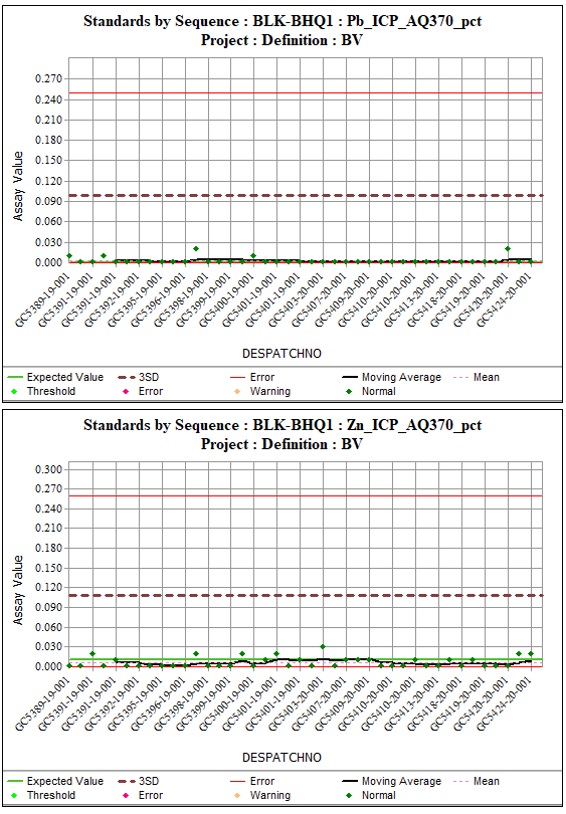
Figure 8‑4: | Standard Control Charts- Blank BHQ1: Pb and Zn- Bureau Veritas 2020 | 8-16 |
Figure 8‑5: | Pulp Duplicate Analyses for Ag and Au- Bureau Veritas 2018 | 8-18 |
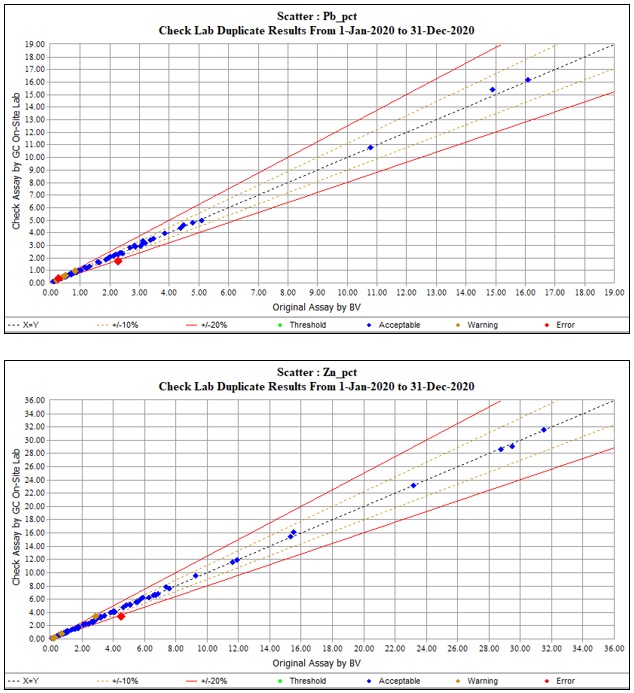
Figure 8‑6: | Pulp Duplicate Analyses for Pb and Zn- Bureau Veritas 2020 | 8-19 |
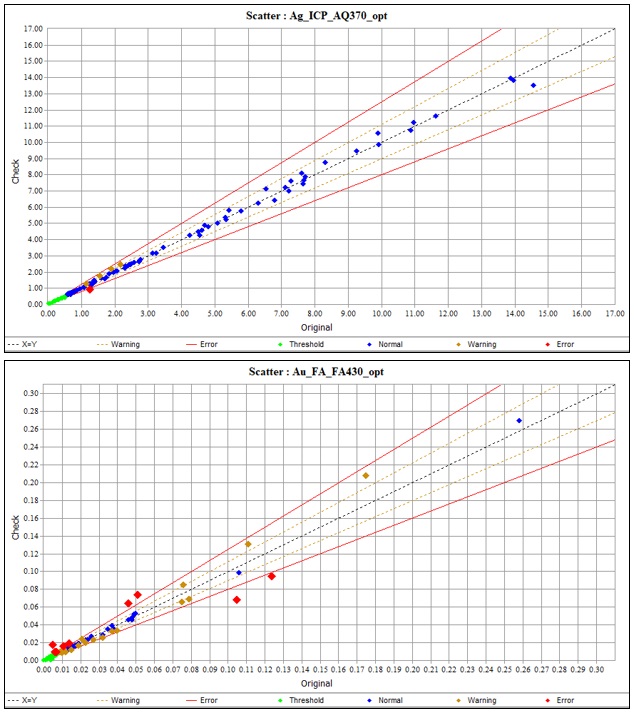
Figure 8‑7: | Pulp Check Analyses – Greens Creek Mine Laboratory: Ag, Au – 2020 | 8-21 |
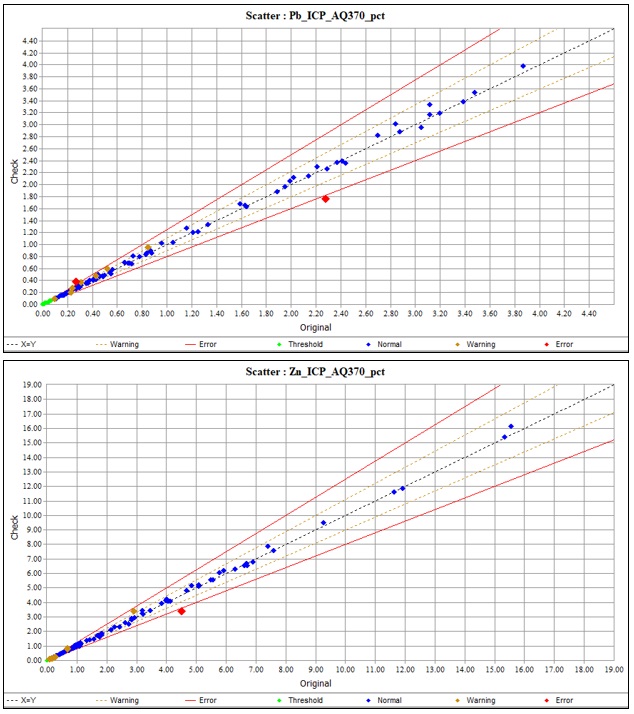
Figure 8‑8: | Pulp Check Analyses – Greens Creek Mine Laboratory: Pb, Zn – 2020 | 8-22 |
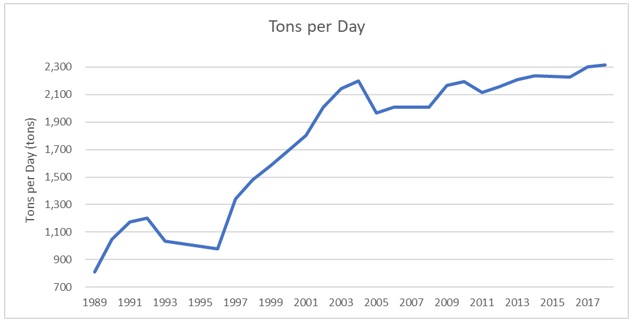
Figure 10‑1: | Incremental Throughput Improvements, 1989 through 2018 | 10-4 |
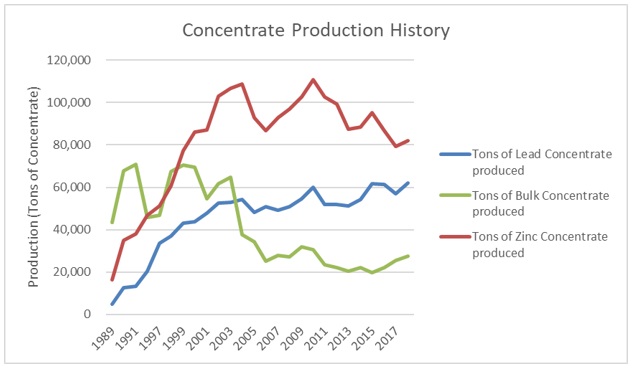
Figure 10‑2: | Concentrate Production History, 1989 to 2018 | 10-5 |
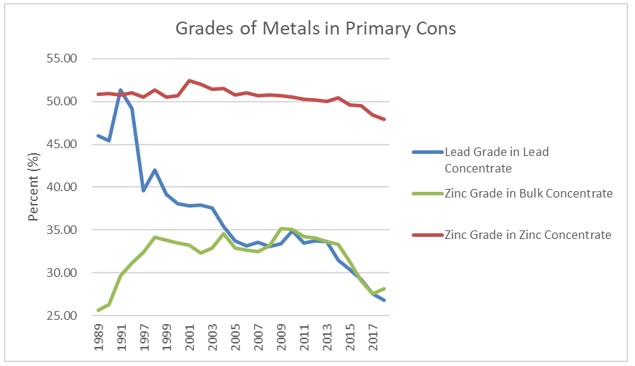
Figure 10‑3: | Changes in Metal Grades in Primary Concentrates, 1989 to 2018 | 10-6 |
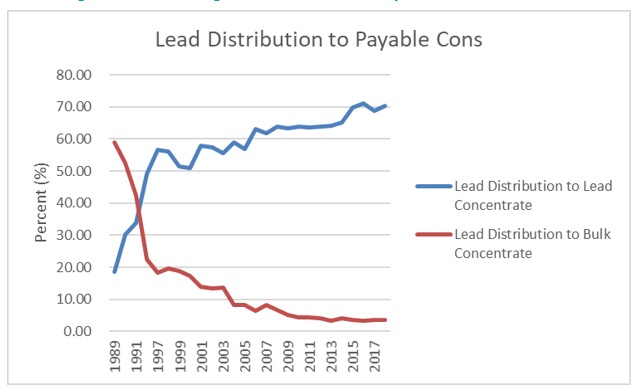
Figure 10‑4: | Changes in Lead Distribution in Primary Concentrates, 1989 to 2018 | 10-6 |
Figure 10‑5: | Changes in Lead Distribution in Primary Concentrates, 1989 to 2018 | 10-7 |
Figure 10‑6: | Distribution of Recovered Silver into Product Streams – 2018 | 10-7 |
Figure 10‑7: | Distribution of Recovered Gold into Product Streams – 2018 | 10-8 |
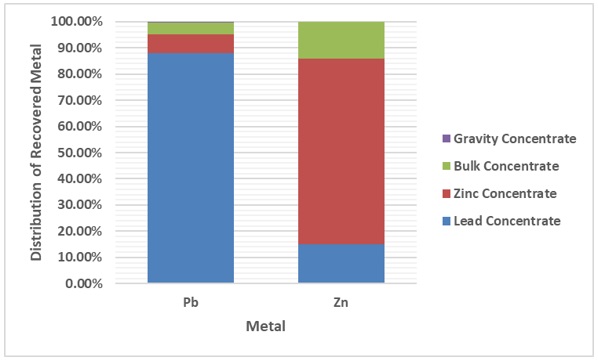
Figure 10‑8: | Distribution of Recovered Zinc and Lead into Product Streams – 2018 | 10-8 |
Figure 11‑1: | Distribution of Value by Metal | 11-5 |
Figure 11‑2: | Three-Dimensional Contours of Gold for the $50 NSR/ton Wireframe, Looking Northwest, 200S Deposit | 11-12 |
Figure 11‑3: | Three-Dimensional Contours of Silver for the $50 NSR/ton Wireframe, Looking Northwest, 200S Deposit | 11-13 |
Hecla Mining Company | Greens Creek Mine, SLR Project No: 101.00632.00020
Technical Report Summary - February 21, 2022
Figure 11‑4: | Three-Dimensional Contours of Lead for the $50 NSR/ton Wireframe, Looking Northwest, 200S Deposit | 11-13 |
Figure 11‑5: | Three-Dimensional Contours of Zinc for the $50 NSR/ton Wireframe, Looking Northwest, 200S Deposit | 11-13 |
Figure 11‑6: | Normal Scores for Gold, 200S Deposit Major Direction, $140 NSR/ton Wireframe | 11-14 |
Figure 11‑7: | Normal Scores for Silver, 200S Deposit Major Direction, $140 NSR/ton Wireframe | 11-15 |
Figure 11‑8: | Normal Scores for Lead, 200S Deposit Major Direction, $140 NSR/ton Wireframe | 11-15 |
Figure 11‑9: | Normal Scores Variogram for Zinc, 200S Deposit Major Direction, $140 NSR/ton Wireframe | 11-16 |
Figure 11‑10: | Swath Plot by Northing for Gold - $140 NSR/ton Wireframe, 200S Deposit | 11-20 |
Figure 11‑11: | Swath Plot by Northing for Silver- $140 NSR/ton Wireframe, 200S Deposit | 11-21 |
Figure 11‑12: | Swath Plot by Northing for Lead- $140 NSR/ton Wireframe, 200S Deposit | 11-21 |
Figure 11‑13: | Swath Plot by Northing for Zinc - $140 NSR/ton Wireframe, 200S Deposit | 11-22 |
Figure 11‑14: | Comparison of 3D Contoured Grades with Block Model Estimated Grades, Gold, 200S Deposit | 11-23 |
Figure 11‑15: | Comparison of 3D Contoured Grades with Block Model Estimated Grades, Silver, 200S Deposit | 11-24 |
Figure 11‑16: | Comparison of 3D Contoured Grades with Block Model Estimated Grades, Lead, 200S Deposit | 11-25 |
Figure 11‑17: | Comparison of 3D Contoured Grades with Block Model Estimated Grades, Zinc, 200S Deposit | 11-26 |
Figure 12‑1: | Distribution of Mineral Reserves by Mineral Zone | 12-8 |
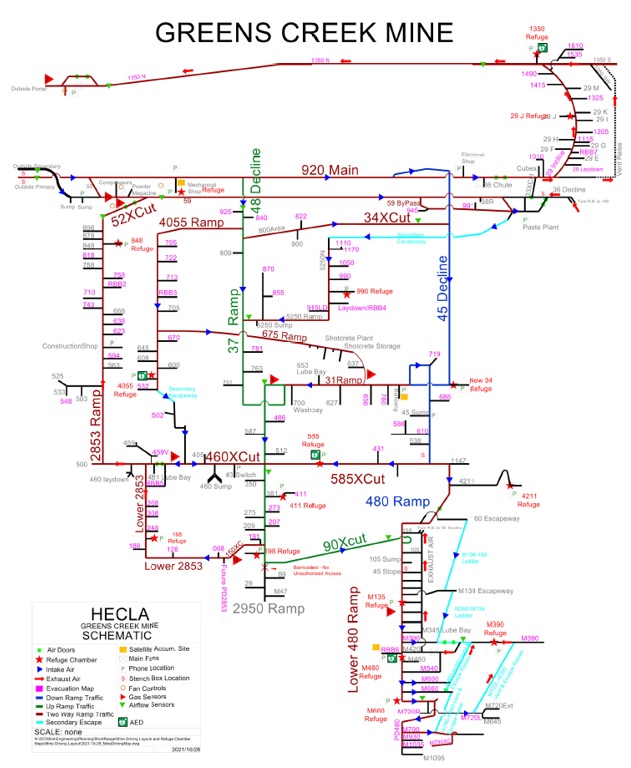
Figure 13‑1: | Underground Mine General Layout Schematic | 13-2 |
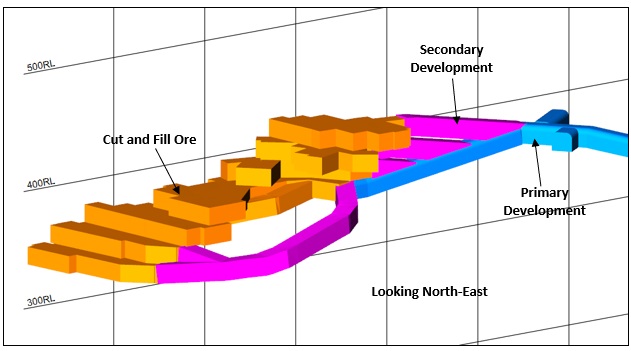
Figure 13‑2: | Typical Cut and Fill Design from NWW Zone | 13-4 |
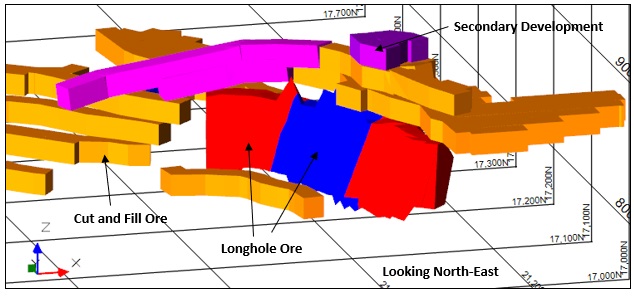
Figure 13‑3: | Typical Longhole Design from 5250 Zone | 13-5 |
Figure 13‑4: | Active Face | 13-5 |
Figure 13‑5: | Mine Ventilation Schematic | 13-9 |
Figure 13‑6: | Typical Auxiliary Fan Layout | 13-10 |
Figure 13‑7: | Mine Plan – Life of Mine Ore Production | 13-17 |
Figure 13‑8: | Life of Mine Expensed and Capital Development | 13-19 |
Figure 13‑9: | Life of Mine Capital Lateral Development by Zone | 13-20 |
Figure 13‑10: | Mine Development 2021 to 2024 | 13-21 |
Figure 13‑11: | Mine Development | 13-21 |
Figure 13‑12: | Plan View- Existing and Planned Primary Mine Development through 2032 | 13-22 |
Figure 13‑13: | Plan View- Existing and Planned Mine Development including Mineral Reserves | 13-22 |
Hecla Mining Company | Greens Creek Mine, SLR Project No: 101.00632.00020
Technical Report Summary - February 21, 2022
Figure 13‑14: | 3D View- Existing and Planned Primary Mine Development through 2032 | 13-23 |
Figure 13‑15: | 3D View- Existing and Planned Mine Development including Mineral Reserves | 13-23 |
Figure 14‑1: | Greens Creek Plant Flowsheet | 14-3 |
Figure 15‑1: | Infrastructure Layout Map | 15-2 |
Figure 15‑2: | Hawk Inlet Infrastructure | 15-3 |
Figure 15‑3: | 920 & 860 Mine Site Area | 15-4 |
Figure 15‑4: | Hawk Inlet Facilities | 15-4 |
Figure 15‑5: | 920 Area Facilities | 15-5 |
Figure 15‑6: | Hawk Inlet Dry Stack Tailings Disposal Facility | 15-7 |
Figure 15‑7: | Site 23 Waste Rock Storage Facility | 15-9 |
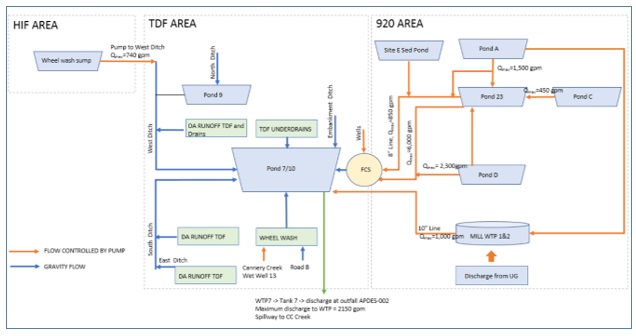
Figure 15‑8: | Greens Creek Water Management Flowchart | 15-11 |
Figure 16‑1: | Concentrate Destinations | 16-3 |
Figure 19‑1: | After-tax NPV at 5% Sensitivity Analysis | 19-7 |
APPENDIX TABLES AND FIGURES
| | | |
Table A1: | Summary of the Unpatented Lode Claims | 27-2 |
Table A2: | Summary of the Unpatented Mill Site Claims | 27-16 |
Hecla Mining Company | Greens Creek Mine, SLR Project No: 101.00632.00020
Technical Report Summary - February 21, 2022
SLR International Corporation (SLR) was retained by Hecla Mining Company (Hecla) to prepare an independent Technical Report Summary (TRS) for the Greens Creek Mine (Greens Creek or the Property), located in southeastern Alaska, USA The purpose of this TRS is to support the disclosure of the Greens Creek Mineral Resource and Mineral Reserve estimates as of December 31, 2021. This TRS conforms to the United States Securities and Exchange Commission’s (SEC) Modernized Property Disclosure Requirements for Mining Registrants as described in Subpart 229.1300 of Regulation S-K, Disclosure by Registrants Engaged in Mining Operations (S-K 1300) and Item 601 (b)(96) Technical Report Summary. SLR visited the Property on September 21 and 22, 2021.
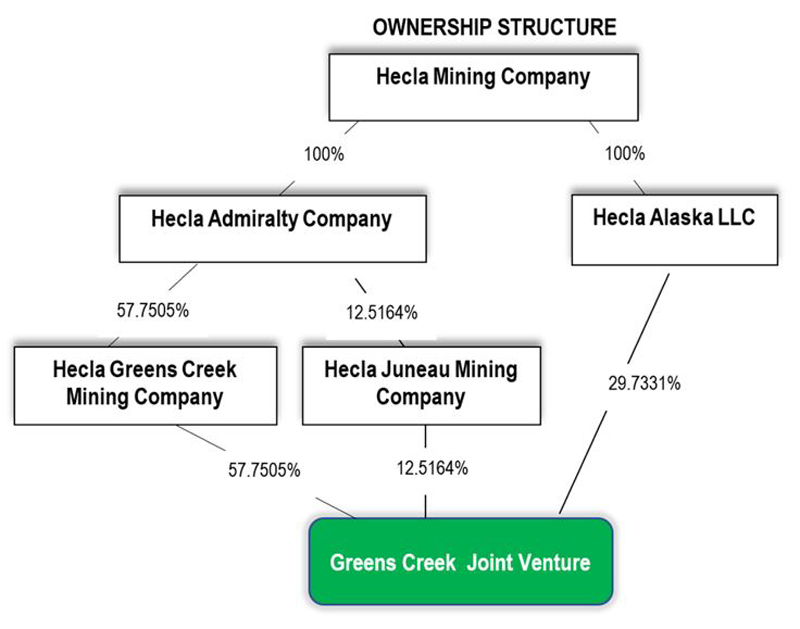
Hecla was established in 1891 and has its headquarters in Coeur d’Alene, Idaho, USA. Hecla owns and operates 100% of the Property via ownership through several Hecla corporate entities. Hecla is listed on the New York Stock Exchange (NYSE) and currently reports Mineral Reserves of lead, zinc, silver, and gold in SEC filings.
The Property includes the Greens Creek mine and a processing plant (or mill). The mine primarily produces silver, with accompanying zinc, gold, and lead extracted from sediment and volcanic hosted, stratiform massive sulfide deposits using underground mining methods. The plant is a conventional flotation concentrator that produces a gravity gold concentrate, a silver concentrate, a zinc concentrate and a precious metals concentrate comprising precious and base metals.
Greens Creek commenced operations in 1989 with Rio Tinto Zinc as the operator. In 2008, Hecla acquired Kennecott Minerals’ (Kennecott) interest and became the sole owner of the Property. Except for a three year hiatus between 1993 to 1996, the mine has been in continuous operation since 1989 and as of December 31, 2020 the mine has produced a total of approximately 1.95 million tons (Mst) Zn, approximately 0.76 tons Pb, approximately 322 million ounces (Moz) Ag, and approximately 2.66 Moz Au in the plant feed.
For 2021, mine production occurred at a rate of approximately 2,100 tons per day (stpd) to 2,300 stpd using cut and fill and longhole stoping as the primary mining methods. Greens Creek has produced 9.2 Moz Ag in 2021.
SLR offers the following conclusions by area.
1.1.1.1 | Geology and Mineral Resources |
| | ● | Exploration activities have been successful in identifying a number of additional massive sulfide lenses at depth beyond the initial mineralization discovered on surface. To date, economic mineralization has been located in nine deposits that are located in spatial proximity to a contact between footwall phyllitic rocks (interpreted as altered mafic volcanic and volcaniclastic rocks) and hanging wall clastic sedimentary units. Large portions of this favorable mine contact have not been fully evaluated by diamond drilling at depth. |
Hecla Mining Company | Greens Creek Mine, SLR Project No: 101.00632.00020
Technical Report Summary - February 21, 2022
| | ● | The understanding of the genetic aspects of the Greens Creek mineralization continues to evolve and improve as a result of the academic studies completed to date. The level of knowledge is likely to continue to improve with additional studies. |
| | ● | The understanding of the complex folding and faulting history of the host rocks and massive sulfide mineralization also continues to improve with further studies and collection of additional drilling information. |
| | ● | As prepared by Hecla, and reviewed and accepted by SLR, the Greens Creek Indicated Mineral Resources are estimated to total approximately 8.36 Mst at an average grade of approximately 12.8 oz/ton Ag, 0.10 oz/ton Au, 3.0% Pb, and 8.4% Zn. Inferred Mineral Resources are estimated at approximately 2.15 Mst at an average grade of approximately 12.8 oz/ton Ag, 0.08 oz/ton Au, 2.8% Pb, and 6.8% Zn. All Mineral Resources are effective as of December 31, 2021 and are stated exclusive of Mineral Reserves. |
| | ● | Mineral Resources have been classified in accordance with S-K 1300 definitions for Mineral Resources. |
| | ● | The geological data and procedures are adequate for the estimation of Mineral Resources and comply with industry standards. |
| | ● | The “Reasonable Prospects for Economic Extraction” requirement for Mineral Resources as defined in S-K 1300 is satisfied by the application of polygons as reporting criteria for eight of the nine mineralized deposits such that: |
| | o | All blocks >$215 net smelter return (NSR)/ton immediately adjacent to the designed Mineral Reserve shapes were enclosed. |
| | o | All blocks >$215 NSR/ton that may be separated from the designed Mineral Reserve shapes were enclosed if the blocks were observed to be continuous in 3D to contain a total of approximately 20,000 tons or more. Where these blocks were only a single block wide (five feet), they were not enclosed. |
| | o | No blocks >$215 NSR/ton immediately adjacent to as-builts were enclosed unless those blocks were determined to be sufficiently continuous and wide enough to support a separate stope. |
| | o | Once blocks were selected in the appropriate model, they were reported without any dilution from neighboring blocks with <$215 NSR/ton values. |
| | ● | The “Reasonable Prospects for Economic Extraction” requirement for Mineral Resources as defined in S-K 1300 is satisfied for the Gallagher deposit by application of similar criteria, however, using an increased cut-off value of $220 NSR/ton. |
1.1.1.2 | Mining and Mineral Reserves |
| | ● | Mineral Reserve estimates, as prepared by Hecla and reviewed and accepted by SLR, have been classified in accordance with S-K 1300 definitions for Mineral Reserves. Mineral Reserves as of December 31, 2021 total 11.08 Mst grading 11.3 oz/ton Ag, 0.085 oz/ton Au, 2.6% Pb, and 6.5% Zn and containing 125.2 Moz Ag, 0.946 Moz Au, 282,000 tons Pb and 726,000 tons Zn at an NSR cut-off value of $215 NSR/ton. |
| | ● | The Mineral Reserves are divided into nine separate zones, each constituting between 3% and 27% of total Mineral Reserve tons. The largest zone is 200S followed by South-West. |
Hecla Mining Company | Greens Creek Mine, SLR Project No: 101.00632.00020
Technical Report Summary - February 21, 2022
| | ● | Mineral Reserves are estimated by qualified professionals using modern mine planning software in a manner consistent with industry best practices. |
| | ● | SLR verified that Hecla’s selected metal prices for estimating Mineral Reserves are consistent with independent forecasts from banks and other lenders. |
| | ● | Mineral Reserve estimates do not include Inferred material which historically have constituted a large portion of ore mined at Greens Creek. |
| | ● | Greens Creek is a well established mine with many years of operating experience, providing the necessary expertise to extract, safely and economically, the Mineral Reserves. |
| | ● | Mining at Greens Creek primarily utilizes cut and fill, and drift and fill techniques, supplemented by longhole stoping where orebody geometry permits. The mining methods used are appropriate to the deposit style and employ conventional mining tools and mechanization. All areas are backfilled with either paste or rock fill depending on future confinement and strength requirements. |
| | ● | Stopes are designed to a minimum mining width governed by mining equipment. Two dilution factors are applied to all mining shapes; 6% to account for overbreak into surrounding rock, and 6% to account for overbreak into adjacent backfill. Background metal grades for waste and tailings are applied, respectively. |
| | ● | Extraction for all mining methods is assumed to be 100% based on operating experience. |
| | ● | Greens Creek tends to mine a significant amount of material outside of the Mineral Reserves each year. This is typically Inferred Resources at the margins of Mineral Reserves, and additional reserve grade material not previously identified by the definition diamond drilling program. |
| | ● | The equipment and infrastructure requirements for life of mine (LOM) operations are well understood. Conventional underground mining equipment is used to support the underground mining activities. |
| | ● | The underground equipment fleet is standard to the industry and has been proven on site. Numerous crucial units have recently been replaced or overhauled as part of the mobile equipment rebuild/replacement schedule. |
| | ● | The predicted mine life to 2035 is achievable based on the projected Mineral Reserves estimated. SLR is of the opinion however, that maintaining the planned production rate is optimistic and will be particularly difficult as the number of active mining areas drops toward the end of the LOM. |
1.1.1.3 | Mineral Processing |
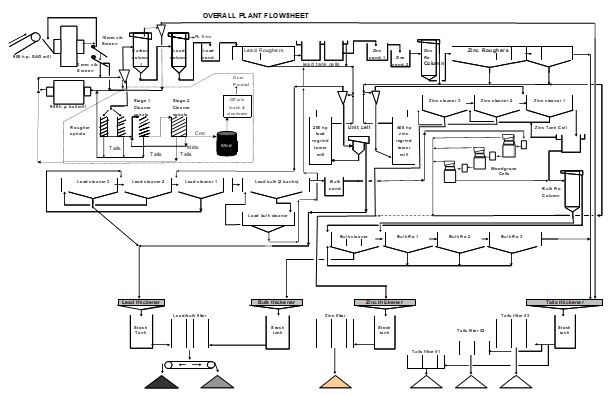
| | ● | The plant is a conventional but complex semi-autogenous grinding (SAG) mill-ball mill grinding and flotation concentrator producing silver, zinc and precious metals (PM) flotation concentrates and gold concentrate using gravity spiral concentrators. The plant is compact and efficient, using particle size monitoring and on-stream analysis for grinding and flotation process control. |
| | ● | The target grind size for rougher flotation is 80% passing (P80) 70 μm to 85 μm and 95% passing (P95) 140 μm to 160 μm. A particle size monitor is used to monitor cyclone overflow on a continuous basis. |
| | ● | A gravity circuit comprising three stages of gravity spiral concentrators treats part of the grinding circuit cyclone underflow producing a precious metals concentrate that is shipped off site for intensive leaching, electrowinning, and doré casting. The gravity concentrates typically recover 15% to 20% of the gold in the mill feed and less than 1% of the silver. |
Hecla Mining Company | Greens Creek Mine, SLR Project No: 101.00632.00020
Technical Report Summary - February 21, 2022
| | ● | Naturally floating carbonaceous material is removed from the flotation feed using column flotation cells, improving the performance of the lead flotation cells. |
| | ● | The first stage of both lead and zinc rougher flotation uses column flotation cells. The concentrate from the lead rougher column is final concentrate and flows directly to the concentrate thickeners. Zinc column concentrates may also be of final concentrate grade and can be pumped to the concentrate thickener. |
| | ● | The lead and zinc rougher concentrates are reground to P80 20 μm (98% passing 38 μm) using Metso Outotec Vertimills prior to cleaning. A unit flotation cell is installed in the lead Vertimill regrinding circuit circulating load to recover galena, gold and silver from the lead regrind cyclone underflow and to reduce overgrinding. The unit cell concentrates flow by gravity to the silver concentrate thickener. |
| | ● | Lead and zinc roughing and cleaning circuits are similar using conventional mechanical cells. |
| | ● | The PM flotation circuit treats the lead and zinc circuit cleaner tailings. The lead cleaner tailings feeds a lead PM rougher and cleaner circuit followed by Woodgrove swing cells before joining the zinc cleaner tailings in the PM rougher column cell feeding the PM flotation circuit. |
| | ● | Flotation circuit performance is monitored by on-stream analysis of eighteen flotation circuit streams for lead, zinc, copper, silver, iron, and percent solids every 15 minutes using an on-stream analyzer. Mass flow is calculated on each concentrate stream providing an estimated concentrate mass yield for each concentrate. |
| | ● | On-stream assays for all streams are used with feed tonnage and concentrate mass flow estimates to determine an estimated on-line mass balance. Daily composites of on-stream analysis samples are collected and assayed to monitor and correct on-stream analyzer (OSA) calibration. |
| | ● | The Greens Creek metallurgical department provides flotation grade targets to the operators, which then adjust rougher and cleaner mass yields by manual control of reagent addition. |
| | ● | Reagents are pumped from the reagent mixing and storage area to head tanks at appropriate locations in the flotation circuit. The head tanks are equipped with computerized solenoid discharge valves for gravity addition of flotation reagents. Flocculants are added by positive displacement pumps and CO2 is added using customized mixing systems to inject CO2 into a water stream. |
| | ● | Tailings filtration is a very important operation at Greens Creek. All filter presses are equipped for diaphragm pressing and cake blowing using regular plant air and are mounted on four load cells to determine cake weight, monitor the degree of slurry filling, degree of completion of diaphragm press and air blow cycles, completeness of cake discharge, and the weight of cake produced on each cycle. |
| | ● | Tailings filtration is a potential limiting operation in the plant. Tailings filtration is carried out in presses of similar design, with each press yielding four tons to 4.5 tons of filter cake at 11% to 12% moisture every seven to eight minutes. Tailings are sent to the surface batch plant to satisfy the mine’s backfilling requirements. Excess tailings filter cake is trucked to the dry stack tailings disposal facility (TDF) for placement and compaction according to an engineered design. |
| | ● | Mill production, ore grades and recoveries are consistent for both the five year and 10 year LOM plan. The average annual production for the period is 950,000 tons of ore with total lead, zinc, silver and gold recoveries of 81%, 89%, 80%, and 69%, respectively. The plant is projected to produce approximately 12 Moz Ag and 83,000 oz Au per year, with most of the precious metals reporting to the silver concentrate, and 18% of the gold reporting to the gravity concentrate. The primary grades of the silver, zinc, and PM concentrates are 27.5% Pb, 47.5% Zn, and 25% Zn, respectively. |
Hecla Mining Company | Greens Creek Mine, SLR Project No: 101.00632.00020
Technical Report Summary - February 21, 2022
| | ● | Greens Creek has the appropriate infrastructure to support the current LOM plan to 2032. |
| | ● | Modifications to the plan of operations and engineering are necessary to optimize the waste storage capacity at Site 23. |
| | ● | Early-stage engineering studies are in progress to determine modifications to the plan of operations to accommodate additional material beyond the current Greens Creek Mineral Reserve life. |
| | ● | Engineering studies to gain an understanding of options for final disposal of historic waste rock piles, include the potential for impoundment in the TDF or underground disposal. |
| | ● | Hecla maintains a comprehensive environmental management and compliance program. All permits required for the current Greens Creek operations are in place, and mine staff continually monitor permits/regulated conditions and file required reports with the applicable regulatory agencies at the federal, state, and local level. |
| | ● | Greens Creek represents one of the longest concurrent environmental baseline databases available used in assessing compliance and impact. |
| | ● | Hecla’s Environmental Management System (EMS) follows a 13 element plan-do-check-act approach that ensures continuous improvement around issues including obligation registers, management of change, air quality, water and waste management, energy management, training, and reporting. This system promotes a culture of environmental awareness and innovation throughout the company. The EMS program is benchmarked against ISO-14001 and complements Canada’s Towards Sustainable Mining (TSM) program. On a related matter, there appears to be good cross-discipline support for the overall environmental program. |
| | ● | Hecla has sufficiently addressed the environmental impact of the operation, and subsequent closure and remediation. No Notice(s) of Violation were reported during 2021 and Hecla works cooperatively with federal, state, and local agencies regarding permitting, regulatory oversite, and inspections. |
| | ● | Hecla has developed a reclamation/closure plan to meet internal Hecla and regulatory requirements. The most recent cost estimates to perform this work is $108.2 million (November 2021 Asset Retirement Obligation (ARO)). Financial Assurance instruments are in place to ensure closure commitments are guaranteed should Hecla be unable to perform its obligations. |
| | ● | Hecla reports that community relationships are good, and that it maintains open communication with the public for the purpose of providing information to interested residents and visitors. |
Hecla Mining Company | Greens Creek Mine, SLR Project No: 101.00632.00020
Technical Report Summary - February 21, 2022
SLR offers the following recommendations by area.
1.1.2.1 | Geology and Mineral Resources |
| | 1. | For future Mineral Resource updates apply a metal price deck to the creation of mineralization wireframes that aligns with the prices used to prepare the Mineral Resource statements. |
| | 2. | Evaluate the impact of treating any unsampled intervals for the non-payable metals (such as barium, calcium, and iron) as null values upon the calculation of the block density values. |
1.1.2.2 | Mining and Mineral Reserves |
| | 1. | Use a single set of metal prices for Mineral Reserve reporting and LOM planning to maintain cut-off grade consistency. |
| | 2. | Update backfill metal grades in future LOM plans to reflect expected tailings grades. |
| | 3. | Evaluate actual extraction (recovery) from longhole stoping areas and consider applying a modifying factor if appropriate. |
| | 4. | Treat waste material and Inferred material in a similar manner with respect to metal grade assignment. |
| | 5. | Continue to investigate the resource model accuracy through reconciliation analysis and strive to improve lead and zinc grade estimates. |
| | 6. | Continue to identify production areas suitable for longhole mining in the LOM plan to take advantage of the production efficiencies gained through bulk mining. |
| | 7. | Create a long range plan (LRP) with Inferred material removed. Stoping areas and supporting development should be designed to maximize the recovery of Mineral Reserves. These designs can be augmented with additional designs that target the recovery of Inferred material and used to develop a LRP that can be used as a comparison against the LOM plan. SLR is of the opinion that following this methodology will: |
| | o | Result in a more robust LOM plan that is more likely to be achieved. |
| | o | Allow for more accurate reporting of Mineral Reserve grades and tons, and production and development costs. |
1.1.2.3 | Mineral Processing |
| | 1. | Maintain continuous communication between the plant and the mine to understand the feed materials being delivered to the blending stockpiles at the plant. |
| | 2. | Prioritize plans to upgrade or replace the existing automated tailings filters. Tailings filtration is a limiting operation in the plant and achieving the throughput rates and cake moistures is dependent on operations and maintenance of the filtration equipment and the material types being processed. |
| | 1. | Track and participate in the development of new environmental and mine permitting regulations that could impact operations. |
Hecla Mining Company | Greens Creek Mine, SLR Project No: 101.00632.00020
Technical Report Summary - February 21, 2022
| | 2. | Continue to perform internal and external audits of environmental compliance. |
| | 3. | Evaluate opportunities for concurrent reclamation to minimize financial obligations at closure. |
| | 4. | Continue to update reclamation and closure cost estimates on a regular basis. |
An after-tax cash flow projection has been prepared from the LOM production schedule and capital and operating cost estimates and is summarized in Table 1‑2. A summary of the key criteria is provided in following subsections.
| | ● | Total mill feed processed: 11.1 Mst |
| | ● | Average processing rate: 2,300 stpd with following production profile presented in Table 1‑1. |
Table 1‑1: Production Summary
Hecla Mining Company – Greens Creek Mine
Commodity | Head Grade | % Recovery | Recovered
Metal | Annual
Production | Payable Metal |
Gold | 0.09 oz/ton | 72.8 | 0.69 Moz | 52,000 oz/year | 0.58 Moz |
Silver | 11.3 oz/ton | 76.5 | 95.7 Moz | 7.3 Moz/year | 85.6 Moz |
Lead | 2.5% | 78.4 | 443 Mlb | 34 Mlb/year | 338 Mlb |
Zinc | 6.6% | 86.1 | 1,250 Mlb | 94 Mlb/year | 865 Mlb |
| | ● | Metal prices used in the economic analysis are constant US$1,650/oz Au, US$21/oz Ag, US$0.95/lb Pb, and US$1.25/lb Zn. |
| | ● | Revenue is calculated assuming the above metal price forecast and incorporates a $2.7 million hedge loss for lead and zinc over the first three years of the cash flow. |
| | ● | Average LOM concentrate freight cost: $57/wet metric tonne with cost, insurance, and freight (CIF) basis to customer’s discharge points. |
| | ● | Average LOM benchmark treatment charge: $115/dry metric tonne (dmt) Ag concentrate, $190/dmt Zn to $202/dmt Zn and precious metal concentrates. |
| | ● | Average LOM refining costs for concentrates: $0.07/dmt. |
| | ● | Average doré refining cost: $2.10/oz Au. |
1.2.1.3 | Capital and Operating Costs |
| | ● | LOM capital costs of $294.2 million |
| | ● | LOM site operating cost of $194.70/ton milled |
Hecla Mining Company | Greens Creek Mine, SLR Project No: 101.00632.00020
Technical Report Summary - February 21, 2022
| | ● | LOM closure/reclamation $92.8 million, including $87.3 million for final reclamation in the year after final production |
1.2.1.4 | Taxation and Royalties |
Mining companies conducting business in Alaska are primarily subject to U.S. corporate income tax, Alaska State income tax, and Alaska Mining License tax. The State of Alaska levies a mining license tax on mining net income received in connection with mining properties and activities in Alaska, at a rate of $4,000 plus 7% over $100,000. The U.S. corporate income tax rate is 21% and the Alaska state income tax rate is 9.4%.
No income tax payable is anticipated to be payable over the LOM. Hecla plans to use a combination of existing and forecasted depreciation expenses, allocation of expenses from other entities within the consolidate tax group, percentage depletion allowances, and existing net operating losses to generate zero annual taxable income over the LOM. The mine will, however, still incur $35 million in Alaskan mining taxes over the LOM.
The Property is subject to an 2.5% NSR royalty to a third party (Bristol Royalty) over approximately 11.2% of production.
SLR has reviewed Hecla’s Greens Creek Reserves only model and has prepared its own unlevered after-tax LOM cash flow model based on the information contained in this TRS to confirm the physical and economic parameters of the mine.
The Greens Creek economics have been evaluated using the discounted cash flow method by considering annual processed tonnages and ore grade. The associated process recovery, metal prices, operating costs, refining and transportation charges, and sustaining capital expenditures were also considered.
The indicative economic analysis results, presented in Table 1‑2 with no allowance for inflation, present a pre-tax and after-tax NPV, using a 5% discount rate, of $772 million and $747 million, respectively. The SLR QP is of the opinion that a 5% discount/hurdle rate for after-tax cash flow discounting of long lived precious/base metal operations in a politically stable region is reasonable, appropriate, and commonly used. For this cash flow analysis, the internal rate of return (IRR) and payback period are not applicable as there is no negative initial cash flow (no initial investment to be recovered) as Greens Creek has been in operation for a number of years.
Hecla Mining Company | Greens Creek Mine, SLR Project No: 101.00632.00020
Technical Report Summary - February 21, 2022
Table 1‑2: Life of Mine Indicative Economic Results
Hecla Mining Company – Greens Creek Mine
Description | Value |
Realized Market Prices |
Au (US$/oz) | $1,650 |
Ag (US$/oz) | $21.00 |
Pb (US$/lb) | $0.95 |
Zn (US$/lb) | $1.25 |
Payable Metal |
Au (Moz) | 0.58 |
Ag (Moz) | 86 |
Pb (Mlb) | 338 |
Zn (Mlb) | 865 |
Total Gross Revenue | 4,156 |
Mine Cost | (1,035) |
Mill Cost | (402) |
Surface Operations Cost | (298) |
Environmental Cost | (44) |
G & A Cost | (376) |
Concentrate Freight Cost | (115) |
Offsite Costs | (429) |
Bristol Royalty | (10) |
Total Operating Costs | (2,709) |
Operating Margin (EBITDA) | 1,447 |
Tax Payable | (35) |
Operating Cash Flow | 1,412 |
Capital Expenditures | (294) |
Closure/Reclamation Costs | (93) |
Total Capital | (387) |
Pre-tax Free Cash Flow | 1,060 |
Pre-tax NPV at 5% | 772 |
After-tax Free Cash Flow | 1,025 |
After-tax NPV at 5% | 747 |
Hecla Mining Company | Greens Creek Mine, SLR Project No: 101.00632.00020
Technical Report Summary - February 21, 2022
1.2.3 | Sensitivity Analysis |
The Greens Creek after-tax cumulative cash flow discounted at five percent (NPV5) was analyzed for sensitivity to variations in revenue and operating and capital cost assumptions. The results of the sensitivity analysis demonstrate that the Mineral Reserve estimates are most sensitive to variations in metals prices, less sensitive to changes in metals grades and recoveries, and least sensitive to fluctuations in operating and capital costs.
1.3.1 | Property Description |
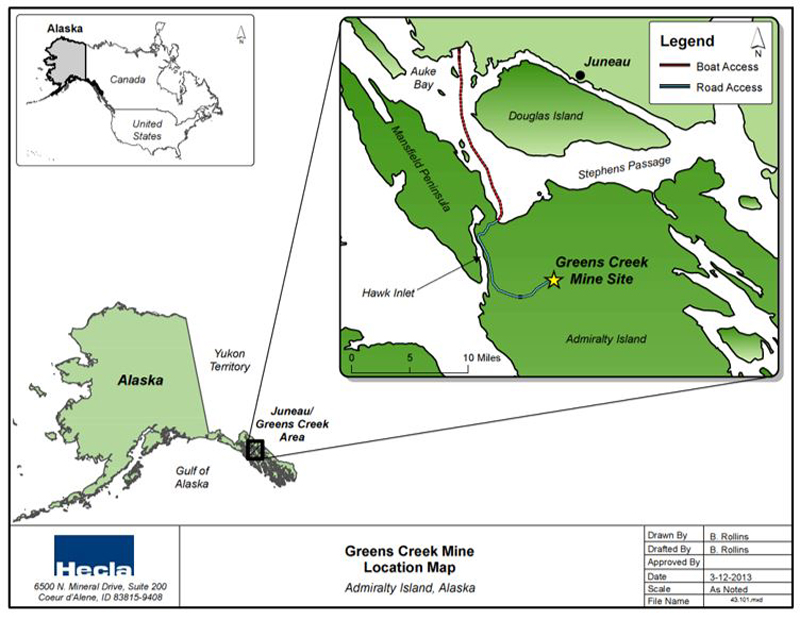
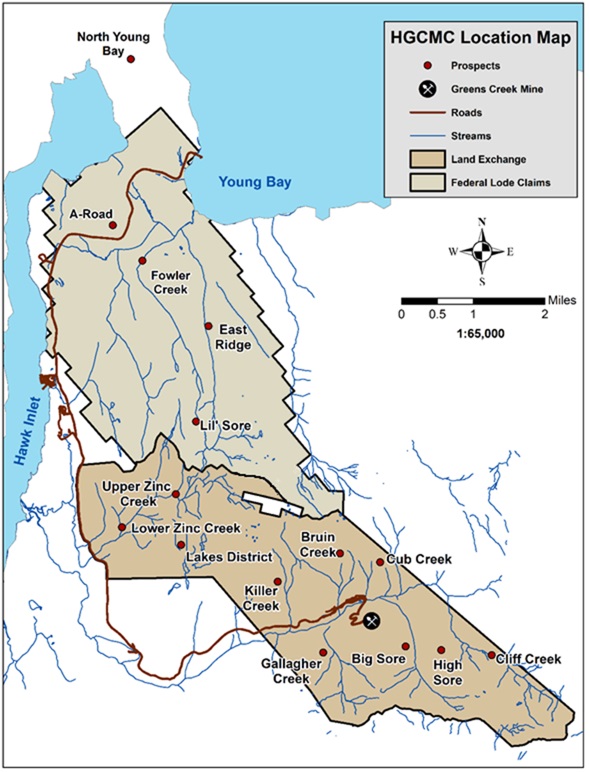
Greens Creek is located on Admiralty Island, approximately 18 miles (29 km) to the southwest of Juneau, Alaska. The Property is 100% owned and operated by Hecla subsidiaries. The total land package encompasses 16,140 acres (ac) (6,530 hectares (ha)). The Property includes mineral tenures that are administered under either Alaskan State law, or under Federal permits.
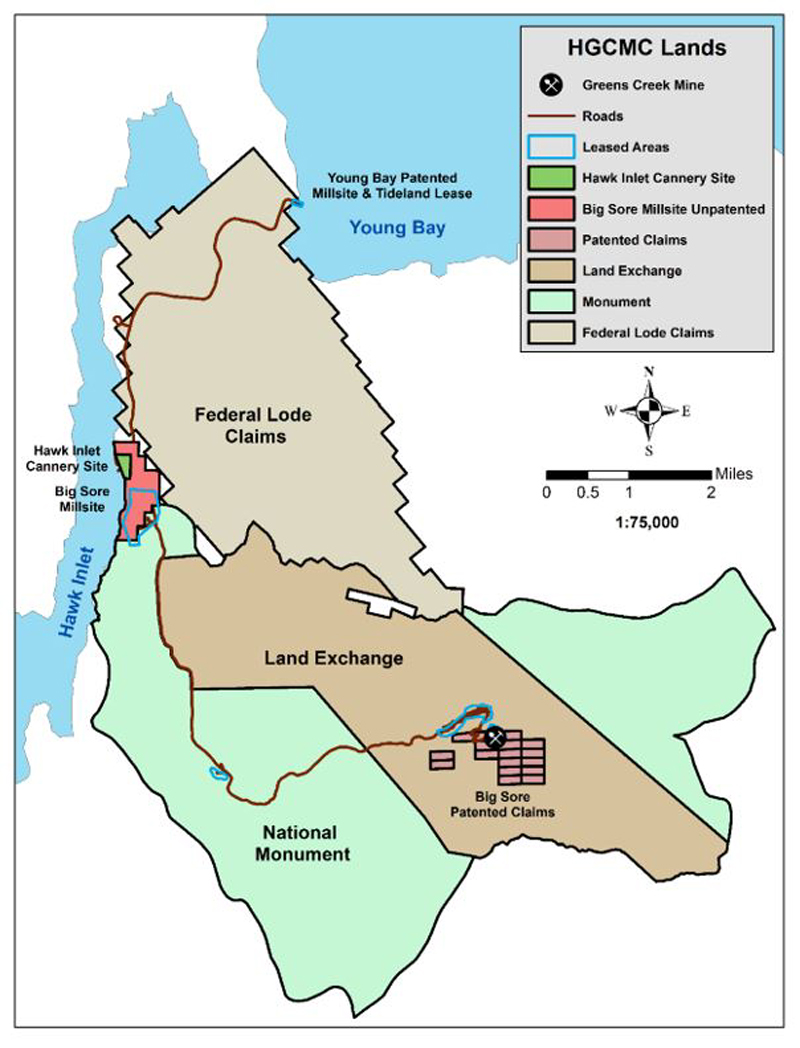
The Property includes 440 unpatented lode mining claims, 58 unpatented mill site claims, 17 patented lode claims, one patented mill site and other fee lands, notably the Hawk Inlet historic cannery site. Hecla also holds title to mineral rights on 7,301 ac (2,955 ha) of Federal land acquired through a land exchange with the United States Forest Service (USFS).
Bristol Resources, Inc. holds a 2.5% NSR royalty based on 11.2142% of the Greens Creek Joint Venture. This royalty is the sole responsibility of the Hecla Juneau Mining Company ownership interest (12.5164%).
Under the land exchange, production from news discoveries on the exchanged lands will be subject to Federal royalties included in the Land Exchange Agreement. The royalty is only due on production from Mineral Reserves that are not part of Greens Creek’s extralateral rights. Thus far, there has been no production, and no payments of the royalty have been triggered.
Per the Greens Creek Land Exchange Act of 1995, (Public Law 104-123), properties in the land exchange are subject to a royalty payable to the USFS that is calculated on the basis of net island receipts (NIR). NIR are equal to revenues from metals extracted from the land exchange properties less transportation and treatment charges (e.g., smelting, refining, penalties, assaying) incurred after loading at Admiralty Island.
The NIR royalty is 3% if the average value of the Mineral Reserve mined during a year is greater than $120/ton ($132/t) of ore, and 0.75% if the value is $120/ton ($132/t) or less. The benchmark of $120/ton ($132/t) was adjusted annually according to the US Gross Domestic Product (GDP) Implicit Price Deflator until the year 2016, after which time it became a fixed rate of $161/ton.
Mineralization was discovered at the Big Sore copper sub-crop in 1974. Mining operations commenced in 1989 but ceased in 1993 due to low metal prices. In 1996, the mine was re-opened, and production has continued uninterrupted to date. Greens Creek has had a number of various holders to the mineral interests in the Property that have carried out various exploration, drilling, and development programs over time. Hecla obtained a 100% interest in the Project in 2008 and has continually operated the mine since then.
Hecla Mining Company | Greens Creek Mine, SLR Project No: 101.00632.00020
Technical Report Summary - February 21, 2022
1.3.4 | Geological Setting, Mineralization, and Deposit |
The Greens Creek sulfide mineralization is localized on the Mississippian/Late Triassic contact marked by the Hyd basal conglomerate. This erosional unconformity is referred to as the “mine contact” by the mine geologists Though mineralization and significant alteration extend into the footwall mafic rocks and though some lenses of mineralization occur in the overlying argillites, the bulk of mineable material is located immediate to the mine contact.
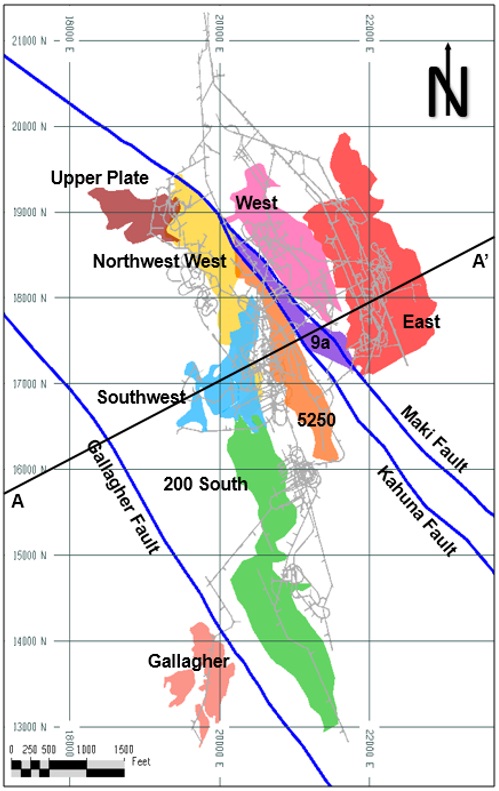
The mine contact is variably mineralized over the claim block and nearly continuously mineralized in the mine area. Three main trends of mineralization have been traced along the mine contact with multiple centers of mineralization along those trends.
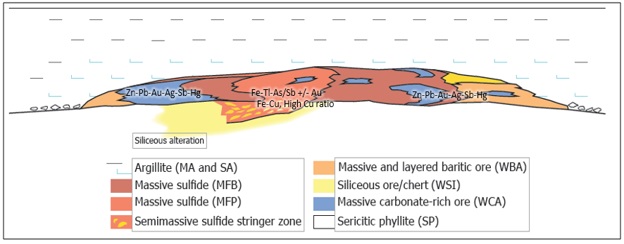
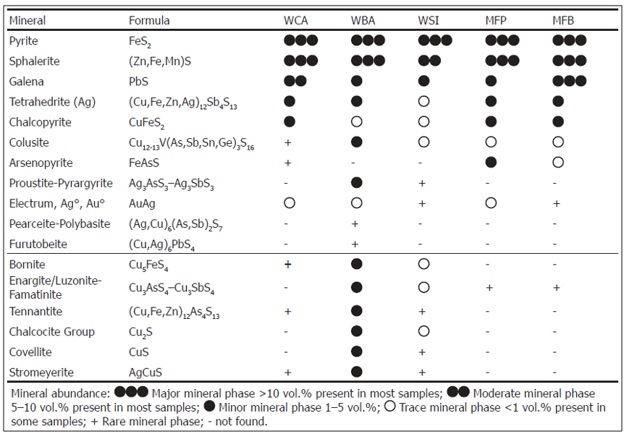
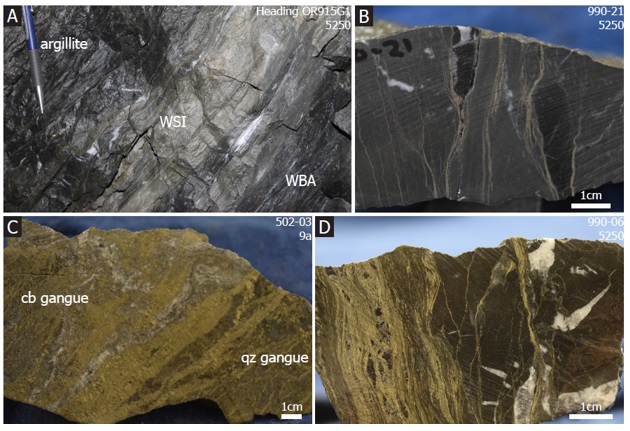
In general, the mineralized bodies are zoned over a silica flooded, pyrite-rich footwall phyllite (SPs). Semi-massive stringer mineralization is often present in the footwall below significant massive sulfide centers. The central mineralization immediately above the stringers is rich in copper, iron, arsenic, and gold and called massive pyritic ore lithology (MFP) due to the high pyrite content. Grading immediately outward from the MFP zones are the base metal (Zn-Pb) and silver rich mineral zones (MFB). Massive carbonate-rich material (WCA) is present within the MFB and towards the MFB’s outer margins. More distal mineralization is characterized by quartz and barite-rich white mineral styles, WSI and WBA, respectively. While minable grades exist within all the mineral types, the MFB, MFP, and WBA types typically have the highest overall grades. Base metals typically are lower in the white mineral type though some baritic material can have high sphalerite contents. Baritic material (WBA) is observed to be particularly silver rich while the white siliceous mineral style (WSI) is typically of the lowest grade.
Ore minerals are dominantly comprised of sphalerite, galena, tetrahedrite, electrum, and proustite-pyrargyrite. A weak, epigenetic, high sulfidation event overprinted portions of the mineral deposit producing bornite, covellite, chalcocite and stromeyerite.
Exploration commenced on the Property in 1973 and continued through to Hecla’s acquisition of a 100% ownership in the land package in 2008. Since 2008, Hecla has completed a number of surface and underground core drilling programs, auger and mobile metal-ion (MMI) soil geochemistry, ground and borehole pulse electromagnetic (EM) geophysical surveys, and compilation of historic geophysical survey information. Reconnaissance-scale and detail-scale geologic mapping have been completed by Dr. Norm Duke, Dr. John Proffett, and various Hecla geologists.
A total of 8,202 drill holes totaling to 4,024,918 ft (1,226,795 m) have been completed over the entire Project area from 1975 to 2020. Of these drill holes, 412 drill holes totaling 508,454 ft (154,977 m) are surface-based holes drilled for exploration or Mineral Resource development purposes. Underground exploration or Mineral Resource definition drill holes total 5,462 for 2,996,378 ft (913,296 m) and are typically drilled on 50 ft to 200 ft (15 m to 60 m) spaced vertical sections. The remaining 2,328 drill holes, totaling 520,088 ft (158,523 m), are underground pre-production drill holes that are drilled on cross-sections and plan-views spaced from 20 ft to 50 ft (15m to 60 m).
Hecla Mining Company | Greens Creek Mine, SLR Project No: 101.00632.00020
Technical Report Summary - February 21, 2022
1.3.6 | Mineral Resource Estimates |
Mineral Resource estimates have been prepared for each of the nine deposits found on the Property. The Mineral Resource estimation workflow adopts a NSR strategy in which the key payable metals are gold, silver, lead, and zinc. Each of these four metals contribute to the overall value of the material in approximately equal amounts.
A two-stage approach is undertaken when preparing the mineralization wireframe outlines for the nine deposits. The wireframing process begins with the creation of wireframe outlines using a modelling threshold of $50 NSR/ton so as to outline continuous volumes of mineralized material. A second set of mineralization wireframes are created using a threshold value of $140 NSR/ton that outline the higher grade portions of the mineralization. Grades are estimated using the ordinary kriging (OK) interpolation method for gold, silver, lead, and zinc using information from capped, composited drill hole data. Grades are also estimated for non-payable metals and elements such as barium, calcium, and iron. No capping values are applied to non-payable metals.
Density values are calculated using a formula that considers the estimated barium, calcium, iron, lead, and zinc grades for each block. Mineral Resources have been classified in accordance with the S-K 1300 definitions for Mineral Resources. Classification criteria are set after considering the continuity of the grades of silver and zinc from available drill hole sample information.
Mineral Resource statements are prepared exclusive of Mineral Reserves using block models that have been depleted for mining activities as of December 31, 2021. The Mineral Resource estimates were prepared by Hecla and reviewed and accepted by SLR. Mineral Resources are stated using a threshold value of $215 NSR/ton for all zones except for the Gallagher deposit, where a threshold value of $220 NSR/ton is applied. The Greens Creek Mineral Resource estimate as of December 31, 2021 is presented in Table 1‑3.
Table 1‑3: Summary of Mineral Resources – December 31, 2021
Hecla Mining Company – Greens Creek Mine
Category | Tonnage
(000 ton) | Grade | Contained Metal |
| | | (oz/ton Au) | (oz/ton Ag) | (% Pb) | (% Zn) | (oz Au) | (oz Ag) | (ton Pb) | (ton Zn) |
Measured | - | - | - | - | - | - | - | - | - |
Indicated | 8,355 | 0.10 | 12.8 | 3.0 | 8.4 | 835,900 | 106,670,300 | 250,040 | 701,520 |
Measured + Indicated | 8,355 | 0.10 | 12.8 | 3.0 | 8.4 | 835,900 | 106,670,300 | 250,040 | 701,520 |
Inferred | 2,152 | 0.08 | 12.8 | 2.8 | 6.8 | 163,700 | 27,507,500 | 60,140 | 146,020 |
Notes:
| | 1. | Classification of Mineral Resources is in accordance with the S-K 1300 classification system. |
| | 2. | Mineral Resources were estimated by Hecla staff and reviewed and accepted by SLR. |
| | 3. | Mineral Resources are exclusive of Mineral Reserves and do not have demonstrated economic viability. |
| | 4. | Mineral Resources are 100% attributable to Hecla. |
| | 5. | Mineral Resource block models are prepared from drilling and sample data current as of October 31, 2021; all Mineral Resources have been depleted for mining as of December 31, 2021. |
| | 6. | Mineral Resources are based on the following metal prices and cut-off assumptions: $1,700/oz Au, $21/oz Ag, $1.15/lb Pb, $1.35/lb Zn, NSR cut-off of $215 NSR/ton for all zones except the Gallagher Zone, which used a $220 NSR/ton cut-off. |
| | 7. | The reasonable prospects for economic extraction requirement for Mineral Resources is satisfied by application of criteria that consider the spatial continuity of blocks above the nominated cut-off value as well as the practical aspects of extraction by means of underground mining methods. |
| | 8. | Totals may not agree due to rounding. |
The SLR QP is of the opinion that with consideration of the recommendations summarized in Sections 1 and 23 of this TRS, any issues relating to all relevant technical and economic factors likely to influence the prospect of economic extraction can be resolved with further work.
Hecla Mining Company | Greens Creek Mine, SLR Project No: 101.00632.00020
Technical Report Summary - February 21, 2022
1.3.7 | Mineral Reserve Estimates |
Mineral Reserve estimates, as prepared by Hecla and reviewed and accepted by SLR, have been classified in accordance with the definitions for Mineral Reserves in S-K 1300. As shown in Table 1‑4, Mineral Reserves as of December 31, 2021 total 11.08 Mst grading 11.3 oz/ton Ag, 0.085 oz/ton Au, 2.6% Pb, and 6.5% Zn and containing 125.2 Moz Ag, 0.946 Moz Au, 282,000 tons Pb and 726,000 tons Zn at an NSR cut-off value of US$215/ton.
Table 1‑4: Summary of Mineral Reserves – December 31, 2021
Hecla Mining Company – Greens Creek Mine
Category | Tonnage
(000 ton) | Grade | Contained Metal |
| | | Ag
(oz/ton) | Au
(oz/ton) | Pb (%) | Zn (%) | Ag
(000 oz) | Au
(000 oz) | Pb
(000 tons) | Zn
(000 tons) |
Proven | 2 | 9.60 | 0.075 | 1.66 | 4.54 | 0 | 0.1 | 0.0 | 0.1 |
Probable | 11,074 | 11.31 | 0.085 | 2.55 | 6.55 | 125,219 | 945.6 | 282.2 | 725.8 |
Total Proven + Probable | 11,076 | 11.31 | 0.085 | 2.55 | 6.55 | 125,219 | 945.7 | 282.3 | 725.9 |
Notes:
| | 1. | Classification of Mineral Reserves is in accordance with the S-K 1300 classification system. |
| | 2. | Mineral Reserves were estimated by Hecla and reviewed and accepted by SLR. |
| | 3. | Mineral Reserves are 100% attributable to Hecla |
| | 4. | Mineral Reserves are estimated at a NSR cut-off of $215 NSR/ton for all zones except the Gallagher Zone, which used a $220 NSR/ton cut-off $215 NSR/ton. |
| | 5. | Mineral Reserves are estimated using an average long term price of $1,600/oz Au, $17.00/oz Ag, $0.90/lb Pb, and $1.15/lb Zn. |
| | 6. | A minimum mining width of 4.6 m (15 ft) was used. |
| | 7. | A density of 0.075 t/ft3 was used for waste material. |
| | 8. | Totals may not add due to rounding. |
The SLR QP is not aware of any risk factors associated with, or changes to, any aspects of the modifying factors such as mining, metallurgical, infrastructure, permitting, or other relevant factors that could materially affect the Mineral Reserve estimate.
Current practice at Greens Creek is to classify all in situ underground Reserves as Probable Mineral Reserves. The only material included in the “Proven” Mineral Reserve category is the relatively small amount of ore tonnage present in the surface stockpile. Inferred Mineral Resources were not converted to Mineral Reserves and are not included in the LOM plan.
The Mineral Reserves are estimated for nine different zones each constituting between 3% and 27% of total Mineral Reserve tons. The four most significant zones in terms of Mineral Reserves are 200S (27% of total tons, 29% of total Ag ounces), South-West (16% of total tons, 15% of total Ag ounces), West (14% of total tons, 13% of total Ag ounces), and East (13% of total tons, 13% of silver ounces). Grade varies across the nine zones with the highest grade zones approximately twice the grade of the lowest grade zones for each of the four metals.
Hecla Mining Company | Greens Creek Mine, SLR Project No: 101.00632.00020
Technical Report Summary - February 21, 2022
Greens Creek is a portal accessed mine that utilizes conventional rubber-tired mining equipment, and drill and blast techniques. Production mining is primarily executed using cut and fill and drift and fill methods, supplemented by longhole stoping where orebody geometry permits.
The orebody is complex which has resulted in each of the nine mining zones being unique in size and shape. Each requires differing levels of mine development infrastructure which is included in the mine plan. Ore handling is performed with a fleet of underground haulage trucks and scooptrams or load-haul-dump units (LHDs). Waste is either trucked out of the mine to the waste disposal area or is placed in previously mined-out stopes when available. All LHDs are equipped with remote operating capability and can be operated from an operations room on surface. Production areas are backfilled with either paste fill, created from concentrator tailings, or cemented or uncemented rock depending on future strength requirements.
Fresh air is fed into the mine via the 920 level access portal and distributed through a series of internal ramps and raises, and exhausts through the 1350 level portal and the 2853 surface raise. A ventilation on demand (VOD) system is currently in place in a limited number of headings and is planned to be extended to the remainder of the mine.
The LOM plan is based on a 2,300 stpd production rate continuing through to the end of mine life in 2035. Ore grades remain relatively stable through the mine life with silver grade ranging from a 10.6 oz/ton Ag to 11.9 oz/ton Ag.
1.3.9 | Processing and Recovery Methods |
Greens Creek mineralization is a typical example of a polymetallic mineral deposit. The metals that contribute to revenue are silver, lead, zinc, and gold. Copper, while present in the Greens Creek deposits, is not recovered as a marketable product. Hecla has elected to apply a conventional NSR approach for use in discriminating between ore and waste material but has applied a slight modification to this approach by including the price of each of the individual metals as a discrete input variable, as compared to including the price of the metal within the NSR factor.
Metallurgical testing programs are continually conducted to evaluate possible changes in feed types from new mining areas, proposed changes in processing to improve recoveries and/or concentrate grades and to investigate factors causing lower than desired recoveries and concentrate grades. Industry standard studies were performed as part of process development and initial Greens Creek mill design. Subsequent production experience and focused investigations, as well as marketing requirements, have guided mill expansions and process changes. The ‘filter cake balance’, based on the assays and weights of final mill products, is the official production balance and is the most accurate in the long term. There is good long term assay agreement between measured mill feed at the flotation feed sampler and the plant feed calculated from filter cake assays, wet filter cake production tonnages from the filter press load cells and the moisture contents of filter cake samples. Full-stream samplers are installed to sample flotation circuit products at the feed to each of the four thickeners. These assays are used, together with the SAG mill feed dry tonnage and the thickener feed mass flow loop measurements, as initial estimates in mass-balancing.
Greens Creek metallurgists annually update a concentrator recovery model to estimate the metallurgical distribution of mill products as a function of ore feed grades and concentrate product quality constraints. The model is developed through extensive process simulation work and monitoring of actual plant performance over the prior 16 month period.
Hecla Mining Company | Greens Creek Mine, SLR Project No: 101.00632.00020
Technical Report Summary - February 21, 2022
The plant produces three saleable flotation concentrates and a gravity concentrate. Concentrates are separately hauled and stored to a storage–loadout facility at Hawk Inlet, which is approximately eight miles (10 km) from the mine. At the Hawk Inlet facility concentrates are stored indoors in piles until being loaded periodically into ocean-going ships for transport to a variety of smelters. The Greens Creek LOM plan for the plant assumes similar throughputs, recoveries, and concentrate grades to those achieved in recent years, based on projected mill feed grades provided by geology and mine staff for the LOM.
The plant is a conventional SAG mill-ball mill grinding, gravity and flotation concentrator producing the following concentrates.
| | ● | Carbon is removed from the circuit using column flotation prior to base metal flotation producing a carbon concentrate that is discarded to tailings. |
| | ● | A gravity circuit comprising spiral concentrators treats a bleed stream from the grinding circuit cyclone underflow to produce a gravity concentrate containing precious metals that is further processed off site. |
| | ● | Silver concentrate is produced in a rougher-cleaner flotation circuit including re-grinding of the cleaner circuit feed. The silver-lead concentrate is relatively low grade, at approximately 35% Pb, but carries a large proportion of the silver in mill feed. |
| | ● | Zinc concentrate is produced in a rougher-cleaner flotation circuit including re-grinding, using lead rougher tailings as feed. The zinc concentrate typically contains 46% Zn to 50% Zn, which is a normal grade, and considerably less silver than the silver concentrate. |
| | ● | PM concentrate is produced in a complex circuit treating cleaner tailings from both the lead and zinc circuits. It is a relatively low grade zinc concentrate, at 30% Zn, with a smaller amount of lead and some silver. PM concentrate has a relatively limited market so PM and zinc concentrates production is preferred over that of PM. |
Mined ore is delivered to the plant stockpile near the portal by underground haulage trucks. Ore is stockpiled on a coarse ore pad with two active stockpiles. One stockpile is constructed by back dumping run of mine ore on a ramp and dozing to produce even layers, while the other stockpile is reclaimed by dozing slots down through the steep face of the ramp into day piles with a Caterpillar D8 dozer. Stockpiles range in volume from two to ten day’s capacity (4,000 tons to 20,000 tons).
The unit operations in the concentrator include:
| | ● | Stockpiling and blending of underground ore |
| | ● | Primary SAG mill grinding |
| | ● | Hydrocyclone classification |
| | ● | Spiral concentration for gravity recovery of precious metals from cyclone underflow |
| | ● | Column flotation of graphitic carbon and carbonaceous materials |
| | ● | Lead rougher flotation column – concentrate to final concentrate thickener |
| | ● | Lead rougher flotation in conventional cells |
| | o | Lead rougher concentrate regrinding in a tower mill |
Hecla Mining Company | Greens Creek Mine, SLR Project No: 101.00632.00020
Technical Report Summary - February 21, 2022
| | o | Lead unit flotation cell in regrind mill cyclone underflow – concentrate to final silver concentrate thickener |
| | o | Lead rougher concentrate cleaning in three stages |
| | o | Lead cleaner concentrate to silver concentrate thickening and filtration |
| | ● | Lead PM rougher flotation of lead cleaner tailings |
| | o | Lead PM cleaner flotation with concentrate to lead regrinding |
| | ● | PM conditioning of lead PM rougher tailings |
| | o | PM flotation in Woodgrove SFR cells |
| | o | Woodgrove concentrates to zinc regrinding |
| | o | Woodgrove tailings to PM flotation column |
| | o | PM column flotation followed by three stages of conventional rougher cells |
| | o | PM concentrate thickening and filtration |
| | ● | Zinc rougher flotation of lead rougher tailings |
| | o | Zinc rougher concentrate regrinding in a tower mill |
| | o | Zinc unit flotation cell in regrind mill cyclone underflow – concentrate to final zinc concentrate thickener |
| | o | Zinc concentrate cleaning in three stages or two stage cleaning plus scavenger |
| | o | Zinc cleaner concentrate to concentrate thickening and filtration |
| | o | Zinc cleaner tailings to zinc tank cell |
| | o | Zinc tank cell concentrate to zinc regrinding |
| | o | Zinc tank cell tailing combined in PM flotation column |
| | ● | Tailings thickening and filtration, carbon column concentrate, zinc rougher tailings and PM rougher tailings |
The plant is highly instrumented, with operators accessing information directly from local instrument readouts, Allen Bradley Panelview programmable logic controller (PLC) terminals in the control room, or from the supervisory control and data acquisition (SCADA) system. Monitoring of trends in measured variables, setpoints, and control outputs takes place in the SCADA system. The process control scope is generally restricted to automatic control around manual setpoints, although substantial PLC programming has allowed the development of some integrated SAG mill, thickener, pressure filter, and mill water balance control integration.
Hecla Mining Company | Greens Creek Mine, SLR Project No: 101.00632.00020
Technical Report Summary - February 21, 2022
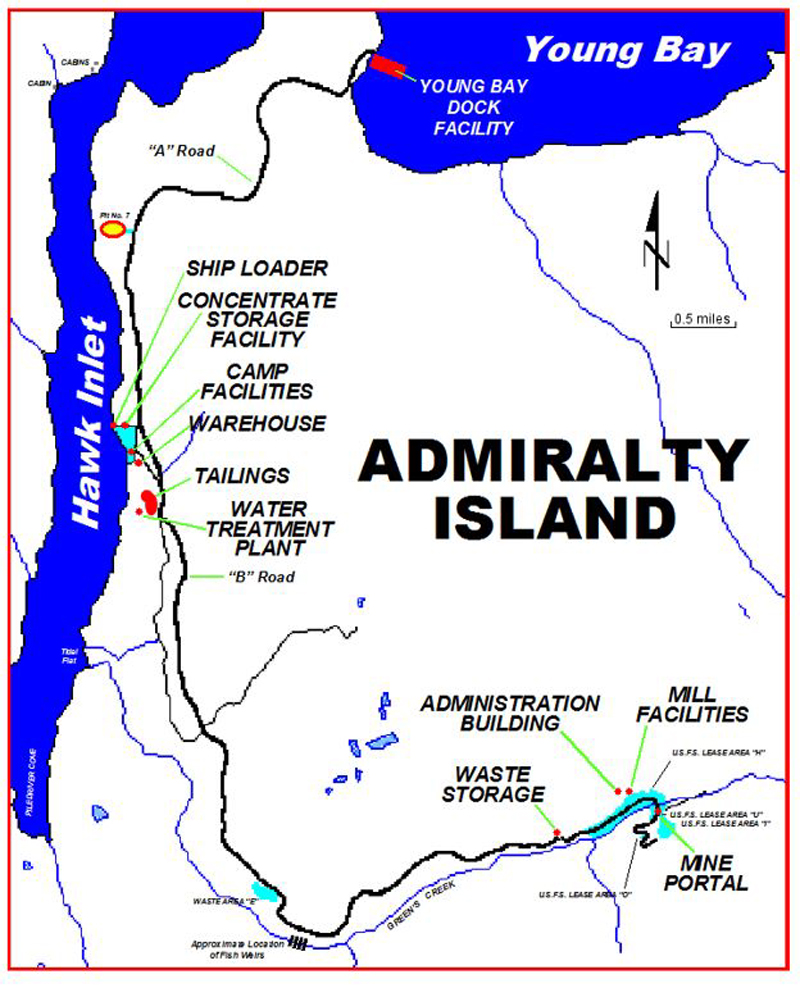
The Greens Creek mining operation includes a significant amount of existing infrastructure primarily at two locations: the 920/860 mine area and the Hawk Inlet camp, which are connected by an 8.5 mi long road. Key existing infrastructure includes the following:
| | o | Underground mine portals |
| | o | Administration and support buildings |
| | o | Mill building and associated processing facilities |
| | o | Mobile equipment repair shop |
| | o | Water collection and treatment facilities |
| | o | Development waste rock storage (“Site 23”) |
| | o | Personnel housing and dining buildings |
| | o | Concentrate storage and shipping facilities |
| | o | Materials receiving dock and warehouse |
| | o | Water collection and treatment facilities (Pond 7/10 Dam System) |
| | o | Fully-permitted discharge facilities for treated water (APDES 002) |
| | o | High voltage electrical intertie to the Juneau power grid via undersea cable |
| | o | Young Bay crew ferry terminal |
| | o | Over 13.5 mi of mine roads |
The current dry stack TDF has sufficient capacity to accommodate tailings to the end of the current mine life in 2030. Early-stage engineering studies are underway to determine modifications to the plan of operations in order to accommodate additional material beyond the current Greens Creek Mineral Reserve life.
The mine has now been operational for a 30 year period, and continuously operational for the last 23 years, and has current contracts in place for silver, zinc, and precious metals flotation concentrate sales, doré refining, concentrate transportation, metals hedging, and other goods and services required to operate an underground mine.
Hecla Mining Company | Greens Creek Mine, SLR Project No: 101.00632.00020
Technical Report Summary - February 21, 2022
1.3.12 | Environmental Studies, Permitting and Plans, Negotiations, or Agreements with Local Individuals or Groups |
Greens Creek has obtained the requisite construction and operating permits needed to operate the existing operations. In addition, they have begun permitting for expansion of the dry stack tailings to account for additional tailings storage to accommodate current long range reserves. Environmental monitoring during operations includes surface water, groundwater, air quality, meteorology, aquatics, and biological resources for regulatory compliance. These activities will continue after closure to assess reclamation success and release of financial assurance (bonding). Reclamation and closure plans have been submitted to the appropriate agencies and are updated regularly. ARO legal obligations are updated regularly and based upon existing site conditions, current laws, regulations, and costs to perform the permitted activities. The ARO is to be conducted in accordance with Financial Accounting Standards Board (FASB) Accounting Standards Codification (ASC) 410.
1.3.13 | Capital and Operating Cost Estimates |
Greens Creek has been in operation for decades hence there are no preproduction capital costs to consider. Capital costs over the LOM total $294.2 million and are summarized in Table 1‑5.
Table 1‑5: Capital Cost Summary
Hecla Mining Company – Greens Creek Mine
Item | Cost
(US$ 000) |
Capitalized Mine Development | 100,929 |
Capitalized Definition Drilling | 36,411 |
Other Capital Expenditures | 173,430 |
Capital Lease Financing | (16,553) |
Total | 294,216 |
Note:
| | 1. | Totals may not agree due to rounding. |
Operating costs over the LOM total $194.70/t milled and are summarized in Table 1‑6.
Table 1‑6: Operating Cost Summary
Hecla Mining Company – Greens Creek Mine
Item | Cost
(US$ 000) | Unit Cost
($/t milled) |
Mine | 1,035,118 | 93.47 |
Mill | 402,327 | 36.33 |
Surface Operations | 297,838 | 26.90 |
Environmental | 44,297 | 4.00 |
Administration | 376,456 | 34.00 |
Total | 2,156,037 | 194.70 |
Note:
| | 1. | Totals may not agree due to rounding. |
Hecla’s forecasted capital and operating costs estimates are derived from annual budgets and historical actuals over the long life of the current operation. According to the American Association of Cost Engineers (AACE) International, these estimates would be classified as Class 1 with an accuracy range of ‑3% to -10% to +3% to +15%.
Hecla Mining Company | Greens Creek Mine, SLR Project No: 101.00632.00020
Technical Report Summary - February 21, 2022
SLR International Corporation (SLR) was retained by Hecla Mining Company (Hecla) to prepare an independent Technical Report Summary (TRS) for the Greens Creek Mine (Greens Creek or the Property), located in southeastern Alaska, USA The purpose of this TRS is to support the disclosure of the Greens Creek Mineral Resource and Mineral Reserve estimates as of December 31, 2021. This TRS conforms to the United States Securities and Exchange Commission’s (SEC) Modernized Property Disclosure Requirements for Mining Registrants as described in Subpart 229.1300 of Regulation S-K, Disclosure by Registrants Engaged in Mining Operations (S-K 1300) and Item 601 (b)(96) Technical Report Summary.
Hecla was established in 1891 and has its headquarters in Coeur d’Alene, Idaho, USA. Hecla owns and operates 100% of the Property via ownership through several Hecla corporate entities. Hecla is listed on the New York Stock Exchange (NYSE) and currently reports Mineral Reserves of lead, zinc, silver, and gold in SEC filings.
The Property includes the Greens Creek mine and a processing plant (or mill). The mine primarily produces silver, with accompanying zinc, gold, and lead extracted from sediment and volcanic hosted, stratiform massive sulfide deposits using underground mining methods. The plant is a conventional gravity and flotation plant that produces a gravity gold concentrate, a silver concentrate, a zinc concentrate, and a precious metal concentrate consisting of precious and base metals.
Greens Creek commenced operations in 1989 with Rio Tinto Zinc as the operator. In 2008, Hecla acquired Kennecott Minerals’ (Kennecott) interest and became the sole owner of the Property. Except for a three year hiatus between 1993 to 1996, the mine has been in continuous operation since 1989 and as of December 31, 2020 the mine has produced a total of approximately 1.95 million tons (Mst) Zn, approximately 0.76 tons Pb, approximately 322 million ounces (Moz) Ag, and approximately 2.66 Moz Au in the plant feed.
For 2021, mine production occurred at a rate of approximately 2,100 tons per day (stpd) to 2,300 stpd using cut and fill and longhole stoping as the primary mining methods. Greens Creek has produced 9.2 Moz Ag in 2021.
SLR most recently visited the site on September 21 and September 22, 2021. During the most recent site visit, the SLR QPs received a project overview by site management followed by a visit to the mine stockpile area and a tour of the plant, control room, and on site metallurgical laboratory facilities (the Greens Creek Laboratory).
The SLR geology QP visited the core shack where examples of the mineralization were examined, the logging and sampling procedures were reviewed, and visits carried out to the sample sawing and density measurement facilities. Visits were also made to several locations in the underground mine where the style and structural complexity of the host rocks, alteration signatures, and sulfide mineralization were observed. Discussions were carried out regarding the grade control and sampling procedures. A visit had been made previously during Roscoe Postle Associates Inc.’s (RPA), which is now part of SLR, 2017 site visit to the Greens Creek Laboratory and associated sample preparation facility.
The SLR mining QP visited production, development, exploration drilling, and critical infrastructure areas in the underground mine. Both cut and fill and longhole stoping production areas were visited where discussions were carried out on the mining cycle, productivities, dilution, and recovery. The SLR mining QP visited the concentrator including the communication, flotation, ore loadout, and water handling facilities. The SLR mining QP discussed mining methods, mine economics, planning and scheduling activities, ventilation, and geotechnical procedures with relevant subject matter experts.
Hecla Mining Company | Greens Creek Mine, SLR Project No: 101.00632.00020
Technical Report Summary - February 21, 2022
The SLR processing QP toured the plant and maintenance areas in Area 920 with the Manager of Mill Operations and toured the underground mine with the geologists on the first day. The plant flowsheet and process control systems were reviewed, including the ore blending, grinding, gravity separation, flotation, concentrate and tailings filtration and storage, water treatment, control room, reagent area, and Greens Creek Laboratory. The second day was spent at Hawk Inlet reviewing tailings management, and infrastructure including the camp, concentrate storage and ship loading systems, fuel storage, emergency power, and potable water systems, followed by a tour of the dry stacked tailings disposal facility (TDF) area, water treatment plant, and ponds.
The SLR environmental, social, and governance QP interviewed Hecla environmental and applicable staff manager(s) regarding the Greens Creek environmental/social management system(s), permitting and compliance program, reclamation and closure plan, and associated budget(s).
2.2 | Sources of Information |
During the preparation of this TRS, discussions were held with the following Hecla personnel:
| | ● | Mr. Keith Blair, Chief Geologist, Hecla |
| | ● | Mr. Robert Davidson, Chief Geologist, Hecla Greens Creek |
| | ● | Mr. Joshua Pritts, Resource Geologist, Hecla Greens Creek |
| | ● | Mr. Jacob Miller, Senior Production Geologist, Hecla Greens Creek |
| | ● | Mr. Martin Stearns, Environmental/Surface Operations Manager, Hecla Greens Creek |
| | ● | Mr. Ben Beard, Senior Mine Engineer, Hecla Greens Creek |
| | ● | Mr. Sam Wiley, Senior Mine Engineer, Hecla Greens creek |
| | ● | Mr. Tim Brueggeman, Chief Mine Engineer, Hecla Greens Creek |
| | ● | Mr. Russell Lawlar, Chief Financial Officer, Hecla |
No previous Technical Report Summaries have been filed regarding the Property.
This TRS was prepared by SLR QPs. The documentation reviewed, and other sources of information, are listed at the end of this TRS in Section 24.0, References.
Hecla Mining Company | Greens Creek Mine, SLR Project No: 101.00632.00020
Technical Report Summary - February 21, 2022
Units of measurement used in this TRS conform to the imperial system. All currency in this TRS is US dollars (US$) unless otherwise noted.
μ | micron | kVA | kilovolt-amperes |
μg | microgram | kW | kilowatt |
a | annum | kWh | kilowatt-hour |
A | ampere | L | litre |
bbl | barrels | lb | pound |
Btu | British thermal units | L/s | litres per second |
°C | degree Celsius | m | meter |
C$ | Canadian dollars | M | mega (million); molar |
cal | calorie | m2 | square meter |
cfm | cubic feet per minute | m3 | cubic meter |
cm | centimeter | MASL | meters above sea level |
cm2 | square centimeter | m3/h | cubic meters per hour |
d | day | mi | mile |
dia | diameter | min | minute |
dmt | dry metric tonne | mm | micrometer |
dwt | dead-weight ton | mm | millimeter |
°F | degree Fahrenheit | mph | miles per hour |
ft | foot | Mst | million short tons |
ft2 | square foot | MVA | megavolt-amperes |
ft3 | cubic foot | MW | megawatt |
ft/s | foot per second | MWh | megawatt-hour |
g | gram | oz | Troy ounce (31.1035 g) |
G | giga (billion) | oz/ton | ounce per short ton |
Gal | Imperial gallon | ppb | part per billion |
g/L | gram per litre | ppm | part per million |
Gpm | Imperial gallons per minute | psia | pound per square inch absolute |
g/t | gram per tonne | psig | pound per square inch gauge |
gr/ft3 | grain per cubic foot | RL | relative elevation |
gr/m3 | grain per cubic meter | s | second |
ha | hectare | ton | short ton |
hp | horsepower | stpa | short ton per annum |
hr | hour | stpd | short ton per day |
Hz | hertz | t | metric tonne |
in. | inch | tpa | metric tonne per annum |
in2 | square inch | tpd | metric tonne per day |
J | joule | US$ | United States dollar |
k | kilo (thousand) | Usg | United States gallon |
kcal | kilocalorie | USgpm | US gallon per minute |
kg | kilogram | V | volt |
km | kilometer | W | watt |
km2 | square kilometer | wmt | wet metric tonne |
km/h | kilometer per hour | wt% | weight percent |
kPa | kilopascal | yd3 | cubic yard |
| | | yr | year |
Hecla Mining Company | Greens Creek Mine, SLR Project No: 101.00632.00020
Technical Report Summary - February 21, 2022
Greens Creek is located on Admiralty Island, approximately 18 mi (29 km) to the southwest of Juneau, Alaska. The Property is 100% owned and operated by Hecla subsidiaries (refer to Section 3.2). The total land package encompasses 16,140 acres (ac) (6,530 ha). The Property location is displayed in Figure 3‑1. The Property layout is presented in Figure 3‑2.
The Property coordinates in UTM North American Datum of 1983 (NAD 83) Zone 8V are:
Hecla Mining Company | Greens Creek Mine, SLR Project No: 101.00632.00020
Technical Report Summary - February 21, 2022
Figure 3‑1: Project Location
Hecla Mining Company | Greens Creek Mine, SLR Project No: 101.00632.00020
Technical Report Summary - February 21, 2022
Figure 3‑2: Mine Layout Plan
Hecla Mining Company | Greens Creek Mine, SLR Project No: 101.00632.00020
Technical Report Summary - February 21, 2022
3.1 | Property and Title in Alaska |
Information included in the following subsections is summarized from Alaska Department of Natural Resources (ADNR) (2009), Alaska Division of Mining, Land and Water (2012), Bureau of Land Management (BLM) (2011a, 2011b, 2012), and the Alaska Department of Revenue (2012).
Mineral tenure can be held either under Alaskan State law, or under Federal permits.
3.1.1.1 | Federal Mineral Titles |
Alaska is one of the 19 US states where there are federally administered lands that allow for staking of mining claims.
There are three basic types of minerals on Federal lands:
| | ● | Locatable (subject to the General Mining Law of 1872, as amended) |
| | ● | Leasable (subject to the various Mineral Leasing Acts) |
| | ● | Saleable (subject to mineral materials disposed of under the Materials Act of 1947, as amended) |
The General Mining Law of May 10, 1872, as amended (30 U.S.C. §§ 22-54 and §§ 611-615) is the major Federal law governing locatable minerals. The General Mining Law allows for the enactment of State laws governing location and recording of mining claims and sites that are consistent with Federal law.
The BLM manages the surface of public lands and the United States Forest Service (USFS) manages the surface of National Forest System lands. The BLM is responsible for the subsurface on both public lands and National Forest System lands.
Mining claims may not be located on lands that have been:
| | ● | Designated by Congress as part of the National Wilderness Preservation System. |
| | ● | Designated as a wild portion of a Wild and Scenic River. |
| | ● | Withdrawn by Congress for study as a Wild and Scenic River. |
Areas also excluded from the location of mining claims include National Parks, National Monuments, Native American reservations, most reclamation projects, military reservations, scientific testing areas, most wildlife protection areas (such as Federal wildlife refuges), and lands withdrawn from mineral entry for other reasons.
3.1.1.2 | Claim and Entry Types |
Two main claim types can be granted, lode mining and placer mining claims.
| | ● | Federal lode mining claims are defined by the BLM as: |
| | o | Deposits subject to lode claims include classic veins or lodes having well-defined boundaries. They also include other in place rocks bearing valuable minerals and may be broad zones of mineralized rock. Examples include quartz or other veins bearing gold or other metallic minerals and large volume, but low grade disseminated gold deposits. Descriptions are by metes and bounds surveys beginning at the discovery point on the claim and including a reference to natural objects or permanent monuments. A Federal statute limits their size to a maximum of 1,500 ft in length, and a maximum width of 600 ft (300 ft on either side of the vein). The end lines of the lode claim must be parallel to qualify for underground extralateral rights. Extralateral rights involve the rights to minerals that extend at depth beyond the vertical boundaries of the claim. |
Hecla Mining Company | Greens Creek Mine, SLR Project No: 101.00632.00020
Technical Report Summary - February 21, 2022
| | o | The boundaries of a claim based on staking and located after January 1, 1985, shall run in the four cardinal directions unless the claim is a fractional claim or the commissioner determines that staking in compliance with this paragraph is impractical because of local topography or because of the location of other claims; a claim established in this manner may be known as a non- meridian, township, range, section, and claim (MTRSC) location. |
| | ● | Federal placer mining claims are defined by the BLM as: |
| | o | Including all forms of deposit, excepting veins of quartz, or other in place rock. Therefore, every deposit, not located with a lode claim, should be appropriated by a placer location. Placer claims, where practicable, are located by legal subdivision (aliquot part and complete lots). The maximum size is 20 ac/locator, and the maximum for an association placer is 160 ac for eight or more locators. The maximum size in Alaska is 40 ac. The maximum size for a corporation is 20 ac/claim. Corporations may not locate association placers unless they are in association with other locators or corporations as co-locators. |
Federal lode and placer mining claims are administered by the BLM under the General Mining Law. After physically staking the boundaries with six posts a minimum of one meter tall, new claims are filed with the local county and with the BLM.
Maintenance requirements are based on the assessment year which begins September 1, at noon, and ends the following September 1, at noon. An annual $165/claim maintenance fee is required to be filed or postmarked (if mailed) on or before September 1 of the year preceding an assessment year. These BLM fees are increased from time to time.
Claimants who perform assessment work must spend a minimum of $100/claim in labor or improvements, and record evidence of such with the BLM by December 30 of the calendar year in which the assessment year ended. Assessment work includes, but is not limited to, drilling, excavations, driving shafts and tunnels, sampling (geochemical or bulk), road construction on or for the benefit of the mining claim, and geological, geochemical, and geophysical surveys.
In addition to these claim types, there are two kinds of mineral entry claim.
| | ● | Mill site entries are defined by the BLM as: |
| | o | A mill site must be located on non-mineral land. Its purpose is to either (1) support a lode or placer mining claim operation or (2) support itself independent of any particular claim. A mill site must include the erection of a mill or reduction works and/or may include other uses reasonably incident to the support of a mining operation. Descriptions of mill sites are by metes and bounds surveys or legal subdivision. The maximum size of a mill site is five acres. |
| | ● | Tunnel sites are defined by the BLM as: |
| | o | A tunnel site is where a tunnel is run to develop a vein or lode. It may also be used for the discovery of unknown veins or lodes. To stake a tunnel site, two stakes are placed up to 3,000 ft apart on the line of the proposed tunnel. Recordation is the same as a lode claim. An individual may locate lode claims to cover any or all blind (not known to exist) veins or lodes intersected by the tunnel. The maximum distance these lode claims may exist is 1,500 ft on either side of the centerline of the tunnel. This, in essence, gives the mining claimant the right to prospect an area 3,000 ft wide and 3,000 ft long. Any mining claim located for a blind lode discovered while driving a tunnel relates back in time to the date of the location of the tunnel site. |
Hecla Mining Company | Greens Creek Mine, SLR Project No: 101.00632.00020
Technical Report Summary - February 21, 2022
3.1.1.2.1 | Federal Lode and Placer Patented Mining Claims |
A patented claim is one for which the federal government has passed title to the claimant, making it private land. While a person may mine and remove minerals from a mining claim without a patent, mineral patent gives the owner title to the minerals, surface, and other resources (timber, vegetative). Mineral patents can be issued for lode claims and placer claims.
Patenting requires the claimant to demonstrate the existence of a valuable mineral deposit. In addition, the applicant needs to:
| | ● | Survey, if required, subsequent to location: |
| | o | Survey application requires initial fee of $750 plus $300 for each additional claim. |
| | o | Approved survey plan and notice of intent to patent posted on claim. |
| | ● | File patent application in BLM State Office accompanied by fees - $250 service charge (one claim) and $50 for each additional claim. |
| | ● | Provide evidence of title and citizenship. |
| | ● | Provide statement of expenditures and improvements. |
| | ● | Have BLM approval notice published in newspaper. |
| | ● | Provide proofs of posting and publications, and corroborated statements. |
Under the current law, if all requirements have been satisfied, the applicant can purchase a patent for a lode claim at $5.00/ac ($12/ha) and placer claims for $2.50/ac ($6.18/ha).
3.1.1.2.2 | Federal Conditions of Use |
Activities that ordinarily result in no or negligible disturbance of the public lands or resources are termed “casual use.” In general, the operator may engage in casual use activities without consulting, notifying, or seeking approval from the BLM.
For exploration activity greater than casual use and which causes surface disturbance of five acres (two hectares) or less of public lands; the operator must file a complete notice with the responsible BLM field office. Notice is for exploration only and only 1,000 tons (907 t) may be removed for testing.
A Plan of Operations is required for surface disturbance greater than casual use, unless the activity qualifies for a Notice filing. Surface disturbance greater than casual use on certain special category lands always requires the operator to file a Plan of Operations and receive approval from the federal agency that administers the land (i.e., BLM, the USFS). An applicant for a plan of operations must pay a processing fee, and/or for a mineral examination on a case-by-case basis.
Anyone proposing to prospect for or mine locatable minerals that might cause disturbance of surface resources is required to file a “Notice of Intention to Operate” with the local USFS office or BLM. If the Federal Agency determines that such operations will cause a significant disturbance to the environment, the operator must submit a proposed Plan of Operations, from which the impacts of the operations will be assessed. The Plan of Operations must describe such things as the type of operation proposed and how it will be conducted; proposed roads or access routes and means of transportation; and the time period during which the proposed activities will take place. The Plan of Operations must also indicate the measures to be taken to rehabilitate areas where mining activities have been completed. An operator shall also be required to furnish a bond commensurate with the expected cost of rehabilitation.
Hecla Mining Company | Greens Creek Mine, SLR Project No: 101.00632.00020
Technical Report Summary - February 21, 2022
There are no fees associated with processing notices of intent or plans of operations needed for locatable minerals. A bond is required for a plan of operations, in an amount that would be adequate to reclaim the surface resources. In addition, the USFS may require an applicant to submit environmental information and may authorize an applicant to prepare an environmental assessment.
3.1.1.3 | State Mineral Titles |
State-owned lands cover an area larger than the entire State of California, and most of these lands are open to mining under a location system which is a modern version of the Federal mining law.
Legislation relating to mining claims was enacted in 2000 as Senate Bill 175. State mining claims in Alaska use the meridian, township, range, section, and claim (MTRSC) format. Two sizes of claim can be staked, quarter section (approximately 160 ac or 65 ha), and quarter–quarter section (approximately 40 ac or 16 ha). Claims require posting of corners, as the corner posts define the actual claim location and mineral rights acquired. Typically, such locators are defined using global positioning system (GPS) instruments.
Annual rental payments for a mining claim, leasehold location, or mining lease are based on the number of years since the concession was first located. Claims that were located before 31 August 1989 have that date as their commencement date for fee payment purposes.
Rental payments are required as follows:
| | ● | For all traditional mining claims and quarter–quarter section MTRSC locations, the annual rental amount is $35/year for the first five years, $70/year for the second five years and $170/year thereafter. |
| | ● | For all quarter section MTRSC locations, the annual rental amount is $140/year for the first five years, $280/year for the second five years and $680/year thereafter. |
| | ● | For all leases, the annual rent is $0.88/ac ($2.17/ha) per year for the first five years, $1.75/ac ($4.32/ha) for the second five years, and $4.25/ac ($10.50/ha) per year thereafter. |
There is also a minimum labor requirement for each mining claim. Under Alaska legislation, “labor” includes geological, geochemical, geophysical, and airborne surveys conducted by qualified experts and verified by a detailed report lodged with the appropriate Alaskan authorities. Work such as drilling, excavations, driving shafts and tunnels, sampling (geochemical or bulk), and road construction on or for the benefit of the mining claim is considered “labor” under this requirement. In addition to the minimum labor requirement, the following commitments are required for maintenance of the claims:
| | ● | $100/claim, leasehold location, or lease if the claim, leasehold location, or lease is a quarter–quarter section MTRSC claim, leasehold location, or lease. |
| | ● | $400 for each quarter section. |
| | ● | $100 for each partial or whole 40 ac (16 ha) of each mining claim, leasehold location, or lease not established using the MTRSC system. |
If more work is performed than required to meet minimum commitments, then an application can be made to have the excess applied against the following year, or for as many as four years. There is provision for a cash payment to be made in lieu of work expenditure.
Hecla Mining Company | Greens Creek Mine, SLR Project No: 101.00632.00020
Technical Report Summary - February 21, 2022
At any time in the exploration or production process, a claimholder may convert the mining claim to a mining lease. Mining leases have the same rental and production royalty rates do mineral claims and require annual claim filing and recordation. Each lease title defines specific rights of control and tenure for that lease that may otherwise be open to conflict with third party claimants or other multiple use users of the State land. A mining lease shall be for any period up to 55 years and is renewable if requirements for the lease remain satisfied. Minerals on State lands cannot be patented.
Of the total area of Alaska, 60% (222 million acres (Mac) or 89.8 million ha (Mha)) is classed as Federal lands. The USFS and BLM manage approximately 20 Mac and 78 Mac (8.1 Mha and 31.6 Mha) respectively, for a total of 98 Mac (39.7 Mha), for multiple use purposes including timber production, fish and wildlife, recreation, water, and mining.
Mineral tenure holders do not have surface rights but do have the rights to concurrent use of land to the extent necessary for the prospecting for, extraction of, or basic processing of mineral deposits once necessary permits have been obtained. Requirements for BLM land varies from those for USFS administered lands.
When Alaska became a state in 1959, the federal government granted the new state 28% ownership of its total area. Approximately 103.35 Mac (41.8 Mha) were selected under three types of grants:
| | ● | Community (400,000 ac or 162,000 ha) |
| | ● | National Forest Community (400,000 ac or 162,000 ha) |
| | ● | General (102.55 Mac or 41.5 Mha) |
Additional territorial grants, for schools, university, and mental health trust lands; totaling 1.2 Mac (486,000 ha) were confirmed with statehood.
Mineral tenure holders do not have surface rights but do have the rights to concurrent use of land to the extent necessary for the prospecting for, extraction of, or basic processing of mineral deposits.
Where surface rights are held by a third-party other than the State, appropriate compensation must be negotiated with the owner.
3.1.2.3 | Alaska Native Claims Settlement Acts Lands |
In 1971 Congress passed the Alaska Native Claims Settlement Act (ANSCA). This law granted 44 Mac (17.8 Mha) and $1.0 billion to village and native corporations created under the act. Generally, ANSCA gave Natives selection priority over state land selections. Native lands are private lands. Thirteen regional corporations were created for the distribution of ANSCA land and money. Twelve of those shared in selection of 16 Mac (6.5 Mha) and the 13th corporation, based in Seattle, received a cash settlement only. A total of 224 village corporations, of 25 or more residents, shared 26 Mac (10.5 Mha). The remaining acres, which include historical sites and existing native-owned lands, were allocated to a land pool to provide land to small villages of less than 25 people.
Hecla Mining Company | Greens Creek Mine, SLR Project No: 101.00632.00020
Technical Report Summary - February 21, 2022
Agreements and compensation for land access and infrastructure construction must be separately negotiated with ANSCA holders.
The Alaska Water Use Act defines water rights as:
| | ● | A water right is a legal right to use surface or groundwater under the Alaska Water Use Act (AS 46.15). A water right allows a specific amount of water from a specific water source to be diverted, impounded, or withdrawn for a specific use. When a water right is granted, it becomes appurtenant to the land where the water is being used for as long as the water is used. If the land is sold, the water right transfers with the land to the new owner, unless the Department of Natural Resources approves its separation from the land. In Alaska, because water wherever it naturally occurs is a common property resource, landowners do not have automatic rights to groundwater or surface water. |
3.1.4 | Permits and Environmental |
Permits issued by federal agencies constitute “federal actions.” Any major federal action requires review under the National Environmental Protection Act (NEPA). A number of agencies can be involved in the review, at both the Federal and State levels. Other agencies are involved for specialist areas, such as transport of explosives, communication licenses, and landing strips for aircraft.
Typically, for larger metalliferous projects in Alaska, agencies involved in the permitting process can include:
| | ● | Federal Aviation Administration (FAA) |
| | ● | National Marine Fisheries Service (NMFS) |
| | ● | U.S. Army Corps of Engineers (USACE) |
| | ● | Environmental Protection Agency (EPA) |
| | ● | Bureau of Alcohol, Tobacco, and Firearms (BATF) |
| | ● | Federal Communications Commission (FCC) |
| | ● | U.S. Department of Homeland Security (DHS) |
| | ● | U.S. Department of Transportation (DoT) |
| | ● | Mine Safety and Health Administration (MSHA) |
| | ● | Alaska Department of Environmental Conservation (ADEC) |
| | ● | Alaska Department of Fish and Game (ADFG) |
The federal agency with the predominant federal permit is usually designated the lead for the NEPA process. During the permitting process, the agencies identified as requiring input into the process will review the proposed Project, evaluate impacts associated with each facet of the Project, consider alternatives, identify compliance conditions, and ultimately decide whether or not to issue the requested permits.
Hecla Mining Company | Greens Creek Mine, SLR Project No: 101.00632.00020
Technical Report Summary - February 21, 2022
Upon completion of the NEPA process, a Record of Decision is prepared that supports issuance of the permit for the preferred alternative for the Project, describes the conditions of the decision to issue the permit, and explains the basis for the decision. The state permitting process typically is not finalized until the NEPA process is completed. Each federal and state permit has compliance stipulations requiring review and possibly negotiation by the applicant and appropriate agency.
The US Mining Laws, specifically 43 CFR 3809 on the federal level, define the reclamation standards for mines operated since 1981. An Alaskan State law regulates the reclamation procedures on private, state, and federal lands for mines operated since mid-October 1991. The Department of Natural Resources and Division of Water and Mining issued the reclamation requirements. Briefly, requirements are that all mined land be returned to a stable state, that post-mining erosion be minimized, and that the potential for natural re-vegetation be enhanced. Before a mining permit can be issued, the mining company must first submit a plan for reclamation.
An approved reclamation plan from the appropriate Alaskan regulatory authority Is required prior to mining operations commencement. An individual financial assurance is normally required, although for certain mining operations, the State will allow a bonding pool. However, a mining operation may not be allowed to participate in the bonding pool if the mining operation will chemically process material or has the potential to generate acid.
The Alaskan Commissioner determines the amount of the financial assurance needed after consideration of the reasonable and probable costs of reclamation for that operation. There are a number of methods of meeting the financial assurance requirements, including a surety bond, letter of credit, certificate of deposit, a corporate guarantee that meets the financial tests set in regulation by the commissioner, or payments and deposits into a specified trust fund. Typically, companies establish a fund under the Alaskan “Trust Fund for Reclamation, Closure & Post-Closure Obligations”, such that the amount in the fund is sufficient to generate adequate cash flow to cover all reclamation, closure, and post-closure costs.
Applying to State lands only, there is a 3% production royalty that is calculated on the same net profits basis as the mining license tax. This production royalty is payable on all State land production and does not include the 3.5 year grace period. Failure to file and pay this royalty will result in loss of claims.
No Federal taxes are currently levied; however, royalties are payable by Hecla to the Federal Government in certain instances (see Section 3.3).
Hecla Mining Company | Greens Creek Mine, SLR Project No: 101.00632.00020
Technical Report Summary - February 21, 2022
The Project core claims at Big Sore are held in the name of Hecla Greens Creek Mining Company, a wholly-owned Hecla subsidiary.
Table 3‑1 and Table 3‑2 present a summary of the Hecla ground holdings. Details of the unpatented claims are included in Appendix 1. The holding obligations are summarized in Table 3‑3. The annual maintenance fees of US$165/claim required to hold the unpatented mining claims have been paid annually to the BLM, and the required annual filing fees have been paid to Juneau Recording District, State of Alaska. The claims have been properly maintained and are in good standing. Hecla owns the patented mining and mill site claims and fee parcels, and pays the assessed property taxes, which payments are current as of the date of this TRS.
Figure 3‑3 presents the ownership structure of the Greens Creek mining operations, while Figure 3‑4 presents the project and regional land holdings layout.
Figure 3‑3: Ownership Structure of Greens Creek Mining Operations
Hecla Mining Company | Greens Creek Mine, SLR Project No: 101.00632.00020
Technical Report Summary - February 21, 2022
Figure 3‑4: Project and Regional Land Holdings Layout Plan
Hecla Mining Company | Greens Creek Mine, SLR Project No: 101.00632.00020
Technical Report Summary - February 21, 2022
Table 3‑1: Summary- Patented Claims and Mill Sites
Hecla Mining Company – Greens Creek Mine
Claim Names | Number | BLM Serial No. or Survey No. or ADL No. | Type | Acreage |
Patented Claims |
Big Sore #s 902, 903, 904, 905, 906, 1006, 1007 and Big Sore #1305 | 8 | Mineral patent Surveys: MS2402, MS2515 | Patented surface and subsurface (“fee simple”) lode mining claims | 155.366 ac
(62.874 ha) |
| | | | | |
Big Sore #s 1002, 1003, 1004, 1005, 1106, 1107; Big Sore #1105, 1207; and Big Sore #1304 | 9 | Mineral Patent Surveys: MS2402, MS2515, MS2516 | Patented lode | 171.825 ac
(69.535 ha) |
Patented Mill Site |
Young No. 1 mill site | 1 | Mineral Patent Survey: MS2514 | Patented mill site, patented (surface) in Dec. 1992 | 0.6151 ac
(0.2489 ha) |
Table 3‑2: Summary- Land Exchange and Other Fee Properties
Hecla Mining Company – Greens Creek Mine
Property Name | Number | BLM Serial No. or Survey No. or ADL No. | Type | Acreage |
Exchange lands (Greens Creek Land Exchange Act of 1995) | N/A | Pat. No. 50-98-0434; U.S. Survey No. 11840, Alaska | Subsurface mineral estate, surface considered AINM non-wilderness for mining development purposes | 7,301.48 ac
(2,954.80 ha) |
| | | | | |
Hawk Inlet Cannery site | 1 | U.S. Survey No. 793 | Fee Simple | 16.83 ac
(6.81 ha) |
| | | | | |
Hawk Inlet Cannery site tidelands | 1 | Alaska Tidelands Survey No. 57/ Serial No. 63-1523 | Alaska State tidelands/shorelines | 21.019 ac
(8.5 ha) |
Hecla Mining Company | Greens Creek Mine, SLR Project No: 101.00632.00020
Technical Report Summary - February 21, 2022
Table 3‑3: Summary- Claims Holding Obligations
Hecla Mining Company – Greens Creek Mine
Names | Number | Type | Acreage | Holding Costs | Royalties | Comments |
Big Sore’s 902, 903, 904, 905, 906, 1006, 1007 (MS 2402) and Big Sore # 1305 (MS 2515) | 8 | patented surface and subsurface ‘fee simple’) Federal lode mining claims | 155.366 ac
(62.874 ha) | property taxes | none | within Exchange Lands, represents so-called “perfected” claims in the immediate mine area (core claims with valid discoveries as of 12/1/78) |
| | | | | | | |
Big Sore ‘s 1002, 1003, 1004, 1005, 1106, 1107 (MS 2402); Big Sore # 1105, 1207 (MS 2516); and Big Sore # 1304 (MS 2515) | 9 | patented subsurface Federal lode mining claims | 171.825 ac
(69.535 ha) | property taxes | none | within Exchange Lands, represent so-called “unperfected” claims in the immediate mine area (core claims with valid discoveries made after 12/1/78 ) |
| | | | | | | |
Young No. 1 Mill Site | 1 | Federal mill site claim, fully patented (surface) in Dec. 1992 | 0.6151 ac
(0.2489 ha) | property taxes | none | outside of AINM within standard Tongass National Forest lands; claim provides a site for Young Bay dock and parking facility |
| | | | | | | |
Big Sore 1321-1324, 1421-1424, 1521-1524, 1623-1627, 1723-1728, 1824-1827 | 27 | unpatented Federal lode mining claims | claimed acreage, at 20 ac/claim, is 540 ac (219 ha); valid acreage is much less | $165/year/claim BLM rental fees, plus filing/recording fees | none | Mariposite Ridge area (abutting the Mammoth claims) within Tongass National Forest lands but overlapping into AINM; a portion of this claim block is invalid |
Hecla Mining Company | Greens Creek Mine, SLR Project No: 101.00632.00020
Technical Report Summary - February 21, 2022
Names | Number | Type | Acreage | Holding Costs | Royalties | Comments |
Mariposite 1-77, 79-87, 100-114 | 101 | unpatented Federal lode mining claims | claimed acreage, at 20 ac/claim, is 2,020 ac (817 ha); because of overlaps actual valid acreage will be less | $165/year/claim BLM rental fees, plus filing/recording fees | none | multiple groups staked in the 1980s; on Tongass National Forest lands; portions may be invalid due to overlaps, especially with Lil Sore block |
| | | | | | | |
West Mariposite 115-123, 128-156, 159-165, 168-171 | 49 | unpatented Federal lode mining claims | claimed acreage, at 20 ac/claim, is 980 ac (397 ha); because of overlaps actual valid acreage will be less | $165/year/claim BLM rental fees, plus filing/recording fees | none | staked in 1996; on Tongass National Forest land: |
| | | | | | | |
Lil Sore 41-48 | 8 | unpatented Federal lode mining claims | claimed acreage, at 20 ac/claim, is 160 ac (65 ha); because of overlaps actual valid acreage will be less | $165/year/claim BLM rental fees, plus filing/recording fees | none | staked in 1996; on Tongass National Forest land; borders Lil’’ Sore block to W, Fowler block to N, Young Bay Experimental Forest to E |
| | | | | | | |
Fowler 543-558, 643-658, 743-758, 843-858, 943-958, 1043-1047, 1143-1147 | 90 | unpatented Federal lode mining claims | claimed acreage, at 20 ac/claim, is 1,800 ac (728 ha); because of overlaps actual valid acreage will be less | $165/year/claim BLM rental fees, plus filing/recording fees | none | staked in 1985; on Tongass National Forest land; bordered by West Fowler, North Fowler, & East Fowler; Lil Sore and Mariposite blocks to S |
| | | | | | | |
North Fowler 41, 141-144, 226-246, 250-251, 336-358, 363, 436-461 | 75 | unpatented Federal lode mining claims | claimed acreage, at 20 ac/claim, is 1,660 ac (672 ha); because of overlaps actual valid acreage will be less | $165/year/claim BLM rental fees, plus filing/recording fees | none | 93 claims staked in 1996; on Tongass National Forest land; 10 claims were declared Null and Void Ab Initio (and portions of 12 others) by BLM in February 1997 (State Selected Land) |
Hecla Mining Company | Greens Creek Mine, SLR Project No: 101.00632.00020
Technical Report Summary - February 21, 2022
Names | Number | Type | Acreage | Holding Costs | Royalties | Comments |
West Fowler 559-561, 659-664, 759-767, 859-865, 959-966 | 33 | unpatented Federal lode mining claims | claimed acreage, at 20 ac/claim, is 660 ac (267 ha); because of overlaps actual valid acreage will be less | $165/year/claim BLM rental fees, plus filing/recording fees | none | staked in 1996; on Tongass National Forest land; seven claims abandoned in April 1997 that overlapped new mill sites claims, one declared Null and Void Ab Initio (and portions of 10 others) by BLM in February 1997 (State Selected Land) |
| | | | | | | |
East Fowler 538-542, 641-642, 741-742, 841-842, 941-942, 1042 | 14 | unpatented Federal lode mining claims | claimed acreage, at 20 ac/claim, is 280 ac (113 ha); because of overlaps actual valid acreage will be less | $165/year/claim BLM rental fees, plus filing/recording fees | none | 41 claims staked in 1996; on Tongass National Forest land. |
| | | | | | | |
Big Sore Mill Site Nos. 798, 802-803, 899-902, 904-907, 996, 1001-1010, 1096-1097, 1103- 1108, 1202-1205, 1505-1508, 1509-1511, 1514, 1516-1517, 1610-1614, 1710-1718 | 58 | unpatented Federal mill site mining claims | claimed acreage, at 5.0 ac/claim, is 290 ac (117 ha) | $165/year/claim BLM rental fees, plus filing/recording fees | none | 25 were re-staked in Fall 1993; on Tongass National Forest land; covers main tailings area; 33 sites to the north and east were re-staked in May 2002 (originally staked in Fall 1996) |
| | | | | | | |
HIP 010, 020, 030, 040, and 050 | 5 | Alaska State Prospecting Sites | claimed acreage is 800 ac (324 ha) (1/4 section, 160 ac, per pros. Site), ‘valid’ acreage is approximately ½ that due to shoreline | no rentals, no fees, no filings required until land tentatively approved, costs thereafter would be same as the state tideland claims | 3% net income production royalty | staked in Feb 1996; on State selected lands along E side of Hawk Inlet, status in limbo; no development allowed until state selections are tentatively approved (has not happened as of Sept, 2005) |
Hecla Mining Company | Greens Creek Mine, SLR Project No: 101.00632.00020
Technical Report Summary - February 21, 2022
Names | Number | Type | Acreage | Holding Costs | Royalties | Comments |
Hawk Inlet Cannery site | 1 | fee simple land (US survey 783) | 16.83 ac
(6.81 ha) | property taxes | NA | acquired from Bristol Resources, Inc. (Bristol Resources) |
| | | | | | | |
Hawk Inlet Cannery site tidelands | 1 | Alaska Tidelands Survey No. 57 | 21.019 ac
(8.50 ha) | property taxes | NA | acquired from Bristol Resources |
| | | | | | | |
Exchange Lands (Greens Creek Land Exchange Act of 1996) | NA | Subsurface mineral estate, surface remains AINM non-wilderness | 7,301 ac
(2,955 ha) | none | 3% net island receipts (NIR) production royalty; 0.75% NIR when NIR value is less than $120/ton ore | Completed in 1998; no surface mining allowed; 100 year expiration of conveyance |
| | | | | | | |
East Ridge #’s 1011-1015, 1111-1115, 1210-1215, 1310-1315, 1408-1417, 1510-1515, 1611-1615, | 43 | unpatented Federal lode mining claims | claimed acreage, at 20 ac/claim, is 860 ac (348 ha); because of overlaps actual valid acreage will be less | $165/year/claim BLM rental fees, plus filing/recording fees | none | |
| | | | | | | |
The total unpatented and patented claims and mill sites, state prospecting sites and tideland claims; including Exch. Lands, approximately 16,410 ac (6,530 ha) encompassed | | | approximate total direct holding costs, excluding property taxes, are $87,750 plus approx. $1720 in recording costs | | | * excluding USFS leases and State tideland leases (approx. 113 ac (46 ha) total) ** AINM is Admiralty Island National Monument |
Hecla Mining Company | Greens Creek Mine, SLR Project No: 101.00632.00020
Technical Report Summary - February 21, 2022
The Property includes 440 unpatented lode mining claims, 58 unpatented mill site claims, 17 patented lode claims, one patented mill site and other fee lands, notably the Hawk Inlet historic cannery site. Hecla also holds title to mineral rights on 7,301 ac (2,955 ha) of Federal land acquired through a land exchange with the USFS.
3.2.1 | Patented and Unpatented Claims |
The patented lode claims, containing approximately 327 ac (132 ha), are located in Sections 4, 8, 9 and 10, Township 44 South, Range 66 East, Copper River Meridian, Juneau Recording District, Alaska. The 0.62 ac (0.25 ha) mill site claim is located in Section 1, Township 43 South, Range 65 East.
The unpatented lode and mill site mining claims are situated in Sections 1-3, 10-15, and 22-27, Township 43 South, Range 65 East, and Sections 7, 17 to 20, and 29 to 33, Township 43 South, Range 66 East, Copper River Meridian. The unpatented lode and mill site claims encompass approximately 8,072 ac (3,267 ha).
Greens Creek leases parcels from the USFS on both the Monument and non-monument lands. It uses other public lands pursuant to special use permits issued by the USFS and leases issued by the State of Alaska. Some areas within the Monument required for the road right-of-way, mine portal and mill site access, campsite, mine waste area and a tailings impoundment are governed by USFS leases. Alaska National Interest Lands Conservation Act (ANILCA) is the legal basis for these leases and others which may be required.
3.2.3 | Land Exchange Properties |
Pursuant to “The Federal Greens Creek Land Exchange Act of 1995” (Pub. L. 104-123 April 1, 1996), 7,301 ac (2,955 ha) of mineral lands (subsurface estate and certain restricted surface use rights) surrounding the core group of 17 patented claims were conveyed to the Greens Creek Joint Venture in exchange for $1.0 million of private lands purchased by the Venture and a royalty on mineral production from the Land Exchange properties. Previously patented claims, including associated extralateral rights, are not subject to the royalty. The Property extents are approximately from Section 26, Township 43 South, Range 65 East, to Section 13, Township 44 South, Range 66 East, Copper River Meridian.
The Land Exchange properties conveyed are subject to:
| | ● | Restrictive covenants limiting surface use; and |
| | ● | A future interest held by the United States which pertains to the Land Exchange properties, the core claims, and other Greens Creek properties. |
The future interest vests with the United States upon the earlier of:
| | ● | Abandonment of the properties. |
| | ● | January 1, 2045 (absent good faith mineral exploration, production, or reclamation); or |
Hecla Mining Company | Greens Creek Mine, SLR Project No: 101.00632.00020
Technical Report Summary - February 21, 2022
3.3 | Surface Rights and Property Agreements |
The land comprising the Property, inclusive of all Admiralty Island facilities, consists of both publicly- and privately-owned land. It owns land on Admiralty Island both as a result of patenting mining and mill site claims and through transfer of private lands in the historic cannery area from its predecessor.
As noted in Section 3.3.2, Hecla leases parcels from the UFSF on both the Monument and non-monument lands. Hecla uses other public lands pursuant to special use permits issued by the USFS and leases issued by the State of Alaska. Additionally, Hecla holds subsurface and restricted surface use rights under the Land Exchange.
Kennecott and the USFS began discussing the possibility of the existence of extralateral rights at Greens Creek in circa 1990. In 1994, Kennecott prepared a comprehensive geologic and legal analysis of extralateral rights at Greens Creek based upon the geologic information then available. Based upon that analysis, the USFS agreed that extralateral rights exist with respect to the Big Sore claims.
At Greens Creek, underground mining has progressed outside of the vertical boundaries of the mining claims under the extralateral rights. Hecla and predecessor companies have also conducted underground exploration beyond the mining claims’ vertical boundaries.
In addition to the right to mine inherent in the Big Sore claims and the extralateral rights acknowledged by the USFS, Kennecott was granted mining rights pursuant to US Patent No. 50-98-0434 (AA-80626; the Patent) and the associated Agreement dated December 14, 1994 between Kennecott and the United States (the Patent Agreement). Hecla is also bound by these agreements and granted rights, and each of these rights carries with it somewhat different mining or possessory rights.
First, as it has done historically, Hecla can mine each and every mineral deposit found within the vertical boundaries of the Big Sore claims based upon the intraliminal rights that are inherent to every mining claim. Second, to the extent extralateral rights associated with the Big Sore claims can be demonstrated to exist, Hecla can mine “down dip” on a vein outside of the vertical boundaries of the claims. As long as Hecla stays within such vertical planes, there is no limit how far down dip Hecla can mine. And third, pursuant to the Patent and the Patent Agreement, Hecla is permitted to mine a specified area (the Agreement Area) outside of the vertical boundaries of the Big Sore claims even where no extralateral rights can be shown to exist.
To the extent Hecla mines pursuant to its intraliminal rights, i.e., the right inherent in the Big Sore claims, it is not obligated to make any royalty payment to the Federal Government. Likewise, to the extent Hecla mines pursuant to extralateral rights, i.e., down dip on a vein within vertical planes drawn through the end line of a claim that has extralateral rights, it is not obligated to make any royalty payment to the Federal Government.
When Hecla mines a mineral deposit located outside of the Big Sore claims where it cannot demonstrate extralateral rights, it must mine pursuant to the Patent and the Patent Agreement. The Patent and the Patent Agreement carry with them the obligation to pay a royalty to the Federal Government (the Federal Royalty, see Section 3.3). In addition, the area that can be mined is geographically limited to the Agreement Area.
Hecla Mining Company | Greens Creek Mine, SLR Project No: 101.00632.00020
Technical Report Summary - February 21, 2022
From the statutory language of the General Mining Law, courts have established a number of requirements that must be met in order to obtain extralateral rights:
| | ● | The deposit involved must be a “lode” or a “vein”. |
| | ● | The deposit must “apex” within the claim boundaries. |
| | ● | The deposit must “dip”, and not be horizontal. |
| | ● | The deposit must be “continuous”. |
| | ● | The deposit can only be pursued beyond the vertical boundaries of the side lines of a claim within planes parallel to the end lines of the claim. |
These definitions of what constitute the basis for extralateral rights are being reviewed in relation to known mineralization, in particular the Gallagher Zone, which is adjacent to and appears to extend into, the Land Exchange boundaries. Hecla is currently exploring the relationships of the Greens Creek mineral bodies to the Gallagher Zone, and evaluating the influence of a major structural boundary, the Gallagher Fault, on mineralization continuity. If extralateral rights across the Gallagher Fault are not established, then the Gallagher Zone would be subject to a royalty to the US Government.
3.4 | Royalties and Encumbrances |
Bristol Resources holds a 2.5% net smelter return (NSR) royalty based on 11.2142% of the Greens Creek Joint Venture. This royalty is the sole responsibility of the Hecla Juneau Mining Company ownership interest (12.5164%; refer to Figure 3‑3 for the ownership interest breakdown).
The royalty was payable once a calculated “capital recovery amount” of $26.5 million was recouped. The capital recovery amount is based on a percent of the capital investment related to the original feasibility study, the original purchase price of Bristol’s ownership share, and interest accumulated for a four year period. Earnings applied to capital recovery were essentially calculated based on 11.2142% of net income before non-cash charges and income tax. The NSR value used in the Bristol Resources royalty is calculated as follows:
| | ● | Net proceeds from smelter. |
| | ● | Less on-island concentrate transportation, storage, and ship loading costs. |
Under the land exchange, production from new discoveries on the exchanged lands will be subject to Federal royalties included in the Land Exchange Agreement. The royalty is only due on production from Mineral Reserves that are not part of Greens Creek’s extralateral rights. Thus far, there has been no production, and no payments of the royalty have been triggered.
Per the Greens Creek Land Exchange Act of 1995, (Public Law 104-123), properties in the land exchange are subject to a royalty payable to the USFS that is calculated on the basis of NIR. NIR are equal to revenues from metals extracted from the land exchange properties less transportation and treatment charges (e.g., smelting, refining, penalties, assaying) incurred after loading at Admiralty Island.
The NIR royalty is 3% if the average value of the Mineral Reserve mined during a year is greater than $120/ton ($132/t) of ore, and 0.75% if the value is $120/ton ($132/t) or less. The benchmark of $120/ton ($132/t) was adjusted annually according to the US Gross Domestic Product (GDP) Implicit Price Deflator until the year 2016, after which time it became a fixed rate of $161/ton.
Hecla Mining Company | Greens Creek Mine, SLR Project No: 101.00632.00020
Technical Report Summary - February 21, 2022
Hecla complies with all state and federal employment laws, which identify Native Alaskans as a protected minority classification. Hecla has no First Nations agreements in regard to Greens Creek and there are no outstanding First Nations claims in the project area.
3.6 | Other Significant Factors and Risks |
SLR is not aware of any environmental liabilities on the Property. Hecla has all required permits to conduct the proposed work on the Property. SLR is not aware of any other significant factors and risks that may affect access, title, or the right or ability to perform the proposed work program on the Property.
Hecla Mining Company | Greens Creek Mine, SLR Project No: 101.00632.00020
Technical Report Summary - February 21, 2022
4.0 | ACCESSIBILITY, CLIMATE, LOCAL RESOURCES, INFRASTRUCTURE AND PHYSIOGRAPHY |
The Property is situated partly within the Admiralty Island National Monument and completely within the municipal boundaries of the City and Borough of Juneau. The majority of the area of Admiralty Island is part of the Admiralty Island National Monument, which covers an area of more than 955,000 ac (3,860 km²). The mine and plant are located approximately five miles (eight kilometers) up the Greens Creek River valley with the mine camp located at Hawk Inlet (Figure 3‑2).
Greens Creek employees are shuttled by ferry boat, which travels twice daily from Auke Bay, Juneau to Young Bay dock on Admiralty Island. Fixed wing air transport is also available on a charter basis originating at the Juneau airport and landing at the sea plane dock at Hawk Inlet camp. A number of helicopter services are also available on a charter basis and may, with proper clearance, land at two landing pads; one located at Hawk Inlet camp and the second located at the mine site in the Greens Creek valley.
Freight services operate via weekly scheduled barge with service originating in Seattle, Washington, and subsequent connections to Juneau. Once on Admiralty Island, buses are used to transport passengers along an improved dirt and gravel road from Young Bay dock to the Hawk Inlet camp or to the mine.
Admiralty Island is a temperate rainforest featuring a cool temperate climate milder than its latitude may suggest, due to the influence of the Pacific Ocean. Winters are moist, long but only slightly cold: temperatures drop to 20° F (−6.7° C) in January, and highs are frequently above freezing. Spring, summer, and fall are cool to mild, with average highs peaking in July at 65° F (18.3° C).
Annual snowfall on Admiralty Island averages 98 in. (213 cm) and occurs chiefly from November to March. Precipitation occurs year-round, ranging from 55 in. (1,400 mm) to 90 in. (2,290 mm) annually. The months of May and June are the driest while September and October are the wettest. Admiralty Island’s monthly temperature, precipitation and snowfall are summarized in Table 4‑1.
Surface exploration at Greens Creek operates at elevations ranging from sea level to 3,300 ft (1,005 m). Weather is highly variable, ranging from sunny to week-long periods of low clouds and fog and because of these weather conditions, exploration activities are conducted generally over a five month period; between May to October each year. Mining activity occurs year-round.
Hecla Mining Company | Greens Creek Mine, SLR Project No: 101.00632.00020
Technical Report Summary - February 21, 2022
Table 4‑1: Climate Summary Table
Hecla Mining Company – Greens Creek Mine
Month | Average
Maximum Temp
(°F) | Average
Maximum Temp
(°C) | Average
Minimum Temp
(°F) | Average
Minimum Temp
(°C) | Average Total
Precipitation
(in.) | Average Total
Precipitation
(mm) | Average Total
Snowfall
(in.) | Average Total
Snowfall
(mm) |
January | 29 | -1.7 | 18.2 | -7.7 | 4.26 | 108 | 26.8 | 681 |
February | 34.2 | 1.2 | 23 | -5 | 3.92 | 100 | 19.6 | 498 |
March | 38.7 | 3.7 | 26.6 | -3 | 3.48 | 88 | 14.4 | 366 |
April | 47.5 | 8.6 | 32.4 | 0.2 | 2.93 | 74 | 2.8 | 71 |
May | 55.3 | 12.9 | 39.2 | 4 | 3.53 | 90 | — | — |
June | 61.6 | 16.4 | 45.3 | 7.4 | 3.13 | 80 | — | — |
July | 64 | 17.8 | 48.4 | 9.1 | 4.29 | 109 | — | — |
August | 62.7 | 17.1 | 47.6 | 8.7 | 5.34 | 136 | — | — |
September | 56 | 13.3 | 43.2 | 6.2 | 7.21 | 183 | — | — |
October | 47 | 8.3 | 36.9 | 2.7 | 7.86 | 200 | 1.1 | 28 |
November | 37.7 | 3.2 | 28.5 | -1.9 | 5.43 | 138 | 11.7 | 297 |
December | 32.5 | 0.3 | 23.4 | -4.8 | 5.09 | 129 | 21.8 | 554 |
Annual | 47.2 | 8.4 | 34.4 | 1.3 | 56.47 | 1,434 | 98.4 | 2,499 |
4.3 | Local Resources and Infrastructure |
Juneau is the closest large city with a population of approximately 30,000. It is fully capable of providing all goods and services required by the mine and exploration teams. Operating supplies are shipped via weekly barge service from Juneau, AK, and Seattle, WA. The project infrastructure and the infrastructure layout at the mine site are discussed in Section 15 of this TRS. There is sufficient suitable land available within the mineral tenure held by Hecla for tailings disposal, mine waste disposal, and installations such as the plant and related mine infrastructure. All necessary infrastructure has been built and is sufficient for the projected long range plan (LRP).
Mine facility elevations range from the concentrate shipping facility, which is at sea level, to the 1350-adit at an elevation of 1,350 ft (412 m) above sea level. The plant and main mine portal are located at an elevation of 920 ft (280 m).
The ecology of Admiralty Island is dominated by temperate rainforest that is primarily made up of Sitka spruce, and western hemlock interspersed with small areas of muskeg. The timberline is typically at an elevation of 2,000 ft to 2,500 ft (610 m to 762 m). Above the timberline the forest gradually changes to alpine-tundra with rock outcrops and permanent and semi-permanent snow fields.
Hecla Mining Company | Greens Creek Mine, SLR Project No: 101.00632.00020
Technical Report Summary - February 21, 2022
The Pan Sound Joint Venture, formed in 1973, consisted of joint venture partners Noranda Exploration (29.73%), Marietta Resources International (29.73%), Exhalas Resources Corporation (29.73%), and Texas Gas Exploration (10.81%). Under the Pan Sound Joint Venture, the first mineral claims were staked over the Big Sore vegetation and geochemical anomaly.
Bristol Bay Resources (Bristol), a company held by the Bristol Bay Native Corporation, joined the original partners in 1976.
In 1978, the Pan Sound Joint Venture was dissolved, and the Greens Creek Joint Venture created, with the same partners holding the interests in the Greens Creek Joint Venture.
Bristol sold its 11.2% interest in 1988 to Noranda and Hawk Inlet Company, with a half interest sold to each party. Bristol retained a 2.5% NSR royalty on its 11.2% share as part of the sale.
In 1982, Anaconda Minerals bought Marietta’s interest and, in 1986, Amselco (a unit of BP Minerals) purchased both Anaconda’s and Noranda’s interests, subsequently selling off a portion to Hecla in 1987.
Texas Gas changed its name to CSX Alaska Mining Company, Inc. (CSX) in 1987. Following the merger of British Petroleum and Sohio, Kennecott Minerals (Kennecott) acquired Amselco in 1987.
The three remaining joint venture partners, Kennecott, Hecla, and CSX bought out Exhalas Resources Corporation in 1993. Kennecott Minerals bought out CSX in 1994, and CSX changed its name to Kennecott Juneau Mining Company (KJMC). At that time, the ownership was Kennecott Greens Creek Mining Company (KGCMC) with a 57.75% interest, KJMC with a 12.52% interest and Hecla with an interest of 29.73%.
In 1994, the Greens Creek Joint Venture (GCJV) agreement was restated in order to resolve certain issues between the Joint Venture participants.
KGCMC operated the mine up to 2008 with Hecla maintaining its 29.73% interest. On April 6, 2008, Hecla Mining Company completed its transaction to acquire KGCMC’s 57.75% and KJMC’s 12.52% interests in the Joint Venture (the Kennecott subsidiaries which held the remaining 70.27% interest in Greens Creek). As a result, Hecla subsidiaries now hold 100% of the Greens Creek Joint Venture since 2008.
5.2 | Exploration and Development |
Information in this section is based on a summary prepared by West (2010) and by Hecla staff. A summary of the exploration and development work completed from 1973 to 2020 is presented in Table 5‑1. The localities discussed in Table 5‑1 are indicated in Figure 5‑1. Mineralization was discovered at the Big Sore copper sub-crop in 1974. Mining operations commenced in 1989 but ceased in 1993 due to low metal prices. In 1996, the mine was re-opened, and production has continued uninterrupted to date.
Hecla Mining Company | Greens Creek Mine, SLR Project No: 101.00632.00020
Technical Report Summary - February 21, 2022
Table 5‑1: Exploration and Development History, 1973 to 2020
Hecla Mining Company – Greens Creek Mine
Year | | Operator | | Work Completed | | Comment |
1973 | | Pan Sound Joint Venture, a consortium vehicle of partners Noranda Exploration (29.73%), Marietta Resources (29.73%), Exhalas Resources (29.73%), and Texas Gas Exploration (10.81%) | | Stream sediment sampling. | | Identified a zinc and copper anomaly associated with Cliff Creek, but no claims were pegged. |
| | | | | | | |
1974 | | | | Air reconnaissance inspection. | | Identified a large unperfected zone that was vegetation free, the “Big Sore”; claims staking. |
| | | | | | | |
1974–1975 | | | | Additional stream sediment sampling, soil and rock sampling, Crone shoot-back electromagnetic (CEM) geophysical survey, surface magnetometer survey, geological mapping, trenching, and blasting and drilling of three core holes. | | PS0001 (first surface drill hole) intersects a wide zone of mineralization at Big Sore. |
| | | | | | | |
1976 | | Noranda assumed operatorship of the Pan Sound Joint Venture | | Geochemical sampling, CEM and magnetic surveys, geological mapping at Big Sore, core (five holes) and Winkie (AQ size; eight holes) drilling. | | First-time Mineral Resource estimate. |
| | | | | | | |
1977 | | | | 22 holes totaling 8,810 ft (2,685 m) were completed at Big Sore, Killer Creek and Gallagher Creek. Additional soil sampling was undertaken over extensions to these areas, as was a CEM survey. Soil surveys, CEM and magnetic geophysical surveys, and geologic mapping were also carried out on the Zinc Creek and Mariposite Ridge prospects. | | |
| | | | | | | |
1978 | | Pan Sound Joint Venture was dissolved | | | | Greens Creek Joint Venture formed in its place to accommodate the involvement of the Bristol Bay Native Corporation. |
| | | | | | | |
1978 | | Greens Creek Joint Venture | | Exploration drift was started; a total of 24 underground drill stations were established, from which 50 core holes were collared. Environmental baseline studies commenced. | | By November 1979, 4,190 ft (1,277 m) of drift and a 219 ft (67 m) raise had been completed. |
Hecla Mining Company | Greens Creek Mine, SLR Project No: 101.00632.00020
Technical Report Summary - February 21, 2022
Year | | Operator | | Work Completed | | Comment |
1980 | | | | 33 core holes were completed, and an Environmental Impact Assessment commissioned. | | The Alaska National Interest Land Conservation Act was passed, under which the Admiralty Island National Monument was created. The Greens Creek deposit and mineral tenure, although within the national monument zone, were excluded from the wilderness classification of the remainder of the national monument area. Section 504 of ANILCA allowed for exploration on previously located, unpatented claims that fell within three-quarters of a mile of Greens Creek, providing that exploration ceased in five years and any claims not “perfected” reverted to national monument status. |
| | | | | | | |
1981–1982 | | | | Metallurgical bulk sample. Surface core drilling (12 holes totaling 11,210 ft or 3,417 m) was conducted, with nine holes completed in the Big Sore area, two in Gallagher Creek, and one in Bruin Creek, on the north side of Greens Creek. Detailed geological mapping at a scale of one inch = 500 ft was conducted in the Greens Creek area. | | Development-support activities such as engineering and environmental studies. Mineral resource estimates updated. |
| | | | | | | |
1983 | | Anaconda purchased all of Martin-Marietta’s interest in the Greens Creek Joint Venture in March 1983 | | 17 holes drilled | | Feasibility study completed. |
| | | | | | | |
1984 | | At the end of the year, Anaconda and Noranda equally bought out Bristol Bay Native Corporation’s properties at Hawk Inlet for a cash payment and a 0.28% NSR royalty. The land would revert back to Bristol Bay Native Corporation upon termination of the Greens Creek Joint Venture. | | Surface drilling, mapping, trenching. Two bulk samples were mined, one of which was tested by Noranda, the second by Anaconda. | | |
| | | | | | | |
1985 | | | | 10 holes totaling 12,266 ft (3,739 m) were completed from surface, and 47 holes and 34,749 ft (10,591 m) of drilling from underground. | | A 10 year lease with a drill commitment and royalty payment obligation on production was signed with the owners of the nearby Mammoth claims. |
Hecla Mining Company | Greens Creek Mine, SLR Project No: 101.00632.00020
Technical Report Summary - February 21, 2022
Year | | Operator | | Work Completed | | Comment |
1986 | | Amselco (BP) become operator by buying out Anaconda and Noranda. Amselco sells portion to Hecla ; CSX acquires Texas Gas. | | Three surface holes, totaling 4,694 ft (1,431 m), and one underground exploration hole was drilled to 1,271 ft (387 m). Surface mapping and exploration at the Mammoth and Mariposite claim groups. Four EM and magnetic survey lines were flown. Mill and surface road construction begins. | | No magnetic anomalies were delineated but six electro-magnetic anomalies were co-incident with known soil geochemical anomalies in the Big Sore area. At the end of the year, the Greens Creek Joint Venture lost all rights to the Big Sore claims except for the eight core claims and the nine additional perfected claims. |
| | | | | | | |
1987 | | | | Structural mapping and interpretation. | | |
| | | | | | | |
1988–1989 | | | | Engineering and technical studies in support of mine development. | | |
| | | | | | | |
1989 | | Rio Tinto Zinc buys Kennecott from BP (Amselco) and becomes operator. | | Two surface holes were drilled in 1989, and underground exploration drilling conducted. | | Mill start-up occurred in February 1989. Surface holes tested for down-dip extensions of the North mineral zone. Underground drilling, also testing the North mineral zone, identified mineralization at a previously unrecognized horizon at a lower elevation than the North mineral zone. |
| | | | | | | |
1990 | | | | 10 holes totaling 23,287 ft (7.098 m) completed to validate claims to the west of the core claim group at Big Sore. | | Underground drilling program intersected three new mineral bodies: the Central West, the Northwest West, and the Southwest zones. No additional surface drilling subsequently took place until the passage of the Land Exchange Act in 1996. |
| | | | | | | |
1990–1993 | | | | Underground drilling was continued to define the West, Northwest-West and Southwest zones. | | Negotiations began on a new land-exchange proposal whereby private land in-holdings on Admiralty Island and other areas of the Tongass National Forest would be conveyed to the USFS in return for the subsurface mineral rights to 6,875 ac (2,782 ha) surrounding the core claims. Greens Creek received title to the 17 core claims and one mill site claim in 1992 after the USFS and BLM approved the final validity test in December. |
| | | | | | | |
1993 | | Exhalas share bought out by Kennecott/Hecla | | Underground drilling was continued to define the Southwest Ore Zone. | | Mine closure due to low metal prices. |
Hecla Mining Company | Greens Creek Mine, SLR Project No: 101.00632.00020
Technical Report Summary - February 21, 2022
Year | | Operator | | Work Completed | | Comment |
1994 | | CSX bought out; Greens Creek Joint Venture now Kennecott (70.27%), Hecla (29.73%) | | | | The land exchange agreement was with the USFS concluded. |
| | | | | | | |
1996 | | | | Updated feasibility study. Airborne EM, radiometric, and magnetometer surveys were completed during 1996–1997 to determine which might be more effective in surface exploration. Geological mapping. Underground definition drilling in the Northwest West and 5250 mineral zones. Underground and surface gravity surveys were completed. Two test lines over the West and Northwest West mineral zones were surveyed by the controlled source audio-magnetotelluric (CSAMT) method. A time-domain electromagnetic (TEM) survey was completed over eight lines and measured a strong response from the West Ore. Down-hole TEM surveys were completed on surface and underground holes. | | The land exchange agreement approved by Congress. A total of 745-line mi (1,200-line km) of surveys covered the entire Greens Creek area, including the land exchange parcel. Distinct magnetic anomalies corresponded with already mapped ultramafic bodies. The EM survey proved useful in identifying graphitic rocks, such as the Hyd argillite. A completely revised one inch = 1,000 ft scale district map and numerous one inch = 200 ft scale mine geologic maps were compiled during 1996 to 1997, and the prospective mine stratigraphy was traced to the south and north. Milling operations re-commence in July. |
| | | | | | | |
1997 | | | | Nine holes (7,755.5 ft or 2,364 m) were completed, targeting extensions to known mineralization at the North Ore Zone, the Upper Plate Extension of the Northwest West Ore Zone, and a possible north extension of the West Ore. Four diamond drill holes (6,316 ft or 1,925 m) were completed in 1997 at Big Sore with limited results. Soil sampling, gravity, magnetic and TEM geophysical surveying, and geologic mapping on cut grids. | | No high priority, near-surface coincident gravity and TEM anomalies (possible shallow massive-sulfide bodies) were identified. Soil sampling and geologic mapping outlined drill targets or areas for detailed follow up work in Bruin, Gallagher, and Lower Zinc Creek prospects. However, underground drilling identified the very high grade 200 South Zone. |
| | | | | | | |
1998 | | | | Four holes were drilled in Bruin Creek; grid extension and development, geochemical sampling, and geophysical surveys. | | One new grid (Upper Big Sore) and extensions of three 1997 grids (Lower Zinc, Bruin, and “A” Road) were geochemically sampled and geophysically surveyed. The work outlined numerous multi-element anomalies with coincident TEM anomalies; however, none were considered immediate drill targets. |
Hecla Mining Company | Greens Creek Mine, SLR Project No: 101.00632.00020
Technical Report Summary - February 21, 2022
Year | | Operator | | Work Completed | | Comment |
1999 | | | | Grid expansion, geochemical sampling, and geophysical surveys. Ten diamond drill holes were completed (12,715 ft or 3,875 m), seven at Bruin Creek and three at Killer Creek. | | Grid expansion continued at Killer Creek, Upper Zinc Creek and Cub prospects. Numerous high rank, multi-element soil anomalies were defined, and numerous sulfide-bearing outcrops and gossan zones were sampled and mapped. No mineralization was encountered in the Bruin Creek holes; the Killer Creek drilling intersected chalcopyrite and minor sphalerite mineralization. |
| | | | | | | |
2000 | | | | CSAMT geophysical survey; drilling | | A CSAMT geophysical survey was completed along three lines in Bruin and Cub Creek prospects in 2000. Three lines were also surveyed in Killer Creek area. In conjunction with soil survey results, the identified Bruin and Cub Creek anomalies were tested by six core holes, with limited results. Five holes were drilled in Killer Creek. Four moderately southwest-dipping zones with silver and zinc enrichment were outlined. |
| | | | | | | |
2004 | | | | Completed 41 surface holes from 17 sites totaling 47,034 ft (14,335 m). Detailed geological mapping by John Proffett continued in the Gallagher Creek area. Down-hole electro-magnetic (DH-UTEM) and natural source audio-magnetotelluric geophysical surveys were completed. | | Underground drilling identifies the Gallagher deposit. Four holes in Lower Gallagher Zone intersect sub-economic to economic grade mineralization. Upper Gallagher Zone drilling identified mineralization on west side of Gallagher Fault. Lower Zinc Creek drilling identified silica and massive pyrite at contact. |
| | | | | | | |
2005 | | | | Completed 35 surface drill holes from seven sites totaling 36,100 ft (11,003 m). Soil geochemistry grids completed at Cliff Creek, and grid extensions to Killer Creek, Cub Creek and Upper Gallagher prospects. Geological mapping along Killer Creek, Cliff Creek and Cub Creek prospects. Larger scale Magneto-Telluric (MT) survey in the Upper Gallagher Zone that targeted the West Gallagher contact. | | Intersection of mineralized intervals underground in Southwest West Bench (Middle Gallagher) and within East Ore. MT survey refines local geology and may extend West Gallagher horizons to the north, west, and south. Surface-based drilling identified mineralization at Lower Zinc Creek and Lil’ Sore. |
| | | | | | | |
2006 | | | | Completed 25 surface-based drill holes from six sites totaling 30,201 ft (9,205 m). Prospecting, geochemistry, and mapping grids extended at Cliff Creek, High Sore and Killer Creek. Mobile metal-ion (MMI) sampling tested at Killer Creek, West Bruin, and Lil’ Sore prospects. Detailed mapping at High Sore and Cliff Creek. | | Northern projection of West Bench mineralization intersected by underground excavations. Minor mineralized intersections at West Gallagher and Lower Zinc prospects located. Mine contact intersected at Bruin and Cub Creek prospects. Discovery of the 5250 North extension underground. |
Hecla Mining Company | Greens Creek Mine, SLR Project No: 101.00632.00020
Technical Report Summary - February 21, 2022
Year | | Operator | | Work Completed | | Comment |
2007 | | | | Surface drilling from seven sites totaling 28,920 ft (8,815 m) on Lower Zinc Creek, Cub Creek, West Gallagher and Lil’ Sore prospects. Mapping and geochemical sampling at Killer Creek and West Bruin prospects. CSAMT and AMT/MT geophysical surveys completed West Gallagher prospect. | | Definition of the Deep 200 South Zone at depth and the identification of the Northeast contact below the current mine infrastructure. Weak mineralization defined at Lower Zinc and Cub Creek prospects along mine contact. Claims near Young Bay staked. |
| | | | | | | |
2008 | | Hecla buys out the Kennecott interest in the Greens Creek Joint Venture, becomes 100% owner-operator | | Surface drilling from 7 sites totaling 20,649 ft (6,293 m) on North Big Sore, East Ridge, Cub (northwest contact) prospects, and East Ore Zone. LiDAR surveys, geological mapping and geochemical sampling initiated on newly staked Young Bay ground. | | Deep 200 South Zone drilling defines two distinct zone or fold limbs and 5250 Zone extended to the south. Southern extension to East Ore Zone mineralization intersected from surface. Detailed mapping defined mine contact at Lower Zinc and Killer Creek prospects. |
| | | | | | | |
2009 | | | | 20 drill holes from surface totaled 18,064 ft (5,506 m) on East Ore Zone and West Gallagher, Bruin, and Northeast contact (Cub) prospects. Detailed mapping Bruin along projected northeast contact. Reconnaissance mapping and geochemical sampling at Young Bay claims. | | Intersections of mineralization at south extent of East Ore Zone. Disseminated sulfides defined with drilling at Bruin and Cub prospects along projection of Northeast contact. |
| | | | | | | |
2010 | | | | Surface drilling of 17 holes totaling 21,217 ft (6,467 m) at Northeast contact (Cub and Bruin), East Ridge and Killer Creek prospects. Geochemical and MMI survey in the North Young Bay area. Compilation of historic geophysical data. | | Expansion of the Deep 200 South, Northwest West and 5250 zone Mineral Resources. Mapping and drilling extend the Northeast contact to the northeast of the mine infrastructure. Weak mineralization along mine contact identified by drilling at East Ridge and Killer Gossan prospects. |
| | | | | | | |
2011 | | | | Completed 14 surface holes totaling 27,384 ft (8,346 m) at Northeast contact, West Bruin, and East Ore. 3D inversion analysis on portion of historic Aerodat airborne geophysical data. Surface and borehole Pulse EM surveys used to define targets. Reconnaissance mapping and geochemical sampling in North Young Bay area. Detailed mapping in Keller Creek area. | | Continued expansion of the Deep 200 South, East Ore and 5250 Mineral Resources. Surface drilling continues to define the Northeast contact beyond Bruin and Cub prospects. Pulse EM identified conductor in sufficient detail to conduct drilling at Killer Creek and West Gallagher prospects. |
Hecla Mining Company | Greens Creek Mine, SLR Project No: 101.00632.00020
Technical Report Summary - February 21, 2022
Year | | Operator | | Work Completed | | Comment |
2012 | | | | Completed eight surface holes totaling 17,710 ft (5,398 m) at Killer Creek, West Gallagher, West Bruin prospects and East Ore Zone. Reconnaissance and detailed mapping and geochemical sampling in North Young Bay area. Detailed mapping of Killer Creek area. | | Strong mineralization intersected underground at Deep 200 South, Southwest Bench, and Northwest West zones. Surface drilling at Killer Creek identified a broad copper-rich vein zone which may represent a new mineralizing vent area. Drilling to the southeast identified zinc-rich zones near the mine contact. |
| | | | | | | |
2013 | | | | Ten surface drill holes totaling 28,746 ft (8,762 m) at the Killer Creek target. Reconnaissance mapping of the anomalous Zinc Creek area and detailed structural mapping of Mariposite ridge. | | Two silicified copper and zinc-rich zones were encountered near surface in the Killer Creek area. These broad zones likely represent a shallow feeder zone. |
| | | | | | | |
2014 | | | | Six surface drill holes totaling 23,214 ft (7,076 m) in the Killer Creek target area. Reconnaissance mapping of the Killer-Lakes district area and detailed structural mapping of the Killer Creek – Mammoth areas. One downhole EM survey was conducted in Killer Creek to define mineralization and ‘mine contact’ in the area. | | A deep mine argillite contact was encountered with weak mineralization. The upper portions of drill holes in Killer Creek target continued to define shallow copper and zinc-rich zones. |
| | | | | | | |
2015 | | | | Four surface drill holes totaling 8,085 ft (2,464 m) were completed in the Lower Killer Creek and High Sore target areas. Mapping of the High Sore and Big Sore areas with a focus on local s2.5 shears. Physical property data (density), Magnetic Susceptibility and conductivity measurements were taken in every. | | The Big Sore syncline was tested in Lower Killer Creek by a single drill hole between the Gallagher and Maki Faults. Though weak mineralization was encountered at the High Sore target, several s2.5 shears were encountered east of known locations. |
| | | | | | | |
2016 | | | | Two surface drill holes totaling 3,074 ft (937 m) were completed in Big Sore Creek targeting potential offset mineralization. Reconnaissance mapping of the Big Sore Creek and East of the Mammoth claims was completed. | | Anomalous zinc mineralization in hanging wall argillite indicated that the ‘mine contact’ hosting Greens Creek mineralization was likely eroded away above Big Sore Creek. A barren Northeast contact was also encountered in each drill hole. |
| | | | | | | |
2017 | | | | Nine drill holes totaling 20,419 ft (6,224 m) were completed in the West Gallagher, Upper Gallagher, and Big Sore prospects. Mapping was completed in the Lower Zinc Creek area with a focus on mapping shear zones. | | Five drill holes west of the Gallagher Fault encountered bench mineralization in shear zones. Broad zinc mineralization was encountered at the ‘Bench’ Contact west of known Mineral Resources and east of the Gallagher Fault. Drilling south of the mine in Upper Gallagher encountered a weakly mineralized mine contact. |
Hecla Mining Company | Greens Creek Mine, SLR Project No: 101.00632.00020
Technical Report Summary - February 21, 2022
Year | | Operator | | Work Completed | | Comment |
2018 | | | | Fifteen drill holes totaling 20,941 ft (6,383 m) were completed in the West Gallagher and Lower Gallagher Areas targeting Southwest Bench – 200S Bench and the Upper Plate Zone respectively. Detailed mapping was completed in the Upper Gallagher and Mammoth ridge areas. | | Upper Plate ore grade mineralization was extended 150 ft west of known Mineral Resource. Four drill holes further defined western extensions of ‘Bench’ mineralization east of the Gallagher Fault and west of known Mineral Resources. |
| | | | | | | |
2019 | | | | Ten drill holes totaling 11,578 ft (3,529 m) were completed in the 200S, Southwest, and East Zones. | | Ten drill holes targeting the 200s deposit extended the upper and lower benches by approximately 400 ft (122 m) and 800 ft (244 m) down plunge, respectively. |
| | | | | | | |
2020 | | | | Nine drill holes totaling 5,603 ft (2,927 m) were completed in the 200S zone. | | Nine drill holes targeting the 200S deposit infilled a gap in exploration drilling and established continuity within the upper and lower benches. |
| | | | | | | |
2021 | | | | Seven surface exploration drill holes targeted the Lil’Sore Trend, and three targeted the 5250 Trend for a total of 22,484 ft of surface exploration drilling. Three underground exploration drill holes targeted the Gallagher Trend, four targeted the Gallagher Fault Block, five targeted the 200S zone, and two targeted the West zone, for a total of 16,324 ft of underground exploration drilling. | | Surface exploration intersected Zn rich base metal rich mineralization within the Lil’Sore Trend. Underground exploration continued to extend the 200S mineralization down plunge. |
Hecla Mining Company | Greens Creek Mine, SLR Project No: 101.00632.00020
Technical Report Summary - February 21, 2022
Figure 5‑1: Plan Map of Exploration Target Areas, with Land Exchange and Claims
Hecla Mining Company | Greens Creek Mine, SLR Project No: 101.00632.00020
Technical Report Summary - February 21, 2022
5.3 | Mineral Reserve History |
Greens Creek replaced or added Mineral Reserves from 1997 until 2001, both by new discoveries and by upgrading Mineral Resource models. In 1998, discovery and development of the 200S Zone and a change in classification of the 5250 Zone accounted for a significant increase in Mineral Reserves.
In 1999, there were more positive changes in these zones and in the Southwest Zone. In 2000, the West Zone Mineral Reserve increased substantially, but in 2001 and 2002, re-evaluation of the model and decreasing metal prices more than erased the 2000 gain.
After a notable decrease in 2001 due to metal prices, the Greens Creek Mineral Reserve tonnage was maintained at a consistent level of 7.0 Mst to 8.5 Mst between 2001 to 2017, until experiencing a large increase with the 2018 end of year update due to the addition of the Gallagher and Upper Plate zones and improved Mineral Resource models which enabled the addition of significant remnant material that was left behind by previous mining.
Mineral Reserve grades for precious metals have remained stable over the past ten years while grades for base metals have decreased steadily. Table 5‑2 shows the Greens Creek Mineral Reserve history from 1997 to 2021.
Table 5‑2: Greens Creek Mineral Reserve History - 1997 to 2021
Hecla Mining Company – Greens Creek Mine
Year | Ore
(Mst) | Grade | Contained Metal |
| | | (oz/ton Au) | (oz/ton Ag) | (% Pb) | (% Zn) | (000 oz Au) | (Moz Ag) | (000 ton Pb) | (000 ton Zn) |
1997 | 8.39 | 0.15 | 18.6 | 4.5 | 12.7 | 1,242 | 156 | 377 | 1,068 |
1998 | 9.76 | 0.14 | 15.4 | 4.5 | 12.3 | 1,385 | 150 | 440 | 1,202 |
1999 | 10.02 | 0.14 | 16.2 | 4.5 | 11.9 | 1,357 | 163 | 448 | 1,193 |
2000 | 10.01 | 0.13 | 15.7 | 4.4 | 11.9 | 1,335 | 157 | 442 | 1,190 |
2001 | 7.59 | 0.13 | 16.7 | 4.6 | 11.6 | 1,007 | 127 | 347 | 883 |
2002 | 7.05 | 0.13 | 14.9 | 4.2 | 11.4 | 903 | 105 | 298 | 801 |
2003 | 7.49 | 0.12 | 14.1 | 4.0 | 10.7 | 863 | 106 | 301 | 798 |
2004 | 7.93 | 0.11 | 14.1 | 3.9 | 10.2 | 880 | 112 | 313 | 809 |
2005 | 7.48 | 0.12 | 14.5 | 3.9 | 10.2 | 864 | 108 | 291 | 766 |
2006 | 7.68 | 0.11 | 14.4 | 4.0 | 10.4 | 865 | 111 | 306 | 798 |
2007 | 8.45 | 0.11 | 13.7 | 3.8 | 10.2 | 908 | 116 | 321 | 861 |
2008 | 8.07 | 0.11 | 13.7 | 3.8 | 10.5 | 870 | 111 | 309 | 851 |
2009 | 8.32 | 0.10 | 12.1 | 3.6 | 10.3 | 847 | 101 | 303 | 853 |
2010 | 8.24 | 0.09 | 12.1 | 3.5 | 9.3 | 757 | 100 | 291 | 767 |
2011 | 7.99 | 0.09 | 12.3 | 3.5 | 9.2 | 742 | 98 | 282 | 733 |
2012 | 7.86 | 0.09 | 12.0 | 3.4 | 9.0 | 721 | 95 | 267 | 704 |
2013 | 7.80 | 0.09 | 11.9 | 3.3 | 8.7 | 713 | 93 | 256 | 678 |
Hecla Mining Company | Greens Creek Mine, SLR Project No: 101.00632.00020
Technical Report Summary - February 21, 2022
Year | Ore
(Mst) | Grade | Contained Metal |
| | | (oz/ton Au) | (oz/ton Ag) | (% Pb) | (% Zn) | (000 oz Au) | (Moz Ag) | (000 ton Pb) | (000 ton Zn) |
2014 | 7.70 | 0.10 | 12.2 | 3.1 | 8.3 | 739 | 94 | 241 | 640 |
2015 | 7.21 | 0.09 | 12.3 | 3.0 | 8.1 | 677 | 89 | 218 | 583 |
2016 | 7.59 | 0.09 | 11.7 | 2.9 | 7.6 | 673 | 89 | 217 | 576 |
2017 | 7.55 | 0.10 | 11.9 | 3.0 | 8.1 | 725 | 90 | 225 | 615 |
2018 | 9.28 | 0.09 | 11.5 | 2.8 | 7.6 | 840 | 107 | 263 | 706 |
2019 | 10.72 | 0.09 | 12.2 | 2.8 | 7.3 | 932 | 131 | 305 | 778 |
2020 | 8.98 | 0.09 | 12.4 | 2.8 | 7.3 | 828 | 11 | 255 | 652 |
2021 | 11.08 | 0.09 | 11.3 | 2.6 | 6.6 | 946 | 125 | 282 | 726 |
A detailed summary of mine production from 1989 to 2020 is summarized in Table 5‑3. An overall life of mine (LOM) production summary is included in Table 5‑4.
Hecla Mining Company | Greens Creek Mine, SLR Project No: 101.00632.00020
Technical Report Summary - February 21, 2022
Table 5‑3: Production History, 1989 to 2020
Hecla Mining Company – Greens Creek Mine
Year | Tons
Milled | Head Grade | Recovery | Contained Metal in Feed |
| | (ton) | (% Zn) | (% Pb) | (oz/ton Ag) | (oz/ton Au) | (% Zn) | (% Pb) | (% Ag) | (% Au) | (000 ton Zn) | (000 ton Pb) | (Moz Ag) | (000 oz Au) |
1989 | 264,672 | 8.71 | 4.39 | 24.22 | 0.139 | 84 | 77.6 | 80.6 | 63.9 | 23.1 | 11.6 | 6.4 | 36.8 |
1990 | 382,574 | 10.43 | 4.89 | 23.04 | 0.12 | 89.1 | 82.9 | 86.6 | 83.3 | 39.9 | 18.7 | 8.8 | 45.7 |
1991 | 427,942 | 11.05 | 4.65 | 22 | 0.116 | 85.3 | 76.3 | 80.6 | 73.9 | 47.3 | 19.9 | 9.4 | 49.5 |
1992 | 439,828 | 10.82 | 4.66 | 20.78 | 0.113 | 80.2 | 71.4 | 76.3 | 65.1 | 47.6 | 20.5 | 9.1 | 49.8 |
1993 | 119,772 | 11.3 | 4.58 | 20.7 | 0.131 | 86.1 | 75.2 | 79.1 | 64.1 | 13.5 | 5.5 | 2.5 | 15.7 |
1994 | 0 | 0 | 0 | 0 | 0 | 0 | 0 | 0 | 0 | 0 | 0 | 0 | 0 |
1995 | 0 | 0 | 0 | 0 | 0 | 0 | 0 | 0 | 0 | 0 | 0 | 0 | 0 |
1996 | 143,737 | 9.98 | 4.85 | 23.81 | 0.108 | 80.1 | 72.9 | 80.8 | 66.4 | 14.3 | 7 | 3.4 | 15.5 |
1997 | 489,854 | 10.47 | 4.79 | 25.68 | 0.177 | 80 | 74.8 | 77.3 | 64.3 | 51.3 | 23.5 | 12.6 | 86.8 |
1998 | 540,028 | 11.93 | 5.13 | 22.74 | 0.17 | 84.1 | 75.8 | 77.3 | 65.9 | 64.5 | 27.7 | 12.3 | 91.9 |
1999 | 578,298 | 13.47 | 5.66 | 23.64 | 0.212 | 80.6 | 70.3 | 75.9 | 65.7 | 77.9 | 32.7 | 13.7 | 122.7 |
2000 | 619,438 | 13.57 | 5.28 | 20.06 | 0.208 | 79.6 | 68.1 | 74.3 | 64.8 | 84.1 | 32.7 | 12.4 | 128.7 |
2001 | 658,008 | 12.12 | 4.75 | 21.76 | 0.194 | 80.1 | 71.7 | 76.6 | 68.6 | 79.7 | 31.2 | 14.3 | 127.7 |
2002 | 733,431 | 12.52 | 4.73 | 19.73 | 0.203 | 79.9 | 70.9 | 75.4 | 68.9 | 91.9 | 34.7 | 14.5 | 149 |
2003 | 781,275 | 12.29 | 4.6 | 19.69 | 0.187 | 79.3 | 69.1 | 76.1 | 68 | 96 | 35.9 | 15.4 | 146.2 |
2004 | 805,353 | 11.14 | 4.05 | 16.65 | 0.163 | 77.1 | 67.1 | 72.4 | 65.5 | 89.7 | 32.6 | 13.4 | 131.6 |
2005 | 717,564 | 10.34 | 3.98 | 18.17 | 0.149 | 78.6 | 65.1 | 74.1 | 67.9 | 74.2 | 28.6 | 13 | 107.1 |
2006 | 732,100 | 9.36 | 3.66 | 15.78 | 0.13 | 76.5 | 69.5 | 76.8 | 66.2 | 68.5 | 26.8 | 11.6 | 95 |
2007 | 732,150 | 9.67 | 3.66 | 15.45 | 0.137 | 79.1 | 70 | 76.4 | 68 | 70.8 | 26.8 | 11.3 | 100.1 |
Hecla Mining Company | Greens Creek Mine, SLR Project No: 101.00632.00020
Technical Report Summary - February 21, 2022
Year | Tons
Milled | Head Grade | Recovery | Contained Metal in Feed |
| | (ton) | (% Zn) | (% Pb) | (oz/ton Ag) | (oz/ton Au) | (% Zn) | (% Pb) | (% Ag) | (% Au) | (000 ton Zn) | (000 ton Pb) | (Moz Ag) | (000 oz Au) |
2008 | 734,907 | 10.09 | 3.58 | 13.38 | 0.142 | 78.5 | 70.5 | 72.7 | 64.5 | 74.2 | 26.3 | 9.8 | 104.7 |
2009 | 790,871 | 10.13 | 3.64 | 13.01 | 0.133 | 79.1 | 68.5 | 72.5 | 63.8 | 80.1 | 28.8 | 10.3 | 105.5 |
2010 | 800,397 | 10.66 | 4.09 | 12.3 | 0.134 | 78.1 | 68 | 73.2 | 64.3 | 85.3 | 32.8 | 9.8 | 107.1 |
2011 | 772,068 | 9.81 | 3.52 | 11.49 | 0.118 | 78.8 | 68.1 | 73.2 | 62.3 | 75.7 | 27.2 | 8.9 | 91.2 |
2012 | 789,569 | 9.35 | 3.49 | 11.13 | 0.115 | 77.7 | 67.8 | 72.8 | 61 | 73.8 | 27.5 | 8.8 | 91 |
2013 | 805,322 | 8.47 | 3.33 | 13.04 | 0.118 | 74.1 | 67.6 | 70.9 | 60.6 | 68.2 | 26.8 | 10.5 | 94.9 |
2014 | 816,213 | 8.38 | 3.22 | 13.24 | 0.115 | 75.9 | 69.3 | 72.4 | 62.5 | 68.4 | 26.3 | 10.8 | 93.9 |
2015 | 814,398 | 8.74 | 3.3 | 13.5 | 0.111 | 75.1 | 73.3 | 76.9 | 67 | 71.2 | 26.9 | 11 | 90.5 |
2016 | 815,639 | 8.08 | 3.11 | 14.55 | 0.097 | 75 | 74.7 | 78 | 68.2 | 65.9 | 25.4 | 11.9 | 79.1 |
2017 | 839,589 | 7.25 | 2.72 | 12.88 | 0.093 | 74.6 | 72.7 | 77.2 | 65 | 60.9 | 22.9 | 10.8 | 78.2 |
2018 | 845,398 | 7.47 | 2.8 | 12.16 | 0.094 | 87.7 | 80.1 | 77.4 | 65.1 | 63.1 | 23.7 | 10.3 | 79.1 |
2019 | 846,076 | 7.43 | 2.92 | 14.64 | 0.096 | 90.3 | 81.5 | 79.8 | 69.5 | 62.9 | 24.7 | 12.4 | 81.5 |
2020 | 818,408 | 7.58 | 3.13 | 15.65 | 0.082 | 91.6 | 83.5 | 81.9 | 72.6 | 62 | 25.6 | 12.8 | 66.8 |
Notes:
| | 1. | Zinc recovery: to Zn concentrate, precious metals (PM) concentrate (Pb concentrate in 2018 only) |
| | 2. | Lead recovery: to Pb concentrate, PM concentrate (Zn concentrate in 2018 only) |
| | 3. | Silver recovery: to doré, Pb concentrate, Zn concentrate, PM concentrate |
| | 4. | Gold recovery: to doré, Pb concentrate, Zn concentrate, PM concentrate |
| | 5. | In 2018, zinc in the lead concentrate and lead in the zinc concentrate became payable, so they are included in the 2018 recovery percentages |
Hecla Mining Company | Greens Creek Mine, SLR Project No: 101.00632.00020
Technical Report Summary - February 21, 2022
Table 5‑4: Life of Mine Production 1989 to 2020
Hecla Mining Company – Greens Creek Mine
Items | Units | Production |
Tons milled | ton | 19,654,879 |
Head Grade |
Zinc | % Zn | 9.90 |
Lead | % Pb | 3.87 |
Silver | oz/ton Ag | 16.39 |
Gold | oz/ton Au | 0.140 |
Metal in Feed |
Zinc | 000 ton Zn | 1,946 |
Lead | 000 ton Pb | 761 |
Silver | Moz Ag | 322 |
Gold | 000 oz Au | 2,663 |
Metal Recovered |
Zinc | 000 ton Zn | 1,556 |
Lead | 000 ton Pb | 547 |
Silver | Moz Ag | 246 |
Gold | 000 oz Au | 1,765 |
Hecla Mining Company | Greens Creek Mine, SLR Project No: 101.00632.00020
Technical Report Summary - February 21, 2022
6.0 | GEOLOGICAL SETTING, MINERALIZATION, AND DEPOSIT |
Regional geological interpretations are largely based on work completed by the United States Geological Survey (USGS). USGS Professional Paper 1763 (Taylor and Johnson, 2010) and subsequent work by the USGS (Wilson et.al, 2015 and Karl and Wilson, 2016) best summarize the regional geology surrounding the Greens Creek deposit.
Greens Creek lies within the Alexander Triassic Metallogenic Belt which lies unconformably on Late Proterozoic to Permian aged strata of the Alexander Terrane. The tectono-stratigraphic map of Figure 6‑1 shows these units as they now exist against the North American continent and where other deposits similar in type to Greens Creek have been discovered.
Amalgamation of the Alexander and Wrangellia terranes by Permian time resulted in sub-aerial exposure of the region and the formation of an erosional unconformity. The unconformity appears to have variably removed Devonian to Permian units from the Alexander terrane in the vicinity of the Greens Creek claim block.
Post-amalgamation of the Alexander and Wrangellia terranes, late Triassic rifting developed a restricted basin on the east side of the composite terrane as evidenced by the Hyd Group marine sediments and flood basalts of Carnian and Norian ages. The Greens Creek deposit is hosted within the Hyde marine sediments (Tr hgs) of Carnian to Norian age immediately below the Hyd basalts (Tr hgv) as shown in Figure 6‑2 (Karl and Wilson, 2016).
Beginning in the middle Jurassic and continuing through the Mid-Cretaceous, compressional tectonism attended the suturing of the Alexander/Wrangellia superterrane to continental North America. Crustal thickening during the Mid-Cretaceous collision resulted in intense fold and thrust style structural deformation. Toward the end of the Cretaceous compressional tectonism waned as tectonic plates along the coast of North America began to move in a dextral fashion which motion continues to the present.
Brittle dextral movement in the Tertiary affected the entire accreted coast of North America. The Chatham Strait Fault is one of many north-northwest striking faults of this brittle faulting which has caused significant strike-slip dislocation across the superterrane (Figure 6‑1 and Figure 6‑2). Two such Tertiary faults run through the Greens Creek deposit. The Maki Fault and Gallagher Fault have dextral offsets of approximately 1,800 ft (549 m) and 2,750 ft (838 m), respectively. The faults generally dip steeply to the west and have reverse movement (west side up) of approximately 110 ft (33 m) and 650 ft (198 m), respectively. Taylor and Johnson (2010) place Greens Creek into a series of deposits and prospects that they term the Alexander Triassic Metallogenic Belt (Figure 6‑1). The belt is located along the eastern margin of the Alexander terrane throughout southeastern Alaska and northwestern British Columbia and exhibits a range of characteristics consistent with a single rift basin deepening to the north. Occurrences included in this group include Windy Craggy, Mt. Henry Clay, Greens Creek, Glacier Creek, Pyrola, and Yellow Bear Mountain among others.
Hecla Mining Company | Greens Creek Mine, SLR Project No: 101.00632.00020
Technical Report Summary - February 21, 2022
Source: Steeves (2018), modified from Taylor (2008) and Campbell and Dodds (1983)
Figure 6‑1: Regional Tectono-Stratigraphic Map
Hecla Mining Company | Greens Creek Mine, SLR Project No: 101.00632.00020
Technical Report Summary - February 21, 2022
Source: Karl and Wilson (2016)
Figure 6‑2: Geologic Map of Admiralty Island
Hecla Mining Company | Greens Creek Mine, SLR Project No: 101.00632.00020
Technical Report Summary - February 21, 2022
Extensive surface mapping on the Greens Creek claim block has allowed a detailed bedrock map to be produced for the project area. USGS units were not typically used in mapping lithologies, but Figure 6‑3 provides mapped lithologies according to USGS defined units. Table 6‑1 equates the surface mapping geologic units of Figure 6‑3 to lithologies utilized in underground mapping and core drilling. A stratigraphic column showing the position of the Greens Creek mineralization relative to the regional geological setting is provided in Figure 6‑4.
Table 6‑1: Correlation of USGS Units to Greens Creek Mine Lithologic Units
Hecla Mining Company – Greens Creek Mine
USGS Unit/ GC
Surface Mapping Unit | Explanation | GC Underground Mine
Geology Units |
Dg-gr | Gambier Bay Formation graphitic schist | not present |
Dg-gst | Gambier Bay Formation greenstone | not present |
Dg-sp | Gambier Bay Formation altered greenstone | not present |
Dgf | Gambier Bay Formation felsic intrusive | not present |
Dgm | Gambier Bay Formation marble | not present |
Dsc | Hawk Inlet cherts | not present |
KHsc | Seymour Canal Formation | not present |
PDc | Cannery Formation | not present |
Pzcs-gr | Lake Kathleen Unit graphitic schist | SPgr |
PZcs-gst | Lake Kathleen Unit greenstone | GST |
Pzcs-sp | Lake Kathleen Unit altered greenstone | SP, SPc |
Pzgs-gst | Piledriver Unit greenstone | GST |
Pzgs-um | Piledriver Unit ultramafic | SC |
Tr_h-gn | Hyde Group gabbro gneiss | GB |
Tr_hgs-ls | Hyde Group limestone | MB |
Tr_hgs-x | Hyde Group basal conglomerate | SPcx |
Tr_hs-arg | Hyde Group argillite | SA, MA, CHT |
Tr_hs-exh | Hyde Group mineralized horizon exhalites | MFB, MFP, WBA, WCA, WSI |
Tr_hs-xu | Hyde Group undifferentiated conglomerate | SPcx |
Tr_hv-gst | Hyde Group basaltic greenstone | CR, GST |
Tr_hv-rhy | Hyde Group rhyolite/dacite | RHY |
Tr_hv-sp | Hyde Group basaltic greenstone – altered | SP, SPs |
Hecla Mining Company | Greens Creek Mine, SLR Project No: 101.00632.00020
Technical Report Summary - February 21, 2022
Figure 6‑3: Geologic Map of the Greens Creek Claim Area
Hecla Mining Company | Greens Creek Mine, SLR Project No: 101.00632.00020
Technical Report Summary - February 21, 2022
Figure 6‑4: Chronostratigraphy of the Greens Creek Area
Hecla Mining Company | Greens Creek Mine, SLR Project No: 101.00632.00020
Technical Report Summary - February 21, 2022
While the regionally mapped units are mostly present at Greens Creek, some are absent, and others have been subdivided according to mine scale mapping and logging of drill holes. The Greens Creek mineralization is conformable to the contact between the Alexander Terrane Paleozoic-aged rocks and the late Triassic-aged Hyd Group. As the mineral zones are located at this unconformable contact the local lithologies are discussed according to footwall, mineralized horizon and hanging wall groups. Some dikes and sills cross-cut the Paleozoic units, Triassic units, and in rare situations cut the mineralized bodies.
6.2.2.1 | Footwall Lithologies |
The Admiralty subterrane makes up the stratigraphic footwall to the Greens Creek mineral deposit. The subterrane is variable in composition and spans Ediacarian through Permian time. North of the mine, but still on the claim block, Devonian aged metavolcanics, cherts and graphitic sediments have been mapped. East and south of the mine, younger Permian marine sediments have been mapped. This apparent younging of the Admiralty subterrane from the northwest to the southeast may be explained by some combination of the erosional unconformity immediately above the Permian boundary, which may be an angular unconformity and tectonic exhumation of deeper units on the northern end of the subterrane.
The erosional unconformity is marked by a polymictic conglomerate composed entirely of footwall lithologies. This conglomerate is found extensively within the Alexander terrane and is common below the Hyd Group metasediments. It is variably present in the mine area with thickness varying up to tens of feet. The conglomerate is hypothesized to have formed as debris flows over the basin bounding faults which formed the Triassic basin.
In the immediate mine area and directly below the polymictic conglomerate, the footwall is composed of Mississippian aged metavolcanics (Sack, 2016). These metavolcanics dominate footwall lithologies within a couple miles of the mineral deposit though some gabbroic intrusions and graphitic sedimentary units are present. The metavolcanics are further distinguished into the following mine units by mine geologists:
| | ● | Greenstone (GST) – a massive greenstone with pervasive foliation formed by chlorite and weak segregation of quartz into banding. |
| | ● | Marble (MB) – though very rare in the immediate mine area this gray, coarse-grained dolomitic marble is present in the claim block. |
| | ● | Graphitic phyllite (SPgr) – a well foliated carbonaceous quartz mica schist. |
| | ● | Chloritic phyllite (SPc) – a well foliated and banded quartz chlorite muscovite schist. |
| | ● | Sericitic phyllite (SPsr) – a well foliated and sericitically altered unit likely derived from the greenstone, graphitic phyllite and chloritic phyllite units. |
Siliceous phyllite (SPs) – a dark grey quartz rich phyllite found proximal to the mineral bodies. This unit is likely derived from the other phyllite units by hydrothermal alteration related to mineral deposit formation.
| | ● | Altered ultramafic (AUM) – a fuchsite bearing quartz carbonate chlorite muscovite schist. |
| | ● | Serpentinite (SC) – massive to talc altered serpentinite likely cross-cutting the mafic metavolcanics but clearly metamorphosed during the Cretaceous collision. This unit has not been radiometrically dated and is debated by some to cut the Triassic Hyd Group. Mapping and logging of core at the mine indicates the unit is pre-Hyd Group. |
Hecla Mining Company | Greens Creek Mine, SLR Project No: 101.00632.00020
Technical Report Summary - February 21, 2022
| | ● | Polymictic conglomerate (SPcx) – a highly strained sub-rounded to angular breccia/conglomerate that is found at the erosional unconformity between the footwall Mississippian age metavolcanics units and the overlying Hyd Group. Other polymictic conglomerates appear within the Hyde Group above the erosional unconformity but these have zircons dominated by Triassic ages, not Mississippian as in the basal conglomerate. |
The relative age relationships are, from youngest to oldest, polymictic conglomerate, serpentinite, and all other units undifferentiated.
6.2.2.2 | Hanging Wall Lithologies |
The hanging wall of the mineral deposit, which is located immediately above the basal polymictic conglomerate, is entirely composed of the Hyd Group. In the immediate mine area, the mine geologists break the unit into the following lithologies:
| | ● | Massive Argillite (MA) – dolomitic argillite typically found close to the base of the Hyd Group. Beds tend to be one inch to 10 in. (2.5 cm to 25 cm) thick and have quartz-carbonate ladder veining normal to bedding due to post-depositional folding. Conodont samples have provided a Carnian-Norian age of 220 Ma. |
| | ● | Slatey Argillite (SA) – finely laminated siliciclastic carbonaceous argillite, often with thin sulfide banding. Often grades into a phyllite where post-depositional deformation has strained the unit. |
| | ● | Gabbroic sills (GB), basalts (BSLT) and a thin rhyolite (RHY) occur up in the Hyd Group section, structurally and/or stratigraphically over the mineral deposits. These volcanic bodies also cross the Paleozoic footwall units but are not generally recognized in the immediate mine area due to intense alteration and deformation. |
| | ● | Relative ages of the hanging wall units from youngest to oldest are basalt, then argillite, rhyolite and gabbroic sills intermixed and finally massive argillite at the base. Some researchers put the polymictic conglomerate at the base of the Hyd group, but the conglomerate appears to be devoid of any Hyd group lithologies, at least in the immediate mine area. |
An early and poorly preserved S1 metamorphic segregation foliation is present in the footwall lithologies. As such it is likely pre-Triassic and may have developed as a result of the amalgamation of Alexandria and Wrangellia in the Permian.
Intense mountain building throughout the Cretaceous resulted in D2 thrusting and penetrative S2 foliation in muscovite-rich lithologies. In the hanging wall argillite, the S2 foliation is less apparent though F2 folding is well preserved. The F2 folds in the argillite are generally non-cylindrical, isoclinal and often recumbent. The shallow dipping “benches” of mineralization developed across the mineral deposit are pronounced recumbent F2 folds with amplitudes up to 1,000 ft.
Following D2, the mine area was subjected to protracted D3 transpression which created open to isoclinal upright folding and north-northwest striking shear zones.
Several post-D2 ductile shears have been mapped across the claim block which are nearly age equivalent to the upright D3 shears and have been assigned to a D2.5 event in the literature. These D2.5 shears have C-S fabrics indicating top to the west-northwest movement. The two prominent D2.5 shears mapped in the mine area are the Upper Shear and the Klaus Shear. The cross-cutting relationship between D3 and D2.5 shears have not been observed directly though regional mapping of a D2.5 shear appeared to fold up into a D3 shear.
Hecla Mining Company | Greens Creek Mine, SLR Project No: 101.00632.00020
Technical Report Summary - February 21, 2022
A pronounced S3 crenulation cleavage is present as thin 0.05 in. to 0.125 in. bands cutting S2 foliation. The cleavage bands are spaced one inch to 10 in. apart where present and are nearly axial planar to the F3 folds they helped create. These cylindrical folds are generally of low amplitude, typically less than 20 ft, but can be more than 100 ft in amplitude, significantly deforming the deposit.
A weak D4 folding event affected the mine area. The folds are open and of very low amplitude to wavelength ratio with amplitudes rarely exceeding several feet. These folds do not appreciably deform the mineralization. Figure 6‑5 illustrates the superposition of folding present within the mine area.
Mid- to late-Tertiary dextral transform faulting caused brittle D5 faults such as the Maki Fault system, which cuts through the immediate Greens Creek area. The similar orientations of D3-ductile and D5-brittle structures indicate that the D3 structural grain was utilized in D5. The Maki Fault zone has approximately 1,800 ft (550 m) of right-lateral and 110 ft (33 m) of reverse, west side up, offset. The Maki Fault zone is a zone of parallel fault splays with particularly intense faulting concentrated along the bounding structures, the Maki fault on the east and the Kahuna Fault on the west. The zone is 350 ft wide at the southern end of the deposit but narrows to less than 25 ft wide at the northern end of the deposit. Significantly, the Maki Fault zone truncates mineralization and hosts the 9a ore zone, which is composed of entrained blocks of mineralization. The other significant D5 fault in the mine area is the Gallagher Fault with 2,750 ft (840 m) of right-lateral and 650 ft (200 m) of reverse, west side up, offset.
Hecla Mining Company | Greens Creek Mine, SLR Project No: 101.00632.00020
Technical Report Summary - February 21, 2022
Source: Proffett, 2010
Figure 6‑5: Fold and Shear Relationships at Greens Creek
Hecla Mining Company | Greens Creek Mine, SLR Project No: 101.00632.00020
Technical Report Summary - February 21, 2022
6.3 | Geology of Mineralization |
6.3.1 | Locations and Relationships |
The Greens Creek sulfide mineralization is localized on the Mississippian/Late Triassic contact marked by the Hyd basal conglomerate. This erosional unconformity is referred to as the “mine contact” by the mine geologists. Though mineralization and significant alteration extend into the footwall mafic rocks and though some lenses of mineralization occur in the overlying argillites, the bulk of mineable material is located immediate to the mine contact.
The mine contact is variably mineralized over the claim block and nearly continuously mineralized in the mine area. Three main trends of mineralization have been traced along the mine contact with multiple centers of mineralization along those trends. Though the trends are folded with the mine contact the general mineralization trends strike 160° and plunge 20° to the south. Figure 6‑6 displays the mineralized wireframes of each mineral zone of the Greens Creek Mineral Resource and Mineral Reserve with the faults that displace them. Figure 6‑7 shows a section through the mineralized zones with major fault offsets.
Hecla Mining Company | Greens Creek Mine, SLR Project No: 101.00632.00020
Technical Report Summary - February 21, 2022
Figure 6‑6: Plan View of the Mineral Resource and Mineral Reserve Mineralization Shells of the Greens Creek Mineralized Zones
Hecla Mining Company | Greens Creek Mine, SLR Project No: 101.00632.00020
Technical Report Summary - February 21, 2022
Note:
| | 1. | Line of section A-A’ is shown in Figure 6‑6, Looking Northwest |
Figure 6‑7: Section through the East, 9A, 5250 and Southwest Zones
Hecla Mining Company | Greens Creek Mine, SLR Project No: 101.00632.00020
Technical Report Summary - February 21, 2022
In general, the mineralized bodies are zoned over a silica flooded, pyrite-rich footwall phyllite (SPs). Semi-massive stringer mineralization is often present in the footwall below significant massive sulfide centers. The central mineralization immediately above the stringers is rich in copper, iron, arsenic, and gold and called massive pyritic ore lithology (MFP) due to the high pyrite content. Grading immediately outward from the MFP zones are the base metal (Zn-Pb) and silver rich mineral zones (MFB). Massive carbonate-rich material (WCA) is present within the MFB and towards the MFB’s outer margins. More distal mineralization is characterized by quartz and barite-rich white mineral styles, WSI and WBA respectively (Figure 6‑8).
Source: Steeves, 2018
Figure 6‑8: Simplified Mineralization Cross –Section
Figure 6‑9 provides a plan view of the entire mineral deposit separated according to the mineral types. Clear centers of mineralization are seen with at least four major MFP/MFB cores along the linear mineralization trends. The largest MFP/MFB core is centered on the West and Northwest-West (NWW) zones. Two more centers are present in the SW and upper 200S zones. Another core is present in the deeper, more southern, 200S Zone. Finally, there appears to be two more centers of mineralization at the farthest southern end of the current Mineral Resource; one on the deep vertical limb below the southern 200S Zone and the other possibly emerging at the southern end of the Gallagher Zone.
While minable grades exist within all the mineral types, the MFB, MFP, and WBA types typically have the highest overall grades. Base metals typically are lower in the white mineral type though some baritic material can have high sphalerite contents. Baritic material (WBA) is observed to be particularly silver rich while the white siliceous mineral style (WSI) is typically of the lowest grade.
Ore minerals are dominantly comprised of sphalerite, galena, tetrahedrite, electrum, and proustite-pyrargyrite. A weak, epigenetic, high sulfidation event overprinted portions of the mineral deposit producing bornite, covellite, chalcocite and stromeyerite. Figure 6‑10 provides relative mineral abundances for each of the mineral types.
Hecla Mining Company | Greens Creek Mine, SLR Project No: 101.00632.00020
Technical Report Summary - February 21, 2022
Source: Steeves, 2018
Figure 6‑9: Plan View of Mineral Types across the Greens Creek Mineral Deposit
Hecla Mining Company | Greens Creek Mine, SLR Project No: 101.00632.00020
Technical Report Summary - February 21, 2022
Source: Steeves, 2018
Figure 6‑10: Mineral Zonation at Greens Creek by Mineral Type
6.3.2 | Mineral Type Descriptions |
6.3.2.1 | Massive Fine Pyritic Mineral Type (MFP) |
The massive fine pyritic mineral type contains at least 50% overall sulfide with pyrite being more abundant than the other sulfides combined. Sphalerite and galena dominate the base metal sulfides though chalcopyrite, arsenopyrite and tetrahedrite are common. Gangue consists of quartz, carbonate, barite, and muscovite.
The MFP material is finely bedded generally with the pyrite often framboidal and colloform. Sometimes the MFP unit displays coarser textures suggesting annealing during metamorphism. Near faults the pyritic material becomes brecciated and has late carbonate gangue.
Figure 6‑11 provides photographs of MFP as it appears at the stope and hand sample scales. Photo A taken from a mine heading shows the stratification between MFB and MFP mineral styles. Photo B displays the massive sulfide texture and fine segregation of minerals present in the MFP in a cut hand sample. Photo C shows intense deformation and late carbonate gangue in veinlets in a cut hand sample.
Hecla Mining Company | Greens Creek Mine, SLR Project No: 101.00632.00020
Technical Report Summary - February 21, 2022
Source: Steeves, 2018
Figure 6‑11: Massive Pyritic Material (MFP) at Greens Creek
6.3.2.2 | Massive Fine Base Metal Mineral Type (MFB) |
The MFB has >50% sulfide with sphalerite, and galena dominating over pyrite. The textures are similar to MFP material but with more sphalerite and galena. Figure 6‑12 displays the MFB at heading and hand sample scales. Photos A through D show the stratification, massive and finely bedded natures of the MFB material at outcrop and hand specimen scales. Photos E and F show boudinaged, rolled clasts and intense folding within the material at hand specimen scale.
Hecla Mining Company | Greens Creek Mine, SLR Project No: 101.00632.00020
Technical Report Summary - February 21, 2022
Source: Steeves, 2018
Figure 6‑12: Massive Base Metal-Rich Mineral Type (MFB) at Greens Creek
6.3.2.3 | Baritic Mineral Type (WBA) |
The WBA contains less than 50% total sulfide and a lower pyrite to zinc and lead base metal sulfide ratio than the MFP material. Pyrite, sphalerite, galena, tetrahedrite, proustite-pyrargyrite and stromeyerite are common minerals of WBA material. The gangue is dominated by barite, carbonate, quartz, and muscovite. Figure 6‑13 shows the baritic mineral type at outcrop and hand sample scales. Photo A shows a heading in the 5250 Zone where massive baritic material is common. The material is well layered and dark brown with fine banding. The hand samples of photos B through E show the fine banding of sulfide and gangue and the presence of proustite.
Hecla Mining Company | Greens Creek Mine, SLR Project No: 101.00632.00020
Technical Report Summary - February 21, 2022
Source: Steeves, 2018
Figure 6‑13: Massive Base Metal-rich Mineral Type (MFB) at Greens Creek
Hecla Mining Company | Greens Creek Mine, SLR Project No: 101.00632.00020
Technical Report Summary - February 21, 2022
6.3.2.4 | Carbonate Mineral Type (WCA) |
The WCA at Greens Creek contain less than 50% sulfide by volume and are dominated by carbonate gangue minerals. Pyrite, sphalerite, galena, tetrahedrite and chalcopyrite are the dominant sulfides while dolomite, calcite, Ba-carbonate, biotite, barite, quartz, muscovite, and graphite make up the gangue minerals. The carbonate material tends to be massive and recrystallized due to metamorphism. Carbonate veining is common to the unit.
Figure 6‑14 displays the textures common to the carbonate mineral type. The photos show a typically massive gray rock with disrupted sulfide and carbonate lenses. Possibly due to repeated carbonation and brecciation the original host lithology is largely destroyed; only small fragments of argillite remain intact. Possibly this unit was originally a carbonate-rich sediment mostly replaced by dolomitization, void creation, breccia collapse and re-dolomitization during the original mineralization event.
Hecla Mining Company | Greens Creek Mine, SLR Project No: 101.00632.00020
Technical Report Summary - February 21, 2022
Source: Steeves, 2018
Figure 6‑14: White Carbonate-Rich Mineral Type (WCA) at Greens Creek
6.3.2.5 | Siliceous Mineral Types (WSI) |
Siliceous mineral types contain less than 50% sulfide and pervasive quartz flooding. As with the previous mineral styles, pyrite, sphalerite, galena, tetrahedrite, chalcopyrite are dominant sulfides. Muscovite, albite, and carbonate are accessory gangue minerals accompanying the dominant quartz.
Hecla Mining Company | Greens Creek Mine, SLR Project No: 101.00632.00020
Technical Report Summary - February 21, 2022
Steeves (2018) makes the important observation that the WSI material occupies three different stratigraphic locations and represent differing processes during mineralization at Greens Creek. At the lowest stratigraphy within the fossil hydrothermal system there is widespread silica flooding of the footwall host rock. Due to the sulfide and quartz replacement of the footwall and the brecciation of the unit during mineralization and later metamorphism, the original host lithology is undiscernible except through trace element lithogeochemistry.
The second stratigraphic level and occurrence of the WSI material is within the MFP mineral style as separate layers indicating episodes or growth of the early hydrothermal system. The last stratigraphic, and highest level, occurrence of the WSI mineral type is at the mineral-argillite contact, likely representing the cap and coolest portion of the observable VMS system.
Figure 6‑15 illustrates the common forms of WSI material at Greens Creek. Photo A shows the WSI altered contact between baritic material toward the footwall and argillite in the hanging wall (uppermost stratigraphic level). Photo B shows the massive quartz flooding typical in the WSI sometimes mistaken for chert. The lower right corner of photo C shows stringer sulfide material with quartz only gangue would be from the second stratigraphic episode discussed above. Photo D shows finely banded sulfide mineral in a quartz flooded rock; late, white quartz veining in this photo is from tensional cracking of the primary siliceous material during metamorphism.
Source: Steeves, 2018
Figure 6‑15: White Siliceous Mineral Type (WSI) at Greens Creek
Hecla Mining Company | Greens Creek Mine, SLR Project No: 101.00632.00020
Technical Report Summary - February 21, 2022
Due to variations in mineralization, structural complexity, and spatial location, the Greens Creek mineralization is segregated into nine separate mineralized zones. In order from easternmost and highest elevations to westernmost, the zones are:
The mineralization is stratigraphically controlled and typically found at the contact between the phyllites (stratigraphic footwall) and the argillites (stratigraphic hanging wall). Due to the intense structural deformation, mineralization may be tightly folded into the phyllite or argillite packages such that the original stratigraphic relationships are unclear.
At the deposit scale the mineralization trends N 30° W and plunges to the south at approximately -20°. The East Zone outcrops at the eastern edge of the mineral deposit, dips to the west, and transitions into the West Zone near a tight F2 fold where the mineral horizon transitions from a nearly flat orientation to a nearly vertical wall dipping steeply to the west. The East and West zones are bounded on the west by the Maki Fault system which offset the mineral horizon to the north in a dextral sense. The western deformation boundary of the Maki Fault zone is a continuous fault splay which is called the Kahuna Fault. The mineralization hosted inside the fault zone are called the 9A Zone.
West of the Kahuna Fault, the Northwest West Zone represents the offset portion of the West Zone. Above and to the south of the Northwest West Zone is the main trend of mineralization which includes the Southwest Zone followed by the 200S Zone further down plunge. The 5250 Zone is offset of the East zone across the Maki Fault zone (Figure 6‑9).
The Gallagher Zone lies to the west of the 200 South Zone and is located west of a second major dextral fault zone known as the Gallagher Fault. Offset of a post-mineralized dike swarm, the trend of the 200S Zone into the Gallagher Fault and the similar structural and chemical styles between the southern 200S and Gallagher mineral zones all indicate that the Gallagher Zone is the fault offset of the 200S Zone.
Hecla Mining Company | Greens Creek Mine, SLR Project No: 101.00632.00020
Technical Report Summary - February 21, 2022
The East Zone outcrops at the discovery “Big Sore” gossan and extends down-dip to the west until it is deformed and offset by the D2.5 Klaus Shear at depth or by the Maki Fault at its southern extent. The mineralization occurs along the phyllite/argillite contact and varies from one foot to 30 ft (0.3 m to nine meters) in thickness.
At the surface the mineralization dips at 60° to 80° to the west with the argillite on the bottom or eastern side. The dip shallows with depth to near-horizontal as a result of F2 folding. Where the mineral body terminates into the Maki Fault drag folding has rotated the mineralization nearly 900 ft to 850 ft along strike. This geometry indicates that the entire Greens Creek deposit is on an overturned major antiform such that the stratigraphic younging direction is now oriented to depth.
Figure 6‑16 shows a $140 NSR/ton mineralized envelope for the East Zone as created in Leapfrog 3D software. Figure 6‑17 shows a level plan of drilling and the Mineral Resource block model at the 1,110 ft elevation, which is located in the approximate centre of the zone’s vertical extent of 750 ft to1,980 ft elevation. Figure 6‑18 shows the XS2600 cross section (located on the plan map) with drilling and block interpolation displayed by $NSR/ton.
The Klaus Shear and related F2 fold deforms the lower portion of the East Zone and into a sub-horizontal, argillite-cored fold extending 600 ft to the northwest over the top of the West Zone. One high angle, ductile shear striking northwest and dipping to the west has drag folded the East Zone at approximately the 1,200 ft elevation, causing the zone to have an apparent repeat of mineralization (Figure 6‑18).
Figure 6‑16: East Zone – 3D Model
Hecla Mining Company | Greens Creek Mine, SLR Project No: 101.00632.00020
Technical Report Summary - February 21, 2022
Figure 6‑17: East Zone – Level Plan 1100
Hecla Mining Company | Greens Creek Mine, SLR Project No: 101.00632.00020
Technical Report Summary - February 21, 2022
Figure 6‑18: East Zone – Cross Section 2600
Hecla Mining Company | Greens Creek Mine, SLR Project No: 101.00632.00020
Technical Report Summary - February 21, 2022
The West Zone is the down-dip extension of the East Zone located below the Klaus Shear, and present from 75 ft to 1,100 ft in elevation. While quite variable, the overall trend of the deposit strikes N 30°W for over 2,500 ft (762 m) of strike length and 1,025 ft of vertical extent (75 ft to 1,110 ft). The thickness is also highly variable from less than 10 ft (three meters) to over 300 ft (91 m) in its central portions.
The West Zone shows well developed metal zoning patterns with silver rich fringes around a central high iron, copper core of MFP with a high zinc to lead ratio. Baritic material tends to form more commonly surrounding the core of MFP.
Figure 6‑19 is an illustration of the 3D model for the West Zone. Figure 6‑20 is a level plan at the 700 ft elevation showing drilling and the Mineral Resource block model by $NSR/ton values. Figure 6‑21 is a cross- section through the West Zone as located on the level plan map.
Figure 6‑19: West Zone – 3D Model
Hecla Mining Company | Greens Creek Mine, SLR Project No: 101.00632.00020
Technical Report Summary - February 21, 2022
Figure 6‑20: West Zone – Level Plan 700
Hecla Mining Company | Greens Creek Mine, SLR Project No: 101.00632.00020
Technical Report Summary - February 21, 2022
Figure 6‑21: West Zone – Cross Section 3600
The 9A Zone is the most structurally dismembered zone at Greens Creek as it lies within the Maki Fault Zone. The general orientation of the mineral body is striking to the northwest and dipping steeply to the west but many internal fault splays cut mineralization at differing orientations. In plan view, mineralized widths range between less than five meters (1.5 m) up to 100 ft (30 m).
Restoration of the movement along the Maki Fault suggests that the 9A Zone represents the fault-bounded connection between the East and West zones (east of the fault zone) and the 5250, Northwest West Zone and Southwest Zone (east of the fault). As such, the mineral types within the 9A Zone tends to be similar to the East, West, and Northwest-West zones. MFB and MFP materials dominate with less carbonate, siliceous and baritic material intermixed. The intense deformation within this fault zone, which appears to have early ductile deformation prior to the brittle faulting, has remobilized precious metals so that exceptionally high silver grades can be found in brittle fractures cutting S2 foliation.
Figure 6‑22 is an illustration of the block model extents. Figure 6‑23 is a cross-section through the 9A Zone. Figure 6‑24 is a level plan that shows the orientation of the mineralization in relation to the Maki Fault, and the trace of the mine contact.
Hecla Mining Company | Greens Creek Mine, SLR Project No: 101.00632.00020
Technical Report Summary - February 21, 2022
Figure 6‑22: 9A Zone – 3D Model
Hecla Mining Company | Greens Creek Mine, SLR Project No: 101.00632.00020
Technical Report Summary - February 21, 2022
Figure 6‑23: 9A Zone – Level 800
Hecla Mining Company | Greens Creek Mine, SLR Project No: 101.00632.00020
Technical Report Summary - February 21, 2022
Figure 6‑24: 9A Zone – Cross Section 2700
Hecla Mining Company | Greens Creek Mine, SLR Project No: 101.00632.00020
Technical Report Summary - February 21, 2022
The Northwest West Zone the fault offset of the West Zone, with the 9A Zone tying the two together through the Maki Fault zone. The structural setting is dominated by a pair of recumbent F2 folds. The upper fold is an argillite-cored syncline while the lower fold is a phyllite-cored anticline. Mineral types and mineralization are similar to what has previously been described for the West Zone, with MFB and MFP dominate with some WSI and WCA intermixed.
In the Northwest Zone some mineralization is located up to 100 ft off the mine contact into the hanging wall argillite as a result of high amplitude F2 folding. Mineral types are a mixture of mostly massive and white-siliceous material types with lesser carbonate, baritic material and mineralized argillites. This zone is particularly rich in zinc, iron, and copper with lower silver relative to most of the Greens Creek deposit.
Figure 6‑25 illustrates the Northwest West Zone mineralization envelope in 3D with definition drilling completed within the area. Figure 6‑26 provides a plan view of the drilling and Mineral Resource block model at the 450 ft elevation. Figure 6‑27 displays a cross section through the middle of the Zone at XS2700. In the cross section the two large F2 folds are apparent.
Figure 6‑25: Northwest West Zone – 3D Model
Hecla Mining Company | Greens Creek Mine, SLR Project No: 101.00632.00020
Technical Report Summary - February 21, 2022
Figure 6‑26: Northwest West Zone – Level Plan 450
Hecla Mining Company | Greens Creek Mine, SLR Project No: 101.00632.00020
Technical Report Summary - February 21, 2022
Figure 6‑27: Northwest West Zone – Cross Section 4400
Hecla Mining Company | Greens Creek Mine, SLR Project No: 101.00632.00020
Technical Report Summary - February 21, 2022
The Upper Plate Zone is located at the far northern end of the Greens Creek deposit and above the Northwest West Zone. It is a smaller body representing the fault offset (across the Maki Fault zone) of the western extension of the flat-lying portion of the East zone. Upper Plate mineralization occurs along the margins of an argillite cored recumbent fold. The recumbent fold has an amplitude of over 3,000 ft with an argillite core no more than 200 ft thick. Mineralization is found mostly on the upper and lower contacts of the fold but does in places cross into the argillite core.
Ore types for this relatively thin zone are generally MFB or mineralized argillite. Figure 6‑28, Figure 6‑29, and Figure 6‑30 provide a 3D view of the $140 NSR/ton mineralization shell, a level plan through the 1,100 ft elevation and a cross section through the southeastern end of the mineral zone, respectively.
Figure 6‑28: Upper Plate Zone – 3D Model
Hecla Mining Company | Greens Creek Mine, SLR Project No: 101.00632.00020
Technical Report Summary - February 21, 2022
Figure 6‑29: Upper Plate Zone – Level Plan 1100
Figure 6‑30: Upper Plate Zone – Cross Section 4550
Hecla Mining Company | Greens Creek Mine, SLR Project No: 101.00632.00020
Technical Report Summary - February 21, 2022
Immediately west of the Maki Fault zone is a lower temperature lens of barite-rich mineralization. This lens, known as the 5250 Zone, is continuous for up to 1,200 ft (366 m) along a N300W trend and represents the uppermost mineralization trend at Greens Creek. It represents the fault offset of the upper portion of the East zone.
The mineral types are dominated by white baritic material (WBA) with lesser massive mineral and minor amounts of carbonate and siliceous mineral types. The silver grades are typically higher than average for the Greens Creek mineral bodies while zinc, lead and gold are below average. The mineralized material occurs along the phyllite/argillite mine contact and trends approximately N 35° W. The interpretation shows two limbs of a fold: the western limb dips generally 30° to the west/southwest and the eastern limb dips more steeply at approximately -80°.
Figure 6‑31 is an illustration of the mineralized wireframe with definition drilling shown. Figure 6‑32 is a level plan map of the drilling and Mineral Resource block model for the 5250 Zone. Figure 6‑33 shows cross-section XS2200 through the 5250 Zone showing the block model and drill traces.
Figure 6‑31: 5250 Zone – 3D Model
Hecla Mining Company | Greens Creek Mine, SLR Project No: 101.00632.00020
Technical Report Summary - February 21, 2022
Figure 6‑32: 5250 Zone – Level 65
Hecla Mining Company | Greens Creek Mine, SLR Project No: 101.00632.00020
Technical Report Summary - February 21, 2022
Figure 6‑33: 5250 Zone – Cross Section 2200
The Southwest Zone is comprised of a large phyllite cored F2 anticline with a nearly horizontal argillite syncline (also F2) on its upper limb. The lower limb of the anticline is steeply east dipping to moderately westerly dipping with increasing depth. Mineralization wraps around the anticline’s mine contact, staying on the contact except at the hinge of the fold where multiple lenses of mineralization have folded up into the argillite above the hinge along steep parasitic folds as is commonly seen over large intensely folded structures. Late F3 folding has significantly deformed the mine contact and F2 argillite cored syncline.
The Southwest Zone body continues down dip and trends directly into the 200S Zone, the boundary between the 200S and SW Zone being somewhat arbitrarily set to keep modeling calculations manageable.
Hecla Mining Company | Greens Creek Mine, SLR Project No: 101.00632.00020
Technical Report Summary - February 21, 2022
The high amount of deformation in the Southwest Zone has remobilized and enriched precious metals, especially silver. As the zone sits atop a hydrothermal center and has secondary enrichment it has historically been one of the highest grade areas at Greens Creek. Even after being mostly mined out this zone still contains the highest silver Mineral Resource and Mineral Reserve numbers for the mine. Mineral types are a mixture of MFB, WSI, WCA, and MFP; indicating that the location is in a focused vent area.
Figure 6‑34 provides a 3D view of the Southwest Zone mineralization envelope at a $140 NSR/ton cut-off. Figure 6‑35 is a level plan view through the zone at the 300 ft elevation. Note the north-northwest striking F3 folds on the plan map at the 19800E and 20200E gridlines. Figure 6‑36 displays a cross section through the middle of the Southwest Zone as located on the plan map.
Figure 6‑34: Southwest Zone – 3D Model
Hecla Mining Company | Greens Creek Mine, SLR Project No: 101.00632.00020
Technical Report Summary - February 21, 2022
Figure 6‑35: Southwest Zone – Level Plan 300
Figure 6‑36: Southwest Zone – Cross Section 2700
Hecla Mining Company | Greens Creek Mine, SLR Project No: 101.00632.00020
Technical Report Summary - February 21, 2022
The 200 South (200S) Zone is a continuation of the Southwest Zone trend and has been historically subdivided into two major areas, the main 200 South and the Deep 200 South zones. As the division was due to limiting model sizes to practical levels, this differentiation is not recognized in this TRS, rather one continuous 200S Zone is described beginning at the arbitrary XS2200 boundary between the Southwest and 200S zones.
The main 200 South Zone displays the same general anticlinal geometry as the Southwest Zone, with a steeply dipping eastern limb and a flat-lying western limb. Mineralization continues for 1,200 ft (366 m) along a strike of N 15° W.
There appears to be at least one major F2 anticline in the core of the deposit that has been affected by an F3 fold with east-dipping axial plane. One major D2.5 shear offsets the 200S Zone at approximately the 550 ft elevation, top to the northwest. Mineralization is bounded on the east by a steep, brittle fault zone that offsets the mineral horizon several hundred feet (75 m to 100 m) in a dextral sense.
Figure 6‑37 is a 3D illustration of the mineralized wireframe and definition drilling. Figure 6‑38 is a level plan at Level 100 that shows the outline of the block model in relation to the mine contact, and the major drill hole orientations. Figure 6‑39 is a cross-section through the 200 South Zone that shows the relationship of the drilling to the block model.
Figure 6‑37: 200S Zone -3D Model
Hecla Mining Company | Greens Creek Mine, SLR Project No: 101.00632.00020
Technical Report Summary - February 21, 2022
Figure 6‑38: 200S Zone – Level Plan 100
Hecla Mining Company | Greens Creek Mine, SLR Project No: 101.00632.00020
Technical Report Summary - February 21, 2022
Figure 6‑39: 200S Zone – Cross Section 1400
Hecla Mining Company | Greens Creek Mine, SLR Project No: 101.00632.00020
Technical Report Summary - February 21, 2022
As the 100 Level of the 200S Zone is mostly mined out, Figure 6‑40 is at the -600ft elevation, which is in the deepest area of active mining at Greens Creek. Figure 6‑41 is a cross section XS000 through the Deep 200 South Zone showing the relationship of the drilling to the Mineral Resource block model. Figure 6‑42 is a level plan at -800 ft elevation, which is below any historic or active stopes at Greens Creek. Figure 6‑43 displays cross section XS-1300 which reaches near the maximum southern extent of definition drilling on the 200 South Zone (and for the entire mine).
At the northern end of the 200 South Zone a mixed group of mineral types are present such as MFB, MFP, WCA and WBA which are interpreted to be localized at an original hydrothermal seafloor vent. At the southern extents of the 200 South Zone baritic material (WBA) dominates with high silver grades. Two to three benches are present with a high angle mine contact on the western side of the deposit which is also mineralized.
A deeper mineralized trend is present below the benches shown in Figure 6‑41 and Figure 6‑43, at the -1,100 ft elevation. This deeper, poorly explored trend is thought to be the main Greens Creek mineralization trend, and displays hotter, or more proximal, MFP, WSI and MFB mineral types.
Hecla Mining Company | Greens Creek Mine, SLR Project No: 101.00632.00020
Technical Report Summary - February 21, 2022
Figure 6‑40: 200S Zone – Level Plan at -600 Elevation
Hecla Mining Company | Greens Creek Mine, SLR Project No: 101.00632.00020
Technical Report Summary - February 21, 2022
Figure 6‑41: 200S Zone – Cross Section XS000
Hecla Mining Company | Greens Creek Mine, SLR Project No: 101.00632.00020
Technical Report Summary - February 21, 2022
Figure 6‑42: 200S Zone – Level Plan – 800 Elevation
Hecla Mining Company | Greens Creek Mine, SLR Project No: 101.00632.00020
Technical Report Summary - February 21, 2022
Figure 6‑43: 200S Zone – Cross Section XS-1300
Hecla Mining Company | Greens Creek Mine, SLR Project No: 101.00632.00020
Technical Report Summary - February 21, 2022
The Gallagher Zone is located west of the Gallagher Fault and is the westernmost of the known zones of the Property (refer to Figure 6‑6). The overall Gallagher Zone strikes N70°E and dips 25° SE.
The thickness of the mineralized horizon is highly variable. In the northwest portion of the zone where the horizon is sub-horizontal the true thickness ranges from less than five feet (1.5 m) up to a maximum of 15 ft (4.6 m). To the south, where the mineralized horizon becomes conformable to the phyllite/argillite contact the thicknesses typically range from 10 ft (three meters) to 20 ft (6.1 m).
The Gallagher Zone does show some broad-scale zonation patterns with Fe-rich massive mineralization dominate in the lower southern sections, a middle barite-rich relatively metal-poor central section, and a more typical mixture of white and massive mineralization types in the northern sections. The Gallagher Zone is the offset of the 200 South Zone across the Gallagher Fault as is evidenced by similarities in structural style and mineral types, and post-D4/pre-D5 late Cretaceous dike offset across the fault.
Figure 6‑44 displays the mineralized $140 NSR/ton wireframe with definition drilling. Figure 6‑45 is a level plan map at the zero feet elevation showing the Mineral Resource block model and drilling. Figure 6‑46 shows cross section XS-250 through the mineral body.
Figure 6‑44: Gallagher Zone – 3D Model
Hecla Mining Company | Greens Creek Mine, SLR Project No: 101.00632.00020
Technical Report Summary - February 21, 2022
Figure 6‑45: Gallagher Zone – Level Plan at 0 ft Elevation
Hecla Mining Company | Greens Creek Mine, SLR Project No: 101.00632.00020
Technical Report Summary - February 21, 2022
Figure 6‑46: Gallagher Zone – Cross Section -250
6.5 | Comments on Geological Setting and Mineralization |
In the QP’s opinion, the geological understanding of the settings, lithologies, structural and alteration controls on mineralization, and mineralization continuity and geometry in the defined mineral zones is sufficient to support estimation of Mineral Resources and Mineral Reserves. The geological knowledge of the area is also considered sufficiently acceptable to reliably inform mine planning. The mineralization style and setting are well understood and support the declaration of Mineral Resources and Mineral Reserves.
Other prospects identified within the Project area (see Section 7.1.6.7) are at an earlier stage of exploration, and the lithology, structural, and alteration controls on mineralization, as well as the continuity and geometry of the mineralization, are currently insufficiently understood to support estimation of Mineral Resources.
6.6.1 | Research on Greens Creek Deposit Type |
Work by Taylor and Johnson (2010) indicated that the Greens Creek deposit displays a range of syngenetic, diagenetic, and epigenetic features that are typical of volcanic massive sulfide deposits (VMS), sedimentary exhalative (SEDEX), and Mississippi Valley-type (MVT) genetic models. Based on those observations the investigators indicated that the Greens Creek mineral deposit was a ‘hybrid’ type possessing elements of several deposit models.
Hecla Mining Company | Greens Creek Mine, SLR Project No: 101.00632.00020
Technical Report Summary - February 21, 2022
Since that earlier work, two PhD thesis out of the Center for Ore Deposit and Earth Sciences at the University of Tasmania (Sack, 2009, 2016 and Steeves, 2018) have added significantly to the observations available for the deposit from which to evaluate previous interpretations. More mapping of the mineralization, structures and alteration across the claim block has also added to the data from which to classify the deposit.
6.6.2 | Interpretation of the Greens Creek Depositional Setting |
Based on the most recent data, the Greens Creek deposit most fully follows that of a volcanogenic massive sulfide (VMS) deposit (Steeves, 2018). This classification puts the Greens Creek deposit more in line with the other VMS deposits of the Alexander Triassic Metallogenic Belt.
6.6.2.1 | Support for VMS Classification |
Characteristics that are displayed at Greens Creek that fit the VMS model include:
| | ● | A zinc–lead–silver–gold–copper metal endowment similar to Kuroko-type VMS deposits, |
| | ● | Bimodal volcanism is present in the Triassic, mineralization-age, host lithologies, |
| | ● | A zoned alteration profile with a copper-iron-zinc core grading outward into baritic, precious metal rich fringes and silicified cap, |
| | ● | Presence of quartz-sericite-sulfide stringers in the footwall directly below the massive sulfide accumulations; and massive chloritic alteration around the stringers, |
| | ● | Mineralogy similar to that of white smoker systems of the southwestern Pacific Ocean. Baritic and carbonate mineral styles with framboidal and colloform pyrite indicate primary seafloor deposition, and |
| | ● | The Greens Creek mineral deposits are within a well-established metallogenic belt where numerous other VMS deposits of Late Triassic age have been identified. |
Figure 6‑47 presents the schematic depositional setting for the Greens Creek deposit.
Hecla Mining Company | Greens Creek Mine, SLR Project No: 101.00632.00020
Technical Report Summary - February 21, 2022
Source: Steeves, 2018
Figure 6‑47: Schematic Depositional Setting for the Greens Creek Mineral Deposit
Earlier investigators accepted the Triassic rifting, deep circulation of seawater, and seafloor deposition but pointed to several observations out of line with ‘typical’ VMS deposits such as:
| | ● | Apparent sub-seafloor replacement mineralization, |
| | ● | Lack of felsic igneous rock and a preponderance of ultramafics, |
| | ● | A lack of focused feeder systems, |
| | ● | Chromium and barium rich silicates and carbonate alteration, and |
| | ● | High zinc, lead, and silver grades without typical high (several percent) copper grades. |
Hecla Mining Company | Greens Creek Mine, SLR Project No: 101.00632.00020
Technical Report Summary - February 21, 2022
Steeves (2018) responds to these arguments using observations from other VMS deposits which have similar characteristics. VMS deposits have been identified in other intra-arc settings whereas SEDEX and MVT deposits tend to form on craton margins only. SEDEX deposits are limited to anoxic basins whereas the argillites of Greens Creek show pronounced negative Ce anomalies and high Y/Ho ratios indicative of oxic conditions in the basin. The abundant barite also argues for oxidizing conditions in the basin. Sub-seafloor replacement is common at other VMS deposits as well, a condition that only requires longevity of the hydrothermal system post-burial.
Further mapping, drilling and age dating of units has confirmed bimodal volcanism of similar age to the Greens Creek deposit, which is typical for VMS deposits and not SEDEX or MVT deposits. Continued mapping and drilling have located two major feeder systems in the footwall unknown to the earlier investigators, which is understandable as the feeders are sub-parallel to the footwall/hanging wall mine contact and immediately underlie most of the mined zones. As the mafic to ultramafic footwall units were enriched in chromium it is not surprising that high chromium is found in the alteration products as well as direct sedimentary input to the base of the Hyd Group.
The main feeder system responsible for Greens Creek has also been shown to be zoned over several miles of strike length with the more copper-rich core located north of the mine area. It is only the zinc-rich and copper-poor portion of the feeder system which underlies the mine. Rather than the Greens Creek hydrothermal system being low in copper, only the cooler zinc, lead and silver southern limb was preserved below current topography. Zonation of the preserved mineral deposit shows a hotter core on the northern end and cooler baritic Mineral styles on the southern end. The mineral styles do not zone back to cooler types north of the Greens Creek mineral body but were eroded off above the copper rich feeder zone north of Greens Creek.
Steeves (2018) also argues that the enrichment of gold, silver, zinc, and lead are incompatible in a typical low temperature SEDEX type deposit as the solubility of gold is inverse to the other metals given chloride and bi-sulfide complexing activities, and therefore could not explain the rich endowment of all the metals at Greens Creek. Steeves also explains the exceptional metal budget of high gold with high silver, zinc, and lead as being derived from Devonian – Mississippian mafic metavolcanics (CR, SP) and graphitic metasedimentary (SPgr) footwall rocks enriched in the metals.
In summary, data obtained since the original USGS (2010) publication explains the apparent incongruities of the Greens Creek deposit relative to other VMS deposits. The only remaining oddity is that the Greens Creek deposit formed directly on a 100Ma aged unconformity, a very unique stratigraphic location for a VMS deposit. There is no reason why the VMS system should not form at this stratigraphic location however, and some have proposed that the conglomerate at the unconformity may have been a permeable aquifer for the hydrothermal fluids creating the deposit.
The QP concurs with the interpretation that the Greens Creek mineral deposit is of the VMS type and consider the model and interpreted deposit genesis to be appropriate to support exploration activities.
Hecla Mining Company | Greens Creek Mine, SLR Project No: 101.00632.00020
Technical Report Summary - February 21, 2022
Historical exploration activities at the Greens Creek project prior to Hecla’s acquisition of the land package in March 2008, are extensive. Exploration commenced on the Property in 1973. A complete overview of historical exploration activities at Greens Creek, including work completed by Hecla since its acquisition of Greens Creek in 2008, is included in Table 5‑1.
This section focuses mainly on exploration activities completed since Hecla acquired sole possession of the Property. Hecla’s exploration target selection criteria and exploration programs have been built using refinements in knowledge and understanding from historical exploration data combined with knowledge and experiences gained from more recent systematic exploration programs.
Since 2008, Hecla has completed a number of surface and underground core drilling programs (described in further detail in Section 7.2), auger and MMI soil geochemistry, ground and borehole pulse electromagnetic (EM) geophysical surveys, and compilation of historic geophysical survey information. Reconnaissance-scale and detail-scale geologic mapping have been completed by Dr. Norm Duke, Dr. John Proffett, and various Hecla geologists. These exploration programs are summarized in Table 7‑1.
The original regional identification of the Greens Creek deposit was likely done with USGS topographic maps. The USGS quadrangle maps from this period use the horizontal North American Datum (NAD) of 1927 (NAD27).
By 1977 an assumed or local plane grid was developed for the immediate area surrounding the Big Sore mineral occurrence. This grid, referred to as the “mine grid”, is orthogonal to true north and is still in use for all current underground surveying.
A second assumed grid was also developed prior to commencement of the underground drill program in 1978. This grid was rotated 26° 33’ 54’’ W (counter-clockwise) of the mine grid so as to parallel the average strike of the East Zone. The origin of the grid was offset to the southwest of the East Zone. This grid, known as the “geo-grid”, is still in use for planning drill hole layouts, sectional geologic interpretations, and Mineral Resource modeling. All grid coordinates are in U.S. Geological Survey Feet. The coordinate transform coefficients for conversion from/to mine grid to geo-grid are shown in Table 7‑2.
Beginning in 1983 the horizontal datum was changed from NAD27 to North American Datum of 1983 (NAD83). All surface exploration mapping, geochemistry grids, drill collars and geophysical surveys exist in both NAD27 and the NAD83 datum. The affine transform parameters used for coordinate transformation of mine grid to Alaska State Plane Zone 1, NAD83 are shown in Table 7‑3.
Hecla Mining Company | Greens Creek Mine, SLR Project No: 101.00632.00020
Technical Report Summary - February 21, 2022
Table 7‑1: Summary Table of Hecla Greens Creek Exploration Activities 2008 to 2020
Hecla Mining Company – Greens Creek Mine
Year | Exploration Activity | Contractor | Exploration Activity Completed | Purpose | Results |
2008 | Geologic Mapping | John Proffett, Norm Duke, Greens Creek Exploration Staff | Reconnaissance and detailed geologic mapping | Reconnaissance mapping for extensions of mine contact, originating from a known favorable target area into unknown areas. Detailed mapping for refining targets, identified from regional mapping and geochemical anomalies. | Reconnaissance mapping resulted in expansion of the known mine contact. Detailed mapping began to bring an understanding of the Killer Creek target area. |
| | | | | | |
| | Soil Geochemistry | Greens Creek Exploration Staff | 658 auger soil geochemical samples and 658 MMI soil geochemical samples along 67,800 ft of gridlines in the Young Bay area. | Begin to identify geochemical anomalies in the Young Bay area. | Minor soil anomalies identified. |
| | | | | | |
| | Core Drilling | Connors Drilling | 15 underground core holes totaling 9,935 ft (3,028 m). 18 surface core holes totaling 20,649 ft (6,294 m). | Surface drilling in North Big Sore, East Ridge, East Lil Sore, Cub, and Young Bay targets. Underground drilling to expand Mineral Resources. | Surface drilling advanced geologic and geochemical knowledge of the target areas. Underground drilling expanded Mineral Resources. |
| | | | | | |
2009 | Geologic Mapping | John Proffett, Norm Duke, Greens Creek Exploration Staff | Reconnaissance and detailed geologic mapping | Reconnaissance mapping for extensions of mine contact, originating from a known favorable target area into unknown areas. Detailed mapping for refining targets, identified from regional mapping and geochemical anomalies. | Reconnaissance mapping resulted in expansion of the known mine contact. Detailed mapping included interpretation of cross-section in the area of the Northeast Contact. |
| | | | | | |
| | Core Drilling | Connors Drilling | 20 underground core holes totaling 18,064 ft (5,506 m). Four surface core holes totaling 8,292 ft (2,527 m). | Surface Drilling to test the Northeast Contact. Underground drilling to expand Mineral Resources. | Surface drilling intersected repeated folds of the Northeast Contact as expected. Underground drilling expanded Mineral Resources. |
| | | | | | |
| | Geologic Mapping | John Proffett, Norm Duke, Greens Creek Exploration Staff | Reconnaissance and detailed geologic mapping | Reconnaissance mapping for extensions of mine contact, originating from a known favorable target area into unknown areas. Detailed mapping for refining targets, identified from regional mapping and geochemical anomalies. | Reconnaissance mapping resulted in expansion of the known mine contact. Detailed mapping focused in the Killer Creek target area and assisted in definition of the geologic interpretation for drilling in 2011 and 2012. |
Hecla Mining Company | Greens Creek Mine, SLR Project No: 101.00632.00020
Technical Report Summary - February 21, 2022
Year | Exploration Activity | Contractor | Exploration Activity Completed | Purpose | Results |
2010 | Soil Geochemistry | Greens Creek Exploration Staff | 580 auger soil geochemical samples and 580 MMI soil geochemical samples taken in the North Young Bay area. | To identify geochemical anomalies in the Young Bay area. | Minor soil anomalies identified. |
| | | | | | |
| | Core Drilling | Connors Drilling | 25 underground core holes totaling 31,464 ft (9,590 m). 17 surface core holes totaling 21,217 ft (6,467 m). | Surface drilling continued testing the Northeast Contact, Killer Creek, and East Ridge targets. Underground drilling to expand Mineral Resource. | Surface drilling continued to define the Northeast Contact and the one hole in the Killer Creek target intersected anomalous silver and zinc mineralization. Underground drilling expanded Mineral Resources. |
| | | | | | |
2010 | Geophysics | Ken Robertson | Compilation of Historic Geophysical Data | To identify geophysical survey methods that could be effective in future work. | Results from this compilation re-defined the Killer Creek target area as a priority for exploration. This target had been drilled by Noranda Exploration in the late 1970s then abandoned when the Greens Creek deposit was discovered. |
| | | | | | |
2011 | Geologic Mapping | John Proffett, Norm Duke, Greens Creek Exploration Staff | Reconnaissance and detailed geologic mapping | Reconnaissance mapping for extensions of mine contact, originating from a known favorable target area into unknown areas. Detailed mapping for refining targets, identified from regional mapping and geochemical anomalies. | Reconnaissance mapping resulted in expansion of the known mine contact. Detailed mapping focused in the Killer Creek and upper Bruin Creek target area and assisted in definition of the geologic interpretation for drilling in 2011 and 2012. |
| | | | | | |
| | Soil Geochemistry | Greens Creek Exploration Staff | 818 auger soil geochemical samples taken in the North Young Bay area. | To identify geochemical anomalies in the Young Bay area. | Minor soil anomalies identified. |
| | | | | | |
| | Core Drilling | Connors Drilling | 28 underground core holes totaling 38,098 ft (11,612 m). 14 surface core holes totaling 27,384 ft (8,347 m). | Surface drilling continued testing the Northeast Contact, West Bruin Contact, and East Ore targets. Underground drilling to expand Mineral Resources. | Surface drilling continued to define the Northeast Contact and began to define the West Bruin Contact and the East Ore target. Underground drilling expanded Mineral Resources. |
| | Geophysics | Ken Robertson, Techno Imaging, and Crone Geophysics & Exploration Limited | 3D Inversion of 340-line km subset of the 1,227 line-km from the 1996 Aerodat Ltd frequency domain EM survey. Borehole pulse EM surveys at Killer Creek target | 3D Inversion analysis on a portion of the historic Aerodat data was completed to identify overlooked anomalies. Surface and Borehole Pulse EM surveys were used to define EM anomalies identified from the 3D Inversion. | 3D Inversion re-identified the Killer Creek conductor. Pulse EM defined the re-identified conductor in sufficient detail for exploration drilling. |
Hecla Mining Company | Greens Creek Mine, SLR Project No: 101.00632.00020
Technical Report Summary - February 21, 2022
Year | Exploration Activity | Contractor | Exploration Activity Completed | Purpose | Results |
| | Geologic Mapping | John Proffett, Norm Duke, Greens Creek Exploration Staff | Reconnaissance and detailed geologic mapping | Reconnaissance mapping for extensions of mine contact, originating from a known favorable target area into unknown areas. Detailed mapping for refining targets, identified from regional mapping and geochemical anomalies. | Reconnaissance mapping resulted in expansion of the known mine contact. Detailed mapping focused in the Killer Creek target area and assisted in definition of the geologic interpretation for drilling in 2012. |
| | | | | | |
| | Soil Geochemistry | Greens Creek Exploration Staff | 253 auger soil geochemical samples taken in the North Young Bay area. | To identify geochemical anomalies in the Young Bay area. | Minor soil anomalies identified. |
| | | | | | |
2012 | Core Drilling | Connors Drilling | 24 underground core holes totaling 20,817 ft (6,345 m). Eight surface core holes totaling 17,710 ft (5,398 m). | Surface drilling to test the Killer Creek and West Gallagher target areas. Underground drilling to expand Mineral Resources. | Surface drilling in the Killer Creek target identified a broad copper-rich vein zone varying from 2.1 ft to seven feet and accompanying values up to 7.0% Cu and 5.0 oz/ton Ag. This area is interpreted to be the center of a mineralizing vent. Underground drilling expanded Mineral Resources. |
| | | | | | |
| | Geophysics | Ken Robertson | Review of 2011 geophysical survey results | To propose additional geophysical survey if needed. | Still in review. |
| | | | | | |
| Core Drilling | Falcon Drilling | Ten surface drill holes totaling 28,746 ft (8,732 m) at the Killer Creek target | Continuation of 2012 program testing extent of shallow and broad copper and zinc-rich zones in the area. | Zoned Copper and Zinc-rich extents further defined as potential for higher grade mineralization in the area. |
| | | | | | |
| 2013 | Geologic Mapping | John Proffett, Norm Duke and Exploration Staff | Reconnaissance mapping of the anomalous Zinc Creek area and detailed structural mapping of Mariposite ridge | Continued mapping of major s2.5 shears north and west of known locations. Mapping mine contact and associated mineralization north of Zinc Creek and along Mariposite ridge (east and west of Mammoth claims). | Large and silicified shear zone mapped north and west along mariposite ridge. Mine contact was expanded from Lower Zinc Creek to Upper Zinc Creek-Lakes District. |
| | | | | | |
| | Core Drilling | Falcon Drilling | Six surface drill holes totaling 23,214 ft (7,076 m) in the Killer Creek target area | Continuation of 2013 program testing extent of shallow and broad copper and zinc-rich zones and exploring for mine contact at Killer Creek target. | A deep mine contact was intercepted in five drill holes likely corresponding to the ‘Deep mine syncline’ below the ‘Mine syncline’ and associated mineralization at the mine. This contact was weakly mineralized. |
Hecla Mining Company | Greens Creek Mine, SLR Project No: 101.00632.00020
Technical Report Summary - February 21, 2022
Year | Exploration Activity | Contractor | Exploration Activity Completed | Purpose | Results |
2014 | Geologic Mapping | John Proffett, Norm Duke and Exploration Staff | Reconnaissance mapping of the Killer-Lakes district area and detailed structural mapping of the Killer Creek – Mammoth areas | Reconnaissance mapping to determine extensions of mine contact and mineralization in the Lakes District and Killer Creek areas. Detailed mapping of s2.5 shears and mineralization in the Mammoth and Killer Creek areas. | Expanded known mine contact in the Zinc Creek area north and east into the Lakes District. Detailed mapping of mineralization in the Killer Creek target yielded a better understanding the habit and orientation of mineralization. |
| | | | | | |
| | Geophysics | SJ Geophysics | One downhole EM survey was conducted in Killer Creek to define mineralization and ‘mine contact’ in the area | Determine geometry of possible mine contact and mineralization in the Killer Creek area. | Recognized district deep mine contacts and alteration changes between lithologies though no sulfide horizons were outlined from the survey. |
| | | | | | |
| | Core Drilling | Falcon Drilling | Four surface drill holes totaling 8,085 ft were completed in the Lower Killer Creek and High Sore target areas | Exploring for offset mineralization east of known East Ore Mineral Resource and across Cub and High Sore Faults. Test the Big Sore syncline in Lower Killer Creek target between the Gallagher and Maki Faults. | Several bifurcating s2.5 shears were intercepted in the High Sore drill holes though no offset mineralization was found. A weakly mineralized Big Sore syncline was encountered at depth north of known mineralization. |
| | | | | | |
2015 | Geologic Mapping | John Proffett and Exploration Staff | Mapping of the High Sore and Big Sore areas with a focus on local s2.5 shears | Mapping s2.5 age shears east of known intercepts and mineralization/mine contact in Big Sore Creek. | Detailed orientation of local S2.5 shearing in High Sore prospect and down into the Big Sore drainage was captured. |
| | | | | | |
| | Geophysics | Exploration Staff | Physical property data (density), Magnetic Susceptibility and conductivity measurements were taken in every drill hole | Provide base-line data for future surveys. | Collected data for all units not just mineral lithologies which will further refine future geophysical surveys. |
| | | | | | |
2016 | Core Drilling | Falcon Drilling | Two surface drill holes totaling 3,074 ft (937 m) were completed in Big Sore Creek area | Testing offset East Ore mine contact and mineralization east of the Cub Fault and known Mineral Resource. | One drill hole intersected expected East Ore mineralization close to surface. Drilling east of known East Ore Zone mineralization and targeting displaced mineral across the Cub Fault intersected anomalous zinc mineralization in hanging wall argillite nearing a likely eroded mine contact. A barren Northeast contact was also encountered in each drill hole. |
Hecla Mining Company | Greens Creek Mine, SLR Project No: 101.00632.00020
Technical Report Summary - February 21, 2022
Year | Exploration Activity | Contractor | Exploration Activity Completed | Purpose | Results |
2016 | Geologic Mapping | Exploration Staff | Reconnaissance mapping of Big Sore Creek, and Lil Sore areas and east of the Mammoth claims was completed. | Verify historic mapping in the Big Sore Creek area and follow extents of shearing at East and West of the Mammoth claims. Map geochemical anomaly at Lil’ Sore prospect and sample Rhyolite occurrence. | Mapping in the Big Sore Creek drainage confirmed no mine contact was present where historical mapping showed. Several s2.5 shears, known to offset mineral at the mine, were mapped north and west of Mammoth Ridge. Further defined mine contact at Lil’ Sore Rhyolite and determined unit is Devonian. |
| | | | | | |
2017 | Core Drilling | Falcon Drilling | Nine drill holes totaling 20,419 ft (6,224 m) were completed in the West Gallagher, Upper Gallagher, and Big Sore prospects. | Testing potential western extents of Southwest bench mineralization east of the Gallagher Fault, offset ‘Bench’ mineralization west of the Gallagher Fault, and southern extents of the East Ore and 5250 zones of the mine. | Five drill holes targeted west of the Gallagher Fault for offset ‘Bench’ mineralization in the mine while one drill hole targeted western extensions of the Southwest Bench Zone east of the Gallagher Fault. Broad zinc mineralization was encountered at the ‘Bench’ Contact west of known Mineral Resource east of the Gallagher Fault and higher grade mineralization was encountered west of the Gallagher Fault within the interpreted Klaus Shear. Drilling south of the mine in Upper Gallagher targeting southern extensions of the 5250 Zone encountered a weakly mineralized mine contact. Drilling south of the Big Sore target area tested southern continuations of the East Ore Zone between the Kahuna and Maki Faults. No mine contact was encountered in this area. A single 5250 drill hole tested a mineralized anticline 2,000 ft south of known Mineral Resource and above the 200S zone. No significant mineralization was encountered. |
| | | | | | |
| | Geologic Mapping | Exploration Staff | Mapping was completed in the Lower Zinc Creek area with a focus on S2.5 shearing. | Determine location of ‘Zinc Creek Thrust’ and link with structures seen north and east in North Mammoth. | Location of ‘Zinc Creek Thrust’ changed. |
Hecla Mining Company | Greens Creek Mine, SLR Project No: 101.00632.00020
Technical Report Summary - February 21, 2022
Year | Exploration Activity | Contractor | Exploration Activity Completed | Purpose | Results |
2018 | Core Drilling | Timberline Drilling | Fifteen drill holes totaling 20,941 ft (6,383 m) were completed in the West Gallagher and Lower Gallagher Areas targeting Southwest Bench – 200S Bench and the Upper Plate Zone respectively. | A continuation of the 2017 program testing for western extensions of ‘Bench’ Mineralization east and west of the Gallagher Fault and western extensions of the Upper Plate Zone. | Upper Plate ore grade mineralization was extended 150 ft west of known Mineral Resource on either limb of a flat-lying F2 fold. Four drill holes further defined western extensions of ‘Bench’ mineralization east of the Gallagher Fault and west of known Mineral Resource. Mineralization is generally broad and zinc-rich at or near the ‘Bench’ mine contact. One drill hole was extended to test the ‘Deep Mine Syncline’ below known mine mineralization. This drill hole intersected a very silicified and pyrite-rich footwall immediate to the mine contact with trace base metal mineralization. |
| | | | | | |
| | Geologic Mapping | John Proffett and Exploration Staff | Detailed mapping was completed in the Upper Gallagher and Mariposite ridge west of Gunsight pass. | Map conglomerate units of Upper Gallagher and extend mapping south along the Gallagher Ridge. Link mapping of units and structures in Upper Zinc Creek and Northwest Mammoth. | Collected several conglomerate samples for detrital zircon analysis to determine if they are of similar age to the basal conglomerate of the mine. Extended mapping of mine contact west of Mammoth Ridge. |
| | | | | | |
2019 | Core Drilling | First Drilling | Ten underground diamond drill holes totaling 11,578 ft (3,529 m) were completed in the 200S, Southwest, and East Zones. | 200S drilling tested the down plunge extent of the bench. Southwest drilling followed up to the north of an existing ore grade intercept. East drilling tested the eastern extent of flat-lying mineralization. | Ten drill holes targeting the 200S drilling extended the upper and lower benches approximately 400 ft (122 m) and 800 ft (244 m), down plunge, respectively. |
| | | | | | |
2020 | Core Drilling | Timberline Drilling | Nine underground diamond drill holes totalling 5,603 ft (1,708 m) were completed in the 200S Zone. | Infill drilling targeting the upper and lower portions of the 200S bench, between two widely spaced sections of existing exploration drilling. | Nine drill holes targeting the 200S infilled a gap in exploration drilling and established continuity within the upper and lower benches. |
| | | | | | |
2021 | Core Drilling | Timberline Drilling | Ten surface diamond drill holes totaling 22,484 ft (6,853 m) and 14 underground exploration drill holes totaling 16,324 ft (4,976 m) were completed in 2021. | Surface drilling followed up on existing intercepts within the Lil’Sore and 5250 trend prospects. Underground drilling followed up on existing intercepts within the Gallagher trend, Gallagher Fault Block, 200S and West Zones. | Surface exploration intersected Zn rich base metal rich mineralization within the Lil’Sore Trend. Underground exploration continued to extend the 200S mineralization down plunge. |
Hecla Mining Company | Greens Creek Mine, SLR Project No: 101.00632.00020
Technical Report Summary - February 21, 2022
Table 7‑2: Coordinate Transform Coefficients to Convert from/to Mine Grid to Geo-Grid
Hecla Mining Company – Greens Creek Mine
Origin Offset in US Survey Feet |
| | Mine Grid | Geo-Grid |
X (Easting) | 0.00 | 17438.42 |
Y (Northing) | 0.00 | 12635.93 |
Z (Elevation) | 0.00 | 0.00 |
Rotation Angle
(°) |
ATAN(1/2)= | -26.56505 |
Table 7‑3: Affine Transform Parameters Used for Coordinate Transformation of Mine Grid to Alaska State Plane Zone 1, NAD83
Hecla Mining Company – Greens Creek Mine
Horizontal Conversions: State Plane to Mine Grid |
Formulas | Coeff. | Value |
| | a | 1.000097656 |
X’ = ax + by + c | b | -0.010449167 |
Y’ = dx + ey + f | c | -2455614.471 |
x,y (state plane) | d | 0.010566122 |
(X’,Y’) calc mine grid | e | 1.000969256 |
| | f | -2290833.4 |
Horizontal Conversions: Mine Grid to State Plane |
Formulas | Coeff. | Value |
| | a | 0.999792212 |
X’ = ax + by + c | b | 0.010435993 |
Y’ = dx + ey + f | c | 2479013.084 |
x,y (mine grid) | d | -0.010553352 |
(X’,Y’) calc state plane | e | 0.998919067 |
| | f | 2262447.0 |
Vertical Conversions | | |
Grid to MLLW | -61.11 | |
MLLW to Ortho | -3.742 | |
Hecla Mining Company | Greens Creek Mine, SLR Project No: 101.00632.00020
Technical Report Summary - February 21, 2022
Geologic mapping at Greens Creek has been ongoing since 1976. A basic understanding of the lithologic units was first gathered from early drill holes in the Big Sore Creek area located immediately east of the current mine. In 1977, a Noranda geologist, John Dunbier, realized that the mineralized zone was at a lithologic contact between argillite and tuffites (the tuffites were later recognized as phyllites). This lithologic contact has been dubbed the “mine contact”. To date, over 30 mi (48 km) of mine contact have been identified through mapping efforts, of which less than 10 mi (16 km) have been tested by diamond drilling for its potential of hosting base metal deposits.
Figure 6‑3 displays a compilation of regional geological mapping programs undertaken from 1974 through to the present day. The map has been compiled from different sources and has changed over time as new data are available. The major contributors to this regional geology map are Paul A. Lindberg, Norman A. Duke, John M. Proffett, Andrew W. West, Paul W. Jensen, and Christopher D. Mack.
Dr. Paul Lindberg made mapping contributions from 1995–2000. His efforts are reflected in the current geological understanding of the deposit and through numerous cross-section interpretations. On the regional map, Dr. Lindberg’s mapping is visible in the Mariposite Ridge prospect area, Upper Gallagher, East Lil’ Sore and Upper Big Sore Basin prospects; his maps range from a very detailed 1:200 scale to 1:10,000 metric scale.
Dr. Norm Duke has been responsible for the regional (1:10,000) metric scale mapping of the geology at Greens Creek from 1995 through 2014. His regional mapping sheets are usually the first observations made in an unknown area and influence future decisions for follow up efforts. It is in part through Dr. Duke’s efforts that the mine contact has been extended for the distance it has. Dr. Duke has covered most of the land package north of Greens Creek with his activities.
Dr. John Proffett conducted detailed mapping at 1:24,000 scale. His contributions have been in both underground and surface mapping with structural interpretations. Dr. Proffett’s efforts started with a month of mapping in 1987, with mapping of the 1350 drift in the underground mine. After 1987, Dr. Proffett did not return to the Property until 1996. Since then, he has mapped at Greens Creek continually every year to the present. His areas of focus have been Big Sore Basin, Upper Big Sore Ridge, Upper Big Sore, Lakes District, High Sore, Cliff Creek, Big Boil, Killer Creek, and the underground mine.
Andrew West, Greens Creek’s exploration superintendent from 1998 to January 2011, contributed to the map shown in Figure 6‑3 in portions of the Upper and Lower Zinc Creek areas as well as in the Cub Creek, Bruin Creek, Little Sore, and Gallagher prospects. His mapping was also performed at 1:24,000 scale.
Table 7‑4 summarizes the soil sampling programs since 1974. The auger and MMI soil geochemistry results shown in Figure 7‑1 and Figure 7‑2 present contours of the silver concentrations in auger drilling and silver concentrations in MMI data, respectively. Similar maps reflecting contoured values for gold, lead, zinc, and copper have also been developed by Hecla’s exploration team.
The auger soil sampling grids cover every known prospect from the southern to the northern boundaries within the Greens Creek’s land package. Within each prospect, the grid spacing of samples is 100 ft (30 m) apart along grid lines spaced 300 ft (90 m) apart, which originate from an established baseline. Standard auger soil samples are taken at each station. All soil campaigns were successful in delineating geochemical anomalies within many of the prospects.
Hecla Mining Company | Greens Creek Mine, SLR Project No: 101.00632.00020
Technical Report Summary - February 21, 2022
Since 2008, Hecla has continued investigating the land package for economic mineral potential by compiling historical rock and soil geochemistry results onto comprehensive maps.
Most recent efforts focus on developing soil geochemistry from within the North Young claim group. Prior to 2008, mine contact lithologies were identified by regional scale mapping within this area. This mapping successfully extended the contact 9,500 ft (2,896 m) in the district, warranting further follow up exploration. This included establishing a soil-sampling grid over the contacts’ location and flanks. So far, the sampling has revealed some small anomalies which will be followed-up by infill sampling in order to develop targets. Hecla has mostly employed the use of inductively coupled plasma mass spectrometry (ICP-MS) analyses for 53 elements within this area. However, in 2010–2011 the use of MMI analysis was used on samples taken within the Greens Creek land boundary.
A total of 1,443 MMI and 2,309 auger soil samples have been collected since 2008. Results of the exercise suggested several single point anomalies within the soil data. Overall, the soil data points to the East Lil’ Sore, Killer Creek, Gallagher Creek, and Bruin Creek target areas as the best surface geochemical targets. The soil geochemical data also appears to identify the two main structural trends dominated by the northwest-trending Maki and Gallagher Fault systems. The data also indicate that precious metals appear to favor the Maki Fault system and the base metals have a stronger relationship with the Gallagher Fault system.
Hecla Mining Company | Greens Creek Mine, SLR Project No: 101.00632.00020
Technical Report Summary - February 21, 2022
Table 7‑4: Summary Table of Greens Creek Soil Sampling Activities 1974-2020
Hecla Mining Company – Greens Creek Mine
Year | Contractor | Exploration Activity Completed | Purpose | Results |
1974 | Watts, Griffis and McOuat, Inc. | Initial soil geochemical sampling in Big Sore. | Define anomalies in the Big Sore target. | Defined numerous silver-zinc anomalies. |
| | | | | |
1975 | Watts, Griffis and McOuat, Inc. | Expansion of the soil geochemical sampling grid at Big Sore. | Expansion of the previous Big Sore soil grid. | Expanded soil anomalies in the Big Sore area. |
| | | | | |
1976 | Noranda | Soil geochemical sampling at Gallagher and Killer Creeks. | Expand soil sampling coverage in Gallaher and Killer Creek areas. | |
| | | | | |
1977 | Noranda | Soil geochemical sampling at Big Sore, Gallagher, Killer Creek, Zinc Creek, and Mariposite Ridge. | Expand soil sampling coverage in all of the target areas at the time. | Local silver and zinc anomalies along the contact zone at Big Sore were identified. The expanded Killer Creek soil results identified 16 primary soil anomalies. Weak soil anomalies identified in Zinc Creek. The Mariposite soil results identified nine soil anomalies associated with mineralization located along the contacts of a mariposite-carbonate contact. |
| | | | | |
1988 | Noranda | Soil geochemical sampling at Lil’ Sore and Mariposite claims. | Define anomalies in the Lil Sore and Mariposite target areas. | Six anomalous soil geochemical zones were outlined. |
| | | | | |
1997 | Kennecott | Soil sampling along seven new grids totaling 230,000 line-ft in the High Sore, Bruin, Lower Zinc, Upper Zinc, “A” Road, and Gallagher target areas. | Define anomalies in these target areas. | Soil sampling and geologic mapping outlined drill targets or areas for detailed follow up work in the Bruin, Gallagher, and Lower Zinc Creek target areas. |
| | | | | |
1988 | Kennecott | One new soil grid in the Upper Big Sore target and extensions to three of the 1997 grids in Lower Zinc, Bruin, and the “A” Road target areas. | Define additional anomalies in these target areas. | Outlined numerous soil anomalies but none significant enough to warrant drill testing. |
| | | | | |
1999 | Kennecott | Large Killer Creek soil survey and a new survey in the Cub Creek target areas. | Define additional anomalies in these target areas. | Numerous multi-element soil anomalies were defined. |
| | | | | |
2000 | Kennecott | 904 soil samples collected in the Bruin, High Sore, Killer Creek, Upper Gallagher, and Upper Zinc Creek target areas. | Define additional anomalies in these target areas. | Numerous multi-element soil anomalies were defined. |
Hecla Mining Company | Greens Creek Mine, SLR Project No: 101.00632.00020
Technical Report Summary - February 21, 2022
Year | Contractor | Exploration Activity Completed | Purpose | Results |
2002 | Kennecott | 583 Soil samples collected in the Gallagher, Lil’ Sore, and Lower Zinc Creek target areas. | Define additional anomalies in these target areas. | Identified numerous multi-element soil anomalies of which the most significant occurred at the southern end of the Zinc Creek target. |
| | | | | |
2003 | Kennecott | 757 soil samples collected in the Gallagher, Killer, and Lil’ Sore target areas. | Expand and fill in previous soil sampling in these target areas to follow up on the anomalies identified in 2002. | Identified numerous multi-element soil anomalies of which the most significant occurring within the Lil Sore target area. The 2003 Gallagher soil results, when combined with the 2002 soil results, outlined two significant multi-element anomalies coincident with the mine contact zone. |
| | | | | |
2004 | Kennecott | 238 soil samples collected in the High Sore and Lil’ Sore target areas. | Further define previous anomalies in these target areas. | In combination with the 1997 High Sore sampling, the 2004 results identified 11 multi-element soil anomalies. |
| | | | | |
2005 | Kennecott | 486 soil samples collected in the Cliff Creek, High Sore, and Killer Creek target areas. | Define additional anomalies in these target areas. | Eight multi-element soil anomalies identified in the Cliff Creek target area. Five multi-element anomalies identified in the Killer Creek target area. |
| | | | | |
2006 | Kennecott | 586 soil samples collected in the Cliff Creek, High Sore, Upper Zinc, and Young Bay target areas. | Define additional anomalies in these target areas. | Minor soil anomalies identified. |
| | | | | |
2008 | Greens Creek Exploration Staff | 658 auger soil geochemical samples and 658 MMI soil geochemical samples along 67,800 ft (20,665 m) of gridlines in the Young Bay area. | Begin to identify geochemical anomalies in the Young Bay area. | Minor soil anomalies identified. |
| | | | | |
2010 | Greens Creek Exploration Staff | 580 auger soil geochemical samples and 580 MMI soil geochemical samples taken in the North Young Bay area. | To identify geochemical anomalies in the Young Bay area. | Minor soil anomalies identified. |
| | | | | |
2011 | Greens Creek Exploration Staff | 818 auger soil geochemical samples taken in the North Young Bay area. | To identify geochemical anomalies in the Young Bay area. | Minor soil anomalies identified. |
| | | | | |
2012 | Greens Creek Exploration Staff | 253 auger soil geochemical samples taken in the North Young Bay area. | To identify geochemical anomalies in the Young Bay area. | Minor soil anomalies identified. |
| | | | | |
2013-2021 | | | | No soil sampling programs completed. |
Hecla Mining Company | Greens Creek Mine, SLR Project No: 101.00632.00020
Technical Report Summary - February 21, 2022
Figure 7‑1: Greens Creek Soil Auger Geochemical Sample Location and Silver Contour Map
Hecla Mining Company | Greens Creek Mine, SLR Project No: 101.00632.00020
Technical Report Summary - February 21, 2022
Figure 7‑2: Greens Creek Soil MMI Geochemical Sample Location and Silver Contour Map
Hecla Mining Company | Greens Creek Mine, SLR Project No: 101.00632.00020
Technical Report Summary - February 21, 2022
Various geophysical surveys have been conducted at Greens Creek since 1996 by several geophysical contractors and the previous Greens Creek owners.
Historic geophysical surveys prior to Hecla’s acquisition of the Property in March 2008 include airborne, ground and bore-hole surveys. Details of these geophysical surveys are summarized in Table 7‑5 and Section 5 of this TRS. Table 7‑5 also summarizes the surveys undertaken between 1996 and 2007 including 1,227 line km of AeroDat airborne frequency-domain EM, magnetic, and radiometric surveys (1996), ground pulse EM (1998-99), gravity (1996–98), magnetic (1997–2003), controlled-source audio-frequency magneto-telluric (1996–2007), and audio-frequency magneto-telluric (2004–05) surveys, and bore hole TEM and UTEM3 surveys (1996–2004).
The results from the ground gravity surveys are summarized in Figure 7‑3, those of the ground magnetic surveys in Figure 7‑4, and the AeroDat geophysical survey results are included as Figure 7‑5.
VOX Geoscience Ltd. based out of Vancouver BC, Canada, was contracted in 2010 to assist in the compilation of the historical geophysical surveys completed on the Property and to recommend geophysical survey methods that could be effective in future exploration work. Data from the 1996 AeroDat airborne survey was high quality but in the 15 years since the survey was flown; geophysical software and processing methods have steadily improved.
Beginning in late 2010 and early 2011, Hecla began a program of re-processing the airborne survey results. The first step involved micro-levelling the aeromagnetic data to remove the effects of line offsets and line corrugation. The survey was studied line by line and any spurious readings that could be attributed to man-made cultural interference were removed by hand. The resulting, cleaned, grid was then filtered. Figure 7‑6 presents a close up of the Greens Creek and Big Sore areas with the re-processed tilt derivative contouring. A very good fit between the mapped northeastern mine contact and the western edge of the strong magnetic low (blue) can be observed.
Techno Imaging of Salt Lake City was contracted in late 2010 to use their 3D EM Inversion software on a 211 line-mi (340 line-km) subset of the 1996 AeroDat EM survey. The results from application of this inversion on the data subset provided little additional insights. Consequently, the remaining 551 line-mi (887 line-km) of data were not inverted.
Hecla Mining Company | Greens Creek Mine, SLR Project No: 101.00632.00020
Technical Report Summary - February 21, 2022
Table 7‑5: Greens Creek Geophysical Surveys 1996 through 2020
Hecla Mining Company – Greens Creek Mine
Survey Type | Year | Contractor | Survey Location(s) | Spacing | Purpose | Results |
Fixed Loop TEM | 1996 | Zonge Engineering | Gallagher Gridlines 3800N to 5400N | 50 ft | Orientation survey over the western-most extent of the GC mineral body to see what geophysical method may provide useful data and help optimize future surveys. | Able to detect the West Ore as a large 400 ft by 200 ft .1 ohm-m conductor at depth of 800 ft |
| | | | | | | |
Downhole TEM | 1996 | Zonge Engineering | PS-111, PS-112, GC1530 | 5 m | Test DH-TEM. | GC1350 detected the West Ore body and the PS-holes had an anomalous response coincident with a narrow sulfide band. |
| | | | | | | |
CSAMT | 1996 | Zonge Engineering | Gallagher Gridlines 5000N and 4600N | 100 ft spacings, all scalar measurements | Underground Orientation survey over the NW-W mineral zone to determine if gravity could detect a GC mineral zone. | Subsurface conductors coincide with the west projection of the Upper plate NW-W Zone, suggests taking E-filed measurements parallel to strike. |
| | | | | | | |
Gravity (UG) | 1996 | Greens Creek personnel, data processed by James Fueg, KEX geophysicists | 59 Drift,36 Decline,33 X-Cut and 52 X-Cut over the West Ore Zone | 95 stations over 6,400 line-ft (50 ft to 100 ft spacings) | Orientation survey over the western-most extent of the GC mineral body. | Detected a 1.5 mgal high over the West Ore Zone. |
| | | | | | | |
Surface Gravity | 1996 | Greens Creek personnel, data processed by James Fueg, KEX geophysicists | Gallagher Gridlines 5000N and 4600N | 50 ft | Test surface gravity over the West Ore Zone and Maki Fault. | Only a minor to non-existent response over the West Ore, mineral body may be too deep to detect. |
| | | | | | | |
Aerial Magnetics, EM, and radiometrics
(K, Th, U) | 1996 | AeroDAT | Over entire Land Package and much of Mansfield Peninsula | 200 m line spacings, 100 m spacings near mine | Provide property wide geophysical maps for regional geologic mapping and 1st order targeting. | EM survey outlined the mine contact very well through-out the Property, mag data shows the ultramafic bodies also very well. Was very useful to the regional geologic map. Selected EM anomalies not rigorously evaluated. |
Hecla Mining Company | Greens Creek Mine, SLR Project No: 101.00632.00020
Technical Report Summary - February 21, 2022
Survey Type | Year | Contractor | Survey Location(s) | Spacing | Purpose | Results |
Pulse EM Grid Surveys | 1997 | Crone Geophysics | Gallagher, Bruin, Lower Zn, Upper Zn (East), ‘A’ Road, and High Sore grids | 100 ft station spacings with 400 ft line spacings (800 ft spacings in the ‘A’ Road grid) | Provide ground EM data on recently cut and sampled gridlines to map geology and outline possible conductive anomalies. | Agrees well within existing known trend of lithologic units and aerial EM. |
| | | | | | | |
3D Downhole Pulse EM | 1997 | Crone Geophysics | PS-120, PS-121, and PS-122 | uncertain | Test for any off hole conductive horizons that may represent mineralization, also map project intersected sulfide bands away from the hole. | Conductor 200 ft below the TD of PS-120 was identified, hole was re-entered in 1998 and intersected 24 ft of graphic phyllite at the conductor target. |
| | | | | | | |
Ground Gravity | 1997 | Tony Newman (operator) Clarke Jorgenson (processor) | Gallagher, Bruin, Lower Zn, Upper Zn (East), ‘A’ Road, and High Sore grids | 100 ft station spacings with 400 ft line spacings (800 ft spacings in the ‘A’ Road grid) | Detect possible massive sulfide or baritic bodies at depth. | No significant anomalies found that do not correlate with topography |
| | | | | | | |
Pulse EM Grid Surveys | 1998 | Crone Geophysics | New extensions of the Gallagher, Bruin (north-end), Lower Zn, ‘A’ Road Grids, Upper Big Sore grid and other KEX grids. | 100 ft station spacings with 400 ft line spacings (800 ft spacings in the ‘A’ Road grid) | Provide ground EM data on recently cut and sampled gridlines and extensions to map geology and outline possible conductive anomalies. | Agrees well within existing known trend of lithologic units and aerial EM. |
| | | | | | | |
Downhole Pulse EM | 1998 | Crone Geophysics | PS-123, PS-124, PS-125, PS-126, and PS-127 | uncertain | Test for any off hole conductive horizons that may represent mineralization, also map project intersected sulfide bands away from the hole. | All significant responses are due to lithologic changes at footwall-argillite contacts, West Bruin contact could be seen off hole with increasing conductivity to the south and/or west in PS-126 and Zn-Pb mineralization 400M down in PS-123 correlates with conductive body centered to the south of hole. |
Hecla Mining Company | Greens Creek Mine, SLR Project No: 101.00632.00020
Technical Report Summary - February 21, 2022
Survey Type | Year | Contractor | Survey Location(s) | Spacing | Purpose | Results |
Ground Magnetometer | 1998 | KGCMC Personnel | Bruin (north-end), Upper Big Sore, Lower Zn, and ‘A’ Road grids. | Approximately every 10 ft, was run in walking mag mode (must verify) along lines, 400 ft line spacings (800 ft in ‘A’ Road grid) | Aid in geologic mapping of the newly emplaced grids. | Ground mag data generally replicates the trends seen in the aeromagnetic data. Highlights exposed and suspected ultramafic bodies |
| | | | | | | |
Ground Gravity | 1998 | Clarke Jorgenson | Bruin (north-end), Upper Big Sore, Lower Zn, and ‘A’ Road grids. | 100 ft station spacings with 400 ft line spacings (800 ft spacings in the ‘A’ Road grid) | Detect possible massive sulfide or baritic bodies at depth. | Generally, correlates well with topography. High along Bruin line 2400N and another within the ‘A’ Road grid that is coincident with a PEM anomaly are features of interest. |
| | | | | | | |
Downhole 3-Component TEM | 1999 | Zonge Engineering | PS-130 through PS-137 | 10 ft | Detect possible off-hole conductive anomalies. | All but PS-135 had indicated conductive anomalies that correlated with conductive lithologic units. |
| | | | | | | |
Ground Magnetometer | 2000 | KGCMC Personnel | Killer Creek, Cub Creek, and Lakes District grids | 20 ft | Aid in geologic mapping of the newly emplaced grids. | Ground mag data generally replicates the trends seen in the aeromagnetic data. Highlights exposed and suspected ultramafic bodies |
| | | | | | | |
CSAMT | 2000 | Zonge Engineering | Bruin and Cub Creek lines 2400N, 2800N, and 3200N, and Killer Creek lines 800N, 1200N, and 2000N | 100 ft | Map out the various exposed contacts in the Bruin and Cub Creeks to a greater depth, explore for buried argillite contact in Killer Creek where no argillite is exposed. | Detected the buried East Bruin contact (argillite syncline), defined the geometry of the exposed Bruin contact. Steep conductors on the west side of Killer Creek remain unexplained. |
Hecla Mining Company | Greens Creek Mine, SLR Project No: 101.00632.00020
Technical Report Summary - February 21, 2022
Survey Type | Year | Contractor | Survey Location(s) | Spacing | Purpose | Results |
CSAMT | 2002 | Zonge Engineering | Killer line 2800N, Bruin lines 800N and 4400N, Lower Zn lines CSAMT1, CSAMT2, and CSAMT3 | 100 ft spacing along selected lines. Mostly vector measurements | Provide subsurface resistivity mapping for determining contact (target) geometry for drill hole orientation. | The three lines in Lower Zn defined the geometry of the argillite and graphitic phyllite units. Bruin line 4400N shows a deep conductor that may be the northern extensions of the East Bruin Contact. Deep conductor along Killer 2800N was attributed as the West Bruin Contact, however drilling did not intersect any conductive units. |
| | | | | | | |
CSAMT | 2003 | Zonge Engineering | Killer line 2000S, Bruin lines 2000N and 3200N, Upper Zn lines line 2000N, and Gallagher Line 4400N and 5200N | 100 ft spacings, mostly vector measurements | Provide subsurface resistivity mapping for determining contact (target) geometry for drill hole orientation. Killer line (2000S) was exploring for the north projection of the West Gallagher argillite. | All lines surveyed showed conductive units that conform with surface mapping and adding greatly in understanding the subsurface geology. |
| | | | | | | |
Ground Magnetometer | 2003 | KGCMC Personnel | West Gallagher, East Lower Zn extension, South Lil’ Sore, NW Mammoth | 50 ft | Aid in geologic mapping of the newly emplaced grids. | Maps out geology, especially the ultramafics that outcrop in the South Lil Sore and NW Mammoth grids |
| | | | | | | |
AMT | 2004 | Phoenix Geophysics | Upper Gallagher Lines XS200b and LS2000 | 150 ft | Test the AMT technique at Greens Creek and explore for the Gallagher Mineral Resource Zone and conductive argillite on west side of Gallagher Fault at a depth of >2,000 ft from surface. | Two conductive bodies were mapped the correlates with the Gallagher argillite and an upper argillite unit intersected in PS-223 |
| | | | | | | |
Complex Resistivity Bench Tests | 2004 | Zonge Engineering | Selected UG and surface drill core | N.A. | Provide resistivity data for modeling the MT/AMT survey in upper Gallagher. Most core samples were from Gallagher drill holes. | CR results from representative lithology shows a wide range of resistivities. |
Hecla Mining Company | Greens Creek Mine, SLR Project No: 101.00632.00020
Technical Report Summary - February 21, 2022
Survey Type | Year | Contractor | Survey Location(s) | Spacing | Purpose | Results |
Downhole UTEM3 | 2004 | SJ Geophysics | GC2459, GC2463, GC2551, PS0153, PS0161, PS0166, PS0169, PS0203, PS0210, PS0219, and PS0223 | uncertain | Original aim was to downhole survey GC2551 and PS0223 which intersect or comes close to the new Gallagher Mineralized zone to determine its possible extent and structural orientation. | GC2551 could not be surveyed and only half of PS0223, thus other holes were surveyed. The survey of PS-210 |
| | | | | | | |
MT/AMT | 2005 | Phoenix Geophysics | Upper Gallagher, 12 XS and 11 LS lines spaced 100 ft to 200 ft apart. | 150 ft | Expand on the 2004 AMT survey in Upper Gallagher to determine the possible extend of the Gallagher Mineral Resource and use MT frequencies to model deeper. | Four anomalies were identified, most related to known and drilled argillite horizon near surface. |
| | | | | | | |
Gravity re-modeling | 2005 | Big Sky Geophysics | Gallagher, Bruin, Upper Zn (East), Upper Big Sore, Lower Zn, and ‘A’ Road and High Sore grids | 100 ft | Remodel the gravity data from the 1997 and 1998 surveys using the greatly improved LiDAR terrain data for the terrain corrections. | Forward modeling shows much better resolution with Lidar data as opposed to inclinometer measurements at stations. Gravity highs in High Sore and ‘A’ Road grids need further investigation. |
| | | | | | | |
MT 3D Model | 2007 | GeoSystems | Upper Gallagher grid | used data from MT/AMT survey | Use the closed spaced grid data from the 2004 and 2005 MT/AMT to create a 3D model below Upper Gallagher. | Upper argillite is well modeled across the entire survey area, lowest conductor that can be modeled is at 700 m depth (Above the Gallagher Zone). Modeled only down to sea-level. |
| | | | | | | |
CSAMT | 2007 | Zonge Engineering | East Lil Sore lines 2000N, 4400N, 4800N, and 5600N, Young Bay lines 5600S, 6400S, and 8000S, and NW Mammoth 6000N. | 100 ft spacings, mostly vector | Survey above the East Ridge prospect and its projection of the north to determine the geometry of the contact. | East Ridge contact well mapped out by conductive units. Young Bay gridlines define graphitic phyllite over conglomerate contact much better than the conglomerate over argillite (Mine) contact. |
| | | | | | | |
PEM | 2011 | Crone | Killer Creek | 10 m | Determine location and geometry of argillite contact in Killer Creek. | No contact encountered |
| | | | | | | |
PEM | 2011 | Crone | Killer Creek | 25 m | Determine location and geometry of argillite contact in Killer Creek. | No contact encountered |
| | | | | | | |
Volterra Borehole EM | 2014 | SJ Geophysics | Killer Creek | | Determine location and geometry of argillite contact in Killer Creek. | Frequencies employed were too high. The U and V components of the magnetometer were too noisy, so no 3D orientation of conductors available. |
| | | | | | | |
| | 2015-2021 | | | | | No geophysical surveys completed. |
Hecla Mining Company | Greens Creek Mine, SLR Project No: 101.00632.00020
Technical Report Summary - February 21, 2022
Figure 7‑3: Greens Creek Ground Gravity Surveys
Hecla Mining Company | Greens Creek Mine, SLR Project No: 101.00632.00020
Technical Report Summary - February 21, 2022
Figure 7‑4: Greens Creek Ground Magnetic Surveys
Hecla Mining Company | Greens Creek Mine, SLR Project No: 101.00632.00020
Technical Report Summary - February 21, 2022
Figure 7‑5: Greens Creek AeroDat Surveys Total Radiometrics
Hecla Mining Company | Greens Creek Mine, SLR Project No: 101.00632.00020
Technical Report Summary - February 21, 2022
Figure 7‑6: Greens Creek 2010-2011 Tilt Derivative Reprocessing of the AeroDat Survey Magnetics Data
Hecla Mining Company | Greens Creek Mine, SLR Project No: 101.00632.00020
Technical Report Summary - February 21, 2022
In 2011, Crone Geophysics & Exploration Limited based in Mississauga, Ontario, Canada, was contracted by Hecla to conduct surface and borehole pulse EM surveys on the Killer Creek target area. Twelve surface lines utilizing two surface loops and two boreholes were surveyed form one transmitter loop. The surface surveys were carried out using a time base of 100.00 milliseconds (2.5 Hz) with a 1.5 m/s shut-off ramp time. Vertical and in-line data were collected at a nominal station spacing of 82 ft (25 m).
Some interesting but confusing data were acquired as the host lithologies in the area can be very conductive. In particular, discriminating graphitic sediments from sulfides is problematic for EM surveys. However, the Crone Pulse Electro Magnetic data was modelled with Electromagnetic Imaging Technology Maxwell software, which resulted in the isolation of a small conductor from the background conductivity. This small conductor was drill tested in 2012 and copper-rich sulfide mineralization was intersected in a vein zone varying from 2.1 ft to seven feet (0.6 m to 2.1 m) with anomalous copper and silver values.
Hecla Mining Company | Greens Creek Mine, SLR Project No: 101.00632.00020
Technical Report Summary - February 21, 2022
7.1.5 | Petrology, Mineralogy, and Research Studies |
Hecla and its predecessor companies have commissioned specialist petrographic and mineralogic reports in support of elucidation of mineral species and lithological determinations. A number of professional papers and research studies have been completed on the Greens Creek deposit and surrounding area, including:
| | ● | USGS Professional Paper 1763: Geology, Geochemistry, and Genesis of the Greens Creek Massive Sulfide Deposit, Admiralty Island, Southeastern Alaska. |
| | ● | Anderson, V.M., and Taylor, C.D., 2000: Alteration Mineralogy and Zonation in Host Rocks to the Greens Creek Deposit, Southeastern Alaska: Geological Society of American Cordilleran Section Meeting, Abstracts with Programs, v. 32. No. 6, p. A-2. |
| | ● | Dressler, J.S., and Dunbire, J.C., 1981: The Greens Creek ore deposit, Admiralty Island, Alaska: Canadian Institute of Mining and Metallurgy Bulletin, v. 74, no. 833, p. 57. |
| | ● | Franklin, J.M., and McRoberts, S., 2009: Report on Analytical Reliability and Method Selection for Hecla Greens Creek Mining Company. |
| | ● | Freitag, K., 2000: Geology and Structure of the Lower Southwest Orebody, Greens Creek Mine, Alaska: Colorado School of Mines Thesis. |
| | ● | Freitag, K., 2010, Structure of the Lower Southwest Orebody, Structural Com‐parison to Neighboring Orebodies, and Tectonic Model for the Greens Creek Deposit, in Taylor, C.D. and Johnson, C.A., eds., Geology, Geochemistry, and Genesis of the Greens Creek Massive Sulfide Deposit, Admiralty Island, Southeastern Alaska: U.S. Geological Survey Professional Paper 1763, p. 367–401. |
| | ● | Fulton, R.L., Gemmell, J.B., West, A., Lear, K., Erickson, B., and Duke, N., 2003: Geology of the Hanging Wall Argillite Sequence, Greens Creek VHMS Deposit, Admiralty Island, Alaska, GAC-MAC Abstract, v. 28, p. 299. |
| | ● | Newberry, R.J. and Brew, D.A., 1997, The Upper Triassic Greens Creek VMS (volcanogenic massive sulfide) deposit and Woewodski Island VMS pros‐pects, Southeastern Alaska; chemical and isotopic data for rocks and ores demonstrate similarity of these deposits and their host rocks: U.S. Geo‐logical Survey Open File Report 97-539, p. 49. |
| | ● | Sack, P., 2009: Characterization of Footwall Lithologies to the Greens Creek Volcanic-Hosted Massive Sulfide (VHMS) deposit, Alaska, USA: PhD thesis, Univ. of Tasmania. |
| | ● | Steeves, N., 2018. Mineralization and Genesis of the Greens Creek Volcanogenic Massive Sulfide (VMS) Deposit, Alaska, USA. Unpublished PhD, University of Tasmania, Hobart, Australia, 416p. |
| | ● | Taylor, D.D., Newkirk, S.R., Hall, T.E., Lear, K.G., Premo, W.R., Leventhal, J.S., Meier, A.L., Johnson, C.A., and Harris, A.G., 1999: The Greens Creek Deposit Southeastern Alaska – A VMS-SEDEX Hybrid: in Stanley, D.J., and others, eds., Mineral Deposits – Processes to Processing, Rotterdam, Balkema, v. 1, p. 597– 600. |
| | ● | Taylor, D.D., Premo, B.R., and Lear, K.G., 2000: The Greens Creek Massive Sulfide Deposit – Premier Example of the Late Triassic Metallogeny of the Alexander Terrane, Southeastern Alaska and British Columbia [abs.]: Geological Society of America Abstracts with Programs, v. 32, no. 6, p. A-71. |
Hecla Mining Company | Greens Creek Mine, SLR Project No: 101.00632.00020
Technical Report Summary - February 21, 2022
7.1.6 | Exploration Potential |
Greens Creek exploration programs are designed to continually develop prospective target areas, evaluate emerging prospects, and test potential economic targets. Development of favorable areas includes regional mapping, followed by geochemical sampling and/or geophysical surveys. Evaluation activities include detailed geologic mapping and the incorporation of refined historical data with new exploration data to establish target potential. Testing involves diamond core drilling with the assessment of new information. Since Hecla assumed 100% ownership of Greens Creek in 2008, surface exploration programs have tested several prospects per season.
In 1977, it was recognized that the mineralization at Greens Creek is associated with the lithologic contact between argillite and phyllite. This was dubbed the “mine contact”. To date, much of the mine contact on the Greens Creek claim block has not been tested, even at coarse spacing on the order of 1,000 ft (approximately 300 m).
The main feeder system under the Greens Creek deposit is still being targeted where it meets the mine contact in the mine area. A separate, lower feeder system was found to mineralize the mine contact on a major anticline below the mine workings. This lower system has not been tested over most of the northern claim area.
Underground exploration at Greens Creek has historically followed the mine contact down dip and down plunge. When the contact is interrupted by major structural boundaries such as the Klaus Shear or the Maki and Gallagher Fault systems, the exploration strategy concentrates on locating the mine contact across the structure, then continuing to follow it down plunge. After the initial discovery of the East Zone, the implementation of this strategy has led to the discovery of the West, Northwest West, 9A, 5250, Southwest, 200 South zones, and most recently the Deep 200 South and Gallagher zones.
Exploration targets underground are categorized as emerging or advanced based upon the amount of drill testing that has been applied to that target. Currently there are five major exploration targets being tested at Greens Creek, all on the main Greens Creek feeder system. They are: 1) down plunge on the 200 South Zone, 2) down plunge on the Gallagher Zone, 3) down plunge on the Northwest-West Zone, 4) down plunge on the 5250 Zone and 5) along strike on the Upper Plate Zone. These targets are shown in relationship to the current Mineral Resources in Figure 7‑7.
Hecla Mining Company | Greens Creek Mine, SLR Project No: 101.00632.00020
Technical Report Summary - February 21, 2022
Note:
| | 1. | Magenta boxes and arrows show exploration targets. |
Figure 7‑7: Plan View of Underground Exploration Targets in Relation to the Mineral Zones
Hecla Mining Company | Greens Creek Mine, SLR Project No: 101.00632.00020
Technical Report Summary - February 21, 2022
7.1.6.1 | 200 South Down Plunge |
The Deep 200 South Zone projects to the south approximately 750 ft to 1,000 ft from current Mineral Resource limit to the Gallagher Fault where it is likely cut and offset to become the Gallagher Zone. As ore grade mineralization is present in drilling at the southern end of the known 200 South Zone, and as the Gallagher Zone also has mineable grades, it is expected that drilling down plunge on the 200 South Zone will intercept 750 ft to 1,000 ft of well mineralized rock before being cut off by the Gallagher Fault.
Exploration down plunge has typically been from an exploration drift at the -390 ft elevation, which will continue to work for defining the upper benches of mineralization described in Figure 6‑43. This bench mineralization does not represent the main mineral trend of the 200S Zone at the southern end however as the hotter MFP and MFB mineralization diverged from the bench and are now located on an anticlinal hinge below the benches at approximately 1,100 ft elevation. To adequately test and convert this main trend of mineralization another exploration drift at the -790 ft elevation is planned. This exploration work will continue for several years into the future. Figure 7‑8 shows the planned drifts for carrying out diamond drilling programs targeting the Deep 200 South Zone and the Gallagher Zone.
Note:
| | 1. | Long section, looking east . |
Figure 7‑8: Drifts Planned for Exploring Down Plunge on the Gallagher Zone (4211 Drift), Upper Bench of 200S Zone (M390 Drift), and Lower Trend of 200S Zone (M790 Drift)
7.1.6.2 | Gallagher Zone Down Plunge |
The Gallagher Zone is interpreted as the faulted offset of the 200 South Zone. Based on this interpretation, the zone represents the down plunge continuation of the upper bench of the 200 South as depicted in Figure 6‑43. Below this bench the main trend of Greens Creek has been identified under the 200 South Zone, but drilling has not been carried out to follow this trend to the south. The M790 drift shown in Figure 7‑8 will be necessary to follow this main trend to the south with diamond drill holes. The 4211-exploration drift will also continue to advance to the south to follow the upper level bench mineralization as shown in Figure 6‑43.
Hecla Mining Company | Greens Creek Mine, SLR Project No: 101.00632.00020
Technical Report Summary - February 21, 2022
7.1.6.3 | Northwest West Zone Down Plunge |
The Northwest West Zone represents the lowest of three mineralized trends identified at Greens Creek. Down plunge from the current Mineral Reserve significant Inferred Mineral Resource is present and is open to the south. Recent completion of the PD150 ramp has given access for drilling this down plunge extension which has begun in 2019. This mineralization will be followed to the south until it terminates or connects with the lower levels of the Southwest Zone.
7.1.6.4 | 5250 Zone Down Plunge |
Underground exploration drilling in 2016 and surface drilling in 2017 identified mineralized mine contact approximately 2,000 ft south of, and on trend with, the current 5250 Zone Mineral Resource. This drilling indicates that the 5250 Zone trend may host significant mineralization between the Mineral Resource and the exploration drilling. Surface exploration drilling was planned to step closer to the 5250 Zone Mineral Resource but was canceled due to a focus of exploration work on Upper Plate Zone drilling in 2018. As this 2,000 ft of open ground is highly prospective it will be targeted in the future from both surface and underground drilling.
7.1.6.5 | Upper Plate along strike |
A reinterpretation of this zone suggests it is open down plunge to the south and to the north. Further drilling is planned to test this interpretation.
7.1.6.6 | Lower Feeder System |
Below the entire mine, but still on the mine contact, mineralization has been found on a major anticline which closes to the east. The mineralization, called the “Northeast Contact” target, was tested in the mine area and to the north across the Greens Creek drainage from 2008 to 2011. Though a hydrothermal system was clearly active in this area, and some high grade intercepts were encountered, no Mineral Resource or Mineral Reserve was discovered.
While better defining the main feeder system for the Greens Creek deposit in drilling and on surface, a second, lower feeder system was apparent. This feeder system coincides with the “Northeast Contact” target and appears be the source of mineralization at the Lil’ Sore prospect (Figure 5‑1) Between these two target areas, a distance of over 2.5 mi (four kilometers), significant mine contact is expected to be present at depth and remains to be tested. As VMS mineralization is typically located where feeder systems intersect the mine contact, this area is considered as highly prospective.
Many other prospects are present across the claim block as the geochemical sampling maps indicate. Analysis of exploration results can be difficult as geochemical anomalies may be located in footwall host rocks and geophysical anomalies such as magnetic, gravity or conductive highs can just as easily be associated with greenstone, serpentinite or graphitic argillites and schists, respectively. Overturned F2 folding also complicates interpretation of the exploration results, as the mine contact may be folded under footwall lithologies at any place on the claim block.
Hecla Mining Company | Greens Creek Mine, SLR Project No: 101.00632.00020
Technical Report Summary - February 21, 2022
Mineralization at Zinc Creek is folded and likely associated with the main Greens Creek feeder system but has a large thrust complicating the geology (Figure 5‑1 and Figure 6‑3). The mineralization is present between the Zinc Creek and Lil’ Sore prospects and is defined with very few drill holes. More drilling is needed to adequately assess the mineral potential of this area.
Southeast of the mine several square kilometers of the claim block is essentially unexplored. The USGS has indicated that the mine contact is present less than 1,500 ft below surface in this area (Karl, 2016). Furthermore, the Hyd Group which dominates the surface outcrop in this area may yet have VMS deposits within the section as others VMS deposits are in the Triassic Metallogenic Belt.
7.1.7 | Comments on Exploration |
In the QP’s opinion:
| | ● | The exploration programs completed to date are appropriate to the style of the deposit and prospects. |
| | ● | The research work supports Hecla’s genetic and affinity interpretations for the deposits. |
| | ● | Additional drilling has a likelihood of generating further exploration successes, particularly down-plunge of known zones. |
A total of 8,202 drill holes totaling to 4,024,918 ft (1,226,795 m) have been completed over the entire Project area from 1975 to 2020 (Figure 7‑9; Table 7‑6 and Table 7‑7). Of these drill holes, 412 drill holes totaling 508,454 ft (154,977 m) are surface-based holes drilled for exploration or Mineral Resource development purposes. Underground exploration or Mineral Resource definition drill holes total 5,462 for 2,996,378 ft (913,296 m) and are typically drilled on 50 ft to 200 ft (15 m to 60 m) spaced vertical sections. The remaining 2,328 drill holes, totaling 520,088 ft (158,523 m), are underground pre-production drill holes that are drilled on cross-sections and plan-views spaced from 20 ft to 50 ft (15 m to 60 m).
All bedrock drilling has been completed using conventional wireline coring methods. Surface-based drill holes collared in unconsolidated sediments utilize RC methods until bedrock is encountered (typically less than 100 ft or 30 m) and are then completed using conventional wireline coring methods.
7.2.1 | Pre-2008 Legacy Drilling |
Prior to 2008, a total of 4,792 drill holes (2,196,694 ft or 669,553 m) had been completed (Table 7‑6). Of these drill holes, 307 (305,887 ft or 93,234 m) are surface holes drilled for exploration or Mineral Resource development, 2,963 (1,590,079 ft or 484,656 m) are underground Mineral Resource definition drill holes, and 1,522 (300,728 ft or 91,662 m) are underground pre-production drill holes.
Since 2008, a total of 3,410 drill holes (1,828,223 ft or 557,242 m) have been completed (Table 7‑7). Of these drill holes, 105 (202,567 ft or 61,742 m) are surface holes drilled for exploration or Mineral Resource development, 2,499 (1,406,299 ft or 428,640 m) are underground Mineral Resource definition drill holes, and 806 (219,360 ft or 66,861 m) are underground pre-production drill holes.
Hecla Mining Company | Greens Creek Mine, SLR Project No: 101.00632.00020
Technical Report Summary - February 21, 2022
Figure 7‑9: Plan View Map with Drill Hole Locations
Hecla Mining Company | Greens Creek Mine, SLR Project No: 101.00632.00020
Technical Report Summary - February 21, 2022
Table 7‑6: Summary of Legacy Drilling- 1975 to 2007
Hecla Mining Company – Greens Creek Mine
Year | Surface
Exploration
(PS Series) | Underground
Definition & Exploration
(GC-series) | Pre-production /
Stope Planning
(PP+ST-series) | Annual Totals | Drill Contractor |
| | Holes | Feet | Holes | Feet | Holes | Feet | Holes | Feet | |
1975 | 3 | 997 | - | - | - | - | 3 | 997 | Wink Brothers |
1976 | 16 | 5,350 | - | - | - | - | 16 | 5,350 | |
1977 | 19 | 7,901 | - | - | - | - | 19 | 7,901 | |
1978 | - | - | 4 | 1,427 | - | - | 4 | 1,427 | Unknown |
1979 | - | - | 40 | 17,094 | - | - | 40 | 17,094 | |
1980 | - | - | 34 | 13,528 | - | - | 34 | 13,528 | |
1981 | - | - | - | - | - | - | 0 | 0 | |
1982 | 13 | 12,220 | - | - | - | - | 13 | 12,220 | Diamond Drill Contracting Co |
1983 | 17 | 7,438 | - | - | - | - | 17 | 7,438 | |
1984 | 15 | 12,424 | 10 | 8,970 | - | - | 25 | 21,393 | |
1985 | 10 | 11,721 | 44 | 33,760 | - | - | 54 | 45,482 | |
1986 | 3 | 4,692 | 7 | 2,068 | - | - | 10 | 6,760 | |
1987 | - | - | 12 | 3,426 | - | - | 12 | 3,426 | |
1988 | - | - | 164 | 47,011 | - | - | 164 | 47,011 | Greens Creek (Underground)
Surface
(Unknown) |
1989 | 2 | 2,562 | 98 | 27,676 | - | - | 100 | 30,238 | |
1990 | 9 | 21,053 | 139 | 68,488 | - | - | 148 | 89,541 | |
1991 | - | - | 247 | 138,613 | - | - | 247 | 138,613 | |
1992 | - | - | 226 | 74,899 | - | - | 226 | 74,899 | |
1993 | - | - | 17 | 17,856 | - | - | 17 | 17,856 | |
1994 | - | - | 200 | 132,998 | - | - | 200 | 132,998 | NANA Dyantech |
1995 | - | - | 184 | 96,787 | 103 | 21,118 | 287 | 117,905 | Connors Drilling, LLC |
1996 | 8 | 7,420 | 127 | 83,694 | 101 | 30,880 | 236 | 121,994 | |
1997 | 4 | 7,071 | 166 | 111,381 | 242 | 39,474 | 412 | 157,926 | |
1998 | 5 | 8,484 | 157 | 92,651 | 224 | 30,567 | 386 | 131,702 | |
1999 | 11 | 12,148 | 127 | 78,285 | 144 | 28,425 | 282 | 118,858 | |
2000 | 15 | 15,812 | 206 | 90,333 | 83 | 22,430 | 304 | 128,575 | |
2001 | - | - | 98 | 87,278 | 43 | 8,991 | 141 | 96,269 | |
2002 | 20 | 17,258 | 109 | 73,212 | 73 | 14,109 | 202 | 104,579 | |
2003 | 25 | 27,743 | 85 | 60,598 | 87 | 13,830 | 197 | 102,171 | |
Hecla Mining Company | Greens Creek Mine, SLR Project No: 101.00632.00020
Technical Report Summary - February 21, 2022
Year | Surface
Exploration
(PS Series) | Underground
Definition & Exploration
(GC-series) | Pre-production /
Stope Planning
(PP+ST-series) | Annual Totals | Drill Contractor |
| | Holes | Feet | Holes | Feet | Holes | Feet | Holes | Feet |
2004 | 45 | 52,174 | 95 | 54,923 | 89 | 18,957 | 229 | 126,054 | |
2005 | 34 | 35,920 | 158 | 82,807 | 108 | 18,552 | 300 | 137,279 | |
2006 | 19 | 16,555 | 78 | 40,893 | 106 | 17,744 | 203 | 75,192 | |
2007 | 14 | 18,946 | 131 | 49,425 | 119 | 35,652 | 264 | 104,023 | |
Total | 307 | 305,887 | 2,963 | 1,590,079 | 1,522 | 300,728 | 4,792 | 2,196,694 | |
Table 7‑7: Summary of Hecla Drilling 2008 to 2020
Hecla Mining Company – Greens Creek Mine
Year | Surface Exploration
(PS series) | Underground Definition & Exploration
(GC- series) | Pre-production / Stope Planning
(PP+ST-series) | Annual Total | Surface Drill Contractor | Underground Drill Contractor |
| | Holes | Feet | Holes | Feet | Holes | Feet | Holes | Feet | | |
2008 | 16 | 20,041 | 132 | 54,530 | 23 | 2,822 | 171 | 77,392 | Connors Drilling, LLC |
2009 | 4 | 8,292 | 51 | 39,556 | 55 | 12,830 | 110 | 60,678 | |
2010 | 17 | 21,805 | 67 | 89,373 | 29 | 9,677 | 113 | 120,854 | |
2011 | 14 | 27,397 | 88 | 88,345 | 25 | 6,210 | 127 | 121,952 | |
2012 | 7 | 19,858 | 186 | 105,929 | 35 | 19,593 | 228 | 145,380 | |
2013 | 11 | 29,873 | 220 | 140,199 | 60 | 17,168 | 291 | 187,240 | Falcon Drilling, Inc. | Connors Drilling, LLC |
2014 | 6 | 23,316 | 145 | 84,886 | 67 | 20,454 | 218 | 128,656 | | |
2015 | 4 | 7,587 | 317 | 173,177 | 125 | 19,960 | 446 | 200,723 | Falcon Drilling, Inc. | First Drilling, LLC |
2016 | 2 | 3,074 | 229 | 140,949 | 110 | 37,282 | 341 | 181,305 | | |
2017 | 9 | 20,419 | 309 | 156,358 | 66 | 16,397 | 384 | 193,174 | | |
2018 | 15 | 20,906 | 322 | 157,141 | 97 | 29,167 | 434 | 207,213 | Timberline Drilling, Inc. | First Drilling, LLC |
2019 | 0 | 0 | 329 | 129,447 | 81 | 18,974 | 410 | 148,421 | N/A | First Drilling, LLC |
2020 | 0 | 0 | 104 | 46,409 | 33 | 8,826 | 137 | 55,235 | N/A | Timberline Drilling |
2021 | 11 | 22,991 | 153 | 78,863 | 28 | 5,782 | 192 | 107,636 | Timberline Drilling | Timberline Drilling |
Total | 116 | 225,558 | 2,652 | 1,485,162 | 834 | 225,142 | 3,602 | 1,935,859 | | |
Hecla Mining Company | Greens Creek Mine, SLR Project No: 101.00632.00020
Technical Report Summary - February 21, 2022
7.2.3.1 | Pre-2008 or Legacy Drilling |
The drilling methods of prior operators were similar to the practices employed by Hecla. Underground core was mostly NQ or NQTK diameter, and minor footage of BQ and BQTK diameter core was used for longer holes. In some drill holes, the drill core diameter was reduced from NQ/NQTK to BQ/BQTK (telescoping) due to problematic ground conditions, typically as a result of faulting.
Surface legacy exploration drilling also utilized methods similar to current Hecla practices. Drilling in the overburden (unconsolidated sediments) utilized HQ as casing and drill core was typically reduced to NQ or NQTK once bedrock was encountered. In some drill holes, the drill core diameter was reduced from NQ to BQ due to problematic ground conditions.
Legacy drilling methods, where known, are summarized in Table 7‑8. Information concerning the number and types of drill rigs utilized for the legacy underground and surface drill programs are not available.
Table 7‑8: Summary of Legacy Drill Methods- 1975 to 2007
Hecla Mining Company – Greens Creek Mine
Core Type | Diameter
(in.) | Diameter
(mm) | Typical Use |
BQ | 1.44 | 36.5 | Legacy (pre-2000) – used to extend drilling in difficult ground conditions |
BQTK | 1.61 | 40.9 | Legacy – when required to extend holes in difficult ground conditions and some legacy ST holes. |
NQ | 1.87 | 47.6 | Legacy (pre-2000) – standard surface and underground core size |
NQTK (NQ2) | 2.00 | 50.8 | Standard surface and underground core size |
HQ | 2.50 | 63.5 | Typically used on surface for overburden drilling and underground for longholes |
Hecla has explored Greens Creek deposits since 2008 with core holes spaced at various intervals depending on the stage of exploration and development.
Surface-based exploration holes (PS-prefix series drill holes) are drilled primarily with HQ and NQTK tools. To drill through the unconsolidated overburden HQ-diameter tri-cone methods are utilized so as to enable the insertion of drill casings. Typically, one to six holes are drilled from remote, helicopter-accessible sites, and holes are more rarely completed from setups located adjacent to the existing mine road system. All drilling sites require USFS approval prior to construction of a wooden drill platform. A typical remote site requires a 60 ft x 60 ft (18 x 18 m) clearing to ensure safe access by helicopter.
All remote drilling is supported by one Greens Creek dedicated helicopter (Hughes 500D) based at Hawk Inlet. Drill rigs are moved using an A-Star B2 or B3, which is mobilized from Juneau as needed. During the active drill season one to two drills are active on a 24 hour basis, seven days per week. Drill plans are laid out parallel to geo-grid sections (refer to Section 7.1 for an explanation of the Project grids).
Hecla Mining Company | Greens Creek Mine, SLR Project No: 101.00632.00020
Technical Report Summary - February 21, 2022
Definition holes (GC-prefix series drill holes) are completed with NQTK or HQ tools. Holes are drilled in fans principally from underground drill stations spaced from 50 ft to 100 ft (15.2 m to 30 m) along strike of mineralization. Depending on the availability of drill stations, the vertical spacing of holes within mineralization in individual sections may range from 12 ft to 100 ft (3.6 m to 30 m).
Pre-production holes (PP-prefix series) and stope holes (ST-prefix series) are drilled with NQTK tools. Pre-production drill fans are drilled at 50 ft (15.2 m) intervals along strike of mineralization and on 30 ft to 60 ft (nine meters to 18 m) vertical intervals. Most pre-production drill holes are planned to produce a final drill hole spacing of 50 ft (15.2 m) or less in mineralized zones. Stope delineation (ST-prefix series) drill holes are completed in areas of complex mineralized shapes to aid mine design and planning.
Drill core for exploration, infill and definition purposes is generally NQ in diameter. In some drill holes, the drill core diameter is reduced from HQ to NQ to BQ (telescoping) due to ground conditions problems, typically as a result of faulting. Longer holes or holes in areas with anticipated bad ground are generally collared using HQ tooling. Table 7‑9 summarizes the size of coring at Greens Creek post-2008. Table 7‑10 summarizes the makes and models of drilling equipment utilized by Hecla post-2008.
Once retrieved from the core barrel, the core is placed in sequential order in core boxes labeled with the drill hole number. Each successive section of core drilled, usually 10 ft (three meters) long, is identified by a wood block marked with the depth of the interval. At the end of each shift, core boxes are transported by the drillers to the logging area which is located at the 860 Area on surface.
Table 7‑9: Summary of Current Drill Methods- Post-2008
Hecla Mining Company – Greens Creek Mine
Core Type | Diameter
(in) | Diameter
(mm) | Typical Use |
BQTK | 1.61 | 40.9 | ST-series holes; when required for difficult ground conditions. |
NQTK (NQ2) | 2.00 | 50.8 | Standard surface and underground core size. |
HQ | 2.50 | 63.5 | Typically used on surface for overburden drilling and underground for longholes. |
Table 7‑10: Drill Equipment Utilized for Core Drilling- Post-2008
Hecla Mining Company – Greens Creek Mine
Make | Model | Description |
Christensen | CS14 | Surface Drilling, 2009 & 2011 |
Atlas Copco | CS1000 | Surface Drilling 2008,2010-2012 |
Atlas Copco | U6 | Underground Drilling 2008-2009 |
Atlas Copco | U8 | Underground Drilling 2009-2018 |
Connors Drilling | 20HH | Underground Drilling 2009-2018 |
Falcon Drilling | F-3500 | Surface Drilling 2013-2017 |
Sandvik | DE-140 | Surface Drilling 2018 |
Hecla Mining Company | Greens Creek Mine, SLR Project No: 101.00632.00020
Technical Report Summary - February 21, 2022
The current system of logging employed by Hecla has been used with minor modifications since 1987 (starting with drill hole GC0150). Prior to 1987, lithological nomenclature differed in the names applied to various units. All of the pre-1987 logging has been translated into the current system based on the descriptive details from the original logs. Over 95% of the logged intervals contained adequate details to unequivocally place intervals into the current lithological system. Where insufficient descriptions did occur, assays and or adjacent holes were utilized to ensure continuity. Other differences found in the pre-1987 logging include the use of longer maximum sample lengths (up to 10 ft or three meters) that may span multiple lithologies. Finally, not all of the legacy logs prior to 2000 have consistently recorded Rock Quality Data (RQD) and fracture counts. The majority of the legacy core was photographed wet with either 35 mm slides or digitally.
Underground drill core is logged for recovery, RQD, lithology, alteration, mineralization, structure, and fabric according to a standardized system of logging and sampling procedures. Lithologies can be subdivided into non-mineralized/non-ore (generally not mineralized but may contain erratic high grade values that can be mined) and mineralized/ore categories. Underground logging information is entered directly into the acQuire database.
Surface core is logged for recovery, lithology, alteration, mineralization, structure, and fabric. The surface lithologies use the same classification system as is used in the underground mine. Typically, surface core logs contain a higher level of descriptive details than underground logs. Surface logs are recorded on paper at a one inch = 10 ft scale before entry of the collected data in the acQuire database.
All core is photographed wet. Graphical logs are recorded on paper at scales ranging from one inch = 20 ft to one inch = five feet, depending on observed complexity.
Core recovery is generally high because of the compact nature of the greenschist metamorphic rocks. Approximately 80% of drilled intervals have core recovery greater than 95%. Poor recovery, defined as less than 50% core recovery, occurs in approximately 2% of intervals. Poor recovery is generally localized to heavily-faulted areas in the argillite.
The majority of the legacy underground drill collars were surveyed with conventional mine survey equipment by the mine staff. In rare cases (approximately 2%), collar locations were mapped by Brunton compass and tape methods from known survey points. All collar points were recorded in the database utilizing the mine grid coordinate system.
Hecla Mining Company | Greens Creek Mine, SLR Project No: 101.00632.00020
Technical Report Summary - February 21, 2022
Drill holes are planned (azimuth, dip, length) by geologists on vertical cross-sections and on vertical longitudinal sections orthogonal to the geo-grid.
For surface drill holes a 2 in. x 4 in. (5 cm x 10 cm) tack board is aligned with the geo-grid sectional line (333° azimuth) during pad construction. When the rig is slung into place the skid frame is aligned with the tack board. If drill holes are planned that are not parallel with the geo-grid section line, an arrow pointing in the planned direction is painted onto the deck. After drill hole completion, surface drill collars are located using a Trimble Geo XH 600 handheld GPS instrument. The collar coordinates are recorded using the UTM-NAD83 datum. Accuracy is generally ±10 ft (three meters) for northing and easting coordinates. Elevations are adjusted to match the local light detection and ranging (LiDAR) topographic survey.
Underground drill lines are marked (front sight and back sight) by the mine surveyors. After completion, underground drill hole collars are surveyed with conventional mine surveying equipment by Hecla staff.
All collar locations are recorded in the database utilizing the mine grid coordinate system.
Prior to 1996, down-hole surveys were done by magnetic single-shot cameras. The majority used a Sperry-Sun single-shot camera with a few using a Well-Nav single-shot. Usually, a shot was taken at the collar, at 50 ft (15 m), and approximately every 100 ft to 200 ft (30 m to 60 m) thereafter. If the azimuth and inclination at the collar were more than a few degrees different from that of the shot at 50 ft (15 m), the collar azimuth and inclination were regarded as suspect (affected by steel in the equipment) and replaced by the azimuth and inclination at 50 ft (15 m). Magnetic azimuths were corrected for magnetic declination and, for the Sperry-Sun, had a high latitude correction applied.
Between 1996 and 2000 a combination of Sperry-Sun and MAXIBOR instruments were used. The MAXIBOR system determines drill hole deviation optically relative to a survey measurement of the drill hole collar. The Sperry-Sun was replaced with a Reflex© EZ-shot survey tool in 2000. The EZ-Shot is a solid-state electronic, single-shot instrument with stated accuracy of ±0.5° azimuth and ±0.2° dip. Between 2000 and 2004, the EZ-Shot and MAXIBOR system were used in tandem. Since 2005 the EZ-Shot has been the only system used for down-hole surveys at Greens Creek.
Hecla continued the use of the EZ-Shot system implemented in 2005; from 2008 through 2021 all surface and underground drill holes have been surveyed using an EZ-Shot system. From 2022 through present all surface and underground drill holes have been surveyed using an EZ-Trac system.
For underground drill holes an initial shot at 50 ft (15 m) depth is taken and compared to the planned drill hole azimuth and dip. If the hole alignment is off by more than ±3° in azimuth or ±1° in dip the hole is typically stopped and re-collared. After the initial 50 ft (15 m) shot, surveys are typically taken every 200 ft (60 m) and at the end of the drill hole. Surveys are taken as the drill hole advances. Readings that show anomalous magnetic field strength are flagged as suspect during database entry.
For surface drill holes, an initial survey is first shot below the casing and then every 100 ft (30 m) down hole thereafter as the drill hole progress. A final shot is taken at the end of the drill hole upon completion.
Hecla Mining Company | Greens Creek Mine, SLR Project No: 101.00632.00020
Technical Report Summary - February 21, 2022
7.2.8 | Geotechnical and Hydrological Drilling |
Surface-based drilling methods of prior operators were similar to the practices employed by Hecla. Prior to 2008, a significant number of geotechnical and hydrological drill holes were completed in support of construction and operations of the Greens Creek surface facilities. Areas covered by these holes include the 920 Area, Site 23-D, Site E, and the TDF. An accurate tally of the number of holes and footage for this period is not currently available.
Underground geologic core drilling methods of prior operators were similar to the practices employed by Hecla. However, the portion of the legacy Ingres database that contained core recoveries and RQD data was not successfully recovered with the transfer to acQuire in 2008 (see Section 9.2 for details). These data are still available on the paper logs.
Since 2008, a total of 136 geotechnical and hydrological holes for a total of 7,619.1 ft (2,322.3 m) have been completed (Table 7‑11). The drill campaign in 2009 was focused on investigating existing pile conditions at the TDF. A uniaxial hydraulic jab was used to push a three inch (7.6 cm) diameter Shelby sample tube into the TDF for collection. Sample depths ranged from 20 ft to 45 ft (six meters to 13.7 m).
Drilling investigations in 2010 and 2011 were in support of a proposed TDF expansion. Additionally, in 2010, Site 23, the mill back slope area, and 1350 Area were drill tested to support stability and groundwater monitoring programs. The 2010 program utilized a CME-75 track-mounted rig operated by Cascade Drilling of Woodinville, Washington; the 2011 program utilized a heli-portable CME-45C drill rig operated by Denali Drilling Inc. of Alaska.
The typical methodology for foundation and hydrogeological investigations in 2010 and 2011 included using hollow stem auger drilling for peat, tri-cone mud rotary (water/bentonite-based) for sand/gravel/till, and HQ3 coring for bedrock lithology. Data collection included standard penetration testing (SPT), typically at five feet (1.5 m) intervals and sample collection using a SPT split spoon for index testing. Core samples were also taken where bedrock was encountered. Where clays were encountered, Shelby tube samples were typically collected.
For drill rigs with auto-hammer capability (2010), energy transfer efficiency measurements were taken utilizing a pile driving analyzer at initiation of the drill program to verify correlation. For drill rigs without auto-hammer capability (2011), energy transfer efficiency measurements were taken throughout the duration of the field program for blow count correction.
During the 2011 drill program, a vane borer was also utilized for in situ shear strength data collection. Since 2012, the geotechnical drilling has focused on the TDF.
Hecla logs geotechnical data on all standard underground drill core, and data are stored in the acQuire® database. The dataset includes core recovery (all core), RQD data, and fracture count (sampled intervals and all ST holes). The data set is used in conjunction with the lithologic rock type to classify the mining areas based on the Greens Creek Ground Support Management Plan (GCMP). The GCMP is audited and validated by outside consultants.
Hecla Mining Company | Greens Creek Mine, SLR Project No: 101.00632.00020
Technical Report Summary - February 21, 2022
Table 7‑11: Summary of Surface Geotechnical and Hydrological Drilling- 2008 to 2020
Hecla Mining Company – Greens Creek Mine
Year | Area | Driller | Holes | Footage |
2008 | | No drilling | 0 | 0 |
2009 | Tailings | Unknown | 5 | 152.6 |
| | 1350 Area | Cascade Drilling | 4 | 381.5 |
2010 | Tailings | Cascade Drilling | 8 | 595.7 |
| | Tailings | Cascade Drilling | 11 | 780.8 |
| | A-Road | Denali Drilling | 3 | 345.5 |
2011 | Tailings | Cascade Drilling | 11 | 568.3 |
| | Tailings | Denali Drilling | 18 | 848 |
2012 | | No drilling | 0 | 0 |
2013 | | No drilling | 0 | 0 |
2014 | Tailings | Denali Drilling | 4 | 315 |
| | Tailings | ConeTec | 6 | 77.1 |
| | Site E | Denali Drilling | 2 | 49.5 |
| | Ore Pad Backslope | Denali Drilling | 2 | 88 |
2015 | Tailings | ConeTec | 5 | 271.9 |
| | Tailings | Mud Bay | 5 | 323.5 |
2016 | | No drilling | 0 | 0 |
2017 | B Road | Mud Bay | 7 | 304.3 |
| | Tailings | Mud Bay/ConeTec | 10 | 793.4 |
2018 | Tailings | Mud Bay/ConeTec | 35 | 1724 |
2019 | B Road | Mud Bay/ConeTec | 2 | 160 |
| | Tailings | Mud Bay/ConeTec | 18 | 2074.4 |
2020 | Hawk Inlet | Mud Bay/ConeTec | 15 | 890.4 |
| | Site 23 | Mud Bay/ConeTec | 2 | 375 |
2021 | B Road | Discovery | 2 | 71.5 |
| | Tailings | Discovery | 6 | 249.5 |
| | 920 Area | Discovery | 5 | 143 |
7.2.9 | Metallurgical Drilling |
Current metallurgical testing is primarily based on actual mill feed or composite samples collected from underground faces. See Section 8.2 for a description of metallurgical drill sampling.
Hecla Mining Company | Greens Creek Mine, SLR Project No: 101.00632.00020
Technical Report Summary - February 21, 2022
7.2.10 | Sample Length/True Thickness |
Drill holes are designed to intersect the mineralization as perpendicular as possible; reported mineralized intercepts using core lengths are typically longer than the true thickness of the mineralization.
A series of section and plan maps for each mineralized zone are included in Section 7.4. These maps include drill hole traces, block model outlines, and an interpretation of major geologic contacts and faults. These plans and figures show that drill orientations are generally appropriate for the mineralization style and have been drilled at orientations that are optimal for the orientation of mineralization for the bulk of the deposit areas.
7.2.11 | Comments on Drilling |
In the opinion of the QP, the quantity and quality of the logging, geotechnical, collar and down-hole survey data collected in the exploration and infill drill programs are sufficient to support Mineral Resource and Mineral Reserve estimation as follows:
| | ● | Core logging performed by Hecla staff meets industry standards for exploration on polymetallic deposits. |
| | ● | Core logging performed prior to Hecla acquiring 100% Project ownership met industry standards at the time of logging. |
| | ● | Collar surveys for Hecla core holes have been performed using industry standard instrumentation. |
| | ● | Collar surveys for legacy drill holes were performed using methods that were industry standard for the time. |
| | ● | Down-hole surveys performed after 2008 were performed using industry standard instrumentation. |
| | ● | Prior to 1996, magnetic single-shot cameras were used for down-hole surveys. Although standard for the time, these readings can be affected by magnetic rocks and drill casings. From 1996 to 2006, industry standard instrumentation was used. |
| | ● | Drilling practices, logging, collar surveys and down-hole surveys have been periodically reviewed by independent auditors (refer to Section 9). |
| | ● | Recovery data from core drill programs are acceptable. |
| | ● | Geotechnical logging of drill core meets industry standards for planned open pit and underground operations. |
| | ● | Drilling is normally perpendicular to the strike of the mineralization. |
| | ● | Drill orientations are shown in the example cross-sections in Section 7 and are considered to appropriately test the mineralization. |
| | ● | No factors were identified with the data collection from the drill programs that could affect Mineral Resource or Mineral Reserve estimation. |
Hecla Mining Company | Greens Creek Mine, SLR Project No: 101.00632.00020
Technical Report Summary - February 21, 2022
8.0 | SAMPLE PREPARATION, ANALYSES, AND SECURITY |
Nearly every mining face is marked with paint to delineate the mineral subtypes, plus argillite and phyllite wall rocks, low grade mineralized material, and occasional high grade precious metals zones. Usually, a single face sample is taken from each mineral type; where the area represented by a mineral type is greater than 50 ft2 (4.6 m2), multiple face samples are taken. These samples are taken by chipping the face on an irregular grid.
The locations of stope-face samples are initially recorded in the grade control geologist’s field book, wherein the geologist records the distance to the face, typically the center, from a spad, rib or other reference object/feature. On the surface, the geologist utilizes an AutoLISP program within the AutoCAD software program to insert a “stope-face” block at the appropriate measured distance from the reference object into an as-built drawing for the appropriate bench elevation. The orientation of the stope-face (relative to the drift/drive) is determined by the geologist. The geologist adjusts the stope-face block positions manually based upon detailed stope surveys.
The area of each sampled face is calculated using two different methods. The first method is the traditional cross-sectional area (width by height). The second method relies upon digital photography of the face and then on-screen digitization of the distinct sample areas on the photo. The individual sample areas are electronically summed and then compared with the first method. Hecla tolerates up to a 20% difference between the two area methods; differences larger than this are not permitted by the data-entry procedure, which requires the data entry person to modify the input data.
A detailed survey is performed in active stopes at least every five days and preferably after every three rounds. The elevation is initially based on the mid-rib elevation and is more accurately “back determined” at the end of the month through the wire-framing of the back and floor survey points.
The survey crew consists of a single individual utilizing a special Geodimeter total station equipped with a visible red laser. The instrument calculates the distance to an object by reading the reflected laser beam. This makes for very efficient single-person surveying, although erroneous distance readings can and do occur. The distance that can be measured is limited/impacted by the reflectivity of the target object, the clarity of the air in the stope/drive, and the angle at which the laser hits the target. The erroneous distances for the detailed survey points are readily identified and removed after loading the survey data into AutoCAD.
Drill core is sampled using two methods based on the stage of drilling. Exploration and definition drilling are sampled on intervals ranging from one foot to five feet (0.3 m to 1.5 m) that do not cross lithological boundaries. Exploration drill holes are cut and sampled as half-core; definition drill holes are whole-core sampled.
Barren contacts are sampled through 15 ft (4.6 m) ‘buffer’ zones into the hanging wall and the footwall, whereas mineralized or ore-type contacts are sampled through 30 ft (9.2 m) ‘buffers’ into the hanging wall and footwall. If a mineral type lithology is encountered off the mine contact, it will also receive a 30 ft (9.2 m) buffer on both sides. If a mineralized, but non-ore type, lithology is encountered off the mine contact, the buffer length is at the discretion of the logging geologist, but not to be less than five feet (1.5 m).
Hecla Mining Company | Greens Creek Mine, SLR Project No: 101.00632.00020
Technical Report Summary - February 21, 2022
For sampling the buffer zones, narrower intervals of two feet (0.6 m) followed by three feet (one meter) samples, are placed immediately adjacent to lithological contacts; five feet (1.5 m) intervals are sampled through the rest of the buffer zone.
Mineralization occurring within veins or as remobilized bands away from contacts are sampled in five feet (1.5 m) intervals or less, depending on the thickness of mineralization, and are enclosed by five feet (1.5 m) buffer samples.
Geologists are responsible for identifying samples in the core, labeling each sample extent with polyvinyl chloride (PVC) flagging, and documenting them with photographic logs. Sample intervals are also recorded on the paper log sheets and in the drill hole database. Core samples are dispatched to the underground cutting facility where technicians process the sample intervals into half-core samples. The half-core sample intervals are individually bagged and then delivered to either the Greens Creek Laboratory or the offsite commercial laboratory.
Pre-production and stope drill holes are typically sampled through the majority of the drill hole as whole-core, with sample intervals ranging from one foot to five feet (0.3 m to 1.5 m). Samples are documented in an identical method to exploration and definition core.
8.2 | Metallurgical Sampling |
Prior to 2000, composited quarter-cut definition drill core was used for metallurgical test work on a mineral zone basis in selective cases. The core was chosen from select definition drill hole intervals that had been previously sampled. Since 2000, metallurgical sampling is done using quarter-cut definition or exploration drill core on an as-needed basis when new zones or new mineral styles are encountered.
8.3 | Density/Specific Gravity Determinations |
The procedure for measuring specific gravity (SG) of core at Greens Creek is the weight in water versus weight in air method. The weighing takes place after the core has been logged, but before the core is cut, and occurs in the underground core cutting facility. Exploration and definition core holes are considered for density sampling.
Samples of whole core approximately one foot to five feet (0.3 m to 1.5 m) in length are weighed in air and the weight is recorded on the paper SG sheet. The sample and tray are then placed in water until fully submerged and the weight recorded. Completed sheets are returned to the 860-Core Shack for manual data entry. At the time of data entry, the weight of the basket, wet and dry, is subtracted from the recorded weights accordingly and the final values are manually entered into the acQuire® database.
SG measurements are required of all exploration or definition core that is a mineralized or ore-type lithology as well as the associated buffer samples. For exploration drilling, all mineralized lithologies are sampled for SG measurements. For definition drilling, all mineralized lithologies within a 15 ft buffer of the main mineralized zones are sampled for SG measurements.
Highly fractured or faulted core is measured for SG, though it is difficult. The holes in the tray used are several millimeters in diameter. Material deemed at risk for falling or flowing through those holes is generally not weighed in water or in air. This type of material makes up a relatively small percentage of the total samples and is generally related to heavily-faulted intervals.
Hecla Mining Company | Greens Creek Mine, SLR Project No: 101.00632.00020
Technical Report Summary - February 21, 2022
8.4 | Analytical and Test Laboratories |
Table 8‑1 summarizes the laboratories utilized throughout the Project history and covers legacy and current operations. All laboratories are independent of Hecla and previous operators, except for the Greens Creek Laboratory and Kennecott Utah Copper laboratory. Dates of legacy contracts are best estimates and noted as “unclear” where the information was not available.
Bondar Clegg Canada Ltd. (Bondar Clegg), now part of ALS Chemex Laboratories, obtained ISO 9001 certification in 1998; however, its accreditation through the period of use at Greens Creek is not known. SVL Laboratories’ accreditation through the period of use at Greens Creek is also unknown. The accreditation of other metallurgical laboratories, Lakefield Research, company laboratories, Kennecott Utah Copper Labs and CESL, are not known.
McClelland Laboratories is a metallurgical laboratory with extensive experience in precious metals metallurgy and process and a good reputation within the mining industry; however, it is not a certified laboratory. SGS is an ISO 9001 certified laboratory.
Acme was ISO 9001 certified in 1997 and successfully maintained that certification until its acquisition by Bureau Veritas (BV) in 2015. Acme and Inspectorate Laboratories were acquired and successfully integrated by BV starting January 1, 2015. BV is also ISO 9001 certified. Acme/BV has been the primary laboratory used for exploration and definition drill core from 1987 to present. The Greens Creek Laboratory is used for pre-production and grade control samples and is the secondary laboratory used for exploration and definition drill core samples since 2002. The Greens Creek Laboratory has participated in round robin programs to compare its results to other laboratories intermittently throughout its history but is not a certified laboratory.
Table 8‑1: Assay Laboratories used at Greens Creek
Hecla Mining Company – Greens Creek Mine
Laboratory | Location | Period of Use | Comments |
Bondar Clegg Canada Ltd. | Vancouver, BC | 1976 | 1982 | Primary laboratory for early surface exploration and definition drill core |
| | | | | |
Acme Analytical Laboratories Ltd. | Vancouver, BC | 1987 | 2015 | Primary laboratory for all exploration and definition drill core |
| | | | | |
Bureau Veritas | Vancouver, BC | 2015 | 2021 | Primary laboratory for all exploration and definition drill core after acquisition of Acme Analytical |
| | | | | |
SVL Analytical | Kellogg, ID | 1987 | 2002 | Primary laboratory for all exploration and definition drill core until Acme, then secondary umpire laboratory until 2002 |
| | | | | |
McClelland Laboratories, INC | Sparks, NV | 1988 | Unclear | Gravity concentrates |
| | | | | |
Greens Creek Laboratory | Admiralty Island, AK | 1989 | Present | Primary laboratory for some exploration and definition drill core in 1989-90 range. Primary laboratory for pre-production and stope drill core and grade control samples since 1994.Secondary laboratory for all exploration and definition drill core since 2002. |
| | | | | |
Lakefield Research | | 1992 | 1994 | West Zone tests |
| | | | | |
Kennecott Utah Copper Laboratory | Salt Lake City, UT | 1996 | 2000 | Acid rock drainage (ARD) samples 1996–2000 |
| | | | | |
CESL | Vancouver, BC | 1998 | 2008 | ARD samples 1996–2000 |
| | | | | |
SGS Canada Inc. | Toronto, On | 2006 | 2010 | Surface soil MMI analysis |
Hecla Mining Company | Greens Creek Mine, SLR Project No: 101.00632.00020
Technical Report Summary - February 21, 2022
8.5 | Sample Preparation and Analysis |
Sample preparation and analytical methods have been consistent with the current methods since 1998 (MRDI, 1998). Methods used prior to 1998 are not well documented and are not known in detail.
From 2008 through late 2011, all drill core sample preparation was done at Acme laboratory locations in Whitehorse, Yukon or Vancouver, British Columbia. In late 2011, a sample preparation laboratory, purchased by Greens Creek but operated by Acme personnel, was established on the Greens Creek site. From late 2011 on, nearly all exploration and definition core samples were prepared for analysis at this facility on site and then shipped to the Acme/BV laboratory facility in Vancouver for analysis. Preparation procedures were the same, whether they occurred at the Whitehorse or Vancouver sites or were prepared at the Greens Creek facility. The on site preparation was discontinued in 2015 with the establishment of a new sample preparation facility in Juneau, AK by BV.
The current preparation procedure consists of crushing to 70% passing 10 mesh (two millimeters), riffle splitting approximately 250 g, then ring pulverizing to 95% passing (P95) 150 mesh (106 μm). Additional cleaning of the preparation equipment is requested after high base metal content samples. Of the pulverized material 115 to 120 g is sent for analysis, and the remaining 115 to 120 g are stored as a master pulp.
Currently, all mineralized definition and exploration drill core is assayed at BV for Au, Ag, Pb, Zn, Cu, Fe, and Ba. All mineralized samples are also analyzed for a 33 element inductively coupled plasma emission spectroscopy (ICP-ES) assay suite.
Silver and base metal assays for Pb, Zn, Cu, and Fe are performed using ICP-ES on one gram samples digested in hot aqua regia. Automatic re-analysis is triggered on a smaller sample size if results return above detection limits. Silver is re-assayed by fire-assay with gravimetric finish if the initial ICP-ES results are greater than 300 ppm and by metallic-screen fire assay if the original over-limit assay is greater than 80 oz/ton.
The standard assay package employed consists of fire assay for Au on a 30 g sample with an AA finish. Gold is re-assayed by gravimetric finish if the initial fire assay results return values above 7 ppm. Where the gravimetric finish assays continue to determine grades greater than 7 ppm Au, a third assay is carried out using a metallic-screen fire assay.
Preparation for the 33-element suite involves a 0.5 g sample split digested in an aqua regia solution containing equal parts HCl, HNO3, and de-ionized H2O before analysis by ICP-ES.
Hecla Mining Company | Greens Creek Mine, SLR Project No: 101.00632.00020
Technical Report Summary - February 21, 2022
Analysis for Ba is a lithium borate fusion of a 0.2 g subsample with analysis by ICP-ES.
Since 2008, the Greens Creek Laboratory has been used as the primary laboratory for pre-production and in-stope drill core as well as an umpire laboratory for definition and exploration drill core. The standard assay package employed consists of fire assay for Au and Ag, and ICP-ES analysis for Pb, Zn, Cu, and Fe.
8.6 | Quality Assurance and Quality Control (QA/QC) |
Previous (pre-2008) operators have used a similar system to the current QA/QC methodology. Legacy assaying protocols are typical of those employed in the mining industry and have been described in several reports (MRDI 1998 and 1999; AMEC, 2005, 2008 and 2013). The 1998 MRDI report is referenced as the source of pre-1998 legacy QA/QC procedures by all the subsequent audit reports, with QA/QC of drill holes added since 1998 covered by each subsequent report period (see Section 9 for a description of external reviews on Greens Creek data).
Different standard reference materials (SRMs) were created by the Greens Creek Joint Venture (GCJV) to reflect the different mineral types at Greens Creek, and successor SRMs were created as the stocks became exhausted. SRMs were prepared at Hazen Research by ball milling to exceed P95 150 mesh. Ten packets of each SRM were submitted to independent commercial laboratories to determine the recommended values for controlling quality.
Standards B, D, F and G were made from Southwest Zone cores. Standards E and H were made from Northwest West and West Zone cores. Standard I was made from mineralized material from a stope in the 200S Zone. The material was submitted to six independent laboratories: Hazen Research, Denver; SVL, Acme, Cone Geochemical Laboratories, Lakefield, CO; Rocky Mountain Geochemical Laboratories (RMG), and Chemex, Mississauga, Ontario. Standard H was characterized by Acme, CAS, RMG and SVL. Standard I was submitted to Acme, Hazen, SVL, RMG, and two laboratories not previously used: Actlabs, Wheatridge, CO; and SGS, Vancouver, BC.
Duplicate assays were performed at the same laboratory as the original assays and were not “blind.” Acme performed assay (same pulp) duplicates and coarse reject (second split, second pulp) duplicates on every 10th sample and reported the results on the same assay certificate. Duplicate assay (same pulp) and coarse reject duplicates (second split and second pulp) were performed for one in every 20 samples by the Greens Creek Laboratory.
Most of the Greens Creek drill holes were included in a check assay program where SVL Analytical, formerly Silver Valley Laboratories, of Kellogg, Idaho was the umpire laboratory.
Approximately one in 15 samples were selected for a check assay on the pulp. The checks were selected from intervals logged as massive and white mineral styles in approximately equal amounts. Any interval showing visible gold was also selected for check assay. Selected samples were recorded on the sample submission form, directing Acme to send a split of the pulp to SVL. After receiving Acme assay results, geologists examined the results for a reasonable match to geologic observation and requested additional check assays on samples that reported unreasonably high or low values.
Hecla Mining Company | Greens Creek Mine, SLR Project No: 101.00632.00020
Technical Report Summary - February 21, 2022
SVL performed a fire assay for Au and Ag using a half-assay ton sample. SVL determined Pb, Zn, and Cu by AA on one gram samples digested in aqua regia. SVL analyzed base metals by AA. If samples reported above 15 percent Zn or above 20 percent Pb (as determined by AA), those samples were re-assayed using titration methods.
Acme performed check assays on pulps selected from drill hole samples prepared and assayed by the Greens Creek Laboratory, using the protocols described above. The practice of submitting pulps for check assay was discontinued for pre-production drill holes on April 1, 1998.
Since 2008, Hecla has used two laboratories for drill core assays: the Greens Creek Laboratory; and Acme, followed by its successor laboratory, BV, in Vancouver, Canada. BV acquired Acme in 2015 and is currently the primary commercial laboratory for Greens Creek. Batches are controlled by a system of SRMs, pulp duplicate samples, coarse reject duplicate samples, and check assay submittals.
From 2008 to 2011, standards materials were sourced from underground bulk samples or drill core and then prepared and certified by Hazen Research, Inc. of Golden, Colorado. The Hazen Research standards used from 2008 are Standard K, Standard L, Standard N, and Standard P; these materials were used until exhausted during the period between 2012 and 2015.
Beginning in 2011, matrix-matched standards materials were prepared and certified by CDN Resource Laboratories Ltd (CDN) of Langley, BC, Canada using mineralized materials sourced from several locations in the mine. Additional matrix-matched standards have been prepared as needed when the previous supplies became depleted by CDN through 2021. A summary of the various matrix-matched standards used since 2008, and the material from which they were sourced are summarized in Table 8‑2. All reference materials used have certified values for Au, Ag, Pb, Zn, Cu, and Fe. A more detailed summary of the source, preparing company, certificate dates and recommended values for the reference standards used are presented in Table 8‑3.
From 2008 to March 2018, one standard was submitted as the 10th sample of each drill hole; an additional standard was inserted for every subsequent 20 samples and as the last sample for every drill hole. Beginning in March 2018, one standard is submitted as the 10th sample of each drill hole with an additional standard inserted for every subsequent 25 samples.
Standard assay results are reported along with the primary assay results and are captured by the acQuire® database during the normal importing routine. Upon receipt, the results for the standards are compared with certified values by the project geologist using graphical reports generated by acQuire® database utilities. From 2008 to March 2018, analyses for jobs are rejected if one standard per submittal is outside of three standard deviations from the certified value, or if two standards per submittal are outside of two standard deviations from the certified value.
Beginning in March 2018, if the running mean on any standard assay over time (five sample moving average) exceeds the 2x standard-deviation limits, the batches associated to those samples causing the exceedance are re-assayed. As in the previous period, if a single sample exceeds the 3x standard-deviation limits, the associated batch is re-assayed.
Hecla Mining Company | Greens Creek Mine, SLR Project No: 101.00632.00020
Technical Report Summary - February 21, 2022
Table 8‑2: Standards Used at Greens Creek Since 2008
Hecla Mining Company – Greens Creek Mine
Standard Name | STD K | STD L | STD N | STD P | STD Q | STD-ME-15 | STD S | STD T | STD S14 |
Description | 200S Massive Ore Standard | 5250 Low Grade Ore Standard | Gallagher Low Grade Ore Standard | NWW Massive Ore Standard | 200S Exploration Grade Standard | Purchased from CDN | Exploration Grade Standard | Low Grade Ore Standard | Exploration Grade Standard |
| | | | | | | | | | |
Source Material | Greens Creek UG Bulk Sample | Greens Creek UG Bulk Sample | Greens Creek UG Drill Core | Greens Creek UG Bulk Sample | Greens Creek UG Drill Core | Cerro de San Pedro deposit, San Luis Potosi, Mexico | Greens Creek UG Drill Core | Greens Creek UG Drill Core | Greens Creek UG Drill Core |
Years Used | 2008 | X | X | | | | | | | |
| | 2009 | X | X | X | | | | | | |
| | 2010 | X | | X | X | | | | | |
| | 2011 | X | X | X | X | X | | | | |
| | 2012 | X | | X | X | X | X | | | |
| | 2013 | | | X | X | X | X | X | X | |
| | 2014 | | | X | X | | X | X | X | |
| | 2015 | | | X | X | X | X | X | X | X |
| | 2016 | | | | | X | X | | | X |
| | 2017 | | | | | | | | | |
| | 2018 | | | | | | | X | | X |
| | 2019 | | | | | | | | | |
| | 2020 | | | | | | | | | |
Hecla Mining Company | Greens Creek Mine, SLR Project No: 101.00632.00020
Technical Report Summary - February 21, 2022
Standard Name | STD T14 | STD U | STD V | BLK-BHQ1 | BLK-MBL1 | BLK-BHQ2 | STD V17 | STD T17 | STD U18 |
Description | Moderate Grade Ore Standard | Exploration Grade Standard | Moderate Grade Ore Standard | Blank Rock Standard (basalt) | Blank Rock Standard (marble) | Blank Rock Standard (basalt) | 5250 High Grade Ore Standard | 9A Moderate Grade Ore Standard | Low Grade Standard |
| | | | | | | | | | |
Source Material | Greens Creek UG Drill Core | Greens Creek UG Drill Core | Greens Creek UG Drill Core | Brown’s Hill Quarry, Fairbanks | Vigaro Marble Chip Landscape Rock | Brown’s Hill Quarry, Fairbanks | Greens Creek UG Bulk Sample | Greens Creek UG Bulk Sample | Greens Creek UG Drill Core |
Years Used | 2008 | | | | | | | | | |
| | 2009 | | | | | | | | | |
| | 2010 | | | | | | | | | |
| | 2011 | | | | | | | | | |
| | 2012 | | | | | | | | | |
| | 2013 | | | | | | | | | |
| | 2014 | | | | | | | | | |
| | 2015 | X | | | | | | | | |
| | 2016 | X | X | X | | | | | | |
| | 2017 | X | X | X | X | | | | | |
| | 2018 | X | X | X | X | | | X | X | X |
| | 2019 | | | | X | | | X | X | X |
| | 2020 | | | | X | X | X | X | X | X |
Hecla Mining Company | Greens Creek Mine, SLR Project No: 101.00632.00020
Technical Report Summary - February 21, 2022
Table 8‑3: Standards Used at Greens Creek – Source, Characterization, and Recommended Values
Hecla Mining Company – Greens Creek Mine
Standard Name | STD K | STD L | STD N | STD P | STD Q | CDN-ME-15 | STD S | STD T | STD S14 |
Description | 200S Massive Ore Standard | 5250 Low Grade Ore Standard | Gallagher Low Grade Ore Standard | NWW Massive Ore Standard | 200S Exploration Grade Standard | Low Grade Ore Standard | Exploration Grade Standard | Low Grade Ore Standard | Exploration Grade Standard |
| | | | | | | | | | |
Source Material | UG Bulk Sample | UG Bulk Sample | UG Drill Core | UG Bulk Sample | UG Drill Core | Commercial | UG Drill Core | UG Drill Core | UG Drill Core |
| | | | | | | | | | |
Source Facility | Hazen Research Inc. | Hazen Research Inc. | Hazen Research Inc. | Hazen Research Inc. | CDN | CDN | CDN1 | CDN | CDN2 |
| | | | | | | | | | |
Certificate Date | 5-May-2000 | 2-Dec-2003 | 6-Nov-2006 | 14-Apr-2010 | May, 2010 | 2012 | Oct, 2012 | Oct, 2012 | Aug, 2014 |
Certificate Values |
AuA | 0.794 oz/ton | 0.051 oz/ton | 0.062 oz/ton | 0.193 oz/ton | 0.006 oz/ton (0.193 g/t) | 0.04 oz/ton (1.386 g/t) | 0.011 oz/ton (0.371 g/t) | 0.072 oz/ton (2.482 g/t) | 0.026 oz/ton (0.902 g/t) |
| | | | | | | | | | |
Ag | 13.2 oz/ton | 13.6 oz/ton | 4.62 oz/ton | 9.2 oz/ton | 0.385 oz/ton (13.2 ppm) | 0.992 oz/ton (34 g/t) | 0.216 oz/ton (7.4 ppm) | 8.225 oz/ton (282 ppm) | 0.202 oz/ton (7 ppm) |
| | | | | | | | | | |
Cu | 0.229 % | 0.186% | 0.129% | 0.244% | - | 0.014 % | 0.215% | 0.197% | 0.01% (95.1 ppm) |
| | | | | | | | | | |
Pb | 6.75% | 1.64% | 2.56% | 10.7% | 0.35% | 0.413% | 0.05% | 3.35% | 0.09% (871 ppm) |
| | | | | | | | | | |
Zn | 17.4% | 3.54% | 4.99% | 19.4% | 0.67% | 0.251% | 0.214% | 7.34% | 0.2% (1961 ppm) |
| | | | | | | | | | |
Fe | 15.7% | 1.67% | 6.88% | 16.4% | 8.9% | - | 10.34 % | 3.01% | 5.82% |
Hecla Mining Company | Greens Creek Mine, SLR Project No: 101.00632.00020
Technical Report Summary - February 21, 2022
Standard Name | STD T14 | STD U | STD V | BLK-BHQ1 | BLK-MBL1 | BLK-BHQ2 | STD V17 | STD T17 | STD U18 |
Description | Moderate Grade Ore Standard | Exploration Grade Standard | Moderate Grade Ore Standard | Blank Rock Standard | Blank Rock Standard | Blank Rock Standard | 5250 High Grade Ore Standard | 9A Moderate Grade Ore Standard | Low Grade Standard |
| | | | | | | | | | |
Source Material | UG Drill Core | UG Drill Core | UG Drill Core | Quarried Basalt | Quarried Basalt | Quarried Basalt | UG Bulk Sample | UG Bulk Sample | UG Drill Core |
| | | | | | | | | | |
Source Facility | CDN2 | CDN2 | CDN2 | Browns Hill Quarry, Fairbanks | Vigaro Marble Chip Landscape Rock | Browns Hill Quarry, Fairbanks | CDN2 | CDN2 | CDN2 |
| | | | | | | | | | |
Certificate Date | Sept, 2014 | Aug, 2016 | Aug, 2016 | 2017 | 2020 | 2020 | June, 2018 | June, 2018 | Sept, 2018 |
Certificate Values |
Au | 0.198 oz/ton (6.78 g/t) | 0.016 oz/ton (0.547 g/t) | 0.037 oz/ton (1.262 g/t) | - | - | - | 0.078 oz/ton (2.663 g/t) | 0.1 oz/ton (3.422 g/t) | 0.011 oz/ton (0.36 g/t) |
| | | | | | | | | | |
Ag | 6.154 oz/ton (211 ppm) | 1.511 oz/ton (51.8 ppm) | 9.421 oz/ton (323 ppm) | - | - | - | 66.79 oz/ton (2290 ppm) | 10.821 oz/ton (371 ppm) | 2.094 oz/ton (71.8 ppm) |
| | | | | | | | | | |
Cu | 0.600% | 0.097% | 0.272% | - | - | - | 0.877% | 0.215% | 0.077% |
| | | | | | | | | | |
Pb | 5.01% | 1.36% | 3.85% | - | - | - | 5.51% | 5.83% | 0.34% |
| | | | | | | | | | |
Zn | 19.85% | 2.74% | 8.43% | - | - | - | 10.43% | 13.84% | 1.12% |
| | | | | | | | | | |
Fe | 25.25% | 7.99% | 9.16% | - | - | - | 5.29% | 17.61% | 6.13% |
Notes:
| | 1. | CDN values for Au and Pb are provisional; all other elements are certified |
| | 2. | CDN certified values based on aqua-regia digest, four acid digest results also provided in certificate. |
Hecla Mining Company | Greens Creek Mine, SLR Project No: 101.00632.00020
Technical Report Summary - February 21, 2022
Rejected jobs are re-assayed for the element or elements that failed. Control charts are generated and reviewed by year; all standards have performed with satisfactory accuracy and precision for Au, Ag, Pb, and Zn throughout their use. An example of the statistics and control charts reviewed for Standard T17 for 2020 is presented in Table 8‑4 and Figure 8‑1 for Ag and Au, and Figure 8‑2 for Pb and Zn.
The statistics and controls charts show some variability with a few instances outside the 2x standard deviation ‘warning limits’. Most of the data and the overall trends are within the acceptance limits for the period indicating acceptable accuracy and precision for the metal analyses.
Table 8‑4: Standard T17 2020 Analytical Results – Bureau Veritas
Hecla Mining Company – Greens Creek Mine
Statistic |
# of Analyses | 333 | 333 | 333 | 333 |
# Outside Warning Limit | 12 | 3 | 55 | 17 |
# Outside Error Limit | 0 | 0 | 8 | 0 |
# of Analyses below Threshold | 0 | 0 | 0 | 0 |
% Outside Error Limit | 0 | 0 | 2.4 | 0 |
| | Ag_ICP_oz/ton | Au_FA_oz/ton | Pb_ICP_% | Zn_ICP_% |
Mean | 10.83 | 0.097 | 5.9 | 13.6 |
Median | 10.80 | 0.097 | 5.9 | 13.7 |
Min | 10.16 | 0.084 | 5.5 | 12.9 |
Max | 11.65 | 0.113 | 6.4 | 14.4 |
Standard Deviation | 0.25 | 0.004 | 0.13 | 0.28 |
% Rel. Std. Dev. | 2.33 | 4.435 | 2.20 | 2.03 |
Coeff. Of Var. | 0.02 | 0.044 | 0.02 | 0.02 |
Standard Error | 0.01 | 0.000 | 0.01 | 0.02 |
% Rel. Std. Err. | 0.13 | 0.243 | 0.12 | 0.11 |
Total Bias | -0.02 | -0.019 | -0.01 | -0.005 |
% Mean Bias | -1.51 | -1.872 | -1.3333 | -0.46 |
Hecla Mining Company | Greens Creek Mine, SLR Project No: 101.00632.00020
Technical Report Summary - February 21, 2022
Figure 8‑1: Standard Control Charts – Standard T17: Ag, Au – Bureau Veritas 2020
Hecla Mining Company | Greens Creek Mine, SLR Project No: 101.00632.00020
Technical Report Summary - February 21, 2022
Figure 8‑2: Standard Control Charts – Standard T17: Pb, Zn – Bureau Veritas 2020
Hecla Mining Company | Greens Creek Mine, SLR Project No: 101.00632.00020
Technical Report Summary - February 21, 2022
Prior to late 2017, no coarse blank material was used except for BV’s internal blanks. To begin a blank program, a minus one inch crushed basalt was purchased from the Browns Hill Quarry in North Pole, AK, so that sample preparation and analytical processes could be tested. Starting in October 2017, blanks samples were inserted within each mineral intercept with an overall insertion rate of approximately one in 20 samples. The performance limits for this material are being evaluated as the analytical database increases.
For the coarse blank standards, any blank registering more than 3x the assay detection limit is reviewed. If the amount of contamination could contribute 10% or more of the metal seen in adjoining samples, the possibly contaminated samples are noted to the resource geologist. Though the contamination may have come during the comminution stage, the pulps of the likely contaminated sample are re-assayed. Pulp blanks inserted by the laboratory are also reviewed to determine if the contamination is occurring during the analytical stage. A letter is also sent to the preparation laboratory, notifying them of any contamination.
Blanks statistics and controls charts for 2020 are presented in Table 8‑5 and Figure 8‑3 for Au and Ag, and Figure 8‑4 for Pb and Zn. Blanks statistics and controls charts show acceptable metal analyses with few warnings and anomalous results for the period. One instance shows anomalous results for Pb and Zn; but no significant contamination is interpreted.
Table 8‑5: Blank BHQ1 – 2020 Analytical Results – Bureau Veritas
Hecla Mining Company – Greens Creek Mine
Statistics | ICP | FA |
| | (oz/ton Ag) | (% Pb) | (% Zn) | (oz/ton Au) |
Number of Analyses | 41 | 41 | 41 | 41 |
Number Outside Warning Limit | 0 | 0 | 0 | 0 |
Number Outside Error Limit | 0 | 0 | 0 | 0 |
% Outside Error Limit | 0 | 0 | 0 | 0 |
Mean | 0.0378 | 0.0030 | 0.0070 | 0.0001 |
Median | 0.0300 | 0.0010 | 0.0010 | 0.0001 |
Min | 0.0300 | 0.0010 | 0.0010 | 0.0001 |
Max | 0.2700 | 0.0200 | 0.0300 | 0.0001 |
Standard Deviation | 0.0392 | 0.0050 | 0.0080 | 0.0000 |
Hecla Mining Company | Greens Creek Mine, SLR Project No: 101.00632.00020
Technical Report Summary - February 21, 2022
Figure 8‑3: Standard Control Charts- Blank BHQ1: Au and Ag- Bureau Veritas 2020
Hecla Mining Company | Greens Creek Mine, SLR Project No: 101.00632.00020
Technical Report Summary - February 21, 2022
Figure 8‑4: Standard Control Charts- Blank BHQ1: Pb and Zn- Bureau Veritas 2020
Hecla Mining Company | Greens Creek Mine, SLR Project No: 101.00632.00020
Technical Report Summary - February 21, 2022
Coarse reject duplicate samples are randomly assigned at a rate of approximately one in every 36 samples by BV during the preparation stage of the process. These samples are an extra split from the crushed sample that is then treated as any other sample from that stage onward. Results for these samples are reported by the laboratory along with the primary assay results and are captured by the acQuire® database during the normal importing routine. The performance of these duplicates has been reviewed during various in-house quarterly and yearly studies and third-party audits.
From 2008 to present, pulp duplicate samples were randomly assigned at a rate of approximately one in every 36 samples and represent the repeat of a specific analytical run.
The current practice is to create a pulp duplicate for one in 20 samples. These duplicate samples are analyzed at BV with 50% of them also being analyzed at the Greens Creek Laboratory. Results for these samples are reported on the assay sheets and are imported into the acQuire database during the normal importing routine. The performance of these duplicates has been reviewed during various in-house quarterly and yearly studies and third-party audits. Scatterplots for the 2020 pulp duplicate data analyzed at BV are presented in Figure 8‑5 for Ag and Au, and Figure 8‑6 for Pb and Zn. The scatterplots show good agreement for Ag, Pb, and Zn in the important grade ranges, Au shows some variability. Additional checking for Au is ongoing.
Hecla Mining Company | Greens Creek Mine, SLR Project No: 101.00632.00020
Technical Report Summary - February 21, 2022
Figure 8‑5: Pulp Duplicate Analyses for Ag and Au- Bureau Veritas 2018
Hecla Mining Company | Greens Creek Mine, SLR Project No: 101.00632.00020
Technical Report Summary - February 21, 2022
Figure 8‑6: Pulp Duplicate Analyses for Pb and Zn- Bureau Veritas 2020
Hecla Mining Company | Greens Creek Mine, SLR Project No: 101.00632.00020
Technical Report Summary - February 21, 2022
Samples for check assays are selected by the project geologist at a rate of approximately one in forty project samples. The project geologist assigns this designation based on lithology, with preference given to mineralized lithologies. An extra split is taken after pulverizing and returned to the project geologist. The project geologist dispatches a group of check samples to the Greens Creek Laboratory which is used as a check laboratory. Results are imported into the acQuire® database. The performance of these check assays has been reviewed during various in-house quarterly and yearly studies and third-party audits. Scatterplots for the 2020 pulp check data analyzed at the Greens Creek Laboratory are presented in Figure 8‑7 for Ag and Au, and Figure 8‑8 for Pb and Zn. Overall, the check assays agree satisfactorily with the original assays. There is some higher variance at low grades for all metals, but no observable bias. Further analysis of the check assays from the Greens Creek Laboratory is ongoing.
Hecla Mining Company | Greens Creek Mine, SLR Project No: 101.00632.00020
Technical Report Summary - February 21, 2022
Figure 8‑7: Pulp Check Analyses – Greens Creek Mine Laboratory: Ag, Au – 2020
Hecla Mining Company | Greens Creek Mine, SLR Project No: 101.00632.00020
Technical Report Summary - February 21, 2022
Figure 8‑8: Pulp Check Analyses – Greens Creek Mine Laboratory: Pb, Zn – 2020
Hecla Mining Company | Greens Creek Mine, SLR Project No: 101.00632.00020
Technical Report Summary - February 21, 2022
Drill hole and production face-sampling data are captured in a SQL database at Greens Creek that utilizes acQuire® software. These data include drill hole collars, down-hole surveys, assays, and geological descriptions. Standard database management techniques are utilized that limit access and user rights to ensure data integrity. The acQuire® system also has many built-in features that restrict data import and approvals and perform some data checking.
A drill hole data set is created for each zone based on geographic limits. Where drilling pierces multiple zones, caution is exercised to be certain that mineralization in a drill hole is properly assigned to its appropriate zone.
Primary original documents, logs, down-hole surveys, core photographs, and assay certificates are cataloged and stored on site. Digital copies are stored on networks drives that are routinely backed-up with copies stored in off site locations.
8.8 | Drill Core and Sample Chain-of-Custody and Security |
Drill core is transported to the core shed at the end of each drill shift by the drill crews and quick-logged each morning by the geology staff. Core is stored on surface at the 860-core shed until it can be logged.
After logging, core is separated into sampled and unsampled intervals and each is placed on a separate pallet. Core Technicians transport the pallets of core to be sampled to the underground sampling facility where it is cut or whole-sampled depending on the type of hole drilled. Samples are bagged in sturdy cloth bags and labeled with barcoded sample tags with a second sample tag in the bag. Bags are tied shut with string. Two samples are placed in a rice bag which is labeled with the dispatch number and number of that rice bag in the dispatch. A sample submittal form and standard samples are included in the first rice bag of the dispatch. Rice bags are placed into a supersack with one or more dispatches to fill the sack. All samples in each dispatch are kept together in a single super sack and the super sacks are labeled with the dispatches inside.
Supersacks are loaded into a shipping container and, when ready for shipment, a shipping manifest is created for the Warehouse and Surface Operations noting the container number and the contents. The shipping manifest and digital copies of the sample submittals are emailed to the BV Juneau Laboratory Manager. Surface Operations personnel transport the container to the dock at Hawk Inlet and it is loaded onto an Alaska Marine Lines (AML) barge. That barge is transported to Juneau and the container is delivered to the Juneau Prep laboratory by AML at which point the laboratory takes possession of the samples. AML is in possession of the container and samples while on the barge and the person receiving the container during delivery is recorded by AML. The progress of the container is tracked online from shipping to receiving.
The SRM inventory, returned coarse reject and pulp samples are secured and kept in locations with restricted access. The core is stored within the original boxes in a remote underground drift designated as a core archive.
Hecla Mining Company | Greens Creek Mine, SLR Project No: 101.00632.00020
Technical Report Summary - February 21, 2022
8.9 | Comments on Sample Preparation, Analyses, and Security |
In the SLR QP’s opinion, the sample preparation, analyses, and security procedures at the mine are acceptable, meet industry standard practice, and are adequate for Mineral Resource and Mineral Reserve estimation and mine planning purposes. In the SLR QP’s opinion, the QA/QC program as designed and implemented by Hecla at the mine is adequate and the assay results within the database are suitable for use in a Mineral Resource estimate, based on the following:
| | ● | Face sampling covers sufficient area and is adequately spaced to support mine planning. |
| | ● | Drill sampling is adequately spaced to first define, then infill, base metal anomalies to provide prospect-scale and deposit-scale drill data. |
| | ● | Since 2008, data have been collected following industry standard sampling protocols (see Section 9 for discussion of third-party reviews). |
| | ● | Sample collection and handling of core is undertaken in accordance with industry standard practices, with procedures to limit potential sample losses and sampling biases. |
| | ● | Sample intervals in core, comprising one foot to five feet (0.3 m to 1.5 m) intervals, are considered to adequately represent the true thicknesses of mineralization. Not all drill material may be sampled depending on location and alteration. |
| | ● | Sample preparation for samples that support Mineral Resource estimation has followed a similar procedure since 2008. The preparation procedure is in line with industry standard methods for polymetallic deposits. |
| | ● | Exploration and infill core programs are analyzed by independent laboratories using industry standard methods for gold, silver, lead, zinc, copper, iron, and barium analyses. Current run-of-mine sample analyses are performed by the Greens Creek Laboratory. |
| | ● | SG determination procedures are consistent with industry standard procedures. There are sufficient acceptable SG measurements to support the values utilized in tonnage calculations. |
| | ● | Limited information is available on the QA/QC for the pre-1998 drill programs; however, sufficient programs of re-analysis have been performed that the data can be accepted for use in estimation (refer to Section 9). |
| | ● | Typically, drill programs include the insertion of blank, duplicate, and standard samples. The QA/QC program results do not indicate any problems with the analytical programs, therefore the analyses from the core drilling are suitable for inclusion in Mineral Resource and Mineral Reserve estimation. |
| | ● | Data collected are subject to validation, using in-built program triggers that automatically check data upon import to the database. |
| | ● | Verification is performed on all digitally-collected data on import to the main database, including checks on surveys, collar co-ordinates, lithology data, and assay data. The checks are appropriate and consistent with industry standards. |
| | ● | Sample security relies on the fact that the samples are always attended or locked in the on site logging or sampling facilities. Chain-of-custody procedures consist of filling out sample submittal forms that are sent to the laboratory with sample shipments and shipment tracking to ensure that all samples are received by the laboratory. |
| | ● | Current sample storage procedures and storage areas are consistent with industry standards. |
Hecla Mining Company | Greens Creek Mine, SLR Project No: 101.00632.00020
Technical Report Summary - February 21, 2022
Hecla and the Greens Creek Joint Venture (GCJV) operators have consistently involved third-party consultants in database reviews, Mineral Resource and Mineral Reserve estimates, and mine audits. This work is summarized in the following subsections, categorized below as ‘legacy’ (performed for the Greens Creek Joint Venture), and ‘Hecla’ (performed for Hecla after the company became 100% owner/operator of the Property in 2008).
9.1.1.1 | Mineral Resource Development Inc., 1997 |
A face-sampling study was conducted by Mineral Resource Development, Inc. (MRDI) to check for sampling bias, and to determine the level of reproducibility obtainable from face sampling, using a modified sample preparation protocol. Sample preparation and assay protocols were formulated to provide the analytical precision required.
9.1.1.2 | Mineral Resource Development Inc., 1998 |
A review of the 1994 Southwest Feasibility Study (1994 FS) block models and their reconciliation to production for the Southwest Zone was undertaken.
The principal conclusions were:
| | ● | The mineral zones in the Southwest Zone have been deformed by multiple events, to the extent that they can no longer be considered stratiform. |
| | ● | Overall, the 1994 FS model grade and tonnage have been confirmed by production (1997), with the exception of silver, which had been of lower grade than predicted. |
| | ● | The 1994 FS model is very inaccurate in terms of predicting the locations and grades of mineral types. |
| | ● | There was a significant amount of over-break and ore loss (particularly high silver zones) which resulted in a higher tonnage at a lower grade reaching the plant than was predicted by grade-control data. To some extent this over-break was desirable, as the value of high grade material in the structurally complicated Southwest Zone exceeds the cost of dilution, i.e., it is important to take some dilution to ensure as much as possible of the ore is recovered. |
In June 1998, MRDI was contracted to assist in the preparation of Mineral Resource models for the three zones that were considered to be major contributors to the five year production schedule. The Southwest, Northwest West and 200 South zones were selected for this work. Greens Creek staff prepared all the geologic interpretations and worked under the direction of Dr. Harry Parker to develop appropriate modeling techniques including capping for gold and silver grades, composite length studies, and appropriate model estimation parameters model.
Review of the data collection and acquisition procedures showed that it followed industry standard practices for sampling, assaying, quality-control, and data entry and management. The interpreted mineralization envelopes were reasonable for the Southwest and 200 South zones. Concerns were expressed with the Northwest West model because the mixture of large, base metal, low grade areas of white carbonate mineral style with more massive, base metal-rich material could result in the over-projection of gold, lead, and zinc grades from composites of base metal-rich massive mineralization, and of silver grades from white carbonate mineral type. The results from the work completed by MRDI in 1998 have formed the basis for all subsequent modeling techniques up to 2018.
Hecla Mining Company | Greens Creek Mine, SLR Project No: 101.00632.00020
Technical Report Summary - February 21, 2022
9.1.1.3 | Mineral Resource Development Inc., 1999 |
A review was completed on the 5250 Zone model and Mineral Resource estimate reported in February 1999. The model was found acceptable for the purposes of reporting Mineral Resource estimates for the zone. Similar reviews were performed on the Southwest, Northwest West and 200S Zone models and estimates. The database was found to be acceptable for use in Mineral Resource estimation, and the resulting estimates were considered adequate for all three zones.
Recommendations relating to modeling and estimation focused on timely QA/QC reviews, data entry and data validation, and appropriate data archiving.
A review of the 1999 operating plan was performed in December 1999 on behalf of Standard Bank London Limited in support of the Project acquisition by Hecla and Pan American Silver Corporation. The operating plan was found to represent an appropriate response to the ongoing development of the Greens Creek operation, and the assumptions in the proposed operating and development plan were considered to be reasonable. A recommendation was made that documentation supporting mine plans should be collated.
In October 2002, AMEC, the successor company to MRDI, audited the block model for the Central Zone. The evaluation compared the updated 2001 block model with that of the block model completed in 2000 and determined that a new model would be required. Recommendations were made in relation to modeling methods and reconciliation evaluations.
A Mineral Resource/Mineral Reserve audit was performed in December 2002 on the 2002 estimates to review supporting data, Mineral Resource estimates, mine designs and Mineral Reserve estimates to give an assessment of the reasonableness of the Greens Creek Mineral Reserve statement. The emphasis of the audit was on the 9A, Central West, 5250, Southwest Bench and Deep Southwest zones. Reviews of mine designs were conducted for the East, 200 South, Southwest, and Northwest West zone deposits. The independent review confirmed the 2002 Mineral Resource/Mineral Reserve statement.
A number of recommendations were made to address the areas of QA/QC management, consistent reproducibility of Au values at Acme, provision of documentation in relation to Mineral Resource/Mineral Reserve conversion procedures and supporting information and, establishment of grade control procedures in areas mined by longhole methods.
The Greens Creek Joint Venture produced new Mineral Resource models in 2003. AMEC reviewed the changes and assisted in the completion of new models or model updates for two mineral zones, namely the 9A and Northwest West zones. In addition, AMEC reviewed the conversion of Mineral Resources to Mineral Reserves for the Northwest West Zone.
Hecla Mining Company | Greens Creek Mine, SLR Project No: 101.00632.00020
Technical Report Summary - February 21, 2022
Drilling, sampling, sample preparation and assaying methods were considered to meet or exceed industry standard practice and results were considered adequate to support Mineral Resource estimates. Density measurements were adequate to support tonnage estimates. Minor errors with the down-hole survey data were not considered to affect estimates and could be remediated. The assay database showed an acceptable low error rate. Mineral Resource estimates for the 9A and Northwest West zones were accepted as reasonable. Conversion of the Mineral Resources at the Northwest West Zone to Mineral Reserves was considered to use appropriate modifying factors and the mine plan was achievable in the time-frame contemplated.
Recommendations included change of support analysis for Measured and Indicated Mineral Resources, and evaluation and quantification of dilution percentages to be expected by stope during mining activities.
AMEC reviewed supporting data, Mineral Resource estimates, mine designs and Mineral Reserve estimates to give an assessment of the reasonableness of the Mineral Reserve statement for 2005. The deposits reviewed were Northwest West, 5250, Southwest Bench and 200S zones.
AMEC found the error rate for the lithology, sampled intervals, assays, and down-hole surveys to be acceptable, and considered the database acceptable for use in Mineral Resource estimation. Assay quality was controlled by a consistently applied system of standard reference materials (SRMs), pulp duplicate samples, coarse reject duplicate samples, and check assays. Mineral Resource and Mineral Reserve estimates were considered to be appropriately estimated.
Recommendations included: updating the database with missing Ba and ICP assays; checks of the methods whereby down-hole survey data are uploaded; review of potential assay bias at Acme for Ag and Pb; review of density values assigned to high Ba material; and quantification of dilution percentages to be expected by stope during drift and fill, primary longhole, and secondary longhole mining activities.
9.1.2 | Hecla Database and Verification |
In 2008, AMEC audited the databases, data transfer, and data storage procedures for the 5250N, Northwest West and Gallagher zones. No significant errors that would preclude Mineral Resource or Mineral Reserve estimates were noted. A number of recommendations were made to address program improvements and to implement incremental checks and additional validation steps in the data collection, QA/QC verification, modeling, and estimation processes.
AMEC found the error rate for lithology codes within the mineral zones, sampled intervals, and assays in the Greens Creek databases to be acceptable to support Mineral Resource estimation for the Gallagher and 5250N zones, but found the error rate close to 1% for lithology and greater than 1% for assays in the Northwest West Zone. AMEC was unable to determine the precision of Au, Ag, Pb and Zn assays.
Key recommendations included:
| | ● | Integration of the QA/QC data into the site acQuire database. |
| | ● | Reviewing of inconsistencies in Ba and ICP data. |
| | ● | Procedures to ensure that errors identified with the database during the Datamine® modeling could be updated in acQuire®. |
| | ● | Review of potential high biases in Pb and Ag results at Acme. |
Hecla Mining Company | Greens Creek Mine, SLR Project No: 101.00632.00020
Technical Report Summary - February 21, 2022
| | ● | Implementation of incremental checks and additional validation steps in the data collection and model completion process. |
| | ● | Checks on the amount of contact dilution allowed for in the models. |
AMEC also audited the Mineral Reserve and Mineral Resource statement. Scope items included auditing the database and review of supporting data, Mineral Resource estimates, mine designs, and Mineral Reserve estimates to give an assessment of the reasonableness of the Mineral Reserve statement for 2007. Mineral Resource estimates for the 5250N and Gallagher zones were reviewed, Mineral Reserve estimates were reviewed for Northwest West and 5250N zones, and the database was audited for all three zones.
AMEC was requested to provide technical assistance with auditing the Project database and building of wireframe models for five zones (the Northwest-West, Upper Plate, Northwest-West South, 200 South-Deep, and Gallagher zones) and the old mining area of East Zone. The database audit was only partially completed, as only a portion of the QA/QC files were available at the time of the audit. Wire-frame modeling of the East Zone was also only partially completed due to time constraints.
Recommendations from this work included identifying and filing documentation of historic drill logs and collar details, maintenance of QA/QC data to facilitate data verification, validation of collar locations, review of East Zone survey measurements after magnetic declination is applied, modification of sampling protocols so that mineralization in non-traditional mineral lithologies is assayed, and improvement of database storage and import procedures between the acQuire® database and the Datamine® modeling and estimation software.
AMEC performed a review of the 2009 Mineral Resources and Mineral Reserves for 5250 and 9A zones, including reviews of supporting data, Mineral Resource estimates, mine designs, and Mineral Reserve estimates.
AMEC found the error rate for the lithology, sampled intervals, assays and down-hole surveys to be acceptable and considered the database acceptable for use in Mineral Resource estimation. Assay quality was controlled by a consistently-applied system of SRMs, pulp duplicate samples, coarse reject duplicate samples, and check assays. AMEC did not find a fatal flaw in mine operations, planning, scheduling, or budgeting that would prevent Hecla from executing their plans to mine the 5250 and 9A Mineral Reserves.
Recommendations arising from the audit included notations relating to inclusion of Ba and “over-limit” samples for Zn in the database, investigation of potential assay biases at Acme and the Greens Creek Laboratory, continued recommendations for real-time QA/QC monitoring, density assignments for white barite ore, and reconciliation.
AMEC was requested to conduct a review of Hecla’s 2011 Mineral Resources and Mineral Reserves for the Deep 200 South, Southwest Bench, East Zone, and Gallagher zones in early 2012. This report was finished and received by Hecla in September 2014.
AMEC found that the definition of the domains was done using applicable and reasonable parameters, care, and execution. Grade capping and compositing was found to be reasonable, and variography was adequately executed. Estimation plans were found to be adequate, and AMEC agreed with the Mineral Resource classification methods applied.
Hecla Mining Company | Greens Creek Mine, SLR Project No: 101.00632.00020
Technical Report Summary - February 21, 2022
The mining review focused on the Southwest Bench Zone, as mining was active in this zone. AMEC did not find any fatal flaws in mine operations, planning, scheduling, or budgeting that would prevent Hecla from executing its plans to mine the Southwest Bench Mineral Reserve. Reconciliation between actual mined and model depletion showed significant variation and required addressing. Regular geotechnical reviews were recommended as mining advances. The development plan and equipment were considered appropriate for the Southwest Bench Zone.
Recommendations arising from the audit included compiling more formal documentation for Mineral Resource model reports for each mineralized zone; improving Mineral Resource model archiving procedures; investigating more comprehensive variography procedures, including locally varying anisotropy; tracking each mining area by tons produced by mining method, and capturing those volumes mined for the depletion model; generating a detailed ventilation model that shows areas by equipment used to improve the effectiveness of the total allotted airflows; creating an equipment maintenance schedule that showed the equipment purchase, rebuild, breakdowns, and planned maintenance schedule by maintenance bay and the personnel allotted to each in order to enable a more proactive approach to maintenance; production histories were recommended to be kept for each mining block; and production forecasts were recommended to include appropriate dilution and recovery.
9.1.2.4 | AMEC Foster Wheeler, 2016 |
Hecla Greens Creek Mining Company (HGCMC) commissioned Amec Foster Wheeler to review the Mineral Resource models constructed by Hecla in 2016 for the NWW Zone (NWW) and the 5250 Zone (5250). This review included a site visit the Hecla offices in Juneau, AK from October 31 to November 4, 2016. During the site visit, the construction of the Mineral Resource model was discussed and reviewed with Hecla staff.
The project scope was to review the Mineral Resource models for the NWW (effective date July 26, 2016) and 5250 (effective date July 14, 2016) mineral zones. A review of the database was not included in the scope of work and Amec Foster Wheeler did not audit the database.
Amec Foster Wheeler found no significant errors in the Mineral Resource modeling methodology and found that model validations supported the grade estimates. Recommendations included better documentation of procedures and production of a final written report documenting the data used, data analysis, model construction, grade estimation methods and tabulation of the Mineral Resources. Alternative methods for estimating density and a modified Mineral Resource classification method to remove unrealistic isolated blocks were also recommended. Amec Foster Wheeler also suggested the inclusion of a complete set of cross-sections for each metal be archived with the models.
9.1.2.5 | Roscoe Postle Associates, 2017 |
Roscoe Postle Associates Inc. (RPA), now part of SLR, was retained in 2017 by Hecla to complete a Mineral Resource and Mineral Reserve audit of Greens Creek to be used for internal purposes. At Hecla’s request, RPA’s audit focused on two of the nine mining zones, the 200 Deep South (200S) and Northwest West (NWW) zones. These zones contain approximately 50% of the Greens Creek Mineral Reserves.
RPA did not find any major issues in the Mineral Resource modeling methodologies but made many recommendations. The main recommendation was a modification to the workflow for the mineral selection/interpretation criteria to provide a more accurate reflection of the potentially economic mineralization and to be more flexible in responding to variations in metal prices and operating costs. To that end, RPA recommended that the NSR value using the Mineral Resource price deck be used to discriminate the potentially economic mineralization. Where possible, the mineral zone interpretation should also incorporate the detailed grade control mapping and sampling information. In 2017 and 2018, a new workflow was developed by the mine geology staff for mineral zone interpretation based on these recommendations. Testing and modifications of the Mineral Resource estimation workflow are ongoing.
Hecla Mining Company | Greens Creek Mine, SLR Project No: 101.00632.00020
Technical Report Summary - February 21, 2022
Other recommendations made by RPA included updating the Mineral Resource classification scheme to eliminate artifacts created from the model re-blocking process and to improve the accounting procedure for mined volumes. Minor recommendations focused on dilution grades, mining recovery for longhole stopes, and mining depletion.
Finally, RPA recommended that a set of Standard Operating Procedures be prepared that describe each of the steps in the preparation of the Mineral Resource and Mineral Reserve statements and include a formal peer review process and sign-off procedure to ensure that each step of the workflow is completed in a consistent and proper manner. All of RPA’s recommendations have been implemented or are in the process of being implemented.
Until 2006, all geological data were stored in an Ingres database. This became corrupted, but extraction of most files was possible. A period of approximately two years followed where the database consisted of a number of Microsoft Access® databases. In 2007 acQuire® software was purchased, and over the following three years, all data were transferred to the database. All drill hole assay data was reloaded from the original electronic assay files. All data were checked during the transfer process.
A standard set of referential integrity ‘logic’ checks are applied to the data as they are entered into the acQuire® database. These checks include checking for overlapping or gaps in intervals, validation of lithologic codes against lookup tables, and enforcement of unique records for sample numbers and drill hole names.
As data are extracted from the acQuire® database and brought into Datamine® for modeling, a second set of validation checks are performed. These checks include flagging drill holes with missing survey data, checking for overlapping intervals or gaps, lithologic code validation, flagging drill holes with anomalous calculated angular deviations, flagging sampled intervals that are missing assays or have returned values greater than the detection limit. Where errors are noted, the problems are corrected prior to the database being used for Mineral Resource estimation purposes.
9.2.1 | acQuire Database Health Check |
In early 2018, acQuire Software Pty Ltd was retained to perform a health check for the Greens Creek acQuire® database. A thorough review was requested to identify potential issues with the data, databases, and workspaces, and to recommend possible repair options and improvements. The database backups and acQuire® workspaces used for the health check were effective March 14, 2018.
This detailed review of the databases and workspaces found no serious issues that significantly impact database contents or integrity. Areas were identified where systems could be enhanced, cleaned up, or streamlined. The key recommendations for improving the existing system dealt with training of new users, database issues with missing, duplicate, or unnecessary fields, and upgrades to the acQuire® program and SQL Server maintenance and backups. Project personnel are working through the recommendations on the database issues.
Hecla Mining Company | Greens Creek Mine, SLR Project No: 101.00632.00020
Technical Report Summary - February 21, 2022
9.3 | SLR Data Validation Methods |
Validation of the Greens Creek mine geological data by SLR began with a personal inspection by the geological QP, conducted from September 21 and September 22, 2021 where the following activities were carried out by the geological QP:
| | ● | Visited the core shack where examples of the mineralization and enclosing host rocks were inspected, logging and sampling procedures reviewed, |
| | ● | Inspected the sample shipping arrangements, |
| | ● | Visited the sample sawing and density measurement facilities, |
| | ● | Visited several locations in the underground mines in which the nature of the mineralization was observed and the grade control mapping and sampling procedures were discussed, |
| | ● | Visited one of the drilling stations where the drilling equipment was reviewed and the drilling and survey procedures were discussed, |
| | ● | Carry out discussions with site geological staff in regards to the regional and local scale geology as well discussions on the potential for discovering additional mineralized deposits elsewhere on the Property, and |
| | ● | Visited some of the mine stockpile areas, in addition to conducting a brief tour of the plant to inspect the sampling points used to determine the tonnages and grades processed. |
A visit was made to the site sample preparation facility as well as the Greens Creek Laboratory during a previous site visit carried out in 2017.
In addition to personal inspections of the site, SLR carried out a program of validating the assay tables in the drill hole databases by means of spot checking a selection of drill holes that intersected the mineralization of the 200S, Northwest West, and 5250 deposits, as together these three deposits comprise the majority of the Mineral Resources and Mineral Reserves. SLR proceeded to carry out its drill hole database validation exercise by comparing the information contained within the assay tables of the digital databases against the assays presented in the original laboratory certificates. The selection of drill holes for validation considered the long production history of the mine and focused on those drill holes that contribute to the greater degree to the anticipated Mineral Resource and Mineral Reserve estimates.
Comparisons of the lithological information contained within the drill logs against the information contained within the digital databases were also carried out, as was a comparison of the results of the down-hole deviation measurements with those contained within the survey table of the drill hole database.
9.4 | Comments on Data Verification |
The process of data verification for the Project has been performed by external consultant firms from 1997 to 2013, as well as by Hecla personnel. Since 2013, all data verification has been done by project staff as the data are being collected and imported into the acQuire® database. The 2018 check on the acQuire® databases and workspaces carried out by Hecla found no serious deficiencies.
SLR considers that a reasonable level of verification is completed, and that no material issues would have been left unidentified from the programs undertaken. External reviews of the database have been undertaken in support of acquisitions, support of feasibility-level studies, and in support of Mineral Resource and Mineral Reserve estimates, producing independent assessments of the database quality. No significant problems with the database, sampling protocols, analytical flowsheets, check analysis program, or data storage were noted. Drill data are verified prior to Mineral Resource and Mineral Reserve estimation using various automated and manual checks.
Hecla Mining Company | Greens Creek Mine, SLR Project No: 101.00632.00020
Technical Report Summary - February 21, 2022
The SLR QP is of the opinion that the data verification programs undertaken on the data collected from the Project adequately support the geological interpretations, validate the analytical and database quality, and support the use of the data in Mineral Resource and Mineral Reserve estimation and in mine planning. No significant sample biases were identified from the QA/QC programs undertaken, and sample data collected adequately reflect deposit dimensions, true widths of mineralization, and the style of the deposit.
Hecla Mining Company | Greens Creek Mine, SLR Project No: 101.00632.00020
Technical Report Summary - February 21, 2022
10.0 | MINERAL PROCESSING AND METALLURGICAL TESTING |
10.1 | Metallurgical Test Work |
Since mill construction and startup, numerous internal and external studies have been performed to investigate metallurgical issues and support mill modifications. Many of these are listed in Table 10‑1.
Extensive initial test work programs were conducted at Noranda’s Matagami Lake and Mattabi laboratories in Ontario, and at Dawson Metallurgical Laboratory in Salt Lake City, UT, as compiled and summarized by Banning (1983). Composites of various mineral types were developed using drill core samples. Results of these programs allowed the development of the basic Greens Creek lead-zinc flotation flowsheet, with inclusion of a gravity gold circuit. Primary grinding requirements for the white mineral types and massive sulfide types were developed and use of stage addition for flotation reagents was established, along with collector and modifier recommendations. These programs demonstrated the desirability of a preliminary carbon removal pre-flotation step and re-grinding of rougher concentrates prior to cleaner flotation.
Following mill start-up, investigations were pursued regarding alternatives to the originally installed plane table used for gravity recovery of relatively coarse free gold. The plane tables had proved to be labor intensive and did not perform up to expectations. Screening trials indicated that available centrifugal gravity concentrators would create water balance issues and that gravity spiral concentrators had better performance. They also indicated that re-grinding of spirals concentrate prior to final cleaning with a shaking table improved product grades significantly. Plant trials with spirals confirmed the screening results and a revised gravity circuit utilizing concentrating spirals, concentrate re-grinding and final tabling was implemented (Sawyer, 1997).
Mill expansion by way of construction of a new building primarily devoted to cleaner flotation circuits also allowed reallocation of existing equipment and floor space in the original mill building. Bench scale test work followed by plant trials in 1999 to 2000 produced results used to develop modifications to the plant flowsheet, size and specify required equipment and analyze economic consequences of the expansion. Resulting concentrate assay improvements, improved recoveries, and economically favorable redistribution of payable metals among the various concentrates indicated overall recovery improvements of 2% for lead, 8% for zinc, 1.5% for silver and 2% for gold.
Several formal and informal studies have been performed during the life of Greens Creek which investigated causes of poor mill recoveries. Two examples are an exhaustive 2007 study (Reynolds, 2007), which examined a variety of mineral types and mill products, and a more focused 2009 study, which examined mill feeds producing particularly low recoveries, as well as examining more typical feeds for comparison (Blake, 2009). Both studies considered analytical and classic mineralogical results as well as SEM and other instrumental approaches. Both studies concluded that the principal cause of poor flotation recoveries was the presence of extremely fine-grained minerals and intergrowths that cannot be economically liberated by grinding.
Hecla Mining Company | Greens Creek Mine, SLR Project No: 101.00632.00020
Technical Report Summary - February 21, 2022
Table 10‑1: Greens Creek Metallurgical Studies
Hecla Mining Company – Greens Creek Mine
Title, year | | Facility | | Description |
Metallurgical Evaluation of the Greens Creek Orebody. Approx. 1983 (Banning, 1983) | | Matagami, Mattabi, Dawson Metallurgical | | Mineralogical, physical evaluations. Grinding studies. Flotation studies, including flowsheet development and reagent requirements. Gravity processing studies. Product evaluations. |
| | | | | |
Recovery of Gold by Gravity Separation at the Greens Creek Mine Alaska, 1997. (Sawyer, 1997) | | Greens Creek | | Describes test work, plant trials, evaluation and design of spirals gravity concentration circuit replacing original plane tables. |
| | | | | |
Three-Stage Lead and Zinc Cleaning for the Greens Creek Concentrator (Scheding, 2000) | | Greens Creek | | Summarizes bench scale and plant trial test work used for design and economic analysis of mill expansion via new cleaner building. |
| | | | | |
Performance Assessment and Optimization of the Greens Creek Grinding Circuit. (Jankovic, 2003) | | Greens Creek | | Review of Greens Creek grinding circuit performance. |
| | | | | |
Green’s Creek Mine: A Mineralogical Characterization of Selected Ores and Plant Products (Reynolds, 2007) | | Rio Tinto Research, Bundoora, Australia | | Extensive mineralogic investigation of mineral styles and mill products. |
| | | | | |
Greens Creek Mine: Silver and Base Metal Mineralogy of a Suite of Products from the Lead Circuit (Blake, 2009) | | Mineralogy Consultant, Clevedon, United Kingdom | | Mineralogic investigation of selected mineral feeds and mill products. |
| | | | | |
Cleaner Flotation on a New Sample of Baritic Ore: Our Project P-4167(Armstrong, 2011) | | Dawson Metallurgical | | Evaluation of metallurgical response of mineral from new 5250 Zone mining area. |
| | | | | |
Backfill Acid Consumption (Asarte, 2011) | | Greens Creek | | Investigation on effect of mine backfill on mill process pH and of effect of sulfuric acid on performance. |
| | | | | |
Report of Effects of Carbon Dioxide and Sulfuric Acid to Modify pH for Flotation of 90% Ore/10% Backfill Composite Feed (Peterson, 2012) | | Dawson Metallurgical | | Investigation of carbon dioxide use as process pH control reagent. |
| | | | | |
Initial Evaluation of Carbon Dioxide for pH Control at Greens Creek(Tahija, Initial Evaluation of Carbon Dioxide Use for pH Control at Greens Creek, 2012) | | Greens Creek, Dawson Metallurgical | | Discussion of test work results and preliminary economic evaluation of carbon dioxide use. |
| | | | | |
On site SEM analysis one year trial (2013) | | FEI/Bluecoast | | Investigation of grind performance and flotation performance on a daily basis |
| | | | | |
Gravity gold investigation
(2011-2015) | | Greens Creek | | Statistical studies of correlations between gravity gold recovery and mill and feed parameters. |
Hecla Mining Company | Greens Creek Mine, SLR Project No: 101.00632.00020
Technical Report Summary - February 21, 2022
The performance of the grinding circuit was reviewed in 2003 as part of planning for a contemplated increase in throughput. Findings included Bond Work Index values ranging from 11.9 kWh/ton to 12.8 kWh/ton, feed specific gravities ranging from 3.5 to 4.0 and Julius Kruttschnitt Mineral Research Centre (JKMRC) abrasion parameter (ta) values ranging from 0.51 to 0.88. Bond Index values referenced from a 1993 pilot plant ranged from 10.5 to 10.7 (Jankovic, 2003).
The grinding circuit and flotation circuit performance were monitored daily using an on site SEM for over a year through 2013. This data showed that much of the lead and silver could be collected using the second carbon column. The routing of the second carbon column was adjusted so the concentrate could be directed to the overall lead concentrate and allow for much of the lead and silver to be “scalped” off without the risk of recovery losses downstream. This resulted in an increase to the lead recovery of nearly 5% starting in September 2014.
Successful metallurgical testing was conducted on using carbon dioxide for pH control beginning in 2012 and implemented in the plant in early 2015. This resulted in an approximately 2% increase in lead recovery, a 5% increase in lead recovery, and a 3% increase in gold recovery.
Plant trial testing conducted throughout 2014 and into 2015 on an additional cleaning stage of gravity concentrating spiral in the gravity circuit has shown that a gold concentrate product could be made without the need for additional regrind and shaking table and then sent off site for further processing eliminating the need for a doré furnace as well. A third stage cleaner spiral was installed and implemented in the second half of 2015 and has resulted in an approximately 1% increase of gold recovery to gravity concentrate and has also eliminated the need for operation of a regrind mill and shaking table or the further processing of gold concentrate into doré.
On site plant trial testing in 2016 on the use of Woodgrove staged flotation reactor (SFR) cells showed better separation of zinc from iron in the swing cell and PM circuit. This was implemented in 2017 to improve zinc distribution to zinc concentrate and improve silver distribution to PM concentrate.
Metallurgical testing programs are continually conducted to evaluate possible changes in feed types from new mining areas, proposed changes in processing to improve recoveries and/or concentrate grades and to investigate factors causing lower than desired recoveries and concentrate grades. Some examples of such recent and current work include:
| | ● | Installation of FloatForce flotation agitators (2016 to present) |
| | ● | Investigation of vibratory mills for use in regrind stage (2018) |
| | ● | Investigation into alternative collector and promoter reagents (2017 to 2018) |
Hecla Mining Company | Greens Creek Mine, SLR Project No: 101.00632.00020
Technical Report Summary - February 21, 2022
Figure 10‑1 shows the change in throughput rate from 1989 through 2018.
Figure 10‑1: Incremental Throughput Improvements, 1989 through 2018
Production improvement efforts from commissioning through 2004 were centered mainly on increasing tonnage capabilities through the plant. This was a successful effort focused mainly in the grinding circuit and required minimal capital expenditures.
The cleaner expansion in 2000 was the first major capital project and was required to maintain the metallurgical performance at the increased throughput. Flotation capacity remained a significant issue and the cleaner circuits were again expanded in 2001 to help maintain metallurgical performance. In 2007, the lead rougher circuit capacity was expanded by 17% by adding two tank cells to the circuit.
10.2.2 | Flotation Strategy Advancement |
The plant was originally designed to skim off a small amount of high grade lead concentrate and then make a small amount of high grade zinc concentrate. The remaining flotation concentrates were directed to a PM sulfide concentrate. This strategy was effective because of the payment terms of the smelter contracts.
Efforts were made to maximize NSR by adjusting distributions and recoveries of the payable metals. Increasing lead concentrate production was the major goal in these efforts due to the more favorable payment terms for metals in this concentrate. The grade of the lead concentrate was allowed to drop in conjunction with increased lead and silver recovery to this concentrate.
In 2004, the market for PM concentrate was very tight due to the closure of several ISF plants. This forced a change in flotation strategy to prevent making large quantities of PM concentrate with limited marketability. Several flow changes in the plant enabled these changes to be effective. The lead concentrate grade targets were considerably reduced which increased lead concentrate quantities. The zinc targets remained constant and the additional throughput resulted in more zinc concentrate production. The PM production was significantly reduced to match market conditions. The change in strategy was necessary and recovery losses were minimized but evident.
Hecla Mining Company | Greens Creek Mine, SLR Project No: 101.00632.00020
Technical Report Summary - February 21, 2022
In 2018, smelter terms improved and resulted in partial payment of lead in zinc concentrate and zinc in lead concentrate. This resulted in large increases of recoveries for lead and zinc to a payable concentrate. Depending on smelter market conditions, treatment terms and conditions are expected to vary and may impact payable metals recoveries and payout.
Figure 10‑2 to Figure 10‑5 show the changes in concentrate production and throughput over time. The distributions of recovered silver and gold into the gravity products and concentrates are shown in Figure 10‑6 and Figure 10‑7. Figure 10‑8 shows the distribution of recovered zinc and lead into the respective lead, zinc, and PM concentrates.
Note that lead and zinc tonnage increased from 1989 to 2003 as the payables from PM concentrate sales became less favorable due to smelter market conditions as well as process and plant improvements made by Greens Creek. Lead concentrate grades slightly decreased over time due to favorable smelter terms allowing lower concentrate grades that resulted in higher lead recoveries. For similar reasons, but more dramatically, the zinc concentrate grades were significantly reduced with attendant recovery increases. After initial years of high zinc grades, the ability to lower the zinc concentrate grades resulted in higher zinc recoveries to the zinc concentrate; thereby, decreasing zinc recovery to the PM concentrate. The net effects on lead and zinc distributions to the respective primary concentrates to PM concentrate are shown in Figure 10‑4 and Figure 10‑5.
Figure 10‑2: Concentrate Production History, 1989 to 2018
Hecla Mining Company | Greens Creek Mine, SLR Project No: 101.00632.00020
Technical Report Summary - February 21, 2022
Figure 10‑3: Changes in Metal Grades in Primary Concentrates, 1989 to 2018
Figure 10‑4: Changes in Lead Distribution in Primary Concentrates, 1989 to 2018
Hecla Mining Company | Greens Creek Mine, SLR Project No: 101.00632.00020
Technical Report Summary - February 21, 2022
Figure 10‑5: Changes in Lead Distribution in Primary Concentrates, 1989 to 2018
Figure 10‑6: Distribution of Recovered Silver into Product Streams – 2018
Hecla Mining Company | Greens Creek Mine, SLR Project No: 101.00632.00020
Technical Report Summary - February 21, 2022
Figure 10‑7: Distribution of Recovered Gold into Product Streams – 2018
In 2018, overall plant gold recoveries averaged 65% to 68%. A graphical view of the average 2018 metal distributions into the gold gravity, two primary concentrates and PM concentrate are shown in Figure 10‑8.
Figure 10‑8: Distribution of Recovered Zinc and Lead into Product Streams – 2018
Hecla Mining Company | Greens Creek Mine, SLR Project No: 101.00632.00020
Technical Report Summary - February 21, 2022
Greens Creek mineralization is a typical example of a polymetallic mineral deposit wherein a number of different metals contribute to the total revenue of any given ton of material. The metals that contribute to the revenue stream are silver, lead, zinc, and gold. Copper, while present in the Greens Creek deposits, is not recovered as a marketable product by the plant, and so no value is assigned to this metal. Hecla has elected to apply a conventional NSR approach for use in discriminating between ore and waste material but has applied a slight modification to this approach by including the price of each of the individual metals as a discrete input variable, as compared to including the price of the metal within the NSR factor. The metal prices are set by the senior management team on an annual basis.
Greens Creek metallurgists annually update a concentrator recovery model to estimate the metallurgical distribution of mill products as a function of ore feed grades and concentrate product quality constraints. The model is developed through extensive process simulation work and monitoring of actual plant performance over the prior 16 month period. Results of this model, average marketing terms, and metal prices are then used to develop a simplified equation to estimate the NSR value of Greens Creek ore as a function of ore grades and metal pricing.
The simplified equation uses two formulas for estimating the NSR value. One equation estimates the NSR value derived from the gravity circuit, while the second equation estimates the NSR value derived from the flotation circuit. The sum of these two equations makes up the total NSR value for each block. The equations used to prepare the estimates of the 2022 Mineral Resources and Mineral Reserves are as follows:
| | ● | Flotation NSR = 0.3400 * Au(oz/ton) * Au($/oz) + 0.6862 * Ag(oz/ton) * Ag($/oz) + 23.26 * Pb(%) * Pb($/lb) + 7.68 * Zn(%) * Zn($/lb) – 3.609 * Fe(%) + 27.35 |
| | ● | Gravity NSR = If (Au(oz/ton)> 0.026, 0, (0.2465*Au(oz/ton)-0.0065) * Au($/oz) * 0.9289 |
| | ● | Total NSR = Flotation NSR + Gravity NSR |
The NSR formula factors are updated annually by the plant department with the most recent mill performance data to adjust for changes to the concentrator circuit, ore characteristics, and concentrate specifications. The NSR equations are used by the geology department to calculate the NSR in the geological block models.
10.2.4 | Projected Life of Mine Recoveries |
LOM projected recovery figures are as summarized in Table 10‑2.
Table 10‑2: Projected Life of Mine Recovery Estimates
Hecla Mining Company – Greens Creek Mine
Product | Recovery
(%) |
| | Lead | Zinc | Silver | Gold |
Lead Concentrate | 71.31 | 13.04 | 63.96 | 36.00 |
Zinc Concentrate | 5.46 | 62.50 | 7.46 | 5.13 |
PM Concentrate | 4.07 | 12.97 | 6.27 | 4.33 |
Gravity Concentrate | 0.36 | - | 0.48 | 19.10 |
Hecla Mining Company | Greens Creek Mine, SLR Project No: 101.00632.00020
Technical Report Summary - February 21, 2022
10.3 | Metallurgical Variability |
Samples selected for metallurgical testing during feasibility and development studies were representative of the various types and styles of mineralization within the different deposits. Samples were selected from a range of locations within the deposit zones. Sufficient sized samples were collected to ensure testing integrity.
| 10.3.1 | Mill Feed Variability |
The mine produces several mineral types differing in terms of mineralogy, mineral grain size and metals grades. Dilution rock types are also variable, with backfill from prior mining cycles typically being present in mill feed as well. No practical means of selective mining or stockpiling exists, as more than one mineralization type commonly is found even in a single working face and day to day production from multiple working places is necessary. Blending at the plant stockpile is utilized to maintain reasonably consistent mill feed over periods of a few days.
Mill control is largely based on process stream assays, as determined by on-line analyzers of these streams. Mill metals feed grades have an influence on recoveries, while gold and silver feed grades influence the precious metals grades of concentrates. Recoveries in the future are expected to be like those observed currently and experienced in past years.
10.3.2 | Backfill Materials in Mill Feed |
Backfill materials can be incorporated in the plant feed as diluting material mined in those portions of active stopes that are in direct contact with previous mining areas. Once in the plant, the backfill can raise flotation circuit pH levels, which can affect mill recoveries. Currently, Hecla manages fluctuating pH levels using carbon dioxide as a result of several studies completed (e.g., Asarte, 2011; Peterson, 2012; Tahija, 2012), and work remains ongoing to improve circuit performance on feed containing backfill.
In early 2011, the properties of average mill feed for 2012 to 2016 were estimated, in conjunction with geologic staff, on the basis of four major mineral types and average grades for each mineral type. During the summer and fall of 2011, mine geologists alerted the plant metallurgy staff when each mineral type would be available. Large samples of actual blasted and loaded mine muck produced from these faces were sampled to ensure that the sample would contain production-level amounts of dilution rock and backfill (Tahija, Large sample description, 2011).
Once adequate quantities of material representing each mineral type were collected, the sample lots were shipped to a firm specializing in crushing, blending, and splitting large mineral composites. A large composite weighing approximately 1,700 lb was prepared using a blending recipe, as directed by Hecla metallurgical staff, and split into smaller lots for ease in use (Phillips, 2011). These small lots, as well as leftover lots of the individual mineral types are held in refrigerated storage for use as needed in future metallurgical testing programs.
Hecla Mining Company | Greens Creek Mine, SLR Project No: 101.00632.00020
Technical Report Summary - February 21, 2022
The presence of the potentially deleterious elements arsenic, mercury and antimony was noted during initial testing (Banning, 1983). These elements are extremely difficult to separate due to the typical modes of occurrence, which are intergrowths or interstitial. Over the course of production and marketing, deleterious elements upon which customers have set limits include:
| | ● | Arsenic, mercury, and antimony in lead concentrates. |
| | ● | Magnesium, arsenic, mercury, and cadmium in zinc concentrates. |
| | ● | Magnesium, arsenic, mercury, and cadmium in PM concentrates. |
Penalties charges have been applied against some shipments from time to time, most commonly for arsenic and mercury content. Other potential deleterious elements have been identified in geological and concentrate analyses, including selenium, fluorine, and thallium. These have not been present in high concentrations; overall these have not been and are not expected to be a significant issue from a concentrate sale standpoint.
10.5 | Metallurgical Accounting |
The ‘filter cake balance’, based on the assays and weights of final mill products, is the official production balance and is the most accurate in the long term, but the least meaningful for day to day flotation circuit control, due to thickener and stock tank inventory changes. Manual sampling is employed at the filter cake bays after an interval of a specified number of cycles. The fine particle size, effective blending and random nature of cake discharge all act to limit segregation and bias. Filter press load cells are calibrated monthly with a static weight. The four-idler semi-autogenous grinding (SAG) mill feed weightometer is calibrated by chain to within 0.5% on each shutdown. Good long term assay agreement is obtained between measured mill feed at the flotation feed sampler and the plant feed as calculated from filter cake assays, wet filter cake production tonnages from the load cells and the moisture contents of filter cake samples. On an annual basis, agreement between measured and recalculated mill feed assays ranges from 0.5% to 2% (gold being the least reliable and silver being the most reliable).
Full-stream samplers are installed to sample flotation circuit products at the feed to each of the four thickeners. These assays are used, together with the SAG mill feed dry tonnage and the thickener feed mass flow loop measurements, as initial estimates in mass-balancing.
10.6 | Overall Process Monitoring and Control |
The plant is highly instrumented, with operators accessing information directly from local instrument readouts, Allen Bradley Panelview programmable logic controller (PLC) terminals in the control room, or from the supervisory control and data acquisition (SCADA) system. Monitoring of trends in measured variables, setpoints, and control outputs takes place in the SCADA system. The process control scope is generally restricted to automatic control around manual setpoints, although substantial PLC programming has allowed the development of some integrated SAG mill, thickener, pressure filter, and mill water balance control integration.
Hecla Mining Company | Greens Creek Mine, SLR Project No: 101.00632.00020
Technical Report Summary - February 21, 2022
11.0 | MINERAL RESOURCE ESTIMATES |
Mineral Resource estimates have been prepared for each of the nine deposits found on the Property. The Mineral Resource estimation workflow adopts a NSR strategy in which the key payable metals are gold, silver, lead, and zinc. Each of these four metals contribute to the overall value of the material in approximately equal amounts.
A two-stage approach is undertaken when preparing the mineralization wireframe outlines for the nine deposits. The wireframing process begins with the creation of wireframe outlines using a modelling threshold of $50 NSR/ton so as to outline continuous volumes of mineralized material. A second set of mineralization wireframes are created using a threshold value of $140 NSR/ton that outline the higher grade portions of the mineralization. Grades are estimated using the OK interpolation method for gold, silver, lead, and zinc using information from capped, composited drill hole data. Grades are also estimated for non-payable metals and elements such as barium, calcium, and iron. No capping values are applied to non-payable metals.
Density values are calculated using a formula that considers the estimated barium, calcium, iron, lead, and zinc grades for each block. Mineral Resources have been classified in accordance with the S-K 1300 definitions for Mineral Resources. Classification criteria are set after considering the continuity of the grades of silver and zinc from available drill hole sample information.
Mineral Resource statements are prepared exclusive of Mineral Reserves using block models that have been depleted for mining activities as of December 31, 2021. The Mineral Resource estimates were prepared by Hecla and reviewed and accepted by SLR. Mineral Resources are stated using a threshold value of $215 NSR/ton for all zones except for the Gallagher deposit, where a threshold value of $220 NSR/ton is applied. The Greens Creek Mineral Resource estimate as of December 31, 2021 is presented in Table 11‑1.
Table 11‑1: Summary of Mineral Resources – December 31, 2021
Hecla Mining Company – Greens Creek Mine
Category | Tonnage | Grade | Contained Metal |
| | (000 ton) | (oz/ton Au) | (oz/ton Ag) | (% Pb) | (% Zn) | (oz Au) | (oz Ag) | (ton Pb) | (ton Zn) |
Measured | - | - | - | - | - | - | - | - | - |
Indicated | 8,355 | 0.10 | 12.8 | 3.0 | 8.4 | 835,900 | 106,670,300 | 250,040 | 701,520 |
Measured + Indicated | 8,355 | 0.10 | 12.8 | 3.0 | 8.4 | 835,900 | 106,670,300 | 250,040 | 701,520 |
Inferred | 2,152 | 0.08 | 12.8 | 2.8 | 6.8 | 163,700 | 27,507,500 | 60,140 | 146,020 |
Notes:
| | 1. | Classification of Mineral Resources is in accordance with the S-K 1300 classification system. |
| | 2. | Mineral Resources were estimated by Hecla staff and reviewed and accepted by SLR. |
| | 3. | Mineral Resources are exclusive of Mineral Reserves and do not have demonstrated economic viability. |
| | 4. | Mineral Resources are 100% attributable to Hecla. |
| | 5. | Mineral Resource block models are prepared from drilling and sample data current as of October 31, 2021; all Mineral Resources have been depleted for mining as of December 31, 2021. |
| | 6. | Mineral Resources are based on the following metal prices and cut-off assumptions: $1,700/oz Au, $21/oz Ag, $1.15/lb Pb, $1.35/lb Zn, NSR cut-off of $215 NSR/ton for all zones except the Gallagher Zone, which used a $220 NSR/ton cut-off. |
Hecla Mining Company | Greens Creek Mine, SLR Project No: 101.00632.00020
Technical Report Summary - February 21, 2022
| | 7. | The reasonable prospects for economic extraction requirement for Mineral Resources is satisfied by application of criteria that consider the spatial continuity of blocks above the nominated cut-off value as well as the practical aspects of extraction by means of underground mining methods. |
| | 8. | Totals may not agree due to rounding. |
| | 9. | Reporting units are imperial, Tons: dry short tons (dst); Au (troy ounces/dst); Ag (troy ounces/dst); Pb and Zn percent (%). |
The SLR QP is of the opinion that with consideration of the recommendations summarized in Sections 1 and 23 of this TRS, any issues relating to all relevant technical and economic factors likely to influence the prospect of economic extraction can be resolved with further work.
The drill hole data used to prepare the year-end 2021 Mineral Resource estimates include assay information received as of the closing dates presented in Table 11‑2. While all drill hole information is stored in an Acquire master database, separate subsets of the drill hole information are extracted for each of the mineral deposits and used for preparation of the Mineral Resource estimates by importing the data subsets into the Leapfrog software package. While detailed grade control channel sample information is also collected and stored in the master database, these data are not used for estimation of the Mineral Resources but rather are used as guides for the preparation of the geological and mineralization interpretations. Only the drill hole assay data are used for the estimation of the various grades into the block models.
The drill hole intercepts in the master database are uniquely coded to each zone by the geologists based on their understanding of the three-dimensional spatial continuity of the various mineralized deposits; however, a single drill hole may intercept multiple zones and so may be included in more than one data subset. The coordinate system used for Mineral Resource modeling is the local geologic grid (geo-grid). The coordinate systems used at Greens Creek, and transform properties are discussed in Section 7.1.1.
Table 11‑2: Summary of Drill Hole Database Crystallization Dates
Hecla Mining Company – Greens Creek Mine
Zone | Database Crystallization Date |
East | October 31, 2021 |
West | October 31, 2021 |
9A | October 31, 2021 |
Northwest West | October 31, 2021 |
Southwest | October 31, 2021 |
200S | December 5, 2021 |
5250 | October 31, 2021 |
Gallagher | October 31, 2021 |
Upper Plate | October 31, 2021 |
Typically, non-mineralized units such as phyllite and argillite are assayed if they are observed to be mineralized with visually recognizable sulfides and are near the contacts with the massive/white sulfide mineral zones. Un-assayed samples are assigned a default grade of zero for all elements during the estimation process.
Hecla Mining Company | Greens Creek Mine, SLR Project No: 101.00632.00020
Technical Report Summary - February 21, 2022
11.3 | Geological Interpretation, Structure, and Mineralization Wireframes |
11.3.1 | Geological Interpretation |
Hecla Greens Creek geologists have long understood that the various mineralized zones are located in close spatial relation to the contact between the stratigraphic footwall phyllite units and the stratigraphic hanging wall argillite units. This contact is referred to as the mine contact. The current form and location of this mine contact is a result of several episodes of folding and faulting such that its geometry can be very complex in places. The location of the mine contact is interpreted from all available drill hole, geological mapping, and grade control information. The estimation procedure begins with the creation of a three dimensional surface of this mine contact using the Geo/Edge functions of the Leapfrog v.2021.1.3 software package. Additional surface and geological interpretations are completed using the Studio RM Datamine version 1.5.47.0 software package as needed. As no other significant lithological contacts or stratigraphic marker units are present in the immediate mine area, only the interpreted location of the mine contact is prepared.
11.3.2 | Structural Interpretation |
Three significant faults are recognized in the immediate mine area: the Kahuna Fault, the Maki Fault, and the Gallagher Fault. The Kahuna Fault and the Maki Fault have been shown to merge together in the northwestern regions of the mine and diverge into separate faults in the central and southeast portions of the mine. Each of these three faults are interpreted to postdate the mineralization event and have been shown to offset and displace the mineralized zones. Descriptions of these were provided in Chapter 6.2.3.
Three dimensional surfaces of these faults are created using the Leapfrog software package using all available information collected from lithologic mapping, drill hole logging, and grade control programs. These fault surfaces are subsequently used to define and constrain the limits of the various mineralized zones.
11.3.3 | Mineralization Wireframes |
Hecla Greens Creek geologists construct mineralized envelopes which define the extent and volume of each mineral deposit. These envelopes are constructed using the implicit modelling functionality of the Leapfrog software package by viewing data in three dimensions, using a combination of ore lithologies, assay grades, and a review of structural continuity.
A NSR of $50 NSR/ton forms the basis for a preliminary interpretation, which is guided by the interpreted location of the mine contact. The NSR value for each sample in the drill hole database is calculated by multiplying the individual drill hole assay value by the corresponding NSR factor. These NSR factors are derived by the mine engineering staff in consideration of such input parameters as the metal prices, metallurgical recoveries, treatment and refining charges, concentrate grades, and contract penalty terms. Once the NSR value has been determined for each of the significant metals to be estimated, the NSR value for each metal is summed into a total NSR value for subsequent use in mineralization modelling.
A summary of the NSR factors used to prepare the mineralized wireframe boundaries for each of the mineralized zones is provided in Table 11‑3. To be clear, the NSR factors created for the drill hole sample information are used for preparation of the three-dimensional outline of the mineralized zones only and are not used to estimate the NSR value to the block model. Only the individual metal grades of the drill hole samples are used to estimate grades into the block model. It is important to note that Hecla has elected to retain the price deck that was used for the preparation of the year-end 2018 Mineral Resource estimates to calculate the NSR value for the assay sample. Considering that the current prices used to prepare the year-end 2021 Mineral Resource estimate are higher, this approach will result in a conservative estimate of the Mineral Resources. SLR recommends that future Mineral Resource updates apply a metal price deck to the creation of mineralization wireframes that aligns with the prices used to prepare the Mineral Resource statements.
Hecla Mining Company | Greens Creek Mine, SLR Project No: 101.00632.00020
Technical Report Summary - February 21, 2022
Table 11‑3: Summary of Assay Database NSR Factors
Hecla Mining Company – Greens Creek Mine
Metal | Long Term Price | NSR Factor |
Silver | US$17.25/oz | 0.648 |
Zinc | US$1.00/lb | 6.89 |
Gold | US$1,225/oz | 0.338 (flotation), 0.2465 (gravimetric) |
Lead | US$0.90/lb | 13.1 |
When preparing Mineral Resource estimates for polymetallic deposits, it is often useful to understand the relative contribution to the overall value of the material of the each of the metals of interest. In the case of Greens Creek, revenues are derived from the sale of gold, silver, lead, and zinc. While copper is present locally, it is not present in sufficient quantities to warrant recovery and sale. The relative contribution of each of the four metals, based on the Mineral Resource and Mineral Reserve estimates completed as of year-end 2018 is presented in Figure 11‑1. While silver can be seen to contribute to a large portion of the value of the ores at Greens Creek, the other three metals are also significant contributors to the overall value.
Figure 11‑1: Distribution of Value by Metal
Hecla Mining Company | Greens Creek Mine, SLR Project No: 101.00632.00020
Technical Report Summary - February 21, 2022
Two sets of wireframes are created for each zone. An initial shell is created using a threshold value of $50 NSR/ton whose purpose is to act as a guide for the creation of a higher grade wireframe as well as acting as a dilution shell. A second, higher grade shell is then created at a threshold value of $140 NSR/ton that is contained completely within the broader, lower grade dilution shell.
Full-length grade composites (i.e., a single composite value is created for the full width of the mineralized interval) were built in order to assist in the interpretation of the $50 NSR/ton shell, where samples are grouped (composited) and averaged continuously until the average NSR drops below $50 NSR/ton. These composites are built using the following parameters:
| | ● | Minimum thickness of composite is 10 ft unless high grade assays have enough metal content to mine the face economically. |
| | ● | Internal waste may not be longer than seven feet. |
| | ● | Internal waste will be included in the full-length composite if adjacent material on either side can average to the specified cut-off. |
Wireframes are created using the geological modelling functions available in the Leapfrog software package, are snapped to the full-length grade composites, and are also snapped to the appropriate face samples that are assayed during the mining process.
Within the $50 NSR/ton shell, separate higher-value wireframes are created at an $140 NSR/ton threshold using a special interpolation process available in Leapfrog known as the FastRBF (radial basis function). Specifically, face samples and five foot composites created from raw drill hole assay files are interpolated using an indicator RBF function to create the $140 NSR/ton shell strictly within the $50 NSR/ton shell. The RBF function utilizes the structural forms defined for the $50 NSR/ton shell so as to provide a similar form to the $140 NSR/ton shell. A resource geologist then reviews and adjusts the results for proper volume and geologic continuity.
For grade estimation purposes, all boundaries between zones, structural domains, and NSR zones are considered as hard boundaries (i.e., samples are not shared between domains). Composite samples are coded by mineralized domain and NSR shell, with samples from each zone used in separate interpolation runs.
To better model thinner zones that are smaller than the minimum stope design dimensions, the waste shell is constructed around mineralized material to estimate the dilution grade that may be considered during the stope design phase. The perimeters for the waste model are created by expanding the $50 NSR/ton wireframes 10 ft from all boundaries. This waste shell is then used to create waste blocks and flag samples to be used for interpolation into these blocks.
Nine models were updated for the end of year (EOY, refers to work used to complete December 31 Mineral Resource and Mineral Reserve estimates and mine plans) 2021: 9A, SWB, East, West, 200S, Gallagher, Upper Plate, NWW and 5250 zones. East Zone
The East Zone is bounded by the Klaus Fault at lower elevations and the Maki Fault to the west. The Klaus Fault separates it from West Zone, and the Maki separates it from 9A Zone. The East Zone was modelled using Leapfrog’s vein system tool. Wireframes were built around grade composites using a $50 NSR/ton minimum and were snapped to mined-face data. The $140 NSR/ton shell was interpolated within the $50 NSR/ton shell using a combination of mined-face and assay data.
Hecla Mining Company | Greens Creek Mine, SLR Project No: 101.00632.00020
Technical Report Summary - February 21, 2022
The West Zone is bounded by the Klaus Fault at higher elevations and the Maki Fault to the west. The Klaus Fault separates the West Zone from the East Zone, and the Maki Fault separates the West Zone from the 9A Zone. It was modelled using a combination of Leapfrog’s vein system tool and intrusion tool. Wireframes were built around grade composites using a $50 NSR/ton minimum and were snapped to mined-face data. The $140 NSR/ton shell was interpolated within the $50 NSR/ton shell using a combination of mined-face and assay data.
The 9A Zone is bounded by the Maki Fault to the east and the Kahuna Fault to the west. The Maki separates it from East and West zones, and the Kahuna separates it from the 5250, Southwest, and Northwest West zones. It was modelled using Leapfrog’s vein system tool. Wireframes were built around grade composites using a $50 NSR/ton minimum and were snapped to mined-face data. The $140 NSR/ton shell was interpolated within the $50 NSR/ton shell using a combination of mined-face and assay data.
11.3.6 | Northwest West Zone |
The Northwest West Zone (NWW) is bounded by the Kahuna Fault to the east and the Upper Plate Shear Zone at higher elevations. Greens Creek geologists also apply domain boundaries to the zone, to separate it from SW and 5250 zones. This is due to differences in mineral trends between the three zones, as well as computational constraints seen during block model construction. The Kahuna Fault separates the 5250 Zone from the 9A Zone. The NWW Zone mineralization shell was created from sectional interpretations on mineralized intervals selected by the resource geologist. The interval selection process was done per drill hole primarily according to silver, zinc and lead grades with the general composite grade equaling $140 NSR/ton to $190 NSR/ton.
The Upper Plate Zone is bounded by the Upper Plate Shear Zone at lower elevations and the Kahuna Fault to the east. The Kahuna Fault separates it from the 9A and West zones, and the shear zone separates it from Northwest West Zone. It was modelled using Leapfrog’s vein system tool. Wireframes were built around grade composites using a $50 NSR/ton minimum and were snapped to mined-face data. The $140 NSR/ton shell was interpolated within the $50 NSR/ton shell using the structural form of the $50 NSR/ton shell and assay data.
The Southwest Zone is bounded by the Kahuna Fault to the east. Greens Creek geologists also apply domain boundaries to the zone to separate it from NWW and 5250 zones. This is due to differences in mineral trends between the three zones, as well as computational constraints seen during block model construction. It was modelled using a combination of Leapfrog’s vein system tool and intrusion tool. Wireframes were built around grade composites using a $50 NSR/ton minimum and were snapped to mined-face data. The $140 NSR/ton shell was interpolated within the $50 NSR/ton shell using a combination of mined-face and assay data.
Hecla Mining Company | Greens Creek Mine, SLR Project No: 101.00632.00020
Technical Report Summary - February 21, 2022
The 200 South Zone is bounded by the Gallagher Fault to the west. Greens Creek geologists also apply domain boundaries to the zone to separate it from the Southwest. This is due to a desire to maintain historical consistency, as well as to address computational constraints seen during block model construction. The Gallagher Fault separates it from the Gallagher Zone. The 200 South Zone was modelled using a combination of Leapfrog’s vein system tool and intrusion tool. Wireframes were built around grade composites using a $50 NSR/ton minimum and were snapped to mined-face data. The $140 NSR/ton shell was interpolated within the $50 NSR/ton shell using a combination of mined-face and assay data.
The 5250 Zone is bounded by the Kahuna Fault to the east and the Upper Plate Shear Zone at higher elevations. Greens Creek geologists also apply domain boundaries to the zone to separate it from SW and NWW zones. This is due to differences in mineral trends between the three zones, as well as computational constraints seen during block model construction. The Kahuna Fault separates it from the 9A Zone. The 5250 Zone mineralization shell was created from sectional interpretations on mineralized intervals selected by the resource geologist. The interval selection process was done per drill hole primarily according to silver, zinc and lead grades with the general composite grade equaling $140 NSR/ton to $190 NSR/ton.
The Gallagher Zone is bounded by the Gallagher Fault to the east. The Gallagher Fault separates it from the 200 South Zone and modelled using a combination of Leapfrog’s vein system tool and intrusion tool. Wireframes were built around grade composites using a $50 NSR/ton minimum and were snapped to mined-face data. The $140 NSR/ton shell was interpolated within the $50 NSR/ton shell using the structural form of the $50 NSR/ton shell and assay data.
11.4 | Exploratory Data Analysis |
Exploratory data analysis (EDA), in the form of summary statistics, correlation matrices, histograms, cumulative probability plots and XY plots are performed separately for each mineralized domain on both uncapped and capped sample and composite values for Ag, Zn, Au and Pb along with the sample lengths to aid in the selection of suitable parameters relative to mineralization. Summary statistics for the raw assay values for each mineralized domain are provided in Table 11‑4.
Hecla Mining Company | Greens Creek Mine, SLR Project No: 101.00632.00020
Technical Report Summary - February 21, 2022
Table 11‑4: Descriptive Statistics of the Raw Assay Values by Domain
Hecla Mining Company – Greens Creek Mine
Item | Silver | Gold | Lead | Zinc | Silver | Gold | Lead | Zinc |
| | East Zone | West Zone |
Mean | 12.5 | 0.10 | 3.0 | 7.4 | 10.4 | 0.13 | 3.0 | 9.5 |
Median | 4.7 | 0.034 | 1.4 | 4.2 | 5.1 | 0.09 | 1.6 | 7.5 |
Standard Deviation | 38.7 | 0.59 | 4.1 | 8.3 | 34.2 | 0.38 | 3.6 | 8.4 |
Coefficient of Variation | 3.01 | 6.08 | 1.4 | 1.12 | 3.3 | 2.98 | 1.2 | 0.9 |
Minimum | 0.0 | 0.00 | 0.0 | 0.0 | 0.0 | 0.00 | 0.0 | 0.0 |
Maximum | 1,798.2 | 53.82 | 43.4 | 58.8 | 2,078.3 | 34.15 | 54.9 | 51.2 |
Number of Samples | 5,580 | 5,394 | 5,394 | 5,394 | 19,081 | 19,082 | 19,082 | 19,082 |
| | 9A Zone | Northwest West Zone |
Mean | 11.0 | 0.10 | 3.4 | 9.0 | 9.9 | 0.10 | 2.8 | 8.5 |
Median | 5.4 | 0.05 | 1.9 | 7.4 | 4.2 | 0.07 | 1.1 | 6.3 |
Standard Deviation | 38.3 | 0.33 | 4.0 | 8.0 | 39.0 | 0.29 | 3.6 | 8.3 |
Coefficient of Variation | 3.5 | 3.39 | 1.2 | 0.9 | 4.0 | 2.84 | 1.3 | 1.0 |
Minimum | 0.0 | 0.00 | 0.0 | 0.0 | 0.0 | 0.00 | 0.0 | 0.0 |
Maximum | 2,399.5 | 25.53 | 30.0 | 45.9 | 3,437.3 | 55.368 | 34.0 | 46.0 |
Number of Samples | 9,071 | 9,071 | 9,071 | 9,071 | 18,506 | 18,506 | 18,506 | 18,506 |
| | Upper Plate Zone | Southwest Zone |
Mean | 10.6 | 0.04 | 1.8 | 4.2 | 19.3 | 0.10 | 3.3 | 6.9 |
Median | 3.9 | 0.01 | 1.0 | 2.5 | 7.0 | 0.03 | 1.6 | 3.6 |
Standard Deviation | 24.8 | 0.21 | 2.4 | 4.9 | 59.4 | 0.32 | 3.9 | 8.1 |
Coefficient of Variation | 2.3 | 5.7 | 1.3 | 1.2 | 3.1 | 3.31 | 1.2 | 1.2 |
Minimum | 0.0 | 0.00 | 0.0 | 0.0 | 0.0 | 0.00 | 0.0 | 0.0 |
Maximum | 686.7 | 11.384 | 22.7 | 27.9 | 4,440.8 | 31.334 | 35.5 | 61.1 |
Number of Samples | 1,677 | 1,677 | 1,677 | 1,677 | 19,654 | 19,655 | 19,654 | 19,654 |
| | 200 South Zone | 5250 Zone |
Mean | 13.7 | 0.11 | 2.9 | 7.3 | 12.7 | 0.050 | 2.8 | 6.8 |
Median | 5.9 | 0.04 | 1.3 | 3.5 | 5.6 | 0.02 | 1.8 | 4.5 |
Standard Deviation | 24.8 | 0.21 | 3.6 | 8.6 | 31.4 | 0.12 | 2.9 | 6.7 |
Coefficient of Variation | 1.8 | 1.85 | 1.2 | 1.2 | 2.5 | 2.50 | 1.1 | 1.0 |
Minimum | 0.0 | 0.00 | 0.0 | 0.0 | 0.0 | 0.00 | 0.0 | 0.0 |
Maximum | 687.7 | 11.537 | 34.8 | 47.1 | 1,881.2 | 6.857 | 31.3 | 57.2 |
Number of Samples | 21,386 | 21,386 | 21,386 | 21,386 | 9,984 | 9,984 | 9,984 | 9,984 |
Hecla Mining Company | Greens Creek Mine, SLR Project No: 101.00632.00020
Technical Report Summary - February 21, 2022
Item | Silver | Gold | Lead | Zinc | Silver | Gold | Lead | Zinc |
| | Gallagher Zone | |
Mean | 5.0 | 0.081 | 2.4 | 5.2 | | | | |
Median | 3.0 | 0.04 | 1.6 | 3.5 | | | | |
Standard Deviation | 10.7 | 0.19 | 2.6 | 5.8 | | | | |
Coefficient of Variation | 2.1 | 2.35 | 1.10 | 1.1 | | | | |
Minimum | 0.0 | 0.00 | 0.0 | 0.0 | | | | |
Maximum | 335.8 | 5.340 | 18.5 | 34.6 | | | | |
Number of Samples | 2,510 | 2,510 | 2,510 | 2,510 | | | | |
11.5 | Treatment of High Grade Assays |
Grade capping is the sole method used to limit the spatial extrapolation of the occasional high, isolated precious metal grades. Capping analyses undertaken at Greens Creek include the use of probability plots, the Parrish (1997) decile method, and consideration of experience gained from operations. For all the zones modeled the results are compared and an appropriate value is determined for use as the grade cap. For low to moderate drill density areas, methods tend to compare favorably. Capping levels are applied at the sample level only. Table 11‑5 summarizes the caps imposed by zone.
Table 11‑5: Summary of Capping Values by Deposit
Hecla Mining Company – Greens Creek Mine
Element/unit | East | West | 9A | NWW | SW | 200S | 5250 | Gallagher | Upper
Plate |
Ag (oz/ton) | 259.26 | 387.24 | 188.10 | 239.00 | 222.00 | 283.08 | 318.36 | 141.00 | 116.47 |
Zn (%) | 42.46 | 40.85 | 42.87 | 45.00 | 37.50 | 46.49 | 41.45 | 34.00 | 28.00 |
Au (oz/ton) | 1.766 | 1.461 | 1.565 | 0.860 | 1.680 | 2.020 | 1.477 | 1.340 | 1.093 |
Pb (%) | 26.74 | 20.70 | 23.32 | 22.00 | 22.00 | 22.09 | 19.69 | 16.50 | 1515 |
Composite lengths for interpolation purposes are set to a constant length of five feet and are applied to the capped assay values using the functions available in the Leapfrog software package. Composites start and stop at the $50 NSR/ton, and $140 NSR/ton boundaries.
Two methods have been utilized to handle intervals where the flagged length is not an integral multiple of the design composite length. If any un-assayed intervals are present within the mineralized wireframe surfaces, the payable metal values (gold, silver, lead, and zinc) are set to zero. Non-payable elements are left as null (missing value).
SLR recommends that the impact of treating any unsampled intervals for the non-payable metals (such as barium, calcium, and iron) as null values upon the calculation of the block density values be evaluated.
Hecla Mining Company | Greens Creek Mine, SLR Project No: 101.00632.00020
Technical Report Summary - February 21, 2022
When composites do not reach the full specified interval length, shorter samples are created that are cut at the boundary. The descriptive statistics of the capped, composited assay values are presented in Table 11‑6.
Table 11‑6: Descriptive Statistics of the Composited Assay Values by Domain
Hecla Mining Company – Greens Creek Mine
Item | Silver | Gold | Lead | Zinc | Silver | Gold | Lead | Zinc |
| | East Zone | West Zone |
Mean | 12.1 | 0.08 | 2.8 | 6.9 | 9.6 | 0.11 | 2.9 | 9.2 |
Median | 5.8 | 0.04 | 1.6 | 4.5 | 5.3 | 0.09 | 1.8 | 7.5 |
Standard Deviation | 21.6 | 0.13 | 3.5 | 7.2 | 17.9 | 0.12 | 3.2 | 7.8 |
Coefficient of Variation | 1.8 | 1.67 | 1.6 | 1.0 | 1.81 | 1.08 | 1.1 | 0.9 |
Minimum | 0.0 | 0.000 | 0.0 | 0.0 | 0.0 | 0.00 | 0.0 | 0.0 |
Maximum | 259.3 | 1.78 | 26.7 | 42.5 | 355.5 | 1.46 | 20.7 | 40.9 |
Number of Samples | 3,578 | 3,578 | 3,578 | 3,578 | 13,940 | 13,940 | 13,940 | 13,940 |
| | 9A Zone | Northwest West Zone |
Mean | 9.6 | 0.09 | 3.2 | 8.5 | 9.2 | 0.10 | 2.8 | 8.5 |
Median | 5.6 | 0.05 | 2.0 | 7.2 | 4.6 | 0.08 | 1.4 | 6.7 |
Standard Deviation | 13.8 | 0.12 | 3.5 | 7.7 | 15.2 | 0.10 | 3.31 | 7.7 |
Coefficient of Variation | 1.4 | 1.37 | 1.1 | 0.9 | 1.67 | 0.99 | 1.20 | 0.9 |
Minimum | 0.0 | 0.00 | 0.0 | 0.0 | 0.0 | 0.00 | 0.0 | 0.0 |
Maximum | 188.1 | 1.57 | 23.3 | 42.4 | 239.0 | 0.86 | 22.0 | 45.0 |
Number of Samples | 6,558 | 6,558 | 6,558 | 6,558 | 13,437 | 13,437 | 13,437 | 13,437 |
| | Upper Plate Zone | Southwest Zone |
Mean | 9.6 | 0.03 | 1.8 | 4.1 | 16.4 | 0.09 | 3.0 | 6.3 |
Median | 4.5 | 0.011 | 1.2 | 2.8 | 7.3 | 0.03 | 1.7 | 3.9 |
Standard Deviation | 14.3 | 0.08 | 1.9 | 4.0 | 24.1 | 0.16 | 3.4 | 7.1 |
Coefficient of Variation | 1.48 | 2.44 | 1.08 | 1.0 | 15 | 1.89 | 1.1 | 1.1 |
Minimum | 0.0 | 0.00 | 0.0 | 0.0 | 0.0 | 0.00 | 0.0 | 0.0 |
Maximum | 115.8 | 0.938 | 15.2 | 24.2 | 222.0 | 1.68 | 22.0 | 37.5 |
Number of Samples | 1,017 | 1,017 | 1,017 | 1,017 | 15,001 | 15,001 | 15,001 | 15,001 |
Hecla Mining Company | Greens Creek Mine, SLR Project No: 101.00632.00020
Technical Report Summary - February 21, 2022
Item | Silver | Gold | Lead | Zinc | Silver | Gold | Lead | Zinc |
| | 200 South Zone | 5250 Zone |
Mean | 13.6 | 0.11 | 2.9 | 7.3 | 12.1 | 0.05 | 2.7 | 6.6 |
Median | 7.0 | 0.05 | 1.6 | 4.2 | 6.4 | 0.02 | 1.9 | 4.9 |
Standard Deviation | 20.0 | 0.16 | 3.2 | 8.0 | 18.1 | 0.07 | 2.5 | 5.9 |
Coefficient of Variation | 1.5 | 1.44 | 1.1 | 1.1 | 1.50 | 1.56 | 0.93 | 0.9 |
Minimum | 0.0 | 0.00 | 0.0 | 0.0 | 0.0 | 0.00 | 0.0 | 0.0 |
Maximum | 280.2 | 1.949 | 22.1 | 46.5 | 298.9 | 1.480 | 19.6 | 41.1 |
Number of Samples | 14,398 | 14,398 | 14,398 | 14,398 | 6,904 | 6,904 | 6,904 | 6,904 |
| | Gallagher Zone | |
Mean | 5.0 | 0.078 | 2.4 | 5.2 | | | | |
Median | 3.3 | 0.04 | 1.8 | 3.9 | | | | |
Standard Deviation | 7.44 | 0.11 | 2.2 | 5.0 | | | | |
Coefficient of Variation | 1.5 | 1.41 | 0.9 | 1.0 | | | | |
Minimum | 0.0 | 0.00 | 0.0 | 0.0 | | | | |
Maximum | 106.8 | 1.265 | 16.4 | 31.7 | | | | |
Number of Samples | 1,597 | 1,597 | 1,597 | 1,597 | | | | |
Note:
| | 1. | Gold and silver in oz/ton. Lead and zinc in percent. |
As aids in understanding the spatial distributions of the various metal grades and carrying out the estimation process, three-dimensional contours were prepared for selected deposits using the functionality available in the Leapfrog (v.21.1.3) software package. In brief, the process for creating three-dimensional contours begins with the selection of the desired contour intervals. These are then used by the software package to create three-dimensional iso-surfaces (surfaces of equal values) of the target metal grades from the uncapped, composited drill hole assay information. The resulting iso-surfaces are then trimmed by the mineralization wireframe outline. The resulting contours can then be viewed in three dimensions or in sectional/plan views. Samples of the three-dimensional contoured gold, silver, lead, and zinc grades for the 200S deposit are presented in Figure 11‑2 to Figure 11‑5, respectively.
Examination of the three-dimensional contour data shows a clear spatial zonation of the gold, lead, and zinc grades whereby the higher grades for these metals are located in the northern portion of the wireframe model. In contrast, silver exhibits a general negative correlation with the gold, lead, and zinc values for this wireframe whereby the higher silver values can be seen to concentrate towards the central portions of the $50 NSR/ton wireframe model.
Hecla Mining Company | Greens Creek Mine, SLR Project No: 101.00632.00020
Technical Report Summary - February 21, 2022
Figure 11‑2: Three-Dimensional Contours of Gold for the $50 NSR/ton Wireframe, Looking Northwest, 200S Deposit
Figure 11‑3: Three-Dimensional Contours of Silver for the $50 NSR/ton Wireframe, Looking Northwest, 200S Deposit
Hecla Mining Company | Greens Creek Mine, SLR Project No: 101.00632.00020
Technical Report Summary - February 21, 2022
Figure 11‑4: Three-Dimensional Contours of Lead for the $50 NSR/ton Wireframe, Looking Northwest, 200S Deposit
Figure 11‑5: Three-Dimensional Contours of Zinc for the $50 NSR/ton Wireframe, Looking Northwest, 200S Deposit
Hecla Mining Company | Greens Creek Mine, SLR Project No: 101.00632.00020
Technical Report Summary - February 21, 2022
The analysis of the spatial continuity of the mineralization found in the nine deposits present at Greens Creek was carried out using the variography functions of the Leapfrog software package. Individual normal score variograms were constructed using the sample data contained within the $140 NSR/ton, $50 NSR/ton, and waste wireframe modes for gold, silver, lead, and zine for each of the nine deposits. The variogram analyses began with selection of an appropriate nugget (C0) for each metal from down-hole variograms. Directional variograms were then constructed for the major, semi-major and minor axes using either a single structure or two structures.
Experimental variograms were also constructed for barium, calcium, iron, arsenic, copper, and antimony. For zones with low drilling density, directional variograms are calculated along the axes of anisotropy as defined by the overall trend and geometry of the interpretations. Nugget values generally range between 0 to 50% of the sill, with Pb and Zn typically lower than Au and Ag. Structural ranges can range from less continuous (approximately 10 ft) to showing good continuity (>200 ft) depending on the element and direction. Figure 11‑6 to Figure 11‑9 present examples of experimental and modeled variograms for gold, silver, lead, and zinc for the 200S deposit, respectively. It is important to note that the dip values are stated using the Datamine convention in which downward dipping features are expressed as positive numbers, and vice-versa.
Figure 11‑6: Normal Scores for Gold, 200S Deposit Major Direction, $140 NSR/ton Wireframe
Hecla Mining Company | Greens Creek Mine, SLR Project No: 101.00632.00020
Technical Report Summary - February 21, 2022
Figure 11‑7: Normal Scores for Silver, 200S Deposit Major Direction, $140 NSR/ton Wireframe
Figure 11‑8: Normal Scores for Lead, 200S Deposit Major Direction, $140 NSR/ton Wireframe
Hecla Mining Company | Greens Creek Mine, SLR Project No: 101.00632.00020
Technical Report Summary - February 21, 2022
Figure 11‑9: Normal Scores Variogram for Zinc, 200S Deposit Major Direction, $140 NSR/ton Wireframe
Considering the wide range of bulk densities or ore grade and waste materials that are encountered in the mine, Greens Creek geologists have developed and refined a stoichiometric approach to calculating the bulk densities making use of chemical formulas for principal ore and gangue minerals. As a result of study work carried out by the geological team, individual formulae have been developed for each deposit using the general formula of:
Bulk Density (tonnes/m3) = constant + a*(Ba%) + b*(Fe%) + c*(Pb%) + d*(Zn%) + e*(Ca%).
The relevant coefficients are shown in Table 11‑7.
Table 11‑7: Summary of Density Coefficients by Deposit
Hecla Mining Company – Greens Creek Mine
Deposit | 9A | NWW | 5250 | 200S | UPP | GAL | East | SWB |
Constant | 2.6952 | 2.7322 | 2.9326 | 2.9677 | 2.7322 | 2.6272 | 2.5574 | 2.6844 |
Ba_coeff (a) | 0.0330 | 0.0408 | 0.0300 | 0.0325 | 0.0408 | 0.0309 | 0.0401 | 0.0294 |
Fe_coeff (b) | 0.0430 | 0.0405 | 0.0312 | 0.0352 | 0.0405 | 0.0319 | 0.0446 | 0.0381 |
Pb_coeff (c) | 0.0000 | 0.0503 | 0.0196 | 0.0591 | 0.0503 | 0.0298 | 0.0000 | 0.0162 |
Zn_coeff (d) | 0.0000 | 0.0128 | 0.0033 | 0.0000 | 0.0128 | 0.0122 | 0.0139 | 0.0041 |
Ca_coeff (e) | 0.0113 | 0.0091 | 0.0000 | 0.0000 | 0.0091 | 0.0000 | 0.0106 | 0.0043 |
Hecla Mining Company | Greens Creek Mine, SLR Project No: 101.00632.00020
Technical Report Summary - February 21, 2022
Depending upon the assay protocol in place at the time of sampling, some core samples do not have the full suite of validated assays required by these formulae. The following hierarchical approach is taken to assign a density to a sampled interval:
| | 1. | Sample has a full suite of validated assays: Use full regression formula. |
| | 2. | Sample has full suite except Ba: If logged as a non-baritic mineral type, assign a default value for Ba based on zone statistics for non-white baritic mineral samples and apply the full regression. The default Ba value is only used for density assignment and not for interpolation. |
| | 3. | Sample does not meet the criteria for 1 or 2 above but has a measured SG: Assign measured SG as final sample density. |
| | 4. | Sample does not meet criteria for 1 to 3 listed above: Assign a default SG based on logged mineral type. Default values are determined by zone/lithological type during EDA. |
Where the bulk densities of the samples in the drill hole database have been determined by direct measurement, those direct measurements are used to estimate the bulk densities into the block model for the immediate vicinity of the drill hole. For those remaining materials not in close proximity to a drill hole, the block density is calculated using the appropriate values estimated into the block model.
As-mined volumes are determined using survey information of the excavated volume collected using Trimble Robotic Total Stations and Data Collectors, and the field data are processed using the Deswik.CAD 3D Mine Modeling Software package. These surveys of the excavated volumes are performed by setting up a total station on a temporary point (tripod) and resection (with a minimum of two survey control points) is performed to determine the instrument location in 3D space. Once the resection procedure is performed and is of adequate quality (minimal standard deviations) a “detail” is done by the surveyor on the excavated area, “shooting” points on the sill (floor), back (roof), and ribs (walls/face) with XYZ coordinates collected for each surveyed point. This data is then processed with Deswik.CAD software package to create point clouds for the floor and back shots, and a polyline rib outline of the open area. These points are then used to create a 3D wireframe model of the excavation by means of triangulation.
11.10 | Block Model Construction |
For interpolation purposes, a block size of 5 ft x 5 ft x 5 ft (x, y, z) was selected. This dimension functions well in fitting mineralization with narrow widths or having complex geometrical shapes, but also can be conveniently upblocked to match the selective mining unit (SMU), or the minimum stope design dimension, of 10 ft x 10 ft x 15 ft. Initial block models are created for each of the nine deposits present at Greens Creek with the Leapfrog Edge software package, using a non-rotated, whole block approach and a parent block size as stated above. No sub-blocking or partial percentages are used.
Once the initial block models are complete, revised block models are created where the initial blocks for all zones are re-blocked larger to dimensions measuring 5 ft x 5 ft x15 ft. These re-blocked models are then forwarded to the mine engineering department for use in mine planning.
For the thin, vein-like zones or benches, the size of the mineralized material within the envelope is commonly less than the SMU size. To accommodate evaluations on the thin veins a 10 ft block model buffer is created around mineralized blocks. Blocks in the buffer model are estimated separately. The buffer blocks are then used to estimate the grade of the material that may be included as dilution to meet the minimum stope design. This step typically occurs during the stope design process.
Hecla Mining Company | Greens Creek Mine, SLR Project No: 101.00632.00020
Technical Report Summary - February 21, 2022
11.11 | Estimation/Interpolation Methods |
Grades are estimated in the block model using the composited drill hole data sets. In addition to the four principal metals of economic interest (gold, silver, lead, and zinc) and the three metals/elements required for calculation of the block density (barium, iron, and calcium), the grades of arsenic, mercury, and antimony are also estimated in support of prediction of their values in the final concentrates. The grades for all models are estimated using OK as the primary estimation method. Separate estimation runs were performed for each of the $140 NSR/ton, $50 NSR/ton, and waste wireframe models for each deposit. Each of the wireframe domains were treated as “hard” boundaries so that only those composite samples contained within each of the wireframe domains were used for grade estimation, and the resulting estimated grades were only coded to those blocks lying within the respective wireframe model. A discretization of 2:2:2 was applied for the OK estimation.
Grades are also estimated using the inverse distance squared (ID2) interpolation algorithm and the nearest neighbor (NN) method for validation purposes. Dynamic anisotropy is employed, where the interpreted geologic structure guides the search orientations by actively reorienting the search ellipse based on the strike and dip of nearby wireframe triangles. Two estimation passes are carried out using the search strategies as shown in Table 11‑8.
Table 11‑8: Summary of Search Strategies
Hecla Mining Company – Greens Creek Mine
Item | Pass 1 | Pass 2 |
Range | 100% of Variogram | 100% of Variogram |
Minimum No. Comps | 3 | 1 |
Maximum No. Comps | 16 | 25 |
Minimum No. Quadrants | 2 | 1 |
Maximum Samples per Quadrant | 8 | - - |
Maximum Comps per DDH | 6 | 6 |
Once the grade estimations have been completed, the bulk densities of each block are calculated by applying the formulae described in Chapter 11.8 above. In consideration that the block models are created in the Imperial measurement system, the bulk densities are then converted to inverse tonnage factors for use in preparing Mineral Resource and Mineral Reserve reports.
A series of NSR values are also prepared from the estimated block grades for use in subsequent mine planning and Mineral Resource and Mineral Reserve reporting. The methodology and formulae used to prepare the NSR values have been presented in Chapter 10.2.3 above. The following metal prices have been adopted for use in calculating the year-end 2021 Mineral Resource NSR values. These metal prices were adopted by Hecla in consideration of the current and long term market price trends, contract obligations, and general market outlook. A comparison of metal price decks used for the 2020 and 2021 Mineral Resource estimates is presented in Table 11‑9.
Hecla Mining Company | Greens Creek Mine, SLR Project No: 101.00632.00020
Technical Report Summary - February 21, 2022
Table 11‑9: Summary of Mineral Resource Metal Prices, 2020 and 2021
Hecla Mining Company – Greens Creek Mine
Metal | 2020 Mineral Resource Prices | 2021 Mineral Resource Prices |
Gold | US$1,500/oz | US$1,700/oz |
Silver | US$21.00/oz | US$21.00/oz |
Lead | US$1.15/lb | US$1.15/lb |
Zinc | US$1.35/lb | US$1.35/lb |
11.12 | Depletion for Mining Activities |
Once all grade estimation activities have been completed, the block models are then coded so as to reflect those volumes that have been excavated due to mining activities. All block models are coded with the excavation volumes that are current as of December 31, 2021.
11.13 | Block Model Validation |
Estimation validation is done by performing one or more of the following checks on the model:
| | ● | Review and inspection of parameter files (Datamine macros and Leapfrog calculations) used in the Mineral Resource estimation |
| | ● | Visual inspection of results by metal on plan and section. |
| | ● | Comparison of OK or ID and NN distributions (Table 11‑10). |
| | ● | Analysis of grade profiles by easting, northing and elevation using swath plots (Figure 11‑10 to Figure 11‑13). |
| | ● | Visual comparison of the estimated grade distributions with the 3D contoured grade distributions of the informing samples (Figure 11‑14 to Figure 11‑17). |
| | ● | External spot-checks of key calculations such as block kriging and compositing. |
The checks showed the models were acceptable for use in Mineral Resource and Mineral Reserve estimation.
Hecla Mining Company | Greens Creek Mine, SLR Project No: 101.00632.00020
Technical Report Summary - February 21, 2022
Table 11‑10: Block Statistics- Nearest Neighbor vs Ordinary Kriging
Hecla Mining Company – Greens Creek Mine
Zone | N Blocks | AgOK | AgNN | %Diff | ZnOK | ZnNN | %Diff | PbOK | PbNN | %Diff | AuOK | AuNN | %Diff |
WEST | 525,357 | 13.18 | 12.93 | 1.9% | 12.22 | 12.11 | 0.9% | 3.96 | 3.92 | 1.0% | 0.1440 | 0.1415 | 1.7% |
9A | 251,897 | 12.92 | 12.96 | -0.3% | 11.93 | 11.93 | 0.0% | 4.38 | 4.39 | -0.3% | 0.1221 | 0.1220 | 0.0% |
SWB | 309,861 | 25.64 | 25.62 | 0.1% | 10.24 | 10.18 | 0.5% | 4.83 | 4.79 | 0.7% | 0.1504 | 0.1486 | 1.2% |
200S | 445,651 | 20.55 | 20.51 | 0.2% | 9.61 | 9.57 | 0.4% | 3.91 | 3.89 | 0.5% | 0.1591 | 0.1588 | 0.2% |
GAL | 50,454 | 8.39 | 8.46 | -0.9% | 8.33 | 8.15 | 2.1% | 3.82 | 3.83 | -0.1% | 0.1283 | 0.1273 | 0.8% |
UPPL | 40,497 | 18.10 | 17.20 | 5.0% | 6.72 | 6.50 | 3.3% | 3.22 | 3.03 | 5.8% | 0.0462 | 0.0454 | 1.7% |
EAST | 173,516 | 19.62 | 19.58 | 0.2% | 10.88 | 10.58 | 2.8% | 4.27 | 4.20 | 1.6% | 0.1259 | 0.1229 | 2.4% |
5250 | 241,187 | 18.40 | 18.26 | 0.8% | 8.49 | 8.59 | -1.1% | 3.79 | 3.85 | -1.4% | 0.0745 | 0.0752 | -1.0% |
NWW | 374,218 | 12.56 | 12.48 | 0.6% | 12.27 | 12.33 | -0.4% | 3.89 | 3.93 | -1.2% | 0.1304 | 0.1305 | 0.0% |
Note:
| | 1. | oz/ton Ag, % Zn, % Pb, oz/ton Au |
Figure 11‑10: Swath Plot by Northing for Gold - $140 NSR/ton Wireframe, 200S Deposit
Hecla Mining Company | Greens Creek Mine, SLR Project No: 101.00632.00020
Technical Report Summary - February 21, 2022
Figure 11‑11: Swath Plot by Northing for Silver- $140 NSR/ton Wireframe, 200S Deposit
Figure 11‑12: Swath Plot by Northing for Lead- $140 NSR/ton Wireframe, 200S Deposit
Hecla Mining Company | Greens Creek Mine, SLR Project No: 101.00632.00020
Technical Report Summary - February 21, 2022
Figure 11‑13: Swath Plot by Northing for Zinc - $140 NSR/ton Wireframe, 200S Deposit
Hecla Mining Company | Greens Creek Mine, SLR Project No: 101.00632.00020
Technical Report Summary - February 21, 2022
Figure 11‑14: Comparison of 3D Contoured Grades with Block Model Estimated Grades, Gold, 200S Deposit
Hecla Mining Company | Greens Creek Mine, SLR Project No: 101.00632.00020
Technical Report Summary - February 21, 2022
Figure 11‑15: Comparison of 3D Contoured Grades with Block Model Estimated Grades, Silver, 200S Deposit
Hecla Mining Company | Greens Creek Mine, SLR Project No: 101.00632.00020
Technical Report Summary - February 21, 2022
Figure 11‑16: Comparison of 3D Contoured Grades with Block Model Estimated Grades, Lead, 200S Deposit
Hecla Mining Company | Greens Creek Mine, SLR Project No: 101.00632.00020
Technical Report Summary - February 21, 2022
Figure 11‑17: Comparison of 3D Contoured Grades with Block Model Estimated Grades, Zinc, 200S Deposit
Hecla Mining Company | Greens Creek Mine, SLR Project No: 101.00632.00020
Technical Report Summary - February 21, 2022
11.14 | Cut-Off Grade (Value) |
Metal prices used for reserves are based on consensus, long term forecasts from banks, financial institutions, and other sources. For resources, metal prices used are slightly higher than those for reserves. Considering that revenue is realized from the extraction and sale of gold, silver, lead, and zinc from Greens Creek, Mineral Resources are reported using a NSR approach in which the dollar contribution from the sale of each metal is summed into a single revenue factor. The threshold value (cut-off grade) for Mineral Resource reporting is then set to meet or exceed the estimated operating costs for each deposit (Table 11‑11). Operating costs are estimated from information collected during normal course operations at the mine as well as considerations of potential future changes to the operating costs. The operating cost components related to each of the deposits are averaged to derive site-wide operating costs. The cost inputs for determining the threshold value for reporting of Mineral Resources include the anticipated costs of sustaining capital items and capitalized development.
Table 11‑11: Summary of Estimated Operating Costs for Mineral Resource Reporting
Hecla Mining Company – Greens Creek Mine
Item | Value |
West, 9A, SW, 200S, Upper, East, 5250, and NWW Deposits |
Mining Cost ($/ton) | 75.33 |
Processing Costs ($/ton) | 33.29 |
Surface Operations Costs ($/ton) | 27.49 |
Environmental Costs ($/ton) | 3.82 |
General & Administration Costs ($/ton) | 32.25 |
Sustaining Capital ($/ton) | 42.81 |
Royalty Charges ($/ton) | 0.00 |
Reporting Threshold (Cut-off Value) | $215/ton |
Gallagher Deposit |
Mining Cost ($/ton) | 75.33 |
Processing Costs ($/ton) | 33.29 |
Surface Operations Costs ($/ton) | 27.49 |
Environmental Costs ($/ton) | 3.82 |
General & Administration Costs ($/ton) | 32.25 |
Sustaining Capital ($/ton) | 42.81 |
Royalty Charges ($/ton) | 5.00 |
Reporting Threshold (Cut-off Value) | $220/ton |
Hecla Mining Company | Greens Creek Mine, SLR Project No: 101.00632.00020
Technical Report Summary - February 21, 2022
11.15 | Classification of Mineral Resources |
Definitions for resource categories used in this TRS are those defined by SEC in S-K 1300. Mineral Resources are classified into either the Indicated or Inferred categories. No material is classified into the Measured category.
In order to determine appropriate classification standards, the spatial continuity of the mineralization as determined from the variography studies for each zone are considered for Ag (lower continuity) and Zn (higher continuity).
Classification distances are set at a range that corresponds with a certain percentage of the total sill for Ag and Zn as read off the semi-variograms. Indicated blocks need to fall within an average of 70% of the sill-range of the major axis semi-variogram for both elements.
Table 11‑12 shows the classification parameters used for assigning material into the Indicated Mineral Resource category. All remaining blocks within the $140 NSR/ton wireframes that were not classified into the Indicated category are assigned into the Inferred Mineral Resource category.
Table 11‑12: Summary of Classification Parameters by Zone
Hecla Mining Company – Greens Creek Mine
Parameter | Gallagher | 5250 | 200s | NWW | 9a | SW | West | Upper Plate | East |
Max. Avg. Distance (ft) | 60 | 65 | 120 | 100 | 65 | 58 | 85 | 85 | 60 |
Min. No. Composites | 3 | 3 | 3 | 3 | 3 | 3 | 3 | 3 | 3 |
Max. No. Composites | 16 | 16 | 16 | 16 | 16 | 16 | 16 | 16 | 16 |
Min. No. Quadrants | 2 | 2 | 2 | 2 | 2 | 2 | 2 | 2 | 2 |
Max. No. Comps per Quadrant | 8 | 8 | 8 | 8 | 8 | 8 | 8 | 8 | 8 |
Max. No. Comps per Drill Hole | 6 | 6 | 6 | 6 | 6 | 6 | 6 | 6 | 6 |
11.16 | Reasonable Prospects of Economic Extraction |
Over 20 years of production experience demonstrates that the mineral deposits at Greens Creek are amenable to extraction using underground overhand cut and fill and longhole stoping methods, with marketable concentrates being produced from gravity concentration and flotation concentration processing methods. Based on this production history, the following assumptions have been applied to determine the extent of the classified material that might have a reasonable expectation of economic extraction.
As with previous years a 5 ft x 5 ft x 5 ft block model and a re-blocked 5 ft x 5 ft x 15 ft block model was created for each zone by the geology team. The models were subsequently used by the engineering department to design Mineral Reserve shapes with the thinner and more horizontal mineral zones utilizing the 5 ft x 5 ft x 5 ft model. Once Mineral Reserve shapes were designed the Mineral Reserve was calculated based on the 5 ft x 5 ft x 15 ft re-blocked model.
For Mineral Resource reporting, the models were depleted for mined as-builts and for the Mineral Reserve shapes. Deswik software package was used to prepare the depleted block models.
Hecla Mining Company | Greens Creek Mine, SLR Project No: 101.00632.00020
Technical Report Summary - February 21, 2022
Mineral Resource statements were then prepared from those depleted Mineral Resource models using the Datamine software package and by applying the following workflow:
| | ● | Depending on the mineral zone, either the 5 ft x 5 ft x 5 ft or 5 ft x 5 ft x15 ft model was viewed in plan at mid-block with the NSR values displayed. Polygons were drawn at mid-block around the depleted Mineral Resource blocks so that: |
| | o | All blocks >$215 NSR/ton immediately adjacent to the designed Mineral Reserve shapes were enclosed. |
| | o | All blocks >$215 NSR/ton that may be separated from the designed Mineral Reserve shapes were enclosed if the blocks were seen to be continuous in 3D to contain a total of approximately 20,000 tons or more. Where these blocks were only a single block wide (five feet), they were not enclosed. |
| | o | No blocks >$215 NSR/ton immediately adjacent to as-builts were enclosed unless those blocks were judged to be sufficiently continuous and wide enough to support a separate stope. |
| | o | Once blocks were selected in the appropriate model, they were reported without any dilution from neighboring blocks with <$215 NSR/ton values. |
| | ● | The Gallagher and Upper Plate zone Mineral Resource polygons were drawn every five feet in elevation at mid-block on the 5 ft x 5 ft x 5 ft model. Once blocks were selected and coded the Mineral Resource report used the 5 ft x 5 ft x 5 ft model. This approach was taken as the mineral zones are often thin and shallowly dipping. The guiding principle on selecting the >$215 NSR/ton blocks was to keep a 10 ft mining width over 20,000 tons if away from a Mineral Reserve shape. A cut-off value of >$220 NSR/ton was used for the Gallagher deposit to reflect the increased mining costs and royalty obligations. |
| | ● | The 200S Zone Mineral Resource polygons were drawn every 15 ft in elevation while viewing the 5 ft x 5 ft x 15 ft model and mid-block elevation. Those polygons were extruded into 15 ft high selection volumes that coded blocks as Mineral Resource within the 5 ft x 5 ft x5 ft model. The 5 ft x 5 ft x 5 ft model was then used to report the Mineral Resource statement. The 5 ft x 5 ft x 5 ft model was chosen so as to not overly dilute (and reduce) the Mineral Resource with 15 ft high blocks which often split the thin vein and create artifact zones of Mineral Resource parallel to each other simply due to the larger blocks splitting the vein or not. |
| | ● | The remaining Mineral Resource polygons of the 9A, East, SWB, West, NWW and 5250 zones were drawn every 15 ft in elevation while viewing the 5 ft x5 ft x 15 ft models. The polygons were extruded into 15 ft high selection volumes to code the 5 ft x 5 ft x 15 ft model blocks as Mineral Resource. Only blocks > $215 NSR/ton were selected for tabulation of the Mineral Resource which was performed on the 5 ft x 5 ft x 15 ft model. The thicker model was chosen for these zones as the mineralization is often thicker and does not display the artifact banding that the other thinner and more horizontal mineral bodies did. |
11.17 | Mineral Resource Statement |
Mineral Resource statements are prepared in consideration of the relevant technical and economic parameters, along with those volumes in the block models that have been depleted for mining. As the Mineral Resources are stated exclusive of Mineral Reserves, those volumes in the respective block models that have been classified into the Mineral Reserve categories are excluded from the Mineral Resource reports. Mineral Resources are also required by S-K 1300 to demonstrate Reasonable Prospects for Economic Extraction (RPEE). This requirement is satisfied by the application of criteria that consider the spatial continuity of blocks containing NSR values above the nominated cut-off value as well as the practical aspects required for extraction by means of underground mining methods, as discussed above.
Hecla Mining Company | Greens Creek Mine, SLR Project No: 101.00632.00020
Technical Report Summary - February 21, 2022
Hecla cautions that Mineral Resources that are not Mineral Reserves and have not demonstrated economic viability. Indicated Mineral Resources are reported in Table 11‑13. Inferred Mineral Resources are reported in Table 11‑14. Comparisons with the previous Mineral Resource estimate is presented in Table 11‑15.
11.17.1 | Risk Factors That May Affect the Mineral Resource Estimate |
Factors which may affect the Mineral Resource estimates include:
| | ● | Due to variations in the global supply chains, the actual metal prices realized at the time of production may differ from the long term metal prices that were used in the preparation of the Mineral Resource statements. Lower zinc metal prices realized at the time of production may result in a decrease in Mineral Resources. In SLR’s opinion the Mineral Resources are not sensitive to variations in the prices of gold, silver lead or zinc from those used in the current Mineral Resource statement. |
| | ● | Changes to design parameter assumptions that pertain to creation of reporting volumes. |
| | ● | Changes to geotechnical, mining, and metallurgical recovery assumptions. |
| | ● | Changes to the formula used to generate the block model NSR values. |
| | ● | Changes to the assumptions used to generate the reporting NSR cut-off value. |
| | ● | Changes in interpretations of mineralization geometry and continuity of mineralization zones resulting from additional drill hole information and channel sample assays, and new geological mapping information. |
| | ● | Due to the reliance of the estimation of the density on the estimate of metal grades for those portions of the mineralization located in areas with a low density of sample information, the tonnage for those portions can vary at a local scale if the actual metal grades differ from the estimated metal grades. |
Hecla Mining Company | Greens Creek Mine, SLR Project No: 101.00632.00020
Technical Report Summary - February 21, 2022
Table 11‑13: Measured and Indicated Mineral Resources December 31, 2021
Hecla Mining Company – Greens Creek Mine
| | Tonnage | Grade | Contained Metal |
| | (ton) | (oz/ton Au) | (oz/ton Ag) | (% Pb) | (% Zn) | (oz Au) | (oz Ag) | (ton Pb) | (ton Zn) |
Measured Resources |
East | - - | - - | - - | - - | - - | - - | - - | - - | - - |
West | - - | - - | - - | - - | - - | - - | - - | - - | - - |
9A | - - | - - | - - | - - | - - | - - | - - | - - | - - |
NWW | - - | - - | - - | - - | - - | - - | - - | - - | - - |
SW | - - | - - | - - | - - | - - | - - | - - | - - | - - |
200S | - - | - - | - - | - - | - - | - - | - - | - - | - - |
5250 | - - | - - | - - | - - | - - | - - | - - | - - | - - |
Gallagher | - - | - - | - - | - - | - - | - - | - - | - - | - - |
Upper Plate | - - | - - | - - | - - | - - | - - | - - | - - | - - |
Total Measured | 0 | 0.00 | 0.0 | 0.0 | 0.0 | 0 | 0 | 0 | 0 |
| | | | | | | | | | |
Indicated Resources |
East | 514,800 | 0.09 | 12.2 | 2.8 | 7.6 | 45,100 | 6,267,700 | 14,300 | 39,380 |
West | 2,620,700 | 0.12 | 10.7 | 3.0 | 9.6 | 309,600 | 28,046,200 | 79,840 | 250,410 |
9A | 592,000 | 0.09 | 10.4 | 3.5 | 9.4 | 54,600 | 6,131,600 | 20,680 | 55,410 |
NWW | 1,188,900 | 0.09 | 9.3 | 2.6 | 8.6 | 111,700 | 11,062,200 | 30,320 | 102,330 |
SW | 838,900 | 0.07 | 18.5 | 3.2 | 6.5 | 62,600 | 15,517,900 | 26,780 | 54,940 |
200S | 1,693,400 | 0.11 | 16.3 | 2.9 | 7.7 | 194,500 | 27,653,300 | 49,400 | 130,590 |
5250 | 520,400 | 0.05 | 14.4 | 3.1 | 7.9 | 26,400 | 7,482,800 | 16,190 | 40,860 |
Gallagher | 194,100 | 0.13 | 8.0 | 3.5 | 7.9 | 24,300 | 1,561,000 | 6,840 | 15,270 |
Upper Plate | 191,600 | 0.04 | 15.4 | 3.0 | 6.4 | 7,100 | 2,947,800 | 5,690 | 12,340 |
Total Indicated | 8,355,000 | 0.10 | 12.8 | 3.0 | 8.4 | 835,900 | 106,670,300 | 250,040 | 701,520 |
Total Measured
and Indicated | 8,355,000 | 0.10 | 12.8 | 3.0 | 8.4 | 835,900 | 106,670,300 | 250,040 | 701,520 |
Hecla Mining Company | Greens Creek Mine, SLR Project No: 101.00632.00020
Technical Report Summary - February 21, 2022
Table 11‑14: Inferred Mineral Resources - December 31, 2021
Hecla Mining Company – Greens Creek Mine
| | Tonnage | Grade | Contained Metal |
| | (ton) | (oz/ton Au) | (oz/ton Ag) | (% Pb) | (% Zn) | (oz Au) | (oz Ag) | (ton Pb) | (ton Zn) |
Inferred Resources |
East | 425,200 | 0.09 | 12.8 | 2.4 | 6.7 | 36,300 | 5,449,400 | 10,110 | 28,350 |
West | 407,800 | 0.08 | 10.0 | 2.6 | 6.7 | 31,600 | 4,078,500 | 10,520 | 27,400 |
9A | 392,400 | 0.08 | 10.5 | 3.3 | 8.7 | 32,300 | 4,115,100 | 13,060 | 34,070 |
NWW | 35,000 | 0.06 | 9.6 | 2.2 | 6.3 | 2,100 | 335,900 | 770 | 2,190 |
SW | 278,000 | 0.07 | 14.4 | 2.5 | 5.1 | 18,200 | 4,014,700 | 7,050 | 14,200 |
200S | 118,000 | 0.10 | 27.1 | 2.3 | 4.7 | 12,200 | 3,197,300 | 2,710 | 5,550 |
5250 | 58,700 | 0.04 | 11.0 | 3.5 | 7.6 | 2,200 | 648,300 | 2,050 | 4,440 |
Gallagher | 221,100 | 0.09 | 9.8 | 3.6 | 7.5 | 20,600 | 2,174,300 | 7,860 | 16,560 |
Upper Plate | 215,400 | 0.04 | 16.2 | 2.8 | 6.2 | 8,200 | 3,494,100 | 6,010 | 13,250 |
Total Inferred | 2,151,700 | 0.08 | 12.8 | 2.8 | 6.8 | 163,700 | 27,507,500 | 60,140 | 146,020 |
Notes:
| | 1. | Classification of Mineral Resources is in accordance with the S-K 1300 classification system. |
| | 2. | Mineral Resources were estimated by Hecla staff and reviewed and accepted by SLR. |
| | 3. | Mineral Resources are exclusive of Mineral Reserves and do not have demonstrated economic viability. |
| | 4. | Mineral Resources are 100% attributable to Hecla. |
| | 5. | Mineral Resource block models are prepared from drilling and sample data current as of October 31, 2021; all Mineral Resources have been depleted for mining as of December 31, 2021. |
| | 6. | Mineral Resources are based on the following metal prices and cut-off assumptions: $1,700/oz Au, $21/oz Ag, $1.15/lb Pb, $1.35/lb Zn, NSR cut-off of $215 NSR/ton for all zones except the Gallagher Zone, which used a $220 NSR/ton cut-off. |
| | 7. | The reasonable prospects for economic extraction requirement for Mineral Resources is satisfied by application of criteria that consider the spatial continuity of blocks above the nominated cut-off value as well as the practical aspects of extraction by means of underground mining methods. |
| | 8. | Totals may not agree due to rounding. |
| | 9. | Reporting units are imperial, Tons: dry short tons (dst); Au (troy ounces/dst); Ag (troy ounces/dst); Pb and Zn percent (%). |
Hecla Mining Company | Greens Creek Mine, SLR Project No: 101.00632.00020
Technical Report Summary - February 21, 2022
Table 11‑15: Comparison of 2020 and 2021 Mineral Resource Statements
Hecla Mining Company – Greens Creek Mine
Category | Tonnage | Grade | Contained Metal |
| | (ton) | (oz/ton Au) | (oz/ton Ag) | (% Pb) | (% Zn) | (oz Au) | (oz Ag) | (ton Pb) | (ton Zn) |
Mineral Resources as of December 31, 2020 |
Measured and Indicated | 8,895,000 | 0.10 | 12.9 | 3.0 | 8.3 | 881,300 | 114,680,600 | 266,110 | 739,020 |
Inferred | 1,766,700 | 0.08 | 13.2 | 2.8 | 7.0 | 145,400 | 23,370,400 | 49,670 | 123,480 |
Mineral Resources as of December 31, 2021 |
Measured and Indicated | 8,355,000 | 0.10 | 12.8 | 3.0 | 8.4 | 835,900 | 106,670,300 | 250,040 | 701,520 |
Inferred | 2,151,700 | 0.08 | 12.8 | 2.8 | 6.8 | 163,700 | 27,507,500 | 60,140 | 146,020 |
Difference |
Measured and Indicated | -540,000 | 0.00 | -0.1 | 0.0 | 0.1 | -45,400 | -8,010,300 | -16,070 | -37,500 |
Inferred | 385,000 | 0.00 | -0.4 | 0.0 | -0.2 | 18,300 | 4,137,100 | 10,470 | 22,540 |
% Difference |
Measured and Indicated | -6% | 0% | -1% | 0% | 1% | -5% | -7% | -6% | -5% |
Inferred | 22% | 0% | -3% | 0% | -3% | 13% | 18% | 21% | 18% |
Gains and losses are essentially explained by:
| | ● | Geological reinterpretation of mineralized zones resulting from new drill hole information and new grade control mapping and sample data. |
| | ● | Conversion of Inferred Mineral Resources into Indicated Mineral Resources. |
| | ● | Reclassifying Measured Mineral Resources to Indicated Mineral Resources. |
| | ● | Changes in the cut-off value from $190 NSR/ton to $215 NSR/ton for all zones except Gallagher and $220 NSR/ton for the Gallagher deposit. |
| | ● | Changes to the metal price selection. |
| | ● | Conversion of Mineral Resources into Mineral Reserves. |
| | ● | Subtraction of low grade Mineral Resources (below cut-off grade). |
The QP is of the opinion that the Mineral Resources for the Project, which have been estimated using information obtained from core drill data, geological mapping, and grade control sampling programs, have been performed to industry best practices, and conform to the requirements of S-K 1300. The QP is not aware of any environmental, permitting, legal, title, taxation, socio-economic, marketing, political, or other relevant factors that would materially affect the Mineral Resource estimate.
Hecla Mining Company | Greens Creek Mine, SLR Project No: 101.00632.00020
Technical Report Summary - February 21, 2022
12.0 | MINERAL RESERVE ESTIMATES |
The Mineral Reserve estimates, as prepared by Hecla and reviewed and accepted by SLR, reported as of December 31, 2021 are summarized in Table 12‑1.
It should be noted that at Greens Creek, due to the complexity of the deposit, there is a tendency to mine a significant amount of material outside of the Mineral Reserves each year. This is typically Inferred Resources at the margins of Mineral Reserves, and additional reserve grade material not previously identified by the definition diamond drilling program. The estimated material mined outside of the Mineral Reserves include 37%, 30%, and 17% during 2019, 2020, and 2021 respectively. All efforts are taken by Greens Creek staff to include only Measured and Indicated Resources when converting these to Mineral Reserves. Although this is difficult any inclusion of Inferred material is considered, in SLR’s opinion, to be minimum and not material.
Table 12‑1: Summary of Mineral Reserves – December 31, 2021
Hecla Mining Company – Greens Creek Mine
Category | Tonnage | Grade | Contained Metal |
| | (000 ton) | Ag
(oz/ton) | Au
(oz/ton) | Pb (%) | Zn (%) | Ag
(000 oz) | Au
(000 oz) | Pb
(000 tons) | Zn
(000 tons) |
Proven | 2 | 9.60 | 0.075 | 1.66 | 4.54 | 18 | 0.1 | 0.0 | 0.1 |
Probable | 11,074 | 11.31 | 0.085 | 2.55 | 6.55 | 125,201 | 945.6 | 282.2 | 725.8 |
Total Proven + Probable | 11,076 | 11.31 | 0.085 | 2.55 | 6.55 | 125,219 | 945.7 | 282.3 | 725.9 |
Notes:
| | 1. | Classification of Mineral Reserves is in accordance with the S-K 1300 classification system. |
| | 2. | Mineral Reserves were estimated by Hecla and reviewed and accepted by SLR. |
| | 3. | Mineral Reserves are 100% attributable to Hecla. |
| | 4. | Mineral Reserves are estimated at an NSR cut-off of $215 NSR/ton for all zones except the Gallagher Zone, which used a $220 NSR/ton cut-off $215 NSR/ton. |
| | 5. | Mineral Reserves are estimated using an average long term price of $1,600/oz Au, $17.00/oz Ag, $0.90/lb Pb, and $1.15/lb Zn. |
| | 6. | A minimum mining width of 4.6 m (15 ft) was used. |
| | 7. | A density of 0.075 t/ft3 was used for waste material. |
| | 8. | Totals may not add due to rounding. |
| | 9. | Reporting units are imperial, Tons: dry short tons (dst); Au (troy ounces/dst); Ag (troy ounces/dst); Pb and Zn percent (%). |
The SLR QP is not aware of any risk factors associated with, or changes to, any aspects of the modifying factors such as mining, metallurgical, infrastructure, permitting, or other relevant factors that could materially affect the Mineral Reserve estimate.
Hecla Mining Company | Greens Creek Mine, SLR Project No: 101.00632.00020
Technical Report Summary - February 21, 2022
12.2 | Conversion to Mineral Reserves |
Mineral Reserves have been estimated from the Mineral Resource block model, which is developed by the geology department and updated regularly to incorporate new information (see Section 11). All zones in the geological model are considered for conversion from Mineral Resource to Mineral Reserve as the models are updated.
The following criteria were used to convert Mineral Resources to Mineral Reserves:
| | ● | Only Measured and Indicated Mineral Resources are considered. |
| | ● | Dilution is included in the Mineral Reserve estimate. |
| | ● | Mineral Reserves are supported by an economic mine plan. |
| | ● | The reference point for Mineral Reserves is the plant feed. Metallurgical process losses are not considered when determining the Mineral Reserves. |
The Greens Creek Mineral Reserves Estimate was created with Deswik software using similar methodologies and basic assumptions as previous annual Mineral Reserve estimates. All areas are designed for either longhole stoping (where the mineralized zone is sufficiently vertical), drift and fill stoping, or overhand cut and fill stoping.
The design process begins by creating a grade shell of the resource block model to highlight Measured and Indicated Mineral Resource blocks with an NSR in excess of the $215 NSR/ton cut-off. Areas with sufficient amounts of these blocks are targeted for evaluation as potential Mineral Reserves.
A detailed stope design is created for each level considering appropriate stoping criteria such as stope dimensions, level spacing, geological and geotechnical factors, the shape of the mineral zone, and any nearby previous mining. This is followed with the creation of 3D primary development and access ramp designs, as well as supporting infrastructure excavations.
The minimum mining height and width is 15 ft, which is the smallest dimension that can effectively accommodate Greens Creek’s mining equipment. In areas to be mined with drift and fill methods, the centerline of each planned drift is created to maximize the planned mineral extraction in each 15 ft vertical interval of the block model. These centerlines are then extruded into 15 ft wide by 15 ft high three-dimensional solids to reflect the nominal stoping dimension.
3D solids are also created in the areas where longhole mining is planned. The height and width of these solids reflect the actual longhole design. Most longhole stopes are 25 ft wide with a variable height. The dimensions of longhole stopes vary significantly depending upon the shape of the mineral zone, the competence of the rock, and the limitations of drilling equipment.
The stope design wireframes are then evaluated against the geologic block model to generate tons and grade for each stope, determined from the model blocks that fall within the design. The block models are depleted as part of this process to account for historic mining, replacing previously mined blocks with backfill grades. Dilution factors are then added to account for rock overbreak and backfill dilution. Once the mine design is completed and interrogated, the designed stopes and mine development are exported to Deswik Scheduler where an optimized schedule is generated.
Hecla Mining Company | Greens Creek Mine, SLR Project No: 101.00632.00020
Technical Report Summary - February 21, 2022
12.2.1 | Probable and Proven Mineral Reserve Classifications |
Current practice at Greens Creek is to classify all in-situ underground Reserves as Probable Mineral Reserves. The only material included in the “Proven” Mineral Reserve category is the relatively small amount of ore tonnage present in the surface stockpile.
12.2.2 | Handling of Waste and Inferred Mineral Resource Inside Mineral Reserve Wireframes |
Areas of Inferred Mineral Resource and waste are not targeted for inclusion in the stope design wireframes used to determine the Mineral Reserve. The waste material are regions of the block model that did not meet NSR cut-off and were therefore not given a resource classification. To generate a feasible mining shape, block model cells of Inferred Mineral Resource class and waste are sometimes incidentally included within the extents of stope design wireframes that primarily target Measured or Indicated Mineral Resource material.
When this occurs, the metal value is removed from the proportion of the wireframe that encompasses Inferred Mineral Resource blocks. The metal value within the waste blocks is maintained. Inferred Mineral Resources of 6.7 Moz Ag, 43,200 oz Au, 36,600 tons Zn and 14,700 st Pb lie within the boundaries of the Mineral Reserve wireframes and have been discounted from Reserves. Current practice is to also exclude this material from the Inferred Mineral Resource totals since the tons (but not the metal) are already encompassed by the Mineral Reserve.
SLR is of the opinion that this methodology can be improved upon. Waste material has not been classified as a Mineral Resource and should thus be treated as Inferred material with metal value removed. It may be reasonable to assign background metal values equivalent to those used for “Rock Overbreak Dilution” (discussed in Section 12.7) to both Inferred and Waste material. SLR investigated the impact that these changes would have on the Mineral Reserve and the result was immaterial.
The NSR value per ton of the mineralized material is determined with a formula that is required due to the complexity of the combination of concentrates produced at Greens Creek. The mine produces four different concentrates, including a silver, zinc, PM, and gravity concentrate. Each of these have different payability factors and smelter terms. The ore value is therefore expressed in terms of NSR rather than by metal grade. The NSR formula is determined by the Greens Creek metallurgy group and is based on linear regression (line of best fit) between the metal content and NSR values of a wide variety of Greens Creek ore types and grades. The formula accounts for metallurgical recoveries, payability terms, and smelter charges for the four types of concentrate produced. It is important to note that the NSR value cannot be used to determine the individual NSR for each metal, it rather provides an estimate of all metals combined. This is due to the complex interaction of the different metal grades in the milling process. For example, the silver reports to the silver concentrate where it has the best payability terms, hence changes to the lead grade of the plant feed can impact the recovery and payability of the contained silver by affecting the proportion of silver that reports to each type of concentrate. The NSR formula for the EOY 2021 reserves is expressed as follows:
Hecla Mining Company | Greens Creek Mine, SLR Project No: 101.00632.00020
Technical Report Summary - February 21, 2022
| Flotation NSR: | {(0.3400 * [Au oz/ton] * [Au $/oz]) + (0.6862 * [Ag oz/ton] * [Ag $/oz]) + (23.26 * [Pb %] * [Pb $/lb.]) + (7.68 * [Zn (%)] * [Zn $/lb.]) - (3.609* [Fe (%)])} + $27.35 |
| Gravity NSR: | IF [Au oz/ton] < 0.026 | 0 |
| | | |
| | IF [Au oz/ton] >= 0.026 | (0.2465 * [Au oz/ton]-0.0065) * [Au $/oz] * 0.9289) |
Total NSR = [Flotation NSR] + [Gravity NSR]
12.4 | Metal Price Assumptions |
Metal prices used for Reserve estimation were supplied by Hecla Corporate and are shown in Table 12‑2.
Table 12‑2: Metal Price Assumptions
Hecla Mining Company – Greens Creek Mine
Category | Ag
($/oz) | Au
($/oz) | Pb
(%/lb) | Zn
($/lb) |
Metal Price | 17.00 | 1600 | 0.90 | 1.15 |
Hecla historically uses different metal prices for Mineral Reserve estimation and LOM planning exercises. Using the ‘LOM Price’ deck results in an increase in average NSR over the LOM of approximately $26/ton. To maintain and permit auditability, and allow for clearer sensitivity analyses, SLR recommends the use of a single price deck for all long range planning and reserve estimation exercises.
12.5 | Cut-off Grade and “Must-Take” Ore |
The cut-off grade (COG) NSR value used for stope design of all mining methods is $215/ton. This COG reflects the actual property-wide cash costs distributed on a per ton basis as well as an allocation for the expected cost of sustaining capital items including capitalized development. The breakdown of this cost is presented in Table 11‑11.
The Gallagher Zone is subject to a royalty amounting to approximately 3% of NSR unless extralateral rights are established. This was accounted for in mine planning processes by increasing the NSR COG by $5.0/ton to $220/ton for the Gallagher Zone. This potential royalty has been included when evaluating the economics of the area. The Greens Creek geology group is advancing the process of determining whether extralateral rights have been established for this zone which would negate the potential royalty.
Mining plans will frequently require mining through Mineral Resource areas of less than $215 NSR/ton material to access more distant above-cut-off value ore. When low grade Mineral Resource must be mined to access a higher grade area, a “must-take” cut-off of $90 NSR ton is applied. Since this material must be mined regardless of NSR value it can be profitably milled if the NSR exceeds $90 NSR/ton, which covers incremental milling and administrative costs. Therefore, any Measured or Indicated Mineral Resource intersected by development and resulting in a diluted grade above $90 NSR/ton is considered ore and is included in the Mineral Reserve, while any material below $90 NSR/ton is treated as waste.
Hecla Mining Company | Greens Creek Mine, SLR Project No: 101.00632.00020
Technical Report Summary - February 21, 2022
12.6 | Other Mineral Reserves Criteria |
All undeveloped mining levels are subjected to an economic analysis to ensure that the operating cash flow produced from the extraction of the Mineral Reserves (above $215 NSR/ton) exceeds the marginal development cost to access the level. This becomes an important criterion for certain levels at the margins of the mineral body which require a large amount of development to access but contain relatively low ore tonnage.
For Mineral Reserves located at shallow depths relative to surface topography, a minimum crown pillar criterion of 100 ft has been applied.
Historic mining and backfill are considered when evaluating an area for inclusion in Mineral Reserve. Historically mined areas with incomplete as-built surveys are not eligible to be included in Mineral Reserve until a complete set of reliable as-builts is located.
Certain historical mining panels are recorded as being filled with loose waste rock or unconsolidated tailings instead of cemented backfill. This prohibits any mining adjacent or underneath the affected area, and generally results in the sterilization of the potential Mineral Reserve. Certain areas which contain adjacent ore of very high grades are evaluated on a case-by-case basis for re-entry, removal of the waste or tailings, and placement of cemented backfill.
Geotechnical factors are considered when determining Mineral Reserves. Small areas of above-cut-off grade material have been excluded from the Mineral Reserve due to high geotechnical risk (highly stressed pillars adjacent to large backfilled longhole blocks). These areas may be added to Mineral Reserves in the future if geotechnical analysis demonstrates they can be extracted safely and economically.
Dilution in the 2022 LRP comes from three sources:
12.7.1 | Dilution Within the Designed Stope Volume |
All block models have a waste model enveloping the ore blocks which allows dilution to be accounted for in the mine design process. In some areas the mineralization may be thinner than the 15 ft minimum mining width. If the ore has sufficiently high grade, this dilution will be intentionally mined and is accounted for when the designed ore volume is interrogated against the block model.
12.7.2 | Rock Overbreak Dilution |
A certain percentage of overbreak is normal and expected when mining using drill and blast methods. When multiple drifts are planned to be mined adjacent to each other, some of this overbreak material will be accounted for by the tonnage otherwise expected from subsequent panels.
In other instances, the overbreak will be low grade waste material that would not be targeted for mining. This overbreak is accounted for by applying an empirically derived dilution factor of 6%, with metal grades as listed in Table 12‑3.
Hecla Mining Company | Greens Creek Mine, SLR Project No: 101.00632.00020
Technical Report Summary - February 21, 2022
Table 12‑3: Rock Dilution Grades
Hecla Mining Company – Greens Creek Mine
Metal | Unit | Rock Dilution Grade |
Ag | oz/ton | 1.000 |
Au | oz/ton | 0.010 |
Pb | % | 0.25 |
Zn | % | 0.75 |
Cu | % | 0.10 |
Fe | % | 5.50 |
When mining adjacent to previously backfilled drifts, some amount of overbreak will occur into the backfill. An empirically derived dilution factor of 6% was used in all mined stopes to account for this backfill dilution. At other times, backfill is contained within the planned stope volume due to mining adjacent to a backfilled drift with an irregular back, rib, or sill. The backfill contains a small amount of residual metal value as it consists of cemented tailings from the Greens Creek mill. Grades used for backfill dilution are based on historical tailings assays provided by the plant and are presented in Table 12‑4.
Table 12‑4: Backfill Dilution Grades
Hecla Mining Company – Greens Creek Mine
Metal | Unit | Backfill Dilution Grade |
Ag | oz/ton | 4.800 |
Au | oz/ton | 0.066 |
Pb | % | 1.04 |
Zn | % | 1.78 |
Cu | % | 0.15 |
Fe | % | 14.61 |
Density | tons/ft3 | 0.075 |
SLR notes that tailings metal contents in the actual 2021 dataset are lower grade than those used in backfill dilution assumptions. The impact of this grade discrepancy was calculated for the 2023 production year. Total metal mined content would be overestimated for each metal by 1% Ag; 2.6% Au, 0.7% Pb, and 0.6% Zn% using the above backfill grades versus recent tailings grades. SLR recommends that Hecla update backfill metal grades in future LRPs to better represent expected tailings grades.
Hecla Mining Company | Greens Creek Mine, SLR Project No: 101.00632.00020
Technical Report Summary - February 21, 2022
There is not an extraction (recovery) factor applied in the stope design as the majority of the extraction or mining recovery will typically be over 100%. SLR recommends evaluating the extraction performance of longhole stoping areas and consider the application of a modifying factor to account for any identified losses. In SLR’s experience a 95% extraction factor would be a typical value used in this scenario to account for losses through potential hang-ups, equipment limitations, and reduced selectivity.
12.9 | Mineral Reserves Statement |
Mineral Reserves estimates include consideration of environmental, permitting, legal, title, taxation, socio-economic, marketing, and political factors, and constraints. The Mineral Reserves are acceptable to support the mine planning. Mineral Reserves have an effective date of December 31, 2021 and are reported using a fully diluted NSR cut-off of $215 NSR/ton for all zones and all mining methods (Table 12‑5).
Table 12‑5: Greens Creek Mineral Reserve Estimate
Hecla Mining Company – Greens Creek Mine
| | Grade | Contained Metal |
Probable Mineral
Reserves | Tonnage
(000 ton) | Ag
(oz/ton) | Au
(oz/ton) | Pb
(%) | Zn
(%) | Ag
(000 oz) | Au
(000 oz) | Pb
(000 ton) | Zn
(000 ton) |
200S | 3,031.8 | 12.00 | 0.101 | 2.04 | 5.09 | 36,400 | 306.0 | 61.8 | 154.4 |
5250 | 721.8 | 14.36 | 0.047 | 2.80 | 6.90 | 10,400 | 34.2 | 20.2 | 49.8 |
9A | 1,243.4 | 9.35 | 0.068 | 3.28 | 7.98 | 11,600 | 84.7 | 40.8 | 99.2 |
East | 1,456.4 | 10.87 | 0.082 | 2.15 | 5.92 | 15,800 | 119.0 | 31.3 | 86.3 |
Gallagher | 335.2 | 5.67 | 0.123 | 3.19 | 7.05 | 1,900 | 41.3 | 10.7 | 23.6 |
NWW | 1,732.5 | 10.53 | 0.092 | 2.55 | 7.62 | 18,200 | 160.2 | 44.2 | 132.0 |
SW | 724.2 | 13.47 | 0.056 | 2.82 | 5.83 | 9,800 | 40.4 | 20.4 | 42.2 |
Upper Plate | 323.5 | 13.57 | 0.044 | 2.22 | 4.58 | 4,400 | 14.2 | 7.2 | 14.8 |
West | 1,504.9 | 11.10 | 0.097 | 3.02 | 8.20 | 16,700 | 145.6 | 45.5 | 123.4 |
Total Probable
Mineral Reserves | 11,703.8 | 11.31 | 0.085 | 2.55 | 6.55 | 125,200 | 945.6 | 282.2 | 725.8 |
Proven Mineral Reserves
(Stockpile) | 1.9 | 9.60 | 0.075 | 1.66 | 4.54 | 0 | 0.1 | 0.0 | 0.1 |
Total Proven and
Probable Reserves | 11,075.7 | 11.31 | 0.085 | 2.55 | 6.55 | 125,200 | 945.7 | 282.3 | 725.9 |
Notes
| | 1. | Classification of Mineral Reserves is in accordance with the S-K 1300 classification system. |
| | 2. | Mineral Reserves were estimated by Hecla and reviewed and accepted by SLR. |
| | 3. | Mineral Reserves are 100% attributable to Hecla |
| | 4. | Mineral Reserves are estimated at a NSR cut-off of $215 NSR/ton for all zones except the Gallagher Zone, which used a $220 NSR/ton cut-off $215 NSR/ton. |
Hecla Mining Company | Greens Creek Mine, SLR Project No: 101.00632.00020
Technical Report Summary - February 21, 2022
| | 5. | Mineral Reserves are estimated using an average long term price of $1,600/oz Au, $17.00/oz Ag, $0.90/lb Pb, and $1.15/lb Zn. |
| | 6. | A minimum mining width of 4.6 m (15 ft) was used. |
| | 7. | A density of 0.075 t/ft3 was used for waste material. |
| | 8. | Totals may not add due to rounding. |
| | 9. | Reporting units are imperial, Tons: dry short tons (dst); Au (troy ounces/dst); Ag (troy ounces/dst); Pb and Zn percent (%). |
The distribution of Greens Creek Mineral Reserves by Mineral Zone is shown in Figure 12‑1.
Figure 12‑1: Distribution of Mineral Reserves by Mineral Zone
12.10 | Factors That May Affect the Mineral Reserve Estimates |
Factors that may affect the Mineral Reserve estimates include:
| | ● | Metals price assumptions. |
| | ● | Variations in short term marketing and sales contracts. |
| | ● | Changes to the Mineral Resource block model. |
| | ● | Changes to the assumptions that go into defining the NSR cut-off. |
| | ● | Assumptions relating to the geotechnical and hydrological parameters used in mine design. |
| | ● | Metallurgical recovery factors: recoveries vary on a day to day basis depending on the grades and mineralization types being processed. These variations are expected to trend to the forecast LOM recovery value for monthly or longer reporting periods. |
Hecla Mining Company | Greens Creek Mine, SLR Project No: 101.00632.00020
Technical Report Summary - February 21, 2022
| | ● | Variations to the permitting, operating, or social license regime. |
Greens Creek performs periodic reconciliations of Mineral Reserve models to the mine and plant performance, including three factors: mine reported production versus block model depletion (F1), mill feed versus mine reported production (F2), and mill feed versus block model depletion (F3). Reconciliation data for 2021 production is shown in Table 12‑6.
Table 12‑6: Greens Creek Reconciliation Data for 2021
Hecla Mining Company – Greens Creek Mine
Factor | Description | Tonnage | Grade | Contained Metal |
| | | (000 ton) | Ag
(oz/ton) | Au
(oz/ton) | Pb
(%) | Zn
(%) | Ag
(000 oz) | Au
(000 oz) | Pb
(000 ton) | Zn
(000 ton) |
| | Model Depletions | 704 | 14.5 | 0.083 | 3.5 | 8.7 | 10,200 | 58.6 | 24.5 | 61.3 |
| | Mine Reported | 841 | 13.8 | 0.072 | 3.1 | 7.6 | 11,600 | 60.2 | 25.6 | 63.9 |
| | Mill Feed | 842 | 15.7 | 0.082 | 3.1 | 7.6 | 13,200 | 68.7 | 26.4 | 63.8 |
F1 | Mine/Model | 1.19 | 0.95 | 0.86 | 0.88 | 0.87 | 1.13 | 1.03 | 1.05 | 1.04 |
F2 | Mill/Mine | 1.00 | 1.13 | 1.14 | 1.03 | 1.00 | 1.13 | 1.14 | 1.03 | 1.00 |
F3 | Mill/Model | 1.20 | 1.08 | 0.98 | 0.90 | 0.87 | 1.29 | 1.17 | 1.08 | 1.04 |
The estimated mined and mill feed grades for 2021 are lower than model predicted grades (F1) of the depleted Mineral Reserve for all four metals. Mined tons are 19% higher than model, which can largely be attributed to mining a large proportion of ore from outside of reserves. This was calculated to be 17% of the total ore in 2021 and reflects the mining of Inferred Mineral Resource at the margins of certain mine levels which is not included in Mineral Reserve. It also included additional ore identified during the mining process that was not previously defined with drilling and therefore was not included in the Mineral Resource models.
In 2018 Greens Creek implemented a short term model that incorporates face mapping data that is believed to have resulted in more realistic mining reserve shapes in the model. Changes to the ore density in the model were also implemented around the same time. Both changes have helped to reduce error in the ‘mine to model’ and ‘mill to model’ factors since that time, as shown in Table 12‑7. Grade estimates for silver and gold in the model have continued to fall within their historic norm and within an acceptable error range of 10%. However, grade accuracy for lead and zinc were lower in 2021 than in the previous five years. Greens Creek is embarking on an exercise to identify the sources of error in the short term model and to reduce the variance. The reduced mine versus model grade (F1) was offset by higher than mill versus mine grades (F2) for silver and gold. These results bring the plant versus model grades (F3) for silver and gold more in-line with the historical trends over the mine life.
Hecla Mining Company | Greens Creek Mine, SLR Project No: 101.00632.00020
Technical Report Summary - February 21, 2022
Historical Mill-Model reconciliation factors (F3) for the last five years are shown in Table 12‑7.
Table 12‑7: F3 Factors by Year: Mill Production / Mineral Reserve Depletion
Hecla Mining Company – Greens Creek Mine
Year | Grade | Tonnage
(ton) |
| | (oz/ton Au) | (oz/ton Ag) | (% Pb) | (% Zn) | |
2017 | 1.07 | 1.08 | 0.97 | 0.94 | 1.46 |
2018 | 1.07 | 1.12 | 0.97 | 0.94 | 1.74 |
2019 | 1.01 | 1.04 | 0.97 | 0.99 | 1.58 |
2020 | 1.08 | 1.14 | 0.96 | 0.98 | 1.36 |
2021 | 0.98 | 1.08 | 0.90 | 0.87 | 1.20 |
Hecla Mining Company | Greens Creek Mine, SLR Project No: 101.00632.00020
Technical Report Summary - February 21, 2022
13.1 | Underground Mine Access and Layout |
The underground mine is accessed by a portal (920 Main) on the 920 ft elevation, located in the same general area as the plant, stockpile pad, and administration building. The 920 Main is the primary equipment and personnel entrance to the mine as well as the primary air intake.
A secondary escapeway portal (the 59 Secondary Escapeway) is located immediately adjacent to the 920 portal and offers a secondary egress from certain areas of the mine.
A third portal is located above the mine site at the 1350 elevation, this portal is used as a ventilation exhaust and secondary escapeway. The 1350 portal is not normally used for haulage or personnel access due to the steep surface access roadway which is not maintained during winter months.
All active areas of the mine are accessed via one or more of the nine major ramp systems:
Most ramps are connected via cross cuts at various locations, therefore most working areas have multiple options for equipment access in the event a particular ramp is blocked for rehab or utility work. However, two of the ramp systems, the 5250 and 480 ramps, have a single route for mobile equipment access. These ramps feature laddered escapeway raises to enable airflow and a secondary means of egress.
A general mine layout schematic for the underground ramp system is shown in Figure 13‑1. See Section 13.16.5 (“Mine Plan Overview”) for views of the as-built wireframes for the ramp system.
Hecla Mining Company | Greens Creek Mine, SLR Project No: 101.00632.00020
Technical Report Summary - February 21, 2022
Figure 13‑1: Underground Mine General Layout Schematic
Hecla Mining Company | Greens Creek Mine, SLR Project No: 101.00632.00020
Technical Report Summary - February 21, 2022
Mine development is undertaken with fully mechanized drill and blast methods. Conventional diesel-powered rubber-tired equipment is used. Blastholes are drilled by a fleet of twin & single boom drilling jumbos. Blasting is carried out with mobile explosives loading vehicles utilizing bulk emulsion. Mucking and hauling is via load-haul-dump units (LHDs) and end-dump articulated haul trucks.
Ground support activities are performed with mechanized bolting equipment. Jacklegs are not used for face drilling or ground support installation. Primary ground support consists of split set and Swellex friction rock bolts and wire mesh. Cable bolts and wet-process shotcrete is applied as required, and there is an ongoing project to install fully grouted rebar bolts in existing and new haulage ways for LOM support.
Currently, most primary ramp development and ore access drives are driven with an arched profile at 16.0 ft width by 17.5 ft height. The back height is increased in areas where fans are to be installed or truck loading is to occur. Some of the historical ramp development was driven at smaller dimensions which can still accommodate most of the current equipment fleet. Primary haulage ramps are driven at a gradient of no more than -15%, with -12.5% being typical. Ore access drives are driven at a decline of -15% to -18% from the haulage ramp. In-Stope waste and secondary development drives are typically driven at 15.0 ft width by 15.0 ft height with gradients dependent on ore geometry.
Other mine workings include raises which serve as ventilation routes, secondary escapeways, and muck transfer passes. Vertical development is currently undertaken by a raiseboring contractor. Many historical raises are in use which were developed using a variety of methods including raiseboring, Alimak, and longhole (drop) raising.
Development is split into capitalized and expensed categories as follows:
Most production mining is completed using cut and fill and drift and fill techniques. Mining blocks are accessed through a primary ore access in waste. Once in ore drifting continues until waste is encountered. The drift is then backfilled before an adjacent ore drift is mined. Secondary development accesses are developed to meet ore mining requirements and are typically started by wall or backslashing a previously mined primary or secondary access. Production mining typically progresses in a bottom to top sequence such that mining occurs on top of previously backfilled lifts. Conventional drill and blast techniques and equipment are used with resources shared across the operation.
Hecla Mining Company | Greens Creek Mine, SLR Project No: 101.00632.00020
Technical Report Summary - February 21, 2022
Due to the complex and variable orebody geometry each block requires a unique design and sequencing methodology. An example of a typical cut and fill mining block is shown in Figure 13‑2.
Figure 13‑2: Typical Cut and Fill Design from NWW Zone
Longhole stoping is used where the mineral body is sufficiently steep and/or thick and geotechnical conditions are favorable. There is no standardized design due to the highly variable geometry of the mineral zones. Both longitudinal and transverse methods are used depending on the local shape of the mineral zone.
Typically, overcut and undercut drives are driven at widths between 15 ft and 25 ft and separated by thicknesses ranging from 30 ft to 75 ft vertically. Where development of an overcut is not economic, the longhole may be mined as a backstope where ground conditions warrant.
Ore zones are drilled and blasted from the overcut (with Cubex drill) or undercut (with Simba drill). Extraction occurs via remote mucking on the undercut level, and then the stope is filled from the overcut level. In the case of longhole backstopes, filling is achieved by drilling a borehole from higher elevation workings into which a paste pipe is inserted.
Transverse stoping layouts are designed as primaries and secondaries, with primary and secondary stopes being similar in size. This enables additional working faces as well as the opportunity to use mine development waste for backfill of secondaries.
Hecla Mining Company | Greens Creek Mine, SLR Project No: 101.00632.00020
Technical Report Summary - February 21, 2022
Figure 13‑3 presents a typical longhole design from the 5250 zone.
Figure 13‑3: Typical Longhole Design from 5250 Zone
Grade control is maintained by production geologists in cut and fill headings. The lithologies in each face are mapped and sampled to determine if any adjustments are necessary to keep the heading in the ore. The geometry of the mineralized lithology is frequently very complex, as shown in Figure 13‑4.
Figure 13‑4: Active Face
Hecla Mining Company | Greens Creek Mine, SLR Project No: 101.00632.00020
Technical Report Summary - February 21, 2022
Ore handling is performed with a fleet of underground haulage trucks and scooptrams or LHDs. All LHDs are equipped with remote operating capability and can be operated from an operations room on surface. This allows mucking to take place during blast and shift change.
All ore is trucked out of the mine to the surface mill stockpile, located approximately 450 ft from the 920 Portal. The underground haulage fleet consists primarily of 40 ton articulated end-dump haul trucks. A haul truck automation project is being advanced that will increase fleet capacity.
Haulage distances are highly variable since active working headings are located throughout all elevations of the mine. A round trip from the ore pad to the M720 (currently the lowest production level in the mine) is approximately seven miles.
The two mine ramps which are driven in an upwards direction (29 Ramp and 5250) feature muck pass raises to facilitate material handling.
Waste is either trucked out of the mine to the Site 23 waste disposal area located approximately 0.5 mi from the 920 portal or is placed in previously mined-out stopes when available. If no future mining is planned directly alongside or underneath, waste can be used to backfill cut and fill stopes by placement on the sill with subsequent placement of cemented tailings on top. The waste used to backfill secondary longhole stopes is dumped near the top cut and pushed into the empty stope using an LHD or jammer.
Backfill of mined-out voids is achieved via three methods:
| | ● | Paste fill: cemented tailings are trucked from the plant to the underground paste plant where they are pumped into the mined-out voids via a network of pipes. This method is low cost but is not practical for all areas of the mine where pumping pressures would be too high. |
| | ● | Jam (conventional) fill: Where delivery of paste fill is not feasible, cemented tailings are trucked to the heading and compacted using jammer equipment. This method is more flexible but more costly than paste fill. |
| | ● | Waste fill: Loose waste rock is placed in areas where structural support of the mined-out void is not necessary to enable future mining. This enables a reduction in the amount of waste rock that must be impounded on surface. |
In the cut and fill excavations, extracted panels are typically “tight-filled” with a combination of cemented tailings and waste, allowing further panel extraction alongside and between backfill. The backfill mixture is typically composed of dewatered tailings and 5% cement content. When future mining is planned directly underneath a filled area, 8% cement content is used enabling the backfill to support the future back span. The tailings are batched with cement on surface and hauled either to the stope (for jam filling) or to the paste plant where water is added, and the mixture is then pumped directly to the stope.
To prevent the placed pastefill from flowing out of the stope being backfilled, a shotcrete “paste wall” is built or a plug of cemented tailings is jammed into the heading. This will make the heading airtight, so “breather pipes” are installed through the paste wall in addition to the paste pipe to allow excess air and water to evacuate the heading as it is being filled to prevent the creation of paste voids. The paste line is flushed with air and water at the completion of each pour to clear and clean the line.
Hecla Mining Company | Greens Creek Mine, SLR Project No: 101.00632.00020
Technical Report Summary - February 21, 2022
Primary longhole stopes are filled with paste backfill, containing a cement content of 5% to 8%. This allows the safe extraction of secondary blocks between backfill, while minimizing dilution. Secondary longhole stopes are filled with waste rock from mine development wherever possible.
The paste plant was commissioned in 2001 and located in the 59 Drift is approximately 3,600 ft from the 920 Portal. The plant features a dump hopper, mixer, and two positive displacement paste pumps. A backfill QA/QC program is in place with samples tested regularly to ensure the required design strength.
Backfill criteria are as follows.
Target % Solids:
Minimum fill strength requirement is dependent upon desired application:
| | ● | Ribs (for drifting alongside fill): 25psi |
| | ● | Longhole stopes (tall ribs): 70psi |
| | ● | Back (for drifting underneath fill): 150psi |
Typical minimum strength (UCS) achieved with 28 day cure time:
| | ● | Paste fill with 5% cement: 100psi |
| | ● | Paste fill with 8% cement: 200psi |
The mine is ventilated using an exhausting system with a design capacity of 450 kcfm. Intake air is drawn into the mine from the 920 Portal and the 59 Escapeway Portal. Exhaust air exits the mine via the 1350 Portal and the 2853 Exhaust Raise. A schematic of the ventilation airflows is shown in Figure 13‑5.
Primary ventilation is achieved with four main underground fans:
| | ● | 500 hp, 84 in. dia. located near the 1350 portal (259 kcfm) – Main Fan |
| | ● | 350 hp, 84 in. dia. located near the bottom of the 2853 Raise (153 kcfm) – Main Fan |
| | ● | 500 hp, 84 in. dia. located on the M390 Drift (152 kcfm) – Booster Fan |
| | ● | 75 hp, 42 in, dia. compressor room fan exhausting to the 2853 Raise (38 kcfm) – Main Fan |
Secondary ventilation of achieved with auxiliary heading fans (ranging from 40 hp to 150 hp) which pull air from the main ramps and force-ventilate the working faces via plastic hardline and vent bag, as shown in Figure 13‑6.
Both primary and auxiliary fans can be controlled from surface using the mine’s SCADA system. Since blasting is initiated from surface, the local auxiliary fan is turned off remotely prior to the shot and then turned back on immediately afterwards to clear blasting gases.
The underground air flow is controlled by several sets of ventilation doors and numerous permanent bulkheads which separate intake from exhaust circuits. There is no provision for heating the intake air. Mine water and discharge lines located near the 920 Portal consist of insulated “Arctic Pipe” to prevent freezing.
Hecla Mining Company | Greens Creek Mine, SLR Project No: 101.00632.00020
Technical Report Summary - February 21, 2022
Shop facilities include fire doors as required per MSHA regulation. The 920 Main shop includes a dedicated exhaust raise and fan which sends shop exhaust directly to the 1350 Main Fan where it promptly flows out the 1350 Portal.
The 500hp booster fan in the M390 level to provide for additional airflow capacity due to a planned increase in mining activity in this area, as well as to manage heat load as the mine workings progress to greater depth. This fan will operate initially at significantly less than maximum capacity using a variable frequency drive (VFD) however is intended to be ramped up in future years if ventilation requirements increase in this area.
Secondary ventilation is a material proportion of the mine’s overall electricity consumption. A ventilation on demand (VOD) system is currently in place in a limited number of headings and is planned to be extended to the remainder of the mine. This system involves the installation of a VFD on the secondary fan which is linked to the radio-frequency identification or RFID transponder located on each piece of equipment and personnel cap lamp.
The VOD system automatically turns off the fan when the heading is inactive (no personnel present). The VOD system also adjusts the VFD setting to the appropriate power level based on the ventilation needs of the heading’s current occupants – “low” for personnel and light utility vehicles, “high” for larger equipment.
Hecla Mining Company | Greens Creek Mine, SLR Project No: 101.00632.00020
Technical Report Summary - February 21, 2022
Figure 13‑5: Mine Ventilation Schematic
Hecla Mining Company | Greens Creek Mine, SLR Project No: 101.00632.00020
Technical Report Summary - February 21, 2022
Figure 13‑6: Typical Auxiliary Fan Layout
Hecla Mining Company | Greens Creek Mine, SLR Project No: 101.00632.00020
Technical Report Summary - February 21, 2022
13.8 | Communications and Emergency Infrastructure |
Underground communications systems include: a leaky-feeder radio system, mine phones placed throughout active working areas, and an underground Wi-Fi network.
There is a stench alert system located at the 920 Portal as well as other key locations throughout the mine. This system can be activated remotely through the SCADA system or manually at the stench release locations.
There are several refuge chambers located at key areas throughout the mine; these refuge chambers are connected to the mine compressed air system to provide a breathable atmosphere in case of a mine fire or other underground hazardous atmosphere. In the event of a failure or contamination of the compressed air system, the refuge chambers have oxygen bottles and CO2 scrubbers. The chambers also contain water, medical supplies, toilets, mine radios connected to the leaky feeder system, and mine phones.
13.9 | Blasting and Explosives |
Blasting is carried out primarily with the use of bulk emulsion transported to the heading with a powder truck containing an emulsion pump. Non-electric (nonel) blasting caps are used for drifting and i-Kon-II electronic caps are used in longhole stoping.
Bulk emulsion is transported by ISO containers to permanent underground storage tanks located in the underground powder magazine on the 59 Drift. The cap mag is also located in this area.
Blasting takes place at the end of shift after all personnel have left the mine. Each round is initiated by an electronic cap tied into a remote blasting box which is controlled through the centralized electronic blasting system. Blasting gases are monitored remotely using a network of sensors at various locations along the airflow exhaust routes to ensure that the mine atmosphere is safe prior to re-entry.
Greens Creek is a sulfide mineral deposit and has historically experienced occasional sulfide dust ignitions with blasting. These ignitions caused minor damage to infrastructure located near the face (including ventilation bags and utility lines). Current practice is to identify high sulfide headings based on face sampling and to wet down the back and ribs near the face immediately prior to blasting. This minimizes the quantity of sulfide dust which becomes airborne during blasting and reduces the chance of a secondary sulfide dust ignition.
The Greens Creek Ground Control Management Plan (GCMP) summarizes how the mine deals with the ground conditions created due to mining. The mineral deposits at Greens Creek have undergone several folding sequences that have resulted in a contorted rock mass yielding a complex structural system. Standard ground support designs are used based on design conditions, primarily related to back span.
The mineralized material is the strongest and most competent material in most areas of the mine. Mineral lithologies have a rock strength of up to 30,000 psi. The structural footwall unit, composed primarily of phyllite, has a rock strength of up to 15,000 psi. The structural hanging wall unit, composed primarily of argillite, has a rock strength of up to 7,000 psi.
Hecla Mining Company | Greens Creek Mine, SLR Project No: 101.00632.00020
Technical Report Summary - February 21, 2022
The ground support strategy in use at the mine uses the concept of rock reinforcement and surface control to construct a stable support arch for the specified excavation geometry. Rock reinforcement or rock bolts clamp the arch together and assures its integrity and strength. Surface support ensures an intact and regular excavation profile that allows the bolts to perform at maximum efficiency.
The following ground support is typical for most new development and production areas at Greens Creek:
| | ● | Split sets 39 mm, six feet in length are installed on a four feet by four feet pattern in the back and ribs. Galvanized split sets are used for all development headings and other areas which will be open for longer than six months. Plain steel split sets are used in short term production areas. |
| | ● | Swellex bolts are installed on a five feet by six feet pattern in the back unless a higher density is specified due to unusual ground conditions. The length of the Swellex is dependent upon the heading width. Swellex are not installed when mining underneath backfill |
| | ● | Galvanized wire mesh is used in both rock and backfill. Mesh is installed on the back and ribs to within seven feet of the mine floor. |
| | ● | Main haulage ramps and other LOM excavations are supported by fully grouted rebar bolts which are installed in campaigns after development of the ramp segment has been completed. This provides very long term corrosion-resistant ground support. Rebar bolts of eight foot length installed on five feet by six feet spacing in the back. |
Cable bolts and wet-process shotcrete are applied as required to support occasional areas of large span or poor ground. Shotcrete is also applied to areas of permanent infrastructure as well as muckbays and loading areas to minimize damage to the wire mesh caused by inadvertent scraping with the mucker bucket.
Greens Creek experiences areas of corrosion of ground support due to the galvanic process involving the steel, sulfides, graphitic and atmospheric conditions. The argillite, especially with elevated sulfide and/or graphite content, is particularly aggressive to steel. Thin-walled friction bolts, such as Swellex or split sets, are susceptible because of the large surface area in contact with the ground and minimal thickness. Corrosion can occur inside the bolt (away from the collar) and unobservable. The result can be an unanticipated ground failure because the load carrying capacity of the system degrades over time.
To mitigate issues with ground support corrosion, current Greens Creek practice is to install galvanized ground support in areas which will be open for longer than six months. Very long term openings (such as LOM haulage ramps and other infrastructure excavations) are bolted with fully grouted rebar bolts which provide a high degree of corrosion resistance. Greens Creek also has an active rock bolt pull testing program.
A variety of historical ground support systems are still in place throughout the mine due to the large extent of haulage ramp which was developed prior to the implementation of current ground support standards. Certain older areas are supported primarily by split sets and steel mats. The mine has an ongoing rehab program and historical areas are progressively being brought to current support standards with fully grouted rebar bolts. Approximately 25% of haulage ramp is now supported with rebar. Near term plans include a campaign of cable bolting for haulage ramp intersections and other existing areas of wide span.
Hecla Mining Company | Greens Creek Mine, SLR Project No: 101.00632.00020
Technical Report Summary - February 21, 2022
13.11 | Underground Water Handling |
The mine is considered a dry mine. The mine is overlain by mountainous topography that offers little opportunity to develop a perched water table of significant volume. The average annual precipitation at the 920 ft elevation ranges from 67 in. to 80 in. Despite this surface precipitation, the water that is continuously pumped out of the mine due to groundwater sources ranges from approximately 25 to 50 gpm.
The ultimate mine depth is planned to extend to approximately 1,500 ft beneath sea level and the coastline is approximately 5.5 mi from the mine site.
The Maki Fault is a major geological feature encountered at the mine. This fault, and sympathetic Maki-like faults, intersect the Greens Creek drainage and provide the most probable conduit for water ingress into the mine. The Maki Fault has been intersected on numerous occasions in the mine workings at various orientations and elevations. On at least one occasion it has exhibited high pressure water inflows upon exposure. These inflows bled off quickly.
13.11.2 | Hydrological Investigation |
Prior to a mining a new zone, definition holes are drilled to investigate the ore extent, grade, and quantify the presence of groundwater. Holes are drilled with a packer in-case excess water pressure is encountered such that pressure can be bled off in a controlled manner. Typically, only low pressure is encountered, and any pressure can be quickly bled off.
While completing definition drilling in the upper East Ore Zone (above elevation 1610) significant groundwater was encountered with instantaneous flow rates greater than 400 gpm. Flow rates and pressures did not dissipate so holes were shut-off and grouted. Greens Creek currently plans to conduct a hydrologic study of this area to better define flow rates and recharge rates and determine the preferred control methods.
If recharge rates are high pre-grouting of the area may be required prior to development into the zone to limit water ingress. Limiting water inflow is important to ease mining, maintain ground stability, and limit long term water treatment costs. The proportion of Mineral Reserve tonnage which is affected by this groundwater is approximately 240kt, equivalent to 2.2% of overall Mineral Reserve.
13.11.3 | Pumping and Discharge System |
The mine uses many small local water collection sumps into which drill water and groundwater collected at the face is pumped. Water from these local sumps is then pumped into one of the four main sumps located in the 920 Main, the 45 Ramp, the 460 XC, and the 480 ramp. The main sumps each include multiple bays which allow slimes to settle. The water is then decanted and pumped out of the mine to the 920 water treatment plant (see section 15.6.1). The slimes are mucked using an LHD and gobbed underground.
Hecla Mining Company | Greens Creek Mine, SLR Project No: 101.00632.00020
Technical Report Summary - February 21, 2022
13.12 | Underground Electrical System |
High voltage power enters the mine at 4160V from a main switchgear room located on surface. Power is then fed from this switchgear room to four underground switchgear rooms which serve separate regions of the mine. Each underground switchgear room in turn feeds a network of mine power centers (MPCs) which reduce the voltage to 480V and supply power to local loads (including fans, pumps, and drill power).
13.13 | Compressed Air System |
The mine compressed air system consists of three 480V compressors located underground (Sullair LS-25S 250L at 250 hp ea) and one diesel compressor located on surface (Sullair 900 at 265 hp). Total system capacity is 4,550 cfm. The underground compressor room has a dedicated exhaust fan to the 2853 Raise.
13.14 | Underground Mobile Equipment |
Conventional underground mining equipment is used to support the underground mining activities. This equipment is standard to the industry and has been proven on site. Table 13‑1 shows the major underground equipment that is currently operational at Greens Creek. Greens Creek currently uses one Sandvik LH514 LHD which is capable of semi-autonomous operation as well as one Sandvik LH514 LHD which can be operated via a tele-remote system from surface. This equipment enables production activities to continue during the shift change and post-blasting periods when no personnel are allowed underground.
Table 13‑1: List of Major Underground Equipment
Hecla Mining Company - Greens Creek Mine
Equipment Type | Unit Make | Unit Model | Quantity |
Backfill Truck | ATLAS COPCO | MT2010 | 4 |
Backfill Truck | ATLAS COPCO | MT436B | 5 |
Bolter | SANDVIK | DS311D-EC | 5 |
Bolter | SANDVIK | DS410-C | 1 |
Bolter | SANDVIK | ROBOLT 320-30SSW | 1 |
Bolter | SANDVIK | SECOMA ROBOLT 05 | 1 |
Bolter | TAMROCK | ROBOLT 07-330 S | 1 |
Bolter | TAMROCK | ROBOLT 7 737SSW | 1 |
Bolter | MACLEAN | 975 OMNIA | 1 |
Boom Truck | GETMAN | A64 | 2 |
Dozer | CATERPILLAR | D4G | 2 |
Excavator | JOHN DEERE | 50G | 1 |
Flatdeck Truck | GETMAN | A64 | 1 |
Flatdeck Truck | NORMET | UTIMEC LF130 | 1 |
Grader | CATERPILLAR | 120G | 2 |
Hecla Mining Company | Greens Creek Mine, SLR Project No: 101.00632.00020
Technical Report Summary - February 21, 2022
Equipment Type | Unit Make | Unit Model | Quantity |
Haul Truck | ATLAS COPCO | MT436B | 5 |
Haul Truck | ATLAS COPCO | MT2010 | 2 |
Jumbo Drill | SANDVIK | DD31140C | 1 |
Jumbo Drill | SANDVIK | DD420 | 1 |
Jumbo Drill | TAMROCK | H105D | 2 |
Jumbo Drill | TAMROCK | H205D | 2 |
LHD | ATLAS COPCO | ST7 | 4 |
LHD | CATERPILLAR | 236B | 1 |
LHD | SANDVIK | LH514 | 7 |
Lift Truck | DUX | S1SL6000 | 1 |
Lift Truck | GETMAN | A64 | 5 |
Longhole Drill | ATLAS COPCO | SIMBA H157 | 1 |
Longhole Drill | CUBEX | Orion | 1 |
Lube Truck | GETMAN | A64 | 2 |
Portable Compressor | CATERPILLAR | 900H | 1 |
Powder Truck | GETMAN | A64 | 3 |
Shotcrete Pump | SCHWING | SP305 | 1 |
Shotcrete Sprayer | NORMET | SPRAY MEC 1050W | 1 |
Telehandler | CATERPILLAR | TH406C | 1 |
Telehandler | CATERPILLAR | TH514 | 2 |
Transmixer | BTI | SCT-6RD | 2 |
Transmixer | NORMET | LF500 | 1 |
Mobile equipment maintenance facilities are located both underground and on surface. Comprehensive maintenance tracking and reporting systems, in addition to preventive maintenance (PM) programs are well established. Frame-up rebuilds are performed based on engine hours, as recommended by the equipment supplier, and/or based on component wear factors. Major overhauls and rebuilds are often done offsite at a contracted facility.
Hecla Mining Company | Greens Creek Mine, SLR Project No: 101.00632.00020
Technical Report Summary - February 21, 2022
The Greens Creek LOM plan has been scheduled using Deswik software. Price assumptions, cutoff grade, and all other criteria are the same as applied to Mineral Reserves as discussed in Section 12. Production totals match the Mineral Reserves estimates presented in Section 12.
The goal of the LOM plan is to create a schedule which maintains steady silver production for as long as possible while maximizing near term grades to optimize the NPV. A secondary objective is to minimize and smooth near term development requirements.
Target longhole production is 300 tpd until all longhole stopes are depleted. In the current mine plan this occurs in 2022. Greens Creek will continue to pursue the conversion of planned cut and fill mining to longhole where the ore geometry is conducive to longhole mining methods. From an operational perspective, longhole tonnage is used to smooth the day to day variations in cut and fill production. Current Greens Creek practice is to maintain at least one shot longhole available to be mucked to make up for any short term cut and fill production shortfall.
The mine life extends to 2035 with a constant total production rate of 840,000 stpa or 2,300 stpd through to 2034 followed by one partial year of production.
Ore drifting advance rates for cut and fill mining and longhole top/bottom cut development are typically no more than 4.0 ft/day per face. This is a relatively slow advance rate which allows ample time for geological mapping and sampling to maintain a high level of grade control due to the geometric complexity of the mineral body. Scheduled advance rates are reduced when drifting size is significantly larger than normal (for example, many longhole top/bottom cuts are 25 ft wide and therefore scheduled at 2.5 ft/day per face).
| | ● | Towards the end of the mine life as the number of ore faces drops, the advance rate per heading will need to increase to maintain 2,300 stpd. Greens Creek is planning to ramp up development advance rates to 6.0 ft/day which is considered achievable based on the following reasons: |
| | ● | With fewer available ore faces, additional mining resources can be applied to each face. |
| | ● | Most of the ore to be mined near the end of the mine life will be remnants of levels which have been active for significant lengths of time. Mining will take place above, below and/or adjacent to previously mined panels. These areas are therefore well-defined with a large amount of geologic mapping and face sampling data, reducing the need for extensive mapping and sampling to maintain grade control on advance. |
Hecla Mining Company | Greens Creek Mine, SLR Project No: 101.00632.00020
Technical Report Summary - February 21, 2022
Figure 13‑7 presents the LOM plan ore production, while Table 13‑2 presents the mine production overview.
Figure 13‑7: Mine Plan – Life of Mine Ore Production
Table 13‑2: Mine Plan – Mine Production Overview
Hecla Mining Company - Greens Creek Mine
| | Silver
(oz/ton Ag) | Gold
(oz/ton Au) | Lead
(% Pb) | Zinc
(% Zn) |
Next Five Years
(2022 to 2026) | 11.60 | 0.083 | 2.59 | 6.75 |
LOM Average
(2022 to 2035) | 11.31 | 0.086 | 2.55 | 6.56 |
SLR notes that the maximum production rate of 2,300 stpd is maintained through to the end of the mine life and in SLR’s opinion this appears to be optimistic given the reduction in available mining areas that will occur. Additionally, it is common to have difficulty maintaining an adequate workforce as the mine life ends and it is expected that this will impact productivities in the last years of operation.
Overall backfill rates are scheduled at a placement rate of 600 stpd per backfill heading. Planned total monthly backfill tonnages are aligned with historic actuals for a production rate of 2,300 stpd ore. It is assumed that 75% of the volume of mined void each month will require cemented backfill, of which two-thirds is placed as paste fill and one-third is placed as jam fill with cemented tailings. Waste fill is assumed to be the lesser of 7,300 tons/month or the total monthly production of #2-4 (acid-generating) development waste. All #1 (inert) development waste is assumed to be hauled to surface since it is required for use as dry stack capping material.
Hecla Mining Company | Greens Creek Mine, SLR Project No: 101.00632.00020
Technical Report Summary - February 21, 2022
A delay of three days is assumed between the completion of mining in a heading and the beginning of backfill to allow for final mapping & surveying, heading cleanup, removal of utilities and installation of paste pipe.
Mine development requirements over the LOM are shown below in Table 13‑3.
Table 13‑3: Mine Plan – Development Schedule
Hecla Mining Company - Greens Creek Mine
| | Capital | Expensed | Total Lateral | Vertical |
2022 | 5,620 | 5,982 | 11,602 | 0 |
2023 | 6,462 | 9.033 | 15,494 | 0 |
2024 | 6,518 | 9,448 | 15,966 | 570 |
2025 | 6,502 | 9,713 | 16,215 | 13 |
2026 | 6,138 | 9,761 | 15,899 | 0 |
2027 | 6,103 | 10,701 | 16,805 | 597 |
2028 | 5,863 | 12,233 | 18,096 | 1,941 |
2029 | 1,790 | 10,872 | 12,662 | 206 |
2030 | 1,834 | 11,723 | 13,557 | 0 |
2031 | 1,661 | 8,856 | 10,517 | 0 |
2032 | 1,027 | 9,087 | 10,115 | 0 |
2033 | 838 | 6,038 | 6,876 | 0 |
2024 | 1,407 | 3,956 | 5,362 | 0 |
2035 | 275 | 4,337 | 4,612 | 0 |
Total Development – LOM
(2027 to 2035) | 52,039 ft | 121,738 ft | 173,777 ft | 3,326 ft |
Hecla Mining Company | Greens Creek Mine, SLR Project No: 101.00632.00020
Technical Report Summary - February 21, 2022
Lateral development requirements in feet per day are presented in Figure 13‑8.
Figure 13‑8: Life of Mine Expensed and Capital Development
Expensed development is scheduled at a maximum advance rate of 4.0 ft/day per face. Capital development is scheduled at a maximum advance rate of 3.5 ft/day per face due to the slightly larger heading profile. Because mine development is undertaken by the same crews and equipment as mine production, development faces are typically advanced at relatively low rates in a stop-start fashion when mining resources are available and not required for production activities.
SLR notes that the Expensed Development requirements in the LOM plan are high compared to Greens Creek actuals, and that up to 10 expensed development headings will need to be advanced to meet the development requirements in 2028. The development designs and development schedule used in the LOM were derived from different sources due to the fact that Greens Creek carries two mine designs: a Mineral Reserves design, and LRP design. The LRP includes the recovery of Inferred Resources, in addition to the Mineral Reserves presented in this TRS. However, the LRP contains the most up to date development schedule and was thus used as the basis for Expensed development requirements in this TRS. After examining the two mine designs and schedules SLR is of the opinion that Expensed Development requirements are overestimated in the LOM plan and recommends that Greens Creek update their mine design and schedule to reflect the development requirements more accurately.
Hecla Mining Company | Greens Creek Mine, SLR Project No: 101.00632.00020
Technical Report Summary - February 21, 2022
Capital development requirements by mining zone is shown in Figure 13‑9.
Figure 13‑9: Life of Mine Capital Lateral Development by Zone
The capital development planned for 2022 is 15 ft/day, equivalent to just over one round per day, ramping up to 18 ft/day for 2024.
The primary focus of capital development in 2022 will be advancing the 480 ramp and M790 drift to the next breakthrough, with rates as follows:
| | ● | 480 heading: 3 ft/day = One round every two days |
| | ● | M790 heading: 3 ft/day = One round every two days |
| | ● | All others combined:7 ft/day = One round every two days |
Hecla Mining Company | Greens Creek Mine, SLR Project No: 101.00632.00020
Technical Report Summary - February 21, 2022
When this breakthrough occurs in late February 2022, it will allow access to four new ore levels which will be developed in 2022. This is shown in Figure 13‑10 below.
Figure 13‑10: Mine Development 2021 to 2024
The M790 drift will provide access to the high potential drilling targets as shown in Figure 13‑11.
Figure 13‑11: Mine Development
Vertical development is achieved via raiseboring and is undertaken by a contractor. Most vertical development remaining in the mine plan consists of paired sets of raises: an eight foot diameter bald ventilation raise adjacent to a 42 in. diameter escapeway raise lined with laddertube. Vertical advance rates are scheduled at 4.0 ft/day to account for mobilization, setup, piloting, and laddertube installation in addition to the actual raisebore excavation.
Hecla Mining Company | Greens Creek Mine, SLR Project No: 101.00632.00020
Technical Report Summary - February 21, 2022
13.16.5 | Mine Plan Overview |
Figure 13‑12 to Figure 13‑15 show the existing and planned primary development for the mine.
Notes:
| | 1. | Green: Haulage Ramp – Blue: Ore Access Drive – Yellow: Definition Drilling Drift |
Figure 13‑12: Plan View- Existing and Planned Primary Mine Development through 2032
Notes:
| | 1. | Green: Haulage Ramp, Blue: Ore Access Drive, Yellow: Definition Drilling Drift, Orange: Ore, Pink: In-Stope Waste |
Figure 13‑13: Plan View- Existing and Planned Mine Development including Mineral Reserves
Hecla Mining Company | Greens Creek Mine, SLR Project No: 101.00632.00020
Technical Report Summary - February 21, 2022
Notes:
| | 1. | Green: Haulage Ramp – Blue: Ore Access Drive – Yellow: Definition Drilling Drift |
Figure 13‑14: 3D View- Existing and Planned Primary Mine Development through 2032
Notes:
| | 1. | Green: Haulage Ramp, Blue: Ore Access Drive, Yellow: Definition Drilling Drift, Orange: Ore, Pink: In-Stope Waste |
Figure 13‑15: 3D View- Existing and Planned Mine Development including Mineral Reserves
Hecla Mining Company | Greens Creek Mine, SLR Project No: 101.00632.00020
Technical Report Summary - February 21, 2022
13.16.6 | Timeline of Key Events in the Mine Plan |
Red numbers indicate the location of the item discussed in the mine plan Figure 13‑12 to Figure 13‑15.
| | o | Breakthrough of the 480 ramp to the M790 exploration drift, establishing several new high grade production levels in the 200S Zone. |
| | o | Initiation of East Ore 29 Up-Ramp development after completion of hydrologic study (see section 13.11). |
| | o | Completion of the M790 exploration drift, a key drilling platform for the most prospective remaining untested geology in proximity to the mine. |
| | o | PD480 ramp reaches the bottom of the 200S body. Mining begins of the deepest Mineral Reserves at Greens Creek: 1,410 ft below sea level, approximately 4,600 ft below surface topography. |
| | o | Initiation of Gallagher Zone ramp development. |
| | o | Completion of Gallagher ramp, begin mining Gallagher Zone. |
13.16.7 | Mine Plan Discussion |
A large proportion of Greens Creek Mineral Reserves are at locations in proximity to existing haulage ramps. Approximately 80% of Mineral Reserve tonnage either already has an access developed or can be accessed with a relatively short cross cut from an existing ramp. These ramps are actively used as haulage ways and ventilation airflow routes and are maintained in good condition.
This results in less development schedule risk to mine production. New haulage ramps are continuously advanced to provide access to higher grade ore, particularly in the deeper areas of the mine. However, if this development falls behind schedule, new ore headings can be established by driving short ore access drifts from existing haulage ramps, ensuring sufficient working areas to achieve target production tonnage.
This situation is due to the large amount of historical ramp development completed at much lower metal prices, resulting in a large amount of current Mineral Reserve tonnage that was accessible but left behind as uneconomic by previous mining. In recent years, significant amounts of ore have also been discovered in proximity to existing ramps. This material had not been discovered previously due to limited exploration drilling budgets during periods of lower metal prices.
Ore production is sourced from multiple mineral zones throughout every year of the mine life. This reduces the potential for equipment congestion or infrastructure bottlenecks in any one zone.
Hecla Mining Company | Greens Creek Mine, SLR Project No: 101.00632.00020
Technical Report Summary - February 21, 2022
The Expensed Development presented in the LOM plan does not well represent how the orebody will be mined. SLR is of the opinion that a mine design and associated schedule should be developed to best recover Proven and Probable Reserves. Stope designs that are economically dependent on the occurrence of Inferred material should be avoided where possible. An additional LRP could then be developed using the base plan, created based on Mineral Reserves, that targets recovery of Inferred Resources. It is acknowledged that given the long operating history and experience with underground grade control at Greens Creek that the plan put forth is workable, however SLR believes that more robust plan could be developed using the approach described above.
Hecla Mining Company | Greens Creek Mine, SLR Project No: 101.00632.00020
Technical Report Summary - February 21, 2022
14.0 | PROCESSING AND RECOVERY METHODS |
The plant is a conventional SAG mill-ball mill grinding and flotation concentrator producing three saleable flotation concentrates and a gravity concentrate.
| | ● | Carbon is removed from the circuit using column flotation prior to base metal flotation producing a carbon concentrate that is discarded to tailings. |
| | ● | A gravity circuit comprising spiral concentrators treats a bleed stream from the grinding circuit cyclone underflow to produce a gravity concentrate containing precious metals that is further processed off site. |
| | ● | Silver concentrate is produced in a rougher-cleaner flotation circuit including re-grinding of the cleaner circuit feed. The silver concentrate is relatively low grade, at approximately 35% Pb, but carries a large proportion of the silver in mill feed. |
| | ● | Zinc concentrate is produced in a rougher-cleaner flotation circuit including re-grinding, using lead rougher tailings as feed. The zinc concentrate typically contains 46% Zn to 50% Zn, which is a normal grade, and considerably less silver than the silver concentrate. |
| | ● | PM concentrate is produced in a complex circuit treating cleaner tailings from both the lead and zinc circuits. It is a relatively low grade zinc concentrate, at 30% Zn, with a smaller amount of lead and some silver. PM concentrate has a relatively limited market so silver and zinc concentrates production is preferred over that of PM. |
A summary of the unit operations in the concentrator include:
| | ● | Stockpiling and blending of underground ore |
| | ● | Hydrocyclone classification |
| | ● | Spiral concentration for gravity recovery of precious metals from cyclone underflow |
| | ● | Column flotation of graphitic carbon and carbonaceous materials |
| | ● | Lead rougher flotation column – concentrate to final concentrate thickener |
| | ● | Lead rougher flotation in conventional cells |
| | o | Lead rougher concentrate regrinding in tower mill |
| | o | Lead unit flotation cell in regrind mill cyclone underflow – concentrate to final silver concentrate thickener |
| | o | Lead rougher concentrate cleaning in three stages |
| | o | Lead cleaner concentrate to silver concentrate thickening and filtration |
| | ● | Lead PM rougher flotation of lead cleaner tailings |
| | o | Lead PM cleaner flotation with concentrate to lead regrinding |
Hecla Mining Company | Greens Creek Mine, SLR Project No: 101.00632.00020
Technical Report Summary - February 21, 2022
| | ● | PM conditioning of lead PM rougher tailings |
| | o | PM flotation in Woodgrove SFR cells |
| | o | Woodgrove concentrates to zinc regrinding |
| | o | Woodgrove tailings to PM flotation column |
| | o | PM column flotation followed by three stages of conventional rougher cells |
| | o | PM concentrate thickening and filtration |
| | ● | Zinc rougher flotation of lead rougher tailings |
| | o | Zinc rougher concentrate regrinding in a tower mill |
| | o | Zinc unit flotation cell in regrind mill cyclone underflow – concentrate to final zinc concentrate thickener |
| | o | Zinc concentrate cleaning in three stages or two stage cleaning plus scavenger |
| | o | Zinc cleaner concentrate to concentrate thickening and filtration |
| | o | Zinc cleaner tailings to zinc tank cell |
| | o | Zinc tank cell concentrate to zinc regrinding |
| | o | Zinc tank cell tailing combined in PM flotation column |
| | ● | Tailings thickening and filtration, carbon column concentrate, zinc rougher tailings and PM rougher tailings |
Hecla Mining Company | Greens Creek Mine, SLR Project No: 101.00632.00020
Technical Report Summary - February 21, 2022
The plant flowsheet is shown as Figure 14‑1.
Figure 14‑1: Greens Creek Plant Flowsheet
Hecla Mining Company | Greens Creek Mine, SLR Project No: 101.00632.00020
Technical Report Summary - February 21, 2022
14.2 | Mill Process Description |
14.2.1 | Material Stockpiling and Blending |
Mined ore is delivered to the plant stockpile near the portal by underground haulage trucks. Ore is stockpiled on a coarse ore pad with two active stockpiles. One stockpile is constructed by back dumping run of mine ore on a ramp and dozing to produce even layers, while the other stockpile is reclaimed by dozing slots down through the steep face of the ramp into day piles with a Caterpillar D8 dozer. Stockpiles range in volume from two to ten days capacity (4,000 tons to 20,000 tons). A Caterpillar 980 loader is used to transfer blended material through a fixed grizzly with 15 in. square apertures located above a dump pocket with a 60 ton, 35 min capacity. Grizzly oversize material is broken using a hydraulic rock-breaker. Grizzly undersize material is drawn from the dump pocket using a 48 in. variable speed apron feeder, which loads the ore onto the 48 in. SAG mill feed conveyor at a rate of 95-110 WT/h (wet tons per hour). The feed rate is controlled using a belt weightometer.
The ore is delivered to a 16 ft diameter by five feet long Marcy semi-autogenous SAG mill which operates in closed circuit with a primary vibrating screen with eight millimeter apertures. The SAG mill drive train consists of a 900 hp induction motor, Dodge gearbox and Allen Bradley variable speed drive. Mill charge weight is measured by bearing pressure. The plant is operated at an operator selected feed rate and mill load based on a feed trunnion bearing pressure target setpoint. The plant control system adjusts the plant rotational speed to maintain the target bearing pressure. Ball charge varies between 16% to 18 % by volume and 4.5 in. diameter steel balls are added as required to maintain mill capacity.
Primary screen undersize (-8 mm) flows by gravity to a secondary vibrating screen with four millimeter apertures. The secondary screen oversize (+4 mm) is directed to the feed end of the ball mill. The undersize from the screen reports to the ball mill discharge (cyclone feed) box where it combines with the discharge from the 900 hp 11 ft diameter x 13 ft long EGL Marcy overflow ball mill, before being pumped to a cluster of five 10 in. diameter Warman Cavex cyclones. Two inch diameter forged steel balls are added to maintain a target mill power draw of 600 kW. Four cyclones are usually in operation at 2300 tpd, with the underflow from one cyclone being diverted through the gravity circuit for free gold recovery prior to return to the feed end of the ball mill. The other three cyclone underflows are directed back to the feed end of the ball mill. Water is added to the cyclone feed pump box to maintain a target cyclone feed density, while pump speed is adjusted to maintain cyclone feed pressure. Target cyclone feed density is occasionally overridden to control the pump box level between low and high limits. Cyclone overflow at 48% to 52 % solids yields a particle size range of 80% passing (P80) 70 μm to 85 μm and P95 140 μm to 160 μm. An Outokumpu PSI 200 particle size monitor is currently used to monitor cyclone overflow on a continuous basis. This Outokumpu unit is being upgraded to a Metso-Outotec PSI-300 particle size monitor in Q4 2021. A 60 in. diameter Sweco trash screen has been installed on the cyclone overflow stream to remove unwanted debris from the process stream prior to flotation.
14.2.4 | Gravity Concentration |
A gravity concentration circuit is operated to improve overall gold recovery, percent of payable gold and revenue turnaround. Free gold, mainly in the form of electrum, is concentrated in the ball mill circulating load to approximately 1.0 oz/ton by virtue of its density and malleability. There are three stages of gravity concentration. Two banks of eight double-start spirals are installed for roughing to a grade of 3.0 oz/ton Au, with a single bank of two double-start spirals for secondary circuit cleaning to 6.0 oz/ton Au. Concentrates from the secondary cleaner are pumped to a single start finishing spiral to 25 oz/ton Au to 50 oz/ton Au. Rougher spiral tailings are returned to the feed end of the ball mill and rougher spiral concentrate is pumped to the cleaner spirals. Second stage Cleaner spiral tailings are pumped to the feed end of the ball mill. Third stage spiral tails are directed back to the feed to the second stage spirals. The third stage spiral concentrate is passed through a vibrating screen to remove relatively coarse (+ 30 mesh) material and then captured in barrels and shipped to an off site toll facility where it is treated using intensive cyanidation to recover precious metals. The gravity concentrates typically recover 15% to 20% of the gold in mill feed and less than 1% of the silver. The coarse fraction contains a significant amount of tramp copper wire fragments, which tend to interfere with intensive cyanidation. It is planned to treat the relatively small volume of coarse material separately, simplifying and improving the treatment of the fine fraction.
Hecla Mining Company | Greens Creek Mine, SLR Project No: 101.00632.00020
Technical Report Summary - February 21, 2022
14.2.5 | Flotation Concentrate Regrinding Circuits |
Lead rougher concentrate and zinc rougher concentrate are reground in similarly configured tower mill circuits. These tower mills were installed in 1992 to compensate for additional mill feed rate and finer intergrowth of the ore being processed. Rougher concentrates are pumped with the plant discharge to a cluster of five inch by six inch diameter Krebs cyclones. Cyclone underflow flows by gravity to feed each mill, the ground slurry discharges from the overflow at the top of the plant and flows by gravity through a unit flotation cell to the cyclone feed pump box closing the circuit. The target sizing for cyclone overflow slurry from both circuits is P80 20 μm (98% passing 38 μm). Metso Outotec 200 hp and 400 hp Vertimills are employed for lead and zinc rougher concentrate regrind respectively. Both mills are equipped with magnetic liners and loaded with 0.5 in., 12% chrome grinding balls.
A unit flotation cell is installed in the tower mill circuit to recover galena, gold and silver from the lead regrind cyclone underflow and to reduce overgrinding. The unit cell concentrates flow by gravity to the silver concentrate thickener and the unit cell tailings flow to the tower mill feed ports.
All flotation is carried out in conventional Outokumpu mechanical flotation cells, unless otherwise noted. Cyclone overflow is diluted from 48% to 52% solids to 45% solids before gravitating to a 60 in. Sweco trash screen and on to one eight-foot diameter carbon flotation column cell. This column flotation cell removes naturally floatable material (graphite, carbonaceous pyrite, talc, and layered silicates) from the ore and directs it to a smaller 30 in. Sweco trash screen. The carbon concentrate is screened at one millimeter to remove trash that floated with the carbon concentrate and then pumped at > 45 psi through six two-inch Krebs cyclones. Carbon cyclone underflow, comprising 75% of the cyclone feed weight, along with the carbon flotation tailings is directed to lead rougher flotation feed. Removal of naturally floatable material greatly reduces collector consumption and greatly improves lead rougher selectivity, for less than 2% loss of the value metals in feed.
A seven foot diameter column flotation cell is now being used for lead rougher flotation. Lead rougher flotation takes place at a pH of 8.5 to 9.2 in this column followed by 2 - 3 x 300 ft3 cells and two 20 m3 tank cells. Carbon dioxide, CO2 is being added to the circuit to reduce the pH of the lead rougher slurry when the feed contains significant amounts of backfill. The concentrate from the lead rougher column is sent directly to final silver concentrate thickener. A low grade (<20% Pb) lead rougher concentrate is recovered from the remaining rougher cells, reground to P80 20 μm, and then cleaned at pH 8.0 in 10 ft3 to 100 ft3 cells. The lead cleaning circuit comprises three stages in closed circuit, the first, second and third stages containing 2 x 4 plus 1 x 2, 1 x 3 plus 1 x 2 and 1 x 3, 100 ft3 cells respectively. Zinc depression is accomplished using zinc sulfate in lead roughing and lead cleaning. Lead rougher tails are conditioned with lime and then copper sulfate is added prior to zinc roughing. Several options have been installed on the lead cleaning circuit. There are options to run the circuit as a two-stage cleaner or as a two-stage cleaner plus scavenger.
Hecla Mining Company | Greens Creek Mine, SLR Project No: 101.00632.00020
Technical Report Summary - February 21, 2022
Lead cleaner tailings are pumped to a bank of 2 - 3 x 100 ft3 lead-PM rougher cells at pH 8.5. The lead-bulk rougher concentrate is cleaned in 3 x 100 ft3 cells in closed circuit to form one component of the final PM concentrate. This concentrate also has the option of being pumped back to the lead cleaners for re-cleaning. Lead-PM rougher tailings report to the PM conditioner and on to three Woodgrove staged flotation reactor (SFR) cells, collectively referred to as the swing cells. This bank of cells can operate as a PM rougher or as a scavenger on the lead side PM tailings. The concentrate from the swing cells will report to the zinc rougher concentrate pump box where it is mixed with the concentrate from the zinc roughers and pumped on to the zinc cleaners. Other options available are to send the concentrate from these cells directly to zinc or PM concentrate or to the zinc side PM cleaners for upgrading. The zinc cleaner option has become the standard flow location. The tailings from the swing cells form part of the feed to the zinc-PM rougher circuit.
Zinc roughing is carried out at a pH of 10.0 - 10.5 in a seven feet diameter by 30 ft high zinc rougher column, followed by five 300 ft3 cells in series with three 100 ft3 cells. A zinc column scalp option is also available to send zinc column concentrate directly to the final zinc concentrate thickener. Zinc rougher tailings form most of the final tails flow. Rougher concentrate is reground to P80 20 μm before being fed to the zinc cleaning circuit at pH 10.5 - 11.0. The zinc cleaning circuit comprises three stages in closed circuit, the first, second and third stages containing 2 x4 plus 1x2, 1 x 2 plus 1x4 and 1 x 4, 100 ft3 cells respectively. Zinc cleaner tailings join the swing cell tailings to feed the seven foot diameter by 30 ft high zinc-PM rougher column, the tails from which feed 12 (or nine) x 100 ft3 zinc-PM rougher cells. Zinc-PM rougher tailings are directed to final tailings, while zinc-PM rougher concentrate is cleaned once in 3 x 100 ft3 cells in closed circuit with the rougher, with zinc-PM cleaner concentrate forming the other component of final PM concentrate. Zinc cleaner cell capacity can be reconfigured from three stages to two stages of cleaning at high zinc head grades.
Pumping of most flotation circuit streams is carried out by four inch and six inch vertical spindle Sala pumps, which cope well with variable flow rates and frothy pulps.
14.2.7 | Flotation Circuit Control |
Flotation circuit performance is monitored by on-stream analysis of eighteen flotation circuit streams for lead, zinc, copper, silver, iron, and percent solids every 15 min using a PERI on-stream analyzer. Bredel peristaltic pumps are used to pump sample streams from in-line samplers to multiplexers located above the analysis zone. Similar pumps are also used to pump to a second PERI on-stream analyzer in the cleaner building. Mass flow is calculated on each concentrate stream providing an estimated concentrate mass yield for each concentrate. On-stream assays for all streams are used with feed tonnage and concentrate mass flow estimates and balanced on the SCADA system for an estimated on-line mass balance. Daily composites of on-stream analysis samples are collected and assayed to monitor and correct on-stream analyzer (OSA) calibration.
The Metallurgical group provide flotation grade targets to the operators. The operators then adjust rougher and cleaner mass yields towards these grade targets, while retaining overall responsibility for maximizing selectivity between sphalerite and galena/tetrahedrite by manual control of reagents.
Hecla Mining Company | Greens Creek Mine, SLR Project No: 101.00632.00020
Technical Report Summary - February 21, 2022
14.2.8 | Concentrate and Tailings Filtration |
Silver, PM, and zinc concentrates and final tailings are pumped to their separate thickeners, which are respectively 30 ft, 20 ft, 30 ft, and 60 ft in diameter (10 m, six meters, 10 m, and 20 m). All thickeners have been retrofitted with high capacity auto dilution feedwells.
Thickener underflows are pumped by Warman variable speed horizontal spindle pumps or diaphragm pumps at 65 to 70% solids to individual stock tanks and into Metso-Outotec (Sala) filter presses using high pressure Warman pumps. Thickener underflows are fully instrumented for flow, density, and pressure to allow thickener inventory control and to eliminate sanding problems.
All filter presses are equipped for diaphragm pressing and cake blowing using regular plant air. All presses are mounted on four load cells, the outputs from which are summed and converted to a weight relative to tare weight. This is used at various points in the press cycle to monitor degree of slurry filling, degree of completion of diaphragm press and air blow cycles, completeness of cake discharge, and the weight of cake produced on each cycle.
A single 24-plate press is dedicated to zinc concentrate filtration, while another 18-plate press is used to filter silver and PM concentrates batchwise as demanded by silver and PM stock tank levels. The zinc filter cake falls directly to the zinc concentrate storage bay below, while a shuttle conveyor directs the silver/bulk press output to the correct storage bay, depending on the origin of the filter feed slurry. Concentrate filter cycles yield between 2.5 tons and three tons of filter cake every seven to eight minutes at 8% to 11% moisture. Tailings filtration is carried out in three to 34 plate Sala presses of similar design, each press yielding four tons to 4.5 tons of filter cake at 11% to 12% moisture every seven to eight minutes. Tailings filter cake falls into storage bays located near the batch plant feed hopper.
Tailings are sent to the surface batch plant based on the requirement in the underground mine for backfill. Tailings are fed to a feed hopper and conveyed to a batch mixer or pug mill. Cement and water are added to meet either a 5% mix or an 8% mix depending on the desired underground specification. The mixer discharges to a truck loading hopper and is held until the underground mine haul trucks drive into the plant and request a load. The trucks haul the tailings backfill either directly to a heading for use as conventional backfill or to the underground paste plant. At the underground paste plant, tailings backfill is blended with water and the resulting slurry pumped to headings for use as paste backfill.
14.2.10 | Concentrate Storage and Tailings Placement |
Concentrates are hauled approximately eight miles from the plant in dedicated 50 tons Maxhaul trailers by tractor units to separate stockpiles within the Hawk Inlet concentrate storage building. Excess tailings filter cake is trucked to the tailings area for dry placement and compaction according to an engineered design.
The plant department performs all on site sample preparation and reports assays on all samples from mine and mill production, underground exploration, ship loading, smelter outturn and water treatment. The facilities include an integrated sample preparation area, fire assay laboratory and metallurgical laboratory, together with a separate wet assay laboratory. A total of 10,000 to 15,000 determinations per month are carried out. Silver and gold determinations are by fire assay, while lead, zinc, copper, and iron are by atomic absorption. Payable base metals in final concentrates are by titration.
Hecla Mining Company | Greens Creek Mine, SLR Project No: 101.00632.00020
Technical Report Summary - February 21, 2022
14.3 | Materials, Water and Power Consumption |
14.3.1 | Reagents and Materials Consumption |
Reagents are pumped from the reagent mixing and storage area to head tanks at appropriate locations in the flotation circuit. The head tanks are equipped with computerized solenoid discharge valves for gravity addition of flotation reagents including xanthate, copper sulfate, zinc sulfate, 3413 and MIBC to the flotation cells. Flocculants are added by positive displacement pumps (Pulsafeeder, Liquid Metronics, or Moyno). The CO2 is added using customized mixing panels to inject the CO2 into a water stream.
Table 14‑1 lists the process consumables used during 2021 in the concentrator along with their location and function.
Table 14‑1: Reagent and Consumable Summary Table 2021 Actuals
Hecla Mining Company – Greens Creek Mine
Consumable | Location | Application | Units | Consumption |
4.5 in. SAG mill balls | Primary grinding | Grinding Media | lb/ton | 0.585 |
Two inch ball mill balls | Secondary grinding | Grinding Media | lb/ton | 0.846 |
0.5 in. regrind balls (12% Cr) | Lead and zinc regrinding | Grinding Media | lb/ton | 0.312 |
Carbon Dioxide Liquid, CO2 | Lead roughing/cleaning | pH Modifier | lb/ton | 1.589 |
Zinc sulfate monohydrate | Lead roughing/cleaning | Zn Depressant | lb/ton | 0.395 |
Sodium isopropyl xanthate, SIPX | All circuits | Collector | lb/ton | 0.355 |
Aerophine 3413 promoter | Lead roughing/cleaning | Collector | lb/ton | 0.098 |
Copper sulfate pentahydrate | Zinc and PM circuits | Activator | lb/ton | 0.745 |
MIBC | All circuits | Frother | lb/ton | 0.089 |
Lime (unslaked) | Zinc/PM, water plants | pH Modifier | lb/ton | 1.695 |
Cement | Backfill Plant | Backfill | lb/ton | 54.304 |
Z Floc 2525 | All thickeners | Non-ionic Flocculant | lb/ton | 0.021 |
Ferric chloride (42%) | Water treatment plants | Coagulant | lb/ton | 0.576 |
Goldenwest 774 | Water treatment plants | Anionic Flocculant | lb/ton | 0.029 |
Antiscalant ML27 | Water treatment plants | | lb/ton | 0.040 |
Hecla Mining Company | Greens Creek Mine, SLR Project No: 101.00632.00020
Technical Report Summary - February 21, 2022
14.3.2 | Process Water Supply, Consumption and Treatment |
Fresh water is used to supply a potable water system, gland water, mine water and water for reagent mixing, with the balance available being distributed between the grinding and lead cleaner flotation circuits. Process water is used where the elevated pH and dissolved salts have little or no impact on flotation response or in high volume utility applications where some solids loading can be tolerated (e.g., froth control on thickeners and pump boxes). Reclaim water is used in applications where either pH control and/or high clarity and/or trash removal is desirable (e.g., filter cloth wash sprays and additional grinding circuit, lead circuit or PM circuit dilution water). On average, approximately 75% of total water consumption is recirculated, unless low water levels mandate restricted withdrawal to maintain flows in Greens Creek. Under these conditions, reclaim water is substituted for fresh water and process water for reclaim water until water recycle rate approaches 95%, with a corresponding loss in flotation selectivity. Recycle of mine water to the plant can result in flotation difficulties due to residual drilling polymer and other contaminates.
The IDI water treatment plants comprise the following components: a reaction vessel where ferric chloride is added to precipitate as iron hydroxide; a ‘rapid mix’ vessel where the flow is contacted with recirculated ferric sludge and an anionic high molecular weight polymer to occlude heavy metal precipitates and residual solids from the waste water stream; a clarifier and rake unit to generate a high density underflow sludge and a clear overflow, generally below one sixth of the maximum instantaneous NPDES permit direct discharge limits of 1.0 ppm total Zn, 0.6 ppm total Pb and 0.3 ppm total Cu. Monthly average limits are one half of these values. Dissolved and total metals are monitored every 12 hours by grab sampling and AA analysis, while pH and turbidity of effluent are monitored continuously. The 400 and 800 gpm plant sludges have sufficient metal values to yield a positive NSR when recycled to the PM thickener for disposal with concentrate.
Concentrator personnel also maintain and operate a 400 gpm-rated IDI plant near the plant, while Surface Operations operate a 2400 gpm-rated IDI plant at the TDF. The 400 gpm plant treats excess tailings thickener overflow, mine water and 920 area surface runoff. The tailings area plant treats runoff water and percolation water intercepted from the tailings piles, as well as retreating effluents from the 920 area.
The plant requires approximately 4.8 MW of power to operate at full capacity.
Hecla Mining Company | Greens Creek Mine, SLR Project No: 101.00632.00020
Technical Report Summary - February 21, 2022
14.4 | Production and Recovery Forecasts |
The Greens Creek LOM plan for the plant assumes similar throughputs, recoveries, and concentrate grades to those achieved in recent years, based on projected mill feed grades provided by geology and mine staff for the LOM. Mill production, feed grades and recoveries are consistent for both the five year and 10 year LOM plan. The average annual production for the period is 950,000 tons of ore with total Pb, Zn, Ag and Au recoveries of 81%, 89%, 80%, and 69%, respectively. The plant is projected to produce approximately 12,000,000 oz Ag and 83,000 oz Au per year, with most of the precious metals reporting to the silver concentrate, and 18% of the Au reporting to the gravity concentrate. The primary grades of the Pb, Zn and PM concentrates are 27.5% Pb, 47.5% Zn and 25% Zn respectively.
Table 14‑2 shows forecast five year average and LOM production forecast including mill feed tonnages and grades, primary concentrate grades and metal recovery to each concentrate. Table 14‑2 also presents the five year and LOM silver, zinc and PM concentrate quantities and concentrate grade forecast. The projections are very consistent until the final year, 2032 when production tapers and ends.
Table 14‑2: Five Year and Life of Mine Production Forecast
Hecla Mining Company – Greens Creek Mine
Parameter | Units | Five Year Average
(2022 to 2027) | LOM Total
(2022 to 2032) |
Total Mill Feed |
Tons | ton | 949,433.3 | 9,828,333.0 |
Zinc | % | 6.99 | 6.67 |
Lead | % | 2.77 | 2.57 |
Silver | oz/ton | 12.88 | 11.63 |
Gold | oz/ton | 0.09 | 0.09 |
Contained Metals in Mill Feed |
Zinc | ton | 66,414.2 | 672,304.9 |
Lead | ton | 26,329.4 | 264,534.6 |
Silver | oz | 12,224,494.5 | 115,567,476.9 |
Gold | oz | 82,646.5 | 891,233.6 |
Average Primary Metal Concentrate Grades |
Lead in Silver Concentrate | % | 27.5 | 27.5 |
Zinc in Zinc Concentrate | % | 47.5 | 47.5 |
Zinc in PM Concentrate | % | 25.0 | 25.0 |
Hecla Mining Company | Greens Creek Mine, SLR Project No: 101.00632.00020
Technical Report Summary - February 21, 2022
Parameter | Units | Five Year Average
(2022 to 2027) | LOM Total
(2022 to 2032) |
Weighted Average Mill Recoveries |
Zinc in Silver | % | 11.7 | 11.1 |
Zinc in Zinc | % | 64.4 | 64.6 |
Zinc in PM | % | 12.9 | 13.0 |
Total Zinc Recovery | % | 89.0 | 80.7 |
Lead in Gravity | % | 0.3 | 0.3 |
Lead in Silver | % | 70.0 | 69.4 |
Lead in Zinc | % | 6.5 | 6.5 |
Lead in PM | % | 4.4 | 4.6 |
Total Lead Recovery | % | 81.3 | 73.6 |
Silver in Doré | % | 0.6 | 0.6 |
Silver in Silver | % | 61.6 | 61.1 |
Silver in Zinc | % | 9.5 | 9.4 |
Silver in PM | % | 7.9 | 8.0 |
Total Silver Recovery | % | 79.6 | 72.0 |
Gold in Doré | % | 18.4 | 18.5 |
Gold in Silver | % | 39.1 | 38.3 |
Gold in Zinc | % | 6.4 | 6.3 |
Gold in PM | % | 5.3 | 5.3 |
Total Gold Recovery | % | 69.2 | 62.2 |
Hecla Mining Company | Greens Creek Mine, SLR Project No: 101.00632.00020
Technical Report Summary - February 21, 2022
Table 14‑3: Concentrate Production and Grade Forecast
Hecla Mining Company – Greens Creek Mine
Parameter | Units | Five Year Average
(2022 to 2027) | LRP Total
(2022 to 2032) |
Silver Concentrate Grade |
Zinc | % | 11.6 | 12.2 |
Lead | % | 27.5 | 27.5 |
Silver | oz/ton | 113.6 | 127.2 |
Gold | oz/ton | 0.49 | 0.77 |
Concentrate | tons | 67,076 | 668,649 |
Zinc Concentrate Grade |
Zinc | % | 47.5 | 47.5 |
Lead | % | 1.9 | 1.8 |
Silver | oz/ton | 13.1 | 12.4 |
Gold | oz/ton | 0.06 | 0.07 |
Concentrate | tons | 89,959 | 913,144 |
PM Concentrate Grade |
Zinc | % | 25.0 | 25.0 |
Lead | % | 3.4 | 3.3 |
Silver | oz/ton | 28.7 | 27.4 |
Gold | oz/ton | 0.13 | 0.15 |
Concentrate | tons | 34,328 | 349,224 |
Hecla Mining Company | Greens Creek Mine, SLR Project No: 101.00632.00020
Technical Report Summary - February 21, 2022
The major infrastructure areas (Figure 15‑1 to Figure 15‑8) supporting operations at Greens Creek include the 920/860 Area, Site 23, Hawk Inlet, TDF Area, Young Bay dock, 13 mi of connecting roadways, a power intertie connecting Greens Creek to the Juneau area power grid, and various pipelines and outfalls for wastewater and stormwater.
The 920 Area is located adjacent to the main portal at the 920 ft elevation or approximately eight road miles from the tidewater facilities located at Hawk Inlet. Located at the 920 Area are the plant, backfill batch plant, power-house, water treatment plants, surface maintenance shop, main warehouse, administrative offices, and fuel storage tanks. There is also a summer-only road to the 1350 exhaust portal.
The 860 Area, which is immediately adjacent to the 920 Area, has additional office buildings, assay laboratory, and core-logging facilities. Site 23, which is adjacent to the 860 Area or approximately 0.2 mi from the 920 Area, is the active waste rock storage facility and includes a helipad and shotcrete batch plant.
The dry stack TDF includes all the tailings produced to date that have not been placed as backfill underground. Ponds 7 and 10 and a 2500 GMP industrial wastewater treatment plant are located at the TDF Area.
Support facilities at Hawk Inlet include core storage; concentrate storage; a deep-water port that accommodates cargo ships, freight barges and fuel barges; warehouse; sanitary sewer and potable water treatment; fuel storage; and camp housing.
The Young Bay facility consists solely of a boat dock for the crew transport ferry that runs twice daily from Juneau, parking for buses, and a generator for powering lighting.
Hecla Mining Company | Greens Creek Mine, SLR Project No: 101.00632.00020
Technical Report Summary - February 21, 2022
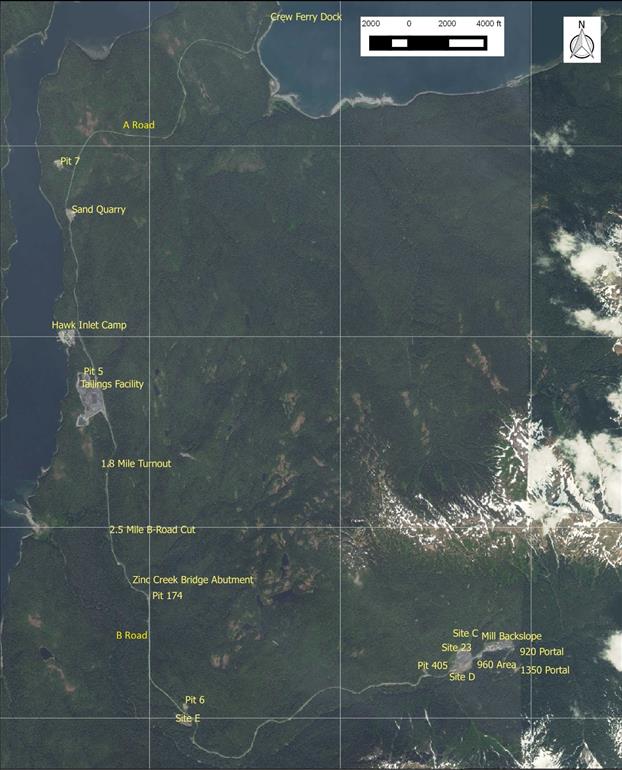
Figure 15‑1: Infrastructure Layout Map
Hecla Mining Company | Greens Creek Mine, SLR Project No: 101.00632.00020
Technical Report Summary - February 21, 2022
Figure 15‑2: Hawk Inlet Infrastructure
Hecla Mining Company | Greens Creek Mine, SLR Project No: 101.00632.00020
Technical Report Summary - February 21, 2022
Figure 15‑3: 920 & 860 Mine Site Area
Figure 15‑4: Hawk Inlet Facilities
Hecla Mining Company | Greens Creek Mine, SLR Project No: 101.00632.00020
Technical Report Summary - February 21, 2022
Figure 15‑5: 920 Area Facilities
Two mine roads link the Young Bay and the Hawk Inlet sites with the mine/mill site. A five mile long, 18 ft wide road (“A Road”) allows transport of personnel from the Young Bay dock to Hawk Inlet. An 8.5 mi, 20 ft wide road (“B Road) allows transport of personnel, supplies, and concentrate between Hawk Inlet and the mine, as well as transport of dry tailings from the mine to the TDF. Several borrow pits lie along the roadways.
Hecla’s policy for travel on these single-lane roads with turnouts requires that all employees and contractors maintain radio contact during transit. Limited public access to the road system is allowed. The roads are occasionally used by hunters who access Admiralty Island via private boat.
15.3 | Tailings Disposal Facilities |
The plant generates approximately 1,800 dry tons of filter-pressed tailings per day, or approximately 650,000 stpa. These tailings are dewatered in a filter press at the plant, with approximately 50% of the tailings being mixed with cement and hauled back into the underground mine for disposal in mined-out areas as backfill.
The remaining 50% of the tailings are transported from the plant on the B Road using covered 45 ton haul trucks to a surface TDF located near Hawk Inlet.
At the TDF, tailings are end dumped and placed using bulldozers. The tailings are placed and compacted in lifts in a manner to minimize surface infiltration and promote runoff.
Hecla Mining Company | Greens Creek Mine, SLR Project No: 101.00632.00020
Technical Report Summary - February 21, 2022
Leachate is contained using a system of geomembrane liners, cutoff walls, and above and below liner drainage systems. Surface water is managed via a system of lined ditches and culverts. Outside slopes are capped with carbonate-rich mine development rock (argillite or type 1) to protect against erosion and to provide geochemical buffering capacity for the potentially acid-generating tailings.
The TDF has undergone multiple staged, incremental expansions as the mine life has been extended over time. The “Stage 3” expansion was recently completed which will accommodate projected mine tailings storage requirements through the end of the mine life in 2030. Early-stage engineering studies are underway to determine modifications to the plan of operations to accommodate additional material beyond the current Greens Creek Mineral Reserve life.
The following items are monitored at the TDF:
| | ● | Surface and ground water quality |
| | ● | Water levels with wells and piezometers |
| | ● | Geochemical properties of the tailings |
| | ● | Aquatic biology in several small, adjacent creeks |
Hecla Mining Company | Greens Creek Mine, SLR Project No: 101.00632.00020
Technical Report Summary - February 21, 2022
Figure 15‑6: Hawk Inlet Dry Stack Tailings Disposal Facility
Hecla Mining Company | Greens Creek Mine, SLR Project No: 101.00632.00020
Technical Report Summary - February 21, 2022
15.4 | Mine Development Rock Disposal Facilities |
The current development rock storage area is Site 23 located 1,100 ft west of the 920 mine site. It is used to store potentially acid-generating mine development rock which cannot be used for capping tailings (see Section 15.3). Site 23 currently has a total capacity of 2.1 Mst and is expected to reach this capacity in early 2021 based on the planned mine development schedule.
At this time several options are being evaluated to optimize the development of Site 23 within approved boundaries to provide additional storage for development rock. Once the capacity of Site 23 is exhausted, development rock can be hauled to the TDF and/or used to backfill abandoned access ramps underground.
Ultimately, the material stored at Site 23 will be hauled underground during reclamation activities. This material will fill most of the void left by mine access ramps and other workings.
Historic development rock storage areas are found primarily at two locations:
| | ● | Site D, immediately down slope of Site 23 and |
| | ● | Site E, located at mile marker 4.6 on the B Road, approximately half the road distance between Hawk Inlet and the mine portal. |
Site E is currently undergoing a multi-year removal and reclamation effort. The material from Site E is disposed of with tailings at the TDF.
In addition to Site E, discussed in Section 15.4, reclamation material storage stockpiles are located at various points along the haul road (B Road) connecting the 920 Area and Hawk Inlet.
Hecla Mining Company | Greens Creek Mine, SLR Project No: 101.00632.00020
Technical Report Summary - February 21, 2022
Figure 15‑7: Site 23 Waste Rock Storage Facility
Hecla Mining Company | Greens Creek Mine, SLR Project No: 101.00632.00020
Technical Report Summary - February 21, 2022
The 920-water system draws up to 700 gallons per minute (GPM) from Greens Creek via three intake screens in stream bed for use in the plant and the mine. This water is referred to as fresh water. Fresh water is pumped to a head tank at elevation 1,160 ft or directly to the plant.
Two discharge pipelines are installed in the head tank providing gravity flow for the fresh and fire water systems. The fire water pipeline is installed in the bottom of the 1160 head tank. The fresh water pipe line is installed above the fire water pipeline allowing storage for the firewater system.
Up to 10 GPM is pulled from the fresh water and is filtered, chlorinated, and stored in three tanks totaling 28,000 gallons for potable water.
15.6.2 | Hawk Inlet Water System |
Water infiltrates from Cannery Creek into two caisson-type wet wells:
| | ● | Caisson no. 1 pumped/gravity feed to the Hawk Inlet storage/fire tanks and |
| | ● | Wet well 18 pumped feed to the TDF wheel wash area supply tank. |
The withdrawal from Cannery Creek is limited to 104,000 gpd. Control of each system is based on demand and corresponding storage tank levels.
Water from caisson no. 1 is pumped to three 20,000-gallon tanks located outside the Hawk Inlet water utilities building. Of this initial 60,000 gallons, 45,000 gallons are reserved for the fire suppression systems. Water demand by the camp facilities, wash down and domestic uses is drawn from these storage tanks. These tanks also supply the potable water filtration system where fresh water is filtered, chlorinated, and stored in a fourth 20,000-gallon tank before distribution in the Hawk Inlet camp.
Greens Creek is in a maritime environment and receives considerable precipitation (refer to Section 4.2). Non-contact water is diverted from the site by upland ditches and drains and discharge to the numerous fresh water courses found adjacent to the site.
Management of contact water is undertaken to protect the environment. Contact water includes the following:
| | ● | water withdrawn from Greens Creek and Cannery Creek |
| | ● | ground water from underdrain systems, curtain drains, and collected seeps. |
Hecla Mining Company | Greens Creek Mine, SLR Project No: 101.00632.00020
Technical Report Summary - February 21, 2022
The following flow chart displays the current water management system at Greens Creek. Note that all contact water reports to Ponds 7 and 10 collectively referred to as Pond 7/10.
Figure 15‑8: Greens Creek Water Management Flowchart
15.7.1 | 920 Area Water Management |
All water collected and/or used at the 920 Area is ultimately piped to Pond 7/10 at the TDF, and from there is treated by the TDF water treatment plant (TDF WTP) prior to discharge into Hawk Inlet.
Underground discharge water is sent to the plant where it is combined with tails thickener discharge and sent to the two 920 water treatment plants (920 WTP) and ultimately piped to Pond 7/10.
The main objective of the 920 Area stormwater systems is to protect the environment by controlling contact water at the site for treatment. The stormwater system at the 920 Area mill site is in place to route, contain, treat, store, recycle and export stormwater from the mine and plant.
Water is routed through the system as follows:
| | ● | site collection ditches and lift stations to sediment removal basins |
| | ● | to mill for recycling or Pond 7/10 via pipelines buried adjacent to the B Road. |
In general, all water considered “contact” water is contained at the 920 Area and eventually treated at the TDF WTP. Surface water conveyance systems at the 920 Area are designed to handle a 10 year/24 hour storm event.
Two chemical precipitation plants (CPPs) are used to treat wastewater and are configured and designed to route water back to the plant or to Pond 7/10.
Hecla Mining Company | Greens Creek Mine, SLR Project No: 101.00632.00020
Technical Report Summary - February 21, 2022
15.7.1.3 | Site 23 Water Management |
All water collected and/or used at the 860 and Site 23 area is ultimately piped to Pond 7/10 at the TDF, and from there is treated by the TDF WTP prior to discharge into Hawk Inlet.
Pond D receives water from runoff and the Site D curtain drain system. This water is generally recycled for use in the plant but can be routed to Pond 23 as needed. Pond 23 receives stormwater from Site 23 curtain drains and discharge from Pond A, Pond D, and Pond C. Water from Pond 23 reports to Pond 7/10.
15.7.2 | TDF and Hawk Inlet Water Management |
15.7.2.1 | Hawk Inlet Contact Water |
The Hawk Inlet system routes, stores, collects, and exports water to the TDF area for additional treatment and ultimate discharge.
Contact water is received from the following sources:
| | ● | hawk Inlet stormwater drainage |
| | ● | hawk Inlet wheel wash facility |
| | ● | wash-down from concentrate storage and ship loader; and |
| | ● | treated and disinfected domestic sewage treatment effluent. |
These waters report to de-gritting basin number DB-04, where the heaviest material settles out. Flows are then routed by gravity to the stormwater wet well (integral to the wheel wash building), where it is pumped to Pond 7/10 for additional treatment at the TDF WTP and ultimate discharge to seawater through the APDES outfall 002 located in Hawk Inlet.
15.7.2.2 | TDF Contact Water |
A series of perimeter ditches at the TDF capture surface contact water from precipitation. All surface flows report to Pond 7/10. A series of complex underdrains exist throughout the TDF and at Pond 7/10. All underdrains gravity flow to perimeter ditches or lift stations referred to as wet wells. Water is pumped from the wet wells to perimeter ditches or via pipes to Pond 7/10.
15.7.2.3 | TDF Water Treatment Plant |
All waste, contact, and process water from the 920, 860, Site 23, Hawk Inlet Facility, and the TDF areas ultimately report to Pond 7/10. Pond 7/10 stores water before treatment in the TDF WTP. It provides surge protection for stormwater flows. It is designed to handle the 25 year / 24 hour storm site wide. Pond 7/10 has a total capacity of 66.66 ac feet. Water collected in Pond 7/10 is pumped to the TDF WTP, which is a chemical precipitation plant (CPP). Effluent water (post treatment) is discharged to Hawk inlet via APDES outfall 002.
Hecla Mining Company | Greens Creek Mine, SLR Project No: 101.00632.00020
Technical Report Summary - February 21, 2022
The mine’s electrical power needs are met by utilizing a combination of two sources. The primary source is from purchased power generated by the local Juneau power utility. The Juneau power grid is connected to the Greens Creek grid by an undersea cable and a 13 mi long 69 kV aerial power line. This power is generated by hydroelectric dams and is available to Greens Creek except when reservoir levels fall below predetermined limits.
The secondary source is on site diesel-powered generation. This system includes two separate power-houses that contain nine generating units capable of producing 11.25 MW. The on site generators include a mixture of reciprocating and turbine generators.
Concentrates are transported from the plant to Hawk Inlet using the same 45 ton trucks that are used for transporting tailings. The Hawk Inlet facilities include an approximately 30,000 ton capacity concentrate storage building located near tidewater. Concentrates are loaded onto bulk transport ships using a covered telescoping conveyor.
Fuel arrives at the Hawk Inlet port facility by ocean barges that serve southeast Alaska. It is pumped directly into a 200,000 gallon storage tank that is equipped with full spillage containment. The fuel is then delivered by 9,500 gallon tanker trailers to the 920 Area fuel storage area, which consists of three fully contained tanks yielding a storage capacity of approximately 156,000 gallons.
When electricity is supplied by the local utility intertie, fuel is delivered at one to two month intervals as needed. When the mine is required to operate the diesel generators to supply power to the site approximately 150,000 gallons is delivered weekly.
A 331 bed camp facility with kitchen is located at Hawk Inlet. This is used by staff working a rotational schedule.
All supplies are delivered to the Hawk Inlet port facility via freight barge. Supplies destined for the 920 area are transported by truck. Trash, waste, and empty shipping containers are also loaded back onto barges at the Hawk Inlet port. Both Hawk Inlet and the 920 area have warehouse facilities for material storage and handling. Aggregates are delivered to Hawk Inlet by barge and are stockpiled at various locations throughout the mine site.
Corporate communications on the mine site are handled over fiber-optic cables, leased from GCI Communication Corp, utilizing voice-over-internet-protocol technology.
Process control management is accomplished over an internal Ethernet system utilizing both fiber optic and Cat5 communications. The internal fiber optic system extends into the mine and is utilized to monitor/control fan systems, monitor mine gasses, and track equipment and personnel. A SCADA program is used, allowing remote monitoring and control from multiple sites. A single, site-wide standard is accomplished utilizing “Ignition SCADA” software.
Hecla Mining Company | Greens Creek Mine, SLR Project No: 101.00632.00020
Technical Report Summary - February 21, 2022
Vehicle safety and emergency reporting and communication are accomplished using an island- and mine-wide radio system with dedicated channels for mill operations, mine operations, and road operations. The radio system extends throughout the underground mine by use of a leaky feeder system. Vehicle safety on the surface and underground is enhanced with a proximity detection and collision avoidance system.
A hard-wired mine phone system is also installed throughout the mine with direct communication to supervisory offices and the medical office.
In the event of a fiber optic failure, a backup microwave system is in place to ensure site safety. Emergency satellite phones are also available at both the Hawk Inlet and 920 offices.
Hecla Mining Company | Greens Creek Mine, SLR Project No: 101.00632.00020
Technical Report Summary - February 21, 2022
The mine has now been operational for a 30 year period, and continuously operational for the last 23 years, and has current contracts in place for silver, zinc, and precious metals flotation concentrate sales, doré refining, concentrate transportation, metals hedging, and other goods and services required to operate an underground mine.
Global mined zinc output is approximately 13 million tonnes per annum (Mtpa), contained in approximately 25 Mt zinc concentrate. Global zinc smelting capacity is approximately 14 Mtpa Zn and includes 1.0 Mt to 1.5 Mt of capacity to refine zinc secondary by-products into metal.
Global mined lead output is only approximately 4.6 Mtpa, contained in approximately 8.0 Mt lead concentrates. Global lead smelting capacity is significantly higher at 6.7 Mt Pb and also includes the capability to produce approximately 1.0 Mt Pb from scrap and residues.
Hecla produces approximately 53,000 Mtpa Zn and 44,000 Mtpa Pb in concentrates at its two mines in Alaska and Idaho. Hecla’s total output comprises less than 1% of both global zinc mine capacity and global lead mine capacity. Because Hecla’s concentrate products also contain significant amounts of payable gold and silver, they are sought after by smelters who capture additional value from recovering precious metals through processing and refining zinc and silver concentrates. The current market for Hecla concentrate products is both very liquid and very strong, globally. Hecla’s primary customer base operates in Korea, Japan, Canada, and China. Its concentrate products have also been exported to and processed in Mexico, Belgium, Italy, England, Germany, and the Netherlands.
Global silver supply is approximately 1.0 billion ounces with mine production accounting for around 80% of silver supply. The majority of silver produced is as a by-product of lead, zinc, copper, and gold mines. According to the Silver Institute, lead-zinc mines are the biggest contributors to global silver supply, accounting for approximately 32% of silver mine production in 2020. Mexico, China, and Peru produce 50% of world’s silver, while the United States accounts for only 4% of world silver production.
Silver demand is primarily composed of Industrial demand, which accounts for 50% of total silver demand of 1.0 billion ounces. Investment demand (physical and exchange traded products) and jewelry and silverware account for 25% share each respectively. Silver has the highest electrical conductivity of all metals and this property positions silver as a unique metal for multitude of uses in electronic circuitry in automotive and electronics. Silver’s use in photovoltaic cells has also seen a rapid expansion in the past five years and is expected to be one of the key growth areas in green energy.
Gold supply is approximately 165 Moz Au, with mine production contributing 75% of gold supply and recycling accounting for the remaining 25%. In terms of gold demand, jewelry fabrication accounts for approximately 55% of total demand while Investment in physical bars, coins and Exchange Traded Funds is at 25% of overall demand. Gold’s use in technology applications was around 11 Moz Au, or 8% of total demand in 2021, according to the World Gold Council. Accommodative fiscal and monetary policies globally due to COVID-19 lent support to investment demand for gold in 2020 as gold prices reached record levels in 2020.
Hecla Mining Company | Greens Creek Mine, SLR Project No: 101.00632.00020
Technical Report Summary - February 21, 2022
16.1.2 | Commodity Price Projections |
The metal prices used in the estimation of Mineral Resources and Mineral Reserves are determined by Hecla’s corporate office in Coeur d’Alene, Idaho, USA. Greens Creek Mineral Reserves are estimated using a silver price of $17.00/ounce, lead price of $0.90/lb, zinc price of $1.15/lb, and a gold price of $1,600/oz. Mineral Resources are estimated using a silver price of $31.00/ounce, lead price of $1.15/lb, zinc price of $1.35/lb, and a gold price of $,1,700/oz. The difference in prices is the result of a longer historical period used as the basis for the Mineral Resource estimation.
Table 16‑1 shows the realized metal prices Hecla has received for sales of its products.
Table 16‑1: Hecla Historical Average Realized Metal Prices
Hecla Mining Company – Greens Creek Mine
Metal Prices | 2019 | 2020 | 2021 | Three Year Average |
Silver ($/oz) | 16.65 | 21.15 | 25.24 | 21.01 |
Lead ($/lb) | 0.91 | 0.84 | 1.03 | 0.93 |
Zinc ($/lb) | 1.14 | 1.03 | 1.44 | 1.20 |
Gold ($/oz) | 1.413 | 1,757 | 1,796 | 1,655 |
The economic analysis performed in the LOM plan assumes an average silver price of $21.00/oz, lead price of $0.95/lb, zinc price of $1.25/lb, and a gold price of $1,650/oz based upon analysis of consensus metal price forecasts by financial institutions. Based on macroeconomic trends, the SLR QP is of the opinion that Hecla’s realized metal pricing will remain at least at the current three year trailing average or above for the next five years.
Hecla has agreements at typical lead and zinc concentrates industry benchmark terms for metal payables, treatment charges and refining charges for concentrates produced from the mine. The major customers since 2018 included Korea Zinc (39.3%), Cliveden (13.6%), Mitsui Mining & Smelting (11.8%), and Teck Metals Limited (14.7%). These custom smelters are located in Canada, Japan, and South Korea. Figure 16‑1 shows the product sales by country for Greens Creek products.
Hecla Mining Company | Greens Creek Mine, SLR Project No: 101.00632.00020
Technical Report Summary - February 21, 2022
Figure 16‑1: Concentrate Destinations
Hecla has had concentrate sales frame contracts in place since the beginning of operations in 1989. These contracts are typical sales contracts in the industry and most include an evergreen component so remain in effect from year-to-year after the initial term until cancelled. For those that don’t include an evergreen component new frame contracts are negotiated at the end of their terms. When surplus tonnage is available, spot sales contracts are arranged six to 12 months in advance of shipment. For all of Hecla’s sales contracts, the title and risk of ownership of the concentrates transfers either at the load port or discharge port.
Treatment costs and refining costs vary depending on the concentrate type and the destination smelter. Table 16‑2 summarizes the average metal payability factors.
Table 16‑2: Payability and Treatment Charges Summary
Hecla Mining Company - Greens Creek Mine
Description | Silver | Zinc | Precious Metals |
Pb | 90-95 | None | 90-95 |
Zn | 0-10 | 83-85 | 83-85 |
Ag | 90-95 | 50-65 | 70-80 |
Au | 90-95 | 25-45 | 55-65 |
Base TC $/dmt | 120-150 | 200-220 | Zinc +10-15 |
Hecla Mining Company | Greens Creek Mine, SLR Project No: 101.00632.00020
Technical Report Summary - February 21, 2022
Greens Creek concentrates are higher in precious metals content, but lower in lead and zinc content than typical lead, zinc, and PM concentrates. With regard to Greens Creek’s PM concentrate, this product requires treatment at Imperial Smelting Furnaces (ISFs) which are declining in number due to more efficient technologies coming on-line. All bulk concentrate tonnage anticipated to be produced at Greens Creek is committed to our current frame contract on an evergreen basis. Hecla has also previously delivered PM concentrate to China and Korea and has those relationships in place should it be necessary to place additional PM concentrate tonnage at any time during LOM operations.
Gravity concentrate is shipped to a processor in Kimberly, ID (Metals Research) for treatment through their oxygenated-cyanide leach process. Once treated, Metals Research produces doré bars and forwards them to Metalor on Hecla’s behalf for further refining under a toll refining agreement. Upon receipt of doré bars from Greens Creek, Metalor further refines the material and Hecla’s pool accounts are credited with ounces of gold and silver bullion from this process. The gold bullion is sold on a biweekly basis to a large bank at prevailing spot prices. The silver bullion is sold to Metalor on a quarterly basis at prevailing spot prices with refined metals being sold to various metal traders.
Lastly, the tailings resulting from the oxygenated-cyanide leach process at Metals Research are sent via truck to Teck’s smelter in Trail, BC on a quarterly basis for further processing and eventual disposal.
Hecla utilizes financially-settled forward contracts to manage the exposure to changes in prices of zinc, lead, silver, and gold contained in concentrate shipments between the time of sale and final settlement. In addition, we utilize financially-settled forward contracts to manage the exposure to changes in prices of zinc and lead (but not silver and gold) contained in our forecasted future concentrate shipments. These contracts do not qualify for hedge accounting and are marked-to-market through earnings each period.
A Contract of Affreightment is in place with an international shipping company covering the shipments of the silver, zinc, and PM concentrates from the Greens Creek port facilities at Hawk Inlet, AK to overseas discharge ports serving the smelter customers. The current Contract of Affreightment has a term of two years and expires at the end of December 2019. Negotiations are currently underway for a new Contract of Affreightment with the same shipping company.
Several other contracts have been utilized for other goods and services required to operate an underground mine. Large contracts include lease of office facilities in Juneau, lease of a boat dock at Auke Bay, AK for employee parking and boat dock facilities, employee marine transportation services for the Greens Creek workforce to commute from Auke Bay to Admiralty Island, contract drilling services for surface exploration and underground core drilling, camp catering and housekeeping for an employee camp facility, barge transportation of supplies and equipment from Seattle to Admiralty Island and small float plane and helicopter support.
A contract is in place with the local Juneau electric utility for any excess hydroelectric power not required for the City and Borough of Juneau.
On occasion, mining contractors are employed for specific mine development projects.
Many supplies contracts are in place with suppliers for purchase of various goods; the largest contracts include purchase of fuel, reagents, ground support, and leases of mining equipment.
Hecla Mining Company | Greens Creek Mine, SLR Project No: 101.00632.00020
Technical Report Summary - February 21, 2022
17.0 | ENVIRONMENTAL STUDIES, PERMITTING, AND PLANS, NEGOTIATIONS, OR AGREEMENTS WITH LOCAL INDIVIDUALS OR GROUPS |
Greens Creek has a well-established and effective environmental and permitting management program. Staff is knowledgeable and experienced in site and regulatory requirements. Budgets are reasonable and there were no critical path permitting items referenced that would limit production. A reclamation/closure plan and estimates to perform this activity are in place. The budgets and staffing to perform required programs are adequate and indicative of activities and responsibilities.
17.1 | Environmental Studies and Monitoring |
Greens Creek has been collecting environmental data and monitoring environmental conditions and compliance since the 1980s. Environmental monitoring programs are in place to assess compliance with permits and standards.
Greens Creek falls under Hecla’s Environmental Management System (EMS) which follows a 13 element plan-do-check-act approach that ensures continuous improvement around issues including obligation registers, management of change, air quality, water and waste management, energy management, training, and reporting. This system promotes a culture of environmental awareness and innovation throughout the company. The EMS program is benchmarked against ISO-14001 and complements Canada’s Towards Sustainable Mining (TSM) program.
Internal and external audits are performed to assess compliance with corporate, permit, regulatory and industry requirements. Findings are documented and tracked.
Permitting at Greens Creek falls within the purview of numerous entities (regulatory and non-regulatory) on the federal, state, and local levels. These agencies require oversight, registration, and/or notification prior to initiating or significantly modifying facilities and operations at the mine. All necessary registrations, authorizations and permits required for operations to date, and for continued operation of this facility, are in place. Although some permits have expired or are set to expire, renewal applications are filed with the appropriate agency in each case or other measures were taken, as necessary, to administratively extend the prior conditions until such time as a renewed permit or additional authorization to utilize is issued.
Hecla Mining Company | Greens Creek Mine, SLR Project No: 101.00632.00020
Technical Report Summary - February 21, 2022
A list of the current permits in place is included in Table 17‑1.
Table 17‑1: Current Project Permits/Approvals
Hecla Mining Company – Greens Creek Mine
Description | Reference # | Agency | Date of Approval | Category |
APDES/NPDES Permit
Name Change
Renewal Request | AK-004320-6 | ADEC/EPA | 5/20/05;
Effective 7/01/05
Renewal 10/01/15-9/30/20 | Water |
401 Certification for NPDES Permit | AK-004320-6 | ADEC | 3/31/2005 | Water |
401 Certification for 404 Permit | 404 Permit | ADEC | 6/20/2014 | Water |
Health Permit
Cannery Camp - (Food Service) | 113010178 | ADEC | 1/2018 | Facilities |
Waste Management Permit | 2014DB0003
[Replaces 0211-BA001] | ADEC | 8/11/2014 – 8/10/2019 | Waste |
Title V Air Quality Operating Permit | AQ0302TVP03 (replaces AQ302TVP02 Revision 1) | ADEC | 7/01/08 (orig.)
Revised 7/13/2016 – 6/16/2021 | Air |
Owner Requested Limit (ORL) Air Quality Operating Permit | 0853ORL02 | ADEC | 3/11/10 | Air |
Cooperative Service Agreement | Letter of Agreement | ADEC | 4/27/09 | Other |
Underground Secondary Containment Agreement | Letter of Agreement | ADEC & SPAR | 12/30/08 | Spill |
Corrosion Control Addition Approval | Plan Rev #4874;
PWSID #113560 | ADEC | 11/19/09 | Water |
Drinking Water System Classification Letter | PWSID #113560 | ADEC | 3/7/2017 | Water |
Drinking Water System Classification Letter | PWSID #119205 | ADEC | 3/7/2017 | Water |
Waiver Asbestos Monitoring
Affidavit | PWSID #113560 | ADEC | 12/28/2001 | Water |
Waiver Asbestos Monitoring
Affidavit | PWSID #119205 | ADEC | 12/28/2001 | Water |
Hecla Mining Company | Greens Creek Mine, SLR Project No: 101.00632.00020
Technical Report Summary - February 21, 2022
Description | Reference # | Agency | Date of Approval | Category |
Waiver SOC & OOC Monitoring; PMP Certification | PWSID# 113560 | ADEC | 1/01/11; 6/03/15;
10/30/18 | Water |
Waiver SOC & OOC Monitoring; PMP Certification | PWSID# 119205 | ADEC | 1/01/11; 6/03/15;
10/30/18 | Water |
Certificate of Approval to Operate a Dam – Pond 7 | AK00307
FY2018-18-AK00316 | ADNR | 4/19/2018 | Facilities |
Hazard Potential Classification and Jurisdictional Review
Pond 10 | NID ID# AK00316 | ADNR | 2/2/2018 | Facilities |
Hazard Potential Classification and Jurisdictional Review
Pond 23 | N/A | ADNR | 2/2/2018 | Facilities |
Hazard Potential Classification and Jurisdictional Review
A Pond | N/A | ADNR | 2/2/2018 | Facilities |
Hazard Potential Classification and Jurisdictional Review
C Pond | N/A | ADNR | 2/2/2018 | Facilities |
Hazard Potential Classification and Jurisdictional Review
D Pond | N/A | ADNR | 2/2/2018 | Facilities |
Hazard Potential Classification and Jurisdictional Review
Sand Pit | NID ID# AK00317 | ADNR | 2/2/2018 | Facilities |
Certificate of Approval to Modify a Dam | FY2019-11-AK00317 | ADNR | 9/6/2018 | Facilities |
Certificate of Approval to Operate a Dam | FY2019-12-AK00317 | ADNR | 9/17/2018 | Facilities |
Right of Way Permit (Marine Outfall to Hawk Inlet) | ADL 105124
Amendment 2 | ADNR | 7/01/91
Amended 5/01/08 for name change; 7/2016: renewed for 25 years | Land |
Tideland Lease (Young Bay Dock) | ADL 106488;
Amendment1
Amendment 2 | ADNR | 1/25/00
5/01/08
4/28/2015 | Land |
Hecla Mining Company | Greens Creek Mine, SLR Project No: 101.00632.00020
Technical Report Summary - February 21, 2022
Description | Reference # | Agency | Date of Approval | Category |
Tideland Permit (Mooring Buoy in Hawk Inlet) | LAS 19928 | ADNR | 10/06/2015 | Land |
Water Right # 656 (Cannery Creek - 17,000 Gal/Day - Public Supply)
Name Change | ADL 43347 | ADNR | 10/06/86 | Water |
Temporary Water Use Permit (Cannery Creek 103,400 gal/day) | TWUP J2000-10 | ADNR | 10/06/00 | Water |
Water Use Permit (700 gal/min-Greens Creek-for milling purposes)
Name Change | LAS 11807 | ADNR | 10/05/88 | Water |
Water Use Permit (Five dewatering wells within mill site complex, 10 gpm limit)
Name Change | LAS 11808 | ADNR | 10/05/88 | Water |
Temporary Water Use Authorization - 109 | TWUA F2015-109 | ADNR | 2/23/2016 | Water |
Temporary Water Use Authorization - 110 | TWUA F2015-110 | ADNR | 2/23/2016 | Water |
Temporary Water Use Authorization – 111 | TWUA F2015-111 | ADNR | 2/23/2016 | Water |
Temporary Water Use Authorization – 112 | TWUA F2015-112 | ADNR | 2/23/2016 | Water |
Temporary Water Use Authorization – 113 | TWUA F2015-113 | ADNR | 2/23/2016 | Water |
Temporary Water Use Authorization - 114 | TWUA F2015-114 | ADNR | 2/23/2016 | Water |
Fish Habitat Permit | FH-08-III-0210 | ADF&G | 7/15/08 | Wildlife |
Fish Habitat Permit | FH14-I-0040 | ADF&G | 6/20/14 | Wildlife |
Culvert 1 – Stream No. 111-41-10190 | FH14-I-0109 | ADF&G | 4/27/15 (does not expire) | Wildlife |
Culvert 1 – Stream No. 111-41-10190 | FH14-I-0109 | ADF&G | 4/27/15 (does not expire) | Wildlife |
Culvert 2 – Drainage to Fowler Creek | FH14-I-0110 | ADF&G | 4/27/15 (does not expire) | Wildlife |
Culvert 3 – Drainage to Fowler Creek | FH14-I-0111 | ADF&G | 4/27/15 (does not expire) | Wildlife |
Water Withdrawal Point 1 – Zinc Creek | FH15-I-0024 | ADF&G | 4/27/15 (does not expire) | Wildlife |
Hecla Mining Company | Greens Creek Mine, SLR Project No: 101.00632.00020
Technical Report Summary - February 21, 2022
Description | Reference # | Agency | Date of Approval | Category |
Water Withdrawal Point 2 – Little Sore Creek | FH15-I-0025 | ADF&G | 4/27/15 (does not expire) | Wildlife |
Water Withdrawal Point 3 – Little Sore Creek | FH15-I-0026 | ADF&G | 4/27/15 (does not expire) | Wildlife |
Plywood flume for stream gauge – Tributary Creek | FH15-I-0133 | ADF&G | 8/18/15 (does not expire) | Wildlife |
Water Withdrawal Point | FH18-I-0128 | ADF&G | 9/7/2018 | Wildlife |
Mining License | APMA Ref # J55571
License No 99475 | ADOR (AK Dept. Of Revenue) | 5/1/2018 | Land |
Large Mine Permit | M-02-95 | CBJ | Summary approval granted 8/12/14 | Land |
Facility Response Plan | EPA #FRPAKA0096
USCG
GPO Append 9 | EPA / USCG | Reviewed and accepted by USCG
9/3/2014 | Spill |
Underground Injection Well
Class V (Tailings Materials to Active Stope Areas) | N/A | EPA | Notification sent 9/03/98 | Waste |
Underground Injection Well
Class V (#33 Decline in Mine/Mill used for temporary storage of approximately one million gallons of water) | N/A | EPA | Notification sent 11/16/94 | Waste |
Underground Injection Well
Class V (Stope 21AS in Section 21, Zone 8 of the Mine used to permanently store sludge and sediment) | N/A | EPA | Notification sent 11/16/94 | Waste |
Underground Injection Well
Class V (380 cy of settleable solids and water stored temporarily in stope off the 33 Cross Cut) | N/A | EPA | Notification sent 11/21/94 | Waste |
Landing Facility Location Identifier (Hawk Inlet Federal Aviation Administration) | HWI Private Airport | FAA | 9/6/01 | Transportation |
Radio Station Authorization (FCC Registration Number (FRN) 0008396178) | WNMG649 | FCC | 10/4/14 | Other |
Radio Station Authorization | WPLY665 | FCC | 6/5/13 | Other |
Hecla Mining Company | Greens Creek Mine, SLR Project No: 101.00632.00020
Technical Report Summary - February 21, 2022
Description | Reference # | Agency | Date of Approval | Category |
Radio Station Authorization | WPMJ594 | FCC | 12/5/13 | Other |
Radio Station Authorization | WQBL479 | FCC | 10/10/14 | Other |
Radio Station Authorization | WRV305 | FCC | 6/5/14 | Other |
Memorandum of Understanding (USFS, ADEC, ADNR MOU for single bond) | Reclamation Bond | Multi-Agency | 2014
Amended 6/08/09 for name change | Other |
Radioactive Material License (Radioactive materials license (Fixed & mobile)) | 50-23276-01 Amendment 17 | NRC | 5/22/18 | Other |
Tailings Expansion October 31, 2019 | POA-1988-269-M7 | USCOE | 1/6/15 | Facilities |
Certificate of Adequacy Waiver (Waiver to the Oil & Garbage requirements of 30 CFR 158.150) | 16450 | USCG | 1/27/92 | Transportation |
Certificate of Documentation (UMTB 165 Replacement Young Bay Breakwater (in Juneau) | 642888 | USCG | 8/24/17 | Transportation |
ATF Explosives Permit | 9-AK-110-33-8G-91620 | USDJ | N/A | Other |
Hazardous Materials Certificate of Registration | 050615 551 053XZ for registration years 2018-2021 | USDOT | 7/1/2018 – 6/30/2021 | Transportation |
Lease-Mine Portal/Mill Site (61.19 ac) | 4050-03
Amendment 6 | USFS | Original 8/12/86;
Amendment 6 issued 4/27/94 | Land |
Lease for Milling - 1350 Portal and Campsite (9.82 ac) | 4050-09 | USFS | 12/31/86 | Land |
Communications Site (microwave tower) Special Use Permit (0.18 ac)
Amendment 2 | ADM113 (renum.4050-11); Amendment 2 name change ADM227 | USFS | 6/15/09 | Land/Communications |
Special Use Permit-Road (146 ac)
Amendment 1 | ADM4050-02; ADM228 | USFS | 12/31/97; 6/15/09 | Land |
Hecla Mining Company | Greens Creek Mine, SLR Project No: 101.00632.00020
Technical Report Summary - February 21, 2022
Description | Reference # | Agency | Date of Approval | Category |
Waste Area E (10.8 ac)
Amendment 3 | 4050-08;
Amendment 1;
Amendment 2;
Amendment 3 number changed to ADM229 | USFS | 10/27/87;
11/23/87;
1/24/01;
06/15/09 | Land |
Lease for Mining (123 ac) Tailings & Pipeline – Stage II Expansion
Amendment 2 | ADM 4050-10
Amendment 1: Amendment 2 number changed to ADM230 | USFS | 9/01/88;
4/05/04;
6/15/09 | Land |
Decision Notice – Approval of Surface Exploration EA 2017 | Decision Notice | USFS | 4/14/17 | Land/Exploration |
GPO Appendices
Appendix 1
Appendix 2
Appendix 3
Appendix 4
Appendix 5
Appendix 6
Appendix 7
Appendix 8
Appendix 9
Appendix 10
Appendix 11
Appendix 12
Appendix 13
Appendix 14
Appendix 15 | GPO’s | USFS | 11/1/2014
5/1/2002
8/1/2017
8/1/1995
3/1/2016
6/1/2016
8/1/2014
1/1/1999
3/1/2014
2/1/2013
11/1/2014
6/1/2016
12/1/2005
7/1/2016
11/1/2014 | Land |
Joint Venture Agreement-Hawk Inlet Warranty Deed | N/A | N/A | 1/10/78
Effective 09/30/84 | |
Hecla Mining Company | Greens Creek Mine, SLR Project No: 101.00632.00020
Technical Report Summary - February 21, 2022
Hecla has filed an amendment to its General Plan of Operations (critical path permit) to expand its TDF by approximately 13.7 ac. The expansion is primarily inside the existing USFS lease area and will allow mine operations to continue past 2031, when the current facility is expected be full. Other supporting permits/amendments will follow. Budget and schedule for these permitting activities are reasonable and provide for contingency/appeal(s).
Greens Creek operates through permission granted by multiple permits, which are summarized in Table 17‑1. The permits contain requirements for site monitoring including air, water, waste, and land aspects of the Property. The permit-required data are maintained by the facility, and exceptions to the monitoring obligations are reportable to the permitting authority. Monitoring is conducted in compliance with permit requirements, and management plans are developed as needed to outline protocols and mitigation strategies for specific components or activities.
Greens Creek is in a maritime environment and receives considerable precipitation. Non-contact water is diverted from the site by upland ditches and drains, monitored and discharge to the numerous freshwater courses found adjacent to the site.
Management and monitoring of contact water is undertaken to meet permitting requirements and protect the environment. Contact water includes the following:
| | ● | water withdrawn from Greens Creek and Cannery Creek |
| | ● | ground water from underdrain systems, curtain drains, and collected seeps |
All water collected and/or used at the 920 Area is ultimately piped to Pond 7/10 at the TDF, and from there is treated by the TDF WTP prior to discharge into Hawk Inlet. Monitoring occurs regularly according to permit requirements (prior to discharge).
Underground discharge water is sent to the plant where it is combined with tails thickener discharge and sent to the 920 WTP.
17.2.3 | Hazardous Materials, Hazardous Waste, and Solid Waste Management |
Greens Creek manages its hazardous materials, hazardous wastes and solid wastes in accordance and compliance with issued permits and applicable regulatory requirements.
17.2.4 | Tailings Disposal, Mine Overburden, and Waste Rock Stockpiles |
Greens Creek generates approximately 1,800 dry tons of filter-pressed tailings per day, or approximately 650,000 stpa. These tailings are dewatered in a filter press at the plant, with approximately 50% of the tailings being mixed with cement and hauled back into the underground mine for disposal in mined-out areas as backfill. The remaining 50% of the tailings are transported from the plant on the B Road using covered 45 ton haul trucks to a surface TDF located near Hawk Inlet. At the TDF, tailings are end dumped and placed using bulldozers. The tailings are placed and compacted in lifts in a manner to minimize surface infiltration and promote runoff.
Hecla Mining Company | Greens Creek Mine, SLR Project No: 101.00632.00020
Technical Report Summary - February 21, 2022
The Greens Creek mineralized material is comprised of massive sulfides in a temperate rainforest environment. Proper management of the waste materials from the mining process is of primary importance due to potential acid rock drainage (ARD) and metals leaching considerations. Regulatory oversight is rigorous, and the relationship between the agencies and the mine is transparent.
Waste materials are regulated under the State’s Waste Management Permit, which involves provisions for building contained waste storage facilities, diverting water from the facilities, and capturing and treating all water that contacts the waste.
17.3 | Reclamation and Closure |
Returning the land to a safe use condition as a publicly owned national forest is the intent for closure. The closure strategy's physical aspects are designed to return the disturbed areas to near natural conditions to the extent practical and utilize established industry standards, such as common civil works activity using mobile equipment for grading, contouring, and re-vegetating with native species. Power and utilities will be maintained if necessary for water treatment during the closure period and beyond, as required by regulation. Facility and structure removal is well defined, and standard industry practice will be employed to remove specified structures and facilities from the Property. For planning and estimating purposes, all facilities will eventually be removed from the Property, but some features of the infrastructure may be maintained past the substantial completion of reclamation to accommodate monitoring and treatment systems. Provisions for operational support during the closure period and beyond are included in the cost estimates.
17.3.1 | Reclamation and Permit Requirements |
Greens Creek has prepared a reclamation and closure plan to address interim, concurrent, final reclamation and post-mining land use of the mine. The reclamation and closure plan and closure cost estimates are submitted to the USFS as required under 36 CFR 228.1 et. seq. and 36 CFR 228A. Concurrently, the reclamation and closure plan and cost estimate are submitted to ADNR and ADEC in accordance with AS 27.19.010 et. seq., 11 AAC 97.100 et. seq., AS 46.03.010 et. seq., and 18 AAC 60.25 et seq.
The reclamation and closure plan sets performance goals applicable to interim, concurrent, and final reclamation, and addresses post-closure monitoring requirements. It also sets scheduling and other standards for reclamation and for final closure planning requirements, and it explains how detailed, regularly updated reclamation task planning will be used for purposes of calculating a reclamation bond. Reclamation practices will utilize best practicable established and accepted technologies and methodologies suitable for the southeast Alaska environment.
17.3.2 | Reclamation and Closure Cost |
Greens Creek has developed a Closure, Reclamation, Post-Closure, and Cost Estimate Plan (Plan). This Plan is intended to satisfy four distinct objectives:
| | 1. | Return surface disturbed areas to a stable and productive condition following mining |
| | 2. | Provide for public safety |
| | 3. | Protect long term land, water, air, and biological resources in the area |
| | 4. | Provide funding and financial assurance guarantee the reclamation/closure will occur |
Hecla Mining Company | Greens Creek Mine, SLR Project No: 101.00632.00020
Technical Report Summary - February 21, 2022
The most recent version of the Plan was updated in 2020 and utilized the 2021 LOM Plan to estimate the schedule for post closure activities. The updated 2021 LOM Plan has forecasted production to 2036. Major closure and reclamation activities are assumed to begin the year following the cessation of production (2037) and last for approximately three years. Post-Closure activities primarily consist of long term water treatment and monitoring immediately following closure and extending for a period of 30 years.
As shown (updated November 2019), the total financial responsibility required is $108,219,855.
Reclamation and closure costs are generally categorized (broken down) as follows:
| | ● | Holding year (2034) = $5,864,383 |
| | ● | Reclamation Phase (2035 to 2037) = $54,929,942 |
| | ● | Long Term Care Phase (2038 to ?) = $47,425,530 |
The reclamation estimate is derived from the Standardized Reclamation Cost Estimator (SRCE) model, developed by SRK Consultants, and used at Greens Creek since 2011. The SRCE model uses a unit cost approach and categorizes direct cost estimates into seven elements, representing different property closure aspects. These seven elements are: 1) Earthwork/Contouring, 2) Revegetation/Stabilization, 3) Detoxification/Water Treatment/Disposal of Wastes, 4) Structure, Equipment, and Facility Removal, 5) Monitoring, 6) Construction Management and Support, and 7) Closure planning, G&A, Human Resources. The total reclamation cost is the sum of these seven elements (direct costs) plus the indirect costs (a percentage of the direct costs).
This number will be updated in 2024 or as part of the TDF permitting effort, whichever comes first. ARO legal obligations are updated regularly and based upon existing site conditions, current laws, regulations, and costs to perform the permitted activities. The ARO is to be conducted in accordance with Financial Accounting Standards Board (FASB) Accounting Standards Codification (ASC) 410.
Greens Creek is a major economic and philanthropic pillar in Southeast Alaska. It is Juneau’s largest taxpayer and largest private-sector employer. It helps support more than 50 non-profits in the Juneau area, including the Pathways to Mining program at the University of Alaska Southeast. Recently, Hecla Mining Company, through its Charitable Foundation, committed up to $125,000 in financial assistance to support community needs during the COVID-19 crisis.
Greens Creek looks for opportunities to work collaboratively with stakeholders to support activities that are of benefit to the communities in which the company operates.
SLR was not able to independently verify adequacy of management of social issues and though no specific adversarial issues were raised, it was relayed by staff that Greens Creek, in most cases, has a positive relationship with stakeholders.
Government, community relations representatives and staff from Greens Creek formally and informally engage with the community on an ongoing basis and serve as the face of the company. They sit on boards of community and business organizations at regional and local levels, participate in discussions with government officials, and act as a point of contact within the community. In doing so, they keep stakeholders apprised of critical issues to the operations, understand important topics in the community, and seek to listen to any questions or concerns. Greens Creek indicated that this strategy allows them to maintain an ongoing relationship with stakeholders and collaborate with communities to find solutions should any issues arise.
Hecla Mining Company | Greens Creek Mine, SLR Project No: 101.00632.00020
Technical Report Summary - February 21, 2022
18.0 | CAPITAL AND OPERATING COSTS |
Hecla’s forecasted capital and operating costs estimates are derived from annual budgets and historical actuals over the long life of the current operation. According to the American Association of Cost Engineers (AACE) International, these estimates would be classified as Class 1 with an accuracy range of ‑3% to -10% to +3% to +15%.
18.1 | Capital Cost Estimates |
Greens Creek has been in operation for decades hence there are no preproduction capital costs to consider. Capital costs over the LOM total $294.2 million and are summarized in Table 18‑1.
Table 18‑1: Capital Cost Summary
Hecla Mining Company - Greens Creek Mine
Item | Cost ($000) |
Capitalized Mine Development | 100,929 |
Capitalized Definition Drilling | 36,411 |
Other Capital Expenditures | 173,430 |
Capital Lease Financing | (16,553) |
Total | 294,216 |
Note:
| | 1. | Totals may not agree due to rounding. |
The mine sustaining capital is shown in Table 18‑1. The mine development is carried out by HGCMC employees with no contractors currently included in the schedule to carry out sustaining mine development, drift rehabilitation work and other construction work. Contingency is added to the planned capital estimates. Contingency percentages typically applied range from 5% to 30% based on the characteristics of the underlying work program.
Capital development costs have been estimated based on the expected amount of development in each year and the anticipated costs of development. This is derived from past experience with updates to the cost based on projected changes in items that would affect costs. Total LOM mine development is estimated at $102 million.
Included within the mine capital cost estimate is provision for underground mine rehabilitation; these costs are primarily ground support and labor costs, which are estimated based on expected rehabilitation activities to be performed in specific years.
Hecla Mining Company | Greens Creek Mine, SLR Project No: 101.00632.00020
Technical Report Summary - February 21, 2022
18.1.3 | Capitalized Definition Drilling Costs |
Capitalized drilling expenditures are estimated based on the anticipated amount of drilling in a specific year and an expected cost for the drilling program for each specific year. Total LOM capitalized drilling costs are projected to be $36.4 million.
18.1.4 | Other Capital Costs |
Process capital costs are estimated based on specific projects which are anticipated to be undertaken. In these cases, cost estimates are provided by project management, and long term capital is anticipated based on prior experience regarding the amount of sustaining capital which is expected for the plant to maintain anticipated production levels. The capital costs other than the mine sustaining development and definition diamond drilling are listed in Table 18‑2.
Table 18‑2: Other Capital Cost Summary
Hecla Mining Company - Greens Creek Mine
Item | Cost
($000) |
Mine Mobile Equipment | 56,277 |
Other Mine Equipment | 6,537 |
Process Plant | 14,685 |
Surface Infrastructure
(Amortizable Assets) | 51,636 |
Surface Infrastructure (Other) | 25,560 |
Surface Mobile Equipment | 15,865 |
Environmental | 2,870 |
Total | 173,430 |
Note:
| | 1. | Totals may not agree due to rounding. |
Working capital costs, composed of accounts receivable, accounts payable, and product and supply inventories, are included in in the mine cash flow and net to zero over the LOM. Accounts receivable balances fluctuate based upon period-end sale amounts and the average duration of time between shipments and receipt of payment. Accounts payable vary over time based upon the average portion of a period’s expenditures that are typically unpaid at the end of the period. Inventory values fluctuate based upon the estimated quantities of product produced and the average duration of time between production and sale of products. Depending on the assumptions in the LOM, the working capital variation at the end of the mine life can be positive or negative. In the case of the Greens Creek Mine, Hecla expects the end-of-life sums received from sales of the final concentrate parcels produced to be greater than the other working capital items, such that an estimated $18.0 million cash inflow is expected, which will result in working capital to draw down to zero.
Hecla Mining Company | Greens Creek Mine, SLR Project No: 101.00632.00020
Technical Report Summary - February 21, 2022
18.2 | Operating Cost Estimates |
| 18.2.1 | Operating Cost History |
The operating costs for Greens Creek for the period 2016 to 2021 are summarized in Table 18‑3.
Table 18‑3: 2016 to 2021 Operating Cost Data
Hecla Mining Company – Greens Creek Mine
| | Units | 2016 | 2017 | 2018 | 2019 | 2020 | 2021 |
Production Costs | | | | | | | |
Mining | $ millions | 56.7 | 59.5 | 60.3 | 68.2 | 65.9 | 68.9 |
Mill | $ millions | 26.1 | 27.2 | 28.3 | 31.3 | 30.6 | 29.6 |
Surface Operations | $ millions | 18.0 | 18.8 | 19.7 | 22.5 | 20.0 | 20.5 |
Environmental | $ millions | 2.5 | 2.4 | 2.9 | 2.7 | 2.8 | 2.7 |
Administration | $ millions | 22.7 | 22.6 | 23.0 | 24.4 | 30.3 | 29.9 |
Total | $ millions | 125.9 | 130.5 | 134.3 | 149.1 | 149.6 | 151.5 |
Cost
per ton milled | | | | | | | |
Mining | $/ton | 69.48 | 70.86 | 71.37 | 80.57 | 80.58 | 81.79 |
Mill | $/ton | 31.99 | 32.38 | 33.53 | 37.02 | 37.37 | 35.12 |
Surface Operations | $/ton | 22.01 | 22.42 | 23.30 | 26.63 | 24.42 | 24.29 |
Environmental | $/ton | 3.04 | 2.82 | 3.44 | 3.14 | 3.37 | 3.20 |
Administration | $/ton | 27.88 | 26.98 | 27.18 | 28.82 | 37.02 | 35.52 |
Total | $/ton | 154.40 | 155.46 | 158.82 | 176.19 | 182.75 | 179.92 |
| 18.2.2 | Operating Cost Estimate |
Operating costs over the LOM total $194.70/t milled and are summarized in Table 18‑4.
Table 18‑4: Operating Cost Summary
Hecla Mining Company – Greens Creek Mine
| | Units | Total | 2022 | 2023 | 2024 | 2025 | 2026 to 2035 |
Production Costs | | | | | | | |
Mining | $ millions | 1,035.1 | 74.1 | 73.7 | 73.1 | 72.9 | 741.4 |
Mill | $ millions | 402.3 | 30.2 | 30.6 | 30.2 | 30.1 | 281.2 |
Surface Operations | $ millions | 297.8 | 22.5 | 22.5 | 22.7 | 22.5 | 207.6 |
Environmental | $ millions | 44.3 | 3.4 | 3.4 | 3.4 | 3.4 | 30.9 |
Administration | $ millions | 376.5 | 28.3 | 28.4 | 28.6 | 28.5 | 262.6 |
Total | $ millions | 2,156.0 | 158.4 | 158.6 | 157.9 | 157.5 | 1,523.6 |
| | | | | | | | |
Cost per ton milled | | | | | | | |
Mining | $/ton | 93.47 | 88.25 | 87.79 | 86.79 | 86.87 | 98.95 |
Mill | $/ton | 36.33 | 35.95 | 36.49 | 35.92 | 35.82 | 36.66 |
Surface Operations | $/ton | 26.90 | 26.75 | 26.86 | 26.92 | 26.87 | 26.94 |
Environmental | $/ton | 4.00 | 4.00 | 4.00 | 3.99 | 4.00 | 4.00 |
Administration | $/ton | 34.00 | 33.77 | 33.81 | 33.95 | 34.00 | 34.04 |
Total | $/ton | 194.70 | 188.71 | 188.94 | 187.58 | 187.56 | 200.60 |
Total LOM operating costs are anticipated to be $194.70/ton milled. The operating costs included in the LOM are derived from the 2021 actuals for the near term and adjusted for factors regarding expected cost changes in the later years. The budget is built using various cost inputs including operating experience, quotes from various service providers, anticipated personnel changes, and changes in production.
Diesel fuel was estimated at $2.50/gallon through the LOM; however, fluctuations in the price of diesel fuel will affect operating costs.
Power is both purchased from the local utility company at a rate of approximately $0.13/kWh and generated on site for an expected LOM rate of $0.50/kWh. The LOM plan estimates purchasing 769 million kWh of power from the locally utility and generating 132 million kWh on site.
18.2.4 | Mine Operating Costs |
Mining costs of $93.47/ton milled include both production mining and ore access development costs.
The LOM production mining cost per ton is anticipated to be $75.69/ton milled. These costs include expected direct costs for the ore mining process (drilling, blasting, mucking, hauling, backfill) such as labor, ground support, explosives, and diesel fuel.
In addition to the production mining costs, ore access development costs are anticipated to be $17.79/ton milled which accounts non-capitalized waste development necessary to access the ore.
Both costs also include indirect cost allocations for equipment and electrical maintenance, underground service crews and mine management and technical service costs.
18.2.5 | Process Operating Costs |
LOM milling cost per ton is anticipated to be $36.33/ton milled. These costs include labor, maintenance, reagents, grinding media, and electricity. Mill consumables and electricity were estimated based on an expected usage rate per ton milled; other costs such as labor were estimated as fixed costs.
Hecla Mining Company | Greens Creek Mine, SLR Project No: 101.00632.00020
Technical Report Summary - February 21, 2022
18.2.6 | Surface Operating Costs |
Surface operation costs are estimated at $26.90/ton milled. These costs primarily consist of labor, surface maintenance costs, fuel, and power usage. Activities included in these costs include concentrate and tailings haulage, road maintenance, tailings placement, buildings maintenance, concentrate ship loading, freight haulage and water treatment operations.
18.2.7 | Environmental Operating Costs |
Environmental operating costs are estimated at $4.00/ton milled. These costs primarily consist of labor specific to the environmental department.
18.2.8 | General and Administrative Operating Costs |
G&A operating costs are estimated to be $34.00/ton milled over the LOM. These costs mainly consist of labor for accounting, human resources, purchasing, health and safety, management, various insurance costs, property taxes, communications, and IT services. In addition to these costs, G&A costs include costs for providing camp facilities and transportation services for the Greens Creek workforce.
The current Greens Creek manpower total 457 persons. The breakdown by department is shown in Table 18‑5.
Table 18‑4: Current Manpower
Hecla Mining Company – Greens Creek Mine
| | Hourly FTE | Salary FTE | Total |
Mine | 155 | 21 | 176 |
Mill | 49 | 6 | 55 |
Surface Operations | 49 | 4 | 53 |
Environment | 2 | 5 | 7 |
Maintenance | 122 | 7 | 129 |
Administration | 18 | 19 | 37 |
Total | 395 | 62 | 457 |
The Greens Creek full time equivalent (FTE) manpower for 2020, 2021, and the LOM plan is summarized in Table 18‑6.
Hecla Mining Company | Greens Creek Mine, SLR Project No: 101.00632.00020
Technical Report Summary - February 21, 2022
Table 18‑5: LOM Manpower Levels
Hecla Mining Company – Greens Creek Mine
| | Hourly FTE | Salary FTE | Total |
2020 Actual | 375 | 61 | 436 |
2021 Actual | 395 | 62 | 457 |
2022 - 2026 | 420 | 75 | 495 |
SLR notes that most of the workforce increase is planned in the mining department, and that an additional 30 mine department personnel are expected to be hired through 2022. The workforce increase will be critical to achieving the planned production increase and this represents some risk to the LOM plan, considering the skilled nature of the work and the worldwide demand for skilled personnel.
Hecla Mining Company | Greens Creek Mine, SLR Project No: 101.00632.00020
Technical Report Summary - February 21, 2022
An after-tax Cash Flow Projection has been generated from the LOM production schedule and capital and operating cost estimates and is summarized in Table 19‑2. A summary of the key criteria is provided below.
| | ● | Total mill feed processed: 11.1 Mst |
| | ● | Average processing rate: 2,300 stpd with following production profile shown in Table 19‑1. |
Table 19‑1: Production Summary
Hecla Mining Company – Greens Creek Mine
Commodity | Head Grade | % Recovery | Recovered
Metal | Annual
Production | Payable Metal |
Gold | 0.09 oz/ton | 72.8 | 0.69 Moz | 52,000 oz/year | 0.58 Moz |
Silver | 11.3 oz/ton | 76.5 | 95.7 Moz | 7.3 Moz/year | 85.6 Moz |
Lead | 2.5% | 78.4 | 443 Mlb | 34 Mlb/year | 338 Mlb |
Zinc | 6.6% | 86.1 | 1,250 Mlb | 94 Mlb/year | 865 Mlb |
| | ● | Metal prices used in the economic analysis are constant US$1,650/oz Au, US$21/oz Ag, US$0.95/lb Pb, and US$1.25/lb Zn. |
| | ● | Revenue is calculated assuming the above metal price forecast and incorporates a $2.7 million hedge loss for lead and zinc over the first three years of cash flow. |
| | ● | Average LOM concentrate freight cost: $57/wmt CIF to customer’s discharge points. |
| | ● | Average LOM treatment charge: $115/dmt silver concentrate, $173/dmt to $202/dmt zinc and precious metals concentrate. |
| | ● | Average LOM refining costs for concentrates: $0.07/dmt. |
| | ● | Average doré refining cost: $2.10/oz Au. |
19.1.3 | Capital and Operating Costs |
| | ● | LOM capital costs of $294.2 million |
| | ● | LOM site operating cost of $194.70/ton milled |
| | ● | LOM closure/reclamation $92.8 million, including $87.3 million for final reclamation in year after final production |
Hecla Mining Company | Greens Creek Mine, SLR Project No: 101.00632.00020
Technical Report Summary - February 21, 2022
19.1.4 | Taxation and Royalties |
Mining companies doing business in Alaska are primarily subject to U.S. corporate income tax, Alaska State income tax and Alaska Mining License tax. The State of Alaska levies a mining license tax on mining net income received in connection with mining properties and activities in Alaska, at a rate of $4,000 plus 7% over $100,000. The U.S. corporate income tax rate is 21% and the Alaska state income tax rate in 9.4%.
No income tax is anticipated to be payable over the LOM. Hecla plans to use a combination of existing and forecasted depreciation expenses, allocation of expenses from other entities within the consolidated tax group, percentage depletion allowance, and existing net operating losses to generate zero annual taxable income through LOM. However, the mine will still incur $35 million for AK state mining taxes during LOM.
The Property is subject to an 2.5% NSR royalty to a third party (Bristol Royalty) over approximately 11.2% of production.
SLR has reviewed the Hecla’s Greens Creek Reserves only model and has prepared its own unlevered after-tax LOM cash flow model based on the information contained in this TRS to confirm the physical and economic parameters of the mine.
The Greens Creek economics have been evaluated using the discounted cash flow method by considering annual processed tonnages and grade of ore. The associated process recovery, metal prices, operating costs, refining and transportation charges, and sustaining capital expenditures were also considered.
The annual cash flow, presented in Table 19‑2 with no allowance for inflation, show a pre-tax and after-tax NPV, using a 5% discount rate, of $772 million and $747 million, respectively. The SLR QP is of the opinion that a 5% discount/hurdle rate for after-tax cash flow discounting of long lived precious/base metal operations in a politically stable region is reasonable and appropriate and commonly used. For this cash flow analysis, the internal rate of return (IRR) and payback are not applicable as there is no negative initial cash flow (no initial investment to be recovered) since Greens Creek has been in operation for a number of years.
Hecla Mining Company | Greens Creek Mine, SLR Project No: 101.00632.00020
Technical Report Summary - February 21, 2022
Table 19‑2: Life of Mine Indicative Economic Results
Hecla Mining Company – Greens Creek Mine
Hecla Mining Company | Greens Creek Mine, SLR Project No: 101.00632.00020
Technical Report Summary - February 21, 2022
Hecla Mining Company | Greens Creek Mine, SLR Project No: 101.00632.00020
Technical Report Summary - February 21, 2022
The Project’s after-tax cumulative cash flow discounted at five percent (NPV5) from the model presented above were analyzed for sensitivity to variations in revenue, operating, and capital cost assumptions.
Positive and negative variations were applied independently to each of the following parameters:
Table 19‑3 shows the sensitivity cases analyzed, which are shown in the chart in Figure 19‑1. Because of the Project’s 30 year operating history, values for capital and operating costs, metals recoveries, and metal grades are well understood. Therefore, these parameters were flexed over a smaller range compared to metals prices, which are more volatile and were evaluated over a wider range of sensitivity.
Hecla Mining Company | Greens Creek Mine, SLR Project No: 101.00632.00020
Technical Report Summary - February 21, 2022
Table 19‑3: Sensitivity Analysis Summary
Hecla Mining Company – Greens Creek Mine
Variance From Base Case | Head Grade
(oz/ton Ag) | NPV at 5%
(US$ M) |
0.90 | 10.2 | 493 |
0.95 | 10.7 | 620 |
1.00 | 11.3 | 747 |
1.05 | 11.9 | 873 |
1.10 | 12.4 | 992 |
Variance From Base Case | Recovery
(% Ag) | NPV at 5%
(US$ M) |
0.90 | 68.8 | 493 |
0.95 | 72.6 | 620 |
1.00 | 76.5 | 747 |
1.05 | 80.3 | 873 |
1.10 | 84.1 | 992 |
Variance From Base Case | Metal Prices
(US$/oz Ag) | NPV at 5%
(US$ M) |
0.80 | 16.80 | 155 |
0.90 | 18.90 | 454 |
1.00 | 21.00 | 747 |
1.10 | 23.10 | 1,029 |
1.20 | 25.20 | 1,313 |
Variance From Base Case | Operating Costs
(US$/t) | NPV at 5%
(US$ M) |
0.90 | 175.23 | 901 |
0.95 | 184.96 | 824 |
1.00 | 194.70 | 747 |
1.08 | 209.30 | 631 |
1.15 | 223.90 | 515 |
Variance From Base Case | Capital Costs
(US$ M) | NPV at 5%
(US$ M) |
0.90 | 348 | 775 |
0.95 | 368 | 761 |
1.00 | 387 | 747 |
1.08 | 416 | 725 |
1.15 | 445 | 704 |
Hecla Mining Company | Greens Creek Mine, SLR Project No: 101.00632.00020
Technical Report Summary - February 21, 2022
Figure 19‑1: After-tax NPV at 5% Sensitivity Analysis
The results of the sensitivity analysis demonstrate that the Mineral Reserve estimates are most sensitive to variations in metals prices, less sensitive to changes in metals grades and recoveries, and least sensitive to fluctuations in operating and capital costs.
Hecla Mining Company | Greens Creek Mine, SLR Project No: 101.00632.00020
Technical Report Summary - February 21, 2022
The SLR QP has not independently verified this information and this information is not necessarily indicative of the mineralization at the [Project Name].
Hecla Mining Company | Greens Creek Mine, SLR Project No: 101.00632.00020
Technical Report Summary - February 21, 2022
21.0 | OTHER RELEVANT DATA AND INFORMATION |
Cautionary Note: This Section 21 of the Greens Creek TRS contains information that is different than the Economic Analysis provided in Section 19 of the Greens Creek TRS. Section 19 was prepared in accordance with specific SEC rules which require that only Proven and Probable Mineral Reserves (LOM Plan) be used and disallow the inclusion of Inferred Mineral Resources in demonstrating the economic viability in support of a disclosure of a mineral reserve. See Item 1302(e)(6) of SEC Regulation S-K.
The supplemental information in this Section 21 is not designed to replace the Economic Analysis disclosed in Section 19, but rather to provide additional, supplemental disclosure. This Section 21 supplements the disclosure contained in Section 19’s Economic Analysis by inclusion of Inferred Mineral Resources as described below. You are cautioned not to rely on the economic analysis in this Section 21 instead of Section 19, as this supplemental information includes Inferred Mineral Resources that are not Mineral Reserves and do not have demonstrated economic viability. You should not assume that all or any part of Inferred Mineral Resources will ever be converted into Mineral Reserves. Further, Inferred Mineral Resources have a great amount of uncertainty as to their existence and as to whether they can be mined legally or economically, and are considered too speculative geologically to have modifying factors applied to them that would enable them to be categorized as Mineral Reserves. Inferred Mineral Resources may not be considered when assessing the economic viability of a mining project, and may not be converted to a Mineral Reserve. The percentage of the mineral resources used in the LTP cash flow analysis that was classified as Inferred Mineral Resources is approximately 15%.
Supplemental Information: The Company develops Long Term Plans (LTP) to support the strategic direction of its mines. The LTPs are updated annually by the technical teams using the most current geologic information, mine designs, processing parameters, cost and price inputs, regulatory considerations, and financial analyses. The plans include some Inferred resources when those resources, in the judgement of the technical team and based on historical performance, have a reasonable probability of contributing positively to the economic performance of the mines. As such, the valuation of the mines as determined by the Company in its LTP exceeds the valuation determined when only Reserves are analyzed. Experience has shown that the LTPs include in the order of 5% to 10% Inferred Mineral Resources.
An after-tax Cash Flow Projection has been generated from the LTP production schedule and capital and operating cost estimates, and is summarized in Table 21-1 along with the corresponding LOM plan (Mineral Reserves only presented in Section 19) metrics and the variances between the two plans.
Hecla Mining Company | Greens Creek Mine, SLR Project No: 101.00632.00020
Technical Report Summary - February 21, 2022
Table 21‑1: LTP versus LOM Plan
Hecla Mining Company – Greens Creek Mine
| Long Term Plan |
Parameter | Years 1 to 3
(2022 to 2024) | Years 4 to 8
(2025 to 2029) | Remaining LRP
(2030 to 2036) | Total LTP |
| Operations |
Ore Milled
(000 ton) | 2,500 | 4,200 | 6,000 | 12,700 |
Metal Produced
(000 oz Ag) | 23,200 | 37,200 | 49,800 | 110,200 |
Metal Produced
(000 oz Ag) | 100 | 300 | 400 | 800 |
Metal Produced
(ton Pb) | 53,400 | 83,900 | 119,900 | 257,200 |
Metal Produced
(ton Zinc) | 152,700 | 230,400 | 351,900 | 735,000 |
| Financial (in millions) |
Revenue | 900 | 1,400 | 2,000 | 4,300 |
Cost of Goods Sold | 650 | 1,100 | 1,450 | 3,200 |
Gross Profit | 250 | 300 | 550 | 1,100 |
Less: Income Tax | 5 | 10 | 100 | 115 |
Net Income | 245 | 290 | 450 | 985 |
| Cash Flow (in millions) |
Net Income | 245 | 290 | 450 | 985 |
Depreciation, Depletion, and Amortization (DDA) | 150 | 300 | 250 | 700 |
Working Capital and other non-cash changes | 10 | 25 | 10 | 45 |
Cash Flow from Operations | 405 | 615 | 710 | 1,730 |
Less: Capital Expenditures | 130 | 150 | 50 | 330 |
Net Cash Flow | 275 | 465 | 660 | 1,400 |
NPV (0%) | | | | 1,400 |
NPV (5%) | | | | 1,000 |
Hecla Mining Company | Greens Creek Mine, SLR Project No: 101.00632.00020
Technical Report Summary - February 21, 2022
| Life of Mine Plan |
Parameter | Years 1 to 3
(2022 to 2024) | Years 4 to 8
(2025 to 2029) | Remaining RSV
(2030 to 2036) | Total RSV |
| Operations |
Ore Milled
(000 ton) | 2,500 | 4,200 | 4,400 | 11,100 |
Metal Produced
(000 oz Ag) | 23,200 | 37,200 | 35,300 | 95,700 |
Metal Produced
(000 oz Ag) | 150 | 260 | 280 | 690 |
Metal Produced
(ton Pb) | 53,400 | 83,900 | 84,100 | 221,400 |
Metal Produced
(ton Zinc) | 152,700 | 230,400 | 242,000 | 625,100 |
| Financial/Cash Flow (in millions) |
Net Income US$ M | 266 | 309 | 395 | 970 |
Cash Flow from Operations US$M | 356 | 533 | 523 | 1,412 |
Net Cash Flow US$M | 244 | 372 | 409 | 1,025 |
NPV (0%) US$ M | | | | 1,025 |
NPV (5%) US$ M | | | | 747 |
| Variance (LTP versus LOM Plan) |
Parameters | Years 1 to 3
(2022 to 2024) | Years 4 to 8
(2025 to 2029) | Remaining Life
(2030 to 2036) | Total Variance |
| Operations |
Ore Milled
(000 ton) | - | - | 1,600 | 1,600 |
Metal Produced
(000 oz Ag) | - | - | 14,500 | 14,500 |
Metal Produced
(000 oz Ag) | (50) | 40 | 120 | 110 |
Metal Produced
(ton Pb) | - | - | 35,800 | 35,800 |
Metal Produced
(ton Zinc) | - | - | 109,900 | 109,900 |
Ore Milled | 0% | 0% | 36% | 14% |
Silver Produced % Variance | 0% | 0% | 41% | 15% |
Gold Produced % Variance | -33% | 15% | 43% | 16% |
Lead Produced % Variance | 0% | 0% | 43% | 16% |
Zinc Produced % Variance | 0% | 0% | 45% | 18% |
| | | | | |
Net Income % Variance | -8% | -6% | 14% | 2% |
Cash Flow from Operations
% Variance | 14% | 15% | 36% | 22% |
Net Cash Flow % Variance | 13% | 25% | 62% | 37% |
NPV (0%) % Variance | | | | 37% |
NPV (5%) % Variance | | | | 34% |
Hecla Mining Company | Greens Creek Mine, SLR Project No: 101.00632.00020
Technical Report Summary - February 21, 2022
As the operating cash flow and net cash flow metrics show the impact of the additional Inferred Mineral Resources in the LTP, the LTP’s estimate of non-cash charges was based on Hecla book values, while the calculation of income taxes uses an estimate of non-cash charges related to income taxes. In the LOM plan the non-cash charges utilize a separate estimate methodology for income taxes payable calculations in Section 19. Furthermore, when combined with a more detailed income tax model in the LTP, the net effect of these changes is materially no change (2%) in net income compared to the LOM.
Hecla Mining Company | Greens Creek Mine, SLR Project No: 101.00632.00020
Technical Report Summary - February 21, 2022
22.0 | INTERPRETATION AND CONCLUSIONS |
SLR offers the following conclusions by area.
| 22.1 | Geology and Mineral Resources |
| | ● | Exploration activities have been successful in identifying a number of additional massive sulfide lenses at depth beyond the initial mineralization discovered on surface. To date, economic mineralization has been located in nine deposits that are located in spatial proximity to a contact between footwall phyllitic rocks (interpreted as altered mafic volcanic and volcaniclastic rocks) and hanging wall clastic sedimentary units. Large portions of this favorable mine contact have not been fully evaluated by diamond drilling at depth. |
| | ● | The understanding of the genetic aspects of the Greens Creek mineralization continues to evolve and improve as a result of the academic studies completed to date. The level of knowledge is likely to continue to improve with additional studies. |
| | ● | The understanding of the complex folding and faulting history of the host rocks and massive sulfide mineralization also continues to improve with further studies and collection of additional drilling information. |
| | ● | As prepared by Hecla, and reviewed and accepted by SLR, the Greens Creek Indicated Mineral Resources are estimated to total approximately 8.36 Mst at an average grade of approximately 12.8 oz/ton Ag, 0.10 oz/ton Au, 3.0% Pb, and 8.4% Zn. Inferred Mineral Resources are estimated at approximately 2.15 Mst at an average grade of approximately 12.8 oz/ton Ag, 0.08 oz/ton Au, 2.8% Pb, and 6.8% Zn. All Mineral Resources are effective as of December 31, 2021 and are stated exclusive of Mineral Reserves. |
| | ● | Mineral Resources have been classified in accordance with S-K 1300 definitions for Mineral Resources. |
| | ● | The geological data and procedures are adequate for the estimation of Mineral Resources and comply with industry standards. |
| | ● | The “Reasonable Prospects for Economic Extraction” requirement for Mineral Resources as defined in S-K 1300 is satisfied by the application of polygons as reporting criteria for eight of the nine mineralized deposits such that: |
| | o | All blocks >$215 NSR/ton immediately adjacent to the designed Mineral Reserve shapes were enclosed. |
| | o | All blocks >$215 NSR/ton that may be separated from the designed Mineral Reserve shapes were enclosed if the blocks were observed to be continuous in 3D to contain a total of approximately 20,000 tons or more. Where these blocks were only a single block wide (five feet), they were not enclosed. |
| | o | No blocks >$215 NSR/ton immediately adjacent to as-builts were enclosed unless those blocks were determined to be sufficiently continuous and wide enough to support a separate stope. |
| | o | Once blocks were selected in the appropriate model, they were reported without any dilution from neighboring blocks with <$215 NSR/ton values. |
Hecla Mining Company | Greens Creek Mine, SLR Project No: 101.00632.00020
Technical Report Summary - February 21, 2022
| | ● | The “Reasonable Prospects for Economic Extraction” requirement for Mineral Resources as defined in S-K 1300 is satisfied for the Gallagher deposit by application of similar criteria, however, using an increased cut-off value of $220 NSR/ton. |
| 22.2 | Mining and Mineral Reserves |
| | ● | Mineral Reserve estimates, as prepared by Hecla and reviewed and accepted by SLR, have been classified in accordance with S-K 1300 definitions for Mineral Reserves. Mineral Reserves as of December 31, 2021 total 11.08 Mst grading 11.3 oz/ton Ag, 0.085 oz/ton Au, 2.6% Pb, and 6.5% Zn and containing 125.2 Moz Ag, 0.946 Moz Au, 282,000 tons Pb and 726,000 tons Zn at an NSR cut-off value of $215 NSR/ton. |
| | ● | The Mineral Reserves are divided into nine separate zones, each constituting between 3% and 27% of total Mineral Reserve tons. The largest zone is 200S followed by South-West. |
| | ● | Mineral Reserves are estimated by qualified professionals using modern mine planning software in a manner consistent with industry best practices. |
| | ● | SLR verified that Hecla’s selected metal prices for estimating Mineral Reserves are consistent with independent forecasts from banks and other lenders. |
| | ● | Mineral Reserve estimates do not include Inferred material which historically have constituted a large portion of ore mined at Greens Creek. |
| | ● | Greens Creek is a well established mine with many years of operating experience, providing the necessary expertise to extract, safely and economically, the Mineral Reserves. |
| | ● | Mining at Greens Creek primarily utilizes cut and fill, and drift and fill techniques, supplemented by longhole stoping where orebody geometry permits. The mining methods used are appropriate to the deposit style and employ conventional mining tools and mechanization. All areas are backfilled with either paste or rock fill depending on future confinement and strength requirements. |
| | ● | Stopes are designed to a minimum mining width governed by mining equipment. Two dilution factors are applied to all mining shapes; 6% to account for overbreak into surrounding rock, and 6% to account for overbreak into adjacent backfill. Background metal grades for waste and tailings are applied, respectively. |
| | ● | Extraction for all mining methods is assumed to be 100% based on operating experience. |
| | ● | Greens Creek tends to mine a significant amount of material outside of the Mineral Reserves each year. This is typically Inferred Resources at the margins of Mineral Reserves, and additional reserve grade material not previously identified by the definition diamond drilling program. |
| | ● | The equipment and infrastructure requirements for LOM operations are well understood. Conventional underground mining equipment is used to support the underground mining activities. |
| | ● | The underground equipment fleet is standard to the industry and has been proven on site. Numerous crucial units have recently been replaced or overhauled as part of the mobile equipment rebuild/replacement schedule. |
| | ● | The predicted mine life to 2035 is achievable based on the projected Mineral Reserves estimated. SLR is of the opinion however, that maintaining the planned production rate is optimistic and will be particularly difficult as the number of active mining areas drops toward the end of the LOM. |
Hecla Mining Company | Greens Creek Mine, SLR Project No: 101.00632.00020
Technical Report Summary - February 21, 2022
| | ● | The plant is a conventional but complex semi-autogenous grinding (SAG) mill-ball mill grinding and flotation concentrator producing silver, zinc and precious metals (PM) flotation concentrates and gold concentrate using gravity spiral concentrators. The plant is compact and efficient, using particle size monitoring and on-stream analysis for grinding and flotation process control. |
| | ● | The target grind size for rougher flotation is P80 70 μm to 85 μm and P95 140 μm to 160 μm. A particle size monitor is used to monitor cyclone overflow on a continuous basis. |
| | ● | A gravity circuit comprising three stages of gravity spiral concentrators treats part of the grinding circuit cyclone underflow producing a precious metals concentrate that is shipped off site for intensive leaching, electrowinning, and doré casting. The gravity concentrates typically recover 15% to 20% of the gold in the mill feed and less than 1% of the silver. |
| | ● | Naturally floating carbonaceous material is removed from the flotation feed using column flotation cells, improving the performance of the lead flotation cells. |
| | ● | The first stage of both lead and zinc rougher flotation uses column flotation cells. The concentrate from the lead rougher column is final concentrate and flows directly to the concentrate thickeners. Zinc column concentrates may also be of final concentrate grade and can be pumped to the concentrate thickener. |
| | ● | The lead and zinc rougher concentrates are reground to P80 20 μm (98% passing 38 μm) using Metso Outotec Vertimills prior to cleaning. A unit flotation cell is installed in the lead Vertimill regrinding circuit circulating load to recover galena, gold and silver from the lead regrind cyclone underflow and to reduce overgrinding. The unit cell concentrates flow by gravity to the silver concentrate thickener. |
| | ● | Lead and zinc roughing and cleaning circuits are similar using conventional mechanical cells. |
| | ● | The PM flotation circuit treats the lead and zinc circuit cleaner tailings. The lead cleaner tailings feeds a lead PM rougher and cleaner circuit followed by Woodgrove swing cells before joining the zinc cleaner tailings in the PM rougher column cell feeding the PM flotation circuit. |
| | ● | Flotation circuit performance is monitored by on-stream analysis of eighteen flotation circuit streams for lead, zinc, copper, silver, iron, and percent solids every 15 minutes using an on-stream analyzer. Mass flow is calculated on each concentrate stream providing an estimated concentrate mass yield for each concentrate. |
| | ● | On-stream assays for all streams are used with feed tonnage and concentrate mass flow estimates to determine an estimated on-line mass balance. Daily composites of on-stream analysis samples are collected and assayed to monitor and correct OSA calibration. |
| | ● | The Greens Creek metallurgical department provides flotation grade targets to the operators, which then adjust rougher and cleaner mass yields by manual control of reagent addition. |
| | ● | Reagents are pumped from the reagent mixing and storage area to head tanks at appropriate locations in the flotation circuit. The head tanks are equipped with computerized solenoid discharge valves for gravity addition of flotation reagents. Flocculants are added by positive displacement pumps and CO2 is added using customized mixing systems to inject CO2 into a water stream. |
| | ● | Tailings filtration is a very important operation at Greens Creek. All filter presses are equipped for diaphragm pressing and cake blowing using regular plant air and are mounted on four load cells to determine cake weight, monitor the degree of slurry filling, degree of completion of diaphragm press and air blow cycles, completeness of cake discharge, and the weight of cake produced on each cycle. |
Hecla Mining Company | Greens Creek Mine, SLR Project No: 101.00632.00020
Technical Report Summary - February 21, 2022
| | ● | Tailings filtration is a potential limiting operation in the plant. Tailings filtration is carried out in presses of similar design, with each press yielding four tons to 4.5 tons of filter cake at 11% to 12% moisture every seven to eight minutes. Tailings are sent to the surface batch plant to satisfy the mine’s backfilling requirements. Excess tailings filter cake is trucked to the dry stack TDF for placement and compaction according to an engineered design. |
| | ● | Mill production, ore grades and recoveries are consistent for both the five year and 10 year LOM plan. The average annual production for the period is 950,000 tons of ore with total lead, zinc, silver and gold recoveries of 81%, 89%, 80%, and 69%, respectively. The plant is projected to produce approximately 12 Moz Ag and 83,000 oz Au per year, with most of the precious metals reporting to the silver concentrate, and 18% of the gold reporting to the gravity concentrate. The primary grades of the silver, zinc, and PM concentrates are 27.5% Pb, 47.5% Zn, and 25% Zn, respectively. |
| | ● | Greens Creek has the appropriate infrastructure to support the current LOM plan to 2032. |
| | ● | Modifications to the plan of operations and engineering are necessary to optimize the waste storage capacity at Site 23. |
| | ● | Early-stage engineering studies are in progress to determine modifications to the plan of operations to accommodate additional material beyond the current Greens Creek Mineral Reserve life. |
| | ● | Engineering studies to gain an understanding of options for final disposal of historic waste rock piles, include the potential for impoundment in the TDF or underground disposal. |
| | ● | Hecla maintains a comprehensive environmental management and compliance program. All permits required for the current Greens Creek operations are in place, and mine staff continually monitor permits/regulated conditions and file required reports with the applicable regulatory agencies at the federal, state, and local level. |
| | ● | Greens Creek represents one of the longest concurrent environmental baseline databases available used in assessing compliance and impact. |
| | ● | Hecla’s EMS follows a 13 element plan-do-check-act approach that ensures continuous improvement around issues including obligation registers, management of change, air quality, water and waste management, energy management, training, and reporting. This system promotes a culture of environmental awareness and innovation throughout the company. The EMS program is benchmarked against ISO-14001 and complements Canada’s TSM program. On a related matter, there appears to be good cross-discipline support for the overall environmental program. |
| | ● | Hecla has sufficiently addressed the environmental impact of the operation, and subsequent closure and remediation. No Notice(s) of Violation were reported during 2021 and Hecla works cooperatively with federal, state, and local agencies regarding permitting, regulatory oversite, and inspections. |
| | ● | Hecla has developed a reclamation/closure plan to meet internal Hecla and regulatory requirements. The most recent cost estimates to perform this work is $108.2 million (November 2021 ARO). Financial Assurance instruments are in place to ensure closure commitments are guaranteed should Hecla be unable to perform its obligations. |
| | ● | Hecla reports that community relationships are good, and that it maintains open communication with the public for the purpose of providing information to interested residents and visitors. |
Hecla Mining Company | Greens Creek Mine, SLR Project No: 101.00632.00020
Technical Report Summary - February 21, 2022
SLR offers the following recommendations by area.
| 23.1 | Geology and Mineral Resources |
| | 1. | For future Mineral Resource updates apply a metal price deck to the creation of mineralization wireframes that aligns with the prices used to prepare the Mineral Resource statements. |
| | 2. | Evaluate the impact of treating any unsampled intervals for the non-payable metals (such as barium, calcium, and iron) as null values upon the calculation of the block density values. |
| 23.2 | Mining and Mineral Reserves |
| | 1. | Use a single set of metal prices for Mineral Reserve reporting and LOM planning to maintain cut-off grade consistency. |
| | 2. | Update backfill metal grades in future LOM plans to reflect expected tailings grades. |
| | 3. | Evaluate actual extraction (recovery) from longhole stoping areas and consider applying a modifying factor if appropriate. |
| | 4. | Treat waste material and Inferred material in a similar manner with respect to metal grade assignment. |
| | 5. | Continue to investigate the resource model accuracy through reconciliation analysis and strive to improve lead and zinc grade estimates. |
| | 6. | Continue to identify production areas suitable for longhole mining in the LOM plan to take advantage of the production efficiencies gained through bulk mining. |
| | 7. | Create an LRP with Inferred material removed. Stoping areas and supporting development should be designed to maximize the recovery of Mineral Reserves. These designs can be augmented with additional designs that target the recovery of Inferred material and used to develop a LRP that can be used as a comparison against the LOM plan. SLR is of the opinion that following this methodology will: |
| | o | Result in a more robust LOM plan that is more likely to be achieved. |
| | o | Allow for more accurate reporting of Mineral Reserve grades and tons, and production and development costs. |
| | 1. | Maintain continuous communication between the plant and the mine to understand the feed materials being delivered to the blending stockpiles at the plant. |
| | 2. | Prioritize plans to upgrade or replace the existing automated tailings filters. Tailings filtration is a limiting operation in the plant and achieving the throughput rates and cake moistures is dependent on operations and maintenance of the filtration equipment and the material types being processed. |
Hecla Mining Company | Greens Creek Mine, SLR Project No: 101.00632.00020
Technical Report Summary - February 21, 2022
| | 1. | Track and participate in the development of new environmental and mine permitting regulations that could impact operations. |
| | 2. | Continue to perform internal and external audits of environmental compliance. |
| | 3. | Evaluate opportunities for concurrent reclamation to minimize financial obligations at closure. |
| | 4. | Continue to update reclamation and closure cost estimates on a regular basis. |
Hecla Mining Company | Greens Creek Mine, SLR Project No: 101.00632.00020
Technical Report Summary - February 21, 2022
AACE International, 2012, Cost Estimate Classification System – As applied in the Mining and Mineral Processing Industries, AACE International Recommended Practice No. 47R-11, 17 p.
Alaska Department of Natural Resources Division of Mining, Land and Water, 2009: Mining Laws and Regulations as Contained in the Alaska Statutes and Alaska Administrative Code: booklet produced by the Alaska Department of Natural Resources, 2009, 76 p.
Alaska Department of Revenue, 2012: Mining License Tax: information posted to Alaska Department of Revenue website, accessed 1 March 2013, http://www.tax.alaska.gov/programs/programs/index.aspx?60610.
AMEC Foster Wheeler, 2017: 2016 Review – NWW and 5250 Mineral Zones, Greens Creek Mine, Alaska, Project Number 191234, April 2017.
AMEC, 2002: Letter Report – Review of Central West Zone Resource Model, Greens Creek, Alaska: unpublished internal report prepared by AMEC E&C Services Inc. for Kennecott Greens Creek Mining Company, November 2002.
AMEC, 2003: 2002 Resource and Reserve Audit, Greens Creek Mine, Alaska: unpublished internal report prepared by AMEC E&C Services Inc. for Kennecott Greens Creek Mining Company, February 2003.
AMEC, 2004: 2003 Review – 9A & Northwest West Zones, Greens Creek Mine, Alaska: unpublished internal report prepared by AMEC E&C Services Inc. for Kennecott Greens Creek Mining Company, March 2004.
AMEC, 2006: 2005 Review – 200S, 5250, NWW and SWB Zones, Greens Creek Mine, Alaska: unpublished internal report prepared by AMEC E&C Services Inc. for Kennecott Greens Creek Mining Company, March 2006.
AMEC, 2008: 2007 Reserve Audit, 5250N and Northwest West Deposits; Resource Audit, 5250N and Gallagher, Greens Creek Mine, Alaska: unpublished internal report prepared by AMEC E&C Services Inc. for Kennecott Greens Creek Mining Company, June 2008.
AMEC, 2008: Review of 2009 Life-of-Mine Plan, Greens Creek Mine, Alaska: unpublished internal report prepared by AMEC E&C Services Inc. for Hecla Mining Company, November, 2008.
AMEC, 2010: 2009 Review – 5250 and 9A Zones, Greens Creek Mine, Alaska: unpublished report prepared by AMEC E&C Services Inc. prepared for Hecla Greens Creek Mining Company, November, 2010.
AMEC, 2013: 2012 Reserve Audit: draft of unpublished internal report prepared by AMEC E&C Services Inc. prepared for Hecla Greens Creek Mining Company, March 2013.
Hecla Mining Company | Greens Creek Mine, SLR Project No: 101.00632.00020
Technical Report Summary - February 21, 2022
Anderson, V.M., and Taylor, C.D., 2000: Alteration Mineralogy and Zonation in Host Rocks to the Greens Creek Deposit, Southeastern Alaska: Geological Society of American Cordilleran Section Meeting, Abstracts with Programs, v. 32. no. 6, p. A-2.
Armstrong, S., 2011: Cleaner Flotation Testing on a New Sample of Baritic Ore: Our Project P-4167: unpublished Dawson Metallurgical Laboratories Letter Report to John Ackerman, 2011.
Asarte, P., 2011: Backfill Acid Consumption: unpublished Hecla Greens Creek Mining Company internal memorandum, May 5, 2011.
Banning, S.W., 1983: Metallurgical Evaluation of the Greens Creek Orebody: internal memorandum, Noranda Mining Inc., 1983.
Blake, C., 2009: Greens Creek Mine: Silver and Base Metal Mineralogy of a Suite of Products from the Lead Circuit: unpublished internal memorandum prepared by Chris Blake of Clevedon, United Kingdom for Hecla Greens Creek Mining Company, 2009.
Bureau of Land Management 2011b: Mining Claims and Sites on Federal Lands: publication by the Bureau of Land Management, 2011, 44 p.
Bureau of Land Management, 2011a: Mining Claim Information: article posted to US Department of Interior, Bureau of Land Management website, accessed 1 March 2013, http://www.blm.gov/az/st/en/prog/mining/requirements.html.
Bureau of Land Management, 2012: BLM Alaska Minerals Program: information posted to Bureau of Land Management website, accessed 1 March 2013, http://www.blm.gov/ak/st/en/prog/minerals.html.
Department of Mining, Land and Water, 2012: Water Rights: information posted to Department of Mining, Land and Water webpage, accessed 1 March 2013, http://dnr.alaska.gov/mlw/water/wrfact.cfm.
Dressler, J.S., and Dunbire, J.C., 1981: The Greens Creek Ore Deposit, Admiralty Island, Alaska: Canadian Institute of Mining and Metallurgy Bulletin, v. 74, no. 833, p. 57.
Franklin, J.M., and McRoberts, S., 2009: Report on Analytical Reliability and Method Selection for Hecla Greens Creek Mining Company.
Freitag, K., 2000: Geology and Structure of the Lower Southwest Orebody, Greens Creek Mine, Alaska: Colorado School of Mines Thesis.
Fulton, R.L., Gemmell, J.B., West, A., Lear, K., Erickson, B., and Duke, N., 2003: Geology of the Hanging Wall Argillite Sequence, Greens Creek VHMS Deposit, Admiralty Island, Alaska, GAC-MAC Abstract, v. 28, p. 299.
Hecla Mining Company | Greens Creek Mine, SLR Project No: 101.00632.00020
Technical Report Summary - February 21, 2022
Hecla Mining Company Ltd, 2021, Greens Creek Mine: Hecla Mining Company website (URL: https://www.hecla-mining.com/greens-creek/), visited on September 16, 2021.
Hecla Mining Company, 2020, website, https://ir.hecla-mining.com.
Hoy, T., 1995: Sedimentary Hosted Exhalative Deposits of British Columbia: in B.C. Ministry of Energy, Mines and Natural Resources, Paper 95-8, pages 1-59
Jankovic, A., and Valery, W. Jnr., 2003: Performance Assessment and Optimizations of the Greens Creek Grinding Circuit: unpublished report prepared by the Julius Kruttschnitt Mineral Research Centre, 2003.
Karl, S.M. and Wilson, F.H., 2016: Plate-1 Generalized geologic map of south‐east Alaska, northwest British Columbia, and southwest Yukon, in, GAC-MAC annual meeting Field trip B2, Whitehorse, June 2016.
Lefebure, D.V. and Alldrick, D.J. 1996: Sediment hosted Cu+/-Ag+/Co in British Columbia, in Selected British Columbia Mineral Deposits, edited Sangster, D., B.C., Paper 96-17, Ministry of Energy, Mines and Natural Resources, pp. 45-91.
MacIntyre, Don, 1995, Sedimentary Exhalative Zn-Pb-Ag deposits, in Selected British Columbia Deposit Profiles, Volume 1 – Metallic and Coal, edited by Lefebure, D.V., pp. 68-102.
Massive Sulfide (VMS) Deposit, Alaska, USA. Unpublished PhD, University of Tasmania, Hobart, Australia, 416 p.
Mineral Resources Development Incorporated, 1998: Face Sampling Study, Greens Creek Mine: unpublished report prepared by Mineral Resources Development Incorporated for Kennecott Greens Creek Mining Company, May 1998.
Mineral Resources Development Incorporated, 1998: Resource Modelling for Southwest Zone, Northwest West Zone, 200 South Zone: unpublished report prepared by Mineral Resources Development Incorporated for Kennecott Greens Creek Mining Company, December 1998.
Mineral Resources Development Incorporated, 1998: Review of Resource Model and Reconciliation to Production, Greens Creek Mine: unpublished report prepared by Mineral Resources Development Incorporated for Kennecott Greens Creek Mining Company, March 1998.
Mineral Resources Development Incorporated, 1999: CIBC World Markets, Greens Creek Due Diligence: draft unpublished Independent Engineer’s report prepared by Mineral Resources Development Incorporated for CIBC World Markets, December 1999.
Mineral Resources Development Incorporated, 1999: Resource Audit, 5250 Zone: unpublished report prepared by Mineral Resources Development Incorporated for Kennecott Greens Creek Mining Company, February 1999.
Hecla Mining Company | Greens Creek Mine, SLR Project No: 101.00632.00020
Technical Report Summary - February 21, 2022
Mineral Resources Development Incorporated, 1999: Standard Bank London Limited, Greens Creek Initial Status Report: unpublished Independent Engineer’s report prepared by Mineral Resources Development Incorporated for Standard Bank London Limited, December 1999.
Newberry, R.J. and Brew, D.A., 1997, The Upper Triassic Greens Creek VMS (volcanogenic massive sulfide) deposit and Woewodski Island VMS pros‐pects, Southeastern Alaska; chemical and isotopic data for rocks and ores demonstrate similarity of these deposits and their host rocks: U.S. Geo‐logical Survey Open File Report 97-539, p. 49.
Parrish, I.S., 1997: Geologist’s Gordian Knot: To Cut or not to Cut, Mining Engineering, v. 49, no. 4, pp. 45-56.
Peterson, M., 2012: Report on Effects of Carbon Dioxide and Sulfuric Acid to Modify pH for Flotation of 90% Ore/10% Backfill Composite Flotation Feed: unpublished report prepared by Dawson Metallurgical Laboratories, 2012.
Phillips, R.J. 2011: Preparation of a Bulk Composite Sample for Greens Creek Mine: unpublished letter report from Phillips Enterprises, LLC, addressed to Dave Tahija, December 13, 2011.
Proffett, John M 2010: Geological Structure of the Greens Creek Mine Area, Southeast Alaska: Geology, Geochemistry, and Genesis of the Greens Creek Massive Sulfide Deposit, Admiralty Island, Southeastern Alaska. USGS Professional Paper 1763, Chapter 7, pp. 137-157.
Reynolds, I., 2007: Green's Creek Mine: A Mineralogical Characterization of Selected Ores and Plant Products: unpublished internal report, Rio Tinto Bundoora, Victoria, Australia, 2007.
Roscoe Postle Associates Inc., 2017: Mineral Resource and Mineral Reserve Audit of the Greens Creek Mine, Alaska, U.S.A.: unpublished internal report prepared by Roscoe Postal Associates Inc. for Hecla Greens Creek Mining Company, August 2017.
Sack, P., 2009: Characterization of Footwall Lithologies to the Greens Creek Volcanic-Hosted Massive Sulfide (VHMS) Deposit, Alaska, USA: PhD thesis, University of Tasmania.
Sack, P.J., Berry, R.F., Gemmell, J.B, Meffre, S., and West, A., 2016: U-Pb Zircon Geochronology from the Alexandre Terrane, Southeast Alaska: Implications for the Greens Creek Massive Sulphide Deposit: Canadian Journal of Earth Science, v. 53, p. 1458-1475.
Sawyer, R.J., 1997: Recovery of Gold by Gravity Separation at the Greens Creek Mine Alaska: presentation at SME Annual Meeting, Denver, Colorado, 1997.
Scheding, B., 2000: Three-Stage Lead and Zinc Cleaning for the Greens Creek Concentrator. Juneau, Alaska: unpublished internal report, Kennecott Greens Creek Mining Company, 2000.
Steeves, N., 2018: Mineralization and Genesis of the Greens Creek Volcanogenic Massive Sulfide (VMS) Deposit, Alaska, USA: PhD Thesis, University of Tasmania, 416 p.
Hecla Mining Company | Greens Creek Mine, SLR Project No: 101.00632.00020
Technical Report Summary - February 21, 2022
Tahija, D., 2011: Large Sample Description: unpublished internal memorandum, Hecla Greens Creek Mining Company, November 2, 2011.
Tahija, D., 2012: Initial Evaluation of Carbon Dioxide Use for pH Control at Greens Creek: unpublished internal memorandum, Hecla Greens Creek Mining Company, 2012.
Taylor, D.D., and A.L., Johnson, 2010: Geology, Geochemistry, and Genesis of the Greens Creek Massive Sulfide Deposit, Admiralty Island, Southeastern Alaska. USGS Professional Paper 1763.
Taylor, D.D., Newkirk, S.R., Hall, T.E., Lear, K.G., Premo, W.R., Leventhal, J.S., Meier, A.L., Johnson, C.A., and Harris, A.G., 1999: The Greens Creek Deposit Southeastern Alaska – A VMS-SEDEX Hybrid: in Stanley, D.J., and others, eds., Mineral Deposits – Processes to Processing, Rotterdam, Balkema, v. 1, pp. 597–600.
Taylor, D.D., Premo, B.R., and Lear, K.G., 2000: The Greens Creek Massive Sulfide Deposit – Premier Example of the Late Triassic Metallogeny of the Alexander Terrane, Southeastern Alaska and British Columbia [abs.]: Geological Society of America Abstracts with Programs, v. 32, no. 6, p. A-71.
US Securities and Exchange Commission, 2018: Regulation S-K, Subpart 229.1300, Item 1300 Disclosure by Registrants Engaged in Mining Operations and Item 601 (b)(96) Technical Report Summary.
West, Andrew W, 2010: The History of Greens Creek Exploration: Geology, Geochemistry, and Genesis of the Greens Creek Massive Sulfide Deposit, Admiralty Island, Southeast Alaska, USGS Professional Paper 1763, Chapter 3 p. 65.
Wilson, F.H., Hults, C.P., Mull, C.G, and Karl, S.M, comps., 2017, Geologic map of Alaska: U.S. Geological Survey Scientific Investigations Map 3340, pamphlet 196 p., 2 sheets, scale 1:1,584,000, http://dx.doi.org/10.3133/sim3340.
Hecla Mining Company | Greens Creek Mine, SLR Project No: 101.00632.00020
Technical Report Summary - February 21, 2022
25.0 | RELIANCE ON INFORMATION PROVIDED BY THE REGISTRANT |
This TRS has been prepared by SLR for Hecla. The information, conclusions, opinions, and estimates contained herein are based on:
| | ● | Information available to SLR at the time of preparation of this TRS. |
| | ● | Assumptions, conditions, and qualifications as set forth in this TRS. |
| | ● | Data, reports, and other information supplied by Hecla and other third party sources. |
For the purpose of this TRS, SLR has relied on ownership information provided by Hecla and verified by the Senior Property and Contract Coordinator. SLR has not researched property title or mineral rights for Hecla as we consider it reasonable to rely on Hecla’s Land Administration personnel who are responsible for maintaining this information.
SLR has relied on Hecla for guidance on applicable taxes, royalties, and other government levies or interests, applicable to revenue or income from Greens Creek in the Executive Summary and Section 19. As Greens Creek has been in operation for over ten years, Hecla has considerable experience in this area.
The Qualified Persons have taken all appropriate steps, in their professional opinion, to ensure that the above information from Hecla is sound.
Except for the purposes legislated under provincial securities laws, any use of this TRS by any third party is at that party’s sole risk.
Hecla Mining Company | Greens Creek Mine, SLR Project No: 101.00632.00020
Technical Report Summary - February 21, 2022
26.0 | DATE AND SIGNATURE PAGE |
This report titled “Technical Report Summary on the Greens Creek Mine, Alaska, USA” with an effective date of December 31, 2021 was prepared and signed by:
Dated at Lakewood, CO
February 21, 2022 | Signed SLR International Corporation. SLR International Corporation |
Hecla Mining Company | Greens Creek Mine, SLR Project No: 101.00632.00020
Technical Report Summary - February 21, 2022
A detailed description of the unpatented lode claims and the unpatented mill site claims that form part of the Greens Creek land holdings are presented in Table A1 and Table A2, respectively.
Table A1: Summary of the Unpatented Lode Claims
Hecla Mining Company – Greens Creek Mine
Claim Name | Certificate of Location Recorded in
Juneau Recording District, State of Alaska | BLM Serial Number |
| | Book | Page | |
BIG SORE GROUP |
Big Sore 1321 | 125 | 423 | AA 25819 |
Big Sore 1322 | 126 | 236 | AA 25820 |
Big Sore 1323 | 126 | 237 | AA 25821 |
Big Sore 1324 | 126 | 238 | AA 25822 |
Big Sore 1421 | 126 | 239 | AA 25845 |
Big Sore 1422 | 126 | 240 | AA 25846 |
Big Sore 1423 | 126 | 241 | AA 25847 |
Big Sore 1424 | 126 | 242 | AA 25848 |
Big Sore 1521 | 125 | 437 | AA 25867 |
Big Sore 1522 | 125 | 438 | AA 25868 |
Big Sore 1523 | 125 | 439 | AA 25869 |
Big Sore 1524 | 125 | 440 | AA 25870 |
Big Sore 1623 | 125 | 448 | AA 25888 |
Big Sore 1624 | 125 | 449 | AA 25889 |
Big Sore 1625 | 125 | 450 | AA 25890 |
Big Sore 1626 | 125 | 451 | AA 25891 |
Big Sore 1627 | 125 | 452 | AA 25892 |
Big Sore 1723 | 125 | 459 | AA 25909 |
Big Sore 1724 | 125 | 460 | AA 25910 |
Big Sore 1725 | 125 | 461 | AA 25911 |
Big Sore 1726 | 125 | 462 | AA 25912 |
Big Sore 1727 | 125 | 463 | AA 25913 |
Big Sore 1728 | 125 | 464 | AA 25914 |
Big Sore 1824 | 125 | 479 | AA 25929 |
Hecla Mining Company | Greens Creek Mine, SLR Project No: 101.00632.00020
Technical Report Summary - February 21, 2022
| Certificate of Location Recorded in
Juneau Recording District, State of Alaska | |
| | Book | Page | |
Big Sore 1825 | 125 | 480 | AA 25930 |
Big Sore 1826 | 125 | 481 | AA 25931 |
Big Sore 1827 | 125 | 482 | AA 25932 |
MARIPOSITE GROUP |
Mariposite 1 | 254 | 238 | AA 55244 |
Mariposite 2 | 254 | 239 | AA 55245 |
Mariposite 3 | 254 | 240 | AA 55246 |
Mariposite 4 | 254 | 241 | AA 55247 |
Mariposite 5 | 254 | 242 | AA 55248 |
Mariposite 6 | 279 | 233 | AA 55249 |
Mariposite 7 | 279 | 234 | AA 55250 |
Mariposite 8 | 251 | 962 | AA 55251 |
Mariposite 9 | 251 | 963 | AA 55252 |
Mariposite 10 | 251 | 964 | AA 55253 |
Mariposite 11 | 279 | 235 | AA 55254 |
Mariposite 12 | 279 | 236 | AA 55255 |
Mariposite 13 | 279 | 237 | AA 55256 |
Mariposite 14 | 279 | 238 | AA 55257 |
Mariposite 15 | 251 | 969 | AA 55258 |
Mariposite 16 | 254 | 245 | AA 55259 |
Mariposite 17 | 254 | 246 | AA 55260 |
Mariposite 18 | 254 | 247 | AA 55261 |
Mariposite 19 | 254 | 248 | AA 55262 |
Mariposite 20 | 254 | 249 | AA 55263 |
Mariposite 21 | 254 | 250 | AA 55264 |
Mariposite 22 | 251 | 976 | AA 55265 |
Mariposite 23 | 251 | 977 | AA 55266 |
Mariposite 24 | 251 | 978 | AA 55267 |
Mariposite 25 | 279 | 239 | AA 55268 |
Mariposite 26 | 279 | 240 | AA 55269 |
Mariposite 27 | 279 | 241 | AA 55270 |
Mariposite 28 | 279 | 242 | AA 55271 |
Hecla Mining Company | Greens Creek Mine, SLR Project No: 101.00632.00020
Technical Report Summary - February 21, 2022
| Certificate of Location Recorded in
Juneau Recording District, State of Alaska | BLM Serial Number |
| | | | |
Mariposite 29 | 279 | 243 | AA 55272 |
Mariposite 30 | 279 | 244 | AA 55273 |
Mariposite 31 | 279 | 245 | AA 55274 |
Mariposite 32 | 279 | 246 | AA 55275 |
Mariposite 33 | 279 | 247 | AA 55276 |
Mariposite 34 | 254 | 256 | AA 55277 |
Mariposite 35 | 254 | 257 | AA 55278 |
Mariposite 36 | 279 | 248 | AA 55279 |
Mariposite 37 | 279 | 249 | AA 55280 |
Mariposite 38 | 251 | 992 | AA 55281 |
Mariposite 39 | 251 | 993 | AA 55282 |
Mariposite 40 | 251 | 994 | AA 55283 |
Mariposite 41 | 251 | 995 | AA 55284 |
Mariposite 42 | 251 | 996 | AA 55285 |
Mariposite 43 | 251 | 997 | AA 55286 |
Mariposite 44 | 251 | 998 | AA 55287 |
Mariposite 45 | 251 | 999 | AA 55288 |
Mariposite 46 | 252 | 1 | AA 55289 |
Mariposite 47 | 252 | 2 | AA 55290 |
Mariposite 48 | 252 | 3 | AA 55291 |
Mariposite 49 | 252 | 4 | AA 55292 |
Mariposite 50 | 254 | 258 | AA 55293 |
Mariposite 51 | 254 | 259 | AA 55294 |
Mariposite 52 | 254 | 260 | AA 55295 |
Mariposite 53 | 254 | 261 | AA 55296 |
Mariposite 54 | 254 | 262 | AA 55297 |
Mariposite 55 | 254 | 263 | AA 55298 |
Mariposite 56 | 254 | 264 | AA 55299 |
Mariposite 57 | 254 | 265 | AA 55300 |
Mariposite 58 | 254 | 266 | AA 55301 |
Mariposite 59 | 254 | 267 | AA 55302 |
Mariposite 60 | 254 | 268 | AA 55303 |
Hecla Mining Company | Greens Creek Mine, SLR Project No: 101.00632.00020
Technical Report Summary - February 21, 2022
| Certificate of Location Recorded in
Juneau Recording District, State of Alaska | BLM Serial Number |
| | | | |
Mariposite 61 | 252 | 16 | AA 55304 |
Mariposite 62 | 252 | 17 | AA 55305 |
Mariposite 63 | 252 | 18 | AA 55306 |
Mariposite 64 | 252 | 19 | AA 55307 |
Mariposite 65 | 252 | 20 | AA 55308 |
Mariposite 66 | 252 | 21 | AA 55309 |
Mariposite 67 | 254 | 269 | AA 55310 |
Mariposite 68 | 254 | 270 | AA 55311 |
Mariposite 69 | 254 | 271 | AA 55312 |
Mariposite 70 | 254 | 272 | AA 55313 |
Mariposite 71 | 252 | 26 | AA 55314 |
Mariposite 72 | 252 | 27 | AA 55315 |
Mariposite 73 | 254 | 273 | AA 55316 |
Mariposite 74 | 254 | 274 | AA 55317 |
Mariposite 75 | 254 | 275 | AA 55318 |
Mariposite 76 | 254 | 276 | AA 55319 |
Mariposite 77 | 252 | 32 | AA 55320 |
Mariposite 79 | 254 | 278 | AA 55322 |
Mariposite 80 | 254 | 279 | AA 55323 |
Mariposite 81 | 252 | 36 | AA 55324 |
Mariposite 82 | 254 | 280 | AA 55325 |
Mariposite 83 | 254 | 281 | AA 55326 |
Mariposite 84 | 254 | 282 | AA 55327 |
Mariposite 85 | 254 | 283 | AA 55328 |
Mariposite 86 | 254 | 284 | AA 55329 |
Mariposite 87 | 292 | 664 | AA 63033 |
Mariposite 100 | 320 | 601 | AA 71489 |
Mariposite 101 | 320 | 602 | AA 71490 |
Mariposite 102 | 320 | 603 | AA 71491 |
Mariposite 103 | 320 | 604 | AA 71492 |
Mariposite 104 | 320 | 605 | AA 71493 |
Mariposite 105 | 320 | 606 | AA 71494 |
Hecla Mining Company | Greens Creek Mine, SLR Project No: 101.00632.00020
Technical Report Summary - February 21, 2022
| Certificate of Location Recorded in
Juneau Recording District, State of Alaska | BLM Serial Number |
| | Book | Page | |
Mariposite 106 | 320 | 607 | AA 71495 |
Mariposite 107 | 320 | 608 | AA 71496 |
Mariposite 108 | 320 | 609 | AA 71497 |
Mariposite 109 | 320 | 610 | AA 71498 |
Mariposite 110 | 320 | 611 | AA 71499 |
Mariposite 111 | 320 | 612 | AA 71500 |
Mariposite 112 | 320 | 613 | AA 71501 |
Mariposite 113 | 320 | 614 | AA 71502 |
Mariposite 114 | 320 | 615 | AA 71503 |
FOWLER GROUP |
Fowler 543 | 262 | 546 | AA 57281 |
Fowler 544 | 262 | 548 | AA 57282 |
Fowler 545 | 262 | 549 | AA 57283 |
Fowler 546 | 262 | 550 | AA 57284 |
Fowler 547 | 262 | 551 | AA 57285 |
Fowler 548 | 262 | 552 | AA 57286 |
Fowler 549 | 262 | 553 | AA 57287 |
Fowler 550 | 262 | 554 | AA 57288 |
Fowler 551 | 262 | 555 | AA 57289 |
Fowler 552 | 262 | 556 | AA 57290 |
Fowler 553 | 262 | 557 | AA 57291 |
Fowler 554 | 262 | 558 | AA 57292 |
Fowler 555 | 262 | 559 | AA 57293 |
Fowler 556 | 262 | 560 | AA 57294 |
Fowler 557 | 262 | 561 | AA 57295 |
Fowler 558 | 262 | 562 | AA 57296 |
Fowler 643 | 262 | 563 | AA 57297 |
Fowler 644 | 262 | 564 | AA 57298 |
Fowler 645 | 262 | 565 | AA 57299 |
Fowler 646 | 262 | 566 | AA 57300 |
Fowler 647 | 262 | 567 | AA 57301 |
Fowler 648 | 262 | 568 | AA 57302 |
Hecla Mining Company | Greens Creek Mine, SLR Project No: 101.00632.00020
Technical Report Summary - February 21, 2022
| Certificate of Location Recorded in
Juneau Recording District, State of Alaska | |
| | Book | Page | |
Fowler 649 | 262 | 569 | AA 57303 |
Fowler 650 | 262 | 570 | AA 57304 |
Fowler 651 | 262 | 571 | AA 57305 |
Fowler 652 | 262 | 572 | AA 57306 |
Fowler 653 | 262 | 573 | AA 57307 |
Fowler 654 | 262 | 574 | AA 57308 |
Fowler 655 | 262 | 575 | AA 57309 |
Fowler 656 | 262 | 576 | AA 57310 |
Fowler 657 | 262 | 577 | AA 57311 |
Fowler 658 | 262 | 578 | AA 57312 |
Fowler 743 | 262 | 579 | AA 57313 |
Fowler 744 | 262 | 580 | AA 57314 |
Fowler 745 | 262 | 581 | AA 57315 |
Fowler 746 | 262 | 582 | AA 57316 |
Fowler 747 | 262 | 583 | AA 57317 |
Fowler 748 | 262 | 584 | AA 57318 |
Fowler 749 | 262 | 585 | AA 57319 |
Fowler 750 | 262 | 586 | AA 57320 |
Fowler 751 | 262 | 587 | AA 57321 |
Fowler 752 | 262 | 588 | AA 57322 |
Fowler 753 | 262 | 589 | AA 57323 |
Fowler 754 | 262 | 590 | AA 57324 |
Fowler 755 | 262 | 591 | AA 57325 |
Fowler 756 | 262 | 592 | AA 57326 |
Fowler 757 | 262 | 593 | AA 57327 |
Fowler 758 | 262 | 594 | AA 57328 |
Fowler 843 | 262 | 595 | AA 57329 |
Fowler 844 | 262 | 596 | AA 57330 |
Fowler 845 | 262 | 597 | AA 57331 |
Fowler 846 | 262 | 598 | AA 57332 |
Fowler 847 | 262 | 599 | AA 57333 |
Fowler 848 | 262 | 600 | AA 57334 |
Hecla Mining Company | Greens Creek Mine, SLR Project No: 101.00632.00020
Technical Report Summary - February 21, 2022
| Certificate of Location Recorded in
Juneau Recording District, State of Alaska | |
| | Book | Page | |
Fowler 849 | 262 | 601 | AA 57335 |
Fowler 850 | 262 | 602 | AA 57336 |
Fowler 851 | 262 | 603 | AA 57337 |
Fowler 852 | 262 | 604 | AA 57338 |
Fowler 853 | 262 | 605 | AA 57339 |
Fowler 854 | 262 | 606 | AA 57340 |
Fowler 855 | 262 | 607 | AA 57341 |
Fowler 856 | 262 | 608 | AA 57342 |
Fowler 857 | 262 | 609 | AA 57343 |
Fowler 858 | 262 | 610 | AA 57344 |
Fowler 943 | 262 | 611 | AA 57345 |
Fowler 944 | 262 | 612 | AA 57346 |
Fowler 945 | 262 | 613 | AA 57347 |
Fowler 946 | 262 | 614 | AA 57348 |
Fowler 947 | 262 | 615 | AA 57349 |
Fowler 948 | 262 | 616 | AA 57350 |
Fowler 949 | 262 | 617 | AA 57351 |
Fowler 950 | 262 | 618 | AA 57352 |
Fowler 951 | 262 | 619 | AA 57353 |
Fowler 952 | 262 | 620 | AA 57354 |
Fowler 953 | 262 | 621 | AA 57355 |
Fowler 954 | 262 | 622 | AA 57356 |
Fowler 955 | 262 | 623 | AA 57357 |
Fowler 956 | 262 | 624 | AA 57358 |
Fowler 957 | 262 | 625 | AA 57359 |
Fowler 958 | 262 | 626 | AA 57360 |
Fowler 1043 | 262 | 627 | AA 57361 |
Fowler 1044 | 262 | 628 | AA 57362 |
Fowler 1045 | 262 | 629 | AA 57363 |
Fowler 1046 | 262 | 630 | AA 57364 |
Fowler 1047 | 262 | 631 | AA 57365 |
Fowler 1143 | 262 | 632 | AA 57366 |
Hecla Mining Company | Greens Creek Mine, SLR Project No: 101.00632.00020
Technical Report Summary - February 21, 2022
| Certificate of Location Recorded in
Juneau Recording District, State of Alaska | |
| | Book | Page | |
Fowler 1144 | 262 | 633 | AA 57367 |
Fowler 1145 | 262 | 634 | AA 57368 |
Fowler 1146 | 262 | 635 | AA 57369 |
Fowler 1147 | 262 | 636 | AA 57370 |
LIL SORE GROUP |
Lil Sore 41 | 443 | 333-335 | AA 78220 |
Lil Sore 42 | 443 | 336-338 | AA 78221 |
Lil Sore 43 | 443 | 339-341 | AA 78222 |
Lil Sore 44 | 443 | 342-344 | AA 78223 |
Lil Sore 45 | 443 | 345-347 | AA 78224 |
Lil Sore 46 | 443 | 378-350 | AA 78225 |
Lil Sore 47 | 443 | 351-353 | AA 78226 |
Lil Sore 48 | 443 | 354-356 | AA 78227 |
EAST FOWLER GROUP | | | |
East Fowler 538 | 443 | 357-359 | AA 78228 |
East Fowler 539 | 443 | 360-362 | AA 78229 |
East Fowler 540 | 443 | 363-365 | AA 78230 |
East Fowler 541 | 443 | 366-368 | AA 78231 |
East Fowler 542 | 443 | 369-371 | AA 78232 |
East Fowler 641 | 443 | 372-374 | AA 78233 |
East Fowler 642 | 443 | 375-377 | AA 78234 |
East Fowler 741 | 443 | 378-380 | AA 78235 |
East Fowler 742 | 443 | 381-383 | AA 78236 |
East Fowler 841 | 443 | 384-386 | AA 78237 |
East Fowler 842 | 443 | 387-389 | AA 78238 |
East Fowler 941 | 443 | 390-392 | AA 78239 |
East Fowler 942 | 443 | 393-395 | AA 78240 |
East Fowler 1042 | 443 | 396-398 | AA 78241 |
WEST MARIPOSITE GROUP |
West Mariposite 115 | 443 | 162-164 | AA 78242 |
West Mariposite 116 | 443 | 165-167 | AA 78243 |
West Mariposite 117 | 443 | 168-170 | AA 78244 |
Hecla Mining Company | Greens Creek Mine, SLR Project No: 101.00632.00020
Technical Report Summary - February 21, 2022
| Certificate of Location Recorded in
Juneau Recording District, State of Alaska | BLM Serial Number |
| | Book | Page | |
West Mariposite 118 | 443 | 171-173 | AA 78245 |
West Mariposite 119 | 443 | 174-176 | AA 78246 |
West Mariposite 120 | 443 | 177-179 | AA 78247 |
West Mariposite 121 | 443 | 180-182 | AA 78248 |
West Mariposite 122 | 443 | 183-185 | AA 78249 |
West Mariposite 123 | 443 | 186-188 | AA 78250 |
West Mariposite 128 | 443 | 201-203 | AA 78255 |
West Mariposite 129 | 443 | 204-206 | AA 78256 |
West Mariposite 130 | 443 | 207-209 | AA 78257 |
West Mariposite 131 | 443 | 210-212 | AA 78258 |
West Mariposite 132 | 443 | 213-215 | AA 78259 |
West Mariposite 133 | 443 | 216-218 | AA 78260 |
West Mariposite 134 | 443 | 219-221 | AA 78261 |
West Mariposite 135 | 443 | 222-224 | AA 78262 |
West Mariposite 136 | 443 | 225-227 | AA 78263 |
West Mariposite 137 | 443 | 228-230 | AA 78264 |
West Mariposite 138 | 443 | 231-233 | AA 78265 |
West Mariposite 139 | 443 | 234-236 | AA 78266 |
West Mariposite 140 | 443 | 237-239 | AA 78267 |
West Mariposite 141 | 443 | 240-242 | AA 78268 |
West Mariposite 142 | 443 | 243-245 | AA 78269 |
West Mariposite 143 | 443 | 246-248 | AA 78270 |
West Mariposite 144 | 443 | 249-251 | AA 78271 |
West Mariposite 145 | 443 | 252-254 | AA 78272 |
West Mariposite 146 | 443 | 255-257 | AA 78273 |
West Mariposite 147 | 443 | 258-260 | AA 78274 |
West Mariposite 148 | 443 | 261-263 | AA 78275 |
West Mariposite 149 | 443 | 264-266 | AA 78276 |
West Mariposite 150 | 443 | 267-269 | AA 78277 |
West Mariposite 151 | 443 | 270-272 | AA 78278 |
West Mariposite 152 | 443 | 273-275 | AA 78279 |
West Mariposite 153 | 443 | 276-278 | AA 78280 |
Hecla Mining Company | Greens Creek Mine, SLR Project No: 101.00632.00020
Technical Report Summary - February 21, 2022
| Certificate of Location Recorded in
Juneau Recording District, State of Alaska | |
| | Book | Page | |
West Mariposite 154 | 443 | 279-281 | AA 78281 |
West Mariposite 155 | 443 | 282-284 | AA 78282 |
West Mariposite 156 | 443 | 285-287 | AA 78283 |
West Mariposite 159 | 443 | 294-296 | AA 78286 |
West Mariposite 160 | 443 | 297-299 | AA 78287 |
West Mariposite 161 | 443 | 300-302 | AA 78288 |
West Mariposite 162 | 443 | 303-305 | AA 78289 |
West Mariposite 163 | 443 | 306-308 | AA 78290 |
West Mariposite 164 | 443 | 309-311 | AA 78291 |
West Mariposite 165 | 443 | 312-314 | AA 78292 |
West Mariposite 168 | 443 | 321-323 | AA 78295 |
West Mariposite 169 | 443 | 324-326 | AA 78296 |
West Mariposite 170 | 443 | 327-329 | AA 78297 |
West Mariposite 171 | 443 | 330-332 | AA 78298 |
WEST FOWLER GROUP | | | |
West Fowler 559 | 443 | 399-401 | AA 78299 |
West Fowler 560 | 443 | 402-404 | AA 78300 |
West Fowler 561 | 443 | 405-407 | AA 78301 |
West Fowler 659 | 443 | 411-413 | AA 78303 |
West Fowler 660 | 443 | 414-416 | AA 78304 |
West Fowler 661 | 443 | 417-419 | AA 78305 |
West Fowler 662 | 443 | 420-422 | AA 78306 |
West Fowler 663 | 443 | 423-425 | AA 78307 |
West Fowler 664 | 443 | 426-428 | AA 78308 |
West Fowler 759 | 443 | 429-431 | AA 78309 |
West Fowler 760 | 443 | 432-434 | AA 78310 |
West Fowler 761 | 443 | 435-437 | AA 78311 |
West Fowler 762 | 443 | 438-440 | AA 78312 |
West Fowler 763 | 443 | 444-446 | AA 78313 |
West Fowler 764 | 443 | 447-449 | AA 78314 |
West Fowler 765 | 443 | 450-452 | AA 78315 |
West Fowler 766 | 443 | 453-455 | AA 78316 |
Hecla Mining Company | Greens Creek Mine, SLR Project No: 101.00632.00020
Technical Report Summary - February 21, 2022
| Certificate of Location Recorded in
Juneau Recording District, State of Alaska | BLM Serial Number |
| | Book | Page | |
West Fowler 767 | 443 | 456-458 | AA 78317 |
West Fowler 859 | 443 | 462-464 | AA 78319 |
West Fowler 860 | 443 | 465-467 | AA 78320 |
West Fowler 861 | 443 | 468-470 | AA 78321 |
West Fowler 862 | 443 | 471-473 | AA 78322 |
West Fowler 863 | 443 | 474-476 | AA 78323 |
West Fowler 864 | 443 | 477-479 | AA 78324 |
West Fowler 865 | 443 | 480-482 | AA 78325 |
West Fowler 959 | 443 | 492-494 | AA 78329 |
West Fowler 960 | 443 | 495-497 | AA 78330 |
West Fowler 961 | 443 | 498-500 | AA 78331 |
West Fowler 962 | 443 | 501-503 | AA 78332 |
West Fowler 963 | 443 | 504-506 | AA 78333 |
West Fowler 964 | 443 | 507-509 | AA 78334 |
West Fowler 965 | 443 | 510-512 | AA 78335 |
West Fowler 966 | 443 | 513-515 | AA 78336 |
NORTH FOWLER GROUP |
North Fowler 41 | 442 | 882-884 | AA 78341 |
North Fowler 141 | 442 | 885-887 | AA 78342 |
North Fowler 142 | 442 | 888-890 | AA 78343 |
North Fowler 143 | 442 | 891-893 | AA 78344 |
North Fowler 144 | 442 | 894-896 | AA 78345 |
North Fowler 226 | 442 | 912-914 | AA 78351 |
North Fowler 227 | 442 | 915-917 | AA 78352 |
North Fowler 228 | 442 | 918-920 | AA 78353 |
North Fowler 229 | 442 | 921-923 | AA 78354 |
North Fowler 230 | 442 | 924-926 | AA 78355 |
North Fowler 231 | 442 | 927-929 | AA 78356 |
North Fowler 232 | 442 | 930-932 | AA 78357 |
North Fowler 233 | 442 | 933-935 | AA 78358 |
North Fowler 234 | 442 | 936-938 | AA 78359 |
North Fowler 235 | 442 | 939-941 | AA 78360 |
Hecla Mining Company | Greens Creek Mine, SLR Project No: 101.00632.00020
Technical Report Summary - February 21, 2022
| Certificate of Location Recorded in
Juneau Recording District, State of Alaska | |
| | Book | Page | |
North Fowler 236 | 442 | 942-944 | AA 78361 |
North Fowler 237 | 442 | 945-947 | AA 78362 |
North Fowler 238 | 442 | 948-950 | AA 78363 |
North Fowler 239 | 442 | 951-953 | AA 78364 |
North Fowler 240 | 442 | 954-956 | AA 78365 |
North Fowler 241 | 442 | 957-959 | AA 78366 |
North Fowler 242 | 442 | 960-962 | AA 78367 |
North Fowler 243 | 442 | 963-965 | AA 78368 |
North Fowler 244 | 442 | 966-968 | AA 78369 |
North Fowler 245 | 442 | 969-971 | AA 78370 |
North Fowler 246 | 442 | 972-974 | AA 78371 |
North Fowler 336 | 442 | 990-992 | AA 78377 |
North Fowler 337 | 442 | 993-995 | AA 78378 |
North Fowler 338 | 442 | 996-998 | AA 78379 |
North Fowler 339 | 0442/0443 | 999/001-002 | AA 78380 |
North Fowler 340 | 443 | 003-005 | AA 78381 |
North Fowler 341 | 443 | 006-008 | AA 78382 |
North Fowler 342 | 443 | 009-011 | AA 78383 |
North Fowler 343 | 443 | 012-014 | AA 78384 |
North Fowler 344 | 443 | 015-017 | AA 78385 |
North Fowler 345 | 443 | 018-020 | AA 78386 |
North Fowler 346 | 443 | 021-023 | AA 78387 |
North Fowler 347 | 443 | 024-026 | AA 78388 |
North Fowler 348 | 443 | 027-029 | AA 78389 |
North Fowler 349 | 443 | 030-032 | AA 78390 |
North Fowler 350 | 443 | 033-035 | AA 78391 |
North Fowler 351 | 443 | 036-038 | AA 78392 |
North Fowler 352 | 443 | 039-041 | AA 78393 |
North Fowler 353 | 443 | 042-044 | AA 78394 |
North Fowler 354 | 443 | 045-047 | AA 78395 |
North Fowler 355 | 443 | 048-050 | AA 78396 |
North Fowler 356 | 443 | 051-053 | AA 78397 |
Hecla Mining Company | Greens Creek Mine, SLR Project No: 101.00632.00020
Technical Report Summary - February 21, 2022
| Certificate of Location Recorded in
Juneau Recording District, State of Alaska | |
| | Book | Page | |
North Fowler 357 | 443 | 054-056 | AA 78398 |
North Fowler 358 | 443 | 057-059 | AA 78399 |
North Fowler 436 | 443 | 075-077 | AA 78405 |
North Fowler 437 | 443 | 078-080 | AA 78406 |
North Fowler 438 | 443 | 081-083 | AA 78407 |
North Fowler 439 | 443 | 084-086 | AA 78408 |
North Fowler 440 | 443 | 087-089 | AA 78409 |
North Fowler 441 | 443 | 090-092 | AA 78410 |
North Fowler 442 | 443 | 093-095 | AA 78411 |
North Fowler 443 | 443 | 096-098 | AA 78412 |
North Fowler 444 | 443 | 099-101 | AA 78413 |
North Fowler 445 | 443 | 102-104 | AA 78414 |
North Fowler 446 | 443 | 105-107 | AA 78415 |
North Fowler 447 | 443 | 108-110 | AA 78416 |
North Fowler 448 | 443 | 111-113 | AA 78417 |
North Fowler 449 | 443 | 114-116 | AA 78418 |
North Fowler 450 | 443 | 117-119 | AA 78419 |
North Fowler 451 | 443 | 120-122 | AA 78420 |
North Fowler 452 | 443 | 123-125 | AA 78421 |
North Fowler 453 | 443 | 126-128 | AA 78422 |
North Fowler 454 | 443 | 129-131 | AA 78423 |
North Fowler 455 | 443 | 132-134 | AA 78424 |
North Fowler 456 | 443 | 135-137 | AA 78425 |
North Fowler 457 | 443 | 138-140 | AA 78426 |
North Fowler 458 | 443 | 141-143 | AA 78427 |
North Fowler 459 | 443 | 144-146 | AA 78428 |
North Fowler 460 | 443 | 147-149 | AA 78429 |
North Fowler 461 | 443 | 150-152 | AA 78430 |
EAST RIDGE GROUP |
East Ridge 1011 | 2009-007170-0 | AA 91926 |
East Ridge 1012 | 2009-007171-0 | AA 91927 |
East Ridge 1013 | 2009-007172-0 | AA 91928 |
Hecla Mining Company | Greens Creek Mine, SLR Project No: 101.00632.00020
Technical Report Summary - February 21, 2022
| Certificate of Location Recorded in
Juneau Recording District, State of Alaska | |
| | Book | Page | |
East Ridge 1014 | 2009-007173-0 | AA 91929 |
East Ridge 1015 | 2009-007174-0 | AA 91930 |
East Ridge 1111 | 2009-007175-0 | AA 91931 |
East Ridge 1112 | 2009-007176-0 | AA 91932 |
East Ridge 1113 | 2009-007177-0 | AA 91933 |
East Ridge 1114 | 2009-007178-0 | AA 91934 |
East Ridge 1115 | 2009-007179-0 | AA 91935 |
East Ridge 1210 | 2009-007180-0 | AA 91936 |
East Ridge 1211 | 2009-007181-0 | AA 91937 |
East Ridge 1212 | 2009-007182-0 | AA 91938 |
East Ridge 1213 | 2009-007183-0 | AA 91939 |
East Ridge 1214 | 2009-007184-0 | AA 91940 |
East Ridge 1215 | 2009-007185-0 | AA 91941 |
East Ridge 1310 | 2009-007186-0 | AA 91942 |
East Ridge 1311 | 2009-007187-0 | AA 91943 |
East Ridge 1312 | 2009-007188-0 | AA 91944 |
East Ridge 1313 | 2009-007189-0 | AA 91945 |
East Ridge 1314 | 2009-007190-0 | AA 91946 |
East Ridge 1315 | 2009-007191-0 | AA 91947 |
East Ridge 1408 | 2009-007192-0 | AA 91948 |
East Ridge 1409 | 2009-007193-0 | AA 91949 |
East Ridge 1410 | 2009-007194-0 | AA 91950 |
East Ridge 1411 | 2009-007195-0 | AA 91951 |
East Ridge 1412 | 2009-007196-0 | AA 91952 |
East Ridge 1413 | 2009-007197-0 | AA 91953 |
East Ridge 1414 | 2009-007198-0 | AA 91954 |
East Ridge 1415 | 2009-007199-0 | AA 91955 |
East Ridge 1416 | 2009-007200-0 | AA 91956 |
East Ridge 1417 | 2009-007201-0 | AA 91957 |
East Ridge 1510 | 2009-007202-0 | AA 91958 |
East Ridge 1511 | 2009-007203-0 | AA 91959 |
Hecla Mining Company | Greens Creek Mine, SLR Project No: 101.00632.00020
Technical Report Summary - February 21, 2022
| Certificate of Location Recorded in
Juneau Recording District, State of Alaska | |
| | Book | Page | |
East Ridge 1512 | 2009-007204-0 | AA 91960 |
East Ridge 1513 | 2009-007205-0 | AA 91961 |
East Ridge 1514 | 2009-007206-0 | AA 91962 |
East Ridge 1515 | 2009-007207-0 | AA 91963 |
East Ridge 1611 | 2009-007208-0 | AA 91964 |
East Ridge 1612 | 2009-007209-0 | AA 91965 |
East Ridge 1613 | 2009-007210-0 | AA 91966 |
East Ridge 1614 | 2009-007211-0 | AA 91967 |
East Ridge 1615 | 2009-007212-0 | AA 91968 |
Table A2: Summary of the Unpatented Mill Site Claims
Hecla Mining Company – Greens Creek Mine
Claim Name | Certificate of Location Recorded in
Juneau Recording District, State of Alaska at | BLM Serial Number |
| | Book | Page | |
Big Sore Mill Site No. 900 | 394 | 511-512 | AA 77046 |
Big Sore Mill Site No. 901 | 394 | 513 | AA 77047 |
Big Sore Mill Site No. 902 | 394 | 514 | AA 77048 |
Big Sore Mill Site No. 1001 | 394 | 515 | AA 77049 |
Big Sore Mill Site No. 1002 | 394 | 516 | AA 77050 |
Big Sore Mill Site No. 1003 | 394 | 517 | AA 77051 |
Big Sore Mill Site No. 1108 | 394 | 518 | AA 77052 |
Big Sore Mill Site No. 1505 | 394 | 519 | AA 77053 |
Big Sore Mill Site No. 1506 | 394 | 520 | AA 77054 |
Big Sore Mill Site No. 1507 | 394 | 521 | AA 77055 |
Big Sore Mill Site No. 1509 | 394 | 522 | AA 77056 |
Big Sore Mill Site No. 1510 | 394 | 523 | AA 77057 |
Big Sore Mill Site No. 1516 | 394 | 524 | AA 77058 |
Big Sore Mill Site No. 1517 | 394 | 525 | AA 77059 |
Big Sore Mill Site No. 1610 | 394 | 526 | AA 77060 |
Big Sore Mill Site No. 1611 | 394 | 527 | AA 77061 |
Big Sore Mill Site No. 1710 | 394 | 528 | AA 77062 |
Big Sore Mill Site No. 1711 | 394 | 529 | AA 77063 |
Hecla Mining Company | Greens Creek Mine, SLR Project No: 101.00632.00020
Technical Report Summary - February 21, 2022
| Certificate of Location Recorded in
Juneau Recording District, State of Alaska at | |
| | Book | Page | |
Big Sore Mill Site No. 1712 | 394 | 530 | AA 77064 |
Big Sore Mill Site No. 1713 | 394 | 531 | AA 77065 |
Big Sore Mill Site No. 1714 | 394 | 532 | AA 77066 |
Big Sore Mill Site No. 1715 | 394 | 533 | AA 77067 |
Big Sore Mill Site No. 1716 | 394 | 534 | AA 77068 |
Big Sore Mill Site No. 1717 | 394 | 535 | AA 77069 |
Big Sore Mill Site No. 1718 | 394 | 536 | AA 77070 |
Big Sore Mill Site No. 798 | 2002-005167-0 | AA 84088 |
Big Sore Mill Site No. 802 | 2002-005168-0 | AA 84089 |
Big Sore Mill Site No. 803 | 2002-005169-0 | AA 84090 |
Big Sore Mill Site No. 899 | 2002-005170-0 | AA 84091 |
Big Sore Mill Site No. 904 | 2002-005171-0 | AA 84092 |
Big Sore Mill Site No. 905 | 2002-005172-0 | AA 84093 |
Big Sore Mill Site No. 906 | 2002-005173-0 | AA 84094 |
Big Sore Mill Site No. 907 | 2002-005174-0 | AA 84095 |
Big Sore Mill Site No. 996 | 2002-005175-0 | AA 84096 |
Big Sore Mill Site No. 1004 | 2002-005176-0 | AA 84097 |
Big Sore Mill Site No. 1005 | 2002-005177-0 | AA 84098 |
Big Sore Mill Site No. 1006 | 2002-005178-0 | AA 84099 |
Big Sore Mill Site No. 1007 | 2002-005179-0 | AA 84100 |
Big Sore Mill Site No. 1008 | 2002-005180-0 | AA 84101 |
Big Sore Mill Site No. 1009 | 2002-005181-0 | AA 84102 |
Big Sore Mill Site No. 1010 | 2002-005182-0 | AA 84103 |
Big Sore Mill Site No. 1096 | 2002-005183-0 | AA 84104 |
Big Sore Mill Site No. 1097 | 2002-005184-0 | AA 84105 |
Big Sore Mill Site No. 1103 | 2002-005185-0 | AA 84106 |
Big Sore Mill Site No. 1104 | 2002-005186-0 | AA 84107 |
Big Sore Mill Site No. 1105 | 2002-005187-0 | AA 84108 |
Big Sore Mill Site No. 1106 | 2002-005188-0 | AA 84109 |
Big Sore Mill Site No. 1107 | 2002-005189-0 | AA 84110 |
Big Sore Mill Site No. 1202 | 2002-005190-0 | AA 84111 |
Big Sore Mill Site No. 1203 | 2002-005191-0 | AA 84112 |
Hecla Mining Company | Greens Creek Mine, SLR Project No: 101.00632.00020
Technical Report Summary - February 21, 2022
| Certificate of Location Recorded in
Juneau Recording District, State of Alaska at | |
| | Book | Page | |
Big Sore Mill Site No. 1204 | 2002-005192-0 | AA 84113 |
Big Sore Mill Site No. 1205 | 2002-005193-0 | AA 84114 |
Big Sore Mill Site No. 1508 | 2002-005194-0 | AA 84115 |
Big Sore Mill Site No. 1511 | 2002-005195-0 | AA 84116 |
Big Sore Mill Site No. 1514 | 2002-005196-0 | AA 84117 |
Big Sore Mill Site No. 1612 | 2002-005197-0 | AA 84118 |
Big Sore Mill Site No. 1613 | 2002-005198-0 | AA 84119 |
Big Sore Mill Site No. 1614 | 2002-005199-0 | AA 84120 |
Hecla Mining Company | Greens Creek Mine, SLR Project No: 101.00632.00020
Technical Report Summary - February 21, 2022