UNITED STATES
SECURITIES AND EXCHANGE COMMISSION
Washington, D.C. 20549
FORM N-CSR
CERTIFIED SHAREHOLDER REPORT OF REGISTERED
MANAGEMENT INVESTMENT COMPANIES
Investment Company Act file number 811-3737
Fidelity Advisor Series IV
(Exact name of registrant as specified in charter)
82 Devonshire St., Boston, Massachusetts 02109
(Address of principal executive offices) (Zip code)
Eric D. Roiter, Secretary
82 Devonshire St.
Boston, Massachusetts 02109
(Name and address of agent for service)
Registrant's telephone number, including area code: 617-563-7000
Date of fiscal year end: | November 30 |
Date of reporting period: | November 30, 2007 |
Item 1. Reports to Stockholders
Fidelity ®
Institutional
Short-Intermediate
Government Fund
Annual Report
November 30, 2007
(2_fidelity_logos) (Registered_Trademark)
Contents
Chairman's Message | Ned Johnson's message to shareholders. | |
Performance | How the fund has done over time. | |
Management's Discussion | The manager's review of fund performance, strategy and outlook. | |
Shareholder Expense Example | An example of shareholder expenses. | |
Investment Changes | A summary of major shifts in the fund's investments over the past six months. | |
Investments | A complete list of the fund's investments with their market values. | |
Financial Statements | Statements of assets and liabilities, operations, and changes in net assets, | |
Notes | Notes to the financial statements. | |
Report of Independent Registered Public Accounting Firm | ||
Trustees and Officers | ||
Distributions | ||
Board Approval of Investment Advisory Contracts and Management Fees | ||
To view a fund's proxy voting guidelines and proxy voting record for the 12-month period ended June 30, visit http://www.fidelity.com (search for "proxy voting guidelines") or visit the Securities and Exchange Commission's (SEC) website at http://www.sec.gov. You may also call 1-800-544-8544 to request a free copy of the proxy voting guidelines.
Standard & Poor's, S&P and S&P 500 are registered service marks of The McGraw-Hill Companies, Inc. and have been licensed for use by Fidelity Distributors Corporation.
Other third party marks appearing herein are the property of their respective owners.
All other marks appearing herein are registered or unregistered trademarks or service marks of FMR LLC or an affiliated company.
Annual Report
This report and the financial statements contained herein are submitted for the general information of the shareholders of the fund. This report is not authorized for distribution to prospective investors in the fund unless preceded or accompanied by an effective prospectus.
A fund files its complete schedule of portfolio holdings with the SEC for the first and third quarters of each fiscal year on Form N-Q. Forms N-Q are available on the SEC's web site at http://www.sec.gov. A fund's Forms N-Q may be reviewed and copied at the SEC's Public Reference Room in Washington, DC. Information regarding the operation of the SEC's Public Reference Room may be obtained by calling 1-800-SEC-0330. For a complete list of a fund's portfolio holdings, view the most recent holdings listing, semiannual report, or annual report on Fidelity's web site at http://www.fidelity.com or http://www.advisor.fidelity.com, as applicable.
NOT FDIC INSURED · MAY LOSE VALUE · NO BANK GUARANTEE
Neither the fund nor Fidelity Distributors Corporation is a bank.
Annual Report
Chairman's Message
(photo_of_Edward_C_Johnson_3d)
Dear Shareholder:
Many stock and bond markets around the world have been unsettled of late; however, volatility can often lead to opportunity for patient investors. Financial markets are always unpredictable, but there are a number of time-tested principles that can put the historical odds in your favor.
One of the basic tenets is to invest for the long term. Over time, riding out the markets' inevitable ups and downs has proven much more effective than selling into panic or chasing the hottest trend. Even missing only a few of the markets' best days can significantly diminish investor returns. Patience also affords the benefits of compounding - of earning interest on additional income or reinvested dividends and capital gains. There are tax advantages and cost benefits to consider as well. The more you sell, the more taxes you pay, and the more you trade, the higher the costs. While staying the course doesn't eliminate risk, it can considerably lessen the effect of short-term declines.
You can further manage your investing risk through diversification. And today, more than ever, geographic diversification should be taken into account. Studies indicate that asset allocation is the single most important determinant of a portfolio's long-term success. The right mix of stocks, bonds and cash - aligned to your particular risk tolerance and investment objective - is very important. Age-appropriate rebalancing is also an essential aspect of asset allocation. For younger investors, an emphasis on equities - which historically have been the best-performing asset class over time - is encouraged. As investors near their specific goal, such as retirement or sending a child to college, consideration may be given to replacing volatile assets (e.g. common stocks) with more-stable fixed investments (bonds or savings plans).
A third investment principle - investing regularly - can help lower the average cost of your purchases. Investing a certain amount of money each month or quarter helps ensure you won't pay for all your shares at market highs. This strategy - known as dollar cost averaging - also reduces unconstructive "emotion" from investing, helping shareholders avoid selling weak performers just prior to an upswing, or chasing a hot performer just before a correction.
We invite you to contact us via the Internet, through our Investor Centers or over the phone. It is our privilege to provide you the information you need to make the investments that are right for you.
Sincerely,
/s/Edward C. Johnson 3d
Edward C. Johnson 3d
Annual Report
Performance: The Bottom Line
Average annual total return reflects the change in the value of an investment, assuming reinvestment of the fund's dividend income and capital gains (the profits earned upon the sale of securities that have grown in value, if any) and assuming a constant rate of performance each year. The $100,000 table and the fund's returns do not reflect the deduction of taxes that a shareholder would pay on fund distributions or the redemption of fund shares. During periods of reimbursement by Fidelity, a fund's total return will be greater than it would be had the reimbursement not occurred. How a fund did yesterday is no guarantee of how it will do tomorrow.
Average Annual Total Returns
Periods ended November 30, 2007 | Past 1 | Past 5 | Past 10 |
Fidelity® Inst Sht-Int Govt Fund | 6.54% | 3.25% | 4.94% |
$100,000 Over 10 Years
Let's say hypothetically that $100,000 was invested in Fidelity® Institutional Short-Intermediate Government Fund on November 30, 1997. The chart shows how the value of your investment would have changed, and also shows how the Lehman Brothers® 1-5 Year U.S. Government/Credit Index performed over the same period.
Annual Report
Management's Discussion of Fund Performance
Comments from Brett Kozlowski, Portfolio Manager of Fidelity® Institutional Short-Intermediate Government Fund
The investment-grade bond market - led by the Treasury sector - had solid performance for the 12 months ending November 30, 2007. Much of the positive momentum for high-quality debt occurred in the second half of the period as stocks struggled against the backdrop of tight credit conditions, the subprime mortgage meltdown and a potential recession. Two interest rate cuts by the Federal Reserve Board also helped spark the rally in bonds. For the period overall, the Lehman Brothers® U.S. Aggregate Index - a measure of high-quality, taxable debt securities - returned 6.05%. Treasuries had the best showing within the Aggregate index, rising 8.03% as measured by the Lehman Brothers U.S. Treasury Index. In a flight to quality, investors poured money into Treasuries, seeking the safe haven of government-guaranteed debt. In response, Treasury prices soared, while their yields fell. The asset-backed category - home to volatile subprime mortgages, as well as credit card debt and auto loans - had the weakest performance, returning only 2.37% according to the Lehman Brothers U.S. Fixed-Rate Asset-Backed Securities Index.
The fund returned 6.54% during the past year, while its benchmark, the Lehman Brothers 1-5 Year U.S. Government/Credit Index, returned 7.34%. The fund trailed the benchmark mainly because of a sharp increase in the yields on interest rate swap contracts versus the yields on comparable U.S. Treasury securities (i.e., swap yield "spreads"). Reflecting a period of increased market volatility and reluctance on the part of market participants to lend to each other, swap yield spreads rose during July and August and remained elevated for the balance of the period. Fluctuations in the swap market are significant for the fund because the fund's out-of-index allocations to mortgage pass-through securities, collateralized mortgage obligations (CMOs) and hybrid adjustable-rate mortgage (ARM) bonds are highly correlated to swap spreads. Therefore, when swap prices decline and their yields rise relative to Treasuries, the prices of mortgage pass-throughs, CMOs and hybrid ARMs also decline relative to Treasuries. In an effort to mitigate the impact of higher swap yield spreads, I used interest rate swaps to increase the portfolio's sensitivity to falling short-term yields and to reduce its sensitivity to rising long-term yields-an approach that helped the fund's results as the yield curve became steeper.
The views expressed above reflect those of the portfolio manager(s) only through the end of the period as stated on the cover of this report and do not necessarily represent the views of Fidelity or any other person in the Fidelity organization. Any such views are subject to change at any time based upon market or other conditions and Fidelity disclaims any responsibility to update such views. These views may not be relied on as investment advice and, because investment decisions for a Fidelity fund are based on numerous factors, may not be relied on as an indication of trading intent on behalf of any Fidelity fund.
Annual Report
Shareholder Expense Example
As a shareholder of the Fund, you incur two types of costs: (1) transaction costs, and (2) ongoing costs, including management fees and other Fund expenses. This Example is intended to help you understand your ongoing costs (in dollars) of investing in the Fund and to compare these costs with the ongoing costs of investing in other mutual funds.
The Example is based on an investment of $1,000 invested at the beginning of the period and held for the entire period (June 1, 2007 to November 30, 2007).
Actual Expenses
The first line of the accompanying table provides information about actual account values and actual expenses. You may use the information in this line, together with the amount you invested, to estimate the expenses that you paid over the period. Simply divide your account value by $1,000.00 (for example, an $8,600 account value divided by $1,000.00 = 8.6), then multiply the result by the number in the first line under the heading entitled "Expenses Paid During Period" to estimate the expenses you paid on your account during this period.
Hypothetical Example for Comparison Purposes
The second line of the accompanying table provides information about hypothetical account values and hypothetical expenses based on the Fund's actual expense ratio and an assumed rate of return of 5% per year before expenses, which is not the Fund's actual return. The hypothetical account values and expenses may not be used to estimate the actual ending account balance or expenses you paid for the period. You may use this information to compare the ongoing costs of investing in the Fund and other funds. To do so, compare this 5% hypothetical example with the 5% hypothetical examples that appear in the shareholder reports of the other funds.
Please note that the expenses shown in the table are meant to highlight your ongoing costs only and do not reflect any transaction costs. Therefore, the second line of the table is useful in comparing ongoing costs only, and will not help you determine the relative total costs of owning different funds.
Beginning | Ending | Expenses Paid | |
Actual | $ 1,000.00 | $ 1,050.60 | $ 2.31 |
Hypothetical (5% return per year before expenses) | $ 1,000.00 | $ 1,022.81 | $ 2.28 |
* Expenses are equal to the Fund's annualized expense ratio of .45%; multiplied by the average account value over the period, multiplied by 183/365 (to reflect the one-half year period).
Annual Report
Investment Changes
Coupon Distribution as of November 30, 2007 | ||
% of fund's investments | % of fund's investments | |
Less than 3% | 1.8 | 2.2 |
3 - 3.99% | 28.0 | 1.2 |
4 - 4.99% | 27.9 | 56.1 |
5 - 5.99% | 27.1 | 20.9 |
6 - 6.99% | 4.9 | 14.1 |
7% and over | 0.7 | 1.0 |
Coupon distribution shows the range of stated interest rates on the fund's investments, excluding short-term investments. |
Weighted Average Maturity as of November 30, 2007 | ||
6 months ago | ||
Years | 3.7 | 2.9 |
The weighted average maturity is based on the dollar-weighted average length of time until principal payments are expected or until securities reach maturity, taking into account any maturity shortening feature such as a call, refunding or redemption provision. |
Duration as of November 30, 2007 | ||
6 months ago | ||
Years | 2.3 | 2.2 |
Duration shows how much a bond fund's price fluctuates with changes in comparable interest rates. If rates rise 1%, for example, a fund with a five-year duration is likely to lose about 5% of its value. Other factors also can influence a bond fund's performance and share price. Accordingly, a bond fund's actual performance may differ from this example. |
Asset Allocation (% of fund's net assets) | |||||||
As of November 30, 2007 * | As of May 31, 2007 ** | ||||||
 | Mortgage Securities 37.2% |  | Mortgage Securities 18.1% | ||||
 | CMOs and |  | CMOs and | ||||
 | U.S. Treasury |  | U.S. Treasury | ||||
 | U.S. Government |  | U.S. Government | ||||
 | Asset-Backed |  | Asset-Backed | ||||
 | Short-Term |  | Short-Term | ||||
* Futures and Swaps | (0.2)% | ** Futures and Swaps | (1.3)% | ||||

(dagger) Short-Term Investments and Net Other Assets are not included in the pie chart. |
Annual Report
Investments November 30, 2007
Showing Percentage of Net Assets
U.S. Government and Government Agency Obligations - 70.8% | ||||
Principal Amount | Value | |||
U.S. Government Agency Obligations - 27.5% | ||||
Fannie Mae: | ||||
3.875% 12/10/09 | $ 18,400,000 | $ 18,465,357 | ||
4.5% 10/15/08 | 2,517,000 | 2,530,305 | ||
4.75% 11/19/12 | 2,000,000 | 2,062,676 | ||
4.875% 5/18/12 | 2,000,000 | 2,073,658 | ||
5.125% 9/2/08 | 9,430,000 | 9,485,147 | ||
Federal Home Loan Bank: | ||||
4.5% 10/14/08 | 2,240,000 | 2,245,510 | ||
5.375% 8/19/11 | 2,595,000 | 2,732,737 | ||
5.8% 9/2/08 | 9,855,000 | 9,960,941 | ||
Freddie Mac: | ||||
4.125% 11/30/09 | 33,600,000 | 33,876,629 | ||
5.125% 4/18/11 | 13,500,000 | 14,082,525 | ||
Israeli State (guaranteed by U.S. Government through Agency for International Development) 6.8% 2/15/12 | 2,500,000 | 2,655,483 | ||
Overseas Private Investment Corp. U.S. Government guaranteed participation certificates 6.77% 11/15/13 | 784,615 | 804,475 | ||
TOTAL U.S. GOVERNMENT AGENCY OBLIGATIONS | 100,975,443 | |||
U.S. Treasury Inflation Protected Obligations - 2.3% | ||||
U.S. Treasury Inflation-Indexed Notes 1.875% 7/15/13 | 8,229,185 | 8,503,089 | ||
U.S. Treasury Obligations - 41.0% | ||||
U.S. Treasury Notes: | ||||
3.375% 11/30/12 | 10,000,000 | 9,993,750 | ||
3.5% 2/15/10 (b) | 16,295,000 | 16,446,495 | ||
3.625% 10/31/09 (c) | 54,150,000 | 54,716,563 | ||
3.875% 5/15/09 | 6,200,000 | 6,269,750 | ||
3.875% 10/31/12 (c) | 21,456,000 | 21,898,340 | ||
4.5% 4/30/12 | 7,300,000 | 7,628,500 | ||
4.625% 7/31/12 | 6,500,000 | 6,831,097 | ||
4.75% 2/15/10 | 10,000,000 | 10,359,380 | ||
4.75% 3/31/11 | 9,250,000 | 9,720,446 | ||
4.75% 5/31/12 | 6,000,000 | 6,334,686 | ||
TOTAL U.S. TREASURY OBLIGATIONS | 150,199,007 | |||
TOTAL U.S. GOVERNMENT AND GOVERNMENT AGENCY OBLIGATIONS (Cost $255,284,855) | 259,677,539 | |||
U.S. Government Agency - Mortgage Securities - 37.2% | ||||
Principal Amount | Value | |||
Fannie Mae - 27.8% | ||||
3.587% 9/1/33 (e) | $ 151,670 | $ 150,635 | ||
3.718% 6/1/33 (e) | 462,095 | 461,987 | ||
3.754% 10/1/33 (e) | 48,347 | 48,137 | ||
3.782% 6/1/33 (e) | 554,343 | 553,048 | ||
3.797% 6/1/33 (e) | 40,421 | 40,369 | ||
3.876% 6/1/33 (e) | 197,380 | 197,058 | ||
3.901% 5/1/34 (e) | 292,710 | 290,873 | ||
3.912% 5/1/33 (e) | 218,827 | 218,686 | ||
3.915% 5/1/33 (e) | 17,162 | 17,183 | ||
3.935% 5/1/34 (e) | 231,136 | 229,700 | ||
3.96% 8/1/33 (e) | 209,593 | 208,979 | ||
3.977% 9/1/33 (e) | 360,835 | 359,459 | ||
4% 9/1/13 to 5/1/20 | 1,360,254 | 1,320,192 | ||
4% 3/1/34 (e) | 421,654 | 419,273 | ||
4.001% 4/1/34 (e) | 464,705 | 462,074 | ||
4.007% 10/1/18 (e) | 32,687 | 32,532 | ||
4.029% 3/1/34 (e) | 889,805 | 884,871 | ||
4.039% 6/1/33 (e) | 525,071 | 525,005 | ||
4.063% 3/1/35 (e) | 813,110 | 809,613 | ||
4.101% 2/1/35 (e) | 19,644 | 19,745 | ||
4.116% 4/1/34 (e) | 578,753 | 576,102 | ||
4.122% 5/1/34 (e) | 471,579 | 469,654 | ||
4.156% 8/1/33 (e) | 216,144 | 215,901 | ||
4.172% 1/1/35 (e) | 113,791 | 112,992 | ||
4.186% 11/1/34 (e) | 552,775 | 551,429 | ||
4.23% 4/1/33 (e) | 10,629 | 10,660 | ||
4.245% 1/1/34 (e) | 114,260 | 113,609 | ||
4.25% 2/1/35 (e) | 46,719 | 46,443 | ||
4.256% 5/1/35 (e) | 49,251 | 49,506 | ||
4.263% 10/1/33 (e) | 19,069 | 19,043 | ||
4.283% 6/1/33 (e) | 20,155 | 20,236 | ||
4.289% 3/1/33 (e) | 41,289 | 41,486 | ||
4.292% 3/1/35 (e) | 39,747 | 39,784 | ||
4.299% 3/1/33 (e) | 31,351 | 31,153 | ||
4.3% 4/1/35 (e) | 21,451 | 21,541 | ||
4.307% 8/1/33 (e) | 88,562 | 88,458 | ||
4.312% 1/1/35 (e) | 397,381 | 395,903 | ||
4.339% 1/1/35 (e) | 52,458 | 52,247 | ||
4.344% 10/1/19 (e) | 50,413 | 50,209 | ||
4.362% 2/1/34 (e) | 104,050 | 103,518 | ||
4.367% 11/1/35 (e) | 1,317,536 | 1,315,941 | ||
4.39% 10/1/34 (e) | 196,963 | 196,401 | ||
U.S. Government Agency - Mortgage Securities - continued | ||||
Principal Amount | Value | |||
Fannie Mae - continued | ||||
4.391% 2/1/35 (e) | $ 82,649 | $ 82,275 | ||
4.399% 10/1/33 (e) | 218,609 | 217,420 | ||
4.412% 5/1/35 (e) | 51,724 | 51,892 | ||
4.423% 8/1/34 (e) | 143,187 | 143,003 | ||
4.425% 8/1/34 (e) | 1,089,167 | 1,086,681 | ||
4.434% 3/1/35 (e) | 90,104 | 89,768 | ||
4.437% 5/1/35 (e) | 649,490 | 651,141 | ||
4.45% 1/1/35 (e) | 49,455 | 49,205 | ||
4.453% 11/1/33 (e) | 71,976 | 71,725 | ||
4.457% 8/1/35 (e) | 704,768 | 703,728 | ||
4.482% 1/1/35 (e) | 251,485 | 250,809 | ||
4.483% 5/1/35 (e) | 135,611 | 135,742 | ||
4.49% 12/1/34 (e) | 25,872 | 25,813 | ||
4.5% 3/1/18 to 10/1/18 | 918,875 | 911,229 | ||
4.506% 2/1/35 (e) | 508,282 | 507,659 | ||
4.522% 4/1/33 (e) | 495,430 | 498,601 | ||
4.528% 7/1/35 (e) | 155,062 | 155,032 | ||
4.537% 2/1/35 (e) | 37,406 | 37,620 | ||
4.554% 9/1/34 (e) | 1,040,734 | 1,039,834 | ||
4.558% 2/1/35 (e) | 19,966 | 20,161 | ||
4.568% 2/1/35 (e) | 176,234 | 175,922 | ||
4.569% 1/1/35 (e) | 393,481 | 392,948 | ||
4.574% 7/1/35 (e) | 112,012 | 111,955 | ||
4.59% 8/1/34 (e) | 904,401 | 904,905 | ||
4.601% 8/1/35 (e) | 523,545 | 526,486 | ||
4.603% 2/1/36 (e) | 632,120 | 632,694 | ||
4.636% 1/1/35 (e) | 253,555 | 253,625 | ||
4.645% 10/1/34 (e) | 156,485 | 156,506 | ||
4.66% 6/1/35 (e) | 185,938 | 186,308 | ||
4.663% 3/1/35 (e) | 330,023 | 332,864 | ||
4.668% 8/1/35 (e) | 241,974 | 241,961 | ||
4.682% 9/1/34 (e) | 642,519 | 643,479 | ||
4.69% 2/1/35 (e) | 688,922 | 689,055 | ||
4.69% 3/1/35 (e) | 11,718 | 11,827 | ||
4.693% 10/1/34 (e) | 122,513 | 122,637 | ||
4.713% 7/1/34 (e) | 143,505 | 143,760 | ||
4.72% 2/1/35 (e) | 304,469 | 304,648 | ||
4.729% 12/1/35 (e) | 1,857,726 | 1,860,442 | ||
4.768% 1/1/35 (e) | 216,750 | 217,042 | ||
4.77% 12/1/34 (e) | 44,956 | 45,016 | ||
4.794% 4/1/35 (e) | 569,825 | 570,215 | ||
4.797% 11/1/34 (e) | 106,399 | 106,613 | ||
U.S. Government Agency - Mortgage Securities - continued | ||||
Principal Amount | Value | |||
Fannie Mae - continued | ||||
4.798% 7/1/35 (e) | $ 208,565 | $ 208,755 | ||
4.8% 6/1/35 (e) | 155,212 | 155,563 | ||
4.818% 12/1/34 (e) | 478,647 | 479,797 | ||
4.818% 10/1/35 (e) | 107,602 | 107,861 | ||
4.819% 7/1/36 (e) | 234,381 | 235,283 | ||
4.824% 2/1/33 (e) | 63,192 | 63,780 | ||
4.84% 9/1/34 (e) | 202,096 | 202,620 | ||
4.841% 9/1/34 (e) | 433,454 | 434,422 | ||
4.854% 7/1/35 (e) | 275,984 | 276,587 | ||
4.858% 10/1/34 (e) | 406,719 | 407,948 | ||
4.871% 1/1/35 (e) | 166,759 | 167,302 | ||
4.882% 10/1/35 (e) | 67,869 | 67,887 | ||
4.884% 5/1/35 (e) | 82,815 | 83,062 | ||
4.904% 11/1/35 (e) | 455,601 | 457,506 | ||
4.911% 3/1/33 (e) | 135,495 | 136,112 | ||
4.927% 8/1/34 (e) | 420,352 | 421,905 | ||
4.946% 8/1/34 (e) | 317,141 | 318,530 | ||
4.948% 2/1/35 (e) | 246,306 | 247,318 | ||
4.95% 3/1/35 (e) | 227,850 | 228,772 | ||
4.989% 8/1/34 (e) | 33,083 | 33,186 | ||
4.997% 2/1/34 (e) | 366,646 | 368,385 | ||
5% 2/1/16 to 10/1/37 (d) | 41,411,739 | 40,786,201 | ||
5% 12/12/37 (c) | 5,000,000 | 4,915,625 | ||
5.016% 7/1/34 (e) | 21,368 | 21,463 | ||
5.035% 12/1/32 (e) | 413,912 | 415,999 | ||
5.04% 5/1/35 (e) | 270,940 | 272,785 | ||
5.066% 9/1/34 (e) | 283,786 | 285,232 | ||
5.076% 10/1/35 (e) | 294,594 | 296,144 | ||
5.082% 9/1/34 (e) | 35,664 | 35,869 | ||
5.095% 5/1/35 (e) | 102,559 | 103,264 | ||
5.103% 10/1/35 (e) | 204,245 | 205,557 | ||
5.122% 8/1/34 (e) | 284,822 | 286,861 | ||
5.132% 3/1/35 (e) | 22,590 | 22,739 | ||
5.161% 3/1/36 (e) | 625,096 | 630,801 | ||
5.176% 6/1/35 (e) | 188,781 | 190,025 | ||
5.189% 8/1/33 (e) | 58,853 | 59,211 | ||
5.25% 11/1/36 (e) | 130,733 | 132,127 | ||
5.285% 7/1/35 (e) | 1,220,675 | 1,231,943 | ||
5.286% 4/1/36 (e) | 247,502 | 250,847 | ||
5.299% 12/1/36 (e) | 132,797 | 133,099 | ||
5.3% 7/1/35 (e) | 23,022 | 23,156 | ||
5.312% 12/1/34 (e) | 60,379 | 60,858 | ||
U.S. Government Agency - Mortgage Securities - continued | ||||
Principal Amount | Value | |||
Fannie Mae - continued | ||||
5.334% 2/1/36 (e) | $ 48,439 | $ 48,529 | ||
5.34% 1/1/36 (e) | 515,816 | 516,660 | ||
5.357% 2/1/36 (e) | 366,294 | 366,805 | ||
5.376% 3/1/37 (e) | 951,685 | 962,525 | ||
5.396% 2/1/37 (e) | 129,531 | 130,840 | ||
5.404% 2/1/37 (e) | 609,379 | 616,791 | ||
5.48% 6/1/47 (e) | 106,399 | 107,613 | ||
5.484% 2/1/37 (e) | 835,231 | 846,144 | ||
5.5% 1/1/09 to 10/1/17 | 2,145,760 | 2,185,569 | ||
5.523% 11/1/36 (e) | 260,062 | 262,819 | ||
5.618% 2/1/36 (e) | 156,504 | 158,789 | ||
5.647% 4/1/37 (e) | 572,285 | 580,359 | ||
5.65% 4/1/36 (e) | 569,622 | 577,902 | ||
5.663% 6/1/36 (e) | 361,498 | 366,942 | ||
5.795% 3/1/36 (e) | 1,132,444 | 1,151,544 | ||
5.803% 1/1/36 (e) | 127,057 | 129,170 | ||
5.83% 3/1/36 (e) | 374,062 | 380,659 | ||
5.833% 5/1/36 (e) | 869,750 | 884,772 | ||
5.893% 12/1/36 (e) | 208,786 | 212,709 | ||
5.903% 9/1/36 (e) | 230,941 | 234,225 | ||
5.938% 5/1/36 (e) | 361,657 | 368,587 | ||
5.966% 5/1/36 (e) | 130,935 | 133,497 | ||
6% 5/1/12 to 6/1/30 | 3,400,120 | 3,491,908 | ||
6.023% 4/1/36 (e) | 2,286,667 | 2,332,709 | ||
6.102% 3/1/37 (e) | 215,888 | 220,566 | ||
6.159% 4/1/36 (e) | 228,489 | 233,294 | ||
6.226% 3/1/37 (e) | 69,972 | 71,507 | ||
6.236% 6/1/36 (e) | 35,399 | 35,927 | ||
6.5% 6/1/15 to 7/1/32 | 552,752 | 572,660 | ||
7% 6/1/12 to 6/1/31 | 350,335 | 363,666 | ||
7.253% 12/1/32 (e) | 177,294 | 180,855 | ||
7.5% 5/1/37 | 185,242 | 194,124 | ||
9% 2/1/13 to 8/1/21 | 144,131 | 157,143 | ||
9.5% 5/1/09 to 11/1/21 | 4,544 | 4,716 | ||
10.5% 5/1/10 to 8/1/20 | 30,184 | 33,682 | ||
11% 11/1/10 to 9/1/14 | 123,994 | 132,132 | ||
11.5% 11/1/15 to 7/15/19 | 129,098 | 147,021 | ||
12% 4/1/15 | 12,880 | 15,218 | ||
12.5% 3/1/16 | 3,307 | 3,693 | ||
102,008,539 | ||||
U.S. Government Agency - Mortgage Securities - continued | ||||
Principal Amount | Value | |||
Freddie Mac - 9.3% | ||||
3.379% 7/1/33 (e) | $ 463,142 | $ 459,821 | ||
3.999% 5/1/33 (e) | 689,538 | 689,346 | ||
4% 11/1/20 | 923,784 | 892,314 | ||
4.005% 4/1/34 (e) | 694,022 | 687,822 | ||
4.075% 7/1/35 (e) | 325,877 | 323,953 | ||
4.178% 1/1/35 (e) | 688,636 | 684,325 | ||
4.299% 2/1/35 (e) | 120,194 | 120,031 | ||
4.3% 12/1/34 (e) | 57,999 | 57,531 | ||
4.306% 3/1/35 (e) | 58,794 | 58,673 | ||
4.421% 2/1/34 (e) | 61,639 | 61,213 | ||
4.422% 6/1/35 (e) | 106,064 | 105,923 | ||
4.423% 3/1/35 (e) | 72,601 | 72,070 | ||
4.452% 3/1/35 (e) | 75,448 | 74,959 | ||
4.5% 2/1/18 to 11/1/20 | 728,374 | 721,660 | ||
4.539% 2/1/35 (e) | 138,032 | 137,286 | ||
4.573% 6/1/33 (e) | 213,488 | 212,542 | ||
4.643% 5/1/35 (e) | 453,321 | 452,167 | ||
4.664% 2/1/35 (e) | 1,720,113 | 1,714,461 | ||
4.697% 9/1/36 (e) | 143,985 | 144,104 | ||
4.789% 2/1/36 (e) | 63,803 | 63,665 | ||
4.801% 3/1/33 (e) | 19,300 | 19,446 | ||
4.807% 3/1/35 (e) | 123,442 | 123,348 | ||
4.82% 5/1/35 (e) | 1,174,259 | 1,172,669 | ||
4.85% 10/1/35 (e) | 277,661 | 277,585 | ||
4.898% 10/1/36 (e) | 773,803 | 771,788 | ||
4.995% 4/1/35 (e) | 303,940 | 305,361 | ||
5% 9/1/18 to 9/1/35 | 1,505,635 | 1,514,036 | ||
5.01% 7/1/35 (e) | 746,101 | 747,495 | ||
5.034% 10/1/36 (e) | 298,467 | 300,389 | ||
5.037% 4/1/35 (e) | 514,409 | 515,214 | ||
5.115% 7/1/35 (e) | 232,890 | 233,745 | ||
5.271% 2/1/36 (e) | 20,104 | 20,221 | ||
5.275% 11/1/35 (e) | 235,617 | 235,113 | ||
5.43% 3/1/37 (e) | 89,402 | 90,044 | ||
5.5% 8/1/14 to 11/1/20 | 3,614,323 | 3,678,560 | ||
5.501% 1/1/36 (e) | 207,777 | 209,591 | ||
5.529% 4/1/37 (e) | 131,413 | 132,512 | ||
5.532% 1/1/36 (e) | 282,675 | 285,263 | ||
5.579% 3/1/36 (e) | 933,535 | 943,383 | ||
5.648% 8/1/36 (e) | 952,750 | 962,627 | ||
5.703% 4/1/36 (e) | 2,035,203 | 2,057,130 | ||
5.76% 10/1/35 (e) | 61,641 | 62,384 | ||
U.S. Government Agency - Mortgage Securities - continued | ||||
Principal Amount | Value | |||
Freddie Mac - continued | ||||
5.772% 5/1/37 (e) | $ 1,063,105 | $ 1,075,471 | ||
5.784% 3/1/37 (e) | 485,957 | 491,647 | ||
5.809% 4/1/37 (e) | 453,517 | 458,912 | ||
5.833% 5/1/37 (e) | 148,256 | 149,914 | ||
5.835% 5/1/37 (e) | 104,454 | 105,587 | ||
5.838% 6/1/37 (e) | 359,896 | 364,481 | ||
5.839% 5/1/37 (e) | 607,299 | 614,832 | ||
5.954% 4/1/36 (e) | 1,209,119 | 1,228,648 | ||
6% 11/1/16 to 2/1/19 | 1,395,129 | 1,447,163 | ||
6.015% 6/1/36 (e) | 160,207 | 162,809 | ||
6.141% 2/1/37 (e) | 134,548 | 136,823 | ||
6.159% 12/1/36 (e) | 1,130,757 | 1,145,923 | ||
6.221% 5/1/36 (e) | 127,277 | 129,747 | ||
6.299% 8/1/36 (e) | 1,621,874 | 1,653,138 | ||
6.349% 7/1/36 (e) | 167,887 | 171,088 | ||
6.416% 6/1/37 (e) | 34,912 | 35,603 | ||
6.5% 5/1/08 to 12/1/21 | 477,190 | 490,673 | ||
6.501% 9/1/36 (e) | 840,881 | 859,013 | ||
6.725% 8/1/37 (e) | 269,972 | 275,982 | ||
7.5% 11/1/12 | 102,410 | 106,691 | ||
7.581% 4/1/37 (e) | 35,000 | 35,842 | ||
8% 1/1/08 to 12/1/09 | 4,171 | 4,167 | ||
8.5% 7/1/09 to 6/1/14 | 2,926 | 2,925 | ||
9% 9/1/10 to 12/1/18 | 48,408 | 53,157 | ||
9.5% 2/1/17 to 12/1/22 | 173,701 | 192,167 | ||
10% 1/1/09 to 6/1/20 | 24,874 | 26,669 | ||
10.5% 9/1/20 to 5/1/21 | 6,890 | 7,165 | ||
11% 12/1/11 | 1,079 | 1,151 | ||
11.5% 10/1/15 | 4,253 | 4,909 | ||
12% 10/1/13 to 11/1/19 | 16,375 | 18,833 | ||
12.25% 11/1/14 | 20,027 | 23,132 | ||
12.5% 8/1/10 to 6/1/19 | 110,216 | 124,479 | ||
33,990,511 | ||||
Government National Mortgage Association - 0.1% | ||||
8% 11/15/09 to 12/15/23 | 387,490 | 408,055 | ||
8.5% 5/15/16 to 3/15/17 | 43,174 | 47,453 | ||
10.5% 1/15/16 to 1/15/18 | 48,207 | 55,693 | ||
U.S. Government Agency - Mortgage Securities - continued | ||||
Principal Amount | Value | |||
Government National Mortgage Association - continued | ||||
11% 10/20/13 | $ 1,603 | $ 1,821 | ||
13.5% 7/15/11 | 3,518 | 3,903 | ||
516,925 | ||||
TOTAL U.S. GOVERNMENT AGENCY - MORTGAGE SECURITIES (Cost $134,335,148) | 136,515,975 | |||
Asset-Backed Securities - 0.4% | ||||
Fannie Mae Grantor Trust Series 2005-T4 Class A1C, 4.9388% 9/25/35 (e) | 1,334,037 | 1,317,362 | ||
Collateralized Mortgage Obligations - 8.4% | ||||
U.S. Government Agency - 8.4% | ||||
Fannie Mae: | ||||
floater: | ||||
Series 1994-42 Class FK, 4.07% 4/25/24 (e) | 1,464,842 | 1,394,835 | ||
Series 2007-95 Class A1, 5.0331% 8/27/36 (e) | 802,437 | 802,179 | ||
planned amortization class Series 2002-83 Class ME, 5% 12/25/17 | 2,390,000 | 2,351,463 | ||
sequential payer: | ||||
Series 1993-238 Class C, 6.5% 12/25/08 | 650,088 | 652,456 | ||
Series 1999-25 Class Z, 6% 6/25/29 | 2,818,473 | 2,881,111 | ||
Fannie Mae subordinate REMIC pass-thru certificates: | ||||
floater: | ||||
Series 2001-38 Class QF, 5.7631% 8/25/31 (e) | 347,709 | 354,601 | ||
Series 2002-49 Class FB, 5.2863% 11/18/31 (e) | 586,429 | 589,289 | ||
Series 2002-60 Class FV, 5.7831% 4/25/32 (e) | 128,579 | 131,151 | ||
Series 2002-74 Class FV, 5.2331% 11/25/32 (e) | 1,284,781 | 1,287,851 | ||
Series 2002-75 Class FA, 5.7831% 11/25/32 (e) | 263,393 | 268,433 | ||
planned amortization class: | ||||
Series 2002-11: | ||||
Class QC, 5.5% 3/25/17 | 703,505 | 711,110 | ||
Class UC, 6% 3/25/17 | 544,696 | 556,996 | ||
Series 2002-16 Class PG, 6% 4/25/17 | 670,000 | 684,826 | ||
Series 2002-18 Class PC, 5.5% 4/25/17 | 360,000 | 364,836 | ||
Series 2002-61 Class PG, 5.5% 10/25/17 | 945,000 | 964,255 | ||
Series 2004-81 Class KC, 4.5% 4/25/17 | 325,000 | 324,957 | ||
Series 2005-52 Class PB, 6.5% 12/25/34 | 928,461 | 950,676 | ||
Collateralized Mortgage Obligations - continued | ||||
Principal Amount | Value | |||
U.S. Government Agency - continued | ||||
Fannie Mae subordinate REMIC pass-thru certificates: - continued | ||||
sequential payer: | ||||
Series 2002-56 Class MC, 5.5% 9/25/17 | $ 174,745 | $ 176,638 | ||
Series 2003-18 Class EY, 5% 6/25/17 | 908,584 | 909,751 | ||
Series 2004-95 Class AN, 5.5% 1/25/25 | 446,251 | 450,727 | ||
Freddie Mac Multi-class participation certificates guaranteed: | ||||
floater: | ||||
Series 2448 Class FT, 5.6519% 3/15/32 (e) | 566,776 | 579,182 | ||
Series 2526 Class FC, 5.0519% 11/15/32 (e) | 294,530 | 295,165 | ||
Series 2530 Class FE, 5.2519% 2/15/32 (e) | 334,446 | 335,332 | ||
Series 2630 Class FL, 5.1519% 6/15/18 (e) | 24,979 | 25,258 | ||
Series 2925 Class CQ, 0% 1/15/35 (e) | 110,310 | 96,837 | ||
planned amortization class: | ||||
Series 2356 Class GD, 6% 9/15/16 | 188,943 | 193,418 | ||
Series 2363 Class PF, 6% 9/15/16 | 260,126 | 266,241 | ||
Series 2376 Class JE, 5.5% 11/15/16 | 188,514 | 192,220 | ||
Series 2378 Class PE, 5.5% 11/15/16 | 542,311 | 549,742 | ||
Series 2381 Class OG, 5.5% 11/15/16 | 148,069 | 150,133 | ||
Series 2390 Class CH, 5.5% 12/15/16 | 490,654 | 497,479 | ||
Series 2425 Class JH, 6% 3/15/17 | 257,765 | 263,994 | ||
Series 2695 Class DG, 4% 10/15/18 | 805,000 | 767,012 | ||
Series 2752 Class PW, 4% 4/15/22 | 710,881 | 708,655 | ||
sequential payer: | ||||
Series 1929 Class EZ, 7.5% 2/17/27 | 1,051,972 | 1,102,288 | ||
Series 2570 Class CU, 4.5% 7/15/17 | 94,327 | 93,500 | ||
Series 2572 Class HK, 4% 2/15/17 | 137,093 | 134,690 | ||
Series 2617 Class GW, 3.5% 6/15/16 | 742,449 | 740,937 | ||
Series 2672 Class HA, 4% 9/15/16 | 1,015,472 | 1,002,784 | ||
Series 2675 Class CB, 4% 5/15/16 | 799,328 | 789,390 | ||
Series 2683 Class JA, 4% 10/15/16 | 839,310 | 828,624 | ||
Series 2860 Class CP, 4% 10/15/17 | 103,743 | 102,051 | ||
Series 2866 Class N, 4.5% 12/15/18 | 679,510 | 677,496 | ||
Series 2937 Class HJ, 5% 10/15/19 | 443,087 | 443,536 | ||
Series 3013 Class VJ, 5% 1/15/14 | 1,011,624 | 1,018,448 | ||
Collateralized Mortgage Obligations - continued | ||||
Principal Amount | Value | |||
U.S. Government Agency - continued | ||||
Freddie Mac Multi-class participation certificates guaranteed: - continued | ||||
Series 2975 Class NA, 5% 7/15/23 | $ 309,401 | $ 310,763 | ||
Ginnie Mae guaranteed REMIC pass-thru securities planned amortization class Series 2005-58 Class NJ, 4.5% 8/20/35 | 1,630,000 | 1,625,095 | ||
TOTAL COLLATERALIZED MORTGAGE OBLIGATIONS (Cost $30,520,428) | 30,598,411 | |||
Cash Equivalents - 12.2% | |||
Maturity Amount | |||
Investments in repurchase agreements in a joint trading account at 4.65%, dated 11/30/07 due 12/3/07: | |||
(Collateralized by U.S. Government Obligations) # | $ 28,204,928 | 28,194,000 | |
(Collateralized by U.S. Government Obligations) # (a) | 16,586,425 | 16,580,000 | |
TOTAL CASH EQUIVALENTS (Cost $44,774,000) | 44,774,000 | ||
TOTAL INVESTMENT PORTFOLIO - 129.0% (Cost $466,248,468) | 472,883,287 | ||
NET OTHER ASSETS - (29.0)% | (106,302,721) | ||
NET ASSETS - 100% | $ 366,580,566 | ||
Swap Agreements | |||||
Expiration Date | Notional Amount | ||||
Interest Rate Swaps | |||||
Receive quarterly a floating rate based on 3-month LIBOR and pay semi-annually a fixed rate equal to 5.35% with Bank of America | March 2037 | $ 850,000 | $ (53,562) | ||
Legend |
(a) Investment made with cash collateral received from securities on loan. |
(b) Security or a portion of the security is on loan at period end. |
(c) Security or a portion of the security purchased on a delayed delivery or when-issued basis. |
(d) A portion of the security is subject to a forward commitment to sell. |
(e) The coupon rate shown on floating or adjustable rate securities represents the rate at period end. |
# Additional Information on each counterparty to the repurchase agreement is as follows: |
Repurchase Agreement / Counterparty | Value |
$28,194,000 due 12/03/07 at 4.65% | |
ABN AMRO Bank N.V., New York Branch | $ 1,087,309 |
BNP Paribas Securities Corp. | 1,794,059 |
Banc of America Securities LLC | 652,127 |
Bank of America, NA | 10,873,086 |
Barclays Capital, Inc. | 4,866,798 |
Citigroup Global Markets, Inc. | 724,873 |
ING Financial Markets LLC | 3,624,363 |
Societe Generale, New York Branch | 222,149 |
UBS Securities LLC | 3,624,363 |
WestLB AG | 724,873 |
$ 28,194,000 | |
$16,580,000 due 12/03/07 at 4.65% | |
Banc of America Securities LLC | $ 9,446,528 |
Barclays Capital, Inc. | 7,133,472 |
$ 16,580,000 | |
Income Tax Information |
At November 30, 2007, the fund had a capital loss carryforward of approximately $14,043,772 of which $4,168,919, $1,483,869, $4,816,509 and $3,574,475 will expire on November 30, 2008, 2012, 2013 and 2014, respectively. |
See accompanying notes which are an integral part of the financial statements.
Annual Report
Financial Statements
Statement of Assets and Liabilities
November 30, 2007 | ||
Assets | ||
Investment in securities, at value (including securities loaned of $16,148,752 and repurchase agreements of $44,774,000) - See accompanying schedule: Unaffiliated issuers (cost $466,248,468) | $ 472,883,287 | |
Commitment to sell securities on a delayed delivery basis | (34,249,095) | |
Receivable for securities sold on a delayed delivery basis | 33,572,812 | (676,283) |
Receivable for investments sold, regular delivery | 384,458 | |
Receivable for fund shares sold | 830,035 | |
Interest receivable | 2,226,298 | |
Total assets | 475,647,795 | |
Liabilities | ||
Payable to custodian bank | $ 60,973 | |
Payable for investments purchased | 10,128,137 | |
Delayed delivery | 81,173,291 | |
Payable for fund shares redeemed | 908,144 | |
Distributions payable | 26,310 | |
Swap agreements, at value | 53,562 | |
Accrued management fee | 135,931 | |
Other affiliated payables | 881 | |
Collateral on securities loaned, at value | 16,580,000 | |
Total liabilities | 109,067,229 | |
Net Assets | $ 366,580,566 | |
Net Assets consist of: | ||
Paid in capital | $ 374,126,232 | |
Undistributed net investment income | 591,600 | |
Accumulated undistributed net realized gain (loss) on investments | (14,042,240) | |
Net unrealized appreciation (depreciation) on investments | 5,904,974 | |
Net Assets, for 37,657,249 shares outstanding | $ 366,580,566 | |
Net Asset Value, offering price and redemption price per share ($366,580,566 ÷ 37,657,249 shares) | $ 9.73 | |
See accompanying notes which are an integral part of the financial statements.
Annual Report
Statement of Operations
Year ended November 30, 2007 | ||
Investment Income | ||
Interest | $ 16,401,046 | |
Expenses | ||
Management fee | $ 1,554,048 | |
Independent trustees' compensation | 1,218 | |
Miscellaneous | 723 | |
Total expenses before reductions | 1,555,989 | |
Expense reductions | (50,744) | 1,505,245 |
Net investment income | 14,895,801 | |
Realized and Unrealized Gain (Loss) Net realized gain (loss) on: | ||
Investment securities: | ||
Unaffiliated issuers | 525,456 | |
Swap agreements | 227,373 | |
Total net realized gain (loss) | 752,829 | |
Change in net unrealized appreciation (depreciation) on: Investment securities | 7,256,539 | |
Swap agreements | (53,562) | |
Delayed delivery commitments | (676,283) | |
Total change in net unrealized appreciation (depreciation) | 6,526,694 | |
Net gain (loss) | 7,279,523 | |
Net increase (decrease) in net assets resulting from operations | $ 22,175,324 | |
See accompanying notes which are an integral part of the financial statements.
Annual Report
Financial Statements - continued
Statement of Changes in Net Assets
Year ended | Year ended | |
Increase (Decrease) in Net Assets | ||
Operations | ||
Net investment income | $ 14,895,801 | $ 14,237,579 |
Net realized gain (loss) | 752,829 | (4,160,439) |
Change in net unrealized appreciation (depreciation) | 6,526,694 | 4,629,247 |
Net increase (decrease) in net assets resulting | 22,175,324 | 14,706,387 |
Distributions to shareholders from net investment income | (15,480,468) | (13,677,962) |
Share transactions | 106,902,706 | 79,142,633 |
Reinvestment of distributions | 15,061,493 | 13,207,771 |
Cost of shares redeemed | (105,203,552) | (178,939,958) |
Net increase (decrease) in net assets resulting from share transactions | 16,760,647 | (86,589,554) |
Total increase (decrease) in net assets | 23,455,503 | (85,561,129) |
Net Assets | ||
Beginning of period | 343,125,063 | 428,686,192 |
End of period (including undistributed net investment income of $591,600 and undistributed net investment income of $1,677,788, respectively) | $ 366,580,566 | $ 343,125,063 |
Other Information Shares | ||
Sold | 11,200,861 | 8,366,309 |
Issued in reinvestment of distributions | 1,578,974 | 1,393,237 |
Redeemed | (11,041,611) | (18,873,327) |
Net increase (decrease) | 1,738,224 | (9,113,781) |
See accompanying notes which are an integral part of the financial statements.
Annual Report
Financial Highlights
Years ended November 30, | 2007 | 2006 | 2005 | 2004 | 2003 |
Selected Per-Share Data | |||||
Net asset value, beginning of period | $ 9.55 | $ 9.52 | $ 9.65 | $ 9.71 | $ 9.71 |
Income from Investment Operations | |||||
Net investment income B | .411 | .382 | .293 | .225 | .236 |
Net realized and unrealized gain (loss) | .196 | .012 | (.160) | (.060) | .004 |
Total from investment operations | .607 | .394 | .133 | .165 | .240 |
Distributions from net investment income | (.427) | (.364) | (.263) | (.225) | (.240) |
Net asset value, end of period | $ 9.73 | $ 9.55 | $ 9.52 | $ 9.65 | $ 9.71 |
Total Return A | 6.54% | 4.24% | 1.39% | 1.71% | 2.48% |
Ratios to Average Net Assets C | |||||
Expenses before reductions | .45% | .45% | .45% | .45% | .45% |
Expenses net of fee waivers, if any | .45% | .45% | .45% | .45% | .45% |
Expenses net of all reductions | .44% | .44% | .44% | .45% | .44% |
Net investment income | 4.31% | 4.03% | 3.05% | 2.31% | 2.42% |
Supplemental Data | |||||
Net assets, end of period | $ 366,581 | $ 343,125 | $ 428,686 | $ 485,782 | $ 527,063 |
Portfolio turnover rate | 257% | 126% | 96% | 165% | 289% |
A Total returns would have been lower had certain expenses not been reduced during the periods shown.
B Calculated based on average shares outstanding during the period.
C Expense ratios reflect operating expenses of the Fund. Expenses before reductions do not reflect amounts reimbursed by the investment adviser or expense offset arrangements and do not represent the amount paid by the Fund during periods when reimbursements or reductions occur. Expenses net of fee waivers reflect expenses after reimbursement by the investment adviser but prior to reductions from expense offset arrangements. Expenses net of all reductions represent the net expenses paid by the Fund.
See accompanying notes which are an integral part of the financial statements.
Annual Report
Notes to Financial Statements
For the period ended November 30, 2007
1. Organization.
Fidelity Institutional Short - Intermediate Government Fund (the Fund) is a fund of Fidelity Advisor Series IV (the trust) and is authorized to issue an unlimited number of shares. The trust is registered under the Investment Company Act of 1940, as amended (the 1940 Act), as an open-end management investment company organized as a Massachusetts business trust.
2. Significant Accounting Policies.
The financial statements have been prepared in conformity with accounting principles generally accepted in the United States of America, which require management to make certain estimates and assumptions at the date of the financial statements. The following summarizes the significant accounting policies of the Fund:
Security Valuation. Investments are valued and net asset value per share is calculated (NAV calculation) as of the close of business of the New York Stock Exchange, normally 4:00 p.m. Eastern time. Wherever possible, the Fund uses independent pricing services approved by the Board of Trustees to value its investments. Debt securities, including restricted securities, for which quotes are readily available, are valued by independent pricing services or by dealers who make markets in such securities. Pricing services consider yield or price of bonds of comparable quality, coupon, maturity and type as well as available dealer supplied prices.
When current market prices or quotations are not readily available or do not accurately reflect fair value, valuations may be determined in accordance with procedures adopted by the Board of Trustees. Factors used in the determination of fair value may include current market trading activity, interest rates, credit quality and default rates. The frequency of when fair value pricing is used is unpredictable. The value of securities used for NAV calculation under fair value pricing may differ from published prices for the same securities. Investments in open-end mutual funds are valued at their closing net asset value each business day. Short-term securities with remaining maturities of sixty days or less for which quotations are not readily available are valued at amortized cost, which approximates value.
Investment Transactions and Income. For financial reporting purposes, the Fund's investment holdings and NAV include trades executed through the end of the last business day of the period. The NAV for processing shareholder transactions includes trades executed through the end of the prior business day. Gains and losses on securities sold are determined on the basis of identified cost. Interest income is accrued as earned. Interest income includes coupon interest and amortization of premium and accretion of discount on debt securities.
Annual Report
2. Significant Accounting Policies - continued
Expenses. Most expenses of the trust can be directly attributed to a fund. Expenses which cannot be directly attributed are apportioned among each Fund in the trust. Expense estimates are accrued in the period to which they relate and adjustments are made when actual amounts are known.
Income Tax Information and Distributions to Shareholders. Each year, the Fund intends to qualify as a regulated investment company by distributing all of its taxable income and realized gains under Subchapter M of the Internal Revenue Code. As a result, no provision for income taxes is required in the accompanying financial statements.
Dividends are declared daily and paid monthly from net investment income. Distributions from realized gains, if any, are recorded on the ex-dividend date. Income and capital gain distributions are determined in accordance with income tax regulations, which may differ from generally accepted accounting principles.
Capital accounts within the financial statements are adjusted for permanent book-tax differences. Certain adjustments have been made to the accounts relating to prior periods. Collectively, these adjustments have no impact on net assets or the results of operations. Temporary book-tax differences will reverse in a subsequent period.
Book-tax differences are primarily due to swap agreements, prior period premium and discount on debt securities, market discount, deferred trustees compensation, financing transactions, capital loss carryforwards, expiring capital loss carryforwards and losses deferred due to wash sales.
The tax-basis components of distributable earnings and the federal tax cost as of period end were as follows:
Unrealized appreciation | $ 6,537,163 | |
Unrealized depreciation | (551,204) | |
Net unrealized appreciation (depreciation) | 5,985,959 | |
Undistributed ordinary income | 513,026 | |
Capital loss carryforward | (14,043,772) | |
Cost for federal income tax purposes | $ 466,897,328 |
The tax character of distributions paid was as follows:
November 30, 2007 | November 30, 2006 | |
Ordinary Income | $ 15,480,468 | $ 13,677,962 |
New Accounting Pronouncements. In July 2006, Financial Accounting Standards Board Interpretation No. 48, Accounting for Uncertainty in Income Taxes - an interpretation of FASB Statement 109 (FIN 48), was issued and is effective on the last business day of the semiannual reporting period for fiscal years beginning after December 15, 2006.
Annual Report
Notes to Financial Statements - continued
2. Significant Accounting Policies - continued
New Accounting Pronouncements - continued
FIN 48 sets forth a threshold for financial statement recognition, measurement and disclosure of a tax position taken or expected to be taken on a tax return. Management has concluded that the adoption of FIN 48 will not result in a material impact on the Fund's net assets, results of operations and financial statement disclosures.
In addition, in September 2006, Statement of Financial Accounting Standards No. 157, Fair Value Measurements (SFAS 157), was issued and is effective for fiscal years beginning after November 15, 2007. SFAS 157 defines fair value, establishes a framework for measuring fair value and expands disclosures about fair value measurements. Management is currently evaluating the impact the adoption of SFAS 157 will have on the Fund's financial statement disclosures.
3. Operating Policies.
Repurchase Agreements. Fidelity Management & Research Company (FMR) has received an Exemptive Order from the Securities and Exchange Commission (the SEC) which permits the Fund and other affiliated entities of FMR to transfer uninvested cash balances into joint trading accounts which are then invested in repurchase agreements. The Fund may also invest directly with institutions in repurchase agreements. Repurchase agreements are collateralized by government or non-government securities. Upon settlement date, collateral is held in segregated accounts with custodian banks and may be obtained in the event of a default of the counterparty. The Fund monitors, on a daily basis, the value of the collateral to ensure it is at least equal to the principal amount of the repurchase agreement (including accrued interest). In the event of a default by the counterparty, realization of the collateral proceeds could be delayed, during which time the value of the collateral may decline.
Delayed Delivery Transactions and When-Issued Securities. The Fund may purchase or sell securities on a delayed delivery or when-issued basis. Payment and delivery may take place after the customary settlement period for that security. The price of the underlying securities and the date when the securities will be delivered and paid for are fixed at the time the transaction is negotiated. During the time a delayed delivery sell is outstanding, the contract is marked-to-market daily and equivalent deliverable securities are held for the transaction. The value of the securities purchased on a delayed delivery or when-issued basis are identified as such in the Fund's Schedule of Investments. The Fund may receive compensation for interest forgone in the purchase of a delayed delivery or when-issued security. With respect to purchase commitments, the Fund identifies securities as segregated in its records with a value at least equal to the amount of the commitment. The payables and receivables associated with the purchases
Annual Report
3. Operating Policies - continued
Delayed Delivery Transactions and When-Issued Securities - continued
and sales of delayed delivery securities having the same coupon, settlement date and broker are offset. Delayed delivery or when-issued securities that have been purchased from and sold to different brokers are reflected as both payables and receivables in the fund's Statement of Assets and Liabilities under the caption "Delayed delivery." Losses may arise due to changes in the value of the underlying securities or if the counterparty does not perform under the contract's terms, or if the issuer does not issue the securities due to political, economic, or other factors.
Swap Agreements. The Fund may invest in swaps for the purpose of managing its exposure to interest rate, credit or market risk. Interest rate swaps are agreements to exchange cash flows periodically based on a notional principal amount, for example, the exchange of fixed rate interest payments for floating rate interest payments. The primary risk associated with interest rate swaps is that unfavorable changes in the fluctuation of interest rates could adversely impact a fund.
Swaps are marked-to-market daily based on dealer-supplied valuations and changes in value are recorded as unrealized appreciation (depreciation). Gains or losses are realized upon early termination of the swap agreement. Collateral, in the form of cash or securities, may be required to be held in segregated accounts with a fund's custodian in compliance with swap contracts. Risks may exceed amounts recognized on the Statement of Assets and Liabilities. These risks include changes in the returns of the underlying instruments, failure of the counterparties to perform under the contracts' terms and the possible lack of liquidity with respect to the swap agreements. Details of swap agreements open at period end are included in the Fund's Schedule of Investments under the caption "Swap Agreements."
Mortgage Dollar Rolls. To earn additional income, the Fund may employ trading strategies which involve the sale and simultaneous agreement to repurchase similar securities ("mortgage dollar rolls") or the purchase and simultaneous agreement to sell similar securities ("reverse mortgage dollar rolls"). The securities traded are mortgage securities and bear the same interest rate but may be collateralized by different pools of mortgages. During the period between the sale and repurchase in a mortgage dollar roll transaction, a fund will not be entitled to receive interest and principal payments on the securities sold but will invest the proceeds of the sale in other securities which may enhance the yield and total return. In addition, the difference between the sale price and the future purchase price is recorded as an adjustment to investment income. During the period between the purchase and subsequent sale in a reverse mortgage dollar roll transaction a fund is entitled to interest and principal payments on the securities purchased. The price differential between the purchase and sale is recorded as an
Annual Report
Notes to Financial Statements - continued
3. Operating Policies - continued
Mortgage Dollar Rolls - continued
adjustment to investment income. Losses may arise due to changes in the value of the securities or if the counterparty does not perform under the terms of the agreement. If the counterparty files for bankruptcy or becomes insolvent, a fund's right to repurchase or sell securities may be limited.
4. Fees and Other Transactions with Affiliates.
Management Fee. FMR and its affiliates provide the Fund with investment management related services for which the Fund pays a monthly management fee that is based on an annual rate of .45% of the Fund's average net assets. FMR pays all other expenses, except the compensation of the independent Trustees and certain exceptions such as interest expense, including commitment fees. The management fee paid to FMR by the Fund is reduced by an amount equal to the fees and expenses paid by the Fund to the independent Trustees.
5. Committed Line of Credit.
The Fund participates with other funds managed by FMR in a $4.2 billion credit facility (the "line of credit") to be utilized for temporary or emergency purposes to fund shareholder redemptions or for other short-term liquidity purposes. The Fund has agreed to pay commitment fees on its pro rata portion of the line of credit, which amounted to $723 and is reflected in Miscellaneous Expense on the Statement of Operations. During the period, there were no borrowings on this line of credit.
6. Security Lending.
The Fund lends portfolio securities from time to time in order to earn additional income. On the settlement date of the loan, the Fund receives collateral (in the form of U.S. Treasury obligations, letters of credit and/or cash) against the loaned securities and maintains collateral in an amount not less than 100% of the market value of the loaned securities during the period of the loan. The market value of the loaned securities is determined at the close of business of the Fund and any additional required collateral is delivered to the Fund on the next business day. If the borrower defaults on its obligation to return the securities loaned because of insolvency or other reasons, a fund could experience delays and costs in recovering the securities loaned or in gaining access to the collateral. Any cash collateral received is invested in cash equivalents. The value of loaned securities and cash collateral at period end are disclosed on the Fund's Statement of Assets and Liabilities. Security lending income represents the income earned on investing cash collateral, less fees and expenses associated with the loan, plus any
Annual Report
6. Security Lending - continued
premium payments that may be received on the loan of certain types of securities. Security lending income is presented in the Statement of Operations as a component of interest income. Net income from lending portfolio securities during the period amounted to $9,106.
7. Expense Reductions.
Through arrangements with the Fund's custodian and transfer agent, credits realized as a result of uninvested cash balances were used to reduce the Fund's management fee. During the period, these credits reduced the Fund's management fee by $50,744.
8. Other.
The Fund's organizational documents provide former and current trustees and officers with a limited indemnification against liabilities arising in connection with the performance of their duties to the Fund. In the normal course of business, the Fund may also enter into contracts that provide general indemnifications. The Fund's maximum exposure under these arrangements is unknown as this would be dependent on future claims that may be made against the Fund. The risk of material loss from such claims is considered remote.
Annual Report
Report of Independent Registered Public Accounting Firm
To the Trustees of Fidelity Advisor Series IV and the Shareholders of Fidelity Institutional Short-Intermediate Government Fund:
In our opinion, the accompanying statement of assets and liabilities, including the schedule of investments, and the related statements of operations and of changes in net assets and the financial highlights present fairly, in all material respects, the financial position of Fidelity Institutional Short-Intermediate Government Fund (a fund of Fidelity Advisor Series IV) at November 30, 2007, the results of its operations for the year then ended, the changes in its net assets for each of the two years in the period then ended and the financial highlights for each of the five years in the period then ended, in conformity with accounting principles generally accepted in the United States of America. These financial statements and financial highlights (hereafter referred to as "financial statements") are the responsibility of the Fidelity Institutional Short-Intermediate Government Fund's management. Our responsibility is to express an opinion on these financial statements based on our audits. We conducted our audits of these financial statements in accordance with the standards of the Public Company Accounting Oversight Board (United States). Those standards require that we plan and perform the audit to obtain reasonable assurance about whether the financial statements are free of material misstatement. An audit includes examining, on a test basis, evidence supporting the amounts and disclosures in the financial statements, assessing the accounting principles used and significant estimates made by management, and evaluating the overall financial statement presentation. We believe that our audits, which included confirmation of securities at November 30, 2007 by correspondence with the custodian and brokers, provide a reasonable basis for our opinion.
/s/ PricewaterhouseCoopers LLP
PricewaterhouseCoopers LLP
Boston, Massachusetts
January 17, 2008
Annual Report
Trustees and Officers
The Trustees, Members of the Advisory Board, and executive officers of the trust and fund, as applicable, are listed below. The Board of Trustees governs the fund and is responsible for protecting the interests of shareholders. The Trustees are experienced executives who meet periodically throughout the year to oversee the fund's activities, review contractual arrangements with companies that provide services to the fund, and review the fund's performance. Except for James C. Curvey, each of the Trustees oversees 373 funds advised by FMR or an affiliate. Mr. Curvey oversees 368 funds advised by FMR or an affiliate.
The Trustees hold office without limit in time except that (a) any Trustee may resign; (b) any Trustee may be removed by written instrument, signed by at least two-thirds of the number of Trustees prior to such removal; (c) any Trustee who requests to be retired or who has become incapacitated by illness or injury may be retired by written instrument signed by a majority of the other Trustees; and (d) any Trustee may be removed at any special meeting of shareholders by a two-thirds vote of the outstanding voting securities of the trust. Each Trustee who is not an interested person (as defined in the 1940 Act) (Independent Trustee), shall retire not later than the last day of the calendar year in which his or her 72nd birthday occurs. The Independent Trustees may waive this mandatory retirement age policy with respect to individual Trustees. The executive officers and Advisory Board Members hold office without limit in time, except that any officer and Advisory Board Member may resign or may be removed by a vote of a majority of the Trustees at any regular meeting or any special meeting of the Trustees. Except as indicated, each individual has held the office shown or other offices in the same company for the past five years.
The fund's statement of additional information (SAI) includes more information about the trustees. To request a free copy, call Fidelity at 1-800-544-8544.
Interested Trustees*:
Correspondence intended for each Trustee who is an interested person may be sent to Fidelity Investments, 82 Devonshire Street, Boston, Massachusetts 02109.
Name, Age; Principal Occupation | |
Edward C. Johnson 3d (77) | |
Year of Election or Appointment: 1983 Mr. Johnson is Chairman of the Board of Trustees. Mr. Johnson serves as President (2006-present), Chief Executive Officer, Chairman, and a Director of FMR LLC; Chairman and a Director of FMR; Chairman and a Director of Fidelity Research & Analysis Company (FRAC); Chairman and a Director of Fidelity Investments Money Management, Inc.; and Chairman (2001-present) and a Director of FMR Co., Inc. In addition, Mr. Johnson serves as Chairman and Director of Fidelity International Limited (FIL). | |
James C. Curvey (72) | |
Year of Election or Appointment: 2007 Mr. Curvey also serves as Trustee (2007-present) or Member of the Advisory Board (2007-present) of other investment companies advised by FMR. Mr. Curvey is a Director of FMR and FMR Co., Inc. (2007- | |
* Trustees have been determined to be "Interested Trustees" by virtue of, among other things, their affiliation with the trust or various entities under common control with FMR. FMR Corp. merged with FMR LLC on October 1, 2007. Any references to FMR LLC for prior periods are deemed to be references to the prior entity.
Independent Trustees:
Correspondence intended for each Independent Trustee (that is, the Trustees other than the Interested Trustees) may be sent to Fidelity Investments, P.O. Box 55235, Boston, Massachusetts 02205-5235.
Name, Age; Principal Occupation | |
Dennis J. Dirks (59) | |
Year of Election or Appointment: 2005 Prior to his retirement in May 2003, Mr. Dirks was Chief Operating Officer and a member of the Board of The Depository Trust & Clearing Corporation (DTCC) (1999-2003). He also served as President, Chief Operating Officer, and Board member of The Depository Trust Company (DTC) (1999-2003) and President and Board member of the National Securities Clearing Corporation (NSCC) (1999-2003). In addition, Mr. Dirks served as Chief Executive Officer and Board member of the Government Securities Clearing Corporation (2001-2003) and Chief Executive Officer and Board member of the Mortgage-Backed Securities Clearing Corporation (2001-2003). Mr. Dirks also serves as a Trustee and a member of the Finance Committee of Manhattan College (2005-present) and a Trustee and a member of the Finance Committee of AHRC of Nassau County (2006-present). | |
Albert R. Gamper, Jr. (65) | |
Year of Election or Appointment: 2006 Prior to his retirement in December 2004, Mr. Gamper served as Chairman of the Board of CIT Group Inc. (commercial finance). During his tenure with CIT Group Inc. Mr. Gamper served in numerous senior management positions, including Chairman (1987-1989; 1999-2001; 2002-2004), Chief Executive Officer (1987-2004), and President (1989-2002). He currently serves as a member of the Board of Directors of Public Service Enterprise Group (utilities, 2001-present), Chairman of the Board of Governors, Rutgers University (2004-present), and Chairman of the Board of Saint Barnabas Health Care System. | |
George H. Heilmeier (71) | |
Year of Election or Appointment: 2004 Dr. Heilmeier is Chairman Emeritus of Telcordia Technologies (communication software and systems), where prior to his retirement, he served as company Chairman and Chief Executive Officer. He currently serves on the Boards of Directors of The Mitre Corporation (systems engineering and information technology support for the government), and HRL Laboratories (private research and development, 2004-present). He is Chairman of the General Motors Science & Technology Advisory Board and a Life Fellow of the Institute of Electrical and Electronics Engineers (IEEE). Dr. Heilmeier is a member of the Defense Science Board and the National Security Agency Advisory Board. He is also a member of the National Academy of Engineering, the American Academy of Arts and Sciences, and the Board of Overseers of the School of Engineering and Applied Science of the University of Pennsylvania. Previously, Dr. Heilmeier served as a Director of TRW Inc. (automotive, space, defense, and information technology, 1992-2002), Compaq (1994-2002), Automatic Data Processing, Inc. (ADP) (technology-based business outsourcing, 1995-2002), INET Technologies Inc. (telecommunications network surveillance, 2001-2004), and Teletech Holdings (customer management services). He is the recipient of the 2005 Kyoto Prize in Advanced Technology for his invention of the liquid crystal display, and a member of the Consumer Electronics Hall of Fame. | |
James H. Keyes (67) | |
Year of Election or Appointment: 2007 Prior to his retirement in 2003, Mr. Keyes was Chairman, President, and Chief Executive Officer of Johnson Controls, Inc. (automotive supplier, 1993-2003). He currently serves as a member of the boards of LSI Logic Corporation (semiconductor technologies), Navistar International Corporation (manufacture and sale of trucks, buses, and diesel engines, 2002-present), and Pitney Bowes, Inc. (integrated mail, messaging, and document management solutions). | |
Marie L. Knowles (61) | |
Year of Election or Appointment: 2001 Prior to Ms. Knowles' retirement in June 2000, she served as Executive Vice President and Chief Financial Officer of Atlantic Richfield Company (ARCO) (diversified energy, 1996-2000). From 1993 to 1996, she was a Senior Vice President of ARCO and President of ARCO Transportation Company. She served as a Director of ARCO from 1996 to 1998. She currently serves as a Director of Phelps Dodge Corporation (copper mining and manufacturing) and McKesson Corporation (healthcare service, 2002-present). Ms. Knowles is a Trustee of the Brookings Institution and the Catalina Island Conservancy and also serves as a member of the Advisory Board for the School of Engineering of the University of Southern California. | |
Ned C. Lautenbach (63) | |
Year of Election or Appointment: 2000 Mr. Lautenbach is Chairman of the Independent Trustees (2006-present). Mr. Lautenbach has been a partner of Clayton, Dubilier & Rice, Inc. (private equity investment firm) since September 1998. Previously, Mr. Lautenbach was with the International Business Machines Corporation (IBM) from 1968 until his retirement in 1998. Mr. Lautenbach serves as a Director of Sony Corporation (2006-present) and Eaton Corporation (diversified industrial) as well as the Philharmonic Center for the Arts in Naples, Florida. He also is a member of the Board of Trustees of Fairfield University (2005-present), as well as a member of the Council on Foreign Relations. | |
Cornelia M. Small (63) | |
Year of Election or Appointment: 2005 Ms. Small is a member (2000-present) and Chairperson (2002-present) of the Investment Committee, and a member (2002-present) of the Board of Trustees of Smith College. Previously, she served as Chief Investment Officer (1999-2000), Director of Global Equity Investments (1996-1999), and a member of the Board of Directors of Scudder, Stevens & Clark (1990-1997) and Scudder Kemper Investments (1997-1999). In addition, Ms. Small served as Co-Chair (2000-2003) of the Annual Fund for the Fletcher School of Law and Diplomacy. | |
William S. Stavropoulos (68) | |
Year of Election or Appointment: 2002 Mr. Stavropoulos is Chairman Emeritus of the Board of Directors of The Dow Chemical Company. Since joining The Dow Chemical Company in 1967, Mr. Stavropoulos served in numerous senior management positions, including President (1993-2000; 2002-2003), CEO (1995-2000; 2002-2004), and Chairman of the Executive Committee (2000-2004). Currently, he is a Director of NCR Corporation (data warehousing and technology solutions), Chemical Financial Corporation, Maersk Inc. (industrial conglomerate, 2002-present), Tyco International, Inc. (multinational manufacturing and services, 2007-present), and a member of the Advisory Board for Metalmark Capital (private equity investment firm, 2005-present). He is a special advisor to Clayton, Dubilier & Rice, Inc., a private equity investment firm. He also serves as a member of the Board of Trustees of the American Enterprise Institute for Public Policy Research. In addition, Mr. Stavropoulos is a member of The Business Council, J.P. Morgan International Council and the University of Notre Dame Advisory Council for the College of Science. | |
Kenneth L. Wolfe (68) | |
Year of Election or Appointment: 2005 Mr. Wolfe is Chairman and a Director of Hershey Foods Corporation (2007-present), where prior to his retirement in 2001, he was Chairman and Chief Executive Officer. Mr. Wolfe currently serves as a member of the board of Revlon Inc. (2004-present). Previously, Mr. Wolfe served as a member of the boards of Adelphia Communications Corporation (2003-2006) and Bausch & Lomb, Inc. (1993-2007). | |
Advisory Board Members and Executive Officers**:
Correspondence intended for Mr. Mauriello, Mr. Thomas, Mr. Wiley, Mr. Lacy, and Mr. Arthur Johnson may be sent to Fidelity Investments, P.O. Box 55235, Boston, Massachusetts 02205-5235. Correspondence intended for each executive officer and Mr. Lynch may be sent to Fidelity Investments, 82 Devonshire Street, Boston, Massachusetts 02109.
Name, Age; Principal Occupation | |
Arthur E. Johnson (60) | |
Year of Election or Appointment: 2008 Member of the Advisory Board of Fidelity Advisor Series IV. Mr. Johnson serves as Senior Vice President of Corporate Strategic Development of Lockheed Martin Corporation (defense contractor). In addition, Mr. Johnson serves as a member of the Board of Directors of AGL Resources, Inc. (holding company, 2002-present), and IKON Office Solutions, Inc. (document management systems and services). | |
Alan J. Lacy (54) | |
Year of Election or Appointment: 2008 Member of the Advisory Board of Fidelity Advisor Series IV. Mr. Lacy serves as Senior Adviser (2007-present) of Oak Hill Capital Partners, L.P. (a private equity firm). Mr. Lacy also served as Vice Chairman and Chief Executive Officer of Sears Holdings Corporation and Sears, Roebuck and Co. (retail, 2005-2006; 2000-2005). In addition, Mr. Lacy serves as a member of the Board of Directors of The Western Union Company (global money transfer, 2006-present). Mr. Lacy is a Trustee of the National Parks Conservation Association and The Field Museum of Natural History. | |
Peter S. Lynch (63) | |
Year of Election or Appointment 2003 Member of the Advisory Board of Fidelity Advisor Series IV. Mr. Lynch is Vice Chairman and a Director of FMR, and Vice Chairman (2001- | |
Joseph Mauriello (63) | |
Year of Election or Appointment: 2007 Member of the Advisory Board of Fidelity Advisor Series IV. Prior to his retirement in January 2006, Mr. Mauriello served in numerous senior management positions including Deputy Chairman and Chief Operating Officer (2004-2005), and Vice Chairman of Financial Services (2002-2004) of KPMG LLP US (professional services firm, 1965-2005). Mr. Mauriello currently serves as a member of the Board of Directors of XL Capital Ltd., (global insurance and re-insurance company, 2006-present) and of Arcadia Resources Inc., (health care services and products, 2007-present). He also served as a Director of the Hamilton Funds of the Bank of New York (2006-2007). | |
David M. Thomas (58) | |
Year of Election or Appointment: 2007 Member of the Advisory Board of Fidelity Advisor Series IV. Previously, Mr. Thomas served as Executive Chairman (2005-2006) and Chairman and Chief Executive Officer (2000-2005) of IMS Health, Inc. (pharmaceutical and healthcare information solutions). In addition, Mr. Thomas serves as a member of the Board of Directors of Fortune Brands, Inc. (consumer products holding company), and Interpublic Group of Companies, Inc. (marketing communication, 2004-present). | |
Michael E. Wiley (57) | |
Year of Election or Appointment: 2007 Member of the Advisory Board of Fidelity Advisor Series IV. Mr. Wiley also serves as a member of the Board of Trustees of the University of Tulsa (2000-2006; 2007-present). He serves as a Director of Tesoro Corporation (independent oil refiner and marketer, 2005-present), and a Director of Bill Barrett Corporation (exploration and production company, 2005-present). In addition, he also serves as a Director of Post Oak Bank (privately-held bank, 2004-present). Previously, Mr. Wiley served as a Sr. Energy Advisor of Katzenbach Partners, LLC (consulting firm, 2006-2007), and as an Advisory Director of Riverstone Holdings (private investment firm), and Chairman, President, and CEO of Baker Hughes, Inc. (oilfield services company, 2000-2004), and as Director of Spinnaker Exploration Company (exploration and production company, 2001-2005). | |
Kimberley H. Monasterio (43) | |
Year of Election or Appointment: 2007 President and Treasurer of Institutional Short-Intermediate Government. Ms. Monasterio also serves as President and Treasurer of other Fidelity funds (2007-present) and is an employee of FMR (2004-present). Previously, Ms. Monasterio served as Deputy Treasurer of the Fidelity funds (2004-2006). Before joining Fidelity Investments, Ms. Monasterio served as Treasurer (2000-2004) and Chief Financial Officer (2002-2004) of the Franklin Templeton Funds and Senior Vice President of Franklin Templeton Services, LLC (2000-2004). | |
Boyce I. Greer (51) | |
Year of Election or Appointment: 2006 Vice President of Institutional Short-Intermediate Government. Mr. Greer also serves as Vice President of certain Asset Allocation Funds (2005-present), Fixed-Income Funds (2006-present), and Money Market Funds (2006-present). Mr. Greer is also a Trustee of other investment companies advised by FMR (2003-present). Mr. Greer is an Executive Vice President of FMR (2005-present) and FMR Co., Inc. (2005-present), and Senior Vice President of Fidelity Investments Money Management, Inc. (2006-present). Previously, Mr. Greer served as Vice President of certain Fidelity Equity Funds (2005-2007), a Director and Managing Director of Strategic Advisers, Inc. (2002-2005), and Executive Vice President (2000-2002) and Money Market Group Leader (1997-2002) of the Fidelity Investments Fixed Income Division. Mr. Greer also served as Vice President of Fidelity's Money Market Funds (1997-2002), Senior Vice President of FMR (1997-2002), and Vice President of FIMM (1998-2002). | |
Thomas J. Silvia (46) | |
Year of Election or Appointment: 2005 Vice President of Institutional Short-Intermediate Government. Mr. Silvia also serves as Vice President of Fidelity's Fixed-Income Funds (2005-present) and Senior Vice President and Bond Group Leader of the Fidelity Investments Fixed-Income Division (2005-present). Previously, Mr. Silvia served as Vice President of certain Balanced Funds (2005-2007), certain Asset Allocation Funds (2005-2007), a Director of Fidelity's Taxable Bond portfolio managers (2002-2004) and a portfolio manager in the Bond Group (1997-2004). | |
Eric D. Roiter (59) | |
Year of Election or Appointment: 1998 Secretary of Institutional Short-Intermediate Government. He also serves as Secretary of other Fidelity funds; Vice President, General Counsel, and Secretary of FMR Co., Inc. (2001-present) and FMR; Assistant Secretary of Fidelity Management & Research (U.K.) Inc. (2001-present), Fidelity Research & Analysis Company (2001-present), and Fidelity Investments Money Management, Inc. (2001-present). Mr. Roiter is an Adjunct Member, Faculty of Law, at Boston College Law School (2003-present). Previously, Mr. Roiter served as Vice President and Secretary of Fidelity Distributors Corporation (FDC) (1998-2005). | |
Scott C. Goebel (39) | |
Year of Election or Appointment: 2007 Assistant Secretary of Institutional Short-Intermediate Government. Mr. Goebel also serves as Assistant Secretary of other Fidelity funds (2007-present), and is an employee of FMR. | |
R. Stephen Ganis (41) | |
Year of Election or Appointment: 2006 Anti-Money Laundering (AML) officer of Institutional Short-Intermediate Government. Mr. Ganis also serves as AML officer of other Fidelity funds (2006-present) and FMR LLC (2003-present). Before joining Fidelity Investments, Mr. Ganis practiced law at Goodwin Procter, LLP (2000-2002). | |
Joseph B. Hollis (59) | |
Year of Election or Appointment: 2006 Chief Financial Officer of Institutional Short-Intermediate Government. Mr. Hollis also serves as Chief Financial Officer of other Fidelity funds. Mr. Hollis is President of Fidelity Pricing and Cash Management Services (FPCMS) (2005-present). Mr. Hollis also serves as President and Director of Fidelity Service Company, Inc. (2006-present). Previously, Mr. Hollis served as Senior Vice President of Cash Management Services (1999-2002) and Investment Management Operations (2002-2005). | |
Kenneth A. Rathgeber (60) | |
Year of Election or Appointment: 2004 Chief Compliance Officer of Institutional Short-Intermediate Government. Mr. Rathgeber also serves as Chief Compliance Officer of other Fidelity funds (2004-present) and Executive Vice President of Risk Oversight for Fidelity Investments (2002-present). He is Chief Compliance Officer of FMR (2005-present), FMR Co., Inc. (2005-present), Fidelity Management & Research (U.K.) Inc. (2005-present), Fidelity Research & Analysis Company (2005-present), Fidelity Investments Money Management, Inc. (2005-present), and Strategic Advisers, Inc. (2005-present). Previously, Mr. Rathgeber served as Executive Vice President and Chief Operating Officer for Fidelity Investments Institutional Services Company, Inc. (1998-2002). | |
Bryan A. Mehrmann (46) | |
Year of Election or Appointment: 2005 Deputy Treasurer of Institutional Short-Intermediate Government. Mr. Mehrmann also serves as Deputy Treasurer of other Fidelity funds (2005-present) and is an employee of FMR. Previously, Mr. Mehrmann served as Vice President of Fidelity Investments Institutional Services Group (FIIS)/Fidelity Investments Institutional Operations Corporation, Inc. (FIIOC) Client Services (1998-2004). | |
Kenneth B. Robins (38) | |
Year of Election or Appointment: 2005 Deputy Treasurer of Institutional Short-Intermediate Government. Mr. Robins also serves as Deputy Treasurer of other Fidelity funds (2005-present) and is an employee of FMR (2004-present). Before joining Fidelity Investments, Mr. Robins worked at KPMG LLP, where he was a partner in KPMG's department of professional practice (2002-2004) and a Senior Manager (1999-2000). In addition, Mr. Robins served as Assistant Chief Accountant, United States Securities and Exchange Commission (2000-2002). | |
Robert G. Byrnes (40) | |
Year of Election or Appointment: 2005 Assistant Treasurer of Institutional Short-Intermediate Government. Mr. Byrnes also serves as Assistant Treasurer of other Fidelity funds (2005-present) and is an employee of FMR (2005-present). Previously, Mr. Byrnes served as Vice President of FPCMS (2003-2005). Before joining Fidelity Investments, Mr. Byrnes worked at Deutsche Asset Management where he served as Vice President of the Investment Operations Group (2000-2003). | |
Peter L. Lydecker (53) | |
Year of Election or Appointment: 2004 Assistant Treasurer of Institutional Short-Intermediate Government. Mr. Lydecker also serves as Assistant Treasurer of other Fidelity funds (2004) and is an employee of FMR. | |
Paul M. Murphy (60) | |
Year of Election or Appointment: 2007 Assistant Treasurer of Institutional Short-Intermediate Government. Mr. Murphy also serves as Assistant Treasurer of other Fidelity funds (2007-present) and is an employee of FMR (2007-present). Previously, Mr. Murphy served as Chief Financial Officer of the Fidelity Funds (2005-2006), Vice President and Associate General Counsel of FMR (2007), and Senior Vice President of Fidelity Pricing and Cash Management Services Group (FPCMS) (1994-2007). | |
Gary W. Ryan (49) | |
Year of Election or Appointment: 2005 Assistant Treasurer of Institutional Short-Intermediate Government. Mr. Ryan also serves as Assistant Treasurer of other Fidelity funds (2005-present) and is an employee of FMR (2005-present). Previously, Mr. Ryan served as Vice President of Fund Reporting in FPCMS (1999-2005). | |
** FMR Corp. merged with FMR LLC on October 1, 2007. Any references to FMR LLC for prior periods are deemed to be references to the prior entity.
Annual Report
Distributions
A total of 29.93% of the dividends distributed during the fiscal year was derived from interest on U.S. Government securities which is generally exempt from state income tax.
The fund designates $14,032,507 of distributions paid during the period January 1, 2007 to November 30, 2007, as qualifying to be taxed as interest-related dividends for nonresident alien shareholders.
The fund will notify shareholders in January 2008 of amounts for use in preparing 2007 income tax returns.
Annual Report
Board Approval of Investment Advisory Contracts and Management Fees
Fidelity Institutional Short-Intermediate Government Fund
Each year, typically in June, the Board of Trustees, including the Independent Trustees (together, the Board), votes on the renewal of the management contract and sub-advisory agreements (together, the Advisory Contracts) for the fund. The Board, assisted by the advice of fund counsel and Independent Trustees' counsel, requests and considers a broad range of information throughout the year.
The Board meets regularly each month except August and takes into account throughout the year matters bearing on Advisory Contracts. The Board, acting directly and through its separate committees, considers at each of its meetings factors that are relevant to the annual renewal of the fund's Advisory Contracts, including the services and support provided to the fund and its shareholders. At the time of the renewal, the Board had 12 standing committees, each composed of Independent Trustees with varying backgrounds, to which the Board has assigned specific subject matter responsibilities in order to enhance effective decision-making by the Board. Each committee has adopted a written charter outlining the structure and purposes of the committee. One such committee, the Fixed-Income Contract Committee, meets periodically as needed throughout the year to consider matters specifically related to the annual renewal of Advisory Contracts. The committee requests and receives information on, and makes recommendations to the Independent Trustees concerning, the approval and annual review of the Advisory Contracts.
At its June 2007 meeting, the Board of Trustees, including the Independent Trustees, unanimously determined to renew the Advisory Contracts for the fund. In reaching its determination, the Board considered all factors it believed relevant, including (i) the nature, extent, and quality of the services to be provided to the fund and its shareholders (including the investment performance of the fund); (ii) the competitiveness of the management fee and total expenses of the fund; (iii) the total costs of the services to be provided by and the profits to be realized by the investment adviser and its affiliates from the relationship with the fund; (iv) the extent to which economies of scale would be realized as the fund grows; and (v) whether fee levels reflect these economies of scale, if any, for the benefit of fund shareholders. The Board also approved amendments to the fund's agreements with foreign sub-advisers to clarify that each sub-adviser provides services as an independent contractor.
In determining whether to renew the Advisory Contracts for the fund, the Board ultimately reached a determination, with the assistance of fund counsel and Independent Trustees' counsel, that the renewal of the Advisory Contracts and the compensation to be received by Fidelity under the management contract is consistent with Fidelity's fiduciary duty under applicable law. In addition to evaluating the specific factors noted above, the Board, in reaching its determination, is aware that shareholders in the fund have a broad range of investment choices available to them, including a wide choice among mutual funds offered by competitors to Fidelity, and that the fund's shareholders, with the opportunity to review and weigh the disclosure provided by the fund in its prospectus and other public disclosures, have chosen to invest in this fund, managed by Fidelity.
Annual Report
Nature, Extent, and Quality of Services Provided. The Board considered staffing within the investment adviser, FMR, and the sub-advisers (together, the Investment Advisers), including the background of the fund's portfolio manager and the fund's investment objective and discipline. The Independent Trustees also had discussions with senior management of Fidelity's investment operations and investment groups. The Board considered the structure of the portfolio manager compensation program and whether this structure provides appropriate incentives.
Resources Dedicated to Investment Management and Support Services. The Board reviewed the size, education, and experience of the Investment Advisers' investment staff, their use of technology, and the Investment Advisers' approach to recruiting, training, and retaining portfolio managers and other research, advisory, and management personnel. The Board considered Fidelity's extensive global research capabilities that enable the Investment Advisers to aggregate data from various sources in an effort to produce positive investment results. The Board noted that Fidelity's analysts have access to a variety of technological tools that enable them to perform both fundamental and quantitative analysis and to specialize in various disciplines. The Board also considered that Fidelity's portfolio managers and analysts have access to daily portfolio attribution that allows for monitoring of a fund's portfolio, as well as an electronic communication system that provides immediate real-time access to research concerning issuers and credit enhancers. In addition, the Board considered the trading resources that are an integrated part of the fixed-income portfolio management investment process.
Shareholder and Administrative Services. The Board considered (i) the nature, extent, quality, and cost of advisory, administrative, distribution, and shareholder services performed by the Investment Advisers and their affiliates under the Advisory Contracts and under separate agreements covering transfer agency, pricing and bookkeeping, and securities lending services for the fund; (ii) the nature and extent of the Investment Advisers' supervision of third party service providers, principally custodians and subcustodians; and (iii) the resources devoted to, and the record of compliance with, the fund's compliance policies and procedures.
The Board noted that the growth of fund assets across the complex allows Fidelity to reinvest in the development of services designed to enhance the value or convenience of the Fidelity funds as investment vehicles. These services include 24-hour access to account information and market information through phone representatives and over the Internet, and investor education materials and asset allocation tools.
Annual Report
Board Approval of Investment Advisory Contracts and
Management Fees - continued
Investment in a Large Fund Family. The Board considered the benefits to shareholders of investing in a Fidelity fund, including the benefits of investing in a fund that is part of a large family of funds offering a variety of investment disciplines and providing for a large variety of mutual fund investor services. For example, fund shareholders are offered the privilege of exchanging shares of the fund for shares of other Fidelity funds, as set forth in the fund's prospectus, without paying a sales charge. The Board noted that, since the last Advisory Contract renewals in June 2006, Fidelity has taken a number of actions that benefited particular funds, including (i) dedicating additional resources to investment research and to restructure the investment research teams; (ii) contractually agreeing to reduce the management fee on Fidelity Advisor Floating Rate High Income Fund; (iii) contractually agreeing to reduce the management fees on Fidelity's California, Massachusetts, New Jersey, and New York AMT Tax-Free Money Market Funds, launching new Institutional Classes and Service Classes of these funds, and contractually agreeing to impose expense limitations on these funds; (iv) eliminating the exchange fee on the Fidelity Select Portfolios and reducing the pricing and bookkeeping fee rates for these funds; (v) reducing the maximum transfer agency fee rates on high income funds and certain equity funds; (vi) proposing amended management contracts that, if approved by shareholders, will add a performance adjustment component to the management fees paid by 18 Fidelity Advisor equity funds; (vii) contractually agreeing to reduce fees for Ultra-Short Central Fund and the money market Central Funds; (viii) waiving the Fidelity Advisor funds' contingent deferred sales charge on certain redemptions made through systematic withdrawal programs; and (ix) amending the management contracts for equity and fixed-income funds whose management contracts incorporate a "group fee" structure by adding four new fee "breakpoints" to the group fee rate schedules.
Investment Performance. The Board considered whether the fund has operated within its investment objective, as well as its record of compliance with its investment restrictions. It also reviewed the fund's absolute investment performance, as well as the fund's relative investment performance measured against (i) a broad-based securities market index, and (ii) a peer group of mutual funds deemed appropriate by the Board over multiple periods. The following charts considered by the Board show, over the one-, three-, and five-year periods ended December 31, 2006, the fund's cumulative total returns, the cumulative total returns of a broad-based securities market index ("benchmark"), and a range of cumulative total returns of a peer group of mutual funds identified by Lipper Inc. as having an investment objective similar to that of the fund. The box within each chart shows the 25th percentile return (bottom of box) and the 75th percentile return (top of box) of the peer group. Returns shown above the box are in the first quartile and returns shown below the box are in the fourth quartile. The percentage beaten number noted below each chart corresponds to the percentile box and represents the percentage of funds in the peer group whose performance was equal to or lower than that of the fund.
Annual Report
Fidelity Institutional Short-Intermediate Government Fund
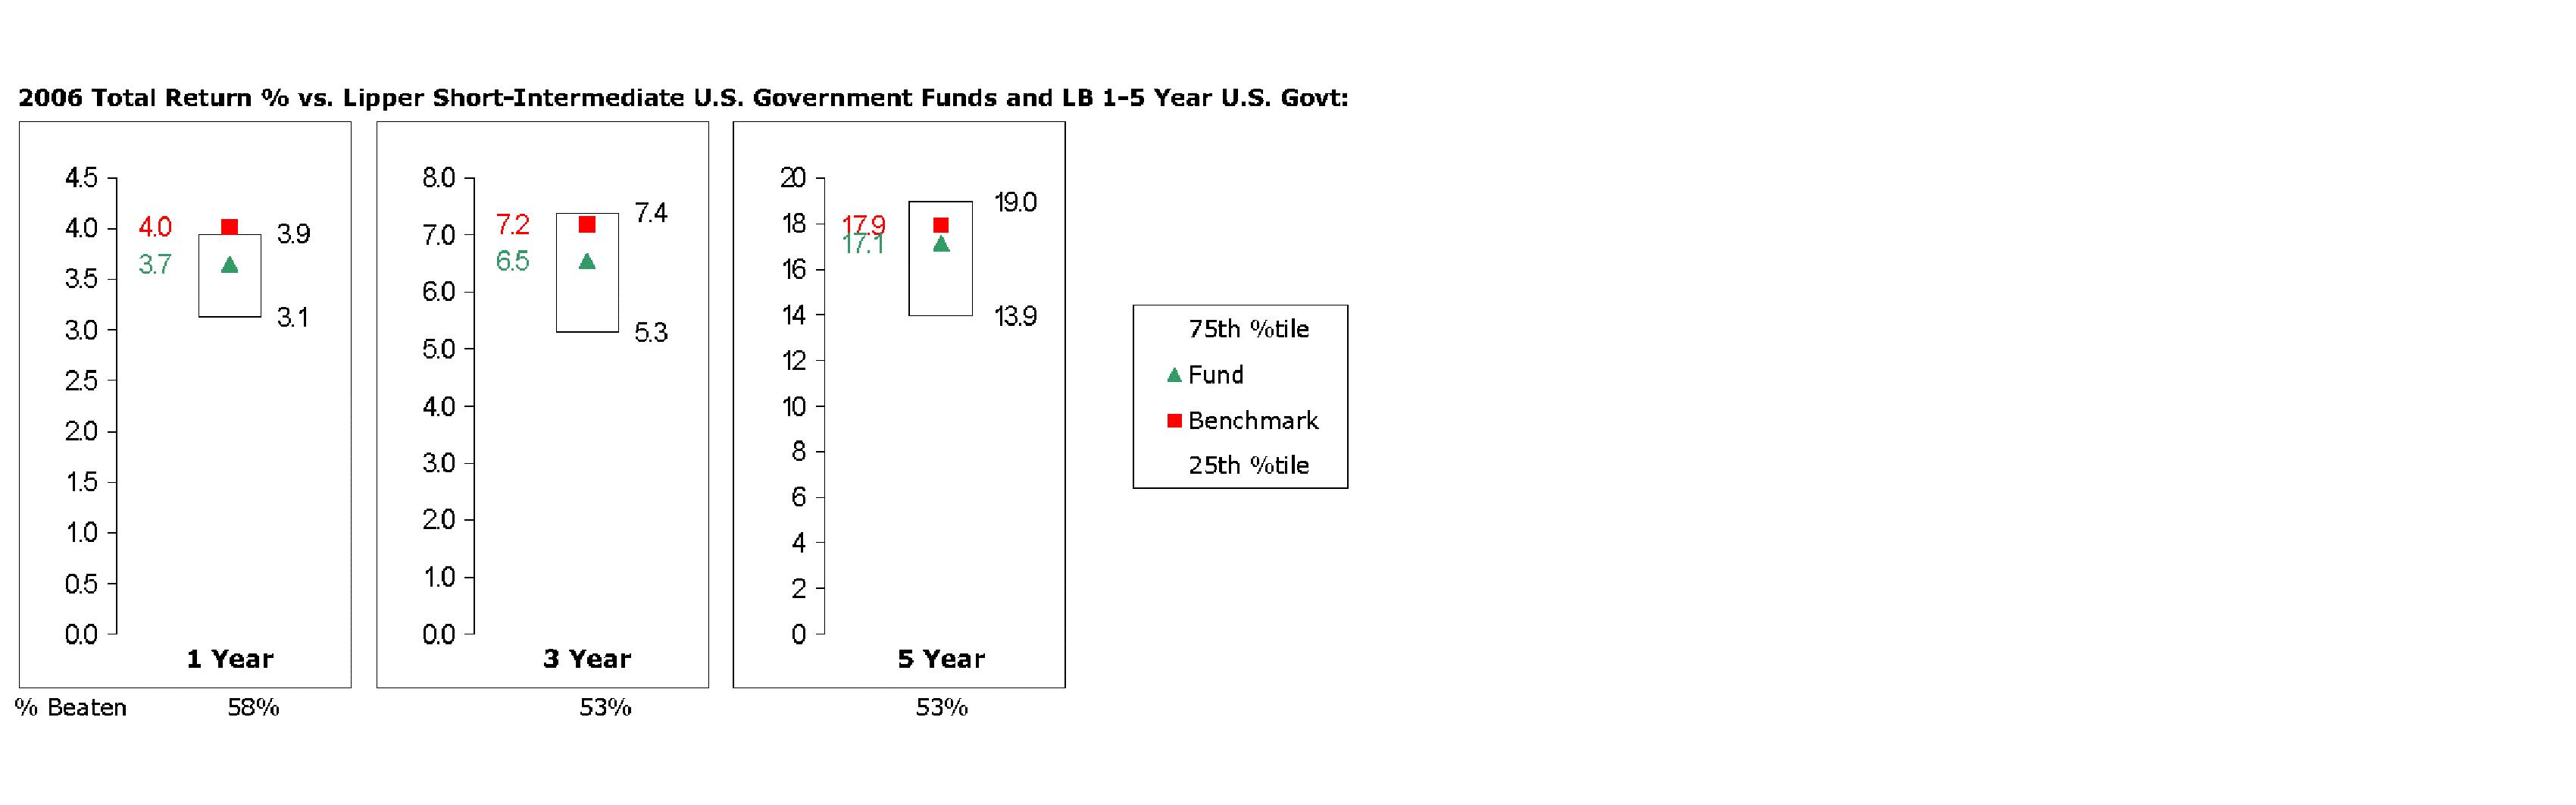
The Board reviewed the fund's relative investment performance against its peer group and stated that the performance of the fund was in the second quartile for all the periods shown. The Board also stated that the relative investment performance of the fund was lower than its benchmark for all the periods shown. The Board discussed with FMR actions to be taken by FMR to improve the fund's below-benchmark performance.
Based on its review, and giving particular weight to the nature and quality of the resources dedicated by the Investment Advisers to maintain and improve relative performance, the Board concluded that the nature, extent, and quality of the services provided to the fund will benefit the fund's shareholders, particularly in light of the Board's view that the fund's shareholders benefit from investing in a fund that is part of a large family of funds offering a variety of investment disciplines and services.
Competitiveness of Management Fee and Total Fund Expenses. The Board considered the fund's management fee and total expenses compared to "mapped groups" of competitive funds and classes. Fidelity creates "mapped groups" by combining similar Lipper investment objective categories that have comparable management fee characteristics. Combining Lipper investment objective categories aids the Board's management fee and total expense comparisons by broadening the competitive group used for comparison and by reducing the number of universes to which various Fidelity funds are compared.
The Board considered two proprietary management fee comparisons for the 12-month periods shown in the chart below. The group of Lipper funds used by the Board for management fee comparisons is referred to below as the "Total Mapped Group" and, for the reasons explained above, is broader than the Lipper peer group used by the Board for performance comparisons. The Total Mapped Group comparison focuses on a fund's standing relative to the total universe of comparable funds available to investors, in terms of gross management fees before expense reimbursements or caps. "TMG %" represents the percentage of funds in the Total Mapped Group that had management fees that were lower than the fund's. For example, a TMG % of 3% means that 97% of the funds in the Total Mapped Group had higher management fees than the fund. The "Asset-Size Peer Group" (ASPG) comparison focuses on a fund's standing relative to non-Fidelity funds similar in size to the fund within the Total Mapped Group. The ASPG represents at least 15% of the funds in the Total Mapped Group with comparable asset size and management fee characteristics, subject to a minimum of 50 funds (or all funds in the Total Mapped Group if fewer than 50). Additional information, such as the ASPG quartile in which the fund's management fee ranked, is also included in the chart and considered by the Board. For a more meaningful comparison of management fees, the fund is compared on the basis of a hypothetical "net management fee," which is derived by subtracting payments made by FMR for non-management expenses (including transfer agent fees, pricing and bookkeeping fees, and custody fees) from the fund's all-inclusive fee. In this regard, the Board realizes that net management fees can vary from year to year because of differences in non-management expenses.
Annual Report
Board Approval of Investment Advisory Contracts and
Management Fees - continued
Fidelity Institutional Short-Intermediate Government Fund

The Board noted that the fund's hypothetical net management fee ranked below the median of its Total Mapped Group and below the median of its ASPG for 2006. Based on its review, the Board concluded that the fund's management fee was fair and reasonable in light of the services that the fund receives and the other factors considered.
Annual Report
In its review of the fund's total expenses, the Board considered the fund's hypothetical net management fee as well as the fund's all-inclusive fee. The Board also considered other expenses, such as transfer agent fees, pricing and bookkeeping fees, and custodial, legal, and audit fees, paid by FMR under the all-inclusive arrangement. The Board also noted the effects of any waivers and reimbursements on fees and expenses. As part of its review, the Board also considered current and historical total expenses of the fund compared to competitive fund median expenses. The fund is compared to those funds and classes in the Total Mapped Group (used by the Board for management fee comparisons) that have a similar sales load structure.
The Board noted that the fund's total expenses ranked below its competitive median for 2006.
In its review of total expenses, the Board also considered Fidelity fee structures and other information on clients that FMR and its affiliates service in other competitive markets, such as other mutual funds advised or subadvised by FMR or its affiliates, pension plan clients, and other institutional clients.
Based on its review, the Board concluded that the fund's total expenses were reasonable in light of the services that the fund and its shareholders receive and the other factors considered.
Costs of the Services and Profitability. The Board considered the revenues earned and the expenses incurred by Fidelity in conducting the business of developing, marketing, distributing, managing, administering and servicing the fund and its shareholders. The Board also considered the level of Fidelity's profits in respect of all the Fidelity funds.
On an annual basis, FMR presents to the Board Fidelity's profitability for the fund. Fidelity calculates the profitability for each fund, as well as aggregate profitability for groups of Fidelity funds and all Fidelity funds, using a series of detailed revenue and cost allocation methodologies which originate with the audited books and records of Fidelity. The Audit Committee of the Board reviews any significant changes from the prior year's methodologies.
PricewaterhouseCoopers LLP (PwC), independent registered public accounting firm and auditor to Fidelity and certain Fidelity funds, has been engaged annually by the Board as part of the Board's assessment of the results of Fidelity's profitability analysis. PwC's engagement includes the review and assessment of Fidelity's methodologies used in determining the revenues and expenses attributable to Fidelity's mutual fund business, and completion of agreed-upon procedures surrounding the mathematical accuracy of fund profitability and its conformity to allocation methodologies. After considering PwC's reports issued under the engagement and information provided by Fidelity, the Board believes that while other allocation methods may also be reasonable, Fidelity's profitability methodologies are reasonable in all material respects.
Annual Report
Board Approval of Investment Advisory Contracts and
Management Fees - continued
The Board has also reviewed Fidelity's non-fund businesses and any fall-out benefits related to the mutual fund business as well as cases where Fidelity's affiliates may benefit from or be related to the fund's business.
The Board considered the costs of the services provided by and the profits realized by Fidelity in connection with the operation of the fund and determined that the amount of profit is a fair entrepreneurial profit for the management of the fund.
Economies of Scale. The Board considered whether there have been economies of scale in respect of the management of the Fidelity funds, whether the Fidelity funds (including the fund) have appropriately benefited from any such economies of scale, and whether there is potential for realization of any further economies of scale. The Board considered the extent to which the fund will benefit from economies of scale through increased services to the fund, through waivers or reimbursements, or through fee or expense reductions. The Board concluded that any potential economies of scale are being shared between fund shareholders and Fidelity in an appropriate manner.
Additional Information Requested by the Board. In order to develop fully the factual basis for consideration of the Fidelity funds' Advisory Contracts, the Board requested and received additional information on several topics, including (i) Fidelity's fund profitability methodology, profitability by investment discipline, and profitability trends within certain funds; (ii) Fidelity's compensation structure relative to competitors and its effect on profitability; (iii) funds and accounts managed by Fidelity other than the Fidelity funds, including fee arrangements; (iv) the total expenses of certain funds and classes relative to competitors; (v) fund performance trends; (vi) fall-out benefits received by certain Fidelity affiliates; and (vii) Fidelity's fee structures.
Based on its evaluation of all of the conclusions noted above, and after considering all material factors, the Board ultimately concluded that the advisory fee structures are fair and reasonable, and that the fund's Advisory Contracts should be renewed.
Annual Report
Annual Report
Annual Report
Annual Report
Annual Report
Annual Report
Investment Adviser
Fidelity Management & Research Company
Boston, MA
Investment Sub-Advisers
Fidelity Investments Money
Management, Inc.
Fidelity International Investment
Advisors
Fidelity International Investment
Advisors (U.K.) Limited
Fidelity Research & Analysis Company
General Distributor
Fidelity Distributors Corporation
Boston, MA
Transfer and Service Agents
Fidelity Investments Institutional Operations Company, Inc.
Boston, MA
Fidelity Service Company, Inc.
Boston, MA
Custodian
The Bank of New York
New York, NY
ISIG-UANN-0108
1.786710.104
(Fidelity Investment logo)(registered trademark)
Corporate Headquarters
82 Devonshire St., Boston, MA 02109
www.fidelity.com
Item 2. Code of Ethics
As of the end of the period, November 30, 2007, Fidelity Advisor Series IV (the trust) has adopted a code of ethics, as defined in Item 2 of Form N-CSR, that applies to its President and Treasurer and its Chief Financial Officer. A copy of the code of ethics is filed as an exhibit to this Form N-CSR.
Item 3. Audit Committee Financial Expert
The Board of Trustees of the trust has determined that Marie L. Knowles is an audit committee financial expert, as defined in Item 3 of Form N-CSR. Ms. Knowles is independent for purposes of Item 3 of Form N-CSR.
Item 4. Principal Accountant Fees and Services
(a) Audit Fees.
For the fiscal years ended November 30, 2007 and November 30, 2006, the aggregate Audit Fees billed by PricewaterhouseCoopers LLP (PwC) for professional services rendered for the audits of the financial statements, or services that are normally provided in connection with statutory and regulatory filings or engagements for those fiscal years, for the Fidelity Institutional Short-Intermediate Government Fund (the fund) and for all funds in the Fidelity Group of Funds are shown in the table below.
Fund | 2007A | 2006A |
Fidelity Institutional Short-Intermediate Government Fund | $46,000 | $44,000 |
All funds in the Fidelity Group of Funds audited by PwC | $14,400,000 | $13,500,000 |
A | Aggregate amounts may reflect rounding. |
(b) Audit-Related Fees.
In each of the fiscal years ended November 30, 2007 and November 30, 2006, the aggregate Audit-Related Fees billed by PwC for services rendered for assurance and related services to the fund that are reasonably related to the performance of the audit or review of the fund's financial statements, but not reported as Audit Fees, are shown in the table below.
Fund | 2007A | 2006A |
Fidelity Institutional Short-Intermediate Government Fund | $0 | $0 |
A | Aggregate amounts may reflect rounding. |
In each of the fiscal years ended November 30, 2007 and November 30, 2006, the aggregate Audit-Related Fees that were billed by PwC that were required to be approved by the Audit Committee for services rendered on behalf of Fidelity Management & Research Company (FMR) and entities controlling, controlled by, or under common control with FMR (not including any sub-adviser whose role is primarily portfolio management and is subcontracted with or overseen by another investment adviser) that provide ongoing services to the fund ("Fund Service Providers") for assurance and related services that relate directly to the operations and financial reporting of the fund that are reasonably related to the performance of the audit or review of the fund's financial statements, but not reported as Audit Fees, are shown in the table below.
Billed By | 2007A | 2006A |
PwC | $0 | $0 |
A | Aggregate amounts may reflect rounding. |
Fees included in the audit-related category comprise assurance and related services (e.g., due diligence services) that are traditionally performed by the independent registered public accounting firm. These audit-related services include due diligence related to mergers and acquisitions, accounting consultations and audits in connection with acquisitions, internal control reviews, attest services that are not required by statute or regulation and consultation concerning financial accounting and reporting standards.
(c) Tax Fees.
In each of the fiscal years ended November 30, 2007 and November 30, 2006, the aggregate Tax Fees billed by PwC for professional services rendered for tax compliance, tax advice, and tax planning for the fund is shown in the table below.
Fund | 2007A | 2006A |
Fidelity Institutional Short-Intermediate Government Fund | $2,900 | $2,700 |
A | Aggregate amounts may reflect rounding. |
In each of the fiscal years ended November 30, 2007 and November 30, 2006, the aggregate Tax Fees billed by PwC that were required to be approved by the Audit Committee for professional services rendered on behalf of the Fund Service Providers for tax compliance, tax advice, and tax planning that relate directly to the operations and financial reporting of the fund is shown in the table below.
Billed By | 2007A | 2006A |
PwC | $0 | $0 |
A | Aggregate amounts may reflect rounding. |
Fees included in the Tax Fees category comprise all services performed by professional staff in the independent registered public accounting firm's tax division except those services related to the audit. Typically, this category would include fees for tax compliance, tax planning, and tax advice. Tax compliance, tax advice, and tax planning services include preparation of original and amended tax returns, claims for refund and tax payment-planning services, assistance with tax audits and appeals, tax advice related to mergers and acquisitions and requests for rulings or technical advice from taxing authorities.
(d) All Other Fees.
In each of the fiscal years ended November 30, 2007 and November 30, 2006, the aggregate Other Fees billed by PwC for all other non-audit services rendered to the fund is shown in the table below.
Fund | 2007A | 2006A | |
Fidelity Institutional Short-Intermediate Government Fund | $1,400 | $1,400 | |
A | Aggregate amounts may reflect rounding. |
In each of the fiscal years ended November 30, 2007 and November 30, 2006, the aggregate Other Fees billed by PwC that were required to be approved by the Audit Committee for all other non-audit services rendered on behalf of the Fund Service Providers that relate directly to the operations and financial reporting of the fund is shown in the table below.
Billed By | 2007A | 2006A |
PwC | $150,000 | $145,000 |
A | Aggregate amounts may reflect rounding. |
Fees included in the All Other Fees category include services related to internal control reviews, strategy and other consulting, financial information systems design and implementation, consulting on other information systems, and other tax services unrelated to the fund.
(e) (1) | Audit Committee Pre-Approval Policies and Procedures: |
The trust's Audit Committee must pre-approve all audit and non-audit services provided by the independent registered public accounting firm relating to the operations or financial reporting of the fund. Prior to the commencement of any audit or non-audit services to a fund, the Audit Committee reviews the services to determine whether they are appropriate and permissible under applicable law.
The trust's Audit Committee has adopted policies and procedures to, among other purposes, provide a framework for the Committee's consideration of non-audit services by the audit firms that audit the Fidelity funds. The policies and procedures require that any non-audit service provided by a fund audit firm to a Fidelity Fund and any non-audit service provided by a fund auditor to a Fund Service Provider that relates directly to the operations and financial reporting of a Fidelity fund (Covered Service) are subject to approval by the Audit Committee before such service is provided. Non-audit services provided by a fund audit firm for a Fund Service Provider that do not relate directly to the operations and financial reporting of a Fidelity fund (Non-Covered Service) but that are expected to exceed $50,000 are also subject to pre-approval by the Audit Committee.
All Covered Services, as well as Non-Covered Services that are expected to exceed $50,000, must be approved in advance of provision of the service either: (i) by formal resolution of the Audit Committee, or (ii) by oral or written approval of the service by the Chair of the Audit Committee (or if the Chair is unavailable, such other member of the Audit Committee as may be designated by the Chair to act in the Chair's absence). The approval contemplated by (ii) above is permitted where the Treasurer determines that action on such an engagement is necessary before the next meeting of the Audit Committee. Neither pre-approval nor advance notice of Non-Covered Service engagements for which fees are not expected to exceed $50,000 is required; such engagements are to be reported to the Audit Committee monthly.
(e) (2) | Services approved pursuant to paragraph (c)(7)(i)(C) of Rule 2-01 of Regulation S-X: |
Audit-Related Fees:
There were no amounts that were approved by the Audit Committee pursuant to the de minimis exception for the fiscal years ended November 30, 2007 and November 30, 2006 on behalf of the fund.
There were no amounts that were required to be approved by the Audit Committee pursuant to the de minimis exception for the fiscal years ended November 30, 2007 and November 30, 2006 on behalf of the Fund Service Providers that relate directly to the operations and financial reporting of the fund.
Tax Fees:
There were no amounts that were approved by the Audit Committee pursuant to the de minimis exception for the fiscal years ended November 30, 2007 and November 30, 2006 on behalf of the fund.
There were no amounts that were required to be approved by the Audit Committee pursuant to the de minimis exception for the fiscal years ended November 30, 2007 and November 30, 2006 on behalf of the Fund Service Providers that relate directly to the operations and financial reporting of the fund.
All Other Fees:
There were no amounts that were approved by the Audit Committee pursuant to the de minimis exception for the fiscal years ended November 30, 2007 and November 30, 2006 on behalf of the fund.
There were no amounts that were required to be approved by the Audit Committee pursuant to the de minimis exception for the fiscal years ended November 30, 2007 and November 30, 2006 on behalf of the Fund Service Providers that relate directly to the operations and financial reporting of the fund.
(f) Not applicable.
(g) For the fiscal years ended November 30, 2007 and November 30, 2006, the aggregate fees billed by PwC of $1,465,000A and $1,290,000A for non-audit services rendered on behalf of the fund, FMR (not including any sub-adviser whose role is primarily portfolio management and is subcontracted with or overseen by another investment adviser) and Fund Service Providers relating to Covered Services and Non-Covered Services are shown in the table below.
2007A | 2006A | |
Covered Services | $155,000 | $150,000 |
Non-Covered Services | $1,310,000 | $1,140,000 |
A | Aggregate amounts may reflect rounding. |
(h) The trust's Audit Committee has considered Non-Covered Services that were not pre-approved that were provided by PwC to Fund Service Providers to be compatible with maintaining the independence of PwC in its audit of the fund, taking into account representations from PwC, in accordance with Independence Standards Board Standard No.1, regarding its independence from the fund and its related entities.
Item 5. Audit Committee of Listed Registrants
Not applicable.
Item 6. Schedule of Investments
Not applicable.
Item 7. Disclosure of Proxy Voting Policies and Procedures for Closed-End Management Investment Companies
Not applicable.
Item 8. Portfolio Managers of Closed-End Management Investment Companies
Not applicable.
Item 9. Purchase of Equity Securities by Closed-End Management Investment Company and Affiliated Purchasers
Not applicable.
Item 10. Submission of Matters to a Vote of Security Holders
There were no material changes to the procedures by which shareholders may recommend nominees to the trust's Board of Trustees.
Item 11. Controls and Procedures
(a)(i) The President and Treasurer and the Chief Financial Officer have concluded that the trust's disclosure controls and procedures (as defined in Rule 30a-3(c) under the Investment Company Act) provide reasonable assurances that material information relating to the trust is made known to them by the appropriate persons, based on their evaluation of these controls and procedures as of a date within 90 days of the filing date of this report.
(a)(ii) There was no change in the trust's internal control over financial reporting (as defined in Rule 30a-3(d) under the Investment Company Act) that occurred during the second fiscal quarter of the period covered by this report that has materially affected, or is reasonably likely to materially affect, the trust's internal control over financial reporting.
Item 12. Exhibits
(a) | (1) | Code of Ethics pursuant to Item 2 of Form N-CSR is filed and attached hereto as EX-99.CODE ETH. |
(a) | (2) | Certification pursuant to Rule 30a-2(a) under the Investment Company Act of 1940 (17 CFR 270.30a-2(a)) is filed and attached hereto as Exhibit 99.CERT. |
(a) | (3) | Not applicable. |
(b) | Certification pursuant to Rule 30a-2(b) under the Investment Company Act of 1940 (17 CFR 270.30a-2(b)) is furnished and attached hereto as Exhibit 99.906CERT. |
SIGNATURES
Pursuant to the requirements of the Securities Exchange Act of 1934 and the Investment Company Act of 1940, the registrant has duly caused this report to be signed on its behalf by the undersigned, thereunto duly authorized.
Fidelity Advisor Series IV
By: | /s/Kimberley Monasterio |
Kimberley Monasterio | |
President and Treasurer | |
Date: | January 28, 2008 |
Pursuant to the requirements of the Securities Exchange Act of 1934 and the Investment Company Act of 1940, this report has been signed below by the following persons on behalf of the registrant and in the capacities and on the dates indicated.
By: | /s/Kimberley Monasterio |
Kimberley Monasterio | |
President and Treasurer | |
Date: | January 28, 2008 |
By: | /s/Joseph B. Hollis |
Joseph B. Hollis | |
Chief Financial Officer | |
Date: | January 28, 2008 |