UNITED STATES
SECURITIES AND EXCHANGE COMMISSION
Washington, D.C. 20549
FORM N-CSR
Certified Shareholder Report of
Registered Management Investment Companies
Investment Company Act File Number: 811-03734
EuroPacific Growth Fund
(Exact Name of Registrant as Specified in Charter)
333 South Hope Street
Los Angeles, California 90071
(Address of Principal Executive Offices)
Registrant's telephone number, including area code: (213) 486-9200
Date of fiscal year end: March 31
Date of reporting period: September 30, 2014
Michael W. Stockton
EuroPacific Growth Fund
333 South Hope Street
Los Angeles, California 90071
(Name and Address of Agent for Service)
Copies to:
Mark D. Perlow
K&L Gates LLP
Four Embarcadero Center, Suite 1200
San Francisco, California 94111
(Counsel for the Registrant)
ITEM 1 – Reports to Stockholders

 | EuroPacific Growth Fund®
Semi-annual report
for the six months ended
September 30, 2014 |
EuroPacific Growth Fund seeks to provide long-term growth of capital.
This fund is one of more than 40 offered by one of the nation’s largest mutual fund families, American Funds, from Capital Group. For more than 80 years, Capital has invested with a long-term focus based on thorough research and attention to risk.
Fund results shown in this report, unless otherwise indicated, are for Class A shares at net asset value. If a sales charge (maximum 5.75%) had been deducted, the results would have been lower. Results are for past periods and are not predictive of results for future periods. Current and future results may be lower or higher than those shown. Share prices and returns will vary, so investors may lose money. Investing for short periods makes losses more likely. Investments are not FDIC-insured, nor are they deposits of or guaranteed by a bank or any other entity, so they may lose value. For current information and month-end results, visit americanfunds.com.
Here are the average annual total returns on a $1,000 investment with all distributions reinvested for periods ended September 30, 2014:
| Class A shares | 1 year | | 5 years | | 10 years | |
| | | | | | | |
| Reflecting 5.75% maximum sales charge | 0.49% | | 5.51% | | 7.63% | |
For other share class results, visit americanfunds.com and americanfundsretirement.com.
The total annual fund operating expense ratio was 0.84% for Class A shares as of the prospectus dated August 29, 2014.
Investment results assume all distributions are reinvested and reflect applicable fees and expenses. When applicable, investment results reflect fee waivers, without which results would have been lower. Visit americanfunds.com for more information.
Investing outside the United States may be subject to risks, such as currency fluctuations, periods of illiquidity and price volatility. These risks may be heightened in connection with investments in developing countries. Refer to the fund prospectus and the Risk Factors section of this report for more information on these and other risks associated with investing in the fund.

We are finding
new investment
opportunities while
also intensifying
our analysis of
existing holdings.
Fellow investors:
International markets declined over the six months ended September 30, 2014, amid investor concerns about the slowing pace of worldwide economic growth — particularly the deteriorating outlook for Europe’s economy. Market volatility increased late in the period, exacerbated by worsening geopolitical conflicts in the Middle East and Ukraine. Meanwhile, Japan continued to struggle as it slowly implemented a series of economic reforms.
Against this backdrop, EuroPacific Growth Fund’s return for the first half of its fiscal year was –1.54%, compared with –0.50% for the unmanaged MSCI All Country World ex USA Index, which reflects the returns of more than 40 developed and developing country stock markets, and –2.14% for the Lipper International Funds Average, a peer group measure. As shown in the table below, the fund has outpaced both measures over longer time periods.
Results at a glance
For periods ended September 30, 2014, with all distributions reinvested
| | | Cumulative total returns | | | Average annual total returns |
| | | 6 months | | 1 year | | 5 years | | 10 years | | Lifetime
(since 4/16/84) |
| | | | | | | | | | | |
| EuroPacific Growth Fund (Class A shares) | | | –1.54 | % | | | 6.63 | % | | | 6.76 | % | | | 8.27 | % | | | 11.34 | % |
| MSCI All Country World ex USA Index1,2 | | | –0.50 | | | | 4.77 | | | | 6.03 | | | | 7.06 | | | | — | |
| Lipper International Funds Average | | | –2.14 | | | | 3.92 | | | | 6.53 | | | | 6.25 | | | | 9.07 | |
| MSCI EAFE Index1,3 | | | –2.03 | | | | 4.25 | | | | 6.56 | | | | 6.32 | | | | 8.81 | |
| 1 | The market indexes are unmanaged and, therefore, have no expenses. Investors cannot invest directly in an index. |
| 2 | The index did not exist prior to December 31, 1987. Results reflect dividends gross of withholding taxes through December 31, 2000, and dividends net of withholding taxes thereafter. |
| 3 | This was the fund’s primary benchmark until the fiscal year ended March 31, 2007. Results reflect dividends net of withholding taxes. |
The market environment
European stocks struggled amid heightened concerns about the region’s weak economic recovery, mounting deflationary pressures and a rapidly depreciating euro. The deteriorating conditions prompted the European Central Bank (ECB) to reduce its primary lending rate by 10 basis points effectively to zero, or 0.05%, in September and launch a bond buying program. The ECB also cut its overnight bank deposit rate to –0.2% in an effort to encourage commercial banks to lend their surplus funds to other financial institutions. Despite these measures, officials in a number of large euro-zone countries did not appear to pursue reforms quickly or vigorously enough to help their struggling economies.
The euro tumbled almost 8% against the U.S. dollar as investors speculated the Federal Reserve would raise interest rates in the coming year while the ECB would do the opposite. Euro-zone inflation fell to 0.3% in September — the lowest rate since October 2009 and considerably below the ECB’s official target rate of just under 2%. Meanwhile, GDP growth remained flat in the second quarter, largely due to a decline in Germany’s economic output and harsh austerity measures across the region. National debt as a proportion of GDP remains high in many countries. ECB President Mario Draghi has stated that additional steps will be taken if needed to jump-start Europe’s anemic growth and low inflation levels.
While Japan’s economy experienced a sharp contraction following a nationwide sales tax increase, the country’s weakening yen sent shares of automakers and other exporters higher. Bank of Japan Governor Haruhiko Kuroda reiterated his pledge to maintain the pace of monetary easing after disappointing economic data stoked fears that it would be difficult for the nation to achieve its 2% inflation target by next year. April’s tax increase weighed heavily on the economy. Second-quarter GDP was revised down from an annualized decline of 6.8% to 7.1%, reflecting a large drop in business investment. In light of the disappointing figures, Prime Minister Shinzo Abe has said that he will make a final decision by the end of the year on a second sales tax increase scheduled for October 2015.
Emerging markets remained volatile, prompting mixed results. Russian stocks suffered as the ruble fell amid escalating tensions with Ukraine and increased sanctions from the West. A number of Russian military troops withdrew from Eastern Ukraine following a cease-fire in September, but Russian military support continues there. A primary question moving forward will be how the ongoing Russian effort to influence Ukraine will affect Russia’s relationship with the West — especially Germany. Finding a sustainable settlement to the crisis likely will be difficult and could take years.
Where the fund’s assets are invested
(Percent invested by country)
EuroPacific Growth Fund invests primarily in the stocks of companies based in Europe and the Pacific Basin.1
| | | EuroPacific
Growth Fund | | MSCI
All Country
World ex USA
Index2 |
| Europe | | (9/30/14) | | (3/31/14) | | (9/30/14) |
| Euro zone3 | | | 23.1 | % | | | 25.9 | % | | | 21.6 | % |
| United Kingdom | | | 12.1 | | | | 12.3 | | | | 15.1 | |
| Switzerland | | | 5.3 | | | | 6.2 | | | | 6.5 | |
| Denmark | | | 5.1 | | | | 5.4 | | | | 1.1 | |
| Sweden | | | 1.5 | | | | 1.4 | | | | 2.2 | |
| Russia | | | 1.2 | | | | 1.2 | | | | 1.0 | |
| Other Europe | | | .1 | | | | .4 | | | | 1.4 | |
| | | | 48.4 | | | | 52.8 | | | | 48.9 | |
| | | | | | | | | | | | | |
| Pacific Basin | | | | | | | | | | | | |
| Japan | | | 12.1 | | | | 12.1 | | | | 14.8 | |
| China | | | 5.5 | | | | 4.7 | | | | 4.2 | |
| Hong Kong | | | 4.6 | | | | 4.5 | | | | 2.1 | |
| South Korea | | | 3.0 | | | | 3.9 | | | | 3.3 | |
| Canada | | | 2.5 | | | | 2.3 | | | | 7.6 | |
| Taiwan | | | 1.5 | | | | 1.4 | | | | 2.6 | |
| Australia | | | .5 | | | | 1.0 | | | | 5.3 | |
| Other Pacific Basin | | | 3.9 | | | | 2.4 | | | | 4.5 | |
| | | | 33.6 | | | | 32.3 | | | | 44.4 | |
| | | | | | | | | | | | | |
| Other | | | | | | | | | | | | |
| India | | | 6.8 | | | | 5.1 | | | | 1.5 | |
| South Africa | | | 1.0 | | | | 1.4 | | | | 1.6 | |
| Israel | | | .6 | | | | .7 | | | | .4 | |
| Other countries | | | .3 | | | | 3 | | | | 3.2 | |
| | | | 8.7 | | | | 7.5 | | | | 6.7 | |
| | | | | | | | | | | | | |
| Short-term securities & other assets less liabilities | | | 9.3 | | | | 7.4 | | | | — | |
| | | | | | | | | | | | | |
| Total | | | 100.0 | % | | | 100.0 | % | | | 100.0% | |
| 1 | A country is considered part of the Pacific Basin if any of its borders touches the Pacific Ocean. |
| 2 | Weighted by market capitalization. |
| 3 | Countries using the euro as a common currency: Austria, Belgium, Cyprus, Estonia, Finland, France, Germany, Greece, Ireland, Italy, Latvia, Luxembourg, Malta, the Netherlands, Portugal, Slovakia, Slovenia and Spain. |
Most Asian markets advanced despite concerns about pro-democracy protests in Hong Kong. Investors appeared to take heart from China’s targeted stimulus measures and new reforms regarding state-owned enterprises, but these efforts only partly offset worries about slowing economic growth in China. Indian stocks continued to rise as reform-minded Prime Minister Narendra Modi won the May election. Stocks were also supported by India’s better-than-expected improvement in GDP growth. Several smaller Asian markets rallied, spurred by hopes for political change. Indonesian stocks climbed with the election of Joko Widodo as the country’s president in late July. Despite the challenges they face, we expect both Modi and Widodo will try hard to lead their countries in the right direction.
Inside the portfolio
The fund’s investments in the health care, information technology and consumer staples sectors contributed to returns. Shares of pharmaceutical firms Novo Nordisk, Bayer and Novartis all posted gains and remain three of the fund’s largest holdings. Novo Nordisk continues to provide strong results due to its long-term prospects in the diabetes market. In September the company received regulatory approval in the U.S. for use of a higher dose version of its diabetes drug Victoza to treat obesity. Bayer and Novartis benefited from increased mergers-and-acquisitions activity in the sector, with both companies adding to their portfolio of products. Novartis also had promising news in the development of a treatment for chronic heart failure.
Among the fund’s technology holdings, Chinese internet giant Baidu recorded impressive gains during the period, helped by growth of its mobile platforms in areas such as online chat and video applications. Japan’s Murata Manufacturing also boosted returns, benefiting from strong sales of LTE phones in China and the launch of the iPhone 6, for which it provides components. However, shares of Samsung Electronics tumbled as the company posted its worst quarterly profit in two years amid increased competition for smartphones.
After rallying last year, Japan-based telecommunication services firm SoftBank experienced a drop in quarterly profits due to slowing customer growth. The company was also hurt by the collapse of the proposed merger between its U.S. wireless unit Sprint and T-Mobile US. However, we continue to believe that SoftBank will benefit over the long term from its large stakes in Sprint and Alibaba, the Chinese e-commerce company that recently went public in the U.S.
Investments in the consumer discretionary and industrials sectors also hampered the fund’s returns. Shares of casino operator Sands China declined amid a broader slowdown in the Macau gaming sector. With China’s anti-corruption campaign in full swing, both the luxury and mass-market segments have declined. Meanwhile, cyclical companies exposed to the economic downturn in Europe suffered as well. German automaker Volkswagen and airline-related firms Lufthansa and Airbus saw double-digit losses. Emirates, the largest buyer of Airbus’ superjumbo A380 series, cancelled its multibillion dollar order of A350 airplanes.
Looking ahead
While the global economic picture continues to improve moderately, the outlook remains mixed. Many believe that even with the possibility of additional monetary stimulus, the European economy will not benefit from improved growth prospects. On the other hand, there are some who would point out that the recently completed stress tests on European banks, the commencement of the ECB’s long-term refinancing operation, and the recent decline of the euro and the price of oil might be the winning combination to help Europe’s economy recover. In Japan, further economic reforms will be needed to sustain a long-term recovery. Abe’s pace of reform has disappointed many, but we do not doubt his commitment. Although geopolitical troubles and a potential increase in U.S. interest rates could challenge some developing economies, rising consumer demand should continue to provide long-term investment opportunities for companies with exposure to emerging markets.
The fund’s portfolio managers continue to find attractively valued, well-managed companies experiencing growing consumer and business demand, including those in the automotive and aerospace industries. They also have focused on businesses that stand to benefit from technological innovations in areas such as health care and e-commerce, many of which are disrupting their respective industries in an ever-changing world. We continue to research and identify new investment opportunities in these areas while also intensifying our analysis of the fund’s existing holdings.
As always, we thank you, our fellow investors, for your continued support of EuroPacific Growth Fund.
| Sincerely, | | |
| | | |
 | |  |
| | | |
| Michael Thawley | | Carl Kawaja |
| Vice Chairman of the Board | | President |
| | | |
| November 7, 2014 | | |
For current information about the fund, visit americanfunds.com.
With this report, we bid farewell to Michael Thawley, trustee of EuroPacific Growth Fund for the past two years. After serving nine years with Capital Group as an international adviser — and before that five years as Australia’s ambassador to the U.S. — Michael is returning to his home country to take a senior position in the government. As a skilled and thoughtful analyst of political and economic developments around the world, Michael has been instrumental in helping the fund navigate a challenging but fruitful period in its history. We thank him for his dedication to pursuing EuroPacific Growth Fund’s mission on behalf of investors.
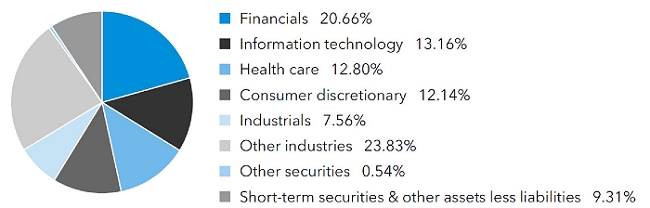
| Summary investment portfolio September 30, 2014 | unaudited |
| Industry sector diversification | Percent of net assets |
| Country diversification by domicile | | Percent of
net assets |
| Euro zone* | | | 23.19 | % |
| Japan | | | 12.09 | |
| United Kingdom | | | 12.06 | |
| India | | | 6.79 | |
| China | | | 5.48 | |
| Switzerland | | | 5.32 | |
| Denmark | | | 5.09 | |
| Hong Kong | | | 4.58 | |
| South Korea | | | 3.04 | |
| Canada | | | 2.52 | |
| Other countries | | | 10.53 | |
| Short-term securities & other assets less liabilities | | | 9.31 | |
| * | Countries using the euro as a common currency; those represented in the fund’s portfolio are Austria, Belgium, Finland, France, Germany, Greece, Ireland, Italy, the Netherlands, Portugal and Spain. |
| Common stocks 90.15% | | Shares | | | Value
(000) | |
| Financials 20.66% | | | | | | |
| Prudential PLC | | | 93,463,984 | | | $ | 2,084,903 | |
| Barclays PLC | | | 538,901,987 | | | | 1,987,096 | |
| HDFC Bank Ltd. | | | 83,160,429 | | | | 1,175,032 | |
| HDFC Bank Ltd. (ADR) | | | 7,852,300 | | | | 365,760 | |
| AIA Group Ltd. | | | 232,909,200 | | | | 1,204,312 | |
| Housing Development Finance Corp. Ltd. | | | 62,275,570 | | | | 1,064,059 | |
| AXA SA | | | 39,998,157 | | | | 985,639 | |
| Commerzbank AG, non-registered shares1 | | | 56,740,233 | | | | 848,523 | |
| Société Générale | | | 15,528,896 | | | | 792,789 | |
| ICICI Bank Ltd. | | | 33,068,399 | | | | 767,571 | |
| Bank of Ireland1,2 | | | 1,901,774,953 | | | | 746,972 | |
| Bankia, SA1 | | | 389,975,203 | | | | 728,001 | |
| Axis Bank Ltd. | | | 116,124,320 | | | | 710,171 | |
| UniCredit SpA | | | 85,957,649 | | | | 679,641 | |
| Fairfax Financial Holdings Ltd.2 | | | 868,291 | | | | 387,439 | |
| Fairfax Financial Holdings Ltd. (CAD denominated)2 | | | 525,000 | | | | 235,225 | |
| ORIX Corp. | | | 44,952,700 | | | | 620,136 | |
| Common stocks (continued) | | Shares | | | Value
(000) | |
| Financials (continued) | | | | | | | | |
| ING Groep NV, depository receipts1 | | | 39,990,000 | | | $ | 571,261 | |
| Brookfield Asset Management Inc., Class A | | | 12,330,000 | | | | 554,357 | |
| Other securities | | | | | | | 8,999,676 | |
| | | | | | | | 25,508,563 | |
| | | | | | | | | |
| Information technology 13.16% | | | | | | | | |
| Murata Manufacturing Co., Ltd.2 | | | 16,016,400 | | | | 1,821,058 | |
| Baidu, Inc., Class A (ADR)1 | | | 7,780,900 | | | | 1,698,026 | |
| Samsung Electronics Co. Ltd. | | | 1,468,900 | | | | 1,648,119 | |
| Samsung Electronics Co. Ltd., nonvoting preferred | | | 48,800 | | | | 41,528 | |
| Tencent Holdings Ltd. | | | 94,946,500 | | | | 1,412,303 | |
| Taiwan Semiconductor Manufacturing Co. Ltd. | | | 302,957,649 | | | | 1,195,119 | |
| Taiwan Semiconductor Manufacturing Co. Ltd. (ADR) | | | 5,822,723 | | | | 117,502 | |
| Nintendo Co., Ltd.2 | | | 10,185,600 | | | | 1,107,948 | |
| Naver Corp. | | | 1,250,006 | | | | 955,939 | |
| ASML Holding NV | | | 8,496,811 | | | | 845,888 | |
| Infineon Technologies AG2 | | | 56,470,947 | | | | 584,371 | |
| ARM Holdings PLC | | | 38,430,700 | | | | 564,456 | |
| Other securities | | | | | | | 4,253,128 | |
| | | | | | | | 16,245,385 | |
| | | | | | | | | |
| Health care 12.80% | | | | | | | | |
| Novo Nordisk A/S, Class B | | | 122,081,900 | | | | 5,841,487 | |
| Bayer AG | | | 20,348,384 | | | | 2,850,244 | |
| Novartis AG | | | 27,121,405 | | | | 2,561,008 | |
| UCB SA2 | | | 10,724,824 | | | | 973,686 | |
| Roche Holding AG | | | 2,623,000 | | | | 777,806 | |
| Teva Pharmaceutical Industries Ltd. (ADR) | | | 12,810,300 | | | | 688,554 | |
| Other securities | | | | | | | 2,107,501 | |
| | | | | | | | 15,800,286 | |
| | | | | | | | | |
| Consumer discretionary 12.14% | | | | | | | | |
| Toyota Motor Corp. | | | 21,518,000 | | | | 1,268,027 | |
| Liberty Global PLC, Class A1 | | | 13,481,000 | | | | 573,482 | |
| Liberty Global PLC, Class C1 | | | 11,364,070 | | | | 466,097 | |
| Volkswagen AG, nonvoting preferred | | | 3,766,362 | | | | 782,068 | |
| Rakuten, Inc. | | | 65,173,300 | | | | 750,525 | |
| Industria de Diseño Textil, SA | | | 24,920,000 | | | | 688,520 | |
| Honda Motor Co., Ltd. | | | 19,113,400 | | | | 662,238 | |
| Naspers Ltd., Class N | | | 5,785,900 | | | | 638,448 | |
| Other securities | | | | | | | 9,166,615 | |
| | | | | | | | 14,996,020 | |
| | | | | | | | | |
| Industrials 7.56% | | | | | | | | |
| Airbus Group NV | | | 15,521,890 | | | | 976,717 | |
| Ryanair Holdings PLC (ADR)1 | | | 16,627,920 | | | | 938,314 | |
| Rolls-Royce Holdings PLC1 | | | 51,682,535 | | | | 808,108 | |
| International Consolidated Airlines Group, SA (CDI)1,2 | | | 116,313,540 | | | | 692,210 | |
| Other securities | | | | | | | 5,913,981 | |
| | | | | | | | 9,329,330 | |
| | | Shares | | | Value
(000) | |
| Consumer staples 7.17% | | | | | | |
| Associated British Foods PLC | | | 38,705,838 | | | $ | 1,681,018 | |
| British American Tobacco PLC | | | 26,840,999 | | | | 1,515,133 | |
| Nestlé SA | | | 15,566,799 | | | | 1,145,457 | |
| Pernod Ricard SA | | | 9,194,053 | | | | 1,040,949 | |
| Alimentation Couche-Tard Inc., Class B | | | 21,626,800 | | | | 691,509 | |
| Other securities | | | | | | | 2,774,260 | |
| | | | | | | | 8,848,326 | |
| | | | | | | | | |
| Telecommunication services 4.11% | | | | | | | | |
| SoftBank Corp. | | | 37,919,600 | | | | 2,658,434 | |
| Other securities | | | | | | | 2,422,984 | |
| | | | | | | | 5,081,418 | |
| | | | | | | | | |
| Materials 3.40% | | | | | | | | |
| Syngenta AG | | | 2,100,315 | | | | 669,452 | |
| First Quantum Minerals Ltd. | | | 29,972,181 | | | | 578,596 | |
| Other securities | | | | | | | 2,950,691 | |
| | | | | | | | 4,198,739 | |
| | | | | | | | | |
| Energy 2.31% | | | | | | | | |
| BG Group PLC | | | 33,293,000 | | | | 615,292 | |
| Other securities | | | | | | | 2,238,374 | |
| | | | | | | | 2,853,666 | |
| | | | | | | | | |
| Utilities 1.91% | | | | | | | | |
| Power Grid Corp. of India Ltd.2 | | | 296,023,422 | | | | 648,270 | |
| Other securities | | | | | | | 1,716,442 | |
| | | | | | | | 2,364,712 | |
| | | | | | | | | |
| Miscellaneous 4.93% | | | | | | | | |
| Other common stocks in initial period of acquisition | | | | | | | 6,084,048 | |
| | | | | | | | | |
| Total common stocks (cost: $76,309,728,000) | | | | | | | 111,310,493 | |
| | | | | | | | | |
| Rights & warrants 0.00% | | | | | | | | |
| Miscellaneous 0.00% | | | | | | | | |
| Other rights & warrants in initial period of acquisition | | | | | | | 712 | |
| | | | | | | | | |
| Total rights & warrants (cost: $0) | | | | | | | 712 | |
| | | | | | | | | |
| Bonds, notes & other debt instruments 0.54% | | Principal amount
(000) | | | | | |
| U.S. Treasury bonds & notes 0.54% | | | | | | | | |
| U.S. Treasury 0.54% | | | | | | | | |
| Other securities | | | | | | | 673,152 | |
| | | | | | | | | |
| Total bonds, notes & other debt instruments (cost: $672,325,000) | | | | | | | 673,152 | |
| Short-term securities 9.19% | | Principal amount
(000) | | | Value
(000) | |
| Fannie Mae 0.05%-0.16% due 10/27/2014-8/3/2015 | | $ | 1,681,870 | | | $ | 1,681,459 | |
| Federal Home Loan Bank 0.04%-0.17% due 10/3/2014-8/3/2015 | | | 2,754,063 | | | | 2,753,710 | |
| Freddie Mac 0.07%-0.16% due 10/1/2014-8/18/2015 | | | 3,990,175 | | | | 3,989,392 | |
| Toyota Motor Credit Corp. 0.16% due 10/30/2014 | | | 25,000 | | | | 24,999 | |
| Other securities | | | | | | | 2,903,832 | |
| | | | | | | | | |
| Total short-term securities (cost: $11,351,849,000) | | | | | | | 11,353,392 | |
| | | | | | | | | |
| Total investment securities 99.88% (cost: $88,333,902,000) | | | | | | | 123,337,749 | |
| Other assets less liabilities 0.12% | | | | | | | 142,135 | |
| | | | | | | | | |
| Net assets 100.00% | | | | | | $ | 123,479,884 | |
This summary investment portfolio is designed to streamline the report and help investors better focus on the fund’s principal holdings. See the inside back cover for details on how to obtain a complete schedule of portfolio holdings.
As permitted by U.S. Securities and Exchange Commission regulations, “Miscellaneous” securities include holdings in their first year of acquisition that have not previously been publicly disclosed.
“Other securities” includes all issues that are not disclosed separately in the summary investment portfolio, including securities which were valued under fair value procedures adopted by authority of the board of trustees. The total value of securities which were valued under fair value procedures was $111,153,000, which represented .09% of the net assets of the fund. Some securities within “Other securities” (with an aggregate value of $2,298,909,000, which represented 1.86% of the net assets of the fund) were acquired in transactions exempt from registration under Rule 144A or section 4(2) of the Securities Act of 1933 and may be resold in the U.S. in transactions exempt from registration, normally to qualified institutional buyers.
Forward currency contracts
The fund has entered into forward currency contracts to sell currencies as shown in the following table. The average notional amount of open forward currency contracts was $2,678,091,000 over the prior 12-month period.
| | | | | | | Contract amount | | | Unrealized
appreciation | |
| | | Settlement date | | Counterparty | | Receive
(000) | | | Deliver
(000) | | | at 9/30/2014
(000) | |
| Sales: | | | | | | | | | | | | | | | | | |
| Australian dollars | | 11/18/2014 | | UBS AG | | | $35,614 | | | | A$39,300 | | | | $ | 1,328 | |
| Euros | | 10/9/2014 | | HSBC Bank | | | $144,762 | | | | €106,365 | | | | | 10,410 | |
| Euros | | 10/20/2014 | | HSBC Bank | | | $64,861 | | | | €50,000 | | | | | 1,700 | |
| Euros | | 10/20/2014 | | UBS AG | | | $38,340 | | | | €29,560 | | | | | 999 | |
| Euros | | 10/27/2014 | | Bank of America, N.A. | | | $191,589 | | | | €149,000 | | | | | 3,359 | |
| Euros | | 10/31/2014 | | Citibank | | | $220,422 | | | | €173,600 | | | | | 1,110 | |
| Euros | | 12/8/2014 | | JPMorgan Chase | | | $143,657 | | | | €110,600 | | | | | 3,894 | |
| Japanese yen | | 10/6/2014 | | Bank of America, N.A. | | | $62,289 | | | | ¥6,545,000 | | | | | 2,610 | |
| Japanese yen | | 10/9/2014 | | JPMorgan Chase | | | $65,508 | | | | ¥6,659,000 | | | | | 4,775 | |
| Japanese yen | | 10/16/2014 | | UBS AG | | | $25,864 | | | | ¥2,750,000 | | | | | 787 | |
| Japanese yen | | 10/20/2014 | | Barclays Bank PLC | | | $308,647 | | | | ¥33,042,500 | | | | | 7,328 | |
| Japanese yen | | 10/21/2014 | | Bank of America, N.A. | | | $152,152 | | | | ¥16,300,000 | | | | | 3,508 | |
| Japanese yen | | 10/23/2014 | | Barclays Bank PLC | | | $391,519 | | | | ¥41,957,500 | | | | | 8,893 | |
| Swiss francs | | 11/14/2014 | | Citibank | | | $125,281 | | | | CHF117,000 | | | | | 2,682 | |
| | | | | | | | | | | | | | | | $ | 53,383 | |
| 10 | EuroPacific Growth Fund |
Investments in affiliates
A company is an affiliate of the fund under the Investment Company Act of 1940 if the fund’s holdings in that company represent 5% or more of the outstanding voting shares. The value of the fund’s affiliated-company holdings is either shown in the summary investment portfolio or included in the value of “Other securities” under the respective industry sectors. Further details on such holdings and related transactions during the six months ended September 30, 2014, appear below.
| | | Beginning
shares or
principal
amount | | | Additions | | | Reductions | | | Ending
shares or
principal
amount | | | Dividend
or interest
income
(000) | | | Value of
affiliates at
9/30/2014
(000) | |
| Murata Manufacturing Co., Ltd. | | | 14,705,400 | | | | 1,311,000 | | | | — | | | | 16,016,400 | | | $ | 10,591 | | | $ | 1,821,058 | |
| Nintendo Co., Ltd. | | | 10,185,600 | | | | — | | | | — | | | | 10,185,600 | | | | — | | | | 1,107,948 | |
| UCB SA | | | 9,315,505 | | | | 2,019,319 | | | | 610,000 | | | | 10,724,824 | | | | 13,589 | | | | 973,686 | |
| Bank of Ireland | | | 1,871,511,153 | | | | 406,763,800 | | | | 376,500,000 | | | | 1,901,774,953 | | | | — | | | | 746,972 | |
| Bank of Ireland 10.24% (undated) | | | €5,190,000 | | | | — | | | | €5,190,000 | | | | — | | | | 122 | | | | — | |
| International Consolidated Airlines Group, SA (CDI)1 | | | 111,313,540 | | | | 5,000,000 | | | | — | | | | 116,313,540 | | | | — | | | | 692,210 | |
| Power Grid Corp. of India Ltd. | | | 296,023,422 | | | | — | | | | — | | | | 296,023,422 | | | | 6,412 | | | | 648,270 | |
| Fairfax Financial Holdings Ltd. | | | 826,291 | | | | 42,000 | | | | — | | | | 868,291 | | | | — | | | | 387,439 | |
| Fairfax Financial Holdings Ltd. (CAD denominated) | | | 525,000 | | | | — | | | | — | | | | 525,000 | | | | — | | | | 235,225 | |
| Infineon Technologies AG | | | 56,470,947 | | | | — | | | | — | | | | 56,470,947 | | | | — | | | | 584,371 | |
| Ctrip.com International, Ltd. (ADR)1 | | | 8,414,000 | | | | — | | | | — | | | | 8,414,000 | | | | — | | | | 477,579 | |
| Gemalto NV | | | 4,804,745 | | | | — | | | | — | | | | 4,804,745 | | | | 2,119 | | | | 441,068 | |
| Chr. Hansen Holding A/S | | | 7,573,000 | | | | 924,492 | | | | — | | | | 8,497,492 | | | | — | | | | 328,449 | |
| China Resources Gas Group Ltd. | | | 91,800,000 | | | | 26,620,000 | | | | — | | | | 118,420,000 | | | | 3,819 | | | | 320,266 | |
| Eurobank Ergasias SA1 | | | — | | | | 800,389,651 | | | | — | | | | 800,389,651 | | | | — | | | | 315,411 | |
| Trend Micro Inc.3 | | | 3,070,000 | | | | 4,092,200 | | | | — | | | | 7,162,200 | | | | — | | | | 242,277 | |
| Paddy Power PLC | | | 3,077,308 | | | | 126,692 | | | | — | | | | 3,204,000 | | | | 2,103 | | | | 231,356 | |
| Fuji Media Holdings, Inc.3 | | | 6,769,000 | | | | 8,585,000 | | | | — | | | | 15,354,000 | | | | 2,301 | | | | 228,333 | |
| Air France-KLM1 | | | 11,477,262 | | | | 8,023,458 | | | | — | | | | 19,500,720 | | | | — | | | | 182,856 | |
| Global Brands Group Holding Ltd.1 | | | — | | | | 510,868,100 | | | | — | | | | 510,868,100 | | | | — | | | | 112,505 | |
| Sysmex Corp.4 | | | 13,183,600 | | | | — | | | | 4,760,000 | | | | 8,423,600 | | | | 1,671 | | | | — | |
| Carnival PLC4 | | | 9,745,000 | | | | — | | | | 1,300,000 | | | | 8,445,000 | | | | 4,548 | | | | — | |
| EuroPacific Growth Fund | 11 |
| | | Beginning
shares or
principal
amount | | | Additions | | | Reductions | | | Ending
shares or
principal
amount | | | Dividend
or interest
income
(000) | | | Value of
affiliates at
9/30/2014
(000) | |
| First Quantum Minerals Ltd.4 | | | 29,232,081 | | | | 740,100 | | | | — | | | | 29,972,181 | | | $ | 3,307 | | | $ | — | |
| Deutsche Lufthansa AG4 | | | 27,172,815 | | | | — | | | | 9,643,340 | | | | 17,529,475 | | | | 14,354 | | | | — | |
| Nokian Renkaat Oyj4 | | | 6,677,000 | | | | — | | | | 796,373 | | | | 5,880,627 | | | | 11,355 | | | | — | |
| NetEase, Inc. (ADR)4 | | | 6,959,167 | | | | — | | | | 3,427,000 | | | | 3,532,167 | | | | 3,489 | | | | — | |
| | | | | | | | | | | | | | | | | | | $ | 79,780 | | | $ | 10,077,279 | |
The following footnotes apply to either the individual securities noted or one or more of the securities aggregated and listed as a single line item.
| 1 | Security did not produce income during the last 12 months. |
| 2 | Represents an affiliated company as defined under the Investment Company Act of 1940. |
| 3 | This security was an unaffiliated issuer in its initial period of acquisition at 3/31/2014; it was not publicly disclosed. |
| 4 | Unaffiliated issuer at 9/30/2014. |
Key to abbreviations and symbols
ADR = American Depositary Receipts
CDI = CREST Depository Interest
A$ = Australian dollars
CAD = Canadian dollars
CHF = Swiss francs
€ = Euros
¥ = Japanese yen
See Notes to Financial Statements
| 12 | EuroPacific Growth Fund |
Financial statements
Statement of assets and liabilities
at September 30, 2014 | unaudited
(dollars in thousands) |
| Assets: | | | | | | | | |
| Investment securities, at value: | | | | | | | | |
| Unaffiliated issuers (cost: $80,251,708) | | $ | 113,260,470 | | | | | |
| Affiliated issuers (cost: $8,082,194) | | | 10,077,279 | | | $ | 123,337,749 | |
| Cash denominated in currencies other than U.S. dollars (cost: $47,754) | | | | | | | 47,735 | |
| Cash | | | | | | | 3,145 | |
| Unrealized appreciation on open forward currency contracts | | | | | | | 53,383 | |
| Receivables for: | | | | | | | | |
| Sales of investments | | | 223,303 | | | | | |
| Sales of fund’s shares | | | 213,573 | | | | | |
| Closed forward currency contracts | | | 14 | | | | | |
| Dividends and interest | | | 209,130 | | | | 646,020 | |
| | | | | | | | 124,088,032 | |
| Liabilities: | | | | | | | | |
| Payables for: | | | | | | | | |
| Purchases of investments | | | 220,711 | | | | | |
| Repurchases of fund’s shares | | | 249,822 | | | | | |
| Investment advisory services | | | 43,411 | | | | | |
| Services provided by related parties | | | 31,502 | | | | | |
| Trustees’ deferred compensation | | | 3,756 | | | | | |
| Other | | | 58,946 | | | | 608,148 | |
| Net assets at September 30, 2014 | | | | | | $ | 123,479,884 | |
| | | | | | | | | |
| Net assets consist of: | | | | | | | | |
| Capital paid in on shares of beneficial interest | | | | | | $ | 90,644,577 | |
| Undistributed net investment income | | | | | | | 1,253,569 | |
| Accumulated net realized loss | | | | | | | (3,418,278 | ) |
| Net unrealized appreciation | | | | | | | 35,000,016 | |
| Net assets at September 30, 2014 | | | | | | $ | 123,479,884 | |
See Notes to Financial Statements
| EuroPacific Growth Fund | 13 |
(dollars and shares in thousands, except per-share amounts)
Shares of beneficial interest issued and outstanding (no stated par value) —
unlimited shares authorized (2,550,462 total shares outstanding)
| | | Net assets | | | Shares
outstanding | | | Net asset value
per share | |
| Class A | | $ | 30,537,140 | | | | 628,190 | | | $ | 48.61 | |
| Class B | | | 186,896 | | | | 3,875 | | | | 48.24 | |
| Class C | | | 1,851,880 | | | | 39,164 | | | | 47.29 | |
| Class F-1 | | | 7,362,927 | | | | 152,344 | | | | 48.33 | |
| Class F-2 | | | 14,049,115 | | | | 289,011 | | | | 48.61 | |
| Class 529-A | | | 1,159,911 | | | | 24,104 | | | | 48.12 | |
| Class 529-B | | | 24,476 | | | | 516 | | | | 47.44 | |
| Class 529-C | | | 365,576 | | | | 7,789 | | | | 46.94 | |
| Class 529-E | | | 61,434 | | | | 1,289 | | | | 47.66 | |
| Class 529-F-1 | | | 90,834 | | | | 1,886 | | | | 48.17 | |
| Class R-1 | | | 288,679 | | | | 6,179 | | | | 46.72 | |
| Class R-2 | | | 1,002,412 | | | | 21,310 | | | | 47.04 | |
| Class R-2E | | | 25 | | | | 1 | | | | 48.61 | |
| Class R-3 | | | 6,714,907 | | | | 141,141 | | | | 47.58 | |
| Class R-4 | | | 13,547,672 | | | | 283,887 | | | | 47.72 | |
| Class R-5 | | | 11,193,944 | | | | 230,200 | | | | 48.63 | |
| Class R-6 | | | 35,042,056 | | | | 719,576 | | | | 48.70 | |
See Notes to Financial Statements
| 14 | EuroPacific Growth Fund |
Statement of operations
for the six months ended September 30, 2014 | unaudited
(dollars in thousands) |
| Investment income: | | | | | | | | |
| Income: | | | | | | | | |
| Dividends (net of non-U.S. taxes of $132,087; also includes $79,658 from affiliates) | | $ | 1,301,743 | | | | | |
| Interest (net of non-U.S. taxes of $6; also includes $122 from affiliates) | | | 13,743 | | | $ | 1,315,486 | |
| Fees and expenses*: | | | | | | | | |
| Investment advisory services | | | 264,480 | | | | | |
| Distribution services | | | 104,027 | | | | | |
| Transfer agent services | | | 51,271 | | | | | |
| Administrative services | | | 25,108 | | | | | |
| Reports to shareholders | | | 2,326 | | | | | |
| Registration statement and prospectus | | | 1,133 | | | | | |
| Trustees’ compensation | | | 251 | | | | | |
| Auditing and legal | | | 89 | | | | | |
| Custodian | | | 10,584 | | | | | |
| Other | | | 966 | | | | 460,235 | |
| Net investment income | | | | | | | 855,251 | |
| | | | | | | | | |
| Net realized gain and unrealized depreciation on investments, forward currency contracts and currency: | | | | | | | | |
| Net realized gain (loss) on: | | | | | | | | |
| Investments (includes $55,825 net gain from affiliates) | | | 3,756,269 | | | | | |
| Forward currency contracts | | | 111,364 | | | | | |
| Currency transactions | | | (6,843 | ) | | | 3,860,790 | |
| Net unrealized (depreciation) appreciation on: | | | | | | | | |
| Investments (net of non-U.S. taxes of $49,356) | | | (6,627,025 | ) | | | | |
| Forward currency contracts | | | 39,668 | | | | | |
| Currency translations | | | (8,946 | ) | | | (6,596,303 | ) |
| Net realized gain and unrealized depreciation on investments, forward currency contracts and currency | | | | | | | (2,735,513 | ) |
| Net decrease in net assets resulting from operations | | | | | | $ | (1,880,262 | ) |
* Additional information related to class-specific fees and expenses is included in the Notes to Financial Statements.
See Notes to Financial Statements
| EuroPacific Growth Fund | 15 |
| Statements of changes in net assets | |
(dollars in thousands)
| | | Six months ended
September 30,
2014* | | | Year ended
March 31,
2014 | |
| | | | | | | |
| Operations: | | | | | | | | |
| Net investment income | | $ | 855,251 | | | $ | 1,831,644 | |
| Net realized gain on investments, forward currency contracts and currency transactions | | | 3,860,790 | | | | 6,602,715 | |
| Net unrealized (depreciation) appreciation on investments, forward currency contracts and currency translations | | | (6,596,303 | ) | | | 10,328,126 | |
| Net (decrease) increase in net assets resulting from operations | | | (1,880,262 | ) | | | 18,762,485 | |
| | | | | | | | | |
| Dividends paid to shareholders from net investment income | | | — | | | | (1,238,841 | ) |
| | | | | | | | | |
| Net capital share transactions | | | 1,171,312 | | | | (851,469 | ) |
| | | | | | | | | |
| Total (decrease) increase in net assets | | | (708,950 | ) | | | 16,672,175 | |
| | | | | | | | | |
| Net assets: | | | | | | | | |
| Beginning of period | | | 124,188,834 | | | | 107,516,659 | |
| End of period (including undistributed net investment income: $1,253,569 and $398,318, respectively) | | $ | 123,479,884 | | | $ | 124,188,834 | |
* Unaudited.
See Notes to Financial Statements
| 16 | EuroPacific Growth Fund |
| Notes to financial statements | unaudited |
1. Organization
EuroPacific Growth Fund (the “fund”) is registered under the Investment Company Act of 1940 as an open-end, diversified management investment company. The fund seeks to provide long-term growth of capital. Shareholders approved a proposal to reorganize the fund from a Massachusetts business trust to a Delaware statutory trust. The reorganization may be completed in the next 12 months; however, the fund reserves the right to delay the implementation.
The fund has 17 share classes consisting of five retail share classes (Classes A, B and C, as well as two F share classes, F-1 and F-2), five 529 college savings plan share classes (Classes 529-A, 529-B, 529-C, 529-E and 529-F-1) and seven retirement plan share classes (Classes R-1, R-2, R-2E, R-3, R-4, R-5 and R-6). The 529 college savings plan share classes can be used to save for college education. The retirement plan share classes are generally offered only through eligible employer-sponsored retirement plans. The fund’s share classes are further described in the following table:
| Share class | | Initial sales
charge | | Contingent deferred sales
charge upon redemption | | Conversion feature |
| Classes A and 529-A | | Up to 5.75% | | None (except 1% for certain redemptions within one year of purchase without an initial sales charge) | | None |
| Classes B and 529-B* | | None | | Declines from 5% to 0% for redemptions within six years of purchase | | Classes B and 529-B convert to Classes A and 529-A, respectively, after eight years |
| Class C | | None | | 1% for redemptions within one year of purchase | | Class C converts to Class F-1 after 10 years |
| Class 529-C | | None | | 1% for redemptions within one year of purchase | | None |
| Class 529-E | | None | | None | | None |
| Classes F-1, | | None | | None | | None |
| F-2 and 529-F-1 | | | | | | |
Classes R-1, R-2, R-2E,
R-3, R-4, R-5 and R-6 | | None | | None | | None |
* Class B and 529-B shares of the fund are not available for purchase.
On August 29, 2014, the fund made an additional retirement plan share class (Class R-2E) available for sale pursuant to an amendment to its registration statement filed with the U.S. Securities and Exchange Commission. Refer to the fund’s prospectus for more details.
Holders of all share classes have equal pro rata rights to the assets, dividends and liquidation proceeds of the fund. Each share class has identical voting rights, except for the exclusive right to vote on matters affecting only its class. Share classes have different fees and expenses (“class-specific fees and expenses”), primarily due to different
| EuroPacific Growth Fund | 17 |
arrangements for distribution, transfer agent and administrative services. Differences in class-specific fees and expenses will result in differences in net investment income and, therefore, the payment of different per-share dividends by each share class.
2. Significant accounting policies
The fund is an investment company that applies the accounting and reporting guidance issued in Topic 946 by the U.S. Financial Accounting Standards Board. The fund’s financial statements have been prepared to comply with U.S. generally accepted accounting principles (“U.S. GAAP”). These principles require the fund’s investment adviser to make estimates and assumptions that affect reported amounts and disclosures. Actual results could differ from those estimates. The fund follows the significant accounting policies described in this section, as well as the valuation policies described in the next section on valuation.
Security transactions and related investment income — Security transactions are recorded by the fund as of the date the trades are executed with brokers. Realized gains and losses from security transactions are determined based on the specific identified cost of the securities. In the event a security is purchased with a delayed payment date, the fund will segregate liquid assets sufficient to meet its payment obligations. Dividend income is recognized on the ex-dividend date and interest income is recognized on an accrual basis. Market discounts, premiums and original issue discounts on fixed-income securities are amortized daily over the expected life of the security.
Class allocations — Income, fees and expenses (other than class-specific fees and expenses) and realized and unrealized gains and losses are allocated daily among the various share classes based on their relative net assets. Class-specific fees and expenses, such as distribution, transfer agent and administrative services, are charged directly to the respective share class.
Dividends and distributions to shareholders — Dividends and distributions to shareholders are recorded on the ex-dividend date.
Currency translation — Assets and liabilities, including investment securities, denominated in currencies other than U.S. dollars are translated into U.S. dollars at the exchange rates supplied by one or more pricing vendors on the valuation date. Purchases and sales of investment securities and income and expenses are translated into U.S. dollars at the exchange rates on the dates of such transactions. The effects of changes in exchange rates on investment securities are included with the net realized gain or loss and net unrealized appreciation or depreciation on investments in the fund’s statement of operations. The realized gain or loss and unrealized appreciation or depreciation resulting from all other transactions denominated in currencies other than U.S. dollars are disclosed separately.
| 18 | EuroPacific Growth Fund |
3. Valuation
Capital Research and Management Company (“CRMC”), the fund’s investment adviser, values the fund’s investments at fair value as defined by U.S. GAAP. The net asset value of each share class of the fund is generally determined as of approximately 4:00 p.m. New York time each day the New York Stock Exchange is open.
Methods and inputs — The fund’s investment adviser uses the following methods and inputs to establish the fair value of the fund’s assets and liabilities. Use of particular methods and inputs may vary over time based on availability and relevance as market and economic conditions evolve.
Equity securities are generally valued at the official closing price of, or the last reported sale price on, the exchange or market on which such securities are traded, as of the close of business on the day the securities are being valued or, lacking any sales, at the last available bid price. Prices for each security are taken from the principal exchange or market on which the security trades.
Fixed-income securities, including short-term securities, are generally valued at prices obtained from one or more pricing vendors. Vendors value such securities based on one or more of the inputs described in the following table. The table provides examples of inputs that are commonly relevant for valuing particular classes of fixed-income securities in which the fund is authorized to invest. However, these classifications are not exclusive, and any of the inputs may be used to value any other class of fixed-income security.
| Fixed-income class | Examples of standard inputs |
| All | Benchmark yields, transactions, bids, offers, quotations from dealers and trading systems, new issues, spreads and other relationships observed in the markets among comparable securities; and proprietary pricing models such as yield measures calculated using factors such as cash flows, financial or collateral performance and other reference data (collectively referred to as “standard inputs”) |
| Corporate bonds & notes; convertible securities | Standard inputs and underlying equity of the issuer |
| Bonds & notes of governments & government agencies | Standard inputs and interest rate volatilities |
When the fund’s investment adviser deems it appropriate to do so (such as when vendor prices are unavailable or deemed to be not representative), fixed-income securities will be valued in good faith at the mean quoted bid and ask prices that are reasonably and timely available (or bid prices, if ask prices are not available) or at prices for securities of comparable maturity, quality and type.
Securities with both fixed-income and equity characteristics, or equity securities traded principally among fixed-income dealers, are generally valued in the manner described for either equity or fixed-income securities, depending on which method is deemed most
| EuroPacific Growth Fund | 19 |
appropriate by the fund’s investment adviser. Forward currency contracts are valued at the mean of representative quoted bid and ask prices, generally based on prices supplied by one or more pricing vendors.
Securities and other assets for which representative market quotations are not readily available or are considered unreliable by the fund’s investment adviser are fair valued as determined in good faith under fair valuation guidelines adopted by authority of the fund’s board of trustees as further described. The investment adviser follows fair valuation guidelines, consistent with U.S. Securities and Exchange Commission rules and guidance, to consider relevant principles and factors when making fair value determinations. The investment adviser considers relevant indications of value that are reasonably and timely available to it in determining the fair value to be assigned to a particular security, such as the type and cost of the security; contractual or legal restrictions on resale of the security; relevant financial or business developments of the issuer; actively traded similar or related securities; conversion or exchange rights on the security; related corporate actions; significant events occurring after the close of trading in the security; and changes in overall market conditions. In addition, the closing prices of equity securities that trade in markets outside U.S. time zones may be adjusted to reflect significant events that occur after the close of local trading but before the net asset value of each share class of the fund is determined. Fair valuations and valuations of investments that are not actively trading involve judgment and may differ materially from valuations that would have been used had greater market activity occurred.
Processes and structure — The fund’s board of trustees has delegated authority to the fund’s investment adviser to make fair value determinations, subject to board oversight. The investment adviser has established a Joint Fair Valuation Committee (the “Fair Valuation Committee”) to administer, implement and oversee the fair valuation process, and to make fair value decisions. The Fair Valuation Committee regularly reviews its own fair value decisions, as well as decisions made under its standing instructions to the investment adviser’s valuation teams. The Fair Valuation Committee reviews changes in fair value measurements from period to period and may, as deemed appropriate, update the fair valuation guidelines to better reflect the results of back testing and address new or evolving issues. The Fair Valuation Committee reports any changes to the fair valuation guidelines to the board of trustees with supplemental information to support the changes. The fund’s board and audit committee also regularly review reports that describe fair value determinations and methods.
The fund’s investment adviser has also established a Fixed-Income Pricing Review Group to administer and oversee the fixed-income valuation process, including the use of fixed-income pricing vendors. This group regularly reviews pricing vendor information and market data. Pricing decisions, processes and controls over security valuation are also subject to additional internal reviews, including an annual control self-evaluation program facilitated by the investment adviser’s compliance group.
| 20 | EuroPacific Growth Fund |
Classifications — The fund’s investment adviser classifies the fund’s assets and liabilities into three levels based on the inputs used to value the assets or liabilities. Level 1 values are based on quoted prices in active markets for identical securities. Level 2 values are based on significant observable market inputs, such as quoted prices for similar securities and quoted prices in inactive markets. Certain securities trading outside the U.S. may transfer between Level 1 and Level 2 due to valuation adjustments resulting from significant market movements following the close of local trading. Level 3 values are based on significant unobservable inputs that reflect the investment adviser’s determination of assumptions that market participants might reasonably use in valuing the securities. The valuation levels are not necessarily an indication of the risk or liquidity associated with the underlying investment. For example, U.S. government securities are reflected as Level 2 because the inputs used to determine fair value may not always be quoted prices in an active market. The following tables present the fund’s valuation levels as of September 30, 2014 (dollars in thousands):
| | | Investment securities | |
| | | Level 1 | | | Level 2* | | | Level 3 | | | Total | |
| Assets: | | | | | | | | | | | | | | | | |
| Common stocks: | | | | | | | | | | | | | | | | |
| Financials | | $ | 25,507,491 | | | $ | — | | | $ | 1,072 | | | $ | 25,508,563 | |
| Information technology | | | 16,245,385 | | | | — | | | | — | | | | 16,245,385 | |
| Health care | | | 15,800,286 | | | | — | | | | — | | | | 15,800,286 | |
| Consumer discretionary | | | 14,996,020 | | | | — | | | | — | | | | 14,996,020 | |
| Industrials | | | 9,329,330 | | | | — | | | | — | | | | 9,329,330 | |
| Consumer staples | | | 8,848,326 | | | | — | | | | — | | | | 8,848,326 | |
| Telecommunication services | | | 5,081,418 | | | | — | | | | — | | | | 5,081,418 | |
| Materials | | | 4,088,658 | | | | 110,081 | | | | — | | | | 4,198,739 | |
| Energy | | | 2,853,666 | | | | — | | | | — | | | | 2,853,666 | |
| Utilities | | | 2,364,712 | | | | — | | | | — | | | | 2,364,712 | |
| Miscellaneous | | | 6,084,048 | | | | — | | | | — | | | | 6,084,048 | |
| Rights & warrants | | | 712 | | | | — | | | | — | | | | 712 | |
| Bonds, notes & other debt instruments | | | — | | | | 673,152 | | | | — | | | | 673,152 | |
| Short-term securities | | | — | | | | 11,353,392 | | | | — | | | | 11,353,392 | |
| Total | | $ | 111,200,052 | | | $ | 12,136,625 | | | $ | 1,072 | | | $ | 123,337,749 | |
| | | Other investments† |
| | | Level 1 | | | Level 2 | | | Level 3 | | | Total | |
| Assets: | | | | | | | | | | | | | | | | |
| Unrealized appreciation on open forward currency contracts | | $ | — | | | $ | 53,383 | | | $ | — | | | $ | 53,383 | |
| * | Securities with a value of $95,561,160,000, which represented 77.39% of the net assets of the fund, transferred from Level 2 to Level 1 since the prior fiscal year-end, primarily due to a lack of significant market movements following the close of local trading. |
| † | Forward currency contracts are not included in the investment portfolio. |
| EuroPacific Growth Fund | 21 |
4. Risk factors
Investing in the fund may involve certain risks including, but not limited to, those described below.
Market conditions — The prices of, and the income generated by, the common stocks and other securities held by the fund may decline — sometimes rapidly or unpredictably — due to various factors, including events or conditions affecting the general economy or particular industries; overall market changes; local, regional or global political, social or economic instability; governmental or governmental agency responses to economic conditions; and currency, interest rate and commodity price fluctuations.
Issuer risks — The values of, and the income generated by, securities held by the fund may also decline in response to various factors directly related to the issuers of such securities, including reduced demand for an issuer’s goods or services, poor management performance and strategic initiatives such as mergers, acquisitions or dispositions and the market response to any such initiative.
Investing in growth-oriented stocks — Growth-oriented common stocks and other equity-type securities (such as preferred stocks, convertible preferred stocks and convertible bonds) may involve larger price swings and greater potential for loss than other types of investments. These risks may be even greater in the case of smaller capitalization stocks.
Investing outside the U.S. — Securities of issuers domiciled outside the U.S., or with significant operations outside the U.S., may lose value because of adverse political, social, economic or market developments in the countries or regions in which the issuers operate. These securities may also lose value due to changes in foreign currency exchange rates against the U.S. dollar and/or currencies of other countries. Securities markets in certain countries may be more volatile and/or less liquid than those in the U.S. Investments outside the U.S. may also be subject to different accounting practices and different regulatory, legal and reporting standards, and may be more difficult to value, than those in the U.S. In addition, the value of investments outside the U.S. may be reduced by foreign taxes, including foreign withholding taxes on interest and dividends. Further, there may be increased risks of delayed settlement of securities purchased or sold by the fund. The risks of investing outside the U.S. may be heightened in connection with investments in emerging markets.
Investing in emerging markets — Investing in emerging markets may involve risks in addition to and greater than those generally associated with investing in the securities markets of developed countries. For instance, developing countries may have less developed legal and accounting systems than those in developed countries. The governments of these countries may be less stable and more likely to impose capital controls, nationalize a company or industry, place restrictions on foreign ownership and on withdrawing sale proceeds of securities from the country, and/or impose punitive taxes that could adversely affect the prices of securities. In addition, the economies of
| 22 | EuroPacific Growth Fund |
these countries may be dependent on relatively few industries that are more susceptible to local and global changes. Securities markets in these countries can also be relatively small and have substantially lower trading volumes. As a result, securities issued in these countries may be more volatile and less liquid, and may be more difficult to value, than securities issued in countries with more developed economies and/or markets. Additionally, there may be increased settlement risks for transactions in local securities.
Management — The investment adviser to the fund actively manages the fund’s investments. Consequently, the fund is subject to the risk that the methods and analyses employed by the investment adviser in this process may not produce the desired results. This could cause the fund to lose value or its investment results to lag relevant benchmarks or other funds with similar objectives.
5. Certain investment techniques
Forward currency contracts — The fund has entered into forward currency contracts, which represent agreements to exchange currencies on specific future dates at predetermined rates. The fund’s investment adviser uses forward currency contracts to manage the fund’s exposure to changes in exchange rates. Upon entering into these contracts, risks may arise from the potential inability of counterparties to meet the terms of their contracts and from possible movements in exchange rates.
On a daily basis, the fund’s investment adviser values forward currency contracts and records unrealized appreciation or depreciation for open forward currency contracts in the fund’s statement of assets and liabilities. Realized gains or losses are recorded at the time the forward currency contract is closed or offset by another contract with the same broker for the same settlement date and currency.
Closed forward currency contracts that have not reached their settlement date are included in the respective receivables or payables for closed forward currency contracts in the fund’s statement of assets and liabilities. Net realized gains or losses from closed forward currency contracts and net unrealized appreciation or depreciation from open forward currency contracts are recorded in the fund’s statement of operations.
| EuroPacific Growth Fund | 23 |
The following tables present the financial statement impacts resulting from the fund’s use of forward currency contracts as of September 30, 2014 (dollars in thousands):
| | | Assets | | Liabilities |
| Contract | | Location on statement of
assets and liabilities | | Value | | Location on statement of
assets and liabilities | | Value |
| Forward currency | | Unrealized appreciation on open forward currency contracts | | $ | 53,383 | | Unrealized depreciation on open forward currency contracts | | $ | — |
| | | | | | | | | | | |
| Forward currency | | Receivables for closed forward currency contracts | | | 14 | | Payables for closed forward currency contracts | | | — |
| | | | | $ | 53,397 | | | | $ | — |
| | | | | | | | | | | |
| | | Net realized gain | | Net unrealized appreciation |
| Contract | | Location on statement of
operations | | Value | | Location on statement of
operations | | Value |
| Forward currency | | Net realized gain on forward currency contracts | | $ | 111,364 | | Net unrealized appreciation on forward currency contracts | | $ | 39,668 |
Collateral — The fund participates in a collateral program due to its use of forward currency contracts. The program calls for the fund to either receive or pledge collateral based on the net gain or loss on unsettled forward currency contracts by counterparty. The purpose of the collateral is to cover potential losses that could occur in the event that either party cannot meet its contractual obligations.
Rights of offset — The fund has entered into enforceable master netting agreements with certain counterparties for forward currency contracts, where amounts payable by each party to the other in the same currency, with the same settlement date and with the same counterparty are settled net of each party’s payment obligation. For financial reporting purposes, the fund does not offset financial assets and financial liabilities that are subject to netting arrangements in the statement of assets and liabilities.
| 24 | EuroPacific Growth Fund |
The following table presents the fund’s forward currency contracts by counterparty, including those that are subject to potential offset on the statement of assets and liabilities as of September 30, 2014 (dollars in thousands):
| | | | | | Gross amounts not offset in the | | | | |
| | | Gross amounts | | | statement of assets and liabilities and | | | | |
| | | recognized in the | | | subject to a master netting agreement | | | | |
| | | statement of assets | | | Available | | | Non-cash | | | Cash | | | Net | |
| Counterparty | | and liabilities | | | to offset | | | collateral* | | | collateral | | | amount | |
| Assets: | | | | | | | | | | | | | | | | | | | | |
| Bank of America, N.A. | | $ | 9,478 | | | $ | — | | | $ | (7,921 | ) | | $ | — | | | $ | 1,557 | |
| Barclays Bank PLC | | | 16,221 | | | | — | | | | (13,794 | ) | | | — | | | | 2,427 | |
| Citibank | | | 3,791 | | | | — | | | | (3,791 | ) | | | — | | | | — | |
| HSBC Bank | | | 12,110 | | | | — | | | | (11,298 | ) | | | — | | | | 812 | |
| JPMorgan Chase | | | 8,683 | | | | — | | | | (7,902 | ) | | | — | | | | 781 | |
| UBS AG | | | 3,114 | | | | — | | | | (2,851 | ) | | | — | | | | 263 | |
| Total | | $ | 53,397 | | | $ | — | | | $ | (47,557 | ) | | $ | — | | | $ | 5,840 | |
* Non-cash collateral is shown on a settlement basis.
6. Taxation and distributions
Federal income taxation — The fund complies with the requirements under Subchapter M of the Internal Revenue Code applicable to mutual funds and intends to distribute substantially all of its net taxable income and net capital gains each year. The fund is not subject to income taxes to the extent such distributions are made. Therefore, no federal income tax provision is required.
As of and during the period ended September 30, 2014, the fund did not have a liability for any unrecognized tax benefits. The fund recognizes interest and penalties, if any, related to unrecognized tax benefits as income tax expense in the statement of operations. During the period, the fund did not incur any interest or penalties.
The fund is not subject to examination by U.S. federal tax authorities for tax years before 2010, by state tax authorities for tax years before 2009 and by tax authorities outside the U.S. for tax years before 2007.
Non-U.S. taxation — Dividend and interest income are recorded net of non-U.S. taxes paid. Gains realized by the fund on the sale of securities in certain countries are subject to non-U.S. taxes. The fund records a liability based on unrealized gains to provide for potential non-U.S. taxes payable upon the sale of these securities.
Distributions — Distributions paid to shareholders are based on net investment income and net realized gains determined on a tax basis, which may differ from net investment income and net realized gains for financial reporting purposes. These differences are due primarily to different treatment for items such as currency gains and losses; short-term capital gains and losses; capital losses related to sales of certain securities within 30 days
| EuroPacific Growth Fund | 25 |
of purchase; unrealized appreciation of certain investments in securities outside the U.S.; and net capital losses. The fiscal year in which amounts are distributed may differ from the year in which the net investment income and net realized gains are recorded by the fund for financial reporting purposes.
The components of distributable earnings on a tax basis are reported as of the fund’s most recent year-end. As of March 31, 2014, the components of distributable earnings on a tax basis were as follows (dollars in thousands):
| Undistributed ordinary income | | $ | 1,029,409 | |
| Capital loss carryforward expiring 2018* | | | (6,846,399 | ) |
| Post-October capital loss deferral† | | | (7,553 | ) |
| * | The capital loss carryforward will be used to offset any capital gains realized by the fund in the current year or in subsequent years through the expiration date. The fund will not make distributions from capital gains while a capital loss carryforward remains. |
| † | This deferral is considered incurred in the subsequent year. |
Under the Regulated Investment Company Modernization Act of 2010 (the “Act”), net capital losses recognized after March 31, 2011, may be carried forward indefinitely, and their character is retained as short-term and/or long-term losses. Previously, net capital losses were carried forward for eight years and treated as short-term losses. As a transition rule, the Act requires that post-enactment net capital losses be used before pre-enactment net capital losses.
As of September 30, 2014, the tax basis unrealized appreciation (depreciation) and cost of investment securities were as follows (dollars in thousands):
| Gross unrealized appreciation on investment securities | | $ | 36,772,768 | |
| Gross unrealized depreciation on investment securities | | | (2,779,720 | ) |
| Net unrealized appreciation on investment securities | | | 33,993,048 | |
| Cost of investment securities | | | 89,344,701 | |
| 26 | EuroPacific Growth Fund |
No distributions were paid to shareholders during the six months ended September 30, 2014. Tax-basis distributions paid to shareholders from ordinary income during the year ended March 31, 2014, were as follows (dollars in thousands):
| Share class | | | |
| Class A | | $ | 299,130 | |
| Class B | | | 199 | |
| Class C | | | 4,118 | |
| Class F-1 | | | 81,016 | |
| Class F-2 | | | 118,419 | |
| Class 529-A | | | 10,359 | |
| Class 529-B | | | — | |
| Class 529-C | | | 758 | |
| Class 529-E | | | 416 | |
| Class 529-F-1 | | | 972 | |
| Class R-1 | | | 556 | |
| Class R-2 | | | 2,853 | |
| Class R-3 | | | 49,012 | |
| Class R-4 | | | 135,957 | |
| Class R-5 | | | 160,460 | |
| Class R-6 | | | 374,616 | |
| Total | | $ | 1,238,841 | |
7. Fees and transactions with related parties
CRMC, the fund’s investment adviser, is the parent company of American Funds Distributors,® Inc. (“AFD”), the principal underwriter of the fund’s shares, and American Funds Service Company® (“AFS”), the fund’s transfer agent. CRMC, AFD and AFS are considered related parties to the fund.
Investment advisory services — The fund has an investment advisory and service agreement with CRMC that provides for monthly fees accrued daily. These fees are based on a series of decreasing annual rates beginning with 0.690% on the first $500 million of daily net assets and decreasing to 0.397% on such assets in excess of $115 billion. For the six months ended September 30, 2014, the investment advisory services fee was $264,480,000, which was equivalent to an annualized rate of 0.419% of average daily net assets.
Class-specific fees and expenses — Expenses that are specific to individual share classes are accrued directly to the respective share class. The principal class-specific fees and expenses are further described below:
Distribution services — The fund has plans of distribution for all share classes, except Class F-2, R-5 and R-6 shares. Under the plans, the board of trustees approves certain categories of expenses that are used to finance activities primarily intended to sell fund shares and service existing accounts. The plans provide for payments, based on an annualized percentage of average daily net assets, ranging from 0.25%
| EuroPacific Growth Fund | 27 |
to 1.00% as noted in this section. In some cases, the board of trustees has limited the amounts that may be paid to less than the maximum allowed by the plans. All share classes with a plan may use up to 0.25% of average daily net assets to pay service fees, or to compensate AFD for paying service fees, to firms that have entered into agreements with AFD to provide certain shareholder services. The remaining amounts available to be paid under each plan are paid to dealers to compensate them for their sales activities.
For Class A and 529-A shares, distribution-related expenses include the reimbursement of dealer and wholesaler commissions paid by AFD for certain shares sold without a sales charge. These share classes reimburse AFD for amounts billed within the prior 15 months but only to the extent that the overall annual expense limit of 0.25% is not exceeded. As of September 30, 2014, there were no unreimbursed expenses subject to reimbursement for Class A or 529-A shares.
| | Share class | | Currently approved limits | | Plan limits |
| | Class A | | | 0.25 | % | | | 0.25 | % |
| | Class 529-A | | | 0.25 | | | | 0.50 | |
| | Classes B and 529-B | | | 1.00 | | | | 1.00 | |
| | Classes C, 529-C and R-1 | | | 1.00 | | | | 1.00 | |
| | Class R-2 | | | 0.75 | | | | 1.00 | |
| | Class R-2E | | | 0.60 | | | | 0.85 | |
| | Classes 529-E and R-3 | | | 0.50 | | | | 0.75 | |
| | Classes F-1, 529-F-1 and R-4 | | | 0.25 | | | | 0.50 | |
Transfer agent services – The fund has a shareholder services agreement with AFS under which the fund compensates AFS for providing transfer agent services to each of the fund’s share classes. These services include recordkeeping, shareholder communications and transaction processing. In addition, the fund reimburses AFS for amounts paid to third parties for performing transfer agent services on behalf of fund shareholders.
Administrative services – The fund has an administrative services agreement with CRMC under which the fund compensates CRMC for providing administrative services to Class A, C, F, 529 and R shares. These services include, but are not limited to, coordinating, monitoring, assisting and overseeing third parties that provide services to fund shareholders. Under the agreement, Class A shares pay an annual fee of 0.01% and Class C, F, 529 and R shares pay an annual fee of 0.05% of their respective average daily net assets.
529 plan services — Each 529 share class is subject to service fees to compensate the Virginia College Savings Plan (“Virginia529”) for its oversight and administration of the 529 college savings plan. The quarterly fee is based on a series of decreasing annual rates beginning with 0.10% on the first $30 billion on the net assets invested in Class 529 shares of the American Funds and decreasing to 0.05% on such assets in excess of $70 billion. The fee for any given calendar quarter is accrued and calculated on the basis of the average net assets of Class 529 shares of the American
| 28 | EuroPacific Growth Fund |
Funds for the last month of the prior calendar quarter. The fee is included in other expenses in the fund’s statement of operations. Virginia529 is not considered a related party to the fund.
For the six months ended September 30, 2014, class-specific expenses under the agreements were as follows (dollars in thousands):
| | | | Distribution | | | Transfer agent | | | Administrative | | | 529 plan |
| | Share class | | services | | | services | | | services | | | services |
| | Class A | | | $ 37,933 | | | | $20,926 | | | | $ 1,604 | | | Not applicable |
| | Class B | | | 1,086 | | | | 126 | | | | Not applicable | | | Not applicable |
| | Class C | | | 9,780 | | | | 1,077 | | | | 491 | | | Not applicable |
| | Class F-1 | | | 10,618 | | | | 5,121 | | | | 2,132 | | | Not applicable |
| | Class F-2 | | | Not applicable | | | | 5,789 | | | | 3,113 | | | Not applicable |
| | Class 529-A | | | 1,271 | | | | 510 | | | | 301 | | | $538 |
| | Class 529-B | | | 139 | | | | 15 | | | | 7 | | | 12 |
| | Class 529-C | | | 1,890 | | | | 178 | | | | 95 | | | 171 |
| | Class 529-E | | | 158 | | | | 18 | | | | 16 | | | 28 |
| | Class 529-F-1 | | | — | | | | 39 | | | | 23 | | | 42 |
| | Class R-1 | | | 1,499 | | | | 164 | | | | 75 | | | Not applicable |
| | Class R-2 | | | 3,960 | | | | 1,849 | | | | 267 | | | Not applicable |
| | Class R-2E* | | | — | † | | | — | † | | | — | † | | Not applicable |
| | Class R-3 | | | 17,814 | | | | 5,161 | | | | 1,791 | | | Not applicable |
| | Class R-4 | | | 17,879 | | | | 7,404 | | | | 3,591 | | | Not applicable |
| | Class R-5 | | | Not applicable | | | | 2,846 | | | | 2,989 | | | Not applicable |
| | Class R-6 | | | Not applicable | | | | 48 | | | | 8,613 | | | Not applicable |
| | Total class-specific expenses | | | $104,027 | | | | $51,271 | | | | $25,108 | | | $791 |
| * | Class R-2E shares were offered beginning August 29, 2014. |
| † | Amount less than one thousand. |
Trustees’ deferred compensation — Trustees who are unaffiliated with CRMC may elect to defer the cash payment of part or all of their compensation. These deferred amounts, which remain as liabilities of the fund, are treated as if invested in shares of the fund or other American Funds. These amounts represent general, unsecured liabilities of the fund and vary according to the total returns of the selected funds. Trustees’ compensation of $251,000 in the fund’s statement of operations includes $145,000 in current fees (either paid in cash or deferred) and a net increase of $106,000 in the value of the deferred amounts.
Affiliated officers and trustees — Officers and certain trustees of the fund are or may be considered to be affiliated with CRMC, AFD and AFS. No affiliated officers or trustees received any compensation directly from the fund.
| EuroPacific Growth Fund | 29 |
8. Capital share transactions
Capital share transactions in the fund were as follows (dollars and shares in thousands):
| | | Sales* | | | Reinvestments
of dividends | | | Repurchases* | | | Net (decrease)
increase | |
| Share class | | Amount | | | Shares | | | Amount | | | Shares | | | Amount | | | Shares | | | Amount | | | Shares | |
| | | | | | | | | | | | | | | | | | | | | | | | | |
| Six months ended September 30, 2014 | | | | | | | | | | | | | | | | | | | | | | | | | |
| | | | | | | | | | | | | | | | | | | | | | | | | | | | | | | | | |
| Class A | | $ | 1,305,836 | | | | 26,185 | | | $ | — | | | | — | | | $ | (2,596,932 | ) | | | (52,082 | ) | | $ | (1,291,096 | ) | | | (25,897 | ) |
| Class B | | | 1,427 | | | | 29 | | | | — | | | | — | | | | (64,221 | ) | | | (1,299 | ) | | | (62,794 | ) | | | (1,270 | ) |
| Class C | | | 108,839 | | | | 2,239 | | | | — | | | | — | | | | (211,626 | ) | | | (4,356 | ) | | | (102,787 | ) | | | (2,117 | ) |
| Class F-1 | | | 1,029,855 | | | | 20,814 | | | | — | | | | — | | | | (3,013,524 | ) | | | (60,433 | ) | | | (1,983,669 | ) | | | (39,619 | ) |
| Class F-2 | | | 4,556,910 | | | | 91,112 | | | | — | | | | — | | | | (964,752 | ) | | | (19,341 | ) | | | 3,592,158 | | | | 71,771 | |
| Class 529-A | | | 55,362 | | | | 1,121 | | | | — | | | | — | | | | (64,097 | ) | | | (1,296 | ) | | | (8,735 | ) | | | (175 | ) |
| Class 529-B | | | 291 | | | | 6 | | | | — | | | | — | | | | (6,412 | ) | | | (132 | ) | | | (6,121 | ) | | | (126 | ) |
| Class 529-C | | | 18,100 | | | | 375 | | | | — | | | | — | | | | (23,291 | ) | | | (482 | ) | | | (5,191 | ) | | | (107 | ) |
| Class 529-E | | | 3,208 | | | | 66 | | | | — | | | | — | | | | (3,525 | ) | | | (72 | ) | | | (317 | ) | | | (6 | ) |
| Class 529-F-1 | | | 7,333 | | | | 148 | | | | — | | | | — | | | | (5,413 | ) | | | (109 | ) | | | 1,920 | | | | 39 | |
| Class R-1 | | | 23,099 | | | | 481 | | | | — | | | | — | | | | (27,435 | ) | | | (570 | ) | | | (4,336 | ) | | | (89 | ) |
| Class R-2 | | | 96,453 | | | | 1,995 | | | | — | | | | — | | | | (154,413 | ) | | | (3,189 | ) | | | (57,960 | ) | | | (1,194 | ) |
| Class R-2E† | | | 25 | | | | 1 | | | | — | | | | — | | | | — | | | | — | | | | 25 | | | | 1 | |
| Class R-3 | | | 700,293 | | | | 14,322 | | | | — | | | | — | | | | (1,092,919 | ) | | | (22,345 | ) | | | (392,626 | ) | | | (8,023 | ) |
| Class R-4 | | | 1,495,916 | | | | 30,513 | | | | — | | | | — | | | | (2,137,158 | ) | | | (43,546 | ) | | | (641,242 | ) | | | (13,033 | ) |
| Class R-5 | | | 1,225,227 | | | | 24,596 | | | | — | | | | — | | | | (2,087,641 | ) | | | (41,691 | ) | | | (862,414 | ) | | | (17,095 | ) |
| Class R-6 | | | 5,204,953 | | | | 104,030 | | | | — | | | | — | | | | (2,208,456 | ) | | | (44,105 | ) | | | 2,996,497 | | | | 59,925 | |
| Total net increase (decrease) | | $ | 15,833,127 | | | | 318,033 | | | $ | — | | | | — | | | $ | (14,661,815 | ) | | | (295,048 | ) | | $ | 1,171,312 | | | | 22,985 | |
| | | | | | | | | | | | | | | | | | | | | | | | | | | | | | | | | |
| Year ended March 31, 2014 | | | | | | | | | | | | | | | | | | | | | | | | | |
| Class A | | $ | 3,117,893 | | | | 67,652 | | | $ | 291,351 | | | | 6,020 | | | $ | (5,795,209 | ) | | | (126,005 | ) | | $ | (2,385,965 | ) | | | (52,333 | ) |
| Class B | | | 5,483 | | | | 119 | | | | 197 | | | | 4 | | | | (128,445 | ) | | | (2,809 | ) | | | (122,765 | ) | | | (2,686 | ) |
| Class C | | | 262,029 | | | | 5,784 | | | | 4,006 | | | | 84 | | | | (466,768 | ) | | | (10,381 | ) | | | (200,733 | ) | | | (4,513 | ) |
| Class F-1 | | | 2,265,788 | | | | 49,621 | | | | 79,710 | | | | 1,656 | | | | (2,543,987 | ) | | | (55,945 | ) | | | (198,489 | ) | | | (4,668 | ) |
| Class F-2 | | | 3,289,346 | | | | 70,625 | | | | 103,593 | | | | 2,144 | | | | (1,857,593 | ) | | | (40,436 | ) | | | 1,535,346 | | | | 32,333 | |
| Class 529-A | | | 132,482 | | | | 2,892 | | | | 10,357 | | | | 216 | | | | (118,339 | ) | | | (2,614 | ) | | | 24,500 | | | | 494 | |
| Class 529-B | | | 721 | | | | 16 | | | | — | | | | — | | | | (14,107 | ) | | | (313 | ) | | | (13,386 | ) | | | (297 | ) |
| Class 529-C | | | 42,312 | | | | 944 | | | | 758 | | | | 16 | | | | (47,318 | ) | | | (1,066 | ) | | | (4,248 | ) | | | (106 | ) |
| Class 529-E | | | 7,307 | | | | 161 | | | | 416 | | | | 9 | | | | (6,905 | ) | | | (153 | ) | | | 818 | | | | 17 | |
| Class 529-F-1 | | | 16,326 | | | | 359 | | | | 971 | | | | 20 | | | | (13,598 | ) | | | (295 | ) | | | 3,699 | | | | 84 | |
| Class R-1 | | | 52,278 | | �� | | 1,177 | | | | 555 | | | | 12 | | | | (86,297 | ) | | | (1,958 | ) | | | (33,464 | ) | | | (769 | ) |
| Class R-2 | | | 223,949 | | | | 5,023 | | | | 2,850 | | | | 61 | | | | (348,879 | ) | | | (7,840 | ) | | | (122,080 | ) | | | (2,756 | ) |
| Class R-3 | | | 1,453,227 | | | | 32,318 | | | | 48,991 | | | | 1,032 | | | | (2,324,885 | ) | | | (51,699 | ) | | | (822,667 | ) | | | (18,349 | ) |
| Class R-4 | | | 3,210,218 | | | | 71,249 | | | | 135,938 | | | | 2,861 | | | | (3,965,194 | ) | | | (88,560 | ) | | | (619,038 | ) | | | (14,450 | ) |
| Class R-5 | | | 2,523,579 | | | | 55,341 | | | | 160,113 | | | | 3,314 | | | | (6,193,730 | ) | | | (136,097 | ) | | | (3,510,038 | ) | | | (77,442 | ) |
| Class R-6 | | | 10,409,982 | | | | 227,020 | | | | 373,366 | | | | 7,719 | | | | (5,166,307 | ) | | | (111,691 | ) | | | 5,617,041 | | | | 123,048 | |
| Total net increase (decrease) | | $ | 27,012,920 | | | | 590,301 | | | $ | 1,213,172 | | | | 25,168 | | | $ | (29,077,561 | ) | | | (637,862 | ) | | $ | (851,469 | ) | | | (22,393 | ) |
| * | Includes exchanges between share classes of the fund. |
| † | Class R-2E shares were offered beginning August 29, 2014. |
| 30 | EuroPacific Growth Fund |
9. Investment transactions
The fund made purchases and sales of investment securities, excluding short-term securities and U.S. government obligations, if any, of $15,941,745,000 and $16,318,503,000, respectively, during the six months ended September 30, 2014.
| EuroPacific Growth Fund | 31 |
Financial highlights
| | | | | | Income (loss) from investment operations1 | |
| | | Net asset
value,
beginning
of period | | | Net
investment
income
(loss)2 | | | Net gains
(losses) on
securities (both
realized and
unrealized) | | | Total from
investment
operations | |
| Class A: | | | | | | | | | | | | | | | | |
| Six months ended 9/30/20144,5 | | $ | 49.37 | | | $ | .31 | | | $ | (1.07 | ) | | $ | (.76 | ) |
| Year ended 3/31/2014 | | | 42.38 | | | | .69 | | | | 6.75 | | | | 7.44 | |
| Year ended 3/31/2013 | | | 39.47 | | | | .58 | | | | 3.02 | | | | 3.60 | |
| Year ended 3/31/2012 | | | 42.81 | | | | .65 | | | | (3.40 | ) | | | (2.75 | ) |
| Year ended 3/31/2011 | | | 38.62 | | | | .54 | | | | 4.22 | | | | 4.76 | |
| Year ended 3/31/2010 | | | 25.78 | | | | .51 | | | | 12.95 | | | | 13.46 | |
| Class B: | | | | | | | | | | | | | | | | |
| Six months ended 9/30/20144,5 | | | 49.17 | | | | .12 | | | | (1.05 | ) | | | (.93 | ) |
| Year ended 3/31/2014 | | | 42.16 | | | | .33 | | | | 6.71 | | | | 7.04 | |
| Year ended 3/31/2013 | | | 39.20 | | | | .32 | | | | 2.96 | | | | 3.28 | |
| Year ended 3/31/2012 | | | 42.39 | | | | .37 | | | | (3.34 | ) | | | (2.97 | ) |
| Year ended 3/31/2011 | | | 38.21 | | | | .26 | | | | 4.15 | | | | 4.41 | |
| Year ended 3/31/2010 | | | 25.52 | | | | .26 | | | | 12.79 | | | | 13.05 | |
| Class C: | | | | | | | | | | | | | | | | |
| Six months ended 9/30/20144,5 | | | 48.22 | | | | .12 | | | | (1.05 | ) | | | (.93 | ) |
| Year ended 3/31/2014 | | | 41.41 | | | | .32 | | | | 6.59 | | | | 6.91 | |
| Year ended 3/31/2013 | | | 38.57 | | | | .28 | | | | 2.92 | | | | 3.20 | |
| Year ended 3/31/2012 | | | 41.76 | | | | .34 | | | | (3.28 | ) | | | (2.94 | ) |
| Year ended 3/31/2011 | | | 37.70 | | | | .23 | | | | 4.10 | | | | 4.33 | |
| Year ended 3/31/2010 | | | 25.21 | | | | .22 | | | | 12.65 | | | | 12.87 | |
| Class F-1: | | | | | | | | | | | | | | | | |
| Six months ended 9/30/20144,5 | | | 49.10 | | | | .31 | | | | (1.08 | ) | | | (.77 | ) |
| Year ended 3/31/2014 | | | 42.15 | | | | .67 | | | | 6.72 | | | | 7.39 | |
| Year ended 3/31/2013 | | | 39.27 | | | | .57 | | | | 3.01 | | | | 3.58 | |
| Year ended 3/31/2012 | | | 42.59 | | | | .63 | | | | (3.37 | ) | | | (2.74 | ) |
| Year ended 3/31/2011 | | | 38.43 | | | | .52 | | | | 4.20 | | | | 4.72 | |
| Year ended 3/31/2010 | | | 25.66 | | | | .49 | | | | 12.91 | | | | 13.40 | |
| Class F-2: | | | | | | | | | | | | | | | | |
| Six months ended 9/30/20144,5 | | | 49.32 | | | | .39 | | | | (1.10 | ) | | | (.71 | ) |
| Year ended 3/31/2014 | | | 42.33 | | | | .82 | | | | 6.74 | | | | 7.56 | |
| Year ended 3/31/2013 | | | 39.44 | | | | .66 | | | | 3.05 | | | | 3.71 | |
| Year ended 3/31/2012 | | | 42.80 | | | | .73 | | | | (3.39 | ) | | | (2.66 | ) |
| Year ended 3/31/2011 | | | 38.62 | | | | .61 | | | | 4.25 | | | | 4.86 | |
| Year ended 3/31/2010 | | | 25.78 | | | | .47 | | | | 13.10 | | | | 13.57 | |
| Class 529-A: | | | | | | | | | | | | | | | | |
| Six months ended 9/30/20144,5 | | | 48.89 | | | | .30 | | | | (1.07 | ) | | | (.77 | ) |
| Year ended 3/31/2014 | | | 41.98 | | | | .66 | | | | 6.69 | | | | 7.35 | |
| Year ended 3/31/2013 | | | 39.12 | | | | .55 | | | | 2.99 | | | | 3.54 | |
| Year ended 3/31/2012 | | | 42.45 | | | | .61 | | | | (3.35 | ) | | | (2.74 | ) |
| Year ended 3/31/2011 | | | 38.31 | | | | .51 | | | | 4.20 | | | | 4.71 | |
| Year ended 3/31/2010 | | | 25.59 | | | | .48 | | | | 12.86 | | | | 13.34 | |
| 32 | EuroPacific Growth Fund |
Dividends
(from net
investment
income) | | | Net asset
value, end
of period | | | Total
return3 | | | Net assets,
end of period
(in millions) | | | Ratio of
expenses to
average net
assets | | | Ratio of
net income
(loss) to
average net
assets2 | |
| | | | | | | | | | | | | | | | | |
| $ | — | | | $ | 48.61 | | | | (1.54 | )% | | $ | 30,537 | | | | .82 | %6 | | | 1.27 | %6 |
| | (.45 | ) | | | 49.37 | | | | 17.57 | | | | 32,295 | | | | .84 | | | | 1.50 | |
| | (.69 | ) | | | 42.38 | | | | 9.19 | | | | 29,939 | | | | .86 | | | | 1.48 | |
| | (.59 | ) | | | 39.47 | | | | (6.25 | ) | | | 31,443 | | | | .84 | | | | 1.65 | |
| | (.57 | ) | | | 42.81 | | | | 12.39 | | | | 39,417 | | | | .82 | | | | 1.39 | |
| | (.62 | ) | | | 38.62 | | | | 52.23 | | | | 40,426 | | | | .85 | | | | 1.45 | |
| | — | | | | 48.24 | | | | (1.89 | ) | | | 187 | | | | 1.55 | 6 | | | .59 | 6 |
| | (.03 | ) | | | 49.17 | | | | 16.70 | | | | 253 | | | | 1.58 | | | | .73 | |
| | (.32 | ) | | | 42.16 | | | | 8.39 | | | | 330 | | | | 1.59 | | | | .81 | |
| | (.22 | ) | | | 39.20 | | | | (6.95 | ) | | | 464 | | | | 1.58 | | | | .96 | |
| | (.23 | ) | | | 42.39 | | | | 11.57 | | | | 741 | | | | 1.57 | | | | .69 | |
| | (.36 | ) | | | 38.21 | | | | 51.12 | | | | 923 | | | | 1.59 | | | | .77 | |
| | — | | | | 47.29 | | | | (1.93 | ) | | | 1,852 | | | | 1.60 | 6 | | | .50 | 6 |
| | (.10 | ) | | | 48.22 | | | | 16.69 | | | | 1,990 | | | | 1.62 | | | | .72 | |
| | (.36 | ) | | | 41.41 | | | | 8.34 | | | | 1,896 | | | | 1.63 | | | | .73 | |
| | (.25 | ) | | | 38.57 | | | | (6.97 | ) | | | 2,111 | | | | 1.62 | | | | .89 | |
| | (.27 | ) | | | 41.76 | | | | 11.51 | | | | 2,851 | | | | 1.61 | | | | .60 | |
| | (.38 | ) | | | 37.70 | | | | 51.06 | | | | 2,901 | | | | 1.63 | | | | .66 | |
| | — | | | | 48.33 | | | | (1.57 | ) | | | 7,363 | | | | .86 | 6 | | | 1.32 | 6 |
| | (.44 | ) | | | 49.10 | | | | 17.55 | | | | 9,425 | | | | .87 | | | | 1.47 | |
| | (.70 | ) | | | 42.15 | | | | 9.19 | | | | 8,288 | | | | .85 | | | | 1.45 | |
| | (.58 | ) | | | 39.27 | | | | (6.25 | ) | | | 7,399 | | | | .86 | | | | 1.62 | |
| | (.56 | ) | | | 42.59 | | | | 12.36 | | | | 8,868 | | | | .85 | | | | 1.35 | |
| | (.63 | ) | | | 38.43 | | | | 52.24 | | | | 8,601 | | | | .86 | | | | 1.39 | |
| | — | | | | 48.61 | | | | (1.44 | ) | | | 14,049 | | | | .59 | 6 | | | 1.42 | 6 |
| | (.57 | ) | | | 49.32 | | | | 17.90 | | | | 10,714 | | | | .59 | | | | 1.78 | |
| | (.82 | ) | | | 42.33 | | | | 9.47 | | | | 7,828 | | | | .59 | | | | 1.67 | |
| | (.70 | ) | | | 39.44 | | | | (6.02 | ) | | | 5,958 | | | | .58 | | | | 1.86 | |
| | (.68 | ) | | | 42.80 | | | | 12.65 | | | | 6,216 | | | | .59 | | | | 1.54 | |
| | (.73 | ) | | | 38.62 | | | | 52.65 | | | | 4,028 | | | | .60 | | | | 1.31 | |
| | — | | | | 48.12 | | | | (1.58 | ) | | | 1,160 | | | | .88 | 6 | | | 1.21 | 6 |
| | (.44 | ) | | | 48.89 | | | | 17.52 | | | | 1,187 | | | | .90 | | | | 1.45 | |
| | (.68 | ) | | | 41.98 | | | | 9.12 | | | | 999 | | | | .91 | | | | 1.40 | |
| | (.59 | ) | | | 39.12 | | | | (6.30 | ) | | | 928 | | | | .89 | | | | 1.56 | |
| | (.57 | ) | | | 42.45 | | | | 12.36 | | | | 982 | | | | .87 | | | | 1.31 | |
| | (.62 | ) | | | 38.31 | | | | 52.14 | | | | 826 | | | | .89 | | | | 1.37 | |
See page 37 for footnotes.
| EuroPacific Growth Fund | 33 |
Financial highlights (continued)
| | | | | | Income (loss) from investment operations1 | |
| | | Net asset
value,
beginning
of period | | | Net
investment
income
(loss)2 | | | Net gains
(losses) on
securities (both
realized and
unrealized) | | | Total from
investment
operations | |
| Class 529-B: | | | | | | | | | | | | | | | | |
| Six months ended 9/30/20144,5 | | $ | 48.39 | | | $ | .10 | | | $ | (1.05 | ) | | $ | (.95 | ) |
| Year ended 3/31/2014 | | | 41.51 | | | | .28 | | | | 6.60 | | | | 6.88 | |
| Year ended 3/31/2013 | | | 38.61 | | | | .26 | | | | 2.92 | | | | 3.18 | |
| Year ended 3/31/2012 | | | 41.77 | | | | .32 | | | | (3.29 | ) | | | (2.97 | ) |
| Year ended 3/31/2011 | | | 37.68 | | | | .21 | | | | 4.09 | | | | 4.30 | |
| Year ended 3/31/2010 | | | 25.20 | | | | .20 | | | | 12.63 | | | | 12.83 | |
| Class 529-C: | | | | | | | | | | | | | | | | |
| Six months ended 9/30/20144,5 | | | 47.88 | | | | .10 | | | | (1.04 | ) | | | (.94 | ) |
| Year ended 3/31/2014 | | | 41.15 | | | | .29 | | | | 6.54 | | | | 6.83 | |
| Year ended 3/31/2013 | | | 38.36 | | | | .24 | | | | 2.93 | | | | 3.17 | |
| Year ended 3/31/2012 | | | 41.60 | | | | .29 | | | | (3.26 | ) | | | (2.97 | ) |
| Year ended 3/31/2011 | | | 37.58 | | | | .20 | | | | 4.09 | | | | 4.29 | |
| Year ended 3/31/2010 | | | 25.14 | | | | .20 | | | | 12.62 | | | | 12.82 | |
| Class 529-E: | | | | | | | | | | | | | | | | |
| Six months ended 9/30/20144,5 | | | 48.49 | | | | .16 | | | | (.99 | ) | | | (.83 | ) |
| Year ended 3/31/2014 | | | 41.65 | | | | .54 | | | | 6.63 | | | | 7.17 | |
| Year ended 3/31/2013 | | | 38.82 | | | | .44 | | | | 2.97 | | | | 3.41 | |
| Year ended 3/31/2012 | | | 42.11 | | | | .50 | | | | (3.32 | ) | | | (2.82 | ) |
| Year ended 3/31/2011 | | | 38.02 | | | | .39 | | | | 4.16 | | | | 4.55 | |
| Year ended 3/31/2010 | | | 25.41 | | | | .37 | | | | 12.77 | | | | 13.14 | |
| Class 529-F-1: | | | | | | | | | | | | | | | | |
| Six months ended 9/30/20144,5 | | | 48.89 | | | | .51 | | | | (1.23 | ) | | | (.72 | ) |
| Year ended 3/31/2014 | | | 41.97 | | | | .75 | | | | 6.70 | | | | 7.45 | |
| Year ended 3/31/2013 | | | 39.11 | | | | .63 | | | | 3.00 | | | | 3.63 | |
| Year ended 3/31/2012 | | | 42.45 | | | | .69 | | | | (3.36 | ) | | | (2.67 | ) |
| Year ended 3/31/2011 | | | 38.30 | | | | .58 | | | | 4.22 | | | | 4.80 | |
| Year ended 3/31/2010 | | | 25.57 | | | | .55 | | | | 12.86 | | | | 13.41 | |
| Class R-1: | | | | | | | | | | | | | | | | |
| Six months ended 9/30/20144,5 | | | 47.64 | | | | .12 | | | | (1.04 | ) | | | (.92 | ) |
| Year ended 3/31/2014 | | | 40.90 | | | | .33 | | | | 6.50 | | | | 6.83 | |
| Year ended 3/31/2013 | | | 38.12 | | | | .27 | | | | 2.90 | | | | 3.17 | |
| Year ended 3/31/2012 | | | 41.34 | | | | .32 | | | | (3.24 | ) | | | (2.92 | ) |
| Year ended 3/31/2011 | | | 37.36 | | | | .21 | | | | 4.08 | | | | 4.29 | |
| Year ended 3/31/2010 | | | 25.01 | | | | .20 | | | | 12.57 | | | | 12.77 | |
| Class R-2: | | | | | | | | | | | | | | | | |
| Six months ended 9/30/20144,5 | | | 47.96 | | | | .12 | | | | (1.04 | ) | | | (.92 | ) |
| Year ended 3/31/2014 | | | 41.20 | | | | .34 | | | | 6.54 | | | | 6.88 | |
| Year ended 3/31/2013 | | | 38.39 | | | | .28 | | | | 2.92 | | | | 3.20 | |
| Year ended 3/31/2012 | | | 41.60 | | | | .33 | | | | (3.26 | ) | | | (2.93 | ) |
| Year ended 3/31/2011 | | | 37.56 | | | | .23 | | | | 4.09 | | | | 4.32 | |
| Year ended 3/31/2010 | | | 25.13 | | | | .20 | | | | 12.62 | | | | 12.82 | |
| 34 | EuroPacific Growth Fund |
Dividends
(from net
investment
income) | | | Net asset
value, end
of period | | | Total
return3 | | | Net assets,
end of period
(in millions) | | | Ratio of
expenses to
average net
assets | | | Ratio of
net income
(loss) to
average net
assets2 | |
| | | | | | | | | | | | | | | | | |
| $ | — | | | $ | 47.44 | | | | (1.97 | )% | | $ | 24 | | | | 1.68 | %6 | | | .46 | %6 |
| | — | | | | 48.39 | | | | 16.58 | | | | 31 | | | | 1.70 | | | | .62 | |
| | (.28 | ) | | | 41.51 | | | | 8.26 | | | | 39 | | | | 1.71 | | | | .68 | |
| | (.19 | ) | | | 38.61 | | | | (7.05 | ) | | | 52 | | | | 1.70 | | | | .83 | |
| | (.21 | ) | | | 41.77 | | | | 11.43 | | | | 79 | | | | 1.68 | | | | .56 | |
| | (.35 | ) | | | 37.68 | | | | 50.94 | | | | 91 | | | | 1.71 | | | | .59 | |
| | — | | | | 46.94 | | | | (1.94 | ) | | | 366 | | | | 1.67 | 6 | | | .42 | 6 |
| | (.10 | ) | | | 47.88 | | | | 16.57 | | | | 378 | | | | 1.68 | | | | .66 | |
| | (.38 | ) | | | 41.15 | | | | 8.29 | | | | 329 | | | | 1.70 | | | | .62 | |
| | (.27 | ) | | | 38.36 | | | | (7.05 | ) | | | 321 | | | | 1.68 | | | | .77 | |
| | (.27 | ) | | | 41.60 | | | | 11.46 | | | | 356 | | | | 1.67 | | | | .52 | |
| | (.38 | ) | | | 37.58 | | | | 50.98 | | | | 313 | | | | 1.70 | | | | .57 | |
| | — | | | | 47.66 | | | | (1.71 | ) | | | 61 | | | | 1.13 | 6 | | | .95 | 6 |
| | (.33 | ) | | | 48.49 | | | | 17.22 | | | | 63 | | | | 1.15 | | | | 1.19 | |
| | (.58 | ) | | | 41.65 | | | | 8.86 | | | | 53 | | | | 1.17 | | | | 1.14 | |
| | (.47 | ) | | | 38.82 | | | | (6.58 | ) | | | 50 | | | | 1.16 | | | | 1.29 | |
| | (.46 | ) | | | 42.11 | | | | 12.03 | | | | 55 | | | | 1.16 | | | | 1.02 | |
| | (.53 | ) | | | 38.02 | | | | 51.73 | | | | 46 | | | | 1.19 | | | | 1.08 | |
| | — | | | | 48.17 | | | | (1.47 | ) | | | 91 | | | | .67 | 6 | | | 1.41 | 6 |
| | (.53 | ) | | | 48.89 | | | | 17.75 | | | | 90 | | | | .68 | | | | 1.65 | |
| | (.77 | ) | | | 41.97 | | | | 9.37 | | | | 74 | | | | .70 | | | | 1.60 | |
| | (.67 | ) | | | 39.11 | | | | (6.09 | ) | | | 65 | | | | .68 | | | | 1.78 | |
| | (.65 | ) | | | 42.45 | | | | 12.58 | | | | 71 | | | | .66 | | | | 1.50 | |
| | (.68 | ) | | | 38.30 | | | | 52.47 | | | | 56 | | | | .69 | | | | 1.58 | |
| | — | | | | 46.72 | | | | (1.93 | ) | | | 289 | | | | 1.60 | 6 | | | .49 | 6 |
| | (.09 | ) | | | 47.64 | | | | 16.70 | | | | 299 | | | | 1.61 | | | | .75 | |
| | (.39 | ) | | | 40.90 | | | | 8.36 | | | | 288 | | | | 1.61 | | | | .72 | |
| | (.30 | ) | | | 38.12 | | | | (6.98 | ) | | | 300 | | | | 1.61 | | | | .85 | |
| | (.31 | ) | | | 41.34 | | | | 11.52 | | | | 330 | | | | 1.62 | | | | .57 | |
| | (.42 | ) | | | 37.36 | | | | 51.08 | | | | 279 | | | | 1.64 | | | | .59 | |
| | — | | | | 47.04 | | | | (1.92 | ) | | | 1,002 | | | | 1.58 | 6 | | | .52 | 6 |
| | (.12 | ) | | | 47.96 | | | | 16.71 | | | | 1,079 | | | | 1.57 | | | | .76 | |
| | (.39 | ) | | | 41.20 | | | | 8.41 | | | | 1,041 | | | | 1.60 | | | | .74 | |
| | (.28 | ) | | | 38.39 | | | | (7.00 | ) | | | 1,098 | | | | 1.62 | | | | .87 | |
| | (.28 | ) | | | 41.60 | | | | 11.54 | | | | 1,353 | | | | 1.61 | | | | .60 | |
| | (.39 | ) | | | 37.56 | | | | 51.02 | | | | 1,303 | | | | 1.66 | | | | .60 | |
See page 37 for footnotes.
| EuroPacific Growth Fund | 35 |
Financial highlights (continued)
| | | | | | Income (loss) from investment operations1 | |
| | | Net asset
value,
beginning
of period | | | Net
investment
income
(loss)2 | | | Net gains
(losses) on
securities (both
realized and
unrealized) | | | Total from
investment
operations | |
| Class R-2E: | | | | | | | | | | | | | | | | |
| Period from 8/29/2014 to 9/30/20144,5,7 | | $ | 50.08 | | | $ | .05 | | | $ | (1.52 | ) | | $ | (1.47 | ) |
| Class R-3: | | | | | | | | | | | | | | | | |
| Six months ended 9/30/20144,5 | | | 48.40 | | | | .23 | | | | (1.05 | ) | | | (.82 | ) |
| Year ended 3/31/2014 | | | 41.56 | | | | .54 | | | | 6.62 | | | | 7.16 | |
| Year ended 3/31/2013 | | | 38.73 | | | | .46 | | | | 2.96 | | | | 3.42 | |
| Year ended 3/31/2012 | | | 42.01 | | | | .51 | | | | (3.31 | ) | | | (2.80 | ) |
| Year ended 3/31/2011 | | | 37.93 | | | | .41 | | | | 4.13 | | | | 4.54 | |
| Year ended 3/31/2010 | | | 25.35 | | | | .38 | | | | 12.75 | | | | 13.13 | |
| Class R-4: | | | | | | | | | | | | | | | | |
| Six months ended 9/30/20144,5 | | | 48.48 | | | | .30 | | | | (1.06 | ) | | | (.76 | ) |
| Year ended 3/31/2014 | | | 41.63 | | | | .67 | | | | 6.64 | | | | 7.31 | |
| Year ended 3/31/2013 | | | 38.79 | | | | .57 | | | | 2.98 | | | | 3.55 | |
| Year ended 3/31/2012 | | | 42.09 | | | | .62 | | | | (3.33 | ) | | | (2.71 | ) |
| Year ended 3/31/2011 | | | 38.00 | | | | .51 | | | | 4.16 | | | | 4.67 | |
| Year ended 3/31/2010 | | | 25.37 | | | | .50 | | | | 12.76 | | | | 13.26 | |
| Class R-5: | | | | | | | | | | | | | | | | |
| Six months ended 9/30/20144,5 | | | 49.32 | | | | .37 | | | | (1.06 | ) | | | (.69 | ) |
| Year ended 3/31/2014 | | | 42.33 | | | | .82 | | | | 6.76 | | | | 7.58 | |
| Year ended 3/31/2013 | | | 39.43 | | | | .70 | | | | 3.02 | | | | 3.72 | |
| Year ended 3/31/2012 | | | 42.78 | | | | .76 | | | | (3.40 | ) | | | (2.64 | ) |
| Year ended 3/31/2011 | | | 38.59 | | | | .65 | | | | 4.22 | | | | 4.87 | |
| Year ended 3/31/2010 | | | 25.75 | | | | .63 | | | | 12.93 | | | | 13.56 | |
| Class R-6: | | | | | | | | | | | | | | | | |
| Six months ended 9/30/20144,5 | | | 49.38 | | | | .41 | | | | (1.09 | ) | | | (.68 | ) |
| Year ended 3/31/2014 | | | 42.38 | | | | .85 | | | | 6.76 | | | | 7.61 | |
| Year ended 3/31/2013 | | | 39.48 | | | | .70 | | | | 3.04 | | | | 3.74 | |
| Year ended 3/31/2012 | | | 42.85 | | | | .73 | | | | (3.36 | ) | | | (2.63 | ) |
| Year ended 3/31/2011 | | | 38.65 | | | | .63 | | | | 4.28 | | | | 4.91 | |
| Period from 5/1/2009 to 3/31/20104,9 | | | 28.64 | | | | .42 | | | | 10.30 | | | | 10.72 | |
| | | Six months ended | | | | | | | | | | |
| | | September 30, | | Year ended March 31 |
| | | 20144,5 | | 2014 | | 2013 | | 2012 | | 2011 | | 2010 |
| Portfolio turnover rate for all share classes | | | 14 | % | | | 28 | % | | | 27 | % | | | 24 | % | | | 31 | % | | | 26 | % |
See Notes to Financial Statements
| 36 | EuroPacific Growth Fund |
Dividends
(from net
investment
income) | | | Net asset
value, end
of period | | | Total
return3 | | | Net assets,
end of period
(in millions) | | | Ratio of
expenses to
average net
assets | | | Ratio of
net income
(loss) to
average net
assets2 | |
| | | | | | | | | | | | | | | | | |
| $ | — | | | $ | 48.61 | | | | (2.94 | )% | | $ | — | 8 | | | .07 | % | | | .10 | % |
| | — | | | | 47.58 | | | | (1.69 | ) | | | 6,715 | | | | 1.13 | 6 | | | .96 | 6 |
| | (.32 | ) | | | 48.40 | | | | 17.24 | | | | 7,219 | | | | 1.14 | | | | 1.20 | |
| | (.59 | ) | | | 41.56 | | | | 8.87 | | | | 6,962 | | | | 1.14 | | | | 1.18 | |
| | (.48 | ) | | | 38.73 | | | | (6.52 | ) | | | 6,922 | | | | 1.14 | | | | 1.32 | |
| | (.46 | ) | | | 42.01 | | | | 12.03 | | | | 7,810 | | | | 1.13 | | | | 1.06 | |
| | (.55 | ) | | | 37.93 | | | | 51.80 | | | | 7,131 | | | | 1.15 | | | | 1.10 | |
| | — | | | | 47.72 | | | | (1.57 | ) | | | 13,548 | | | | .84 | 6 | | | 1.25 | 6 |
| | (.46 | ) | | | 48.48 | | | | 17.57 | | | | 14,394 | | | | .84 | | | | 1.50 | |
| | (.71 | ) | | | 41.63 | | | | 9.20 | | | | 12,961 | | | | .85 | | | | 1.47 | |
| | (.59 | ) | | | 38.79 | | | | (6.25 | ) | | | 12,490 | | | | .85 | | | | 1.61 | |
| | (.58 | ) | | | 42.09 | | | | 12.35 | | | | 13,775 | | | | .85 | | | | 1.32 | |
| | (.63 | ) | | | 38.00 | | | | 52.21 | | | | 11,204 | | | | .86 | | | | 1.43 | |
| | — | | | | 48.63 | | | | (1.40 | ) | | | 11,194 | | | | .54 | 6 | | | 1.57 | 6 |
| | (.59 | ) | | | 49.32 | | | | 17.93 | | | | 12,197 | | | | .54 | | | | 1.79 | |
| | (.82 | ) | | | 42.33 | | | | 9.54 | | | | 13,746 | | | | .55 | | | | 1.78 | |
| | (.71 | ) | | | 39.43 | | | | (5.99 | ) | | | 14,016 | | | | .55 | | | | 1.93 | |
| | (.68 | ) | | | 42.78 | | | | 12.70 | | | | 16,572 | | | | .55 | | | | 1.65 | |
| | (.72 | ) | | | 38.59 | | | | 52.70 | | | | 16,716 | | | | .56 | | | | 1.80 | |
| | — | | | | 48.70 | | | | (1.38 | ) | | | 35,042 | | | | .49 | 6 | | | 1.57 | 6 |
| | (.61 | ) | | | 49.38 | | | | 17.97 | | | | 32,575 | | | | .49 | | | | 1.85 | |
| | (.84 | ) | | | 42.38 | | | | 9.58 | | | | 22,744 | | | | .50 | | | | 1.76 | |
| | (.74 | ) | | | 39.48 | | | | (5.94 | ) | | | 17,603 | | | | .50 | | | | 1.88 | |
| | (.71 | ) | | | 42.85 | | | | 12.78 | | | | 13,786 | | | | .50 | | | | 1.61 | |
| | (.71 | ) | | | 38.65 | | | | 37.43 | | | | 7,635 | | | | .52 | 6 | | | 1.26 | 6 |
| 1 | Based on average shares outstanding. |
| 2 | For the year ended March 31, 2014, this column reflects the impact of a corporate action event that resulted in a one-time increase to net investment income. If the corporate action event had not occurred, the Class A net investment income per share and ratio of net income to average net assets would have been lower by $.19 and .40 percentage points, respectively. The impact to the other share classes would have been similar. |
| 3 | Total returns exclude any applicable sales charges, including contingent deferred sales charges. |
| 4 | Based on operations for the period shown and, accordingly, is not representative of a full year. |
| 5 | Unaudited. |
| 6 | Annualized. |
| 7 | Class R-2E shares were offered beginning August 29, 2014. |
| 8 | Amount less than $1 million. |
| 9 | Class R-6 shares were offered beginning May 1, 2009. |
| EuroPacific Growth Fund | 37 |
As a fund shareholder, you incur two types of costs: (1) transaction costs, such as initial sales charges on purchase payments and contingent deferred sales charges on redemptions (loads), and (2) ongoing costs, including management fees, distribution and service (12b-1) fees, and other expenses. This example is intended to help you understand your ongoing costs (in dollars) of investing in the fund so you can compare these costs with the ongoing costs of investing in other mutual funds. The example is based on an investment of $1,000 invested at the beginning of the period and held for the entire six-month period (April 1, 2014, through September 30, 2014).
Actual expenses:
The first line of each share class in the following table provides information about actual account values and actual expenses. You may use the information in this line, together with the amount you invested, to estimate the expenses that you paid over the period. Simply divide your account value by $1,000 (for example, an $8,600 account value divided by $1,000 = 8.6), then multiply the result by the number in the first line under the heading entitled “Expenses paid during period” to estimate the expenses you paid on your account during this period.
Hypothetical example for comparison purposes:
The second line of each share class in the following table provides information about hypothetical account values and hypothetical expenses based on the actual expense ratio for the share class and an assumed rate of return of 5.00% per year before expenses, which is not the actual return of the share class. The hypothetical account values and expenses may not be used to estimate the actual ending account balance or expenses you paid for the period. You may use this information to compare the ongoing costs of investing in the fund and other funds. To do so, compare this 5.00% hypothetical example with the 5.00% hypothetical examples that appear in the shareholder reports of the other funds.
Notes:
Retirement plan participants may be subject to certain fees charged by the plan sponsor, and Class F-1, F-2 and 529-F-1 shareholders may be subject to fees charged by financial intermediaries, typically ranging from 0.75% to 1.50% of assets annually depending on services offered. You can estimate the impact of these fees by adding the amount of the fees to the total estimated expenses you paid on your account during the period as calculated above. In addition, your ending account value would be lower by the amount of these fees.
Note that the expenses shown in the table on the following page are meant to highlight your ongoing costs only and do not reflect any transactional costs, such as sales charges (loads). Therefore, the second line of each share class in the table is useful in comparing ongoing costs only and will not help you determine the relative total costs of owning different funds. In addition, if these transactional costs were included, your costs would have been higher.
| 38 | EuroPacific Growth Fund |
| | | Beginning
account value
4/1/2014 | | | Ending
account value
9/30/2014 | | | Expenses paid
during period* | | | Annualized
expense ratio | |
| Class A - actual return | | $ | 1,000.00 | | | $ | 984.60 | | | $ | 4.08 | | | | .82 | % |
| Class A - assumed 5% return | | | 1,000.00 | | | | 1,020.96 | | | | 4.15 | | | | .82 | |
| Class B - actual return | | | 1,000.00 | | | | 981.11 | | | | 7.70 | | | | 1.55 | |
| Class B - assumed 5% return | | | 1,000.00 | | | | 1,017.30 | | | | 7.84 | | | | 1.55 | |
| Class C - actual return | | | 1,000.00 | | | | 980.70 | | | | 7.94 | | | | 1.60 | |
| Class C - assumed 5% return | | | 1,000.00 | | | | 1,017.05 | | | | 8.09 | | | | 1.60 | |
| Class F-1 - actual return | | | 1,000.00 | | | | 984.34 | | | | 4.28 | | | | .86 | |
| Class F-1 - assumed 5% return | | | 1,000.00 | | | | 1,020.76 | | | | 4.36 | | | | .86 | |
| Class F-2 - actual return | | | 1,000.00 | | | | 985.62 | | | | 2.94 | | | | .59 | |
| Class F-2 - assumed 5% return | | | 1,000.00 | | | | 1,022.11 | | | | 2.99 | | | | .59 | |
| Class 529-A - actual return | | | 1,000.00 | | | | 984.25 | | | | 4.38 | | | | .88 | |
| Class 529-A - assumed 5% return | | | 1,000.00 | | | | 1,020.66 | | | | 4.46 | | | | .88 | |
| Class 529-B - actual return | | | 1,000.00 | | | | 980.35 | | | | 8.34 | | | | 1.68 | |
| Class 529-B - assumed 5% return | | | 1,000.00 | | | | 1,016.65 | | | | 8.49 | | | | 1.68 | |
| Class 529-C - actual return | | | 1,000.00 | | | | 980.58 | | | | 8.29 | | | | 1.67 | |
| Class 529-C - assumed 5% return | | | 1,000.00 | | | | 1,016.70 | | | | 8.44 | | | | 1.67 | |
| Class 529-E - actual return | | | 1,000.00 | | | | 982.89 | | | | 5.62 | | | | 1.13 | |
| Class 529-E - assumed 5% return | | | 1,000.00 | | | | 1,019.40 | | | | 5.72 | | | | 1.13 | |
| Class 529-F-1 - actual return | | | 1,000.00 | | | | 985.27 | | | | 3.33 | | | | .67 | |
| Class 529-F-1 - assumed 5% return | | | 1,000.00 | | | | 1,021.71 | | | | 3.40 | | | | .67 | |
| Class R-1 - actual return | | | 1,000.00 | | | | 980.70 | | | | 7.94 | | | | 1.60 | |
| Class R-1 - assumed 5% return | | | 1,000.00 | | | | 1,017.05 | | | | 8.09 | | | | 1.60 | |
| Class R-2 - actual return | | | 1,000.00 | | | | 980.83 | | | | 7.85 | | | | 1.58 | |
| Class R-2 - assumed 5% return | | | 1,000.00 | | | | 1,017.15 | | | | 7.99 | | | | 1.58 | |
| Class R-2E - actual return† | | | 1,000.00 | | | | 970.64 | | | | .72 | | | | .83 | |
| Class R-2E - assumed 5% return† | | | 1,000.00 | | | | 1,020.91 | | | | 4.20 | | | | .83 | |
| Class R-3 - actual return | | | 1,000.00 | | | | 983.05 | | | | 5.62 | | | | 1.13 | |
| Class R-3 - assumed 5% return | | | 1,000.00 | | | | 1,019.40 | | | | 5.72 | | | | 1.13 | |
| Class R-4 - actual return | | | 1,000.00 | | | | 984.32 | | | | 4.18 | | | | .84 | |
| Class R-4 - assumed 5% return | | | 1,000.00 | | | | 1,020.86 | | | | 4.26 | | | | .84 | |
| Class R-5 - actual return | | | 1,000.00 | | | | 986.02 | | | | 2.69 | | | | .54 | |
| Class R-5 - assumed 5% return | | | 1,000.00 | | | | 1,022.36 | | | | 2.74 | | | | .54 | |
| Class R-6 - actual return | | | 1,000.00 | | | | 986.22 | | | | 2.44 | | | | .49 | |
| Class R-6 - assumed 5% return | | | 1,000.00 | | | | 1,022.61 | | | | 2.48 | | | | .49 | |
| * | The “expenses paid during period” are equal to the “annualized expense ratio,” multiplied by the average account value over the period, multiplied by the number of days in the period, and divided by 365 (to reflect the one-half year period). |
| † | The period for the “annualized expense ratio” and “actual return” line is based on the number of days since the initial sale of the share class on August 29, 2014. The “assumed 5% return” line is based on 183 days. |
| EuroPacific Growth Fund | 39 |
This page was intentionally left blank.
| 40 | EuroPacific Growth Fund |
This page was intentionally left blank.
| EuroPacific Growth Fund | 41 |
This page was intentionally left blank.
| 42 | EuroPacific Growth Fund |
This page was intentionally left blank.
| EuroPacific Growth Fund | 43 |
Offices of the fund and of the investment adviser
Capital Research and Management Company
333 South Hope Street
Los Angeles, CA 90071-1406
6455 Irvine Center Drive
Irvine, CA 92618-4518
Transfer agent for shareholder accounts
American Funds Service Company
(Write to the address near you.)
P.O. Box 6007
Indianapolis, IN 46206-6007
P.O. Box 2280
Norfolk, VA 23501-2280
Custodian of assets
JPMorgan Chase Bank
270 Park Avenue
New York, NY 10017-2070
Counsel
K&L Gates LLP
Four Embarcadero Center, Suite 1200
San Francisco, CA 94111-5994
Independent registered public accounting firm
Deloitte & Touche LLP
695 Town Center Drive
Suite 1200
Costa Mesa, CA 92626-7188
Principal underwriter
American Funds Distributors, Inc.
333 South Hope Street
Los Angeles, CA 90071-1406
| 44 | EuroPacific Growth Fund |
Investors should carefully consider investment objectives, risks, charges and expenses. This and other important information is contained in the fund prospectus and summary prospectus, which can be obtained from your financial professional and should be read carefully before investing. You may also call American Funds Service Company (AFS) at (800) 421-4225 or visit the American Funds website at americanfunds.com.
“American Funds Proxy Voting Procedures and Principles” — which describes how we vote proxies relating to portfolio securities — is available on the American Funds website or upon request by calling AFS. The fund files its proxy voting record with the U.S. Securities and Exchange Commission (SEC) for the 12 months ended June 30 by August 31. The proxy voting record is available free of charge on the SEC website at sec.gov and on the American Funds website.
A complete September 30, 2014, portfolio of EuroPacific Growth Fund’s investments is available free of charge by calling AFS or visiting the SEC website (where it is part of Form N-CSR).
EuroPacific Growth Fund files a complete list of its portfolio holdings with the SEC for the first and third quarters of each fiscal year on Form N-Q. This filing is available free of charge on the SEC website. You may also review or, for a fee, copy this filing at the SEC’s Public Reference Room in Washington, D.C. Additional information regarding the operation of the Public Reference Room may be obtained by calling the SEC’s Office of Investor Education and Advocacy at (800) SEC-0330. Additionally, the list of portfolio holdings is available by calling AFS.
This report is for the information of shareholders of EuroPacific Growth Fund, but it also may be used as sales literature when preceded or accompanied by the current prospectus or summary prospectus, which gives details about charges, expenses, investment objectives and operating policies of the fund. If used as sales material after December 31, 2014, this report must be accompanied by an American Funds statistical update for the most recently completed calendar quarter.
The American Funds Advantage
Since 1931, American Funds, part of Capital Group, has helped investors pursue long-term investment success. Our consistent approach — in combination with The Capital SystemSM — has resulted in a superior long-term track record.
| | Aligned with investor success |
| | We base our decisions on a long-term perspective, which we believe aligns our goals with the interests of our clients. Our portfolio managers average 26 years of investment experience, including 21 years at our company, reflecting a career commitment to our long-term approach.1 |
| | |
| | The Capital SystemSM |
| | Our investment process, The Capital System, combines individual accountability with teamwork. Each fund is divided into portions that are managed independently by investment professionals with diverse backgrounds, ages and investment approaches. An extensive global research effort is the backbone of our system. |
| | |
| | Superior long-term track record |
| | Our equity funds have beaten their Lipper peer indexes in 90% of 10-year periods and 96% of 20-year periods. Our fixed-income funds have beaten their Lipper indexes in 56% of 10-year periods and 57% of 20-year periods.2 Our fund management fees have been among the lowest in the industry.3 |
| | 1 | Portfolio manager experience as of December 31, 2013. |
| | 2 | Based on Class A share results for rolling periods through December 31, 2013. Periods covered are the shorter of the fund’s lifetime or since the comparable Lipper index inception date (except SMALLCAP World Fund, for which the Lipper average was used). |
| | 3 | Based on management fees for the 20-year period ended December 31, 2013, versus comparable Lipper categories, excluding funds of funds. |

ITEM 2 – Code of Ethics
Not applicable for filing of semi-annual reports to shareholders.
ITEM 3 – Audit Committee Financial Expert
Not applicable for filing of semi-annual reports to shareholders.
ITEM 4 – Principal Accountant Fees and Services
Not applicable for filing of semi-annual reports to shareholders.
ITEM 5 – Audit Committee of Listed Registrants
Not applicable to this Registrant, insofar as the Registrant is not a listed issuer as defined in Rule 10A-3 under the Securities Exchange Act of 1934.
ITEM 6 – Schedule of Investments
EuroPacific Growth Fund®
Investment portfolio
September 30, 2014
Common stocks 90.15%
Financials 20.66% | Shares | Value
(000) |
| Prudential PLC | 93,463,984 | $2,084,903 |
| Barclays PLC | 538,901,987 | 1,987,096 |
| HDFC Bank Ltd. | 83,160,429 | 1,175,032 |
| HDFC Bank Ltd. (ADR) | 7,852,300 | 365,760 |
| AIA Group Ltd. | 232,909,200 | 1,204,312 |
| Housing Development Finance Corp. Ltd. | 62,275,570 | 1,064,059 |
| AXA SA | 39,998,157 | 985,639 |
| Commerzbank AG, non-registered shares1 | 56,740,233 | 848,523 |
| Société Générale | 15,528,896 | 792,789 |
| ICICI Bank Ltd. | 33,068,399 | 767,571 |
| Bank of Ireland1,2 | 1,901,774,953 | 746,972 |
| Bankia, SA1 | 389,975,203 | 728,001 |
| Axis Bank Ltd. | 116,124,320 | 710,171 |
| UniCredit SpA | 85,957,649 | 679,641 |
| Fairfax Financial Holdings Ltd.2 | 868,291 | 387,439 |
| Fairfax Financial Holdings Ltd. (CAD denominated)2 | 525,000 | 235,225 |
| ORIX Corp. | 44,952,700 | 620,136 |
| ING Groep NV, depository receipts1 | 39,990,000 | 571,261 |
| Brookfield Asset Management Inc., Class A | 12,330,000 | 554,357 |
| Kotak Mahindra Bank Ltd. | 30,067,137 | 493,216 |
| Sumitomo Mitsui Financial Group, Inc. | 12,025,000 | 490,210 |
| Banco Santander, SA1 | 49,667,608 | 477,458 |
| Credit Suisse Group AG | 17,134,374 | 475,067 |
| Sun Hung Kai Properties Ltd. | 33,460,260 | 474,442 |
| BNP Paribas SA | 7,098,298 | 470,868 |
| Investment AB Kinnevik, Class B | 12,801,828 | 462,505 |
| Mizuho Financial Group, Inc. | 240,945,000 | 430,373 |
| Sberbank of Russia (ADR) | 42,800,875 | 338,267 |
| Sberbank of Russia (GDR)3 | 11,167,686 | 88,448 |
| Hana Financial Group Inc. | 10,668,630 | 389,237 |
| China Overseas Land & Investment Ltd. | 147,592,000 | 379,774 |
| Henderson Land Development Co. Ltd. | 58,365,116 | 378,084 |
| Eurobank Ergasias SA1,2 | 800,389,651 | 315,411 |
| Deutsche Bank AG | 8,318,333 | 291,817 |
| Sampo Oyj, Class A | 5,976,655 | 289,874 |
| Link Real Estate Investment Trust | 42,126,971 | 242,784 |
| Banca Monte dei Paschi di Siena SPA1 | 171,569,458 | 226,236 |
| Ping An Insurance (Group) Co. of China, Ltd., Class H | 28,674,000 | 215,290 |
| Grupo Financiero Santander México, SAB de CV, Class B (ADR) | 14,998,300 | 202,927 |
| Aegon NV | 24,562,997 | 202,651 |
| UBS AG | 10,049,020 | 175,361 |
| Resona Holdings, Inc. | 27,900,000 | 157,314 |
| Svenska Handelsbanken AB, Class A | 3,269,000 | 153,801 |
| Royal Bank of Scotland Group PLC1 | 17,920,061 | 106,966 |
| Daito Trust Construction Co., Ltd. | 897,700 | 106,038 |
| Cheung Kong (Holdings) Ltd. | 6,310,000 | 103,936 |
| Siam Commercial Bank PCL | 17,426,100 | 97,812 |
EuroPacific Growth Fund — Page 1 of 8
Common stocks
Financials (continued) | Shares | Value
(000) |
| Toronto-Dominion Bank | 1,900,000 | $93,766 |
| Assicurazioni Generali SpA | 4,410,000 | 92,797 |
| Shinsei Bank, Ltd. | 42,327,000 | 90,694 |
| Bancolombia SA (ADR) | 1,530,000 | 86,782 |
| AEON Financial Service Co., Ltd. | 3,915,000 | 83,779 |
| MS&AD Insurance Group Holdings, Inc. | 2,658,000 | 57,983 |
| Daiwa Securities Group Inc. | 7,200,000 | 57,042 |
| Investor AB, Class B | 1,557,614 | 55,086 |
| Industrial and Commercial Bank of China Ltd., Class H | 87,810,255 | 54,734 |
| Itaú Unibanco Holding SA, preferred nominative (ADR) | 3,653,053 | 50,704 |
| Kerry Properties Ltd. | 9,888,500 | 33,238 |
| Banco Santander (Brasil) SA, units (ADR) | 532,100 | 3,480 |
| Global Logistic Properties Ltd. | 1,107,000 | 2,352 |
| Ayala Land, Inc., preference shares4 | 481,283,600 | 1,072 |
| | | 25,508,563 |
| Information technology 13.16% | | |
| Murata Manufacturing Co., Ltd.2 | 16,016,400 | 1,821,058 |
| Baidu, Inc., Class A (ADR)1 | 7,780,900 | 1,698,026 |
| Samsung Electronics Co. Ltd. | 1,468,900 | 1,648,119 |
| Samsung Electronics Co. Ltd., nonvoting preferred | 48,800 | 41,528 |
| Tencent Holdings Ltd. | 94,946,500 | 1,412,303 |
| Taiwan Semiconductor Manufacturing Co. Ltd. | 302,957,649 | 1,195,119 |
| Taiwan Semiconductor Manufacturing Co. Ltd. (ADR) | 5,822,723 | 117,502 |
| Nintendo Co., Ltd.2 | 10,185,600 | 1,107,948 |
| Naver Corp. | 1,250,006 | 955,939 |
| ASML Holding NV | 8,496,811 | 845,888 |
| Infineon Technologies AG2 | 56,470,947 | 584,371 |
| ARM Holdings PLC | 38,430,700 | 564,456 |
| Yandex NV, Class A1 | 16,542,400 | 459,796 |
| Gemalto NV2 | 4,804,745 | 441,068 |
| Alcatel-Lucent1 | 133,730,799 | 415,009 |
| Infosys Ltd. | 6,074,000 | 368,585 |
| AAC Technologies Holdings Inc. | 59,144,500 | 343,525 |
| NetEase, Inc. (ADR) | 3,532,167 | 302,566 |
| Hexagon AB, Class B | 8,800,111 | 279,272 |
| Tech Mahindra Ltd. | 6,039,942 | 243,485 |
| Quanta Computer Inc. | 95,825,530 | 243,190 |
| Trend Micro Inc.2 | 7,162,200 | 242,277 |
| TDK Corp. | 3,510,000 | 195,862 |
| Samsung SDI Co., Ltd. | 1,418,520 | 164,671 |
| SAP SE | 1,566,500 | 112,976 |
| Delta Electronics, Inc. | 17,145,603 | 108,219 |
| Mail.Ru Group Ltd. (GDR)1 | 2,295,000 | 64,512 |
| Mail.Ru Group Ltd. (GDR)1,3 | 735,000 | 20,661 |
| STMicroelectronics NV | 10,279,882 | 79,462 |
| Keyence Corp. | 159,500 | 69,319 |
| OMRON Corp. | 1,320,000 | 59,937 |
| ASM Pacific Technology Ltd. | 3,127,300 | 30,951 |
| Spectris PLC | 265,600 | 7,785 |
| | | 16,245,385 |
EuroPacific Growth Fund — Page 2 of 8
Common stocks
Health care 12.80% | Shares | Value
(000) |
| Novo Nordisk A/S, Class B | 122,081,900 | $5,841,487 |
| Bayer AG | 20,348,384 | 2,850,244 |
| Novartis AG | 27,121,405 | 2,561,008 |
| UCB SA2 | 10,724,824 | 973,686 |
| Roche Holding AG | 2,623,000 | 777,806 |
| Teva Pharmaceutical Industries Ltd. (ADR) | 12,810,300 | 688,554 |
| Fresenius SE & Co. KGaA | 9,725,727 | 481,474 |
| Grifols, SA, Class A, non-registered shares | 4,410,000 | 180,692 |
| Grifols, SA, Class B, non-registered shares | 4,636,263 | 165,135 |
| Grifols, SA, Class B (ADR) | 1,770,739 | 62,206 |
| Sysmex Corp. | 8,423,600 | 338,710 |
| AstraZeneca PLC | 3,925,000 | 282,613 |
| Fresenius Medical Care AG & Co. KGaA | 3,322,000 | 232,031 |
| Merck KGaA | 1,686,000 | 155,518 |
| William Demant Holding A/S1 | 1,348,900 | 103,475 |
| Sonova Holding AG | 377,715 | 60,374 |
| Sonic Healthcare Ltd. | 2,948,000 | 45,273 |
| | | 15,800,286 |
| Consumer discretionary 12.14% | | |
| Toyota Motor Corp. | 21,518,000 | 1,268,027 |
| Liberty Global PLC, Class A1 | 13,481,000 | 573,482 |
| Liberty Global PLC, Class C1 | 11,364,070 | 466,097 |
| Volkswagen AG, nonvoting preferred | 3,766,362 | 782,068 |
| Rakuten, Inc. | 65,173,300 | 750,525 |
| Industria de Diseño Textil, SA | 24,920,000 | 688,520 |
| Honda Motor Co., Ltd. | 19,113,400 | 662,238 |
| Naspers Ltd., Class N | 5,785,900 | 638,448 |
| Altice SA1 | 10,278,359 | 544,339 |
| Sands China Ltd. | 93,499,200 | 487,674 |
| Ctrip.com International, Ltd. (ADR)1,2 | 8,414,000 | 477,579 |
| Li & Fung Ltd. | 399,354,100 | 453,622 |
| Publicis Groupe SA | 6,082,969 | 417,730 |
| Kering SA | 1,768,874 | 356,686 |
| Carnival PLC | 8,445,000 | 337,337 |
| Renault SA | 3,922,922 | 284,160 |
| H & M Hennes & Mauritz AB, Class B | 6,698,000 | 278,000 |
| Numericable Group SA, non-registered shares1 | 5,188,179 | 276,861 |
| Tata Motors Ltd. | 32,729,698 | 266,114 |
| Hyundai Mobis Co., Ltd. | 1,090,716 | 265,638 |
| adidas AG | 3,474,000 | 259,979 |
| Galaxy Entertainment Group Ltd. | 44,110,000 | 256,201 |
| Bajaj Auto Ltd. | 6,652,128 | 253,289 |
| Mahindra & Mahindra Ltd. | 10,840,000 | 238,845 |
| Paddy Power PLC2 | 3,204,000 | 231,356 |
| Fuji Media Holdings, Inc.2 | 15,354,000 | 228,333 |
| Burberry Group PLC | 8,922,000 | 218,550 |
| Hero MotoCorp Ltd. | 4,638,863 | 213,282 |
| Panasonic Corp. | 16,201,400 | 192,703 |
| JD.com, Inc., Class A (ADR)1 | 7,461,392 | 192,653 |
| Melco Crown Entertainment Ltd. (ADR) | 7,314,000 | 192,285 |
| Mr Price Group Ltd. | 10,047,345 | 189,081 |
| LVMH Moët Hennessey-Louis Vuitton SA | 1,129,099 | 183,540 |
| Nokian Renkaat Oyj | 5,880,627 | 177,369 |
| PT Astra International Tbk | 284,194,000 | 164,429 |
EuroPacific Growth Fund — Page 3 of 8
Common stocks
Consumer discretionary (continued) | Shares | Value
(000) |
| ASOS PLC1 | 4,097,900 | $149,474 |
| Daimler AG | 1,910,000 | 146,507 |
| Techtronic Industries Co. Ltd. | 43,815,000 | 126,679 |
| Cie. Générale des Établissements Michelin | 1,291,975 | 121,865 |
| TOD’S SpA | 1,224,376 | 121,319 |
| Global Brands Group Holding Ltd.1,2 | 510,868,100 | 112,505 |
| Shangri-La Asia Ltd. | 73,102,000 | 108,455 |
| Nissan Motor Co., Ltd. | 8,475,000 | 82,606 |
| Ocado Group PLC1 | 19,202,016 | 82,493 |
| Accor SA | 1,740,000 | 77,172 |
| Genting Singapore PLC | 80,300,000 | 71,758 |
| Hyundai Motor Co. | 383,000 | 69,141 |
| SEGA SAMMY HOLDINGS INC. | 3,820,000 | 61,475 |
| MGM China Holdings Ltd. | 18,300,000 | 52,674 |
| Kia Motors Corp. | 994,660 | 50,617 |
| Kingfisher PLC | 9,544,000 | 50,115 |
| Whitbread PLC | 655,225 | 44,125 |
| | | 14,996,020 |
| Industrials 7.56% | | |
| Airbus Group NV | 15,521,890 | 976,717 |
| Ryanair Holdings PLC (ADR)1 | 16,627,920 | 938,314 |
| Rolls-Royce Holdings PLC1 | 51,682,535 | 808,108 |
| International Consolidated Airlines Group, SA (CDI)1,2 | 116,313,540 | 692,210 |
| ASSA ABLOY AB, Class B | 9,378,500 | 484,261 |
| Jardine Matheson Holdings Ltd. | 7,700,400 | 458,944 |
| KONE Oyj, Class B | 10,988,000 | 441,610 |
| SMC Corp. | 1,348,700 | 371,992 |
| Babcock International Group PLC | 20,939,478 | 370,691 |
| easyJet PLC | 15,770,474 | 363,808 |
| Geberit AG1 | 1,055,000 | 341,242 |
| Hutchison Whampoa Ltd. | 23,802,000 | 288,143 |
| Schneider Electric SE | 3,690,342 | 283,394 |
| Deutsche Lufthansa AG | 17,529,475 | 276,868 |
| Siemens AG | 1,850,000 | 220,509 |
| Komatsu Ltd. | 9,200,000 | 212,772 |
| Wolseley PLC | 3,626,904 | 190,622 |
| Meggitt PLC | 25,818,247 | 188,851 |
| Bureau Veritas SA | 8,354,000 | 184,599 |
| Air France-KLM1,2 | 19,500,720 | 182,856 |
| Canadian Pacific Railway Ltd. | 824,000 | 171,010 |
| Kubota Corp. | 9,800,000 | 154,807 |
| Experian PLC | 7,450,000 | 118,783 |
| Marubeni Corp. | 17,200,000 | 117,746 |
| China State Construction International Holdings Ltd. | 77,638,000 | 115,384 |
| VINCI, SA | 1,945,905 | 113,070 |
| SGS SA | 38,834 | 80,580 |
| DP World Ltd. | 3,503,062 | 72,689 |
| ITOCHU Corp. | 4,400,000 | 53,759 |
| Andritz AG | 555,000 | 29,596 |
| Alstom SA1 | 742,476 | 25,395 |
| | | 9,329,330 |
EuroPacific Growth Fund — Page 4 of 8
Common stocks
Consumer staples 7.17% | Shares | Value
(000) |
| Associated British Foods PLC | 38,705,838 | $1,681,018 |
| British American Tobacco PLC | 26,840,999 | 1,515,133 |
| Nestlé SA | 15,566,799 | 1,145,457 |
| Pernod Ricard SA | 9,194,053 | 1,040,949 |
| Alimentation Couche-Tard Inc., Class B | 21,626,800 | 691,509 |
| Japan Tobacco Inc. | 16,361,000 | 532,115 |
| SABMiller PLC | 9,338,000 | 518,941 |
| ITC Ltd. | 58,045,737 | 347,936 |
| Seven & i Holdings Co., Ltd. | 8,519,000 | 330,429 |
| Magnit OJSC (GDR) | 5,520,000 | 318,835 |
| Wal-Mart de México, SAB de CV, Series V | 65,671,436 | 165,126 |
| Asahi Group Holdings, Ltd. | 3,510,000 | 101,547 |
| Coca-Cola HBC AG (CDI) | 3,520,910 | 76,087 |
| Hengan International Group Co. Ltd. | 7,587,500 | 74,606 |
| Anheuser-Busch InBev NV | 670,000 | 74,571 |
| Thai Beverage PCL | 103,695,000 | 62,183 |
| Unilever NV, depository receipts | 1,493,000 | 59,457 |
| PT Indofood Sukses Makmur Tbk | 87,140,000 | 50,060 |
| Orion Corp. | 42,250 | 35,033 |
| Treasury Wine Estates Ltd. | 7,363,000 | 27,334 |
| | | 8,848,326 |
| Telecommunication services 4.11% | | |
| SoftBank Corp. | 37,919,600 | 2,658,434 |
| China Mobile Ltd. | 35,005,000 | 404,605 |
| MTN Group Ltd. | 18,349,866 | 387,595 |
| China Telecom Corp. Ltd., Class H | 585,102,000 | 358,679 |
| KDDI Corp. | 4,954,000 | 297,805 |
| China Unicom (Hong Kong) Ltd. | 187,472,000 | 280,067 |
| TeliaSonera AB | 22,175,000 | 153,406 |
| Reliance Communications Ltd.1 | 91,597,000 | 146,828 |
| Deutsche Telekom AG | 7,555,000 | 114,508 |
| Swisscom AG | 191,000 | 108,534 |
| OJSC Mobile TeleSystems (ADR) | 3,924,929 | 58,638 |
| MegaFon OJSC (GDR)3 | 2,270,600 | 57,628 |
| Intouch Holdings PCL | 18,455,200 | 41,265 |
| Intouch Holdings PCL, nonvoting depository receipts | 6,004,800 | 13,426 |
| | | 5,081,418 |
| Materials 3.40% | | |
| Syngenta AG | 2,100,315 | 669,452 |
| First Quantum Minerals Ltd. | 29,972,181 | 578,596 |
| Linde AG | 2,164,239 | 415,908 |
| Chr. Hansen Holding A/S2 | 8,497,492 | 328,449 |
| Rio Tinto PLC | 6,038,000 | 296,739 |
| Amcor Ltd. | 28,815,000 | 285,844 |
| Glencore PLC | 40,505,000 | 225,361 |
| Grasim Industries Ltd. (GDR)4 | 1,915,953 | 110,081 |
| Grasim Industries Ltd. | 1,544,513 | 88,739 |
| K+S AG | 7,000,000 | 198,533 |
| Anhui Conch Cement Co. Ltd., Class H | 58,507,000 | 186,864 |
| L’Air Liquide SA, non-registered shares | 1,285,631 | 156,812 |
| BASF SE | 1,650,500 | 151,409 |
| Fortescue Metals Group Ltd. | 47,565,000 | 144,926 |
| LG Chem, Ltd. | 410,800 | 99,464 |
EuroPacific Growth Fund — Page 5 of 8
Common stocks
Materials (continued) | Shares | Value
(000) |
| Akzo Nobel NV | 1,290,000 | $88,391 |
| ArcelorMittal | 5,874,000 | 80,869 |
| Givaudan SA1 | 34,832 | 55,749 |
| Koninklijke DSM NV | 515,979 | 31,839 |
| Impala Platinum Holdings Ltd.1 | 611,317 | 4,714 |
| | | 4,198,739 |
| Energy 2.31% | | |
| BG Group PLC | 33,293,000 | 615,292 |
| Royal Dutch Shell PLC, Class A (EUR denominated) | 4,573,000 | 175,155 |
| Royal Dutch Shell PLC, Class B | 2,785,000 | 110,028 |
| Royal Dutch Shell PLC, Class A | 2,110,000 | 80,676 |
| Royal Dutch Shell PLC, Class B (ADR) | 988,700 | 78,226 |
| Royal Dutch Shell PLC, Class A (ADR) | 1,000,000 | 76,130 |
| Reliance Industries Ltd. | 24,871,800 | 380,850 |
| KunLun Energy Co. Ltd. | 183,706,000 | 264,977 |
| BP PLC | 26,138,164 | 192,144 |
| TOTAL SA | 2,172,000 | 141,145 |
| Pacific Rubiales Energy Corp. | 8,086,800 | 135,604 |
| Gazprom OJSC (ADR) | 18,750,000 | 132,000 |
| Enbridge Inc. | 2,599,520 | 124,434 |
| Oil Search Ltd. | 14,535,428 | 113,520 |
| INPEX CORP. | 6,600,000 | 93,246 |
| CNOOC Ltd. | 39,400,100 | 67,588 |
| Eni SpA | 2,568,000 | 61,205 |
| Repsol, SA, non-registered shares | 482,031 | 11,446 |
| | | 2,853,666 |
| Utilities 1.91% | | |
| Power Grid Corp. of India Ltd.2 | 296,023,422 | 648,270 |
| Power Assets Holdings Ltd. | 43,296,500 | 382,790 |
| China Resources Gas Group Ltd.2 | 118,420,000 | 320,266 |
| National Grid PLC | 18,749,517 | 269,915 |
| ENN Energy Holdings Ltd. | 34,250,000 | 224,074 |
| Cheung Kong Infrastructure Holdings Ltd. | 21,780,000 | 152,870 |
| PT Perusahaan Gas Negara (Persero) Tbk | 258,300,000 | 127,189 |
| EDP - Energias de Portugal, SA | 21,644,335 | 94,452 |
| Snam SPA | 13,650,000 | 75,514 |
| Hong Kong and China Gas Co. Ltd. | 31,986,963 | 69,372 |
| | | 2,364,712 |
| Miscellaneous 4.93% | | |
| Other common stocks in initial period of acquisition | | 6,084,048 |
| Total common stocks (cost: $76,309,728,000) | | 111,310,493 |
Rights & warrants 0.00%
Miscellaneous 0.00% | | |
| Other rights & warrants in initial period of acquisition | | 712 |
| Total rights & warrants (cost: $0) | | 712 |
EuroPacific Growth Fund — Page 6 of 8
Bonds, notes & other debt instruments 0.54%
U.S. Treasury bonds & notes 0.54%
U.S. Treasury 0.54% | Principal amount
(000) | Value
(000) |
| U.S. Treasury 0.25% 2015 | $392,300 | $392,814 |
| U.S. Treasury 0.25% 2015 | 145,000 | 145,169 |
| U.S. Treasury 0.25% 2015 | 135,000 | 135,169 |
| Total U.S. Treasury bonds & notes | | 673,152 |
Corporate bonds & notes 0.00%
Financials 0.00% | | |
| Total corporate bonds, notes & loans | | 0 |
| Total bonds, notes & other debt instruments (cost: $672,325,000) | | 673,152 |
| Short-term securities 9.19% | | |
| Abbott Laboratories 0.10% due 12/12/20143 | 58,750 | 58,741 |
| American Honda Finance Corp. 0.12% due 12/4/2014 | 50,000 | 49,989 |
| Apple Inc. 0.11% due 1/8/20153 | 50,000 | 49,976 |
| AstraZeneca PLC 0.10% due 11/24/20143 | 50,000 | 49,990 |
| Australia & New Zealand Banking Group, Ltd. 0.21% due 3/9/20153 | 24,000 | 23,978 |
| Bank of Montreal 0.18% due 11/17/2014 | 50,000 | 50,002 |
| Bank of Nova Scotia 0.17%–0.18% due 12/16/2014–1/2/20153 | 200,500 | 200,450 |
| Bank of Tokyo-Mitsubishi UFJ, Ltd. 0.18% due 10/21/20143 | 49,400 | 49,396 |
| BNZ International Funding Ltd. 0.20% due 10/17/20143 | 50,000 | 49,997 |
| CAFCO, LLC 0.21% due 2/2/2015 | 50,000 | 49,965 |
| Coca-Cola Co. 0.17%–0.21% due 10/16/2014–4/9/20153 | 98,000 | 97,953 |
| Electricité de France 0.18% due 10/2/20143 | 50,000 | 50,000 |
| Export Development Canada 0.12% due 10/8/2014 | 50,000 | 50,000 |
| Fannie Mae 0.05%–0.16% due 10/27/2014–8/3/2015 | 1,681,870 | 1,681,459 |
| Federal Farm Credit Banks 0.11%–0.16% due 12/1/2014–8/27/2015 | 248,000 | 247,876 |
| Federal Home Loan Bank 0.04%–0.17% due 10/3/2014–8/3/2015 | 2,754,063 | 2,753,710 |
| Freddie Mac 0.07%–0.16% due 10/1/2014–8/18/2015 | 3,990,175 | 3,989,392 |
| General Electric Co. 0.15% due 1/21/2015–1/29/2015 | 122,700 | 122,641 |
| GlaxoSmithKline Finance PLC 0.09% due 10/21/20143 | 45,475 | 45,472 |
| International Bank for Reconstruction and Development 0.10% due 1/2/2015 | 100,000 | 99,993 |
| Kells Funding, LLC 0.23% due 10/3/20143 | 25,000 | 25,000 |
| KfW 0.11% due 12/12/2014–1/16/20153 | 94,700 | 94,679 |
| Mitsubishi UFJ Trust and Banking Corp. 0.17%–0.22% due 10/7/2014–1/16/20153 | 160,200 | 160,150 |
| Mizuho Funding LLC 0.20% due 11/3/2014–11/12/20143 | 180,300 | 180,270 |
| National Rural Utilities Cooperative Finance Corp. 0.08% due 10/6/2014 | 30,000 | 29,999 |
| Nordea Bank AB 0.16%–0.23% due 11/13/2014–4/7/20153 | 110,900 | 110,840 |
| Nordea North America, Inc. 0.18% due 1/8/20153 | 96,100 | 96,052 |
| Province of Ontario 0.07% due 10/15/2014 | 37,500 | 37,499 |
| Québec (Province of) 0.10% due 10/3/2014–10/7/20143 | 100,000 | 99,999 |
| Reckitt Benckiser Treasury Services PLC 0.25% due 12/10/20143 | 40,000 | 39,987 |
| Siemens Capital Co. LLC 0.10% due 12/8/20143 | 98,000 | 97,973 |
| Standard Chartered Bank 0.18% due 11/13/20143 | 25,000 | 24,996 |
| Sumitomo Mitsui Banking Corp. 0.14%–0.19% due 10/21/2014–11/25/20143 | 157,800 | 157,764 |
| Svenska Handelsbanken Inc. 0.20% due 10/22/2014–2/18/20153 | 76,500 | 76,455 |
| Thunder Bay Funding, LLC 0.15%–0.22% due 10/15/2014–3/16/20153 | 128,652 | 128,590 |
| Toronto-Dominion Holdings USA Inc. 0.08% due 11/5/20143 | 63,600 | 63,594 |
| Toyota Motor Credit Corp. 0.16% due 10/30/2014 | 25,000 | 24,999 |
| U.S. Treasury Bills 0.12% due 3/5/2015 | 33,700 | 33,696 |
EuroPacific Growth Fund — Page 7 of 8
| Short-term securities | Principal amount
(000) | Value
(000) |
| United Parcel Service Inc. 0.12% due 2/2/20153 | $50,000 | $49,977 |
| Westpac Banking Corp. 0.26% due 6/19/20153 | 50,000 | 49,893 |
| Total short-term securities (cost: $11,351,849,000) | | 11,353,392 |
| Total investment securities 99.88% (cost: $88,333,902,000) | | 123,337,749 |
| Other assets less liabilities 0.12% | | 142,135 |
| Net assets 100.00% | | $123,479,884 |
As permitted by U.S. Securities and Exchange Commission regulations, “Miscellaneous” securities include holdings in their first year of acquisition that have not previously been publicly disclosed.
| 1 | Security did not produce income during the last 12 months. |
| 2 | Represents an affiliated company as defined under the Investment Company Act of 1940. |
| 3 | Acquired in a transaction exempt from registration under Rule 144A or Section 4(2) of the Securities Act of 1933. May be resold in the U.S. in transactions exempt from registration, normally to qualified institutional buyers. The total value of all such securities was $2,298,909,000, which represented 1.86% of the net assets of the fund. |
| 4 | Valued under fair value procedures adopted by authority of the board of trustees. The total value of all such securities was $111,153,000, which represented .09% of the net assets of the fund. |
| Key to abbreviations |
| ADR = American Depositary Receipts |
| CDI = CREST Depository Interest |
| GDR = Global Depositary Receipts |
| CAD = Canadian dollars |
| EUR = Euros |
Investments are not FDIC-insured, nor are they deposits of or guaranteed by a bank or any other entity, so they may lose value.
Investors should carefully consider investment objectives, risks, charges and expenses. This and other important information is contained in the fund prospectus and summary prospectus, which can be obtained from your financial professional and should be read carefully before investing. You may also call American Funds Service Company (AFS) at (800) 421-4225 or visit the American Funds website at americanfunds.com.
| MFGEFPX-016-1114O-S42226 | EuroPacific Growth Fund — Page 8 of 8 |
ITEM 7 – Disclosure of Proxy Voting Policies and Procedures for Closed-End Management Investment Companies
Not applicable to this Registrant, insofar as the Registrant is not a closed-end management investment company.
ITEM 8 – Portfolio Managers of Closed-End Management Investment Companies
Not applicable to this Registrant, insofar as the Registrant is not a closed-end management investment company.
ITEM 9 – Purchases of Equity Securities by Closed-End Management Investment Company and Affiliated Purchasers
Not applicable to this Registrant, insofar as the Registrant is not a closed-end management investment company.
ITEM 10 – Submission of Matters to a Vote of Security Holders
There have been no material changes to the procedures by which shareholders may recommend nominees to the Registrant’s board of trustees since the Registrant last submitted a proxy statement to its shareholders. The procedures are as follows. The Registrant has a nominating and governance committee comprised solely of persons who are not considered ‘‘interested persons’’ of the Registrant within the meaning of the Investment Company Act of 1940, as amended. The committee periodically reviews such issues as the board’s composition, responsibilities, committees, compensation and other relevant issues, and recommends any appropriate changes to the full board of trustees. While the committee normally is able to identify from its own resources an ample number of qualified candidates, it will consider shareholder suggestions of persons to be considered as nominees to fill future vacancies on the board. Such suggestions must be sent in writing to the nominating and governance committee of the Registrant, c/o the Registrant’s Secretary, and must be accompanied by complete biographical and occupational data on the prospective nominee, along with a written consent of the prospective nominee for consideration of his or her name by the nominating and governance committee.
ITEM 11 – Controls and Procedures
| (a) | The Registrant’s Principal Executive Officer and Principal Financial Officer have concluded, based on their evaluation of the Registrant’s disclosure controls and procedures (as such term is defined in Rule 30a-3 under the Investment Company Act of 1940), that such controls and procedures are adequate and reasonably designed to achieve the purposes described in paragraph (c) of such rule. |
| | |
| (b) | There were no changes in the Registrant’s internal controls over financial reporting (as defined in Rule 30a-3(d) under the Investment Company Act of 1940) that occurred during the Registrant’s second fiscal quarter of the period covered by this report that has materially affected, or is reasonably likely to materially affect, the Registrant’s internal control over financial reporting. |
ITEM 12 – Exhibits
| (a)(1) | Not applicable for filing of semi-annual reports to shareholders. |
| | |
| (a)(2) | The certifications required by Rule 30a-2 of the Investment Company Act of 1940 and Sections 302 and 906 of the Sarbanes-Oxley Act of 2002 are attached as exhibits hereto. |
SIGNATURES
Pursuant to the requirements of the Securities Exchange Act of 1934 and the Investment Company Act of 1940, the Registrant has duly caused this report to be signed on its behalf by the undersigned, thereunto duly authorized.
| | EUROPACIFIC GROWTH FUND |
| | |
| | By /s/ Walter R. Burkley |
| | Walter R. Burkley, Executive Vice President and Principal Executive Officer |
| | |
| | Date: November 28, 2014 |
Pursuant to the requirements of the Securities Exchange Act of 1934 and the Investment Company Act of 1940, this report has been signed below by the following persons on behalf of the Registrant and in the capacities and on the dates indicated.
| By /s/ Walter R. Burkley |
Walter R. Burkley, Executive Vice President and Principal Executive Officer |
| |
| Date: November 28, 2014 |
| By /s/ Brian C. Janssen |
Brian C. Janssen, Treasurer and Principal Financial Officer |
| |
| Date: November 28, 2014 |