UNITED STATES
SECURITIES AND EXCHANGE COMMISSION
Washington, D.C. 20549
FORM N-CSR
Certified Shareholder Report of
Registered Management Investment Companies
Investment Company Act File Number: 811-03734
EuroPacific Growth Fund
(Exact Name of Registrant as Specified in Charter)
333 South Hope Street
Los Angeles, California 90071
(Address of Principal Executive Offices)
Registrant's telephone number, including area code: (213) 486-9200
Date of fiscal year end: March 31
Date of reporting period: September 30, 2017
Michael W. Stockton
EuroPacific Growth Fund
333 South Hope Street
Los Angeles, California 90071
(Name and Address of Agent for Service)
ITEM 1 – Reports to Stockholders
 | EuroPacific Growth Fund® Semi-annual report
for the six months ended
September 30, 2017 |

We believe high-
conviction investing
and diverse
perspectives lead
to better results.
EuroPacific Growth Fund seeks to provide you with long-term growth of capital.
This fund is one of more than 40 offered by one of the nation’s largest mutual fund families, American Funds, from Capital Group. For more than 85 years, Capital has invested with a long-term focus based on thorough research and attention to risk.
Fund results shown in this report, unless otherwise indicated, are for Class A shares at net asset value. If a sales charge (maximum 5.75%) had been deducted, the results would have been lower. Results are for past periods and are not predictive of results for future periods. Current and future results may be lower or higher than those shown. Share prices and returns will vary, so investors may lose money. Investing for short periods makes losses more likely. For current information and month-end results, visit americanfunds.com.
Here are the average annual total returns on a $1,000 investment with all distributions reinvested for periods ended September 30, 2017:
| Class A shares | | 1 year | | | 5 years | | | 10 years | |
| | | | | | | | | | |
| Reflecting 5.75% maximum sales charge | | | 13.29% | | | | 7.84% | | | | 2.70% | |
For other share class results, visit americanfunds.com and americanfundsretirement.com.
The total annual fund operating expense ratio was 0.85% for Class A shares as of the prospectus dated June 1, 2017.
Investment results assume all distributions are reinvested and reflect applicable fees and expenses. When applicable, investment results reflect fee waivers, without which results would have been lower. Visit americanfunds.com for more information.
Investing outside the United States may be subject to risks, such as currency fluctuations, periods of illiquidity and price volatility. These risks may be heightened in connection with investments in developing countries. Refer to the fund prospectus and the Risk Factors section of this report for more information on these and other risks associated with investing in the fund.
Investments are not FDIC-insured, nor are they deposits of or guaranteed by a bank or any other entity, so they may lose value.
Fellow investors:
In a six-month span when international equity markets rallied, EuroPacific Growth Fund produced solid returns and exceeded all of its benchmarks for the period ended September 30, 2017.
The fund returned 14.85% for shareholders who reinvested dividends and capital gains. This return surpassed the 12.30% increase recorded by the fund’s primary benchmark, the unmanaged MSCI All Country World Index ex USA, which reflects the returns of more than 40 developed and developing country stock markets.
EuroPacific Growth outpaced its peers, as well, as reflected by the Lipper International Funds Average, which advanced 12.80% during the six-month period. The fund also exceeded the return of the MSCI EAFE (Europe, Australasia, Far East) Index, which gained 11.86%. Over longer time frames, the fund’s results compare favorably to the indexes and the peer group, as shown in the table below.
Results at a glance
For periods ended September 30, 2017, with all distributions reinvested
| | | Cumulative total returns | | Average annual total returns |
| | | 6 months | | 1 year | | 5 years | | 10 years | | Lifetime
(since 4/16/84) |
| | | | | | | | | | | |
| EuroPacific Growth Fund (Class A shares) | | | 14.85 | % | | | 20.20 | % | | | 9.13 | % | | | 3.30 | % | | | 10.96 | % |
| MSCI ACWI (All Country World Index) ex USA Index1,2 | | | 12.30 | | | | 19.61 | | | | 6.97 | | | | 1.28 | | | | — | |
| MSCI EAFE (Europe, Australasia, Far East) Index1,3 | | | 11.86 | | | | 19.10 | | | | 8.38 | | | | 1.34 | | | | 8.47 | |
| Lipper International Funds Average4 | | | 12.80 | | | | 18.53 | | | | 7.85 | | | | 1.42 | | | | 8.99 | |
| 1 | The market indexes are unmanaged and, therefore, have no expenses. Investors cannot invest directly in an index. Source: MSCI. |
| 2 | Results reflect dividends net of withholding taxes. No lifetime result shown because the index did not exist prior to December 31, 1987. |
| 3 | This index was the fund’s primary benchmark until the fiscal year ended March 31, 2007. Results reflect dividends net of withholding taxes. |
| 4 | Lipper averages reflect the current composition of all eligible mutual funds (all share classes) within a given category. Lipper source: Thomson Reuters Lipper. Lipper categories are dynamic and averages may have few funds, especially over longer periods. To see the number of funds included in the Lipper category for each fund’s lifetime, please see the Quarterly Statistical Update, available on our website. |
Strong gains in resilient markets
International equity markets posted strong gains during the April-to-September period, boosted by improving economic growth in Europe, Japan and many developing markets. In a number of key sectors, corporate earnings growth accelerated at a rapid pace as companies benefited from higher consumer spending, expanding trade activity and a low interest-rate environment. Central bank stimulus measures, particularly in Europe and Japan, also provided support for economies struggling to combat deflationary pressures.
Markets consistently climbed higher despite challenges arising from volatile politics in Western democracies and increasing tensions with Russia and North Korea. The election of President Emmanuel Macron in France fueled investor hopes for business-friendly policies, labor market reforms and potentially better euro-zone economic growth in the years ahead. In Japan, gross domestic product (GDP) growth improved significantly, rising 2.5% in the second quarter, roughly on par with the U.S. economy. Emerging markets, including China, also enjoyed strong gains amid rising commodities prices, technology-sector advancements and a weakening U.S. dollar.
All sectors rise
All sectors within the MSCI ACWI ex USA Index generated positive returns for the six-month period, led by a 24% gain in the information technology sector. Investor enthusiasm for new products and solid earnings growth drove share prices higher among large technology companies, including China’s Alibaba and Tencent, South Korea’s Samsung Electronics and Taiwan Semiconductor Manufacturing. Stocks in the consumer discretionary sector also experienced strong gains, rising 13% in aggregate, as a brightening global economic outlook helped to spur consumer spending in key markets.
Cyclical sectors outpaced defensive areas of the market amid signs of a long-awaited synchronized global recovery from the 2008–09 financial crisis. Stocks in the industrials sector rose nearly 13% on expectations for greater infrastructure spending, higher demand for aircraft and signs of a sustainable recovery in manufacturing. Stocks in the materials sector also experienced strong gains, rising 12% in aggregate, amid a solid rebound in prices for certain commodities and basic materials. Meanwhile, energy and health care stocks lagged the overall market, but those sectors still rose 9% and 8%, respectively.
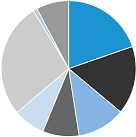
Where the fund’s assets are invested
(percent invested by country of domicile)
EuroPacific Growth Fund invests primarily in the stocks of companies based in Europe and the Pacific Basin.1
| | | EuroPacific
Growth Fund | | MSCI ACWI
ex USA Index2 |
| | | (9/30/17) | | (3/31/17) | | (9/30/17) |
| Europe | | | | | | |
| Euro zone3 | | | 20.9 | % | | | 20.2 | % | | | 23.1 | % |
| United Kingdom | | | 10.9 | | | | 12.1 | | | | 12.3 | |
| Switzerland | | | 3.1 | | | | 3.1 | | | | 5.7 | |
| Denmark | | | 1.9 | | | | 1.7 | | | | 1.3 | |
| Russia | | | .6 | | | | .3 | | | | .8 | |
| Sweden | | | .4 | | | | .6 | | | | 2.0 | |
| Other Europe | | | .1 | | | | .1 | | | | 1.2 | |
| | | | 37.9 | | | | 38.1 | | | | 46.4 | |
| | | | | | | | | | | | | |
| Pacific Basin | | | | | | | | | | | | |
| Japan | | | 13.6 | % | | | 13.7 | % | | | 15.9 | % |
| China | | | 8.3 | | | | 6.3 | | | | 7.1 | |
| South Korea | | | 5.9 | | | | 4.8 | | | | 3.6 | |
| Hong Kong | | | 4.9 | | | | 5.0 | | | | 2.4 | |
| Canada | | | 3.7 | | | | 4.6 | | | | 6.7 | |
| Taiwan | | | 2.8 | | | | 2.4 | | | | 2.8 | |
| Thailand | | | 1.3 | | | | 1.2 | | | | .5 | |
| United States | | | .9 | | | | 1.3 | | | | — | |
| Australia | | | .9 | | | | 1.0 | | | | 4.7 | |
| Other Pacific Basin | | | .9 | | | | .6 | | | | 3.8 | |
| | | | 43.2 | | | | 40.9 | | | | 47.5 | |
| | | | | | | | | | | | | |
| Other | | | | | | | | | | | | |
| India | | | 7.5 | % | | | 8.1 | % | | | 2.0 | % |
| Brazil | | | 2.2 | | | | 2.0 | | | | 1.8 | |
| South Africa | | | .9 | | | | 1.1 | | | | 1.5 | |
| Other countries | | | .4 | | | | .7 | | | | .8 | |
| | | | 11.0 | | | | 11.9 | | | | 6.1 | |
| | | | | | | | | | | | | |
| Short-term securities & other assets less liabilities | | | 7.9 | | | | 9.1 | | | | — | |
| | | | | | | | | | | | | |
| Total | | | 100.0 | % | | | 100.0 | % | | | 100.0 | % |
| 1 | A country is considered part of the Pacific Basin if any of its borders touches the Pacific Ocean. |
| 2 | Weighted by market capitalization. |
| 3 | Countries using the euro as a common currency: Austria, Belgium, Cyprus, Estonia, Finland, France, Germany, Greece, Ireland, Italy, Lithuania, Latvia, Luxembourg, Malta, the Netherlands, Portugal, Slovakia, Slovenia and Spain. |
| | |
Inside the portfolio
Select investments in the information technology sector produced strong returns for the fund. Companies engaged in e-commerce and internet-search-related activities were among the largest contributors to results. Shares of Chinese internet companies Alibaba, Tencent and Baidu rose sharply amid rapid growth in China’s online search and shopping markets. Chinese stocks in general bounced back strongly from steep declines in 2016 amid worries about China’s slowing economy. Elsewhere in the tech sector, shares of video game giant Nintendo and semiconductor equipment maker ASML also produced solid gains.
Investments in the financials sector also boosted returns. India’s HDFC was the largest contributor to returns within the sector as the Mumbai-based bank enjoyed a rapidly growing customer base and higher-than-expected earnings in recent quarters. Elsewhere in the portfolio, shares of DONG Energy rallied as the Denmark-based company expanded its use of renewable energy, including offshore wind farms, and continued to shift away from the use of fossil fuels. (The company plans to change its name to Ørsted, pending shareholder approval.) In the industrials sector, Airbus shares climbed higher on rising demand for more fuel-efficient airplanes.
Certain investments in consumer-related sectors disappointed for the six-month period. Shares of Dutch cable and telecommunications firm Altice declined amid concerns about the company’s debt levels and rising competition from streaming video services. In the consumer staples sector, British American Tobacco shares fell sharply after the U.S. Food and Drug Administration announced a regulatory plan to reduce nicotine levels in cigarettes. In the materials sector, Barrick Gold shares declined after the Toronto-based mining company reported lower-than-expected first-quarter earnings.
Looking ahead
As international markets continue to stage an impressive rally, we remain optimistic about the long-term outlook for equities. Europe, Japan and the United States appear to be experiencing a broad-based economic recovery, while many emerging markets are enjoying even faster growth amid rising commodities prices, impressive technology advances and a weakening U.S. dollar. Investor sentiment in Europe has improved dramatically after elections in France and Germany returned a measure of stability to the European Union. And even Japan’s long-struggling economy is showing some signs of light at the end of the tunnel.
After such a strong run-up, high valuations are a concern. However, it is important to note that international equities have lagged U.S. equities for many years, and that trend has just started to reverse in 2017. Given that Europe, Japan and a number of other economies are further behind in the economic recovery cycle than the U.S., we believe this reversal could continue for quite some time. We think valuations outside the U.S., generally speaking, are still attractive and could remain so into the foreseeable future. As always, we evaluate these opportunities on a bottom-up, fundamental, company-by-company basis and we will continue to do so as we guide the fund’s investments going forward.
Thank you for your commitment to the EuroPacific Growth Fund. We look forward to reporting to you again in six months.
Sincerely,

Carl Kawaja
Vice Chairman of the Board and President
November 10, 2017
For current information about the fund, visit americanfunds.com.
| Summary investment portfolio September 30, 2017 | unaudited |
| | |
| Industry sector diversification | Percent of net assets |
 | n Information technology 19.90% |
| n Financials 16.40% |
| n Consumer discretionary 11.60% |
| n Industrials 8.82% |
| n Consumer staples 7.66% |
| n Other industries 27.60% |
| n Other securities .16% |
| n Short-term securities & other assets less liabilities 7.86% |
| Country diversification by domicile | | Percent of
net assets |
| Euro zone* | | | 20.87 | % |
| Japan | | | 13.64 | |
| United Kingdom | | | 10.93 | |
| China | | | 8.28 | |
| India | | | 7.54 | |
| South Korea | | | 5.89 | |
| Hong Kong | | | 4.91 | |
| Canada | | | 3.72 | |
| Switzerland | | | 3.10 | |
| Other countries | | | 13.26 | |
| Short-term securities & other assets less liabilities | | | 7.86 | |
| * | Countries using the euro as a common currency; those represented in the fund’s portfolio are Belgium, Finland, France, Germany, Greece, Ireland, Italy, the Netherlands, Portugal and Spain. |
| Common stocks 91.98% | | | Shares | | | Value
(000) | |
| Information technology 19.90% | | | | | | | | |
| Samsung Electronics Co., Ltd.1 | | | 1,943,771 | | | $ | 4,369,029 | |
| Samsung Electronics Co., Ltd., nonvoting preferred1 | | | 48,800 | | | | 88,147 | |
| Alibaba Group Holding Ltd. (ADR)2 | | | 23,189,745 | | | | 4,005,101 | |
| Taiwan Semiconductor Manufacturing Co., Ltd.1 | | | 428,345,649 | | | | 3,080,717 | |
| Taiwan Semiconductor Manufacturing Co., Ltd. (ADR) | | | 8,247,523 | | | | 309,694 | |
| Tencent Holdings Ltd.1 | | | 64,809,787 | | | | 2,801,866 | |
| Nintendo Co., Ltd.1 | | | 6,916,426 | | | | 2,563,503 | |
| ASML Holding NV1 | | | 13,616,811 | | | | 2,322,908 | |
| Baidu, Inc., Class A (ADR)2 | | | 7,178,562 | | | | 1,778,058 | |
| Murata Manufacturing Co., Ltd.1 | | | 10,758,526 | | | | 1,590,582 | |
| SK hynix, Inc.1 | | | 16,712,500 | | | | 1,213,653 | |
| AAC Technologies Holdings Inc.1 | | | 52,703,429 | | | | 890,203 | |
| Keyence Corp.1 | | | 1,619,700 | | | | 863,512 | |
| Infineon Technologies AG1 | | | 29,897,842 | | | | 751,602 | |
| Other securities | | | | | | | 4,093,878 | |
| | | | | | | | 30,722,453 | |
| | | | Shares | | | | Value
(000) | |
| Financials 16.40% | | | | | | | | |
| HDFC Bank Ltd.1 | | | 101,228,459 | | | $ | 2,804,626 | |
| HDFC Bank Ltd. (ADR) | | | 6,523,800 | | | | 628,699 | |
| AIA Group Ltd.1 | | | 445,826,600 | | | | 3,306,383 | |
| UniCredit SpA1,2 | | | 88,376,250 | | | | 1,882,223 | |
| Prudential PLC1 | | | 75,543,496 | | | | 1,808,856 | |
| Barclays PLC1 | | | 678,968,270 | | | | 1,761,924 | |
| Kotak Mahindra Bank Ltd.1 | | | 93,721,246 | | | | 1,439,954 | |
| Housing Development Finance Corp. Ltd.1 | | | 41,218,425 | | | | 1,100,395 | |
| Sberbank of Russia PJSC (ADR)1 | | | 51,491,557 | | | | 734,055 | |
| Other securities | | | | | | | 9,850,782 | |
| | | | | | | | 25,317,897 | |
| | | | | | | | | |
| Consumer discretionary 11.60% | | | | | | | | |
| Sony Corp.1 | | | 55,367,000 | | | | 2,060,844 | |
| Altice NV, Class A1,2,3 | | | 76,957,011 | | | | 1,543,442 | |
| Altice NV, Class B1,2,3 | | | 16,341,536 | | | | 326,900 | |
| Naspers Ltd., Class N1 | | | 5,837,222 | | | | 1,274,218 | |
| adidas AG1 | | | 4,341,373 | | | | 982,062 | |
| LVMH Moët Hennessy-Louis Vuitton SE1 | | | 3,508,700 | | | | 967,335 | |
| Kering SA1 | | | 2,259,328 | | | | 899,370 | |
| Industria de Diseño Textil, SA1 | | | 23,536,000 | | | | 886,966 | |
| Galaxy Entertainment Group Ltd.1 | | | 103,064,000 | | | | 728,274 | |
| Paddy Power Betfair PLC1,3 | | | 6,722,676 | | | | 670,880 | |
| Other securities | | | | | | | 7,557,607 | |
| | | | | | | | 17,897,898 | |
| | | | | | | | | |
| Industrials 8.82% | | | | | | | | |
| Airbus SE, non-registered shares1 | | | 28,673,767 | | | | 2,729,242 | |
| International Consolidated Airlines Group, SA (CDI)1,3 | | | 153,050,123 | | | | 1,217,396 | |
| Ryanair Holdings PLC (ADR)2 | | | 10,729,994 | | | | 1,131,156 | |
| Recruit Holdings Co., Ltd.1 | | | 45,410,300 | | | | 983,778 | |
| Komatsu Ltd.1 | | | 26,956,600 | | | | 767,802 | |
| Other securities | | | | | | | 6,781,836 | |
| | | | | | | | 13,611,210 | |
| | | | | | | | | |
| Consumer staples 7.66% | | | | | | | | |
| British American Tobacco PLC1 | | | 54,295,950 | | | | 3,394,625 | |
| Associated British Foods PLC1 | | | 39,192,549 | | | | 1,678,233 | |
| Nestlé SA1 | | | 15,072,799 | | | | 1,262,368 | |
| Pernod Ricard SA1 | | | 8,319,513 | | | | 1,150,340 | |
| Kao Corp.1 | | | 13,326,800 | | | | 785,788 | |
| CP ALL PCL1 | | | 337,235,000 | | | | 675,023 | |
| Other securities | | | | | | | 2,877,523 | |
| | | | | | | | 11,823,900 | |
| | | | | | | | | |
| Health care 5.76% | | | | | | | | |
| Novartis AG1 | | | 12,624,432 | | | | 1,083,319 | |
| HOYA Corp.1 | | | 15,601,900 | | | | 846,225 | |
| Shire PLC1 | | | 14,915,000 | | | | 759,829 | |
| Other securities | | | | | | | 6,203,390 | |
| | | | | | | | 8,892,763 | |
| Common stocks (continued) | | | Shares | | | | Value
(000) | |
| Materials 5.54% | | | | | | | | |
| Glencore PLC1 | | | 250,223,000 | | | $ | 1,147,072 | |
| Chr. Hansen Holding A/S1,3 | | | 8,743,000 | | | | 749,854 | |
| Vale SA, ordinary nominative (ADR) | | | 48,996,373 | | | | 493,394 | |
| Vale SA, ordinary nominative | | | 16,296,278 | | | | 163,984 | |
| Other securities | | | | | | | 5,996,007 | |
| | | | | | | | 8,550,311 | |
| | | | | | | | | |
| Energy 4.71% | | | | | | | | |
| Reliance Industries Ltd.1 | | | 203,636,942 | | | | 2,439,663 | |
| Enbridge Inc. (CAD denominated) | | | 20,020,499 | | | | 836,280 | |
| Royal Dutch Shell PLC, Class A1 | | | 23,620,145 | | | | 711,793 | |
| Royal Dutch Shell PLC, Class A (EUR denominated)1 | | | 766,933 | | | | 23,191 | |
| Other securities | | | | | | | 3,256,594 | |
| | | | | | | | 7,267,521 | |
| | | | | | | | | |
| Telecommunication services 2.86% | | | | | | | | |
| SoftBank Group Corp.1 | | | 33,909,406 | | | | 2,740,901 | |
| Nippon Telegraph and Telephone Corp.1 | | | 24,994,000 | | | | 1,146,256 | |
| Other securities | | | | | | | 530,220 | |
| | | | | | | | 4,417,377 | |
| | | | | | | | | |
| Utilities 2.85% | | | | | | | | |
| DONG Energy AS1,3 | | | 27,014,285 | | | | 1,546,317 | |
| China Gas Holdings Ltd.1,3 | | | 268,700,000 | | | | 808,983 | |
| Other securities | | | | | | | 2,049,171 | |
| | | | | | | | 4,404,471 | |
| | | | | | | | | |
| Real estate 1.07% | | | | | | | | |
| CK Asset Holdings Ltd.1 | | | 79,511,708 | | | | 661,319 | |
| Other securities | | | | | | | 989,036 | |
| | | | | | | | 1,650,355 | |
| | | | | | | | | |
| Miscellaneous 4.81% | | | | | | | | |
| Other common stocks in initial period of acquisition | | | | | | | 7,423,430 | |
| | | | | | | | | |
| Total common stocks (cost: $93,410,890,000) | | | | | | | 141,979,586 | |
| | | | | |
| Convertible bonds 0.04% | Principal amount
(000) | | | |
| Miscellaneous 0.04% | | | | | | | | |
| Other convertible bonds in initial period of acquisition | | | | | | | 60,059 | |
| | | | | | | | | |
| Total convertible bonds (cost: $46,444,000) | | | | | | | 60,059 | |
| | | | | | | | | |
| Bonds, notes & other debt instruments 0.12% | | | | | | | |
| Other bonds & notes 0.12% | | | | | | | | |
| Other securities | | | | | | | 178,943 | |
| | | | | | | | | |
| Total bonds, notes & other debt instruments (cost: $178,532,000) | | | | | | | 178,943 | |
| Short-term securities 7.50% | Principal amount
(000) | | | | Value
(000) | |
| Federal Home Loan Bank 1.01%–1.37% due 10/3/2017–2/21/2018 | | $ | 3,257,500 | | | $ | 3,251,839 | |
| U.S. Treasury Bills 1.20%–1.35% due 11/16/2017–2/8/2018 | | | 1,167,200 | | | | 1,164,064 | |
| Other securities | | | | | | | 7,162,887 | |
| | | | | | | | | |
| Total short-term securities (cost: $11,578,279,000) | | | | | | | 11,578,790 | |
| Total investment securities 99.64% (cost: $105,214,145,000) | | | | | | | 153,797,378 | |
| Other assets less liabilities 0.36% | | | | | | | 553,857 | |
| | | | | | | | | |
| Net assets 100.00% | | | | | | $ | 154,351,235 | |
This summary investment portfolio is designed to streamline the report and help investors better focus on the fund’s principal holdings. See the inside back cover for details on how to obtain a complete schedule of portfolio holdings.
As permitted by U.S. Securities and Exchange Commission regulations, “Miscellaneous” securities include holdings in their first year of acquisition that have not previously been publicly disclosed.
“Other securities” includes all issues that are not disclosed separately in the summary investment portfolio. “Other securities” also includes securities (with an aggregate value of $5,392,112,000, which represented 3.49% of the net assets of the fund) which were acquired in transactions exempt from registration under Section 4(2) of the Securities Act of 1933 and may be resold in the U.S. in transactions exempt from registration, normally to qualified institutional buyers. “Other securities” also includes a security which was pledged as collateral. The total value of pledged collateral was $17,259,000, which represented .01% of the net assets of the fund.
Forward currency contracts
| Contract amount | | | | | | Unrealized
appreciation
(depreciation) | |
Purchases
(000) | | Sales
(000) | | Counterparty | | Settlement
date | | at 9/30/2017
(000) | |
| USD43,175 | | ZAR570,000 | | Barclays Bank PLC | | 10/18/2017 | | $ | 1,207 | |
| USD33,338 | | JPY3,669,900 | | Bank of America, N.A. | | 10/19/2017 | | | 691 | |
| USD313,487 | | GBP239,992 | | Citibank | | 10/19/2017 | | | (8,318 | ) |
| USD206,830 | | GBP160,279 | | UBS AG | | 10/20/2017 | | | (8,096 | ) |
| USD175,539 | | INR11,337,161 | | Bank of America, N.A. | | 10/23/2017 | | | 2,535 | |
| USD453,432 | | JPY50,000,000 | | Bank of America, N.A. | | 11/10/2017 | | | 8,193 | |
| USD6,096 | | JPY664,700 | | JPMorgan Chase | | 11/10/2017 | | | 177 | |
| USD44,647 | | JPY4,900,000 | | JPMorgan Chase | | 11/16/2017 | | | 1,002 | |
| USD458,782 | | JPY50,945,000 | | HSBC Bank | | 11/22/2017 | | | 4,902 | |
| USD243,149 | | JPY27,000,000 | | Barclays Bank PLC | | 11/22/2017 | | | 2,600 | |
| | | | | | | | | $ | 4,893 | |
Investments in affiliates
A company is an affiliate of the fund under the Investment Company Act of 1940 if the fund’s holdings in that company represent 5% or more of the outstanding voting shares. The value of the fund’s affiliated-company holdings is either shown in the summary investment portfolio or included in the value of “Other securities” under the respective industry sectors. Further details on such holdings and related transactions during the six months ended September 30, 2017, appear below.
| | | Beginning
shares | | | Additions | | | Reductions | | | Ending
shares | |
| Common stocks 6.21% | | | | | | | | | | | | | | | | |
| Information technology 0.00% | | | | | | | | | | | | | | | | |
| Nintendo Co., Ltd.1,4 | | | 7,332,426 | | | | — | | | | 416,000 | | | | 6,916,426 | |
| | | | | | | | | | | | | | | | | |
| Financials 0.31% | | | | | | | | | | | | | | | | |
| Indiabulls Housing Finance Ltd.1 | | | 26,207,577 | | | | — | | | | — | | | | 26,207,577 | |
| | | | | | | | | | | | | | | | | |
| Consumer discretionary 2.51% | | | | | | | | | | | | | | | | |
| Altice NV, Class A1,2 | | | 52,918,115 | | | | 26,227,647 | | | | 2,188,751 | | | | 76,957,011 | |
| Altice NV, Class B1,2 | | | 16,341,536 | | | | — | | | | — | | | | 16,341,536 | |
| Paddy Power Betfair PLC1 | | | 6,722,676 | | | | — | | | | — | | | | 6,722,676 | |
| Kroton Educacional SA, ordinary nominative | | | 90,424,000 | | | | — | | | | — | | | | 90,424,000 | |
| ASOS PLC1,2 | | | 6,674,299 | | | | — | | | | — | | | | 6,674,299 | |
| William Hill PLC1 | | | 51,985,007 | | | | — | | | | — | | | | 51,985,007 | |
| Global Brands Group Holding Ltd.1,2 | | | 487,835,358 | | | | — | | | | — | | | | 487,835,358 | |
| | | | | | | | | | | | | | | | | |
| Industrials 1.15% | | | | | | | | | | | | | | | | |
International Consolidated Airlines Group, SA
(CDI)1 | | | 153,050,123 | | | | — | | | | — | | | | 153,050,123 | |
| Toshiba Corp.1 | | | 278,979,000 | | | | — | | | | 77,360,000 | | | | 201,619,000 | |
| | | | | | | | | | | | | | | | | |
| Consumer staples 0.00% | | | | | | | | | | | | | | | | |
| Associated British Foods PLC1,4 | | | 42,312,249 | | | | 2,720,300 | | | | 5,840,000 | | | | 39,192,549 | |
| | | | | | | | | | | | | | | | | |
| Health care 0.00% | | | | | | | | | | | | | | | | |
| Sysmex Corp.1,4 | | | 14,836,538 | | | | — | | | | 5,853,538 | | | | 8,983,000 | |
| UCB SA1,4 | | | 12,642,824 | | | | — | | | | 5,352,025 | | | | 7,290,799 | |
| | | | | | | | | | | | | | | | | |
| Materials 0.49% | | | | | | | | | | | | | | | | |
| Chr. Hansen Holding A/S1 | | | 8,743,000 | | | | — | | | | — | | | | 8,743,000 | |
| Nitto Denko Corp.1,4 | | | 10,347,699 | | | | 500,000 | | | | 3,637,600 | | | | 7,210,099 | |
| First Quantum Minerals Ltd.4 | | | 35,467,201 | | | | 4,023,800 | | | | 7,580,000 | | | | 31,911,001 | |
| HeidelbergCement AG1,4 | | | 12,222,194 | | | | 105,000 | | | | 7,143,510 | | | | 5,183,684 | |
| | | | | | | | | | | | | | | | | |
| Energy 0.22% | | | | | | | | | | | | | | | | |
| Tourmaline Oil Corp.2 | | | 16,547,000 | | | | — | | | | — | | | | 16,547,000 | |
| | | | | | | | | | | | | | | | | |
| Utilities 1.53% | | | | | | | | | | | | | | | | |
| DONG Energy AS1 | | | 27,014,285 | | | | — | | | | — | | | | 27,014,285 | |
| China Gas Holdings Ltd.1 | | | 225,874,000 | | | | 42,826,000 | | | | — | | | | 268,700,000 | |
| | | | | | | | | | | | | | | | | |
| | | Net realized
gain (loss)
(000) | | | Net unrealized
appreciation
(depreciation)
(000) | | | Dividend
income
(000) | | | Value of
affiliates at
9/30/2017
(000) | |
| Common stocks 6.21% | | | | | | | | | | | | | | | | |
| Information technology 0.00% | | | | | | | | | | | | | | | | |
| Nintendo Co., Ltd.1,4 | | $ | 78,028 | | | $ | 918,328 | | | $ | 3,336 | | | $ | — | |
| | | | | | | | | | | | | | | | | |
| Financials 0.31% | | | | | | | | | | | | | | | | |
| Indiabulls Housing Finance Ltd.1 | | | — | | | | 82,485 | | | | 7,359 | | | | 485,174 | |
| 10 | EuroPacific Growth Fund |
| | | Net realized
gain (loss)
(000) | | | Net unrealized
appreciation
(depreciation)
(000) | | | Dividend
income
(000) | | | Value of
affiliates at
9/30/2017
(000) | |
| Consumer discretionary 2.51% | | | | | | | | | | | | | | | | |
| Altice NV, Class A1,2 | | $ | (7,550 | ) | | $ | (197,466 | ) | | $ | — | | | $ | 1,543,442 | |
| Altice NV, Class B1,2 | | | — | | | | (42,683 | ) | | | — | | | | 326,900 | |
| Paddy Power Betfair PLC1 | | | — | | | | (49,881 | ) | | | 15,078 | | | | 670,880 | |
| Kroton Educacional SA, ordinary nominative | | | — | | | | 188,861 | | | | 6,715 | | | | 572,439 | |
| ASOS PLC1,2 | | | — | | | | 27,214 | | | | — | | | | 532,711 | |
| William Hill PLC1 | | | — | | | | (13,576 | ) | | | 5,612 | | | | 175,828 | |
| Global Brands Group Holding Ltd.1,2 | | | — | | | | (5,253 | ) | | | — | | | | 46,848 | |
| | | | | | | | | | | | | | | | 3,869,048 | |
| | | | | | | | | | | | | | | | | |
| Industrials 1.15% | | | | | | | | | | | | | | | | |
International Consolidated Airlines Group, SA
(CDI)1 | | | — | | | | 203,004 | | | | 21,775 | | | | 1,217,396 | |
| Toshiba Corp.1 | | | (71,229 | ) | | | 250,367 | | | | — | | | | 564,676 | |
| | | | | | | | | | | | | | | | 1,782,072 | |
| | | | | | | | | | | | | | | | | |
| Consumer staples 0.00% | | | | | | | | | | | | | | | | |
| Associated British Foods PLC1,4 | | | 5,804 | | | | 399,627 | | | | 5,573 | | | | — | |
| | | | | | | | | | | | | | | | | |
| Health care 0.00% | | | | | | | | | | | | | | | | |
| Sysmex Corp.1,4 | | | (26,947 | ) | | | 32,153 | | | | 2,673 | | | | — | |
| UCB SA1,4 | | | (45,393 | ) | | | (41,645 | ) | | | 15,812 | | | | — | |
| | | | | | | | | | | | | | | | — | |
| | | | | | | | | | | | | | | | | |
| Materials 0.49% | | | | | | | | | | | | | | | | |
| Chr. Hansen Holding A/S1 | | | — | | | | 188,685 | | | | 7,560 | | | | 749,854 | |
| Nitto Denko Corp.1,4 | | | 60,440 | | | | 19,739 | | | | 5,139 | | | | — | |
| First Quantum Minerals Ltd.4 | | | (46,908 | ) | | | 53,527 | | | | 266 | | | | — | |
| HeidelbergCement AG1,4 | | | 66,624 | | | | (11,363 | ) | | | 21,433 | | | | — | |
| | | | | | | | | | | | | | | | 749,854 | |
| | | | | | | | | | | | | | | | | |
| Energy 0.22% | | | | | | | | | | | | | | | | |
| Tourmaline Oil Corp.2 | | | — | | | | (32,484 | ) | | | — | | | | 336,444 | |
| | | | | | | | | | | | | | | | | |
| Utilities 1.53% | | | | | | | | | | | | | | | | |
| DONG Energy AS1 | | | — | | | | 504,654 | | | | — | | | | 1,546,317 | |
| China Gas Holdings Ltd.1 | | | — | | | | 348,091 | | | | 6,480 | | | | 808,983 | |
| | | | | | | | | | | | | | | | 2,355,300 | |
| Total | | $ | 12,869 | | | $ | 2,822,384 | | | $ | 124,811 | | | $ | 9,577,892 | |
| 1 | Valued under fair value procedures adopted by authority of the board of trustees. The total value of all such securities, including those in “Other securities,“ was $121,837,043,000, which represented 78.93% of the net assets of the fund. This amount includes $119,031,564,000 related to certain securities trading outside the U.S. whose values were adjusted as a result of significant market movements following the close of local trading. |
| 2 | Security did not produce income during the last 12 months. |
| 3 | Represents an affiliated company as defined under the Investment Company Act of 1940. |
| 4 | Unaffiliated issuer at 9/30/2017. |
| EuroPacific Growth Fund | 11 |
Key to abbreviations and symbol
ADR = American Depositary Receipts
BRL = Brazilian reais
CAD = Canadian dollars
CDI = CREST Depository Interest
EUR = Euros
GBP = British pounds
INR = Indian rupees
JPY = Japanese yen
USD/$ = U.S. dollars
ZAR = South African rand
See Notes to Financial Statements
| 12 | EuroPacific Growth Fund |
Financial statements
Statement of assets and liabilities
at September 30, 2017 | unaudited
(dollars in thousands) |
| Assets: | | | | | | |
| Investment securities, at value: | | | | | | | | |
| Unaffiliated issuers (cost: $97,759,537) | | $ | 144,219,486 | | | | | |
| Affiliated issuers (cost: $7,454,608) | | | 9,577,892 | | | $ | 153,797,378 | |
| Cash | | | | | | | 277,158 | |
Cash denominated in currencies other than U.S. dollars
(cost: $81,243) | | | | | | | 81,127 | |
| Unrealized appreciation on open forward currency contracts | | | | | | | 21,307 | |
| Receivables for: | | | | | | | | |
| Sales of investments | | | 354,818 | | | | | |
| Sales of fund’s shares | | | 345,700 | | | | | |
| Dividends and interest | | | 232,564 | | | | | |
| Other | | | 11,379 | | | | 944,461 | |
| | | | | | | | 155,121,431 | |
| Liabilities: | | | | | | | | |
| Unrealized depreciation on open forward currency contracts | | | | | | | 16,414 | |
| Payables for: | | | | | | | | |
| Purchases of investments | | | 79,696 | | | | | |
| Repurchases of fund’s shares | | | 384,014 | | | | | |
| Closed forward currency contracts | | | 90 | | | | | |
| Investment advisory services | | | 52,342 | | | | | |
| Services provided by related parties | | | 22,319 | | | | | |
| Trustees’ deferred compensation | | | 4,356 | | | | | |
| Non-U.S. taxes | | | 195,189 | | | | | |
| Other | | | 15,776 | | | | 753,782 | |
| Net assets at September 30, 2017 | | | | | | $ | 154,351,235 | |
| | | | | | | | | |
| Net assets consist of: | | | | | | | | |
| Capital paid in on shares of beneficial interest | | | | | | $ | 103,027,207 | |
| Undistributed net investment income | | | | | | | 54,044 | |
| Undistributed net realized gain | | | | | | | 2,865,801 | |
| Net unrealized appreciation | | | | | | | 48,404,183 | |
| Net assets at September 30, 2017 | | | | | | $ | 154,351,235 | |
| | | | | | | | | |
| See Notes to Financial Statements | | | | | | | | |
| EuroPacific Growth Fund | 13 |
(dollars and shares in thousands, except per-share amounts)
Shares of beneficial interest issued and outstanding (no stated par value) —
unlimited shares authorized (2,791,529 total shares outstanding)
| | | Net assets | | | Shares
outstanding | | | Net asset value
per share | |
| | | | | | | | | | |
| Class A | | $ | 28,391,172 | | | | 511,888 | | | $ | 55.46 | |
| Class C | | | 1,329,121 | | | | 24,574 | | | | 54.09 | |
| Class T | | | 11 | | | | — | * | | | 55.52 | |
| Class F-1 | | | 4,433,985 | | | | 80,322 | | | | 55.20 | |
| Class F-2 | | | 23,502,886 | | | | 424,575 | | | | 55.36 | |
| Class F-3 | | | 7,062,341 | | | | 127,183 | | | | 55.53 | |
| Class 529-A | | | 1,336,759 | | | | 24,374 | | | | 54.84 | |
| Class 529-C | | | 380,962 | | | | 7,115 | | | | 53.54 | |
| Class 529-E | | | 67,725 | | | | 1,247 | | | | 54.33 | |
| Class 529-T | | | 12 | | | | — | * | | | 55.51 | |
| Class 529-F-1 | | | 122,453 | | | | 2,233 | | | | 54.85 | |
| Class R-1 | | | 266,775 | | | | 5,008 | | | | 53.27 | |
| Class R-2 | | | 831,741 | | | | 15,482 | | | | 53.72 | |
| Class R-2E | | | 234,027 | | | | 4,288 | | | | 54.58 | |
| Class R-3 | | | 4,725,196 | | | | 87,030 | | | | 54.29 | |
| Class R-4 | | | 10,726,043 | | | | 197,256 | | | | 54.38 | |
| Class R-5E | | | 178,488 | | | | 3,236 | | | | 55.16 | |
| Class R-5 | | | 9,014,908 | | | | 162,681 | | | | 55.41 | |
| Class R-6 | | | 61,746,630 | | | | 1,113,037 | | | | 55.48 | |
*Amount less than one thousand.
See Notes to Financial Statements
| 14 | EuroPacific Growth Fund |
| | |
| Statement of operations | unaudited |
| for the six months ended September 30, 2017 | (dollars in thousands) |
| | |
| Investment income: | | | | | | |
| Income: | | | | | | |
| Dividends (net of non-U.S. taxes of $143,331; also includes $124,811 from affiliates) | | $ | 1,448,051 | | | | | |
| Interest | | | 63,910 | | | $ | 1,511,961 | |
| Fees and expenses*: | | | | | | | | |
| Investment advisory services | | | 301,505 | | | | | |
| Distribution services | | | 78,413 | | | | | |
| Transfer agent services | | | 47,883 | | | | | |
| Administrative services | | | 30,779 | | | | | |
| Reports to shareholders | | | 1,883 | | | | | |
| Registration statement and prospectus | | | 2,291 | | | | | |
| Trustees’ compensation | | | 682 | | | | | |
| Auditing and legal | | | 892 | | | | | |
| Custodian | | | 11,767 | | | | | |
| Other | | | 720 | | | | 476,815 | |
| Net investment income | | | | | | | 1,035,146 | |
| | | | | | | | | |
| Net realized gain and unrealized appreciation: | | | | | | | | |
| Net realized gain (loss) on: | | | | | | | | |
| Investments (net of non-U.S. taxes of $116): | | | | | | | | |
| Unaffiliated issuers | | | 3,122,435 | | | | | |
| Affiliated issuers | | | 12,869 | | | | | |
| Forward currency contracts | | | (96,681 | ) | | | | |
| Currency transactions | | | (18,814 | ) | | | 3,019,809 | |
| Net unrealized appreciation on: | | | | | | | | |
| Investments (net of non-U.S. taxes of $195,189): | | | | | | | | |
| Unaffiliated issuers | | | 12,980,298 | | | | | |
| Affiliated issuers | | | 2,822,384 | | | | | |
| Forward currency contracts | | | 72,654 | | | | | |
| Currency translations | | | 4,809 | | | | 15,880,145 | |
| Net realized gain and unrealized appreciation | | | | | | | 18,899,954 | |
| Net increase in net assets resulting from operations | | | | | | $ | 19,935,100 | |
*Additional information related to class-specific fees and expenses is included in the Notes to Financial Statements.
See Notes to Financial Statements
| EuroPacific Growth Fund | 15 |
Statements of changes in net assets
(dollars in thousands)
| | | Six months ended
September 30,
2017* | | | Year ended
March 31,
2017 | |
| Operations: | | | | | | | | |
| Net investment income | | $ | 1,035,146 | | | $ | 1,381,363 | |
| Net realized gain | | | 3,019,809 | | | | 4,043,887 | |
| Net unrealized appreciation | | | 15,880,145 | | | | 9,840,119 | |
| Net increase in net assets resulting from operations | | | 19,935,100 | | | | 15,265,369 | |
| | | | | | | | | |
| Dividends and distributions paid to shareholders: | | | | | | | | |
| Dividends from net investment income | | | (392,556 | ) | | | (1,711,516 | ) |
| Distributions from net realized gain on investments | | | (2,614,894 | ) | | | — | |
| Total dividends and distributions paid to shareholders | | | (3,007,450 | ) | | | (1,711,516 | ) |
| | | | | | | | | |
| Net capital share transactions | | | 5,143,038 | | | | (2,837,635 | ) |
| | | | | | | | | |
| Total increase in net assets | | | 22,070,688 | | | | 10,716,218 | |
| | | | | | | | | |
| Net assets: | | | | | | | | |
| Beginning of period | | | 132,280,547 | | | | 121,564,329 | |
| End of period (including undistributed and distributions in excess of net investment income: $54,044 and $(588,546), respectively) | | $ | 154,351,235 | | | $ | 132,280,547 | |
*Unaudited.
See Notes to Financial Statements
| 16 | EuroPacific Growth Fund |
| Notes to financial statements | unaudited |
1. Organization
EuroPacific Growth Fund (the “fund“) is registered under the Investment Company Act of 1940 as an open-end, diversified management investment company. The fund seeks to provide long-term growth of capital. Shareholders approved a proposal to reorganize the fund from a Massachusetts business trust to a Delaware statutory trust. The reorganization may be completed in the next 12 months; however, the fund reserves the right to delay the implementation.
The fund has 19 share classes consisting of six retail share classes (Classes A, C, T, F-1, F-2 and F-3), five 529 college savings plan share classes (Classes 529-A, 529-C, 529-E, 529-T and 529-F-1) and eight retirement plan share classes (Classes R-1, R-2, R-2E, R-3, R-4, R-5E, R-5 and R-6). The 529 college savings plan share classes can be used to save for college education. The retirement plan share classes are generally offered only through eligible employer-sponsored retirement plans. The fund’s share classes are described further in the following table:
| Share class | | Initial sales charge | | Contingent deferred sales
charge upon redemption | | Conversion feature |
| Classes A and 529-A | | Up to 5.75% | | None (except 1% for certain redemptions within one year of purchase without an initial sales charge*) | | None |
| Class C | | None | | 1% for redemptions within one year of purchase | | Class C converts to Class F-1 after 10 years |
| Class 529-C | | None | | 1% for redemptions within one year of purchase | | None |
| Class 529-E | | None | | None | | None |
| Classes T and 529-T† | | Up to 2.50% | | None | | None |
| Classes F-1, F-2, F-3 and 529-F-1 | | None | | None | | None |
| Classes R-1, R-2, R-2E, R-3, R-4, R-5E, R-5 and R-6 | | None | | None | | None |
| * | 18 months for shares purchased on or after August 14, 2017. |
| † | Class T and 529-T shares are not available for purchase. |
Holders of all share classes have equal pro rata rights to the assets, dividends and liquidation proceeds of the fund. Each share class has identical voting rights, except for the exclusive right to vote on matters affecting only its class. Share classes have different fees and expenses (“class-specific fees and expenses”), primarily due to different arrangements for distribution, transfer agent and administrative services. Differences in class-specific fees and expenses will result in differences in net investment income and, therefore, the payment of different per-share dividends by each share class.
| EuroPacific Growth Fund | 17 |
2. Significant accounting policies
The fund is an investment company that applies the accounting and reporting guidance issued in Topic 946 by the U.S. Financial Accounting Standards Board. The fund’s financial statements have been prepared to comply with U.S. generally accepted accounting principles (“U.S. GAAP“). These principles require the fund’s investment adviser to make estimates and assumptions that affect reported amounts and disclosures. Actual results could differ from those estimates. Subsequent events, if any, have been evaluated through the date of issuance in the preparation of the financial statements. The fund follows the significant accounting policies described in this section, as well as the valuation policies described in the next section on valuation.
Cash — Cash includes amounts held in an interest bearing deposit facility.
Security transactions and related investment income — Security transactions are recorded by the fund as of the date the trades are executed with brokers. Realized gains and losses from security transactions are determined based on the specific identified cost of the securities. In the event a security is purchased with a delayed payment date, the fund will segregate liquid assets sufficient to meet its payment obligations. Dividend income is recognized on the ex-dividend date and interest income is recognized on an accrual basis. Market discounts, premiums and original issue discounts on fixed-income securities are amortized daily over the expected life of the security.
Class allocations — Income, fees and expenses (other than class-specific fees and expenses) and realized and unrealized gains and losses are allocated daily among the various share classes based on their relative net assets. Class-specific fees and expenses, such as distribution, transfer agent and administrative services, are charged directly to the respective share class.
Dividends and distributions to shareholders — Dividends and distributions to shareholders are recorded on the ex-dividend date.
Currency translation — Assets and liabilities, including investment securities, denominated in currencies other than U.S. dollars are translated into U.S. dollars at the exchange rates supplied by one or more pricing vendors on the valuation date. Purchases and sales of investment securities and income and expenses are translated into U.S. dollars at the exchange rates on the dates of such transactions. The effects of changes in exchange rates on investment securities are included with the net realized gain or loss and net unrealized appreciation or depreciation on investments in the fund’s statement of operations. The realized gain or loss and unrealized appreciation or depreciation resulting from all other transactions denominated in currencies other than U.S. dollars are disclosed separately.
| 18 | EuroPacific Growth Fund |
3. Valuation
Capital Research and Management Company (“CRMC”), the fund’s investment adviser, values the fund’s investments at fair value as defined by U.S. GAAP. The net asset value of each share class of the fund is generally determined as of approximately 4:00 p.m. New York time each day the New York Stock Exchange is open.
Methods and inputs — The fund’s investment adviser uses the following methods and inputs to establish the fair value of the fund’s assets and liabilities. Use of particular methods and inputs may vary over time based on availability and relevance as market and economic conditions evolve.
Equity securities are generally valued at the official closing price of, or the last reported sale price on, the exchange or market on which such securities are traded, as of the close of business on the day the securities are being valued or, lacking any sales, at the last available bid price. Prices for each security are taken from the principal exchange or market on which the security trades.
Fixed-income securities, including short-term securities, are generally valued at prices obtained from one or more pricing vendors. Vendors value such securities based on one or more of the inputs described in the following table. The table provides examples of inputs that are commonly relevant for valuing particular classes of fixed-income securities in which the fund is authorized to invest. However, these classifications are not exclusive, and any of the inputs may be used to value any other class of fixed-income security.
| Fixed-income class | Examples of standard inputs |
| All | Benchmark yields, transactions, bids, offers, quotations from dealers and trading systems, new issues, spreads and other relationships observed in the markets among comparable securities; and proprietary pricing models such as yield measures calculated using factors such as cash flows, financial or collateral performance and other reference data (collectively referred to as “standard inputs”) |
| Corporate bonds & notes; convertible securities | Standard inputs and underlying equity of the issuer |
| Bonds & notes of governments & government agencies | Standard inputs and interest rate volatilities |
When the fund’s investment adviser deems it appropriate to do so (such as when vendor prices are unavailable or deemed to be not representative), fixed-income securities will be valued in good faith at the mean quoted bid and ask prices that are reasonably and timely available (or bid prices, if ask prices are not available) or at prices for securities of comparable maturity, quality and type.
Securities with both fixed-income and equity characteristics, or equity securities traded principally among fixed-income dealers, are generally valued in the manner described for either equity or fixed-income securities, depending on which method is deemed most
| EuroPacific Growth Fund | 19 |
appropriate by the fund’s investment adviser. Forward currency contracts are valued at the mean of representative quoted bid and ask prices, generally based on prices supplied by one or more pricing vendors.
Securities and other assets for which representative market quotations are not readily available or are considered unreliable by the fund’s investment adviser are fair valued as determined in good faith under fair valuation guidelines adopted by authority of the fund’s board of trustees as further described. The investment adviser follows fair valuation guidelines, consistent with U.S. Securities and Exchange Commission rules and guidance, to consider relevant principles and factors when making fair value determinations. The investment adviser considers relevant indications of value that are reasonably and timely available to it in determining the fair value to be assigned to a particular security, such as the type and cost of the security; contractual or legal restrictions on resale of the security; relevant financial or business developments of the issuer; actively traded similar or related securities; conversion or exchange rights on the security; related corporate actions; significant events occurring after the close of trading in the security; and changes in overall market conditions. In addition, the closing prices of equity securities that trade in markets outside U.S. time zones may be adjusted to reflect significant events that occur after the close of local trading but before the net asset value of each share class of the fund is determined. Fair valuations and valuations of investments that are not actively trading involve judgment and may differ materially from valuations that would have been used had greater market activity occurred.
Processes and structure — The fund’s board of trustees has delegated authority to the fund’s investment adviser to make fair value determinations, subject to board oversight. The investment adviser has established a Joint Fair Valuation Committee (the “Fair Valuation Committee”) to administer, implement and oversee the fair valuation process, and to make fair value decisions. The Fair Valuation Committee regularly reviews its own fair value decisions, as well as decisions made under its standing instructions to the investment adviser’s valuation teams. The Fair Valuation Committee reviews changes in fair value measurements from period to period and may, as deemed appropriate, update the fair valuation guidelines to better reflect the results of back testing and address new or evolving issues. The Fair Valuation Committee reports any changes to the fair valuation guidelines to the board of trustees with supplemental information to support the changes. The fund’s board and audit committee also regularly review reports that describe fair value determinations and methods.
The fund’s investment adviser has also established a Fixed-Income Pricing Review Group to administer and oversee the fixed-income valuation process, including the use of fixed-income pricing vendors. This group regularly reviews pricing vendor information and market data. Pricing decisions, processes and controls over security valuation are also subject to additional internal reviews, including an annual control self-evaluation program facilitated by the investment adviser’s compliance group.
| 20 | EuroPacific Growth Fund |
Classifications — The fund’s investment adviser classifies the fund’s assets and liabilities into three levels based on the inputs used to value the assets or liabilities. Level 1 values are based on quoted prices in active markets for identical securities. Level 2 values are based on significant observable market inputs, such as quoted prices for similar securities and quoted prices in inactive markets. Certain securities trading outside the U.S. may transfer between Level 1 and Level 2 due to valuation adjustments resulting from significant market movements following the close of local trading. Level 3 values are based on significant unobservable inputs that reflect the investment adviser’s determination of assumptions that market participants might reasonably use in valuing the securities. The valuation levels are not necessarily an indication of the risk or liquidity associated with the underlying investment. For example, U.S. government securities are reflected as Level 2 because the inputs used to determine fair value may not always be quoted prices in an active market. The following tables present the fund’s valuation levels as of September 30, 2017 (dollars in thousands):
| | | Investment securities |
| | | Level 1 | | | Level 2* | | | Level 3 | | | Total | |
| Assets: | | | | | | | | | | | | | | | | |
| Common stocks: | | | | | | | | | | | | | | | | |
| Information technology | | $ | 6,553,782 | | | $ | 24,168,671 | | | $ | — | | | $ | 30,722,453 | |
| Financials | | | 2,615,025 | | | | 22,702,872 | | | | — | | | | 25,317,897 | |
| Consumer discretionary | | | 1,628,713 | | | | 16,269,185 | | | | — | | | | 17,897,898 | |
| Industrials | | | 1,131,156 | | | | 12,480,054 | | | | — | | | | 13,611,210 | |
| Consumer staples | | | 985,298 | | | | 10,838,602 | | | | — | | | | 11,823,900 | |
| Health care | | | 371,475 | | | | 8,521,288 | | | | — | | | | 8,892,763 | |
| Materials | | | 2,823,430 | | | | 5,726,881 | | | | — | | | | 8,550,311 | |
| Energy | | | 2,906,895 | | | | 4,360,626 | | | | — | | | | 7,267,521 | |
| Telecommunication services | | | — | | | | 4,417,377 | | | | — | | | | 4,417,377 | |
| Utilities | | | — | | | | 4,404,471 | | | | — | | | | 4,404,471 | |
| Real estate | | | — | | | | 1,649,503 | | | | 852 | | | | 1,650,355 | |
| Miscellaneous | | | 1,126,769 | | | | 6,296,661 | | | | — | | | | 7,423,430 | |
| Convertible bonds | | | — | | | | 60,059 | | | | — | | | | 60,059 | |
| Bonds, notes & other debt instruments | | | — | | | | 178,943 | | | | — | | | | 178,943 | |
| Short-term securities | | | — | | | | 11,578,790 | | | | — | | | | 11,578,790 | |
| Total | | $ | 20,142,543 | | | $ | 133,653,983 | | | $ | 852 | | | $ | 153,797,378 | |
See next page for footnote.
| EuroPacific Growth Fund | 21 |
| | | Other investments† |
| | | Level 1 | | | Level 2 | | | Level 3 | | | Total | |
| Assets: | | | | | | | | | | | | | | | | |
| Unrealized appreciation on open forward currency contracts | | $ | — | | | $ | 21,307 | | | $ | — | | | $ | 21,307 | |
| Liabilities: | | | | | | | | | | | | | | | | |
| Unrealized depreciation on open forward currency contracts | | | — | | | | (16,414 | ) | | | — | | | | (16,414 | ) |
| Total | | $ | — | | | $ | 4,893 | | | $ | — | | | $ | 4,893 | |
| * | Securities with a value of $119,031,564,000, which represented 77.12% of the net assets of the fund, transferred from Level 1 to Level 2 since the prior fiscal year-end, primarily due to significant market movements following the close of local trading. |
| † | Forward currency contracts are not included in the investment portfolio. |
4. Risk factors
Investing in the fund may involve certain risks including, but not limited to, those described below.
Market conditions — The prices of, and the income generated by, the common stocks and other securities held by the fund may decline — sometimes rapidly or unpredictably — due to various factors, including events or conditions affecting the general economy or particular industries; overall market changes; local, regional or global political, social or economic instability; governmental or governmental agency responses to economic conditions; and currency exchange rate, interest rate and commodity price fluctuations.
Issuer risks — The prices of, and the income generated by, securities held by the fund may decline in response to various factors directly related to the issuers of such securities, including reduced demand for an issuer’s goods or services, poor management performance and strategic initiatives such as mergers, acquisitions or dispositions and the market response to any such initiatives.
Investing in growth-oriented stocks — Growth-oriented common stocks and other equity-type securities (such as preferred stocks, convertible preferred stocks and convertible bonds) may involve larger price swings and greater potential for loss than other types of investments. These risks may be even greater in the case of smaller capitalization stocks.
Investing outside the U.S. — Securities of issuers domiciled outside the U.S., or with significant operations or revenues outside the U.S., may lose value because of adverse political, social, economic or market developments (including social instability, regional conflicts, terrorism and war) in the countries or regions in which the issuers operate or generate revenue. These securities may also lose value due to changes in foreign currency exchange rates against the U.S. dollar and/or currencies of other countries. Issuers of these securities may be more susceptible to actions of foreign governments,
| 22 | EuroPacific Growth Fund |
such as the imposition of price controls or punitive taxes, that could adversely impact the value of these securities. Securities markets in certain countries may be more volatile and/or less liquid than those in the U.S. Investments outside the U.S. may also be subject to different accounting practices and different regulatory, legal and reporting standards and practices, and may be more difficult to value, than those in the U.S. In addition, the value of investments outside the U.S. may be reduced by foreign taxes, including foreign withholding taxes on interest and dividends. Further, there may be increased risks of delayed settlement of securities purchased or sold by the fund. The risks of investing outside the U.S. may be heightened in connection with investments in emerging markets.
Investing in emerging markets — Investing in emerging markets may involve risks in addition to and greater than those generally associated with investing in the securities markets of developed countries. For instance, developing countries may have less developed legal and accounting systems than those in developed countries. The governments of these countries may be less stable and more likely to impose capital controls, nationalize a company or industry, place restrictions on foreign ownership and on withdrawing sale proceeds of securities from the country, and/or impose punitive taxes that could adversely affect the prices of securities. In addition, the economies of these countries may be dependent on relatively few industries that are more susceptible to local and global changes. Securities markets in these countries can also be relatively small and have substantially lower trading volumes. As a result, securities issued in these countries may be more volatile and less liquid, and may be more difficult to value, than securities issued in countries with more developed economies and/or markets. Less certainty with respect to security valuations may lead to additional challenges and risks in calculating the fund’s net asset value. Additionally, there may be increased settlement risks for transactions in local securities.
Management — The investment adviser to the fund actively manages the fund’s investments. Consequently, the fund is subject to the risk that the methods and analyses employed by the investment adviser in this process may not produce the desired results. This could cause the fund to lose value or its investment results to lag relevant benchmarks or other funds with similar objectives.
5. Certain investment techniques
Forward currency contracts — The fund has entered into forward currency contracts, which represent agreements to exchange currencies on specific future dates at predetermined rates. The fund’s investment adviser uses forward currency contracts to manage the fund’s exposure to changes in exchange rates. Upon entering into these contracts, risks may arise from the potential inability of counterparties to meet the terms of their contracts and from possible movements in exchange rates.
| EuroPacific Growth Fund | 23 |
On a daily basis, the fund’s investment adviser values forward currency contracts and records unrealized appreciation or depreciation for open forward currency contracts in the fund’s statement of assets and liabilities. Realized gains or losses are recorded at the time the forward currency contract is closed or offset by another contract with the same broker for the same settlement date and currency.
Closed forward currency contracts that have not reached their settlement date are included in the respective receivables or payables for closed forward currency contracts in the fund’s statement of assets and liabilities. Net realized gains or losses from closed forward currency contracts and net unrealized appreciation or depreciation from open forward currency contracts are recorded in the fund’s statement of operations. The average month-end notional amount of open forward currency contracts while held was $4,101,098,000.
The following tables present the financial statement impacts resulting from the fund’s use of forward currency contracts as of, or for the six months ended, September 30, 2017 (dollars in thousands):
| | | | | Assets | | Liabilities |
| | | | | Location on statement of | | | | Location on statement of | | |
| Contract | | Risk type | | assets and liabilities | | Value | | assets and liabilities | | Value |
| Forward currency | | Currency | | Unrealized appreciation on open forward currency contracts | | $ | 21,307 | | Unrealized depreciation on open forward currency contracts | | $ | 16,414 |
| Forward currency | | Currency | | Receivables for closed forward currency contracts | | — | | Payables for closed forward currency contracts | | 90 |
| | | | | | | $ | 21,307 | | | | $ | 16,504 |
| |
| | | | | Net realized loss | | Net unrealized appreciation |
| | | | | Location on statement of | | | | Location on statement of | | |
| Contract | | Risk type | | operations | | Value | | operations | | Value |
| Forward currency | | Currency | | Net realized loss on forward currency contracts | | $ | (96,681 | ) | Net unrealized appreciation on forward currency contracts | | $ | 72,654 |
Collateral — The fund participates in a collateral program due to its use of forward currency contracts. The program calls for the fund to either receive or pledge highly liquid assets, such as cash or U.S. Treasury bills, as collateral based on the net gain or loss on unsettled forward currency contracts by counterparty. The purpose of the collateral is to cover potential losses that could occur in the event that either party cannot meet its contractual obligations.
Rights of offset — The fund has entered into enforceable master netting agreements with certain counterparties for forward currency contracts, where on any date amounts payable by each party to the other (in the same currency with respect to the same transaction) may be closed or offset by each party’s payment obligation. If an early
| 24 | EuroPacific Growth Fund |
termination date occurs under these agreements following an event of default or termination event, all obligations of each party to its counterparty are settled net through a single payment in a single currency (“close-out netting“). For financial reporting purposes, the fund does not offset financial assets and financial liabilities that are subject to these master netting arrangements in the statement of assets and liabilities.
The following table presents the fund’s forward currency contracts by counterparty that are subject to master netting agreements but that are not offset in the fund’s statement of assets and liabilities. The net amount column shows the impact of offsetting on the fund’s statement of assets and liabilities as of September 30, 2017, if close-out netting was exercised (dollars in thousands):
| | | | | | Gross amounts not offset in the | | | | |
| | | Gross amounts | | | statement of assets and liabilities and | | | | |
| | | recognized in the | | | subject to a master netting agreement | | | | |
| | | statement of assets | | | Available | | | Non-cash | | | Cash | | | Net | |
| Counterparty | | and liabilities | | | to offset | | | collateral* | | | collateral | | | amount | |
| Assets: | | | | | | | | | | | | | | | | | | | | |
| Bank of America, N.A. | | $ | 11,419 | | | $ | — | | | $ | (11,419 | ) | | $ | — | | | $ | — | |
| Barclays Bank PLC | | | 3,807 | | | | — | | | | (960 | ) | | | (2,645 | ) | | | 202 | |
| HSBC Bank | | | 4,902 | | | | — | | | | (4,491 | ) | | | — | | | | 411 | |
| JPMorgan Chase | | | 1,179 | | | | (90 | ) | | | (1,089 | ) | | | — | | | | — | |
| Total | | $ | 21,307 | | | $ | (90 | ) | | $ | (17,959 | ) | | $ | (2,645 | ) | | $ | 613 | |
| Liabilities: | | | | | | | | | | | | | | | | | | | | |
| Citibank | | $ | 8,318 | | | $ | — | | | $ | (8,047 | ) | | $ | — | | | $ | 271 | |
| JPMorgan Chase | | | 90 | | | | (90 | ) | | | — | | | | — | | | | — | |
| UBS AG | | | 8,096 | | | | — | | | | (8,095 | ) | | | — | | | | 1 | |
| Total | | $ | 16,504 | | | $ | (90 | ) | | $ | (16,142 | ) | | $ | — | | | $ | 272 | |
*Non-cash collateral is shown on a settlement basis.
6. Taxation and distributions
Federal income taxation — The fund complies with the requirements under Subchapter M of the Internal Revenue Code applicable to mutual funds and intends to distribute substantially all of its net taxable income and net capital gains each year. The fund is not subject to income taxes to the extent such distributions are made. Therefore, no federal income tax provision is required.
As of and during the period ended September 30, 2017, the fund did not have a liability for any unrecognized tax benefits. The fund recognizes interest and penalties, if any, related to unrecognized tax benefits as income tax expense in the statement of operations. During the period, the fund did not incur any interest or penalties.
The fund is not subject to examination by U.S. federal tax authorities for tax years before 2013, by state tax authorities for tax years before 2012 and by tax authorities outside the U.S. for tax years before 2010.
| EuroPacific Growth Fund | 25 |
Non-U.S. taxation — Dividend and interest income are recorded net of non-U.S. taxes paid. The fund may file withholding tax reclaims in certain jurisdictions to recover a portion of amounts previously withheld. As a result of rulings from European courts, the fund filed for additional reclaims related to prior years. These reclaims are recorded when the amount is known and there are no significant uncertainties on collectability. Gains realized by the fund on the sale of securities in certain countries, if any, may be subject to non-U.S. taxes. If applicable, the fund records an estimated deferred tax liability based on unrealized gains to provide for potential non-U.S. taxes payable upon the sale of these securities.
Distributions — Distributions paid to shareholders are based on net investment income and net realized gains determined on a tax basis, which may differ from net investment income and net realized gains for financial reporting purposes. These differences are due primarily to different treatment for items such as currency gains and losses; short-term capital gains and losses; capital losses related to sales of certain securities within 30 days of purchase; unrealized appreciation of certain investments in securities outside the U.S.; cost of investments sold and income on certain investments. The fiscal year in which amounts are distributed may differ from the year in which the net investment income and net realized gains are recorded by the fund for financial reporting purposes.
The components of distributable earnings on a tax basis are reported as of the fund’s most recent year-end. As of March 31, 2017, the components of distributable earnings on a tax basis were as follows (dollars in thousands):
| Undistributed ordinary income | | $ | 392,208 | |
| Undistributed long-term capital gains | | | 2,613,795 | |
As of September 30, 2017, the tax basis unrealized appreciation (depreciation) and cost of investments were as follows (dollars in thousands):
| Gross unrealized appreciation on investments | | $ | 52,295,855 | |
| Gross unrealized depreciation on investments | | | (3,388,735 | ) |
| Net unrealized appreciation on investments | | | 48,907,120 | |
| Cost of investments | | | 104,895,151 | |
| 26 | EuroPacific Growth Fund |
The tax character of distributions paid to shareholders was as follows (dollars in thousands):
| | | Six months ended September 30, 2017 | | | Year ended March 31, 2017 |
| | | | | | | | | Total | | | | | | | | | | |
| | | | | | | | | dividends and | | | | | | | | | Total | |
| | | Ordinary | | | Long-term | | | distributions | | | Ordinary | | | Long-term | | | dividends | |
| Share class | | income | | | capital gains | | | paid | | | income | | | capital gains | | | paid | |
| Class A | | $ | 63,943 | | | $ | 495,361 | | | $ | 559,304 | | | $ | 300,737 | | | $ | — | | | $ | 300,737 | |
| Class B1 | | | — | | | | — | | | | — | | | | — | | | | — | | | | — | |
| Class C | | | 614 | | | | 23,902 | | | | 24,516 | | | | 4,442 | | | | — | | | | 4,442 | |
| Class T2 | | | — | 3 | | | — | 3 | | | — | 3 | | | | | | | | | | | | |
| Class F-1 | | | 10,242 | | | | 81,718 | | | | 91,960 | | | | 46,706 | | | | — | | | | 46,706 | |
| Class F-2 | | | 69,486 | | | | 440,474 | | | | 509,960 | | | | 317,393 | | | | — | | | | 317,393 | |
| Class F-34 | | | 9,201 | | | | 52,029 | | | | 61,230 | | | | — | | | | — | | | | — | |
| Class 529-A | | | 2,874 | | | | 23,230 | | | | 26,104 | | | | 13,138 | | | | — | | | | 13,138 | |
| Class 529-B1 | | | — | | | | — | | | | — | | | | — | | | | — | | | | — | |
| Class 529-C | | | 214 | | | | 6,870 | | | | 7,084 | | | | 1,422 | | | | — | | | | 1,422 | |
| Class 529-E | | | 115 | | | | 1,191 | | | | 1,306 | | | | 547 | | | | — | | | | 547 | |
| Class 529-T2 | | | — | 3 | | | — | 3 | | | — | 3 | | | | | | | | | | | | |
| Class 529-F-1 | | | 309 | | | | 2,066 | | | | 2,375 | | | | 1,325 | | | | — | | | | 1,325 | |
| Class R-1 | | | 166 | | | | 4,881 | | | | 5,047 | | | | 1,303 | | | | — | | | | 1,303 | |
| Class R-2 | | | 557 | | | | 15,192 | | | | 15,749 | | | | 3,686 | | | | — | | | | 3,686 | |
| Class R-2E | | | 300 | | | | 3,849 | | | | 4,149 | | | | 1,976 | | | | — | | | | 1,976 | |
| Class R-3 | | | 7,967 | | | | 88,393 | | | | 96,360 | | | | 41,451 | | | | — | | | | 41,451 | |
| Class R-4 | | | 24,422 | | | | 192,297 | | | | 216,719 | | | | 120,004 | | | | — | | | | 120,004 | |
| Class R-5E | | | 437 | | | | 2,476 | | | | 2,913 | | | | 70 | | | | — | | | | 70 | |
| Class R-5 | | | 27,104 | | | | 164,368 | | | | 191,472 | | | | 129,449 | | | | — | | | | 129,449 | |
| Class R-6 | | | 174,605 | | | | 1,016,597 | | | | 1,191,202 | | | | 727,867 | | | | — | | | | 727,867 | |
| Total | | $ | 392,556 | | | $ | 2,614,894 | | | $ | 3,007,450 | | | $ | 1,711,516 | | | $ | — | | | $ | 1,711,516 | |
| | |
| 1 | Class B and 529-B shares were fully liquidated on May 5, 2017. |
| 2 | Class T and 529-T shares began investment operations on April 7, 2017. |
| 3 | Amount less than one thousand. |
| 4 | Class F-3 shares began investment operations on January 27, 2017. |
| EuroPacific Growth Fund | 27 |
7. Fees and transactions with related parties
CRMC, the fund’s investment adviser, is the parent company of American Funds Distributors,® Inc. (“AFD”), the principal underwriter of the fund’s shares, and American Funds Service Company® (“AFS”), the fund’s transfer agent. CRMC, AFD and AFS are considered related parties to the fund.
Investment advisory services — The fund has an investment advisory and service agreement with CRMC that provides for monthly fees accrued daily. These fees are based on a series of decreasing annual rates beginning with 0.690% on the first $500 million of daily net assets and decreasing to 0.394% on such assets in excess of $144 billion. For the six months ended September 30, 2017, the investment advisory services fee was $301,505,000, which was equivalent to an annualized rate of 0.416% of average daily net assets.
Class-specific fees and expenses — Expenses that are specific to individual share classes are accrued directly to the respective share class. The principal class-specific fees and expenses are further described below:
Distribution services — The fund has plans of distribution for all share classes, except Class F-2, F-3, R-5E, R-5 and R-6 shares. Under the plans, the board of trustees approves certain categories of expenses that are used to finance activities primarily intended to sell fund shares and service existing accounts. The plans provide for payments, based on an annualized percentage of average daily net assets, ranging from 0.25% to 1.00% as noted in this section. In some cases, the board of trustees has limited the amounts that may be paid to less than the maximum allowed by the plans. All share classes with a plan may use up to 0.25% of average daily net assets to pay service fees, or to compensate AFD for paying service fees, to firms that have entered into agreements with AFD to provide certain shareholder services. The remaining amounts available to be paid under each plan are paid to dealers to compensate them for their sales activities.
| Share class | | Currently approved limits | | Plan limits |
| Class A | | | 0.25 | % | | | 0.25 | % |
| Class 529-A | | | 0.25 | | | | 0.50 | |
| Classes C, 529-C and R-1 | | | 1.00 | | | | 1.00 | |
| Class R-2 | | | 0.75 | | | | 1.00 | |
| Class R-2E | | | 0.60 | | | | 0.85 | |
| Classes 529-E and R-3 | | | 0.50 | | | | 0.75 | |
| Classes T, F-1, 529-T, 529-F-1 and R-4 | | | 0.25 | | | | 0.50 | |
For Class A and 529-A shares, distribution-related expenses include the reimbursement of dealer and wholesaler commissions paid by AFD for certain shares sold without a sales charge. These share classes reimburse AFD for amounts
| 28 | EuroPacific Growth Fund |
billed within the prior 15 months but only to the extent that the overall annual expense limits are not exceeded. As of September 30, 2017, there were no unreimbursed expenses subject to reimbursement for Class A or 529-A shares.
Transfer agent services — The fund has a shareholder services agreement with AFS under which the fund compensates AFS for providing transfer agent services to each of the fund’s share classes. These services include recordkeeping, shareholder communications and transaction processing. In addition, the fund reimburses AFS for amounts paid to third parties for performing transfer agent services on behalf of fund shareholders.
Administrative services — The fund has an administrative services agreement with CRMC under which the fund compensates CRMC for providing administrative services to Class A, C, T, F, 529 and R shares. These services include, but are not limited to, coordinating, monitoring, assisting and overseeing third parties that provide services to fund shareholders. Under the agreement, Class A shares pay an annual fee of 0.01% and Class C, T, F, 529 and R shares pay an annual fee of 0.05% of their respective average daily net assets.
529 plan services — Each 529 share class is subject to service fees to compensate the Virginia College Savings Plan (“Virginia529“) for its oversight and administration of the 529 college savings plan. The quarterly fee is based on a series of decreasing annual rates beginning with 0.10% on the first $20 billion of the net assets invested in the Class 529 shares of the American Funds and decreasing to 0.03% on such assets in excess of $100 billion. The fee for any given calendar quarter is accrued and calculated on the basis of the average net assets of Class 529 shares of the American Funds for the last month of the prior calendar quarter. The fee is included in other expenses in the fund’s statement of operations. Virginia529 is not considered a related party to the fund.
| EuroPacific Growth Fund | 29 |
For the six months ended September 30, 2017, class-specific expenses under the agreements were as follows (dollars in thousands):
| | | Distribution | | | Transfer agent | | | Administrative | | | 529 plan | |
| Share class | | services | | | services | | | services | | | services | |
| Class A | | | $33,320 | | | | $18,613 | | | | $1,367 | | | Not applicable | |
| Class B1 | | | 1 | | | | — | 2 | | | Not applicable | | | Not applicable | |
| Class C | | | 6,460 | | | | 815 | | | | 323 | | | Not applicable | |
| Class T3 | | | — | | | | — | 2 | | | — | 2 | | Not applicable | |
| Class F-1 | | | 5,549 | | | | 2,701 | | | | 1,110 | | | Not applicable | |
| Class F-2 | | | Not applicable | | | | 12,459 | | | | 5,808 | | | Not applicable | |
| Class F-3 | | | Not applicable | | | | 188 | | | | 1,085 | | | Not applicable | |
| Class 529-A | | | 1,379 | | | | 646 | | | | 318 | | | $430 | |
| Class 529-B1 | | | — | 2 | | | — | 2 | | | — | 2 | | — | 2 |
| Class 529-C | | | 1,815 | | | | 200 | | | | 92 | | | 124 | |
| Class 529-E | | | 160 | | | | 19 | | | | 16 | | | 22 | |
| Class 529-T3 | | | — | | | | — | 2 | | | — | 2 | | — | 2 |
| Class 529-F-1 | | | — | | | | 57 | | | | 28 | | | 39 | |
| Class R-1 | | | 1,298 | | | | 140 | | | | 65 | | | Not applicable | |
| Class R-2 | | | 3,000 | | | | 1,381 | | | | 202 | | | Not applicable | |
| Class R-2E | | | 641 | | | | 203 | | | | 53 | | | Not applicable | |
| Class R-3 | | | 11,738 | | | | 3,347 | | | | 1,174 | | | Not applicable | |
| Class R-4 | | | 13,052 | | | | 4,940 | | | | 2,617 | | | Not applicable | |
| Class R-5E | | | Not applicable | | | | 59 | | | | 27 | | | Not applicable | |
| Class R-5 | | | Not applicable | | | | 2,031 | | | | 2,237 | | | Not applicable | |
| Class R-6 | | | Not applicable | | | | 84 | | | | 14,257 | | | Not applicable | |
| Total class-specific expenses | | | $78,413 | | | | $47,883 | | | | $30,779 | | | $615 | |
| 1 | Class B and 529-B shares were fully liquidated on May 5, 2017. |
| 2 | Amount less than one thousand. |
| 3 | Class T and 529-T shares began investment operations on April 7, 2017. |
Trustees’ deferred compensation — Trustees who are unaffiliated with CRMC may elect to defer the cash payment of part or all of their compensation. These deferred amounts, which remain as liabilities of the fund, are treated as if invested in shares of the fund or other American Funds. These amounts represent general, unsecured liabilities of the fund and vary according to the total returns of the selected funds. Trustees’ compensation of $682,000 in the fund’s statement of operations reflects $251,000 in current fees (either paid in cash or deferred) and a net increase of $431,000 in the value of the deferred amounts.
Affiliated officers and trustees — Officers and certain trustees of the fund are or may be considered to be affiliated with CRMC, AFD and AFS. No affiliated officers or trustees received any compensation directly from the fund.
Security transactions with related funds — The fund may purchase from, or sell securities to, other funds managed by CRMC (or funds managed by certain affiliates of CRMC) under procedures adopted by the fund’s board of trustees. The funds involved in such transactions are considered related by virtue of having a common investment adviser (or affiliated investment advisers), common trustees and/or common officers. When such
| 30 | EuroPacific Growth Fund |
transactions occur, each transaction is executed at the current market price of the security and no brokerage commissions or fees are paid in accordance with Rule 17a-7 of the 1940 Act.
Interfund lending — Pursuant to an exemptive order issued by the SEC, the fund, along with other CRMC-managed funds (or funds managed by certain affiliates of CRMC), may participate in an interfund lending program. The program provides an alternate credit facility that permits the funds to lend or borrow cash for temporary purposes directly to or from one another, subject to the conditions of the exemptive order. The fund did not lend or borrow cash through the interfund lending program at any time during the six months ended September 30, 2017.
8. Capital share transactions
Capital share transactions in the fund were as follows (dollars and shares in thousands):
| | | | | | Reinvestments of | | | | | | | |
| | | | | | dividends and | | | | | | Net (decrease) | |
| | | Sales1 | | | distributions | | | Repurchases1 | | | increase | |
| Share class | | Amount | | | Shares | | | Amount | | | Shares | | | Amount | | | Shares | | | Amount | | | Shares | |
| | | | | | | | | | | | | | | | | | | | | | | | | |
| Six months ended September 30, 2017 |
| | | | | | | | | | | | | | | | | | | | | | | | | | | | | | | | | |
| Class A | | $ | 1,274,871 | | | | 24,176 | | | $ | 548,519 | | | | 10,550 | | | $ | (2,297,838 | ) | | | (43,686 | ) | | $ | (474,448 | ) | | | (8,960 | ) |
| Class B2 | | | — | 3 | | | — | 3 | | | — | | | | — | | | | (3,850 | ) | | | (78 | ) | | | (3,850 | ) | | | (78 | ) |
| Class C | | | 126,937 | | | | 2,459 | | | | 24,196 | | | | 476 | | | | (210,173 | ) | | | (4,100 | ) | | | (59,040 | ) | | | (1,165 | ) |
| Class T4 | | | 10 | | | | — | 3 | | | — | | | | — | | | | — | | | | — | | | | 10 | | | | — | 3 |
| Class F-1 | | | 541,866 | | | | 10,329 | | | | 89,623 | | | | 1,732 | | | | (896,337 | ) | | | (16,892 | ) | | | (264,848 | ) | | | (4,831 | ) |
| Class F-2 | | | 3,986,521 | | | | 75,646 | | | | 482,276 | | | | 9,300 | | | | (6,652,903 | ) | | | (127,056 | ) | | | (2,184,106 | ) | | | (42,110 | ) |
| Class F-3 | | | 5,733,011 | | | | 109,146 | | | | 57,561 | | | | 1,107 | | | | (357,428 | ) | | | (6,631 | ) | | | 5,433,144 | | | | 103,622 | |
| Class 529-A | | | 65,054 | | | | 1,247 | | | | 26,097 | | | | 508 | | | | (73,931 | ) | | | (1,409 | ) | | | 17,220 | | | | 346 | |
| Class 529-B2 | | | — | 3 | | | — | 3 | | | — | | | | — | | | | (378 | ) | | | (8 | ) | | | (378 | ) | | | (8 | ) |
| Class 529-C | | | 17,011 | | | | 333 | | | | 7,081 | | | | 141 | | | | (28,067 | ) | | | (549 | ) | | | (3,975 | ) | | | (75 | ) |
| Class 529-E | | | 3,695 | | | | 71 | | | | 1,305 | | | | 26 | | | | (4,483 | ) | | | (86 | ) | | | 517 | | | | 11 | |
| Class 529-T4 | | | 10 | | | | — | 3 | | | — | 3 | | | — | 3 | | | — | | | | — | | | | 10 | | | | — | 3 |
| Class 529-F-1 | | | 12,439 | | | | 239 | | | | 2,375 | | | | 46 | | | | (7,354 | ) | | | (140 | ) | | | 7,460 | | | | 145 | |
| Class R-1 | | | 16,644 | | | | 327 | | | | 5,047 | | | | 101 | | | | (31,509 | ) | | | (620 | ) | | | (9,818 | ) | | | (192 | ) |
| Class R-2 | | | 91,130 | | | | 1,784 | | | | 15,725 | | | | 311 | | | | (134,098 | ) | | | (2,634 | ) | | | (27,243 | ) | | | (539 | ) |
| Class R-2E | | | 24,307 | | | | 469 | | | | 4,149 | | | | 81 | | | | (7,666 | ) | | | (147 | ) | | | 20,790 | | | | 403 | |
| Class R-3 | | | 480,501 | | | | 9,331 | | | | 96,300 | | | | 1,891 | | | | (900,136 | ) | | | (17,429 | ) | | | (323,335 | ) | | | (6,207 | ) |
| Class R-4 | | | 1,198,741 | | | | 23,246 | | | | 216,645 | | | | 4,250 | | | | (1,762,881 | ) | | | (34,044 | ) | | | (347,495 | ) | | | (6,548 | ) |
| Class R-5E | | | 167,683 | | | | 3,197 | | | | 2,913 | | | | 56 | | | | (10,712 | ) | | | (200 | ) | | | 159,884 | | | | 3,053 | |
| Class R-5 | | | 873,223 | | | | 16,588 | | | | 191,263 | | | | 3,685 | | | | (1,817,751 | ) | | | (34,790 | ) | | | (753,265 | ) | | | (14,517 | ) |
| Class R-6 | | | 7,551,349 | | | | 143,475 | | | | 1,185,662 | | | | 22,823 | | | | (4,781,207 | ) | | | (90,503 | ) | | | 3,955,804 | | | | 75,795 | |
| Total net increase (decrease) | | $ | 22,165,003 | | | | 422,063 | | | $ | 2,956,737 | | | | 57,084 | | | $ | (19,978,702 | ) | | | (381,002 | ) | | $ | 5,143,038 | | | | 98,145 | |
See next page for footnotes.
| EuroPacific Growth Fund | 31 |
| | | | | | Reinvestments of | | | | | | Net (decrease) | |
| | | Sales1 | | | dividends | | | Repurchases1 | | | increase | |
| Share class | | Amount | | | Shares | | | Amount | | | Shares | | | Amount | | | Shares | | | Amount | | | Shares | |
| | | | | | | | | | | | | | | | | | | | | | | | | |
| Year ended March 31, 2017 | | | | | | | | | | | | | | | | | | | | | | |
| | | | | | | | | | | | | | | | | | | | | | | | | | | | | | | | | |
| Class A | | $ | 1,849,987 | | | | 40,081 | | | $ | 293,229 | | | | 6,513 | | | $ | (5,789,900 | ) | | | (125,416 | ) | | $ | (3,646,684 | ) | | | (78,822 | ) |
| Class B | | | 226 | | | | 5 | | | | — | | | | — | | | | (53,639 | ) | | | (1,164 | ) | | | (53,413 | ) | | | (1,159 | ) |
| Class C | | | 125,247 | | | | 2,778 | | | | 4,348 | | | | 98 | | | | (504,610 | ) | | | (11,223 | ) | | | (375,015 | ) | | | (8,347 | ) |
| Class F-1 | | | 838,435 | | | | 18,237 | | | | 45,045 | | | | 1,005 | | | | (1,433,894 | ) | | | (31,225 | ) | | | (550,414 | ) | | | (11,983 | ) |
| Class F-2 | | | 7,158,147 | | | | 154,265 | | | | 292,300 | | | | 6,513 | | | | (6,192,781 | ) | | | (132,780 | ) | | | 1,257,666 | | | | 27,998 | |
| Class F-35 | | | 1,146,977 | | | | 23,623 | | | | — | | | | — | | | | (3,073 | ) | | | (62 | ) | | | 1,143,904 | | | | 23,561 | |
| Class 529-A | | | 102,696 | | | | 2,249 | | | | 13,136 | | | | 295 | | | | (167,766 | ) | | | (3,681 | ) | | | (51,934 | ) | | | (1,137 | ) |
| Class 529-B | | | 84 | | | | 2 | | | | — | | | | — | | | | (7,735 | ) | | | (170 | ) | | | (7,651 | ) | | | (168 | ) |
| Class 529-C | | | 30,837 | | | | 693 | | | | 1,422 | | | | 33 | | | | (59,566 | ) | | | (1,336 | ) | | | (27,307 | ) | | | (610 | ) |
| Class 529-E | | | 5,550 | | | | 123 | | | | 547 | | | | 12 | | | | (9,123 | ) | | | (202 | ) | | | (3,026 | ) | | | (67 | ) |
| Class 529-F-1 | | | 18,435 | | | | 402 | | | | 1,324 | | | | 30 | | | | (18,027 | ) | | | (396 | ) | | | 1,732 | | | | 36 | |
| Class R-1 | | | 38,474 | | | | 865 | | | | 1,303 | | | | 30 | | | | (67,425 | ) | | | (1,514 | ) | | | (27,648 | ) | | | (619 | ) |
| Class R-2 | | | 161,681 | | | | 3,600 | | | | 3,677 | | | | 84 | | | | (280,184 | ) | | | (6,255 | ) | | | (114,826 | ) | | | (2,571 | ) |
| Class R-2E | | | 180,964 | | | | 4,101 | | | | 1,976 | | | | 44 | | | | (20,947 | ) | | | (455 | ) | | | 161,993 | | | | 3,690 | |
| Class R-3 | | | 816,899 | | | | 18,069 | | | | 41,415 | | | | 938 | | | | (1,879,284 | ) | | | (41,630 | ) | | | (1,020,970 | ) | | | (22,623 | ) |
| Class R-4 | | | 1,799,825 | | | | 39,879 | | | | 119,988 | | | | 2,717 | | | | (4,449,180 | ) | | | (99,122 | ) | | | (2,529,367 | ) | | | (56,526 | ) |
| Class R-5E | | | 8,904 | | | | 189 | | | | 70 | | | | 2 | | | | (341 | ) | | | (8 | ) | | | 8,633 | | | | 183 | |
| Class R-5 | | | 1,719,794 | | | | 37,373 | | | | 129,324 | | | | 2,880 | | | | (3,340,903 | ) | | | (73,021 | ) | | | (1,491,785 | ) | | | (32,768 | ) |
| Class R-6 | | | 12,538,147 | | | | 272,818 | | | | 724,851 | | | | 16,126 | | | | (8,774,521 | ) | | | (190,045 | ) | | | 4,488,477 | | | | 98,899 | |
| Total net increase (decrease) | | $ | 28,541,309 | | | | 619,352 | | | $ | 1,673,955 | | | | 37,320 | | | $ | (33,052,899 | ) | | | (719,705 | ) | | $ | (2,837,635 | ) | | | (63,033 | ) |
| 1 | Includes exchanges between share classes of the fund. |
| 2 | Class B and 529-B shares were fully liquidated on May 5, 2017. |
| 3 | Amount less than one thousand. |
| 4 | Class T and 529-T shares began investment operations on April 7, 2017. |
| 5 | Class F-3 shares began investment operations on January 27, 2017. |
| 32 | EuroPacific Growth Fund |
9. Investment transactions
The fund made purchases and sales of investment securities, excluding short-term securities and U.S. government obligations, if any, of $22,668,180,000 and $19,580,472,000, respectively, during the six months ended September 30, 2017.
| EuroPacific Growth Fund | 33 |
Financial highlights
| | | | | | Income (loss) from investment operations1 | |
| | | Net asset | | | | | | Net gains (losses) | | | | |
| | | value, | | | Net | | | on securities (both | | | Total from | |
| | | beginning | | | investment | | | realized and | | | investment | |
| Period ended | | of period | | | income2 | | | unrealized) | | | operations | |
| Class A: | | | | | | | | | | | | | | | | |
| 9/30/20174,5 | | $ | 49.30 | | | $ | .33 | | | $ | 6.91 | | | $ | 7.24 | |
| 3/31/2017 | | | 44.28 | | | | .44 | | | | 5.14 | | | | 5.58 | |
| 3/31/2016 | | | 49.91 | | | | .44 | | | | (4.68 | ) | | | (4.24 | ) |
| 3/31/2015 | | | 49.37 | | | | .43 | | | | .76 | | | | 1.19 | |
| 3/31/2014 | | | 42.38 | | | | .69 | | | | 6.75 | | | | 7.44 | |
| 3/31/2013 | | | 39.47 | | | | .58 | | | | 3.02 | | | | 3.60 | |
| Class C: | | | | | | | | | | | | | | | | |
| 9/30/20174,5 | | | 48.19 | | | | .12 | | | | 6.76 | | | | 6.88 | |
| 3/31/2017 | | | 43.25 | | | | .08 | | | | 5.02 | | | | 5.10 | |
| 3/31/2016 | | | 48.75 | | | | .06 | | | | (4.56 | ) | | | (4.50 | ) |
| 3/31/2015 | | | 48.22 | | | | .05 | | | | .73 | | | | .78 | |
| 3/31/2014 | | | 41.41 | | | | .32 | | | | 6.59 | | | | 6.91 | |
| 3/31/2013 | | | 38.57 | | | | .28 | | | | 2.92 | | | | 3.20 | |
| Class T: | | | | | | | | | | | | | | | | |
| 9/30/20174,5,8 | | | 49.19 | | | | .38 | | | | 7.03 | | | | 7.41 | |
| Class F-1: | | | | | | | | | | | | | | | | |
| 9/30/20174,5 | | | 49.08 | | | | .33 | | | | 6.87 | | | | 7.20 | |
| 3/31/2017 | | | 44.08 | | | | .43 | | | | 5.11 | | | | 5.54 | |
| 3/31/2016 | | | 49.67 | | | | .41 | | | | (4.64 | ) | | | (4.23 | ) |
| 3/31/2015 | | | 49.10 | | | | .45 | | | | .71 | | | | 1.16 | |
| 3/31/2014 | | | 42.15 | | | | .67 | | | | 6.72 | | | | 7.39 | |
| 3/31/2013 | | | 39.27 | | | | .57 | | | | 3.01 | | | | 3.58 | |
| Class F-2: | | | | | | | | | | | | | | | | |
| 9/30/20174,5 | | | 49.17 | | | | .40 | | | | 6.90 | | | | 7.30 | |
| 3/31/2017 | | | 44.19 | | | | .55 | | | | 5.12 | | | | 5.67 | |
| 3/31/2016 | | | 49.82 | | | | .56 | | | | (4.68 | ) | | | (4.12 | ) |
| 3/31/2015 | | | 49.32 | | | | .53 | | | | .76 | | | | 1.29 | |
| 3/31/2014 | | | 42.33 | | | | .82 | | | | 6.74 | | | | 7.56 | |
| 3/31/2013 | | | 39.44 | | | | .66 | | | | 3.05 | | | | 3.71 | |
| Class F-3: | | | | | | | | | | | | | | | | |
| 9/30/20174,5 | | | 49.32 | | | | .38 | | | | 6.96 | | | | 7.34 | |
| 3/31/20174,11 | | | 47.46 | | | | .24 | | | | 1.62 | | | | 1.86 | |
| 34 | EuroPacific Growth Fund |
| Dividends and distributions | | | | | | | | | | | | | | | | |
| Dividends | | | | | | Total | | | | | | | | | | �� | | Ratio of | | | Ratio of net | |
| (from net | | | Distributions | | | dividends | | | Net asset | | | | | | Net assets, | | | expenses | | | income | |
| investment | | | (from capital | | | and | | | value, end | | | Total | | | end of period | | | to average | | | to average | |
| income) | | | gains) | | | distributions | | | of period | | | return3 | | | (in millions) | | | net assets | | | net assets2 | |
| | | | | | | | | | | | | | | | | | | | | | | |
| $ | (.12 | ) | | $ | (.96 | ) | | $ | (1.08 | ) | | $ | 55.46 | | | | 14.85 | %6 | | $ | 28,391 | | | | .83 | %7 | | | 1.26 | %7 |
| | (.56 | ) | | | — | | | | (.56 | ) | | | 49.30 | | | | 12.72 | | | | 25,678 | | | | .85 | | | | .95 | |
| | (.80 | ) | | | (.59 | ) | | | (1.39 | ) | | | 44.28 | | | | (8.60 | ) | | | 26,556 | | | | .83 | | | | .92 | |
| | (.65 | ) | | | — | | | | (.65 | ) | | | 49.91 | | | | 2.48 | | | | 30,770 | | | | .83 | | | | .88 | |
| | (.45 | ) | | | — | | | | (.45 | ) | | | 49.37 | | | | 17.57 | | | | 32,295 | | | | .84 | | | | 1.50 | |
| | (.69 | ) | | | — | | | | (.69 | ) | | | 42.38 | | | | 9.19 | | | | 29,939 | | | | .86 | | | | 1.48 | |
| |
| | (.02 | ) | | | (.96 | ) | | | (.98 | ) | | | 54.09 | | | | 14.42 | 6 | | | 1,329 | | | | 1.61 | 7 | | | .48 | 7 |
| | (.16 | ) | | | — | | | | (.16 | ) | | | 48.19 | | | | 11.82 | | | | 1,240 | | | | 1.63 | | | | .17 | |
| | (.41 | ) | | | (.59 | ) | | | (1.00 | ) | | | 43.25 | | | | (9.30 | ) | | | 1,474 | | | | 1.62 | | | | .13 | |
| | (.25 | ) | | | — | | | | (.25 | ) | | | 48.75 | | | | 1.65 | | | | 1,803 | | | | 1.61 | | | | .11 | |
| | (.10 | ) | | | — | | | | (.10 | ) | | | 48.22 | | | | 16.69 | | | | 1,990 | | | | 1.62 | | | | .72 | |
| | (.36 | ) | | | — | | | | (.36 | ) | | | 41.41 | | | | 8.34 | | | | 1,896 | | | | 1.63 | | | | .73 | |
| |
| | (.12 | ) | | | (.96 | ) | | | (1.08 | ) | | | 55.52 | | | | 15.23 | 6,9 | | | — | 10 | | | .30 | 6,9 | | | .71 | 6,9 |
| |
| | (.12 | ) | | | (.96 | ) | | | (1.08 | ) | | | 55.20 | | | | 14.83 | 6 | | | 4,434 | | | | .86 | 7 | | | 1.23 | 7 |
| | (.54 | ) | | | — | | | | (.54 | ) | | | 49.08 | | | | 12.69 | | | | 4,179 | | | | .87 | | | | .93 | |
| | (.77 | ) | | | (.59 | ) | | | (1.36 | ) | | | 44.08 | | | | (8.60 | ) | | | 4,281 | | | | .86 | | | | .86 | |
| | (.59 | ) | | | — | | | | (.59 | ) | | | 49.67 | | | | 2.43 | | | | 6,773 | | | | .86 | | | | .93 | |
| | (.44 | ) | | | — | | | | (.44 | ) | | | 49.10 | | | | 17.55 | | | | 9,425 | | | | .87 | | | | 1.47 | |
| | (.70 | ) | | | — | | | | (.70 | ) | | | 42.15 | | | | 9.19 | | | | 8,288 | | | | .85 | | | | 1.45 | |
| |
| | (.15 | ) | | | (.96 | ) | | | (1.11 | ) | | | 55.36 | | | | 15.02 | 6 | | | 23,503 | | | | .60 | 7 | | | 1.51 | 7 |
| | (.69 | ) | | | — | | | | (.69 | ) | | | 49.17 | | | | 12.99 | | | | 22,949 | | | | .60 | | | | 1.19 | |
| | (.92 | ) | | | (.59 | ) | | | (1.51 | ) | | | 44.19 | | | | (8.36 | ) | | | 19,386 | | | | .60 | | | | 1.18 | |
| | (.79 | ) | | | — | | | | (.79 | ) | | | 49.82 | | | | 2.69 | | | | 16,273 | | | | .59 | | | | 1.06 | |
| | (.57 | ) | | | — | | | | (.57 | ) | | | 49.32 | | | | 17.90 | | | | 10,714 | | | | .59 | | | | 1.78 | |
| | (.82 | ) | | | — | | | | (.82 | ) | | | 42.33 | | | | 9.47 | | | | 7,828 | | | | .59 | | | | 1.67 | |
| |
| | (.17 | ) | | | (.96 | ) | | | (1.13 | ) | | | 55.53 | | | | 15.04 | 6 | | | 7,062 | | | | .50 | 7 | | | 1.43 | 7 |
| | — | | | | — | | | | — | | | | 49.32 | | | | 3.92 | 6 | | | 1,162 | | | | .09 | 6 | | | .50 | 6 |
See page 41 for footnotes.
| EuroPacific Growth Fund | 35 |
Financial highlights (continued)
| | | | | | Income (loss) from investment operations1 | |
| | | Net asset | | | | | | Net gains (losses) | | | | |
| | | value, | | | Net | | | on securities (both | | | Total from | |
| | | beginning | | | investment | | | realized and | | | investment | |
| Period ended | | of period | | | income2 | | | unrealized) | | | operations | |
| Class 529-A: | | | | | | | | | | | | | | | | |
| 9/30/20174,5 | | $ | 48.77 | | | $ | .32 | | | $ | 6.83 | | | $ | 7.15 | |
| 3/31/2017 | | | 43.82 | | | | .41 | | | | 5.09 | | | | 5.50 | |
| 3/31/2016 | | | 49.41 | | | | .40 | | | | (4.63 | ) | | | (4.23 | ) |
| 3/31/2015 | | | 48.89 | | | | .40 | | | | .75 | | | | 1.15 | |
| 3/31/2014 | | | 41.98 | | | | .66 | | | | 6.69 | | | | 7.35 | |
| 3/31/2013 | | | 39.12 | | | | .55 | | | | 2.99 | | | | 3.54 | |
| Class 529-C: | | | | | | | | | | | | | | | | |
| 9/30/20174,5 | | | 47.73 | | | | .11 | | | | 6.69 | | | | 6.80 | |
| 3/31/2017 | | | 42.90 | | | | .05 | | | | 4.97 | | | | 5.02 | |
| 3/31/2016 | | | 48.38 | | | | .04 | | | | (4.53 | ) | | | (4.49 | ) |
| 3/31/2015 | | | 47.88 | | | | .02 | | | | .73 | | | | .75 | |
| 3/31/2014 | | | 41.15 | | | | .29 | | | | 6.54 | | | | 6.83 | |
| 3/31/2013 | | | 38.36 | | | | .24 | | | | 2.93 | | | | 3.17 | |
| Class 529-E: | | | | | | | | | | | | | | | | |
| 9/30/20174,5 | | | 48.35 | | | | .25 | | | | 6.78 | | | | 7.03 | |
| 3/31/2017 | | | 43.45 | | | | .30 | | | | 5.04 | | | | 5.34 | |
| 3/31/2016 | | | 49.00 | | | | .29 | | | | (4.59 | ) | | | (4.30 | ) |
| 3/31/2015 | | | 48.49 | | | | .27 | | | | .75 | | | | 1.02 | |
| 3/31/2014 | | | 41.65 | | | | .54 | | | | 6.63 | | | | 7.17 | |
| 3/31/2013 | | | 38.82 | | | | .44 | | | | 2.97 | | | | 3.41 | |
| Class 529-T: | | | | | | | | | | | | | | | | |
| 9/30/20174,5,8 | | | 49.19 | | | | .37 | | | | 7.03 | | | | 7.40 | |
| Class 529-F-1: | | | | | | | | | | | | | | | | |
| 9/30/20174,5 | | | 48.74 | | | | .37 | | | | 6.84 | | | | 7.21 | |
| 3/31/2017 | | | 43.81 | | | | .51 | | | | 5.07 | | | | 5.58 | |
| 3/31/2016 | | | 49.40 | | | | .50 | | | | (4.62 | ) | | | (4.12 | ) |
| 3/31/2015 | | | 48.89 | | | | .51 | | | | .74 | | | | 1.25 | |
| 3/31/2014 | | | 41.97 | | | | .75 | | | | 6.70 | | | | 7.45 | |
| 3/31/2013 | | | 39.11 | | | | .63 | | | | 3.00 | | | | 3.63 | |
| Class R-1: | | | | | | | | | | | | | | | | |
| 9/30/20174,5 | | | 47.49 | | | | .13 | | | | 6.64 | | | | 6.77 | |
| 3/31/2017 | | | 42.69 | | | | .08 | | | | 4.96 | | | | 5.04 | |
| 3/31/2016 | | | 48.14 | | | | .07 | | | | (4.50 | ) | | | (4.43 | ) |
| 3/31/2015 | | | 47.64 | | | | .06 | | | | .72 | | | | .78 | |
| 3/31/2014 | | | 40.90 | | | | .33 | | | | 6.50 | | | | 6.83 | |
| 3/31/2013 | | | 38.12 | | | | .27 | | | | 2.90 | | | | 3.17 | |
| 36 | EuroPacific Growth Fund |
| Dividends and distributions | | | | | | | | | | | | | | | | |
| Dividends | | | | | | Total | | | | | | | | | | | | Ratio of | | | Ratio of net | |
| (from net | | | Distributions | | | dividends | | | Net asset | | | | | | Net assets, | | | expenses | | | income | |
| investment | | | (from capital | | | and | | | value, end | | | Total | | | end of period | | | to average | | | to average | |
| income) | | | gains) | | | distributions | | | of period | | | return3 | | | (in millions) | | | net assets | | | net assets2 | |
| | |
| $ | (.12 | ) | | $ | (.96 | ) | | $ | (1.08 | ) | | $ | 54.84 | | | | 14.84 | %6 | | $ | 1,337 | | | | .88 | %7 | | | 1.21 | %7 |
| | (.55 | ) | | | — | | | | (.55 | ) | | | 48.77 | | | | 12.65 | | | | 1,172 | | | | .90 | | | | .90 | |
| | (.77 | ) | | | (.59 | ) | | | (1.36 | ) | | | 43.82 | | | | (8.64 | ) | | | 1,103 | | | | .90 | | | | .86 | |
| | (.63 | ) | | | — | | | | (.63 | ) | | | 49.41 | | | | 2.41 | | | | 1,205 | | | | .89 | | | | .82 | |
| | (.44 | ) | | | — | | | | (.44 | ) | | | 48.89 | | | | 17.52 | | | | 1,187 | | | | .90 | | | | 1.45 | |
| | (.68 | ) | | | — | | | | (.68 | ) | | | 41.98 | | | | 9.12 | | | | 999 | | | | .91 | | | | 1.40 | |
| |
| | (.03 | ) | | | (.96 | ) | | | (.99 | ) | | | 53.54 | | | | 14.39 | 6 | | | 381 | | | | 1.66 | 7 | | | .43 | 7 |
| | (.19 | ) | | | — | | | | (.19 | ) | | | 47.73 | | | | 11.76 | | | | 343 | | | | 1.68 | | | | .12 | |
| | (.40 | ) | | | (.59 | ) | | | (.99 | ) | | | 42.90 | | | | (9.35 | ) | | | 335 | | | | 1.68 | | | | .08 | |
| | (.25 | ) | | | — | | | | (.25 | ) | | | 48.38 | | | | 1.62 | | | | 374 | | | | 1.67 | | | | .04 | |
| | (.10 | ) | | | — | | | | (.10 | ) | | | 47.88 | | | | 16.57 | | | | 378 | | | | 1.68 | | | | .66 | |
| | (.38 | ) | | | — | | | | (.38 | ) | | | 41.15 | | | | 8.29 | | | | 329 | | | | 1.70 | | | | .62 | |
| |
| | (.09 | ) | | | (.96 | ) | | | (1.05 | ) | | | 54.33 | | | | 14.70 | 6 | | | 68 | | | | 1.11 | 7 | | | .98 | 7 |
| | (.44 | ) | | | — | | | | (.44 | ) | | | 48.35 | | | | 12.39 | | | | 60 | | | | 1.13 | | | | .66 | |
| | (.66 | ) | | | (.59 | ) | | | (1.25 | ) | | | 43.45 | | | | (8.86 | ) | | | 57 | | | | 1.14 | | | | .62 | |
| | (.51 | ) | | | — | | | | (.51 | ) | | | 49.00 | | | | 2.15 | | | | 62 | | | | 1.14 | | | | .57 | |
| | (.33 | ) | | | — | | | | (.33 | ) | | | 48.49 | | | | 17.22 | | | | 63 | | | | 1.15 | | | | 1.19 | |
| | (.58 | ) | | | — | | | | (.58 | ) | | | 41.65 | | | | 8.86 | | | | 53 | | | | 1.17 | | | | 1.14 | |
| |
| | (.12 | ) | | | (.96 | ) | | | (1.08 | ) | | | 55.51 | | | | 15.21 | 6,9 | | | — | 10 | | | .32 | 6,9 | | | .69 | 6,9 |
| |
| |
| | (.14 | ) | | | (.96 | ) | | | (1.10 | ) | | | 54.85 | | | | 14.96 | 6 | | | 122 | | | | .66 | 7 | | | 1.42 | 7 |
| | (.65 | ) | | | — | | | | (.65 | ) | | | 48.74 | | | | 12.88 | | | | 102 | | | | .68 | | | | 1.11 | |
| | (.88 | ) | | | (.59 | ) | | | (1.47 | ) | | | 43.81 | | | | (8.44 | ) | | | 90 | | | | .69 | | | | 1.07 | |
| | (.74 | ) | | | — | | | | (.74 | ) | | | 49.40 | | | | 2.62 | | | | 96 | | | | .67 | | | | 1.04 | |
| | (.53 | ) | | | — | | | | (.53 | ) | | | 48.89 | | | | 17.75 | | | | 90 | | | | .68 | | | | 1.65 | |
| | (.77 | ) | | | — | | | | (.77 | ) | | | 41.97 | | | | 9.37 | | | | 74 | | | | .70 | | | | 1.60 | |
| |
| | (.03 | ) | | | (.96 | ) | | | (.99 | ) | | | 53.27 | | | | 14.40 | 6 | | | 267 | | | | 1.60 | 7 | | | .50 | 7 |
| | (.24 | ) | | | — | | | | (.24 | ) | | | 47.49 | | | | 11.86 | | | | 247 | | | | 1.61 | | | | .19 | |
| | (.43 | ) | | | (.59 | ) | | | (1.02 | ) | | | 42.69 | | | | (9.28 | ) | | | 248 | | | | 1.61 | | | | .15 | |
| | (.28 | ) | | | — | | | | (.28 | ) | | | 48.14 | | | | 1.67 | | | | 285 | | | | 1.59 | | | | .12 | |
| | (.09 | ) | | | — | | | | (.09 | ) | | | 47.64 | | | | 16.70 | | | | 299 | | | | 1.61 | | | | .75 | |
| | (.39 | ) | | | — | | | | (.39 | ) | | | 40.90 | | | | 8.36 | | | | 288 | | | | 1.61 | | | | .72 | |
See page 41 for footnotes.
| EuroPacific Growth Fund | 37 |
Financial highlights (continued)
| | | | | | Income (loss) from investment operations1 | |
| | | Net asset | | | | | | Net gains (losses) | | | | |
| | | value, | | | Net | | | on securities (both | | | Total from | |
| | | beginning | | | investment | | | realized and | | | investment | |
| Period ended | | of period | | | income2 | | | unrealized) | | | operations | |
| Class R-2: | | | | | | | | | | | | | | | | |
| 9/30/20174,5 | | $ | 47.88 | | | $ | .13 | | | $ | 6.71 | | | $ | 6.84 | |
| 3/31/2017 | | | 43.01 | | | | .09 | | | | 5.00 | | | | 5.09 | |
| 3/31/2016 | | | 48.49 | | | | .08 | | | | (4.53 | ) | | | (4.45 | ) |
| 3/31/2015 | | | 47.96 | | | | .07 | | | | .73 | | | | .80 | |
| 3/31/2014 | | | 41.20 | | | | .34 | | | | 6.54 | | | | 6.88 | |
| 3/31/2013 | | | 38.39 | | | | .28 | | | | 2.92 | | | | 3.20 | |
| Class R-2E: | | | | | | | | | | | | | | | | |
| 9/30/20174,5 | | | 48.59 | | | | .21 | | | | 6.82 | | | | 7.03 | |
| 3/31/2017 | | | 43.79 | | | | .18 | | | | 5.14 | | | | 5.32 | |
| 3/31/2016 | | | 49.67 | | | | .52 | | | | (4.89 | ) | | | (4.37 | ) |
| 3/31/20154,12 | | | 50.08 | | | | .10 | | | | .27 | | | | .37 | |
| Class R-3: | | | | | | | | | | | | | | | | |
| 9/30/20174,5 | | | 48.32 | | | | .25 | | | | 6.77 | | | | 7.02 | |
| 3/31/2017 | | | 43.40 | | | | .30 | | | | 5.04 | | | | 5.34 | |
| 3/31/2016 | | | 48.93 | | | | .29 | | | | (4.59 | ) | | | (4.30 | ) |
| 3/31/2015 | | | 48.40 | | | | .28 | | | | .74 | | | | 1.02 | |
| 3/31/2014 | | | 41.56 | | | | .54 | | | | 6.62 | | | | 7.16 | |
| 3/31/2013 | | | 38.73 | | | | .46 | | | | 2.96 | | | | 3.42 | |
| Class R-4: | | | | | | | | | | | | | | | | |
| 9/30/20174,5 | | | 48.35 | | | | .33 | | | | 6.78 | | | | 7.11 | |
| 3/31/2017 | | | 43.45 | | | | .43 | | | | 5.03 | | | | 5.46 | |
| 3/31/2016 | | | 48.99 | | | | .43 | | | | (4.59 | ) | | | (4.16 | ) |
| 3/31/2015 | | | 48.48 | | | | .42 | | | | .74 | | | | 1.16 | |
| 3/31/2014 | | | 41.63 | | | | .67 | | | | 6.64 | | | | 7.31 | |
| 3/31/2013 | | | 38.79 | | | | .57 | | | | 2.98 | | | | 3.55 | |
| Class R-5E: | | | | | | | | | | | | | | | | |
| 9/30/20174,5 | | | 49.02 | | | | .34 | | | | 6.93 | | | | 7.27 | |
| 3/31/2017 | | | 44.14 | | | | .53 | | | | 5.09 | | | | 5.62 | |
| 3/31/20164,13 | | | 48.16 | | | | .20 | | | | (2.65 | ) | | | (2.45 | ) |
| Class R-5: | | | | | | | | | | | | | | | | |
| 9/30/20174,5 | | | 49.22 | | | | .41 | | | | 6.90 | | | | 7.31 | |
| 3/31/2017 | | | 44.22 | | | | .58 | | | | 5.13 | | | | 5.71 | |
| 3/31/2016 | | | 49.85 | | | | .58 | | | | (4.68 | ) | | | (4.10 | ) |
| 3/31/2015 | | | 49.32 | | | | .59 | | | | .74 | | | | 1.33 | |
| 3/31/2014 | | | 42.33 | | | | .82 | | | | 6.76 | | | | 7.58 | |
| 3/31/2013 | | | 39.43 | | | | .70 | | | | 3.02 | | | | 3.72 | |
| 38 | EuroPacific Growth Fund |
| Dividends and distributions | | | | | | | | | | | | | | | | |
| Dividends | | | | | | Total | | | | | | | | | | | | Ratio of | | | Ratio of net | |
| (from net | | | Distributions | | | dividends | | | Net asset | | | | | | Net assets, | | | expenses | | | income | |
| investment | | | (from capital | | | and | | | value, end | | | Total | | | end of period | | | to average | | | to average | |
| income) | | | gains) | | | distributions | | | of period | | | return3 | | | (in millions) | | | net assets | | | net assets2 | |
| | |
| $ | (.04 | ) | | $ | (.96 | ) | | $ | (1.00 | ) | | $ | 53.72 | | | | 14.42 | %6 | | $ | 832 | | | | 1.58 | %7 | | | .52 | %7 |
| | (.22 | ) | | | — | | | | (.22 | ) | | | 47.88 | | | | 11.88 | | | | 767 | | | | 1.60 | | | | .20 | |
| | (.44 | ) | | | (.59 | ) | | | (1.03 | ) | | | 43.01 | | | | (9.25 | ) | | | 800 | | | | 1.58 | | | | .18 | |
| | (.27 | ) | | | — | | | | (.27 | ) | | | 48.49 | | | | 1.70 | | | | 975 | | | | 1.57 | | | | .15 | |
| | (.12 | ) | | | — | | | | (.12 | ) | | | 47.96 | | | | 16.71 | | | | 1,079 | | | | 1.57 | | | | .76 | |
| | (.39 | ) | | | — | | | | (.39 | ) | | | 41.20 | | | | 8.41 | | | | 1,041 | | | | 1.60 | | | | .74 | |
| |
| | (.08 | ) | | | (.96 | ) | | | (1.04 | ) | | | 54.58 | | | | 14.60 | 6 | | | 234 | | | | 1.28 | 7 | | | .80 | 7 |
| | (.52 | ) | | | — | | | | (.52 | ) | | | 48.59 | | | | 12.25 | | | | 189 | | | | 1.28 | | | | .40 | |
| | (.92 | ) | | | (.59 | ) | | | (1.51 | ) | | | 43.79 | | | | (8.89 | ) | | | 8 | | | | 1.18 | | | | 1.25 | |
| | (.78 | ) | | | — | | | | (.78 | ) | | | 49.67 | | | | .82 | 6 | | | — | 10 | | | 1.26 | 7 | | | .28 | 7 |
| |
| | (.09 | ) | | | (.96 | ) | | | (1.05 | ) | | | 54.29 | | | | 14.67 | 6 | | | 4,725 | | | | 1.13 | 7 | | | .97 | 7 |
| | (.42 | ) | | | — | | | | (.42 | ) | | | 48.32 | | | | 12.40 | | | | 4,505 | | | | 1.14 | | | | .66 | |
| | (.64 | ) | | | (.59 | ) | | | (1.23 | ) | | | 43.40 | | | | (8.87 | ) | | | 5,029 | | | | 1.14 | | | | .62 | |
| | (.49 | ) | | | — | | | | (.49 | ) | | | 48.93 | | | | 2.16 | | | | 6,482 | | | | 1.13 | | | | .59 | |
| | (.32 | ) | | | — | | | | (.32 | ) | | | 48.40 | | | | 17.24 | | | | 7,219 | | | | 1.14 | | | | 1.20 | |
| | (.59 | ) | | | — | | | | (.59 | ) | | | 41.56 | | | | 8.87 | | | | 6,962 | | | | 1.14 | | | | 1.18 | |
| |
| | (.12 | ) | | | (.96 | ) | | | (1.08 | ) | | | 54.38 | | | | 14.87 | 6 | | | 10,726 | | | | .83 | 7 | | | 1.26 | 7 |
| | (.56 | ) | | | — | | | | (.56 | ) | | | 48.35 | | | | 12.70 | | | | 9,854 | | | | .85 | | | | .96 | |
| | (.79 | ) | | | (.59 | ) | | | (1.38 | ) | | | 43.45 | | | | (8.58 | ) | | | 11,310 | | | | .85 | | | | .92 | |
| | (.65 | ) | | | — | | | | (.65 | ) | | | 48.99 | | | | 2.45 | | | | 13,488 | | | | .84 | | | | .88 | |
| | (.46 | ) | | | — | | | | (.46 | ) | | | 48.48 | | | | 17.57 | | | | 14,394 | | | | .84 | | | | 1.50 | |
| | (.71 | ) | | | — | | | | (.71 | ) | | | 41.63 | | | | 9.20 | | | | 12,961 | | | | .85 | | | | 1.47 | |
| |
| | (.17 | ) | | | (.96 | ) | | | (1.13 | ) | | | 55.16 | | | | 14.99 | 6 | | | 178 | | | | .61 | 7 | | | 1.27 | 7 |
| | (.74 | ) | | | — | | | | (.74 | ) | | | 49.02 | | | | 12.89 | | | | 9 | | | | .62 | | | | 1.14 | |
| | (.98 | ) | | | (.59 | ) | | | (1.57 | ) | | | 44.14 | | | | (5.19 | )6 | | | — | 10 | | | .25 | 6 | | | .46 | 6 |
| |
| | (.16 | ) | | | (.96 | ) | | | (1.12 | ) | | | 55.41 | | | | 15.01 | 6 | | | 9,015 | | | | .54 | 7 | | | 1.56 | 7 |
| | (.71 | ) | | | — | | | | (.71 | ) | | | 49.22 | | | | 13.07 | | | | 8,721 | | | | .54 | | | | 1.27 | |
| | (.94 | ) | | | (.59 | ) | | | (1.53 | ) | | | 44.22 | | | | (8.32 | ) | | | 9,285 | | | | .54 | | | | 1.21 | |
| | (.80 | ) | | | — | | | | (.80 | ) | | | 49.85 | | | | 2.77 | | | | 11,418 | | | | .53 | | | | 1.19 | |
| | (.59 | ) | | | — | | | | (.59 | ) | | | 49.32 | | | | 17.93 | | | | 12,197 | | | | .54 | | | | 1.79 | |
| | (.82 | ) | | | — | | | | (.82 | ) | | | 42.33 | | | | 9.54 | | | | 13,746 | | | | .55 | | | | 1.78 | |
See page 41 for footnotes.
| EuroPacific Growth Fund | 39 |
Financial highlights (continued)
| | | | | | Income (loss) from investment operations1 | |
| | | Net asset | | | | | | Net gains (losses) | | | | |
| | | value, | | | Net | | | on securities (both | | | Total from | |
| | | beginning | | | investment | | | realized and | | | investment | |
| Period ended | | of period | | | income2 | | | unrealized) | | | operations | |
| Class R-6: | | | | | | | | | | | | | | | | |
| 9/30/20174,5 | | $ | 49.27 | | | $ | .42 | | | $ | 6.92 | | | $ | 7.34 | |
| 3/31/2017 | | | 44.27 | | | | .60 | | | | 5.14 | | | | 5.74 | |
| 3/31/2016 | | | 49.90 | | | | .60 | | | | (4.67 | ) | | | (4.07 | ) |
| 3/31/2015 | | | 49.38 | | | | .60 | | | | .74 | | | | 1.34 | |
| 3/31/2014 | | | 42.38 | | | | .85 | | | | 6.76 | | | | 7.61 | |
| 3/31/2013 | | | 39.48 | | | | .70 | | | | 3.04 | | | | 3.74 | |
| | | Six months ended
September 30, | | Year ended March 31 |
| | | 20174,5,6 | | 2017 | | 2016 | | 2015 | | 2014 | | 2013 |
| Portfolio turnover rate for all share classes | | 15% | | 36% | | 30% | | 28% | | 28% | | 27% |
See Notes to Financial Statements
| 40 | EuroPacific Growth Fund |
| Dividends and distributions | | | | | | | | | | | | | | | | |
| Dividends | | | | | | Total | | | | | | | | | | | | Ratio of | | | Ratio of net | |
| (from net | | | Distributions | | | dividends | | | Net asset | | | | | | Net assets, | | | expenses | | | income | |
| investment | | | (from capital | | | and | | | value, end | | | Total | | | end of period | | | to average | | | to average | |
| income) | | | gains) | | | distributions | | | of period | | | return3 | | | (in millions) | | | net assets | | | net assets2 | |
| | |
| $ | (.17 | ) | | $ | (.96 | ) | | $ | (1.13 | ) | | $ | 55.48 | | | | 15.07 | %6 | | $ | 61,747 | | | | .49 | %7 | | | 1.59 | %7 |
| | (.74 | ) | | | — | | | | (.74 | ) | | | 49.27 | | | | 13.10 | | | | 51,100 | | | | .50 | | | | 1.30 | |
| | (.97 | ) | | | (.59 | ) | | | (1.56 | ) | | | 44.27 | | | | (8.26 | ) | | | 41,539 | | | | .50 | | | | 1.27 | |
| | (.82 | ) | | | — | | | | (.82 | ) | | | 49.90 | | | | 2.80 | | | | 38,346 | | | | .49 | | | | 1.20 | |
| | (.61 | ) | | | — | | | | (.61 | ) | | | 49.38 | | | | 17.97 | | | | 32,575 | | | | .49 | | | | 1.85 | |
| | (.84 | ) | | | — | | | | (.84 | ) | | | 42.38 | | | | 9.58 | | | | 22,744 | | | | .50 | | | | 1.76 | |
| 1 | Based on average shares outstanding. |
| 2 | For the year ended March 31, 2014, this column reflects the impact of a corporate action event that resulted in a one-time increase to net investment income. If the corporate action event had not occurred, the Class A net investment income per share and ratio of net income to average net assets would have been lower by $.19 and .40 percentage points, respectively. The impact to the other share classes would have been similar. |
| 3 | Total returns exclude any applicable sales charges, including contingent deferred sales charges. |
| 4 | Based on operations for the period shown and, accordingly, is not representative of a full year. |
| 5 | Unaudited. |
| 6 | Not annualized. |
| 7 | Annualized. |
| 8 | Class T and 529-T shares began investment operations on April 7, 2017. |
| 9 | All or a significant portion of assets in this class consisted of seed capital invested by CRMC and/or its affiliates. Fees for distribution services are not charged or accrued on these seed capital assets. If such fees were paid by the fund on seed capital assets, fund expenses would have been higher and net income and total return would have been lower. |
| 10 | Amount less than $1 million. |
| 11 | Class F-3 shares began investment operations on January 27, 2017. |
| 12 | Class R-2E shares began investment operations on August 29, 2014. |
| 13 | Class R-5E shares began investment operations on November 20, 2015. |
| EuroPacific Growth Fund | 41 |
As a fund shareholder, you incur two types of costs: (1) transaction costs, such as initial sales charges on purchase payments and contingent deferred sales charges on redemptions (loads), and (2) ongoing costs, including management fees, distribution and service (12b-1) fees, and other expenses. This example is intended to help you understand your ongoing costs (in dollars) of investing in the fund so you can compare these costs with the ongoing costs of investing in other mutual funds. The example is based on an investment of $1,000 invested at the beginning of the period and held for the entire six-month period (April 1, 2017, through September 30, 2017).
Actual expenses:
The first line of each share class in the table on the following page provides information about actual account values and actual expenses. You may use the information in this line, together with the amount you invested, to estimate the expenses that you paid over the period. Simply divide your account value by $1,000 (for example, an $8,600 account value divided by $1,000 = 8.6), then multiply the result by the number in the first line under the heading titled “Expenses paid during period” to estimate the expenses you paid on your account during this period.
Hypothetical example for comparison purposes:
The second line of each share class in the table on the following page provides information about hypothetical account values and hypothetical expenses based on the actual expense ratio for the share class and an assumed rate of return of 5.00% per year before expenses, which is not the actual return of the share class. The hypothetical account values and expenses may not be used to estimate the actual ending account balance or expenses you paid for the period. You may use this information to compare the ongoing costs of investing in the fund and other funds. To do so, compare this 5.00% hypothetical example with the 5.00% hypothetical examples that appear in the shareholder reports of the other funds.
Notes:
Retirement plan participants may be subject to certain fees charged by the plan sponsor, and Class F-1, F-2, F-3 and 529-F-1 shareholders may be subject to fees charged by financial intermediaries, typically ranging from 0.75% to 1.50% of assets annually depending on services offered. You can estimate the impact of these fees by adding the amount of the fees to the total estimated expenses you paid on your account during the period as calculated above. In addition, your ending account value would be lower by the amount of these fees.
Note that the expenses shown in the table on the following page are meant to highlight your ongoing costs only and do not reflect any transactional costs, such as sales charges (loads). Therefore, the second line of each share class in the table is useful in comparing ongoing costs only and will not help you determine the relative total costs of owning different funds. In addition, if these transactional costs were included, your costs would have been higher.
| 42 | EuroPacific Growth Fund |
| | | | Beginning
account value
4/1/2017 | | | | Ending
account value
9/30/2017 | | | | Expenses paid
during period* | | | | Annualized
expense ratio | |
| Class A – actual return | | $ | 1,000.00 | | | $ | 1,148.47 | | | $ | 4.47 | | | | .83 | % |
| Class A – assumed 5% return | | | 1,000.00 | | | | 1,020.91 | | | | 4.20 | | | | .83 | |
| Class C – actual return | | | 1,000.00 | | | | 1,144.22 | | | | 8.65 | | | | 1.61 | |
| Class C – assumed 5% return | | | 1,000.00 | | | | 1,017.00 | | | | 8.14 | | | | 1.61 | |
| Class T – actual return† | | | 1,000.00 | | | | 1,152.26 | | | | 3.22 | | | | .62 | |
| Class T – assumed 5% return† | | | 1,000.00 | | | | 1,021.96 | | | | 3.14 | | | | .62 | |
| Class F-1 – actual return | | | 1,000.00 | | | | 1,148.27 | | | | 4.63 | | | | .86 | |
| Class F-1 – assumed 5% return | | | 1,000.00 | | | | 1,020.76 | | | | 4.36 | | | | .86 | |
| Class F-2 – actual return | | | 1,000.00 | | | | 1,150.16 | | | | 3.23 | | | | .60 | |
| Class F-2 – assumed 5% return | | | 1,000.00 | | | | 1,022.06 | | | | 3.04 | | | | .60 | |
| Class F-3 – actual return | | | 1,000.00 | | | | 1,150.42 | | | | 2.70 | | | | .50 | |
| Class F-3 – assumed 5% return | | | 1,000.00 | | | | 1,022.56 | | | | 2.54 | | | | .50 | |
| Class 529-A – actual return | | | 1,000.00 | | | | 1,148.40 | | | | 4.74 | | | | .88 | |
| Class 529-A – assumed 5% return | | | 1,000.00 | | | | 1,020.66 | | | | 4.46 | | | | .88 | |
| Class 529-C – actual return | | | 1,000.00 | | | | 1,143.88 | | | | 8.92 | | | | 1.66 | |
| Class 529-C – assumed 5% return | | | 1,000.00 | | | | 1,016.75 | | | | 8.39 | | | | 1.66 | |
| Class 529-E – actual return | | | 1,000.00 | | | | 1,147.01 | | | | 5.97 | | | | 1.11 | |
| Class 529-E – assumed 5% return | | | 1,000.00 | | | | 1,019.50 | | | | 5.62 | | | | 1.11 | |
| Class 529-T – actual return† | | | 1,000.00 | | | | 1,152.05 | | | | 3.42 | | | | .66 | |
| Class 529-T – assumed 5% return† | | | 1,000.00 | | | | 1,021.76 | | | | 3.35 | | | | .66 | |
| Class 529-F-1 – actual return | | | 1,000.00 | | | | 1,149.60 | | | | 3.56 | | | | .66 | |
| Class 529-F-1 – assumed 5% return | | | 1,000.00 | | | | 1,021.76 | | | | 3.35 | | | | .66 | |
| Class R-1 – actual return | | | 1,000.00 | | | | 1,144.03 | | | | 8.60 | | | | 1.60 | |
| Class R-1 – assumed 5% return | | | 1,000.00 | | | | 1,017.05 | | | | 8.09 | | | | 1.60 | |
| Class R-2 – actual return | | | 1,000.00 | | | | 1,144.24 | | | | 8.49 | | | | 1.58 | |
| Class R-2 – assumed 5% return | | | 1,000.00 | | | | 1,017.15 | | | | 7.99 | | | | 1.58 | |
| Class R-2E – actual return | | | 1,000.00 | | | | 1,146.02 | | | | 6.89 | | | | 1.28 | |
| Class R-2E – assumed 5% return | | | 1,000.00 | | | | 1,018.65 | | | | 6.48 | | | | 1.28 | |
| Class R-3 – actual return | | | 1,000.00 | | | | 1,146.66 | | | | 6.08 | | | | 1.13 | |
| Class R-3 – assumed 5% return | | | 1,000.00 | | | | 1,019.40 | | | | 5.72 | | | | 1.13 | |
| Class R-4 – actual return | | | 1,000.00 | | | | 1,148.72 | | | | 4.47 | | | | .83 | |
| Class R-4 – assumed 5% return | | | 1,000.00 | | | | 1,020.91 | | | | 4.20 | | | | .83 | |
| Class R-5E – actual return | | | 1,000.00 | | | | 1,149.92 | | | | 3.29 | | | | .61 | |
| Class R-5E – assumed 5% return | | | 1,000.00 | | | | 1,022.01 | | | | 3.09 | | | | .61 | |
| Class R-5 – actual return | | | 1,000.00 | | | | 1,150.09 | | | | 2.91 | | | | .54 | |
| Class R-5 – assumed 5% return | | | 1,000.00 | | | | 1,022.36 | | | | 2.74 | | | | .54 | |
| Class R-6 – actual return | | | 1,000.00 | | | | 1,150.71 | | | | 2.64 | | | | .49 | |
| Class R-6 – assumed 5% return | | | 1,000.00 | | | | 1,022.61 | | | | 2.48 | | | | .49 | |
See next page for footnotes.
| EuroPacific Growth Fund | 43 |
| * | The “expenses paid during period” are equal to the “annualized expense ratio,” multiplied by the average account value over the period, multiplied by the number of days in the period, and divided by 365 (to reflect the one-half year period). |
| † | The period for the “annualized expense ratio” and “actual return” line is based on the number of days since the share class began investment operations on April 7, 2017. The “assumed 5% return” line is based on 183 days. |
| 44 | EuroPacific Growth Fund |
This page was intentionally left blank.
| EuroPacific Growth Fund | 45 |
This page was intentionally left blank.
| 46 | EuroPacific Growth Fund |
This page was intentionally left blank.
| EuroPacific Growth Fund | 47 |
This page was intentionally left blank.
| 48 | EuroPacific Growth Fund |
This page was intentionally left blank.
| EuroPacific Growth Fund | 49 |
This page was intentionally left blank.
| 50 | EuroPacific Growth Fund |
This page was intentionally left blank.
| EuroPacific Growth Fund | 51 |
Offices of the fund and of the investment adviser
Capital Research and Management Company
333 South Hope Street
Los Angeles, CA 90071-1406
6455 Irvine Center Drive
Irvine, CA 92618-4518
Transfer agent for shareholder accounts
American Funds Service Company
(Write to the address near you.)
P.O. Box 6007
Indianapolis, IN 46206-6007
P.O. Box 2280
Norfolk, VA 23501-2280
Custodian of assets
JPMorgan Chase Bank
270 Park Avenue
New York, NY 10017-2070
Counsel
Dechert LLP
One Bush Street, Suite 1600
San Francisco, CA 94104-4446
Independent registered public accounting firm
Deloitte & Touche LLP
695 Town Center Drive
Suite 1200
Costa Mesa, CA 92626-7188
Principal underwriter
American Funds Distributors, Inc.
333 South Hope Street
Los Angeles, CA 90071-1406
| 52 | EuroPacific Growth Fund |
Investors should carefully consider investment objectives, risks, charges and expenses. This and other important information is contained in the fund prospectus and summary prospectus, which can be obtained from your financial professional and should be read carefully before investing. You may also call American Funds Service Company (AFS) at (800) 421-4225 or visit the American Funds website at americanfunds.com. Fund shares offered through American Funds Distributors, Inc.
“American Funds Proxy Voting Procedures and Principles” — which describes how we vote proxies relating to portfolio securities — is available on the American Funds website or upon request by calling AFS. The fund files its proxy voting record with the U.S. Securities and Exchange Commission (SEC) for the 12 months ended June 30 by August 31. The proxy voting record is available free of charge on the SEC website at sec.gov and on the American Funds website.
A complete September 30, 2017, portfolio of EuroPacific Growth Fund’s investments is available free of charge by calling AFS or visiting the SEC website (where it is part of Form N-CSR).
EuroPacific Growth Fund files a complete list of its portfolio holdings with the SEC for the first and third quarters of each fiscal year on Form N-Q. This filing is available free of charge on the SEC website. You may also review or, for a fee, copy this filing at the SEC’s Public Reference Room in Washington, D.C. Additional information regarding the operation of the Public Reference Room may be obtained by calling the SEC’s Office of Investor Education and Advocacy at (800) SEC-0330. Additionally, the list of portfolio holdings is available by calling AFS.
This report is for the information of shareholders of EuroPacific Growth Fund, but it also may be used as sales literature when preceded or accompanied by the current prospectus or summary prospectus, which gives details about charges, expenses, investment objectives and operating policies of the fund. If used as sales material after December 31, 2017, this report must be accompanied by an American Funds statistical update for the most recently completed calendar quarter.
American Funds from Capital Group
The Capital AdvantageSM
Since 1931, American Funds, part of Capital Group, has helped investors pursue long-term investment success. Our consistent approach — in combination with The Capital SystemSM — has resulted in a superior long-term track record.
Aligned with investor success
We base our decisions on a long-term perspective, which we believe aligns our goals with the interests of our clients. Our portfolio managers average 27 years of investment experience, including 21 years at our company, reflecting a career commitment to our long-term approach.1
The Capital System
The Capital System combines individual accountability with teamwork. Funds using The Capital System are divided into portions that are managed independently by investment professionals with diverse backgrounds, ages and investment approaches. An extensive global research effort is the backbone of our system.
American Funds’ superior long-term track record
Equity funds have beaten their Lipper peer indexes in 93% of 10-year periods and 98% of 20-year periods. Fixed income funds have beaten their Lipper indexes in 80% of 10-year periods and 80% of 20-year periods.2 Fund management fees have been among the lowest in the industry.3
| 1 | Portfolio manager experience as of December 31, 2016. |
| 2 | Based on Class F-2 share results for rolling periods through December 31, 2016. Periods covered are the shorter of the fund’s lifetime or since the comparable Lipper index inception date (except Capital Income Builder and SMALLCAP World Fund, for which the Lipper average was used). Expenses differ for each share class, so results will vary. Class F-2 shares were first offered on August 1, 2008. Class F-2 share results prior to the date of first sale are hypothetical based on Class A share results without a sales charge, adjusted for typical estimated expenses. Results for certain funds with an inception date after August 1, 2008, also include hypothetical returns because those funds’ Class F-2 shares sold after the funds’ date of first offering. Please see americanfunds.com for more information on specific expense adjustments and the actual dates of first sale. |
| 3 | On average, our management fees were in the lowest quintile 73% of the time, based on the 20-year period ended December 31, 2016, versus comparable Lipper categories, excluding funds of funds. |

ITEM 2 – Code of Ethics
Not applicable for filing of semi-annual reports to shareholders.
ITEM 3 – Audit Committee Financial Expert
Not applicable for filing of semi-annual reports to shareholders.
ITEM 4 – Principal Accountant Fees and Services
Not applicable for filing of semi-annual reports to shareholders.
ITEM 5 – Audit Committee of Listed Registrants
Not applicable to this Registrant, insofar as the Registrant is not a listed issuer as defined in Rule 10A-3 under the Securities Exchange Act of 1934.
ITEM 6 – Schedule of Investments

EuroPacific Growth Fund®
Investment portfolio
September 30, 2017
unaudited
Common stocks 91.98%
Information technology 19.90% | Shares | Value
(000) |
| Samsung Electronics Co., Ltd.1 | 1,943,771 | $4,369,029 |
| Samsung Electronics Co., Ltd., nonvoting preferred1 | 48,800 | 88,147 |
| Alibaba Group Holding Ltd. (ADR)2 | 23,189,745 | 4,005,101 |
| Taiwan Semiconductor Manufacturing Co., Ltd.1 | 428,345,649 | 3,080,717 |
| Taiwan Semiconductor Manufacturing Co., Ltd. (ADR) | 8,247,523 | 309,694 |
| Tencent Holdings Ltd.1 | 64,809,787 | 2,801,866 |
| Nintendo Co., Ltd.1 | 6,916,426 | 2,563,503 |
| ASML Holding NV1 | 13,616,811 | 2,322,908 |
| Baidu, Inc., Class A (ADR)2 | 7,178,562 | 1,778,058 |
| Murata Manufacturing Co., Ltd.1 | 10,758,526 | 1,590,582 |
| SK hynix, Inc.1 | 16,712,500 | 1,213,653 |
| AAC Technologies Holdings Inc.1 | 52,703,429 | 890,203 |
| Keyence Corp.1 | 1,619,700 | 863,512 |
| Infineon Technologies AG1 | 29,897,842 | 751,602 |
| Hangzhou Hikvision Digital Technology Co., Ltd., Class A1 | 134,849,288 | 650,866 |
| MediaTek Inc.1 | 57,173,000 | 538,563 |
| Largan Precision Co., Ltd.1 | 2,238,000 | 396,636 |
| MercadoLibre, Inc. | 1,417,000 | 366,904 |
| SAP SE1 | 2,680,000 | 293,595 |
| Just Eat PLC1,2 | 31,830,000 | 285,394 |
| Naver Corp.1 | 305,422 | 199,101 |
| TEMENOS Group AG (Switzerland)1 | 1,910,000 | 195,156 |
| Worldpay Group PLC1 | 33,299,800 | 181,616 |
| Hamamatsu Photonics KK1 | 5,846,100 | 176,718 |
| Halma PLC1 | 11,480,157 | 172,316 |
| Samsung SDI Co., Ltd.1 | 868,326 | 151,194 |
| Hexagon AB, Class B1 | 2,361,720 | 117,342 |
| ASM Pacific Technology Ltd.1 | 6,969,900 | 100,779 |
| TravelSky Technology Ltd., Class H1 | 37,278,000 | 97,214 |
| Yandex NV, Class A2 | 2,853,565 | 94,025 |
| TDK Corp.1 | 1,120,000 | 76,459 |
| | | 30,722,453 |
| Financials 16.40% | | |
| HDFC Bank Ltd.1 | 101,228,459 | 2,804,626 |
| HDFC Bank Ltd. (ADR) | 6,523,800 | 628,699 |
| AIA Group Ltd.1 | 445,826,600 | 3,306,383 |
| UniCredit SpA1,2 | 88,376,250 | 1,882,223 |
| Prudential PLC1 | 75,543,496 | 1,808,856 |
| Barclays PLC1 | 678,968,270 | 1,761,924 |
| Kotak Mahindra Bank Ltd.1 | 93,721,246 | 1,439,954 |
| Housing Development Finance Corp. Ltd.1 | 41,218,425 | 1,100,395 |
| Sberbank of Russia PJSC (ADR)1 | 51,491,557 | 734,055 |
| BNP Paribas SA1 | 7,545,685 | 608,886 |
| BM&FBOVESPA SA - Bolsa de Valores, Mercadorias e Futuros, ordinary nominative | 79,420,000 | 600,574 |
| Indiabulls Housing Finance Ltd.1,3 | 26,207,577 | 485,174 |
| Deutsche Bank AG1 | 23,884,260 | 412,987 |
EuroPacific Growth Fund — Page 1 of 9
unaudited
Common stocks
Financials (continued) | Shares | Value
(000) |
| Bank Central Asia Tbk PT1 | 267,385,000 | $403,104 |
| Société Générale1 | 6,714,872 | 392,821 |
| Credit Suisse Group AG1 | 24,809,253 | 392,762 |
| Banco Santander, SA1 | 55,817,300 | 389,702 |
| Bank of Ireland Group PLC1,2 | 46,851,951 | 383,775 |
| Fairfax Financial Holdings Ltd., subordinate voting (CAD denominated) | 563,951 | 293,481 |
| Fairfax Financial Holdings Ltd., subordinate voting | 151,291 | 78,520 |
| Toronto-Dominion Bank (CAD denominated) | 6,215,000 | 349,913 |
| State Bank of India1 | 89,547,000 | 349,134 |
| Itaú Unibanco Holding SA, preferred nominative (ADR) | 24,204,500 | 331,602 |
| KB Financial Group Inc.1 | 6,088,000 | 298,892 |
| Hana Financial Group Inc.1 | 7,026,000 | 290,976 |
| Macquarie Group Ltd.1 | 3,767,000 | 269,239 |
| Commerzbank AG, non-registered shares1,2 | 19,194,342 | 261,113 |
| KASIKORNBANK PCL, foreign registered1 | 25,394,600 | 163,191 |
| KASIKORNBANK PCL, nonvoting depository receipts1 | 14,960,400 | 93,016 |
| ABN AMRO Group NV, depository receipts1 | 8,460,361 | 253,430 |
| Banco BPM SPA1,2 | 60,607,284 | 251,844 |
| Brookfield Asset Management Inc., Class A | 5,885,000 | 243,050 |
| Svenska Handelsbanken AB, Class A1 | 13,841,154 | 209,212 |
| Zurich Insurance Group AG1 | 640,500 | 195,607 |
| DBS Group Holdings Ltd1 | 12,495,000 | 192,259 |
| ICICI Bank Ltd.1 | 37,235,587 | 158,211 |
| ICICI Bank Ltd. (ADR) | 1,380,241 | 11,815 |
| Axis Bank Ltd.1 | 21,393,890 | 167,107 |
| AXA SA1 | 5,430,000 | 164,271 |
| Industrial and Commercial Bank of China Ltd., Class H1 | 208,300,000 | 155,606 |
| Metropolitan Bank & Trust Co.1 | 84,220,000 | 143,502 |
| UBS Group AG1 | 8,249,026 | 140,985 |
| Haci Ömer Sabanci Holding AS1 | 37,260,000 | 104,843 |
| RSA Insurance Group PLC1 | 12,067,706 | 100,753 |
| Eurobank Ergasias SA1,2 | 108,860,228 | 96,248 |
| Capitec Bank Holdings Ltd.1 | 1,340,000 | 85,053 |
| Royal Bank of Canada | 1,000,000 | 77,371 |
| Aditya Birla Capital Ltd.1,2 | 24,182,207 | 68,026 |
| Bangkok Bank PCL, nonvoting depository receipt1 | 10,507,900 | 58,775 |
| ORIX Corp.1 | 2,816,000 | 45,458 |
| Intesa Sanpaolo SpA1 | 11,144,000 | 39,408 |
| Siam Commercial Bank Public Co. Ltd., foreign registered1 | 8,508,440 | 39,086 |
| | | 25,317,897 |
| Consumer discretionary 11.60% | | |
| Sony Corp.1 | 55,367,000 | 2,060,844 |
| Altice NV, Class A1,2,3 | 76,957,011 | 1,543,442 |
| Altice NV, Class B1,2,3 | 16,341,536 | 326,900 |
| Naspers Ltd., Class N1 | 5,837,222 | 1,274,218 |
| adidas AG1 | 4,341,373 | 982,062 |
| LVMH Moët Hennessy-Louis Vuitton SE1 | 3,508,700 | 967,335 |
| Kering SA1 | 2,259,328 | 899,370 |
| Industria de Diseño Textil, SA1 | 23,536,000 | 886,966 |
| Galaxy Entertainment Group Ltd.1 | 103,064,000 | 728,274 |
| Paddy Power Betfair PLC1,3 | 6,722,676 | 670,880 |
| Hyundai Motor Co.1 | 4,839,600 | 636,510 |
| Ctrip.com International, Ltd. (ADR)2 | 10,871,305 | 573,353 |
| Kroton Educacional SA, ordinary nominative3 | 90,424,000 | 572,439 |
EuroPacific Growth Fund — Page 2 of 9
unaudited
Common stocks
Consumer discretionary (continued) | Shares | Value
(000) |
| Rakuten, Inc.1 | 49,182,900 | $536,743 |
| ASOS PLC1,2,3 | 6,674,299 | 532,711 |
| Sands China Ltd.1 | 78,995,200 | 412,573 |
| Accor SA1 | 7,867,398 | 390,624 |
| Peugeot SA1 | 16,193,890 | 385,712 |
| Techtronic Industries Co. Ltd.1 | 69,816,500 | 373,363 |
| Hyundai Mobis Co., Ltd.1 | 1,716,800 | 359,772 |
| Carnival Corp., units | 4,336,000 | 279,975 |
| Ryohin Keikaku Co., Ltd.1 | 923,000 | 272,023 |
| Toyota Motor Corp.1 | 3,687,500 | 220,142 |
| Melco Resorts & Entertainment Ltd. (ADR) | 8,414,000 | 202,946 |
| B&M European Value Retail SA1 | 37,835,751 | 196,521 |
| William Hill PLC1,3 | 51,985,007 | 175,828 |
| Continental AG1 | 680,000 | 172,594 |
| Li & Fung Ltd.1 | 335,850,000 | 168,624 |
| Suzuki Motor Corp.1 | 3,160,000 | 165,902 |
| ITV PLC1 | 69,546,903 | 162,827 |
| Motherson Sumi Systems Ltd.1 | 30,330,000 | 156,266 |
| Mahindra & Mahindra Ltd.1 | 7,850,000 | 150,757 |
| Hermès International1 | 275,805 | 139,055 |
| Luxottica Group SpA1 | 2,280,000 | 127,602 |
| Samsonite International SA1 | 23,980,500 | 102,904 |
| Global Brands Group Holding Ltd.1,2,3 | 487,835,358 | 46,848 |
| HUGO BOSS AG1 | 246,134 | 21,695 |
| Elior Group SA1 | 804,827 | 21,298 |
| | | 17,897,898 |
| Industrials 8.82% | | |
| Airbus SE, non-registered shares1 | 28,673,767 | 2,729,242 |
| International Consolidated Airlines Group, SA (CDI)1,3 | 153,050,123 | 1,217,396 |
| Ryanair Holdings PLC (ADR)2 | 10,729,994 | 1,131,156 |
| Recruit Holdings Co., Ltd.1 | 45,410,300 | 983,778 |
| Komatsu Ltd.1 | 26,956,600 | 767,802 |
| Toshiba Corp.1,3 | 201,619,000 | 564,676 |
| Rolls-Royce Holdings PLC1,2 | 47,117,533 | 560,129 |
| DCC PLC1 | 4,343,600 | 421,986 |
| Nidec Corp.1 | 3,231,800 | 397,732 |
| Leonardo SPA1 | 19,113,136 | 358,074 |
| Geberit AG1 | 744,000 | 351,970 |
| Airports of Thailand PCL1 | 198,272,900 | 351,447 |
| KONE Oyj, Class B1 | 6,411,000 | 339,496 |
| Siemens AG1 | 2,130,000 | 300,085 |
| ASSA ABLOY AB, Class B1 | 13,016,000 | 297,838 |
| Eicher Motors Ltd.1 | 612,049 | 292,623 |
| Schindler Holding AG, participation certificate1 | 1,300,000 | 287,162 |
| Schindler Holding AG1 | 2,000 | 430 |
| Jardine Matheson Holdings Ltd.1 | 4,367,800 | 276,761 |
| Hyundai Heavy Industries Co., Ltd. (Korea)1 | 2,029,500 | 258,062 |
| SK Holdings Co., Ltd.1 | 977,455 | 246,226 |
| Edenred SA1 | 8,850,000 | 240,821 |
| CK Hutchison Holdings Ltd.1 | 16,645,240 | 213,613 |
| Groupe Eurotunnel SE1 | 15,517,248 | 187,075 |
| Ferguson PLC1 | 2,720,000 | 178,477 |
| easyJet PLC1 | 10,412,000 | 169,982 |
| Air France-KLM1,2 | 9,233,795 | 145,619 |
EuroPacific Growth Fund — Page 3 of 9
unaudited
Common stocks
Industrials (continued) | Shares | Value
(000) |
| Babcock International Group PLC1 | 12,331,062 | $136,749 |
| Abertis Infraestructuras, SA, Class A, non-registered shares1 | 5,099,904 | 103,072 |
| Capita PLC1 | 7,166,000 | 54,259 |
| Alliance Global Group, Inc.1,2 | 150,350,000 | 47,472 |
| | | 13,611,210 |
| Consumer staples 7.66% | | |
| British American Tobacco PLC1 | 54,295,950 | 3,394,625 |
| Associated British Foods PLC1 | 39,192,549 | 1,678,233 |
| Nestlé SA1 | 15,072,799 | 1,262,368 |
| Pernod Ricard SA1 | 8,319,513 | 1,150,340 |
| Kao Corp.1 | 13,326,800 | 785,788 |
| CP ALL PCL1 | 337,235,000 | 675,023 |
| Alimentation Couche-Tard Inc., Class B | 11,648,800 | 531,210 |
| AMOREPACIFIC Corp.1 | 2,264,298 | 512,936 |
| Thai Beverage PCL1 | 470,990,000 | 312,571 |
| Meiji Holdings Co., Ltd.1 | 3,067,000 | 243,193 |
| Uni-Charm Corp.1 | 9,510,000 | 218,282 |
| Coca-Cola European Partners PLC | 5,233,645 | 217,824 |
| Treasury Wine Estates Ltd.1 | 18,454,663 | 198,905 |
| Ambev SA | 23,931,000 | 158,978 |
| Coca-Cola HBC AG (CDI)1 | 3,562,746 | 120,669 |
| Glanbia PLC1 | 4,615,903 | 87,023 |
| Wal-Mart de México, SAB de CV, Series V | 33,750,000 | 77,286 |
| Imperial Brands PLC1 | 1,653,000 | 70,538 |
| Japan Tobacco Inc.1 | 2,150,000 | 70,481 |
| Seven & i Holdings Co., Ltd.1 | 1,492,000 | 57,627 |
| | | 11,823,900 |
| Health care 5.76% | | |
| Novartis AG1 | 12,624,432 | 1,083,319 |
| HOYA Corp.1 | 15,601,900 | 846,225 |
| Shire PLC1 | 14,915,000 | 759,829 |
| Grifols, SA, Class A, non-registered shares1 | 10,503,000 | 305,998 |
| Grifols, SA, Class B, preferred nonvoting, non-registered shares1 | 11,254,100 | 246,208 |
| Grifols, SA, Class B (ADR) | 3,541,478 | 77,523 |
| Novo Nordisk A/S, Class B1 | 12,504,495 | 600,320 |
| Sysmex Corp.1 | 8,983,000 | 573,432 |
| Takeda Pharmaceutical Co. Ltd.1 | 10,265,000 | 568,505 |
| Fresenius SE & Co. KGaA1 | 6,484,800 | 523,094 |
| UCB SA1 | 7,290,799 | 519,401 |
| Bayer AG1 | 3,758,000 | 512,117 |
| Eurofins Scientific SE, non-registered shares1 | 600,215 | 379,316 |
| AstraZeneca PLC1 | 4,988,000 | 332,531 |
| Teva Pharmaceutical Industries Ltd. (ADR) | 14,917,000 | 262,539 |
| Merck KGaA1 | 2,131,500 | 237,206 |
| Fresenius Medical Care AG & Co. KGaA1 | 2,398,000 | 234,686 |
| CSL Ltd.1 | 1,710,000 | 179,778 |
| Hikma Pharmaceuticals PLC1 | 10,982,389 | 178,363 |
| Chugai Pharmaceutical Co., Ltd.1 | 4,014,000 | 166,709 |
| Roche Holding AG, non-registered shares, nonvoting1 | 595,500 | 152,020 |
| Straumann Holding AG1 | 190,000 | 122,231 |
| Hypermarcas SA, ordinary nominative | 3,089,700 | 31,413 |
| | | 8,892,763 |
EuroPacific Growth Fund — Page 4 of 9
unaudited
Common stocks
Materials 5.54% | Shares | Value
(000) |
| Glencore PLC1 | 250,223,000 | $1,147,072 |
| Chr. Hansen Holding A/S1,3 | 8,743,000 | 749,854 |
| Vale SA, ordinary nominative (ADR) | 48,996,373 | 493,394 |
| Vale SA, ordinary nominative | 16,296,278 | 163,984 |
| Teck Resources Ltd., Class B | 29,814,000 | 627,701 |
| Nitto Denko Corp.1 | 7,210,099 | 601,934 |
| Barrick Gold Corp. | 35,000,000 | 563,150 |
| Barrick Gold Corp. (CAD denominated) | 1,429,788 | 23,010 |
| HeidelbergCement AG1 | 5,183,684 | 532,830 |
| Koninklijke DSM NV1 | 5,347,619 | 437,990 |
| Sika AG, non-registered shares1 | 50,000 | 372,028 |
| First Quantum Minerals Ltd. | 31,911,001 | 358,303 |
| Asahi Kasei Corp.1 | 28,524,000 | 351,449 |
| CCL Industries Inc., Class B, nonvoting | 6,661,715 | 322,368 |
| Grasim Industries Ltd.1 | 17,273,005 | 300,061 |
| Klabin SA, units | 46,863,500 | 271,520 |
| Rio Tinto PLC1 | 4,833,000 | 224,973 |
| Ambuja Cements Ltd.1 | 52,190,000 | 212,918 |
| Fortescue Metals Group Ltd.1 | 44,992,000 | 182,166 |
| Akzo Nobel NV1 | 1,956,051 | 180,630 |
| UltraTech Cement Ltd.1 | 2,838,000 | 167,614 |
| BASF SE1 | 1,029,000 | 109,504 |
| Amcor Ltd.1 | 8,064,000 | 96,491 |
| ACC Ltd.1 | 2,340,000 | 59,367 |
| | | 8,550,311 |
| Energy 4.71% | | |
| Reliance Industries Ltd.1 | 203,636,942 | 2,439,663 |
| Enbridge Inc. (CAD denominated) | 20,020,499 | 836,280 |
| Royal Dutch Shell PLC, Class A1 | 23,620,145 | 711,793 |
| Royal Dutch Shell PLC, Class A (EUR denominated)1 | 766,933 | 23,191 |
| Schlumberger Ltd. | 6,964,700 | 485,857 |
| Petróleo Brasileiro SA (Petrobras), ordinary nominative (ADR)2 | 33,203,674 | 333,365 |
| Petróleo Brasileiro SA (Petrobras), preferred nominative (ADR)2 | 11,502,000 | 111,109 |
| Royal Dutch Shell PLC, Class B1 | 12,815,158 | 394,090 |
| TOTAL SA1 | 7,116,685 | 382,759 |
| Canadian Natural Resources, Ltd. | 10,800,000 | 361,717 |
| Tourmaline Oil Corp.2,3 | 16,547,000 | 336,444 |
| Oil Search Ltd.1 | 55,751,452 | 307,413 |
| Seven Generations Energy Ltd., Class A2 | 15,152,900 | 239,726 |
| Suncor Energy Inc. | 5,775,000 | 202,397 |
| Tullow Oil PLC1,2 | 40,780,035 | 101,717 |
| | | 7,267,521 |
| Telecommunication services 2.86% | | |
| SoftBank Group Corp.1 | 33,909,406 | 2,740,901 |
| Nippon Telegraph and Telephone Corp.1 | 24,994,000 | 1,146,256 |
| BT Group PLC1 | 41,786,128 | 158,979 |
| China Mobile Ltd.1 | 14,000,000 | 141,624 |
| Bharti Airtel Ltd.1 | 16,800,000 | 100,342 |
| TalkTalk Telecom Group PLC1 | 23,374,000 | 65,670 |
| Intouch Holdings PCL, foreign registered1 | 36,860,000 | 63,605 |
| | | 4,417,377 |
EuroPacific Growth Fund — Page 5 of 9
unaudited
Common stocks
Utilities 2.85% | Shares | Value
(000) |
| DONG Energy AS1,3 | 27,014,285 | $1,546,317 |
| China Gas Holdings Ltd.1,3 | 268,700,000 | 808,983 |
| Power Grid Corp. of India Ltd.1 | 152,702,666 | 494,039 |
| Enel SPA1 | 78,250,000 | 471,204 |
| ENN Energy Holdings Ltd.1 | 50,122,000 | 364,396 |
| CK Infrastructure Holdings Ltd.1 | 38,723,000 | 333,918 |
| China Resources Gas Group Ltd.1 | 45,732,000 | 159,827 |
| EDP - Energias de Portugal, SA1 | 35,305,719 | 132,914 |
| Power Assets Holdings Ltd.1 | 8,910,000 | 77,373 |
| SSE PLC1 | 828,214 | 15,500 |
| | | 4,404,471 |
| Real estate 1.07% | | |
| CK Asset Holdings Ltd.1 | 79,511,708 | 661,319 |
| Ayala Land, Inc.1 | 363,638,700 | 311,763 |
| Ayala Land, Inc., preference shares1,4 | 481,283,600 | 852 |
| Henderson Land Development Co. Ltd.1 | 37,307,249 | 247,873 |
| Sun Hung Kai Properties Ltd.1 | 14,720,083 | 240,249 |
| Daiwa House Industry Co., Ltd.1 | 5,450,000 | 188,299 |
| | | 1,650,355 |
| Miscellaneous 4.81% | | |
| Other common stocks in initial period of acquisition | | 7,423,430 |
| Total common stocks (cost: $93,410,890,000) | | 141,979,586 |
Convertible bonds 0.04%
Miscellaneous 0.04% | Principal?amount
(000) | |
| Other convertible bonds in initial period of acquisition | | 60,059 |
| Total convertible bonds (cost: $46,444,000) | | 60,059 |
Bonds, notes & other debt instruments 0.12%
U.S. Treasury bonds & notes 0.07%
U.S. Treasury 0.07% | | |
| U.S. Treasury 0.875% 20175 | $108,700 | 108,691 |
| Total U.S. Treasury bonds & notes | | 108,691 |
| Bonds & notes of governments & government agencies outside the U.S. 0.05% | | |
| Brazil (Federative Republic of) 0% 2021 | BRL123,000 | 28,256 |
| Brazil (Federative Republic of) Global 5.875% 2019 | $15,435 | 16,284 |
| Brazil (Federative Republic of) Global 4.875% 2021 | 23,995 | 25,712 |
| | | 70,252 |
| Total bonds, notes & other debt instruments (cost: $178,532,000) | | 178,943 |
| Short-term securities 7.50% | | |
| American Honda Finance Corp. 1.22%–1.29% due 10/10/2017–12/15/2017 | 182,500 | 182,189 |
| ANZ New Zealand (International) Ltd. 1.20% due 11/22/20176 | 100,000 | 99,819 |
| Apple Inc. 1.20%–1.25% due 10/19/2017–12/5/20176 | 197,750 | 197,506 |
| Australia & New Zealand Banking Group, Ltd. 1.18% due 10/18/2017–11/9/20176 | 200,000 | 199,803 |
| Bank of Montreal 1.20%–1.27% due 10/16/2017–11/3/2017 | 275,000 | 274,741 |
EuroPacific Growth Fund — Page 6 of 9
unaudited
| Short-term securities | Principal?amount
(000) | Value
(000) |
| Bank of New York Mellon Corp. 1.30% due 11/28/2017 | $50,000 | $49,899 |
| Bank of Nova Scotia 1.34%–1.46% due 10/4/2017–11/28/20176 | 100,000 | 99,889 |
| Bank of Tokyo-Mitsubishi UFJ, Ltd. 1.33% due 10/2/2017 | 50,000 | 49,995 |
| BMW U.S. Capital LLC 1.27%–1.30% due 10/24/2017–10/26/20176 | 43,000 | 42,965 |
| BNP Paribas, New York Branch 1.24%–1.30% due 10/18/2017–12/8/2017 | 175,000 | 174,761 |
| British Columbia (Province of) 1.32% due 1/16/2018 | 31,800 | 31,683 |
| CAFCO, LLC 1.26%–1.31% due 10/2/2017–12/11/20176 | 204,700 | 204,432 |
| Caisse d’Amortissement de la Dette Sociale 1.24% due 1/4/20186 | 30,000 | 29,894 |
| Canadian Imperial Bank of Commerce 1.21%–1.36% due 11/14/2017–1/12/20186 | 275,000 | 274,214 |
| Canadian Imperial Holdings Inc. 1.18% due 1/24/2018 | 50,000 | 49,789 |
| Chariot Funding, LLC 1.20% due 1/3/20186 | 53,000 | 52,809 |
| Cisco Systems, Inc. 1.19%–1.25% due 10/18/2017–11/29/20176 | 200,000 | 199,774 |
| CPPIB Capital Inc. 1.16%–1.31% due 10/20/2017–1/3/20186 | 235,000 | 234,357 |
| DBS Bank Ltd. 1.18%–1.29% due 10/4/2017–11/10/20176 | 190,000 | 189,797 |
| Export Development Canada 1.20%–1.29% due 10/2/2017–11/13/2017 | 179,200 | 179,041 |
| Fannie Mae 1.05% due 11/6/2017 | 69,800 | 69,734 |
| Federal Farm Credit Banks 1.16% due 1/10/2018 | 28,000 | 27,913 |
| Federal Home Loan Bank 1.01%–1.37% due 10/3/2017–2/21/2018 | 3,257,500 | 3,251,839 |
| Freddie Mac 0.99%–1.08% due 10/10/2017–12/13/2017 | 181,500 | 181,351 |
| Gotham Funding Corp. 1.04%–1.38% due 11/7/2017–1/12/20186 | 115,000 | 114,724 |
| ING (U.S.) Funding LLC 1.30%–1.40% due 11/10/2017–12/11/2017 | 100,000 | 99,800 |
| John Deere Canada ULC 1.33% due 10/17/20176 | 44,100 | 44,075 |
| Kells Funding, LLC 1.18%–1.31% due 10/27/2017–12/11/20176 | 260,000 | 259,423 |
| KfW 1.24% due 10/6/2017–10/17/20176 | 178,000 | 177,932 |
| Liberty Street Funding Corp. 1.17%–1.28% due 10/6/2017–1/12/20186 | 120,000 | 119,771 |
| Microsoft Corp. 1.13% due 10/24/20176 | 100,000 | 99,923 |
| Mitsubishi UFJ Trust and Banking Corp. 1.09% due 11/8/20176 | 75,000 | 74,897 |
| Mizuho Bank, Ltd. 1.22%–1.29% due 10/20/2017–12/5/20176 | 279,300 | 278,952 |
| Nestlé Capital Corp. 1.22% due 11/17/20176 | 50,000 | 49,923 |
| Nestlé Finance International Ltd. 1.23% due 11/27/2017 | 50,000 | 49,906 |
| Nordea Bank AB 1.16%–1.32% due 10/3/2017–1/16/20186 | 300,000 | 299,481 |
| Novartis Finance Corp. 1.04% due 10/12/20176 | 60,000 | 59,976 |
| Old Line Funding, LLC 1.06%–1.14% due 10/30/2017–11/30/20176 | 80,000 | 79,857 |
| Pfizer Inc. 1.03% due 10/18/20176 | 50,000 | 49,971 |
| Province of Alberta 1.20% due 11/21/20176 | 50,000 | 49,918 |
| Québec (Province of) 0.99%–1.12% due 10/16/2017–12/4/20176 | 215,000 | 214,726 |
| Société Générale 1.08% due 10/31/20176 | 50,000 | 49,947 |
| Sumitomo Mitsui Banking Corp. 1.01%–1.14% due 10/25/2017–11/27/20176 | 250,000 | 249,630 |
| Svenska Handelsbanken Inc. 1.03%–1.05% due 10/2/2017–12/18/20176 | 300,000 | 299,510 |
| Thunder Bay Funding, LLC 1.02%–1.12% due 10/4/2017–11/20/20176 | 200,000 | 199,835 |
| Toronto-Dominion Bank 1.04%–1.05% due 10/6/2017–1/22/20186 | 150,000 | 149,580 |
| Toronto-Dominion Holdings USA Inc. 1.08% due 11/14/20176 | 50,000 | 49,922 |
| Total Capital Canada Ltd. 1.04%–1.07% due 10/5/2017–10/24/20176 | 230,000 | 229,865 |
| Toyota Credit Canada Inc. 1.04% due 11/21/2017 | 50,000 | 49,913 |
| Toyota Motor Credit Corp. 1.31% due 10/11/2017 | 100,000 | 99,963 |
| U.S. Bank, N.A. 1.31% due 2/2/2018 | 100,000 | 100,046 |
| U.S. Treasury Bills 1.20%–1.35% due 11/16/2017–2/8/2018 | 1,167,200 | 1,164,064 |
| United Overseas Bank Limited 1.18%–1.34% due 11/28/2017–1/9/20186 | 204,500 | 203,940 |
| Victory Receivables Corp. 1.29% due 11/9/20176 | 36,200 | 36,148 |
| Wal-Mart Stores, Inc. 1.11% due 10/4/20176 | 50,000 | 49,993 |
EuroPacific Growth Fund — Page 7 of 9
unaudited
| Short-term securities | Principal?amount
(000) | Value
(000) |
| Walt Disney Co. 1.30% due 10/27/20176 | $75,000 | $74,934 |
| Wells Fargo Bank, N.A. 1.42% due 2/1/2018 | 100,000 | 100,051 |
| Total short-term securities (cost: $11,578,279,000) | | 11,578,790 |
| Total investment securities 99.64% (cost: $105,214,145,000) | | 153,797,378 |
| Other assets less liabilities 0.36% | | 553,857 |
| Net assets 100.00% | | $154,351,235 |
As permitted by U.S. Securities and Exchange Commission regulations, “Miscellaneous” securities include holdings in their first year of acquisition that have not previously been publicly disclosed.
Forward currency contracts
| Contract amount | Counterparty | Settlement
date | Unrealized
appreciation
(depreciation)
at 9/30/2017
(000) |
Purchases
(000) | Sales
(000) |
| USD43,175 | ZAR570,000 | Barclays Bank PLC | 10/18/2017 | $1,207 |
| USD33,338 | JPY3,669,900 | Bank of America, N.A. | 10/19/2017 | 691 |
| USD313,487 | GBP239,992 | Citibank | 10/19/2017 | (8,318) |
| USD206,830 | GBP160,279 | UBS AG | 10/20/2017 | (8,096) |
| USD175,539 | INR11,337,161 | Bank of America, N.A. | 10/23/2017 | 2,535 |
| USD453,432 | JPY50,000,000 | Bank of America, N.A. | 11/10/2017 | 8,193 |
| USD6,096 | JPY664,700 | JPMorgan Chase | 11/10/2017 | 177 |
| USD44,647 | JPY4,900,000 | JPMorgan Chase | 11/16/2017 | 1,002 |
| USD458,782 | JPY50,945,000 | HSBC Bank | 11/22/2017 | 4,902 |
| USD243,149 | JPY27,000,000 | Barclays Bank PLC | 11/22/2017 | 2,600 |
| | | | | $4,893 |
The following footnotes apply to either the individual securities noted or one or more of the securities aggregated and listed as a single line item.
| 1 | Valued under fair value procedures adopted by authority of the board of trustees. The total value of all such securities, including those in “Other securities,“ was $121,837,043,000, which represented 78.93% of the net assets of the fund. This amount includes $119,031,564,000 related to certain securities trading outside the U.S. whose values were adjusted as a result of significant market movements following the close of local trading. |
| 2 | Security did not produce income during the last 12 months. |
| 3 | Represents an affiliated company as defined under the Investment Company Act of 1940. |
| 4 | Value determined using significant unobservable inputs. |
| 5 | A portion of this security was pledged as collateral. The total value of pledged collateral was $17,259,000, which represented .01% of the net assets of the fund. |
| 6 | Acquired in a transaction exempt from registration under Section 4(2) of the Securities Act of 1933. May be resold in the U.S. in transactions exempt from registration, normally to qualified institutional buyers. The total value of all such securities was $5,392,112,000, which represented 3.49% of the net assets of the fund. |
| Key to abbreviations and symbol | | |
| ADR = American Depositary Receipts | EUR = Euros | JPY = Japanese yen |
| BRL = Brazilian reais | GBP = British pounds | USD/$ = U.S. dollars |
| CAD = Canadian dollars | INR = Indian rupees | ZAR = South African rand |
| CDI = CREST Depository Interest | | |
EuroPacific Growth Fund — Page 8 of 9
unaudited
Additional financial disclosures are included in the fund’s current shareholder report and should be read in conjunction with this report.
Investments are not FDIC-insured, nor are they deposits of or guaranteed by a bank or any other entity, so they may lose value.
Investors should carefully consider investment objectives, risks, charges and expenses. This and other important information is contained in the fund prospectus and summary prospectus, which can be obtained from your financial professional and should be read carefully before investing. You may also call American Funds Service Company (AFS) at (800) 421-4225 or visit the American Funds website at americanfunds.com. Fund shares offered through American Funds Distributors, Inc.
| MFGEFPX-016-1117O-S60714 | EuroPacific Growth Fund — Page 9 of 9 |
ITEM 7 – Disclosure of Proxy Voting Policies and Procedures for Closed-End Management Investment Companies
Not applicable to this Registrant, insofar as the Registrant is not a closed-end management investment company.
ITEM 8 – Portfolio Managers of Closed-End Management Investment Companies
Not applicable to this Registrant, insofar as the Registrant is not a closed-end management investment company.
ITEM 9 – Purchases of Equity Securities by Closed-End Management Investment Company and Affiliated Purchasers
Not applicable to this Registrant, insofar as the Registrant is not a closed-end management investment company.
ITEM 10 – Submission of Matters to a Vote of Security Holders
There have been no material changes to the procedures by which shareholders may recommend nominees to the Registrant’s board of trustees since the Registrant last submitted a proxy statement to its shareholders. The procedures are as follows. The Registrant has a nominating and governance committee comprised solely of persons who are not considered ‘‘interested persons’’ of the Registrant within the meaning of the
Investment Company Act of 1940, as amended. The committee periodically reviews such issues as the board’s composition, responsibilities, committees, compensation and other relevant issues, and recommends any appropriate changes to the full board of trustees. While the committee normally is able to identify from its own resources an ample number of qualified candidates, it will consider shareholder suggestions of persons to be considered as nominees to fill future vacancies on the board. Such suggestions must be sent in writing to the nominating and governance committee of the Registrant, c/o the Registrant’s Secretary, and must be accompanied by complete biographical and occupational data on the prospective nominee, along with a written consent of the prospective nominee for consideration of his or her name by the nominating and governance committee.
ITEM 11 – Controls and Procedures
| (a) | The Registrant’s Principal Executive Officer and Principal Financial Officer have concluded, based on their evaluation of the Registrant’s disclosure controls and procedures (as such term is defined in Rule 30a-3 under the Investment Company Act of 1940), that such controls and procedures are adequate and reasonably designed to achieve the purposes described in paragraph (c) of such rule. |
| | |
| (b) | There were no changes in the Registrant’s internal controls over financial reporting (as defined in Rule 30a-3(d) under the Investment Company Act of 1940) that occurred during the Registrant’s second fiscal quarter of the period covered by this report that has materially affected, or is reasonably likely to materially affect, the Registrant’s internal control over financial reporting. |
ITEM 12 – Exhibits
| (a)(1) | Not applicable for filing of semi-annual reports to shareholders. |
| | |
| (a)(2) | The certifications required by Rule 30a-2 of the Investment Company Act of 1940 and Sections 302 and 906 of the Sarbanes-Oxley Act of 2002 are attached as exhibits hereto. |
SIGNATURES
Pursuant to the requirements of the Securities Exchange Act of 1934 and the Investment Company Act of 1940, the Registrant has duly caused this report to be signed on its behalf by the undersigned, thereunto duly authorized.
| | EUROPACIFIC GROWTH FUND |
| | |
| | By /s/ Walter R. Burkley |
| | Walter R. Burkley, Executive Vice President and Principal Executive Officer |
| | |
| | Date: November 30, 2017 |
Pursuant to the requirements of the Securities Exchange Act of 1934 and the Investment Company Act of 1940, this report has been signed below by the following persons on behalf of the Registrant and in the capacities and on the dates indicated.
| By /s/ Walter R. Burkley |
Walter R. Burkley, Executive Vice President and Principal Executive Officer |
| |
| Date: November 30, 2017 |
| By /s/ Brian C. Janssen |
Brian C. Janssen, Treasurer and Principal Financial Officer |
| |
| Date: November 30, 2017 |