UNITED STATES
SECURITIES AND EXCHANGE COMMISSION
Washington, D.C. 20549
FORM N-CSR
Certified Shareholder Report of
Registered Management Investment Companies
Investment Company Act File Number: 811-03734
EuroPacific Growth Fund
(Exact Name of Registrant as Specified in Charter)
333 South Hope Street
Los Angeles, California 90071
(Address of Principal Executive Offices)
Registrant's telephone number, including area code: (949) 975-5000
Date of fiscal year end: March 31
Date of reporting period: September 30, 2019
Brian C. Janssen
EuroPacific Growth Fund
6455 Irvine Center Drive
Los Angeles, California 90071
(Name and Address of Agent for Service)
ITEM 1 – Reports to Stockholders
EuroPacific Growth Fund® Semi-annual report
for the six months ended
September 30, 2019 |  |

Tap into the growth
potential of
international equities
Beginning January 1, 2021, as permitted by regulations adopted by the U.S. Securities and Exchange Commission, we intend to no longer mail paper copies of the fund’s shareholder reports, unless specifically requested from American Funds or your financial intermediary, such as a broker-dealer or bank. Instead, the reports will be made available on the Capital Group website (capitalgroup.com); you will be notified by mail and provided with a website link to access the report each time a report is posted. If you have already elected to receive shareholder reports electronically, you will not be affected by this change and do not need to take any action. If you prefer to receive shareholder reports and other communications electronically, you may update your mailing preferences with your financial intermediary, or enroll in e-delivery at capitalgroup.com (for accounts held directly with the fund).
You may elect to receive paper copies of all future reports free of charge. If you invest through a financial intermediary, you may contact your financial intermediary to request that you continue to receive paper copies of your shareholder reports. If you invest directly with the fund, you may inform American Funds that you wish to continue receiving paper copies of your shareholder reports by contacting us at (800) 421-4225. Your election to receive paper reports will apply to all funds held with American Funds or through your financial intermediary.
EuroPacific Growth Fund seeks to provide you with long-term growth of capital.
This fund is one of more than 40 offered by Capital Group, home of American Funds, one of the nation’s largest mutual fund families. For more than 85 years, Capital Group has invested with a long-term focus based on thorough research and attention to risk.
Fund results shown in this report, unless otherwise indicated, are for Class A shares at net asset value. If a sales charge (maximum 5.75%) had been deducted, the results would have been lower. Results are for past periods and are not predictive of results for future periods. Current and future results may be lower or higher than those shown. Share prices and returns will vary, so investors may lose money. Investing for short periods makes losses more likely. For current information and month-end results, visit capitalgroup.com.
Here are the average annual total returns on a $1,000 investment with all distributions reinvested for periods ended September 30, 2019:
| Class A shares | | 1 year | | 5 years | | 10 years |
| | | | | | | |
| Reflecting 5.75% maximum sales charge | | –5.02% | | 3.42% | | 5.08% |
For other share class results, visit capitalgroup.com and americanfundsretirement.com.
The total annual fund operating expense ratio is 0.83% for Class A shares as of the prospectus dated June 1, 2019.
Investment results assume all distributions are reinvested and reflect applicable fees and expenses. When applicable, investment results reflect fee waivers, without which results would have been lower. Visit capitalgroup.com for more information.
Investing outside the United States may be subject to risks, such as currency fluctuations, periods of illiquidity and price volatility. These risks may be heightened in connection with investments in developing countries. Refer to the fund prospectus and the Risk Factors section of this report for more information on these and other risks associated with investing in the fund.
Investments are not FDIC-insured, nor are they deposits of or guaranteed by a bank or any other entity, so they may lose value.
Fellow investors:
In a six-month span marked by rising U.S.-China trade tensions, EuroPacific Growth Fund generated solid returns and exceeded its primary benchmark for the period ended September 30, 2019.
The fund gained 2.04% for shareholders who reinvested dividends and capital gains. This result surpassed the 1.13% increase recorded by the fund’s primary benchmark, the MSCI All Country World Index ex USA, which reflects the returns of more than 40 developed and developing country stock markets.
EuroPacific Growth outpaced its peer group, as well, reflected by the Lipper International Funds Average, which rose 1.75% during the six-month period. The fund lagged the return of the MSCI EAFE (Europe, Australasia, Far East) Index, which advanced 2.57%. Over longer time frames, the fund’s results compare favorably to the indexes and the peer group, as shown in the table below.
Results at a glance
For periods ended September 30, 2019, with all distributions reinvested
| | | Cumulative
total returns | | Average annual total returns |
| | | 6 months | | 1 year | | 5 years | | 10 years | | Lifetime
(since 4/16/84) |
| | | | | | | | | | | |
| EuroPacific Growth Fund (Class A shares) | | | 2.04 | % | | | 0.78 | % | | | 4.65 | % | | | 5.70 | % | | | 10.38 | % |
| MSCI ACWI (All Country World Index) ex USA1,2 | | | 1.13 | | | | –1.23 | | | | 2.90 | | | | 4.45 | | | | 8.42 | |
| MSCI EAFE (Europe, Australasia, Far East) Index1,3 | | | 2.57 | | | | –1.34 | | | | 3.27 | | | | 4.90 | | | | 8.01 | |
| Lipper International Funds Average4 | | | 1.75 | | | | –2.42 | | | | 2.94 | | | | 4.81 | | | | 8.41 | |
| 1 | The market indexes are unmanaged and, therefore, have no expenses. Investors cannot invest directly in an index. Source: MSCI. |
| 2 | From April 16, 1984, through December 31, 1987, the MSCI EAFE (Europe, Australasia, Far East) Index was used because the MSCI ACWI (All Country World Index) ex USA did not yet exist. Since January 1, 1988, the MSCI ACWI ex USA has been used. The MSCI EAFE Index reflects dividends net of withholding taxes. The MSCI ACWI ex USA reflects dividends gross of withholding taxes through December 31, 2000, and dividends net of withholding taxes thereafter. |
| 3 | This index was the fund’s primary benchmark until the fiscal year ended March 31, 2007. Results reflect dividends net of withholding taxes. |
| 4 | Lipper averages reflect the current composition of all eligible mutual funds (all share classes) within a given category. Lipper source: Thomson Reuters Lipper. Lipper categories are dynamic and averages may have few funds, especially over longer periods. To see the number of funds included in the Lipper category for each fund’s lifetime, please see the Quarterly Statistical Update, available on our website. |
Markets rise despite trade tensions
International equity markets advanced during the April-to-September period in the face of an escalating trade war between the U.S. and China. Investor sentiment fluctuated sharply based on indications of progress or setbacks in U.S.-China trade negotiations. Shifting monetary policy also played a significant role. After raising interest rates in the fourth quarter of 2018, the U.S. Federal Reserve reversed course in July 2019 and cut rates for the first time in a decade. The European Central Bank and many others around the world did the same, slashing rates amid worsening trade disputes and signs of a weakening global economy.
European stocks rose despite sluggish economic growth and political turmoil in several countries. In July, U.K. Prime Minister Theresa May resigned after British lawmakers couldn’t agree on a plan to exit the European Union. Meanwhile, Germany teetered on the verge of recession as its export-oriented economy suffered from trade disruptions. Japanese stocks advanced as higher consumer spending helped to offset weak manufacturing activity. China’s slowing economy weighed on world markets, particularly emerging markets stocks. U.S. markets enjoyed some of the strongest gains, hitting a series of record highs over the summer.
Most sectors rise
Most sectors within the ACWI ex USA index rose for the six-month period, led by a 6.29% gain in the information technology sector. Semiconductor and semiconductor equipment stocks rose sharply, rebounding from a tough 2018. The successful launch of Apple’s new iPhone 11 helped to boost the companies involved in the mobile-device global supply chain. Consumer staples and utilities stocks also enjoyed significant gains as some investors rotated into more defensive-oriented, dividend-paying stocks, given widespread indications of weakening global economic growth.
Real estate stocks declined, weighed down by regional challenges at property companies in Germany and China. Energy and materials stocks also fell as investor worries about the health of the global economy sent oil and other commodities prices lower. Communication services stocks fell, hurt by sliding share prices among Chinese gaming companies. The financials sector was essentially flat as bank profitability was impaired by negative interest rates in Europe, Japan and elsewhere.
Where the fund’s assets are invested
(percent invested by country of domicile)
EuroPacific Growth Fund invests primarily in the stocks of companies based in Europe and the Pacific Basin.1
| | | EuroPacific
Growth Fund | | MSCI ACWI
ex USA Index2 |
| | | (9/30/2019) | | (3/31/2019) | | (9/30/2019) |
| Europe | | | | | | | | | | | | |
| Eurozone3 | | | 21.4 | % | | | 20.2 | % | | | 21.5 | % |
| United Kingdom | | | 7.8 | | | | 9.2 | | | | 11.0 | |
| Switzerland | | | 3.6 | | | | 3.6 | | | | 6.3 | |
| Denmark | | | 2.0 | | | | 1.9 | | | | 1.2 | |
| Russian Federation | | | .6 | | | | .5 | | | | 1.0 | |
| Other Europe | | | .6 | | | | .4 | | | | 2.8 | |
| | | | 36.0 | | | | 35.8 | | | | 43.8 | |
| | | | | | | | | | | | | |
| Pacific Basin | | | | | | | | | | | | |
| Japan | | | 14.0 | | | | 12.7 | | | | 16.4 | |
| China | | | 8.4 | | | | 9.6 | | | | 8.3 | |
| Hong Kong | | | 4.8 | | | | 5.7 | | | | 2.4 | |
| South Korea | | | 3.5 | | | | 4.3 | | | | 3.2 | |
| Canada | | | 3.3 | | | | 3.8 | | | | 7.0 | |
| United States | | | 2.0 | | | | 2.2 | | | | — | |
| Taiwan | | | 1.7 | | | | 1.9 | | | | 3.0 | |
| Australia | | | 1.3 | | | | 1.1 | | | | 4.7 | |
| Thailand | | | .8 | | | | .9 | | | | .8 | |
| Philippines | | | .4 | | | | .5 | | | | .3 | |
| Other Pacific Basin | | | 1.1 | | | | 1.0 | | | | 3.1 | |
| | | | 41.3 | | | | 43.7 | | | | 49.2 | |
| | | | | | | | | | | | | |
| Other | | | | | | | | | | | | |
| India | | | 8.5 | | | | 8.6 | | | | 2.2 | |
| Brazil | | | 4.8 | | | | 4.2 | | | | 2.0 | |
| South Africa | | | .5 | | | | .7 | | | | 1.2 | |
| Israel | | | .3 | | | | .5 | | | | .4 | |
| Other countries | | | — | | | | .2 | | | | 1.2 | |
| | | | 14.1 | | | | 14.2 | | | | 7.0 | |
| | | | | | | | | | | | | |
| Short-term securities & other assets less liabilities | | | 8.6 | | | | 6.3 | | | | — | |
| | | | | | | | | | | | | |
| Total | | | 100.0 | % | | | 100.0 | % | | | 100.0 | % |
| 1 | A country is considered part of the Pacific Basin if any of its borders touches the Pacific Ocean. |
| 2 | Weighted by market capitalization. |
| 3 | Countries using the euro as a common currency: Austria, Belgium, Cyprus, Estonia, Finland, France, Germany, Greece, Ireland, Italy, Latvia, Luxembourg, Malta, the Netherlands, Portugal, Slovakia, Slovenia and Spain. |
Inside the portfolio
Select investments in the communication services sector boosted returns relative to the fund’s primary benchmark. Nintendo shares rallied on the Japanese gaming giant’s announcement that it had secured a deal to sell the Switch console in China. Information technology stocks contributed positively to results, led by strong returns from Dutch semiconductor equipment maker ASML. Shares of ASML rallied on the increasing use of its cutting-edge EUV lithography technology to create advanced microchips. Elsewhere in the sector, shares of PagSeguro Digital and Taiwan Semiconductor Manufacturing rose significantly.
Investments in the health care and financials sectors also lifted the fund’s returns. Daiichi Sankyo shares rallied on strong quarterly earnings and investor optimism for its oncology drug pipeline. Among financials stocks, shares of Kotak Mahindra advanced as the Indian bank continued to enjoy a rapidly growing customer base and an expanding loan book. In the consumer discretionary sector, Chinese e-commerce firm Meituan Dianping rose sharply on the soaring popularity of its food delivery services.
Stocks in the materials industry were among the largest detractors amid a broad decline in commodities prices and other setbacks. Shares of Brazilian mining giant Vale declined in the aftermath of a fatal dam collapse. Shares of Canadian miner Teck Resources fell on lower copper and zinc prices, in part due to less demand from China. Among drug companies, shares of Teva Pharmaceuticals fell sharply due to rising competition in generic drug markets and lawsuits stemming from the opioid crisis. Elsewhere in the portfolio, Alibaba and Yamato Holdings were also among the biggest detractors.
Looking ahead
International equity markets have remained resilient this year in the face of daunting circumstances, including trade uncertainty, rising political risk and slowing economic growth in key regions of the world. Moving into 2020, we expect a challenging investment environment to be further strained by a contentious U.S. presidential election. Given these events, we are cautious about the outlook for 2020. However, we remain optimistic about the specific companies we have chosen for this portfolio through fundamental, bottom-up security selection. We believe our long-term investment horizon provides a powerful advantage, allowing us to invest through difficult markets and find attractively priced companies that we think will do well over many years.
From a macroeconomic perspective, accommodative monetary policy around the world should help provide some boost to global economic growth. Low interest rates and other stimulus measures are supportive of higher valuations in the equity markets. We are also encouraged by initial signs of a limited trade truce between the U.S. and China, and we are hopeful that damaging tariffs and other trade restrictions can be meaningfully reduced in the years ahead since they have clearly taken a toll on the global economy.
We thank you for your commitment to the EuroPacific Growth Fund, and we look forward to reporting to you again in six months.
Sincerely,

Carl Kawaja
Co-President

Christopher Thomsen
Co-President
November 11, 2019
For current information about the fund, visit capitalgroup.com.
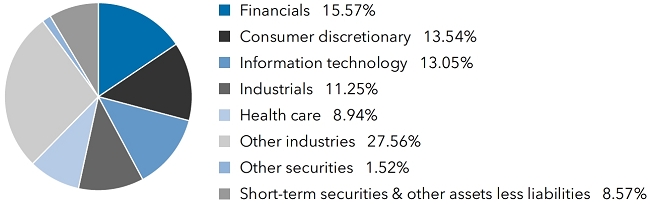
| Summary investment portfolioSeptember 30, 2019 | unaudited |
| Industry sector diversification | Percent of net assets |
| Country diversification by domicile | | Percent of
net assets |
| Eurozone* | | | 21.43 | % |
| Japan | | | 14.04 | |
| India | | | 8.47 | |
| China | | | 8.44 | |
| United Kingdom | | | 7.81 | |
| Brazil | | | 4.77 | |
| Hong Kong | | | 4.75 | |
| Switzerland | | | 3.64 | |
| South Korea | | | 3.51 | |
| Other countries | | | 14.57 | |
| Short-term securities & other assets less liabilities | | | 8.57 | |
| * | Countries using the euro as a common currency; those represented in the fund’s portfolio are Belgium, Finland, France, Germany, Greece, Ireland, Italy, the Netherlands and Spain. |
| Common stocks 89.91% | | Shares | | | Value
(000) | |
| Financials 15.57% | | | | | | | | |
| HDFC Bank Ltd. | | | 211,861,504 | | | $ | 3,669,449 | |
| HDFC Bank Ltd. (ADR) | | | 12,206,296 | | | | 696,369 | |
| AIA Group Ltd. | | | 429,917,600 | | | | 4,061,829 | |
| Kotak Mahindra Bank Ltd. | | | 94,883,478 | | | | 2,201,690 | |
| Prudential PLC | | | 55,816,599 | | | | 1,012,282 | |
| B3 SA - Brasil, Bolsa, Balcao | | | 87,375,000 | | | | 917,501 | |
| London Stock Exchange Group PLC | | | 9,464,216 | | | | 850,412 | |
| Barclays PLC | | | 418,872,724 | | | | 774,598 | |
| Sberbank of Russia PJSC (ADR) | | | 53,567,881 | | | | 759,325 | |
| Other securities | | | | | | | 9,733,534 | |
| | | | | | | | 24,676,989 | |
| | | | | | | | | |
| Consumer discretionary 13.54% | | | | | | | | |
| Alibaba Group Holding Ltd. (ADR)1 | | | 20,114,042 | | | | 3,363,671 | |
| MercadoLibre, Inc.1,2 | | | 3,570,301 | | | | 1,968,057 | |
| LVMH Moët Hennessy-Louis Vuitton SE | | | 4,623,547 | | | | 1,837,630 | |
| adidas AG | | | 4,334,468 | | | | 1,349,512 | |
| Galaxy Entertainment Group Ltd. | | | 211,181,000 | | | | 1,313,532 | |
| | | Shares | | | Value
(000) | |
| Sony Corp. | | | 19,034,500 | | | $ | 1,117,336 | |
| EssilorLuxottica | | | 7,329,559 | | | | 1,056,526 | |
| Meituan Dianping, Class B1 | | | 81,882,758 | | | | 836,828 | |
| Other securities | | | | | | | 8,608,570 | |
| | | | | | | | 21,451,662 | |
| | | | | | | | | |
| Information technology 13.05% | | | | | | | | |
| ASML Holding NV | | | 12,454,648 | | | | 3,084,906 | |
| Samsung Electronics Co., Ltd. | | | 62,352,400 | | | | 2,556,858 | |
| Taiwan Semiconductor Manufacturing Co., Ltd.3 | | | 232,275,329 | | | | 2,034,175 | |
| Taiwan Semiconductor Manufacturing Co., Ltd. (ADR) | | | 8,225,369 | | | | 382,315 | |
| SK hynix, Inc. | | | 26,363,000 | | | | 1,811,678 | |
| Keyence Corp. | | | 2,915,200 | | | | 1,803,717 | |
| PagSeguro Digital Ltd., Class A1,2 | | | 26,160,112 | | | | 1,211,475 | |
| Amadeus IT Group SA, Class A, non-registered shares | | | 15,703,586 | | | | 1,124,872 | |
| SAP SE | | | 9,335,503 | | | | 1,097,704 | |
| Tokyo Electron Ltd. | | | 3,724,000 | | | | 708,292 | |
| Other securities | | | | | | | 4,868,838 | |
| | | | | | | | 20,684,830 | |
| | | | | | | | | |
| Industrials 11.25% | | | | | | | | |
| Airbus SE, non-registered shares | | | 31,874,875 | | | | 4,141,249 | |
| Recruit Holdings Co., Ltd. | | | 54,320,101 | | | | 1,650,829 | |
| Safran SA | | | 6,413,653 | | | | 1,009,787 | |
| Melrose Industries PLC2 | | | 339,320,636 | | | | 841,099 | |
| MTU Aero Engines AG2 | | | 2,850,916 | | | | 757,573 | |
| International Consolidated Airlines Group, SA (CDI)2 | | | 128,758,881 | | | | 751,999 | |
| Other securities | | | | | | | 8,681,500 | |
| | | | | | | | 17,834,036 | |
| | | | | | | | | |
| Health care 8.94% | | | | | | | | |
| Daiichi Sankyo Co., Ltd.2 | | | 39,235,300 | | | | 2,468,966 | |
| Novartis AG | | | 20,069,961 | | | | 1,740,248 | |
| AstraZeneca PLC | | | 12,344,525 | | | | 1,102,090 | |
| Chugai Pharmaceutical Co., Ltd. | | | 13,039,758 | | | | 1,013,031 | |
| Koninklijke Philips NV | | | 17,999,428 | | | | 833,785 | |
| Takeda Pharmaceutical Co. Ltd. | | | 21,638,353 | | | | 738,456 | |
| Alcon Inc.1 | | | 11,532,569 | | | | 672,507 | |
| CSL Ltd. | | | 4,147,828 | | | | 654,233 | |
| Other securities | | | | | | | 4,949,967 | |
| | | | | | | | 14,173,283 | |
| | | | | | | | | |
| Materials 7.47% | | | | | | | | |
| Vale SA, ordinary nominative (ADR) | | | 183,692,520 | | | | 2,112,464 | |
| Vale SA, ordinary nominative | | | 53,432,374 | | | | 614,062 | |
| Koninklijke DSM NV | | | 7,680,931 | | | | 924,250 | |
| Sika AG | | | 5,370,054 | | | | 785,560 | |
| Asahi Kasei Corp.2 | | | 77,119,742 | | | | 758,894 | |
| Teck Resources Ltd., Class B | | | 42,345,128 | | | | 686,548 | |
| Other securities | | | | | | | 5,954,732 | |
| | | | | | | | 11,836,510 | |
| Common stocks (continued) | | Shares | | | Value
(000) | |
| Consumer staples 5.48% | | | | | | | | |
| Nestlé SA | | | 12,265,366 | | | $ | 1,330,689 | |
| Kweichow Moutai Co., Ltd., Class A | | | 5,335,275 | | | | 859,516 | |
| Pernod Ricard SA | | | 4,392,773 | | | | 782,343 | |
| British American Tobacco PLC | | | 19,516,434 | | | | 721,693 | |
| Other securities | | | | | | | 4,997,601 | |
| | | | | | | | 8,691,842 | |
| | | | | | | | | |
| Energy 5.31% | | | | | | | | |
| Reliance Industries Ltd. | | | 200,935,942 | | | | 3,777,359 | |
| Cenovus Energy Inc. (CAD denominated)2 | | | 86,718,436 | | | | 813,609 | |
| Petróleo Brasileiro SA (Petrobras), ordinary nominative (ADR) | | | 53,126,910 | | | | 768,746 | |
| Canadian Natural Resources, Ltd. (CAD denominated) | | | 23,434,108 | | | | 623,506 | |
| Canadian Natural Resources, Ltd. | | | 4,330,337 | | | | 115,317 | |
| Other securities | | | | | | | 2,315,474 | |
| | | | | | | | 8,414,011 | |
| | | | | | | | | |
| Communication services 5.11% | | | | | | | | |
| Nintendo Co., Ltd.2 | | | 10,331,826 | | | | 3,824,089 | |
| Tencent Holdings Ltd. | | | 41,134,911 | | | | 1,733,002 | |
| SoftBank Group Corp. | | | 27,200,100 | | | | 1,066,621 | |
| Other securities | | | | | | | 1,477,797 | |
| | | | | | | | 8,101,509 | |
| | | | | | | | | |
| Utilities 2.98% | | | | | | | | |
| Ørsted AS | | | 17,373,818 | | | | 1,614,636 | |
| China Gas Holdings Ltd. | | | 207,466,600 | | | | 802,051 | |
| ENN Energy Holdings Ltd.2 | | | 72,941,000 | | | | 754,751 | |
| Other securities | | | | | | | 1,552,089 | |
| | | | | | | | 4,723,527 | |
| | | | | | | | | |
| Real estate 1.21% | | | | | | | | |
| Other securities | | | | | | | 1,912,834 | |
| | | | | | | | | |
| Total common stocks (cost: $102,273,546,000) | | | | | | | 142,501,033 | |
| | | | | | | | | |
| Preferred securities 1.37% | | | | | | | | |
| Financials 0.45% | | | | | | | | |
| Itaú Unibanco Holding SA, preferred nominative (ADR) | | | 84,467,457 | | | | 710,371 | |
| | | | | | | | | |
| Consumer discretionary 0.42% | | | | | | | | |
| Volkswagen AG, nonvoting preferred shares | | | 3,886,532 | | | | 661,090 | |
| | | | | | | | | |
| Information technology 0.05% | | | | | | | | |
| Samsung Electronics Co., Ltd., nonvoting preferred shares | | | 2,440,000 | | | | 80,575 | |
| | | | | | | | | |
| Other 0.45% | | | | | | | | |
| Other securities | | | | | | | 718,047 | |
| | | | | | | | | |
| Total preferred securities (cost: $1,963,177,000) | | | | | | | 2,170,083 | |
| Rights & warrants 0.08% | | Shares | | | Value
(000) | |
| Health care 0.08% | | | | | | | | |
| Other securities | | | | | | $ | 120,913 | |
| | | | | | | | | |
| Total rights & warrants(cost: $83,560,000) | | | | | | | 120,913 | |
| | | | | | | | | |
| Bonds, notes & other debt instruments 0.07% | | Principal amount
(000) | | | | | |
| Other 0.07% | | | | | | | | |
| Other securities | | | | | | | 109,276 | |
| | | | | | | | | |
| Total bonds, notes & other debt instruments(cost: $116,788,000) | | | | | | | 109,276 | |
| | | | | | | | | |
| Short-term securities 8.22% | | Shares | | | | | |
| Money market investments 8.12% | | | | | | | | |
| Capital Group Central Cash Fund 2.07%2,4 | | | 128,659,990 | | | | 12,864,712 | |
| | | | | | | | | |
| | | Principal amount
(000) | | | | | |
| Other short-term securities 0.10% | | | | | | | | |
| Other securities | | | | | | | 164,264 | |
| | | | | | | | | |
| Total short-term securities(cost: $13,310,682,000) | | | | | | | 13,028,976 | |
| Total investment securities 99.65% (cost: $117,747,753,000) | | | | | | | 157,930,281 | |
| Other assets less liabilities 0.35% | | | | | | | 557,414 | |
| | | | | | | | | |
| Net assets 100.00% | | | | | | $ | 158,487,695 | |
This summary investment portfolio is designed to streamline the report and help investors better focus on the fund’s principal holdings. See the inside back cover for details on how to obtain a complete schedule of portfolio holdings.
“Other securities” includes all issues that are not disclosed separately in the summary investment portfolio. “Other securities” also includes securities (with an aggregate value of $126,990,000, which represented .08% of the net assets of the fund) which were acquired in transactions exempt from registration under Rule 144A of the Securities Act of 1933 and may be resold in the U.S. in transactions exempt from registration, normally to qualified institutional buyers. “Other securities” also includes securities which were pledged as collateral. The total value of pledged collateral was $1,836,000, which represented less than .01% of the net assets of the fund.
Forward currency contracts
| Contract amount | | | | | Unrealized
appreciation
(depreciation) | |
Purchases
(000) | | Sales
(000) | | Counterparty | | Settlement date | at 9/30/2019
(000) | |
| USD71,199 | | GBP57,139 | | Citibank | | 10/18/2019 | | $ | 888 | |
| USD82,509 | | INR5,925,000 | | HSBC Bank | | 10/18/2019 | | | (929 | ) |
| USD40,614 | | INR2,925,000 | | JPMorgan Chase | | 10/21/2019 | | | (562 | ) |
Forward currency contracts (continued)
| Contract amount | | | | | Unrealized
appreciation
(depreciation) | |
Purchases
(000) | | Sales
(000) | | Counterparty | | Settlement date | at 9/30/2019
(000) | |
| USD62,748 | | INR4,462,500 | | Citibank | | 10/29/2019 | | $ | (13 | ) |
| USD125,826 | | GBP100,572 | | Citibank | | 11/6/2019 | | | 1,972 | |
| | | | | | | | | $ | 1,356 | |
Investments in affiliates
A company is an affiliate of the fund under the Investment Company Act of 1940 if the fund’s holdings represent 5% or more of the outstanding voting shares of that company. The value of the fund’s affiliated-company holdings is either shown in the summary investment portfolio or included in the value of “Other securities” under the respective industry sectors. Further details on these holdings and related transactions during the six months ended September 30, 2019, appear below.
| | | Beginning
shares | | | Additions | | | Reductions | | | Ending
shares | |
| Common stocks 13.67% | | | | | | | | | | | | | | | | |
| Consumer discretionary 2.34% | | | | | | | | | | | | | | | | |
| MercadoLibre, Inc.1 | | | 3,424,500 | | | | 155,000 | | | | 9,199 | | | | 3,570,301 | |
| Melco Resorts & Entertainment Ltd. (ADR) | | | 32,297,140 | | | | 575,000 | | | | 88,299 | | | | 32,783,841 | |
| Just Eat PLC1 | | | 54,396,000 | | | | — | | | | 8,115,650 | | | | 46,280,350 | |
| Ryohin Keikaku Co., Ltd. | | | 2,164,000 | | | | 16,380,900 | | | | 343,900 | | | | 18,201,000 | |
| Takeaway.com NV1 | | | — | | | | 3,176,472 | | | | 8,532 | | | | 3,167,940 | |
| ASOS PLC1 | | | 5,897,884 | | | | — | | | | 1,400,497 | | | | 4,497,387 | |
| Galaxy Entertainment Group Ltd.5 | | | 224,749,000 | | | | 17,726,000 | | | | 31,294,000 | | | | 211,181,000 | |
| GVC Holdings PLC5 | | | 31,312,683 | | | | — | | | | 6,300,885 | | | | 25,011,798 | |
| Information technology 1.14% | | | | | | | | | | | | | | | | |
| PagSeguro Digital Ltd., Class A1 | | | 24,308,238 | | | | 1,922,333 | | | | 70,459 | | | | 26,160,112 | |
| Halma PLC | | | 22,653,157 | | | | 2,090,072 | | | | 66,283 | | | | 24,676,946 | |
| Industrials 2.11% | | | | | | | | | | | | | | | | |
| Melrose Industries PLC | | | 290,421,746 | | | | 49,679,000 | | | | 780,110 | | | | 339,320,636 | |
| MTU Aero Engines AG | | | 3,144,000 | | | | — | | | | 293,084 | | | | 2,850,916 | |
| International Consolidated Airlines Group, SA (CDI) | | | 129,105,675 | | | | — | | | | 346,794 | | | | 128,758,881 | |
| Rentokil Initial PLC | | | 53,636,506 | | | | 44,072,132 | | | | 185,642 | | | | 97,522,996 | |
| DCC PLC | | | 4,784,045 | | | | 258,000 | | | | 13,003 | | | | 5,029,042 | |
| Yamato Holdings Co., Ltd.3,5 | | | 25,518,093 | | | | 178,692 | | | | 25,696,785 | | | | — | |
| Health care 2.05% | | | | | | | | | | | | | | | | |
| Daiichi Sankyo Co., Ltd. | | | 34,141,000 | | | | 5,200,000 | | | | 105,700 | | | | 39,235,300 | |
| Hikma Pharmaceuticals PLC | | | 14,615,045 | | | | — | | | | 39,258 | | | | 14,575,787 | |
| Teva Pharmaceutical Industries Ltd. (ADR)1 | | | 52,991,159 | | | | 3,000,000 | | | | 150,399 | | | | 55,840,760 | |
| GW Pharmaceuticals PLC (ADR)1,5 | | | 1,816,499 | | | | — | | | | 1,295,403 | | | | 521,096 | |
| NMC Health PLC5 | | | 12,262,303 | | | | — | | | | 2,651,089 | | | | 9,611,214 | |
| Materials 1.16% | | | | | | | | | | | | | | | | |
| Asahi Kasei Corp. | | | 76,292,742 | | | | 1,032,000 | | | | 205,000 | | | | 77,119,742 | |
| Chr. Hansen Holding A/S | | | 7,314,000 | | | | — | | | | 19,646 | | | | 7,294,354 | |
| First Quantum Minerals Ltd. | | | 54,022,483 | | | | 1,128,000 | | | | 148,141 | | | | 55,002,342 | |
| Consumer staples 0.37% | | | | | | | | | | | | | | | | |
| KOSÉ Corp. | | | 1,048,500 | | | | 2,409,700 | | | | 5,900 | | | | 3,452,300 | |
| 10 | EuroPacific Growth Fund |
| | | Beginning
shares | | | Additions | | | Reductions | | | Ending
shares | |
| Energy 0.93% | | | | | | | | | | | | | | | | |
| Cenovus Energy Inc. (CAD denominated) | | | 69,818,000 | | | | 17,134,000 | | | | 233,564 | | | | 86,718,436 | |
| Oil Search Ltd. | | | 94,187,800 | | | | 4,920,000 | | | | 266,216 | | | | 98,841,584 | |
| Tourmaline Oil Corp. | | | 16,547,000 | | | | — | | | | 44,447 | | | | 16,502,553 | |
| Communication services 2.69% | | | | | | | | | | | | | | | | |
| Nintendo Co., Ltd. | | | 9,070,426 | | | | 1,289,200 | | | | 27,800 | | | | 10,331,826 | |
| Altice Europe NV, Class A1 | | | 62,627,628 | | | | 6,186,569 | | | | 184,844 | | | | 68,629,353 | |
| Altice Europe NV, Class B1 | | | 14,777,869 | | | | — | | | | 39,695 | | | | 14,738,174 | |
| Utilities 0.88% | | | | | | | | | | | | | | | | |
| ENN Energy Holdings Ltd. | | | 77,627,000 | | | | — | | | | 4,686,000 | | | | 72,941,000 | |
| China Resources Gas Group Ltd. | | | 76,616,000 | | | | 53,834,000 | | | | 328,000 | | | | 130,122,000 | |
| Short-term securities 8.12% | | | | | | | | | | | | | | | | |
| Money market investments 8.12% | | | | | | | | | | | | | | | | |
| Capital Group Central Cash Fund 2.07%4 | | | 93,044,336 | | | | 85,437,938 | | | | 49,822,284 | | | | 128,659,990 | |
| | | | | | | | | | | | | | | | | |
| | | Net
realized
gain (loss)
(000) | | | Net
unrealized
appreciation
(depreciation)
(000) | | | Dividend
income
(000) | | | Value of
affiliates at
9/30/2019
(000) | |
| Common stocks 13.67% | | | | | | | | | | | | | | | | |
| Consumer discretionary 2.34% | | | | | | | | | | | | | | | | |
| MercadoLibre, Inc.1 | | $ | 3,795 | | | $ | 133,444 | | | $ | — | | | $ | 1,968,057 | |
| Melco Resorts & Entertainment Ltd. (ADR) | | | 904 | | | | (105,216 | ) | | | 10,423 | | | | 636,334 | |
| Just Eat PLC1 | | | (25,667 | ) | | | (63,043 | ) | | | — | | | | 380,233 | |
| Ryohin Keikaku Co., Ltd. | | | (41,416 | ) | | | (99,787 | ) | | | 3,233 | | | | 339,696 | |
| Takeaway.com NV1 | | | 150 | | | | (3,714 | ) | | | — | | | | 252,752 | |
| ASOS PLC1 | | | (24,225 | ) | | | (12,400 | ) | | | — | | | | 136,917 | |
| Galaxy Entertainment Group Ltd.5 | | | (25,514 | ) | | | (98,095 | ) | | | 12,475 | | | | — | |
| GVC Holdings PLC5 | | | (36,374 | ) | | | 86,212 | | | | 5,338 | | | | — | |
| | | | | | | | | | | | | | | | 3,713,989 | |
| Information technology 1.14% | | | | | | | | | | | | | | | | |
| PagSeguro Digital Ltd., Class A1 | | | 1,719 | | | | 422,688 | | | | — | | | | 1,211,475 | |
| Halma PLC | | | 1,040 | | | | 56,879 | | | | 2,962 | | | | 598,032 | |
| | | | | | | | | | | | | | | | 1,809,507 | |
| Industrials 2.11% | | | | | | | | | | | | | | | | |
| Melrose Industries PLC | | | 275 | | | | 22,848 | | | | 17,734 | | | | 841,099 | |
| MTU Aero Engines AG | | | 15,917 | | | | 108,260 | | | | 10,089 | | | | 757,573 | |
| International Consolidated Airlines Group, SA (CDI) | | | 1,013 | | | | (107,985 | ) | | | 75,030 | | | | 751,999 | |
| Rentokil Initial PLC | | | 156 | | | | 79,934 | | | | 3,689 | | | | 560,936 | |
| DCC PLC | | | 129 | | | | 3,321 | | | | 5,655 | | | | 438,778 | |
| Yamato Holdings Co., Ltd.3,5 | | | (247,256 | ) | | | (473 | ) | | | — | | | | — | |
| | | | | | | | | | | | | | | | 3,350,385 | |
| Health care 2.05% | | | | | | | | | | | | | | | | |
| Daiichi Sankyo Co., Ltd. | | | 3,636 | | | | 486,818 | | | | 12,729 | | | | 2,468,966 | |
| Hikma Pharmaceuticals PLC | | | 388 | | | | 53,755 | | | | 5,841 | | | | 394,276 | |
| Teva Pharmaceutical Industries Ltd. (ADR)1 | | | (979 | ) | | | (489,891 | ) | | | — | | | | 384,184 | |
| GW Pharmaceuticals PLC (ADR)1,5 | | | 8,884 | | | | (74,231 | ) | | | — | | | | — | |
| NMC Health PLC5 | | | (37,264 | ) | | | 78,302 | | | | 2,213 | | | | — | |
| | | | | | | | | | | | | | | | 3,247,426 | |
| EuroPacific Growth Fund | 11 |
Investments in affiliates (continued)
| | | Net
realized
gain (loss)
(000) | | | Net
unrealized
appreciation
(depreciation)
(000) | | | Dividend
income
(000) | | | Value of
affiliates at
9/30/2019
(000) | |
| Materials 1.16% | | | | | | | | | | | | | | | | |
| Asahi Kasei Corp. | | $ | 834 | | | $ | (36,255 | ) | | $ | 12,867 | | | $ | 758,894 | |
| Chr. Hansen Holding A/S | | | 1,360 | | | | (121,829 | ) | | | 6,901 | | | | 619,119 | |
| First Quantum Minerals Ltd. | | | 1,057 | | | | (162,514 | ) | | | 409 | | | | 462,072 | |
| | | | | | | | | | | | | | | | 1,840,085 | |
| Consumer staples 0.37% | | | | | | | | | | | | | | | | |
| KOSÉ Corp. | | | 339 | | | | (749 | ) | | | 3,135 | | | | 582,700 | |
| Energy 0.93% | | | | | | | | | | | | | | | | |
| Cenovus Energy Inc. (CAD denominated) | | | 426 | | | | 37,936 | | | | 6,545 | | | | 813,609 | |
| Oil Search Ltd. | | | 66 | | | | (59,539 | ) | | | 4,942 | | | | 488,340 | |
| Tourmaline Oil Corp. | | | (312 | ) | | | (91,354 | ) | | | 2,987 | | | | 163,300 | |
| | | | | | | | | | | | | | | | 1,465,249 | |
| Communication services 2.69% | | | | | | | | | | | | | | | | |
| Nintendo Co., Ltd. | | | 8,030 | | | | 797,623 | | | | 32,855 | | | | 3,824,089 | |
| Altice Europe NV, Class A1 | | | 223 | | | | 178,005 | | | | — | | | | 359,052 | |
| Altice Europe NV, Class B1 | | | (244 | ) | | | 38,960 | | | | — | | | | 77,107 | |
| | | | | | | | | | | | | | | | 4,260,248 | |
| Utilities 0.88% | | | | | | | | | | | | | | | | |
| ENN Energy Holdings Ltd. | | | (4,374 | ) | | | 54,117 | | | | 11,106 | | | | 754,751 | |
| China Resources Gas Group Ltd. | | | 855 | | | | 28,594 | | | | 11,588 | | | | 643,330 | |
| | | | | | | | | | | | | | | | 1,398,081 | |
| Total common stocks | | | | | | | | | | | | | | | 21,667,670 | |
| Short-term securities 8.12% | | | | | | | | | | | | | | | | |
| Money market investments 8.12% | | | | | | | | | | | | | | | | |
| Capital Group Central Cash Fund 2.07%4 | | | (31 | ) | | | 816 | | | | 115,463 | | | | 12,864,712 | |
| Total 21.79% | | $ | (392,460 | ) | | $ | 1,141,437 | | | $ | 376,209 | | | $ | 34,532,382 | |
| 1 | Security did not produce income during the last 12 months. |
| 2 | Represents an affiliated company as defined under the Investment Company Act of 1940. |
| 3 | Valued under fair value procedures adopted by authority of the board of trustees. The total value of all such securities, including those in “Other securities,” was $2,455,582,000, which represented 1.55% of the net assets of the fund. This amount includes $36,239,000 related to certain securities trading outside the U.S. whose values were adjusted as a result of significant market movements following the close of local trading. |
| 4 | Rate represents the seven-day yield at 9/30/2019. |
| 5 | Unaffiliated issuer at 9/30/2019. |
Key to abbreviations and symbol
ADR = American Depositary Receipts
CAD = Canadian dollars
CDI = CREST Depository Interest
GBP = British pounds
INR = Indian rupees
USD/$ = U.S. dollars
See notes to financial statements.
| 12 | EuroPacific Growth Fund |
| Financial statements | |
| | |
Statement of assets and liabilities
at September 30, 2019 | unaudited
(dollars in thousands) |
| | |
| Assets: | | | | | | | | |
| Investment securities, at value: | | | | | | | | |
| Unaffiliated issuers (cost: $86,650,997) | | $ | 123,397,899 | | | | | |
| Affiliated issuers (cost: $31,096,756) | | | 34,532,382 | | | $ | 157,930,281 | |
| Cash | | | | | | | 22,136 | |
| Cash denominated in currencies other than U.S. dollars (cost: $112,551) | | | | | | | 112,555 | |
| Unrealized appreciation on open forward currency contracts | | | | | | | 2,860 | |
| Receivables for: | | | | | | | | |
| Sales of investments | | | 712,869 | | | | | |
| Sales of fund’s shares | | | 431,537 | | | | | |
| Dividends and interest | | | 351,056 | | | | | |
| Other | | | 31,401 | | | | 1,526,863 | |
| | | | | | | | 159,594,695 | |
| Liabilities: | | | | | | | | |
| Unrealized depreciation on open forward currency contracts | | | | | | | 1,504 | |
| Payables for: | | | | | | | | |
| Purchases of investments | | | 458,180 | | | | | |
| Repurchases of fund’s shares | | | 311,457 | | | | | |
| Investment advisory services | | | 53,850 | | | | | |
| Services provided by related parties | | | 17,620 | | | | | |
| Trustees’ deferred compensation | | | 4,091 | | | | | |
| Non-U.S. taxes | | | 256,748 | | | | | |
| Other | | | 3,550 | | | | 1,105,496 | |
| Net assets at September 30, 2019 | | | | | | $ | 158,487,695 | |
| | | | | | | | | |
| Net assets consist of: | | | | | | | | |
| Capital paid in on shares of beneficial interest | | | | | | $ | 118,609,916 | |
| Total distributable earnings | | | | | | | 39,877,779 | |
| Net assets at September 30, 2019 | | | | | | $ | 158,487,695 | |
See notes to financial statements.
| EuroPacific Growth Fund | 13 |
(dollars and shares in thousands, except per-share amounts)
Shares of beneficial interest issued and outstanding (no stated par value) —
unlimited shares authorized (3,056,469 total shares outstanding)
| | | | | | Shares | | | Net asset value | |
| | | Net assets | | | outstanding | | | per share | |
| Class A | | $ | 23,864,308 | | | | 458,980 | | | $ | 51.99 | |
| Class C | | | 923,033 | | | | 18,270 | | | | 50.52 | |
| Class T | | | 10 | | | | — | * | | | 52.03 | |
| Class F-1 | | | 2,930,148 | | | | 56,620 | | | | 51.75 | |
| Class F-2 | | | 24,605,332 | | | | 474,431 | | | | 51.86 | |
| Class F-3 | | | 13,482,616 | | | | 259,139 | | | | 52.03 | |
| Class 529-A | | | 1,333,910 | | | | 25,982 | | | | 51.34 | |
| Class 529-C | | | 197,160 | | | | 3,945 | | | | 49.98 | |
| Class 529-E | | | 57,205 | | | | 1,126 | | | | 50.82 | |
| Class 529-T | | | 12 | | | | — | * | | | 52.01 | |
| Class 529-F-1 | | | 146,411 | | | | 2,852 | | | | 51.33 | |
| Class R-1 | | | 196,567 | | | | 3,957 | | | | 49.67 | |
| Class R-2 | | | 676,049 | | | | 13,487 | | | | 50.12 | |
| Class R-2E | | | 94,821 | | | | 1,847 | | | | 51.34 | |
| Class R-3 | | | 3,202,953 | | | | 63,048 | | | | 50.80 | |
| Class R-4 | | | 7,292,571 | | | | 143,299 | | | | 50.89 | |
| Class R-5E | | | 1,556,993 | | | | 30,171 | | | | 51.61 | |
| Class R-5 | | | 7,611,865 | | | | 146,592 | | | | 51.93 | |
| Class R-6 | | | 70,315,731 | | | | 1,352,723 | | | | 51.98 | |
| * | Amount less than one thousand. |
See notes to financial statements.
| 14 | EuroPacific Growth Fund |
Statement of operations
for the six months ended September 30, 2019 | unaudited
(dollars in thousands) |
| Investment income: | | | | | | | | |
| Income: | | | | | | | | |
| Dividends (net of non-U.S. taxes of $169,673; also includes $376,209 from affiliates) | | $ | 1,866,935 | | | | | |
| Interest | | | 92,565 | | | $ | 1,959,500 | |
| Fees and expenses*: | | | | | | | | |
| Investment advisory services | | | 327,649 | | | | | |
| Distribution services | | | 62,553 | | | | | |
| Transfer agent services | | | 45,912 | | | | | |
| Administrative services | | | 29,132 | | | | | |
| Reports to shareholders | | | 2,124 | | | | | |
| Registration statement and prospectus | | | 1,975 | | | | | |
| Trustees’ compensation | | | 399 | | | | | |
| Auditing and legal | | | 204 | | | | | |
| Custodian | | | 15,659 | | | | | |
| Other | | | 657 | | | | | |
| Total fees and expenses before reimbursements | | | 486,264 | | | | | |
| Less transfer agent services reimbursements | | | 28 | | | | | |
| Total fees and expenses after reimbursements | | | | | | | 486,236 | |
| Net investment income | | | | | | | 1,473,264 | |
| | | | | | | | | |
| Net realized gain and unrealized appreciation: | | | | | | | | |
| Net realized gain (loss) on: | | | | | | | | |
| Investments: | | | | | | | | |
| Unaffiliated issuers | | | 1,256,686 | | | | | |
| Affiliated issuers | | | (392,460 | ) | | | | |
| Forward currency contracts | | | 16,222 | | | | | |
| Currency transactions | | | (286 | ) | | | 880,162 | |
| Net unrealized (depreciation) appreciation on: | | | | | | | | |
| Investments (net of non-U.S. taxes of $231,380): | | | | | | | | |
| Unaffiliated issuers | | | (105,903 | ) | | | | |
| Affiliated issuers | | | 1,141,437 | | | | | |
| Forward currency contracts | | | (117 | ) | | | | |
| Currency translations | | | 1,379 | | | | 1,036,796 | |
| Net realized gain and unrealized appreciation | | | | | | | 1,916,958 | |
| | | | | | | | | |
| Net increase in net assets resulting from operations | | | | | | $ | 3,390,222 | |
| * | Additional information related to class-specific fees and expenses is included in the notes to financial statements. |
See notes to financial statements.
| EuroPacific Growth Fund | 15 |
Statements of changes in net assets
(dollars in thousands)
| | | Six months ended | | | Year ended | |
| | | September 30, 2019* | | | March 31, 2019 | |
| Operations: | | | | | | | | |
| Net investment income | | $ | 1,473,264 | | | $ | 2,434,145 | |
| Net realized gain | | | 880,162 | | | | 353,327 | |
| Net unrealized appreciation (depreciation) | | | 1,036,796 | | | | (10,967,830 | ) |
| Net increase (decrease) in net assets resulting from operations | | | 3,390,222 | | | | (8,180,358 | ) |
| | | | | | | | | |
| Distributions paid to shareholders | | | (197,437 | ) | | | (8,900,930 | ) |
| | | | | | | | | |
| Net capital share transactions | | | (1,210,691 | ) | | | 6,917,067 | |
| | | | | | | | | |
| Total increase (decrease) in net assets | | | 1,982,094 | | | | (10,164,221 | ) |
| | | | | | | | | |
| Net assets: | | | | | | | | |
| Beginning of period | | | 156,505,601 | | | | 166,669,822 | |
| End of period | | $ | 158,487,695 | | | $ | 156,505,601 | |
See notes to financial statements.
| 16 | EuroPacific Growth Fund |
| Notes to financial statements | unaudited |
1. Organization
EuroPacific Growth Fund (the “fund”) is registered under the Investment Company Act of 1940 as an open-end, diversified management investment company. The fund seeks to provide long-term growth of capital. Shareholders approved a proposal to reorganize the fund from a Massachusetts business trust to a Delaware statutory trust. The reorganization may be completed in the next 12 months; however, the fund reserves the right to delay the implementation.
The fund has 19 share classes consisting of six retail share classes (Classes A, C, T, F-1, F-2 and F-3), five 529 college savings plan share classes (Classes 529-A, 529-C, 529-E, 529-T and 529-F-1) and eight retirement plan share classes (Classes R-1, R-2, R-2E, R-3, R-4, R-5E, R-5 and R-6). The 529 college savings plan share classes can be used to save for college education. The retirement plan share classes are generally offered only through eligible employer-sponsored retirement plans. The fund’s share classes are described further in the following table:
| Share class | | Initial sales
charge | | Contingent deferred sales
charge upon redemption | | Conversion feature |
| Classes A and 529-A | | Up to 5.75% | | None (except 1% for certain redemptions within 18 months of purchase without an initial sales charge) | | None |
| Class C | | None | | 1% for redemptions within one year of purchase | | Class C converts to Class F-1 after 10 years |
| Class 529-C | | None | | 1% for redemptions within one year of purchase | | Class 529-C converts to Class 529-A after 10 years |
| Class 529-E | | None | | None | | None |
| Classes T and 529-T* | | Up to 2.50% | | None | | None |
| Classes F-1, F-2, F-3 and 529-F-1 | | None | | None | | None |
| Classes R-1, R-2, R-2E, R-3, R-4, R-5E, R-5 and R-6 | | None | | None | | None |
| * | Class T and 529-T shares are not available for purchase. |
Holders of all share classes have equal pro rata rights to the assets, dividends and liquidation proceeds of the fund. Each share class has identical voting rights, except for the exclusive right to vote on matters affecting only its class. Share classes have different fees and expenses (“class-specific fees and expenses”), primarily due to different arrangements for distribution, transfer agent and administrative services. Differences in class-specific fees and expenses will result in differences in net investment income and, therefore, the payment of different per-share dividends by each share class.
| EuroPacific Growth Fund | 17 |
2. Significant accounting policies
The fund is an investment company that applies the accounting and reporting guidance issued in Topic 946 by the U.S. Financial Accounting Standards Board. The fund’s financial statements have been prepared to comply with U.S. generally accepted accounting principles (“U.S. GAAP”). These principles require the fund’s investment adviser to make estimates and assumptions that affect reported amounts and disclosures. Actual results could differ from those estimates. Subsequent events, if any, have been evaluated through the date of issuance in the preparation of the financial statements. The fund follows the significant accounting policies described in this section, as well as the valuation policies described in the next section on valuation.
Security transactions and related investment income — Security transactions are recorded by the fund as of the date the trades are executed with brokers. Realized gains and losses from security transactions are determined based on the specific identified cost of the securities. In the event a security is purchased with a delayed payment date, the fund will segregate liquid assets sufficient to meet its payment obligations. Dividend income is recognized on the ex-dividend date and interest income is recognized on an accrual basis. Market discounts, premiums and original issue discounts on fixed-income securities are amortized daily over the expected life of the security.
Class allocations — Income, fees and expenses (other than class-specific fees and expenses) and realized and unrealized gains and losses are allocated daily among the various share classes based on their relative net assets. Class-specific fees and expenses, such as distribution, transfer agent and administrative services, are charged directly to the respective share class.
Distributions paid to shareholders — Income dividends and capital gain distributions are recorded on the ex-dividend date.
Currency translation — Assets and liabilities, including investment securities, denominated in currencies other than U.S. dollars are translated into U.S. dollars at the exchange rates supplied by one or more pricing vendors on the valuation date. Purchases and sales of investment securities and income and expenses are translated into U.S. dollars at the exchange rates on the dates of such transactions. The effects of changes in exchange rates on investment securities are included with the net realized gain or loss and net unrealized appreciation or depreciation on investments in the fund’s statement of operations. The realized gain or loss and unrealized appreciation or depreciation resulting from all other transactions denominated in currencies other than U.S. dollars are disclosed separately.
| 18 | EuroPacific Growth Fund |
3. Valuation
Capital Research and Management Company (“CRMC”), the fund’s investment adviser, values the fund’s investments at fair value as defined by U.S. GAAP. The net asset value of each share class of the fund is generally determined as of approximately 4:00 p.m. New York time each day the New York Stock Exchange is open.
Methods and inputs — The fund’s investment adviser uses the following methods and inputs to establish the fair value of the fund’s assets and liabilities. Use of particular methods and inputs may vary over time based on availability and relevance as market and economic conditions evolve.
Equity securities are generally valued at the official closing price of, or the last reported sale price on, the exchange or market on which such securities are traded, as of the close of business on the day the securities are being valued or, lacking any sales, at the last available bid price. Prices for each security are taken from the principal exchange or market on which the security trades.
Fixed-income securities, including short-term securities, are generally valued at prices obtained from one or more pricing vendors. Vendors value such securities based on one or more of the inputs described in the following table. The table provides examples of inputs that are commonly relevant for valuing particular classes of fixed-income securities in which the fund is authorized to invest. However, these classifications are not exclusive, and any of the inputs may be used to value any other class of fixed-income security.
| Fixed-income class | | Examples of standard inputs |
| All | | Benchmark yields, transactions, bids, offers, quotations from dealers and trading systems, new issues, spreads and other relationships observed in the markets among comparable securities; and proprietary pricing models such as yield measures calculated using factors such as cash flows, financial or collateral performance and other reference data (collectively referred to as “standard inputs”) |
| Corporate bonds & notes; convertible securities | | Standard inputs and underlying equity of the issuer |
| Bonds & notes of governments & government agencies | | Standard inputs and interest rate volatilities |
When the fund’s investment adviser deems it appropriate to do so (such as when vendor prices are unavailable or deemed to be not representative), fixed-income securities will be valued in good faith at the mean quoted bid and ask prices that are reasonably and timely available (or bid prices, if ask prices are not available) or at prices for securities of comparable maturity, quality and type.
| EuroPacific Growth Fund | 19 |
Securities with both fixed-income and equity characteristics, or equity securities traded principally among fixed-income dealers, are generally valued in the manner described for either equity or fixed-income securities, depending on which method is deemed most appropriate by the fund’s investment adviser. The Capital Group Central Cash Fund (“CCF”), a fund within the Capital Group Central Fund Series (“Central Funds”), is valued based upon a floating net asset value, which fluctuates with changes in the value of CCF’s portfolio securities. The underlying securities are valued based on the policies and procedures in CCF’s statement of additional information. Forward currency contracts are valued at the mean of representative quoted bid and ask prices, generally based on prices supplied by one or more pricing vendors.
Securities and other assets for which representative market quotations are not readily available or are considered unreliable by the fund’s investment adviser are fair valued as determined in good faith under fair valuation guidelines adopted by authority of the fund’s board of trustees as further described. The investment adviser follows fair valuation guidelines, consistent with U.S. Securities and Exchange Commission rules and guidance, to consider relevant principles and factors when making fair value determinations. The investment adviser considers relevant indications of value that are reasonably and timely available to it in determining the fair value to be assigned to a particular security, such as the type and cost of the security; contractual or legal restrictions on resale of the security; relevant financial or business developments of the issuer; actively traded similar or related securities; conversion or exchange rights on the security; related corporate actions; significant events occurring after the close of trading in the security; and changes in overall market conditions. In addition, the closing prices of equity securities that trade in markets outside U.S. time zones may be adjusted to reflect significant events that occur after the close of local trading but before the net asset value of each share class of the fund is determined. Fair valuations and valuations of investments that are not actively trading involve judgment and may differ materially from valuations that would have been used had greater market activity occurred.
Processes and structure — The fund’s board of trustees has delegated authority to the fund’s investment adviser to make fair value determinations, subject to board oversight. The investment adviser has established a Joint Fair Valuation Committee (the “Fair Valuation Committee”) to administer, implement and oversee the fair valuation process, and to make fair value decisions. The Fair Valuation Committee regularly reviews its own fair value decisions, as well as decisions made under its standing instructions to the investment adviser’s valuation teams. The Fair Valuation Committee reviews changes in fair value measurements from period to period and may, as deemed appropriate, update the fair valuation guidelines to better reflect the results of back testing and address new or evolving issues. The Fair Valuation Committee reports any changes to the fair valuation guidelines to the board of trustees. The fund’s board and audit committee also regularly review reports that describe fair value determinations and methods.
| 20 | EuroPacific Growth Fund |
The fund’s investment adviser has also established a Fixed-Income Pricing Review Group to administer and oversee the fixed-income valuation process, including the use of fixed-income pricing vendors. This group regularly reviews pricing vendor information and market data. Pricing decisions, processes and controls over security valuation are also subject to additional internal reviews, including an annual control self-evaluation program facilitated by the investment adviser’s compliance group.
Classifications — The fund’s investment adviser classifies the fund’s assets and liabilities into three levels based on the inputs used to value the assets or liabilities. Level 1 values are based on quoted prices in active markets for identical securities. Level 2 values are based on significant observable market inputs, such as quoted prices for similar securities and quoted prices in inactive markets. Certain securities trading outside the U.S. may transfer between Level 1 and Level 2 due to valuation adjustments resulting from significant market movements following the close of local trading. Level 3 values are based on significant unobservable inputs that reflect the investment adviser’s determination of assumptions that market participants might reasonably use in valuing the securities. The valuation levels are not necessarily an indication of the risk or liquidity associated with the underlying investment. For example, U.S. government securities are reflected as Level 2 because the inputs used to determine fair value may not always be quoted prices in an active market. The following tables present the fund’s valuation levels as of September 30, 2019 (dollars in thousands):
| | | Investment securities | |
| | | Level 1 | | | Level 2 | | | Level 3 | | | Total | |
| Assets: | | | | | | | | | | | | | | | | |
| Common stocks: | | | | | | | | | | | | | | | | |
| Financials | | $ | 24,676,989 | | | $ | — | | | $ | — | | | $ | 24,676,989 | |
| Consumer discretionary | | | 21,451,662 | | | | — | | | | — | | | | 21,451,662 | |
| Information technology | | | 18,350,997 | | | | 2,333,833 | | | | — | | | | 20,684,830 | |
| Industrials | | | 17,834,036 | | | | — | | | | — | | | | 17,834,036 | |
| Health care | | | 14,173,283 | | | | — | | | | — | | | | 14,173,283 | |
| Materials | | | 11,836,510 | | | | — | | | | — | | | | 11,836,510 | |
| Consumer staples | | | 8,691,842 | | | | — | | | | — | | | | 8,691,842 | |
| Energy | | | 8,414,011 | | | | — | | | | — | | | | 8,414,011 | |
| Communication services | | | 8,101,509 | | | | — | | | | — | | | | 8,101,509 | |
| Utilities | | | 4,723,527 | | | | — | | | | — | | | | 4,723,527 | |
| Real estate | | | 1,912,834 | | | | — | | | | — | | | | 1,912,834 | |
| Preferred securities | | | 2,169,247 | | | | — | | | | 836 | | | | 2,170,083 | |
| Rights & warrants | | | — | | | | 120,913 | | | | — | | | | 120,913 | |
| Bonds, notes & other debt instruments | | | — | | | | 109,276 | | | | — | | | | 109,276 | |
| Short-term securities | | | 12,864,712 | | | | 164,264 | | | | — | | | | 13,028,976 | |
| Total | | $ | 155,201,159 | | | $ | 2,728,286 | | | $ | 836 | | | $ | 157,930,281 | |
| EuroPacific Growth Fund | 21 |
| | | Other investments* | |
| | | Level 1 | | | Level 2 | | | Level 3 | | | Total | |
| Assets: | | | | | | | | | | | | | | | | |
| Unrealized appreciation on open forward currency contracts | | $ | — | | | $ | 2,860 | | | $ | — | | | $ | 2,860 | |
| Liabilities: | | | | | | | | | | | | | | | | |
| Unrealized depreciation on open forward currency contracts | | | — | | | | (1,504 | ) | | | — | | | | (1,504 | ) |
| Total | | $ | — | | | $ | 1,356 | | | $ | — | | | $ | 1,356 | |
| * | Forward currency contracts are not included in the investment portfolio. |
4. Risk factors
Investing in the fund may involve certain risks including, but not limited to, those described below.
Market conditions— The prices of, and the income generated by, the common stocks and other securities held by the fund may decline — sometimes rapidly or unpredictably — due to various factors, including events or conditions affecting the general economy or particular industries; overall market changes; local, regional or global political, social or economic instability; governmental, governmental agency or central bank responses to economic conditions; and currency exchange rate, interest rate and commodity price fluctuations.
Issuer risks — The prices of, and the income generated by, securities held by the fund may decline in response to various factors directly related to the issuers of such securities, including reduced demand for an issuer’s goods or services, poor management performance, major litigation related to the issuer, changes in government regulations affecting the issuer or its competitive environment and strategic initiatives such as mergers, acquisitions or dispositions and the market response to any such initiatives.
Investing in growth-oriented stocks — Growth-oriented common stocks and other equity-type securities (such as preferred stocks, convertible preferred stocks and convertible bonds) may involve larger price swings and greater potential for loss than other types of investments. These risks may be even greater in the case of smaller capitalization stocks.
Investing outside the U.S. — Securities of issuers domiciled outside the U.S., or with significant operations or revenues outside the U.S., may lose value because of adverse political, social, economic or market developments (including social instability, regional conflicts, terrorism and war) in the countries or regions in which the issuers operate or generate revenue. These securities may also lose value due to changes in foreign currency exchange rates against the U.S. dollar and/or currencies of other countries. Issuers of these securities may be more susceptible to actions of foreign governments, such as nationalization, currency blockage or the imposition of price controls or punitive
| 22 | EuroPacific Growth Fund |
taxes, each of which could adversely impact the value of these securities. Securities markets in certain countries may be more volatile and/or less liquid than those in the U.S. Investments outside the U.S. may also be subject to different accounting practices and different regulatory, legal and reporting standards and practices, and may be more difficult to value, than those in the U.S. In addition, the value of investments outside the U.S. may be reduced by foreign taxes, including foreign withholding taxes on interest and dividends. Further, there may be increased risks of delayed settlement of securities purchased or sold by the fund. The risks of investing outside the U.S. may be heightened in connection with investments in emerging markets.
Investing in emerging markets — Investing in emerging markets may involve risks in addition to and greater than those generally associated with investing in the securities markets of developed countries. For instance, emerging market countries may have less developed legal and accounting systems than those in developed countries. The governments of these countries may be less stable and more likely to impose capital controls, nationalize a company or industry, place restrictions on foreign ownership and on withdrawing sale proceeds of securities from the country, and/or impose punitive taxes that could adversely affect the prices of securities. In addition, the economies of these countries may be dependent on relatively few industries that are more susceptible to local and global changes. Securities markets in these countries can also be relatively small and have substantially lower trading volumes. As a result, securities issued in these countries may be more volatile and less liquid, and may be more difficult to value, than securities issued in countries with more developed economies and/or markets. Less certainty with respect to security valuations may lead to additional challenges and risks in calculating the fund’s net asset value. Additionally, emerging markets are more likely to experience problems with the clearing and settling of trades and the holding of securities by banks, agents and depositories that are less established than those in developed countries.
Management — The investment adviser to the fund actively manages the fund’s investments. Consequently, the fund is subject to the risk that the methods and analyses, including models, tools and data, employed by the investment adviser in this process may be flawed or incorrect and may not produce the desired results. This could cause the fund to lose value or its investment results to lag relevant benchmarks or other funds with similar objectives.
5. Certain investment techniques
Forward currency contracts — The fund has entered into forward currency contracts, which represent agreements to exchange currencies on specific future dates at predetermined rates. The fund’s investment adviser uses forward currency contracts to manage the fund’s exposure to changes in exchange rates. Upon entering into these contracts, risks may arise from the potential inability of counterparties to meet the terms of their contracts and from possible movements in exchange rates.
| EuroPacific Growth Fund | 23 |
On a daily basis, the fund’s investment adviser values forward currency contracts and records unrealized appreciation or depreciation for open forward currency contracts in the fund’s statement of assets and liabilities. Realized gains or losses are recorded at the time the forward currency contract is closed or offset by another contract with the same broker for the same settlement date and currency.
Closed forward currency contracts that have not reached their settlement date are included in the respective receivables or payables for closed forward currency contracts in the fund’s statement of assets and liabilities. Net realized gains or losses from closed forward currency contracts and net unrealized appreciation or depreciation from open forward currency contracts are recorded in the fund’s statement of operations. The average month-end notional amount of open forward currency contracts while held was $561,071,000.
The following tables identify the location and fair value amounts on the fund’s statement of assets and liabilities and the effect on the fund’s statement of operations resulting from the fund’s use of forward currency contracts as of, or for the six months ended, September 30, 2019 (dollars in thousands):
| | | | | Assets | | | Liabilities | |
| Contracts | | Risk type | | Location on statement of assets and liabilities | | Value | | | Location on statement of assets and liabilities | | Value | |
| Forward currency | | Currency | | Unrealized appreciation on open forward currency contracts | | $ | 2,860 | | | Unrealized depreciation on open forward currency contracts | | $ | 1,504 | |
| | | | | Net realized gain | | | Net unrealized depreciation | |
| Contracts | | Risk type | | Location on statement of operations | | Value | | | Location on statement of operations | | Value | |
| Forward currency | | Currency | | Net realized gain on forward currency contracts | | $ | 16,222 | | | Net unrealized depreciation on forward currency contracts | | $ | (117 | ) |
Collateral — The fund participates in a collateral program due to its use of forward currency contracts that calls for the fund to either receive or pledge highly liquid assets, such as cash or U.S. government securities, as collateral based on the net gain or loss on unsettled forward currency contracts by counterparty. The purpose of the collateral is to cover potential losses that could occur in the event that either party cannot meet its contractual obligation. Non-cash collateral pledged by the fund, if any, is disclosed in the fund’s investment portfolio, and cash collateral pledged by the fund, if any, is held in a segregated account with the fund’s custodian, which is reflected as pledged cash in the fund’s statement of assets and liabilities.
| 24 | EuroPacific Growth Fund |
Rights of offset — The fund has entered into enforceable master netting agreements with certain counterparties for forward currency contracts, where on any date amounts payable by each party to the other (in the same currency with respect to the same transaction) may be closed or offset by each party’s payment obligation. If an early termination date occurs under these agreements following an event of default or termination event, all obligations of each party to its counterparty are settled net through a single payment in a single currency (“close-out netting”). For financial reporting purposes, the fund does not offset financial assets and financial liabilities that are subject to these master netting arrangements in the statement of assets and liabilities.
The following table presents the fund’s forward currency contracts by counterparty that are subject to master netting agreements but that are not offset in the fund’s statement of assets and liabilities. The net amount column shows the impact of offsetting on the fund’s statement of assets and liabilities as of September 30, 2019, if close-out netting was exercised (dollars in thousands):
| | | Gross amounts
recognized in the | | | Gross amounts not offset in the
statement of assets and liabilities and
subject to a master netting agreement | | | | |
| Counterparty | | statement of assets
and liabilities | | | Available
to offset | | | Non-cash
collateral* | | | Cash
collateral* | | | Net
amount | |
| Assets: | | | | | | | | | | | | | | | |
| Citibank | | $ | 2,860 | | | $ | (13 | ) | | $ | — | | | $ | (2,262 | ) | | $ | 585 | |
| Total | | $ | 2,860 | | | $ | (13 | ) | | $ | — | | | $ | (2,262 | ) | | $ | 585 | |
| Liabilities: | | | | | | | | | | | | | | | | | | | | |
| Citibank | | $ | 13 | | | $ | (13 | ) | | $ | — | | | $ | — | | | $ | — | |
| HSBC Bank | | | 929 | | | | — | | | | (929 | ) | | | — | | | | — | |
| JPMorgan Chase | | | 562 | | | | — | | | | (562 | ) | | | — | | | | — | |
| Total | | $ | 1,504 | | | $ | (13 | ) | | $ | (1,491 | ) | | $ | — | | | $ | — | |
| * | Collateral is shown on a settlement basis. |
6. Taxation and distributions
Federal income taxation — The fund complies with the requirements under Subchapter M of the Internal Revenue Code applicable to mutual funds and intends to distribute substantially all of its net taxable income and net capital gains each year. The fund is not subject to income taxes to the extent such distributions are made. Therefore, no federal income tax provision is required.
As of and during the period ended September 30, 2019, the fund did not have a liability for any unrecognized tax benefits. The fund recognizes interest and penalties, if any, related to unrecognized tax benefits as income tax expense in the statement of operations. During the period, the fund did not incur any significant interest or penalties.
| EuroPacific Growth Fund | 25 |
The fund’s tax returns are not subject to examination by federal, state and, if applicable, non-U.S. tax authorities after the expiration of each jurisdiction’s statute of limitations, which is generally three years after the date of filing but can be extended in certain jurisdictions.
Non-U.S. taxation — Dividend and interest income are recorded net of non-U.S. taxes paid. The fund may file withholding tax reclaims in certain jurisdictions to recover a portion of amounts previously withheld. As a result of rulings from European courts, the fund filed for additional reclaims related to prior years. These reclaims are recorded when the amount is known and there are no significant uncertainties on collectability. Gains realized by the fund on the sale of securities in certain countries, if any, may be subject to non-U.S. taxes. If applicable, the fund records an estimated deferred tax liability based on unrealized gains to provide for potential non-U.S. taxes payable upon the sale of these securities.
Distributions — Distributions paid to shareholders are based on net investment income and net realized gains determined on a tax basis, which may differ from net investment income and net realized gains for financial reporting purposes. These differences are due primarily to different treatment for items such as currency gains and losses; short-term capital gains and losses; capital losses related to sales of certain securities within 30 days of purchase; unrealized appreciation of certain investments in securities outside the U.S.; cost of investments sold and income on certain investments. The fiscal year in which amounts are distributed may differ from the year in which the net investment income and net realized gains are recorded by the fund for financial reporting purposes.
The components of distributable earnings on a tax basis are reported as of the fund’s most recent year-end. As of March 31, 2019, the components of distributable earnings on a tax basis were as follows (dollars in thousands):
| Undistributed ordinary income | | $ | 197,377 | |
| Post-October capital loss deferral* | | | (1,321,161 | ) |
| * | This deferral is considered incurred in the subsequent year. |
As of September 30, 2019, the tax basis unrealized appreciation (depreciation) and cost of investments were as follows (dollars in thousands):
| Gross unrealized appreciation on investments | | $ | 45,706,749 | |
| Gross unrealized depreciation on investments | | | (6,807,454 | ) |
| Net unrealized appreciation on investments | | | 38,899,295 | |
| Cost of investments | | | 119,032,342 | |
| 26 | EuroPacific Growth Fund |
Distributions paid were characterized for tax purposes as follows (dollars in thousands):
| | | Six months ended September 30, 2019 | | | Year ended March 31, 2019 | |
| Share class | | Ordinary
income | | | Long-term
capital gains | | | Total
distributions
paid | | | Ordinary
income | | | Long-term
capital gains | | | Total
distributions
paid | |
| Class A | | $ | 17,036 | | | $ | — | | | $ | 17,036 | | | $ | 300,775 | | | $ | 1,127,603 | | | $ | 1,428,378 | |
| Class C | | | — | | | | — | | | | — | | | | 6,163 | | | | 51,849 | | | | 58,012 | |
| Class T | | | — | * | | | — | | | | — | * | | | — | * | | | — | * | | | — | * |
| Class F-1 | | | 2,022 | | | | — | | | | 2,022 | | | | 35,862 | | | | 161,250 | | | | 197,112 | |
| Class F-2 | | | 32,426 | | | | — | | | | 32,426 | | | | 357,839 | | | | 1,054,389 | | | | 1,412,228 | |
| Class F-3 | | | 19,447 | | | | — | | | | 19,447 | | | | 168,391 | | | | 423,728 | | | | 592,119 | |
| Class 529-A | | | 822 | | | | — | | | | 822 | | | | 15,928 | | | | 61,112 | | | | 77,040 | |
| Class 529-C | | | (1 | ) | | | — | | | | (1 | ) | | | 1,305 | | | | 10,802 | | | | 12,107 | |
| Class 529-E | | | 5 | | | | — | | | | 5 | | | | 617 | | | | 2,818 | | | | 3,435 | |
| Class 529-T | | | — | * | | | — | | | | — | * | | | — | * | | | — | * | | | — | * |
| Class 529-F-1 | | | 170 | | | | — | | | | 170 | | | | 2,015 | | | | 5,727 | | | | 7,742 | |
| Class R-1 | | | — | * | | | — | | | | — | * | | | 1,368 | | | | 10,489 | | | | 11,857 | |
| Class R-2 | | | — | * | | | — | | | | — | * | | | 4,303 | | | | 32,240 | | | | 36,543 | |
| Class R-2E | | | — | | | | — | | | | — | | | | 227 | | | | 8,663 | | | | 8,890 | |
| Class R-3 | | | — | * | | | — | | | | — | * | | | 35,061 | | | | 176,288 | | | | 211,349 | |
| Class R-4 | | | 5,279 | | | | — | | | | 5,279 | | | | 102,828 | | | | 402,073 | | | | 504,901 | |
| Class R-5E | | | 1,876 | | | | — | | | | 1,876 | | | | 20,731 | | | | 38,416 | | | | 59,147 | |
| Class R-5 | | | 11,052 | | | | — | | | | 11,052 | | | | 112,862 | | | | 359,636 | | | | 472,498 | |
| Class R-6 | | | 107,303 | | | | — | | | | 107,303 | | | | 1,027,207 | | | | 2,780,365 | | | | 3,807,572 | |
| Total | | $ | 197,437 | | | $ | — | | | $ | 197,437 | | | $ | 2,193,482 | | | $ | 6,707,448 | | | $ | 8,900,930 | |
| * | Amount less than one thousand. |
| EuroPacific Growth Fund | 27 |
7. Fees and transactions with related parties
CRMC, the fund’s investment adviser, is the parent company of American Funds Distributors,® Inc. (“AFD”), the principal underwriter of the fund’s shares, and American Funds Service Company® (“AFS”), the fund’s transfer agent. CRMC, AFD and AFS are considered related parties to the fund.
Investment advisory services — The fund has an investment advisory and service agreement with CRMC that provides for monthly fees accrued daily. These fees are based on a series of decreasing annual rates beginning with 0.690% on the first $500 million of daily net assets and decreasing to 0.392% on such assets in excess of $186 billion. For the six months ended September 30, 2019, the investment advisory services fee was $327,649,000, which was equivalent to an annualized rate of 0.413% of average daily net assets.
Class-specific fees and expenses — Expenses that are specific to individual share classes are accrued directly to the respective share class. The principal class-specific fees and expenses are further described below:
Distribution services — The fund has plans of distribution for all share classes, except Class F-2, F-3, R-5E, R-5 and R-6 shares. Under the plans, the board of trustees approves certain categories of expenses that are used to finance activities primarily intended to sell fund shares and service existing accounts. The plans provide for payments, based on an annualized percentage of average daily net assets, ranging from 0.25% to 1.00% as noted in this section. In some cases, the board of trustees has limited the amounts that may be paid to less than the maximum allowed by the plans. All share classes with a plan may use up to 0.25% of average daily net assets to pay service fees, or to compensate AFD for paying service fees, to firms that have entered into agreements with AFD to provide certain shareholder services. The remaining amounts available to be paid under each plan are paid to dealers to compensate them for their sales activities.
| | Share class | | Currently approved limits | | Plan limits |
| | Class A | | | 0.25 | % | | | 0.25 | % |
| | Class 529-A | | | 0.25 | | | | 0.50 | |
| | Classes C, 529-C and R-1 | | | 1.00 | | | | 1.00 | |
| | Class R-2 | | | 0.75 | | | | 1.00 | |
| | Class R-2E | | | 0.60 | | | | 0.85 | |
| | Classes 529-E and R-3 | | | 0.50 | | | | 0.75 | |
| | Classes T, F-1, 529-T, 529-F-1 and R-4 | | | 0.25 | | | | 0.50 | |
| 28 | EuroPacific Growth Fund |
For Class A and 529-A shares, distribution-related expenses include the reimbursement of dealer and wholesaler commissions paid by AFD for certain shares sold without a sales charge. These share classes reimburse AFD for amounts billed within the prior 15 months but only to the extent that the overall annual expense limits are not exceeded. As of September 30, 2019, there were no unreimbursed expenses subject to reimbursement for Class A or 529-A shares.
Transfer agent services — The fund has a shareholder services agreement with AFS under which the fund compensates AFS for providing transfer agent services to each of the fund’s share classes. These services include recordkeeping, shareholder communications and transaction processing. In addition, the fund reimburses AFS for amounts paid to third parties for performing transfer agent services on behalf of fund shareholders.
Administrative services — The fund has an administrative services agreement with CRMC under which the fund compensates CRMC for providing administrative services to all share classes. Administrative services are provided by CRMC and its affiliates to help assist third parties providing non-distribution services to fund shareholders. These services include providing in depth information on the fund and market developments that impact fund investments. Administrative services also include, but are not limited to, coordinating, monitoring and overseeing third parties that provide services to fund shareholders. The agreement provides the fund the ability to charge an administrative services fee at the annual rate of 0.05% of the daily net assets attributable to each share class of the fund. Prior to July 1, 2019, Class A shares paid CRMC an administrative services fee at the annual rate of 0.01% of daily net assets and all other share classes paid a fee at the annual rate of 0.05% of their respective daily net assets. The fund’s board of trustees authorized the fund to pay CRMC effective July 1, 2019, an administrative services fee at the annual rate of 0.03% of the average daily net assets attributable to each share class of the fund (which could increase as noted above) for CRMC’s provision of administrative services.
529 plan services — Each 529 share class is subject to service fees to compensate the Virginia College Savings Plan (“Virginia529”) for its oversight and administration of the CollegeAmerica 529 college savings plan. The fee is based on the combined net assets invested in Class 529 and ABLE shares of the American Funds. Class ABLE shares are offered on other American Funds by Virginia529 through ABLEAmerica®, a tax-advantaged savings program for individuals with disabilities. The quarterly fee is based on a series of decreasing annual rates beginning with 0.10% on the first $20 billion of the combined net assets invested in the American Funds and decreasing to 0.03% on such assets in excess of $100 billion. The fee for any given calendar quarter is accrued and calculated on the basis of the average net assets of Class 529 and ABLE shares of the American Funds for the last month of the prior calendar quarter. The fee is included in other expenses in the fund’s statement of operations. Virginia529 is not considered a related party to the fund.
| EuroPacific Growth Fund | 29 |
For the six months ended September 30, 2019, class-specific expenses under the agreements were as follows (dollars in thousands):
| Share class | | Distribution
services | | | Transfer agent
services | | | Administrative
services | | | 529 plan
services | |
| Class A | | | $29,468 | | | | $16,689 | | | | $2,443 | | | | Not applicable | |
| Class C | | | 4,814 | | | | 613 | | | | 196 | | | | Not applicable | |
| Class T | | | — | | | | — | * | | | — | * | | | Not applicable | |
| Class F-1 | | | 3,919 | | | | 2,040 | | | | 632 | | | | Not applicable | |
| Class F-2 | | | Not applicable | | | | 14,427 | | | | 4,953 | | | | Not applicable | |
| Class F-3 | | | Not applicable | | | | 196 | | | | 2,513 | | | | Not applicable | |
| Class 529-A | | | 1,551 | | | | 738 | | | | 275 | | | | $449 | |
| Class 529-C | | | 1,012 | | | | 114 | | | | 42 | | | | 68 | |
| Class 529-E | | | 145 | | | | 19 | | | | 12 | | | | 19 | |
| Class 529-T | | | — | | | | — | * | | | — | * | | | — | * |
| Class 529-F-1 | | | — | | | | 79 | | | | 29 | | | | 48 | |
| Class R-1 | | | 1,027 | | | | 109 | | | | 41 | | | | Not applicable | |
| Class R-2 | | | 2,567 | | | | 1,170 | | | | 137 | | | | Not applicable | |
| Class R-2E | | | 282 | | | | 93 | | | | 19 | | | | Not applicable | |
| Class R-3 | | | 8,395 | | | | 2,506 | | | | 674 | | | | Not applicable | |
| Class R-4 | | | 9,373 | | | | 3,757 | | | | 1,503 | | | | Not applicable | |
| Class R-5E | | | Not applicable | | | | 1,137 | | | | 308 | | | | Not applicable | |
| Class R-5 | | | Not applicable | | | | 1,941 | | | | 1,520 | | | | Not applicable | |
| Class R-6 | | | Not applicable | | | | 284 | | | | 13,835 | | | | Not applicable | |
| Total class-specific expenses | | | $62,553 | | | | $45,912 | | | | $29,132 | | | | $584 | |
| | * | Amount less than one thousand. |
Trustees’ deferred compensation — Trustees who are unaffiliated with CRMC may elect to defer the cash payment of part or all of their compensation. These deferred amounts, which remain as liabilities of the fund, are treated as if invested in shares of the fund or other American Funds. These amounts represent general, unsecured liabilities of the fund and vary according to the total returns of the selected funds. Trustees’ compensation of $399,000 in the fund’s statement of operations reflects $273,000 in current fees (either paid in cash or deferred) and a net increase of $126,000 in the value of the deferred amounts.
Affiliated officers and trustees — Officers and certain trustees of the fund are or may be considered to be affiliated with CRMC, AFD and AFS. No affiliated officers or trustees received any compensation directly from the fund.
Investment in CCF — The fund holds shares of CCF, an institutional prime money market fund managed by CRMC. CCF invests in high-quality, short-term money market instruments. CCF is used as the primary investment vehicle for the fund’s short-term investments. CCF shares are only available for purchase by CRMC, its affiliates, and other funds managed by CRMC and are not available to the public. CRMC does not receive an investment advisory services fee from CCF.
| 30 | EuroPacific Growth Fund |
Security transactions with related funds — The fund may purchase securities from, or sell securities to, other funds managed by CRMC (or funds managed by certain affiliates of CRMC) under procedures adopted by the fund’s board of trustees. The funds involved in such transactions are considered related by virtue of having a common investment adviser (or affiliated investment advisers), common trustees and/or common officers. When such transactions occur, each transaction is executed at the current market price of the security and no brokerage commissions or fees are paid in accordance with Rule 17a-7 of the 1940 Act.
Interfund lending — Pursuant to an exemptive order issued by the SEC, the fund, along with other CRMC-managed funds (or funds managed by certain affiliates of CRMC), may participate in an interfund lending program. The program provides an alternate credit facility that permits the funds to lend or borrow cash for temporary purposes directly to or from one another, subject to the conditions of the exemptive order. The fund did not lend or borrow cash through the interfund lending program at any time during the six months ended September 30, 2019.
8. Capital share transactions
Capital share transactions in the fund were as follows (dollars and shares in thousands):
| | | Sales* | | | Reinvestments
of distributions | | | Repurchases* | | | Net (decrease)
increase | |
| Share class | | Amount | | | Shares | | | Amount | | | Shares | | | Amount | | | Shares | | | Amount | | | Shares | |
| | | | | | | | | | | | | | | | | | | | | | | | | |
| Six months ended September 30, 2019 |
| | | | | | | | | | | | | | | | | | | | | | | | | |
| Class A | | $ | 546,109 | | | | 10,552 | | | $ | 16,638 | | | | 324 | | | $ | (1,885,158 | ) | | | (36,377 | ) | | $ | (1,322,411 | ) | | | (25,501 | ) |
| Class C | | | 34,700 | | | | 688 | | | | — | | | | — | | | | (143,355 | ) | | | (2,846 | ) | | | (108,655 | ) | | | (2,158 | ) |
| Class T | | | — | | | | — | | | | — | | | | — | | | | — | | | | — | | | | — | | | | — | |
| Class F-1 | | | 207,626 | | | | 4,023 | | | | 1,939 | | | | 38 | | | | (571,377 | ) | | | (11,121 | ) | | | (361,812 | ) | | | (7,060 | ) |
| Class F-2 | | | 2,575,527 | | | | 49,953 | | | | 30,856 | | | | 603 | | | | (3,093,375 | ) | | | (59,795 | ) | | | (486,992 | ) | | | (9,239 | ) |
| Class F-3 | | | 2,235,474 | | | | 43,073 | | | | 16,971 | | | | 330 | | | | (1,009,167 | ) | | | (19,517 | ) | | | 1,243,278 | | | | 23,886 | |
| Class 529-A | | | 59,653 | | | | 1,167 | | | | 822 | | | | 16 | | | | (129,083 | ) | | | (2,521 | ) | | | (68,608 | ) | | | (1,338 | ) |
| Class 529-C | | | 8,993 | | | | 181 | | | | (1 | ) | | | — | † | | | (33,864 | ) | | | (679 | ) | | | (24,872 | ) | | | (498 | ) |
| Class 529-E | | | 2,383 | | | | 47 | | | | 5 | | | | — | † | | | (6,095 | ) | | | (120 | ) | | | (3,707 | ) | | | (73 | ) |
| Class 529-T | | | — | | | | — | | | | — | † | | | — | † | | | — | | | | — | | | | — | † | | | — | † |
| Class 529-F-1 | | | 13,189 | | | | 259 | | | | 170 | | | | 3 | | | | (15,334 | ) | | | (301 | ) | | | (1,975 | ) | | | (39 | ) |
| Class R-1 | | | 10,697 | | | | 215 | | | | — | † | | | — | † | | | (26,586 | ) | | | (535 | ) | | | (15,889 | ) | | | (320 | ) |
| Class R-2 | | | 81,067 | | | | 1,610 | | | | — | † | | | — | † | | | (106,710 | ) | | | (2,124 | ) | | | (25,643 | ) | | | (514 | ) |
| Class R-2E | | | 14,506 | | | | 282 | | | | — | | | | — | | | | (9,890 | ) | | | (193 | ) | | | 4,616 | | | | 89 | |
| Class R-3 | | | 219,909 | | | | 4,333 | | | | — | † | | | — | † | | | (526,957 | ) | | | (10,404 | ) | | | (307,048 | ) | | | (6,071 | ) |
| Class R-4 | | | 554,311 | | | | 10,921 | | | | 5,278 | | | | 105 | | | | (1,133,692 | ) | | | (22,316 | ) | | | (574,103 | ) | | | (11,290 | ) |
| Class R-5E | | | 123,395 | | | | 2,391 | | | | 1,876 | | | | 37 | | | | (109,381 | ) | | | (2,129 | ) | | | 15,890 | | | | 299 | |
| Class R-5 | | | 994,136 | | | | 19,183 | | | | 11,041 | | | | 216 | | | | (826,162 | ) | | | (15,947 | ) | | | 179,015 | | | | 3,452 | |
| Class R-6 | | | 6,329,484 | | | | 122,409 | | | | 106,888 | | | | 2,085 | | | | (5,788,147 | ) | | | (111,537 | ) | | | 648,225 | | | | 12,957 | |
| Total net increase (decrease) | | $ | 14,011,159 | | | | 271,287 | | | $ | 192,483 | | | | 3,757 | | | $ | (15,414,333 | ) | | | (298,462 | ) | | $ | (1,210,691 | ) | | | (23,418 | ) |
See end of table for footnotes.
| EuroPacific Growth Fund | 31 |
| | | Sales* | | | Reinvestments
of distributions | | | Repurchases* | | | Net (decrease)
increase | |
| Share class | | Amount | | | Shares | | | Amount | | | Shares | | | Amount | | | Shares | | | Amount | | | Shares | |
| | | | | | | | | | | | | | | | | | | | | | | | | |
| Year ended March 31, 2019 |
| | | | | | | | | | | | | | | | | | | | | | | | | |
| Class A | | $ | 1,745,025 | | | | 33,779 | | | $ | 1,400,728 | | | | 27,795 | | | $ | (4,591,568 | ) | | | (90,056 | ) | | $ | (1,445,815 | ) | | | (28,482 | ) |
| Class C | | | 131,659 | | | | 2,589 | | | | 57,361 | | | | 1,146 | | | | (384,770 | ) | | | (7,703 | ) | | | (195,750 | ) | | | (3,968 | ) |
| Class T | | | — | | | | — | | | | — | | | | — | | | | — | | | | — | | | | — | | | | — | |
| Class F-1 | | | 822,668 | | | | 16,074 | | | | 192,181 | | | | 3,793 | | | | (1,772,096 | ) | | | (33,935 | ) | | | (757,247 | ) | | | (14,068 | ) |
| Class F-2 | | | 8,283,565 | | | | 160,944 | | | | 1,336,131 | | | | 26,800 | | | | (8,105,462 | ) | | | (161,012 | ) | | | 1,514,234 | | | | 26,732 | |
| Class F-3 | | | 5,778,865 | | | | 112,229 | | | | 541,201 | | | | 10,866 | | | | (2,726,520 | ) | | | (54,975 | ) | | | 3,593,546 | | | | 68,120 | |
| Class 529-A | | | 148,848 | | | | 2,915 | | | | 77,005 | | | | 1,548 | | | | (221,689 | ) | | | (4,386 | ) | | | 4,164 | | | | 77 | |
| Class 529-C | | | 27,200 | | | | 546 | | | | 12,102 | | | | 245 | | | | (71,019 | ) | | | (1,425 | ) | | | (31,717 | ) | | | (634 | ) |
| Class 529-E | | | 5,528 | | | | 110 | | | | 3,432 | | | | 70 | | | | (12,673 | ) | | | (253 | ) | | | (3,713 | ) | | | (73 | ) |
| Class 529-T | | | — | | | | — | | | | 1 | | | | — | † | | | — | | | | — | | | | 1 | | | | — | † |
| Class 529-F-1 | | | 42,297 | | | | 838 | | | | 7,738 | | | | 157 | | | | (24,685 | ) | | | (492 | ) | | | 25,350 | | | | 503 | |
| Class R-1 | | | 21,196 | | | | 429 | | | | 11,853 | | | | 241 | | | | (60,088 | ) | | | (1,230 | ) | | | (27,039 | ) | | | (560 | ) |
| Class R-2 | | | 156,715 | | | | 3,160 | | | | 36,498 | | | | 737 | | | | (238,880 | ) | | | (4,793 | ) | | | (45,667 | ) | | | (896 | ) |
| Class R-2E | | | 52,852 | | | | 1,018 | | | | 8,890 | | | | 168 | | | | (212,291 | ) | | | (3,979 | ) | | | (150,549 | ) | | | (2,793 | ) |
| Class R-3 | | | 650,346 | | | | 12,821 | | | | 211,068 | | | | 4,245 | | | | (1,578,069 | ) | | | (31,422 | ) | | | (716,655 | ) | | | (14,356 | ) |
| Class R-4 | | | 1,531,980 | | | | 30,328 | | | | 504,822 | | | | 10,214 | | | | (3,503,544 | ) | | | (71,071 | ) | | | (1,466,742 | ) | | | (30,529 | ) |
| Class R-5E | | | 1,264,628 | | | | 24,306 | | | | 59,150 | | | | 1,241 | | | | (310,842 | ) | | | (6,387 | ) | | | 1,012,936 | | | | 19,160 | |
| Class R-5 | | | 1,999,574 | | | | 38,294 | | | | 472,082 | | | | 9,375 | | | | (3,227,419 | ) | | | (62,636 | ) | | | (755,763 | ) | | | (14,967 | ) |
| Class R-6 | | | 14,811,246 | | | | 288,387 | | | | 3,793,726 | | | | 76,102 | | | | (12,241,479 | ) | | | (239,135 | ) | | | 6,363,493 | | | | 125,354 | |
| Total net increase (decrease) | | $ | 37,474,192 | | | | 728,767 | | | $ | 8,725,969 | | | | 174,743 | | | $ | (39,283,094 | ) | | | (774,890 | ) | | $ | 6,917,067 | | | | 128,620 | |
| * | Includes exchanges between share classes of the fund. |
| † | Amount less than one thousand. |
| 32 | EuroPacific Growth Fund |
9. Investment transactions
The fund made purchases and sales of investment securities, excluding short-term securities and U.S. government obligations, if any, of $17,807,738,000 and $21,601,396,000, respectively, during the six months ended September 30, 2019.
| EuroPacific Growth Fund | 33 |
Financial highlights
| | | | | | Income (loss) from investment operations1 |
| | | Net asset | | | | | | Net gains (losses) | | | | |
| | | value, | | | Net | | | on securities (both | | | Total from | |
| | | beginning | | | investment | | | realized and | | | investment | |
| Period ended | | of period | | | income | | | unrealized) | | | operations | |
| Class A: | | | | | | | | | | | | | | | | |
| 9/30/20194,5 | | $ | 50.99 | | | $ | .43 | | | $ | .61 | | | $ | 1.04 | |
| 3/31/2019 | | | 56.66 | | | | .71 | | | | (3.52 | ) | | | (2.81 | ) |
| 3/31/2018 | | | 49.30 | | | | .47 | | | | 9.51 | | | | 9.98 | |
| 3/31/2017 | | | 44.28 | | | | .44 | | | | 5.14 | | | | 5.58 | |
| 3/31/2016 | | | 49.91 | | | | .44 | | | | (4.68 | ) | | | (4.24 | ) |
| 3/31/2015 | | | 49.37 | | | | .43 | | | | .76 | | | | 1.19 | |
| Class C: | | | | | | | | | | | | | | | | |
| 9/30/20194,5 | | | 49.70 | | | | .22 | | | | .60 | | | | .82 | |
| 3/31/2019 | | | 55.32 | | | | .31 | | | | (3.41 | ) | | | (3.10 | ) |
| 3/31/2018 | | | 48.19 | | | | .04 | | | | 9.29 | | | | 9.33 | |
| 3/31/2017 | | | 43.25 | | | | .08 | | | | 5.02 | | | | 5.10 | |
| 3/31/2016 | | | 48.75 | | | | .06 | | | | (4.56 | ) | | | (4.50 | ) |
| 3/31/2015 | | | 48.22 | | | | .05 | | | | .73 | | | | .78 | |
| Class T: | | | | | | | | | | | | | | | | |
| 9/30/20194,5 | | | 50.99 | | | | .49 | | | | .62 | | | | 1.11 | |
| 3/31/2019 | | | 56.69 | | | | .83 | | | | (3.54 | ) | | | (2.71 | ) |
| 3/31/20184,10 | | | 49.19 | | | | .58 | | | | 9.63 | | | | 10.21 | |
| Class F-1: | | | | | | | | | | | | | | | | |
| 9/30/20194,5 | | | 50.75 | | | | .42 | | | | .61 | | | | 1.03 | |
| 3/31/2019 | | | 56.40 | | | | .74 | | | | (3.57 | ) | | | (2.83 | ) |
| 3/31/2018 | | | 49.08 | | | | .45 | | | | 9.46 | | | | 9.91 | |
| 3/31/2017 | | | 44.08 | | | | .43 | | | | 5.11 | | | | 5.54 | |
| 3/31/2016 | | | 49.67 | | | | .41 | | | | (4.64 | ) | | | (4.23 | ) |
| 3/31/2015 | | | 49.10 | | | | .45 | | | | .71 | | | | 1.16 | |
| Class F-2: | | | | | | | | | | | | | | | | |
| 9/30/20194,5 | | | 50.83 | | | | .49 | | | | .61 | | | | 1.10 | |
| 3/31/2019 | | | 56.52 | | | | .82 | | | | (3.52 | ) | | | (2.70 | ) |
| 3/31/2018 | | | 49.17 | | | | .61 | | | | 9.48 | | | | 10.09 | |
| 3/31/2017 | | | 44.19 | | | | .55 | | | | 5.12 | | | | 5.67 | |
| 3/31/2016 | | | 49.82 | | | | .56 | | | | (4.68 | ) | | | (4.12 | ) |
| 3/31/2015 | | | 49.32 | | | | .53 | | | | .76 | | | | 1.29 | |
| Class F-3: | | | | | | | | | | | | | | | | |
| 9/30/20194,5 | | | 50.98 | | | | .51 | | | | .62 | | | | 1.13 | |
| 3/31/2019 | | | 56.68 | | | | .82 | | | | (3.48 | ) | | | (2.66 | ) |
| 3/31/2018 | | | 49.32 | | | | .59 | | | | 9.58 | | | | 10.17 | |
| 3/31/20174,11 | | | 47.46 | | | | .24 | | | | 1.62 | | | | 1.86 | |
| 34 | EuroPacific Growth Fund |
| Dividends and distributions | | | | | | | | | | | | | | | | |
Dividends
(from net
investment
income) | | | Distributions
(from capital
gains) | | | Total
dividends
and
distributions | | | Net asset
value, end
of period | | | Total
return2 | | | Net assets,
end of period
(in millions) | | | Ratio of
expenses
to average
net assets3 | | | Ratio of net
income
to average
net assets | |
| | | | | | | | | | | | | | | | | | | | | | | |
| $ | (.04 | ) | | $ | — | | | $ | (.04 | ) | | $ | 51.99 | | | | 2.04 | %6 | | $ | 23,864 | | | | .84 | %7 | | | 1.64 | %7 |
| | (.62 | ) | | | (2.24 | ) | | | (2.86 | ) | | | 50.99 | | | | (4.97 | ) | | | 24,704 | | | | .83 | | | | 1.37 | |
| | (.49 | ) | | | (2.13 | ) | | | (2.62 | ) | | | 56.66 | | | | 20.74 | | | | 29,067 | | | | .82 | | | | .86 | |
| | (.56 | ) | | | — | | | | (.56 | ) | | | 49.30 | | | | 12.72 | | | | 25,678 | | | | .85 | | | | .95 | |
| | (.80 | ) | | | (.59 | ) | | | (1.39 | ) | | | 44.28 | | | | (8.60 | ) | | | 26,556 | | | | .83 | | | | .92 | |
| | (.65 | ) | | | — | | | | (.65 | ) | | | 49.91 | | | | 2.48 | | | | 30,770 | | | | .83 | | | | .88 | |
| | | | | | | | | | | | | | | | | | | | | | | | | | | | | | | |
| | — | | | | — | | | | — | | | | 50.52 | | | | 1.65 | 6 | | | 923 | | | | 1.59 | 7 | | | .89 | 7 |
| | (.28 | ) | | | (2.24 | ) | | | (2.52 | ) | | | 49.70 | | | | (5.70 | ) | | | 1,015 | | | | 1.60 | | | | .62 | |
| | (.07 | ) | | | (2.13 | ) | | | (2.20 | ) | | | 55.32 | | | | 19.82 | | | | 1,350 | | | | 1.60 | | | | .08 | |
| | (.16 | ) | | | — | | | | (.16 | ) | | | 48.19 | | | | 11.82 | | | | 1,240 | | | | 1.63 | | | | .17 | |
| | (.41 | ) | | | (.59 | ) | | | (1.00 | ) | | | 43.25 | | | | (9.30 | ) | | | 1,474 | | | | 1.62 | | | | .13 | |
| | (.25 | ) | | | — | | | | (.25 | ) | | | 48.75 | | | | 1.65 | | | | 1,803 | | | | 1.61 | | | | .11 | |
| | | | | | | | | | | | | | | | | | | | | | | | | | | | | | | |
| | (.07 | ) | | | — | | | | (.07 | ) | | | 52.03 | | | | 2.18 | 6,8 | | | — | 9 | | | .59 | 7,8 | | | 1.87 | 7,8 |
| | (.75 | ) | | | (2.24 | ) | | | (2.99 | ) | | | 50.99 | | | | (4.76 | )8 | | | — | 9 | | | .59 | 8 | | | 1.60 | 8 |
| | (.58 | ) | | | (2.13 | ) | | | (2.71 | ) | | | 56.69 | | | | 21.27 | 6,8 | | | — | 9 | | | .60 | 7,8 | | | 1.07 | 7,8 |
| | | | | | | | | | | | | | | | | | | | | | | | | | | | | | | |
| | (.03 | ) | | | — | | | | (.03 | ) | | | 51.75 | | | | 2.04 | 6 | | | 2,930 | | | | .86 | 7 | | | 1.62 | 7 |
| | (.58 | ) | | | (2.24 | ) | | | (2.82 | ) | | | 50.75 | | | | (5.01 | ) | | | 3,232 | | | | .87 | | | | 1.43 | |
| | (.46 | ) | | | (2.13 | ) | | | (2.59 | ) | | | 56.40 | | | | 20.69 | | | | 4,385 | | | | .86 | | | | .83 | |
| | (.54 | ) | | | — | | | | (.54 | ) | | | 49.08 | | | | 12.69 | | | | 4,179 | | | | .87 | | | | .93 | |
| | (.77 | ) | | | (.59 | ) | | | (1.36 | ) | | | 44.08 | | | | (8.60 | ) | | | 4,281 | | | | .86 | | | | .86 | |
| | (.59 | ) | | | — | | | | (.59 | ) | | | 49.67 | | | | 2.43 | | | | 6,773 | | | | .86 | | | | .93 | |
| | | | | | | | | | | | | | | | | | | | | | | | | | | | | | | |
| | (.07 | ) | | | — | | | | (.07 | ) | | | 51.86 | | | | 2.16 | 6 | | | 24,605 | | | | .59 | 7 | | | 1.87 | 7 |
| | (.75 | ) | | | (2.24 | ) | | | (2.99 | ) | | | 50.83 | | | | (4.75 | ) | | | 24,585 | | | | .59 | | | | 1.58 | |
| | (.61 | ) | | | (2.13 | ) | | | (2.74 | ) | | | 56.52 | | | | 21.05 | | | | 25,826 | | | | .59 | | | | 1.11 | |
| | (.69 | ) | | | — | | | | (.69 | ) | | | 49.17 | | | | 12.99 | | | | 22,949 | | | | .60 | | | | 1.19 | |
| | (.92 | ) | | | (.59 | ) | | | (1.51 | ) | | | 44.19 | �� | | | (8.36 | ) | | | 19,386 | | | | .60 | | | | 1.18 | |
| | (.79 | ) | | | — | | | | (.79 | ) | | | 49.82 | | | | 2.69 | | | | 16,273 | | | | .59 | | | | 1.06 | |
| | | | | | | | | | | | | | | | | | | | | | | | | | | | | | | |
| | (.08 | ) | | | — | | | | (.08 | ) | | | 52.03 | | | | 2.22 | 6 | | | 13,483 | | | | .48 | 7 | | | 1.98 | 7 |
| | (.80 | ) | | | (2.24 | ) | | | (3.04 | ) | | | 50.98 | | | | (4.65 | ) | | | 11,993 | | | | .49 | | | | 1.60 | |
| | (.68 | ) | | | (2.13 | ) | | | (2.81 | ) | | | 56.68 | | | | 21.15 | | | | 9,473 | | | | .49 | | | | 1.06 | |
| | — | | | | — | | | | — | | | | 49.32 | | | | 3.92 | 6 | | | 1,162 | | | | .09 | 6 | | | .50 | 6 |
See end of table for footnotes.
| EuroPacific Growth Fund | 35 |
Financial highlights (continued)
| | | | | | Income (loss) from investment operations1 |
| | | Net asset | | | | | | Net gains (losses) | | | | |
| | | value, | | | Net | | | on securities (both | | | Total from | |
| | | beginning | | | investment | | | realized and | | | investment | |
| Period ended | | of period | | | income | | | unrealized) | | | operations | |
| Class 529-A: | | | | | | | | | | | | | | | | |
| 9/30/20194,5 | | $ | 50.35 | | | $ | .41 | | | $ | .61 | | | $ | 1.02 | |
| 3/31/2019 | | | 56.00 | | | | .67 | | | | (3.49 | ) | | | (2.82 | ) |
| 3/31/2018 | | | 48.77 | | | | .44 | | | | 9.40 | | | | 9.84 | |
| 3/31/2017 | | | 43.82 | | | | .41 | | | | 5.09 | | | | 5.50 | |
| 3/31/2016 | | | 49.41 | | | | .40 | | | | (4.63 | ) | | | (4.23 | ) |
| 3/31/2015 | | | 48.89 | | | | .40 | | | | .75 | | | | 1.15 | |
| Class 529-C: | | | | | | | | | | | | | | | | |
| 9/30/20194,5 | | | 49.18 | | | | .21 | | | | .59 | | | | .80 | |
| 3/31/2019 | | | 54.79 | | | | .29 | | | | (3.38 | ) | | | (3.09 | ) |
| 3/31/2018 | | | 47.73 | | | | .01 | | | | 9.21 | | | | 9.22 | |
| 3/31/2017 | | | 42.90 | | | | .05 | | | | 4.97 | | | | 5.02 | |
| 3/31/2016 | | | 48.38 | | | | .04 | | | | (4.53 | ) | | | (4.49 | ) |
| 3/31/2015 | | | 47.88 | | | | .02 | | | | .73 | | | | .75 | |
| Class 529-E: | | | | | | | | | | | | | | | | |
| 9/30/20194,5 | | | 49.87 | | | | .35 | | | | .60 | | | | .95 | |
| 3/31/2019 | | | 55.50 | | | | .55 | | | | (3.44 | ) | | | (2.89 | ) |
| 3/31/2018 | | | 48.35 | | | | .31 | | | | 9.31 | | | | 9.62 | |
| 3/31/2017 | | | 43.45 | | | | .30 | | | | 5.04 | | | | 5.34 | |
| 3/31/2016 | | | 49.00 | | | | .29 | | | | (4.59 | ) | | | (4.30 | ) |
| 3/31/2015 | | | 48.49 | | | | .27 | | | | .75 | | | | 1.02 | |
| Class 529-T: | | | | | | | | | | | | | | | | |
| 9/30/20194,5 | | | 50.98 | | | | .47 | | | | .62 | | | | 1.09 | |
| 3/31/2019 | | | 56.68 | | | | .79 | | | | (3.53 | ) | | | (2.74 | ) |
| 3/31/20184,10 | | | 49.19 | | | | .56 | | | | 9.62 | | | | 10.18 | |
| Class 529-F-1: | | | | | | | | | | | | | | | | |
| 9/30/20194,5 | | | 50.32 | | | | .47 | | | | .60 | | | | 1.07 | |
| 3/31/2019 | | | 55.99 | | | | .76 | | | | (3.47 | ) | | | (2.71 | ) |
| 3/31/2018 | | | 48.74 | | | | .56 | | | | 9.40 | | | | 9.96 | |
| 3/31/2017 | | | 43.81 | | | | .51 | | | | 5.07 | | | | 5.58 | |
| 3/31/2016 | | | 49.40 | | | | .50 | | | | (4.62 | ) | | | (4.12 | ) |
| 3/31/2015 | | | 48.89 | | | | .51 | | | | .74 | | | | 1.25 | |
| Class R-1: | | | | | | | | | | | | | | | | |
| 9/30/20194,5 | | | 48.86 | | | | .22 | | | | .59 | | | | .81 | |
| 3/31/2019 | | | 54.46 | | | | .31 | | | | (3.37 | ) | | | (3.06 | ) |
| 3/31/2018 | | | 47.49 | | | | .05 | | | | 9.14 | | | | 9.19 | |
| 3/31/2017 | | | 42.69 | | | | .08 | | | | 4.96 | | | | 5.04 | |
| 3/31/2016 | | | 48.14 | | | | .07 | | | | (4.50 | ) | | | (4.43 | ) |
| 3/31/2015 | | | 47.64 | | | | .06 | | | | .72 | | | | .78 | |
| 36 | EuroPacific Growth Fund |
| Dividends and distributions | | | | | | | | | | | | | | | | |
Dividends
(from net
investment
income) | | | Distributions
(from capital
gains) | | | Total
dividends
and
distributions | | | Net asset
value, end
of period | | | Total
return2 | | | Net assets,
end of period
(in millions) | | | Ratio of
expenses
to average
net assets3 | | | Ratio of net
income
to average
net assets | |
| | | | | | | | | | | | | | | | | | | | | | | |
| $ | (.03 | ) | | $ | — | | | $ | (.03 | ) | | $ | 51.34 | | | | 2.03 | %6 | | $ | 1,334 | | | | .88 | %7 | | | 1.60 | %7 |
| | (.59 | ) | | | (2.24 | ) | | | (2.83 | ) | | | 50.35 | | | | (5.04 | ) | | | 1,376 | | | | .89 | | | | 1.31 | |
| | (.48 | ) | | | (2.13 | ) | | | (2.61 | ) | | | 56.00 | | | | 20.71 | | | | 1,525 | | | | .87 | | | | .81 | |
| | (.55 | ) | | | — | | | | (.55 | ) | | | 48.77 | | | | 12.65 | | | | 1,172 | | | | .90 | | | | .90 | |
| | (.77 | ) | | | (.59 | ) | | | (1.36 | ) | | | 43.82 | | | | (8.64 | ) | | | 1,103 | | | | .90 | | | | .86 | |
| | (.63 | ) | | | — | | | | (.63 | ) | | | 49.41 | | | | 2.41 | | | | 1,205 | | | | .89 | | | | .82 | |
| | | | | | | | | | | | | | | | | | | | | | | | | | | | | | | |
| | — | | | | — | | | | — | | | | 49.98 | | | | 1.62 | 6 | | | 197 | | | | 1.62 | 7 | | | .86 | 7 |
| | (.28 | ) | | | (2.24 | ) | | | (2.52 | ) | | | 49.18 | | | | (5.72 | ) | | | 219 | | | | 1.64 | | | | .59 | |
| | (.03 | ) | | | (2.13 | ) | | | (2.16 | ) | | | 54.79 | | | | 19.76 | | | | 278 | | | | 1.65 | | | | .03 | |
| | (.19 | ) | | | — | | | | (.19 | ) | | | 47.73 | | | | 11.76 | | | | 343 | | | | 1.68 | | | | .12 | |
| | (.40 | ) | | | (.59 | ) | | | (.99 | ) | | | 42.90 | | | | (9.35 | ) | | | 335 | | | | 1.68 | | | | .08 | |
| | (.25 | ) | | | — | | | | (.25 | ) | | | 48.38 | | | | 1.62 | | | | 374 | | | | 1.67 | | | | .04 | |
| | | | | | | | | | | | | | | | | | | | | | | | | | | | | | | |
| | — | 12 | | | — | | | | — | 12 | | | 50.82 | | | | 1.91 | 6 | | | 57 | | | | 1.10 | 7 | | | 1.38 | 7 |
| | (.50 | ) | | | (2.24 | ) | | | (2.74 | ) | | | 49.87 | | | | (5.24 | ) | | | 60 | | | | 1.11 | | | | 1.09 | |
| | (.34 | ) | | | (2.13 | ) | | | (2.47 | ) | | | 55.50 | | | | 20.41 | | | | 71 | | | | 1.11 | | | | .57 | |
| | (.44 | ) | | | — | | | | (.44 | ) | | | 48.35 | | | | 12.39 | | | | 60 | | | | 1.13 | | | | .66 | |
| | (.66 | ) | | | (.59 | ) | | | (1.25 | ) | | | 43.45 | | | | (8.86 | ) | | | 57 | | | | 1.14 | | | | .62 | |
| | (.51 | ) | | | — | | | | (.51 | ) | | | 49.00 | | | | 2.15 | | | | 62 | | | | 1.14 | | | | .57 | |
| | | | | | | | | | | | | | | | | | | | | | | | | | | | | | | |
| | (.06 | ) | | | — | | | | (.06 | ) | | | 52.01 | | | | 2.14 | 6,8 | | | — | 9 | | | .64 | 7,8 | | | 1.82 | 7,8 |
| | (.72 | ) | | | (2.24 | ) | | | (2.96 | ) | | | 50.98 | | | | (4.82 | )8 | | | — | 9 | | | .65 | 8 | | | 1.52 | 8 |
| | (.56 | ) | | | (2.13 | ) | | | (2.69 | ) | | | 56.68 | | | | 21.22 | 6,8 | | | — | 9 | | | .64 | 7,8 | | | 1.03 | 7,8 |
| | | | | | | | | | | | | | | | | | | | | | | | | | | | | | | |
| | (.06 | ) | | | — | | | | (.06 | ) | | | 51.33 | | | | 2.13 | 6 | | | 146 | | | | .65 | 7 | | | 1.82 | 7 |
| | (.72 | ) | | | (2.24 | ) | | | (2.96 | ) | | | 50.32 | | | | (4.81 | ) | | | 145 | | | | .66 | | | | 1.50 | |
| | (.58 | ) | | | (2.13 | ) | | | (2.71 | ) | | | 55.99 | | | | 20.96 | | | | 134 | | | | .65 | | | | 1.02 | |
| | (.65 | ) | | | — | | | | (.65 | ) | | | 48.74 | | | | 12.88 | | | | 102 | | | | .68 | | | | 1.11 | |
| | (.88 | ) | | | (.59 | ) | | | (1.47 | ) | | | 43.81 | | | | (8.44 | ) | | | 90 | | | | .69 | | | | 1.07 | |
| | (.74 | ) | | | — | | | | (.74 | ) | | | 49.40 | | | | 2.62 | | | | 96 | | | | .67 | | | | 1.04 | |
| | | | | | | | | | | | | | | | | | | | | | | | | | | | | | | |
| | — | | | | — | | | | — | | | | 49.67 | | | | 1.66 | 6 | | | 197 | | | | 1.58 | 7 | | | .90 | 7 |
| | (.30 | ) | | | (2.24 | ) | | | (2.54 | ) | | | 48.86 | | | | (5.71 | ) | | | 209 | | | | 1.60 | | | | .61 | |
| | (.09 | ) | | | (2.13 | ) | | | (2.22 | ) | | | 54.46 | | | | 19.82 | | | | 263 | | | | 1.60 | | | | .09 | |
| | (.24 | ) | | | — | | | | (.24 | ) | | | 47.49 | | | | 11.86 | | | | 247 | | | | 1.61 | | | | .19 | |
| | (.43 | ) | | | (.59 | ) | | | (1.02 | ) | | | 42.69 | | | | (9.28 | ) | | | 248 | | | | 1.61 | | | | .15 | |
| | (.28 | ) | | | — | | | | (.28 | ) | | | 48.14 | | | | 1.67 | | | | 285 | | | | 1.59 | | | | .12 | |
See end of table for footnotes.
| EuroPacific Growth Fund | 37 |
Financial highlights (continued)
| | | | | | Income (loss) from investment operations1 |
| | | Net asset | | | | | | Net gains (losses) | | | | |
| | | value, | | | Net | | | on securities (both | | | Total from | |
| | | beginning | | | investment | | | realized and | | | investment | |
| Period ended | | of period | | | income | | | unrealized) | | | operations | |
| Class R-2: | | | | | | | | | | | | | | | | |
| 9/30/20194,5 | | $ | 49.30 | | | $ | .23 | | | $ | .59 | | | $ | .82 | |
| 3/31/2019 | | | 54.93 | | | | .31 | | | | (3.39 | ) | | | (3.08 | ) |
| 3/31/2018 | | | 47.88 | | | | .06 | | | | 9.21 | | | | 9.27 | |
| 3/31/2017 | | | 43.01 | | | | .09 | | | | 5.00 | | | | 5.09 | |
| 3/31/2016 | | | 48.49 | | | | .08 | | | | (4.53 | ) | | | (4.45 | ) |
| 3/31/2015 | | | 47.96 | | | | .07 | | | | .73 | | | | .80 | |
| Class R-2E: | | | | | | | | | | | | | | | | |
| 9/30/20194,5 | | | 50.42 | | | | .31 | | | | .61 | | | | .92 | |
| 3/31/2019 | | | 55.76 | | | | .77 | | | | (3.74 | ) | | | (2.97 | ) |
| 3/31/2018 | | | 48.59 | | | | .20 | | | | 9.38 | | | | 9.58 | |
| 3/31/2017 | | | 43.79 | | | | .18 | | | | 5.14 | | | | 5.32 | |
| 3/31/2016 | | | 49.67 | | | | .52 | | | | (4.89 | ) | | | (4.37 | ) |
| 3/31/20154,13 | | | 50.08 | | | | .10 | | | | .27 | | | | .37 | |
| Class R-3: | | | | | | | | | | | | | | | | |
| 9/30/20194,5 | | | 49.86 | | | | .34 | | | | .60 | | | | .94 | |
| 3/31/2019 | | | 55.48 | | | | .55 | | | | (3.45 | ) | | | (2.90 | ) |
| 3/31/2018 | | | 48.32 | | | | .30 | | | | 9.31 | | | | 9.61 | |
| 3/31/2017 | | | 43.40 | | | | .30 | | | | 5.04 | | | | 5.34 | |
| 3/31/2016 | | | 48.93 | | | | .29 | | | | (4.59 | ) | | | (4.30 | ) |
| 3/31/2015 | | | 48.40 | | | | .28 | | | | .74 | | | | 1.02 | |
| Class R-4: | | | | | | | | | | | | | | | | |
| 9/30/20194,5 | | | 49.91 | | | | .42 | | | | .60 | | | | 1.02 | |
| 3/31/2019 | | | 55.52 | | | | .69 | | | | (3.46 | ) | | | (2.77 | ) |
| 3/31/2018 | | | 48.35 | | | | .46 | | | | 9.32 | | | | 9.78 | |
| 3/31/2017 | | | 43.45 | | | | .43 | | | | 5.03 | | | | 5.46 | |
| 3/31/2016 | | | 48.99 | | | | .43 | | | | (4.59 | ) | | | (4.16 | ) |
| 3/31/2015 | | | 48.48 | | | | .42 | | | | .74 | | | | 1.16 | |
| Class R-5E: | | | | | | | | | | | | | | | | |
| 9/30/20194,5 | | | 50.58 | | | | .47 | | | | .62 | | | | 1.09 | |
| 3/31/2019 | | | 56.29 | | | | .62 | | | | (3.33 | ) | | | (2.71 | ) |
| 3/31/2018 | | | 49.02 | | | | .59 | | | | 9.45 | | | | 10.04 | |
| 3/31/2017 | | | 44.14 | | | | .53 | | | | 5.09 | | | | 5.62 | |
| 3/31/20164,14 | | | 48.16 | | | | .20 | | | | (2.65 | ) | | | (2.45 | ) |
| Class R-5: | | | | | | | | | | | | | | | | |
| 9/30/20194,5 | | | 50.88 | | | | .50 | | | | .62 | | | | 1.12 | |
| 3/31/2019 | | | 56.57 | | | | .89 | | | | (3.57 | ) | | | (2.68 | ) |
| 3/31/2018 | | | 49.22 | | | | .64 | | | | 9.48 | | | | 10.12 | |
| 3/31/2017 | | | 44.22 | | | | .58 | | | | 5.13 | | | | 5.71 | |
| 3/31/2016 | | | 49.85 | | | | .58 | | | | (4.68 | ) | | | (4.10 | ) |
| 3/31/2015 | | | 49.32 | | | | .59 | | | | .74 | | | | 1.33 | |
| 38 | EuroPacific Growth Fund |
| Dividends and distributions | | | | | | | | | | | | | | | | |
Dividends
(from net
investment
income) | | | Distributions
(from capital
gains) | | | Total
dividends
and
distributions | | | Net asset
value, end
of period | | | Total
return2 | | | Net assets,
end of period
(in millions) | | | Ratio of
expenses
to average
net assets3 | | | Ratio of net
income
to average
net assets | |
| | | | | | | | | | | | | | | | | | | | | | | | | | | | | | | |
| $ | — | | | $ | — | | | $ | — | | | $ | 50.12 | | | | 1.66 | %6 | | $ | 676 | | | | 1.57 | %7 | | | .90 | %7 |
| | (.31 | ) | | | (2.24 | ) | | | (2.55 | ) | | | 49.30 | | | | (5.71 | ) | | | 690 | | | | 1.60 | | | | .61 | |
| | (.09 | ) | | | (2.13 | ) | | | (2.22 | ) | | | 54.93 | | | | 19.84 | | | | 818 | | | | 1.58 | | | | .11 | |
| | (.22 | ) | | | — | | | | (.22 | ) | | | 47.88 | | | | 11.88 | | | | 767 | | | | 1.60 | | | | .20 | |
| | (.44 | ) | | | (.59 | ) | | | (1.03 | ) | | | 43.01 | | | | (9.25 | ) | | | 800 | | | | 1.58 | | | | .18 | |
| | (.27 | ) | | | — | | | | (.27 | ) | | | 48.49 | | | | 1.70 | | | | 975 | | | | 1.57 | | | | .15 | |
| | | | | | | | | | | | | | | | | | | | | | | | | | | | | | | |
| | — | | | | — | | | | — | | | | 51.34 | | | | 1.82 | 6 | | | 95 | | | | 1.28 | 7 | | | 1.19 | 7 |
| | (.13 | ) | | | (2.24 | ) | | | (2.37 | ) | | | 50.42 | | | | (5.46 | ) | | | 89 | | | | 1.31 | | | | 1.47 | |
| | (.28 | ) | | | (2.13 | ) | | | (2.41 | ) | | | 55.76 | | | | 20.19 | | | | 254 | | | | 1.29 | | | | .38 | |
| | (.52 | ) | | | — | | | | (.52 | ) | | | 48.59 | | | | 12.25 | | | | 189 | | | | 1.28 | | | | .40 | |
| | (.92 | ) | | | (.59 | ) | | | (1.51 | ) | | | 43.79 | | | | (8.89 | ) | | | 8 | | | | 1.18 | | | | 1.25 | |
| | (.78 | ) | | | — | | | | (.78 | ) | | | 49.67 | | | | .82 | 6 | | | — | 9 | | | 1.26 | 7 | | | .28 | 7 |
| | | | | | | | | | | | | | | | | | | | | | | | | | | | | | | |
| | — | | | | — | | | | — | | | | 50.80 | | | | 1.88 | 6 | | | 3,203 | | | | 1.13 | 7 | | | 1.35 | 7 |
| | (.48 | ) | | | (2.24 | ) | | | (2.72 | ) | | | 49.86 | | | | (5.26 | ) | | | 3,446 | | | | 1.14 | | | | 1.08 | |
| | (.32 | ) | | | (2.13 | ) | | | (2.45 | ) | | | 55.48 | | | | 20.36 | | | | 4,631 | | | | 1.14 | | | | .56 | |
| | (.42 | ) | | | — | | | | (.42 | ) | | | 48.32 | | | | 12.40 | | | | 4,505 | | | | 1.14 | | | | .66 | |
| | (.64 | ) | | | (.59 | ) | | | (1.23 | ) | | | 43.40 | | | | (8.87 | ) | | | 5,029 | | | | 1.14 | | | | .62 | |
| | (.49 | ) | | | — | | | | (.49 | ) | | | 48.93 | | | | 2.16 | | | | 6,482 | | | | 1.13 | | | | .59 | |
| | | | | | | | | | | | | | | | | | | | | | | | | | | | | | | |
| | (.04 | ) | | | — | | | | (.04 | ) | | | 50.89 | | | | 2.03 | 6 | | | 7,293 | | | | .83 | 7 | | | 1.65 | 7 |
| | (.60 | ) | | | (2.24 | ) | | | (2.84 | ) | | | 49.91 | | | | (4.99 | ) | | | 7,715 | | | | .84 | | | | 1.37 | |
| | (.48 | ) | | | (2.13 | ) | | | (2.61 | ) | | | 55.52 | | | | 20.76 | | | | 10,278 | | | | .83 | | | | .85 | |
| | (.56 | ) | | | — | | | | (.56 | ) | | | 48.35 | | | | 12.70 | | | | 9,854 | | | | .85 | | | | .96 | |
| | (.79 | ) | | | (.59 | ) | | | (1.38 | ) | | | 43.45 | | | | (8.58 | ) | | | 11,310 | | | | .85 | | | | .92 | |
| | (.65 | ) | | | — | | | | (.65 | ) | | | 48.99 | | | | 2.45 | | | | 13,488 | | | | .84 | | | | .88 | |
| | | | | | | | | | | | | | | | | | | | | | | | | | | | | | | |
| | (.06 | ) | | | — | | | | (.06 | ) | | | 51.61 | | | | 2.16 | 6 | | | 1,557 | | | | .62 | 7 | | | 1.84 | 7 |
| | (.76 | ) | | | (2.24 | ) | | | (3.00 | ) | | | 50.58 | | | | (4.78 | ) | | | 1,511 | | | | .63 | | | | 1.24 | |
| | (.64 | ) | | | (2.13 | ) | | | (2.77 | ) | | | 56.29 | | | | 21.01 | | | | 603 | | | | .62 | | | | 1.06 | |
| | (.74 | ) | | | — | | | | (.74 | ) | | | 49.02 | | | | 12.89 | | | | 9 | | | | .62 | | | | 1.14 | |
| | (.98 | ) | | | (.59 | ) | | | (1.57 | ) | | | 44.14 | | | | (5.19 | )6 | | | — | 9 | | | .25 | 6 | | | .46 | 6 |
| | | | | | | | | | | | | | | | | | | | | | | | | | | | | | | |
| | (.07 | ) | | | — | | | | (.07 | ) | | | 51.93 | | | | 2.21 | 6 | | | 7,612 | | | | .53 | 7 | | | 1.95 | 7 |
| | (.77 | ) | | | (2.24 | ) | | | (3.01 | ) | | | 50.88 | | | | (4.71 | ) | | | 7,283 | | | | .54 | | | | 1.72 | |
| | (.64 | ) | | | (2.13 | ) | | | (2.77 | ) | | | 56.57 | | | | 21.09 | | | | 8,944 | | | | .53 | | | | 1.16 | |
| | (.71 | ) | | | — | | | | (.71 | ) | | | 49.22 | | | | 13.07 | | | | 8,721 | | | | .54 | | | | 1.27 | |
| | (.94 | ) | | | (.59 | ) | | | (1.53 | ) | | | 44.22 | | | | (8.32 | ) | | | 9,285 | | | | .54 | | | | 1.21 | |
| | (.80 | ) | | | — | | | | (.80 | ) | | | 49.85 | | | | 2.77 | | | | 11,418 | | | | .53 | | | | 1.19 | |
See end of table for footnotes.
| EuroPacific Growth Fund | 39 |
Financial highlights (continued)
| | | | | | Income (loss) from investment operations1 |
| | | Net asset | | | | | | Net gains (losses) | | | | |
| | | value, | | | Net | | | on securities (both | | | Total from | |
| | | beginning | | | investment | | | realized and | | | investment | |
| Period ended | | of period | | | income | | | unrealized) | | | operations | |
| Class R-6: | | | | | | | | | | | | | | | | |
| 9/30/20194,5 | | $ | 50.93 | | | $ | .52 | | | $ | .61 | | | $ | 1.13 | |
| 3/31/2019 | | | 56.63 | | | | .86 | | | | (3.52 | ) | | | (2.66 | ) |
| 3/31/2018 | | | 49.27 | | | | .65 | | | | 9.51 | | | | 10.16 | |
| 3/31/2017 | | | 44.27 | | | | .60 | | | | 5.14 | | | | 5.74 | |
| 3/31/2016 | | | 49.90 | | | | .60 | | | | (4.67 | ) | | | (4.07 | ) |
| 3/31/2015 | | | 49.38 | | | | .60 | | | | .74 | | | | 1.34 | |
| |
| | | Six months ended | | Year ended March 31 |
| | | September 30, 20194,5,6 | | 2019 | | 2018 | | 2017 | | 2016 | | 2015 |
| Portfolio turnover rate for all share classes15 | | | 12 | % | | | 35 | % | | | 29 | % | | | 36 | % | | | 30 | % | | | 28 | % |
See notes to financial statements.
| 40 | EuroPacific Growth Fund |
| Dividends and distributions | | | | | | | | | | | | | | | | |
Dividends
(from net
investment
income) | | | Distributions
(from capital
gains) | | | Total
dividends
and
distributions | | | Net asset
value, end
of period | | | Total
return2 | | | Net assets,
end of period
(in millions) | | | Ratio of
expenses
to average
net assets3 | | | Ratio of net
income
to average
net assets | |
| | | | | | | | | | | | | | | | | | | | | | | |
| $ | (.08 | ) | | $ | — | | | $ | (.08 | ) | | $ | 51.98 | | | | 2.22 | %6 | | $ | 70,316 | | | | .48 | %7 | | | 1.99 | %7 |
| | (.80 | ) | | | (2.24 | ) | | | (3.04 | ) | | | 50.93 | | | | (4.66 | ) | | | 68,234 | | | | .49 | | | | 1.68 | |
| | (.67 | ) | | | (2.13 | ) | | | (2.80 | ) | | | 56.63 | | | | 21.17 | | | | 68,770 | | | | .49 | | | | 1.18 | |
| | (.74 | ) | | | — | | | | (.74 | ) | | | 49.27 | | | | 13.10 | | | | 51,100 | | | | .50 | | | | 1.30 | |
| | (.97 | ) | | | (.59 | ) | | | (1.56 | ) | | | 44.27 | | | | (8.26 | ) | | | 41,539 | | | | .50 | | | | 1.27 | |
| | (.82 | ) | | | — | | | | (.82 | ) | | | 49.90 | | | | 2.80 | | | | 38,346 | | | | .49 | | | | 1.20 | |
| 1 | Based on average shares outstanding. |
| 2 | Total returns exclude any applicable sales charges, including contingent deferred sales charges. |
| 3 | Ratios do not include expenses of any Central Funds. The fund indirectly bears its proportionate share of the expenses of any Central Funds. |
| 4 | Based on operations for a period that is less than a full year. |
| 5 | Unaudited. |
| 6 | Not annualized. |
| 7 | Annualized. |
| 8 | All or a significant portion of assets in this class consisted of seed capital invested by CRMC and/or its affiliates. Fees for distribution services are not charged or accrued on these seed capital assets. If such fees were paid by the fund on seed capital assets, fund expenses would have been higher and net income and total return would have been lower. |
| 9 | Amount less than $1 million. |
| 10 | Class T and 529-T shares began investment operations on April 7, 2017. |
| 11 | Class F-3 shares began investment operations on January 27, 2017. |
| 12 | Amount less than $.01. |
| 13 | Class R-2E shares began investment operations on August 29, 2014. |
| 14 | Class R-5E shares began investment operations on November 20, 2015. |
| 15 | Rates do not include the fund’s portfolio activity with respect to any Central Funds. |
| EuroPacific Growth Fund | 41 |
As a fund shareholder, you incur two types of costs: (1) transaction costs, such as initial sales charges on purchase payments and contingent deferred sales charges on redemptions (loads), and (2) ongoing costs, including management fees, distribution and service (12b-1) fees, and other expenses. This example is intended to help you understand your ongoing costs (in dollars) of investing in the fund so you can compare these costs with the ongoing costs of investing in other mutual funds. The example is based on an investment of $1,000 invested at the beginning of the period and held for the entire six-month period (April 1, 2019, through September 30, 2019).
Actual expenses:
The first line of each share class in the table on the following page provides information about actual account values and actual expenses. You may use the information in this line, together with the amount you invested, to estimate the expenses that you paid over the period. Simply divide your account value by $1,000 (for example, an $8,600 account value divided by $1,000 = 8.6), then multiply the result by the number in the first line under the heading titled “Expenses paid during period” to estimate the expenses you paid on your account during this period.
Hypothetical example for comparison purposes:
The second line of each share class in the table on the following page provides information about hypothetical account values and hypothetical expenses based on the actual expense ratio for the share class and an assumed rate of return of 5.00% per year before expenses, which is not the actual return of the share class. The hypothetical account values and expenses may not be used to estimate the actual ending account balance or expenses you paid for the period. You may use this information to compare the ongoing costs of investing in the fund and other funds. To do so, compare this 5.00% hypothetical example with the 5.00% hypothetical examples that appear in the shareholder reports of the other funds.
Notes:
Retirement plan participants may be subject to certain fees charged by the plan sponsor, and Class F-1, F-2, F-3 and 529-F-1 shareholders may be subject to fees charged by financial intermediaries, typically ranging from 0.75% to 1.50% of assets annually depending on services offered. You can estimate the impact of these fees by adding the amount of the fees to the total estimated expenses you paid on your account during the period as calculated above. In addition, your ending account value would be lower by the amount of these fees.
Note that the expenses shown in the table on the following page are meant to highlight your ongoing costs only and do not reflect any transactional costs, such as sales charges (loads). Therefore, the second line of each share class in the table is useful in comparing ongoing costs only and will not help you determine the relative total costs of owning different funds. In addition, if these transactional costs were included, your costs would have been higher.
| 42 | EuroPacific Growth Fund |
| | | Beginning
account value
4/1/2019 | | | Ending
account value
9/30/2019 | | | Expenses paid
during period* | | | Annualized
expense ratio | |
| Class A – actual return | | $ | 1,000.00 | | | $ | 1,020.36 | | | $ | 4.25 | | | | .84 | % |
| Class A – assumed 5% return | | | 1,000.00 | | | | 1,020.86 | | | | 4.26 | | | | .84 | |
| Class C – actual return | | | 1,000.00 | | | | 1,016.51 | | | | 8.04 | | | | 1.59 | |
| Class C – assumed 5% return | | | 1,000.00 | | | | 1,017.10 | | | | 8.04 | | | | 1.59 | |
| Class T – actual return | | | 1,000.00 | | | | 1,021.77 | | | | 2.99 | | | | .59 | |
| Class T – assumed 5% return | | | 1,000.00 | | | | 1,022.11 | | | | 2.99 | | | | .59 | |
| Class F-1 – actual return | | | 1,000.00 | | | | 1,020.35 | | | | 4.36 | | | | .86 | |
| Class F-1 – assumed 5% return | | | 1,000.00 | | | | 1,020.76 | | | | 4.36 | | | | .86 | |
| Class F-2 – actual return | | | 1,000.00 | | | | 1,021.59 | | | | 2.99 | | | | .59 | |
| Class F-2 – assumed 5% return | | | 1,000.00 | | | | 1,022.11 | | | | 2.99 | | | | .59 | |
| Class F-3 – actual return | | | 1,000.00 | | | | 1,022.23 | | | | 2.43 | | | | .48 | |
| Class F-3 – assumed 5% return | | | 1,000.00 | | | | 1,022.66 | | | | 2.43 | | | | .48 | |
| Class 529-A – actual return | | | 1,000.00 | | | | 1,020.28 | | | | 4.46 | | | | .88 | |
| Class 529-A – assumed 5% return | | | 1,000.00 | | | | 1,020.66 | | | | 4.46 | | | | .88 | |
| Class 529-C – actual return | | | 1,000.00 | | | | 1,016.24 | | | | 8.19 | | | | 1.62 | |
| Class 529-C – assumed 5% return | | | 1,000.00 | | | | 1,016.95 | | | | 8.19 | | | | 1.62 | |
| Class 529-E – actual return | | | 1,000.00 | | | | 1,019.14 | | | | 5.57 | | | | 1.10 | |
| Class 529-E – assumed 5% return | | | 1,000.00 | | | | 1,019.55 | | | | 5.57 | | | | 1.10 | |
| Class 529-T – actual return | | | 1,000.00 | | | | 1,021.42 | | | | 3.24 | | | | .64 | |
| Class 529-T – assumed 5% return | | | 1,000.00 | | | | 1,021.86 | | | | 3.24 | | | | .64 | |
| Class 529-F-1 – actual return | | | 1,000.00 | | | | 1,021.26 | | | | 3.29 | | | | .65 | |
| Class 529-F-1 – assumed 5% return | | | 1,000.00 | | | | 1,021.81 | | | | 3.29 | | | | .65 | |
| Class R-1 – actual return | | | 1,000.00 | | | | 1,016.60 | | | | 7.99 | | | | 1.58 | |
| Class R-1 – assumed 5% return | | | 1,000.00 | | | | 1,017.15 | | | | 7.99 | | | | 1.58 | |
| Class R-2 – actual return | | | 1,000.00 | | | | 1,016.63 | | | | 7.94 | | | | 1.57 | |
| Class R-2 – assumed 5% return | | | 1,000.00 | | | | 1,017.20 | | | | 7.94 | | | | 1.57 | |
| Class R-2E – actual return | | | 1,000.00 | | | | 1,018.23 | | | | 6.48 | | | | 1.28 | |
| Class R-2E – assumed 5% return | | | 1,000.00 | | | | 1,018.65 | | | | 6.48 | | | | 1.28 | |
| Class R-3 – actual return | | | 1,000.00 | | | | 1,018.84 | | | | 5.72 | | | | 1.13 | |
| Class R-3 – assumed 5% return | | | 1,000.00 | | | | 1,019.40 | | | | 5.72 | | | | 1.13 | |
| Class R-4 – actual return | | | 1,000.00 | | | | 1,020.34 | | | | 4.20 | | | | .83 | |
| Class R-4 – assumed 5% return | | | 1,000.00 | | | | 1,020.91 | | | | 4.20 | | | | .83 | |
| Class R-5E – actual return | | | 1,000.00 | | | | 1,021.62 | | | | 3.14 | | | | .62 | |
| Class R-5E – assumed 5% return | | | 1,000.00 | | | | 1,021.96 | | | | 3.14 | | | | .62 | |
| Class R-5 – actual return | | | 1,000.00 | | | | 1,022.14 | | | | 2.69 | | | | .53 | |
| Class R-5 – assumed 5% return | | | 1,000.00 | | | | 1,022.41 | | | | 2.69 | | | | .53 | |
| Class R-6 – actual return | | | 1,000.00 | | | | 1,022.24 | | | | 2.43 | | | | .48 | |
| Class R-6 – assumed 5% return | | | 1,000.00 | | | | 1,022.66 | | | | 2.43 | | | | .48 | |
| * | The “expenses paid during period” are equal to the “annualized expense ratio,” multiplied by the average account value over the period, multiplied by the number of days in the period, and divided by 365 (to reflect the one-half year period). |
| EuroPacific Growth Fund | 43 |
Office of the fund
333 South Hope Street
Los Angeles, CA 90071-1406
Investment adviser
Capital Research and Management Company
333 South Hope Street
Los Angeles, CA 90071-1406
Transfer agent for shareholder accounts
American Funds Service Company
(Write to the address near you.)
P.O. Box 6007
Indianapolis, IN 46206-6007
P.O. Box 2280
Norfolk, VA 23501-2280
Custodian of assets
JPMorgan Chase Bank
270 Park Avenue
New York, NY 10017-2070
Counsel
Dechert LLP
One Bush Street, Suite 1600
San Francisco, CA 94104-4446
Independent registered public accounting firm
Deloitte & Touche LLP
695 Town Center Drive
Suite 1000
Costa Mesa, CA 92626-7188
Principal underwriter
American Funds Distributors, Inc.
333 South Hope Street
Los Angeles, CA 90071-1406
| 44 | EuroPacific Growth Fund |
Investors should carefully consider investment objectives, risks, charges and expenses. This and other important information is contained in the fund prospectus and summary prospectus, which can be obtained from your financial professional and should be read carefully before investing. You may also call American Funds Service Company (AFS) at (800) 421-4225 or visit the Capital Group website at capitalgroup.com.
“American Funds Proxy Voting Procedures and Principles” — which describes how we vote proxies relating to portfolio securities — is available on our website or upon request by calling AFS. The fund files its proxy voting record with the U.S. Securities and Exchange Commission (SEC) for the 12 months ended June 30 by August 31. The proxy voting record is available free of charge on the SEC website at sec.gov and on our website.
A complete September 30, 2019, portfolio of EuroPacific Growth Fund’s investments is available free of charge by calling AFS or visiting the SEC website (where it is part of Form N-CSR).
EuroPacific Growth Fund files a complete list of its portfolio holdings with the SEC for the first and third quarters of each fiscal year on Form N-PORT-EX. This filing is available free of charge on the SEC website. Additionally, the list of portfolio holdings is available by calling AFS.
This report is for the information of shareholders of EuroPacific Growth Fund, but it also may be used as sales literature when preceded or accompanied by the current prospectus or summary prospectus, which gives details about charges, expenses, investment objectives and operating policies of the fund. If used as sales material after December 31, 2019, this report must be accompanied by an American Funds statistical update for the most recently completed calendar quarter.
MSCI has not approved, reviewed or produced this report, makes no express or implied warranties or representations and is not liable whatsoever for any data in the report. You may not redistribute the MSCI data or use it as a basis for other indices or investment products.
American Funds Distributors, Inc., member FINRA.
The Capital Advantage®
Since 1931, Capital Group, home of American Funds, has helped investors pursue long-term investment success. Our consistent approach — in combination with The Capital SystemSM— has resulted in superior outcomes.
Aligned with investor success
We base our decisions on a long-term perspective, which we believe aligns our goals with the interests of our clients. Our portfolio managers average 27 years of investment experience, including 20 years at our company, reflecting a career commitment to our long-term approach.1
The Capital System
The Capital System combines individual accountability with teamwork. Funds using The Capital System are divided into portions that are managed independently by investment professionals with diverse backgrounds, ages and investment approaches. An extensive global research effort is the backbone of our system.
American Funds’ superior outcomes
Equity funds have beaten their Lipper peer indexes in 92% of 10-year periods and 99% of 20-year periods.2Fixed income funds have helped investors achieve diversification through attention to correlation between bonds and equities.3Fund management fees have been among the lowest in the industry.4
| | 1 | Portfolio manager experience as of December 31, 2018. |
| | 2 | Based on Class F-2 share results for rolling periods through December 31, 2018. Periods covered are the shorter of the fund’s lifetime or since the comparable Lipper index inception date (except Capital Income Builder and SMALLCAP World Fund, for which the Lipper average was used). Expenses differ for each share class, so results will vary. |
| | 3 | Based on Class F-2 share results, as of December 31, 2018. Fourteen of our 15 American Funds fixed income funds that have been in existence for the three-year period showed a three-year correlation below 0.2. Standard & Poor’s 500 Composite Index was used as an equity market proxy. Correlation based on monthly total returns. Correlation is a statistical measure of how two securities move in relation to each other. A correlation ranges from –1 to 1. A positive correlation close to 1 implies that as one security moves, either up or down, the other security will move in “lockstep,” in the same direction. A negative correlation close to –1 indicates that the securities have moved in the opposite direction. |
| | 4 | On average, our management fees were in the lowest quintile 70% of the time, based on the 20-year period ended December 31, 2018, versus comparable Lipper categories, excluding funds of funds. |
| | | |
| Class F-2 shares were first offered on August 1, 2008. Class F-2 share results prior to the date of first sale are hypothetical based on Class A share results without a sales charge, adjusted for typical estimated expenses. Results for certain funds with an inception date after August 1, 2008, also include hypothetical returns because those funds’ Class F-2 shares sold after the funds’ date of first offering. Please see capitalgroup.com for more information on specific expense adjustments and the actual dates of first sale. |
| |
| All Capital Group trademarks mentioned are owned by The Capital Group Companies, Inc., an affiliated company or fund. All other company and product names mentioned are the property of their respective companies. |

ITEM 2 – Code of Ethics
Not applicable for filing of semi-annual reports to shareholders.
ITEM 3 – Audit Committee Financial Expert
Not applicable for filing of semi-annual reports to shareholders.
ITEM 4 – Principal Accountant Fees and Services
Not applicable for filing of semi-annual reports to shareholders.
ITEM 5 – Audit Committee of Listed Registrants
Not applicable to this Registrant, insofar as the Registrant is not a listed issuer as defined in Rule 10A-3 under the Securities Exchange Act of 1934.
ITEM 6 – Schedule of Investments

EuroPacific Growth Fund®
Investment portfolio
September 30, 2019
unaudited
Common stocks 89.91%
Financials 15.57% | Shares | Value
(000) |
| HDFC Bank Ltd. | 211,861,504 | $3,669,449 |
| HDFC Bank Ltd. (ADR) | 12,206,296 | 696,369 |
| AIA Group Ltd. | 429,917,600 | 4,061,829 |
| Kotak Mahindra Bank Ltd. | 94,883,478 | 2,201,690 |
| Prudential PLC | 55,816,599 | 1,012,282 |
| B3 SA - Brasil, Bolsa, Balcao | 87,375,000 | 917,501 |
| London Stock Exchange Group PLC | 9,464,216 | 850,412 |
| Barclays PLC | 418,872,724 | 774,598 |
| Sberbank of Russia PJSC (ADR) | 53,567,881 | 759,325 |
| Ping An Insurance (Group) Co. of China, Ltd., Class H | 53,587,499 | 615,685 |
| Ping An Insurance (Group) Co. of China, Ltd., Class A | 8,178,157 | 99,718 |
| DBS Group Holdings Ltd. | 35,615,000 | 644,196 |
| Brookfield Asset Management Inc., Class A | 11,130,023 | 590,893 |
| Axis Bank Ltd. | 56,891,711 | 549,901 |
| Housing Development Finance Corp. Ltd. | 18,926,695 | 528,004 |
| Bank Central Asia Tbk PT | 244,850,000 | 523,508 |
| PICC Property and Casualty Co. Ltd., Class H | 423,721,869 | 494,667 |
| ICICI Bank Ltd. | 77,795,000 | 476,087 |
| UniCredit SpA | 36,169,728 | 426,559 |
| IndusInd Bank Ltd. | 20,150,894 | 393,400 |
| Toronto-Dominion Bank (CAD denominated) | 6,729,397 | 392,381 |
| Deutsche Boerse AG | 2,330,264 | 364,217 |
| Agricultural Bank of China Ltd., Class H | 662,316,000 | 259,427 |
| FinecoBank SpA | 24,039,406 | 254,471 |
| Capitec Bank Holdings Ltd. | 2,909,957 | 247,368 |
| Zurich Insurance Group AG | 638,780 | 244,491 |
| The People’s Insurance Co. (Group) of China Ltd., Class H | 576,766,215 | 231,069 |
| 3i Group PLC | 11,917,901 | 170,935 |
| Fairfax Financial Holdings Ltd., subordinate voting shares (CAD denominated) | 250,326 | 110,345 |
| Fairfax Financial Holdings Ltd., subordinate voting shares | 123,957 | 54,662 |
| Banco Santander, SA | 39,199,422 | 159,643 |
| BNP Paribas SA | 3,198,882 | 155,747 |
| Türkiye Garanti Bankasi AS1 | 73,165,938 | 132,287 |
| Hong Kong Exchanges and Clearing Ltd. | 4,232,200 | 124,195 |
| Banco BPM SpA | 59,907,284 | 122,365 |
| Bank of China Ltd., Class H | 302,585,000 | 118,908 |
| BB Seguridade Participações SA | 13,844,900 | 116,725 |
| Sony Financial Holdings Inc. | 5,272,300 | 114,199 |
| Bank of Ireland Group PLC | 27,778,022 | 110,510 |
| Eurobank Ergasias SA1 | 108,567,816 | 105,080 |
| Royal Bank of Canada | 1,247,640 | 101,207 |
| Metropolitan Bank & Trust Co. | 72,865,122 | 96,160 |
| Macquarie Group Ltd. | 982,354 | 86,911 |
| Société Générale | 3,170,000 | 86,862 |
| Hiscox Ltd. | 4,044,516 | 82,551 |
| KB Financial Group Inc. | 1,891,600 | 67,526 |
| Burford Capital Ltd. | 6,522,433 | 66,082 |
EuroPacific Growth Fund — Page 1 of 9
unaudited
Common stocks (continued)
Financials (continued) | Shares | Value
(000) |
| Credit Suisse Group AG | 5,085,258 | $62,340 |
| Hargreaves Lansdown PLC | 1,929,338 | 49,318 |
| Akbank TAS1 | 32,412,701 | 46,607 |
| BOC Hong Kong (Holdings) Ltd. | 10,829,235 | 36,753 |
| HDFC Life Insurance Co. Ltd. | 2,307,527 | 19,574 |
| | | 24,676,989 |
| Consumer discretionary 13.54% | | |
| Alibaba Group Holding Ltd. (ADR)1 | 20,114,042 | 3,363,671 |
| MercadoLibre, Inc.1,2 | 3,570,301 | 1,968,057 |
| LVMH Moët Hennessy-Louis Vuitton SE | 4,623,547 | 1,837,630 |
| adidas AG | 4,334,468 | 1,349,512 |
| Galaxy Entertainment Group Ltd. | 211,181,000 | 1,313,532 |
| Sony Corp. | 19,034,500 | 1,117,336 |
| EssilorLuxottica | 7,329,559 | 1,056,526 |
| Meituan Dianping, Class B1 | 81,882,758 | 836,828 |
| Kering SA | 1,282,266 | 653,451 |
| Melco Resorts & Entertainment Ltd. (ADR)2 | 32,783,841 | 636,334 |
| Industria de Diseño Textil, SA | 18,631,818 | 576,740 |
| Naspers Ltd., Class N | 3,697,747 | 560,351 |
| Sands China Ltd. | 117,536,800 | 532,370 |
| Hyundai Motor Co. | 4,647,572 | 520,649 |
| Nitori Holdings Co., Ltd. | 3,012,700 | 440,516 |
| Just Eat PLC1,2 | 46,280,350 | 380,233 |
| Ryohin Keikaku Co., Ltd.2 | 18,201,000 | 339,696 |
| Hermès International | 461,661 | 319,021 |
| Suzuki Motor Corp. | 7,323,300 | 310,677 |
| Rakuten, Inc. | 31,146,900 | 306,788 |
| Carnival Corp., units | 6,612,662 | 289,039 |
| Maruti Suzuki India Ltd. | 3,036,840 | 287,783 |
| Prosus NV1 | 3,839,259 | 281,833 |
| Fast Retailing Co., Ltd. | 455,800 | 270,677 |
| Takeaway.com NV1,2 | 3,167,940 | 252,752 |
| GVC Holdings PLC | 25,011,798 | 228,620 |
| Accor SA | 5,224,927 | 217,830 |
| Flutter Entertainment PLC | 2,319,434 | 216,807 |
| ASOS PLC1,2 | 4,497,387 | 136,917 |
| Hyundai Mobis Co., Ltd. | 547,600 | 115,366 |
| Ctrip.com International, Ltd. (ADR)1 | 3,305,808 | 96,827 |
| Eicher Motors Ltd. | 384,086 | 96,282 |
| Melco International Development Ltd. | 39,585,000 | 94,143 |
| Wynn Macau, Ltd. | 46,209,600 | 90,206 |
| Ferrari NV | 573,000 | 88,404 |
| Huazhu Group Ltd. (ADR) | 2,496,647 | 82,439 |
| Valeo SA, non-registered shares | 2,224,010 | 72,116 |
| William Hill PLC | 24,423,219 | 56,350 |
| Peugeot SA | 1,862,934 | 46,458 |
| Li & Fung Ltd. | 55,698,000 | 6,325 |
| Burberry Group PLC | 92,743 | 2,479 |
| HUGO BOSS AG | 39,040 | 2,091 |
| | | 21,451,662 |
EuroPacific Growth Fund — Page 2 of 9
unaudited
Common stocks (continued)
Information technology 13.05% | Shares | Value
(000) |
| ASML Holding NV | 12,454,648 | $3,084,906 |
| Samsung Electronics Co., Ltd. | 62,352,400 | 2,556,858 |
| Taiwan Semiconductor Manufacturing Co., Ltd.3 | 232,275,329 | 2,034,175 |
| Taiwan Semiconductor Manufacturing Co., Ltd. (ADR) | 8,225,369 | 382,315 |
| SK hynix, Inc. | 26,363,000 | 1,811,678 |
| Keyence Corp. | 2,915,200 | 1,803,717 |
| PagSeguro Digital Ltd., Class A1,2 | 26,160,112 | 1,211,475 |
| Amadeus IT Group SA, Class A, non-registered shares | 15,703,586 | 1,124,872 |
| SAP SE | 9,335,503 | 1,097,704 |
| Tokyo Electron Ltd. | 3,724,000 | 708,292 |
| Halma PLC2 | 24,676,946 | 598,032 |
| Fidelity National Information Services, Inc. | 3,724,217 | 494,427 |
| Temenos AG | 2,784,037 | 465,843 |
| Capgemini SE | 3,714,654 | 437,674 |
| Worldline SA, non-registered shares1 | 6,919,350 | 436,667 |
| Hexagon AB, Class B | 6,737,775 | 324,841 |
| Largan Precision Co., Ltd.3 | 1,840,000 | 263,419 |
| WiseTech Global Ltd. | 10,478,748 | 245,632 |
| Xiaomi Corp., Class B1 | 174,055,600 | 195,426 |
| Adyen NV1 | 239,355 | 157,679 |
| Infosys Ltd. | 13,425,000 | 152,618 |
| Nice Ltd. (ADR)1 | 724,277 | 104,151 |
| Nice Ltd.1,3 | 254,028 | 36,239 |
| Murata Manufacturing Co., Ltd. | 2,827,400 | 135,584 |
| Infineon Technologies AG | 6,694,968 | 120,491 |
| OBIC Co., Ltd. | 1,048,363 | 119,453 |
| Shimadzu Corp. | 4,271,300 | 107,765 |
| TravelSky Technology Ltd., Class H | 48,592,000 | 100,932 |
| Hamamatsu Photonics KK | 2,415,574 | 89,586 |
| Nomura Research Institute, Ltd. | 4,085,000 | 81,265 |
| Hangzhou Hikvision Digital Technology Co., Ltd., Class A | 17,699,965 | 80,089 |
| STMicroelectronics NV | 3,800,000 | 73,434 |
| StoneCo Ltd., Class A1 | 1,368,345 | 47,591 |
| | | 20,684,830 |
| Industrials 11.25% | | |
| Airbus SE, non-registered shares | 31,874,875 | 4,141,249 |
| Recruit Holdings Co., Ltd. | 54,320,101 | 1,650,829 |
| Safran SA | 6,413,653 | 1,009,787 |
| Melrose Industries PLC2 | 339,320,636 | 841,099 |
| MTU Aero Engines AG2 | 2,850,916 | 757,573 |
| International Consolidated Airlines Group, SA (CDI)2 | 128,758,881 | 751,999 |
| Rolls-Royce Holdings PLC1 | 63,312,197 | 616,848 |
| Komatsu Ltd. | 26,681,332 | 610,740 |
| DSV A/S | 6,336,544 | 602,947 |
| Rentokil Initial PLC2 | 97,522,996 | 560,936 |
| SMC Corp. | 1,280,100 | 545,781 |
| Nidec Corp. | 4,017,400 | 539,493 |
| Edenred SA | 10,047,937 | 482,205 |
| DCC PLC2 | 5,029,042 | 438,778 |
| Adani Ports & Special Economic Zone Ltd. | 71,362,809 | 416,836 |
| Knorr-Bremse AG, non-registered shares | 3,946,662 | 370,976 |
| Airports of Thailand PCL, foreign registered | 145,308,600 | 355,135 |
| Spirax-Sarco Engineering PLC | 2,661,276 | 256,702 |
| Rheinmetall AG | 1,975,878 | 249,926 |
EuroPacific Growth Fund — Page 3 of 9
unaudited
Common stocks (continued)
Industrials (continued) | Shares | Value
(000) |
| Experian PLC | 7,674,601 | $245,250 |
| Thales SA | 2,120,788 | 243,869 |
| Jardine Matheson Holdings Ltd. | 4,356,200 | 233,057 |
| SK Holdings Co., Ltd. | 1,351,955 | 230,572 |
| Shanghai International Airport Co., Ltd., Class A | 20,000,244 | 223,526 |
| NIBE Industrier AB, Class B | 13,953,735 | 176,972 |
| CCR SA, ordinary nominative | 39,721,300 | 164,910 |
| Ayala Corp. | 9,359,210 | 159,719 |
| Kone OYJ, Class B | 2,702,480 | 153,876 |
| Eiffage SA | 1,381,778 | 143,257 |
| VINCI SA | 1,277,577 | 137,606 |
| Bunzl PLC | 5,177,868 | 135,287 |
| Aalberts NV, non-registered shares | 2,941,045 | 116,555 |
| Rational AG | 144,051 | 103,312 |
| DP World PLC | 5,579,563 | 78,058 |
| Kingspan Group PLC | 885,293 | 43,229 |
| Alliance Global Group, Inc. | 123,500,000 | 25,972 |
| Ryanair Holdings PLC (ADR)1 | 288,787 | 19,170 |
| | | 17,834,036 |
| Health care 8.94% | | |
| Daiichi Sankyo Co., Ltd.2 | 39,235,300 | 2,468,966 |
| Novartis AG | 20,069,961 | 1,740,248 |
| AstraZeneca PLC | 12,344,525 | 1,102,090 |
| Chugai Pharmaceutical Co., Ltd. | 13,039,758 | 1,013,031 |
| Koninklijke Philips NV | 17,999,428 | 833,785 |
| Takeda Pharmaceutical Co. Ltd. | 21,638,353 | 738,456 |
| Alcon Inc.1 | 11,532,569 | 672,507 |
| CSL Ltd. | 4,147,828 | 654,233 |
| HOYA Corp. | 6,949,051 | 566,785 |
| Fresenius SE & Co. KGaA | 11,378,354 | 531,977 |
| Hikma Pharmaceuticals PLC2 | 14,575,787 | 394,277 |
| Teva Pharmaceutical Industries Ltd. (ADR)1,2 | 55,840,760 | 384,184 |
| Grifols, SA, Class A, non-registered shares | 9,933,807 | 292,772 |
| Grifols, SA, Class B (ADR) | 3,531,965 | 70,780 |
| NMC Health PLC | 9,611,214 | 320,253 |
| Aier Eye Hospital Group Co., Ltd., Class A | 60,637,028 | 301,299 |
| Bayer AG | 3,160,531 | 222,845 |
| Novo Nordisk A/S, Class B | 4,301,913 | 221,158 |
| Galapagos NV1 | 1,346,374 | 205,154 |
| Asahi Intecc Co., Ltd. | 7,621,000 | 199,961 |
| Merck KGaA | 1,680,786 | 189,334 |
| Fresenius Medical Care AG & Co. KGaA | 2,391,559 | 160,832 |
| M3, Inc. | 6,083,600 | 146,400 |
| Coloplast A/S, Class B | 1,037,053 | 124,901 |
| Straumann Holding AG | 149,597 | 122,280 |
| Fisher & Paykel Healthcare Corp. Ltd. | 9,834,709 | 106,542 |
| WuXi Biologics (Cayman) Inc.1 | 10,301,847 | 105,152 |
| bioMérieux SA | 1,112,101 | 92,001 |
| GW Pharmaceuticals PLC (ADR)1 | 521,096 | 59,942 |
| Argenx SE (ADR)1 | 445,882 | 50,813 |
| Hypera SA, ordinary nominative | 4,986,500 | 40,241 |
| Demant A/S1 | 1,564,953 | 40,084 |
| | | 14,173,283 |
EuroPacific Growth Fund — Page 4 of 9
unaudited
Common stocks (continued)
Materials 7.47% | Shares | Value
(000) |
| Vale SA, ordinary nominative (ADR) | 183,692,520 | $2,112,464 |
| Vale SA, ordinary nominative | 53,432,374 | 614,062 |
| Koninklijke DSM NV | 7,680,931 | 924,250 |
| Sika AG | 5,370,054 | 785,560 |
| Asahi Kasei Corp.2 | 77,119,742 | 758,894 |
| Teck Resources Ltd., Class B | 42,345,128 | 686,548 |
| Chr. Hansen Holding A/S2 | 7,294,354 | 619,119 |
| Rio Tinto PLC | 10,631,366 | 550,192 |
| First Quantum Minerals Ltd.2 | 55,002,342 | 462,072 |
| Shin-Etsu Chemical Co., Ltd. | 4,096,400 | 437,960 |
| ArcelorMittal SA | 29,773,624 | 418,822 |
| Akzo Nobel NV | 3,920,153 | 349,470 |
| CCL Industries Inc., Class B, nonvoting shares | 8,177,974 | 329,872 |
| Linde PLC (EUR denominated) | 1,645,627 | 319,270 |
| Linde PLC | 42,486 | 8,230 |
| Fortescue Metals Group Ltd. | 47,580,687 | 282,608 |
| Glencore PLC | 91,717,974 | 276,009 |
| Agnico Eagle Mines Ltd. | 4,989,972 | 267,512 |
| LafargeHolcim Ltd. | 4,809,879 | 236,723 |
| HeidelbergCement AG | 2,663,510 | 192,533 |
| Yara International ASA | 3,622,244 | 155,996 |
| Evonik Industries AG | 6,303,778 | 155,624 |
| CRH PLC | 4,392,039 | 151,225 |
| UltraTech Cement Ltd. | 2,112,000 | 129,376 |
| Indorama Ventures PCL, foreign registered | 113,236,600 | 120,327 |
| Barrick Gold Corp. | 6,931,331 | 120,120 |
| Givaudan SA | 40,500 | 112,972 |
| Aluminum Corp. of China Ltd., Class H1 | 255,668,000 | 80,572 |
| BASF SE | 1,013,770 | 70,850 |
| MMG Ltd.1 | 268,572,554 | 63,394 |
| Hindalco Industries Ltd. | 16,253,000 | 43,884 |
| | | 11,836,510 |
| Consumer staples 5.48% | | |
| Nestlé SA | 12,265,366 | 1,330,689 |
| Kweichow Moutai Co., Ltd., Class A | 5,335,275 | 859,516 |
| Pernod Ricard SA | 4,392,773 | 782,343 |
| British American Tobacco PLC | 19,516,434 | 721,693 |
| KOSÉ Corp.2 | 3,452,300 | 582,700 |
| Thai Beverage PCL | 765,139,800 | 489,924 |
| JBS SA, ordinary nominative | 54,094,704 | 426,904 |
| Associated British Foods PLC | 15,053,939 | 426,275 |
| Kirin Holdings Co., Ltd. | 19,298,745 | 408,375 |
| Treasury Wine Estates Ltd. | 27,899,590 | 349,688 |
| Kao Corp. | 4,574,800 | 337,805 |
| Anheuser-Busch InBev SA/NV | 3,351,840 | 319,375 |
| CP ALL PCL, foreign registered | 93,468,566 | 248,302 |
| Uni-Charm Corp. | 6,914,400 | 218,703 |
| Coca-Cola European Partners PLC | 3,598,000 | 199,509 |
| Ambev SA | 41,116,000 | 190,492 |
| Alimentation Couche-Tard Inc., Class B | 4,986,570 | 152,813 |
| LG Household & Health Care Ltd. | 123,000 | 134,399 |
| Wal-Mart de México, SAB de CV, Series V | 36,212,000 | 107,311 |
| Coca-Cola HBC AG (CDI) | 3,015,876 | 98,526 |
| Philip Morris International Inc. | 1,071,115 | 81,330 |
EuroPacific Growth Fund — Page 5 of 9
unaudited
Common stocks (continued)
Consumer staples (continued) | Shares | Value
(000) |
| Shiseido Co., Ltd. | 985,500 | $78,649 |
| Budweiser Brewing Co., APAC Ltd.1 | 21,000,000 | 75,628 |
| Glanbia PLC | 5,203,028 | 64,650 |
| WH Group Ltd. | 6,970,000 | 6,243 |
| | | 8,691,842 |
| Energy 5.31% | | |
| Reliance Industries Ltd. | 200,935,942 | 3,777,359 |
| Cenovus Energy Inc. (CAD denominated)2 | 86,718,436 | 813,609 |
| Petróleo Brasileiro SA (Petrobras), ordinary nominative (ADR) | 53,126,910 | 768,746 |
| Canadian Natural Resources, Ltd. (CAD denominated) | 23,434,108 | 623,506 |
| Canadian Natural Resources, Ltd. | 4,330,337 | 115,317 |
| Royal Dutch Shell PLC, Class B | 11,054,771 | 325,674 |
| Royal Dutch Shell PLC, Class A (GBP denominated) | 10,488,726 | 307,450 |
| Royal Dutch Shell PLC, Class A (EUR denominated) | 122,650 | 3,596 |
| Oil Search Ltd.2 | 98,841,584 | 488,340 |
| TOTAL SA | 6,490,637 | 338,761 |
| Suncor Energy Inc. | 6,146,525 | 193,881 |
| Tourmaline Oil Corp.2 | 16,502,553 | 163,300 |
| Ultrapar Participacoes SA, ordinary nominative | 30,584,000 | 136,102 |
| Saipem SpA, Class S1 | 28,172,263 | 127,493 |
| BP PLC | 14,494,708 | 91,926 |
| Novatek PJSC (GDR) | 393,992 | 79,902 |
| CNOOC Ltd. | 38,696,000 | 59,049 |
| | | 8,414,011 |
| Communication services 5.11% | | |
| Nintendo Co., Ltd.2 | 10,331,826 | 3,824,089 |
| Tencent Holdings Ltd. | 41,134,911 | 1,733,002 |
| SoftBank Group Corp. | 27,200,100 | 1,066,621 |
| Altice Europe NV, Class A1,2 | 68,629,353 | 359,052 |
| Altice Europe NV, Class B1,2 | 14,738,174 | 77,107 |
| United Internet AG | 5,061,368 | 180,560 |
| Cellnex Telecom, SA, non-registered shares | 3,583,209 | 148,019 |
| ITV PLC | 92,234,482 | 142,779 |
| Koninklijke KPN NV | 36,377,176 | 113,437 |
| América Móvil, SAB de CV, Series L (ADR) | 5,858,041 | 87,050 |
| América Móvil, SAB de CV, Series L | 18,821,401 | 13,963 |
| Nippon Telegraph and Telephone Corp. | 1,644,500 | 78,419 |
| Axel Springer SE1 | 960,481 | 65,953 |
| LG Uplus Corp. | 5,053,000 | 57,663 |
| YY Inc., Class A (ADR)1 | 853,701 | 48,004 |
| Yandex NV, Class A1 | 1,341,387 | 46,962 |
| TalkTalk Telecom Group PLC | 35,403,645 | 45,707 |
| ProSiebenSat.1 Media SE | 952,434 | 13,122 |
| | | 8,101,509 |
| Utilities 2.98% | | |
| Ørsted AS | 17,373,818 | 1,614,636 |
| China Gas Holdings Ltd. | 207,466,600 | 802,051 |
| ENN Energy Holdings Ltd.2 | 72,941,000 | 754,751 |
| China Resources Gas Group Ltd.2 | 130,122,000 | 643,330 |
| Enel SpA | 78,250,000 | 584,312 |
EuroPacific Growth Fund — Page 6 of 9
unaudited
Common stocks (continued)
Utilities (continued) | Shares | Value
(000) |
| E.ON SE | 18,014,480 | $175,124 |
| Guangdong Investment Ltd. | 76,294,000 | 149,323 |
| | | 4,723,527 |
| Real estate 1.21% | | |
| China Overseas Land & Investment Ltd. | 198,932,000 | 625,652 |
| Ayala Land, Inc. | 390,814,709 | 372,869 |
| Sun Hung Kai Properties Ltd. | 13,402,583 | 192,890 |
| Vonovia SE | 3,350,000 | 169,969 |
| Vinhomes JSC | 33,474,875 | 128,844 |
| Longfor Group Holdings Ltd. | 34,199,500 | 127,849 |
| CK Asset Holdings Ltd. | 18,420,500 | 124,798 |
| China Resources Land Ltd. | 27,882,639 | 116,864 |
| Central Pattana PCL, foreign registered | 23,882,900 | 53,099 |
| | | 1,912,834 |
| Total common stocks(cost: $102,273,546,000) | | 142,501,033 |
Preferred securities 1.37%
Financials 0.45% | | |
| Itaú Unibanco Holding SA, preferred nominative (ADR) | 84,467,457 | 710,371 |
| Consumer discretionary 0.42% | | |
| Volkswagen AG, nonvoting preferred shares | 3,886,532 | 661,090 |
| Health care 0.38% | | |
| Sartorius AG, nonvoting preferred, non-registered shares | 1,849,400 | 337,437 |
| Grifols, SA, Class B, nonvoting preferred, non-registered shares | 13,415,022 | 271,087 |
| | | 608,524 |
| Energy 0.07% | | |
| Petróleo Brasileiro SA (Petrobras), preferred nominative (ADR) | 8,271,482 | 108,687 |
| Information technology 0.05% | | |
| Samsung Electronics Co., Ltd., nonvoting preferred shares | 2,440,000 | 80,575 |
| Real estate 0.00% | | |
| Ayala Land, Inc., preference shares1,3,4 | 481,283,600 | 836 |
| Total preferred securities(cost: $1,963,177,000) | | 2,170,083 |
Rights & warrants 0.08%
Health care 0.08% | | |
| WuXi AppTec Co., Ltd., Class A, warrants, expire 20203,5 | 10,939,880 | 120,913 |
| Total rights & warrants(cost: $83,560,000) | | 120,913 |
EuroPacific Growth Fund — Page 7 of 9
unaudited
Bonds, notes & other debt instruments 0.07%
U.S. Treasury bonds & notes 0.06%
U.S. Treasury 0.06% | Principal amount
(000) | Value
(000) |
| U.S. Treasury 1.50% 20196 | $100,000 | $99,969 |
| Total U.S. Treasury bonds & notes | | 99,969 |
Corporate bonds & notes 0.01%
Financials 0.01% | | |
| UniCredit SpA 5.861% 20325,7 | 5,890 | 6,077 |
| Total corporate bonds & notes | | 6,077 |
| Bonds & notes of governments & government agencies outside the U.S. 0.00% | | |
| Argentine Republic (Argentina Central Bank 7D Repo Reference Rate) 67.42% 20208 | ARS115,723 | 857 |
| Argentine Republic (Badlar Private Banks ARS Index + 2.00%) 52.006% 20228 | 305,565 | 2,373 |
| | | 3,230 |
| Total bonds, notes & other debt instruments(cost: $116,788,000) | | 109,276 |
Short-term securities 8.22%
Money market investments 8.12% | Shares | |
| Capital Group Central Cash Fund 2.07%2,9 | 128,659,990 | 12,864,712 |
| Other short-term securities 0.10% | Principal amount
(000) | |
| Argentinian Treasury Bills (17.02%)–62.96%due 8/30/2019–7/31/202010 | ARS15,288,341 | 164,264 |
| Total short-term securities(cost: $13,310,682,000) | | 13,028,976 |
| Total investment securities 99.65%(cost: $117,747,753,000) | | 157,930,281 |
| Other assets less liabilities 0.35% | | 557,414 |
| Net assets 100.00% | | $158,487,695 |
Forward currency contracts
| Contract amount | Counterparty | Settlement
date | Unrealized
appreciation
(depreciation)
at 9/30/2019
(000) |
Purchases
(000) | Sales
(000) |
| USD71,199 | GBP57,139 | Citibank | 10/18/2019 | $888 |
| USD82,509 | INR5,925,000 | HSBC Bank | 10/18/2019 | (929) |
| USD40,614 | INR2,925,000 | JPMorgan Chase | 10/21/2019 | (562) |
| USD62,748 | INR4,462,500 | Citibank | 10/29/2019 | (13) |
| USD125,826 | GBP100,572 | Citibank | 11/6/2019 | 1,972 |
| | | | | $1,356 |
EuroPacific Growth Fund — Page 8 of 9
unaudited
The following footnotes apply to either the individual securities noted or one or more of the securities aggregated and listed as a single line item.
| 1 | Security did not produce income during the last 12 months. |
| 2 | Represents an affiliated company as defined under the Investment Company Act of 1940. |
| 3 | Valued under fair value procedures adopted by authority of the board of trustees. The total value of all such securities was $2,455,582,000, which represented 1.55% of the net assets of the fund. This amount includes $36,239,000 related to certain securities trading outside the U.S. whose values were adjusted as a result of significant market movements following the close of local trading. |
| 4 | Value determined using significant unobservable inputs. |
| 5 | Acquired in a transaction exempt from registration under Rule 144A of the Securities Act of 1933. May be resold in the U.S. in transactions exempt from registration, normally to qualified institutional buyers. The total value of all such securities was $126,990,000, which represented .08% of the net assets of the fund. |
| 6 | All or a portion of this security was pledged as collateral. The total value of pledged collateral was $1,836,000, which represented less than .01% of the net assets of the fund. |
| 7 | Step bond; coupon rate may change at a later date. |
| 8 | Coupon rate may change periodically. |
| 9 | Rate represents the seven-day yield at 9/30/2019. |
| 10 | Scheduled interest and/or principal payment was not received. |
| Key to abbreviations and symbol |
| ADR = American Depositary Receipts |
| ARS = Argentine pesos |
| CAD = Canadian dollars |
| CDI = CREST Depository Interest |
| EUR = Euros |
| GBP = British pounds |
| GDR = Global Depositary Receipts |
| INR = Indian rupees |
| USD/$ = U.S. dollars |
Additional financial disclosures are included in the fund’s current shareholder report and should be read in conjunction with this report.
Investments are not FDIC-insured, nor are they deposits of or guaranteed by a bank or any other entity, so they may lose value.
Investors should carefully consider investment objectives, risks, charges and expenses. This and other important information is contained in the fund prospectus and summary prospectus, which can be obtained from your financial professional and should be read carefully before investing. You may also call American Funds Service Company (AFS) at (800) 421-4225 or visit the Capital Group website at capitalgroup.com.
All Capital Group trademarks mentioned are owned by The Capital Group Companies, Inc., an affiliated company or fund. All other company and product names mentioned are the property of their respective companies.
American Funds Distributors, Inc., member FINRA.
© 2019 Capital Group. All rights reserved.
| MFGEFPX-016-1119O-S73113 | EuroPacific Growth Fund — Page 9 of 9 |
ITEM 7 – Disclosure of Proxy Voting Policies and Procedures for Closed-End Management Investment Companies
Not applicable to this Registrant, insofar as the Registrant is not a closed-end management investment company.
ITEM 8 – Portfolio Managers of Closed-End Management Investment Companies
Not applicable to this Registrant, insofar as the Registrant is not a closed-end management investment company.
ITEM 9 – Purchases of Equity Securities by Closed-End Management Investment Company and Affiliated Purchasers
Not applicable to this Registrant, insofar as the Registrant is not a closed-end management investment company.
ITEM 10 – Submission of Matters to a Vote of Security Holders
There have been no material changes to the procedures by which shareholders may recommend nominees to the Registrant’s board of trustees since the Registrant last submitted a proxy statement to its shareholders. The procedures are as follows. The Registrant has a nominating and governance committee comprised solely of persons who are not considered ‘‘interested persons’’ of the Registrant within the meaning of the Investment Company Act of 1940, as amended. The committee periodically reviews such issues as the board’s composition, responsibilities, committees, compensation and other relevant issues, and recommends any appropriate changes to the full board of trustees. While the committee normally is able to identify from its own resources an ample number of qualified candidates, it will consider shareholder suggestions of persons to be considered as nominees to fill future vacancies on the board. Such suggestions must be sent in writing to the nominating and governance committee of the Registrant, c/o the Registrant’s Secretary, and must be accompanied by complete biographical and occupational data on the prospective nominee, along with a written consent of the prospective nominee for consideration of his or her name by the nominating and governance committee.
ITEM 11 – Controls and Procedures
| (a) | The Registrant’s Principal Executive Officer and Principal Financial Officer have concluded, based on their evaluation of the Registrant’s disclosure controls and procedures (as such term is defined in Rule 30a-3 under the Investment Company Act of 1940), that such controls and procedures are adequate and reasonably designed to achieve the purposes described in paragraph (c) of such rule. |
| | |
| (b) | There were no changes in the Registrant’s internal controls over financial reporting (as defined in Rule 30a-3(d) under the Investment Company Act of 1940) that occurred during the Registrant’s semi-annual period covered by this report that has materially affected, or is reasonably likely to materially affect, the Registrant’s internal control over financial reporting. |
ITEM 12 – Exhibits
| (a)(1) | Not applicable for filing of semi-annual reports to shareholders. |
| | |
| (a)(2) | The certifications required by Rule 30a-2 of the Investment Company Act of 1940 and Sections 302 and 906 of the Sarbanes-Oxley Act of 2002 are attached as exhibits hereto. |
SIGNATURES
Pursuant to the requirements of the Securities Exchange Act of 1934 and the Investment Company Act of 1940, the Registrant has duly caused this report to be signed on its behalf by the undersigned, thereunto duly authorized.
| | EUROPACIFIC GROWTH FUND |
| | |
| | By__/s/ Walter R. Burkley____________________ |
| | Walter R. Burkley, Executive Vice President and Principal Executive Officer |
| | |
| | Date: November 29, 2019 |
Pursuant to the requirements of the Securities Exchange Act of 1934 and the Investment Company Act of 1940, this report has been signed below by the following persons on behalf of the Registrant and in the capacities and on the dates indicated.
| By__/s/ Walter R. Burkley_________________ |
Walter R. Burkley, Executive Vice President and Principal Executive Officer |
| |
| Date: November 29, 2019 |
| By ___/s/ Brian C. Janssen __________ |
Brian C. Janssen, Treasurer and Principal Financial Officer |
| |
| Date: November 29, 2019 |