UNITED STATES
SECURITIES AND EXCHANGE COMMISSION
Washington, D.C. 20549
FORM N-CSR
Certified Shareholder Report of
Registered Management Investment Companies
Investment Company Act File Number: 811-03735
The New Economy Fund
(Exact Name of Registrant as Specified in Charter)
333 South Hope Street
Los Angeles, California 90071
(Address of Principal Executive Offices)
Registrant's telephone number, including area code: (949) 975-5000
Date of fiscal year end: November 30
Date of reporting period: November 30, 2019
Gregory F. Niland
The New Economy Fund
5300 Robin Hood Road
Norfolk, Virginia 23513
(Name and Address of Agent for Service)
ITEM 1 – Reports to Stockholders
The New Economy Fund® Annual report
for the year ended
November 30, 2019 |  |

We believe in investing
in global companies
that will help shape
our future.
Beginning January 1, 2021, as permitted by regulations adopted by the U.S. Securities and Exchange Commission, we intend to no longer mail paper copies of the fund’s shareholder reports, unless specifically requested from American Funds or your financial intermediary, such as a broker-dealer or bank. Instead, the reports will be made available on the Capital Group website (capitalgroup.com); you will be notified by mail and provided with a website link to access the report each time a report is posted. If you have already elected to receive shareholder reports electronically, you will not be affected by this change and do not need to take any action. If you prefer to receive shareholder reports and other communications electronically, you may update your mailing preferences with your financial intermediary, or enroll in e-delivery at capitalgroup.com (for accounts held directly with the fund).
You may elect to receive paper copies of all future reports free of charge. If you invest through a financial intermediary, you may contact your financial intermediary to request that you continue to receive paper copies of your shareholder reports. If you invest directly with the fund, you may inform American Funds that you wish to continue receiving paper copies of your shareholder reports by contacting us at (800) 421-4225. Your election to receive paper reports will apply to all funds held with American Funds or through your financial intermediary.
The New Economy Fund seeks long-term growth of capital. Current income is a secondary consideration.
This fund is one of more than 40 offered by Capital Group, home of American Funds, one of the nation’s largest mutual fund families. For more than 85 years, Capital Group has invested with a long-term focus based on thorough research and attention to risk.
Fund results shown in this report, unless otherwise indicated, are for Class A shares at net asset value. If a sales charge (maximum 5.75%) had been deducted, the results would have been lower. Results are for past periods and are not predictive of results for future periods. Current and future results may be lower or higher than those shown. Share prices and returns will vary, so investors may lose money. Investing for short periods makes losses more likely. For current information and month-end results, visit capitalgroup.com.
Here are the average annual total returns on a $1,000 investment with all distributions reinvested for periods ended December 31, 2019 (the most recent calendar quarter-end):
| Class A shares | | 1 year | | 5 years | | 10 years |
| | | | | | | |
| Reflecting 5.75% maximum sales charge | | 19.17% | | 10.23% | | 12.46% |
For other share class results, visit capitalgroup.com and americanfundsretirement.com.
The total annual fund operating expense ratio is 0.80% for Class A shares as of the prospectus dated February 1, 2020 (unaudited). The expense ratio is restated to reflect current fees.
Investment results assume all distributions are reinvested and reflect applicable fees and expenses. When applicable, investment results reflect fee waivers, without which results would have been lower. Visit capitalgroup.com for more information.
Investing outside the United States involves risks, such as currency fluctuations, periods of illiquidity and price volatility, as more fully described in the prospectus. These risks may be heightened in connection with investments in developing countries. Refer to the fund prospectus and the Risk Factors section of this report for more information on these and other risks associated with investing in the fund.
Investments are not FDIC-insured, nor are they deposits of or guaranteed by a bank or any other entity, so they may lose value.
Contents
| 1 | Letter to investors |
| 4 | The value of a long-term perspective |
| 6 | Summary investment portfolio |
| 9 | Financial statements |
| 34 | Board of trustees and other officers |
Fellow investors:
We are pleased to present this annual report for the 12 months ended November 30, 2019.
Stocks rallied globally over the reporting period thanks to many events, including interest rate cuts from the U.S. Federal Reserve, hopes of a U.S.-China trade deal, and the ongoing strength of the U.S. job market.
The New Economy Fund rose 14.56% with all distributions reinvested during the period. The fund’s results lagged the 16.11% return of the Standard & Poor’s 500 Composite Index but exceeded the 13.68% gain of the unmanaged MSCI ACWI (All Country World Index), which measures equity market results based on more than 40 developed and emerging market country indexes. Effective February 1, 2020, the fund has elected to use the ACWI index as its primary benchmark, because it comes closest to reflecting its investment universe and best measures its long-term results and portfolio managers’ success over time. We view ACWI as the most relevant benchmark for the fund. Similarly, we view the Lipper Global Funds Index as the most relevant peer-group benchmark.
For the 10-year period ended November 30, 2019, The New Economy Fund had an average annual total return of 13.15%, which exceeded the 8.63% return of the MSCI ACWI. We believe the 10-year and lifetime returns (see the table below) are important for investors to consider, as they best reflect our long-term approach and philosophy.
Markets rebound on policy pivot, trade hopes
After a rocky start to the reporting period, global equities rallied strongly out of the lows set in December 2018 as the Federal Reserve reversed its tightening bias with a
Results at a glance
For periods ended November 30, 2019, with all distributions reinvested
| | | Cumulative
total returns | | Average annual total returns |
| | | 1 year | | 5 years | | 10 years | | Lifetime
(since 12/1/83) |
| | | | | | | | | | | | | | | | | |
| The New Economy Fund (Class A shares) | | | 14.56 | % | | | 10.52 | % | | | 13.15 | % | | | 11.34 | % |
| Standard & Poor’s 500 Composite Index1,6 | | | 16.11 | | | | 10.98 | | | | 13.44 | | | | 11.14 | |
| MSCI ACWI (All Country World Index)2,3,6 | | | 13.68 | | | | 7.24 | | | | 8.63 | | | | N/A | |
| Global Service and Information Index3,4,6 | | | 16.33 | | | | 9.96 | | | | 11.83 | | | | N/A | |
| Lipper Global Funds Index3,5 | | | 12.03 | | | | 6.68 | | | | 8.35 | | | | N/A | |
| 1 | Source: S&P Dow Jones Indices LLC. |
| 2 | Source: MSCI. Results reflect dividends net of withholding taxes. |
| 3 | This index was not in existence as of the date the fund began investment operations; therefore, lifetime results are not available. |
| 4 | The index is compiled by Capital Research and Management Company, the investment adviser to the fund. |
| 5 | Source: Refinitiv Lipper. Lipper indexes track the largest mutual funds (no more than 30), represented by one share class per fund, in the corresponding Lipper category. |
| 6 | The market indexes are unmanaged and, therefore, have no expenses. Investors cannot invest directly in an index. |
series of three quarter-point interest rate cuts and set an end to its program to reduce the long-term bond holdings on its balance sheet. Policymakers rationalized the policy pivot as a response to economic weakness resulting from ongoing trade tensions between the United States and its major trading partners, especially China.
The central bank’s moves bolstered markets, with the S&P 500 Index enjoying a push to new record highs in October and November. U.S. gross domestic product growth also reaccelerated from a low of 1.1% for the fourth quarter of 2018 to an average of 2.4% for the three quarters that followed. The unemployment rate fell to 3.5% in September and November, the lowest rate since the late 1960s.
Adding to the tailwinds was a thawing of U.S.-China trade relations, with the Trump Administration agreeing in October to suspend previously planned tariff increases on $250 billion worth of Chinese imports while China agreed to buy up to $50 billion worth of U.S. agricultural goods.
In Europe, stocks rebounded amid rising hopes of stabilizing economic growth and ongoing monetary policy support in the eurozone. German stocks recovered on improving manufacturing activity after suffering sharp declines earlier in the year. British stocks rose more slowly as the long-running Brexit drama remained unresolved.
In Asia, Japan’s Nikkei Index rose strongly from September onward as the Bank of Japan kept policy rates in negative territory and highlighted the option of additional monetary easing measures outside of interest rate cuts. And in the emerging markets, China’s Shanghai Stock Exchange Composite Index touched new highs in April before drifting lower on slowing economic growth.
The fund
At the end of the reporting period, roughly 66% of the portfolio’s equity assets were in companies domiciled in the United States with the rest in countries such as China, the United Kingdom, South Korea, and elsewhere. This is an increase from the 59% share in U.S. assets at the beginning of the reporting period. The portfolio’s large position in U.S. equities added to overall results relative to the globally focused ACWI.
At the sector level, the portfolio’s investments were focused on information technology and health care — areas that are seeing a rapid pace of both innovation and earnings growth. Within the S&P 500, these two sectors were among the three largest earnings growers by sector and posted the largest earnings surprises relative to estimates for the third quarter of 2019.
The portfolio’s largest single holding is Netflix. Its shares rose nearly 10% over the reporting period but lagged the S&P 500 Index as competitors, including Disney and Apple, launched their own streaming video services. We believe that a strong pipeline of content and international growth opportunities should continue to benefit Netflix as the streaming industry overall continues to enjoy market share gains at the expense of traditional television providers.
The next largest holding is Microsoft, which recently won a $10 billion cloud computing contract from the U.S. Department of Defense, beating out Amazon and other competitors. Shares rose 36.5% over the reporting period as the company enjoys strong revenue growth.
The third largest holding is Broadcom, a maker of semiconductors. Its products are used in a growing number of technology products. The stock rose more than 33% over the reporting period.
UnitedHealth Group fell 0.5% over the reporting period, largely recovering from earlier weakness as concerns over “Medicare for All” faded.
Where the fund’s assets are invested(by country of domicile)
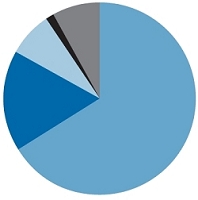
| | As of November 30, 2019 | | Percent of
net assets |
| n | United States | | | 66.2 | % |
| n | Asia & Pacific Basin | | | 17.0 | |
| n | Europe | | | 7.4 | |
| n | Other (including Latin America) | | | 1.6 | |
| n | Short-term securities & other assets less liabilities | | | 7.8 | |
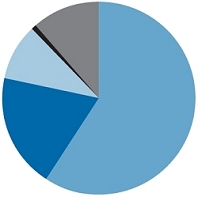
| | As of November 30, 2018 | | Percent of
net assets |
| n | United States | | | 59.4 | % |
| n | Asia & Pacific Basin | | | 19.0 | |
| n | Europe | | | 9.5 | |
| n | Other (including Latin America) | | | .8 | |
| n | Short-term securities & other assets less liabilities | | | 11.3 | |
A look ahead
As we look to what lies ahead, a few dominant themes emerge. Evidence of late-cycle dynamics continues to be seen all around, from elevated U.S. stock valuations to tight U.S. labor market conditions. Political volatility, both at home and abroad, looks set to intensify heading into the 2020 presidential election, with possible implications for large segments of the economy, especially U.S. health care.
Yet this remains a time of incredible technological change and development. This requires balance. Our holdings of cash and short-term securities, which stand at 8% of total assets, provide both a bulwark against possible market weakness and the capital needed to pursue new investment opportunities at a reasonable price.
As mentioned in the fund’s last report, as of February 1, 2020, we will remove the fund’s secondary objective of current income. The fund’s primary investment objective will remain long-term growth of capital.
Thank you for your continued faith in our investment philosophy. We look forward to reporting to you again in six months.
Sincerely,

Timothy D. Armour
Co-President

Claudia P. Huntington
Co-President
January 9, 2020
For current information about the fund, visit capitalgroup.com.
The New Geography of Investing®
Where a company does business can be more important than where it’s located. Here’s a look at The New Economy Fund’s portfolio in terms of where its equity holdings earn their revenue. The charts below show the countries and regions in which the fund’s equity investments are located, and where the revenue comes from.
Equity portion breakdown by domicile (%)
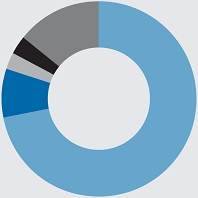
| | Region | | Fund | | Index |
| n | United States | | | 72 | % | | | 100 | % |
| n | Canada | | | — | | | | — | |
| n | Europe | | | 8 | | | | — | |
| n | Japan | | | 3 | | | | — | |
| n | Asia-Pacific ex. Japan | | | 3 | | | | — | |
| n | Emerging markets | | | 14 | | | | — | |
| | Total | | | 100 | % | | | 100 | % |
Equity portion breakdown by revenue (%)
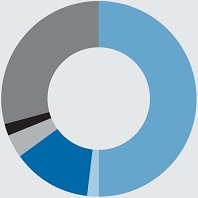
| | Region | | Fund | | Index |
| n | United States | | | 50 | % | | | 62 | % |
| n | Canada | | | 2 | | | | 2 | |
| n | Europe | | | 13 | | | | 12 | |
| n | Japan | | | 4 | | | | 3 | |
| n | Asia-Pacific ex. Japan | | | 2 | | | | 1 | |
| n | Emerging markets | | | 29 | | | | 20 | |
| | Total | | | 100 | % | | | 100 | % |
Compared with the S&P 500 as a percent of net assets.
Source: Capital Group (as of November 30, 2019).
The value of a long-term perspective
Fund results shown are for Class A shares and reflect deduction of the maximum sales charge of 5.75% on the $10,000 investment.1Thus, the net amount invested was $9,425.2Results are for past periods and are not predictive of results for future periods. Current and future results may be lower or higher than those shown. Share prices and returns will vary, so investors may lose money. For current information and month-end results, visit capitalgroup.com.
The results shown are before taxes on fund distributions and sale of fund shares.
| 1 | As outlined in the prospectus, the sales charge is reduced for accounts (and aggregated investments) of $25,000 or more and is eliminated for purchases of $1 million or more. There is no sales charge on dividends or capital gain distributions that are reinvested in additional shares. |
| 2 | The maximum initial sales charge was 8.50% prior to July 1, 1988. |
| 3 | All results are calculated with dividends and capital gains reinvested. |
| 4 | Source: S&P Dow Jones Indices LLC. |
| 5 | From December 1, 1983, through December 31, 1987, the MSCI World Index was used because the MSCI ACWI did not exist. MSCI World Index results reflect dividends net of withholding taxes, and MSCI ACWI results reflect dividends gross of withholding taxes through December 31, 2000, and dividends net of withholding taxes thereafter. Source: MSCI. |
| 6 | The market index is unmanaged and, therefore, has no expenses. Investors cannot invest directly in an index. |
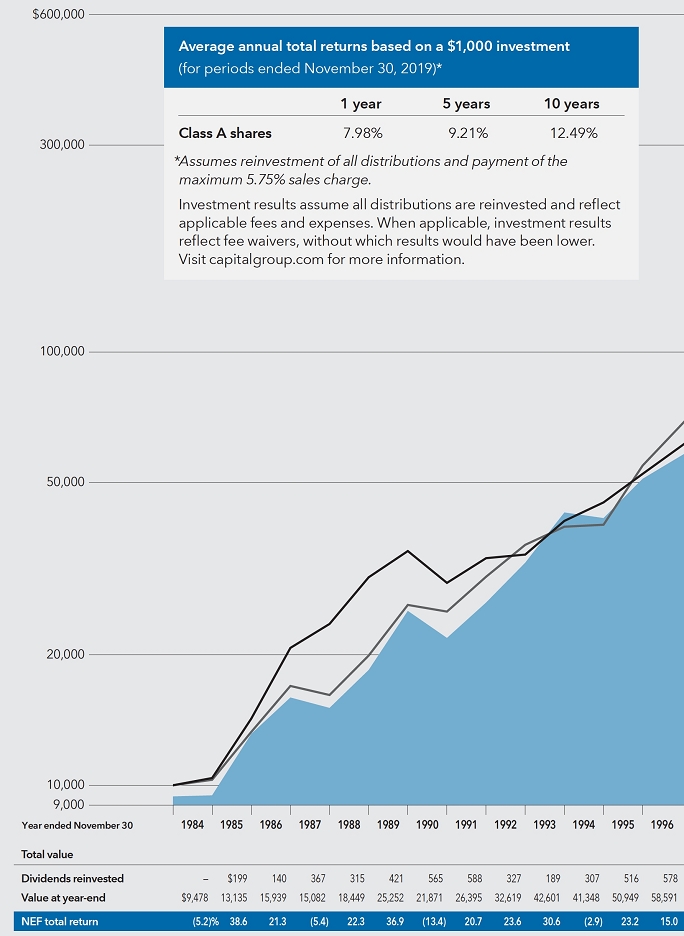
How a $10,000 investment has grown
This chart illustrates how a $10,000 investment in The New Economy Fund’s Class A shares grew between December 1, 1983 — when the fund began operations — and November 30, 2019, the end of its latest fiscal year. The fund’s year-by-year results appear in the table beneath the chart.

Summary investment portfolioNovember 30, 2019
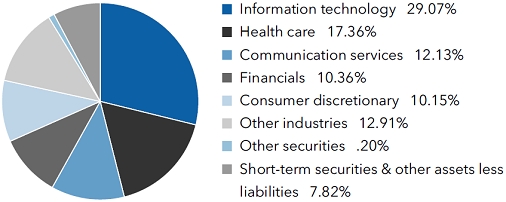
| Industry sector diversification | Percent of net assets |
| Country diversification by domicile | | Percent of
net assets |
| United States | | | 66.23 | % |
| China | | | 4.10 | |
| Eurozone* | | | 3.40 | |
| India | | | 3.04 | |
| Japan | | | 2.85 | |
| South Korea | | | 2.58 | |
| United Kingdom | | | 2.57 | |
| Hong Kong | | | 2.36 | |
| Brazil | | | 1.25 | |
| Other countries | | | 3.80 | |
| Short-term securities & other assets less liabilities | | | 7.82 | |
| * | Countries using the euro as a common currency; those represented in the fund’s portfolio are France, Germany, Italy, the Netherlands and Spain. |
| Common stocks 91.98% | | Shares | | | Value
(000) | |
| Information technology 29.07% | | | | | | | | |
| Microsoft Corp. | | | 4,080,814 | | | $ | 617,754 | |
| Broadcom Inc. | | | 1,767,870 | | | | 559,018 | |
| Samsung Electronics Co., Ltd. | | | 8,942,705 | | | | 380,831 | |
| Mastercard Inc., Class A | | | 1,210,400 | | | | 353,715 | |
| Micron Technology, Inc.1 | | | 5,923,553 | | | | 281,428 | |
| Accenture PLC, Class A | | | 1,332,749 | | | | 268,096 | |
| Ceridian HCM Holding Inc.1 | | | 4,223,205 | | | | 254,913 | |
| Autodesk, Inc.1 | | | 1,250,483 | | | | 226,212 | |
| Adobe Inc.1 | | | 662,906 | | | | 205,189 | |
| PayPal Holdings, Inc.1 | | | 1,791,960 | | | | 193,550 | |
| SK hynix, Inc. | | | 2,759,000 | | | | 188,971 | |
| Taiwan Semiconductor Manufacturing Co., Ltd. (ADR) | | | 3,542,537 | | | | 188,073 | |
| ServiceNow, Inc.1 | | | 535,394 | | | | 151,538 | |
| Cree, Inc.1 | | | 3,234,366 | | | | 142,991 | |
| Other securities | | | | | | | 2,416,820 | |
| | | | | | | | 6,429,099 | |
| | | | | | | | | |
| Health care 17.36% | | | | | | | | |
| UnitedHealth Group Inc. | | | 1,300,663 | | | | 364,016 | |
| Daiichi Sankyo Co., Ltd. | | | 4,144,200 | | | | 259,810 | |
| Abbott Laboratories | | | 2,947,782 | | | | 251,888 | |
| Thermo Fisher Scientific Inc. | | | 722,002 | | | | 226,672 | |
| Cigna Corp. | | | 1,105,866 | | | | 221,085 | |
| Molina Healthcare, Inc.1 | | | 1,619,031 | | | | 219,379 | |
| Novartis AG | | | 2,326,539 | | | | 214,181 | |
| Humana Inc. | | | 540,377 | | | | 184,393 | |
| Boston Scientific Corp.1 | | | 3,965,654 | | | | 171,514 | |
| Bluebird Bio, Inc.1 | | | 2,048,918 | | | | 165,839 | |
| Other securities | | | | | | | 1,559,753 | |
| | | | | | | | 3,838,530 | |
| | | | | | | | | |
| Communication services 12.13% | | | | | | | | |
| Netflix, Inc.1 | | | 2,480,522 | | | | 780,521 | |
| Facebook, Inc., Class A1 | | | 2,595,512 | | | | 523,359 | |
| Alphabet Inc., Class C1 | | | 183,296 | | | | 239,194 | |
| Alphabet Inc., Class A1 | | | 143,766 | | | | 187,484 | |
| Tencent Holdings Ltd. | | | 6,244,700 | | | | 264,688 | |
| Comcast Corp., Class A | | | 3,398,596 | | | | 150,048 | |
| Other securities | | | | | | | 536,936 | |
| | | | | | | | 2,682,230 | |
| | | Shares | | | Value
(000) | |
| Financials 10.36% | | | | | | | | |
| Kotak Mahindra Bank Ltd. | | | 14,058,382 | | | $ | 316,530 | |
| AIA Group Ltd. | | | 21,298,000 | | | | 213,305 | |
| CME Group Inc., Class A | | | 968,000 | | | | 196,243 | |
| Berkshire Hathaway Inc., Class B1 | | | 766,283 | | | | 168,812 | |
| HDFC Bank Ltd. | | | 9,092,000 | | | | 161,587 | |
| Arch Capital Group Ltd.1 | | | 3,310,008 | | | | 138,921 | |
| Other securities | | | | | | | 1,095,922 | |
| | | | | | | | 2,291,320 | |
| | | | | | | | | |
| Consumer discretionary 10.15% | | | | | | | | |
| Amazon.com, Inc.1 | | | 259,518 | | | | 467,340 | |
| Alibaba Group Holding Ltd. (ADR)1 | | | 870,940 | | | | 174,188 | |
| Alibaba Group Holding Ltd.1 | | | 5,349,792 | | | | 135,589 | |
| Galaxy Entertainment Group Ltd. | | | 36,104,000 | | | | 236,141 | |
| Marriott International, Inc., Class A | | | 1,194,507 | | | | 167,661 | |
| Sony Corp. | | | 2,346,000 | | | | 147,977 | |
| Home Depot, Inc. | | | 619,436 | | | | 136,592 | |
| Other securities | | | | | | | 779,892 | |
| | | | | | | | 2,245,380 | |
| | | | | | | | | |
| Industrials 7.77% | | | | | | | | |
| Boeing Co. | | | 762,685 | | | | 279,280 | |
| CSX Corp. | | | 3,182,685 | | | | 227,689 | |
| Airbus SE, non-registered shares | | | 1,469,519 | | | | 215,971 | |
| Union Pacific Corp. | | | 994,543 | | | | 175,030 | |
| Other securities | | | | | | | 819,516 | |
| | | | | | | | 1,717,486 | |
| | | | | | | | | |
| Materials 1.46% | | | | | | | | |
| Sherwin-Williams Co. | | | 321,867 | | | | 187,690 | |
| Other securities | | | | | | | 136,413 | |
| | | | | | | | 324,103 | |
| | | | | | | | | |
| Utilities 1.27% | | | | | | | | |
| ENN Energy Holdings Ltd. | | | 18,414,400 | | | | 199,950 | |
| Other securities | | | | | | | 79,952 | |
| | | | | | | | 279,902 | |
| | | | | | | | | |
| Consumer staples 1.00% | | | | | | | | |
| Costco Wholesale Corp. | | | 629,520 | | | | 188,736 | |
| Other securities | | | | | | | 32,324 | |
| | | | | | | | 221,060 | |
| | | | | | | | | |
| Other 1.41% | | | | | | | | |
| Other securities | | | | | | | 310,487 | |
| | | | | | | | | |
| Total common stocks (cost: $13,700,560,000) | | | | | | | 20,339,597 | |
| | | | | | | | | |
| Preferred securities 0.20% | | | | | | | | |
| Financials 0.20% | | | | | | | | |
| Other securities | | | | | | | 44,217 | |
| | | | | | | | | |
| Total preferred securities (cost: $45,618,000) | | | | | | | 44,217 | |
| | | | | | | | | |
| Short-term securities 7.87% | | | | | | | | |
| Money market investments 7.87% | | | | | | | | |
| Capital Group Central Cash Fund 1.78%2 | | | 17,399,300 | | | | 1,739,930 | |
| | | | | | | | | |
| Total short-term securities (cost: $1,739,830,000) | | | | | | | 1,739,930 | |
| Total investment securities 100.05% (cost: $15,486,008,000) | | | | | | | 22,123,744 | |
| Other assets less liabilities (0.05%) | | | | | | | (12,015 | ) |
| | | | | | | | | |
| Net assets 100.00% | | | | | | $ | 22,111,729 | |
This summary investment portfolio is designed to streamline the report and help investors better focus on the fund’s principal holdings. See the inside back cover for details on how to obtain a complete schedule of portfolio holdings.
“Other securities” includes all issues that are not disclosed separately in the summary investment portfolio. “Other securities” includes a security that was valued under fair value procedures adopted by authority of the board of trustees. The total value of the security that was valued under fair value procedures was $35,874,000, which represented .16% of the net assets of the fund. One security in “Other securities” (with a value of $35,874,000, an aggregate cost of $30,183,000, and which represented .16% of the net assets of the fund) was acquired on January 4, 2019, through private placement transactions exempt from registration under the Securities Act of 1933, which may subject it to legal or contractual restrictions on resale.
Investments in affiliates
A company is an affiliate of the fund under the Investment Company Act of 1940 if the fund’s holdings represent 5% or more of the outstanding voting shares of that company. The value of the fund’s holdings in affiliated companies is included in “Other securities” under the respective industry sectors in the summary investment portfolio. Further details on these holdings and related transactions during the year ended November 30, 2019, appear below.
| | | Beginning
shares | | | Additions | | | Reductions | | | Ending
shares | | | Net
realized
(loss) gain
(000) | | | Net
unrealized
appreciation
(depreciation)
(000) | | | Dividend
income
(000) | | | Value of
affiliates at
11/30/2019
(000) | |
| Common stocks 0.15% | | | | | | | | | | | | | | | | | | | | | | | | | | | | | | | | |
| Health care 0.15% | | | | | | | | | | | | | | | | | | | | | | | | | | | | | | | | |
| Mesoblast Ltd.1 | | | 28,891,583 | | | | — | | | | 2,109,788 | | | | 26,781,795 | | | $ | (12,454 | ) | | $ | 19,932 | | | $ | — | | | $ | 32,789 | |
| Mesoblast Ltd. (ADR)1 | | | 372,800 | | | | — | | | | 223,423 | | | | 149,377 | | | | (352 | ) | | | 911 | | | | — | | | | 935 | |
| | | | | | | | | | | | | | | | | | | | | | | | | | | | | | | | 33,724 | |
| Consumer discretionary 0.00% | | | | | | | | | | | | | | | | | | | | | | | | | | | |
| Moneysupermarket.com Group PLC3 | | | 15,762,066 | | | | 11,540,000 | | | | 5,653,923 | | | | 21,648,143 | | | | 8,127 | | | | (2,668 | ) | | | 6,598 | | | | — | |
| Total 0.15% | | | | | | | | | | | | | | | | | | $ | (4,679 | ) | | $ | 18,175 | | | $ | 6,598 | | | $ | 33,724 | |
| 1 | Security did not produce income during the last 12 months. |
| 2 | Rate represents the seven-day yield at 11/30/2019. |
| 3 | Unaffiliated issuer at 11/30/2019. |
Key to abbreviation
ADR = American Depositary Receipts
See notes to financial statements.
Financial statements
| Statement of assets and liabilities | |
| at November 30, 2019 | (dollars in thousands) |
| Assets: | | | | | | | | |
| Investment securities, at value: | | | | | | | | |
| Unaffiliated issuers (cost: $15,364,059) | | $ | 22,090,020 | | | | | |
| Affiliated issuers (cost: $121,949) | | | 33,724 | | | $ | 22,123,744 | |
| Cash | | | | | | | 84 | |
| Cash denominated in currencies other than U.S. dollars (cost: $1,268) | | | | | | | 1,268 | |
| Receivables for: | | | | | | | | |
| Sales of investments | | | 83,234 | | | | | |
| Sales of fund’s shares | | | 8,681 | | | | | |
| Dividends | | | 17,912 | | | | | |
| Other | | | 562 | | | | 110,389 | |
| | | | | | | | 22,235,485 | |
| Liabilities: | | | | | | | | |
| Payables for: | | | | | | | | |
| Purchases of investments | | | 88,714 | | | | | |
| Repurchases of fund’s shares | | | 9,576 | | | | | |
| Investment advisory services | | | 6,751 | | | | | |
| Services provided by related parties | | | 6,300 | | | | | |
| Trustees’ deferred compensation | | | 2,856 | | | | | |
| Non-U.S. taxes | | | 9,297 | | | | | |
| Other | | | 262 | | | | 123,756 | |
| Net assets at November 30, 2019 | | | | | | $ | 22,111,729 | |
| | | | | | | | | |
| Net assets consist of: | | | | | | | | |
| Capital paid in on shares of beneficial interest | | | | | | $ | 13,977,314 | |
| Total distributable earnings | | | | | | | 8,134,415 | |
| Net assets at November 30, 2019 | | | | | | $ | 22,111,729 | |
(dollars and shares in thousands, except per-share amounts)
Shares of beneficial interest issued and outstanding (no stated par value) —
unlimited shares authorized (466,809 total shares outstanding)
| | | | | | Shares | | | Net asset |
| | | Net assets | | | outstanding | | | value per share |
| Class A | | $ | 13,159,955 | | | | 276,466 | | | $ | 47.60 | |
| Class C | | | 531,170 | | | | 12,643 | | | | 42.01 | |
| Class T | | | 12 | | | | — | * | | | 47.66 | |
| Class F-1 | | | 329,189 | | | | 6,893 | | | | 47.76 | |
| Class F-2 | | | 1,586,142 | | | | 33,336 | | | | 47.58 | |
| Class F-3 | | | 704,782 | | | | 14,768 | | | | 47.72 | |
| Class 529-A | | | 693,799 | | | | 14,746 | | | | 47.05 | |
| Class 529-C | | | 106,413 | | | | 2,497 | | | | 42.62 | |
| Class 529-E | | | 31,257 | | | | 676 | | | | 46.24 | |
| Class 529-T | | | 14 | | | | — | * | | | 47.64 | |
| Class 529-F-1 | | | 64,579 | | | | 1,373 | | | | 47.04 | |
| Class R-1 | | | 39,055 | | | | 897 | | | | 43.52 | |
| Class R-2 | | | 203,400 | | | | 4,643 | | | | 43.81 | |
| Class R-2E | | | 12,689 | | | | 272 | | | | 46.59 | |
| Class R-3 | | | 302,562 | | | | 6,529 | | | | 46.34 | |
| Class R-4 | | | 332,174 | | | | 7,051 | | | | 47.11 | |
| Class R-5E | | | 54,989 | | | | 1,160 | | | | 47.39 | |
| Class R-5 | | | 126,105 | | | | 2,630 | | | | 47.96 | |
| Class R-6 | | | 3,833,443 | | | | 80,229 | | | | 47.78 | |
| * | Amount less than one thousand. |
See notes to financial statements.
| Statement of operations | |
| for the year ended November 30, 2019 | (dollars in thousands) |
| Investment income: | | | | | | | | |
| Income: | | | | | | | | |
| Dividends (net of non-U.S. taxes of $8,877; also includes $6,598 from affiliates) | | $ | 252,752 | | | | | |
| Interest | | | 16,298 | | | $ | 269,050 | |
| Fees and expenses*: | | | | | | | | |
| Investment advisory services | | | 78,720 | | | | | |
| Distribution services | | | 43,965 | | | | | |
| Transfer agent services | | | 19,726 | | | | | |
| Administrative services | | | 5,738 | | | | | |
| Reports to shareholders | | | 736 | | | | | |
| Registration statement and prospectus | | | 1,166 | | | | | |
| Trustees’ compensation | | | 738 | | | | | |
| Auditing and legal | | | 209 | | | | | |
| Custodian | | | 1,568 | | | | | |
| Other | | | 650 | | | | 153,216 | |
| Net investment income | | | | | | | 115,834 | |
| | | | | | | | | |
| Net realized gain and unrealized appreciation: | | | | | | | | |
| Net realized gain (loss) on: | | | | | | | | |
| Investments (net of non-U.S. taxes of $3): | | | | | | | | |
| Unaffiliated issuers | | | 1,525,168 | | | | | |
| Affiliated issuers | | | (4,679 | ) | | | | |
| Currency transactions | | | 357 | | | | 1,520,846 | |
| Net unrealized appreciation on: | | | | | | | | |
| Investments (net of non-U.S. taxes of $9,119): | | | | | | | | |
| Unaffiliated issuers | | | 1,184,519 | | | | | |
| Affiliated issuers | | | 18,175 | | | | | |
| Currency translations | | | 127 | | | | 1,202,821 | |
| Net realized gain and unrealized appreciation | | | | | | | 2,723,667 | |
| | | | | | | | | |
| Net increase in net assets resulting from operations | | | | | | $ | 2,839,501 | |
| * | Additional information related to class-specific fees and expenses is included in the notes to financial statements. |
See notes to financial statements.
| Statements of changes in net assets | |
| | (dollars in thousands) |
| | | Year ended November 30, |
| | | 2019 | | | 2018 | |
| Operations: | | | | | | | | |
| Net investment income | | $ | 115,834 | | | $ | 104,834 | |
| Net realized gain | | | 1,520,846 | | | | 1,584,061 | |
| Net unrealized appreciation (depreciation) | | | 1,202,821 | | | | (1,247,073 | ) |
| Net increase in net assets resulting from operations | | | 2,839,501 | | | | 441,822 | |
| | | | | | | | | |
| Distributions paid to shareholders | | | (1,700,106 | ) | | | (1,455,895 | ) |
| | | | | | | | | |
| Net capital share transactions | | | 1,061,007 | | | | 2,141,051 | |
| | | | | | | | | |
| Total increase in net assets | | | 2,200,402 | | | | 1,126,978 | |
| | | | | | | | | |
| Net assets: | | | | | | | | |
| Beginning of year | | | 19,911,327 | | | | 18,784,349 | |
| End of year | | $ | 22,111,729 | | | $ | 19,911,327 | |
See notes to financial statements.
Notes to financial statements
1. Organization
The New Economy Fund (the “fund”) is registered under the Investment Company Act of 1940 as an open-end, diversified management investment company. The fund seeks long-term growth of capital. Current income is a secondary consideration.
The fund has 19 share classes consisting of six retail share classes (Classes A, C, T, F-1, F-2 and F-3), five 529 college savings plan share classes (Classes 529-A, 529-C, 529-E, 529-T and 529-F-1) and eight retirement plan share classes (Classes R-1, R-2, R-2E, R-3, R-4, R-5E, R-5 and R-6). The 529 college savings plan share classes can be used to save for college education. The retirement plan share classes are generally offered only through eligible employer-sponsored retirement plans. The fund’s share classes are described further in the following table:
| Share class | | Initial sales
charge | | Contingent deferred sales
charge upon redemption | | Conversion feature |
| Classes A and 529-A | | Up to 5.75% | | None (except 1% for certain redemptions within 18 months of purchase without an initial sales charge) | | None |
| Class C | | None | | 1% for redemptions within one year of purchase | | Class C converts to Class F-1 after 10 years |
| Class 529-C | | None | | 1% for redemptions within one year of purchase | | Class 529-C converts to Class 529-A after 10 years |
| Class 529-E | | None | | None | | None |
| Classes T and 529-T* | | Up to 2.50% | | None | | None |
| Classes F-1, F-2, F-3 and 529-F-1 | | None | | None | | None |
| Classes R-1, R-2, R-2E, R-3, R-4, R-5E, R-5 and R-6 | | None | | None | | None |
| * | Class T and 529-T shares are not available for purchase. |
Holders of all share classes have equal pro rata rights to the assets, dividends and liquidation proceeds of the fund. Each share class has identical voting rights, except for the exclusive right to vote on matters affecting only its class. Share classes have different fees and expenses (“class-specific fees and expenses”), primarily due to different arrangements for distribution, transfer agent and administrative services. Differences in class-specific fees and expenses will result in differences in net investment income and, therefore, the payment of different per-share dividends by each share class.
2. Significant accounting policies
The fund is an investment company that applies the accounting and reporting guidance issued in Topic 946 by the U.S. Financial Accounting Standards Board. The fund’s financial statements have been prepared to comply with U.S. generally accepted accounting principles (“U.S. GAAP”). These principles require the fund’s investment adviser to make estimates and assumptions that affect reported amounts and disclosures. Actual results could differ from those estimates. Subsequent events, if any, have been evaluated through the date of issuance in the preparation of the financial statements. The fund follows the significant accounting policies described in this section, as well as the valuation policies described in the next section on valuation.
Security transactions and related investment income — Security transactions are recorded by the fund as of the date the trades are executed with brokers. Realized gains and losses from security transactions are determined based on the specific identified cost of the securities. In the event a security is purchased with a delayed payment date, the fund will segregate liquid assets sufficient to meet its payment obligations. Dividend income is recognized on the ex-dividend date and interest income is recognized on an accrual basis. Market discounts, premiums and original issue discounts on fixed-income securities are amortized daily over the expected life of the security.
Class allocations — Income, fees and expenses (other than class-specific fees and expenses) and realized and unrealized gains and losses are allocated daily among the various share classes based on their relative net assets. Class-specific fees and expenses, such as distribution, transfer agent and administrative services, are charged directly to the respective share class.
Distributions paid to shareholders — Income dividends and capital gain distributions are recorded on the ex-dividend date.
Currency translation — Assets and liabilities, including investment securities, denominated in currencies other than U.S. dollars are translated into U.S. dollars at the exchange rates supplied by one or more pricing vendors on the valuation date. Purchases and sales of investment securities and income and expenses are translated into U.S. dollars at the exchange rates on the dates of such transactions. The effects of changes in exchange rates on investment securities are included with the net realized gain or loss and net unrealized appreciation or depreciation on investments in the fund’s statement of operations. The realized gain or loss and unrealized appreciation or depreciation resulting from all other transactions denominated in currencies other than U.S. dollars are disclosed separately.
3. Valuation
Capital Research and Management Company (“CRMC”), the fund’s investment adviser, values the fund’s investments at fair value as defined by U.S. GAAP. The net asset value of each share class of the fund is generally determined as of approximately 4:00 p.m. New York time each day the New York Stock Exchange is open.
Methods and inputs — The fund’s investment adviser uses the following methods and inputs to establish the fair value of the fund’s assets and liabilities. Use of particular methods and inputs may vary over time based on availability and relevance as market and economic conditions evolve.
Equity securities are generally valued at the official closing price of, or the last reported sale price on, the exchange or market on which such securities are traded, as of the close of business on the day the securities are being valued or, lacking any sales, at the last available bid price. Prices for each security are taken from the principal exchange or market on which the security trades.
Fixed-income securities, including short-term securities, are generally valued at prices obtained from one or more pricing vendors. Vendors value such securities based on one or more of the inputs described in the following table. The table provides examples of inputs that are commonly relevant for valuing particular classes of fixed-income securities in which the fund is authorized to invest. However, these classifications are not exclusive, and any of the inputs may be used to value any other class of fixed-income security.
| Fixed-income class | Examples of standard inputs |
| All | Benchmark yields, transactions, bids, offers, quotations from dealers and trading systems, new issues, spreads and other relationships observed in the markets among comparable securities; and proprietary pricing models such as yield measures calculated using factors such as cash flows, financial or collateral performance and other reference data (collectively referred to as “standard inputs”) |
| Corporate bonds & notes; convertible securities | Standard inputs and underlying equity of the issuer |
| Bonds & notes of governments & government agencies | Standard inputs and interest rate volatilities |
When the fund’s investment adviser deems it appropriate to do so (such as when vendor prices are unavailable or deemed to be not representative), fixed-income securities will be valued in good faith at the mean quoted bid and ask prices that are reasonably and timely available (or bid prices, if ask prices are not available) or at prices for securities of comparable maturity, quality and type.
Securities with both fixed-income and equity characteristics, or equity securities traded principally among fixed-income dealers, are generally valued in the manner described for either equity or fixed-income securities, depending on which method is deemed most appropriate by the fund’s investment adviser. The Capital Group Central Cash Fund (“CCF”), a fund within the Capital Group Central Fund Series (“Central Funds”), is valued based upon a floating net asset value, which fluctuates with changes in the value of CCF’s portfolio securities. The underlying securities are valued based on the policies and procedures in CCF’s statement of additional information.
Securities and other assets for which representative market quotations are not readily available or are considered unreliable by the fund’s investment adviser are fair valued as determined in good faith under fair valuation guidelines adopted by authority of the fund’s board of trustees as further described. The investment adviser follows fair valuation guidelines, consistent with U.S. Securities and Exchange Commission rules and guidance, to consider relevant principles and factors when making fair value determinations. The investment adviser considers relevant indications of value that are reasonably and timely available to it in determining the fair value to be assigned to a particular security, such as the type and cost of the security; contractual or legal restrictions on resale of the security; relevant financial or business developments of the issuer; actively traded similar or related securities; conversion or exchange rights on the security; related corporate actions; significant events occurring after the close of trading in the security; and changes in overall market conditions. In addition, the closing prices of equity securities that trade in markets outside U.S. time zones may be adjusted to reflect significant events that occur after the close of local trading but before the net asset value of each share class of the fund is determined. Fair valuations and valuations of investments that are not actively trading involve judgment and may differ materially from valuations that would have been used had greater market activity occurred.
Processes and structure — The fund’s board of trustees has delegated authority to the fund’s investment adviser to make fair value determinations, subject to board oversight. The investment adviser has established a Joint Fair Valuation Committee (the “Fair Valuation Committee”) to administer, implement and oversee the fair valuation process, and to make fair value decisions. The Fair Valuation Committee regularly reviews its own fair value decisions, as well as decisions made under its standing instructions to the investment adviser’s valuation teams. The Fair Valuation Committee reviews changes in fair value measurements from period to period and may, as deemed appropriate, update the fair valuation guidelines to better reflect the results of back testing and address new or evolving issues. The Fair Valuation Committee reports any changes to the fair valuation guidelines to the board of trustees. The fund’s board and audit committee also regularly review reports that describe fair value determinations and methods.
The fund’s investment adviser has also established a Fixed-Income Pricing Review Group to administer and oversee the fixed-income valuation process, including the use of fixed-income pricing vendors. This group regularly reviews pricing vendor information and market data. Pricing decisions, processes and controls over security valuation are also subject to additional internal reviews, including an annual control self-evaluation program facilitated by the investment adviser’s compliance group.
Classifications — The fund’s investment adviser classifies the fund’s assets and liabilities into three levels based on the inputs used to value the assets or liabilities. Level 1 values are based on quoted prices in active markets for identical securities. Level 2 values are based on significant observable market inputs, such as quoted prices for similar securities and quoted prices in inactive markets. Certain securities trading outside the U.S. may transfer between Level 1 and Level 2 due to valuation adjustments resulting from significant market movements following the close of local trading. Level 3 values are based on significant unobservable inputs that reflect the investment adviser’s determination of assumptions that market participants might reasonably use in valuing the securities. The valuation levels are not necessarily an indication of the risk or liquidity associated with the underlying investment. For example, U.S. government securities are reflected as Level 2 because the inputs used to determine fair value may not always be quoted prices in an active market. The following table presents the fund’s valuation levels as of November 30, 2019 (dollars in thousands):
| | | Investment securities | |
| | | Level 1 | | | Level 2 | | | Level 3 | | | Total | |
| Assets: | | | | | | | | | | | | | | | | |
| Common stocks: | | | | | | | | | | | | | | | | |
| Information technology | | $ | 6,429,099 | | | $ | — | | | $ | — | | | $ | 6,429,099 | |
| Health care | | | 3,802,656 | | | | — | | | | 35,874 | | | | 3,838,530 | |
| Communication services | | | 2,682,230 | | | | — | | | | — | | | | 2,682,230 | |
| Financials | | | 2,291,320 | | | | — | | | | — | | | | 2,291,320 | |
| Consumer discretionary | | | 2,245,380 | | | | — | | | | — | | | | 2,245,380 | |
| Industrials | | | 1,717,486 | | | | — | | | | — | | | | 1,717,486 | |
| Materials | | | 324,103 | | | | — | | | | — | | | | 324,103 | |
| Utilities | | | 279,902 | | | | — | | | | — | | | | 279,902 | |
| Consumer staples | | | 221,060 | | | | — | | | | — | | | | 221,060 | |
| Other | | | 310,487 | | | | — | | | | — | | | | 310,487 | |
| Preferred securities | | | 44,217 | | | | — | | | | — | | | | 44,217 | |
| Short-term securities | | | 1,739,930 | | | | — | | | | — | | | | 1,739,930 | |
| Total | | $ | 22,087,870 | | | $ | — | | | $ | 35,874 | | | $ | 22,123,744 | |
4. Risk factors
Investing in the fund may involve certain risks including, but not limited to, those described below.
Market conditions — The prices of, and the income generated by, the common stocks and other securities held by the fund may decline —sometimes rapidly or unpredictably — due to various factors, including events or conditions affecting the general economy or particular industries; overall market changes; local, regional or global political, social or economic instability; governmental, governmental agency or central bank responses to economic conditions; and currency exchange rate, interest rate and commodity price fluctuations.
Issuer risks — The prices of, and the income generated by, securities held by the fund may decline in response to various factors directly related to the issuers of such securities, including reduced demand for an issuer’s goods or services, poor management performance, major litigation related to the issuer, changes in government regulations affecting the issuer or its competitive environment and strategic initiatives such as mergers, acquisitions or dispositions and the market response to any such initiatives.
Investing in growth-oriented stocks — Growth-oriented common stocks and other equity-type securities (such as preferred stocks, convertible preferred stocks and convertible bonds) may involve larger price swings and greater potential for loss than other types of investments. These risks may be even greater in the case of smaller capitalization stocks.
Investing in income-oriented stocks — The value of the fund’s securities and income provided by the fund may also be reduced by changes in the dividend policies of, and the capital resources available for dividend payments at, the companies in which the fund invests.
Investing outside the U.S. — Securities of issuers domiciled outside the U.S., or with significant operations or revenues outside the U.S., may lose value because of adverse political, social, economic or market developments (including social instability, regional conflicts, terrorism and war) in the countries or regions in which the issuers operate or generate revenue. These securities may also lose value due to changes in foreign currency exchange rates against the U.S. dollar and/or currencies of other countries. Issuers of these securities may be more susceptible to actions of foreign governments, such as nationalization, currency blockage or the imposition of price controls or punitive taxes, each of which could adversely impact the value of these securities. Securities markets in certain countries may be more volatile and/or less liquid than those in the U.S. Investments outside the U.S. may also be subject to different accounting practices and different regulatory, legal and reporting standards and practices, and may be more difficult to value, than those in the U.S. In addition, the value of investments outside the U.S. may be reduced by foreign taxes, including foreign withholding taxes on interest and dividends. Further, there may be increased risks of delayed settlement of securities purchased or sold by the fund. The risks of investing outside the U.S. may be heightened in connection with investments in emerging markets.
Investing in emerging markets — Investing in emerging markets may involve risks in addition to and greater than those generally associated with investing in the securities markets of developed countries. For instance, emerging market countries may have less developed legal and accounting systems than those in developed countries. The governments of these countries may be less stable and more likely to impose capital controls, nationalize a company or industry, place restrictions on foreign ownership and on withdrawing sale proceeds of securities from the country, and/or impose punitive taxes that could adversely affect the prices of securities. In addition, the economies of these countries may be dependent on relatively few industries that are more susceptible to local and global changes. Securities markets in these countries can also be relatively small and have substantially lower trading volumes. As a result, securities issued in these countries may be more volatile and less liquid, and may be more difficult to value, than securities issued in countries with more developed economies and/or markets. Less certainty with respect to security valuations may lead to additional challenges and risks in calculating the fund’s net asset value. Additionally, emerging markets are more likely to experience problems with the clearing and settling of trades and the holding of securities by banks, agents and depositories that are less established than those in developed countries.
Investing in small companies — Investing in smaller companies may pose additional risks. For example, it is often more difficult to value or dispose of small company stocks and more difficult to obtain information about smaller companies than about larger companies. Furthermore, smaller companies often have limited product lines, operating histories, markets and/or financial resources, may be dependent on one or a few key persons for management, and can be more susceptible to losses. Moreover, the prices of their stocks may be more volatile than stocks of larger, more established companies, particularly during times of market turmoil.
Exposure to country, region, industry or sector — Subject to the fund’s investment limitations, the fund may have significant exposure to a particular country, region, industry or sector. Such exposure may cause the fund to be more impacted by risks relating to and developments affecting the country, region, industry or sector, and thus its net asset value may be more volatile, than a fund without such levels of exposure. For example, if the fund has significant exposure in a particular country, then social, economic, regulatory or other issues that negatively affect that country may have a greater impact on the fund than on a fund that is more geographically diversified.
Management — The investment adviser to the fund actively manages the fund’s investments. Consequently, the fund is subject to the risk that the methods and analyses, including models, tools and data, employed by the investment adviser in this process may be flawed or incorrect and may not produce the desired results. This could cause the fund to lose value or its investment results to lag relevant benchmarks or other funds with similar objectives.
5. Taxation and distributions
Federal income taxation — The fund complies with the requirements under Subchapter M of the Internal Revenue Code applicable to mutual funds and intends to distribute substantially all of its net taxable income and net capital gains each year. The fund is not subject to income taxes to the extent such distributions are made. Therefore, no federal income tax provision is required.
As of and during the period ended November 30, 2019, the fund did not have a liability for any unrecognized tax benefits. The fund recognizes interest and penalties, if any, related to unrecognized tax benefits as income tax expense in the statement of operations. During the period, the fund did not incur any significant interest or penalties.
The fund’s tax returns are not subject to examination by federal, state and, if applicable, non-U.S. tax authorities after the expiration of each jurisdiction’s statute of limitations, which is generally three years after the date of filing but can be extended in certain jurisdictions.
Non-U.S. taxation — Dividend and interest income are recorded net of non-U.S. taxes paid. The fund may file withholding tax reclaims in certain jurisdictions to recover a portion of amounts previously withheld. As a result of rulings from European courts, the fund filed for additional reclaims related to prior years. These reclaims are recorded when the amount is known and there are no significant uncertainties on collectability. Gains realized by the fund on the sale of securities in certain countries, if any, may be subject to non-U.S. taxes. If applicable, the fund records an estimated deferred tax liability based on unrealized gains to provide for potential non-U.S. taxes payable upon the sale of these securities.
Distributions — Distributions paid to shareholders are based on net investment income and net realized gains determined on a tax basis, which may differ from net investment income and net realized gains for financial reporting purposes. These differences are due primarily to different treatment for items such as currency gains and losses; short-term capital gains and losses; capital losses related to sales of certain securities within 30 days of purchase; cost of investments sold and income on certain investments. The fiscal year in which amounts are distributed may differ from the year in which the net investment income and net realized gains are recorded by the fund for financial reporting purposes. The fund may also designate a portion of the amount paid to redeeming shareholders as a distribution for tax purposes.
During the year ended November 30, 2019, the fund reclassified $106,173,000 from total distributable earnings to capital paid in on shares of beneficial interest to align financial reporting with tax reporting.
As of November 30, 2019, the tax basis components of distributable earnings, unrealized appreciation (depreciation) and cost of investments were as follows (dollars in thousands):
| Undistributed ordinary income | $ | 80,500 | |
| Undistributed long-term capital gains | | 1,492,763 | |
| Gross unrealized appreciation on investments | | 6,914,101 | |
| Gross unrealized depreciation on investments | | (341,816 | ) |
| Net unrealized appreciation on investments | | 6,572,285 | |
| Cost of investments | | 15,551,459 | |
Distributions paid were characterized for tax purposes as follows (dollars in thousands):
| | | Year ended November 30, 2019 | | | Year ended November 30, 2018 | |
| Share class | | Ordinary
income | | | Long-term
capital gains | | | Total
distributions
paid | | | Ordinary
income | | | Long-term
capital gains | | | Total
distributions
paid | |
| Class A | | $ | 62,394 | | | $ | 965,227 | | | $ | 1,027,621 | | | $ | 19,873 | | | $ | 904,068 | | | $ | 923,941 | |
| Class C | | | — | | | | 48,104 | | | | 48,104 | | | | — | | | | 44,352 | | | | 44,352 | |
| Class T | | | — | * | | | 1 | | | | 1 | | | | — | * | | | 1 | | | | 1 | |
| Class F-1 | | | 1,277 | | | | 24,898 | | | | 26,175 | | | | 368 | | | | 26,807 | | | | 27,175 | |
| Class F-2 | | | 10,513 | | | | 111,102 | | | | 121,615 | | | | 3,724 | | | | 79,263 | | | | 82,987 | |
| Class F-3 | | | 4,513 | | | | 42,715 | | | | 47,228 | | | | 1,489 | | | | 25,141 | | | | 26,630 | |
| Class 529-A | | | 2,884 | | | | 50,606 | | | | 53,490 | | | | 863 | | | | 44,902 | | | | 45,765 | |
| Class 529-C | | | — | | | | 9,601 | | | | 9,601 | | | | — | | | | 9,322 | | | | 9,322 | |
| Class 529-E | | | 65 | | | | 2,402 | | | | 2,467 | | | | — | | | | 2,099 | | | | 2,099 | |
| Class 529-T | | | — | * | | | 1 | | | | 1 | | | | — | * | | | 1 | | | | 1 | |
| Class 529-F-1 | | | 398 | | | | 4,479 | | | | 4,877 | | | | 133 | | | | 3,405 | | | | 3,538 | |
| Class R-1 | | | — | | | | 3,699 | | | | 3,699 | | | | — | | | | 4,001 | | | | 4,001 | |
| Class R-2 | | | — | | | | 16,607 | | | | 16,607 | | | | — | | | | 15,940 | | | | 15,940 | |
| Class R-2E | | | 17 | | | | 855 | | | | 872 | | | | — | | | | 537 | | | | 537 | |
| Class R-3 | | | 425 | | | | 25,829 | | | | 26,254 | | | | — | | | | 26,031 | | | | 26,031 | |
| Class R-4 | | | 1,720 | | | | 30,357 | | | | 32,077 | | | | 625 | | | | 33,069 | | | | 33,694 | |
| Class R-5E | | | 66 | | | | 703 | | | | 769 | | | | 1 | | | | 12 | | | | 13 | |
| Class R-5 | | | 1,025 | | | | 10,406 | | | | 11,431 | | | | 534 | | | | 10,245 | | | | 10,779 | |
| Class R-6 | | | 25,693 | | | | 241,524 | | | | 267,217 | | | | 10,806 | | | | 188,283 | | | | 199,089 | |
| Total | | $ | 110,990 | | | $ | 1,589,116 | | | $ | 1,700,106 | �� | | $ | 38,416 | | | $ | 1,417,479 | | | $ | 1,455,895 | |
| * | Amount less than one thousand. |
6. Fees and transactions with related parties
CRMC, the fund’s investment adviser, is the parent company of American Funds Distributors®, Inc. (“AFD”), the principal underwriter of the fund’s shares, and American Funds Service Company® (“AFS”), the fund’s transfer agent. CRMC, AFD and AFS are considered related parties to the fund.
Investment advisory services — The fund has an investment advisory and service agreement with CRMC that provides for monthly fees accrued daily. These fees are based on a series of decreasing annual rates beginning with 0.580% on the first $500 million of daily net assets and decreasing to 0.345% on such assets in excess of $27 billion. For the year ended November 30, 2019, the investment advisory services fee was $78,720,000, which was equivalent to an annualized rate of 0.379% of average daily net assets.
Class-specific fees and expenses — Expenses that are specific to individual share classes are accrued directly to the respective share class. The principal class-specific fees and expenses are further described below:
Distribution services — The fund has plans of distribution for all share classes, except Class F-2, F-3, R-5E, R-5 and R-6 shares. Under the plans, the board of trustees approves certain categories of expenses that are used to finance activities primarily intended to sell fund shares and service existing accounts. The plans provide for payments, based on an annualized percentage of average daily net assets, ranging from 0.25% to 1.00% as noted in this section. In some cases, the board of trustees has limited the amounts that may be paid to less than the maximum allowed by the plans. All share classes with a plan may use up to 0.25% of average daily net assets to pay service fees, or to compensate AFD for paying service fees, to firms that have entered into agreements with AFD to provide certain shareholder services. The remaining amounts available to be paid under each plan are paid to dealers to compensate them for their sales activities.
| Share class | | Currently approved limits | | Plan limits |
| Class A | | | 0.25 | % | | | 0.25 | % |
| Class 529-A | | | 0.25 | | | | 0.50 | |
| Classes C, 529-C and R-1 | | | 1.00 | | | | 1.00 | |
| Class R-2 | | | 0.75 | | | | 1.00 | |
| Class R-2E | | | 0.60 | | | | 0.85 | |
| Classes 529-E and R-3 | | | 0.50 | | | | 0.75 | |
| Classes T, F-1, 529-T, 529-F-1 and R-4 | | | 0.25 | | | | 0.50 | |
For Class A and 529-A shares, distribution-related expenses include the reimbursement of dealer and wholesaler commissions paid by AFD for certain shares sold without a sales charge. These share classes reimburse AFD for amounts billed within the prior 15 months but only to the extent that the overall annual expense limits are not exceeded. As of November 30, 2019, there were no unreimbursed expenses subject to reimbursement for Class A or 529-A shares.
Transfer agent services — The fund has a shareholder services agreement with AFS under which the fund compensates AFS for providing transfer agent services to each of the fund’s share classes. These services include recordkeeping, shareholder communications and transaction processing. In addition, the fund reimburses AFS for amounts paid to third parties for performing transfer agent services on behalf of fund shareholders.
Administrative services — The fund has an administrative services agreement with CRMC under which the fund compensates CRMC for providing administrative services to all share classes. Administrative services are provided by CRMC and its affiliates to help assist third parties providing non-distribution services to fund shareholders. These services include providing in depth information on the fund and market developments that impact fund investments. Administrative services also include, but are not limited to, coordinating, monitoring and overseeing third parties that provide services to fund shareholders. The agreement provides the fund the ability to charge an administrative services fee at the annual rate of 0.05% of the daily net assets attributable to each share class of the fund. Prior to July 1, 2019, Class A shares paid CRMC an administrative services fee at the annual rate of 0.01% of daily net assets and all other share classes paid a fee at the annual rate of 0.05% of their respective daily net assets. The fund’s board of trustees authorized the fund to pay CRMC effective July 1, 2019, an administrative services fee at the annual rate of 0.03% of the average daily net assets attributable to each share class of the fund (which could increase as noted above) for CRMC’s provision of administrative services.
529 plan services — Each 529 share class is subject to service fees to compensate the Virginia College Savings Plan (“Virginia529”) for its oversight and administration of the CollegeAmerica 529 college savings plan. The fee is based on the combined net assets invested in Class 529 and ABLE shares of the American Funds. Class ABLE shares are offered on other American Funds by Virginia529 through ABLEAmerica®, a tax-advantaged savings program for individuals with disabilities. The quarterly fee is based on
a series of decreasing annual rates beginning with 0.10% on the first $20 billion of the combined net assets invested in the American Funds and decreasing to 0.03% on such assets in excess of $100 billion. The fee for any given calendar quarter is accrued and calculated on the basis of the average net assets of Class 529 and ABLE shares of the American Funds for the last month of the prior calendar quarter. The fee is included in other expenses in the fund’s statement of operations. Virginia529 is not considered a related party to the fund.
For the year ended November 30, 2019, class-specific expenses under the agreements were as follows (dollars in thousands):
| Share class | | Distribution
services | | Transfer agent
services | | Administrative
services | | 529 plan
services | |
| Class A | | $30,851 | | $14,396 | | $2,322 | | Not applicable | |
| Class C | | 5,301 | | 615 | | 222 | | Not applicable | |
| Class T | | — | | — | * | — | * | Not applicable | |
| Class F-1 | | 782 | | 442 | | 131 | | Not applicable | |
| Class F-2 | | Not applicable | | 1,627 | | 617 | | Not applicable | |
| Class F-3 | | Not applicable | | 49 | | 250 | | Not applicable | |
| Class 529-A | | 1,464 | | 669 | | 272 | | $430 | |
| Class 529-C | | 1,047 | | 110 | | 44 | | 70 | |
| Class 529-E | | 150 | | 18 | | 12 | | 20 | |
| Class 529-T | | — | | — | * | — | * | — | * |
| Class 529-F-1 | | — | | 60 | | 24 | | 39 | |
| Class R-1 | | 420 | | 46 | | 18 | | Not applicable | |
| Class R-2 | | 1,472 | | 701 | | 82 | | Not applicable | |
| Class R-2E | | 69 | | 24 | | 5 | | Not applicable | |
| Class R-3 | | 1,525 | | 481 | | 127 | | Not applicable | |
| Class R-4 | | 884 | | 369 | | 149 | | Not applicable | |
| Class R-5E | | Not applicable | | 38 | | 10 | | Not applicable | |
| Class R-5 | | Not applicable | | 64 | | 53 | | Not applicable | |
| Class R-6 | | Not applicable | | 17 | | 1,400 | | Not applicable | |
| Total class-specific expenses | | $43,965 | | $19,726 | | $5,738 | | $559 | |
| * | Amount less than one thousand. |
Trustees’ deferred compensation — Trustees who are unaffiliated with CRMC may elect to defer the cash payment of part or all of their compensation. These deferred amounts, which remain as liabilities of the fund, are treated as if invested in shares of the fund or other American Funds. These amounts represent general, unsecured liabilities of the fund and vary according to the total returns of the selected funds. Trustees’ compensation of $738,000 in the fund’s statement of operations reflects $450,000 in current fees (either paid in cash or deferred) and a net increase of $288,000 in the value of the deferred amounts.
Affiliated officers and trustees — Officers and certain trustees of the fund are or may be considered to be affiliated with CRMC, AFD and AFS. No affiliated officers or trustees received any compensation directly from the fund.
Investment in CCF — The fund holds shares of CCF, an institutional prime money market fund managed by CRMC. CCF invests in high-quality, short-term money market instruments. CCF is used as the primary investment vehicle for the fund’s short-term investments. CCF shares are only available for purchase by CRMC, its affiliates, and other funds managed by CRMC and are not available to the public. CRMC does not receive an investment advisory services fee from CCF.
Security transactions with related funds — The fund purchased securities from, and sold securities to, other funds managed by CRMC (or funds managed by certain affiliates of CRMC) under procedures adopted by the fund’s board of trustees. The funds involved in such transactions are considered related by virtue of having a common investment adviser (or affiliated investment advisers), common trustees and/or common officers. Each transaction was executed at the current market price of the security and no brokerage commissions or fees were paid in accordance with Rule 17a-7 of the 1940 Act. During the year ended November 30, 2019, the fund engaged in such purchase and sale transactions with related funds in the amounts of $367,371,000 and $912,068,000, respectively, which generated $9,728,000 of net realized losses from sales.
Interfund lending — Pursuant to an exemptive order issued by the SEC, the fund, along with other CRMC-managed funds (or funds managed by certain affiliates of CRMC), may participate in an interfund lending program. The program provides an alternate credit facility that permits the funds to lend or borrow cash for temporary purposes directly to or from one another, subject to the conditions of the exemptive order. The fund borrowed $10,000 at a rate of 2.79% from one or more CRMC-managed funds during the year ended November 30, 2019. The fund paid less than $1,000 in interest expense for the loan.
7. Capital share transactions
Capital share transactions in the fund were as follows (dollars and shares in thousands):
| | | Sales* | | | Reinvestments of
distributions | | | Repurchases* | | | Net increase
(decrease) | |
| Share class | | Amount | | | Shares | | | Amount | | | Shares | | | Amount | | | Shares | | | Amount | | | Shares | |
| | | | | | | | | | | | | | | | | |
| Year ended November 30, 2019 | | | | | | | | | | | | |
| | | | | | | | | | | | | |
| Class A | | $ | 951,366 | | | | 21,770 | | | $ | 1,008,844 | | | | 26,204 | | | $ | (1,635,612 | ) | | | (37,454 | ) | | $ | 324,598 | | | | 10,520 | |
| Class C | | | 62,744 | | | | 1,617 | | | | 47,794 | | | | 1,396 | | | | (142,746 | ) | | | (3,676 | ) | | | (32,208 | ) | | | (663 | ) |
| Class T | | | — | | | | — | | | | — | | | | — | | | | — | | | | — | | | | — | | | | — | |
| Class F-1 | | | 67,917 | | | | 1,524 | | | | 25,790 | | | | 668 | | | | (95,128 | ) | | | (2,163 | ) | | | (1,421 | ) | | | 29 | |
| Class F-2 | | | 428,397 | | | | 9,827 | | | | 116,479 | | | | 3,033 | | | | (446,098 | ) | | | (10,263 | ) | | | 98,778 | | | | 2,597 | |
| Class F-3 | | | 212,486 | | | | 4,837 | | | | 45,030 | | | | 1,170 | | | | (133,169 | ) | | | (3,042 | ) | | | 124,347 | | | | 2,965 | |
| Class 529-A | | | 78,757 | | | | 1,811 | | | | 53,461 | | | | 1,404 | | | | (102,617 | ) | | | (2,362 | ) | | | 29,601 | | | | 853 | |
| Class 529-C | | | 12,014 | | | | 305 | | | | 9,599 | | | | 276 | | | | (29,237 | ) | | | (740 | ) | | | (7,624 | ) | | | (159 | ) |
| Class 529-E | | | 3,561 | | | | 83 | | | | 2,466 | | | | 66 | | | | (5,726 | ) | | | (134 | ) | | | 301 | | | | 15 | |
| Class 529-T | | | — | | | | — | | | | 1 | | | | — | † | | | — | | | | — | | | | 1 | | | | — | † |
| Class 529-F-1 | | | 10,741 | | | | 248 | | | | 4,873 | | | | 128 | | | | (9,867 | ) | | | (229 | ) | | | 5,747 | | | | 147 | |
| Class R-1 | | | 5,101 | | | | 126 | | | | 3,699 | | | | 104 | | | | (15,246 | ) | | | (376 | ) | | | (6,446 | ) | | | (146 | ) |
| Class R-2 | | | 42,962 | | | | 1,056 | | | | 16,602 | | | | 465 | | | | (59,217 | ) | | | (1,461 | ) | | | 347 | | | | 60 | |
| Class R-2E | | | 3,956 | | | | 91 | | | | 872 | | | | 23 | | | | (3,245 | ) | | | (75 | ) | | | 1,583 | | | | 39 | |
| Class R-3 | | | 53,825 | | | | 1,256 | | | | 26,119 | | | | 695 | | | | (108,427 | ) | | | (2,545 | ) | | | (28,483 | ) | | | (594 | ) |
| Class R-4 | | | 52,393 | | | | 1,205 | | | | 32,015 | | | | 840 | | | | (150,041 | ) | | | (3,436 | ) | | | (65,633 | ) | | | (1,391 | ) |
| Class R-5E | | | 47,017 | | | | 1,042 | | | | 768 | | | | 20 | | | | (4,173 | ) | | | (94 | ) | | | 43,612 | | | | 968 | |
| Class R-5 | | | 14,798 | | | | 337 | | | | 11,352 | | | | 293 | | | | (38,119 | ) | | | (877 | ) | | | (11,969 | ) | | | (247 | ) |
| Class R-6 | | | 632,216 | | | | 14,471 | | | | 267,208 | | | | 6,935 | | | | (313,548 | ) | | | (7,063 | ) | | | 585,876 | | | | 14,343 | |
| Total net increase (decrease) | | $ | 2,680,251 | | | | 61,606 | | | $ | 1,672,972 | | | | 43,720 | | | $ | (3,292,216 | ) | | | (75,990 | ) | | $ | 1,061,007 | | | | 29,336 | |
| | | | | | | | | | | | | | | | | | | | | | | | | | | | | | | | | |
| Year ended November 30, 2018 | | | | | | | | | | | | | | | | | | | | | | |
| | | | | | | | | | | | | | | | | | | | | | | |
| Class A | | $ | 1,652,612 | | | | 34,509 | | | $ | 905,213 | | | | 20,183 | | | $ | (1,849,156 | ) | | | (39,051 | ) | | $ | 708,669 | | | | 15,641 | |
| Class C | | | 135,633 | | | | 3,152 | | | | 44,004 | | | | 1,089 | | | | (138,565 | ) | | | (3,245 | ) | | | 41,072 | | | | 996 | |
| Class T | | | — | | | | — | | | | — | | | | — | | | | — | | | | — | | | | — | | | | — | |
| Class F-1 | | | 114,484 | | | | 2,382 | | | | 26,845 | | | | 596 | | | | (173,917 | ) | | | (3,625 | ) | | | (32,588 | ) | | | (647 | ) |
| Class F-2 | | | 744,821 | | | | 15,663 | | | | 79,515 | | | | 1,776 | | | | (397,136 | ) | | | (8,503 | ) | | | 427,200 | | | | 8,936 | |
| Class F-3 | | | 322,804 | | | | 6,775 | | | | 25,125 | | | | 560 | | | | (105,665 | ) | | | (2,228 | ) | | | 242,264 | | | | 5,107 | |
| Class 529-A | | | 147,446 | | | | 3,108 | | | | 45,760 | | | | 1,030 | | | | (93,869 | ) | | | (1,993 | ) | | | 99,337 | | | | 2,145 | |
| Class 529-C | | | 21,274 | | | | 487 | | | | 9,318 | | | | 227 | | | | (59,396 | ) | | | (1,351 | ) | | | (28,804 | ) | | | (637 | ) |
| Class 529-E | | | 6,979 | | | | 150 | | | | 2,099 | | | | 48 | | | | (5,374 | ) | | | (115 | ) | | | 3,704 | | | | 83 | |
| Class 529-T | | | — | | | | — | | | | 1 | | | | — | † | | | — | | | | — | | | | 1 | | | | — | † |
| Class 529-F-1 | | | 21,507 | | | | 461 | | | | 3,537 | | | | 80 | | | | (11,921 | ) | | | (251 | ) | | | 13,123 | | | | 290 | |
| Class R-1 | | | 9,731 | | | | 220 | | | | 4,001 | | | | 96 | | | | (17,191 | ) | | | (390 | ) | | | (3,459 | ) | | | (74 | ) |
| Class R-2 | | | 63,099 | | | | 1,417 | | | | 15,935 | | | | 380 | | | | (72,165 | ) | | | (1,632 | ) | | | 6,869 | | | | 165 | |
| Class R-2E | | | 5,819 | | | | 122 | | | | 536 | | | | 12 | | | | (1,946 | ) | | | (43 | ) | | | 4,409 | | | | 91 | |
| Class R-3 | | | 96,821 | | | | 2,081 | | | | 25,867 | | | | 590 | | | | (129,749 | ) | | | (2,792 | ) | | | (7,061 | ) | | | (121 | ) |
| Class R-4 | | | 97,249 | | | | 2,057 | | | | 33,638 | | | | 757 | | | | (164,330 | ) | | | (3,524 | ) | | | (33,443 | ) | | | (710 | ) |
| Class R-5E | | | 10,534 | | | | 224 | | | | 12 | | | | 1 | | | | (1,693 | ) | | | (36 | ) | | | 8,853 | | | | 189 | |
| Class R-5 | | | 35,550 | | | | 746 | | | | 10,665 | | | | 238 | | | | (44,444 | ) | | | (931 | ) | | | 1,771 | | | | 53 | |
| Class R-6 | | | 702,320 | | | | 14,791 | | | | 199,090 | | | | 4,435 | | | | (212,276 | ) | | | (4,435 | ) | | | 689,134 | | | | 14,791 | |
| Total net increase (decrease) | | $ | 4,188,683 | | | | 88,345 | | | $ | 1,431,161 | | | | 32,098 | | | $ | (3,478,793 | ) | | | (74,145 | ) | | $ | 2,141,051 | | | | 46,298 | |
| * | Includes exchanges between share classes of the fund. |
| † | Amount less than one thousand. |
8. Investment transactions
The fund made purchases and sales of investment securities, excluding short-term securities and U.S. government obligations, if any, of $7,629,899,000 and $7,274,396,000, respectively, during the year ended November 30, 2019.
Financial highlights
| | | | | | Income (loss) from
investment operations1 | | | Dividends and distributions | | | | | | | | | | | | | | | | | | | |
| Period ended | | Net asset
value,
beginning
of period | | | Net
investment
income
(loss) | | | Net gains
(losses) on
securities
(both
realized and
unrealized) | | | Total from
investment
operations | | | Dividends
(from net
investment
income) | | | Distributions
(from capital
gains) | | | Total
dividends
and
distributions | | | Net asset
value,
end
of period | | | Total
return2,3 | | | Net assets,
end of period
(in millions) | | | Ratio of
expenses to
average net
assets before
reimbursements4 | | | Ratio of
expenses to
average net
assets after
reimbursements3,4 | | | Ratio of
net income
(loss)
to average
net assets3 | |
| Class A: | | | | | | | | | | | | | | | | | | | | | | | | | | | | | | | | | | | | | | | | | | | | | | | | | | | | |
| 11/30/2019 | | $ | 45.74 | | | $ | .23 | | | $ | 5.52 | | | $ | 5.75 | | | $ | (.24 | ) | | $ | (3.65 | ) | | $ | (3.89 | ) | | $ | 47.60 | | | | 14.56 | % | | $ | 13,160 | | | | .78 | % | | | .78 | % | | | .51 | % |
| 11/30/2018 | | | 48.26 | | | | .24 | | | | .94 | | | | 1.18 | | | | (.08 | ) | | | (3.62 | ) | | | (3.70 | ) | | | 45.74 | | | | 2.59 | | | | 12,165 | | | | .76 | | | | .76 | | | | .49 | |
| 11/30/2017 | | | 36.67 | | | | .11 | | | | 12.29 | | | | 12.40 | | | | (.10 | ) | | | (.71 | ) | | | (.81 | ) | | | 48.26 | | | | 34.53 | | | | 12,079 | | | | .78 | | | | .78 | | | | .25 | |
| 11/30/2016 | | | 38.93 | | | | .11 | | | | (.15 | ) | | | (.04 | ) | | | (.16 | ) | | | (2.06 | ) | | | (2.22 | ) | | | 36.67 | | | | .00 | | | | 9,702 | | | | .81 | | | | .81 | | | | .30 | |
| 11/30/2015 | | | 40.58 | | | | .11 | | | | 1.47 | | | | 1.58 | | | | (.20 | ) | | | (3.03 | ) | | | (3.23 | ) | | | 38.93 | | | | 4.27 | | | | 10,666 | | | | .78 | | | | .78 | | | | .29 | |
| Class C: | | | | | | | | | | | | | | | | | | | | | | | | | | | | | | | | | | | | | | | | | | | | | | | | | | | | |
| 11/30/2019 | | | 40.90 | | | | (.10 | ) | | | 4.86 | | | | 4.76 | | | | — | | | | (3.65 | ) | | | (3.65 | ) | | | 42.01 | | | | 13.69 | | | | 531 | | | | 1.55 | | | | 1.55 | | | | (.25 | ) |
| 11/30/2018 | | | 43.77 | | | | (.13 | ) | | | .88 | | | | .75 | | | | — | | | | (3.62 | ) | | | (3.62 | ) | | | 40.90 | | | | 1.81 | | | | 544 | | | | 1.55 | | | | 1.55 | | | | (.30 | ) |
| 11/30/2017 | | | 33.51 | | | | (.21 | ) | | | 11.18 | | | | 10.97 | | | | — | | | | (.71 | ) | | | (.71 | ) | | | 43.77 | | | | 33.42 | | | | 539 | | | | 1.59 | | | | 1.59 | | | | (.55 | ) |
| 11/30/2016 | | | 35.89 | | | | (.16 | ) | | | (.16 | ) | | | (.32 | ) | | | — | | | | (2.06 | ) | | | (2.06 | ) | | | 33.51 | | | | (.82 | ) | | | 460 | | | | 1.62 | | | | 1.62 | | | | (.51 | ) |
| 11/30/2015 | | | 37.74 | | | | (.18 | ) | | | 1.36 | | | | 1.18 | | | | — | | | | (3.03 | ) | | | (3.03 | ) | | | 35.89 | | | | 3.44 | | | | 542 | | | | 1.59 | | | | 1.59 | | | | (.51 | ) |
| Class T: | | | | | | | | | | | | | | | | | | | | | | | | | | | | | | | | | | | | | | | | | | | | | | | | | | | | |
| 11/30/2019 | | | 45.80 | | | | .33 | | | | 5.51 | | | | 5.84 | | | | (.33 | ) | | | (3.65 | ) | | | (3.98 | ) | | | 47.66 | | | | 14.83 | 5 | | | — | 6 | | | .54 | 5 | | | .54 | 5 | | | .75 | 5 |
| 11/30/2018 | | | 48.32 | | | | .33 | | | | .94 | | | | 1.27 | | | | (.17 | ) | | | (3.62 | ) | | | (3.79 | ) | | | 45.80 | | | | 2.80 | 5 | | | — | 6 | | | .56 | 5 | | | .56 | 5 | | | .69 | 5 |
| 11/30/20177,8 | | | 39.44 | | | | .12 | | | | 8.76 | | | | 8.88 | | | | — | | | | — | | | | — | | | | 48.32 | | | | 22.52 | 5,9 | | | — | 6 | | | .59 | 5,10 | | | .59 | 5,10 | | | .43 | 5,10 |
| Class F-1: | | | | | | | | | | | | | | | | | | | | | | | | | | | | | | | | | | | | | | | | | | | | | | | | | | | | |
| 11/30/2019 | | | 45.85 | | | | .21 | | | | 5.54 | | | | 5.75 | | | | (.19 | ) | | | (3.65 | ) | | | (3.84 | ) | | | 47.76 | | | | 14.50 | | | | 329 | | | | .83 | | | | .83 | | | | .47 | |
| 11/30/2018 | | | 48.36 | | | | .21 | | | | .95 | | | | 1.16 | | | | (.05 | ) | | | (3.62 | ) | | | (3.67 | ) | | | 45.85 | | | | 2.54 | | | | 315 | | | | .83 | | | | .83 | | | | .43 | |
| 11/30/2017 | | | 36.73 | | | | .08 | | | | 12.32 | | | | 12.40 | | | | (.06 | ) | | | (.71 | ) | | | (.77 | ) | | | 48.36 | | | | 34.46 | | | | 363 | | | | .84 | | | | .84 | | | | .19 | |
| 11/30/2016 | | | 38.99 | | | | .09 | | | | (.17 | ) | | | (.08 | ) | | | (.12 | ) | | | (2.06 | ) | | | (2.18 | ) | | | 36.73 | | | | (.08 | ) | | | 305 | | | | .85 | | | | .85 | | | | .26 | |
| 11/30/2015 | | | 40.60 | | | | .10 | | | | 1.47 | | | | 1.57 | | | | (.15 | ) | | | (3.03 | ) | | | (3.18 | ) | | | 38.99 | | | | 4.23 | | | | 404 | | | | .83 | | | | .83 | | | | .25 | |
| Class F-2: | | | | | | | | | | | | | | | | | | | | | | | | | | | | | | | | | | | | | | | | | | | | | | | | | | | | |
| 11/30/2019 | | | 45.75 | | | | .33 | | | | 5.50 | | | | 5.83 | | | | (.35 | ) | | | (3.65 | ) | | | (4.00 | ) | | | 47.58 | | | | 14.81 | | | | 1,586 | | | | .55 | | | | .55 | | | | .75 | |
| 11/30/2018 | | | 48.26 | | | | .34 | | | | .94 | | | | 1.28 | | | | (.17 | ) | | | (3.62 | ) | | | (3.79 | ) | | | 45.75 | | | | 2.82 | | | | 1,406 | | | | .55 | | | | .55 | | | | .71 | |
| 11/30/2017 | | | 36.69 | | | | .19 | | | | 12.28 | | | | 12.47 | | | | (.19 | ) | | | (.71 | ) | | | (.90 | ) | | | 48.26 | | | | 34.81 | | | | 1,052 | | | | .57 | | | | .57 | | | | .46 | |
| 11/30/2016 | | | 38.96 | | | | .19 | | | | (.16 | ) | | | .03 | | | | (.24 | ) | | | (2.06 | ) | | | (2.30 | ) | | | 36.69 | | | | .22 | | | | 751 | | | | .58 | | | | .58 | | | | .53 | |
| 11/30/2015 | | | 40.63 | | | | .19 | | | | 1.47 | | | | 1.66 | | | | (.30 | ) | | | (3.03 | ) | | | (3.33 | ) | | | 38.96 | | | | 4.49 | | | | 776 | | | | .57 | | | | .57 | | | | .50 | |
| Class F-3: | | | | | | | | | | | | | | | | | | | | | | | | | | | | | | | | | | | | | | | | | | | | | | | | | | | | |
| 11/30/2019 | | | 45.87 | | | | .37 | | | | 5.52 | | | | 5.89 | | | | (.39 | ) | | | (3.65 | ) | | | (4.04 | ) | | | 47.72 | | | | 14.93 | | | | 705 | | | | .45 | | | | .45 | | | | .84 | |
| 11/30/2018 | | | 48.38 | | | | .39 | | | | .93 | | | | 1.32 | | | | (.21 | ) | | | (3.62 | ) | | | (3.83 | ) | | | 45.87 | | | | 2.91 | | | | 541 | | | | .46 | | | | .46 | | | | .81 | |
| 11/30/20177,11 | | | 37.90 | | | | .20 | | | | 10.28 | | | | 10.48 | | | | — | | | | — | | | | — | | | | 48.38 | | | | 27.65 | 9 | | | 324 | | | | .47 | 10 | | | .47 | 10 | | | .53 | 10 |
| Class 529-A: | | | | | | | | | | | | | | | | | | | | | | | | | | | | | | | | | | | | | | | | | | | | | | | | | | | | |
| 11/30/2019 | | | 45.25 | | | | .20 | | | | 5.46 | | | | 5.66 | | | | (.21 | ) | | | (3.65 | ) | | | (3.86 | ) | | | 47.05 | | | | 14.51 | | | | 694 | | | | .83 | | | | .83 | | | | .46 | |
| 11/30/2018 | | | 47.80 | | | | .20 | | | | .94 | | | | 1.14 | | | | (.07 | ) | | | (3.62 | ) | | | (3.69 | ) | | | 45.25 | | | | 2.53 | | | | 629 | | | | .83 | | | | .83 | | | | .43 | |
| 11/30/2017 | | | 36.33 | | | | .08 | | | | 12.17 | | | | 12.25 | | | | (.07 | ) | | | (.71 | ) | | | (.78 | ) | | | 47.80 | | | | 34.44 | | | | 561 | | | | .85 | | | | .85 | | | | .19 | |
| 11/30/2016 | | | 38.60 | | | | .08 | | | | (.16 | ) | | | (.08 | ) | | | (.13 | ) | | | (2.06 | ) | | | (2.19 | ) | | | 36.33 | | | | (.10 | ) | | | 416 | | | | .88 | | | | .88 | | | | .23 | |
| 11/30/2015 | | | 40.27 | | | | .08 | | | | 1.46 | | | | 1.54 | | | | (.18 | ) | | | (3.03 | ) | | | (3.21 | ) | | | 38.60 | | | | 4.19 | | | | 431 | | | | .86 | | | | .86 | | | | .21 | |
| | | | | | Income (loss) from
investment operations1 | | | Dividends and distributions | | | | | | | | | | | | | | | | | | | |
| Period ended | | Net asset
value,
beginning
of period | | | Net
investment
income
(loss) | | | Net gains
(losses) on
securities
(both
realized and
unrealized) | | | Total from
investment
operations | | | Dividends
(from net
investment
income) | | | Distributions
(from capital
gains) | | | Total
dividends
and
distributions | | | Net asset
value,
end
of period | | | Total
return2,3 | | | Net assets,
end of period
(in millions) | | | Ratio of
expenses to
average net
assets before
reimbursements4 | | | Ratio of
expenses to
average net
assets after
reimbursements3,4 | | | Ratio of
net income
(loss)
to average
net assets3 | |
| Class 529-C: | | | | | | | | | | | | | | | | | | | | | | | | | | | | | | | | | | | | | | | | | | | | | | | | | | | | |
| 11/30/2019 | | $ | 41.45 | | | $ | (.12 | ) | | $ | 4.94 | | | $ | 4.82 | | | $ | — | | | $ | (3.65 | ) | | $ | (3.65 | ) | | $ | 42.62 | | | | 13.62 | % | | $ | 106 | | | | 1.59 | % | | | 1.59 | % | | | (.30 | )% |
| 11/30/2018 | | | 44.33 | | | | (.15 | ) | | | .89 | | | | .74 | | | | — | | | | (3.62 | ) | | | (3.62 | ) | | | 41.45 | | | | 1.76 | | | | 110 | | | | 1.60 | | | | 1.60 | | | | (.35 | ) |
| 11/30/2017 | | | 33.94 | | | | (.23 | ) | | | 11.33 | | | | 11.10 | | | | — | | | | (.71 | ) | | | (.71 | ) | | | 44.33 | | | | 33.38 | | | | 146 | | | | 1.64 | | | | 1.64 | | | | (.60 | ) |
| 11/30/2016 | | | 36.35 | | | | (.19 | ) | | | (.16 | ) | | | (.35 | ) | | | — | | | | (2.06 | ) | | | (2.06 | ) | | | 33.94 | | | | (.90 | ) | | | 114 | | | | 1.67 | | | | 1.67 | | | | (.57 | ) |
| 11/30/2015 | | | 38.21 | | | | (.21 | ) | | | 1.38 | | | | 1.17 | | | | — | | | | (3.03 | ) | | | (3.03 | ) | | | 36.35 | | | | 3.37 | | | | 120 | | | | 1.66 | | | | 1.66 | | | | (.59 | ) |
| Class 529-E: | | | | | | | | | | | | | | | | | | | | | | | | | | | | | | | | | | | | | | | | | | | | | | | | | | | | |
| 11/30/2019 | | | 44.52 | | | | .10 | | | | 5.37 | | | | 5.47 | | | | (.10 | ) | | | (3.65 | ) | | | (3.75 | ) | | | 46.24 | | | | 14.24 | | | | 31 | | | | 1.07 | | | | 1.07 | | | | .23 | |
| 11/30/2018 | | | 47.11 | | | | .09 | | | | .94 | | | | 1.03 | | | | — | | | | (3.62 | ) | | | (3.62 | ) | | | 44.52 | | | | 2.31 | | | | 29 | | | | 1.07 | | | | 1.07 | | | | .19 | |
| 11/30/2017 | | | 35.83 | | | | (.02 | ) | | | 12.01 | | | | 11.99 | | | | — | | | | (.71 | ) | | | (.71 | ) | | | 47.11 | | | | 34.11 | | | | 27 | | | | 1.09 | | | | 1.09 | | | | (.05 | ) |
| 11/30/2016 | | | 38.09 | | | | — | 12 | | | (.16 | ) | | | (.16 | ) | | | (.04 | ) | | | (2.06 | ) | | | (2.10 | ) | | | 35.83 | | | | (.33 | ) | | | 21 | | | | 1.12 | | | | 1.12 | | | | (.01 | ) |
| 11/30/2015 | | | 39.78 | | | | (.01 | ) | | | 1.43 | | | | 1.42 | | | | (.08 | ) | | | (3.03 | ) | | | (3.11 | ) | | | 38.09 | | | | 3.92 | | | | 22 | | | | 1.11 | | | | 1.11 | | | | (.04 | ) |
| Class 529-T: | | | | | | | | | | | | | | | | | | | | | | | | | | | | | | | | | | | | | | | | | | | | | | | | | | | | |
| 11/30/2019 | | | 45.78 | | | | .31 | | | | 5.51 | | | | 5.82 | | | | (.31 | ) | | | (3.65 | ) | | | (3.96 | ) | | | 47.64 | | | | 14.78 | 5 | | | — | 6 | | | .59 | 5 | | | .59 | 5 | | | .70 | 5 |
| 11/30/2018 | | | 48.30 | | | | .31 | | | | .95 | | | | 1.26 | | | | (.16 | ) | | | (3.62 | ) | | | (3.78 | ) | | | 45.78 | | | | 2.77 | 5 | | | — | 6 | | | .61 | 5 | | | .61 | 5 | | | .64 | 5 |
| 11/30/20177,8 | | | 39.44 | | | | .11 | | | | 8.75 | | | | 8.86 | | | | — | | | | — | | | | — | | | | 48.30 | | | | 22.46 | 5,9 | | | — | 6 | | | .65 | 5,10 | | | .65 | 5,10 | | | .38 | 5,10 |
| Class 529-F-1: | | | | | | | | | | | | | | | | | | | | | | | | | | | | | | | | | | | | | | | | | | | | | | | | | | | | |
| 11/30/2019 | | | 45.28 | | | | .30 | | | | 5.44 | | | | 5.74 | | | | (.33 | ) | | | (3.65 | ) | | | (3.98 | ) | | | 47.04 | | | | 14.75 | | | | 65 | | | | .61 | | | | .61 | | | | .68 | |
| 11/30/2018 | | | 47.80 | | | | .30 | | | | .94 | | | | 1.24 | | | | (.14 | ) | | | (3.62 | ) | | | (3.76 | ) | | | 45.28 | | | | 2.76 | | | | 55 | | | | .61 | | | | .61 | | | | .64 | |
| 11/30/2017 | | | 36.34 | | | | .16 | | | | 12.16 | | | | 12.32 | | | | (.15 | ) | | | (.71 | ) | | | (.86 | ) | | | 47.80 | | | | 34.71 | | | | 45 | | | | .64 | | | | .64 | | | | .39 | |
| 11/30/2016 | | | 38.61 | | | | .15 | | | | (.16 | ) | | | (.01 | ) | | | (.20 | ) | | | (2.06 | ) | | | (2.26 | ) | | | 36.34 | | | | .14 | | | | 33 | | | | .68 | | | | .68 | | | | .43 | |
| 11/30/2015 | | | 40.28 | | | | .16 | | | | 1.45 | | | | 1.61 | | | | (.25 | ) | | | (3.03 | ) | | | (3.28 | ) | | | 38.61 | | | | 4.37 | | | | 33 | | | | .66 | | | | .66 | | | | .41 | |
| Class R-1: | | | | | | | | | | | | | | | | | | | | | | | | | | | | | | | | | | | | | | | | | | | | | | | | | | | | |
| 11/30/2019 | | | 42.22 | | | | (.10 | ) | | | 5.05 | | | | 4.95 | | | | — | | | | (3.65 | ) | | | (3.65 | ) | | | 43.52 | | | | 13.68 | | | | 39 | | | | 1.55 | | | | 1.55 | | | | (.25 | ) |
| 11/30/2018 | | | 45.07 | | | | (.13 | ) | | | .90 | | | | .77 | | | | — | | | | (3.62 | ) | | | (3.62 | ) | | | 42.22 | | | | 1.81 | | | | 44 | | | | 1.55 | | | | 1.55 | | | | (.30 | ) |
| 11/30/2017 | | | 34.47 | | | | (.20 | ) | | | 11.51 | | | | 11.31 | | | | — | | | | (.71 | ) | | | (.71 | ) | | | 45.07 | | | | 33.47 | | | | 50 | | | | 1.56 | | | | 1.56 | | | | (.52 | ) |
| 11/30/2016 | | | 36.84 | | | | (.15 | ) | | | (.16 | ) | | | (.31 | ) | | | — | | | | (2.06 | ) | | | (2.06 | ) | | | 34.47 | | | | (.77 | ) | | | 47 | | | | 1.57 | | | | 1.57 | | | | (.46 | ) |
| 11/30/2015 | | | 38.66 | | | | (.18 | ) | | | 1.39 | | | | 1.21 | | | | — | | | | (3.03 | ) | | | (3.03 | ) | | | 36.84 | | | | 3.44 | | | | 58 | | | | 1.56 | | | | 1.56 | | | | (.49 | ) |
| Class R-2: | | | | | | | | | | | | | | | | | | | | | | | | | | | | | | | | | | | | | | | | | | | | | | | | | | | | |
| 11/30/2019 | | | 42.47 | | | | (.10 | ) | | | 5.09 | | | | 4.99 | | | | — | | | | (3.65 | ) | | | (3.65 | ) | | | 43.81 | | | | 13.70 | | | | 203 | | | | 1.55 | | | | 1.55 | | | | (.25 | ) |
| 11/30/2018 | | | 45.32 | | | | (.13 | ) | | | .90 | | | | .77 | | | | — | | | | (3.62 | ) | | | (3.62 | ) | | | 42.47 | | | | 1.79 | | | | 195 | | | | 1.55 | | | | 1.55 | | | | (.30 | ) |
| 11/30/2017 | | | 34.65 | | | | (.20 | ) | | | 11.58 | | | | 11.38 | | | | — | | | | (.71 | ) | | | (.71 | ) | | | 45.32 | | | | 33.50 | | | | 200 | | | | 1.56 | | | | 1.56 | | | | (.52 | ) |
| 11/30/2016 | | | 37.03 | | | | (.16 | ) | | | (.16 | ) | | | (.32 | ) | | | — | | | | (2.06 | ) | | | (2.06 | ) | | | 34.65 | | | | (.79 | ) | | | 164 | | | | 1.59 | | | | 1.59 | | | | (.48 | ) |
| 11/30/2015 | | | 38.84 | | | | (.17 | ) | | | 1.39 | | | | 1.22 | | | | — | | | | (3.03 | ) | | | (3.03 | ) | | | 37.03 | | | | 3.45 | | | | 186 | | | | 1.55 | | | | 1.55 | | | | (.47 | ) |
| Class R-2E: | | | | | | | | | | | | | | | | | | | | | | | | | | | | | | | | | | | | | | | | | | | | | | | | | | | | |
| 11/30/2019 | | | 44.88 | | | | .02 | | | | 5.41 | | | | 5.43 | | | | (.07 | ) | | | (3.65 | ) | | | (3.72 | ) | | | 46.59 | | | | 14.02 | | | | 13 | | | | 1.25 | | | | 1.25 | | | | .04 | |
| 11/30/2018 | | | 47.55 | | | | — | 12 | | | .95 | | | | .95 | | | | — | | | | (3.62 | ) | | | (3.62 | ) | | | 44.88 | | | | 2.11 | | | | 10 | | | | 1.26 | | | | 1.26 | | | | (.01 | ) |
| 11/30/2017 | | | 36.29 | | | | (.10 | ) | | | 12.14 | | | | 12.04 | | | | (.07 | ) | | | (.71 | ) | | | (.78 | ) | | | 47.55 | | | | 33.88 | | | | 7 | | | | 1.27 | | | | 1.27 | | | | (.25 | ) |
| 11/30/2016 | | | 38.85 | | | | (.07 | ) | | | (.14 | ) | | | (.21 | ) | | | (.29 | ) | | | (2.06 | ) | | | (2.35 | ) | | | 36.29 | | | | (.44 | ) | | | 2 | | | | 1.26 | | | | 1.26 | | | | (.19 | ) |
| 11/30/2015 | | | 40.60 | | | | .06 | | | | 1.54 | | | | 1.60 | | | | (.32 | ) | | | (3.03 | ) | | | (3.35 | ) | | | 38.85 | | | | 4.33 | 5 | | | — | 6 | | | .84 | 5 | | | .84 | 5 | | | .16 | 5 |
See end of table for footnotes.
Financial highlights(continued)
| | | | | | Income (loss) from
investment operations1 | | | Dividends and distributions | | | | | | | | | | | | | | | | | | | |
| Period ended | | Net asset
value,
beginning
of period | | | Net
investment
income
(loss) | | | Net gains
(losses) on
securities
(both
realized and
unrealized) | | | Total from
investment
operations | | | Dividends
(from net
investment
income) | | | Distributions
(from capital
gains) | | | Total
dividends
and
distributions | | | Net asset
value,
end
of period | | | Total
return2,3 | | | Net assets,
end of period
(in millions) | | | Ratio of
expenses to
average net
assets before
reimbursements4 | | | Ratio of
expenses to
average net
assets after
reimbursements3,4 | | | Ratio of
net income
(loss)
to average
net assets3 | |
| Class R-3: | | | | | | | | | | | | | | | | | | | | | | | | | | | | | | | | | | | | | | | | | | | | | | | | | | | | |
| 11/30/2019 | | $ | 44.58 | | | $ | .09 | | | $ | 5.38 | | | $ | 5.47 | | | $ | (.06 | ) | | $ | (3.65 | ) | | $ | (3.71 | ) | | $ | 46.34 | | | | 14.20 | % | | $ | 303 | | | | 1.10 | % | | | 1.10 | % | | | .20 | % |
| 11/30/2018 | | | 47.20 | | | | .07 | | | | .93 | | | | 1.00 | | | | — | | | | (3.62 | ) | | | (3.62 | ) | | | 44.58 | | | | 2.24 | | | | 318 | | | | 1.10 | | | | 1.10 | | | | .15 | |
| 11/30/2017 | | | 35.90 | | | | (.03 | ) | | | 12.04 | | | | 12.01 | | | | — | | | | (.71 | ) | | | (.71 | ) | | | 47.20 | | | | 34.10 | | | | 342 | | | | 1.11 | | | | 1.11 | | | | (.08 | ) |
| 11/30/2016 | | | 38.14 | | | | (.01 | ) | | | (.15 | ) | | | (.16 | ) | | | (.02 | ) | | | (2.06 | ) | | | (2.08 | ) | | | 35.90 | | | | (.33 | ) | | | 286 | | | | 1.13 | | | | 1.13 | | | | (.02 | ) |
| 11/30/2015 | | | 39.84 | | | | (.01 | ) | | | 1.43 | | | | 1.42 | | | | (.09 | ) | | | (3.03 | ) | | | (3.12 | ) | | | 38.14 | | | | 3.91 | | | | 327 | | | | 1.11 | | | | 1.11 | | | | (.04 | ) |
| Class R-4: | | | | | | | | | | | | | | | | | | | | | | | | | | | | | | | | | | | | | | | | | | | | | | | | | | | | |
| 11/30/2019 | | | 45.29 | | | | .22 | | | | 5.46 | | | | 5.68 | | | | (.21 | ) | | | (3.65 | ) | | | (3.86 | ) | | | 47.11 | | | | 14.54 | | | | 332 | | | | .80 | | | | .80 | | | | .51 | |
| 11/30/2018 | | | 47.82 | | | | .21 | | | | .95 | | | | 1.16 | | | | (.07 | ) | | | (3.62 | ) | | | (3.69 | ) | | | 45.29 | | | | 2.57 | | | | 382 | | | | .80 | | | | .80 | | | | .45 | |
| 11/30/2017 | | | 36.34 | | | | .09 | | | | 12.19 | | | | 12.28 | | | | (.09 | ) | | | (.71 | ) | | | (.80 | ) | | | 47.82 | | | | 34.51 | | | | 438 | | | | .81 | | | | .81 | | | | .23 | |
| 11/30/2016 | | | 38.61 | | | | .10 | | | | (.16 | ) | | | (.06 | ) | | | (.15 | ) | | | (2.06 | ) | | | (2.21 | ) | | | 36.34 | | | | (.04 | ) | | | 348 | | | | .82 | | | | .82 | | | | .29 | |
| 11/30/2015 | | | 40.29 | | | | .10 | | | | 1.46 | | | | 1.56 | | | | (.21 | ) | | | (3.03 | ) | | | (3.24 | ) | | | 38.61 | | | | 4.25 | | | | 397 | | | | .81 | | | | .81 | | | | .27 | |
| Class R-5E: | | | | | | | | | | | | | | | | | | | | | | | | | | | | | | | | | | | | | | | | | | | | | | | | | | | | |
| 11/30/2019 | | | 45.59 | | | | .26 | | | | 5.53 | | | | 5.79 | | | | (.34 | ) | | | (3.65 | ) | | | (3.99 | ) | | | 47.39 | | | | 14.79 | | | | 55 | | | | .57 | | | | .57 | | | | .59 | |
| 11/30/2018 | | | 48.17 | | | | .35 | | | | .91 | | | | 1.26 | | | | (.22 | ) | | | (3.62 | ) | | | (3.84 | ) | | | 45.59 | | | | 2.78 | | | | 9 | | | | .58 | | | | .58 | | | | .73 | |
| 11/30/2017 | | | 36.57 | | | | .19 | | | | 12.27 | | | | 12.46 | | | | (.15 | ) | | | (.71 | ) | | | (.86 | ) | | | 48.17 | | | | 34.86 | | | | — | 6 | | | .61 | | | | .55 | | | | .43 | |
| 11/30/2016 | | | 38.93 | | | | .14 | | | | (.15 | ) | | | (.01 | ) | | | (.29 | ) | | | (2.06 | ) | | | (2.35 | ) | | | 36.57 | | | | .11 | | | | — | 6 | | | .69 | | | | .69 | | | | .41 | |
| 11/30/20157,13 | | | 38.84 | | | | — | 12 | | | .09 | | | | .09 | | | | — | | | | — | | | | — | | | | 38.93 | | | | .23 | 9 | | | — | 6 | | | .02 | 9 | | | .02 | 9 | | | — | 9,14 |
| Class R-5: | | | | | | | | | | | | | | | | | | | | | | | | | | | | | | | | | | | | | | | | | | | | | | | | | | | | |
| 11/30/2019 | | | 46.07 | | | | .36 | | | | 5.54 | | | | 5.90 | | | | (.36 | ) | | | (3.65 | ) | | | (4.01 | ) | | | 47.96 | | | | 14.88 | | | | 126 | | | | .49 | | | | .49 | | | | .81 | |
| 11/30/2018 | | | 48.56 | | | | .36 | | | | .96 | | | | 1.32 | | | | (.19 | ) | | | (3.62 | ) | | | (3.81 | ) | | | 46.07 | | | | 2.88 | | | | 133 | | | | .50 | | | | .50 | | | | .76 | |
| 11/30/2017 | | | 36.91 | | | | .22 | | | | 12.34 | | | | 12.56 | | | | (.20 | ) | | | (.71 | ) | | | (.91 | ) | | | 48.56 | | | | 34.88 | | | | 137 | | | | .51 | | | | .51 | | | | .53 | |
| 11/30/2016 | | | 39.17 | | | | .22 | | | | (.16 | ) | | | .06 | | | | (.26 | ) | | | (2.06 | ) | | | (2.32 | ) | | | 36.91 | | | | .30 | | | | 106 | | | | .52 | | | | .52 | | | | .61 | |
| 11/30/2015 | | | 40.80 | | | | .22 | | | | 1.47 | | | | 1.69 | | | | (.29 | ) | | | (3.03 | ) | | | (3.32 | ) | | | 39.17 | | | | 4.55 | | | | 160 | | | | .50 | | | | .50 | | | | .57 | |
| Class R-6: | | | | | | | | | | | | | | | | | | | | | | | | | | | | | | | | | | | | | | | | | | | | | | | | | | | | |
| 11/30/2019 | | | 45.92 | | | | .38 | | | | 5.52 | | | | 5.90 | | | | (.39 | ) | | | (3.65 | ) | | | (4.04 | ) | | | 47.78 | | | | 14.94 | | | | 3,834 | | | | .44 | | | | .44 | | | | .85 | |
| 11/30/2018 | | | 48.42 | | | | .39 | | | | .94 | | | | 1.33 | | | | (.21 | ) | | | (3.62 | ) | | | (3.83 | ) | | | 45.92 | | | | 2.92 | | | | 3,026 | | | | .45 | | | | .45 | | | | .81 | |
| 11/30/2017 | | | 36.81 | | | | .24 | | | | 12.32 | | | | 12.56 | | | | (.24 | ) | | | (.71 | ) | | | (.95 | ) | | | 48.42 | | | | 34.98 | | | | 2,474 | | | | .46 | | | | .46 | | | | .58 | |
| 11/30/2016 | | | 39.08 | | | | .22 | | | | (.15 | ) | | | .07 | | | | (.28 | ) | | | (2.06 | ) | | | (2.34 | ) | | | 36.81 | | | | .31 | | | | 1,920 | | | | .47 | | | | .47 | | | | .64 | |
| 11/30/2015 | | | 40.73 | | | | .24 | | | | 1.47 | | | | 1.71 | | | | (.33 | ) | | | (3.03 | ) | | | (3.36 | ) | | | 39.08 | | | | 4.61 | | | | 1,590 | | | | .46 | | | | .46 | | | | .62 | |
| | Year ended November 30, |
| | 2019 | 2018 | 2017 | 2016 | 2015 |
| Portfolio turnover rate for all share classes15 | 39% | 38% | 28% | 25% | 34% |
| 1 | Based on average shares outstanding. |
| 2 | Total returns exclude any applicable sales charges, including contingent deferred sales charges. |
| 3 | This column reflects the impact, if any, of certain reimbursements from CRMC. During one of the years shown, CRMC reimbursed a portion of the fund’s transfer agent fees for certain share classes. |
| 4 | Ratios do not include expenses of any Central Funds. The fund indirectly bears its proportionate share of the expenses of any Central Funds. |
| 5 | All or a significant portion of assets in this class consisted of seed capital invested by CRMC and/or its affiliates. Fees for distribution services are not charged or accrued on these seed capital assets. If such fees were paid by the fund on seed capital assets, fund expenses would have been higher and net income and total return would have been lower. |
| 6 | Amount less than $1 million. |
| 7 | Based on operations for a period that is less than a full year. |
| 8 | Class T and 529-T shares began investment operations on April 7, 2017. |
| 9 | Not annualized. |
| 10 | Annualized. |
| 11 | Class F-3 shares began investment operations on January 27, 2017. |
| 12 | Amount less than $.01. |
| 13 | Class R-5E shares began investment operations on November 20, 2015. |
| 14 | Amount less than .01%. |
| 15 | Rates do not include the fund’s portfolio activity with respect to any Central Funds. |
See notes to financial statements.
Report of Independent Registered Public Accounting Firm
To the Board of Trustees and Shareholders of The New Economy Fund
Opinion on the Financial Statements
We have audited the accompanying statement of assets and liabilities, including the summary investment portfolio, of The New Economy Fund (the “Fund”) as of November 30, 2019, the related statement of operations for the year ended November 30, 2019, the statement of changes in net assets for each of the two years in the period ended November 30, 2019, including the related notes, and the financial highlights for each of the periods indicated therein (collectively referred to as the “financial statements”). In our opinion, the financial statements present fairly, in all material respects, the financial position of the Fund as of November 30, 2019, the results of its operations for the year then ended, the changes in its net assets for each of the two years in the period ended November 30, 2019 and the financial highlights for each of the periods indicated therein in conformity with accounting principles generally accepted in the United States of America.
Basis for Opinion
These financial statements are the responsibility of the Fund’s management. Our responsibility is to express an opinion on the Fund’s financial statements based on our audits. We are a public accounting firm registered with the Public Company Accounting Oversight Board (United States) (PCAOB) and are required to be independent with respect to the Fund in accordance with the U.S. federal securities laws and the applicable rules and regulations of the Securities and Exchange Commission and the PCAOB.
We conducted our audits of these financial statements in accordance with the standards of the PCAOB. Those standards require that we plan and perform the audit to obtain reasonable assurance about whether the financial statements are free of material misstatement, whether due to error or fraud.
Our audits included performing procedures to assess the risks of material misstatement of the financial statements, whether due to error or fraud, and performing procedures that respond to those risks. Such procedures included examining, on a test basis, evidence regarding the amounts and disclosures in the financial statements. Our audits also included evaluating the accounting principles used and significant estimates made by management, as well as evaluating the overall presentation of the financial statements. Our procedures included confirmation of securities owned as of November 30, 2019 by correspondence with the custodian, transfer agent and brokers; when replies were not received from brokers, we performed other auditing procedures. We believe that our audits provide a reasonable basis for our opinion.
/s/ PricewaterhouseCoopers LLP
Los Angeles, California
January 9, 2020
We have served as the auditor of one or more investment companies in The Capital Group Companies Investment Company Complex since 1934.
As a fund shareholder, you incur two types of costs: (1) transaction costs, such as initial sales charges on purchase payments and contingent deferred sales charges on redemptions (loads), and (2) ongoing costs, including management fees, distribution and service (12b-1) fees, and other expenses. This example is intended to help you understand your ongoing costs (in dollars) of investing in the fund so you can compare these costs with the ongoing costs of investing in other mutual funds. The example is based on an investment of $1,000 invested at the beginning of the period and held for the entire six-month period (June 1, 2019, through November 30, 2019).
Actual expenses:
The first line of each share class in the table on the following page provides information about actual account values and actual expenses. You may use the information in this line, together with the amount you invested, to estimate the expenses that you paid over the period. Simply divide your account value by $1,000 (for example, an $8,600 account value divided by $1,000 = 8.6), then multiply the result by the number in the first line under the heading titled “Expenses paid during period” to estimate the expenses you paid on your account during this period.
Hypothetical example for comparison purposes:
The second line of each share class in the table on the following page provides information about hypothetical account values and hypothetical expenses based on the actual expense ratio for the share class and an assumed rate of return of 5.00% per year before expenses, which is not the actual return of the share class. The hypothetical account values and expenses may not be used to estimate the actual ending account balance or expenses you paid for the period. You may use this information to compare the ongoing costs of investing in the fund and other funds. To do so, compare this 5.00% hypothetical example with the 5.00% hypothetical examples that appear in the shareholder reports of the other funds.
Notes:
Retirement plan participants may be subject to certain fees charged by the plan sponsor, and Class F-1, F-2, F-3 and 529-F-1 shareholders may be subject to fees charged by financial intermediaries, typically ranging from 0.75% to 1.50% of assets annually depending on services offered. You can estimate the impact of these fees by adding the amount of the fees to the total estimated expenses you paid on your account during the period as calculated above. In addition, your ending account value would be lower by the amount of these fees.
Note that the expenses shown in the table on the following page are meant to highlight your ongoing costs only and do not reflect any transactional costs, such as sales charges (loads). Therefore, the second line of each share class in the table is useful in comparing ongoing costs only and will not help you determine the relative total costs of owning different funds. In addition, if these transactional costs were included, your costs would have been higher.
| | | Beginning
account value
6/1/2019 | | | Ending
account value
11/30/2019 | | | Expenses paid
during period* | | | Annualized
expense ratio | |
| Class A – actual return | | $ | 1,000.00 | | | $ | 1,113.70 | | | $ | 4.13 | | | | .78 | % |
| Class A – assumed 5% return | | | 1,000.00 | | | | 1,021.16 | | | | 3.95 | | | | .78 | |
| Class C – actual return | | | 1,000.00 | | | | 1,109.58 | | | | 8.09 | | | | 1.53 | |
| Class C – assumed 5% return | | | 1,000.00 | | | | 1,017.40 | | | | 7.74 | | | | 1.53 | |
| Class T – actual return | | | 1,000.00 | | | | 1,115.10 | | | | 2.76 | | | | .52 | |
| Class T – assumed 5% return | | | 1,000.00 | | | | 1,022.46 | | | | 2.64 | | | | .52 | |
| Class F-1 – actual return | | | 1,000.00 | | | | 1,113.52 | | | | 4.34 | | | | .82 | |
| Class F-1 – assumed 5% return | | | 1,000.00 | | | | 1,020.96 | | | | 4.15 | | | | .82 | |
| Class F-2 – actual return | | | 1,000.00 | | | | 1,115.08 | | | | 2.86 | | | | .54 | |
| Class F-2 – assumed 5% return | | | 1,000.00 | | | | 1,022.36 | | | | 2.74 | | | | .54 | |
| Class F-3 – actual return | | | 1,000.00 | | | | 1,115.46 | | | | 2.28 | | | | .43 | |
| Class F-3 – assumed 5% return | | | 1,000.00 | | | | 1,022.91 | | | | 2.18 | | | | .43 | |
| Class 529-A – actual return | | | 1,000.00 | | | | 1,113.63 | | | | 4.29 | | | | .81 | |
| Class 529-A – assumed 5% return | | | 1,000.00 | | | | 1,021.01 | | | | 4.10 | | | | .81 | |
| Class 529-C – actual return | | | 1,000.00 | | | | 1,109.31 | | | | 8.30 | | | | 1.57 | |
| Class 529-C – assumed 5% return | | | 1,000.00 | | | | 1,017.20 | | | | 7.94 | | | | 1.57 | |
| Class 529-E – actual return | | | 1,000.00 | | | | 1,112.35 | | | | 5.56 | | | | 1.05 | |
| Class 529-E – assumed 5% return | | | 1,000.00 | | | | 1,019.80 | | | | 5.32 | | | | 1.05 | |
| Class 529-T – actual return | | | 1,000.00 | | | | 1,114.92 | | | | 3.08 | | | | .58 | |
| Class 529-T – assumed 5% return | | | 1,000.00 | | | | 1,022.16 | | | | 2.94 | | | | .58 | |
| Class 529-F-1 – actual return | | | 1,000.00 | | | | 1,114.71 | | | | 3.13 | | | | .59 | |
| Class 529-F-1 – assumed 5% return | | | 1,000.00 | | | | 1,022.11 | | | | 2.99 | | | | .59 | |
| Class R-1 – actual return | | | 1,000.00 | | | | 1,109.37 | | | | 8.14 | | | | 1.54 | |
| Class R-1 – assumed 5% return | | | 1,000.00 | | | | 1,017.35 | | | | 7.79 | | | | 1.54 | |
| Class R-2 – actual return | | | 1,000.00 | | | | 1,109.40 | | | | 8.14 | | | | 1.54 | |
| Class R-2 – assumed 5% return | | | 1,000.00 | | | | 1,017.35 | | | | 7.79 | | | | 1.54 | |
| Class R-2E – actual return | | | 1,000.00 | | | | 1,111.12 | | | | 6.62 | | | | 1.25 | |
| Class R-2E – assumed 5% return | | | 1,000.00 | | | | 1,018.80 | | | | 6.33 | | | | 1.25 | |
| Class R-3 – actual return | | | 1,000.00 | | | | 1,112.07 | | | | 5.77 | | | | 1.09 | |
| Class R-3 – assumed 5% return | | | 1,000.00 | | | | 1,019.60 | | | | 5.52 | | | | 1.09 | |
| Class R-4 – actual return | | | 1,000.00 | | | | 1,113.73 | | | | 4.13 | | | | .78 | |
| Class R-4 – assumed 5% return | | | 1,000.00 | | | | 1,021.16 | | | | 3.95 | | | | .78 | |
| Class R-5E – actual return | | | 1,000.00 | | | | 1,114.80 | | | | 2.97 | | | | .56 | |
| Class R-5E – assumed 5% return | | | 1,000.00 | | | | 1,022.26 | | | | 2.84 | | | | .56 | |
| Class R-5 – actual return | | | 1,000.00 | | | | 1,115.36 | | | | 2.55 | | | | .48 | |
| Class R-5 – assumed 5% return | | | 1,000.00 | | | | 1,022.66 | | | | 2.43 | | | | .48 | |
| Class R-6 – actual return | | | 1,000.00 | | | | 1,115.57 | | | | 2.28 | | | | .43 | |
| Class R-6 – assumed 5% return | | | 1,000.00 | | | | 1,022.91 | | | | 2.18 | | | | .43 | |
| * | The “expenses paid during period” are equal to the “annualized expense ratio,” multiplied by the average account value over the period, multiplied by the number of days in the period, and divided by 365 (to reflect the one-half year period). |
We are required to advise you of the federal tax status of certain distributions received by shareholders during the fiscal year. The fund hereby designates the following amounts for the fund’s fiscal year ended November 30, 2019:
| Long-term capital gains | | $1,589,116,000 |
| Qualified dividend income | | 100% |
| Corporate dividends received deduction | | 100% |
| U.S. government income that may be exempt from state taxation | | $6,233,000 |
Individual shareholders should refer to their Form 1099 or other tax information, which was mailed in January 2020, to determine thecalendar yearamounts to be included on their 2019 tax returns. Shareholders should consult their tax advisors.
Approval of Investment Advisory and Service Agreement
New Economy Fund’s board has approved the fund’s Investment Advisory and Service Agreement (the “agreement”) with Capital Research and Management Company (“CRMC”) for an additional one-year term through October 31, 2020. The board approved the agreement following the recommendation of the fund’s Contracts Committee (the “committee”), which is composed of all of the fund’s independent board members. The board and the committee determined in the exercise of their business judgment that the fund’s advisory fee structure was fair and reasonable in relation to the services provided, and that approving the agreement was in the best interests of the fund and its shareholders.
In reaching this decision, the board and the committee took into account information furnished to them throughout the year and otherwise provided to them, as well as information prepared specifically in connection with their review of the agreement, and were advised by their independent counsel with respect to the matters considered. They considered the following factors, among others, but did not identify any single issue or particular piece of information that, in isolation, was the controlling factor, and each board and committee member did not necessarily attribute the same weight to each factor.
1. Nature, extent and quality of services
The board and the committee considered the depth and quality of CRMC’s investment management process, including its global research capabilities; the experience, capability and integrity of its senior management and other personnel; the low turnover rates of its key personnel; the overall financial strength and stability of CRMC and the Capital Group organization; the resources and systems CRMC devotes to investment management (the manner in which the Fund’s assets are managed, including liquidity management), compliance, trading, portfolio accounting and other services; and the ongoing evolution of CRMC’s organizational structure designed to maintain and strengthen these qualities. The board and the committee also considered the nature, extent and quality of administrative, compliance and shareholder services provided by CRMC to the fund under the agreement and other agreements, as well as the benefits to fund shareholders from investing in a fund that is part of a large family of funds. The board and the committee concluded that the nature, extent and quality of the services provided by CRMC have benefited and should continue to benefit the fund and its shareholders.
2. Investment results
The board and the committee considered the investment results of the fund in light of its objective of providing long-term growth of capital. They compared the fund’s investment results with those of other funds (including funds that currently form the basis of the Lipper index for the category in which the fund is included), and data such as relevant market and fund indexes, over various periods through March 31, 2019. This report, including the letter to shareholders and related disclosures, contains certain information about the fund’s investment results. The board and the committee reviewed the fund’s investment results measured against various indexes, including the S&P 500 Index, the Global Service and Information Index, the Lipper Growth Funds Index and the MSCI All Country World Index. They reviewed the results for the one-year, three-year, five-year, 10-year, 20-year and lifetime periods, and placed greater emphasis on longer term periods. They noted that the investment results of the fund generally compared favorably to the results of these indexes for all periods. The board and the committee concluded that the fund’s investment results have been satisfactory for renewal of the agreement, and that CRMC’s record in managing the fund indicated that its continued management should benefit the fund and its shareholders.
3. Advisory fees and total expenses
The board and the committee compared the advisory fees and total expense levels of the fund to those of other relevant funds. They observed that the fund’s advisory fees and expenses generally compared favorably to those of other similar funds included in the Lipper Income Funds category. The board and the committee also considered the breakpoint discounts in the fund’s advisory fee structure that reduce the level of fees charged by CRMC to the fund as fund assets increase. In addition, they reviewed information regarding the effective advisory fees charged to non-mutual fund clients by CRMC and its affiliates. They noted that, to the extent there were differences between the advisory fees paid by the fund and the advisory fees paid by those clients, the differences appropriately reflected the investment, operational, regulatory and market differences between advising the fund and the other clients. The board and the committee concluded that the fund’s cost structure was fair and reasonable in relation to the services provided, and that the fund’s shareholders receive reasonable value in return for the advisory fees and other amounts paid to CRMC by the fund.
4. Ancillary benefits
The board and the committee considered a variety of other benefits that CRMC and its affiliates receive as a result of CRMC’s relationship with the fund and other American Funds, including fees for administrative services provided to certain share classes; fees paid to CRMC’s affiliated transfer agent; sales charges and distribution fees received and retained by the fund’s principal underwriter, an affiliate of CRMC; and possible ancillary benefits to CRMC and its institutional management affiliates in managing other investment vehicles. The board and the committee reviewed CRMC’s portfolio trading practices, noting that through December 31, 2018 CRMC benefited from research obtained with commissions from portfolio transactions made on behalf of the fund and since that time has undertaken to bear the cost of obtaining such research. The board and the committee took these ancillary benefits into account in evaluating the reasonableness of the advisory fees and other amounts paid to CRMC by the fund.
5. Adviser financial information
The board and the committee reviewed information regarding CRMC’s costs of providing services to the American Funds, including personnel, systems and resources of investment, compliance, trading, accounting and other administrative operations. They considered CRMC’s costs and related cost allocation methodology as well as its track record of investing in technology, infrastructure and staff to maintain and expand services and capabilities, respond to industry and regulatory developments, and attract and retain qualified personnel. They noted information regarding the compensation structure for CRMC’s investment professionals. They reviewed information on the profitability of the investment adviser and its affiliates. The board and the committee also compared CRMC’s profitability and compensation data to the reported results and data of several large, publicly held investment management companies. The board and the committee noted the competitiveness and cyclicality of both the mutual fund industry and the capital markets, and the importance in that environment of CRMC’s long-term profitability for maintaining its independence, company culture and management continuity. They further considered the breakpoint discounts in the fund’s advisory fee structure and CRMC’s sharing of potential economies of scale, or efficiencies, through breakpoints and other fee reductions and costs voluntarily absorbed. The board and the committee concluded that the fund’s advisory fee structure reflected a reasonable sharing of benefits between CRMC and the fund’s shareholders.
This page was intentionally left blank.
This page was intentionally left blank.
This page was intentionally left blank.
This page was intentionally left blank.
This page was intentionally left blank.
Board of trustees and other officers
Independent trustees1
| Name and year of birth | | Year first
elected
a trustee
of the fund2 | | Principal occupation(s) during past five years | | Number of
portfolios in fund
complex overseen
by trustee3 | | Other directorships4
held by trustee |
Joseph C. Berenato, 1946
Chairman of the Board
(Independent and Non-Executive) | | 2000 | | Former Chairman and CEO, Ducommun Incorporated (aerospace components manufacturer) | | 16 | | None |
| Mary Anne Dolan, 1947 | | 2008 | | Founder and President, MAD Ink (communications company); former Editor-in-Chief, The Los Angeles Herald Examiner (retired 1989) | | 10 | | None |
| John G. Freund, MD, 1953 | | 2016 | | Founder and Managing Director, Skyline Ventures (a venture capital investor in health care companies) | | 6 | | Collegium Pharmaceutical, Inc.;
Proteon Therapeutics, Inc.;
SI-BONE, Inc.;
Sutro Biopharma, Inc.;
Tetraphase Pharmaceuticals, Inc. |
| Pedro J. Greer, Jr., 1956 | | 2016 | | Physician; Chairman/Associate Dean, Florida International University | | 3 | | None |
| R. Clark Hooper, 1946 | | 2006 | | Private investor | | 89 | | None |
| Merit E. Janow, 1958 | | 2010 | | Dean and Professor, Columbia University, School of International and Public Affairs | | 88 | | Mastercard Incorporated;
Trimble, Inc. |
| Leonade D. Jones, 1947 | | 1995 | | Retired; former Treasurer, The Washington Post Company (retired 1996) | | 10 | | None |
| Earl Lewis, Jr., 1955 | | 2017 | | Professor and Director, University of Michigan; former President, The Andrew W. Mellon Foundation | | 3 | | 2U, Inc. |
| Christopher E. Stone, 1956 | | 2007 | | Professor of Practice of Public Integrity, University of Oxford, Blavatnik School of Government; former President, Open Society Foundations | | 6 | | None |
Interested trustees5,6
Name, year of birth and
position with fund | | Year first
elected
a trustee
or officer
of the fund2 | | Principal occupation(s) during past five years
and positions held with affiliated entities or
the principal underwriter of the fund | | Number of
portfolios in fund
complex overseen
by trustee3 | | Other directorships4
held by trustee |
| Winnie Kwan, 1972 | | 2019 | | Partner — Capital Research Global Investors, Capital International, Inc.7 | | 3 | | None |
| Sung Lee, 1966 | | 2019 | | Partner — Capital Research Global Investors, Capital International, Inc.7 | | 3 | | None |
The fund’s statement of additional information includes further details about fund directors and is available without charge upon request by calling American Funds Service Company at (800) 421-4225 or by visiting the Capital Group website at capitalgroup.com. The address for all trustees and officers of the fund is 333 South Hope Street, Los Angeles, CA 90071, Attention: Secretary.
Other officers6
Name, year of birth and
position with fund | | Year first
elected
an officer
of the fund2 | | Principal occupation(s) during past five years and positions held with affiliated entities
or the principal underwriter of the fund |
Timothy D. Armour, 1960
Co-President | | 1991 | | Chairman of the Board and Chief Executive Officer, The Capital Group Companies, Inc.7;
Partner — Capital World Investors, Capital Research and Management Company;
Partner — Capital World Investors, Capital Bank and Trust Company7;
Director, Capital Research and Management Company |
Claudia P. Huntington, 1952
Co-President | | 1996 | | Partner — Capital Research Global Investors, Capital Research and Management Company;
Partner — Capital Research Global Investors, Capital Bank and Trust Company7;
Director, The Capital Group Companies, Inc.7 |
Donald H. Rolfe, 1972
Executive Vice President | | 2010 | | Senior Vice President and Senior Counsel, Fund Business Management Group,
Capital Research and Management Company; Secretary, Capital Research and Management Company |
Caroline Jones, 1974
Senior Vice President | | 2019 | | Partner — Capital Research Global Investors, Capital Research and Management Company |
Harold H. La, 1970
Senior Vice President | | 2006 | | Partner — Capital Research Global Investors, Capital International, Inc.7 |
Lawrence R. Solomon, 1962
Vice President | | 2010 | | Partner — Capital Research Global Investors, Capital Research and Management Company;
Chairman of the Board, President and Director, Capital Management Services, Inc.7 |
Michael W. Stockton, 1967
Secretary | | 2013 | | Senior Vice President — Fund Business Management Group, Capital Research and Management Company |
Gregory F. Niland, 1971
Treasurer | | 2016 | | Vice President — Investment Operations, Capital Research and Management Company |
Jennifer L. Butler, 1966
Assistant Secretary | | 2013 | | Assistant Vice President — Fund Business Management Group, Capital Research and Management Company |
Sandra Chuon, 1972
Assistant Treasurer | | 2019 | | Assistant Vice President — Investment Operations, Capital Research and Management Company |
Brian C. Janssen, 1972
Assistant Treasurer | | 2016 | | Vice President — Investment Operations, Capital Research and Management Company |
| 1 | The term independent trustee refers to a trustee who is not an “interested person” of the fund within the meaning of the Investment Company Act of 1940. |
| 2 | Trustees and officers of the fund serve until their resignation, removal or retirement. |
| 3 | Funds managed by Capital Research and Management Company or its affiliates. |
| 4 | This includes all directorships/trusteeships (other than those in the American Funds or other funds managed by Capital Research and Management Company or its affiliates) that are held by each trustee as a trustee or director of a public company or a registered investment company. |
| 5 | The term interested trustee refers to a trustee who is an “interested person” within the meaning of the Investment Company Act of 1940, on the basis of their affiliation with the fund’s investment adviser, Capital Research and Management Company, or affiliated entities (including the fund’s principal underwriter). |
| 6 | All of the trustees and/or officers listed are officers and/or directors/trustees of one or more of the other funds for which Capital Research and Management Company serves as investment adviser. |
| 7 | Company affiliated with Capital Research and Management Company. |
Office of the fund
333 South Hope Street
Los Angeles, CA 90071-1406
Investment adviser
Capital Research and Management Company
333 South Hope Street
Los Angeles, CA 90071-1406
Transfer agent for shareholder accounts
American Funds Service Company
(Write to the address near you.)
P.O. Box 6007
Indianapolis, IN 46206-6007
P.O. Box 2280
Norfolk, VA 23501-2280
Custodian of assets
State Street Bank and Trust Company
One Lincoln Street
Boston, MA 02111
Counsel
O’Melveny & Myers LLP
400 South Hope Street
Los Angeles, CA 90071-2899
Independent registered public accounting firm
PricewaterhouseCoopers LLP
601 South Figueroa Street
Los Angeles, CA 90017-3874
Principal underwriter
American Funds Distributors, Inc.
333 South Hope Street
Los Angeles, CA 90071-1406
Investors should carefully consider investment objectives, risks, charges and expenses. This and other important information is contained in the fund prospectus and summary prospectus, which can be obtained from your financial professional and should be read carefully before investing. You may also call American Funds Service Company (AFS) at (800) 421-4225 or visit the Capital Group website at capitalgroup.com.
“American Funds Proxy Voting Procedures and Principles” — which describes how we vote proxies relating to portfolio securities — is available on our website or upon request by calling AFS. The fund files its proxy voting record with the U.S. Securities and Exchange Commission (SEC) for the 12 months ended June 30 by August 31. The proxy voting record is available free of charge on the SEC website at sec.gov and on our website.
A complete November 30, 2019, portfolio of The New Economy Fund’s investments is available free of charge by calling AFS or visiting the SEC website (where it is part of Form N-CSR).
The New Economy Fund files a complete list of its portfolio holdings with the SEC for the first and third quarters of each fiscal year on Form NPORT-P. This filing is available free of charge on the SEC website. Additionally, the list of portfolio holdings is available by calling AFS.
This report is for the information of shareholders of The New Economy Fund, but it also may be used as sales literature when preceded or accompanied by the current prospectus or summary prospectus, which gives details about charges, expenses, investment objectives and operating policies of the fund. If used as sales material after March 31, 2020, this report must be accompanied by an American Funds statistical update for the most recently completed calendar quarter.
MSCI has not approved, reviewed or produced this report, makes no express or implied warranties or representations and is not liable whatsoever for any data in the report. You may not redistribute the MSCI data or use it as a basis for other indices or investment products.
The Standard & Poor’s 500 Composite Index (“Index”) is a product of S&P Dow Jones Indices LLC and/or its affiliates and has been licensed for use by Capital Group. Copyright © 2020 S&P Dow Jones Indices LLC, a division of S&P Global, and/or its affiliates. All rights reserved. Redistribution or reproduction in whole or in part is prohibited without written permission of S&P Dow Jones Indices LLC.
American Funds Distributors, Inc., member FINRA.
The Capital Advantage®
Since 1931, Capital Group, home of American Funds, has helped investors pursue long-term investment success. Our consistent approach — in combination with The Capital SystemSM— has resulted in superior outcomes.
| | Aligned with investor success |
| | We base our decisions on a long-term perspective, which we believe aligns our goals with the interests of our clients. Our portfolio managers average 27 years of investment experience, including 20 years at our company, reflecting a career commitment to our long-term approach.1 |
| | |
| | The Capital System |
| | The Capital System combines individual accountability with teamwork. Funds using The Capital System are divided into portions that are managed independently by investment professionals with diverse backgrounds, ages and investment approaches. An extensive global research effort is the backbone of our system. |
| | |
| | American Funds’ superior outcomes |
| | Equity funds have beaten their Lipper peer indexes in 92% of 10-year periods and 99% of 20-year periods.2Fixed income funds have helped investors achieve diversification through attention to correlation between bonds and equities.3Fund management fees have been among the lowest in the industry.4 |
| | 1 | Portfolio manager experience as of December 31, 2018. |
| | 2 | Based on Class F-2 share results for rolling periods through December 31, 2018. Periods covered are the shorter of the fund’s lifetime or since the comparable Lipper index inception date (except Capital Income Builder and SMALLCAP World Fund, for which the Lipper average was used). Expenses differ for each share class, so results will vary. |
| | 3 | Based on Class F-2 share results, as of December 31, 2018. Fourteen of our 15 American Funds fixed income funds that have been in existence for the three-year period showed a three-year correlation below 0.2. Standard & Poor’s 500 Composite Index was used as an equity market proxy. Correlation based on monthly total returns. Correlation is a statistical measure of how two securities move in relation to each other. A correlation ranges from –1 to 1. A positive correlation close to 1 implies that as one security moves, either up or down, the other security will move in “lockstep,” in the same direction. A negative correlation close to –1 indicates that the securities have moved in the opposite direction. |
| | 4 | On average, our management fees were in the lowest quintile 70% of the time, based on the 20-year period ended December 31, 2018, versus comparable Lipper categories, excluding funds of funds. |
Class F-2 shares were first offered on August 1, 2008. Class F-2 share results prior to the date of first sale are hypothetical based on the results of the original share class of the fund without a sales charge, adjusted for typical estimated expenses. Results for certain funds with an inception date after August 1, 2008, also include hypothetical returns because those funds’ Class F-2 shares sold after the funds’ date of first offering. Please see capitalgroup.com for more information on specific expense adjustments and the actual dates of first sale.
All Capital Group trademarks mentioned are owned by The Capital Group Companies, Inc., an affiliated company or fund. All other company and product names mentioned are the property of their respective companies.

ITEM 2 – Code of Ethics
The Registrant has adopted a Code of Ethics that applies to its Principal Executive Officer and Principal Financial Officer. The Registrant undertakes to provide to any person without charge, upon request, a copy of the Code of Ethics. Such request can be made by calling 800/421-4225 or to the Secretary of the Registrant, 333 South Hope Street, Los Angeles, California 90071.
ITEM 3 – Audit Committee Financial Expert
The Registrant’s board has determined that John G. Freund, a member of the Registrant’s audit committee, is an “audit committee financial expert” and "independent," as such terms are defined in this Item. This designation will not increase the designee’s duties, obligations or liability as compared to his or her duties, obligations and liability as a member of the audit committee and of the board, nor will it reduce the responsibility of the other audit committee members. There may be other individuals who, through education or experience, would qualify as "audit committee financial experts" if the board had designated them as such. Most importantly, the board believes each member of the audit committee contributes significantly to the effective oversight of the Registrant’s financial statements and condition.
ITEM 4 – Principal Accountant Fees and Services
| a) Audit Fees: | | |
| Audit | 2018 | 117,000 |
| | 2019 | 118,000 |
| | | |
| b) Audit-Related Fees: | | |
| | 2018 | None |
| | 2019 | None |
| | | |
| c) Tax Fees: | | |
| | 2018 | None |
| | 2019 | 9,000 |
| | The tax fees consist of professional services relating to the preparation of the Registrant’s tax returns. | |
| | | |
| d) All Other Fees: | | |
| | 2018 | None |
| | 2019 | None |
| | | |
| | Adviser and affiliates (includes only fees for non-audit services billed to the adviser and affiliates for engagements that relate directly to the operations and financial reporting of the Registrant and were subject to the pre-approval policies described below): | |
| a) Audit Fees: | | |
| | Not Applicable | |
| | | |
| b) Audit-Related Fees: | | |
| | 2018 | None |
| | 2019 | None |
| | The audit-related fees consist of assurance and related services relating to the examination of the Registrant’s transfer agent, principal underwriter and investment adviser conducted in accordance with Statement on Standards for Attestation Engagements Number 18 issued by the American Institute of Certified Public Accountants. | |
| | | |
| c) Tax Fees: | | |
| | 2018 | None |
| | 2019 | None |
| | The tax fees consist of consulting services relating to the Registrant’s investments. | |
| | | |
| | | |
| d) All Other Fees: | | |
| | 2018 | None |
| | 2019 | 9,000 |
| | The other fees consist of subscription services related to an accounting research tool. | |
| | | |
| | | |
| | All audit and permissible non-audit services that the Registrant’s audit committee considers compatible with maintaining the independent registered public accounting firm’s independence are required to be pre-approved by the committee. The pre-approval requirement will extend to all non-audit services provided to the Registrant, the investment adviser, and any entity controlling, controlled by, or under common control with the investment adviser that provides ongoing services to the Registrant, if the engagement relates directly to the operations and financial reporting of the Registrant. The committee will not delegate its responsibility to pre-approve these services to the investment adviser. The committee may delegate to one or more committee members the authority to review and pre-approve audit and permissible non-audit services. Actions taken under any such delegation will be reported to the full committee at its next meeting. The pre-approval requirement is waived with respect to non-audit services if certain conditions are met. The pre-approval requirement was not waived for any of the non-audit services listed above provided to the Registrant, adviser and affiliates. | |
| | | |
| | Aggregate non-audit fees paid to the Registrant’s auditors, including fees for all services billed to the Registrant, adviser and affiliates that provide ongoing services to the Registrant, were $0 for fiscal year 2018 and $18,000 for fiscal year 2019. The non-audit services represented by these amounts were brought to the attention of the committee and considered to be compatible with maintaining the auditors’ independence. | |
ITEM 5 – Audit Committee of Listed Registrants
Not applicable to this Registrant, insofar as the Registrant is not a listed issuer as defined in Rule 10A-3 under the Securities Exchange Act of 1934.
ITEM 6 – Schedule of Investments

The New Economy Fund®
Investment portfolio
November 30, 2019
Common stocks 91.98%
Information technology 29.07% | Shares | Value
(000) |
| Microsoft Corp. | 4,080,814 | $617,754 |
| Broadcom Inc. | 1,767,870 | 559,018 |
| Samsung Electronics Co., Ltd. | 8,942,705 | 380,831 |
| Mastercard Inc., Class A | 1,210,400 | 353,715 |
| Micron Technology, Inc.1 | 5,923,553 | 281,428 |
| Accenture PLC, Class A | 1,332,749 | 268,096 |
| Ceridian HCM Holding Inc.1 | 4,223,205 | 254,913 |
| Autodesk, Inc.1 | 1,250,483 | 226,212 |
| Adobe Inc.1 | 662,906 | 205,189 |
| PayPal Holdings, Inc.1 | 1,791,960 | 193,550 |
| SK hynix, Inc. | 2,759,000 | 188,971 |
| Taiwan Semiconductor Manufacturing Co., Ltd. (ADR) | 3,542,537 | 188,073 |
| ServiceNow, Inc.1 | 535,394 | 151,538 |
| Cree, Inc.1 | 3,234,366 | 142,991 |
| ASML Holding NV | 497,295 | 135,324 |
| Texas Instruments Inc. | 1,099,546 | 132,176 |
| RingCentral, Inc., Class A1 | 708,728 | 122,234 |
| Applied Materials, Inc. | 1,999,174 | 115,752 |
| Dell Technologies Inc., Class C1 | 2,301,049 | 111,578 |
| Sabre Corp. | 4,786,576 | 107,363 |
| Fiserv, Inc.1 | 896,630 | 104,224 |
| Intel Corp. | 1,602,838 | 93,045 |
| Square, Inc., Class A1 | 1,259,480 | 87,055 |
| PagSeguro Digital Ltd., Class A1 | 2,456,600 | 83,377 |
| StoneCo Ltd., Class A1 | 1,990,178 | 81,557 |
| MongoDB, Inc., Class A1 | 535,476 | 79,625 |
| Visa Inc., Class A | 385,141 | 71,062 |
| Qorvo, Inc.1 | 632,739 | 65,938 |
| DocuSign, Inc.1 | 899,498 | 64,053 |
| VMware, Inc., Class A | 398,935 | 62,082 |
| Fidelity National Information Services, Inc. | 437,005 | 60,372 |
| Elastic NV, non-registered shares1 | 697,712 | 55,405 |
| Bottomline Technologies, Inc.1 | 1,095,547 | 54,219 |
| Alteryx, Inc., Class A1 | 472,805 | 53,678 |
| International Business Machines Corp. | 389,839 | 52,414 |
| salesforce.com, inc.1 | 265,890 | 43,311 |
| Inphi Corp.1 | 610,748 | 42,526 |
| Tokyo Electron Ltd. | 196,900 | 40,655 |
| Atlassian Corp. PLC, Class A1 | 312,471 | 39,718 |
| Smartsheet Inc., Class A1 | 834,655 | 39,588 |
| Jack Henry & Associates, Inc. | 253,895 | 38,577 |
| STMicroelectronics NV | 1,536,172 | 37,741 |
| Amadeus IT Group SA, Class A, non-registered shares | 470,806 | 37,501 |
| Arista Networks, Inc.1 | 190,421 | 37,157 |
| Yext, Inc.1 | 1,999,174 | 34,506 |
| NortonLifeLock Inc. | 1,380,045 | 34,363 |
| Apple Inc. | 127,947 | 34,194 |
The New Economy Fund — Page 1 of 6
Common stocks (continued)
Information technology (continued) | Shares | Value
(000) |
| Guidewire Software, Inc.1 | 254,895 | $31,054 |
| Amphenol Corp., Class A | 216,910 | 22,559 |
| Paycom Software, Inc.1 | 79,967 | 22,136 |
| PTC, Inc.1 | 236,502 | 18,116 |
| HubSpot, Inc.1 | 103,187 | 15,581 |
| Infineon Technologies AG | 660,727 | 14,113 |
| Workday, Inc., Class A1 | 77,968 | 13,966 |
| Keyence Corp. | 39,200 | 13,409 |
| FleetCor Technologies, Inc.1 | 34,486 | 10,584 |
| Slack Technologies, Inc., Class A1 | 128,466 | 2,932 |
| | | 6,429,099 |
| Health care 17.36% | | |
| UnitedHealth Group Inc. | 1,300,663 | 364,016 |
| Daiichi Sankyo Co., Ltd. | 4,144,200 | 259,810 |
| Abbott Laboratories | 2,947,782 | 251,888 |
| Thermo Fisher Scientific Inc. | 722,002 | 226,672 |
| Cigna Corp. | 1,105,866 | 221,085 |
| Molina Healthcare, Inc.1 | 1,619,031 | 219,379 |
| Novartis AG | 2,326,539 | 214,181 |
| Humana Inc. | 540,377 | 184,393 |
| Boston Scientific Corp.1 | 3,965,654 | 171,514 |
| Bluebird Bio, Inc.1 | 2,048,918 | 165,839 |
| Illumina, Inc.1 | 417,428 | 133,894 |
| Insulet Corp.1 | 680,914 | 126,446 |
| GW Pharmaceuticals PLC (ADR)1 | 1,138,210 | 116,223 |
| PerkinElmer, Inc. | 1,186,469 | 110,223 |
| Allakos Inc.1 | 872,896 | 82,925 |
| WellCare Health Plans, Inc.1 | 246,898 | 79,518 |
| Align Technology, Inc.1 | 273,887 | 75,960 |
| WuXi AppTec Co., Ltd. Class H | 5,951,900 | 69,076 |
| BioMarin Pharmaceutical Inc.1 | 813,564 | 65,663 |
| Regeneron Pharmaceuticals, Inc.1 | 172,629 | 63,700 |
| Vertex Pharmaceuticals Inc.1 | 284,882 | 63,173 |
| Ultragenyx Pharmaceutical Inc.1 | 1,484,293 | 58,852 |
| Stryker Corp. | 266,488 | 54,593 |
| Alcon Inc.1 | 957,904 | 52,886 |
| Centene Corp.1 | 859,645 | 51,983 |
| Guardant Health, Inc.1 | 620,744 | 48,213 |
| Biohaven Pharmaceutical Holding Co. Ltd.1 | 731,698 | 41,941 |
| DexCom, Inc.1 | 182,625 | 41,512 |
| Agilon Health TopCo, Inc.1,2,3,4 | 79,816 | 35,874 |
| Mesoblast Ltd.1,5 | 26,781,795 | 32,789 |
| Mesoblast Ltd. (ADR)1,5 | 149,377 | 935 |
| Zoetis Inc., Class A | 265,890 | 32,045 |
| Sarepta Therapeutics, Inc.1 | 249,000 | 28,010 |
| Hologic, Inc.1 | 473,804 | 24,316 |
| Eli Lilly and Co. | 179,926 | 21,114 |
| Integra LifeSciences Holdings Corp.1 | 226,906 | 13,839 |
| Gilead Sciences, Inc. | 186,923 | 12,569 |
| Allogene Therapeutics, Inc.1 | 389,739 | 10,983 |
| Notre Dame Intermédica Participações SA | 429,000 | 5,738 |
| Teva Pharmaceutical Industries Ltd. (ADR)1 | 456,811 | 4,760 |
| | | 3,838,530 |
The New Economy Fund — Page 2 of 6
Common stocks (continued)
Communication services 12.13% | Shares | Value
(000) |
| Netflix, Inc.1 | 2,480,522 | $780,521 |
| Facebook, Inc., Class A1 | 2,595,512 | 523,359 |
| Alphabet Inc., Class C1 | 183,296 | 239,194 |
| Alphabet Inc., Class A1 | 143,766 | 187,484 |
| Tencent Holdings Ltd. | 6,244,700 | 264,688 |
| Comcast Corp., Class A | 3,398,596 | 150,048 |
| T-Mobile US, Inc.1 | 1,352,641 | 106,250 |
| Daily Mail and General Trust PLC, Class A, nonvoting shares | 9,202,645 | 97,955 |
| Activision Blizzard, Inc. | 1,534,366 | 84,129 |
| Charter Communications, Inc., Class A1 | 149,138 | 70,096 |
| ITV PLC | 23,222,294 | 43,580 |
| Nintendo Co., Ltd. | 89,000 | 34,436 |
| Elang Mahkota Teknologi Tbk PT | 82,047,700 | 32,575 |
| New York Times Co., Class A | 739,501 | 23,849 |
| Electronic Arts Inc.1 | 191,421 | 19,335 |
| Fox Corp., Class A | 499,793 | 17,873 |
| Pinterest, Inc., Class A1 | 283,883 | 5,530 |
| Walt Disney Co. | 8,759 | 1,328 |
| | | 2,682,230 |
| Financials 10.36% | | |
| Kotak Mahindra Bank Ltd. | 14,058,382 | 316,530 |
| AIA Group Ltd. | 21,298,000 | 213,305 |
| CME Group Inc., Class A | 968,000 | 196,243 |
| Berkshire Hathaway Inc., Class B1 | 766,283 | 168,812 |
| HDFC Bank Ltd. | 9,092,000 | 161,587 |
| Arch Capital Group Ltd.1 | 3,310,008 | 138,921 |
| JPMorgan Chase & Co. | 1,021,578 | 134,603 |
| IndusInd Bank Ltd. | 5,961,701 | 130,399 |
| Essent Group Ltd. | 1,880,623 | 102,776 |
| EXOR NV | 1,150,000 | 87,977 |
| Intercontinental Exchange, Inc. | 679,719 | 64,009 |
| Prudential PLC | 3,498,555 | 62,285 |
| East West Bancorp, Inc. | 1,249,484 | 57,251 |
| Webster Financial Corp. | 1,144,527 | 55,727 |
| UniCredit SpA | 3,853,363 | 53,329 |
| Ping An Insurance (Group) Co. of China, Ltd., Class H | 4,481,000 | 50,775 |
| Banco Santander, SA | 12,959,233 | 50,499 |
| American International Group, Inc. | 899,628 | 47,375 |
| Discover Financial Services | 477,803 | 40,551 |
| London Stock Exchange Group PLC | 385,841 | 34,293 |
| MarketAxess Holdings Inc. | 82,966 | 33,503 |
| Tradeweb Markets Inc., Class A | 727,999 | 32,563 |
| DBS Group Holdings Ltd. | 1,729,100 | 31,922 |
| Nasdaq, Inc. | 248,897 | 26,085 |
| | | 2,291,320 |
| Consumer discretionary 10.15% | | |
| Amazon.com, Inc.1 | 259,518 | 467,340 |
| Alibaba Group Holding Ltd. (ADR)1 | 870,940 | 174,188 |
| Alibaba Group Holding Ltd.1 | 5,349,792 | 135,589 |
| Galaxy Entertainment Group Ltd. | 36,104,000 | 236,141 |
| Marriott International, Inc., Class A | 1,194,507 | 167,661 |
| Sony Corp. | 2,346,000 | 147,977 |
| Home Depot, Inc. | 619,436 | 136,592 |
The New Economy Fund — Page 3 of 6
Common stocks (continued)
Consumer discretionary (continued) | Shares | Value
(000) |
| Moneysupermarket.com Group PLC | 21,648,143 | $95,335 |
| Floor & Decor Holdings, Inc., Class A1 | 1,809,282 | 86,864 |
| NIKE, Inc., Class B | 674,721 | 63,080 |
| Naspers Ltd., Class N | 417,827 | 59,715 |
| Booking Holdings Inc.1 | 26,279 | 50,036 |
| MercadoLibre, Inc.1 | 83,683 | 48,585 |
| Kering SA | 79,967 | 48,164 |
| Las Vegas Sands Corp. | 718,703 | 45,099 |
| William Hill PLC | 19,213,845 | 44,407 |
| MGM Resorts International | 1,227,493 | 39,218 |
| Prosus NV1 | 417,827 | 28,480 |
| Norwegian Cruise Line Holdings Ltd.1 | 513,788 | 27,559 |
| Hilton Worldwide Holdings Inc. | 259,893 | 27,289 |
| B2W - Cia. Digital, ordinary nominative1 | 2,022,071 | 26,878 |
| Domino’s Pizza, Inc. | 77,968 | 22,946 |
| Melco Resorts & Entertainment Ltd. (ADR) | 953,510 | 20,291 |
| Wynn Resorts, Ltd. | 149,938 | 18,120 |
| Melco International Development Ltd. | 6,687,000 | 16,401 |
| Meituan Dianping, Class B1 | 866,600 | 11,425 |
| | | 2,245,380 |
| Industrials 7.77% | | |
| Boeing Co. | 762,685 | 279,280 |
| CSX Corp. | 3,182,685 | 227,689 |
| Airbus SE, non-registered shares | 1,469,519 | 215,971 |
| Union Pacific Corp. | 994,543 | 175,030 |
| Nidec Corp. | 540,800 | 79,992 |
| Equifax Inc. | 487,299 | 68,046 |
| TransDigm Group Inc. | 116,752 | 66,210 |
| Meggitt PLC | 7,653,838 | 63,651 |
| L3Harris Technologies, Inc. | 299,876 | 60,302 |
| Northrop Grumman Corp. | 167,931 | 59,073 |
| Recruit Holdings Co., Ltd. | 1,597,200 | 57,815 |
| Adani Ports & Special Economic Zone Ltd. | 9,636,000 | 51,318 |
| JG Summit Holdings, Inc. | 33,268,800 | 50,347 |
| Old Dominion Freight Line, Inc. | 243,899 | 46,729 |
| AKR Corporindo Tbk PT | 173,899,680 | 41,918 |
| Singapore Technologies Engineering Ltd | 11,730,500 | 35,422 |
| TransUnion | 399,835 | 34,510 |
| CCR SA, ordinary nominative | 8,170,100 | 33,135 |
| Norfolk Southern Corp. | 139,942 | 27,079 |
| Honeywell International Inc. | 94,961 | 16,955 |
| MTU Aero Engines AG | 62,474 | 16,925 |
| Rentokil Initial PLC | 1,753,276 | 10,089 |
| | | 1,717,486 |
| Materials 1.46% | | |
| Sherwin-Williams Co. | 321,867 | 187,690 |
| International Flavors & Fragrances Inc. | 399,835 | 56,469 |
| Valvoline Inc. | 2,022,445 | 45,808 |
| Allegheny Technologies Inc.1 | 1,480,299 | 34,136 |
| | | 324,103 |
The New Economy Fund — Page 4 of 6
Common stocks (continued)
Utilities 1.27% | Shares | Value
(000) |
| ENN Energy Holdings Ltd. | 18,414,400 | $199,950 |
| Ørsted AS | 596,844 | 55,002 |
| Naturgy Energy Group, SA | 959,604 | 24,950 |
| | | 279,902 |
| Real estate 1.07% | | |
| Equinix, Inc. REIT | 139,942 | 79,326 |
| American Tower Corp. REIT | 260,892 | 55,839 |
| Two Harbors Investment Corp. REIT | 3,498,555 | 50,869 |
| ESR Cayman Ltd.1 | 17,953,000 | 37,245 |
| Embassy Office Parks REIT | 2,000,000 | 12,383 |
| | | 235,662 |
| Consumer staples 1.00% | | |
| Costco Wholesale Corp. | 629,520 | 188,736 |
| Herbalife Nutrition Ltd.1 | 708,707 | 32,324 |
| | | 221,060 |
| Energy 0.34% | | |
| Baker Hughes Co., Class A | 1,431,109 | 32,086 |
| Schlumberger Ltd. | 799,670 | 28,948 |
| Cactus, Inc., Class A | 456,811 | 13,791 |
| | | 74,825 |
| Total common stocks(cost: $13,700,560,000) | | 20,339,597 |
Preferred securities 0.20%
Financials 0.20% | | |
| Itaú Unibanco Holding SA, preferred nominative (ADR) | 5,432,106 | 44,217 |
| Total preferred securities(cost: $45,618,000) | | 44,217 |
Short-term securities 7.87%
Money market investments 7.87% | | |
| Capital Group Central Cash Fund 1.78%6 | 17,399,300 | 1,739,930 |
| Total short-term securities(cost: $1,739,830,000) | | 1,739,930 |
| Total investment securities 100.05%(cost: $15,486,008,000) | | 22,123,744 |
| Other assets less liabilities (0.05)% | | (12,015) |
| Net assets 100.00% | | $22,111,729 |
| 1 | Security did not produce income during the last 12 months. |
| 2 | Valued under fair value procedures adopted by authority of the board of trustees. The total value of the security was $35,874,000, which represented .16% of the net assets of the fund. |
| 3 | Value determined using significant unobservable inputs. |
| 4 | Acquired through a private placement transaction exempt from registration under the Securities Act of 1933. May be subject to legal or contractual restrictions on resale. Further details on this holding appear below. |
| 5 | Represents an affiliated company as defined under the Investment Company Act of 1940. |
| 6 | Rate represents the seven-day yield at 11/30/2019. |
| Private placement security | Acquisition
date | Cost
(000) | Value
(000) | Percent
of net
assets |
| Agilon Health TopCo, Inc. | 1/4/2019 | $30,183 | $35,874 | .16% |
The New Economy Fund — Page 5 of 6
| Key to abbreviation |
| ADR = American Depositary Receipts |
Additional financial disclosures are included in the fund’s current shareholder report and should be read in conjunction with this report.
Investments are not FDIC-insured, nor are they deposits of or guaranteed by a bank or any other entity, so they may lose value.
Investors should carefully consider investment objectives, risks, charges and expenses. This and other important information is contained in the fund prospectus and summary prospectus, which can be obtained from your financial professional and should be read carefully before investing. You may also call American Funds Service Company (AFS) at (800) 421-4225 or visit the Capital Group website at capitalgroup.com.
All Capital Group trademarks mentioned are owned by The Capital Group Companies, Inc., an affiliated company or fund. All other company and product names mentioned are the property of their respective companies.
American Funds Distributors, Inc., member FINRA.
© 2020 Capital Group. All rights reserved.
| MFGEFPX-014-0120O-S73175 | The New Economy Fund — Page 6 of 6 |
Report of Independent Registered Public Accounting Firm
To the Board of Trustees and Shareholders of The New Economy Fund
Opinion on the Financial Statements
We have audited the accompanying statement of assets and liabilities, including the summary investment portfolio, of The New Economy Fund (the “Fund”) as of November 30, 2019, the related statement of operations for the year ended November 30, 2019, the statement of changes in net assets for each of the two years in the period ended November 30, 2019, including the related notes, and the financial highlights for each of the periods indicated therein (included in Item 1 of this Form N-CSR) and the investment portfolio (included in Item 6 of this Form N-CSR) as of November 30, 2019 (collectively referred to as the “financial statements”). In our opinion, the financial statements present fairly, in all material respects, the financial position of the Fund as of November 30, 2019, the results of its operations for the year then ended, the changes in its net assets for each of the two years in the period ended November 30, 2019 and the financial highlights for each of the periods indicated therein in conformity with accounting principles generally accepted in the United States of America.
Basis for Opinion
These financial statements are the responsibility of the Fund’s management. Our responsibility is to express an opinion on the Fund’s financial statements based on our audits. We are a public accounting firm registered with the Public Company Accounting Oversight Board (United States) (PCAOB) and are required to be independent with respect to the Fund in accordance with the U.S. federal securities laws and the applicable rules and regulations of the Securities and Exchange Commission and the PCAOB.
We conducted our audits of these financial statements in accordance with the standards of the PCAOB. Those standards require that we plan and perform the audit to obtain reasonable assurance about whether the financial statements are free of material misstatement, whether due to error or fraud.
Our audits included performing procedures to assess the risks of material misstatement of the financial statements, whether due to error or fraud, and performing procedures that respond to those risks. Such procedures included examining, on a test basis, evidence regarding the amounts and disclosures in the financial statements. Our audits also included evaluating the accounting principles used and significant estimates made by management, as well as evaluating the overall presentation of the financial statements. Our procedures included confirmation of securities owned as of November 30, 2019 by correspondence with the custodian, transfer agent and brokers; when replies were not received from brokers, we performed other auditing procedures. We believe that our audits provide a reasonable basis for our opinion.
/s/ PricewaterhouseCoopers LLP
Los Angeles, California
January 9, 2020
We have served as the auditor of one or more investment companies in The Capital Group Companies Investment Company Complex since 1934.
ITEM 7 – Disclosure of Proxy Voting Policies and Procedures for Closed-End Management Investment Companies
Not applicable to this Registrant, insofar as the Registrant is not a closed-end management investment company.
ITEM 8 – Portfolio Managers of Closed-End Management Investment Companies
Not applicable to this Registrant, insofar as the Registrant is not a closed-end management investment company.
ITEM 9 – Purchases of Equity Securities by Closed-End Management Investment Company and Affiliated Purchasers
Not applicable to this Registrant, insofar as the Registrant is not a closed-end management investment company.
ITEM 10 – Submission of Matters to a Vote of Security Holders
There have been no material changes to the procedures by which shareholders may recommend nominees to the Registrant’s board of trustees since the Registrant last submitted a proxy statement to its shareholders. The procedures are as follows. The Registrant has a nominating and governance committee comprised solely of persons who are not considered ‘‘interested persons’’ of the Registrant within the meaning of the Investment Company Act of 1940, as amended. The committee periodically reviews such issues as the board’s composition, responsibilities, committees, compensation and other relevant issues, and recommends any appropriate changes to the full board of trustees. While the committee normally is able to identify from its own resources an ample number of qualified candidates, it will consider shareholder suggestions of persons to be considered as nominees to fill future vacancies on the board. Such suggestions must be sent in writing to the nominating and governance committee of the Registrant, c/o the Registrant’s Secretary, and must be accompanied by complete biographical and occupational data on the prospective nominee, along with a written consent of the prospective nominee for consideration of his or her name by the nominating and governance committee.
ITEM 11 – Controls and Procedures
| (a) | The Registrant’s Principal Executive Officer and Principal Financial Officer have concluded, based on their evaluation of the Registrant’s disclosure controls and procedures (as such term is defined in Rule 30a-3 under the Investment Company Act of 1940), that such controls and procedures are adequate and reasonably designed to achieve the purposes described in paragraph (c) of such rule. |
| | |
| (b) | There were no changes in the Registrant’s internal controls over financial reporting (as defined in Rule 30a-3(d) under the Investment Company Act of 1940) that occurred during the Registrant’s semi-annual period covered by this report that has materially affected, or is reasonably likely to materially affect, the Registrant’s internal control over financial reporting. |
ITEM 12 – Exhibits
| (a)(1) | The Code of Ethics that is the subject of the disclosure required by Item 2 is attached as an exhibit hereto. |
| | |
| (a)(2) | The certifications required by Rule 30a-2 of the Investment Company Act of 1940 and Sections 302 and 906 of the Sarbanes-Oxley Act of 2002 are attached as exhibits hereto. |
SIGNATURES
Pursuant to the requirements of the Securities Exchange Act of 1934 and the Investment Company Act of 1940, the Registrant has duly caused this report to be signed on its behalf by the undersigned, thereunto duly authorized.
| | THE NEW ECONOMY FUND |
| | |
| | By __/s/ Donald H. Rolfe________________ |
| | Donald H. Rolfe, Executive Vice President and Principal Executive Officer |
| | |
| | Date: January 31, 2020 |
Pursuant to the requirements of the Securities Exchange Act of 1934 and the Investment Company Act of 1940, this report has been signed below by the following persons on behalf of the Registrant and in the capacities and on the dates indicated.
| By _/s/ Donald H. Rolfe_____________ |
Donald H. Rolfe, Executive Vice President and Principal Executive Officer |
| |
| Date: January 31, 2020 |
| By___/s/ Gregory F. Niland__________________ |
Gregory F. Niland, Treasurer and Principal Financial Officer |
| |
| Date: January 31, 2020 |