UNITED STATES
SECURITIES AND EXCHANGE COMMISSION
Washington, D.C. 20549
FORM N-CSR
Certified Shareholder Report of
Registered Management Investment Companies
Investment Company Act File Number: 811-03735
The New Economy Fund
(Exact Name of Registrant as Specified in Charter)
333 South Hope Street
Los Angeles, California 90071
(Address of Principal Executive Offices)
Registrant's telephone number, including area code: (213) 486-9200
Date of fiscal year end: November 30
Date of reporting period: November 30, 2016
Michael W. Stockton
The New Economy Fund
333 South Hope Street
Los Angeles, California 90071
(Name and Address of Agent for Service)
ITEM 1 – Reports to Stockholders

Exploring ideas for
long-term growth
Special feature page 6
 | The New Economy Fund®
Annual report
for the year ended
November 30, 2016 |
The New Economy Fund seeks long-term growth of capital. Current income is a secondary consideration.
This fund is one of more than 40 offered by one of the nation’s largest mutual fund families, American Funds, from Capital Group. For 85 years, Capital has invested with a long-term focus based on thorough research and attention to risk.
Fund results shown in this report, unless otherwise indicated, are for Class A shares at net asset value. If a sales charge (maximum 5.75%) had been deducted, the results would have been lower. Results are for past periods and are not predictive of results for future periods. Current and future results may be lower or higher than those shown. Share prices and returns will vary, so investors may lose money. Investing for short periods makes losses more likely. Investments are not FDIC-insured, nor are they deposits of or guaranteed by a bank or any other entity, so they may lose value. For current information and month-end results, visit americanfunds.com.
Here are the average annual total returns on a $1,000 investment with all distributions reinvested for periods ended December 31, 2016 (the most recent calendar quarter-end):
| Class A shares | | 1 year | | 5 years | | 10 years |
| | | | | | | |
| Reflecting 5.75% maximum sales charge | | –3.68% | | 13.20% | | 6.46% |
For other share class results, visit americanfunds.com and americanfundsretirement.com.
The total annual fund operating expense ratio is 0.81% for Class A shares as of the prospectus dated February 1, 2017 (unaudited).
Investment results assume all distributions are reinvested and reflect applicable fees and expenses. When applicable, investment results reflect fee waivers, without which results would have been lower. Visit americanfunds.com for more information.
Investing outside the United States may be subject to risks, such as currency fluctuations, periods of illiquidity and price volatility. These risks may be heightened in connection with investments in developing countries. Global diversification can help reduce these risks. Refer to the fund prospectus and the Risk Factors section of this report for more information on these and other risks associated with investing in the fund.

Fellow investors:
Gradual improvement in most major economies including the U.S. helped the U.S. stock market move higher during the 12 months ended November 30, 2016. The New Economy Fund’s return was unchanged with all distributions reinvested. This trailed its benchmarks, including the 8.06% rise of the unmanaged Standard & Poor’s 500 Composite Index, a market capitalization-weighted index based on the results of 500 widely held common stocks, and the 3.68% increase of the unmanaged MSCI ACWI (All Country World Index),1 which measures equity market results based on more than 40 developed and emerging market country indexes.
The fund’s return beat the 2.18% decline of the Lipper International Funds Index (which measures funds invested in securities whose primary trading markets are outside the U.S.) but lagged the 4.39% return of the Global Service and Information Index (an unmanaged index that tracks companies in the services and information sectors around the world), and the 5.07% return of the Lipper Growth Funds Index (which measures a number of U.S. growth funds).
For the 10-year period ending November 30, 2016, The New Economy Fund had an average annual total return
Results at a glance
For periods ended November 30, 2016, with all distributions reinvested
| | | Cumulative | | Average annual |
| | | total returns | | total returns |
| | | 1 year | | 5 years | | 10 years | | Lifetime
(since 12/1/83) |
| | | | | | | | | | | | | | | | | |
| The New Economy Fund (Class A shares) | | | 0.00 | % | | | 14.27 | % | | | 7.26 | % | | | 10.88 | % |
| Standard & Poor’s 500 Composite Index2 | | | 8.06 | | | | 14.45 | | | | 6.89 | | | | 10.80 | |
| MSCI ACWI (All Country World Index)1,2,3 | | | 3.68 | | | | 8.85 | | | | 3.57 | | | | N/A | |
| Global Service and Information Index2,3,4 | | | 4.39 | | | | 13.04 | | | | 4.84 | | | | N/A | |
| Lipper Growth Funds Index5 | | | 5.07 | | | | 13.63 | | | | 6.21 | | | | 9.07 | |
| Lipper International Funds Index3,5 | | | –2.18 | | | | 5.93 | | | | 1.57 | | | | N/A | |
| 1 | Source: MSCI. Results reflect dividends net of withholding taxes. |
| 2 | The market indexes are unmanaged and, therefore, have no expenses. Investors cannot invest directly in an index. S&P 500 source: S&P Dow Jones Indices LLC. |
| 3 | This index was not in existence as of the date the fund began investment operations; therefore, lifetime results are not available. |
| 4 | The index is compiled by Capital Research and Management Company, the investment adviser to the fund. |
| 5 | Lipper indexes track the largest mutual funds (no more than 30), represented by one share class per fund, in the corresponding Lipper category. |
of 7.26%, which exceeded the 6.89% return of the S&P 500, the 3.57% return of the MSCI ACWI, and the 4.84% return of the Global Service and Information Index. We believe the 10-year and lifetime returns (see the table on page 1) are key for investors to consider as they are most reflective of our long-term approach and philosophy.
The U.S. economy continues to lead the way
U.S. economic growth continues to set the pace as evidenced by the 3.5% annualized real GDP growth in the third quarter. Global economies remain uneven in their recovery since the financial crisis. The global financial system overall, however, is stronger than it has been in many years.
Geopolitical events made headlines as the U.K. voted to exit the European Union and the U.S. elected a new president. While each event introduced a level of uncertainty, stock markets were less affected than many investors had predicted. China’s growth rate has slowed, and it is unclear when it may kick into higher gear given challenging debt levels and inefficiencies in many large state-owned enterprises. India seems to be fundamentally moving along well given the implementation of pro-growth policies. Brazil replaced its impeached leader, and while there are plenty of issues that need to be resolved, there is hope that its economy can begin to improve.
The U.S. Federal Reserve raised interest rates for the second time in the past 12 months after nine years of no hikes. Around the world, central banks have kept interest rates at or near historical lows. The U.S. election and the subsequent rise in rates and strengthening of the U.S. dollar have caused some concern in emerging markets.
The fund
The fund’s exposure to health care companies detracted from results as some biotechnology companies faced concerns that regulation may force companies to minimize drug pricing. The fund trimmed some positions in health care while adding to financials late in the period, which benefited the fund.
At this point in the market cycle, selectivity is particularly important.
A look ahead
President-elect Trump and his new administration will likely bring change, and how this will impact the business environment is yet to be seen. These changes could affect the trajectory of interest rates, increase fiscal stimulus and decrease business regulation, and impact U.S.-partner trade agreements. The choices made by our government and others will be important to track, as these decisions could impact major economies around the world.
Periods of dislocation often create attractive valuations for companies that may provide good long-term investment opportunities. We will continue to focus on our strengths of thorough global research and fundamental analysis of companies, while maintaining a long-term perspective.
Where the fund’s assets are invested (by country of domicile)
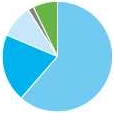
| | | | Percent of |
| | As of November 30, 2016 | | net assets |
| ■ | United States | | | 61.6 | % |
| ■ | Asia & Pacific Basin | | | 19.8 | |
| ■ | Europe | | | 9.8 | |
| ■ | Other (including Latin America) | | | 1.8 | |
| ■ | Short-term securities & other assets less liabilities | | | 7.0 | |
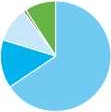
| | | | Percent of |
| | As of November 30, 2015 | | net assets |
| ■ | United States | | | 65.8 | % |
| ■ | Asia & Pacific Basin | | | 14.0 | |
| ■ | Europe | | | 10.3 | |
| ■ | Other (including Latin America) | | | .8 | |
| ■ | Short-term securities & other assets less liabilities | | | 9.1 | |
Thank you for your continued faith in our investment philosophy. We look forward to reporting to you again in six months.
Sincerely,

Timothy D. Armour
Vice Chairman of the Board

Claudia P. Huntington
President
January 13, 2017
For current information about the fund, visit americanfunds.com.
The New Geography of Investing®
Where a company does business can be more important than where it’s located. Here’s a look at The New Economy Fund’s portfolio in terms of where its equity holdings earn their revenue. The charts below show the countries and regions in which the fund’s equity investments are located, and where the revenue comes from.
Equity portion breakdown by domicile (%)
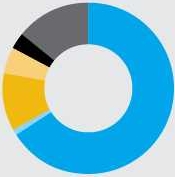
| | Region | | | Fund | | | | Index | |
| ■ | United States | | | 66 | % | | | 100 | % |
| ■ | Canada | | | 1 | | | | – | |
| ■ | Europe | | | 11 | | | | – | |
| ■ | Japan | | | 5 | | | | – | |
| ■ | Asia-Pacific ex. Japan | | | 3 | | | | – | |
| ■ | Emerging markets | | | 14 | | | | – | |
| | Total | | | 100 | % | | | 100 | % |
Equity portion breakdown by revenue (%)
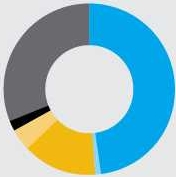
| | Region | | | Fund | | | | Index | |
| ■ | United States | | | 48 | % | | | 64 | % |
| ■ | Canada | | | 1 | | | | 2 | |
| ■ | Europe | | | 14 | | | | 12 | |
| ■ | Japan | | | 4 | | | | 2 | |
| ■ | Asia-Pacific ex. Japan | | | 2 | | | | 1 | |
| ■ | Emerging markets | | | 31 | | | | 19 | |
| | Total | | | 100 | % | | | 100 | % |
Compared with the S&P 500 as a percent of net assets. All figures include convertible securities.
Source: Capital Group (as of November 30, 2016).
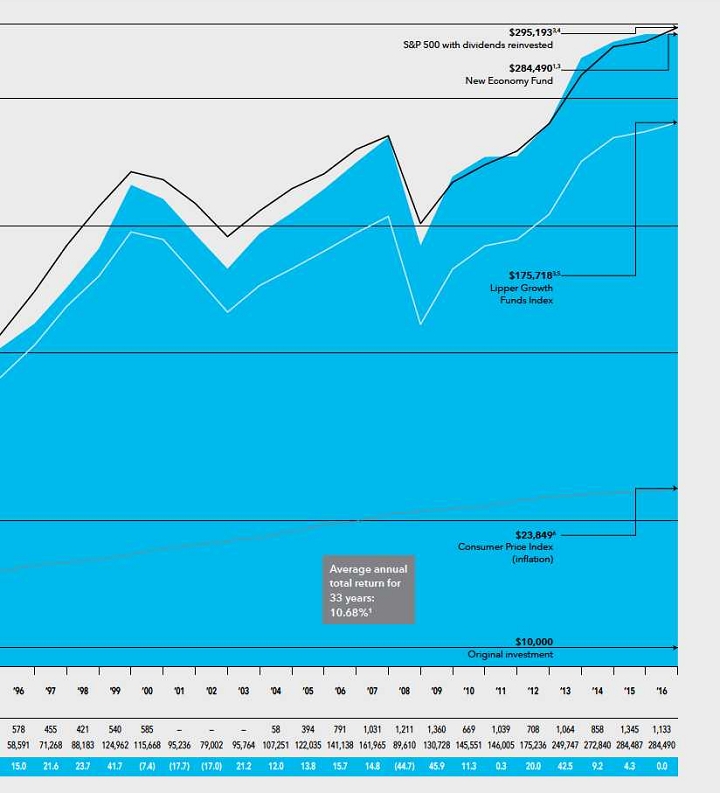
The value of a long-term perspective
Fund results shown are for Class A shares and reflect deduction of the maximum sales charge of 5.75% on the $10,000 investment.1 Thus, the net amount invested was $9,425.2 Results are for past periods and are not predictive of results for future periods. Current and future results may be lower or higher than those shown. Share prices and returns will vary, so investors may lose money. For current information and month-end results, visit americanfunds.com.
The results shown are before taxes on fund distributions and sale of fund shares.
| 1 | As outlined in the prospectus, the sales charge is reduced for accounts (and aggregated investments) of $25,000 or more and is eliminated for purchases of $1 million or more. There is no sales charge on dividends or capital gain distributions that are reinvested in additional shares. |
| 2 | The maximum initial sales charge was 8.50% prior to July 1, 1988. |
| 3 | All results are calculated with dividends and capital gains reinvested. |
| 4 | Source: S&P Dow Jones Indices LLC. Standard & Poor’s 500 Composite Index is unmanaged and, therefore, has no expenses. Investors cannot invest directly in an index. |
| 5 | Source: Thomson Reuters Lipper. Results of the Lipper Growth Funds Index do not reflect any sales charges. Lipper indexes track the largest mutual funds (no more than 30), represented by one share class per fund, in the corresponding Lipper category. |
| 6 | Computed from data supplied by the U.S. Department of Labor, Bureau of Labor Statistics. |
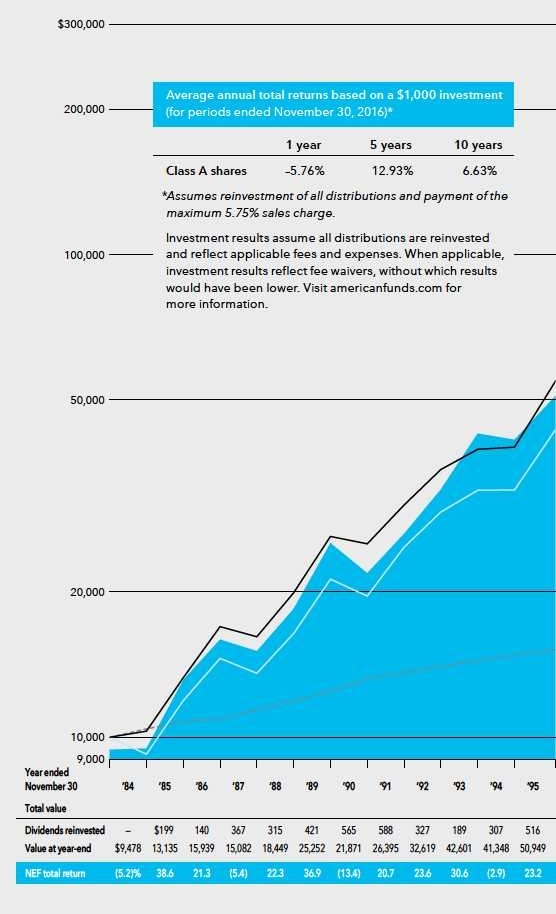
Here’s how a $10,000 investment in The New Economy Fund’s Class A shares grew between December 1, 1983 — when the fund began operations — and November 30, 2016, the end of its latest fiscal year. As you can see, the $10,000 would have increased to $284,490 after deducting the maximum 5.75% sales charge and reinvesting all distributions, an average annual increase of 10.68%. The fund’s year-by-year results appear under the chart.
Exploring the companies that will help shape our future
 | |  | |  |
| | | | | |
Claudia Huntington
Portfolio manager | | Harold La
Portfolio manager | | Tim Armour
Portfolio manager |
Since its inception in 1983, the investment professionals of The New Economy Fund have evaluated companies that will benefit from innovation, exploit new technologies or provide products and services that meet the demands of a global economy.
“We look for great companies we can invest in for the long haul that are in the growing sector of services and technology,” says Claudia Huntington, a portfolio manager with the fund since 1995. “Ideally, the companies also should have some of that growth coming from innovation.”
Harold La, a portfolio manager for the fund since 2006 and based in Hong Kong, looks for companies “that are disruptive and benefit from the changing ways we do business and interact with each other.” Many of his holdings are internet or internet-related companies. “These companies are causing me to do things differently and are becoming more dominant as I’m using their products and services more.”
“Many companies are using innovation to grow and manage their business more effectively or shore up their competitive advantage,” says Tim Armour, a portfolio manager since 1991. “Some are using innovation out of necessity to protect their business or areas of strength.”
How do our investment professionals around the world identify the long-term investment potential of companies that are benefiting from advancements in new technology?
Global coverage by professionals with deep experience
“Our global research capability allows us to analyze a company that operates on a global scale. It’s important and hard to duplicate — and it gives us insight that benefits any investment we make,” says Claudia.
Across Capital Group, we have 166 investment professionals based outside the U.S., many of whom advise on this fund. Representing 51 countries and speaking more than 40 languages,* our global investment team has a deep familiarity not only with companies and industries, but with the local culture, people and language. The investment professionals apply our global, fundamental company research to identify investment opportunities out of the large universe to choose from.
“Not only do we have global coverage of all industries by individuals with a lot of background and experience,” says Tim. “But they also are able to collaborate with, and leverage, counterparts in other industries whose coverage may overlap, building a mosaic of analysis that is truly different.”
*Data as of 12/31/15.
Our global research capability allows us to analyze a company that operates on a global scale. It’s important and hard to duplicate — and it gives us insight that benefits any investment we make.

 | |  | |  |
| | | | | |
Mark Denning
Portfolio manager | | Alex Nicolaou
Investment analyst | | Caroline Jones
Investment analyst |
One recent example was when Claudia visited New Delhi, India, where she traveled with an investment analyst based in Singapore who covers, among other products, Korean cosmetics such as AmorePacific. “We were driving the back roads between Agra and Jaipur, and she was checking small stores to see if they were selling a product she was following and what kind of promotion they had,” recalls Claudia. “She in turn has conversations with our analyst in London — who follows the European cosmetic companies — and they speak with the U.S. analyst. So it really works.”
“All of our portfolio managers also have a wealth of experience as analysts that adds to the great historical knowledge we’re able to bring into a conversation on any company or subject,” says Tim, who earlier in his career covered global telecommunications and U.S. service companies.
On-the-ground, integrated company research
Mark Denning, a portfolio manager with 34 years of investment experience, was in South Korea and Japan recently with our technology analysts from the U.S., Europe and Asia, and they spent the week seeing as many technology and internet companies as possible. “We spent a morning with a major Korean electronics company, meeting the heads of various divisions to hear about their plans for the future,” says Mark. “Being able to understand a company at this level of depth is really helpful in making a judgment about its long-term growth opportunity.”
On-the-ground research can help our investment professionals see what development might be around the corner. For example, we anticipate that smartphone screens might wrap around both sides of the phone and be foldable so two screens can merge into one. Knowing what may be ahead enables our investment professionals to evaluate just how important a product cycle might be.
Thanks to integrated research, a U.S. analyst covering Apple, for instance, can better understand what’s going on in the Apple “food chain” since many of the components of the iPhone are made in Asia. “Understanding cost issues gives additional insights that can provide our investment professionals with a competitive advantage,” says Mark. “That analyst can ask penetrating questions of the various suppliers and gain a better understanding of their technology pipeline.”
The analysts based in Asia also benefit from having the U.S. analyst looking at things from their standpoint. “You get all sorts of different lenses looking at the companies,” continues Mark. “We have the access, the expertise and the perspective and it’s so useful for what we’re trying to do. It’s really a value-added feature of our global research effort.”
Alex Nicolaou covers companies such as U.S. medical device makers Hologic and NuVasive and, like all our investment analysts, travels to meet and evaluate companies and their new and upcoming technology.
Alex attended the North American Spine Society meeting in Boston, where thousands of surgeons and hundreds of spine companies from all over the world convened to show off new products. Alex met physicians to get a sense of what they’re using and why, and what trends are up-and-coming. On a separate trip,
he met with interventional cardiologists at the University of Miami and watched surgical procedures using medical device technology he found interesting.
Deep knowledge of companies and industry
It takes more than just compelling technology to recommend a company’s stock for The New Economy Fund’s portfolio. “It’s not just speaking with a doctor, hearing about a cool product and then making a recommendation,” says Alex. “It’s understanding hospital economics and reimbursement to decipher what products the hospitals are willing to buy and what technologies will get adopted. I want to understand how many patients have a disease, how it’s being treated, what the pricing mechanics are and what kind of market share this product might take over time.”
While company visits can help build general themes that appeal to analysts, analysts then have to roll up their sleeves and build detailed financial models to get into the specifics of expenses, profit and loss, and the earnings power of the business.
Deep knowledge of the industry in which the company operates is also crucial. Caroline Jones, an investment analyst who covers U.S. small-cap banks and U.S. health care companies such as UnitedHealth Group, knows that the health care industry requires intensive and constant study. “The U.S. health care system is complex and always changing so you really have to immerse yourself in it,” explains Caroline. “For example, the Affordable Care Act introduced many new changes over several years, and now many parts of that law may be repealed.
The health care industry requires intensive and constant study. The opportunities come when you know the companies really well, get a sense of how much they’re worth and stand by ready to invest in them at attractive valuations.

Machine learning affects internet platform providers, companies that sell these capabilities and potential new startups. Many industries outside of technology will be affected — from finance to retail.

“My objective is to know my companies inside and out, and this can, over time, produce differentiated insights. The opportunities come when you know the companies really well, get a sense of how much they’re worth and stand by ready to invest in them at attractive valuations.”
The desire to go deeper on key issues and topics
Often, investment research will require a challenging question to be explored and answered. One topic that affected the health care industry dramatically in 2016 was generic drug pricing. The five core global members of our health care “cluster” — including Alex and Caroline — recognized there was a lot of volatility in the generic drug industry and were getting a lot of questions about it. Because the issues were so complex, the group decided they needed to dig deeper to see what they could learn about the investment prospects for companies exposed to generic drug pricing.
They formed a SWAT — a small working analysis team made up of analysts and portfolio managers coalescing around a specific idea or question that requires deeper research. The SWAT drives toward at least one investment idea or critical input into existing investment discussions.
Caroline, Alex and three analysts who cover generic drug industries in various regions around the world were joined by a portfolio manager who used to cover health care. They spent weeks on calls and in meetings with the management teams of virtually every public generic drug company globally and with other stakeholders prior to sharing their conclusion. “It had broader implications than just generic drug companies;

Julien Gaertner
Investment analyst
it impacted the entire drug supply chain,” says Caroline. “And we were all motivated to work on this together because the investment conclusion mattered for those companies affected by it.”
In the end, the SWAT team shared what they learned from their research and what they felt were reasonable investments as a result. “We answered some important questions,” says Alex.
Knowing and researching new technology
Julien Gaertner, an investment analyst who lives in San Francisco and covers hardware and software companies, noticed that machine learning is generating a lot of interest and excitement. Machine learning is a new paradigm that harnesses the power of computers to solve problems and increase productivity. Programmers used to give the computer a specific step-by-step means of solving a problem using mathematics. With machine learning, the computer is given a data “training set” to enable it to deduce the rules itself and reach a certain outcome.
“With greater computing capacity and cloud computing, computers are able to handle much larger data sets,” says Julien, who likens this phenomenon to the takeoff of personal computers and the Internet.
Given the immense potential, another SWAT team was formed with an associate in Hong Kong who covers major users of machine learning such as Tencent and Alibaba, and an associate in Los Angeles who covers Alphabet (formerly Google). Because it was important to understand how machine learning could affect those companies, the team was rounded out by analysts who cover financials, industrials and services.
Claudia and Tim are two portfolio managers on the machine learning SWAT. “It was a cross-nation, cross-sector deep dive that gave us insight that we wouldn’t otherwise have,” says Claudia. “Machine learning factors into our objective of finding companies that are using innovation and the changing global marketplace to create an advantage for their business,” continues Tim.
“It’s the very beginning of the machine learning and artificial intelligence cycle. Every major company in software and the Internet are trying to define how they’re going to play in this,” says Julien.
Machine learning affects internet platform providers, companies that sell these capabilities and potential new startups. Many industries outside of technology will be affected — from finance to retail. “There will be instances in which the technology means you have an advantage by having data that the other companies simply do not have,” says Julien.
The commitment to our global research continues
“We all get together because by having these cross-group discussions, we learn more and we’re better at making decisions,” says Claudia. “It’s a bottom-up, ‘on demand’ way of collecting varied but relevant input on an important investment topic that can help inform our decisions.”
This commitment to global, integrated fundamental research can help our investment professionals locate and evaluate new advancements. This research process can also help them evaluate whether the latest innovation could turn a company into an industry leader and, potentially, a long-term investment for the fund. ■
Summary investment portfolio November 30, 2016
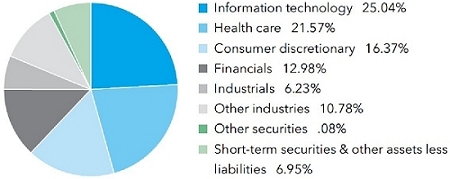
| Industry sector diversification | Percent of net assets |
| Country diversification by domicile | | Percent of
net assets |
| United States | | | 61.63 | % |
| China | | | 6.00 | |
| United Kingdom | | | 5.03 | |
| Japan | | | 5.00 | |
| Euro zone* | | | 4.73 | |
| Hong Kong | | | 2.67 | |
| India | | | 2.48 | |
| South Korea | | | 1.54 | |
| South Africa | | | .77 | |
| Other countries | | | 3.20 | |
| Short-term securities & other assets less liabilities | | | 6.95 | |
| * | Countries using the euro as a common currency; those represented in the fund’s portfolio are Belgium, France, Germany, Ireland, Italy, the Netherlands, and Spain. |
| Common stocks 92.97% | | Shares | | | Value
(000) | |
| Information technology 25.04% | | | | | | | | |
| Alphabet Inc., Class C1 | | | 232,688 | | | $ | 176,387 | |
| Alphabet Inc., Class A1 | | | 192,695 | | | | 149,508 | |
| Tencent Holdings Ltd.2 | | | 13,037,000 | | | | 324,607 | |
| Skyworks Solutions, Inc. | | | 3,467,150 | | | | 266,450 | |
| Accenture PLC, Class A | | | 1,568,300 | | | | 187,302 | |
| Qorvo, Inc.1 | | | 3,294,480 | | | | 175,958 | |
| Trimble Navigation Ltd.1 | | | 5,432,430 | | | | 153,140 | |
| Texas Instruments Inc. | | | 1,858,400 | | | | 137,392 | |
| Alibaba Group Holding Ltd. (ADR)1 | | | 1,432,300 | | | | 134,665 | |
| International Business Machines Corp. | | | 790,000 | | | | 128,154 | |
| Samsung Electronics Co., Ltd.2 | | | 76,445 | | | | 113,106 | |
| Baidu, Inc., Class A (ADR)1 | | | 614,380 | | | | 102,571 | |
| Oracle Corp. | | | 2,401,814 | | | | 96,529 | |
| Nintendo Co., Ltd.2 | | | 382,900 | | | | 93,969 | |
| Other securities | | | | | | | 1,436,758 | |
| | | | | | | | 3,676,496 | |
| | | | | | | | | |
| Health care 21.57% | | | | | | | | |
| Thermo Fisher Scientific Inc. | | | 2,446,000 | | | | 342,709 | |
| Hologic, Inc.1 | | | 5,716,850 | | | | 218,841 | |
| NuVasive, Inc.1,3 | | | 3,163,500 | | | | 205,311 | |
| BioMarin Pharmaceutical Inc.1 | | | 2,162,430 | | | | 185,169 | |
| Amgen Inc. | | | 1,236,613 | | | | 178,159 | |
| AbbVie Inc. | | | 2,162,401 | | | | 131,474 | |
| AbbVie Inc.2,4 | | | 541,232 | | | | 32,578 | |
| Kite Pharma, Inc.1,3 | | | 2,976,570 | | | | 151,597 | |
| Stryker Corp. | | | 1,301,750 | | | | 147,957 | |
| Express Scripts Holding Co.1 | | | 1,923,300 | | | | 145,940 | |
| Ultragenyx Pharmaceutical Inc.1 | | | 1,754,235 | | | | 137,339 | |
| Alexion Pharmaceuticals, Inc.1 | | | 1,111,390 | | | | 136,245 | |
| McKesson Corp. | | | 912,000 | | | | 131,155 | |
| GW Pharmaceuticals PLC (ADR)1 | | | 1,114,054 | | | | 124,384 | |
| China Biologic Products, Inc.1 | | | 1,013,777 | | | | 121,369 | |
| Medtronic PLC | | | 1,299,000 | | | | 94,840 | |
| bluebird bio, Inc.1 | | | 1,521,122 | | | | 91,800 | |
| Other securities | | | | | | | 590,224 | |
| | | | | | | | 3,167,091 | |
| | | | | | | | | |
| Consumer discretionary 16.37% | | | | | | | | |
| Netflix, Inc.1 | | | 4,501,100 | | | | 526,629 | |
| Galaxy Entertainment Group Ltd.2 | | | 51,827,000 | | | | 256,517 | |
| Sony Corp.2 | | | 8,729,000 | | | | 251,399 | |
| Amazon.com, Inc.1 | | | 282,000 | | | | 211,661 | |
| lululemon athletica inc.1 | | | 2,342,000 | | | | 133,471 | |
| | | Shares | | | Value
(000) | |
| Twenty-First Century Fox, Inc., Class A | | | 4,200,000 | | | $ | 118,062 | |
| Daily Mail and General Trust PLC, Class A, non-voting2 | | | 10,896,701 | | | | 103,996 | |
| Kering SA2 | | | 447,000 | | | | 96,906 | |
| Other securities | | | | | | | 703,926 | |
| | | | | | | | 2,402,567 | |
| | | | | | | | | |
| Financials 12.98% | | | | | | | | |
| HDFC Bank Ltd.2 | | | 4,875,000 | | | | 97,881 | |
| HDFC Bank Ltd. (ADR) | | | 1,200,000 | | | | 77,424 | |
| Kotak Mahindra Bank Ltd.2 | | | 14,190,882 | | | | 156,928 | |
| American International Group, Inc. | | | 2,238,000 | | | | 141,732 | |
| Endurance Specialty Holdings Ltd. | | | 1,326,000 | | | | 122,257 | |
| JPMorgan Chase & Co. | | | 1,500,000 | | | | 120,255 | |
| AIA Group Ltd.2 | | | 18,391,800 | | | | 111,994 | |
| Barclays PLC2 | | | 39,981,344 | | | | 107,911 | |
| Essent Group Ltd.1 | | | 3,316,000 | | | | 101,204 | |
| EXOR SpA2 | | | 2,258,000 | | | | 94,716 | |
| Prudential PLC2 | | | 4,900,000 | | | | 94,674 | |
| Other securities | | | | | | | 679,380 | |
| | | | | | | | 1,906,356 | |
| | | | | | | | | |
| Industrials 6.23% | | | | | | | | |
| CSX Corp. | | | 3,809,400 | | | | 136,415 | |
| Union Pacific Corp. | | | 1,075,954 | | | | 109,026 | |
| Nielsen Holdings PLC | | | 2,513,100 | | | | 108,315 | |
| Other securities | | | | | | | 560,679 | |
| | | | | | | | 914,435 | |
| | | | | | | | | |
| Consumer staples 2.33% | | | | | | | | |
| Other securities | | | | | | | 341,456 | |
| | | | | | | | | |
| Energy 0.76% | | | | | | | | |
| Schlumberger Ltd. | | | 1,220,000 | | | | 102,541 | |
| Other securities | | | | | | | 9,516 | |
| | | | | | | | 112,057 | |
| | | | | | | | | |
| Other 3.13% | | | | | | | | |
| Other securities | | | | | | | 459,011 | |
| | | | | | | | | |
| Miscellaneous 4.56% | | | | | | | | |
| Other common stocks in initial period of acquisition | | | | | | | 669,396 | |
| | | | | | | | | |
| Total common stocks (cost: $10,300,497,000) | | | | | | | 13,648,865 | |
| | | | | | | | | |
| Preferred securities 0.08% | | | | | | | | |
| Miscellaneous 0.08% | | | | | | | | |
| Other preferred securities in initial period of acquisition | | | | | | | 11,773 | |
| | | | | | | | | |
| Total preferred securities (cost: $5,997,000) | | | | | | | 11,773 | |
| | | | | | | | | |
| Bonds, notes & other debt instruments 0.00% | Principal amount
(000) | | | | | |
| U.S. Treasury bonds & notes 0.00% | | | | | | | | |
| Other securities | | | | | | | 376 | |
| | | | | | | | | |
| Total bonds, notes & other debt instruments (cost: $375,000) | | | | | | | 376 | |
| Short-term securities 6.90% | Principal amount
(000) | | | Value
(000) | |
| Federal Home Loan Bank 0.28%–0.51% due 12/9/2016–2/22/2017 | | $ | 445,000 | | | $ | 444,808 | |
| IBM Corp. 0.63% due 12/27/20164 | | | 50,000 | | | | 49,985 | |
| Other securities | | | | | | | 517,800 | |
| | | | | | | | | |
| Total short-term securities (cost: $1,012,590,000) | | | | | | | 1,012,593 | |
| Total investment securities 99.95% (cost: $11,319,459,000) | | | | | | | 14,673,607 | |
| Other assets less liabilities 0.05% | | | | | | | 7,119 | |
| | | | | | | | | |
| Net assets 100.00% | | | | | | $ | 14,680,726 | |
This summary investment portfolio is designed to streamline the report and help investors better focus on the fund’s principal holdings. See the inside back cover for details on how to obtain a complete schedule of portfolio holdings.
As permitted by U.S. Securities and Exchange Commission regulations, “Miscellaneous” securities include holdings in their first year of acquisition that have not previously been publicly disclosed.
“Other securities” includes all issues that are not disclosed separately in the summary investment portfolio.
Forward currency contracts
The fund has entered into a forward currency contract as shown in the following table. The average month-end notional amount of open forward currency contracts while held was $38,256,000.
| | | | | | | | | Unrealized |
| | | | | | | Contract amount | | appreciation |
| | | | | | | Receive | | Deliver | | at 11/30/2016 |
| | | Settlement date | | Counterparty | | (000) | | (000) | | (000) |
| Sales: | | | | | | | | | | |
| Euros | | 12/7/2016 | | Barclays Bank PLC | | $12,682 | | €11,407 | | $590 |
Investments in affiliates
A company is an affiliate of the fund under the Investment Company Act of 1940 if the fund’s holdings in that company represent 5% or more of the outstanding voting shares. The value of the fund’s affiliated-company holdings is either shown in the summary investment portfolio or included in the value of “Other securities” under the respective industry sectors. Further details on such holdings and related transactions during the year ended November 30, 2016, appear below.
| | | | | | | | | | | | | | | | | | Value of | |
| | | | | | | | | | | | | | | Dividend | | | affiliates at | |
| | | Beginning | | | | | | | | | Ending | | | income | | | 11/30/2016 | |
| | | shares | | | Additions | | | Reductions | | | shares | | | (000) | | | (000) | |
| NuVasive, Inc.1 | | | 2,854,000 | | | | 309,500 | | | | — | | | | 3,163,500 | | | $ | — | | | $ | 205,311 | |
| Kite Pharma, Inc.1 | | | 2,797,500 | | | | 179,070 | | | | — | | | | 2,976,570 | | | | — | | | | 151,597 | |
| Cray Inc.1 | | | 2,503,010 | | | | — | | | | 200,000 | | | | 2,303,010 | | | | — | | | | 44,448 | |
| Mesoblast Ltd.1,2 | | | 21,900,000 | | | | — | | | | — | | | | 21,900,000 | | | | — | | | | 19,704 | |
| Mesoblast Ltd. (ADR)1 | | | 372,800 | | | | — | | | | — | | | | 372,800 | | | | — | | | | 1,685 | |
| Avanti Communications Group PLC1,2,5 | | | 8,688,970 | | | | — | | | | 3,839,084 | | | | 4,849,886 | | | | — | | | | — | |
| Transocean Partners LLC5 | | | 2,544,143 | | | | — | | | | 2,544,143 | | | | — | | | | 922 | | | | — | |
| | | | | | | | | | | | | | | | | | | $ | 922 | | | $ | 422,745 | |
| 1 | Security did not produce income during the last 12 months. |
| 2 | Valued under fair value procedures adopted by authority of the board of trustees. The total value of all such securities, including those in “Miscellaneous” and “Other securities,” was $3,708,360,000, which represented 25.26% of the net assets of the fund. This amount includes $3,575,245,000 related to certain securities trading outside the U.S. whose values were adjusted as a result of significant market movements following the close of local trading. |
| 3 | Represents an affiliated company as defined under the Investment Company Act of 1940. |
| 4 | Acquired in a transaction exempt from registration under Section 4(2) of the Securities Act of 1933. May be resold in the U.S. in transactions exempt from registration, normally to qualified institutional buyers. The total value of all such securities, including those in “Other securities,” was $391,560,000, which represented 2.67% of the net assets of the fund. |
| 5 | Unaffiliated issuer at 11/30/2016. |
Key to abbreviation and symbol
ADR = American Depositary Receipts
€ = Euros
See Notes to Financial Statements
Financial statements
| Statement of assets and liabilities | | | | | | | | |
| at November 30, 2016 | | | (dollars in thousands) | |
| | | | | | | | | |
| Assets: | | | | | | | | |
| Investment securities, at value: | | | | | | | | |
| Unaffiliated issuers (cost: $10,887,178) | | $ | 14,250,862 | | | | | |
| Affiliated issuers (cost: $432,281) | | | 422,745 | | | $ | 14,673,607 | |
| Cash | | | | | | | 156 | |
| Unrealized appreciation on open forward currency contracts | | | | | | | 590 | |
| Receivables for: | | | | | | | | |
| Sales of investments | | | 23,008 | | | | | |
| Sales of fund’s shares | | | 12,934 | | | | | |
| Dividends and interest | | | 13,986 | | | | | |
| Other | | | 3 | | | | 49,931 | |
| | | | | | | | 14,724,284 | |
| Liabilities: | | | | | | | | |
| Payables for: | | | | | | | | |
| Purchases of investments | | | 6,870 | | | | | |
| Repurchases of fund’s shares | | | 22,938 | | | | | |
| Investment advisory services | | | 4,659 | | | | | |
| Services provided by related parties | | | 5,314 | | | | | |
| Trustees’ deferred compensation | | | 2,236 | | | | | |
| Other | | | 1,541 | | | | 43,558 | |
| Net assets at November 30, 2016 | | | | | | $ | 14,680,726 | |
| | | | | | | | | |
| Net assets consist of: | | | | | | | | |
| Capital paid in on shares of beneficial interest | | | | | | $ | 10,931,245 | |
| Undistributed net investment income | | | | | | | 22,756 | |
| Undistributed net realized gain | | | | | | | 373,057 | |
| Net unrealized appreciation | | | | | | | 3,353,668 | |
| Net assets at November 30, 2016 | | | | | | $ | 14,680,726 | |
(dollars and shares in thousands, except per-share amounts)
Shares of beneficial interest issued and outstanding (no stated par value) —
unlimited shares authorized (402,274 total shares outstanding)
| | | Net assets | | | Shares
outstanding | | | Net asset
value per share | |
| Class A | | $ | 9,701,798 | | | | 264,578 | | | $ | 36.67 | |
| Class B | | | 5,143 | | | | 151 | | | | 34.03 | |
| Class C | | | 459,694 | | | | 13,720 | | | | 33.51 | |
| Class F-1 | | | 304,809 | | | | 8,298 | | | | 36.73 | |
| Class F-2 | | | 750,810 | | | | 20,464 | | | | 36.69 | |
| Class 529-A | | | 416,174 | | | | 11,455 | | | | 36.33 | |
| Class 529-B | | | 766 | | | | 23 | | | | 34.00 | |
| Class 529-C | | | 113,692 | | | | 3,349 | | | | 33.94 | |
| Class 529-E | | | 21,008 | | | | 586 | | | | 35.83 | |
| Class 529-F-1 | | | 33,071 | | | | 910 | | | | 36.34 | |
| Class R-1 | | | 46,803 | | | | 1,358 | | | | 34.47 | |
| Class R-2 | | | 163,833 | | | | 4,728 | | | | 34.65 | |
| Class R-2E | | | 2,168 | | | | 60 | | | | 36.29 | |
| Class R-3 | | | 286,181 | | | | 7,971 | | | | 35.90 | |
| Class R-4 | | | 348,613 | | | | 9,592 | | | | 36.34 | |
| Class R-5E | | | 9 | | | | — | * | | | 36.57 | |
| Class R-5 | | | 106,390 | | | | 2,883 | | | | 36.91 | |
| Class R-6 | | | 1,919,764 | | | | 52,148 | | | | 36.81 | |
* Amount less than one thousand.
See Notes to Financial Statements
| Statement of operations | | | | | | | | |
| for the year ended November 30, 2016 | | | (dollars in thousands) | |
| | | | | | | | | |
| Investment income: | | | | | | | | |
| Income: | | | | | | | | |
Dividends (net of non-U.S. taxes of $4,316;
also includes $922 from affiliates) | | $ | 155,891 | | | | | |
| Interest | | | 7,012 | | | $ | 162,903 | |
| Fees and expenses*: | | | | | | | | |
| Investment advisory services | | | 57,062 | | | | | |
| Distribution services | | | 34,362 | | | | | |
| Transfer agent services | | | 19,633 | | | | | |
| Administrative services | | | 3,408 | | | | | |
| Reports to shareholders | | | 841 | | | | | |
| Registration statement and prospectus | | | 777 | | | | | |
| Trustees’ compensation | | | 475 | | | | | |
| Auditing and legal | | | 373 | | | | | |
| Custodian | | | 1,098 | | | | | |
| Other | | | 927 | | | | 118,956 | |
| Net investment income | | | | | | | 43,947 | |
| | | | | | | | | |
| Net realized gain and unrealized depreciation: | | | | | | | | |
| Net realized gain (loss) on: | | | | | | | | |
Investments (net of non-U.S. taxes of $43;
also includes $35,606 net loss from affiliates) | | | 326,349 | | | | | |
| Forward currency contracts | | | (1,293 | ) | | | | |
| Currency transactions | | | (1,075 | ) | | | 323,981 | |
| Net unrealized (depreciation) appreciation on: | | | | | | | | |
| Investments (net of non-U.S. taxes of $954) | | | (398,874 | ) | | | | |
| Forward currency contracts | | | 590 | | | | | |
| Currency translations | | | (172 | ) | | | (398,456 | ) |
| Net realized gain and unrealized depreciation | | | | | | | (74,475 | ) |
| | | | | | | | | |
| Net decrease in net assets resulting from operations | | | | | | $ | (30,528 | ) |
* Additional information related to class-specific fees and expenses is included in the Notes to Financial Statements.
| Statements of changes in net assets | | | |
| | | (dollars in thousands) | |
| | | | |
| | | Year ended November 30 | |
| | | 2016 | | | 2015 | |
| Operations: | | | | | | | | |
| Net investment income | | $ | 43,947 | | | $ | 42,301 | |
| Net realized gain | | | 323,981 | | | | 997,984 | |
| Net unrealized depreciation | | | (398,456 | ) | | | (437,629 | ) |
| Net (decrease) increase in net assets resulting from operations | | | (30,528 | ) | | | 602,656 | |
| | | | | | | | | |
| Dividends and distributions paid to shareholders: | | | | | | | | |
| Dividends from net investment income | | | (64,296 | ) | | | (72,804 | ) |
| Distributions from net realized gain on investments | | | (836,882 | ) | | | (1,095,957 | ) |
| Total dividends and distributions paid to shareholders | | | (901,178 | ) | | | (1,168,761 | ) |
| | | | | | | | | |
| Net capital share transactions | | | (123,375 | ) | | | 1,672,107 | |
| | | | | | | | | |
| Total (decrease) increase in net assets | | | (1,055,081 | ) | | | 1,106,002 | |
| | | | | | | | | |
| Net assets: | | | | | | | | |
| Beginning of year | | | 15,735,807 | | | | 14,629,805 | |
| End of year (including undistributed net investment income: $22,756 and $37,008, respectively) | | $ | 14,680,726 | | | $ | 15,735,807 | |
See Notes to Financial Statements
Notes to financial statements
1. Organization
The New Economy Fund (the “fund”) is registered under the Investment Company Act of 1940 as an open-end, diversified management investment company. The fund seeks long-term growth of capital. Current income is a secondary consideration.
The fund has 18 share classes consisting of five retail share classes (Classes A, B and C, as well as two F share classes, F-1 and F-2), five 529 college savings plan share classes (Classes 529-A, 529-B, 529-C, 529-E and 529-F-1) and eight retirement plan share classes (Classes R-1, R-2, R-2E, R-3, R-4, R-5E, R-5 and R-6). The 529 college savings plan share classes can be used to save for college education. The retirement plan share classes are generally offered only through eligible employer-sponsored retirement plans. The fund’s share classes are described further in the following table:
| Share class | | Initial sales
charge | | Contingent deferred sales
charge upon redemption | | Conversion feature |
| Classes A and 529-A | | Up to 5.75% | | None (except 1% for certain redemptions within one year of purchase without an initial sales charge) | | None |
| Classes B and 529-B* | | None | | Declines from 5% to 0% for redemptions within six years of purchase | | Classes B and 529-B convert to Classes A and 529-A, respectively, after eight years |
| Class C | | None | | 1% for redemptions within one year of purchase | | Class C converts to Class F-1 after 10 years |
| Class 529-C | | None | | 1% for redemptions within one year of purchase | | None |
| Class 529-E | | None | | None | | None |
| Classes F-1, F-2 and 529-F-1 | | None | | None | | None |
| Classes R-1, R-2, R-2E, R-3, R-4, R-5E, R-5 and R-6 | | None | | None | | None |
* Class B and 529-B shares of the fund are not available for purchase.
Holders of all share classes have equal pro rata rights to the assets, dividends and liquidation proceeds of the fund. Each share class has identical voting rights, except for the exclusive right to vote on matters affecting only its class. Share classes have different fees and expenses (“class-specific fees and expenses”), primarily due to different arrangements for distribution, transfer agent and administrative services. Differences in class-specific fees and expenses will result in differences in net investment income and, therefore, the payment of different per-share dividends by each share class.
2. Significant accounting policies
The fund is an investment company that applies the accounting and reporting guidance issued in Topic 946 by the U.S. Financial Accounting Standards Board. The fund’s financial statements have been prepared to comply with U.S. generally accepted accounting principles (“U.S. GAAP“). These principles require the fund’s investment adviser to make estimates and assumptions that affect reported amounts and disclosures. Actual results could differ from those estimates. Subsequent events, if any, have been evaluated through the date of issuance in the preparation of the financial statements. The fund follows the significant accounting policies described in this section, as well as the valuation policies described in the next section on valuation.
Security transactions and related investment income — Security transactions are recorded by the fund as of the date the trades are executed with brokers. Realized gains and losses from security transactions are determined based on the specific identified cost of the securities. In the event a security is purchased with a delayed payment date, the fund will segregate liquid assets sufficient to meet its payment obligations. Dividend income is recognized on the ex-dividend date and interest income is recognized on an accrual basis. Market discounts, premiums and original issue discounts on fixed-income securities are amortized daily over the expected life of the security.
Class allocations — Income, fees and expenses (other than class-specific fees and expenses) and realized and unrealized gains and losses are allocated daily among the various share classes based on their relative net assets. Class-specific fees and expenses, such as distribution, transfer agent and administrative services, are charged directly to the respective share class.
Dividends and distributions to shareholders — Dividends and distributions to shareholders are recorded on the ex-dividend date.
Currency translation — Assets and liabilities, including investment securities, denominated in currencies other than U.S. dollars are translated into U.S. dollars at the exchange rates supplied by one or more pricing vendors on the valuation date. Purchases and sales of
investment securities and income and expenses are translated into U.S. dollars at the exchange rates on the dates of such transactions. The effects of changes in exchange rates on investment securities are included with the net realized gain or loss and net unrealized appreciation or depreciation on investments in the fund’s statement of operations. The realized gain or loss and unrealized appreciation or depreciation resulting from all other transactions denominated in currencies other than U.S. dollars are disclosed separately.
3. Valuation
Capital Research and Management Company (“CRMC”), the fund’s investment adviser, values the fund’s investments at fair value as defined by U.S. GAAP. The net asset value of each share class of the fund is generally determined as of approximately 4:00 p.m. New York time each day the New York Stock Exchange is open.
Methods and inputs — The fund’s investment adviser uses the following methods and inputs to establish the fair value of the fund’s assets and liabilities. Use of particular methods and inputs may vary over time based on availability and relevance as market and economic conditions evolve.
Equity securities are generally valued at the official closing price of, or the last reported sale price on, the exchange or market on which such securities are traded, as of the close of business on the day the securities are being valued or, lacking any sales, at the last available bid price. Prices for each security are taken from the principal exchange or market on which the security trades.
Fixed-income securities, including short-term securities, are generally valued at prices obtained from one or more pricing vendors. Vendors value such securities based on one or more of the inputs described in the following table. The table provides examples of inputs that are commonly relevant for valuing particular classes of fixed-income securities in which the fund is authorized to invest. However, these classifications are not exclusive, and any of the inputs may be used to value any other class of fixed-income security.
| Fixed-income class | | Examples of standard inputs |
| All | | Benchmark yields, transactions, bids, offers, quotations from dealers and trading systems, new issues, spreads and other relationships observed in the markets among comparable securities; and proprietary pricing models such as yield measures calculated using factors such as cash flows, financial or collateral performance and other reference data (collectively referred to as “standard inputs”) |
| Corporate bonds & notes; convertible securities | | Standard inputs and underlying equity of the issuer |
| Bonds & notes of governments & government agencies | | Standard inputs and interest rate volatilities |
When the fund’s investment adviser deems it appropriate to do so (such as when vendor prices are unavailable or deemed to be not representative), fixed-income securities will be valued in good faith at the mean quoted bid and ask prices that are reasonably and timely available (or bid prices, if ask prices are not available) or at prices for securities of comparable maturity, quality and type.
Securities with both fixed-income and equity characteristics, or equity securities traded principally among fixed-income dealers, are generally valued in the manner described for either equity or fixed-income securities, depending on which method is deemed most appropriate by the fund’s investment adviser. Forward currency contracts are valued at the mean of representative quoted bid and ask prices, generally based on prices supplied by one or more pricing vendors.
Securities and other assets for which representative market quotations are not readily available or are considered unreliable by the fund’s investment adviser are fair valued as determined in good faith under fair valuation guidelines adopted by authority of the fund’s board of trustees as further described. The investment adviser follows fair valuation guidelines, consistent with U.S. Securities and Exchange Commission rules and guidance, to consider relevant principles and factors when making fair value determinations. The investment adviser considers relevant indications of value that are reasonably and timely available to it in determining the fair value to be assigned to a particular security, such as the type and cost of the security; contractual or legal restrictions on resale of the security; relevant financial or business developments of the issuer; actively traded similar or related securities; conversion or exchange rights on the security; related corporate actions; significant events occurring after the close of trading in the security; and changes in overall market conditions. In addition, the closing prices of equity securities that trade in markets outside U.S. time zones may be adjusted to reflect significant events that occur after the close of local trading but before the net asset value of each share class of the fund is determined. Fair valuations and valuations of investments that are not actively trading involve judgment and may differ materially from valuations that would have been used had greater market activity occurred.
Processes and structure — The fund’s board of trustees has delegated authority to the fund’s investment adviser to make fair value determinations, subject to board oversight. The investment adviser has established a Joint Fair Valuation Committee (the “Fair Valuation Committee”) to administer, implement and oversee the fair valuation process, and to make fair value decisions. The Fair Valuation Committee regularly reviews its own fair value decisions, as well as decisions made under its standing instructions to the investment
adviser’s valuation teams. The Fair Valuation Committee reviews changes in fair value measurements from period to period and may, as deemed appropriate, update the fair valuation guidelines to better reflect the results of back testing and address new or evolving issues. The Fair Valuation Committee reports any changes to the fair valuation guidelines to the board of trustees with supplemental information to support the changes. The fund’s board and audit committee also regularly review reports that describe fair value determinations and methods.
The fund’s investment adviser has also established a Fixed-Income Pricing Review Group to administer and oversee the fixed-income valuation process, including the use of fixed-income pricing vendors. This group regularly reviews pricing vendor information and market data. Pricing decisions, processes and controls over security valuation are also subject to additional internal reviews, including an annual control self-evaluation program facilitated by the investment adviser’s compliance group.
Classifications — The fund’s investment adviser classifies the fund’s assets and liabilities into three levels based on the inputs used to value the assets or liabilities. Level 1 values are based on quoted prices in active markets for identical securities. Level 2 values are based on significant observable market inputs, such as quoted prices for similar securities and quoted prices in inactive markets. Certain securities trading outside the U.S. may transfer between Level 1 and Level 2 due to valuation adjustments resulting from significant market movements following the close of local trading. Level 3 values are based on significant unobservable inputs that reflect the investment adviser’s determination of assumptions that market participants might reasonably use in valuing the securities. The valuation levels are not necessarily an indication of the risk or liquidity associated with the underlying investment. For example, U.S. government securities are reflected as Level 2 because the inputs used to determine fair value may not always be quoted prices in an active market. The following tables present the fund’s valuation levels as of November 30, 2016 (dollars in thousands):
| | | Investment securities |
| | | Level 1 | | Level 2* | | Level 3 | | Total |
| Assets: | | | | | | | | | | | | | | | | |
| Common stocks: | | | | | | | | | | | | | | | | |
| Information technology | | $ | 2,737,936 | | | $ | 938,560 | | | $ | — | | | $ | 3,676,496 | |
| Health care | | | 2,971,361 | | | | 195,730 | | | | — | | | | 3,167,091 | |
| Consumer discretionary | | | 1,460,615 | | | | 941,952 | | | | — | | | | 2,402,567 | |
| Financials | | | 1,069,223 | | | | 837,133 | | | | — | | | | 1,906,356 | |
| Industrials | | | 671,868 | | | | 242,567 | | | | — | | | | 914,435 | |
| Consumer staples | | | 174,774 | | | | 166,682 | | | | — | | | | 341,456 | |
| Energy | | | 112,057 | | | | — | | | | — | | | | 112,057 | |
| Other | | | 202,752 | | | | 256,259 | | | | — | | | | 459,011 | |
| Miscellaneous | | | 539,919 | | | | 129,477 | | | | — | | | | 669,396 | |
| Preferred securities | | | 11,773 | | | | — | | | | — | | | | 11,773 | |
| Bonds, notes & other debt instruments | | | — | | | | 376 | | | | — | | | | 376 | |
| Short-term securities | | | — | | | | 1,012,593 | | | | — | | | | 1,012,593 | |
| Total | | $ | 9,952,278 | | | $ | 4,721,329 | | | $ | — | | | $ | 14,673,607 | |
| | | Other investments† |
| | | Level 1 | | Level 2 | | Level 3 | | Total |
| Assets: | | | | | | | | | | | | | | | | |
| Unrealized appreciation on open forward currency contracts | | $ | — | | | $ | 590 | | | $ | — | | | $ | 590 | |
| * | Securities with a value of $3,575,245,000, which represented 24.35% of the net assets of the fund, were classified as Level 2 due to significant market movements following the close of local trading. |
| † | Forward currency contracts are not included in the investment portfolio. |
4. Risk factors
Investing in the fund may involve certain risks including, but not limited to, those described below.
Market conditions — The prices of, and the income generated by, the common stocks and other securities held by the fund may decline — sometimes rapidly or unpredictably — due to various factors, including events or conditions affecting the general economy or particular industries; overall market changes; local, regional or global political, social or economic instability; governmental or governmental agency responses to economic conditions; and currency exchange rate, interest rate and commodity price fluctuations.
Issuer risks — The prices of, and the income generated by, securities held by the fund may decline in response to various factors directly related to the issuers of such securities, including reduced demand for an issuer’s goods or services, poor management performance and strategic initiatives such as mergers, acquisitions or dispositions and the market response to any such initiatives.
Investing in growth-oriented stocks — Growth-oriented common stocks and other equity-type securities (such as preferred stocks, convertible preferred stocks and convertible bonds) may involve larger price swings and greater potential for loss than other types of investments. These risks may be even greater in the case of smaller capitalization stocks.
Investing in income-oriented stocks — Income provided by the fund may be reduced by changes in the dividend policies of, and the capital resources available for dividend payments at, the companies in which the fund invests.
Investing outside the U.S. — Securities of issuers domiciled outside the U.S., or with significant operations or revenues outside the U.S., may lose value because of adverse political, social, economic or market developments (including social instability, regional conflicts, terrorism and war) in the countries or regions in which the issuers operate or generate revenue. These securities may also lose value due to changes in foreign currency exchange rates against the U.S. dollar and/or currencies of other countries. Issuers of these securities may be more susceptible to actions of foreign governments, such as the imposition of price controls or punitive taxes, that could adversely impact the value of these securities. Securities markets in certain countries may be more volatile and/or less liquid than those in the U.S. Investments outside the U.S. may also be subject to different accounting practices and different regulatory, legal and reporting standards and practices, and may be more difficult to value, than those in the U.S. In addition, the value of investments outside the U.S. may be reduced by foreign taxes, including foreign withholding taxes on interest and dividends. Further, there may be increased risks of delayed settlement of securities purchased or sold by the fund. The risks of investing outside the U.S. may be heightened in connection with investments in emerging markets.
Investing in emerging markets — Investing in emerging markets may involve risks in addition to and greater than those generally associated with investing in the securities markets of developed countries. For instance, developing countries may have less developed legal and accounting systems than those in developed countries. The governments of these countries may be less stable and more likely to impose capital controls, nationalize a company or industry, place restrictions on foreign ownership and on withdrawing sale proceeds of securities from the country, and/or impose punitive taxes that could adversely affect the prices of securities. In addition, the economies of these countries may be dependent on relatively few industries that are more susceptible to local and global changes. Securities markets in these countries can also be relatively small and have substantially lower trading volumes. As a result, securities issued in these countries may be more volatile and less liquid, and may be more difficult to value, than securities issued in countries with more developed economies and/or markets. Less certainty with respect to security valuations may lead to additional challenges and risks in calculating the fund’s net asset value. Additionally, there may be increased settlement risks for transactions in local securities.
Investing in small companies — Investing in smaller companies may pose additional risks. For example, it is often more difficult to value or dispose of small company stocks and more difficult to obtain information about smaller companies than about larger companies. Furthermore, smaller companies often have limited product lines, operating histories, markets and/or financial resources, may be dependent on one or a few key persons for management, and can be more susceptible to losses. Moreover, the prices of their stocks may be more volatile than stocks of larger, more established companies.
Exposure to country, region, industry or sector — The fund may have significant exposure to a particular country, region, industry or sector. Such exposure may cause the fund to be more impacted by risks relating to the country, region, industry or sector than a fund without such levels of exposure. For example, if the fund has significant exposure in a particular country, then social, economic, regulatory or other issues that negatively affect that country may have a greater impact on the fund than on a fund that is more geographically diversified.
Management — The investment adviser to the fund actively manages the fund’s investments. Consequently, the fund is subject to the risk that the methods and analyses employed by the investment adviser in this process may not produce the desired results. This could cause the fund to lose value or its investment results to lag relevant benchmarks or other funds with similar objectives.
5. Certain investment techniques
Forward currency contracts — The fund has entered into forward currency contracts, which represent agreements to exchange currencies on specific future dates at predetermined rates. The fund’s investment adviser uses forward currency contracts to manage the fund’s exposure to changes in exchange rates. Upon entering into these contracts, risks may arise from the potential inability of counterparties to meet the terms of their contracts and from possible movements in exchange rates.
On a daily basis, the fund’s investment adviser values forward currency contracts and records unrealized appreciation or depreciation for open forward currency contracts in the fund’s statement of assets and liabilities. Realized gains or losses are recorded at the time the forward currency contract is closed or offset by another contract with the same broker for the same settlement date and currency.
Closed forward currency contracts that have not reached their settlement date are included in the respective receivables or payables for closed forward currency contracts in the fund’s statement of assets and liabilities. Net realized gains or losses from closed forward
currency contracts and net unrealized appreciation or depreciation from open forward currency contracts are recorded in the fund’s statement of operations.
The following tables present the financial statement impacts resulting from the fund’s use of forward currency contracts as of, or for the year ended, November 30, 2016 (dollars in thousands):
| | | | | Assets | | Liabilities |
| Contract | | Risk type | | Location on statement of
assets and liabilities | | Value | | Location on statement of
assets and liabilities | | Value |
| Forward currency | | Currency | | Unrealized appreciation on open forward currency contracts | | $590 | | Unrealized depreciation on open forward currency contracts | | $— |
| | | | | | | | | | | |
| | | | | Net realized loss | | Net unrealized appreciation |
| Contract | | Risk type | | Location on statement of
operations | | Value | | Location on statement of
operations | | Value |
| Forward currency | | Currency | | Net realized loss on forward currency contracts | | $(1,293) | | Net unrealized appreciation on forward currency contracts | | $590 |
Collateral — The fund participates in a collateral program due to its use of forward currency contracts. The program calls for the fund to either receive or pledge collateral based on the net gain or loss on unsettled forward currency contracts by counterparty. The purpose of the collateral is to cover potential losses that could occur in the event that either party cannot meet its contractual obligations.
Rights of offset — The fund has entered into enforceable master netting agreements with certain counterparties for forward currency contracts, where on any date amounts payable by each party to the other (in the same currency with respect to the same transaction) may be closed or offset by each party’s payment obligation. If an early termination date occurs under these agreements following an event of default or termination event, all obligations of each party to its counterparty are settled net through a single payment in a single currency (“close-out netting”). For financial reporting purposes, the fund does not offset financial assets and financial liabilities that are subject to these master netting arrangements in the statement of assets and liabilities.
The following table presents the fund’s forward currency contracts by counterparty that are subject to master netting agreements but that are not offset in the fund’s statement of assets and liabilities. The net amount column shows the impact of offsetting on the fund’s statement of assets and liabilities as of November 30, 2016, if close-out netting was exercised (dollars in thousands):
| | Gross amounts | Gross amounts not offset in the
statement of assets and liabilities and | |
| | recognized in the | subject to a master netting agreement | |
| | statement of assets | Available | Non-cash | Cash | Net |
| Counterparty | and liabilities | to offset | collateral* | collateral | amount |
| Assets: | | | | | |
| Barclays Bank PLC | $590 | $— | $(556) | $— | $34 |
| * | Non-cash collateral is shown on a settlement basis. |
6. Taxation and distributions
Federal income taxation — The fund complies with the requirements under Subchapter M of the Internal Revenue Code applicable to mutual funds and intends to distribute substantially all of its net taxable income and net capital gains each year. The fund is not subject to income taxes to the extent such distributions are made. Therefore, no federal income tax provision is required.
As of and during the period ended November 30, 2016, the fund did not have a liability for any unrecognized tax benefits. The fund recognizes interest and penalties, if any, related to unrecognized tax benefits as income tax expense in the statement of operations. During the period, the fund did not incur any interest or penalties.
The fund is not subject to examination by U.S. federal tax authorities for tax years before 2012, by state tax authorities for tax years before 2011 and by tax authorities outside the U.S. for tax years before 2009.
Non-U.S. taxation — Dividend and interest income are recorded net of non-U.S. taxes paid. The fund may file withholding tax reclaims in certain jurisdictions to recover a portion of amounts previously withheld. As a result of rulings from European courts, the fund filed for additional reclaims related to prior years. These reclaims are recorded when the amount is known and there are no significant uncertainties on collectability. Gains realized by the fund on the sale of securities in certain countries are subject to non-U.S. taxes. The fund records an estimated deferred tax liability based on unrealized gains to provide for potential non-U.S. taxes payable upon the sale of these securities.
Distributions — Distributions paid to shareholders are based on net investment income and net realized gains determined on a tax basis, which may differ from net investment income and net realized gains for financial reporting purposes. These differences are due primarily to different treatment for items such as currency gains and losses; short-term capital gains and losses; unrealized appreciation of certain investments in securities outside the U.S.; cost of investments sold and income on certain investments. The fiscal year in which amounts are distributed may differ from the year in which the net investment income and net realized gains are recorded by the fund for financial reporting purposes. The fund may also designate a portion of the amount paid to redeeming shareholders as a distribution for tax purposes.
During the year ended November 30, 2016, the fund reclassified $34,000 from undistributed net investment income to capital paid in on shares of beneficial interest, $6,131,000 from undistributed net realized gain to undistributed net investment income and $44,605,000 from undistributed net realized gain to capital paid in on shares of beneficial interest to align financial reporting with tax reporting.
As of November 30, 2016, the tax basis components of distributable earnings, unrealized appreciation (depreciation) and cost of investment securities were as follows (dollars in thousands):
| Undistributed ordinary income | | $ | 40,471 | |
| Undistributed long-term capital gains | | | 273,640 | |
| Gross unrealized appreciation on investment securities | | | 4,188,519 | |
| Gross unrealized depreciation on investment securities | | | (749,843 | ) |
| Net unrealized appreciation on investment securities | | | 3,438,676 | |
| Cost of investment securities | | | 11,234,931 | |
The tax character of distributions paid to shareholders was as follows (dollars in thousands):
| | | Year ended November 30, 2016 | | | Year ended November 30, 2015 | |
| Share class | | Ordinary
income | | | Long-term
capital gains | | | Total
dividends and
distributions
paid | | | Ordinary
income | | | Long-term
capital gains | | | Total
dividends and
distributions
paid | |
| Class A | | $ | 42,416 | | | $ | 564,020 | | | $ | 606,436 | | | $ | 49,171 | | | $ | 743,705 | | | $ | 792,876 | |
| Class B | | | — | | | | 1,126 | | | | 1,126 | | | | — | | | | 2,945 | | | | 2,945 | |
| Class C | | | — | | | | 31,172 | | | | 31,172 | | | | — | * | | | 38,028 | | | | 38,028 | |
| Class F-1 | | | 1,264 | | | | 20,849 | | | | 22,113 | | | | 1,507 | | | | 30,588 | | | | 32,095 | |
| Class F-2 | | | 4,814 | | | | 41,082 | | | | 45,896 | | | | 4,867 | | | | 49,207 | | | | 54,074 | |
| Class 529-A | | | 1,442 | | | | 23,103 | | | | 24,545 | | | | 1,701 | | | | 29,252 | | | | 30,953 | |
| Class 529-B | | | — | | | | 170 | | | | 170 | | | | — | | | | 461 | | | | 461 | |
| Class 529-C | | | 1 | | | | 6,785 | | | | 6,786 | | | | — | * | | | 8,640 | | | | 8,640 | |
| Class 529-E | | | 21 | | | | 1,193 | | | | 1,214 | | | | 42 | | | | 1,570 | | | | 1,612 | |
| Class 529-F-1 | | | 177 | | | | 1,786 | | | | 1,963 | | | | 181 | | | | 2,153 | | | | 2,334 | |
| Class R-1 | | | — | | | | 3,158 | | | | 3,158 | | | | — | | | | 4,060 | | | | 4,060 | |
| Class R-2 | | | — | | | | 10,328 | | | | 10,328 | | | | — | | | | 14,434 | | | | 14,434 | |
| Class R-2E | | | 2 | | | | 17 | | | | 19 | | | | — | * | | | 1 | | | | 1 | |
| Class R-3 | | | 166 | | | | 17,697 | | | | 17,863 | | | | 778 | | | | 25,732 | | | | 26,510 | |
| Class R-4 | | | 1,535 | | | | 21,244 | | | | 22,779 | | | | 1,922 | | | | 27,721 | | | | 29,643 | |
| Class R-5E† | | | — | * | | | 1 | | | | 1 | | | | — | | | | — | | | | — | |
| Class R-5 | | | 1,065 | | | | 8,411 | | | | 9,476 | | | | 1,071 | | | | 11,100 | | | | 12,171 | |
| Class R-6 | | | 11,393 | | | | 84,740 | | | | 96,133 | | | | 11,564 | | | | 106,360 | | | | 117,924 | |
| Total | | $ | 64,296 | | | $ | 836,882 | | | $ | 901,178 | | | $ | 72,804 | | | $ | 1,095,957 | | | $ | 1,168,761 | |
| * | Amount less than one thousand. |
| † | Class R-5E shares were offered beginning November 20, 2015. |
7. Fees and transactions with related parties
CRMC, the fund’s investment adviser, is the parent company of American Funds Distributors,® Inc. (“AFD”), the principal underwriter of the fund’s shares, and American Funds Service Company® (“AFS”), the fund’s transfer agent. CRMC, AFD and AFS are considered related parties to the fund.
Investment advisory services — The fund has an investment advisory and service agreement with CRMC that provides for monthly fees accrued daily. These fees are based on a series of decreasing annual rates beginning with 0.580% on the first $500 million of daily net assets and decreasing to 0.345% on such assets in excess of $27 billion. For the year ended November 30, 2016, the investment advisory services fee was $57,062,000, which was equivalent to an annualized rate of 0.388% of average daily net assets.
Class-specific fees and expenses — Expenses that are specific to individual share classes are accrued directly to the respective share class. The principal class-specific fees and expenses are further described below:
Distribution services — The fund has plans of distribution for all share classes, except Class F-2, R-5E, R-5 and R-6 shares. Under the plans, the board of trustees approves certain categories of expenses that are used to finance activities primarily intended to sell fund shares and service existing accounts. The plans provide for payments, based on an annualized percentage of average daily net assets, ranging from 0.25% to 1.00% as noted in this section. In some cases, the board of trustees has limited the amounts that may be paid to less than the maximum allowed by the plans. All share classes with a plan may use up to 0.25% of average daily net assets to pay service fees, or to compensate AFD for paying service fees, to firms that have entered into agreements with AFD to provide certain shareholder services. The remaining amounts available to be paid under each plan are paid to dealers to compensate them for their sales activities.
For Class A and 529-A shares, distribution-related expenses include the reimbursement of dealer and wholesaler commissions paid by AFD for certain shares sold without a sales charge. These share classes reimburse AFD for amounts billed within the prior 15 months but only to the extent that the overall annual expense limit of 0.25% is not exceeded. As of November 30, 2016, there were no unreimbursed expenses subject to reimbursement for Class A or 529-A shares.
| Share class | | Currently approved limits | | Plan limits |
| Class A | | | 0.25 | % | | | 0.25 | % |
| Class 529-A | | | 0.25 | | | | 0.50 | |
| Classes B and 529-B | | | 1.00 | | | | 1.00 | |
| Classes C, 529-C and R-1 | | | 1.00 | | | | 1.00 | |
| Class R-2 | | | 0.75 | | | | 1.00 | |
| Class R-2E | | | 0.60 | | | | 0.85 | |
| Classes 529-E and R-3 | | | 0.50 | | | | 0.75 | |
| Classes F-1, 529-F-1 and R-4 | | | 0.25 | | | | 0.50 | |
Transfer agent services — The fund has a shareholder services agreement with AFS under which the fund compensates AFS for providing transfer agent services to each of the fund’s share classes. These services include recordkeeping, shareholder communications and transaction processing. In addition, the fund reimburses AFS for amounts paid to third parties for performing transfer agent services on behalf of fund shareholders.
Administrative services — The fund has an administrative services agreement with CRMC under which the fund compensates CRMC for providing administrative services to Class A, C, F, 529 and R shares. These services include, but are not limited to, coordinating, monitoring, assisting and overseeing third parties that provide services to fund shareholders. Under the agreement, Class A shares pay an annual fee of 0.01% and Class C, F, 529 and R shares pay an annual fee of 0.05% of their respective average daily net assets.
529 plan services — Each 529 share class is subject to service fees to compensate the Virginia College Savings Plan (“Virginia529”) for its oversight and administration of the 529 college savings plan. From December 1, 2015 to June 30, 2016, the quarterly fee was based on a series of decreasing annual rates beginning with 0.10% on the first $30 billion of the net assets invested in Class 529 shares of the American Funds and decreasing to 0.05% on such assets in excess of $70 billion. Effective July 1, 2016, the quarterly fee was amended to annual rates of 0.10% on the first $20 billion of the net assets invested in the Class 529 shares of the American Funds, 0.05% on such assets between $20 billion and $100 billion, and 0.03% on such assets over $100 billion. The fee for any given calendar quarter is accrued and calculated on the basis of the average net assets of Class 529 shares of the American Funds for the last month of the prior calendar quarter. The fee is included in other expenses in the fund’s statement of operations. Virginia529 is not considered a related party to the fund.
For the year ended November 30, 2016, class-specific expenses under the agreements were as follows (dollars in thousands):
| Share class | | Distribution
services | | | Transfer agent
services | | | Administrative
services | | | 529 plan
services | |
| Class A | | | $22,329 | | | | $15,198 | | | | $ 986 | | | | Not applicable | |
| Class B | | | 115 | | | | 21 | | | | Not applicable | | | | Not applicable | |
| Class C | | | 4,863 | | | | 747 | | | | 244 | | | | Not applicable | |
| Class F-1 | | | 844 | | | | 467 | | | | 169 | | | | Not applicable | |
| Class F-2 | | | Not applicable | | | | 809 | | | | 353 | | | | Not applicable | |
| Class 529-A | | | 834 | | | | 537 | | | | 206 | | | | $332 | |
| Class 529-B | | | 17 | | | | 3 | | | | 1 | | | | 1 | |
| Class 529-C | | | 1,117 | | | | 156 | | | | 56 | | | | 91 | |
| Class 529-E | | | 104 | | | | 15 | | | | 11 | | | | 17 | |
| Class 529-F-1 | | | — | | | | 42 | | | | 16 | | | | 26 | |
| Class R-1 | | | 496 | | | | 55 | | | | 25 | | | | Not applicable | |
| Class R-2 | | | 1,232 | | | | 630 | | | | 83 | | | | Not applicable | |
| Class R-2E | | | 7 | | | | 2 | | | | 1 | | | | Not applicable | |
| Class R-3 | | | 1,488 | | | | 489 | | | | 149 | | | | Not applicable | |
| Class R-4 | | | 916 | | | | 383 | | | | 183 | | | | Not applicable | |
| Class R-5E | | | Not applicable | | | | — | * | | | — | * | | | Not applicable | |
| Class R-5 | | | Not applicable | | | | 68 | | | | 65 | | | | Not applicable | |
| Class R-6 | | | Not applicable | | | | 11 | | | | 860 | | | | Not applicable | |
| Total class-specific expenses | | | $34,362 | | | | $19,633 | | | | $3,408 | | | | $467 | |
| * | Amount less than one thousand. |
Trustees’ deferred compensation — Trustees who are unaffiliated with CRMC may elect to defer the cash payment of part or all of their compensation. These deferred amounts, which remain as liabilities of the fund, are treated as if invested in shares of the fund or other American Funds. These amounts represent general, unsecured liabilities of the fund and vary according to the total returns of the selected funds. Trustees’ compensation of $475,000 in the fund’s statement of operations reflects $426,000 in current fees (either paid in cash or deferred) and a net increase of $49,000 in the value of the deferred amounts.
Affiliated officers and trustees — Officers and certain trustees of the fund are or may be considered to be affiliated with CRMC, AFD and AFS. No affiliated officers or trustees received any compensation directly from the fund.
Security transactions with related funds — The fund may purchase from, or sell securities to, other CRMC-managed funds (or funds managed by certain affiliates of CRMC) under procedures adopted by the fund’s board of trustees. The funds involved in such transactions are considered related by virtue of having a common investment adviser (or affiliated investment advisers), common trustees and/or common officers. When such transactions occur, each transaction is executed at the current market price of the security and no brokerage commissions or fees are paid in accordance with Rule 17a-7 of the 1940 Act.
8. Capital share transactions
Capital share transactions in the fund were as follows (dollars and shares in thousands):
| | | Sales1 | | | Reinvestments of
dividends and distributions | | | Repurchases1 | | | Net (decrease)
increase | |
| Share class | | Amount | | | Shares | | | Amount | | | Shares | | | Amount | | | Shares | | | Amount | | | Shares | |
| | | | | | | | | | | | | | | | | | | | | | | | | |
| Year ended November 30, 2016 | | | | | | | | | | | | | | | | | | | | | | | | | |
| | | | | | | | | | | | | | | | | | | | | | | | | | | | | | | | | |
| Class A | | $ | 783,808 | | | | 22,406 | | | $ | 594,256 | | | | 16,530 | | | $ | (1,705,522 | ) | | | (48,300 | ) | | $ | (327,458 | ) | | | (9,364 | ) |
| Class B | | | 375 | | | | 12 | | | | 1,121 | | | | 33 | | | | (15,620 | ) | | | (479 | ) | | | (14,124 | ) | | | (434 | ) |
| Class C | | | 72,193 | | | | 2,244 | | | | 30,853 | | | | 932 | | | | (147,202 | ) | | | (4,567 | ) | | | (44,156 | ) | | | (1,391 | ) |
| Class F-1 | | | 86,017 | | | | 2,451 | | | | 21,873 | | | | 607 | | | | (180,787 | ) | | | (5,130 | ) | | | (72,897 | ) | | | (2,072 | ) |
| Class F-2 | | | 353,920 | | | | 9,935 | | | | 43,221 | | | | 1,204 | | | | (371,391 | ) | | | (10,585 | ) | | | 25,750 | | | | 554 | |
| Class 529-A | | | 52,172 | | | | 1,496 | | | | 24,543 | | | | 689 | | | | (66,318 | ) | | | (1,888 | ) | | | 10,397 | | | | 297 | |
| Class 529-B | | | 86 | | | | 3 | | | | 169 | | | | 5 | | | | (2,429 | ) | | | (74 | ) | | | (2,174 | ) | | | (66 | ) |
| Class 529-C | | | 15,362 | | | | 470 | | | | 6,785 | | | | 202 | | | | (19,900 | ) | | | (607 | ) | | | 2,247 | | | | 65 | |
| Class 529-E | | | 2,512 | | | | 74 | | | | 1,214 | | | | 34 | | | | (3,381 | ) | | | (98 | ) | | | 345 | | | | 10 | |
| Class 529-F-1 | | | 8,228 | | | | 232 | | | | 1,963 | | | | 55 | | | | (8,494 | ) | | | (238 | ) | | | 1,697 | | | | 49 | |
| Class R-1 | | | 7,359 | | | | 224 | | | | 3,158 | | | | 93 | | | | (17,462 | ) | | | (526 | ) | | | (6,945 | ) | | | (209 | ) |
| Class R-2 | | | 43,565 | | | | 1,309 | | | | 10,323 | | | | 302 | | | | (63,259 | ) | | | (1,909 | ) | | | (9,371 | ) | | | (298 | ) |
| Class R-2E | | | 2,200 | | | | 62 | | | | 19 | | | | 1 | | | | (179 | ) | | | (5 | ) | | | 2,040 | | | | 58 | |
| Class R-3 | | | 66,273 | | | | 1,929 | | | | 17,854 | | | | 506 | | | | (105,025 | ) | | | (3,044 | ) | | | (20,898 | ) | | | (609 | ) |
| Class R-4 | | | 71,025 | | | | 2,047 | | | | 22,777 | | | | 639 | | | | (118,143 | ) | | | (3,385 | ) | | | (24,341 | ) | | | (699 | ) |
| Class R-5E | | | — | | | | — | | | | — | | | | — | | | | — | | | | — | | | | — | | | | — | |
| Class R-5 | | | 31,535 | | | | 900 | | | | 9,470 | | | | 262 | | | | (80,457 | ) | | | (2,348 | ) | | | (39,452 | ) | | | (1,186 | ) |
| Class R-6 | | | 482,376 | | | | 13,908 | | | | 96,133 | | | | 2,672 | | | | (182,544 | ) | | | (5,127 | ) | | | 395,965 | | | | 11,453 | |
| Total net increase (decrease) | | $ | 2,079,006 | | | | 59,702 | | | $ | 885,732 | | | | 24,766 | | | $ | (3,088,113 | ) | | | (88,310 | ) | | $ | (123,375 | ) | | | (3,842 | ) |
| | | | | | | | | | | | | | | | | | | | | | | | | | | | | | | | | |
| Year ended November 30, 2015 | | | | | | | | | | | | | | | | | | | | | | |
| | | | | | | | | | | | | | | | | | | | | | | | | | | | | | | | | |
| Class A | | $ | 1,471,698 | | | | 38,085 | | | $ | 776,272 | | | | 20,913 | | | $ | (1,193,452 | ) | | | (31,054 | ) | | $ | 1,054,518 | | | | 27,944 | |
| Class B | | | 2,016 | | | | 55 | | | | 2,925 | | | | 84 | | | | (20,313 | ) | | | (561 | ) | | | (15,372 | ) | | | (422 | ) |
| Class C | | | 150,578 | | | | 4,215 | | | | 37,629 | | | | 1,092 | | | | (99,109 | ) | | | (2,783 | ) | | | 89,098 | | | | 2,524 | |
| Class F-1 | | | 157,237 | | | | 4,041 | | | | 31,758 | | | | 854 | | | | (179,846 | ) | | | (4,675 | ) | | | 9,149 | | | | 220 | |
| Class F-2 | | | 311,479 | | | | 8,037 | | | | 51,302 | | | | 1,384 | | | | (222,455 | ) | | | (5,817 | ) | | | 140,326 | | | | 3,604 | |
| Class 529-A | | | 71,494 | | | | 1,870 | | | | 30,935 | | | | 840 | | | | (45,832 | ) | | | (1,197 | ) | | | 56,597 | | | | 1,513 | |
| Class 529-B | | | 258 | | | | 7 | | | | 461 | | | | 13 | | | | (3,376 | ) | | | (93 | ) | | | (2,657 | ) | | | (73 | ) |
| Class 529-C | | | 21,604 | | | | 598 | | | | 8,638 | | | | 247 | | | | (15,405 | ) | | | (424 | ) | | | 14,837 | | | | 421 | |
| Class 529-E | | | 3,277 | | | | 87 | | | | 1,613 | | | | 44 | | | | (2,970 | ) | | | (79 | ) | | | 1,920 | | | | 52 | |
| Class 529-F-1 | | | 8,688 | | | | 227 | | | | 2,334 | | | | 63 | | | | (4,919 | ) | | | (129 | ) | | | 6,103 | | | | 161 | |
| Class R-1 | | | 16,616 | | | | 454 | | | | 4,059 | | | | 115 | | | | (12,364 | ) | | | (340 | ) | | | 8,311 | | | | 229 | |
| Class R-2 | | | 54,497 | | | | 1,481 | | | | 14,428 | | | | 406 | | | | (59,941 | ) | | | (1,634 | ) | | | 8,984 | | | | 253 | |
| Class R-2E | | | 71 | | | | 2 | | | | — | | | | — | | | | — | | | | — | | | | 71 | | | | 2 | |
| Class R-3 | | | 101,953 | | | | 2,674 | | | | 26,496 | | | | 726 | | | | (114,947 | ) | | | (3,049 | ) | | | 13,502 | | | | 351 | |
| Class R-4 | | | 113,266 | | | | 2,977 | | | | 29,643 | | | | 805 | | | | (99,890 | ) | | | (2,626 | ) | | | 43,019 | | | | 1,156 | |
| Class R-5E2 | | | 10 | | | | — | 3 | | | — | | | | — | | | | — | | | | — | | | | 10 | | | | — | 3 |
| Class R-5 | | | 50,299 | | | | 1,307 | | | | 12,146 | | | | 326 | | | | (49,485 | ) | | | (1,282 | ) | | | 12,960 | | | | 351 | |
| Class R-6 | | | 390,912 | | | | 10,170 | | | | 117,923 | | | | 3,174 | | | | (278,104 | ) | | | (7,530 | ) | | | 230,731 | | | | 5,814 | |
| Total net increase (decrease) | | $ | 2,925,953 | | | | 76,287 | | | $ | 1,148,562 | | | | 31,086 | | | $ | (2,402,408 | ) | | | (63,273 | ) | | $ | 1,672,107 | | | | 44,100 | |
| 1 | Includes exchanges between share classes of the fund. |
| 2 | Class R-5E shares were offered beginning November 20, 2015. |
| 3 | Amount less than one thousand. |
9. Investment transactions
The fund made purchases and sales of investment securities, excluding short-term securities and U.S. government obligations, if any, of $3,253,960,000 and $3,807,245,000, respectively, during the year ended November 30, 2016.
Financial highlights
| | | | | | (Loss) income from
investment operations1 | | | Dividends and distributions | | | | | | | | | | | | | | | | |
| | | Net asset
value,
beginning
of period | | | Net
investment
income
(loss)2 | | | Net (losses)
gains on
securities (both
realized and
unrealized) | | | Total from
investment
operations | | | Dividends
(from net
investment
income) | | | Distributions
(from capital
gains) | | | Total
dividends
and
distributions | | | Net asset
value,
end
of period | | | Total
return3 | | | Net assets,
end of period
(in millions) | | | Ratio of
expenses to
average
net assets | | | Ratio of
net income
(loss) to
average
net assets2 | |
| Class A: | | | | | | | | | | | | | | | | | | | | | | | | | | | | | | | | | | | | | | | | | | | | | | | | |
| Year ended 11/30/2016 | | $ | 38.93 | | | $ | .11 | | | $ | (.15 | ) | | $ | (.04 | ) | | $ | (.16 | ) | | $ | (2.06 | ) | | $ | (2.22 | ) | | $ | 36.67 | | | | .00 | % | | $ | 9,702 | | | | .81 | % | | | .30 | % |
| Year ended 11/30/2015 | | | 40.58 | | | | .11 | | | | 1.47 | | | | 1.58 | | | | (.20 | ) | | | (3.03 | ) | | | (3.23 | ) | | | 38.93 | | | | 4.27 | | | | 10,666 | | | | .78 | | | | .29 | |
| Year ended 11/30/2014 | | | 39.61 | | | | .22 | | | | 3.28 | | | | 3.50 | | | | (.14 | ) | | | (2.39 | ) | | | (2.53 | ) | | | 40.58 | | | | 9.25 | | | | 9,984 | | | | .79 | | | | .56 | |
| Year ended 11/30/2013 | | | 28.83 | | | | .17 | | | | 11.67 | | | | 11.84 | | | | (.18 | ) | | | (.88 | ) | | | (1.06 | ) | | | 39.61 | | | | 42.52 | | | | 8,920 | | | | .83 | | | | .50 | |
| Year ended 11/30/2012 | | | 24.14 | | | | .16 | | | | 4.65 | | | | 4.81 | | | | (.12 | ) | | | — | | | | (.12 | ) | | | 28.83 | | | | 20.02 | | | | 5,919 | | | | .87 | | | | .59 | |
| Class B: | | | | | | | | | | | | | | | | | | | | | | | | | | | | | | | | | | | | | | | | | | | | | | | | |
| Year ended 11/30/2016 | | | 36.41 | | | | (.15 | ) | | | (.17 | ) | | | (.32 | ) | | | — | | | | (2.06 | ) | | | (2.06 | ) | | | 34.03 | | | | (.81 | ) | | | 5 | | | | 1.58 | | | | (.45 | ) |
| Year ended 11/30/2015 | | | 38.23 | | | | (.17 | ) | | | 1.38 | | | | 1.21 | | | | — | | | | (3.03 | ) | | | (3.03 | ) | | | 36.41 | | | | 3.48 | | | | 21 | | | | 1.54 | | | | (.46 | ) |
| Year ended 11/30/2014 | | | 37.59 | | | | (.07 | ) | | | 3.10 | | | | 3.03 | | | | — | | | | (2.39 | ) | | | (2.39 | ) | | | 38.23 | | | | 8.43 | | | | 39 | | | | 1.55 | | | | (.18 | ) |
| Year ended 11/30/2013 | | | 27.45 | | | | (.08 | ) | | | 11.10 | | | | 11.02 | | | | — | | | | (.88 | ) | | | (.88 | ) | | | 37.59 | | | | 41.39 | | | | 55 | | | | 1.60 | | | | (.24 | ) |
| Year ended 11/30/2012 | | | 23.04 | | | | (.05 | ) | | | 4.46 | | | | 4.41 | | | | — | | | | — | | | | — | | | | 27.45 | | | | 19.09 | | | | 50 | | | | 1.63 | | | | (.19 | ) |
| Class C: | | | | | | | | | | | | | | | | | | | | | | | | | | | | | | | | | | | | | | | | | | | | | | | | |
| Year ended 11/30/2016 | | | 35.89 | | | | (.16 | ) | | | (.16 | ) | | | (.32 | ) | | | — | | | | (2.06 | ) | | | (2.06 | ) | | | 33.51 | | | | (.82 | ) | | | 460 | | | | 1.62 | | | | (.51 | ) |
| Year ended 11/30/2015 | | | 37.74 | | | | (.18 | ) | | | 1.36 | | | | 1.18 | | | | — | | | | (3.03 | ) | | | (3.03 | ) | | | 35.89 | | | | 3.44 | | | | 542 | | | | 1.59 | | | | (.51 | ) |
| Year ended 11/30/2014 | | | 37.16 | | | | (.10 | ) | | | 3.07 | | | | 2.97 | | | | — | | | | (2.39 | ) | | | (2.39 | ) | | | 37.74 | | | | 8.37 | | | | 475 | | | | 1.60 | | | | (.26 | ) |
| Year ended 11/30/2013 | | | 27.15 | | | | (.10 | ) | | | 10.99 | | | | 10.89 | | | | — | | | | (.88 | ) | | | (.88 | ) | | | 37.16 | | | | 41.37 | | | | 350 | | | | 1.63 | | | | (.32 | ) |
| Year ended 11/30/2012 | | | 22.80 | | | | (.05 | ) | | | 4.40 | | | | 4.35 | | | | — | | | | — | | | | — | | | | 27.15 | | | | 19.08 | | | | 186 | | | | 1.67 | | | | (.22 | ) |
| Class F-1: | | | | | | | | | | | | | | | | | | | | | | | | | | | | | | | | | | | | | | | | | | | | | | | | |
| Year ended 11/30/2016 | | | 38.99 | | | | .09 | | | | (.17 | ) | | | (.08 | ) | | | (.12 | ) | | | (2.06 | ) | | | (2.18 | ) | | | 36.73 | | | | (.08 | ) | | | 305 | | | | .85 | | | | .26 | |
| Year ended 11/30/2015 | | | 40.60 | | | | .10 | | | | 1.47 | | | | 1.57 | | | | (.15 | ) | | | (3.03 | ) | | | (3.18 | ) | | | 38.99 | | | | 4.23 | | | | 404 | | | | .83 | | | | .25 | |
| Year ended 11/30/2014 | | | 39.67 | | | | .21 | | | | 3.27 | | | | 3.48 | | | | (.16 | ) | | | (2.39 | ) | | | (2.55 | ) | | | 40.60 | | | | 9.20 | | | | 412 | | | | .84 | | | | .54 | |
| Year ended 11/30/2013 | | | 28.87 | | | | .14 | | | | 11.70 | | | | 11.84 | | | | (.16 | ) | | | (.88 | ) | | | (1.04 | ) | | | 39.67 | | | | 42.46 | | | | 418 | | | | .86 | | | | .43 | |
| Year ended 11/30/2012 | | | 24.16 | | | | .16 | | | | 4.66 | | | | 4.82 | | | | (.11 | ) | | | — | | | | (.11 | ) | | | 28.87 | | | | 20.03 | | | | 143 | | | | .86 | | | | .61 | |
| Class F-2: | | | | | | | | | | | | | | | | | | | | | | | | | | | | | | | | | | | | | | | | | | | | | | | | |
| Year ended 11/30/2016 | | | 38.96 | | | | .19 | | | | (.16 | ) | | | .03 | | | | (.24 | ) | | | (2.06 | ) | | | (2.30 | ) | | | 36.69 | | | | .22 | | | | 751 | | | | .58 | | | | .53 | |
| Year ended 11/30/2015 | | | 40.63 | | | | .19 | | | | 1.47 | | | | 1.66 | | | | (.30 | ) | | | (3.03 | ) | | | (3.33 | ) | | | 38.96 | | | | 4.49 | | | | 776 | | | | .57 | | | | .50 | |
| Year ended 11/30/2014 | | | 39.65 | | | | .29 | | | | 3.31 | | | | 3.60 | | | | (.23 | ) | | | (2.39 | ) | | | (2.62 | ) | | | 40.63 | | | | 9.52 | | | | 662 | | | | .57 | | | | .73 | |
| Year ended 11/30/2013 | | | 28.88 | | | | .24 | | | | 11.68 | | | | 11.92 | | | | (.27 | ) | | | (.88 | ) | | | (1.15 | ) | | | 39.65 | | | | 42.88 | | | | 330 | | | | .57 | | | | .70 | |
| Year ended 11/30/2012 | | | 24.19 | | | | .23 | | | | 4.65 | | | | 4.88 | | | | (.19 | ) | | | — | | | | (.19 | ) | | | 28.88 | | | | 20.35 | | | | 106 | | | | .59 | | | | .87 | |
| Class 529-A: | | | | | | | | | | | | | | | | | | | | | | | | | | | | | | | | | | | | | | | | | | | | | | | | |
| Year ended 11/30/2016 | | | 38.60 | | | | .08 | | | | (.16 | ) | | | (.08 | ) | | | (.13 | ) | | | (2.06 | ) | | | (2.19 | ) | | | 36.33 | | | | (.10 | ) | | | 416 | | | | .88 | | | | .23 | |
| Year ended 11/30/2015 | | | 40.27 | | | | .08 | | | | 1.46 | | | | 1.54 | | | | (.18 | ) | | | (3.03 | ) | | | (3.21 | ) | | | 38.60 | | | | 4.19 | | | | 431 | | | | .86 | | | | .21 | |
| Year ended 11/30/2014 | | | 39.33 | | | | .18 | | | | 3.27 | | | | 3.45 | | | | (.12 | ) | | | (2.39 | ) | | | (2.51 | ) | | | 40.27 | | | | 9.19 | | | | 388 | | | | .87 | | | | .47 | |
| Year ended 11/30/2013 | | | 28.65 | | | | .14 | | | | 11.58 | | | | 11.72 | | | | (.16 | ) | | | (.88 | ) | | | (1.04 | ) | | | 39.33 | | | | 42.38 | | | | 325 | | | | .91 | | | | .42 | |
| Year ended 11/30/2012 | | | 24.00 | | | | .14 | | | | 4.63 | | | | 4.77 | | | | (.12 | ) | | | — | | | | (.12 | ) | | | 28.65 | | | | 19.92 | | | | 197 | | | | .93 | | | | .53 | |
| Class 529-B: | | | | | | | | | | | | | | | | | | | | | | | | | | | | | | | | | | | | | | | | | | | | | | | | |
| Year ended 11/30/2016 | | | 36.41 | | | | (.18 | ) | | | (.17 | ) | | | (.35 | ) | | | — | | | | (2.06 | ) | | | (2.06 | ) | | | 34.00 | | | | (.89 | ) | | | 1 | | | | 1.67 | | | | (.54 | ) |
| Year ended 11/30/2015 | | | 38.27 | | | | (.21 | ) | | | 1.38 | | | | 1.17 | | | | — | | | | (3.03 | ) | | | (3.03 | ) | | | 36.41 | | | | 3.36 | | | | 3 | | | | 1.66 | | | | (.57 | ) |
| Year ended 11/30/2014 | | | 37.68 | | | | (.11 | ) | | | 3.09 | | | | 2.98 | | | | — | | | | (2.39 | ) | | | (2.39 | ) | | | 38.27 | | | | 8.27 | | | | 6 | | | | 1.67 | | | | (.30 | ) |
| Year ended 11/30/2013 | | | 27.54 | | | | (.11 | ) | | | 11.13 | | | | 11.02 | | | | — | | | | (.88 | ) | | | (.88 | ) | | | 37.68 | | | | 41.26 | | | | 8 | | | | 1.72 | | | | (.36 | ) |
| Year ended 11/30/2012 | | | 23.15 | | | | (.08 | ) | | | 4.47 | | | | 4.39 | | | | — | | | | — | | | | — | | | | 27.54 | | | | 18.96 | | | | 8 | | | | 1.75 | | | | (.31 | ) |
| | | | | | (Loss) income from
investment operations1 | | | Dividends and distributions | | | | | | | | | | | | | | | | |
| | | Net asset
value,
beginning
of period | | | Net
investment
income
(loss)2 | | | Net (losses)
gains on
securities (both
realized and
unrealized) | | | Total from
investment
operations | | | Dividends
(from net
investment
income) | | | Distributions
(from capital
gains) | | | Total
dividends
and
distributions | | | Net asset
value,
end
of period | | | Total
return3 | | | Net assets,
end of period
(in millions) | | | Ratio of
expenses to
average
net assets | | | Ratio of
net income
(loss) to
average
net assets2 | |
| Class 529-C: | | | | | | | | | | | | | | | | | | | | | | | | | | | | | | | | | | | | | | | | | | | | | | | | |
| Year ended 11/30/2016 | | $ | 36.35 | | | $ | (.19 | ) | | $ | (.16 | ) | | $ | (.35 | ) | | $ | — | | | $ | (2.06 | ) | | $ | (2.06 | ) | | $ | 33.94 | | | | (.90 | )% | | $ | 114 | | | | 1.67 | % | | | (.57 | )% |
| Year ended 11/30/2015 | | | 38.21 | | | | (.21 | ) | | | 1.38 | | | | 1.17 | | | | — | | | | (3.03 | ) | | | (3.03 | ) | | | 36.35 | | | | 3.37 | | | | 120 | | | | 1.66 | | | | (.59 | ) |
| Year ended 11/30/2014 | | | 37.62 | | | | (.12 | ) | | | 3.10 | | | | 2.98 | | | | — | | | | (2.39 | ) | | | (2.39 | ) | | | 38.21 | | | | 8.29 | | | | 109 | | | | 1.67 | | | | (.33 | ) |
| Year ended 11/30/2013 | | | 27.49 | | | | (.12 | ) | | | 11.13 | | | | 11.01 | | | | — | | | | (.88 | ) | | | (.88 | ) | | | 37.62 | | | | 41.30 | | | | 94 | | | | 1.71 | | | | (.38 | ) |
| Year ended 11/30/2012 | | | 23.11 | | | | (.07 | ) | | | 4.45 | | | | 4.38 | | | | — | | | | — | | | | — | | | | 27.49 | | | | 18.95 | | | | 60 | | | | 1.74 | | | | (.28 | ) |
| Class 529-E: | | | | | | | | | | | | | | | | | | | | | | | | | | | | | | | | | | | | | | | | | | | | | | | | |
| Year ended 11/30/2016 | | | 38.09 | | | | — | 4 | | | (.16 | ) | | | (.16 | ) | | | (.04 | ) | | | (2.06 | ) | | | (2.10 | ) | | | 35.83 | | | | (.33 | ) | | | 21 | | | | 1.12 | | | | (.01 | ) |
| Year ended 11/30/2015 | | | 39.78 | | | | (.01 | ) | | | 1.43 | | | | 1.42 | | | | (.08 | ) | | | (3.03 | ) | | | (3.11 | ) | | | 38.09 | | | | 3.92 | | | | 22 | | | | 1.11 | | | | (.04 | ) |
| Year ended 11/30/2014 | | | 38.91 | | | | .08 | | | | 3.23 | | | | 3.31 | | | | (.05 | ) | | | (2.39 | ) | | | (2.44 | ) | | | 39.78 | | | | 8.89 | | | | 21 | | | | 1.12 | | | | .21 | |
| Year ended 11/30/2013 | | | 28.35 | | | | .05 | | | | 11.48 | | | | 11.53 | | | | (.09 | ) | | | (.88 | ) | | | (.97 | ) | | | 38.91 | | | | 42.04 | | | | 17 | | | | 1.16 | | | | .16 | |
| Year ended 11/30/2012 | | | 23.75 | | | | .07 | | | | 4.57 | | | | 4.64 | | | | (.04 | ) | | | — | | | | (.04 | ) | | | 28.35 | | | | 19.59 | | | | 10 | | | | 1.20 | | | | .26 | |
| Class 529-F-1: | | | | | | | | | | | | | | | | | | | | | | | | | | | | | | | | | | | | | | | | | | | | | | | | |
| Year ended 11/30/2016 | | | 38.61 | | | | .15 | | | | (.16 | ) | | | (.01 | ) | | | (.20 | ) | | | (2.06 | ) | | | (2.26 | ) | | | 36.34 | | | | .14 | | | | 33 | | | | .68 | | | | .43 | |
| Year ended 11/30/2015 | | | 40.28 | | | | .16 | | | | 1.45 | | | | 1.61 | | | | (.25 | ) | | | (3.03 | ) | | | (3.28 | ) | | | 38.61 | | | | 4.37 | | | | 33 | | | | .66 | | | | .41 | |
| Year ended 11/30/2014 | | | 39.33 | | | | .26 | | | | 3.26 | | | | 3.52 | | | | (.18 | ) | | | (2.39 | ) | | | (2.57 | ) | | | 40.28 | | | | 9.39 | | | | 28 | | | | .67 | | | | .68 | |
| Year ended 11/30/2013 | | | 28.65 | | | | .21 | | | | 11.58 | | | | 11.79 | | | | (.23 | ) | | | (.88 | ) | | | (1.11 | ) | | | 39.33 | | | | 42.69 | | | | 22 | | | | .71 | | | | .62 | |
| Year ended 11/30/2012 | | | 24.01 | | | | .19 | | | | 4.62 | | | | 4.81 | | | | (.17 | ) | | | — | | | | (.17 | ) | | | 28.65 | | | | 20.17 | | | | 13 | | | | .74 | | | | .73 | |
| Class R-1: | | | | | | | | | | | | | | | | | | | | | | | | | | | | | | | | | | | | | | | | | | | | | | | | |
| Year ended 11/30/2016 | | | 36.84 | | | | (.15 | ) | | | (.16 | ) | | | (.31 | ) | | | — | | | | (2.06 | ) | | | (2.06 | ) | | | 34.47 | | | | (.77 | ) | | | 47 | | | | 1.57 | | | | (.46 | ) |
| Year ended 11/30/2015 | | | 38.66 | | | | (.18 | ) | | | 1.39 | | | | 1.21 | | | | — | | | | (3.03 | ) | | | (3.03 | ) | | | 36.84 | | | | 3.44 | | | | 58 | | | | 1.56 | | | | (.49 | ) |
| Year ended 11/30/2014 | | | 37.99 | | | | (.09 | ) | | | 3.15 | | | | 3.06 | | | | — | | | | (2.39 | ) | | | (2.39 | ) | | | 38.66 | | | | 8.43 | | | | 52 | | | | 1.56 | | | | (.25 | ) |
| Year ended 11/30/2013 | | | 27.72 | | | | (.08 | ) | | | 11.23 | | | | 11.15 | | | | — | | | | (.88 | ) | | | (.88 | ) | | | 37.99 | | | | 41.46 | | | | 33 | | | | 1.59 | | | | (.25 | ) |
| Year ended 11/30/2012 | | | 23.27 | | | | (.04 | ) | | | 4.49 | | | | 4.45 | | | | — | | | | — | | | | — | | | | 27.72 | | | | 19.12 | | | | 23 | | | | 1.61 | | | | (.15 | ) |
| Class R-2: | | | | | | | | | | | | | | | | | | | | | | | | | | | | | | | | | | | | | | | | | | | | | | | | |
| Year ended 11/30/2016 | | | 37.03 | | | | (.16 | ) | | | (.16 | ) | | | (.32 | ) | | | — | | | | (2.06 | ) | | | (2.06 | ) | | | 34.65 | | | | (.79 | ) | | | 164 | | | | 1.59 | | | | (.48 | ) |
| Year ended 11/30/2015 | | | 38.84 | | | | (.17 | ) | | | 1.39 | | | | 1.22 | | | | — | | | | (3.03 | ) | | | (3.03 | ) | | | 37.03 | | | | 3.45 | | | | 186 | | | | 1.55 | | | | (.47 | ) |
| Year ended 11/30/2014 | | | 38.16 | | | | (.08 | ) | | | 3.15 | | | | 3.07 | | | | — | | | | (2.39 | ) | | | (2.39 | ) | | | 38.84 | | | | 8.41 | | | | 185 | | | �� | 1.57 | | | | (.22 | ) |
| Year ended 11/30/2013 | | | 27.84 | | | | (.07 | ) | | | 11.27 | | | | 11.20 | | | | — | | | | (.88 | ) | | | (.88 | ) | | | 38.16 | | | | 41.47 | | | | 173 | | | | 1.57 | | | | (.23 | ) |
| Year ended 11/30/2012 | | | 23.37 | | | | (.05 | ) | | | 4.52 | | | | 4.47 | | | | — | | | | — | | | | — | | | | 27.84 | | | | 19.13 | | | | 124 | | | | 1.63 | | | | (.17 | ) |
| Class R-2E: | | | | | | | | | | | | | | | | | | | | | | | | | | | | | | | | | | | | | | | | | | | | | | | | |
| Year ended 11/30/2016 | | | 38.85 | | | | (.07 | ) | | | (.14 | ) | | | (.21 | ) | | | (.29 | ) | | | (2.06 | ) | | | (2.35 | ) | | | 36.29 | | | | (.44 | ) | | | 2 | | | | 1.26 | | | | (.19 | ) |
| Year ended 11/30/2015 | | | 40.60 | | | | .06 | | | | 1.54 | | | | 1.60 | | | | (.32 | ) | | | (3.03 | ) | | | (3.35 | ) | | | 38.85 | | | | 4.33 | 5 | | | — | 6 | | | .84 | 5 | | | .16 | 5 |
| Period from 8/29/2014 to 11/30/20147,8 | | | 40.22 | | | | .01 | | | | .37 | | | | .38 | | | | — | | | | — | | | | — | | | | 40.60 | | | | .94 | 5,9 | | | — | 6 | | | .17 | 5,9 | | | .03 | 5,9 |
| Class R-3: | | | | | | | | | | | | | | | | | | | | | | | | | | | | | | | | | | | | | | | | | | | | | | | | |
| Year ended 11/30/2016 | | | 38.14 | | | | (.01 | ) | | | (.15 | ) | | | (.16 | ) | | | (.02 | ) | | | (2.06 | ) | | | (2.08 | ) | | | 35.90 | | | | (.33 | ) | | | 286 | | | | 1.13 | | | | (.02 | ) |
| Year ended 11/30/2015 | | | 39.84 | | | | (.01 | ) | | | 1.43 | | | | 1.42 | | | | (.09 | ) | | | (3.03 | ) | | | (3.12 | ) | | | 38.14 | | | | 3.91 | | | | 327 | | | | 1.11 | | | | (.04 | ) |
| Year ended 11/30/2014 | | | 38.98 | | | | .08 | | | | 3.23 | | | | 3.31 | | | | (.06 | ) | | | (2.39 | ) | | | (2.45 | ) | | | 39.84 | | | | 8.88 | | | | 328 | | | | 1.13 | | | | .21 | |
| Year ended 11/30/2013 | | | 28.38 | | | | .06 | | | | 11.50 | | | | 11.56 | | | | (.08 | ) | | | (.88 | ) | | | (.96 | ) | | | 38.98 | | | | 42.09 | | | | 262 | | | | 1.15 | | | | .19 | |
| Year ended 11/30/2012 | | | 23.77 | | | | .07 | | | | 4.58 | | | | 4.65 | | | | (.04 | ) | | | — | | | | (.04 | ) | | | 28.38 | | | | 19.62 | | | | 168 | | | | 1.18 | | | | .28 | |
See page 28 for footnotes.
Financial highlights (continued)
| | | | | | (Loss) income from
investment operations1 | | | Dividends and distributions | | | | | | | | | | | | | | | | |
| | | Net asset
value,
beginning
of period | | | Net
investment
income
(loss)2 | | | Net (losses)
gains on
securities (both
realized and
unrealized) | | | Total from
investment
operations | | | Dividends
(from net
investment
income) | | | Distributions
(from capital
gains) | | | Total
dividends
and
distributions | | | Net asset
value,
end
of period | | | Total
return3 | | | Net assets,
end of period
(in millions) | | | Ratio of
expenses to
average
net assets | | | Ratio of
net income
(loss) to
average
net assets2 | |
| Class R-4: | | | | | | | | | | | | | | | | | | | | | | | | | | | | | | | | | | | | | | | | | | | | | | | | |
| Year ended 11/30/2016 | | $ | 38.61 | | | $ | .10 | | | $ | (.16 | ) | | $ | (.06 | ) | | $ | (.15 | ) | | $ | (2.06 | ) | | $ | (2.21 | ) | | $ | 36.34 | | | | (.04 | )% | | $ | 348 | | | | .82 | % | | | .29 | % |
| Year ended 11/30/2015 | | | 40.29 | | | | .10 | | | | 1.46 | | | | 1.56 | | | | (.21 | ) | | | (3.03 | ) | | | (3.24 | ) | | | 38.61 | | | | 4.25 | | | | 397 | | | | .81 | | | | .27 | |
| Year ended 11/30/2014 | | | 39.36 | | | | .20 | | | | 3.26 | | | | 3.46 | | | | (.14 | ) | | | (2.39 | ) | | | (2.53 | ) | | | 40.29 | | | | 9.22 | | | | 368 | | | | .81 | | | | .52 | |
| Year ended 11/30/2013 | | | 28.67 | | | | .16 | | | | 11.60 | | | | 11.76 | | | | (.19 | ) | | | (.88 | ) | | | (1.07 | ) | | | 39.36 | | | | 42.52 | | | | 252 | | | | .83 | | | | .49 | |
| Year ended 11/30/2012 | | | 24.01 | | | | .16 | | | | 4.63 | | | | 4.79 | | | | (.13 | ) | | | — | | | | (.13 | ) | | | 28.67 | | | | 20.06 | | | | 150 | | | | .85 | | | | .61 | |
| Class R-5E: | | | | | | | | | | | | | | | | | | | | | | | | | | | | | | | | | | | | | | | | | | | | | | | | |
| Year ended 11/30/2016 | | | 38.93 | | | | .14 | | | | (.15 | ) | | | (.01 | ) | | | (.29 | ) | | | (2.06 | ) | | | (2.35 | ) | | | 36.57 | | | | .11 | | | | — | 6 | | | .69 | | | | .41 | |
| Period from 11/20/2015 to 11/30/20157,10 | | | 38.84 | | | | — | 4 | | | .09 | | | | .09 | | | | — | | | | — | | | | — | | | | 38.93 | | | | .23 | 9 | | | — | 6 | | | .02 | 9 | | | — | 9,11 |
| Class R-5: | | | | | | | | | | | | | | | | | | | | | | | | | | | | | | | | | | | | | | | �� | | | | | | | | | |
| Year ended 11/30/2016 | | | 39.17 | | | | .22 | | | | (.16 | ) | | | .06 | | | | (.26 | ) | | | (2.06 | ) | | | (2.32 | ) | | | 36.91 | | | | .30 | | | | 106 | | | | .52 | | | | .61 | |
| Year ended 11/30/2015 | | | 40.80 | | | | .22 | | | | 1.47 | | | | 1.69 | | | | (.29 | ) | | | (3.03 | ) | | | (3.32 | ) | | | 39.17 | | | | 4.55 | | | | 160 | | | | .50 | | | | .57 | |
| Year ended 11/30/2014 | | | 39.80 | | | | .35 | | | | 3.27 | | | | 3.62 | | | | (.23 | ) | | | (2.39 | ) | | | (2.62 | ) | | | 40.80 | | | | 9.54 | | | | 152 | | | | .52 | | | | .88 | |
| Year ended 11/30/2013 | | | 28.98 | | | | .26 | | | | 11.71 | | | | 11.97 | | | | (.27 | ) | | | (.88 | ) | | | (1.15 | ) | | | 39.80 | | | | 42.93 | | | | 233 | | | | .53 | | | | .79 | |
| Year ended 11/30/2012 | | | 24.26 | | | | .25 | | | | 4.67 | | | | 4.92 | | | | (.20 | ) | | | — | | | | (.20 | ) | | | 28.98 | | | | 20.45 | | | | 131 | | | | .54 | | | | .92 | |
| Class R-6: | | | | | | | | | | | | | | | | | | | | | | | | | | | | | | | | | | | | | | | | | | | | | | | | |
| Year ended 11/30/2016 | | | 39.08 | | | | .22 | | | | (.15 | ) | | | .07 | | | | (.28 | ) | | | (2.06 | ) | | | (2.34 | ) | | | 36.81 | | | | .31 | | | | 1,920 | | | | .47 | | | | .64 | |
| Year ended 11/30/2015 | | | 40.73 | | | | .24 | | | | 1.47 | | | | 1.71 | | | | (.33 | ) | | | (3.03 | ) | | | (3.36 | ) | | | 39.08 | | | | 4.61 | | | | 1,590 | | | | .46 | | | | .62 | |
| Year ended 11/30/2014 | | | 39.73 | | | | .34 | | | | 3.29 | | | | 3.63 | | | | (.24 | ) | | | (2.39 | ) | | | (2.63 | ) | | | 40.73 | | | | 9.60 | | | | 1,421 | | | | .46 | | | | .86 | |
| Year ended 11/30/2013 | | | 28.93 | | | | .28 | | | | 11.69 | | | | 11.97 | | | | (.29 | ) | | | (.88 | ) | | | (1.17 | ) | | | 39.73 | | | | 43.02 | | | | 945 | | | | .48 | | | | .84 | |
| Year ended 11/30/2012 | | | 24.23 | | | | .26 | | | | 4.66 | | | | 4.92 | | | | (.22 | ) | | | — | | | | (.22 | ) | | | 28.93 | | | | 20.48 | | | | 512 | | | | .49 | | | | .97 | |
| | | Year ended November 30 |
| | | | 2016 | | | | 2015 | | | | 2014 | | | | 2013 | | | | 2012 | |
| Portfolio turnover rate for all share classes | | | 25% | | | | 34% | | | | 27% | | | | 29% | | | | 37% | |
| 1 | Based on average shares outstanding. |
| 2 | For the year ended November 30, 2014, this column reflects the impact of a corporate action event that resulted in a one-time increase to net investment income. If the corporate action event had not occurred, the Class A net investment income per share and ratio of net income to average net assets would have been lower by $.09 and .22 percentage points, respectively. The impact to the other share classes would have been similar. |
| 3 | Total returns exclude any applicable sales charges, including contingent deferred sales charges. |
| 4 | Amount less than $.01. |
| 5 | All or a significant portion of assets in this class consisted of seed capital invested by CRMC and/or its affiliates. Fees for distribution services are not charged or accrued on these seed capital assets. If such fees were paid by the fund on seed capital assets, fund expenses would have been higher and net income and total return would have been lower. |
| 6 | Amount less than $1 million. |
| 7 | Based on operations for the period shown and, accordingly, is not representative of a full year. |
| 8 | Class R-2E shares were offered beginning August 29, 2014. |
| 9 | Not annualized. |
| 10 | Class R-5E shares were offered beginning November 20, 2015. |
| 11 | Amount less than .01%. |
See Notes to Financial Statements
Report of Independent Registered Public Accounting Firm
To the Board of Trustees and Shareholders of The New Economy Fund
In our opinion, the accompanying statement of assets and liabilities, including the summary investment portfolio, and the related statements of operations and of changes in net assets and the financial highlights present fairly, in all material respects, the financial position of The New Economy Fund (the “Fund”) at November 30, 2016, the results of its operations for the year then ended, the changes in its net assets for each of the two years in the period then ended and the financial highlights for each of the periods presented, in conformity with accounting principles generally accepted in the United States of America. These financial statements and financial highlights (hereafter referred to as “financial statements”) are the responsibility of the Fund’s management. Our responsibility is to express an opinion on these financial statements based on our audits. We conducted our audits of these financial statements in accordance with the standards of the Public Company Accounting Oversight Board (United States). Those standards require that we plan and perform the audit to obtain reasonable assurance about whether the financial statements are free of material misstatement. An audit includes examining, on a test basis, evidence supporting the amounts and disclosures in the financial statements, assessing the accounting principles used and significant estimates made by management, and evaluating the overall financial statement presentation. We believe that our audits, which included confirmation of securities at November 30, 2016 by correspondence with the custodian and brokers, provide a reasonable basis for our opinion.
PricewaterhouseCoopers LLP
Los Angeles, California
January 13, 2017
As a fund shareholder, you incur two types of costs: (1) transaction costs, such as initial sales charges on purchase payments and contingent deferred sales charges on redemptions (loads), and (2) ongoing costs, including management fees, distribution and service (12b-1) fees, and other expenses. This example is intended to help you understand your ongoing costs (in dollars) of investing in the fund so you can compare these costs with the ongoing costs of investing in other mutual funds. The example is based on an investment of $1,000 invested at the beginning of the period and held for the entire six-month period (June 1, 2016, through November 30, 2016).
Actual expenses:
The first line of each share class in the table on the following page provides information about actual account values and actual expenses. You may use the information in this line, together with the amount you invested, to estimate the expenses that you paid over the period. Simply divide your account value by $1,000 (for example, an $8,600 account value divided by $1,000 = 8.6), then multiply the result by the number in the first line under the heading titled “Expenses paid during period” to estimate the expenses you paid on your account during this period.
Hypothetical example for comparison purposes:
The second line of each share class in the table on the following page provides information about hypothetical account values and hypothetical expenses based on the actual expense ratio for the share class and an assumed rate of return of 5.00% per year before expenses, which is not the actual return of the share class. The hypothetical account values and expenses may not be used to estimate the actual ending account balance or expenses you paid for the period. You may use this information to compare the ongoing costs of investing in the fund and other funds. To do so, compare this 5.00% hypothetical example with the 5.00% hypothetical examples that appear in the shareholder reports of the other funds.
Notes:
Retirement plan participants may be subject to certain fees charged by the plan sponsor, and Class F-1, F-2 and 529-F-1 shareholders may be subject to fees charged by financial intermediaries, typically ranging from 0.75% to 1.50% of assets annually depending on services offered. You can estimate the impact of these fees by adding the amount of the fees to the total estimated expenses you paid on your account during the period as calculated above. In addition, your ending account value would be lower by the amount of these fees.
Note that the expenses shown in the table on the following page are meant to highlight your ongoing costs only and do not reflect any transactional costs, such as sales charges (loads). Therefore, the second line of each share class in the table is useful in comparing ongoing costs only and will not help you determine the relative total costs of owning different funds. In addition, if these transactional costs were included, your costs would have been higher.
| | | Beginning | | | Ending | | | | | | | |
| | | account value | | | account value | | | Expenses paid | | | Annualized | |
| | | 6/1/2016 | | | 11/30/2016 | | | during period* | | | expense ratio | |
| Class A - actual return | | $ | 1,000.00 | | | $ | 1,041.17 | | | $ | 4.09 | | | | .80 | % |
| Class A - assumed 5% return | | | 1,000.00 | | | | 1,021.06 | | | | 4.05 | | | | .80 | |
| Class B - actual return | | | 1,000.00 | | | | 1,036.86 | | | | 8.02 | | | | 1.57 | |
| Class B - assumed 5% return | | | 1,000.00 | | | | 1,017.20 | | | | 7.94 | | | | 1.57 | |
| Class C - actual return | | | 1,000.00 | | | | 1,037.13 | | | | 8.22 | | | | 1.61 | |
| Class C - assumed 5% return | | | 1,000.00 | | | | 1,017.00 | | | | 8.14 | | | | 1.61 | |
| Class F-1 - actual return | | | 1,000.00 | | | | 1,040.82 | | | | 4.35 | | | | .85 | |
| Class F-1 - assumed 5% return | | | 1,000.00 | | | | 1,020.81 | | | | 4.31 | | | | .85 | |
| Class F-2 - actual return | | | 1,000.00 | | | | 1,042.33 | | | | 2.97 | | | | .58 | |
| Class F-2 - assumed 5% return | | | 1,000.00 | | | | 1,022.16 | | | | 2.94 | | | | .58 | |
| Class 529-A - actual return | | | 1,000.00 | | | | 1,040.67 | | | | 4.45 | | | | .87 | |
| Class 529-A - assumed 5% return | | | 1,000.00 | | | | 1,020.71 | | | | 4.41 | | | | .87 | |
| Class 529-B - actual return | | | 1,000.00 | | | | 1,036.59 | | | | 8.37 | | | | 1.64 | |
| Class 529-B - assumed 5% return | | | 1,000.00 | | | | 1,016.85 | | | | 8.29 | | | | 1.64 | |
| Class 529-C - actual return | | | 1,000.00 | | | | 1,036.66 | | | | 8.48 | | | | 1.66 | |
| Class 529-C - assumed 5% return | | | 1,000.00 | | | | 1,016.75 | | | | 8.39 | | | | 1.66 | |
| Class 529-E - actual return | | | 1,000.00 | | | | 1,039.46 | | | | 5.62 | | | | 1.10 | |
| Class 529-E - assumed 5% return | | | 1,000.00 | | | | 1,019.55 | | | | 5.57 | | | | 1.10 | |
| Class 529-F-1 - actual return | | | 1,000.00 | | | | 1,041.87 | | | | 3.38 | | | | .66 | |
| Class 529-F-1 - assumed 5% return | | | 1,000.00 | | | | 1,021.76 | | | | 3.35 | | | | .66 | |
| Class R-1 - actual return | | | 1,000.00 | | | | 1,037.00 | | | | 8.02 | | | | 1.57 | |
| Class R-1 - assumed 5% return | | | 1,000.00 | | | | 1,017.20 | | | | 7.94 | | | | 1.57 | |
| Class R-2 - actual return | | | 1,000.00 | | | | 1,037.11 | | | | 7.97 | | | | 1.56 | |
| Class R-2 - assumed 5% return | | | 1,000.00 | | | | 1,017.25 | | | | 7.89 | | | | 1.56 | |
| Class R-2E - actual return | | | 1,000.00 | | | | 1,038.62 | | | | 6.54 | | | | 1.28 | |
| Class R-2E - assumed 5% return | | | 1,000.00 | | | | 1,018.65 | | | | 6.48 | | | | 1.28 | |
| Class R-3 - actual return | | | 1,000.00 | | | | 1,039.38 | | | | 5.67 | | | | 1.11 | |
| Class R-3 - assumed 5% return | | | 1,000.00 | | | | 1,019.50 | | | | 5.62 | | | | 1.11 | |
| Class R-4 - actual return | | | 1,000.00 | | | | 1,040.96 | | | | 4.14 | | | | .81 | |
| Class R-4 - assumed 5% return | | | 1,000.00 | | | | 1,021.01 | | | | 4.10 | | | | .81 | |
| Class R-5E - actual return | | | 1,000.00 | | | | 1,041.59 | | | | 3.58 | | | | .70 | |
| Class R-5E - assumed 5% return | | | 1,000.00 | | | | 1,021.56 | | | | 3.55 | | | | .70 | |
| Class R-5 - actual return | | | 1,000.00 | | | | 1,042.67 | | | | 2.61 | | | | .51 | |
| Class R-5 - assumed 5% return | | | 1,000.00 | | | | 1,022.51 | | | | 2.59 | | | | .51 | |
| Class R-6 - actual return | | | 1,000.00 | | | | 1,042.79 | | | | 2.36 | | | | .46 | |
| Class R-6 - assumed 5% return | | | 1,000.00 | | | | 1,022.76 | | | | 2.33 | | | | .46 | |
| * | The “expenses paid during period” are equal to the “annualized expense ratio,” multiplied by the average account value over the period, multiplied by the number of days in the period, and divided by 365 (to reflect the one-half year period). |
We are required to advise you of the federal tax status of certain distributions received by shareholders during the fiscal year. The fund hereby designates the following amounts for the fund’s fiscal year ended November 30, 2016:
| | | |
| Long-term capital gains | | $ | 881,486,000 |
| Qualified dividend income | | | 100% |
| Corporate dividends received deduction | | | 100% |
| U.S. government income that may be exempt from state taxation | | $ | 713,000 |
Individual shareholders should refer to their Form 1099 or other tax information, which will be mailed in January 2017, to determine the calendar year amounts to be included on their 2016 tax returns. Shareholders should consult their tax advisors.
Approval of Investment Advisory and Service Agreement
The New Economy Fund’s board has approved the fund’s Investment Advisory and Service Agreement (the “agreement”) with Capital Research and Management Company (“CRMC”) for an additional one-year term through October 31, 2017. The board approved the agreement following the recommendation of the fund’s Contracts Committee (the “committee”), which is composed of all of the fund’s independent board members. The board and the committee determined that the fund’s advisory fee structure was fair and reasonable in relation to the services provided, and that approving the agreement was in the best interests of the fund and its shareholders.
In reaching this decision, the board and the committee took into account information furnished to them throughout the year and otherwise provided to them, as well as information prepared specifically in connection with their review of the agreement, and were advised by their independent counsel. They considered the following factors, among others, but did not identify any single issue or particular piece of information that, in isolation, was the controlling factor, and each board and committee member did not necessarily attribute the same weight to each factor.
1. Nature, extent and quality of services
The board and the committee considered the depth and quality of CRMC’s investment management process, including its global research capabilities; the experience, capability and integrity of its senior management and other personnel; the low turnover rates of its key personnel; the overall financial strength and stability of CRMC and the Capital Group organization; and the ongoing evolution of CRMC’s organizational structure designed to maintain and strengthen these qualities. The board and the committee also considered the nature, extent and quality of administrative, compliance and shareholder services provided by CRMC to the fund under the agreement and other agreements, as well as the benefits to fund shareholders from investing in a fund that is part of a large family of funds. The board and the committee concluded that the nature, extent and quality of the services provided by CRMC have benefited and should continue to benefit the fund and its shareholders.
2. Investment results
The board and the committee considered the investment results of the fund in light of its objective of providing long-term growth of capital with current income a secondary consideration. They compared the fund’s investment results with those of other funds (including funds that currently form the basis of the Lipper index for the category in which the fund is included), and data such as relevant market and fund indexes, over various periods through March 31, 2016. This report, including the letter to shareholders and related disclosures, contains certain information about the fund’s investment results. The board and the committee reviewed the fund’s investment results measured against various indexes, including the S&P 500 Index, the Global Service and Information Industries Index, the Lipper Growth Funds Index and the MSCI All Country World Index. They noted that the investment results of the fund generally compared favorably to those of these indexes for the lifetime, 20-year, 10-year and five-year periods. The board and the committee concluded that the fund’s investment results have been satisfactory for renewal of the agreement and that CRMC’s record in managing the fund indicated that its continued management should benefit the fund and its shareholders.
3. Advisory fees and total expenses
The board and the committee compared the advisory fees and total expense levels of the fund to those of other relevant funds. They observed that the fund’s advisory fees and expenses generally compared favorably to those of other similar funds included in the Lipper Growth Funds category. The board and the committee also considered the breakpoint discounts in the fund’s advisory fee structure that reduce the level of fees charged by CRMC to the fund as fund assets increase. In addition, they reviewed information regarding the effective advisory fees charged to non-mutual fund clients by CRMC and its affiliates. They noted that, to the extent there were differences between the advisory fees paid by the fund and the advisory fees paid by those clients, the differences appropriately reflected the investment, operational, regulatory and market differences between advising the fund and the other clients. The board and the committee concluded that the fund’s cost structure was fair and reasonable in relation to the services provided, and that the fund’s shareholders receive reasonable value in return for the advisory fees and other amounts paid to CRMC by the fund.
4. Ancillary benefits
The board and the committee considered a variety of other benefits that CRMC and its affiliates receive as a result of CRMC’s relationship with the fund and the other American Funds, including fees for administrative services provided to certain share classes; fees paid to CRMC’s affiliated transfer agent; sales charges and distribution fees received and retained by the fund’s principal underwriter, an affiliate of CRMC; and possible ancillary benefits to CRMC and its institutional management affiliates in managing other investment vehicles. The board and the committee reviewed CRMC’s portfolio trading practices, noting the benefits CRMC receives from the research obtained with commissions from portfolio transactions made on behalf of the fund. The board and the committee took these ancillary benefits into account in evaluating the reasonableness of the advisory fees and other amounts paid to CRMC by the fund.
5. Adviser financial information
The board and the committee reviewed information regarding CRMC’s costs of providing services to the American Funds, including personnel, systems and resources of investment, compliance, trading, accounting and other administrative operations. They considered CRMC’s costs and related cost allocation methodology as well as its willingness to invest in technology, infrastructure and staff to maintain and expand services and capabilities, respond to industry and regulatory developments, and attract and retain qualified personnel. They noted information regarding the compensation structure for CRMC’s investment professionals. The board and the committee also compared CRMC’s profitability and compensation data to the reported results and data of several large, publicly held investment management companies. The board and the committee noted the competitiveness and cyclicality of both the mutual fund industry and the capital markets, and the importance in that environment of CRMC’s long-term profitability for maintaining its independence, company culture and management continuity. They further considered the breakpoint discounts in the fund’s advisory fee structure. The board and the committee concluded that the fund’s advisory fee structure reflected a reasonable sharing of benefits between CRMC and the fund’s shareholders.
Board of trustees and other officers
Independent trustees1
| Name and year of birth | | Year first
elected
a trustee
of the fund2 | | Principal occupation(s) during past five years | | Number of
portfolios in fund
complex overseen
by trustee3 | | Other directorships4
held by trustee |
| Joseph C. Berenato, 1946 | | 2000 | | Former Chairman and CEO, Ducommun Incorporated(aerospace components manufacturer) | | 16 | | Ducommun Incorporated |
| Mary Anne Dolan, 1947 | | 2008 | | Founder and President, MAD Ink (communications company) | | 10 | | None |
| John G. Freund, 1953 | | 2016 | | Founder and Managing Director, Skyline Ventures (venture capital investor in health care companies) | | 6 | | Collegium Pharmaceutical, Inc.; Proteon Therapeutics, Inc.; Tetraphase Pharmaceuticals, Inc. |
| Pedro J. Greer, Jr., 1956 | | 2016 | | Physician; Chairman of the Board and Associate Dean, Florida International University | | 3 | | None |
| R. Clark Hooper, 1946 | | 2006 | | Private investor | | 81 | | None |
| Merit E. Janow, 1958 | | 2010 | | Dean and Professor, Columbia University, School of International and Public Affairs | | 80 | | MasterCard Incorporated; Trimble, Inc. |
| Leonade D. Jones, 1947 | | 1995 | | Retired; former Treasurer, The Washington Post Company (retired 1996) | | 10 | | None |
| Earl Lewis, Jr., PhD, 1955 | | 2017 | | President, The Andrew W. Mellon Foundation; former Executive Vice President, Provost, Emory University | | 3 | | 2U, Inc. |
| Stefanie Powers, 1942 | | 2010 | | Actor, producer, author, entrepreneur; Co-founder and President of The William Holden Wildlife Foundation; founder of The Jaguar Conservation Trust; former conservation consultant to Land Rover and Jaguar North America | | 3 | | None |
| Christopher E. Stone, 1956 | | 2007 | | President, Open Society Foundations; former Professor of the Practice of Criminal Justice, John F. Kennedy School of Government, Harvard University | | 6 | | None |
Steadman Upham, PhD, 1949 Chairman of the Board (Independent and Non-Executive) | | 2010 | | President Emeritus and University Professor, The University of Tulsa | | 80 | | None |
Robert J. Denison retired from the fund on December 31, 2016. The trustees thank Mr. Denison for his wise counsel and dedication to the fund.
Interested trustees5,6
Name, year of birth and
position with fund | | Year first elected
a trustee
or officer
of the fund2 | | Principal occupation(s) during past five years
and positions held with affiliated entities or
the principal underwriter of the fund | | Number of
portfolios in fund
complex overseen
by trustee3 | | Other directorships4
held by trustee |
Timothy D. Armour, 1960
Vice Chairman of the Board | | 1991 | | Chairman of the Board, Capital Research and Management Company; Partner — Capital Research Global Investors, Capital Research and Management Company; Chairman of the Board and CEO, The Capital Group Companies, Inc.7 | | 1 | | None |
Claudia P. Huntington, 1952
President | | 1996 | | Partner — Capital Research Global Investors, Capital Research and Management Company; Director, The Capital Group Companies, Inc.7 | | 2 | | None |
The fund’s statement of additional information includes further details about fund trustees and is available without charge upon request by calling American Funds Service Company at (800) 421-4225 or by visiting the American Funds website at americanfunds.com. The address for all trustees and officers of the fund is 333 South Hope Street, Los Angeles, CA 90071, Attention: Secretary.
See page 36 for footnotes.
Other officers6
| Name, year of birth and position with fund | | Year first
elected
an officer
of the fund2 | | Principal occupation(s) during past five years and positions held with affiliated entities
or the principal underwriter of the fund |
Donald H. Rolfe, 1972
Executive Vice President | | 2010 | | Senior Vice President and Senior Counsel — Fund Business Management Group,
Capital Research and Management Company |
Mark E. Denning, 1957
Senior Vice President | | 2006 | | Director, Capital Research and Management Company;
Partner — Capital Research Global Investors, Capital Research Company;7
Partner — Capital Research Global Investors, Capital International, Inc.7 |
Harold H. La, 1970
Senior Vice President | | 2006 | | Partner — Capital Research Global Investors, Capital International, Inc.7 |
Lawrence R. Solomon, 1962
Vice President | | 2010 | | Partner — Capital Research Global Investors, Capital Research and Management Company;
Chairman of the Board and President, Capital Management Services, Inc.7 |
Michael W. Stockton, 1967
Secretary | | 2013 | | Vice President — Fund Business Management Group, Capital Research and Management Company |
Gregory F. Niland, 1971
Treasurer | | 2016 | | Vice President — Investment Operations, Capital Research and Management Company |
| Jennifer L. Butler, 1966 Assistant Secretary | | 2013 | | Assistant Vice President — Fund Business Management Group, Capital Research and Management Company |
Brian C. Janssen, 1972
Assistant Treasurer | | 2016 | | Vice President — Investment Operations, Capital Research and Management Company |
Dori Laskin, 1951
Assistant Treasurer | | 2010 | | Vice President — Investment Operations, Capital Research and Management Company |
| 1 | The term independent trustee refers to a trustee who is not an “interested person” of the fund within the meaning of the Investment Company Act of 1940. |
| 2 | Trustees and officers of the fund serve until their resignation, removal or retirement. |
| 3 | Funds managed by Capital Research and Management Company or its affiliates. |
| 4 | This includes all directorships/trusteeships (other than those in the American Funds or other funds managed by Capital Research and Management Company or its affiliates) that are held by each trustee as a trustee or director of a public company or a registered investment company. |
| 5 | The term interested trustee refers to a trustee who is an “interested person” within the meaning of the Investment Company Act of 1940, on the basis of their affiliation with the fund’s investment adviser, Capital Research and Management Company, or affiliated entities (including the fund’s principal underwriter). |
| 6 | All of the directors/trustees and/or officers listed, with the exception of Harold H. La, are officers and/or directors/trustees of one or more of the other funds for which Capital Research and Management Company serves as investment adviser. |
| 7 | Company affiliated with Capital Research and Management Company. |
Offices of the fund and of the investment adviser
Capital Research and Management Company
333 South Hope Street
Los Angeles, CA 90071-1406
6455 Irvine Center Drive
Irvine, CA 92618-4518
Transfer agent for shareholder accounts
American Funds Service Company
(Write to the address near you.)
P.O. Box 6007
Indianapolis, IN 46206-6007
P.O. Box 2280
Norfolk, VA 23501-2280
Custodian of assets
State Street Bank and Trust Company
One Lincoln Street
Boston, MA 02111
Counsel
O’Melveny & Myers LLP
400 South Hope Street
Los Angeles, CA 90071-2899
Independent registered public accounting firm
PricewaterhouseCoopers LLP
601 South Figueroa Street
Los Angeles, CA 90017-3874
Principal underwriter
American Funds Distributors, Inc.
333 South Hope Street
Los Angeles, CA 90071-1406
Investors should carefully consider investment objectives, risks, charges and expenses. This and other important information is contained in the fund prospectus and summary prospectus, which can be obtained from your financial professional and should be read carefully before investing. You may also call American Funds Service Company (AFS) at (800) 421-4225 or visit the American Funds website at americanfunds.com.
“American Funds Proxy Voting Procedures and Principles” — which describes how we vote proxies relating to portfolio securities — is available on the American Funds website or upon request by calling AFS. The fund files its proxy voting record with the U.S. Securities and Exchange Commission (SEC) for the 12 months ended June 30 by August 31. The proxy voting record is available free of charge on the SEC website at sec.gov and on the American Funds website.
A complete November 30, 2016, portfolio of The New Economy Fund’s investments is available free of charge by calling AFS or visiting the SEC website (where it is part of Form N-CSR).
The New Economy Fund files a complete list of its portfolio holdings with the SEC for the first and third quarters of each fiscal year on Form N-Q. This filing is available free of charge on the SEC website. You may also review or, for a fee, copy this filing at the SEC’s Public Reference Room in Washington, D.C. Additional information regarding the operation of the Public Reference Room may be obtained by calling the SEC’s Office of Investor Education and Advocacy at (800) SEC-0330. Additionally, the list of portfolio holdings is available by calling AFS.
This report is for the information of shareholders of The New Economy Fund, but it also may be used as sales literature when preceded or accompanied by the current prospectus or summary prospectus, which gives details about charges, expenses, investment objectives and operating policies of the fund. If used as sales material after March 31, 2017, this report must be accompanied by an American Funds statistical update for the most recently completed calendar quarter.
MSCI has not approved, reviewed or produced this report, makes no express or implied warranties or representations and is not liable whatsoever for any data in the report. You may not redistribute the MSCI data or use it as a basis for other indices or investment products.
The Standard & Poor’s 500 Composite Index (“Index”) is a product of S&P Dow Jones Indices LLC and/or its affiliates and has been licensed for use by Capital Group. Copyright © 2017 S&P Dow Jones Indices LLC, a division of S&P Global, and/or its affiliates. All rights reserved. Redistribution or reproduction in whole or in part are prohibited without written permission of S&P Dow Jones Indices LLC.
American Funds from Capital Group
The Capital AdvantageSM
Since 1931, American Funds, part of Capital Group, has helped investors pursue long-term investment success. Our consistent approach — in combination with The Capital SystemSM — has resulted in a superior long-term track record.
Aligned with investor success
We base our decisions on a long-term perspective, which we believe aligns our goals with the interests of our clients. Our portfolio managers average 27 years of investment experience, including 22 years at our company, reflecting a career commitment to our long-term approach.1
The Capital SystemSM
The Capital System combines individual accountability with teamwork. Funds using The Capital System are divided into portions that are managed independently by investment professionals with diverse backgrounds, ages and investment approaches. An extensive global research effort is the backbone of our system.
American Funds’ superior long-term track record
Equity funds have beaten their Lipper peer indexes in 91% of 10-year periods and 95% of 20-year periods. Fixed income funds have beaten their Lipper indexes in 58% of 10-year periods and 58% of 20-year periods.2 Fund management fees have been among the lowest in the industry.3
| 1 | Portfolio manager experience as of December 31, 2015. |
| 2 | Based on Class A share results for rolling periods through December 31, 2015. Periods covered are the shorter of the fund’s lifetime or since the comparable Lipper index inception date (except Capital Income Builder and SMALLCAP World Fund, for which the Lipper average was used). Expenses differ for each share class, so results will vary. |
| 3 | On average, our management fees were in the lowest quintile 68% of the time, based on the 20-year period ended December 31, 2015, versus comparable Lipper categories, excluding funds of funds. |

ITEM 2 – Code of Ethics
The Registrant has adopted a Code of Ethics that applies to its Principal Executive Officer and Principal Financial Officer. The Registrant undertakes to provide to any person without charge, upon request, a copy of the Code of Ethics. Such request can be made to American Funds Service Company at 800/421-9225 or to the Secretary of the Registrant, 333 South Hope Street, Los Angeles, California 90071.
ITEM 3 – Audit Committee Financial Expert
The Registrant’s board has determined that Leonade D. Jones, a member of the Registrant’s audit committee, is an “audit committee financial expert” and "independent," as such terms are defined in this Item. This designation will not increase the designee’s duties, obligations or liability as compared to his or her duties, obligations and liability as a member of the audit committee and of the board, nor will it reduce the responsibility of the other audit committee members. There may be other individuals who, through education or experience, would qualify as "audit committee financial experts" if the board had designated them as such. Most importantly, the board believes each member of the audit committee contributes significantly to the effective oversight of the Registrant’s financial statements and condition.
| ITEM 4 – Principal Accountant Fees and Services | |
| | | |
| Registrant: | |
| a) Audit Fees: | |
| | 2015 | $108,000 |
| | 2016 | $125,000 |
| | | |
| b) Audit-Related Fees: | |
| | 2015 | None |
| | 2016 | None |
| | | |
| c) Tax Fees: | |
| | 2015 | $9,000 |
| | 2016 | $9,000 |
| | The tax fees consist of professional services relating to the preparation of the Registrant’s tax returns. |
| | | |
| d) All Other Fees: | |
| | 2015 | None |
| | 2016 | None |
| | | |
| | Adviser and affiliates (includes only fees for non-audit services billed to the adviser and affiliates for engagements that relate directly to the operations and financial reporting of the Registrant and were subject to the pre-approval policies described below): |
| a) Audit Fees: | |
| | Not Applicable | |
| | | |
| b) Audit-Related Fees: | |
| | 2015 | None |
| | 2016 | $17,000 |
| | The audit-related fees consist of assurance and related services relating to the examination of the Registrant’s transfer agent, principal underwriter and investment adviser conducted in accordance with Statement on Standards for Attestation Engagements Number 16 issued by the American Institute of Certified Public Accountants. |
| | | |
| c) Tax Fees: | |
| | 2015 | $29,000 |
| | 2016 | $9,000 |
| | The tax fees consist of consulting services relating to the Registrant’s investments. |
| | | |
| | | |
| d) All Other Fees: | |
| | 2015 | $2,000 |
| | 2016 | $2,000 |
| | The other fees consist of subscription services related to an accounting research tool. |
| | | |
| | | |
| | All audit and permissible non-audit services that the Registrant’s audit committee considers compatible with maintaining the independent registered public accounting firm’s independence are required to be pre-approved by the committee. The pre-approval requirement will extend to all non-audit services provided to the Registrant, the investment adviser, and any entity controlling, controlled by, or under common control with the investment adviser that provides ongoing services to the Registrant, if the engagement relates directly to the operations and financial reporting of the Registrant. The committee will not delegate its responsibility to pre-approve these services to the investment adviser. The committee may delegate to one or more committee members the authority to review and pre-approve audit and permissible non-audit services. Actions taken under any such delegation will be reported to the full committee at its next meeting. The pre-approval requirement is waived with respect to non-audit services if certain conditions are met. The pre-approval requirement was not waived for any of the non-audit services listed above provided to the Registrant, adviser and affiliates. |
| | | |
| | Aggregate non-audit fees paid to the Registrant’s auditors, including fees for all services billed to the Registrant, adviser and affiliates that provide ongoing services to the Registrant, were $59,000 for fiscal year 2015 and $39,000 for fiscal year 2016. The non-audit services represented by these amounts were brought to the attention of the committee and considered to be compatible with maintaining the auditors’ independence. |
ITEM 5 – Audit Committee of Listed Registrants
Not applicable to this Registrant, insofar as the Registrant is not a listed issuer as defined in Rule 10A-3 under the Securities Exchange Act of 1934.
ITEM 6 – Schedule of Investments
The New Economy Fund®
Investment portfolio
November 30, 2016
Common stocks 92.97%
Information technology 25.04% | Shares | Value
(000) |
| Alphabet Inc., Class C1 | 232,688 | $176,387 |
| Alphabet Inc., Class A1 | 192,695 | 149,508 |
| Tencent Holdings Ltd.2 | 13,037,000 | 324,607 |
| Skyworks Solutions, Inc. | 3,467,150 | 266,450 |
| Accenture PLC, Class A | 1,568,300 | 187,302 |
| Qorvo, Inc.1 | 3,294,480 | 175,958 |
| Trimble Navigation Ltd.1 | 5,432,430 | 153,140 |
| Texas Instruments Inc. | 1,858,400 | 137,392 |
| Alibaba Group Holding Ltd. (ADR)1 | 1,432,300 | 134,665 |
| International Business Machines Corp. | 790,000 | 128,154 |
| Samsung Electronics Co., Ltd.2 | 76,445 | 113,106 |
| Baidu, Inc., Class A (ADR)1 | 614,380 | 102,571 |
| Oracle Corp. | 2,401,814 | 96,529 |
| Nintendo Co., Ltd.2 | 382,900 | 93,969 |
| Intuit Inc. | 775,000 | 88,102 |
| Apple Inc. | 797,000 | 88,084 |
| Zebra Technologies Corp., Class A1 | 1,105,800 | 87,413 |
| Broadcom Ltd. | 507,100 | 86,455 |
| Murata Manufacturing Co., Ltd.2 | 620,000 | 85,636 |
| AAC Technologies Holdings Inc.2 | 9,075,500 | 81,979 |
| Intel Corp. | 2,150,000 | 74,605 |
| Autodesk, Inc.1 | 1,000,000 | 72,610 |
| Western Union Co. | 3,435,000 | 72,238 |
| Inphi Corp.1 | 1,537,035 | 69,428 |
| Topcon Corp.2 | 4,597,000 | 68,154 |
| Finisar Corp.1 | 2,033,901 | 67,587 |
| Hamamatsu Photonics KK2 | 2,360,000 | 63,365 |
| LG Display Co., Ltd.2 | 2,460,000 | 58,656 |
| Lumentum Holdings Inc.1 | 1,231,000 | 49,363 |
| Cray Inc.1,3 | 2,303,010 | 44,448 |
| Arista Networks, Inc.1 | 449,400 | 42,608 |
| MasterCard Inc., Class A | 395,000 | 40,369 |
| YY Inc., Class A (ADR)1 | 799,481 | 34,594 |
| Viavi Solutions Inc.1 | 3,983,000 | 31,267 |
| Juniper Networks, Inc. | 1,063,399 | 29,286 |
| ASML Holding NV2 | 272,340 | 28,067 |
| salesforce.com, inc.1 | 330,000 | 23,760 |
| Amphenol Corp., Class A | 310,000 | 21,161 |
| Moneysupermarket.com Group PLC2 | 4,860,000 | 16,106 |
| Cypress Semiconductor Corp. | 578,000 | 6,502 |
| Worldpay Group PLC2 | 1,461,000 | 4,915 |
| | | 3,676,496 |
| Health care 21.57% | | |
| Thermo Fisher Scientific Inc. | 2,446,000 | 342,709 |
| Hologic, Inc.1 | 5,716,850 | 218,841 |
| NuVasive, Inc.1,3 | 3,163,500 | 205,311 |
The New Economy Fund — Page 1 of 6
Common stocks
Health care (continued) | Shares | Value
(000) |
| BioMarin Pharmaceutical Inc.1 | 2,162,430 | $185,169 |
| Amgen Inc. | 1,236,613 | 178,159 |
| AbbVie Inc. | 2,162,401 | 131,474 |
| AbbVie Inc.2,4 | 541,232 | 32,578 |
| Kite Pharma, Inc.1,3 | 2,976,570 | 151,597 |
| Stryker Corp. | 1,301,750 | 147,957 |
| Express Scripts Holding Co.1 | 1,923,300 | 145,940 |
| Ultragenyx Pharmaceutical Inc.1 | 1,754,235 | 137,339 |
| Alexion Pharmaceuticals, Inc.1 | 1,111,390 | 136,245 |
| McKesson Corp. | 912,000 | 131,155 |
| GW Pharmaceuticals PLC (ADR)1 | 1,114,054 | 124,384 |
| Grifols, SA, Class B (ADR) | 2,758,252 | 43,111 |
| Grifols, SA, Class B, preferred non-voting, non-registered shares2 | 2,636,350 | 41,394 |
| Grifols, SA, Class A, non-registered shares2 | 2,000,000 | 39,129 |
| China Biologic Products, Inc.1 | 1,013,777 | 121,369 |
| Medtronic PLC | 1,299,000 | 94,840 |
| bluebird bio, Inc.1 | 1,521,122 | 91,800 |
| UnitedHealth Group Inc. | 571,300 | 90,448 |
| Illumina, Inc.1 | 512,900 | 68,288 |
| Gilead Sciences, Inc. | 872,000 | 64,266 |
| Boston Scientific Corp.1 | 2,551,292 | 52,199 |
| QIAGEN NV1,2 | 1,290,814 | 35,580 |
| Humana Inc. | 147,600 | 31,386 |
| UCB SA2 | 426,000 | 27,345 |
| PerkinElmer, Inc. | 453,000 | 22,976 |
| Mesoblast Ltd.1,2,3 | 21,900,000 | 19,704 |
| Mesoblast Ltd. (ADR)1,3 | 372,800 | 1,685 |
| Edwards Lifesciences Corp.1 | 191,358 | 15,854 |
| Endo International PLC1 | 848,800 | 13,589 |
| Team Health Holdings, Inc.1 | 292,820 | 12,460 |
| athenahealth, Inc.1 | 114,275 | 10,810 |
| | | 3,167,091 |
| Consumer discretionary 16.37% | | |
| Netflix, Inc.1 | 4,501,100 | 526,629 |
| Galaxy Entertainment Group Ltd.2 | 51,827,000 | 256,517 |
| Sony Corp.2 | 8,729,000 | 251,399 |
| Amazon.com, Inc.1 | 282,000 | 211,661 |
| lululemon athletica inc.1 | 2,342,000 | 133,471 |
| Twenty-First Century Fox, Inc., Class A | 4,200,000 | 118,062 |
| Daily Mail and General Trust PLC, Class A, non-voting2 | 10,896,701 | 103,996 |
| Kering SA2 | 447,000 | 96,906 |
| Marriott International, Inc., Class A | 1,066,400 | 84,011 |
| Priceline Group Inc.1 | 50,500 | 75,936 |
| Naspers Ltd., Class N2 | 418,000 | 60,731 |
| Ralph Lauren Corp., Class A | 550,000 | 57,535 |
| William Hill PLC2 | 13,600,000 | 51,191 |
| Lions Gate Entertainment Corp. | 2,105,000 | 49,257 |
| Viacom Inc., Class B | 1,278,964 | 47,936 |
| JCDecaux SA2 | 1,500,000 | 39,015 |
| Entertainment One Ltd.2 | 12,759,700 | 35,017 |
| Home Depot, Inc. | 251,000 | 32,479 |
| Eros International PLC, Class A1 | 2,078,778 | 29,207 |
| Eros International PLC, Class A1,2,4 | 188,000 | 2,483 |
| Paddy Power Betfair PLC2 | 227,200 | 23,719 |
The New Economy Fund — Page 2 of 6
Common stocks
Consumer discretionary (continued) | Shares | Value
(000) |
| Melco Crown Entertainment Ltd. (ADR) | 1,204,400 | $23,679 |
| Altice NV, Class A1,2 | 1,000,000 | 17,138 |
| Altice NV, Class B1,2 | 221,000 | 3,840 |
| Five Below, Inc.1 | 509,220 | 20,043 |
| Lands’ End, Inc.1 | 1,088,463 | 19,320 |
| NIKE, Inc., Class B | 346,400 | 17,344 |
| B2W - Cia. Digital, ordinary nominative1 | 4,192,595 | 14,045 |
| | | 2,402,567 |
| Financials 12.98% | | |
| HDFC Bank Ltd.2 | 4,875,000 | 97,881 |
| HDFC Bank Ltd. (ADR) | 1,200,000 | 77,424 |
| Kotak Mahindra Bank Ltd.2 | 14,190,882 | 156,928 |
| American International Group, Inc. | 2,238,000 | 141,732 |
| Endurance Specialty Holdings Ltd. | 1,326,000 | 122,257 |
| JPMorgan Chase & Co. | 1,500,000 | 120,255 |
| AIA Group Ltd.2 | 18,391,800 | 111,994 |
| Barclays PLC2 | 39,981,344 | 107,911 |
| Essent Group Ltd.1 | 3,316,000 | 101,204 |
| EXOR SpA2 | 2,258,000 | 94,716 |
| Prudential PLC2 | 4,900,000 | 94,674 |
| East West Bancorp, Inc. | 1,800,000 | 86,184 |
| Webster Financial Corp. | 1,554,000 | 77,094 |
| Wells Fargo & Co. | 1,362,300 | 72,093 |
| Progressive Corp. | 1,800,000 | 59,940 |
| Leucadia National Corp. | 2,608,000 | 57,428 |
| State Street Corp. | 700,000 | 55,160 |
| Banco Santander, SA2 | 11,703,569 | 53,410 |
| Goldman Sachs Group, Inc. | 217,000 | 47,586 |
| Fifth Third Bancorp | 1,800,000 | 46,836 |
| Siam Commercial Bank PCL2 | 9,940,000 | 40,728 |
| Metropolitan Bank & Trust Co.2 | 26,500,000 | 40,053 |
| Aberdeen Asset Management PLC2 | 7,370,000 | 24,628 |
| Banca Popolare Di Milano2 | 43,915,000 | 14,210 |
| SVB Financial Group1 | 25,500 | 4,030 |
| | | 1,906,356 |
| Industrials 6.23% | | |
| CSX Corp. | 3,809,400 | 136,415 |
| Union Pacific Corp. | 1,075,954 | 109,026 |
| Nielsen Holdings PLC | 2,513,100 | 108,315 |
| AKR Corporindo Tbk PT2 | 173,899,680 | 85,871 |
| Ryanair Holdings PLC (ADR)1 | 1,026,999 | 81,996 |
| CAE Inc. | 5,000,000 | 73,736 |
| Sensata Technologies Holding NV1 | 1,952,300 | 72,957 |
| JG Summit Holdings, Inc.2 | 33,268,800 | 45,643 |
| Nidec Corp.2 | 360,000 | 32,603 |
| Verisk Analytics, Inc., Class A1 | 381,000 | 31,653 |
| Old Dominion Freight Line, Inc.1 | 336,200 | 29,350 |
| J.B. Hunt Transport Services, Inc. | 298,000 | 28,420 |
| AirAsia Bhd.2 | 45,583,400 | 28,100 |
| Babcock International Group PLC2 | 2,076,923 | 24,763 |
The New Economy Fund — Page 3 of 6
Common stocks
Industrials (continued) | Shares | Value
(000) |
| Alliance Global Group, Inc.2 | 66,610,000 | $17,415 |
| PARK24 Co., Ltd.2 | 285,300 | 8,172 |
| | | 914,435 |
| Consumer staples 2.33% | | |
| Costco Wholesale Corp. | 570,200 | 85,593 |
| Associated British Foods PLC2 | 2,233,240 | 71,253 |
| AMOREPACIFIC Corp.2 | 193,200 | 54,182 |
| COSMOS Pharmaceutical Corp.2 | 225,000 | 41,247 |
| Kroger Co. | 1,028,000 | 33,204 |
| Herbalife Ltd.1 | 628,000 | 30,791 |
| Sprouts Farmers Market, Inc.1 | 1,258,653 | 25,186 |
| | | 341,456 |
| Telecommunication services 1.22% | | |
| AT&T Inc. | 1,496,788 | 57,821 |
| Verizon Communications Inc. | 1,091,000 | 54,441 |
| MTN Group Ltd.2 | 6,500,000 | 52,356 |
| CenturyLink, Inc. | 534,800 | 12,578 |
| Avanti Communications Group PLC1,2 | 4,849,886 | 1,381 |
| | | 178,577 |
| Materials 1.13% | | |
| Nitto Denko Corp.2 | 997,676 | 70,153 |
| Croda International PLC2 | 1,313,103 | 53,489 |
| International Flavors & Fragrances Inc. | 235,700 | 28,531 |
| Monsanto Co. | 139,500 | 14,328 |
| | | 166,501 |
| Energy 0.76% | | |
| Schlumberger Ltd. | 1,220,000 | 102,541 |
| Golar LNG Ltd. | 390,000 | 9,516 |
| | | 112,057 |
| Utilities 0.54% | | |
| ENN Energy Holdings Ltd.2 | 17,156,000 | 78,880 |
| Real estate 0.24% | | |
| Crown Castle International Corp. | 420,000 | 35,053 |
| Miscellaneous 4.56% | | |
| Other common stocks in initial period of acquisition | | 669,396 |
| Total common stocks (cost: $10,300,497,000) | | 13,648,865 |
Preferred securities 0.08%
Miscellaneous 0.08% | | |
| Other preferred securities in initial period of acquisition | | 11,773 |
| Total preferred securities (cost: $5,997,000) | | 11,773 |
The New Economy Fund — Page 4 of 6
Bonds, notes & other debt instruments 0.00%
U.S. Treasury bonds & notes 0.00%
U.S. Treasury 0.00% | Principal amount
(000) | Value
(000) |
| U.S. Treasury 1.00% 2017 | $375 | $376 |
| Total bonds, notes & other debt instruments (cost: $375,000) | | 376 |
| Short-term securities 6.90% | | |
| Apple Inc. 0.52% due 12/5/20164 | 6,800 | 6,800 |
| Estée Lauder Companies Inc. 0.73% due 2/7/20174 | 10,000 | 9,988 |
| Fannie Mae 0.48% due 2/14/2017 | 30,000 | 29,970 |
| Federal Home Loan Bank 0.28%–0.51% due 12/9/2016–2/22/2017 | 445,000 | 444,808 |
| Freddie Mac 0.50% due 5/15/2017 | 25,000 | 24,931 |
| General Electric Co. 0.36% due 12/1/2016 | 26,350 | 26,350 |
| IBM Corp. 0.63% due 12/27/20164 | 50,000 | 49,985 |
| Intel Corp. 0.50% due 12/19/2016 | 45,150 | 45,140 |
| John Deere Financial Ltd. 0.63% due 1/11/20174 | 14,000 | 13,993 |
| Microsoft Corp. 0.54%–0.67% due 12/1/2016–1/17/20174 | 90,400 | 90,364 |
| PepsiCo Inc. 0.40% due 12/9/20164 | 10,000 | 9,999 |
| Pfizer Inc. 0.59%–0.68% due 12/8/2016–12/19/20164 | 65,900 | 65,893 |
| Procter & Gamble Co. 0.51% due 1/11/20174 | 25,000 | 24,988 |
| Qualcomm Inc. 0.51% due 12/7/20164 | 34,500 | 34,497 |
| U.S. Treasury Bills 0.34% due 12/8/2016 | 30,000 | 29,999 |
| United Parcel Service Inc. 0.40% due 12/12/20164 | 25,000 | 24,997 |
| USAA Capital Corp. 0.41% due 12/15/2016 | 25,000 | 24,996 |
| Wal-Mart Stores, Inc. 0.41% due 12/19/20164 | 25,000 | 24,995 |
| Wells Fargo Bank, N.A. 0.92% due 12/1/2016 | 29,900 | 29,900 |
| Total short-term securities (cost: $1,012,590,000) | | 1,012,593 |
| Total investment securities 99.95% (cost: $11,319,459,000) | | 14,673,607 |
| Other assets less liabilities 0.05% | | 7,119 |
| Net assets 100.00% | | $14,680,726 |
As permitted by U.S. Securities and Exchange Commission regulations, “Miscellaneous” securities include holdings in their first year of acquisition that have not previously been publicly disclosed.
The New Economy Fund — Page 5 of 6
Forward currency contracts
The fund has entered into a forward currency contract as shown in the following table. The average month-end notional amount of open forward currency contracts while held was $38,256,000.
| | Settlement
date | Counterparty | Contract amount | Unrealized
appreciation
at 11/30/2016
(000) |
Receive
(000) | Deliver
(000) |
| Sales: | | | | | |
| Euros | 12/7/2016 | Barclays Bank PLC | $12,682 | €11,407 | $590 |
The following footnotes apply to either the individual securities noted or one or more of the securities aggregated and listed as a single line item.
| 1 | Security did not produce income during the last 12 months. |
| 2 | Valued under fair value procedures adopted by authority of the board of trustees. The total value of all such securities, including those in “Miscellaneous,“ was $3,708,360,000, which represented 25.26% of the net assets of the fund. This amount includes $3,575,245,000 related to certain securities trading outside the U.S. whose values were adjusted as a result of significant market movements following the close of local trading. |
| 3 | Represents an affiliated company as defined under the Investment Company Act of 1940. |
| 4 | Acquired in a transaction exempt from registration under Section 4(2) of the Securities Act of 1933. May be resold in the U.S. in transactions exempt from registration, normally to qualified institutional buyers. The total value of all such securities was $391,560,000, which represented 2.67% of the net assets of the fund. |
| Key to abbreviation and symbol |
| ADR = American Depositary Receipts |
| € = Euros |
Investments are not FDIC-insured, nor are they deposits of or guaranteed by a bank or any other entity, so they may lose value.
Investors should carefully consider investment objectives, risks, charges and expenses. This and other important information is contained in the fund prospectus and summary prospectus, which can be obtained from your financial professional and should be read carefully before investing. You may also call American Funds Service Company (AFS) at (800) 421-4225 or visit the American Funds website at americanfunds.com.
| MFGEFPX-014-0117O-S54103 | The New Economy Fund — Page 6 of 6 |
Report of Independent Registered Public Accounting Firm
To the Board of Trustees and Shareholders of The New Economy Fund
In our opinion, the accompanying statement of assets and liabilities, including the summary investment portfolio, and the related statements of operations and of changes in net assets and the financial highlights (included in Item 1 of this Form N-CSR) and the investment portfolio (included in Item 6 of this Form N-CSR) present fairly, in all material respects, the financial position of The New Economy Fund (the “Fund”) at November 30, 2016, the results of its operations for the year then ended, the changes in its net assets for each of the two years in the period then ended and the financial highlights for each of the periods presented, in conformity with accounting principles generally accepted in the United States of America. These financial statements, financial highlights, and investment portfolio (hereafter referred to as "financial statements") are the responsibility of the Fund’s management. Our responsibility is to express an opinion on these financial statements based on our audits. We conducted our audits of these financial statements in accordance with the standards of the Public Company Accounting Oversight Board (United States). Those standards require that we plan and perform the audit to obtain reasonable assurance about whether the financial statements are free of material misstatement. An audit includes examining, on a test basis, evidence supporting the amounts and disclosures in the financial statements, assessing the accounting principles used and significant estimates made by management, and evaluating the overall financial statement presentation. We believe that our audits, which included confirmation of securities at November 30, 2016 by correspondence with the custodian and brokers, provide a reasonable basis for our opinion.
PricewaterhouseCoopers LLP
Los Angeles, California
January 13, 2017
ITEM 7 – Disclosure of Proxy Voting Policies and Procedures for Closed-End Management Investment Companies
Not applicable to this Registrant, insofar as the Registrant is not a closed-end management investment company.
ITEM 8 – Portfolio Managers of Closed-End Management Investment Companies
Not applicable to this Registrant, insofar as the Registrant is not a closed-end management investment company.
ITEM 9 – Purchases of Equity Securities by Closed-End Management Investment Company and Affiliated Purchasers
Not applicable to this Registrant, insofar as the Registrant is not a closed-end management investment company.
ITEM 10 – Submission of Matters to a Vote of Security Holders
There have been no material changes to the procedures by which shareholders may recommend nominees to the Registrant’s board of trustees since the Registrant last submitted a proxy statement to its shareholders. The procedures are as follows. The Registrant has a nominating and governance committee comprised solely of persons who are not considered ‘‘interested persons’’ of the Registrant within the meaning of the Investment Company Act of 1940, as amended. The committee periodically reviews such issues as the board’s composition, responsibilities, committees, compensation and other relevant issues, and recommends any appropriate changes to the full board of trustees. While the committee normally is able to identify from its own resources an ample number of qualified candidates, it will consider shareholder suggestions of persons to be considered as nominees to fill future vacancies on the board. Such suggestions must be sent in writing to the nominating and governance committee of the Registrant, c/o the Registrant’s Secretary, and must be accompanied by complete biographical and occupational data on the prospective nominee, along with a written consent of the prospective nominee for consideration of his or her name by the nominating and governance committee.
ITEM 11 – Controls and Procedures
| (a) | The Registrant’s Principal Executive Officer and Principal Financial Officer have concluded, based on their evaluation of the Registrant’s disclosure controls and procedures (as such term is defined in Rule 30a-3 under the Investment Company Act of 1940), that such controls and procedures are adequate and reasonably designed to achieve the purposes described in paragraph (c) of such rule. |
| | |
| (b) | There were no changes in the Registrant’s internal controls over financial reporting (as defined in Rule 30a-3(d) under the Investment Company Act of 1940) that occurred during the Registrant’s second fiscal quarter of the period covered by this report that has materially affected, or is reasonably likely to materially affect, the Registrant’s internal control over financial reporting. |
ITEM 12 – Exhibits
| (a)(1) | The Code of Ethics that is the subject of the disclosure required by Item 2 is attached as an exhibit hereto. |
| | |
| (a)(2) | The certifications required by Rule 30a-2 of the Investment Company Act of 1940 and Sections 302 and 906 of the Sarbanes-Oxley Act of 2002 are attached as exhibits hereto. |
SIGNATURES
Pursuant to the requirements of the Securities Exchange Act of 1934 and the Investment Company Act of 1940, the Registrant has duly caused this report to be signed on its behalf by the undersigned, thereunto duly authorized.
| | THE NEW ECONOMY FUND |
| | |
| | By /s/ Donald H. Rolfe |
| | Donald H. Rolfe, Executive Vice President and Principal Executive Officer |
| | |
| | Date: January 31, 2017 |
Pursuant to the requirements of the Securities Exchange Act of 1934 and the Investment Company Act of 1940, this report has been signed below by the following persons on behalf of the Registrant and in the capacities and on the dates indicated.
| By /s/ Donald H. Rolfe |
Donald H. Rolfe, Executive Vice President and Principal Executive Officer |
| |
| Date: January 31, 2017 |
| By /s/ Gregory F. Niland |
Gregory F. Niland, Treasurer and Principal Financial Officer |
| |
| Date: January 31, 2017 |